UNITED STATES
SECURITIES AND EXCHANGE COMMISSION
Washington, D.C. 20549
FORM N-CSR
CERTIFIED SHAREHOLDER REPORT OF REGISTERED
MANAGEMENT INVESTMENT COMPANIES
Investment Company Act file number: 811-09815
the arbitrage funds
(exact name of registrant as specified in charter)
41 Madison Avenue, 42nd Floor, New York, NY 10010
(Address of principal executive offices) (Zip code)
John S. Orrico
Water Island Capital, LLC
41 Madison Avenue
42nd Floor
New York, NY 10010
(Name and address of agent for service)
Registrant’s telephone number, including area code: 800-295-4485
Date of fiscal year end: May 31
Date of reporting period: May 31, 2023
Item 1. Reports to Stockholders.

Annual Report
May 31, 2023
Arbitrage Fund
Water Island Event-Driven Fund
Water Island Credit Opportunities Fund

TABLE OF CONTENTS
Shareholder Letter | | | 1 | | |
Arbitrage Fund | |
Manager Commentary | | | 3 | | |
Portfolio Information | | | 5 | | |
Portfolio of Investments | | | 7 | | |
Water Island Event-Driven Fund | |
Manager Commentary | | | 19 | | |
Portfolio Information | | | 21 | | |
Portfolio of Investments | | | 23 | | |
Water Island Credit Opportunities Fund | |
Manager Commentary | | | 34 | | |
Portfolio Information | | | 36 | | |
Portfolio of Investments | | | 38 | | |
Statements of Assets and Liabilities | | | 46 | | |
Statements of Operations | | | 50 | | |
Statements of Changes in Net Assets | | | 54 | | |
Financial Highlights | |
Arbitrage Fund - Class R | | | 57 | | |
Arbitrage Fund - Class I | | | 58 | | |
Arbitrage Fund - Class C | | | 59 | | |
Arbitrage Fund - Class A | | | 60 | | |
Water Island Event-Driven Fund - Class R | | | 61 | | |
Water Island Event-Driven Fund - Class I | | | 62 | | |
Water Island Event-Driven Fund - Class A | | | 63 | | |
Water Island Credit Opportunities Fund - Class R | | | 64 | | |
Water Island Credit Opportunities Fund - Class I | | | 65 | | |
Water Island Credit Opportunities Fund - Class A | | | 66 | | |
Notes to Financial Statements | | | 67 | | |
Report of Independent Registered Public Accounting Firm | | | 91 | | |
Disclosure of Fund Expenses | | | 92 | | |
Additional Information | | | 95 | | |
Approval of Investment Advisory Agreements | | | 96 | | |
Liquidity Risk | | | 101 | | |
Trustees & Officers | | | 102 | | |
The Arbitrage Funds Shareholder Letter
Dear Fellow Shareholders,
The fiscal year ending May 31, 2023, marked yet another challenging 12 months for both event-driven strategies and broader credit and equity markets. We continued to witness heightened volatility over the period, as many of the same challenges we discussed in our letter one year ago remain – such as the Russia/Ukraine conflict and the Federal Reserve's ("Fed") fight to tame inflation with interest rate hikes. We also saw new hazards emerge, such as a regional banking crisis that led to the failures of multiple large regional banks in the U.S. and yet another battle over the U.S. federal government's debt ceiling in Congress.
Within our event-driven universe, regulatory headwinds persisted throughout the course of the year, as antitrust regulators around the globe attempted to block several large transactions, in turn driving sympathetic volatility in deal spreads throughout the merger arbitrage universe. At times, we have found the logic behind the regulators' recent cases to be perplexing – particularly in the U.S., where the Department of Justice ("DOJ") and the Federal Trade Commission ("FTC") have sought to block deals, in our opinion, based on novel legal theories with little basis in historical precedent or antitrust law.
While the FTC and DOJ have succeeded in causing some companies to abandon their planned tie-ups rather than pursue costly litigation, and their actions may have had a chilling effect on future mergers and acquisitions ("M&A") in certain sensitive industries or by large acquirers, the regulatory pendulum may be starting to swing back to the other side. At this point, of the cases that have gone to trial, the FTC and DOJ under the Biden administration have lost more than they have won, and we believe acquirers may increasingly take a bolder stance in fighting regulatory objections. Furthermore, within the ranks of agency staff, there has been considerable brain drain, which may be a result of skepticism regarding the current regime's approach. In the past two years, for example, senior-level attorneys at the FTC have departed the agency at the fastest rate since 2000, which could make future enforcement actions more challenging.
While we are cognizant of the challenges that remain, amidst this environment, we believe the return opportunities in merger arbitrage are compelling. Volatility and rising interest rates are bolstering wider deal spreads, which have reached average levels we haven't seen since the Global Financial Crisis. According to Dealogic data, the average day-one spread (i.e., the spread the day after deal announcement) of pending deals as of May 31, 2023, exceeded 12% – more than double the rate just 12 months prior. And while M&A deal flow has slowed somewhat, with deal volumes in 2023 declining from the already subdued levels of the second half of 2022, activity still remains above pre-pandemic 2019 levels, according to Refinitiv and PwC data – providing plentiful event-driven investment opportunities.
As the Fed gets closer to its goal of combating inflation and interest rates begin to stabilize, we anticipate business leaders will increasingly seek to drive growth through strategic M&A, spurring further consolidation activity. Furthermore, financial acquisitions continue to comprise a large segment of M&A activity, and private equity firms remain flush with cash, with approximately $2.5 trillion on their books waiting to be deployed. All told, we believe the opportunity in the merger arbitrage space remains quite attractive. For our broader event-driven portfolio, given ongoing volatility, we expect to maintain our focus on these and other hard catalyst investments given their more definitive timelines and outcomes, introducing select soft catalyst investments – which typically have greater sensitivity to broader market moves – only when we believe the potential reward outweighs the potential risk and when we can construct appropriate risk mitigation strategies. For our credit portfolio, we see attractive opportunities not just in
Annual Report | May 31, 2023
1
The Arbitrage Funds Shareholder Letter (continued)
merger-related credits, but also other hard catalyst opportunities such as refinancings, as well as less definitive opportunities involving credits near the top of the capital structure, such as term loans.
Sincerely,
The Investment Team
Water Island Capital
The discussion of market trends and companies throughout this commentary are not intended as advice to any person regarding the advisability of investing in any particular security. Some of our comments are based on current management expectations and are considered "forward-looking statements." Actual future results, however, may prove to be different from our expectations. Our views are a reflection of our best judgment at the time of the commentary and are subject to change any time based on market and other conditions, and we have no obligation to update them.
Glossary
Coupon: The annual interest rate paid on a bond.
Deal Flow: The volume of announced mergers and acquisitions activity.
Deal Spread (also "merger spread" or "spread"): The difference between the price at which a target company's shares currently trade and the price an acquiring company has agreed to pay, which forms the rate of return in a merger arbitrage investment.
Global Financial Crisis: A period of severe stress in global financial markets and banking systems between mid-2007 and early 2009.
Hard Catalysts: Situations with more defined potential outcomes and higher probabilities of reaching a successful conclusion.
Soft Catalysts: Situations with less defined potential outcomes and relatively lower probabilities of reaching a successful conclusion.
www.arbitragefunds.com | 1-800-295-4485
2
Arbitrage Fund Manager Commentary
Arbitrage Fund | Tickers: ARBNX, ARBFX, ARBCX, ARGAX
The Fund's Goal and Main Investments
The Fund seeks to achieve capital growth by engaging in merger arbitrage. Merger arbitrage is a sub-set of a broader event-driven investment strategy, which seeks to profit from investing in securities that are involved in corporate events such as mergers and acquisitions. Typically, merger arbitrage is a low volatility strategy pursued by absolute-return-minded investors. At Water Island Capital, our goal is to capture a return stream with a low correlation to the overall markets.
Investment Strategy
The strategy's focus is to capture returns from corporate events, generate market neutral capital growth, preserve capital, generate consistent and positive returns, and achieve low correlation and low volatility. The Fund generally engages in active and frequent trading of portfolio securities to achieve its principal investment objective. In attempting to achieve its investment strategy, the Fund plans to invest at least 80% of its net assets in equity securities of companies (both U.S. and foreign) that are involved in publicly announced mergers, takeovers, tender offers, leveraged buyouts, spin-offs, liquidations, and other corporate reorganizations. The Fund's investment adviser uses investment strategies designed to minimize market exposure, including short selling along with purchasing and selling options. The most common merger arbitrage activity, and the approach generally used by the Fund, involves purchasing the shares of an announced acquisition target company at a discount to their expected value upon the acquisition's completion. That difference, or "spread," is the primary driver of returns for this investment strategy. There is no limit to the number of stocks the Fund can hold; however, the Fund typically invests in 40 to 80 deals at any given time. Each deal will have one, or perhaps two, equity positions (a long and short position in a stock-for-stock deal) and, in many cases, associated derivative positions for hedging purposes.
Fiscal Year Highlights
Arbitrage Fund Class I (ARBNX) returned -0.75% for the fiscal year ended May 31, 2023. Investments in the European region contributed to returns, while the Americas and Asia-Pacific regions detracted from returns. Industrials and health care were the top performing sectors, while financials and information technology detracted the most from returns.
The Fund may utilize derivatives for several purposes, primarily to implement position-level hedges, portfolio-level hedges, or currency hedges. During the fiscal year, the Fund's investments in derivative instruments detracted from returns. Derivative performance was in line with expectations given prevailing market conditions over the period.
The Fund's top contributor for the period was its investment in the acquisition of Twitter by Elon Musk. In April 2022, Elon Musk – CEO of Tesla and SpaceX and one of the richest people in the world – launched an unsolicited bid to personally acquire the 91% of U.S. social media company Twitter that he did not already own for $54.20 per share in cash. Musk put together a financing package combining commitments from a group of banks led by Morgan Stanley and private equity firms with his own personal assets, including loans backed by his holdings in Tesla stock. Musk's commitment to the deal seemingly wavered in line with the fortunes of Tesla shares, which traded down significantly after Twitter's board agreed to the transaction. Musk's capriciousness led to significant volatility in the deal spread, as he attempted to back out of the deal and Twitter filed suit in the Delaware Court of Chancery to enforce the original merger agreement. Rather than undergo litigation, Musk ultimately capitulated and agreed to close the deal on its original terms. Our analysis of the strength of the merger agreement (and thus Musk's likelihood of losing in court) gave us the confidence to maintain exposure to this deal throughout its life. Volatility
Annual Report | May 31, 2023
3
Arbitrage Fund Manager Commentary (continued)
throughout the deal timeline allowed us to trade around the spread and add exposure at attractive rates of return, and the Fund was rewarded when the deal was completed in calendar Q4 2022.
The second-largest contributor for the fiscal year was the Fund's position in the acquisition of Change Healthcare by UnitedHealth Group. In January 2021, Change Healthcare, a U.S.-based medical software and technology provider, agreed to be acquired by OptumInsight, a subsidiary of UnitedHealth Group (which also owns the country's largest health insurer) providing medical information technology services, for $8.8 billion in cash. After a lengthy regulatory review, the DOJ sued to stop the transaction in February 2022, alleging the combination would harm competition in multiple markets. In September, however, a federal judge ruled against the DOJ's attempt to intervene in the deal, allowing the merger to proceed. The deal subsequently closed early in Q4, leading to gains for the Fund.
Conversely, the top detractor in the portfolio was the Fund's position in the failed acquisition of First Horizon by Toronto-Dominion Bank ("TD"). In February 2022, First Horizon – a regional bank based in Tennessee that operates throughout the Southeast U.S. – agreed to be acquired by TD – a Canada-based multinational banking and financial services corporation – for $13.4 billion in cash. While First Horizon was not directly connected to Silicon Valley Bank, the company's shares were a casualty of indiscriminate selling across the U.S. regional banking industry following the news of Silicon Valley Bank's failure. This, combined with an extended regulatory review in Canada as well as rumors of a potential price cut, pressured the deal's spread. Through the volatility, we opted to maintain exposure to the transaction as mere weeks prior TD had publicly reaffirmed its commitment to the transaction – which, due to First Horizon's relatively small size, would have been one of very few paths for TD to gain scale via acquisition – and our outlook on the deal fundamentals had not changed. As the regional banking crisis continued to unfold, leading to the additional failures of Signature Bank and First Republic, volatility in First Horizon shares escalated. Eventually, in May 2023, when no progress had been made on the antitrust review front, First Horizon and TD mutually agreed to terminate the merger due to "uncertainty" as to when the deal might gain the lagging regulatory approvals.
The second-largest detractor for the period was the Fund's position in the failed acquisition of Tegna by Standard General. In February 2022, TEGNA – a U.S.-based broadcast television and digital media company which owns or operates 66 stations in 54 markets – agreed to be acquired by Standard General – a U.S.-based investment company – for $5.3 billion in cash. In February 2023, the U.S. Federal Communications Commission ("FCC") designated the deal for judicial review based on concerns it could raise prices for consumers, sending TEGNA shares lower. Such hearings are typically lengthy and have historically led deals to collapse. Standard General filed a lawsuit in response, describing the FCC's move as "an unprecedented and legally improper maneuver," as it had not previously expressed any concerns with the transaction during its nearly year-long review. After the United States Court of Appeals ruled against Standard General's appeal, the companies were forced to terminate the merger in May 2023, as the FCC would not commit to reviewing the deal before Standard General's financing expired, after which point the company claimed it would not be able to secure financing with comparable interest rates.
www.arbitragefunds.com | 1-800-295-4485
4
Arbitrage Fund Portfolio Information
Performance (annualized returns as of May 31, 2023)
| | | One
Year | | Five
Year | | Ten
Year | | Since
Inception* | |
Arbitrage Fund, Class R | | | -1.03 | % | | | 1.86 | % | | | 1.81 | % | | | 3.50 | % | |
Arbitrage Fund, Class I | | | -0.75 | % | | | 2.12 | % | | | 2.06 | % | | | 2.72 | % | |
Arbitrage Fund, Class C** | | | -2.69 | % | | | 1.10 | % | | | 1.05 | % | | | 0.93 | % | |
Arbitrage Fund, Class A*** | | | -3.75 | % | | | 1.36 | % | | | 1.55 | % | | | 1.55 | % | |
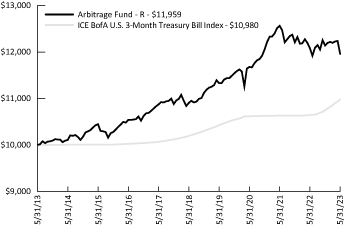
ICE BofA U.S. 3-Month Treasury Bill Index | | | 3.14 | % | | | 1.49 | % | | | 0.94 | % | | | 1.55 | % | |
Current performance may be higher or lower than performance quoted above. Any performance data quoted represents past performance and the investment return and principal value of an investment in the Fund will fluctuate so that an investor's shares, when redeemed, may be worth more or less than their original cost. Past performance is no guarantee of future results. Returns shown above include the reinvestment of all dividends and capital gains. Performance results do not include adjustments made for financial reporting purposes in accordance with U.S. generally accepted accounting principles and may differ from the amount reported in the Financial Highlights. You can obtain performance data current to the most recent month end by calling 1-800-295-4485 or going to www.arbitragefunds.com. This table does not reflect the deduction of taxes that a shareholder would pay on Fund distributions or the redemption of Fund shares.
* Class R inception: 9/18/00; Class I inception: 10/17/03; Class C inception: 6/1/12; Class A inception: 6/1/13. The "Since Inception" returns for securities indices are for the inception date of Class R shares.
** Class C One Year return includes load. Shares are subject to a 1.00% contingent deferred sales charge on all purchases redeemed within 12 months of purchase.
*** After sales charge. Class A shares are subject to a maximum front-end sales load of 2.75% on purchases up to $250,000. The shares are also subject to a deferred sales charge of up to 1.00% on purchases of $250,000 or more purchased without a front-end sales charge and redeemed within 18 months of purchase.
The Total Annual Fund Operating Expenses for Class R, Class I, Class C and Class A are 1.62%, 1.37%, 2.37% and 1.62%, respectively. These expense ratios are as stated in the current prospectus and may differ from the expense ratios disclosed in the financial highlights in this report.
The ICE BofA U.S. 3-Month Treasury Bill Index tracks the performance of the U.S. dollar denominated U.S. Treasury Bills publicly issued in the U.S. domestic market with a remaining term to final maturity of less than 3 months.
An investor may not invest directly in an index.
Annual Report | May 31, 2023
5
Arbitrage Fund Portfolio Information (continued)
Growth of $10,000 Investment
The chart represents historical performance of a hypothetical investment of $10,000 in the Class R shares of the Fund over ten years. Past performance does not guarantee future results. This chart does not reflect the deduction of taxes that a shareholder would pay on Fund distributions or the redemption of Fund shares.
Sector Weighting
The following chart shows the sector weightings of Arbitrage Fund's investments (including short sales and excluding derivatives) as of the report date.

* Concentration Risk: If a large percentage of mergers or event-driven investment opportunities taking place within the U.S. are within one industry over a given period of time, the Fund may invest a large portion of its assets in securities of issuers in a single industry for that period of time. During such a period of concentration, the Fund may be subject to greater volatility with respect to its portfolio securities than a fund that is more broadly diversified.
www.arbitragefunds.com | 1-800-295-4485
6
Arbitrage Fund Portfolio of Investments
| | | Shares | | Value | |
COMMON STOCKS - 87.62% | |
Aerospace & Defense - 3.56% | |
Aerojet Rocketdyne Holdings, Inc.(a) | | | 747,637 | | | $ | 40,731,264 | | |
Banks - 0.93% | |
First Horizon Corp.(b) | | | 1,029,513 | | | | 10,614,279 | | |
Biotechnology - 11.16% | |
BELLUS Health, Inc.(a) | | | 868,574 | | | | 12,689,866 | | |
CTI BioPharma Corp.(a) | | | 993,466 | | | | 8,990,867 | | |
Horizon Therapeutics Plc(a)(b) | | | 482,515 | | | | 48,265,976 | | |
IVERIC bio, Inc.(a)(b) | | | 160,295 | | | | 6,051,136 | | |
Prometheus Biosciences, Inc.(a) | | | 95,482 | | | | 18,972,274 | | |
Seagen, Inc.(a)(c) | | | 95,020 | | | | 18,595,414 | | |
Swedish Orphan Biovitrum AB(a) | | | 257,271 | | | | 5,168,274 | | |
VectivBio Holding AG(a) | | | 534,442 | | | | 8,845,015 | | |
| | | | 127,578,822 | | |
Chemicals - 2.41% | |
Diversey Holdings Ltd.(a) | | | 1,903,358 | | | | 15,854,972 | | |
Rogers Corp.(a) | | | 74,187 | | | | 11,682,227 | | |
| | | | 27,537,199 | | |
Commercial Services - 2.85% | |
Caverion Oyj | | | 1,405,496 | | | | 12,619,614 | | |
Moneylion, Inc.(a)(d) | | | 82,977 | | | | 924,367 | | |
RB Global, Inc. | | | 36,215 | | | | 1,886,077 | | |
Triton International Ltd.(c) | | | 207,913 | | | | 17,181,930 | | |
| | | | 32,611,988 | | |
Computers & Computer Services - 0.63% | |
Ordina N.V. | | | 1,185,517 | | | | 7,172,349 | | |
Distribution/Wholesale - 4.37% | |
Uni-Select, Inc.(a) | | | 266,989 | | | | 9,190,715 | | |
Univar Solutions, Inc.(a) | | | 1,145,739 | | | | 40,811,223 | | |
| | | | 50,001,938 | | |
Diversified Financial Services - 2.44% | |
Focus Financial Partners, Inc., Class A(a)(c) | | | 425,647 | | | | 22,171,952 | | |
Numis Corp. Plc | | | 1,386,619 | | | | 5,752,490 | | |
| | | | 27,924,442 | | |
Electric - 3.53% | |
PNM Resources, Inc. | | | 879,194 | | | | 40,372,588 | | |
Electronics - 3.08% | |
National Instruments Corp.(c) | | | 608,317 | | | | 35,160,723 | | |
See Notes to Financial Statements.
Annual Report | May 31, 2023
7
Arbitrage Fund Portfolio of Investments (continued)
| | | Shares | | Value | |
COMMON STOCKS - 87.62% (Continued) | |
Food - 1.03% | |
Albertsons Cos., Inc., Class A(c) | | | 575,928 | | | $ | 11,725,894 | | |
Healthcare - Products - 0.35% | |
Globus Medical, Inc., Class A(a)(c) | | | 74,750 | | | | 4,046,217 | | |
Healthcare - Services - 1.41% | |
Medica Group Plc | | | 1,150,000 | | | | 3,018,444 | | |
Syneos Health, Inc.(a)(c) | | | 315,909 | | | | 13,141,814 | | |
| | | | 16,160,258 | | |
Insurance - 0.23% | |
TOWER Ltd. | | | 7,208,016 | | | | 2,626,540 | | |
Internet - 4.15% | |
Zendesk, Inc.(a)(e) | | | 601,789 | | | | 47,438,245 | | |
Iron/Steel - 0.30% | |
Kloeckner & Co. SE | | | 333,155 | | | | 3,432,895 | | |
Media - 3.91% | |
TEGNA, Inc.(c) | | | 2,554,217 | | | | 39,564,821 | | |
Telenet Group Holding N.V. | | | 243,254 | | | | 5,182,084 | | |
| | | | 44,746,905 | | |
Mining - 0.51% | |
Arconic Corp.(a) | | | 201,890 | | | | 5,836,640 | | |
Office Furnishings - 0.24% | |
Kimball International, Inc., Class B | | | 221,092 | | | | 2,719,432 | | |
Oil & Gas - 2.03% | |
PDC Energy, Inc. | | | 247,179 | | | | 16,961,423 | | |
Ranger Oil Corp., Class A | | | 168,768 | | | | 6,202,224 | | |
| | | | 23,163,647 | | |
Pharmaceuticals - 0.83% | |
Heska Corp.(a) | | | 78,792 | | | | 9,433,766 | | |
Pipelines - 3.91% | |
DCP Midstream LP(a)(c) | | | 899,158 | | | | 37,395,981 | | |
Magellan Midstream Partners LP(a)(c) | | | 121,687 | | | | 7,326,774 | | |
| | | | 44,722,755 | | |
Real Estate - 1.43% | |
Radius Global Infrastructure, Inc., Class A(a) | | | 1,103,580 | | | | 16,332,984 | | |
See Notes to Financial Statements.
www.arbitragefunds.com | 1-800-295-4485
8
Arbitrage Fund Portfolio of Investments (continued)
| | | Shares | | Value | |
COMMON STOCKS - 87.62% (Continued) | |
Real Estate Investment Trusts - 3.05% | |
Bluerock Homes Trust, Inc.(a) | | | 38,628 | | | $ | 618,048 | | |
Indus Realty Trust, Inc. | | | 191,844 | | | | 12,815,179 | | |
Life Storage, Inc.(c) | | | 122,836 | | | | 15,648,078 | | |
Urstadt Biddle Properties, Inc., Class A | | | 297,585 | | | | 5,758,270 | | |
| | | | 34,839,575 | | |
Retail - 1.06% | |
Ruth's Hospitality Group, Inc. | | | 563,479 | | | | 12,075,355 | | |
Semiconductors - 1.71% | |
Magnachip Semiconductor Corp.(a) | | | 411,831 | | | | 4,213,031 | | |
Silicon Motion Technology Corp., ADR | | | 251,202 | | | | 15,383,611 | | |
| | | | 19,596,642 | | |
Software - 26.51% | |
Absolute Software Corp. | | | 1,011,602 | | | | 11,340,059 | | |
Activision Blizzard, Inc.(a) | | | 819,477 | | | | 65,722,055 | | |
Avalara, Inc.(a)(e) | | | 365,431 | | | | 34,587,094 | | |
Black Knight, Inc.(a) | | | 43,880 | | | | 2,535,386 | | |
Cvent Holding Corp.(a) | | | 1,781,078 | | | | 15,121,352 | | |
EMIS Group Plc | | | 201,882 | | | | 3,350,088 | | |
ForgeRock, Inc., Class A(a)(c) | | | 755,144 | | | | 15,201,049 | | |
Meltwater N.V.(a) | | | 4,708,259 | | | | 7,634,877 | | |
Momentive Global, Inc.(a) | | | 3,931,409 | | | | 37,191,129 | | |
OneMarket Ltd.(a)(e) | | | 111,800 | | | | — | | |
Qualtrics International, Inc., Class A(a) | | | 1,760,369 | | | | 31,827,472 | | |
Rovio Entertainment Oyj(f) | | | 586,900 | | | | 5,771,506 | | |
SimCorp A/S | | | 122,585 | | | | 12,704,294 | | |
Software AG | | | 160,338 | | | | 5,662,571 | | |
VMware, Inc., Class A(a)(c) | | | 398,878 | | | | 54,363,083 | | |
| | | | 303,012,015 | | |
Telecommunications - 0.00% | |
GCI Liberty, Inc.(a)(e) | | | 660,966 | | | | — | | |
TOTAL COMMON STOCKS
(Cost $1,078,099,156) | | | 1,001,615,357 | | |
RIGHTS(a) - 0.52% | |
Bristol-Myers Squibb Co. CVR(d) | | | 857,631 | | | | 857,631 | | |
Concert Pharmaceuticals, Inc. CVR,
Expires 12/31/2029(d)(e) | | | 1,669,338 | | | | 631,677 | | |
Contra Abiomed, Inc. CVR, Expires 12/31/2030(d) | | | 163,650 | | | | 286,388 | | |
Contra Adamas Pharmaceuticals, Inc. CVR,
Expires 12/31/2024(d)(e) | | | 1,150,652 | | | | 79,855 | | |
See Notes to Financial Statements.
Annual Report | May 31, 2023
9
Arbitrage Fund Portfolio of Investments (continued)
| | | Shares | | Value | |
RIGHTS(a) - 0.52% (Continued) | |
Contra Adamas Pharmaceuticals, Inc. CVR,
Expires 12/31/2025(d)(e) | | | 1,150,652 | | | $ | 79,740 | | |
Contra Albireo Pharma, Inc. CVR,
Expires 12/31/2027(d)(e) | | | 313,065 | | | | 688,962 | | |
Contra Amryt Pharma Plc CVR,
Expires 12/31/2024(d)(e) | | | 2,355,440 | | | | 57,261 | | |
Contra Amryt Pharma Plc CVR,
Expires 12/31/2024(d)(e) | | | 2,355,440 | | | | 38,182 | | |
Contra CinCor Pharma, Inc. CVR,
Expires 12/31/2027(d)(e) | | | 339,795 | | | | 1,066,820 | | |
Flexion Therapy CVR, Expires 12/31/2030(d)(e) | | | 1,411,000 | | | | 1,012,534 | | |
Resolute Forest Products, Inc. CVR,
Expires 6/30/2024(d)(e) | | | 803,806 | | | | 1,168,654 | | |
TOTAL RIGHTS
(Cost $5,955,302) | | | 5,967,704 | | |
| | | Maturity
Date | | Rate | | Principal
Amount | | Value | |
CONVERTIBLE CORPORATE BONDS - 0.48% | |
Healthcare - Services - 0.28% | |
UpHealth, Inc.(f) | | 06/15/2026 | | | 6.250 | % | | $ | 1,275,000 | | | $ | 368,953 | | |
UpHealth, Inc., Variable Rate,
(SOFR plus 9.00%)(f) | | 12/15/2025 | | | 14.060 | % | | | 3,506,000 | | | | 2,787,270 | | |
| | | | | | | | | | 3,156,223 | | |
Software - 0.20% | |
Kaleyra, Inc.(f) | | 06/01/2026 | | | 6.125 | % | | | 2,947,000 | | | | 2,324,938 | | |
TOTAL CONVERTIBLE CORPORATE BONDS
(Cost $7,728,000) | | | 5,481,161 | | |
| | | Shares | | Value | |
MUTUAL FUNDS(g) - 6.27% | |
Water Island Event Driven Fund | | | 6,605,365 | | | $ | 71,734,267 | | |
TOTAL MUTUAL FUNDS
(Cost $60,632,644) | | | 71,734,267 | | |
PRIVATE INVESTMENTS(a)(d)(e)(h) - 0.05% | |
Fast Capital LLC | | | 290,700 | | | | 581,400 | | |
TOTAL PRIVATE INVESTMENTS
(Cost $300,786) | | | 581,400 | | |
See Notes to Financial Statements.
www.arbitragefunds.com | 1-800-295-4485
10
Arbitrage Fund Portfolio of Investments (continued)
| | | Shares | | Value | |
WARRANTS(a) - 0.00%(i) | |
Commercial Services - 0.00%(i) | |
Moneylion, Inc., Exercise Price $11.50,
Expires 09/22/2026 | | | 290,320 | | | $ | 10,161 | | |
TOTAL WARRANTS
(Cost $0) | | | 10,161 | | |
| | | Expiration
Date | | Exercise
Price | | Notional
Amount | | Contracts | | Value | |
PURCHASED OPTIONS(a) - 0.15% | |
Call Options Purchased - 0.12% | |
Broadcom, Inc. | |
| | | 06/2023 | | $ | 810.00 | | | $ | 5,090,148 | | | | 63 | | | $ | 235,305 | | |
| | | 06/2023 | | | 815.00 | | | | 5,009,352 | | | | 62 | | | | 221,340 | | |
| | | 06/2023 | | | 810.00 | | | | 5,090,148 | | | | 63 | | | | 278,460 | | |
| | | 06/2023 | | | 815.00 | | | | 5,009,352 | | | | 62 | | | | 261,020 | | |
First Horizon Corp. | | 06/2023 | | | 12.00 | | | | 4,416,804 | | | | 4,284 | | | | 32,130 | | |
IVERIC bio, Inc. | |
| | | 07/2023 | | | 40.00 | | | | 3,042,650 | | | | 806 | | | | 18,135 | | |
| | | 09/2023 | | | 40.00 | | | | 3,042,650 | | | | 806 | | | | 32,240 | | |
MaxLinear, Inc. | | 09/2023 | | | 30.00 | | | | 2,847,975 | | | | 975 | | | | 326,625 | | |
TOTAL CALL OPTIONS PURCHASED
(Cost $1,334,247) | | | 1,405,255 | | |
Put Options Purchased - 0.03% | |
First Horizon Corp. | | 06/2023 | | | 9.00 | | | | 8,006,746 | | | | 7,766 | | | | 194,150 | | |
Horizon Therapeutics Plc | |
| | | 08/2023 | | | 95.00 | | | | 5,911,773 | | | | 591 | | | | 100,470 | | |
| | | 08/2023 | | | 100.00 | | | | 750,225 | | | | 75 | | | | 22,687 | | |
TOTAL PUT OPTIONS PURCHASED
(Cost $863,793) | | | 317,307 | | |
TOTAL PURCHASED OPTIONS
(Cost $2,198,040) | | | 1,722,562 | | |
| | | Yield | | Shares | | Value | |
SHORT-TERM INVESTMENTS - 3.34% | |
Money Market Funds | |
Morgan Stanley Institutional Liquidity
Funds - Government Portfolio | | | 4.997 | %(j) | | | 19,069,419 | | | $ | 19,069,419 | | |
State Street Institutional U.S. Government
Money Market Fund, Premier Class | | | 5.129 | %(j) | | | 19,069,419 | | | | 19,069,419 | | |
| | | | | | | | 38,138,838 | | |
TOTAL SHORT-TERM INVESTMENTS
(Cost $38,138,838) | | | 38,138,838 | | |
See Notes to Financial Statements.
Annual Report | May 31, 2023
11
Arbitrage Fund Portfolio of Investments (continued)
| | | Value | |
Total Investments - 98.43%
(Cost $1,193,052,766) | | $ | 1,125,251,450 | | |
Other Assets in Excess of Liabilities - 1.57%(k) | | | 17,940,942 | | |
NET ASSETS - 100.00% | | $ | 1,143,192,392 | | |
Portfolio Footnotes
(a) Non-income-producing security.
(b) Underlying security for a written/purchased call/put option.
(c) Security, or a portion of security, is being held as collateral for swaps, short sales, written option contracts or forward foreign currency exchange contracts. At May 31, 2023, the aggregate fair market value of those securities was $140,680,110, representing 12.31% of net assets.
(d) Restricted securities (including private placements) - The Fund may own investment securities that have other legal or contractual limitations. At the end of the period, the value of restricted securities (excluding 144A issues) amounted to $7,473,471 or 0.65% of net assets.
Restricted Security | | Acquisition Date | | Acquisition Cost | |
Bristol-Myers Squibb Co. CVR | | 11/20/2020 | | $ | 1,185,787 | | |
Concert Pharmaceuticals, Inc. CVR, Expires 12/31/2029 | | 03/07/2023 | | | 617,655 | | |
Contra Abiomed, Inc. CVR, Expires 12/31/2030 | | 12/21/2022 | | | 166,923 | | |
Contra Adamas Pharmaceuticals, Inc. CVR, Expires 12/31/2024 | | 11/23/2021 | | | 69,039 | | |
Contra Adamas Pharmaceuticals, Inc. CVR, Expires 12/31/2025 | | 11/23/2021 | | | 69,039 | | |
Contra Albireo Pharma, Inc. CVR, Expires 12/31/2027 | | 03/03/2023 | | | 673,090 | | |
Contra Amryt Pharma Plc CVR, Expires 12/31/2024 | | 04/13/2023 | | | 58,886 | | |
Contra Amryt Pharma Plc CVR, Expires 12/31/2024 | | 04/13/2023 | | | 58,886 | | |
Contra CinCor Pharma, Inc. CVR, Expires 12/31/2027 | | 02/23/2023 | | | 1,039,773 | | |
Fast Capital LLC | | 08/18/2020 | | | 300,786 | | |
Flexion Therapy CVR, Expires 12/31/2030 | | 11/22/2021 | | | 874,820 | | |
Moneylion, Inc. | | 06/19/2020 | | | 17,080,470 | | |
Resolute Forest Products, Inc. CVR, Expires 6/30/2024 | | 03/01/2023 | | | 1,141,404 | | |
Total | | | | $ | 23,336,558 | | |
(e) Security fair valued using significant unobservable inputs and classified as a Level 3 security. As of May 31, 2023, the total fair market value of these securities was $87,430,424, representing 7.65% of net assets.
(f) Security exempt from registration under Rule 144A of the Securities Act of 1933. These securities may be resold in transactions exempt from registration, normally to qualified institutional buyers. As of May 31, 2023, these securities had a total value of $11,252,667 or 0.98% of net assets.
(g) Affiliated investment.
(h) Represents a holding that is a direct investment into a private company and is not a listed or publicly traded entity.
(i) Less than 0.005% of net assets.
(j) Rate shown is the 7-day effective yield as of May 31, 2023.
(k) Includes cash held as collateral for short sales.
See Notes to Financial Statements.
www.arbitragefunds.com | 1-800-295-4485
12
Arbitrage Fund Portfolio of Investments (continued)
SCHEDULE OF SECURITIES SOLD SHORT | | Shares | | Value | |
COMMON STOCKS SOLD SHORT - (4.83%) | |
Healthcare - Products - (0.08%) | |
NuVasive, Inc. | | | (22,425 | ) | | $ | (855,738 | ) | |
Office Furnishings - (0.06%) | |
HNI Corp. | | | (28,752 | ) | | | (733,176 | ) | |
Oil & Gas - (1.79%) | |
Baytex Energy Corp. | | | (999,240 | ) | | | (3,150,459 | ) | |
Chevron Corp. | | | (114,642 | ) | | | (17,267,378 | ) | |
| | | | (20,417,837 | ) | |
Pipelines - (0.40%) | |
ONEOK, Inc. | | | (81,165 | ) | | | (4,598,809 | ) | |
Real Estate Investment Trusts - (1.87%) | |
Extra Space Storage, Inc. | | | (82,454 | ) | | | (11,895,638 | ) | |
Public Storage | | | (12,873 | ) | | | (3,646,921 | ) | |
Regency Centers Corp. | | | (103,262 | ) | | | (5,810,553 | ) | |
| | | | (21,353,112 | ) | |
Semiconductors - (0.63%) | |
Broadcom, Inc. | | | (5,448 | ) | | | (4,401,766 | ) | |
MaxLinear, Inc. | | | (97,467 | ) | | | (2,847,011 | ) | |
| | | | (7,248,777 | ) | |
TOTAL SECURITIES SOLD SHORT
(Proceeds $58,127,599) | | $ | (55,207,449 | ) | |
EQUITY SWAP CONTRACTS
Swap
Counterparty/
Payment
Frequency | | Reference
Obligation | | Rate
Paid/
Received
by the
Fund | | Termination
Date | | Upfront
Payments
Made | | Upfront
Payments
Received | | Market
Value | | Notional
Amount | | Unrealized
Appreciation | |
Morgan
Stanley &
Co./
Upon
Termination
| | Brookfield
Infrastructure
Corp.
| | Received
1 Month-
Federal
Rate
Minus
58bps
(-4.500%) | |
10/29/2024 | | $ | — | | | $ | — | | | $ | 28,068 | | | USD | 1,465,789 | | | $ | 28,068 | | |
See Notes to Financial Statements.
Annual Report | May 31, 2023
13
Arbitrage Fund Portfolio of Investments (continued)
Swap
Counterparty/
Payment
Frequency | | Reference
Obligation | | Rate
Paid/
Received
by the
Fund | | Termination
Date | | Upfront
Payments
Made | | Upfront
Payments
Received | | Market
Value | | Notional
Amount | | Unrealized
Depreciation | |
Morgan
Stanley &
Co./
Upon
Termination
| | Broadcom,
Inc.
| | Received
1 Month-
Federal
Rate
Minus
40bps
(-4.680%) | |
10/29/2024 | | $ | — | | | $ | — | | | $ | (13,919,940 | ) | | USD | 22,271,820 | | | $ | (13,919,940 | ) | |
Morgan
Stanley &
Co./
Upon
Termination
| | Intercontinental
Exchange,
Inc.
| | Received
1 Month-
Federal
Rate
Minus
67bps
(-4.400%) | |
10/29/2024 | | | — | | | | — | | | | (8,111 | ) | | USD | 308,997 | | | | (8,111 | ) | |
| | | | | | | | | | | | | $ | (13,928,051 | ) | | | | | | $ | (13,928,051 | ) | |
OUTSTANDING FORWARD FOREIGN CURRENCY EXCHANGE CONTRACTS
Currency
Purchased | | Currency Sold | | Counterparty | | Settlement
Date | | Unrealized
Appreciation | |
CAD | 5,600,200 | | | USD | 4,117,524 | | | Morgan Stanley & Co. | | 06/15/2023 | | $ | 9,223 | | |
USD | 882,030 | | | CAD | 1,183,900 | | | Morgan Stanley & Co. | | 06/15/2023 | | | 9,624 | | |
USD | 12,723,058 | | | DKK | 86,932,100 | | | Morgan Stanley & Co. | | 06/15/2023 | | | 233,829 | | |
EUR | 207,100 | | | USD | 219,905 | | | Morgan Stanley & Co. | | 06/15/2023 | | | 1,628 | | |
USD | 53,217,879 | | | EUR | 48,922,000 | | | Morgan Stanley & Co. | | 06/15/2023 | | | 886,426 | | |
USD | 5,308,021 | | | GBP | 4,247,400 | | | Morgan Stanley & Co. | | 06/15/2023 | | | 23,033 | | |
USD | 8,342,668 | | | NOK | 87,757,800 | | | Morgan Stanley & Co. | | 06/15/2023 | | | 431,665 | | |
USD | 3,485,131 | | | NZD | 5,586,300 | | | Morgan Stanley & Co. | | 06/15/2023 | | | 120,736 | | |
SEK | 3,087,300 | | | USD | 284,021 | | | Morgan Stanley & Co. | | 06/15/2023 | | | 674 | | |
USD | 8,563,450 | | | SEK | 90,026,700 | | | Morgan Stanley & Co. | | 06/15/2023 | | | 261,668 | | |
| | | $ | 1,978,506 | | |
Currency
Purchased | | Currency Sold | | Counterparty | | Settlement
Date | | Unrealized
Depreciation | |
CAD | 73,851,300 | | | USD | 54,888,286 | | | Morgan Stanley & Co. | | 06/15/2023 | | $ | (467,808 | ) | |
USD | 63,217,626 | | | CAD | 86,452,600 | | | Morgan Stanley & Co. | | 06/15/2023 | | | (488,657 | ) | |
USD | 453,116 | | | DKK | 3,167,900 | | | Morgan Stanley & Co. | | 06/15/2023 | | | (2,005 | ) | |
EUR | 10,488,200 | | | USD | 11,438,154 | | | Morgan Stanley & Co. | | 06/15/2023 | | | (219,015 | ) | |
GBP | 4,942,900 | | | USD | 6,173,509 | | | Morgan Stanley & Co. | | 06/15/2023 | | | (23,118 | ) | |
USD | 26,855,574 | | | GBP | 21,977,400 | | | Morgan Stanley & Co. | | 06/15/2023 | | | (490,640 | ) | |
NOK | 2,911,600 | | | USD | 272,871 | | | Morgan Stanley & Co. | | 06/15/2023 | | | (10,403 | ) | |
NZD | 1,261,500 | | | USD | 789,031 | | | Morgan Stanley & Co. | | 06/15/2023 | | | (29,282 | ) | |
See Notes to Financial Statements.
www.arbitragefunds.com | 1-800-295-4485
14
Arbitrage Fund Portfolio of Investments (continued)
Currency
Purchased | | Currency Sold | | Counterparty | | Settlement
Date | | Unrealized
Depreciation | |
SEK | 30,442,700 | | | USD | 2,953,677 | | | Morgan Stanley & Co. | | 06/15/2023 | | $ | (146,413 | ) | |
| | | $ | (1,877,341 | ) | |
The following is a summary of investments classified by country exposure:
Country | | % of Net Assets(a) | |
United States | | | 84.37 | % | |
Canada | | | 3.07 | % | |
Finland | | | 1.61 | % | |
Bermuda | | | 1.50 | % | |
Taiwan | | | 1.34 | % | |
Netherlands | | | 1.30 | % | |
Denmark | | | 1.11 | % | |
United Kingdom | | | 1.06 | % | |
Germany | | | 0.80 | % | |
Switzerland | | | 0.77 | % | |
Belgium | | | 0.45 | % | |
Sweden | | | 0.45 | % | |
Republic of Korea | | | 0.37 | % | |
New Zealand | | | 0.23 | % | |
Australia | | | 0.00 | %(b) | |
Other Assets in Excess of Liabilities | | | 1.57 | % | |
| | | | 100.00 | % | |
(a) These percentages represent long positions only and are not net of short positions.
(b) Less than 0.005% of net assets.
Abbreviations:
AB - Aktiebolag is the Swedish term for a limited company.
ADR - American Depositary Receipt
AG - Aktiengesellschaft is a German term that refers to a corporation that is limited by shares, i.e., owned by shareholders.
A/S - Aktieselskab is a Danish term for a stock-based corporation.
bps - Basis Points. 100 Basis Points is equal to 1 percentage point.
CAD - Canadian dollar
CVR - Contingent Value Rights
DKK - Danish krone
EUR - Euro
GBP - British pound
LLC - Limited Liability Company
LP - Limited Partnership
Ltd. - Limited
NOK - Norwegian krone
N.V. - Naamloze Vennootschap is the Dutch term for a public limited liability corporation.
See Notes to Financial Statements.
Annual Report | May 31, 2023
15
Arbitrage Fund Portfolio of Investments (continued)
NZD - New Zealand dollar
Oyj - Osakeyhtio is the Finnish equivalent of a public limited company.
Plc - Public Limited Company
SE - SE Regulation. A European Company which can operate on a Europe-wide basis and be governed by Community law directly applicable in all Member States
SEK - Swedish krona
SOFR - Secured Overnight Financing Rate
USD - United States Dollar
The following table summarizes the Arbitrage Fund's investments and derivative financial instruments categorized in the fair value hierarchy as of May 31, 2023:
Investments in Securities at Fair Value* | | Level 1 | | Level 2 | | Level 3 | | Total | |
Assets | |
Common Stocks | |
Aerospace & Defense | | $ | 40,731,264 | | | $ | — | | | $ | — | | | $ | 40,731,264 | | |
Banks | | | 10,614,279 | | | | — | | | | — | | | | 10,614,279 | | |
Biotechnology | | | 127,578,822 | | | | — | | | | — | | | | 127,578,822 | | |
Chemicals | | | 27,537,199 | | | | — | | | | — | | | | 27,537,199 | | |
Commercial Services | | | 32,611,988 | | | | — | | | | — | | | | 32,611,988 | | |
Computers & Computer Services | | | 7,172,349 | | | | — | | | | — | | | | 7,172,349 | | |
Distribution/Wholesale | | | 50,001,938 | | | | — | | | | — | | | | 50,001,938 | | |
Diversified Financial Services | | | 27,924,442 | | | | — | | | | — | | | | 27,924,442 | | |
Electric | | | 40,372,588 | | | | — | | | | — | | | | 40,372,588 | | |
Electronics | | | 35,160,723 | | | | — | | | | — | | | | 35,160,723 | | |
Food | | | 11,725,894 | | | | — | | | | — | | | | 11,725,894 | | |
Healthcare - Products | | | 4,046,217 | | | | — | | | | — | | | | 4,046,217 | | |
Healthcare - Services | | | 16,160,258 | | | | — | | | | — | | | | 16,160,258 | | |
Insurance | | | 2,626,540 | | | | — | | | | — | | | | 2,626,540 | | |
Internet | | | — | | | | — | | | | 47,438,245 | | | | 47,438,245 | | |
Iron/Steel | | | 3,432,895 | | | | — | | | | — | | | | 3,432,895 | | |
Media | | | 44,746,905 | | | | — | | | | — | | | | 44,746,905 | | |
Mining | | | 5,836,640 | | | | — | | | | — | | | | 5,836,640 | | |
Office Furnishings | | | 2,719,432 | | | | — | | | | — | | | | 2,719,432 | | |
Oil & Gas | | | 23,163,647 | | | | — | | | | — | | | | 23,163,647 | | |
Pharmaceuticals | | | 9,433,766 | | | | — | | | | — | | | | 9,433,766 | | |
Pipelines | | | 44,722,755 | | | | — | | | | — | | | | 44,722,755 | | |
Real Estate | | | 16,332,984 | | | | — | | | | — | | | | 16,332,984 | | |
Real Estate Investment Trusts | | | 34,839,575 | | | | — | | | | — | | | | 34,839,575 | | |
Retail | | | 12,075,355 | | | | — | | | | — | | | | 12,075,355 | | |
Semiconductors | | | 19,596,642 | | | | — | | | | — | | | | 19,596,642 | | |
Software | | | 231,233,792 | | | | 37,191,129 | | | | 34,587,094 | | | | 303,012,015 | | |
Telecommunications | | | — | | | | — | | | | 0 | | | | 0 | | |
Rights | | | — | | | | 1,144,019 | | | | 4,823,685 | | | | 5,967,704 | | |
Convertible Corporate Bonds** | | | — | | | | 5,481,161 | | | | — | | | | 5,481,161 | | |
Mutual Funds | | | 71,734,267 | | | | — | | | | — | | | | 71,734,267 | | |
Private Investments | | | — | | | | — | | | | 581,400 | | | | 581,400 | | |
Warrants** | | | 10,161 | | | | — | | | | — | | | | 10,161 | | |
See Notes to Financial Statements.
www.arbitragefunds.com | 1-800-295-4485
16
Arbitrage Fund Portfolio of Investments (continued)
Investments in Securities at Fair Value* | | Level 1 | | Level 2 | | Level 3 | | Total | |
Purchased Options | | $ | 1,722,562 | | | $ | — | | | $ | — | | | $ | 1,722,562 | | |
Short-Term Investments | | | 38,138,838 | | | | — | | | | — | | | | 38,138,838 | | |
TOTAL | | $ | 994,004,717 | | | $ | 43,816,309 | | | $ | 87,430,424 | | | $ | 1,125,251,450 | | |
Other Financial Instruments*** | |
Assets | |
Forward Foreign Currency
Exchange Contracts | | $ | — | | | $ | 1,978,506 | | | $ | — | | | $ | 1,978,506 | | |
Equity Swaps | | | 28,068 | | | | — | | | | — | | | | 28,068 | | |
Liabilities | |
Common Stocks** | | | (55,207,449 | ) | | | — | | | | — | | | | (55,207,449 | ) | |
Forward Foreign Currency
Exchange Contracts | | | — | | | | (1,877,341 | ) | | | — | | | | (1,877,341 | ) | |
Equity Swaps | | | (13,928,051 | ) | | | — | | | | — | | | | (13,928,051 | ) | |
TOTAL | | $ | (69,107,432 | ) | | $ | 101,165 | | | $ | — | | | $ | (69,006,267 | ) | |
* Refer to Note 2 where leveling hierarchy is defined.
** Refer to Portfolio of Investments for sector information.
*** Other financial instruments are instruments such as securities sold short, equity swaps and forward foreign currency exchange contracts.
The following is a reconciliation of the fair valuations using significant unobservable inputs (Level 3) for the Fund's assets and liabilities during the period ended May 31, 2023:
Investments
in Securities | | Balance as of
May 31, 2022 | | Realized
Gain
(Loss) | | Change in
Unrealized
Appreciation
(Depreciation) | | Purchases | | Sales
Proceeds | | Transfers
into
Level 3 | | Transfers
out of
Level 3 | | Balance as of
May 31, 2023 | | Net change in
Unrealized
Appreciation
(Depreciation)
from
investments
still held as of
May 31, 2023 | |
Common
Stocks | | $ | 68,815,638 | | | $ | 1,763,299 | | | $ | 2,633,534 | | | $ | 79,679,493 | | | $ | (70,866,625 | ) | | $ | — | | | $ | — | | | $ | 82,025,339 | | | $ | 3,360,714 | | |
Rights | | | 1,277,503 | | | | 402,225 | | | | 163,695 | | | | 3,589,694 | | | | (609,432 | ) | | | — | | | | — | | | | 4,823,685 | | | | 168,357 | | |
Private
Investments | | | 290,700 | | | | — | | | | 290,700 | | | | — | | | | — | | | | — | | | | — | | | | 581,400 | | | | 290,700 | | |
Total | | $ | 70,383,841 | | | $ | 2,165,524 | | | $ | 3,087,929 | | | $ | 83,269,187 | | | $ | (71,476,057 | ) | | $ | — | | | $ | — | | | $ | 87,430,424 | | | $ | 3,819,771 | | |
The following table summarizes the quantitative inputs used for investments categorized as Level 3 of the fair value hierarchy as of May 31, 2023:
Investments in
Securities | | Fair Value at
May 31, 2023 | | Valuation
Technique | | Unobservable
Input | | Range of
Values | | Weighted
Average | |
Common Stocks
| | $ | 82,025,339
| | | Final proceeds
| | Final
determination
on dissent | | | $78.8287-$94.6474
| | | | $85.50
| | |
Rights
| | | 4,823,685
| | | Discounted,
probability
adjusted value | | Discount rate,
probability
| | | 10%, 9.43%-65%
| | | | 10%, 38.64%
| | |
See Notes to Financial Statements.
Annual Report | May 31, 2023
17
Arbitrage Fund Portfolio of Investments (continued)
Investments in
Securities | | Fair Value at
May 31, 2023 | | Valuation
Technique | | Unobservable
Input | | Range of
Values | | Weighted
Average | |
Private
Investments | | $ | 581,400
| | | Recovery
value | | Proceeds from
winding down | | | NA
| | | | NA
| | |
See Notes to Financial Statements.
www.arbitragefunds.com | 1-800-295-4485
18
Water Island Event-Driven Fund Manager Commentary
Water Island Event-Driven Fund | Tickers: AEDNX, AEDFX, AGEAX
The Fund's Goal and Main Investments
The Fund seeks to provide capital growth by investing in credit and equity securities involved in specific corporate events, with a focus on low volatility and low correlation relative to the broader capital markets.
Investment Strategy
The Fund's investment process follows a disciplined, fundamental approach that values risk mitigation while identifying compelling risk/reward opportunities available to us as we screen catalyst-driven corporate events, such as mergers and acquisitions, restructurings, refinancings, recapitalizations, spin-offs, litigation, regulatory changes, and bankruptcy. We analyze these events through three core approaches: merger arbitrage, equity special situations, and credit opportunities. We seek to generate investment returns that have low volatility and low correlation compared to the broader capital markets. We do not manage against any particular benchmark and believe that capital preservation in difficult markets is as important as generating positive returns within our low correlated, low volatility event-driven investment strategy. This process and approach have been an integral part of the culture at Water Island Capital since the firm's inception.
Fiscal Year Highlights
Water Island Event-Driven Fund Class I (AEDNX) returned -0.91% for the fiscal year ended May 31, 2023. The merger arbitrage and credit opportunities sub-strategies contributed to returns for the period, while the equity special situations sub-strategy was a detractor overall. Investments in the European region contributed to returns, while the Americas and Asia-Pacific regions detracted from returns. Industrials and health care were the top performing sectors, while financials and information technology detracted the most from returns.
The Fund may utilize derivatives for several purposes, primarily to implement position-level hedges, portfolio-level hedges, or currency hedges. During the fiscal year, the Fund's investments in derivative instruments detracted from returns. Derivative performance was in line with expectations given prevailing market conditions over the period.
The Fund's top contributor for the period was its investment in the acquisition of Twitter by Elon Musk. In April 2022, Elon Musk – CEO of Tesla and SpaceX and one of the richest people in the world – launched an unsolicited bid to personally acquire the 91% of US social media company Twitter that he did not already own for $54.20 per share in cash. Musk put together a financing package combining commitments from a group of banks led by Morgan Stanley and private equity firms with his own personal assets, including loans backed by his holdings in Tesla stock. Musk's commitment to the deal seemingly wavered in line with the fortunes of Tesla shares, which traded down significantly after Twitter's board agreed to the transaction. Musk's capriciousness led to significant volatility in the deal spread, as he attempted to back out of the deal and Twitter filed suit in the Delaware Court of Chancery to enforce the original merger agreement. Rather than undergo litigation, Musk ultimately capitulated and agreed to close the deal on its original terms. Our analysis of the strength of the merger agreement (and thus Musk's likelihood of losing in court) gave us the confidence to maintain exposure to this deal throughout its life. Volatility throughout the deal timeline allowed us to trade around the spread and add exposure at attractive rates of return, and the Fund was rewarded when the deal was completed in calendar Q4 2022.
Annual Report | May 31, 2023
19
Water Island Event-Driven Fund Manager Commentary (continued)
The second-largest contributor for the fiscal year was the Fund's position in the acquisition of Change Healthcare by UnitedHealth Group. In January 2021, Change Healthcare, a US-based medical software and technology provider, agreed to be acquired by OptumInsight, a subsidiary of UnitedHealth Group (which also owns the country's largest health insurer) providing medical information technology services, for $8.8 billion in cash. After a lengthy regulatory review, the DOJ sued to stop the transaction in February 2022, alleging the combination would harm competition in multiple markets. In September, however, a federal judge ruled against the DOJ's attempt to intervene in the deal, allowing the merger to proceed. The deal subsequently closed early in Q4, leading to gains for the Fund.
Conversely, the top detractor in the portfolio was the Fund's position in the failed acquisition of First Horizon by Toronto-Dominion Bank ("TD"). In February 2022, First Horizon – a regional bank based in Tennessee that operates throughout the Southeast US – agreed to be acquired by TD – a Canada-based multinational banking and financial services corporation – for $13.4 billion in cash. While First Horizon was not directly connected to Silicon Valley Bank, the company's shares were a casualty of indiscriminate selling across the US regional banking industry following the news of Silicon Valley Bank's failure. This, combined with an extended regulatory review in Canada as well as rumors of a potential price cut, pressured the deal's spread. Through the volatility, we opted to maintain exposure to the transaction as mere weeks prior TD had publicly reaffirmed its commitment to the transaction – which, due to First Horizon's relatively small size, would have been one of very few paths for TD to gain scale via acquisition – and our outlook on the deal fundamentals had not changed. As the regional banking crisis continued to unfold, leading to the additional failures of Signature Bank and First Republic, volatility in First Horizon shares escalated. Eventually, in May 2023, when no progress had been made on the antitrust review front, First Horizon and TD mutually agreed to terminate the merger due to "uncertainty" as to when the deal might gain the lagging regulatory approvals.
The second-largest detractor for the period was the Fund's position in the failed acquisition of Rogers by DuPont de Nemours. In November 2021, Rogers – a US-based manufacturer and seller of specialty polymer composite materials and components – agreed to be acquired by DuPont – a US-based provider of chemicals, plastic materials, fibers, and consumer products – for $5.3 billion in cash. This transaction experienced an extended regulatory review at the State Administration for Market Regulation ("SAMR") in China. In November 2022, when the deal's termination date was reached with SAMR approval still outstanding, DuPont opted to walk away rather than agree to extend the timeline. This caught many arbitrageurs by surprise, as the companies had jointly reaffirmed their commitment to the merger and to achieving a resolution with SAMR just two months prior. Speculation around DuPont's reasons for walking away and year-end tax-loss harvesting drove event-driven investors to exit their positions en masse, which exacerbated the price reaction of Rogers shares, leading them to trade at depressed levels – well under what we believed to be a fair valuation. We opted to follow our deal break protocol and wait for more normalized trading levels, seeking to unwind our position in an orderly fashion. While we were rewarded as Rogers shares traded nearly 37% higher during calendar Q1 2023, overall, the deal break remained a top detractor for the Fund.
www.arbitragefunds.com | 1-800-295-4485
20
Water Island Event-Driven Fund Portfolio Information
Performance (annualized returns as of May 31, 2023)
| | | One
Year | | Five
Year | | Ten
Year | | Since
Inception* | |
Water Island Event-Driven Fund Class R | | | -1.11 | % | | | 2.88 | % | | | 1.65 | % | | | 1.94 | % | |
Water Island Event-Driven Fund Class I | | | -0.91 | % | | | 3.13 | % | | | 1.90 | % | | | 2.19 | % | |
Water Island Event-Driven Fund, Class A** | | | -4.38 | % | | | 2.20 | % | | | 1.32 | % | | | 1.32 | % | |
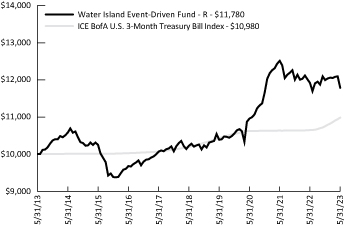
ICE BofA U.S. 3-Month Treasury Bill Index | | | 3.14 | % | | | 1.49 | % | | | 0.94 | % | | | 0.76 | % | |
Current performance may be higher or lower than performance quoted above. Any performance data quoted represents past performance, and the investment return and principal value of an investment in the Fund will fluctuate so that an investor's shares, when redeemed, may be worth more or less than their original cost. Past performance is no guarantee of future results. Returns shown above include the reinvestment of all dividends and capital gains. Performance results do not include adjustments made for financial reporting purposes in accordance with U.S. generally accepted accounting principles and may differ from the amount reported in the Financial Highlights. Performance numbers reflect fee waivers and/or expense reimbursements by the Adviser and any recoupment by the Adviser of waived fees. Absent any applicable waivers and/or expense reimbursements, performance numbers would be reduced. You can obtain performance data current to the most recent month end by calling 1-800-295-4485 or going to www.arbitragefunds.com. This table does not reflect the deduction of taxes that a shareholder would pay on Fund distributions or the redemption of Fund shares.
* Class R and Class I inception: 10/1/10; Class A inception: 6/1/13. The "Since Inception" returns for securities indices are for the inception date of Class R and Class I shares.
** After sales charge. Class A shares are subject to a maximum front-end sales load of 2.75% on purchases up to $250,000. The shares are also subject to a deferred sales charge of up to 1.00% on purchases of $250,000 or more purchased without a front-end sales charge and redeemed within 18 months of purchase.
The Total Annual Fund Operating Expenses for Class R, Class I and Class A are 1.80%, 1.55% and 1.80%, respectively. The Adviser has contractually agreed to limit the total annual operating expenses of the Fund, not including taxes, interest, dividends on short positions, brokerage commissions, acquired fund fees and expenses, and other costs incurred in connection with the purchase or sale of portfolio securities, so they do not exceed 1.69%, 1.44% and 1.69% for Class R, Class I and Class A, respectively. The agreement remains in effect until September 30, 2024, unless terminated earlier by the Board of Trustees. These expense ratios are as stated in the current prospectus and may differ from the expense ratios disclosed in the financial highlights in this report.
The ICE BofA U.S. 3-Month Treasury Bill Index tracks the performance of the U.S. dollar denominated U.S. Treasury Bills publicly issued in the U.S. domestic market with a remaining term to final maturity of less than 3 months.
An investor may not invest directly in an index.
Annual Report | May 31, 2023
21
Water Island Event-Driven Fund Portfolio Information (continued)
Growth of $10,000 Investment
The chart represents historical performance of a hypothetical investment of $10,000 in the Class R shares of the Fund over ten years. Past performance does not guarantee future results. This chart does not reflect the deduction of taxes that a shareholder would pay on Fund distributions or the redemption of Fund shares.
Sector Weighting
The following chart shows the sector weightings of Water Island Event Driven Fund's investments (including short sales and excluding derivatives) as of the report date.

* Concentration Risk: If a large percentage of mergers or event-driven investment opportunities taking place within the U.S. are within one industry over a given period of time, the Fund may invest a large portion of its assets in securities of issuers in a single industry for that period of time. During such a period of concentration, the Fund may be subject to greater volatility with respect to its portfolio securities than a fund that is more broadly diversified.
www.arbitragefunds.com | 1-800-295-4485
22
Water Island Event-Driven Fund Portfolio of Investments
| | | Shares | | Value | |
COMMON STOCKS - 91.57% | |
Aerospace & Defense - 4.04% | |
Aerojet Rocketdyne Holdings, Inc.(a) | | | 84,946 | | | $ | 4,627,858 | | |
Banks - 1.04% | |
First Horizon Corp.(b) | | | 115,970 | | | | 1,195,651 | | |
Biotechnology - 13.26% | |
BELLUS Health, Inc.(a) | | | 105,718 | | | | 1,544,540 | | |
CTI BioPharma Corp.(a) | | | 123,138 | | | | 1,114,399 | | |
Horizon Therapeutics Plc(a)(b) | | | 54,866 | | | | 5,488,246 | | |
IVERIC bio, Inc.(a)(b) | | | 19,737 | | | | 745,072 | | |
Prometheus Biosciences, Inc.(a) | | | 11,757 | | | | 2,336,116 | | |
Seagen, Inc.(a)(c) | | | 11,571 | | | | 2,264,445 | | |
Swedish Orphan Biovitrum AB(a) | | | 31,025 | | | | 623,256 | | |
VectivBio Holding AG(a) | | | 65,041 | | | | 1,076,428 | | |
| | | | 15,192,502 | | |
Chemicals - 2.72% | |
Diversey Holdings Ltd.(a) | | | 234,929 | | | | 1,956,958 | | |
Rogers Corp.(a) | | | 7,325 | | | | 1,153,468 | | |
| | | | 3,110,426 | | |
Commercial Services - 3.17% | |
Caverion Oyj | | | 137,982 | | | | 1,238,907 | | |
Moneylion, Inc.(a)(d) | | | 8,781 | | | | 97,819 | | |
RB Global, Inc. | | | 4,275 | | | | 222,642 | | |
Triton International Ltd.(c) | | | 25,086 | | | | 2,073,107 | | |
| | | | 3,632,475 | | |
Computers & Computer Services - 0.73% | |
Crane NXT Co.(b)(c) | | | 2,519 | | | | 132,575 | | |
Ordina N.V. | | | 117,061 | | | | 708,216 | | |
| | | | 840,791 | | |
Distribution/Wholesale - 5.31% | |
Uni-Select, Inc.(a) | | | 32,998 | | | | 1,135,909 | | |
Univar Solutions, Inc.(a)(c) | | | 138,889 | | | | 4,947,226 | | |
| | | | 6,083,135 | | |
Diversified Financial Services - 2.26% | |
Focus Financial Partners, Inc., Class A(a) | | | 49,680 | | | | 2,587,831 | | |
Electric - 4.01% | |
PNM Resources, Inc. | | | 100,132 | | | | 4,598,061 | | |
Electronics - 3.79% | |
National Instruments Corp.(b)(c) | | | 75,184 | | | | 4,345,635 | | |
See Notes to Financial Statements.
Annual Report | May 31, 2023
23
Water Island Event-Driven Fund Portfolio of Investments (continued)
| | | Shares | | Value | |
COMMON STOCKS - 91.57% (Continued) | |
Entertainment - 0.15% | |
Cineplex, Inc.(a) | | | 23,133 | | | $ | 166,660 | | |
Food - 1.01% | |
Albertsons Cos., Inc., Class A(c) | | | 56,581 | | | | 1,151,989 | | |
Healthcare - Products - 0.40% | |
Globus Medical, Inc., Class A(a)(c) | | | 8,537 | | | | 462,108 | | |
Healthcare - Services - 1.42% | |
Syneos Health, Inc.(a)(c) | | | 39,108 | | | | 1,626,893 | | |
Insurance - 0.32% | |
Hartford Financial Services Group, Inc. | | | 5,355 | | | | 366,925 | | |
Internet - 3.58% | |
Just Eat Takeaway.com N.V.(a)(e) | | | 7,623 | | | | 114,629 | | |
Zendesk, Inc.(a)(f) | | | 50,491 | | | | 3,980,140 | | |
| | | | 4,094,769 | | |
Iron/Steel - 0.29% | |
Kloeckner & Co. SE | | | 32,369 | | | | 333,537 | | |
Machinery - Diversified - 0.16% | |
Crane Co. | | | 2,519 | | | | 183,031 | | |
Media - 3.79% | |
TEGNA, Inc. | | | 238,865 | | | | 3,700,019 | | |
Telenet Group Holding N.V. | | | 29,802 | | | | 634,877 | | |
| | | | 4,334,896 | | |
Mining - 0.63% | |
Arconic Corp.(a) | | | 24,924 | | | | 720,553 | | |
Oil & Gas - 2.44% | |
PDC Energy, Inc.(c) | | | 30,082 | | | | 2,064,227 | | |
Ranger Oil Corp., Class A | | | 19,855 | | | | 729,671 | | |
| | | | 2,793,898 | | |
Pharmaceuticals - 1.49% | |
Bayer AG | | | 9,665 | | | | 538,654 | | |
Heska Corp.(a) | | | 9,725 | | | | 1,164,375 | | |
| | | | 1,703,029 | | |
Pipelines - 0.78% | |
Magellan Midstream Partners LP(a) | | | 14,792 | | | | 890,626 | | |
Real Estate - 1.71% | |
Radius Global Infrastructure, Inc., Class A(a) | | | 132,306 | | | | 1,958,129 | | |
See Notes to Financial Statements.
www.arbitragefunds.com | 1-800-295-4485
24
Water Island Event-Driven Fund Portfolio of Investments (continued)
| | | Shares | | Value | |
COMMON STOCKS - 91.57% (Continued) | |
Real Estate Investment Trusts - 2.25% | |
Life Storage, Inc.(c) | | | 14,696 | | | $ | 1,872,123 | | |
Urstadt Biddle Properties, Inc., Class A(c) | | | 36,140 | | | | 699,309 | | |
| | | | 2,571,432 | | |
Retail - 1.30% | |
Ruth's Hospitality Group, Inc. | | | 69,599 | | | | 1,491,507 | | |
Semiconductors - 1.48% | |
Magnachip Semiconductor Corp.(a) | | | 37,044 | | | | 378,960 | | |
Silicon Motion Technology Corp., ADR | | | 21,531 | | | | 1,318,559 | | |
| | | | 1,697,519 | | |
Software - 27.70% | |
Absolute Software Corp. | | | 123,607 | | | | 1,385,635 | | |
Activision Blizzard, Inc.(a) | | | 85,927 | | | | 6,891,345 | | |
Avalara, Inc.(a)(f) | | | 30,735 | | | | 2,908,988 | | |
Black Knight, Inc.(a) | | | 5,104 | | | | 294,909 | | |
Cvent Holding Corp.(a) | | | 216,636 | | | | 1,839,240 | | |
EMIS Group Plc | | | 23,960 | | | | 397,599 | | |
ForgeRock, Inc., Class A(a)(c) | | | 83,238 | | | | 1,675,581 | | |
Momentive Global, Inc.(a) | | | 478,152 | | | | 4,523,318 | | |
Qualtrics International, Inc., Class A(a)(b) | | | 217,280 | | | | 3,928,422 | | |
Rovio Entertainment Oyj(e) | | | 57,073 | | | | 561,249 | | |
SimCorp A/S | | | 12,121 | | | | 1,256,179 | | |
Software AG | | | 19,399 | | | | 685,104 | | |
VMware, Inc., Class A(a)(c) | | | 39,503 | | | | 5,383,864 | | |
| | | | 31,731,433 | | |
Transportation - 0.34% | |
Exmar N.V. | | | 34,366 | | | | 393,052 | | |
TOTAL COMMON STOCKS
(Cost $112,274,366) | | | 104,886,351 | | |
RIGHTS(a) - 0.40% | |
Bristol-Myers Squibb Co. CVR(d) | | | 67,803 | | | | 67,803 | | |
Concert Pharmaceuticals, Inc. CVR, Expires 12/31/2029(d)(f) | | | 154,954 | | | | 58,635 | | |
Contra Abiomed, Inc. CVR, Expires 12/31/2030(d) | | | 13,890 | | | | 24,308 | | |
Contra Albireo Pharma, Inc. CVR, Expires 12/31/2027(d)(f) | | | 34,047 | | | | 74,927 | | |
Contra Amryt Pharma Plc CVR, Expires 12/31/2024(d)(f) | | | 204,285 | | | | 4,966 | | |
Contra Amryt Pharma Plc CVR, Expires 12/31/2024(d)(f) | | | 204,285 | | | | 3,311 | | |
Contra CinCor Pharma, Inc. CVR, Expires 12/31/2027(d)(f) | | | 39,632 | | | | 124,429 | | |
Resolute Forest Products, Inc. CVR, Expires 6/30/2024(d)(f) | | | 68,936 | | | | 100,226 | | |
TOTAL RIGHTS
(Cost $484,860) | | | 458,605 | | |
See Notes to Financial Statements.
Annual Report | May 31, 2023
25
Water Island Event-Driven Fund Portfolio of Investments (continued)
| | | Maturity
Date | | Rate | | Principal
Amount | | Value | |
CONVERTIBLE CORPORATE BONDS - 0.94% | |
Entertainment - 0.26% | |
Cineplex, Inc.(e) | | 09/30/2025 | | | 5.750 | % | | $ | 392,000 | | | $ | 300,559 | | |
Healthcare - Services - 0.34% | |
UpHealth, Inc.(e) | | 06/15/2026 | | | 6.250 | % | | | 217,000 | | | | 62,795 | | |
UpHealth, Inc., Variable Rate,
(SOFR plus 9.00%)(e) | | 12/15/2025 | | | 14.060 | % | | | 409,000 | | | | 325,155 | | |
| | | | 387,950 | | |
Software - 0.34% | |
Kaleyra, Inc.(e) | | 06/01/2026 | | | 6.125 | % | | | 488,000 | | | | 384,991 | | |
TOTAL CONVERTIBLE CORPORATE BONDS
(Cost $1,402,394) | | | 1,073,500 | | |
| | | Shares | | Value | |
WARRANTS(a) - 0.00%(g) | |
Commercial Services - 0.00%(g) | |
Moneylion, Inc., Exercise Price $11.50, Expires 09/22/2026 | | | 22,640 | | | $ | 792 | | |
TOTAL WARRANTS
(Cost $0) | | | 792 | | |
PRIVATE INVESTMENTS(a)(d)(f)(h) - 0.04% | |
Fast Capital LLC | | | 22,800 | | | | 45,600 | | |
TOTAL PRIVATE INVESTMENTS
(Cost $23,591) | | | 45,600 | | |
| | | Expiration
Date | | Exercise
Price | | Notional
Amount | | Contracts | | Value | |
PURCHASED OPTIONS(a) - 0.15% | |
Call Options Purchased - 0.12% | |
Broadcom, Inc. | |
| | | 06/2023 | | $ | 810.00 | | | $ | 484,776 | | | | 6 | | | $ | 22,410 | | |
| | | 06/2023 | | | 815.00 | | | | 484,776 | | | | 6 | | | | 21,420 | | |
| | | 06/2023 | | | 810.00 | | | | 484,776 | | | | 6 | | | | 26,520 | | |
| | | 06/2023 | | | 815.00 | | | | 484,776 | | | | 6 | | | | 25,260 | | |
First Horizon Corp. | | 06/2023 | | | 12.00 | | | | 507,252 | | | | 492 | | | | 3,690 | | |
IVERIC bio, Inc. | |
| | | 07/2023 | | | 40.00 | | | | 373,725 | | | | 99 | | | | 2,227 | | |
| | | 09/2023 | | | 40.00 | | | | 373,725 | | | | 99 | | | | 3,960 | | |
MaxLinear, Inc. | | 09/2023 | | | 30.00 | | | | 245,364 | | | | 84 | | | | 28,140 | | |
TOTAL CALL OPTIONS PURCHASED
(Cost $131,238) | | | 133,627 | | |
See Notes to Financial Statements.
www.arbitragefunds.com | 1-800-295-4485
26
Water Island Event-Driven Fund Portfolio of Investments (continued)
| | | Expiration
Date | | Exercise
Price | | Notional
Amount | | Contracts | | Value | |
PURCHASED OPTIONS(a) - 0.15% (Continued) | |
Put Options Purchased - 0.03% | |
Crane NXT Co. | | 06/2023 | | $ | 110.00 | | | $ | 131,575 | | | | 25 | | | $ | 0 | | |
First Horizon Corp. | | 06/2023 | | | 9.00 | | | | 907,280 | | | | 880 | | | | 22,000 | | |
Horizon Therapeutics Plc | |
| | | 08/2023 | | | 95.00 | | | | 670,201 | | | | 67 | | | | 11,390 | | |
| | | 08/2023 | | | 100.00 | | | | 90,027 | | | | 9 | | | | 2,723 | | |
National Instruments Corp. | |
| | | 06/2023 | | | 40.00 | | | | 254,320 | | | | 44 | | | | 0 | | |
| | | 06/2023 | | | 45.00 | | | | 236,980 | | | | 41 | | | | 0 | | |
Qualtrics International, Inc. | | 06/2023 | | | 12.50 | | | | 338,096 | | | | 187 | | | | 0 | | |
TOTAL PUT OPTIONS PURCHASED
(Cost $132,365) | | | 36,113 | | |
TOTAL PURCHASED OPTIONS
(Cost $263,603) | | | 169,740 | | |
| | | Yield | | Shares | | Value | |
SHORT-TERM INVESTMENTS - 4.34% | |
Money Market Funds | |
Morgan Stanley Institutional Liquidity Funds -
Government Portfolio | | | 4.997 | %(i) | | | 2,486,408 | | | $ | 2,486,408 | | |
State Street Institutional U.S. Government
Money Market Fund, Premier Class | | | 5.129 | %(i) | | | 2,486,407 | | | | 2,486,407 | | |
| | | | 4,972,815 | | |
TOTAL SHORT-TERM INVESTMENTS
(Cost $4,972,815) | | | 4,972,815 | | |
Total Investments - 97.44%
(Cost $119,421,629) | | | 111,607,403 | | |
Other Assets in Excess of Liabilities - 2.56%(j) | | | 2,932,422 | | |
NET ASSETS - 100.00% | | $ | 114,539,825 | | |
Portfolio Footnotes
(a) Non-income-producing security.
(b) Underlying security for a written/purchased call/put option.
(c) Security, or a portion of security, is being held as collateral for swaps, short sales, written option contracts or forward foreign currency exchange contracts. At May 31, 2023, the aggregate fair market value of those securities was $ 18,129,170 representing 15.83% of net assets.
(d) Restricted securities (including private placements) - The Fund may own investment securities that have other legal or contractual limitations. At the end of the period, the value of restricted securities (excluding 144A issues) amounted to $602,024 or 0.53% of net assets.
See Notes to Financial Statements.
Annual Report | May 31, 2023
27
Water Island Event-Driven Fund Portfolio of Investments (continued)
Restricted Security | | Acquisition Date | | Acquisition Cost | |
Bristol-Myers Squibb Co. CVR | | 11/20/2020 | | $ | 110,781 | | |
Concert Pharmaceuticals, Inc. CVR, Expires 12/31/2029 | | 03/07/2023 | | | 57,333 | | |
Contra Abiomed, Inc. CVR, Expires 12/31/2030 | | 12/21/2022 | | | 14,168 | | |
Contra Albireo Pharma, Inc. CVR, Expires 12/31/2027 | | 03/03/2023 | | | 73,201 | | |
Contra Amryt Pharma Plc CVR, Expires 12/31/2024 | | 04/13/2023 | | | 5,107 | | |
Contra Amryt Pharma Plc CVR, Expires 12/31/2024 | | 04/13/2023 | | | 5,107 | | |
Contra CinCor Pharma, Inc. CVR, Expires 12/31/2027 | | 02/23/2023 | | | 121,274 | | |
Fast Capital LLC | | 08/18/2020 | | | 23,591 | | |
Moneylion, Inc. | | 06/19/2020 | | | 1,926,136 | | |
Resolute Forest Products, Inc. CVR, Expires 6/30/2024 | | 03/01/2023 | | | 97,889 | | |
Total | | | | $ | 2,434,587 | | |
(e) Security exempt from registration under Rule 144A of the Securities Act of 1933. These securities may be resold in transactions exempt from registration, normally to qualified institutional buyers. As of May 31, 2023, these securities had a total value of $1,749,378 or 1.53% of net assets.
(f) Security fair valued using significant unobservable inputs and classified as a Level 3 security. As of May 31, 2023, the total fair market value of these securities was $7,301,222, representing 6.37% of net assets.
(g) Less than 0.005% of net assets.
(h) Represents a holding that is a direct investment into a private company and is not a listed or publicly traded entity.
(i) Rate shown is the 7-day effective yield as of May 31, 2023.
(j) Includes cash held as collateral for short sales and written option contracts.
SCHEDULE OF SECURITIES SOLD SHORT | | Shares | | Value | |
COMMON STOCKS SOLD SHORT - (5.79%) | |
Entertainment - (0.02%) | |
Cineplex, Inc. | | | (3,228 | ) | | $ | (23,256 | ) | |
Healthcare - Products - (0.08%) | |
NuVasive, Inc. | | | (2,561 | ) | | | (97,728 | ) | |
Oil & Gas - (2.12%) | |
Baytex Energy Corp. | | | (103,365 | ) | | | (325,895 | ) | |
Chevron Corp. | | | (13,952 | ) | | | (2,101,450 | ) | |
| | | | (2,427,345 | ) | |
Pipelines - (0.49%) | |
ONEOK, Inc. | | | (9,866 | ) | | | (559,007 | ) | |
Real Estate Investment Trusts - (2.24%) | |
Extra Space Storage, Inc. | | | (9,865 | ) | | | (1,423,224 | ) | |
Public Storage | | | (1,540 | ) | | | (436,282 | ) | |
Regency Centers Corp. | | | (12,541 | ) | | | (705,682 | ) | |
| | | | (2,565,188 | ) | |
See Notes to Financial Statements.
www.arbitragefunds.com | 1-800-295-4485
28
Water Island Event-Driven Fund Portfolio of Investments (continued)
SCHEDULE OF SECURITIES SOLD SHORT | | Shares | | Value | |
COMMON STOCKS SOLD SHORT - (5.79%) (Continued) | |
Semiconductors - (0.84%) | |
Broadcom, Inc. | | | (884 | ) | | $ | (714,237 | ) | |
MaxLinear, Inc. | | | (8,355 | ) | | | (244,049 | ) | |
| | | | (958,286 | ) | |
TOTAL SECURITIES SOLD SHORT
(Proceeds $6,893,868) | | $ | (6,630,810 | ) | |
WRITTEN OPTIONS | | Expiration
Date | | Exercise
Price | | Notional
Amount | | Contracts | | Value | |
Written Call Options | |
Crane NXT Co. | | 06/2023 | | $ | 130.00 | | | $ | (131,575 | ) | | | (25 | ) | | $ | (2,563 | ) | |
TOTAL WRITTEN OPTIONS
(Premiums received $8,708) | | $ | (2,563 | ) | |
EQUITY SWAP CONTRACTS
Swap
Counterparty/
Payment
Frequency | | Reference
Obligation | | Rate
Paid/
Received
by the
Fund | | Termination
Date | | Upfront
Payments
Made | | Upfront
Payments
Received | | Market
Value | | Notional
Amount | | Unrealized
Appreciation | |
Morgan
Stanley &
Co./
Upon
Termination
| | Brookfield
Infrastructure
Corp.
| | Received
1 Month-
Federal
Rate
Minus
58bps
(-4.500%) | |
10/29/2024 | | $ | — | | | $ | — | | | $ | 3,387 | | | USD | 176,861 | | | $ | 3,387 | | |
Swap
Counterparty/
Payment
Frequency | | Reference
Obligation | | Rate
Paid/
Received
by the
Fund | | Termination
Date | | Upfront
Payments
Made | | Upfront
Payments
Received | | Market
Value | | Notional
Amount | | Unrealized
Depreciation | |
Morgan
Stanley &
Co./
Upon
Termination
| | Broadcom,
Inc.
| | Received
1 Month-
Federal
Rate
Minus
40bps
(-4.680%) | |
10/29/2024 | | $ | — | | | $ | — | | | $ | (1,165,673 | ) | | USD | 2,140,499 | | | $ | (1,165,673 | ) | |
See Notes to Financial Statements.
Annual Report | May 31, 2023
29
Water Island Event-Driven Fund Portfolio of Investments (continued)
Swap
Counterparty/
Payment
Frequency | | Reference
Obligation | | Rate
Paid/
Received
by the
Fund | | Termination
Date | | Upfront
Payments
Made | | Upfront
Payments
Received | | Market
Value | | Notional
Amount | | Unrealized
Depreciation | |
Morgan
Stanley &
Co./
Upon
Termination
| | Intercontinental
Exchange,
Inc.
| | Received
1 Month-
Federal
Rate
Minus
40bps
(-4.680%) | |
10/29/2024 | | $ | — | | | $ | — | | | $ | (943 | ) | | USD | 35,928 | | | $ | (943 | ) | |
| | | | | | | | | | | | | $ | (1,166,616 | ) | | | | | | $ | (1,166,616 | ) | |
OUTSTANDING FORWARD FOREIGN CURRENCY EXCHANGE CONTRACTS
Currency
Purchased | | Currency Sold | | Counterparty | | Settlement
Date | | Unrealized
Appreciation | |
CAD | 456,600 | | | USD | 335,706 | | | Morgan Stanley & Co. | | 06/15/2023 | | $ | 759 | | |
USD | 37,885 | | | CAD | 51,100 | | | Morgan Stanley & Co. | | 06/15/2023 | | | 230 | | |
USD | 1,236,411 | | | DKK | 8,588,500 | | | Morgan Stanley & Co. | | 06/15/2023 | | | 2,531 | | |
EUR | 29,600 | | | USD | 31,610 | | | Morgan Stanley & Co. | | 06/15/2023 | | | 53 | | |
USD | 7,360,085 | | | EUR | 6,769,900 | | | Morgan Stanley & Co. | | 06/15/2023 | | | 118,379 | | |
GBP | 982,700 | | | USD | 1,219,139 | | | Morgan Stanley & Co. | | 06/15/2023 | | | 3,621 | | |
USD | 1,229,876 | | | GBP | 986,100 | | | Morgan Stanley & Co. | | 06/15/2023 | | | 2,884 | | |
SEK | 372,300 | | | USD | 34,250 | | | Morgan Stanley & Co. | | 06/15/2023 | | | 81 | | |
USD | 943,959 | | | SEK | 9,921,500 | | | Morgan Stanley & Co. | | 06/15/2023 | | | 29,052 | | |
| | | $ | 157,590 | | |
Currency
Purchased | | Currency Sold | | Counterparty | | Settlement
Date | | Unrealized
Depreciation | |
CAD | 6,870,200 | | | USD | 5,106,205 | | | Morgan Stanley & Co. | | 06/15/2023 | | $ | (43,607 | ) | |
USD | 6,563,738 | | | CAD | 8,976,200 | | | Morgan Stanley & Co. | | 06/15/2023 | | | (50,756 | ) | |
USD | 45,828 | | | DKK | 320,400 | | | Morgan Stanley & Co. | | 06/15/2023 | | | (203 | ) | |
EUR | 1,727,600 | | | USD | 1,887,156 | | | Morgan Stanley & Co. | | 06/15/2023 | | | (39,158 | ) | |
GBP | 112,700 | | | USD | 141,563 | | | Morgan Stanley & Co. | | 06/15/2023 | | | (1,332 | ) | |
USD | 2,089,927 | | | GBP | 1,710,800 | | | Morgan Stanley & Co. | | 06/15/2023 | | | (38,800 | ) | |
SEK | 2,736,100 | | | USD | 265,622 | | | Morgan Stanley & Co. | | 06/15/2023 | | | (13,312 | ) | |
| | | $ | (187,168 | ) | |
See Notes to Financial Statements.
www.arbitragefunds.com | 1-800-295-4485
30
Water Island Event-Driven Fund Portfolio of Investments (continued)
The following is a summary of investments classified by country exposure:
Country | | % of Net Assets(a) | |
United States | | | 82.52 | % | |
Canada | | | 4.15 | % | |
Bermuda | | | 1.81 | % | |
Finland | | | 1.57 | % | |
Germany | | | 1.36 | % | |
Taiwan | | | 1.15 | % | |
Denmark | | | 1.10 | % | |
Switzerland | | | 0.94 | % | |
Belgium | | | 0.90 | % | |
Netherlands | | | 0.72 | % | |
Sweden | | | 0.54 | % | |
United Kingdom | | | 0.35 | % | |
Republic of Korea | | | 0.33 | % | |
Other Assets in Excess of Liabilities | | | 2.56 | % | |
| | | | 100.00 | % | |
(a) These percentages represent long positions only and are not net of short positions.
Abbreviations:
AB - Aktiebolag is the Swedish term for a limited company.
ADR - American Depositary Receipt
AG - Aktiengesellschaft is a German term that refers to a corporation that is limited by shares, i.e., owned by shareholders.
A/S - Aktieselskab is a Danish term for a stock-based corporation.
bps - Basis Points. 100 Basis Points is equal to 1 percentage point.
CAD - Canadian dollar
CVR - Contingent Value Rights
DKK - Danish krone
EUR - Euro
GBP - British pound
LLC - Limited Liability Company
LP - Limited Partnership
Ltd. - Limited
N.V. - Naamloze Vennootschap is the Dutch term for a public limited liability corporation.
Oyj - Osakeyhtio is the Finnish equivalent of a public limited company.
Plc - Public Limited Company
SE - SE Regulation. A European Company which can operate on a Europe-wide basis and be governed by Community law directly applicable in all Member States
SEK - Swedish krona
SOFR - Secured Overnight Financing Rate
USD - United States Dollar
See Notes to Financial Statements.
Annual Report | May 31, 2023
31
Water Island Event-Driven Fund Portfolio of Investments (continued)
The following table summarizes the Water Island Event-Driven Fund's investments and derivative financial instruments categorized in the fair value hierarchy as of May 31, 2023:
Investments in Securities at Fair Value* | | Level 1 | | Level 2 | | Level 3 | | Total | |
Assets | |
Common Stocks | |
Aerospace & Defense | | $ | 4,627,858 | | | $ | — | | | $ | — | | | $ | 4,627,858 | | |
Banks | | | 1,195,651 | | | | — | | | | — | | | | 1,195,651 | | |
Biotechnology | | | 15,192,502 | | | | — | | | | — | | | | 15,192,502 | | |
Chemicals | | | 3,110,426 | | | | — | | | | — | | | | 3,110,426 | | |
Commercial Services | | | 3,632,475 | | | | — | | | | — | | | | 3,632,475 | | |
Computers & Computer Services | | | 840,791 | | | | — | | | | — | | | | 840,791 | | |
Distribution/Wholesale | | | 6,083,135 | | | | — | | | | — | | | | 6,083,135 | | |
Diversified Financial Services | | | 2,587,831 | | | | — | | | | — | | | | 2,587,831 | | |
Electric | | | 4,598,061 | | | | — | | | | — | | | | 4,598,061 | | |
Electronics | | | 4,345,635 | | | | — | | | | — | | | | 4,345,635 | | |
Entertainment | | | 166,660 | | | | — | | | | — | | | | 166,660 | | |
Food | | | 1,151,989 | | | | — | | | | — | | | | 1,151,989 | | |
Healthcare - Products | | | 462,108 | | | | — | | | | — | | | | 462,108 | | |
Healthcare - Services | | | 1,626,893 | | | | — | | | | — | | | | 1,626,893 | | |
Insurance | | | 366,925 | | | | — | | | | — | | | | 366,925 | | |
Internet | | | 114,629 | | | | — | | | | 3,980,140 | | | | 4,094,769 | | |
Iron/Steel | | | 333,537 | | | | — | | | | — | | | | 333,537 | | |
Machinery - Diversified | | | 183,031 | | | | — | | | | — | | | | 183,031 | | |
Media | | | 4,334,896 | | | | — | | | | — | | | | 4,334,896 | | |
Mining | | | 720,553 | | | | — | | | | — | | | | 720,553 | | |
Oil & Gas | | | 2,793,898 | | | | — | | | | — | | | | 2,793,898 | | |
Pharmaceuticals | | | 1,703,029 | | | | — | | | | — | | | | 1,703,029 | | |
Pipelines | | | 890,626 | | | | — | | | | — | | | | 890,626 | | |
Real Estate | | | 1,958,129 | | | | — | | | | — | | | | 1,958,129 | | |
Real Estate Investment Trusts | | | 2,571,432 | | | | — | | | | — | | | | 2,571,432 | | |
Retail | | | 1,491,507 | | | | — | | | | — | | | | 1,491,507 | | |
Semiconductors | | | 1,697,519 | | | | — | | | | — | | | | 1,697,519 | | |
Software | | | 24,299,127 | | | | 4,523,318 | | | | 2,908,988 | | | | 31,731,433 | | |
Transportation | | | 393,052 | | | | — | | | | — | | | | 393,052 | | |
Rights | | | — | | | | 92,111 | | | | 366,494 | | | | 458,605 | | |
Convertible Corporate Bonds** | | | — | | | | 1,073,500 | | | | — | | | | 1,073,500 | | |
Warrants** | | | 792 | | | | — | | | | — | | | | 792 | | |
Private Investments | | | — | | | | — | | | | 45,600 | | | | 45,600 | | |
Purchased Options | | | 169,740 | | | | — | | | | — | | | | 169,740 | | |
Short-Term Investments | | | 4,972,815 | | | | — | | | | — | | | | 4,972,815 | | |
TOTAL | | $ | 98,617,252 | | | $ | 5,688,929 | | | $ | 7,301,222 | | | $ | 111,607,403 | | |
Other Financial Instruments*** | |
Assets | |
Forward Foreign Currency
Exchange Contracts | | $ | — | | | $ | 157,590 | | | $ | — | | | $ | 157,590 | | |
Equity Swaps | | | 3,387 | | | | — | | | | — | | | | 3,387 | | |
See Notes to Financial Statements.
www.arbitragefunds.com | 1-800-295-4485
32
Water Island Event-Driven Fund Portfolio of Investments (continued)
Investments in Securities at Fair Value* | | Level 1 | | Level 2 | | Level 3 | | Total | |
Liabilities | |
Common Stocks** | | $ | (6,630,810 | ) | | $ | — | | | $ | — | | | $ | (6,630,810 | ) | |
Written Options | | | (2,563 | ) | | | — | | | | — | | | | (2,563 | ) | |
Forward Foreign Currency
Exchange Contracts | | | — | | | | (187,168 | ) | | | — | | | | (187,168 | ) | |
Equity Swaps | | | (1,166,616 | ) | | | — | | | | — | | | | (1,166,616 | ) | |
TOTAL | | $ | (7,796,602 | ) | | $ | (29,578 | ) | | $ | — | | | $ | (7,826,180 | ) | |
* Refer to Note 2 where leveling hierarchy is defined.
** Refer to Portfolio of Investments for sector information.
*** Other financial instruments are instruments such as written options, securities sold short, equity swaps and forward foreign currency exchange contracts.
The following is a reconciliation of the fair valuations using significant unobservable inputs (Level 3) for the Fund's assets and liabilities during the period ended May 31, 2023:
Investments
in Securities | | Balance as of
May 31, 2022 | | Realized
Gain (Loss) | | Change in
Unrealized
Appreciation
(Depreciation) | | Purchases | | Sales
Proceeds | | Transfers
into
Level 3 | | Transfers
out of
Level 3 | | Balance as of
May 31, 2023 | | Net change in
Unrealized
Appreciation
(Depreciation)
from
investments
still held as of
May 31, 2023 | |
Common
Stocks | | $ | 6,103,595 | | | $ | 158,827 | | | $ | 221,668 | | | $ | 6,852,914 | | | $ | (6,447,876 | ) | | $ | — | | | $ | — | | | $ | 6,889,128 | | | $ | 285,251 | | |
Rights | | | 18,187 | | | | 34,529 | | | | 6,183 | | | | 359,911 | | | | (52,316 | ) | | | — | | | | — | | | | 366,494 | | | | 6,583 | | |
Private
Investments | | | 22,800 | | | | — | | | | 22,800 | | | | — | | | | — | | | | — | | | | — | | | | 45,600 | | | | 22,800 | | |
Total | | $ | 6,144,582 | | | $ | 193,356 | | | $ | 250,651 | | | $ | 7,212,825 | | | $ | (6,500,192 | ) | | $ | — | | | $ | — | | | $ | 7,301,222 | | | $ | 314,634 | | |
The following table summarizes the quantitative inputs used for investments categorized as Level 3 of the fair value hierarchy as of May 31, 2023:
Investments in
Securities | | Fair Value at
May 31, 2023 | | Valuation
Technique | | Unobservable
Input | | Range of
Values | | Weighted
Average | |
Common Stocks
| | $ | 6,889,128
| | | Final proceeds
| | Final
determination
on dissent | | | $78.8287-$94.6474
|
| | | $85.51
|
| |
Rights
| | | 366,494
| | | Discounted,
probability
adjusted value | | Discount rate,
probability
| | | 10%,9.43%-65%
|
| | | 10%, 44.70%
|
| |
Private
Investments | | | 45,600
| | | Recovery
value | | Proceeds from
winding down | | | NA
| | | | NA
| | |
See Notes to Financial Statements.
Annual Report | May 31, 2023
33
Water Island Credit Opportunities Fund Manager Commentary
Water Island Credit Opportunities Fund | Tickers: ACFIX, ARCFX, AGCAX
The Fund's Goal and Main Investments
The Fund seeks to provide current income and capital growth by focusing on company-specific catalysts and events in order to generate returns that are more correlated to the outcomes and timelines of those events, rather than on overall market direction or changes in interest rates.
Investment Strategy
The Fund employs a fundamentally driven investment approach. The investment team screens catalyst-driven investments such as mergers, acquisitions, asset sales, spin-offs, refinancings, recapitalizations, corporate reorganizations, litigation, and regulatory changes. From this universe the team selects investments based on factors such as risk/reward profile, potential downside, and security liquidity. The team generates returns by holding outright long and short positions and by utilizing capital structure arbitrage, merger arbitrage, and convertible arbitrage techniques to exploit security mispricing or inefficiencies. This portfolio offers a pure-play credit implementation of Water Island Capital's broader event-driven style.
Fiscal Year Highlights
Water Island Credit Opportunities Fund Class I (ACFIX) returned 3.03% for the fiscal year ended May 31, 2023. Investments in the Americas region contributed to returns, though the European region was a detractor overall. The Fund's top-performing sectors were information technology and industrials. Communication services was the only detractor on a sector basis, though for the period the Fund's broad market hedges also detracted from returns overall.
The Fund may utilize derivatives for several purposes, primarily to implement position-level hedges, portfolio-level hedges, or currency hedges. During the fiscal year, the Fund's investments in derivative instruments contributed to returns. Derivative performance was in line with expectations given prevailing market conditions over the period.
The Fund's top contributor for the period was its investment in the debt of Getty Images. Getty is a world-renowned leader in digital and visual media content. Following the company's public listing via a special purpose acquisition company transaction in July, Getty has reduced term loan debt, increased its cash flow profile, and been upgraded by multiple credit-rating agencies. We think this is an attractive short-term yield investment which is supported by both a high coupon and management's desire to reduce debt.
The second-largest contributor for the fiscal year was the Fund's position in the debt of MoneyGram International. MoneyGram is a major global payment services provider. Early in 2022, the company entered into an agreement to be acquired by private equity firm Madison Dearborn Partners for $11 per share in cash. The deal presented us with several refinancing situations in both the company's bonds and term loans. Given the longer-term horizon of approximately one year, we invested in MoneyGram's term loans where we felt adequately compensated for the longer duration of the transaction and where we believed market volatility would be less impacted. The deal closed successfully shortly after fiscal year-end.
Conversely, the top detractor in the portfolio was the Fund's position in the debt of Altice France. Altice is a European broadband internet and cable television service provider. Our investment focused on the company's high coupon senior notes, which we believed would be among the first tranches to be refinanced when market conditions permitted. Given the softer nature of this catalyst, the bonds were more correlated to the swings in the credit markets throughout the period. Despite this, we believe that we are being compensated for such risks with attractive
www.arbitragefunds.com | 1-800-295-4485
34
Water Island Credit Opportunities Fund Manager Commentary (continued)
yields, and we believe Altice can successfully manage its upcoming debt maturities and either improve operational performance or de-leverage its balance sheet, whether organically or through the disposal of data centers.
The second-largest detractor for the period was the Fund's position in the debt of Werner FinCo. Werner is a global manufacturer of ladders, access equipment, secure storage, and light duty construction with the top position in both ladders and truck and jobsite storage projects in North America. After successive revenue and cash flow shortfalls amid weaker demand and higher costs, the company's capital structure was downgraded by Moody's in November, leading to lower bond prices and drawdowns in the Fund. We have frankly lost conviction in management's ability to rectify the business and decrease leverage, and we have since exited the position.
Annual Report | May 31, 2023
35
Water Island Credit Opportunities Fund Portfolio Information
Performance (annualized returns as of May 31, 2023)
| | | One
Year | | Five
Year | | Ten
Year | | Since
Inception* | |
Water Island Credit Opportunities Fund, Class R | | | 2.88 | % | | | 2.78 | % | | | 2.46 | % | | | 2.53 | % | |
Water Island Credit Opportunities Fund, Class I | | | 3.03 | % | | | 3.02 | % | | | 2.69 | % | | | 2.76 | % | |
Water Island Credit Opportunities Fund, Class A** | | | -0.51 | % | | | 2.12 | % | | | 2.11 | % | | | 2.11 | % | |
ICE BofA U.S. 3-Month Treasury Bill Index | | | 3.14 | % | | | 1.49 | % | | | 0.94 | % | | | 0.89 | % | |
Bloomberg U.S. Aggregate Bond Index | | | -2.14 | % | | | 0.81 | % | | | 1.39 | % | | | 1.24 | % | |
Current performance may be higher or lower than performance quoted above. Any performance data quoted represents past performance and the investment return and principal value of an investment in the Fund will fluctuate so that an investor's shares, when redeemed, may be worth more or less than their original cost. Past performance is no guarantee of future results. Returns shown above include the reinvestment of all dividends and capital gains. Performance results do not include adjustments made for financial reporting purposes in accordance with U.S. generally accepted accounting principles and may differ from the amount reported in the Financial Highlights. Contractual fee waivers are currently in effect. Without such fee waivers, performance numbers would be reduced. You can obtain performance data current to the most recent month end by calling 1-800-295-4485 or going to www.arbitragefunds.com. This table does not reflect the deduction of taxes that a shareholder would pay on Fund distributions or the redemption of Fund shares.
* Class R and Class I inception: 10/1/12; Class A inception: 6/1/13. The "Since Inception" returns for securities indices are for the inception date of Class R and Class I shares.
** After sales charge. Class A shares are subject to a maximum front-end sales load of 2.75% on purchases up to $250,000. The shares are also subject to a deferred sales charge of up to 1.00% on purchases of $250,000 or more purchased without a front-end sales charge and redeemed within 18 months of purchase.
The Total Annual Fund Operating Expenses for Class R, Class I and Class A are 1.62%, 1.37% and 1.62%, respectively. The Adviser has contractually agreed to limit the total annual operating expenses of the Fund, not including taxes, interest, dividends on short positions, brokerage commissions, acquired fund fees and expenses and other costs incurred in connection with the purchase or sale of portfolio securities, so they do not exceed 1.23%, 0.98% and 1.23% for Class R, Class I and Class A, respectively. The agreement remains in effect until September 30, 2024, unless terminated earlier by the Board of Trustees. These expense ratios are as stated in the current prospectus and may differ from the expense ratios disclosed in the financial highlights in this report.
The ICE BofA U.S. 3-Month Treasury Bill Index tracks the performance of the U.S. dollar denominated U.S. Treasury Bills publicly issued in the U.S. domestic market with a remaining term to final maturity of less than 3 months.
The Bloomberg U.S. Aggregate Bond Index is a market value-weighted index of investment grade fixed-rated debt issues, including government, corporate, asset-backed and mortgage-backed securities with a maturity of one year or more.
The indexes shown are not intended to, and do not, parallel the risk or investment style of the Fund's investment strategy. An investor may not invest directly in an index.
www.arbitragefunds.com | 1-800-295-4485
36
Water Island Credit Opportunities Fund Portfolio Information (continued)
Growth of $10,000 Investment
The chart represents historical performance of a hypothetical investment of $10,000 in the Class R shares of the Fund since inception. Past performance does not guarantee future results. This chart does not reflect the deduction of taxes that a shareholder would pay on Fund distributions or the redemption of Fund shares.

Sector Weighting
The following chart shows the sector weightings of Water Island Credit Opportunities Fund's investments (including short sales and excluding derivatives) as of the report date.

* Concentration Risk: From time to time, based on market or economic conditions or investment opportunities, the Fund may have significant investments in one or more sectors of the market. During such a period of concentration, the Fund may be subject to greater volatility with respect to its portfolio securities than a fund that is more broadly diversified.
Annual Report | May 31, 2023
37
Water Island Credit Opportunities Fund Portfolio of Investments
| | | Maturity
Date | | Rate | | Principal
Amount | | Value | |
BANK LOANS - 11.10% | |
Chemicals - 4.29% | |
Diversey, Inc., 2021
Term Loan B, TBD(a) | | 09/29/2028 | | | 0.000 | % | | $ | 5,000,000 | | | $ | 4,991,850 | | |
Commercial Services - 6.81% | |
Moneygram International,
Inc., 2021 Term Loan B,
Variable Rate,
(1 mo. USD LIBOR
plus 4.50%) | | 07/21/2026 | | | 9.654 | % | | | 4,934,896 | | | | 4,929,517 | | |
Verscend Holding Corp.,
2021 Term Loan B,
Variable Rate,
(1 mo. USD LIBOR
plus 4.00%) | | 08/27/2025 | | | 9.154 | % | | | 2,992,386 | | | | 2,990,201 | | |
| | | | 7,919,718 | | |
TOTAL BANK LOANS
(Cost $12,949,762) | | | 12,911,568 | | |
CORPORATE BONDS - 51.81% | |
Aerospace & Defense - 1.28% | |
Howmet Aerospace, Inc. | | 10/01/2024 | | | 5.125 | % | | | 1,498,000 | | | | 1,486,423 | | |
Banks - 0.77% | |
Truist Financial Corp.,
Variable Rate,
(3 mo. USD LIBOR
plus 0.65%) | | 03/15/2028 | | | 5.516 | % | | | 1,000,000 | | | | 892,094 | | |
Chemicals - 4.39% | |
Diamond (BC) B.V.(b) | | 10/01/2029 | | | 4.625 | % | | | 2,000,000 | | | | 2,007,600 | | |
Valvoline, Inc.(b)(c) | | 02/15/2030 | | | 4.250 | % | | | 3,160,000 | | | | 3,100,364 | | |
| | | | 5,107,964 | | |
Commercial Services - 3.35% | |
Triton Container
International Ltd.(b)(c) | | 06/07/2024 | | | 1.150 | % | | | 4,000,000 | | | | 3,745,976 | | |
Verscend Escrow Corp.(b)(c) | | 08/15/2026 | | | 9.750 | % | | | 150,000 | | | | 150,328 | | |
| | | | 3,896,304 | | |
Construction Materials - 1.38% | |
JELD-WEN, Inc.(b)(c) | | 05/15/2025 | | | 6.250 | % | | | 1,593,000 | | | | 1,604,947 | | |
Distribution/Wholesale - 2.28% | |
Univar Solutions USA, Inc.(b)(c) | | 12/01/2027 | | | 5.125 | % | | | 2,641,000 | | | | 2,652,758 | | |
See Notes to Financial Statements.
www.arbitragefunds.com | 1-800-295-4485
38
Water Island Credit Opportunities Fund Portfolio of Investments (continued)
| | | Maturity
Date | | Rate | | Principal
Amount | | Value | |
CORPORATE BONDS - 51.81% (Continued) | |
Electrical Components & Equipment - 0.75% | |
WESCO Distribution, Inc.(b) | | 06/15/2025 | | | 7.125 | % | | $ | 870,000 | | | $ | 876,369 | | |
Entertainment - 3.47% | |
Caesars Entertainment, Inc.(b) | | 07/01/2025 | | | 6.250 | % | | | 4,053,000 | | | | 4,040,775 | | |
Food - 5.39% | |
Chobani LLC / Chobani
Finance Corp., Inc.(b) | | 04/15/2025 | | | 7.500 | % | | | 3,549,000 | | | | 3,524,963 | | |
U.S. Foods, Inc.(b)(c) | | 04/15/2025 | | | 6.250 | % | | | 2,750,000 | | | | 2,744,263 | | |
| | | | 6,269,226 | | |
Healthcare - Services - 2.08% | |
Syneos Health, Inc.(b)(c) | | 01/15/2029 | | | 3.625 | % | | | 2,500,000 | | | | 2,418,750 | | |
Internet - 6.33% | |
Gen Digital, Inc.(b) | | 04/15/2025 | | | 5.000 | % | | | 1,407,000 | | | | 1,374,270 | | |
Getty Images, Inc.(b) | | 03/01/2027 | | | 9.750 | % | | | 6,000,000 | | | | 5,981,304 | | |
| | | | 7,355,574 | | |
Media - 1.29% | |
Cengage Learning, Inc.(b) | | 06/15/2024 | | | 9.500 | % | | | 1,500,000 | | | | 1,494,945 | | |
Mining - 3.97% | |
Arconic Corp.(b)(c) | | 05/15/2025 | | | 6.000 | % | | | 4,600,000 | | | | 4,612,406 | | |
Office/Business Equip - 2.23% | |
Xerox Holdings Corp.(b) | | 08/15/2025 | | | 5.000 | % | | | 2,762,000 | | | | 2,597,952 | | |
Oil & Gas - 5.55% | |
Occidental Petroleum Corp. | | 09/01/2025 | | | 5.875 | % | | | 30,000 | | | | 30,008 | | |
PDC Energy, Inc.(c) | | 05/15/2026 | | | 5.750 | % | | | 4,180,000 | | | | 4,167,251 | | |
ROCC Holdings LLC(b) | | 08/15/2026 | | | 9.250 | % | | | 2,100,000 | | | | 2,250,948 | | |
| | | | 6,448,207 | | |
Packaging & Containers - 2.12% | |
Ball Corp.(c) | | 11/15/2023 | | | 4.000 | % | | | 1,357,000 | | | | 1,337,872 | | |
LABL, Inc.(b) | | 07/15/2026 | | | 6.750 | % | | | 1,175,000 | | | | 1,129,486 | | |
| | | | 2,467,358 | | |
Pharmaceuticals - 1.46% | |
Horizon Therapeutics USA, Inc.(b) | | 08/01/2027 | | | 5.500 | % | | | 1,700,000 | | | | 1,702,125 | | |
Software - 1.13% | |
ACI Worldwide, Inc.(b) | | 08/15/2026 | | | 5.750 | % | | | 600,000 | | | | 592,452 | | |
PTC, Inc.(b) | | 02/15/2025 | | | 3.625 | % | | | 750,000 | | | | 721,307 | | |
| | | | 1,313,759 | | |
See Notes to Financial Statements.
Annual Report | May 31, 2023
39
Water Island Credit Opportunities Fund Portfolio of Investments (continued)
| | | Maturity
Date | | Rate | | Principal
Amount | | Value | |
CORPORATE BONDS - 51.81% (Continued) | |
Telecommunications - 2.59% | |
Altice France Holding SA(b)(c) | | 05/15/2027 | | | 10.500 | % | | $ | 5,050,000 | | | $ | 3,017,375 | | |
TOTAL CORPORATE BONDS
(Cost $62,902,057) | | | 60,255,311 | | |
CONVERTIBLE CORPORATE BONDS - 24.67% | |
Aerospace & Defense - 2.42% | |
Kaman Corp.(c) | | 05/01/2024 | | | 3.250 | % | | | 3,000,000 | | | | 2,814,000 | | |
Auto Manufacturers - 0.45% | |
Lightning eMotors, Inc.(b) | | 05/15/2024 | | | 7.500 | % | | | 973,000 | | | | 525,420 | | |
Commercial Services - 1.59% | |
Block, Inc.(c) | | 03/01/2025 | | | 0.125 | % | | | 2,000,000 | | | | 1,845,000 | | |
Diversified Financial Services - 1.26% | |
WisdomTree, Inc. | | 06/15/2026 | | | 3.250 | % | | | 1,500,000 | | | | 1,458,750 | | |
Entertainment - 0.37% | |
Cineplex, Inc.(b) | | 09/30/2025 | | | 5.750 | % | | | 567,000 | | | | 434,738 | | |
Healthcare - Services - 6.36% | |
Oak Street Health, Inc.(d) | | 03/15/2026 | | | 0.000 | % | | | 6,500,000 | | | | 6,446,050 | | |
UpHealth, Inc.(b) | | 06/15/2026 | | | 6.250 | % | | | 689,000 | | | | 199,379 | | |
UpHealth, Inc., Variable Rate,
(SOFR plus 9.00%)(b) | | 12/15/2025 | | | 14.060 | % | | | 938,000 | | | | 745,710 | | |
| | | | 7,391,139 | | |
Internet - 2.56% | |
Spotify USA, Inc.(d) | | 03/15/2026 | | | 0.000 | % | | | 3,500,000 | | | | 2,982,000 | | |
Pharmaceuticals - 1.65% | |
Paratek Pharmaceuticals, Inc.(c) | | 05/01/2024 | | | 4.750 | % | | | 2,250,000 | | | | 1,921,050 | | |
Real Estate - 1.68% | |
Radius Global
Infrastructure, Inc.(b)(c) | | 09/15/2026 | | | 2.500 | % | | | 2,000,000 | | | | 1,955,000 | | |
Software - 6.33% | |
Blackline, Inc.(c)(d) | | 03/15/2026 | | | 0.000 | % | | | 2,000,000 | | | | 1,688,750 | | |
Kaleyra, Inc.(b)(c) | | 06/01/2026 | | | 6.125 | % | | | 1,900,000 | | | | 1,498,942 | | |
RingCentral, Inc.(d) | | 03/01/2025 | | | 0.000 | % | | | 3,105,000 | | | | 2,839,212 | | |
Verint Systems, Inc.(c) | | 04/15/2026 | | | 0.250 | % | | | 1,500,000 | | | | 1,332,187 | | |
| | | | 7,359,091 | | |
TOTAL CONVERTIBLE CORPORATE BONDS
(Cost $31,743,382) | | | 28,686,188 | | |
See Notes to Financial Statements.
www.arbitragefunds.com | 1-800-295-4485
40
Water Island Credit Opportunities Fund Portfolio of Investments (continued)
| | | Shares | | Value | |
WARRANTS(e) - 0.00%(f) | |
Auto Manufacturers - 0.00%(f) | |
Lightning eMotors, Inc., Exercise Price $11.50,
Expires 05/18/2025(g) | | | 53,913 | | | $ | 1,337 | | |
TOTAL WARRANTS
(Cost $0) | | | | | 1,337 | | |
| | | Expiration
Date | | Exercise
Price | | Notional
Amount | | Contracts | | Value | |
PURCHASED OPTIONS(e) - 0.10% | |
Call Options Purchased - 0.09% | |
Caesars Entertainment, Inc. | | 09/2023 | | $ | 50.00 | | | $ | 738,180 | | | | 180 | | | $ | 33,300 | | |
Gen Digital, Inc. | | 07/2023 | | | 19.00 | | | | 526,200 | | | | 300 | | | | 7,500 | | |
Howmet Aerospace, Inc. | | 07/2023 | | | 45.00 | | | | 1,603,125 | | | | 375 | | | | 29,063 | | |
Xerox Holdings Corp. | | 07/2023 | | | 15.00 | | | | 914,550 | | | | 650 | | | | 35,750 | | |
TOTAL CALL OPTIONS PURCHASED
(Cost $160,525) | | | | | | | | | | | 105,613 | | |
Put Options Purchased - 0.01% | |
iShares iBoxx High Yield
Corporate Bond ETF | | 06/2023 | | $ | 72.00 | | | $ | 7,411,000 | | | | 1,000 | | | | 12,000 | | |
TOTAL PUT OPTIONS PURCHASED
(Cost $70,669) | | | | | | | | | | | 12,000 | | |
TOTAL PURCHASED OPTIONS
(Cost $231,194) | | | | | | | | | | | 117,613 | | |
| | | Yield | | Shares | | Value | |
SHORT-TERM INVESTMENTS - 14.30% | |
Money Market Funds | |
Morgan Stanley Institutional Liquidity Funds -
Government Portfolio | | | 4.997 | %(h) | | | 8,311,250 | | | $ | 8,311,250 | | |
State Street Institutional U.S. Government
Money Market Fund, Premier Class | | | 5.129 | %(h) | | | 8,311,250 | | | | 8,311,250 | | |
| | | | 16,622,500 | | |
TOTAL SHORT-TERM INVESTMENTS
(Cost $16,622,500) | | | 16,622,500 | | |
Total Investments - 101.98%
(Cost $124,448,895) | | | 118,594,517 | | |
Liabilities in Excess of Other Assets - (1.98%)(i) | | | (2,297,479 | ) | |
NET ASSETS - 100.00% | | $ | 116,297,038 | | |
See Notes to Financial Statements.
Annual Report | May 31, 2023
41
Water Island Credit Opportunities Fund Portfolio of Investments (continued)
Portfolio Footnotes
(a) This position represents an unsettled loan commitment at period end. Certain details associated with this purchase are not known prior to the settlement date, including coupon rate, which will be adjusted on settlement date.
(b) Security exempt from registration under Rule 144A of the Securities Act of 1933. These securities may be resold in transactions exempt from registration, normally to qualified institutional buyers. As of May 31, 2023, these securities had a total value of $57,700,852 or 49.62% of net assets.
(c) Security, or a portion of security, is being held as collateral for short sales, written option contracts or forward foreign currency exchange contracts. At May 31, 2023, the aggregate fair market value of those securities was $36,904,034, representing 31.04% of net assets.
(d) Represents a zero coupon bond.
(e) Non-income-producing security.
(f) Less than 0.005% of net assets.
(g) Restricted securities (including private placements) – The Fund may own investment securities that have other legal or contractual limitations. At the end of the period, the value of restricted securities (excluding 144A issues) amounted to $1,337 or 0.0% of net assets.
Restricted Security | | Acquisition Date | | Acquisition Cost | |
Lightning eMotors, Inc., Exercise Price $11.50, Expires 05/18/2025 | | 04/28/2021 | | $ | — | | |
Total | | | | $ | — | | |
(h) Rate shown is the 7-day effective yield as of May 31, 2023.
(i) Includes cash held as collateral for short sales.
SCHEDULE OF SECURITIES SOLD SHORT | | Shares | | Value | |
COMMON STOCKS SOLD SHORT - (3.38%) | |
Aerospace & Defense - (0.42%) | |
Howmet Aerospace, Inc. | | | (10,600 | ) | | $ | (453,150 | ) | |
Kaman Corp. | | | (1,800 | ) | | | (37,404 | ) | |
| | | | (490,554 | ) | |
Chemicals - (0.72%) | |
Diversey Holdings Ltd. | | | (100,000 | ) | | | (833,000 | ) | |
Commercial Services - (0.30%) | |
Block, Inc. | | | (5,700 | ) | | | (344,223 | ) | |
Diversified Financial Services - (0.23%) | |
WisdomTree, Inc. | | | (39,400 | ) | | | (267,920 | ) | |
Entertainment - (0.33%) | |
Caesars Entertainment, Inc. | | | (4,500 | ) | | | (184,545 | ) | |
Cineplex, Inc. | | | (28,000 | ) | | | (201,724 | ) | |
| | | | (386,269 | ) | |
Internet - (0.19%) | |
Gen Digital, Inc. | | | (5,600 | ) | | | (98,224 | ) | |
Spotify Technology SA | | | (800 | ) | | | (119,120 | ) | |
| | | | (217,344 | ) | |
See Notes to Financial Statements.
www.arbitragefunds.com | 1-800-295-4485
42
Water Island Credit Opportunities Fund Portfolio of Investments (continued)
SCHEDULE OF SECURITIES SOLD SHORT | | Shares | | Value | |
COMMON STOCKS SOLD SHORT - (3.38%) (Continued) | |
Office/Business Equip - (0.31%) | |
Xerox Holdings Corp. | | | (26,000 | ) | | $ | (365,820 | ) | |
Pharmaceuticals - (0.01%) | |
Paratek Pharmaceuticals, Inc. | | | (11,450 | ) | | | (17,518 | ) | |
Real Estate - (0.45%) | |
Radius Global Infrastructure, Inc., Class A | | | (35,400 | ) | | | (523,920 | ) | |
Software - (0.42%) | |
Blackline, Inc. | | | (2,400 | ) | | | (124,968 | ) | |
RingCentral, Inc., Class A | | | (300 | ) | | | (10,410 | ) | |
Verint Systems, Inc. | | | (9,700 | ) | | | (348,036 | ) | |
| | | | (483,414 | ) | |
TOTAL SECURITIES SOLD SHORT
(Proceeds $4,921,872) | | $ | (3,929,982 | ) | |
EQUITY SWAP CONTRACTS
Swap
Counterparty/
Payment
Frequency | | Reference
Obligation | | Rate
Paid/
Received
by the
Fund | | Termination
Date | | Upfront
Payments
Made | | Upfront
Payments
Received | | Market
Value | | Notional
Amount | | Unrealized
Depreciation | |
Morgan
Stanley &
Co./
Upon
Termination
| | SPDR
Bloomberg
High Yield
Bond ETF
| | Received
1 Month-
Federal
Rate
Minus
83bps
(-4.250%) | | 10/31/2024 | | $ | — | | | $ | — | | | $ | (22,831 | ) | | USD | 2,602,445 | | | $ | (22,831 | ) | |
OUTSTANDING FORWARD FOREIGN CURRENCY EXCHANGE CONTRACTS
Currency
Purchased | | Currency Sold | | Counterparty | | Settlement
Date | | Unrealized
Appreciation | |
CAD | 82,500 | | | USD | 60,454 | | | Morgan Stanley & Co. | | 06/15/2023 | | $ | 340 | | |
USD | 66,882 | | | CAD | 90,000 | | | Morgan Stanley & Co. | | 06/15/2023 | | | 560 | | |
| | | $ | 900 | | |
Currency
Purchased | | Currency Sold | | Counterparty | | Settlement
Date | | Unrealized
Depreciation | |
CAD | 75,000 | | | USD | 55,862 | | | Morgan Stanley & Co. | | 06/15/2023 | | $ | (594 | ) | |
USD | 280,661 | | | CAD | 383,800 | | | Morgan Stanley & Co. | | 06/15/2023 | | | (2,159 | ) | |
| | | $ | (2,753 | ) | |
See Notes to Financial Statements.
Annual Report | May 31, 2023
43
Water Island Credit Opportunities Fund Portfolio of Investments (continued)
The following is a summary of investments classified by country exposure:
Country | | % of Net Assets(a) | |
United States | | | 89.78 | % | |
Netherlands | | | 6.02 | % | |
Bermuda | | | 3.22 | % | |
Luxembourg | | | 2.59 | % | |
Canada | | | 0.37 | % | |
Liabilities in Excess of Other Assets | | | (1.98 | %) | |
| | | | 100.00 | % | |
(a) These percentages represent long positions only and are not net of short positions.
Abbreviations:
bps - Basis Points. 100 Basis Points is equal to 1 percentage point.
B.V. - Besloten Vennootschap is the Dutch term for private limited liability company.
CAD - Canadian dollar
ETF - Exchange-Traded Fund
LIBOR - London Interbank Offered Rate
LLC - Limited Liability Company
Ltd. - Limited
SA - Generally designates corporations in various countries, mostly those employing civil law. This translates literally in all languages mentioned as anonymous company.
SOFR - Secured Overnight Financing Rate
SPDR - Standard & Poor's Depositary Receipt
TBD - To Be Determined
USD - United States Dollar
The following table summarizes the Water Island Credit Opportunities Fund's investments and derivative financial instruments categorized in the fair value hierarchy as of May 31, 2023:
Investments in Securities at Fair Value* | | Level 1 | | Level 2 | | Level 3 | | Total | |
Assets | |
Bank Loans** | | $ | — | | | $ | 12,911,568 | | | $ | — | | | $ | 12,911,568 | | |
Corporate Bonds** | | | — | | | | 60,255,311 | | | | — | | | | 60,255,311 | | |
Convertible Corporate Bonds** | | | — | | | | 28,686,188 | | | | — | | | | 28,686,188 | | |
Warrants** | | | 1,337 | | | | — | | | | — | | | | 1,337 | | |
Purchased Options | | | 117,613 | | | | — | | | | — | | | | 117,613 | | |
Short-Term Investments | | | 16,622,500 | | | | — | | | | — | | | | 16,622,500 | | |
TOTAL | | $ | 16,741,450 | | | $ | 101,853,067 | | | $ | — | | | $ | 118,594,517 | | |
See Notes to Financial Statements.
www.arbitragefunds.com | 1-800-295-4485
44
Water Island Credit Opportunities Fund Portfolio of Investments (continued)
Other Financial Instruments*** | | Level 1 | | Level 2 | | Level 3 | | Total | |
Assets | |
Forward Foreign Currency Exchange
Contracts | | $ | — | | | $ | 900 | | | $ | — | | | $ | 900 | | |
Liabilities | |
Common Stocks** | | | (3,929,982 | ) | | | — | | | | — | | | | (3,929,982 | ) | |
Forward Foreign Currency Exchange
Contracts | | | — | | | | (2,753 | ) | | | — | | | | (2,753 | ) | |
Equity Swaps | | | (22,831 | ) | | | — | | | | — | | | | (22,831 | ) | |
TOTAL | | $ | (3,952,813 | ) | | $ | (1,853 | ) | | $ | — | | | $ | (3,954,666 | ) | |
* Refer to Note 2 where leveling hierarchy is defined.
** Refer to Portfolio of Investments for sector information.
*** Other financial instruments are instruments such as securities sold short, equity swaps and forward foreign currency exchange contracts.
See Notes to Financial Statements.
Annual Report | May 31, 2023
45
| | | Arbitrage Fund | | Water Island
Event-Driven
Fund | |
ASSETS | |
Investments: | |
At cost of unaffiliated investments | | $ | 1,132,420,122 | | | $ | 119,421,629 | | |
At cost of affiliated investments | | | 60,632,644 | | | | — | | |
At fair value of unaffiliated investments (Note 2) | | | 1,053,517,183 | | | | 111,607,403 | | |
At fair value of affiliated investments (Note 2) | | | 71,734,267 | | | | — | | |
Cash | | | 2,496 | | | | 275 | | |
Cash denominated in foreign currency (Cost $1,049,159, $0 and $0) | | | 1,041,540 | | | | — | | |
Deposits with brokers for securities sold short (Note 2) | | | 57,248,110 | | | | 6,736,673 | | |
Segregated cash for collateral (Note 2) | | | — | | | | 200,000 | | |
Receivable for investment securities sold | | | 37,822,195 | | | | 3,901,348 | | |
Receivable for capital shares sold | | | 1,427,295 | | | | 266,250 | | |
Unrealized appreciation on forward foreign currency exchange contracts (Note 9) | | | 1,978,506 | | | | 157,590 | | |
Unrealized appreciation on swap contracts | | | 28,068 | | | | 3,387 | | |
Dividends and interest receivable | | | 1,624,954 | | | | 149,952 | | |
Miscellaneous receivable | | | 383,510 | | | | 38,048 | | |
Prepaid expenses | | | 80,289 | | | | 23,091 | | |
Total Assets | | | 1,226,888,413 | | | | 123,084,017 | | |
LIABILITIES | |
Securities sold short, at value (Note 2) (proceeds $58,127,599, $6,893,868 and $4,921,872) | | | 55,207,449 | | | | 6,630,810 | | |
Written options, at value (Note 2) (premiums received $0, $8,708 and $0) | | | — | | | | 2,563 | | |
Payable for investment securities purchased | | | 6,409,700 | | | | 337,203 | | |
Unrealized depreciation on forward foreign currency exchange contracts (Note 9) | | | 1,877,341 | | | | 187,168 | | |
Unrealized depreciation on swap contracts | | | 13,928,051 | | | | 1,166,616 | | |
Payable for capital shares redeemed | | | 4,797,138 | | | | 33,108 | | |
Payable to Adviser (Note 5) | | | 995,286 | | | | 106,781 | | |
Dividends payable on securities sold short | | | — | | | | — | | |
Payable to Distributor (Note 5) | | | 23,257 | | | | 1,313 | | |
Payable to Administrator (Note 5) | | | 57,281 | | | | 12,789 | | |
Payable to Transfer Agent (Note 5) | | | 89,335 | | | | 8,737 | | |
Payable to Custodian | | | 13,529 | | | | 5,735 | | |
Income distribution payable | | | — | | | | — | | |
Interest expense payable | | | 626 | | | | — | | |
Payable for swap reset | | | 11,929 | | | | 1,439 | | |
Audit and legal fees payable | | | 103,849 | | | | 23,353 | | |
Payable to Trustees | | | 85,694 | | | | 8,505 | | |
Chief Compliance Officer Fees payable (Note 5) | | | 36,480 | | | | 4,849 | | |
Chief Financial Officer Fees payable (Note 5) | | | 5,198 | | | | 1,038 | | |
Other accrued expenses and liabilities | | | 53,878 | | | | 12,185 | | |
Total Liabilities | | | 83,696,021 | | | | 8,544,192 | | |
NET ASSETS | | $ | 1,143,192,392 | | | $ | 114,539,825 | | |
NET ASSETS CONSIST OF: | |
Paid-in capital | | $ | 1,209,661,658 | | | $ | 156,535,313 | | |
Distributable earnings (Accumulated loss) | | | (66,469,266 | ) | | | (41,995,488 | ) | |
NET ASSETS | | $ | 1,143,192,392 | | | $ | 114,539,825 | | |
See Notes to Financial Statements.
www.arbitragefunds.com | 1-800-295-4485
46
Statement of Assets and Liabilities
May 31, 2023
| | | Water Island
Credit
Opportunities Fund | |
ASSETS | |
Investments: | |
At cost of unaffiliated investments | | $ | 124,448,895 | | |
At cost of affiliated investments | | | — | | |
At fair value of unaffiliated investments (Note 2) | | | 118,594,517 | | |
At fair value of affiliated investments (Note 2) | | | — | | |
Cash | | | 77,554 | | |
Cash denominated in foreign currency (Cost $1,049,159, $0 and $0) | | | — | | |
Deposits with brokers for securities sold short (Note 2) | | | 3,783,904 | | |
Segregated cash for collateral (Note 2) | | | 930,000 | | |
Receivable for investment securities sold | | | 760,716 | | |
Receivable for capital shares sold | | | 298,398 | | |
Unrealized appreciation on forward foreign currency exchange contracts (Note 9) | | | 900 | | |
Unrealized appreciation on swap contracts | | | — | | |
Dividends and interest receivable | | | 1,533,343 | | |
Miscellaneous receivable | | | — | | |
Prepaid expenses | | | 23,186 | | |
Total Assets | | | 126,002,518 | | |
LIABILITIES | |
Securities sold short, at value (Note 2) (proceeds $58,127,599, $6,893,868 and $4,921,872) | | | 3,929,982 | | |
Written options, at value (Note 2) (premiums received $0, $8,708 and $0) | | | — | | |
Payable for investment securities purchased | | | 5,282,997 | | |
Unrealized depreciation on forward foreign currency exchange contracts (Note 9) | | | 2,753 | | |
Unrealized depreciation on swap contracts | | | 22,831 | | |
Payable for capital shares redeemed | | | 131,430 | | |
Payable to Adviser (Note 5) | | | 57,508 | | |
Dividends payable on securities sold short | | | 23,693 | | |
Payable to Distributor (Note 5) | | | 1,590 | | |
Payable to Administrator (Note 5) | | | 16,100 | | |
Payable to Transfer Agent (Note 5) | | | 11,137 | | |
Payable to Custodian | | | 2,787 | | |
Income distribution payable | | | 164,793 | | |
Interest expense payable | | | 3,101 | | |
Payable for swap reset | | | — | | |
Audit and legal fees payable | | | 23,720 | | |
Payable to Trustees | | | 8,926 | | |
Chief Compliance Officer Fees payable (Note 5) | | | 4,573 | | |
Chief Financial Officer Fees payable (Note 5) | | | 1,039 | | |
Other accrued expenses and liabilities | | | 16,520 | | |
Total Liabilities | | | 9,705,480 | | |
NET ASSETS | | $ | 116,297,038 | | |
NET ASSETS CONSIST OF: | |
Paid-in capital | | $ | 123,937,113 | | |
Distributable earnings (Accumulated loss) | | | (7,640,075 | ) | |
NET ASSETS | | $ | 116,297,038 | | |
Annual Report | May 31, 2023
47
| | | Arbitrage Fund | | Water Island
Event-Driven
Fund | |
PRICING OF SHARES: | |
CLASS R SHARES: | |
Net assets applicable to Class R shares | | $ | 44,250,159 | | | $ | 3,989,803 | | |
Shares of beneficial interest outstanding (unlimited number of shares authorized, no par value) | | | 3,695,958 | | | | 372,012 | | |
Net asset value and offering price per share | | $ | 11.97 | | | $ | 10.72 | | |
CLASS I SHARES: | |
Net assets applicable to Class I shares | | $ | 1,062,907,026 | | | $ | 108,673,929 | | |
Shares of beneficial interest outstanding (unlimited number of shares authorized, no par value) | | | 85,257,658 | | | | 10,002,458 | | |
Net asset value and offering price per share | | $ | 12.47 | | | $ | 10.86 | | |
CLASS C SHARES: | |
Net assets applicable to Class C shares | | $ | 8,397,816 | | | $ | — | | |
Shares of beneficial interest outstanding (unlimited number of shares authorized, no par value) | | | 757,567 | | | | — | | |
Net asset value and offering price per share(a) | | $ | 11.09 | | | $ | — | | |
CLASS A SHARES: | |
Net assets applicable to Class A shares | | $ | 27,637,391 | | | $ | 1,876,093 | | |
Shares of beneficial interest outstanding (unlimited number of shares authorized, no par value) | | | 2,315,076 | | | | 175,288 | | |
Net asset value and offering price per share(a) | | $ | 11.94 | | | $ | 10.70 | | |
Maximum offering price per share (NAV/(100% — maximum sales charge)) | | $ | 12.28 | | | $ | 11.06 | | |
Maximum sales charge | | | 2.75 | % | | | 3.25 | % | |
(a) Redemption price varies based on length of time held (Note 1).
See Notes to Financial Statements.
www.arbitragefunds.com | 1-800-295-4485
48
Statement of Assets and Liabilities
May 31, 2023
| | | Water Island
Credit
Opportunities Fund | |
PRICING OF SHARES: | |
CLASS R SHARES: | |
Net assets applicable to Class R shares | | $ | 6,741,644 | | |
Shares of beneficial interest outstanding (unlimited number of shares authorized, no par value) | | | 701,722 | | |
Net asset value and offering price per share | | $ | 9.61 | | |
CLASS I SHARES: | |
Net assets applicable to Class I shares | | $ | 109,488,343 | | |
Shares of beneficial interest outstanding (unlimited number of shares authorized, no par value) | | | 11,448,864 | | |
Net asset value and offering price per share | | $ | 9.56 | | |
CLASS C SHARES: | |
Net assets applicable to Class C shares | | $ | — | | |
Shares of beneficial interest outstanding (unlimited number of shares authorized, no par value) | | | — | | |
Net asset value and offering price per share(a) | | $ | — | | |
CLASS A SHARES: | |
Net assets applicable to Class A shares | | $ | 67,051 | | |
Shares of beneficial interest outstanding (unlimited number of shares authorized, no par value) | | | 7,009 | | |
Net asset value and offering price per share(a) | | $ | 9.57 | | |
Maximum offering price per share (NAV/(100% — maximum sales charge)) | | $ | 9.89 | | |
Maximum sales charge | | | 3.25 | % | |
Annual Report | May 31, 2023
49
| | | Arbitrage Fund | | Water Island
Event-Driven
Fund | |
INVESTMENT INCOME | |
Dividend income | | $ | 21,401,573 | | | $ | 1,741,741 | | |
Foreign taxes withheld on dividends | | | (265,763 | ) | | | (31,129 | ) | |
Interest income | | | 785,843 | | | | 184,156 | | |
Rebates on short sales, net of fees | | | 739,365 | | | | 68,615 | | |
Total Investment Income | | | 22,661,018 | | | | 1,963,383 | | |
EXPENSES | |
Investment advisory fees (Note 5) | | | 15,057,509 | | | | 1,269,833 | | |
Distribution and service fees (Note 5) | |
Class R | | | 149,118 | | | | 10,868 | | |
Class C | | | 107,868 | | | | — | | |
Class A | | | 94,053 | | | | 5,529 | | |
Administrative fees | | | 284,501 | | | | 51,361 | | |
Chief Compliance Officer fees | | | 176,578 | | | | 16,975 | | |
Trustees' fees | | | 320,077 | | | | 30,927 | | |
Dividend expense | | | 175,975 | | | | 8,620 | | |
Transfer agent fees | | | 1,167,219 | | | | 98,245 | | |
Custodian and bank service fees | | | 142,227 | | | | 36,875 | | |
Registration and filing fees | | | 88,243 | | | | 50,814 | | |
Printing of shareholder reports | | | 115,106 | | | | 8,121 | | |
Professional fees | | | 189,003 | | | | 30,322 | | |
Line of credit interest expense | | | — | | | | 5,319 | | |
Insurance expense | | | 61,633 | | | | 4,836 | | |
Chief Financial Officer fees | | | 58,742 | | | | 11,275 | | |
Other expenses | | | 73,814 | | | | 22,911 | | |
Total Expenses | | | 18,261,666 | | | | 1,662,831 | | |
Fees waived, reimbursed or recouped by the Adviser, Class R (Note 5) | | | (38,114 | ) | | | 1,128 | | |
Fees waived, reimbursed or recouped by the Adviser, Class I (Note 5) | | | (839,520 | ) | | | 28,129 | | |
Fees waived, reimbursed or recouped by the Adviser, Class C (Note 5) | | | (6,894 | ) | | | — | | |
Fees waived, reimbursed or recouped by the Adviser, Class A (Note 5) | | | (24,040 | ) | | | 575 | | |
Net Expenses | | | 17,353,098 | | | | 1,692,663 | | |
NET INVESTMENT INCOME (LOSS) | | | 5,307,920 | | | | 270,720 | | |
REALIZED AND UNREALIZED GAINS (LOSSES) ON INVESTMENTS AND FOREIGN CURRENCIES | |
Net realized gains (losses) from: | |
Unaffiliated investments | | | 21,303,485 | | | | 2,421,410 | | |
Purchased option contracts | | | (3,753,338 | ) | | | (340,066 | ) | |
Swap contracts | | | 5,016,744 | | | | 399,115 | | |
Securities sold short | | | 7,701,552 | | | | 629,133 | | |
Written option contracts | | | (794,457 | ) | | | (59,394 | ) | |
Forward currency contracts | | | 9,455,080 | | | | 379,573 | | |
Foreign currency transactions (Note 9) | | | 126,724 | | | | 29,855 | | |
See Notes to Financial Statements.
www.arbitragefunds.com | 1-800-295-4485
50
For the Year Ended May 31, 2023
| | | Water Island
Credit
Opportunities Fund | |
INVESTMENT INCOME | |
Dividend income | | $ | 487,056 | | |
Foreign taxes withheld on dividends | | | (446 | ) | |
Interest income | | | 5,474,697 | | |
Rebates on short sales, net of fees | | | 144,711 | | |
Total Investment Income | | | 6,106,018 | | |
EXPENSES | |
Investment advisory fees (Note 5) | | | 1,163,537 | | |
Distribution and service fees (Note 5) | |
Class R | | | 21,578 | | |
Class C | | | — | | |
Class A | | | 191 | | |
Administrative fees | | | 85,675 | | |
Chief Compliance Officer fees | | | 16,231 | | |
Trustees' fees | | | 33,691 | | |
Dividend expense | | | 56,342 | | |
Transfer agent fees | | | 124,565 | | |
Custodian and bank service fees | | | 23,623 | | |
Registration and filing fees | | | 48,547 | | |
Printing of shareholder reports | | | 13,051 | | |
Professional fees | | | 31,169 | | |
Line of credit interest expense | | | 22,254 | | |
Insurance expense | | | 5,041 | | |
Chief Financial Officer fees | | | 11,508 | | |
Other expenses | | | 31,546 | | |
Total Expenses | | | 1,688,549 | | |
Fees waived, reimbursed or recouped by the Adviser, Class R (Note 5) | | | (27,239 | ) | |
Fees waived, reimbursed or recouped by the Adviser, Class I (Note 5) | | | (360,425 | ) | |
Fees waived, reimbursed or recouped by the Adviser, Class C (Note 5) | | | — | | |
Fees waived, reimbursed or recouped by the Adviser, Class A (Note 5) | | | (241 | ) | |
Net Expenses | | | 1,300,644 | | |
NET INVESTMENT INCOME (LOSS) | | | 4,805,374 | | |
REALIZED AND UNREALIZED GAINS (LOSSES) ON INVESTMENTS AND FOREIGN CURRENCIES | |
Net realized gains (losses) from: | |
Unaffiliated investments | | | (2,307,637 | ) | |
Purchased option contracts | | | (61,807 | ) | |
Swap contracts | | | 182,088 | | |
Securities sold short | | | 1,379,050 | | |
Written option contracts | | | 87,999 | | |
Forward currency contracts | | | (1,255 | ) | |
Foreign currency transactions (Note 9) | | | 811 | | |
Annual Report | May 31, 2023
51
| | | Arbitrage Fund | | Water Island
Event-Driven
Fund | |
Net change in unrealized appreciation (depreciation) on: | |
Unaffiliated investments | | | (33,173,752 | ) | | | (3,546,003 | ) | |
Affiliated investments | | | (660,536 | ) | | | — | | |
Securities sold short | | | (316,732 | ) | | | 34,754 | | |
Foreign currency transactions (Note 9) | | | 121,839 | | | | 171,309 | | |
Purchased option contracts | | | (512,810 | ) | | | (96,014 | ) | |
Written option contracts | | | (10,186 | ) | | | 5,284 | | |
Swap contracts | | | (13,900,131 | ) | | | (1,163,229 | ) | |
Forward currency contracts | | | (3,276,363 | ) | | | (177,226 | ) | |
NET REALIZED AND UNREALIZED LOSSES ON INVESTMENTS AND FOREIGN CURRENCIES | | | (12,672,881 | ) | | | (1,311,499 | ) | |
NET INCREASE (DECREASE) IN NET ASSETS RESULTING FROM OPERATIONS | | $ | (7,364,961 | ) | | $ | (1,040,779 | ) | |
See Notes to Financial Statements.
www.arbitragefunds.com | 1-800-295-4485
52
For the Year Ended May 31, 2023
| | | Water Island
Credit
Opportunities Fund | |
Net change in unrealized appreciation (depreciation) on: | |
Unaffiliated investments | | | 1,258,163 | | |
Affiliated investments | | | — | | |
Securities sold short | | | (1,775,332 | ) | |
Foreign currency transactions (Note 9) | | | 248 | | |
Purchased option contracts | | | (87,699 | ) | |
Written option contracts | | | 240 | | |
Swap contracts | | | (22,831 | ) | |
Forward currency contracts | | | 220 | | |
NET REALIZED AND UNREALIZED LOSSES ON INVESTMENTS AND FOREIGN CURRENCIES | | | (1,347,742 | ) | |
NET INCREASE (DECREASE) IN NET ASSETS RESULTING FROM OPERATIONS | | $ | 3,457,632 | | |
Annual Report | May 31, 2023
53
| | | Arbitrage Fund | |
| | | Year Ended
May 31, 2023 | | Year Ended
May 31, 2022 | |
FROM OPERATIONS: | |
Net investment income (loss) | | $ | 5,307,920 | | | $ | (7,137,527 | ) | |
Net realized gains (losses) from: | |
Unaffiliated investments | | | 21,303,485 | | | | 75,174,977 | | |
Purchased option contracts | | | (3,753,338 | ) | | | (1,844,236 | ) | |
Swap contracts | | | 5,016,744 | | | | (6,444,884 | ) | |
Securities sold short | | | 7,701,552 | | | | (19,584,880 | ) | |
Written option contracts | | | (794,457 | ) | | | 2,115,078 | | |
Forward currency contracts | | | 9,455,080 | | | | 9,860,568 | | |
Foreign currency transactions | | | 126,724 | | | | (659,632 | ) | |
Net change in unrealized appreciation (depreciation) on: | |
Unaffiliated investments | | | (33,173,752 | ) | | | (114,517,314 | ) | |
Affiliated investments | | | (660,536 | ) | | | (3,434,790 | ) | |
Securities sold short | | | (316,732 | ) | | | 235,533 | | |
Foreign currency transactions | | | 121,839 | | | | (8,941 | ) | |
Purchased option contracts | | | (512,810 | ) | | | 1,391,682 | | |
Written option contracts | | | (10,186 | ) | | | 10,186 | | |
Swap contracts | | | (13,900,131 | ) | | | 148 | | |
Forward currency contracts | | | (3,276,363 | ) | | | 5,524,437 | | |
Net increase (decrease) in net assets resulting from operations | | | (7,364,961 | ) | | | (59,319,595 | ) | |
FROM DIVIDENDS AND DISTRIBUTIONS TO SHAREHOLDERS: | |
Distributions from distributable earnings, Class R | | | (2,052,959 | ) | | | (516,092 | ) | |
Distributions from distributable earnings, Class I | | | (48,583,107 | ) | | | (7,605,189 | ) | |
Distributions from distributable earnings, Class C | | | (308,280 | ) | | | (99,436 | ) | |
Distributions from distributable earnings, Class A | | | (1,345,088 | ) | | | (213,958 | ) | |
Decrease in net assets from distributions to shareholders | | | (52,289,434 | ) | | | (8,434,675 | ) | |
FROM CAPITAL SHARE TRANSACTIONS (NOTE 8): | |
Proceeds from shares sold | | | 291,944,330 | | | | 493,961,134 | | |
Shares issued in reinvestment of distributions | | | 43,054,678 | | | | 6,813,804 | | |
Payments for shares redeemed | | | (724,701,012 | ) | | | (438,357,571 | ) | |
Net increase (decrease) in net assets from capital share transactions | | | (389,702,004 | ) | | | 62,417,367 | | |
TOTAL INCREASE (DECREASE) IN NET ASSETS | | | (449,356,399 | ) | | | (5,336,903 | ) | |
NET ASSETS: | |
Beginning of year | | | 1,592,548,791 | | | | 1,597,885,694 | | |
End of year | | $ | 1,143,192,392 | | | $ | 1,592,548,791 | | |
See Notes to Financial Statements.
www.arbitragefunds.com | 1-800-295-4485
54
Statement of Changes in Net Assets
| | | Water Island Event-Driven Fund | |
| | | Year Ended
May 31, 2023 | | Year Ended
May 31, 2022 | |
FROM OPERATIONS: | |
Net investment income (loss) | | $ | 270,720 | | | $ | (1,121,511 | ) | |
Net realized gains (losses) from: | |
Unaffiliated investments | | | 2,421,410 | | | | 7,344,199 | | |
Purchased option contracts | | | (340,066 | ) | | | (141,575 | ) | |
Swap contracts | | | 399,115 | | | | (643,295 | ) | |
Securities sold short | | | 629,133 | | | | (2,833,577 | ) | |
Written option contracts | | | (59,394 | ) | | | 227,040 | | |
Forward currency contracts | | | 379,573 | | | | 677,044 | | |
Foreign currency transactions | | | 29,855 | | | | 34,075 | | |
Net change in unrealized appreciation (depreciation) on: | |
Unaffiliated investments | | | (3,546,003 | ) | | | (9,533,762 | ) | |
Affiliated investments | | | — | | | | — | | |
Securities sold short | | | 34,754 | | | | (663,914 | ) | |
Foreign currency transactions | | | 171,309 | | | | (1,610 | ) | |
Purchased option contracts | | | (96,014 | ) | | | 152,193 | | |
Written option contracts | | | 5,284 | | | | 861 | | |
Swap contracts | | | (1,163,229 | ) | | | — | | |
Forward currency contracts | | | (177,226 | ) | | | 363,598 | | |
Net increase (decrease) in net assets resulting from operations | | | (1,040,779 | ) | | | (6,140,234 | ) | |
FROM DIVIDENDS AND DISTRIBUTIONS TO SHAREHOLDERS: | |
Distributions from distributable earnings, Class R | | | — | | | | — | | |
Distributions from distributable earnings, Class I | | | — | | | | — | | |
Distributions from distributable earnings, Class C | | | — | | | | — | | |
Distributions from distributable earnings, Class A | | | — | | | | — | | |
Decrease in net assets from distributions to shareholders | | | — | | | | — | | |
FROM CAPITAL SHARE TRANSACTIONS (NOTE 8): | |
Proceeds from shares sold | | | 21,857,379 | | | | 16,716,837 | | |
Shares issued in reinvestment of distributions | | | — | | | | — | | |
Payments for shares redeemed | | | (20,118,517 | ) | | | (33,328,537 | ) | |
Net increase (decrease) in net assets from capital share transactions | | | 1,738,862 | | | | (16,611,700 | ) | |
TOTAL INCREASE (DECREASE) IN NET ASSETS | | | 698,083 | | | | (22,751,934 | ) | |
NET ASSETS: | |
Beginning of year | | | 113,841,742 | | | | 136,593,676 | | |
End of year | | $ | 114,539,825 | | | $ | 113,841,742 | | |
Annual Report | May 31, 2023
55
The Arbitrage Funds Statement of Changes in Net Assets
| | | Water Island Credit
Opportunities Fund | |
| | | Year Ended
May 31, 2023 | | Year Ended
May 31, 2022 | |
FROM OPERATIONS: | |
Net investment income (loss) | | $ | 4,805,374 | | | $ | 2,354,939 | | |
Net realized gains (losses) from: | |
Investments | | | (2,307,637 | ) | | | 1,164,010 | | |
Purchased option contracts | | | (61,807 | ) | | | (262,482 | ) | |
Swap contracts | | | 182,088 | | | | 200,376 | | |
Securities sold short | | | 1,379,050 | | | | (285,977 | ) | |
Written option contracts | | | 87,999 | | | | 97,867 | | |
Forward currency contracts | | | (1,255 | ) | | | 2,653 | | |
Foreign currency transactions | | | 811 | | | | 883 | | |
Net change in unrealized appreciation (depreciation) on: | |
Investments | | | 1,258,163 | | | | (9,859,431 | ) | |
Securities sold short | | | (1,775,332 | ) | | | 4,035,356 | | |
Foreign currency transactions | | | 248 | | | | (57 | ) | |
Purchased option contracts | | | (87,699 | ) | | | 53,356 | | |
Written option contracts | | | 240 | | | | 83 | | |
Swap contracts | | | (22,831 | ) | | | — | | �� |
Forward currency contracts | | | 220 | | | | 9,606 | | |
Net increase (decrease) in net assets resulting from operations | | | 3,457,632 | | | | (2,488,818 | ) | |
FROM DIVIDENDS AND DISTRIBUTIONS TO SHAREHOLDERS: | |
Distributions from distributable earnings, Class R | | | (350,840 | ) | | | (232,802 | ) | |
Distributions from distributable earnings, Class I | | | (4,888,340 | ) | | | (3,360,754 | ) | |
Distributions from distributable earnings, Class A | | | (3,044 | ) | | | (2,624 | ) | |
Decrease in net assets from distributions to shareholders | | | (5,242,224 | ) | | | (3,596,180 | ) | |
FROM CAPITAL SHARE TRANSACTIONS (NOTE 8): | |
Proceeds from shares sold | | | 18,148,503 | | | | 54,762,362 | | |
Shares issued in reinvestment of distributions | | | 3,406,172 | | | | 3,120,787 | | |
Payments for shares redeemed | | | (38,354,970 | ) | | | (23,344,218 | ) | |
Net increase (decrease) in net assets from capital share
transactions | | | (16,800,295 | ) | | | 34,538,931 | | |
TOTAL INCREASE (DECREASE) IN NET ASSETS | | | (18,584,887 | ) | | | 28,453,933 | | |
NET ASSETS: | |
Beginning of year | | | 134,881,925 | | | | 106,427,992 | | |
End of year | | $ | 116,297,038 | | | $ | 134,881,925 | | |
See Notes to Financial Statements.
www.arbitragefunds.com | 1-800-295-4485
56
Arbitrage Fund — Class R Financial Highlights
Selected Per Share Data and Ratios for a Share Outstanding Throughout the Periods Presented:
| | | Year Ended May 31, | |
| | | 2023 | | 2022 | | 2021 | | 2020 | | 2019 | |
Net asset value,
beginning of period | | $ | 12.54 | | | $ | 13.11 | | | $ | 13.04 | | | $ | 12.92 | | | $ | 12.65 | | |
Income (loss) from
investment operations | |
Net investment income (loss)(a) | | | 0.02 | | | | (0.08 | ) | | | (0.01 | )(b) | | | (0.05 | ) | | | (0.03 | )(b) | |
Net realized and unrealized
gains (losses) on investments
and foreign currencies | | | (0.15 | ) | | | (0.42 | ) | | | 0.97 | | | | 0.44 | | | | 0.52 | | |
Total from investment
operations | | | (0.13 | ) | | | (0.50 | ) | | | 0.96 | | | | 0.39 | | | | 0.49 | | |
Less distributions | |
From net investment income | | | (0.09 | ) | | | — | | | | — | | | | — | | | | (0.06 | ) | |
From net realized gains | | | (0.35 | ) | | | (0.07 | ) | | | (0.89 | ) | | | (0.27 | ) | | | (0.16 | ) | |
Total distributions | | | (0.44 | ) | | | (0.07 | ) | | | (0.89 | ) | | | (0.27 | ) | | | (0.22 | ) | |
Net asset value, end of period | | $ | 11.97 | | | $ | 12.54 | | | $ | 13.11 | | | $ | 13.04 | | | $ | 12.92 | | |
Total return(c) | | | (1.03 | %) | | | (3.83 | %) | | | 7.58 | % | | | 3.07 | % | | | 3.89 | % | |
Net assets, end of period
(in 000s) | | $ | 44,250 | | | $ | 77,866 | | | $ | 97,909 | | | $ | 98,715 | | | $ | 163,349 | | |
RATIOS TO AVERAGE
NET ASSETS: | |
Gross expenses(d) | | | 1.51 | % | | | 1.55 | % | | | 1.64 | % | | | 1.66 | % | | | 1.94 | % | |
Net expenses after advisory
fees waived, recoupment
and expenses reimbursed(d)(e) | | | 1.45 | % | | | 1.49 | % | �� | | 1.58 | % | | | 1.63 | % | | | 1.93 | % | |
Net investment income (loss) | | | 0.13 | % | | | (0.61 | %) | | | (0.08 | %)(b) | | | (0.36 | %) | | | (0.20 | %)(b) | |
Portfolio turnover rate | | | 197 | % | | | 206 | % | | | 300 | % | | | 273 | % | | | 419 | % | |
(a) Per share amounts were calculated using average shares outstanding for the year.
(b) The amount shown for a share outstanding throughout the period may not correlate with the Statement of Operations for the period due to timing of sales and redemptions of Fund shares in relation to income earned, allocation of class specific expenses and/or fluctuating market value of the investments of the Fund.
(c) Total return is a measure of the change in the value of an investment in the Fund over the years covered, which assumes any dividends or capital gains distributions are reinvested in shares of the Fund. Returns shown do not reflect the deduction of taxes a shareholder would pay on Fund distributions or the redemption of Fund shares.
(d) Dividend expense totaled 0.01%, 0.01%, 0.00%, 0.15% and 0.46% of average net assets for the years ended May 31, 2023, 2022, 2021, 2020 and 2019, respectively. Interest rebate expense and line of credit interest expense totaled 0.00%, 0.05%, 0.11%, 0.01% and 0.00% of average net assets for the years ended May 31, 2023, 2022, 2021, 2020 and 2019, respectively.
(e) Excluding dividend and interest expenses, the Fund's net expenses after advisory fees waived and expenses reimbursed would have been 1.44%, 1.43%, 1.47%, 1.47% and 1.47% of average net assets for the years ended May 31, 2023, 2022, 2021, 2020 and 2019, respectively.
See Notes to Financial Statements.
Annual Report | May 31, 2023
57
Arbitrage Fund — Class I Financial Highlights
Selected Per Share Data and Ratios for a Share Outstanding Throughout the Periods Presented:
| | | Year Ended May 31, | |
| | | 2023 | | 2022 | | 2021 | | 2020 | | 2019 | |
Net asset value,
beginning of period | | $ | 13.05 | | | $ | 13.60 | | | $ | 13.47 | | | $ | 13.32 | | | $ | 13.03 | | |
Income (loss) from
investment operations | |
Net investment income (loss)(a) | | | 0.05 | | | | (0.05 | ) | | | 0.02 | | | | (0.02 | ) | | | 0.01 | | |
Net realized and unrealized
gains (losses) on investments
and foreign currencies | | | (0.15 | ) | | | (0.43 | ) | | | 1.00 | | | | 0.45 | | | | 0.54 | | |
Total from investment
operations | | | (0.10 | ) | | | (0.48 | ) | | | 1.02 | | | | 0.43 | | | | 0.55 | | |
Less distributions | |
From net investment income | | | (0.13 | ) | | | — | | | | — | | | | (0.01 | ) | | | (0.10 | ) | |
From net realized gains | | | (0.35 | ) | | | (0.07 | ) | | | (0.89 | ) | | | (0.27 | ) | | | (0.16 | ) | |
Total distributions | | | (0.48 | ) | | | (0.07 | ) | | | (0.89 | ) | | | (0.28 | ) | | | (0.26 | ) | |
Net asset value, end of period | | $ | 12.47 | | | $ | 13.05 | | | $ | 13.60 | | | $ | 13.47 | | | $ | 13.32 | | |
Total return(b) | | | (0.75 | %) | | | (3.55 | %) | | | 7.87 | % | | | 3.27 | % | | | 4.21 | % | |
Net assets, end of period
(in 000s) | | $ | 1,062,907 | | | $ | 1,459,176 | | | $ | 1,449,309 | | | $ | 1,243,838 | | | $ | 1,546,542 | | |
RATIOS TO AVERAGE
NET ASSETS: | |
Gross expenses(c) | | | 1.26 | % | | | 1.30 | % | | | 1.39 | % | | | 1.41 | % | | | 1.69 | % | |
Net expenses after advisory
fees waived, recoupment
and expenses reimbursed(c)(d) | | | 1.20 | % | | | 1.24 | % | | | 1.33 | % | | | 1.38 | % | | | 1.68 | % | |
Net investment income (loss) | | | 0.40 | % | | | (0.41 | %) | | | 0.16 | % | | | (0.13 | %) | | | 0.06 | % | |
Portfolio turnover rate | | | 197 | % | | | 206 | % | | | 300 | % | | | 273 | % | | | 419 | % | |
(a) Per share amounts were calculated using average shares outstanding for the year.
(b) Total return is a measure of the change in the value of an investment in the Fund over the years covered, which assumes any dividends or capital gains distributions are reinvested in shares of the Fund. Returns shown do not reflect the deduction of taxes a shareholder would pay on Fund distributions or the redemption of Fund shares.
(c) Dividend expense totaled 0.01%, 0.01%, 0.00%, 0.15% and 0.46% of average net assets for the years ended May 31, 2023, 2022, 2021, 2020 and 2019, respectively. Interest rebate expense and line of credit interest expense totaled 0.00%, 0.05%, 0.11%, 0.01% and 0.00% of average net assets for the years ended May 31, 2023, 2022, 2021, 2020 and 2019, respectively.
(d) Excluding dividend and interest expenses, the Fund's net expenses after advisory fees waived and expenses reimbursed would have been 1.19%, 1.18%, 1.22%, 1.22% and 1.22% of average net assets for the years ended May 31, 2023, 2022, 2021, 2020 and 2019, respectively.
See Notes to Financial Statements.
www.arbitragefunds.com | 1-800-295-4485
58
Arbitrage Fund — Class C Financial Highlights
Selected Per Share Data and Ratios for a Share Outstanding Throughout the Periods Presented:
| | | Year Ended May 31, | |
| | | 2023 | | 2022 | | 2021 | | 2020 | | 2019 | |
Net asset value,
beginning of period | | $ | 11.64 | | | $ | 12.26 | | | $ | 12.34 | | | $ | 12.34 | | | $ | 12.12 | | |
Income (loss) from
investment operations | |
Net investment loss(a) | | | (0.07 | )(b) | | | (0.16 | ) | | | (0.10 | )(b) | | | (0.14 | ) | | | (0.12 | )(b) | |
Net realized and unrealized
gains (losses) on investments
and foreign currencies | | | (0.13 | ) | | | (0.39 | ) | | | 0.91 | | | | 0.41 | | | | 0.50 | | |
Total from investment
operations | | | (0.20 | ) | | | (0.55 | ) | | | 0.81 | | | | 0.27 | | | | 0.38 | | |
Less distributions | |
From net realized gains | | | (0.35 | ) | | | (0.07 | ) | | | (0.89 | ) | | | (0.27 | ) | | | (0.16 | ) | |
Total distributions | | | (0.35 | ) | | | (0.07 | ) | | | (0.89 | ) | | | (0.27 | ) | | | (0.16 | ) | |
Net asset value, end of period | | $ | 11.09 | | | $ | 11.64 | | | $ | 12.26 | | | $ | 12.34 | | | $ | 12.34 | | |
Total return(c)(d) | | | (1.73 | %) | | | (4.51 | %) | | | 6.77 | % | | | 2.24 | % | | | 3.11 | % | |
Net assets, end of period
(in 000s) | | $ | 8,398 | | | $ | 13,467 | | | $ | 18,043 | | | $ | 19,860 | | | $ | 19,050 | | |
RATIOS TO AVERAGE
NET ASSETS: | |
Gross expenses(e) | | | 2.26 | % | | | 2.30 | % | | | 2.39 | % | | | 2.41 | % | | | 2.69 | % | |
Net expenses after advisory
fees waived, recoupment
and expenses reimbursed(e)(f) | | | 2.20 | % | | | 2.24 | % | | | 2.33 | % | | | 2.38 | % | | | 2.68 | % | |
Net investment loss | | | (0.61 | %) | | | (1.35 | %) | | | (0.85 | %)(b) | | | (1.16 | %) | | | (0.94 | %)(b) | |
Portfolio turnover rate | | | 197 | % | | | 206 | % | | | 300 | % | | | 273 | % | | | 419 | % | |
(a) Per share amounts were calculated using average shares outstanding for the year.
(b) The amount shown for a share outstanding throughout the period may not correlate with the Statement of Operations for the period due to timing of sales and redemptions of Fund shares in relation to income earned, allocation of class specific expenses and/or fluctuating market value of the investments of the Fund.
(c) Total return is a measure of the change in the value of an investment in the Fund over the years covered, which assumes any dividends or capital gains distributions are reinvested in shares of the Fund. Returns shown do not reflect the deduction of taxes a shareholder would pay on Fund distributions or the redemption of Fund shares.
(d) Total return excludes sales charges, if any, and would be lower for the period presented if it reflected these charges.
(e) Dividend expense totaled 0.01%, 0.01%, 0.00%, 0.15% and 0.46% of average net assets for the years ended May 31, 2023, 2022, 2021, 2020 and 2019, respectively. Interest rebate expense and line of credit interest expense totaled 0.00%, 0.05%, 0.11%, 0.01% and 0.00% of average net assets for the years ended May 31, 2023, 2022, 2021, 2020 and 2019, respectively.
(f) Excluding dividend and interest expenses, the Fund's net expenses after advisory fees waived and expenses reimbursed would have been 2.19%, 2.18%, 2.22%, 2.22% and 2.22% of average net assets for the years ended May 31, 2023, 2022, 2021, 2020 and 2019, respectively.
See Notes to Financial Statements.
Annual Report | May 31, 2023
59
Arbitrage Fund — Class A Financial Highlights
Selected Per Share Data and Ratios for a Share Outstanding Throughout the Periods Presented:
| | | Year Ended May 31, | |
| | | 2023 | | 2022 | | 2021 | | 2020 | | 2019 | |
Net asset value,
beginning of period | | $ | 12.52 | | | $ | 13.08 | | | $ | 13.01 | | | $ | 12.90 | | | $ | 12.63 | | |
Income (loss) from
investment operations | |
Net investment income (loss)(a) | | | 0.02 | | | | (0.09 | ) | | | 0.00 | (b) | | | (0.05 | ) | | | (0.02 | )(c) | |
Net realized and unrealized
gains (losses) on investments
and foreign currencies | | | (0.15 | ) | | | (0.40 | ) | | | 0.96 | | | | 0.43 | | | | 0.52 | | |
Total from investment
operations | | | (0.13 | ) | | | (0.49 | ) | | | 0.96 | | | | 0.38 | | | | 0.50 | | |
Less distributions | |
From net investment income | | | (0.10 | ) | | | 0.00 | | | | 0.00 | | | | 0.00 | | | | (0.07 | ) | |
From net realized gains | | | (0.35 | ) | | | (0.07 | ) | | | (0.89 | ) | | | (0.27 | ) | | | (0.16 | ) | |
Total distributions | | | (0.45 | ) | | | (0.07 | ) | | | (0.89 | ) | | | (0.27 | ) | | | (0.23 | ) | |
Net asset value, end of period | | $ | 11.94 | | | $ | 12.52 | | | $ | 13.08 | | | $ | 13.01 | | | $ | 12.90 | | |
Total return(d)(e) | | | (1.06 | %) | | | (3.77 | %) | | | 7.60 | % | | | 3.00 | % | | | 3.94 | % | |
Net assets, end of period
(in 000s) | | $ | 27,637 | | | $ | 42,040 | | | $ | 32,624 | | | $ | 17,762 | | | $ | 18,341 | | |
RATIOS TO AVERAGE
NET ASSETS: | |
Gross expenses(f) | | | 1.51 | % | | | 1.55 | % | | | 1.64 | % | | | 1.66 | % | | | 1.94 | % | |
Net expenses after advisory
fees waived, recoupment
and expenses reimbursed(f)(g) | | | 1.45 | % | | | 1.49 | % | | | 1.58 | % | | | 1.63 | % | | | 1.93 | % | |
Net investment income (loss) | | | 0.16 | % | | | (0.74 | %) | | | (0.03 | %)(c) | | | (0.40 | %) | | | (0.19 | %)(c) | |
Portfolio turnover rate | | | 197 | % | | | 206 | % | | | 300 | % | | | 273 | % | | | 419 | % | |
(a) Per share amounts were calculated using average shares outstanding for the year.
(b) Amount rounds to less than $0.01 per share.
(c) The amount shown for a share outstanding throughout the period may not correlate with the Statement of Operations for the period due to timing of sales and redemptions of Fund shares in relation to income earned, allocation of class specific expenses and/or fluctuating market value of the investments of the Fund.
(d) Total return is a measure of the change in the value of an investment in the Fund over the years covered, which assumes any dividends or capital gains distributions are reinvested in shares of the Fund. Returns shown do not reflect the deduction of taxes a shareholder would pay on Fund distributions or the redemption of Fund shares.
(e) Total return excludes sales charges, if any, and would be lower for the period presented if it reflected these charges.
(f) Dividend expense totaled 0.01%, 0.01%, 0.00%, 0.15% and 0.46% of average net assets for the years ended May 31, 2023, 2022, 2021, 2020 and 2019, respectively. Interest rebate expense and line of credit interest expense totaled 0.00%, 0.05%, 0.11%, 0.01% and 0.00% of average net assets for the years ended May 31, 2023, 2022, 2021, 2020 and 2019, respectively.
(g) Excluding dividend and interest expenses, the Fund's net expenses after advisory fees waived and expenses reimbursed would have been 1.44%, 1.43%, 1.47%, 1.47% and 1.47% of average net assets for the years ended May 31, 2023, 2022, 2021, 2020 and 2019, respectively.
See Notes to Financial Statements.
www.arbitragefunds.com | 1-800-295-4485
60
Water Island Event-Driven Fund — Class R Financial Highlights
Selected Per Share Data and Ratios for a Share Outstanding Throughout the Periods Presented:
| | | Year Ended May 31, | |
| | | 2023 | | 2022 | | 2021 | | 2020 | | 2019 | |
Net asset value,
beginning of period | | $ | 10.84 | | | $ | 11.38 | | | $ | 9.97 | | | $ | 9.47 | | | $ | 9.46 | | |
Income (loss) from
investment operations | |
Net investment income (loss)(a) | | | (0.00 | )(b)(c) | | | (0.12 | ) | | | (0.05 | ) | | | 0.01 | | | | 0.07 | | |
Net realized and unrealized
gains (losses) on investments
and foreign currencies | | | (0.12 | ) | | | (0.42 | ) | | | 1.46 | | | | 0.51 | | | | 0.08 | | |
Total from investment
operations | | | (0.12 | ) | | | (0.54 | ) | | | 1.41 | | | | 0.52 | | | | 0.15 | | |
Less distributions | |
From net investment income | | | — | | | | — | | | | — | | | | (0.02 | ) | | | (0.14 | ) | |
Total distributions | | | — | | | | — | | | | — | | | | (0.02 | ) | | | (0.14 | ) | |
Net asset value, end of period | | $ | 10.72 | | | $ | 10.84 | | | $ | 11.38 | | | $ | 9.97 | | | $ | 9.47 | | |
Total return(d) | | | (1.11 | %) | | | (4.75 | %) | | | 14.14 | % | | | 5.49 | % | | | 1.60 | % | |
Net assets, end of period
(in 000s) | | $ | 3,990 | | | $ | 4,502 | | | $ | 10,116 | | | $ | 7,694 | | | $ | 30,423 | | |
RATIOS TO AVERAGE
NET ASSETS: | |
Gross expenses(e) | | | 1.67 | % | | | 1.78 | % | | | 1.98 | % | | | 2.11 | % | | | 2.58 | % | |
Net expenses after advisory
fees waived, recoupment
and expenses reimbursed(e)(f) | | | 1.70 | % | | | 1.80 | % | | | 1.89 | % | | | 1.83 | % | | | 2.18 | % | |
Net investment income (loss) | | | (0.00 | %)(g) | | | (1.08 | %) | | | (0.51 | %) | | | 0.09 | % | | | 0.70 | % | |
Portfolio turnover rate | | | 216 | % | | | 217 | % | | | 320 | % | | | 397 | % | | | 504 | % | |
(a) Per share amounts were calculated using average shares outstanding for the year.
(b) Amount rounds to less than $0.01 per share.
(c) The amount shown for a share outstanding throughout the period may not correlate with the Statement of Operations for the period due to timing of sales and redemptions of Fund shares in relation to income earned, allocation of class specific expenses and/or fluctuating market value of the investments of the Fund.
(d) Total return is a measure of the change in the value of an investment in the Fund over the years covered, which assumes any dividends or capital gains distributions are reinvested in shares of the Fund. Returns shown do not reflect the deduction of taxes a shareholder would pay on Fund distributions or the redemption of Fund shares.
(e) Dividend expense totaled 0.01%, 0.01%, 0.01%, 0.13% and 0.46% of average net assets for the years ended May 31, 2023, 2022, 2021, 2020 and 2019, respectively. Interest rebate expense and line of credit interest expense totaled 0.00%, 0.10%, 0.19%, 0.01% and 0.03% of average net assets for the years ended May 31, 2023, 2022, 2021, 2020 and 2019, respectively.
(f) Excluding dividend and interest expenses, the Fund's net expenses after advisory fees waived and expenses reimbursed would have been 1.69%, 1.69%, 1.69%, 1.69% and 1.69% of average net assets for the years ended May 31, 2023, 2022, 2021, 2020 and 2019, respectively.
(g) Amount rounds to less than (0.01%) per share.
See Notes to Financial Statements.
Annual Report | May 31, 2023
61
Water Island Event-Driven Fund — Class I Financial Highlights
Selected Per Share Data and Ratios for a Share Outstanding Throughout the Periods Presented:
| | | Year Ended May 31, | |
| | | 2023 | | 2022 | | 2021 | | 2020 | | 2019 | |
Net asset value,
beginning of period | | $ | 10.95 | | | $ | 11.47 | | | $ | 10.05 | | | $ | 9.54 | | | $ | 9.53 | | |
Income (loss) from
investment operations | |
Net investment income (loss)(a) | | | 0.03 | | | | (0.10 | ) | | | (0.03 | ) | | | 0.02 | | | | 0.09 | | |
Net realized and unrealized
gains (losses) on investments
and foreign currencies | | | (0.12 | ) | | | (0.42 | ) | | | 1.48 | | | | 0.53 | | | | 0.09 | | |
Total from investment
operations | | | (0.09 | ) | | | (0.52 | ) | | | 1.45 | | | | 0.55 | | | | 0.18 | | |
Less distributions | |
From net investment income | | | — | | | | — | | | | (0.03 | ) | | | (0.04 | ) | | | (0.17 | ) | |
Total distributions | | | — | | | | — | | | | (0.03 | ) | | | (0.04 | ) | | | (0.17 | ) | |
Net asset value, end of period | | $ | 10.86 | | | $ | 10.95 | | | $ | 11.47 | | | $ | 10.05 | | | $ | 9.54 | | |
Total return(b) | | | (0.82 | %) | | | (4.53 | %) | | | 14.51 | % | | | 5.83 | % | | | 1.88 | % | |
Net assets, end of period
(in 000s) | | $ | 108,674 | | | $ | 107,038 | | | $ | 125,093 | | | $ | 99,069 | | | $ | 92,710 | | |
RATIOS TO AVERAGE
NET ASSETS: | |
Gross expenses(c) | | | 1.42 | % | | | 1.53 | % | | | 1.73 | % | | | 1.86 | % | | | 2.33 | % | |
Net expenses after advisory
fees waived, recoupment
and expenses reimbursed(c)(d) | | | 1.45 | % | | | 1.55 | % | | | 1.64 | % | | | 1.58 | % | | | 1.93 | % | |
Net investment income (loss) | | | 0.25 | % | | | (0.86 | %) | | | (0.24 | %) | | | 0.20 | % | | | 0.92 | % | |
Portfolio turnover rate | | | 216 | % | | | 217 | % | | | 320 | % | | | 397 | % | | | 504 | % | |
(a) Per share amounts were calculated using average shares outstanding for the year.
(b) Total return is a measure of the change in the value of an investment in the Fund over the years covered, which assumes any dividends or capital gains distributions are reinvested in shares of the Fund. Returns shown do not reflect the deduction of taxes a shareholder would pay on Fund distributions or the redemption of Fund shares.
(c) Dividend expense totaled 0.01%, 0.01%, 0.01%, 0.13% and 0.46% of average net assets for the years ended May 31, 2023, 2022, 2021, 2020 and 2019, respectively. Interest rebate expense and line of credit interest expense totaled 0.00%, 0.10%, 0.19%, 0.01% and 0.03% of average net assets for the years ended May 31, 2023, 2022, 2021, 2020 and 2019, respectively.
(d) Excluding dividend and interest expenses, the Fund's net expenses after advisory fees waived and expenses reimbursed would have been 1.44%, 1.44%, 1.44%, 1.44% and 1.44% of average net assets for the years ended May 31, 2023, 2022, 2021, 2020 and 2019, respectively.
See Notes to Financial Statements.
www.arbitragefunds.com | 1-800-295-4485
62
Water Island Event-Driven Fund — Class A Financial Highlights
Selected Per Share Data and Ratios for a Share Outstanding Throughout the Periods Presented:
| | | Year Ended May 31, | |
| | | 2023 | | 2022 | | 2021 | | 2020 | | 2019 | |
Net asset value,
beginning of period | | $ | 10.82 | | | $ | 11.36 | | | $ | 9.97 | | | $ | 9.46 | | | $ | 9.46 | | |
Income (loss) from
investment operations | |
Net investment income (loss)(a) | | | (0.00 | )(b)(c) | | | (0.15 | ) | | | (0.06 | ) | | | (0.00 | )(b) | | | 0.06 | | |
Net realized and unrealized
gains (losses) on investments
and foreign currencies | | | (0.12 | ) | | | (0.39 | ) | | | 1.46 | | | | 0.53 | | | | 0.08 | | |
Total from investment
operations | | | (0.12 | ) | | | (0.54 | ) | | | 1.40 | | | | 0.53 | | | | 0.14 | | |
Less distributions | |
From net investment income | | | — | | | | — | | | | (0.01 | ) | | | (0.02 | ) | | | (0.14 | ) | |
Total distributions | | | — | | | | — | | | | (0.01 | ) | | | (0.02 | ) | | | (0.14 | ) | |
Net asset value, end of period | | $ | 10.70 | | | $ | 10.82 | | | $ | 11.36 | | | $ | 9.97 | | | $ | 9.46 | | |
Total return(d)(e) | | | (1.11 | %) | | | (4.75 | %) | | | 14.20 | % | | | 5.62 | % | | | 1.56 | % | |
Net assets, end of period
(in 000s) | | $ | 1,876 | | | $ | 2,301 | | | $ | 1,384 | | | $ | 347 | | | $ | 799 | | |
RATIOS TO AVERAGE
NET ASSETS: | |
Gross expenses(f) | | | 1.67 | % | | | 1.77 | % | | | 2.00 | % | | | 2.11 | % | | | 2.58 | % | |
Net expenses after advisory
fees waived, recoupment
and expenses reimbursed(f)(g) | | | 1.70 | % | | | 1.79 | % | | | 1.91 | % | | | 1.83 | % | | | 2.18 | % | |
Net investment income (loss) | | | (0.01 | %) | | | (1.35 | %) | | | (0.59 | %) | | | 0.02 | % | | | 0.65 | % | |
Portfolio turnover rate | | | 216 | % | | | 217 | % | | | 320 | % | | | 397 | % | | | 504 | % | |
(a) Per share amounts were calculated using average shares outstanding for the year.
(b) Amount rounds to less than $0.01 per share.
(c) The amount shown for a share outstanding throughout the period may not correlate with the Statement of Operations for the period due to timing of sales and redemptions of Fund shares in relation to income earned, allocation of class specific expenses and/or fluctuating market value of the investments of the Fund.
(d) Total return excludes sales charges, if any, and would be lower for the period presented if it reflected these charges.
(e) Total return is a measure of the change in the value of an investment in the Fund over the years covered, which assumes any dividends or capital gains distributions are reinvested in shares of the Fund. Returns shown do not reflect the deduction of taxes a shareholder would pay on Fund distributions or the redemption of Fund shares or the imposition of any sales load.
(f) Dividend expense totaled 0.01%, 0.00%, 0.01%, 0.13% and 0.46% of average net assets for the years ended May 31, 2023, 2022, 2021, 2020 and 2019, respectively. Interest rebate expense and line of credit interest expense totaled 0.00%, 0.10%, 0.21%, 0.01% and 0.03% of average net assets for the years ended May 31, 2023, 2022, 2021, 2020 and 2019, respectively.
(g) Excluding dividend and interest expenses, the Fund's net expenses after advisory fees waived and expenses reimbursed would have been 1.69%, 1.69%, 1.69%, 1.69% and 1.69% of average net assets for the years ended May 31, 2023, 2022, 2021, 2020 and 2019, respectively.
See Notes to Financial Statements.
Annual Report | May 31, 2023
63
Water Island Credit Opportunities Fund — Class R Financial Highlights
Selected Per Share Data and Ratios for a Share Outstanding Throughout the Periods Presented:
| | | Year Ended May 31, | |
| | | 2023 | | 2022 | | 2021 | | 2020 | | 2019 | |
Net asset value,
beginning of period | | $ | 9.73 | | | $ | 10.16 | | | $ | 9.64 | | | $ | 9.70 | | | $ | 9.77 | | |
Income (loss) from
investment operations | |
Net investment income(a) | | | 0.36 | | | | 0.16 | | | | 0.22 | | | | 0.24 | | | | 0.31 | | |
Net realized and unrealized
gains (losses) on investments
and foreign currencies | | | (0.09 | ) | | | (0.33 | ) | | | 0.54 | | | | (0.01 | ) | | | (0.07 | ) | |
Total from investment
operations | | | 0.27 | | | | (0.17 | ) | | | 0.76 | | | | 0.23 | | | | 0.24 | | |
Less distributions | |
From net investment income | | | (0.39 | ) | | | (0.26 | ) | | | (0.24 | ) | | | (0.29 | ) | | | (0.31 | ) | |
Total distributions | | | (0.39 | ) | | | (0.26 | ) | | | (0.24 | ) | | | (0.29 | ) | | | (0.31 | ) | |
Net asset value, end of period | | $ | 9.61 | | | $ | 9.73 | | | $ | 10.16 | | | $ | 9.64 | | | $ | 9.70 | | |
Total return(b) | | | 2.88 | % | | | (1.74 | %) | | | 8.09 | % | | | 2.46 | % | | | 2.55 | % | |
Net assets, end of period
(in 000s) | | $ | 6,742 | | | $ | 9,072 | | | $ | 7,553 | | | $ | 3,673 | | | $ | 7,845 | | |
RATIOS TO AVERAGE
NET ASSETS: | |
Gross expenses(c) | | | 1.62 | % | | | 1.62 | % | | | 1.77 | % | | | 1.96 | % | | | 2.10 | %(d) | |
Net expenses after advisory
fees waived, recoupment
and expenses reimbursed(c)(e) | | | 1.30 | % | | | 1.32 | % | | | 1.32 | % | | | 1.35 | % | | | 1.59 | %(d) | |
Net investment income | | | 3.70 | % | | | 1.58 | % | | | 2.20 | % | | | 2.48 | % | | | 3.18 | %(d) | |
Portfolio turnover rate | | | 127 | % | | | 148 | % | | | 147 | % | | | 175 | % | | | 221 | % | |
(a) Per share amounts were calculated using average shares outstanding for the year.
(b) Total return is a measure of the change in the value of an investment in the Fund over the years covered, which assumes any dividends or capital gains distributions are reinvested in shares of the Fund. Returns shown do not reflect the deduction of taxes a shareholder would pay on Fund distributions or the redemption of Fund shares.
(c) Dividend expense totaled 0.05%, 0.01%, 0.01%, 0.07% and 0.29% of average net assets for the years ended May 31, 2023, 2022, 2021, 2020 and 2019, respectively. Interest rebate expense and line of credit interest expense totaled 0.02%, 0.08%, 0.08%, 0.05% and 0.01% of average net assets for the years ended May 31, 2023, 2022, 2021, 2020 and 2019, respectively.
(d) Effective August 6, 2018, the investment adviser reduced the advisory fee paid by the Fund and agreed to increase the expense reimbursements it provides to the Fund by contractually limiting the Fund's total expenses (other than certain expenses noted in the Notes to Financial Statements) to 1.23% for Class R shares. Prior to August 6, 2018, the expense limitation had been 1.50%.
(e) Excluding dividend and interest expenses, the Fund's net expenses after advisory fees waived and expenses reimbursed would have been 1.23%, 1.23%, 1.23%, 1.23% and 1.29% of average net assets for the years ended May 31, 2023, 2022, 2021, 2020 and 2019, respectively.
See Notes to Financial Statements.
www.arbitragefunds.com | 1-800-295-4485
64
Water Island Credit Opportunities Fund — Class I Financial Highlights
Selected Per Share Data and Ratios for a Share Outstanding Throughout the Periods Presented:
| | | Year Ended May 31, | |
| | | 2023 | | 2022 | | 2021 | | 2020 | | 2019 | |
Net asset value,
beginning of period | | $ | 9.69 | | | $ | 10.12 | | | $ | 9.60 | | | $ | 9.65 | | | $ | 9.73 | | |
Income (loss) from
investment operations | |
Net investment income(a) | | | 0.38 | | | | 0.18 | | | | 0.24 | | | | 0.26 | | | | 0.34 | | |
Net realized and unrealized
gains (losses) on investments
and foreign currencies | | | (0.10 | ) | | | (0.33 | ) | | | 0.55 | | | | 0.01 | (b) | | | (0.08 | ) | |
Total from investment
operations | | | 0.28 | | | | (0.15 | ) | | | 0.79 | | | | 0.27 | | | | 0.26 | | |
Less distributions | |
From net investment income | | | (0.41 | ) | | | (0.28 | ) | | | (0.27 | ) | | | (0.32 | ) | | | (0.34 | ) | |
Total distributions | | | (0.41 | ) | | | (0.28 | ) | | | (0.27 | ) | | | (0.32 | ) | | | (0.34 | ) | |
Net asset value, end of period | | $ | 9.56 | | | $ | 9.69 | | | $ | 10.12 | | | $ | 9.60 | | | $ | 9.65 | | |
Total return(c) | | | 3.03 | % | | | (1.51 | %) | | | 8.29 | % | | | 2.82 | % | | | 2.70 | % | |
Net assets, end of period
(in 000s) | | $ | 109,488 | | | $ | 125,705 | | | $ | 98,777 | | | $ | 56,869 | | | $ | 49,795 | | |
RATIOS TO AVERAGE
NET ASSETS: | |
Gross expenses(d) | | | 1.37 | % | | | 1.37 | % | | | 1.52 | % | | | 1.71 | % | | | 1.85 | %(e) | |
Net expenses after advisory
fees waived, recoupment
and expenses reimbursed(d)(f) | | | 1.05 | % | | | 1.07 | % | | | 1.07 | % | | | 1.10 | % | | | 1.32 | %(e) | |
Net investment income | | | 3.94 | % | | | 1.84 | % | | | 2.44 | % | | | 2.73 | % | | | 3.51 | %(e) | |
Portfolio turnover rate | | | 127 | % | | | 148 | % | | | 147 | % | | | 175 | % | | | 221 | % | |
(a) Per share amounts were calculated using average shares outstanding for the year.
(b) The amount shown for a share outstanding throughout the period may not correlate with the Statement of Operations for the period due to timing of sales and redemptions of Fund shares in relation to income earned, allocation of class specific expenses and/or fluctuating market value of the investments of the Fund.
(c) Total return is a measure of the change in the value of an investment in the Fund over the years covered, which assumes any dividends or capital gains distributions are reinvested in shares of the Fund. Returns shown do not reflect the deduction of taxes a shareholder would pay on Fund distributions or the redemption of Fund shares.
(d) Dividend expense totaled 0.05%, 0.01%, 0.01%, 0.07% and 0.29% of average net assets for the years ended May 31, 2023, 2022, 2021, 2020 and 2019, respectively. Interest rebate expense and line of credit interest expense totaled 0.02%, 0.08%, 0.08%, 0.05% and 0.01% of average net assets for the years ended May 31, 2023, 2022, 2021, 2020 and 2019, respectively.
(e) Effective August 6, 2018, the investment adviser reduced the advisory fee paid by the Fund and agreed to increase the expense reimbursements it provides to the Fund by contractually limiting the Fund's total expenses (other than certain expenses noted in the Notes to Financial Statements) to 0.98% for Class I shares. Prior to August 6, 2018, the expense limitation had been 1.25%.
(f) Excluding dividend and interest expenses, the Fund's net expenses after advisory fees waived and expenses reimbursed would have been 0.98%, 0.98%, 0.98%, 0.98% and 1.02% of average net assets for the years ended May 31, 2023, 2022, 2021, 2020 and 2019, respectively.
See Notes to Financial Statements.
Annual Report | May 31, 2023
65
Water Island Credit Opportunities Fund — Class A Financial Highlights
Selected Per Share Data and Ratios for a Share Outstanding Throughout the Periods Presented:
| | | Year Ended May 31, | |
| | | 2023 | | 2022 | | 2021 | | 2020 | | 2019 | |
Net asset value,
beginning of period | | $ | 9.69 | | | $ | 10.12 | | | $ | 9.60 | | | $ | 9.65 | | | $ | 9.73 | | |
Income (loss) from
investment operations | |
Net investment income(a) | | | 0.35 | | | | 0.16 | | | | 0.22 | | | | 0.23 | | | | 0.31 | | |
Net realized and unrealized
gains (losses) on investments
and foreign currencies | | | (0.08 | ) | | | (0.33 | ) | | | 0.54 | | | | 0.01 | (b) | | | (0.08 | ) | |
Total from investment
operations | | | 0.27 | | | | (0.17 | ) | | | 0.76 | | | | 0.24 | | | | 0.23 | | |
Less distributions | |
From net investment income | | | (0.39 | ) | | | (0.26 | ) | | | (0.24 | ) | | | (0.29 | ) | | | (0.31 | ) | |
Total distributions | | | (0.39 | ) | | | (0.26 | ) | | | (0.24 | ) | | | (0.29 | ) | | | (0.31 | ) | |
Net asset value, end of period | | $ | 9.57 | | | $ | 9.69 | | | $ | 10.12 | | | $ | 9.60 | | | $ | 9.65 | | |
Total return(c)(d) | | | 2.88 | % | | | (1.76 | %) | | | 8.02 | % | | | 2.56 | % | | | 2.45 | % | |
Net assets, end of period
(in 000s) | | $ | 67 | | | $ | 105 | | | $ | 97 | | | $ | 88 | | | $ | 121 | | |
RATIOS TO AVERAGE
NET ASSETS: | |
Gross expenses(e) | | | 1.61 | % | | | 1.62 | % | | | 1.77 | % | | | 1.96 | % | | | 2.10 | %(f) | |
Net expenses after advisory
fees waived, recoupment
and expenses reimbursed(e)(g) | | | 1.30 | % | | | 1.32 | % | | | 1.32 | % | | | 1.35 | % | | | 1.58 | %(f) | |
Net investment income | | | 3.64 | % | | | 1.59 | % | | | 2.21 | % | | | 2.37 | % | | | 3.24 | %(f) | |
Portfolio turnover rate | | | 127 | % | | | 148 | % | | | 147 | % | | | 175 | % | | | 221 | % | |
(a) Per share amounts were calculated using average shares outstanding for the year.
(b) The amount shown for a share outstanding throughout the period may not correlate with the Statement of Operations for the period due to timing of sales and redemptions of Fund shares in relation to income earned, allocation of class specific expenses and/or fluctuating market value of the investments of the Fund.
(c) Total return excludes sales charges, if any, and would be lower for the period presented if it reflected these charges.
(d) Total return is a measure of the change in the value of an investment in the Fund over the years covered, which assumes any dividends or capital gains distributions are reinvested in shares of the Fund. Returns shown do not reflect the deduction of taxes a shareholder would pay on Fund distributions or the redemption of Fund shares or the imposition of any sales load.
(e) Dividend expense totaled 0.05%, 0.01%, 0.01%, 0.07% and 0.29% of average net assets for the years ended May 31, 2023, 2022, 2021, 2020 and 2019, respectively. Interest rebate expense and line of credit interest expense totaled 0.02%, 0.08%, 0.08%, 0.05% and 0.01% of average net assets for the years ended May 31, 2023, 2022, 2021, 2020 and 2019, respectively.
(f) Effective August 6, 2018, the investment adviser reduced the advisory fee paid by the Fund and agreed to increase the expense reimbursements it provides to the Fund by contractually limiting the Fund's total expenses (other than certain expenses noted in the Notes to Financial Statements) to 1.23% for Class A shares. Prior to August 6, 2018, the expense limitation had been 1.50%.
(g) Excluding dividend and interest expenses, the Fund's net expenses after advisory fees waived and expenses reimbursed would have been 1.23%, 1.23%, 1.23%, 1.23% and 1.28% of average net assets for the years ended May 31, 2023, 2022, 2021, 2020 and 2019, respectively.
See Notes to Financial Statements.
www.arbitragefunds.com | 1-800-295-4485
66
The Arbitrage Funds Notes to Financial Statements
1. ORGANIZATION
The Arbitrage Funds (the "Trust") is a Delaware statutory trust, which was organized on December 22, 1999 and is registered under the Investment Company Act of 1940, as amended (the "1940 Act"), as an open-end management investment company issuing its shares in series. Each series represents a distinct portfolio with its own investment objective and policies. The three series presently authorized are the Arbitrage Fund (the "Arbitrage Fund"), the Water Island Event-Driven Fund (the "Event-Driven Fund") and the Water Island Credit Opportunities Fund (the "Credit Opportunities Fund"), each a "Fund" and collectively the "Funds." The Arbitrage Fund and the Credit Opportunities Fund are each a diversified series of the Trust. The Event-Driven Fund is a non-diversified series of the Trust. Water Island Capital, LLC acts as the Funds' investment adviser (the "Adviser"). The Adviser is responsible for overseeing the management and business affairs of the Funds, and has discretion to purchase and sell securities in accordance with the Funds' objectives, policies, and restrictions, subject to the authority of and supervision by the Trust's Board of Trustees (the "Board"). The Adviser continuously reviews, supervises, and administers the Funds' investment programs. The Funds, together with the series of AltShares Trust, an open-end management investment company also advised by the Adviser, are part of a family of investment companies referred to as the Water Island Capital-Advised Funds.
| | | Commencement of Operations | |
Fund | | Class R shares | | Class I shares | | Class C shares | | Class A shares | |
Arbitrage Fund | | September 18, 2000 | | October 17, 2003 | | June 1, 2012 | | June 1, 2013 | |
Event-Driven Fund | | October 1, 2010 | | October 1, 2010 | | N/A | | June 1, 2013 | |
Credit Opportunities
Fund | | October 1, 2012 | | October 1, 2012 | | N/A | | June 1, 2013 | |
The investment objective of the Arbitrage Fund is to seek to achieve capital growth by engaging in merger arbitrage. The investment objective of the Event-Driven Fund is to seek to achieve capital growth by investing in companies that are impacted by corporate events such as mergers, acquisitions, asset sales, restructurings, refinancings, recapitalizations, reorganizations, or other special situations. The investment objective of the Credit Opportunities Fund is to seek to provide current income and capital growth by investing primarily in debt securities impacted by catalysts and events such as mergers, acquisitions, debt maturities, refinancings, regulatory changes, recapitalizations, reorganizations, restructurings, and other special situations.
The Arbitrage Fund's four classes of shares, Class R, Class I, Class C and Class A, and the Event-Driven Fund's and Credit Opportunities Fund's three classes of shares, Class R, Class I and Class A, represent interests in the same portfolio of investments and have the same rights, but differ primarily in the expenses to which they are subject and the investment eligibility requirements. Class R shares, Class C shares and Class A shares are subject to an annual distribution and servicing fee of up to 0.25%, 1.00% and 0.25%, respectively, of each Fund's average daily net assets attributable to Class R shares, Class C shares and Class A shares, respectively, whereas Class I shares are not subject to any distribution and servicing fees. Class C shares are also subject to a 1.00% contingent deferred sales charge on all purchases redeemed within 12 months of purchase. Class A shares of the Arbitrage Fund are sold subject to a maximum front-end sales load equal to 2.75% of the offering price and are also subject to a 1.00% contingent deferred sales load on purchases at or above $250,000, purchased without a front-end sales charge and redeemed within 18 months of purchase. Class A shares of the Event-Driven Fund and the Credit Opportunities Fund are sold subject to a maximum front-end sales load equal to 3.25% of the offering price and are also subject to a 1.00% contingent deferred sales load on purchases
Annual Report | May 31, 2023
67
The Arbitrage Funds Notes to Financial Statements (continued)
at or above $250,000 purchased without a front-end sales charge and redeemed within 18 months of purchase.
2. SIGNIFICANT ACCOUNTING POLICIES
The following is a summary of significant accounting policies followed by the Funds. These policies are in conformity with U.S. generally accepted accounting principles ("GAAP"). The Funds are considered investment companies for financial reporting purposes under GAAP and Accounting Standards Codification Topic 946 — Financial Services — Investment Companies.
In March 2020, the FASB issued ASU 2020-04, Reference Rate Reform, which provides optional expedients and exceptions for applying GAAP to contracts, hedging relationships, and other transactions which are affected by reference rate reform if certain criteria are met. Such provisions are elective and apply to all entities as of March 12, 2020 through December 31, 2022, subject to meeting certain criteria, that have transactions that reference the London Interbank Offered Rate ("LIBOR") or another reference rate that are discontinued because of reference rate reform. LIBOR ceased to be published effective June 30, 2023. The adoption of the guidance did not have a material impact on the Funds' financial statements.
Use of Estimates — The preparation of financial statements in conformity with GAAP required management to make estimates and assumptions that affected the reported amounts of assets and liabilities at the date of the financial statements and the reported amounts of increases and decreases in net assets from operations during the reporting period. Actual results could differ from those estimates.
Valuation of Investments — The Funds' portfolio securities are valued as of the close of trading of the New York Stock Exchange ("NYSE") (normally 4:00 p.m., Eastern standard time). Common stocks, mutual funds and other securities, including open short positions that are traded on a securities exchange, are valued at the last quoted sales price at the close of regular trading on the day the valuation is made. Securities which are quoted by NASDAQ are valued at the NASDAQ Official Closing Price. Price information on listed stocks is taken from the exchange where the security is primarily traded. Redeemable securities issued by open-end investment companies are valued at the investment company's respective net asset value, with the exception of exchange-traded open-end investment companies, which are priced as common stocks. Market quotations of foreign securities from the principal markets in which they trade may not be reliable if events or circumstances that may affect the value of portfolio securities occur between the time of the market quotation and the close of trading on the NYSE. If a significant event that affects the valuation of a foreign security occurs between the close of a foreign security's primary exchange and the time the Funds calculate their net asset value ("NAV"), the Funds will fair value the foreign security to account for this discrepancy. Securities which are listed on an exchange but which are not traded on the valuation date will be valued at last bid if held long, and last ask if held short. Put and call options and securities traded in the over-the-counter market are valued at the mean of the most recent bid and ask prices. Foreign currency forward contracts are valued at the current day's interpolated foreign exchange rate, as calculated using the current day's spot rate, and the thirty, sixty, ninety and one-hundred eighty day forward rates provided by an independent source.
Debt securities are priced based upon an evaluated bid provided by independent, third-party pricing agents, if available. The third-party pricing agents may also value debt securities at an evaluated bid price by employing methodologies that utilize actual market transactions,
www.arbitragefunds.com | 1-800-295-4485
68
The Arbitrage Funds Notes to Financial Statements (continued)
broker-supplied valuations, or other methodologies designed to identify the market value for such securities. Unlisted securities for which market quotations are readily available are valued at the latest quoted bid price. Single name swap agreements are valued based on the underlying terms of the agreement. Other swap agreements (such as baskets of securities) are valued daily based on the terms of the swap agreement as provided by an independent third party or the counterparty. If a third-party valuation is not available, these other swap agreements are valued based on the valuation provided by the counterparty.
Other assets and securities for which no quotations are readily available are valued at fair value using methods determined in good faith by the Adviser, whom the Board designated as each Fund's valuation designee. Some of the more common reasons that may necessitate that a security be valued at fair value include: the security's trading has been halted or suspended; the security has been delisted from a national exchange; the security's primary trading market is temporarily closed at a time when under normal conditions it would be open; the security has been acquired through completion of a merger/tender or the security's primary pricing source is not able or willing to provide a price. Such methods of fair valuation may include, but are not limited to: multiple of earnings, multiple of book value, discount from market of a similar freely traded security, purchase price of a security, subsequent private transactions in the security or related securities, or a combination of these and other factors. Foreign securities are translated from the local currency into U.S. dollars using currency exchange rates supplied by a quotation service.
Fair Value Measurements — In accordance with the authoritative guidance on fair value measurements under GAAP, the Funds disclose fair value of their investments in a hierarchy that prioritizes the inputs to valuation techniques used to measure the fair value. The objective of a fair value measurement is to determine the price that would be received to sell an asset or paid to transfer a liability in an orderly transaction between market participants at the measurement date (an exit price). Accordingly, the fair value hierarchy gives the highest priority to quoted prices (unadjusted) in active markets for identical assets or liabilities (Level 1) and the lowest priority to unobservable inputs (Level 3). The guidance establishes three levels of the fair value hierarchy as follows:
Level 1 — Unadjusted quoted prices in active markets for identical, unrestricted assets or liabilities that the Funds have the ability to access at the measurement date;
Level 2 — Observable inputs other than quoted prices included in Level 1 that are observable (either directly or indirectly) for substantially the full term of the asset or liability; and
Level 3 — Unobservable inputs for the asset or liability, to the extent relevant observable inputs are not available, representing each Fund's own assumption about the assumptions a market participant would use in valuing the asset or liability, and would be based on the best information available.
Investments are classified within the level of the lowest significant input considered in determining fair value. Investments classified within Level 3, whose fair value measurement considers several inputs, may include Level 1 or Level 2 inputs as components of the overall fair value measurement. The inputs or methodology used for valuing securities are not necessarily an indication of the risk associated with investing in those securities.
Annual Report | May 31, 2023
69
The Arbitrage Funds Notes to Financial Statements (continued)
For the year ended May 31, 2023, there were no significant changes to the Funds' fair value methodologies. Transfers for Level 3 securities, if any, are shown as part of the leveling table in each Fund's Portfolio of Investments.
The availability of observable inputs can vary from security to security and is affected by a wide variety of factors, including, but not limited to, the type of security, whether the security is new and not yet established in the marketplace, the liquidity of markets, and other characteristics particular to the security. To the extent that valuation is based on models or inputs that are less observable or unobservable in the market, the determination of fair value requires more judgment. Accordingly, the degree of judgment exercised in determining fair value is generally greatest for instruments categorized in Level 3. Due to the inherent uncertainty of valuation, the determination of values may differ significantly from values that would have been realized had a ready market for investments existed, and the differences could be material.
Share Valuation — The net asset value per share of each class of shares of the Funds is calculated daily by dividing the total value of a Fund's assets attributable to that class, less liabilities attributable to that class, by the number of shares of that class outstanding.
Security Transactions — Security transactions are accounted for on trade date. Gains and losses on securities sold are determined on a specific identification basis.
Short Positions — The Funds may sell securities short for economic hedging purposes. Subsequent fluctuations in the market prices of securities sold short may require purchasing the securities at prices which may differ from the market value reflected on the Portfolio of Investments. The Funds are liable for any dividends and interest payable on securities while those securities are in a short position. As collateral for their short positions, the Funds maintain assets consisting of cash, cash equivalents or liquid securities. The amount of collateral is required to be adjusted daily to reflect changes in the value of the securities sold short. The Funds are charged an interest rebate expense by the prime broker on securities sold short. The interest rebate expense is charged for the duration of time that a security is sold short and is shown on the Statements of Operations.
Collateral — The Funds maintain a margin account with a broker that is used to hold proceeds received from short sales as well as daily mark-to-market adjustments. The balance is shown in the Statement of Assets and Liabilities as 'Deposits with brokers for securities sold short'. Further, short sales, swap, and forward contracts require the Funds to maintain additional collateral with the broker/counterparty and to pledge assets or cash which is held in a segregated triparty account. Securities pledged as collateral are designated in the Schedule of Investments and cash collateral as 'Segregated cash for collateral' in the Statement of Assets and Liabilities.
Derivative Instruments and Hedging Activities — The following discloses the Funds' use of derivative instruments and hedging activities.
The Funds' investment objectives not only permit the Funds to purchase investment securities, but they also allow the Funds to enter into various types of derivative contracts, including, but not limited to, swap contracts, forward foreign currency exchange contracts, and purchased and written option contracts. In doing so, the Funds will employ strategies in differing combinations to permit them to increase, decrease, or change the level or types of exposure to market factors. Central to those strategies are features inherent to derivatives that make them more attractive for this purpose than equity or debt securities: they require little or no initial cash investment; they can focus exposure on only certain selected risk factors; and they may not require the ultimate receipt or delivery of the underlying security (or securities) to satisfy the contract. This
www.arbitragefunds.com | 1-800-295-4485
70
The Arbitrage Funds Notes to Financial Statements (continued)
may allow the Funds to pursue their objectives more quickly and efficiently than if they were to make direct purchases or sales of securities capable of effecting a similar response to market factors. The Funds may, but are not required to, seek to reduce their currency risk by hedging part or all of their exposure to various foreign currencies.
Market Risk Factors: In pursuit of their investment objectives, the Funds may seek to use derivatives to increase or decrease their exposure to the following market risk factors:
Equity Risk: Equity risk relates to the change in value of equity securities as they relate to increases or decreases in the general market. Investments in securities issued by small and medium capitalization companies tend to be less liquid and more volatile than stocks of companies with relatively large market capitalizations. To the extent a Fund invests in securities of small and medium capitalization companies, it may be more vulnerable to adverse business events than larger, more established companies.
Interest Rate Risk: Interest rate risk refers to the fluctuations in value of fixed-income securities resulting from the inverse relationship between price and yield. For example, an increase in general interest rates will tend to reduce the market value of fixed-income investments, and a decline in general interest rates will tend to increase the value of such investments. In addition, debt securities with longer maturities, which tend to have higher yields, are subject to potentially greater fluctuations in value from changes in interest rates than obligations with shorter maturities.
Foreign Exchange Rate Risk: Foreign exchange rate risk relates to the change in the U.S. dollar value of a security held that is denominated in a foreign currency. The value of a foreign currency denominated security will decrease as the dollar appreciates against the currency, while the value of the foreign currency denominated security will increase as the dollar depreciates against the currency. Adverse changes in exchange rates may erode or reverse any gains produced by foreign currency denominated investments and may widen any losses.
Credit Risk: Credit risk relates to the ability of the issuer to meet interest and principal payments, or both, as they come due. In general, lower-grade, higher-yield bonds are subject to credit risk to a greater extent than lower-yield, higher-quality bonds.
LIBOR Rate Risk: Many debt securities, derivatives, and other financial instruments, including some of the Funds' investments, have historically utilized LIBOR as the reference or benchmark rate for variable interest rate calculations. LIBOR was discontinued as a floating rate benchmark after June 30, 2023. However, many market participants have amended financial instruments referencing LIBOR to a different reference or benchmark rate, such as the Secured Overnight Financing Rate (SOFR). The elimination of LIBOR and changes to other reference rates, such as SOFR, or any other changes or reforms to the determination or supervision of reference rates could have an adverse impact on the market for, or value of, any securities or payments linked to those reference rates, which may adversely affect a Fund's performance. The transition to other reference rates may lead to increased volatility and illiquidity in markets that have historically been tied to LIBOR, fluctuations in values of LIBOR-related investments or investments in issuers that utilized LIBOR, increased difficulty in borrowing or refinancing and diminished effectiveness of hedging strategies, adversely affecting a Fund's performance.
Annual Report | May 31, 2023
71
The Arbitrage Funds Notes to Financial Statements (continued)
Market Disruption Risks Related to Russia-Ukraine Conflict: Russia's invasion of Ukraine in late February 2022 has resulted in sanctions and market disruptions, including declines in regional and global stock markets, unusual volatility in global commodity markets and significant devaluations of Russian currency. The extent and duration of the military action are impossible to predict but could be significant. Market disruption caused by the Russia-Ukraine conflict, and any counter-measures or responses thereto (including international sanctions, a downgrade in the country's credit rating, purchasing and financing restrictions, boycotts, tariffs, changes in consumer or purchaser preferences, cyberattacks and espionage) could have severe adverse impacts on regional and/or global securities and commodities markets, including markets for oil and natural gas. These impacts may include reduced market liquidity, distress in credit markets, further disruption of global supply chains, increased risk of inflation, and limited access to investments in certain international markets and/or issuers. These developments and other related events could negatively impact Fund performance.
Risk of Investing in Derivatives: The Funds' use of derivatives can result in losses due to unanticipated changes in the market risk factors and the overall market. In instances where the Funds are using derivatives to decrease or hedge exposures to market risk factors for securities held by the Funds, there are also risks that those derivatives may not perform as expected, resulting in losses for the combined or hedged positions.
Derivatives may have little or no initial cash investment relative to their market value exposure and therefore can produce significant gains or losses in excess of their cost. This use of embedded leverage allows the Funds to increase their market value exposure relative to their net assets and can substantially increase the volatility of the Funds' performance.
Additional associated risks from investing in derivatives also exist and potentially could have significant effects on the valuation of the derivative instruments and the Funds. Typically, the associated risks are not the risks that the Funds are attempting to increase or decrease exposure to, per their investment objectives, but are the additional risks from investing in derivatives.
Examples of these associated risks are liquidity risk, which is the risk that the Funds will not be able to sell the derivative in the open market in a timely manner, and counterparty credit risk, which is the risk that the counterparty to a transaction will not fulfill its obligation to the Funds. Associated risks can be different for each type of derivative and are discussed by derivative type in the notes that follow.
Option Writing/Purchasing: The Funds may write or purchase option contracts to adjust risk and return of their overall investment positions. When a Fund writes or purchases an option, an amount equal to the premium received or paid by the Fund is recorded as a liability or an asset and is subsequently adjusted to the current market value of the option written or purchased. Premiums received or paid from writing or purchasing options that expire unexercised are treated by the Fund on the expiration date as realized gains or losses. The difference between the premium and the amount paid or received on effecting a closing purchase or sale transaction, including brokerage commissions, is also treated as a realized gain or loss. If an option is exercised, the premium paid or received is added to the cost of the purchase or proceeds from the sale in determining whether the Fund has realized a gain or loss on investment transactions. Risks from entering into option transactions arise from the potential inability of counterparties to meet the terms of the contracts, the potential inability to enter into closing transactions because of an illiquid secondary market and from unexpected movements in security values.
Options held by the Funds at May 31, 2023 are disclosed in the Portfolio of Investments.
www.arbitragefunds.com | 1-800-295-4485
72
The Arbitrage Funds Notes to Financial Statements (continued)
During the period ended May 31, 2023, the Funds engaged in option writing/purchasing to limit volatility and correlation and to create income and optionality. The maximum potential amount of future payments (undiscounted) that a fund as a writer of put options could be required to make is equal to the notional amount multiplied by the exercise price as shown in the Schedule of Investments.
Foreign Currency Exchange Contracts: The Funds may enter into forward foreign currency exchange contracts as a way of managing foreign exchange rate risk. The Funds may enter into these contracts for the purchase or sale of a specific foreign currency at a fixed price on a future date as a hedge or cross-hedge against either specific transactions or portfolio positions. The objective of the Funds' foreign currency hedging transactions is to reduce risk that the U.S. dollar value of the Funds' securities denominated in foreign currency will decline in value due to changes in foreign currency exchange rates.
Foreign currency exchange contracts held by the Funds at May 31, 2023 are disclosed in the Portfolio of Investments.
During the period ended May 31, 2023, the Funds entered into foreign currency exchange contracts to hedge currency risk.
Warrants/Rights: Each Fund may purchase or otherwise receive warrants or rights. Warrants and rights generally give the holder the right to receive, upon exercise, a security of the issuer at a set price. The Funds typically use warrants and rights in a manner similar to their use of purchased options on securities, as described in the Options Writing/Purchasing section above. Risks associated with the use of warrants and rights are generally similar to risks associated with the use of purchased options. However, warrants and rights often do not have standardized terms, and may have longer maturities and may be less liquid than exchange-traded options. In addition, the terms of warrants or rights may limit each Fund's ability to exercise the warrants or rights at such times and in such quantities as each Fund would otherwise wish. Warrants and rights generally pay no dividends and confer no voting or other rights other than to purchase the underlying security.
Warrants/rights held by the Funds at May 31, 2023 are disclosed in the Portfolio of Investments.
During the period ended May 31, 2023, the Funds held warrants/rights as a result of receiving them from completed deals, and to participate in investment opportunities.
Swaps: The Funds may enter into swap transactions, such as interest rate, index, equity, total return and credit default swap agreements, for hedging and non-hedging purposes. These transactions would be entered into in an attempt to obtain a particular return when it is considered desirable to do so, possibly at a lower cost to a Fund than if the Fund had invested directly in the asset that yielded the desired return. Swap agreements may be executed in a multilateral or other trade facility program, such as a registered exchange ("centrally cleared swaps") or may be privately negotiated in the over-the-counter market. The duration of a swap agreement typically ranges from a few weeks to more than one year. In a standard swap transaction, two parties agree to exchange the returns (or differentials in rates of return) earned or realized on particular predetermined investments or instruments, which may be adjusted for an interest factor. The gross returns to be exchanged or "swapped" between the parties are generally calculated with respect to a "notional amount" (i.e., the return on or increase in value of a particular dollar amount invested at a particular interest rate, a particular security, in a particular foreign currency, or in a "basket" of securities representing a particular index). In a centrally cleared swap, immediately following execution of the swap agreement, the swap
Annual Report | May 31, 2023
73
The Arbitrage Funds Notes to Financial Statements (continued)
agreement is novated to a central counterparty (the "CCP") and the Fund's counterparty on the swap agreement becomes the CCP.
Total return swap agreements are contracts in which one party agrees to make periodic payments based on the change in market value of underlying assets, which may include a specified security, basket of securities, defined portfolios of bonds, loans and mortgages, or securities indexes during the specified period in return for periodic payments based on a fixed or variable interest rate or the total return from other underlying assets or indices. Total return swap agreements may be used to obtain exposure to a security or market index without owning or taking physical custody of such security or component securities of a market index. Total return swap agreements may effectively add leverage to a Fund's portfolio because, in addition to its total net assets, the Fund would be subject to investment exposure on the notional amount of the swap. Total return swaps are a mechanism for the user to accept the economic benefits of asset ownership without utilizing the balance sheet. The other leg of the swap, usually an identified reference rate such as the SOFR or the federal funds rate, is spread to reflect the non-balance sheet nature of the product. Total return swaps can be designed with any underlying asset agreed upon between two parties. Typically no notional amounts are exchanged with total return swaps. Total return swap agreements entail the risk that a party will default on its payment obligations to a Fund thereunder. Swap agreements also entail the risk that a Fund will not be able to meet its obligation to the counterparty. Generally, a Fund will enter into total return swaps on a net basis (i.e., the two payment streams are netted out with the Fund receiving or paying, as the case may be, only the net amount of the two payments). The Funds will typically enter into agreements based on either long or short exposure to underlying equities. To help mitigate against default risk by the counterparties these agreements are reset monthly, with cashflows exchanged based on the change in the value of the underlying equity from either the opening price or the last reset price, netted against the interest leg of the swap.
Most swap agreements entered into by a Fund calculate the obligations of the parties to the agreement on a "net basis." Consequently, a Fund's current obligations (or rights) under a swap agreement will generally be equal only to the net present value of amounts to be paid or received under the agreement based on the relative values of the positions held by each party to the agreement (the "net amount"). A Fund's current obligations under a swap agreement will be accrued daily (offset against amounts owed to the Fund). Any net amount accrued but not yet paid to a Fund by the counterparty under a swap agreement (i.e., the Fund's current rights under the swap agreement) is recorded as unrealized appreciation until the amount is paid to the Fund. The Fund's maximum risk of loss from counterparty credit risk is generally limited to the net payment to be received by the Fund and/or the termination value at the end of the contract.
Whether a Fund's use of swap agreements will be successful in furthering its investment objective will depend on management's ability to correctly predict whether certain types of investments are likely to produce greater returns than other investments. Swap agreements that cannot be terminated or sold within seven days may be considered to be illiquid investments. Moreover, a Fund bears the risk of loss of the amount expected to be received under a swap agreement in the event of the default or bankruptcy of a swap agreement counterparty. Although centrally cleared swaps typically present less counterparty risk than non-centrally cleared swaps, a Fund that has entered into centrally cleared swaps is subject to the risk of the failure of the CCP. A Fund will enter into swap agreements only with counterparties that meet certain standards for creditworthiness (generally, such counterparties would have to be eligible counterparties under
www.arbitragefunds.com | 1-800-295-4485
74
The Arbitrage Funds Notes to Financial Statements (continued)
the terms of the Fund's repurchase agreement guidelines) or that are centrally cleared. Certain restrictions imposed on the Funds by the Internal Revenue Code of 1986, as amended (the "Code"), may limit a Fund's ability to use swap agreements. It is possible that developments in the swap market, including additional government regulation, could adversely affect a Fund's ability to terminate existing swap agreements or to realize amounts to be received under such agreements.
International Swaps and Derivatives Association, Inc. Master Agreements ("ISDA Master Agreements") govern over-the-counter financial derivative transactions entered into by a Fund and counterparty. The ISDA Master Agreements maintain provisions for general obligations, representations, agreements, collateral and events of default or termination. Events of termination include conditions that may entitle counterparties to elect to terminate early and cause settlement of all outstanding transactions under the applicable ISDA Master Agreement. Any election to terminate early could be material to the financial statements.
Swap agreements held by the Funds at May 31, 2023 are disclosed in the Portfolio of Investments.
During the period ended May 31, 2023, the Arbitrage Fund, Event-Driven Fund and Credit Opportunities Fund entered into swap agreements to gain efficient exposure to underlying equities.
Fair Value of Derivative Instruments — Fair values of derivatives presented in the financial statements are not netted with the fair value of other derivatives or with any collateral amounts posted by the Funds or any counterparty on the Statement of Assets and Liabilities. The fair value of derivative instruments for the Funds as of May 31, 2023, was as follows:
Derivatives Not
Accounted For As
Hedging Instruments | | Asset
Derivatives
Statement of
Assets and
Liabilities
Location | | Fair Value | | Liability
Derivatives
Statement of
Assets and
Liabilities
Location | | Fair Value | |
Arbitrage Fund | |
Forward Foreign
Currency
Exchange
Contracts
| | Unrealized
appreciation on
forward foreign
currency
exchange
contracts | | $ | 1,978,506 | | | Unrealized
depreciation on
forward foreign
currency
exchange
contracts | | $ | 1,877,341 | | |
Equity Contracts
(swap contracts)
| | Unrealized
appreciation on
swap contracts | | | 28,068 | | | Unrealized
depreciation on
swap contracts | | | 13,928,051 | | |
Equity Contracts
(purchased
option contracts)
| | Investments:
at fair value of
unaffiliated
investments | | | 1,722,562 | | | | | | — | | |
| | | | | $ | 3,729,136 | | | | | $ | 15,805,392 | | |
Annual Report | May 31, 2023
75
The Arbitrage Funds Notes to Financial Statements (continued)
Derivatives Not
Accounted For As
Hedging Instruments | | Asset
Derivatives
Statement of
Assets and
Liabilities
Location | | Fair Value | | Liability
Derivatives
Statement of
Assets and
Liabilities
Location | | Fair Value | |
Event-Driven Fund | |
Forward Foreign
Currency Exchange
Contracts
| | Unrealized
appreciation on
forward foreign
currency exchange
contracts | | $ | 157,590 | | | Unrealized
depreciation on
forward foreign
currency exchange
contracts | | $ | 187,168 | | |
Equity Contracts
(swap contracts)
| | Unrealized
appreciation on
swap contracts | | | 3,387 | | | Unrealized
depreciation on
swap contracts | | | 1,166,616 | | |
Equity Contracts
(purchased
option contracts)
| | Investments:
at fair value of
unaffiliated
investments | | | 169,740 | | | | | | — | | |
Equity Contracts
(written option
contracts) | | | | | — | | | Written options,
at value | | | 2,563 | | |
| | | | | $ | 330,717 | | | | | $ | 1,356,347 | | |
Derivatives Not
Accounted For As
Hedging Instruments | | Asset
Derivatives
Statement of
Assets and
Liabilities
Location | | Fair Value | | Liability
Derivatives
Statement of
Assets and
Liabilities
Location | | Fair Value | |
Credit Opportunities Fund | |
Forward Foreign
Currency Exchange
Contracts
| | Unrealized
appreciation on
forward foreign
currency exchange
contracts | | $ | 900 | | | Unrealized
depreciation on
forward foreign
currency exchange
contracts | | $ | 2,753 | | |
Equity Contracts
(swap contracts) | | Unrealized
appreciation on
swap contracts | | | — | | | Unrealized
depreciation on
swap contracts | | | 22,831 | | |
Equity Contracts
(purchased
option contracts) | | Investments:
at fair value of
unaffiliated
investments | | | 117,613 | | | | | | — | | |
| | | $ | 118,513 | | | | | $ | 25,584 | | |
www.arbitragefunds.com | 1-800-295-4485
76
The Arbitrage Funds Notes to Financial Statements (continued)
The effect of derivative instruments on the Funds' Statement of Operations for the year ended May 31, 2023, was as follows:
Derivatives Not
Accounted For As
Hedging Instruments | | Location Of Gains/(Loss) On
Derivatives Recognized In Income | | Realized
Gain/(Loss)
On Derivatives
Recognized In
Income | | Change in
Unrealized
Gain/(Loss)
On Derivatives
Recognized In
Income | |
Arbitrage Fund | |
Forward Foreign
Currency Exchange
Contracts
| | Net realized gains (losses) from:
Forward currency contracts / Net
change in unrealized appreciation
(depreciation) on: Forward currency
contracts | | $ | 9,455,080 | | | $ | (3,276,363 | ) | |
Swap Contracts
| | Net realized gains (losses) from:
Swap contracts / Net change in
unrealized appreciation
(depreciation) on: Swap contracts | | | 5,016,744 | | | | (13,900,131 | ) | |
Equity Contracts
(purchased option
contracts)
| | Net realized gains (losses) from:
Purchased option contracts / Net
change in unrealized appreciation
(depreciation) on: Purchased option
contracts | | | (3,753,338 | ) | | | (512,810 | ) | |
Equity Contracts
(written option
contracts)
| | Net realized gains (losses) from:
Written option contracts / Net
change in unrealized appreciation
(depreciation) on: Written option
contracts | | | (794,457 | ) | | | (10,186 | ) | |
| | | | | $ | 9,924,029 | | | $ | (17,699,490 | ) | |
Annual Report | May 31, 2023
77
The Arbitrage Funds Notes to Financial Statements (continued)
Derivatives Not
Accounted For As
Hedging Instruments | | Location Of Gains/(Loss) On
Derivatives Recognized In Income | | Realized
Gain/(Loss)
On Derivatives
Recognized In
Income | | Change in
Unrealized
Gain/(Loss)
On Derivatives
Recognized In
Income | |
Event-Driven Fund | |
Forward Foreign
Currency Exchange
Contracts
| | Net realized gains (losses) from:
Forward currency contracts / Net
change in unrealized appreciation
(depreciation) on: Forward currency
contracts | | $ | 379,573 | | | $ | (177,226 | ) | |
Swap Contracts
| | Net realized gains (losses) from:
Swap contracts / Net change in
unrealized appreciation
(depreciation) on: Swap contracts | | | 399,115 | | | | (1,163,229 | ) | |
Equity Contracts
(purchased option
contracts)
| | Net realized gains (losses) from:
Purchased option contracts / Net
change in unrealized appreciation
(depreciation) on: Purchased option
contracts | | | (340,066 | ) | | | (96,014 | ) | |
Equity Contracts
(written option
contracts)
| | Net realized gains (losses) from:
Written option contracts / Net
change in unrealized appreciation
(depreciation) on: Written option
contracts | | | (59,394 | ) | | | 5,284 | | |
| | | | | $ | 379,228 | | | $ | (1,431,185 | ) | |
www.arbitragefunds.com | 1-800-295-4485
78
The Arbitrage Funds Notes to Financial Statements (continued)
Derivatives Not
Accounted For As
Hedging Instruments | | Location Of Gains/(Loss) On
Derivatives Recognized In Income | | Realized
Gain/(Loss)
On Derivatives
Recognized In
Income | | Change in
Unrealized
Gain/(Loss)
On Derivatives
Recognized In
Income | |
Credit Opportunities Fund | |
Forward Foreign
Currency Exchange
Contracts
| | Net realized gains (losses) from:
Forward currency contracts / Net
change in unrealized appreciation
(depreciation) on: Forward currency
contracts | | $ | (1,255 | ) | | $ | 220 | | |
Swap Contracts
| | Net realized gains (losses) from:
Swap contracts / Net change in
unrealized appreciation
(depreciation) on: Swap contracts | | | 182,088 | | | | (22,831 | ) | |
Equity Contracts
(purchased option
contracts)
| | Net realized gains (losses) from:
Purchased option contracts / Net
change in unrealized appreciation
(depreciation) on: Purchased option
contracts | | | (61,807 | ) | | | (87,699 | ) | |
Equity Contracts
(written option
contracts)
| | Net realized gains (losses) from:
Written option contracts / Net
change in unrealized appreciation
(depreciation) on: Written option
contracts | | | 87,999 | | | | 240 | | |
| | | | | $ | 207,025 | | | $ | (110,070 | ) | |
Volume of derivative instruments held by the Funds during the year ended May 31, 2023, was as follows:
Derivative Type | | Unit of Measurement | | Monthly Average | |
Arbitrage Fund | |
Swap Contracts | | Notional Quantity | | $ | 28,001,493 | | |
Forward Foreign Currency Exchange
Contracts | | Net Contracts to Deliver/(Receive) | | | (141,922,944 | ) | |
Purchased Option Contracts | | Contracts | | | 15,238 | | |
Written Option Contracts | | Contracts | | | (1,189 | ) | |
Derivative Type | | Unit of Measurement | | Monthly Average | |
Event-Driven Fund | |
Swap Contracts | | Notional Quantity | | $ | 2,130,995 | | |
Forward Foreign Currency Exchange
Contracts | | Net Contracts to Deliver/(Receive) | | | (10,220,542 | ) | |
Purchased Option Contracts | | Contracts | | | 1,335 | | |
Written Option Contracts | | Contracts | | | (167 | ) | |
Annual Report | May 31, 2023
79
The Arbitrage Funds Notes to Financial Statements (continued)
Derivative Type | | Unit of Measurement | | Monthly Average | |
Credit Opportunities Fund | |
Swap Contracts | | Notional Quantity | | $ | 6,564,298 | | |
Forward Foreign Currency Exchange
Contracts | | Net Contracts to Deliver/(Receive) | | | (185,750 | ) | |
Purchased Option Contracts | | Contracts | | | 3,122 | | |
Written Option Contracts | | Contracts | | | (160 | ) | |
Certain derivative contracts are executed under either standardized netting agreements or, for exchange-traded derivatives, the relevant contracts for a particular exchange which contain enforceable netting provisions. A derivative netting arrangement creates an enforceable right of set-off that becomes effective, and affects the realization of settlement on individual assets, liabilities and collateral amounts, only following a specified event of default or early termination. Default events may include the failure to make payments or deliver securities timely, material adverse changes in financial condition or insolvency, the breach of minimum regulatory capital requirements, or loss of license, charter or other legal authorization necessary to perform under the contract.
The Funds held financial instruments such as equity swaps that are subject to enforceable netting arrangements or other similar agreements as of May 31, 2023. All other derivative contracts held by the Funds were not subject to netting agreements.
The following tables present financial instruments held by the Funds that are subject to enforceable netting arrangements or other similar agreements as of May 31, 2023:
Arbitrage Fund
| | | Gross | | Gross
Amounts
Offset in | | Net Amounts
Presented in | | Gross Amounts Not Offset in the
Statement of Assets and Liabilities | |
Description | | Amounts of
Recognized
Assets | | the Statements
of Assets and
Liabilities | | the Statement
of Assets and
Liabilities | | Financial
Instruments | | Cash
Collateral
Received | | Net
Amount | |
Equity Swaps | | $ | 28,068 | | | $ | (28,068 | ) | | $ | — | | | $ | — | | | $ | — | | | $ | — | | |
Total | | $ | 28,068 | | | $ | (28,068 | ) | | $ | — | | | $ | — | | | $ | — | | | $ | — | | |
| | | Gross | | Gross
Amounts
Offset in | | Net Amounts
Presented in | | Gross Amounts Not Offset in the
Statement of Assets and Liabilities | |
Description | | Amounts of
Recognized
Liabilities | | the Statements
of Assets and
Liabilities | | the Statement
of Assets and
Liabilities | | Financial
Instruments | | Cash
Collateral
Pledged | | Net
Amount | |
Equity Swaps | | $ | 13,928,051 | | | $ | (28,068 | ) | | $ | 13,899,983 | | | $ | (13,899,983 | ) | | $ | — | | | $ | — | | |
Total | | $ | 13,928,051 | | | $ | (28,068 | ) | | $ | 13,899,983 | | | $ | (13,899,983 | ) | | $ | — | | | $ | — | | |
www.arbitragefunds.com | 1-800-295-4485
80
The Arbitrage Funds Notes to Financial Statements (continued)
Event-Driven Fund
| | | Gross | | Gross
Amounts
Offset in | | Net Amounts
Presented in | | Gross Amounts Not Offset in the
Statement of Assets and Liabilities | |
Description | | Amounts of
Recognized
Assets | | the Statements
of Assets and
Liabilities | | the Statement
of Assets and
Liabilities | | Financial
Instruments | | Cash
Collateral
Received | | Net
Amount | |
Equity Swaps | | $ | 3,387 | | | $ | (3,387 | ) | | $ | — | | | $ | — | | | $ | — | | | $ | — | | |
Total | | $ | 3,387 | | | $ | (3,387 | ) | | $ | — | | | $ | — | | | $ | — | | | $ | — | | |
| | | Gross | | Gross
Amounts
Offset in | | Net Amounts
Presented in | | Gross Amounts Not Offset in the
Statement of Assets and Liabilities | |
Description | | Amounts of
Recognized
Liabilities | | the Statements
of Assets and
Liabilities | | the Statement
of Assets and
Liabilities | | Financial
Instruments | | Cash
Collateral
Pledged | | Net
Amount | |
Equity Swaps | | $ | 1,166,616 | | | $ | (3,387 | ) | | $ | 1,163,229 | | | $ | (1,163,229 | ) | | $ | — | | | $ | — | | |
Total | | $ | 1,166,616 | | | $ | (3,387 | ) | | $ | 1,163,229 | | | $ | (1,163,229 | ) | | $ | — | | | $ | — | | |
Credit Opportunities Fund
| | | Gross | | Gross
Amounts
Offset in | | Net Amounts
Presented in | | Gross Amounts Not Offset in the
Statement of Assets and Liabilities | |
Description | | Amounts of
Recognized
Liabilities | | the Statements
of Assets and
Liabilities | | the Statement
of Assets and
Liabilities | | Financial
Instruments | | Cash
Collateral
Pledged | | Net
Amount | |
Equity Swaps | | $ | 22,831 | | | $ | — | | | $ | 22,831 | | | $ | — | | | $ | (22,831 | ) | | $ | — | | |
Total | | $ | 22,831 | | | $ | — | | | $ | 22,831 | | | $ | — | | | $ | (22,831 | ) | | $ | — | | |
Investment Income — Interest income, adjusted for amortization of premium and accretion of discount, is recorded on the accrual basis. Dividend income is recorded on the ex-dividend date, net of any non-reclaimable tax withholdings. Payment-in-kind securities have the option at each interest payment date of making interest payments in cash or additional debt securities. Any interest accrued on payment-in-kind securities is recorded as interest income on an accrual basis. Distributions from real estate investment trusts ("REITs") may be characterized as ordinary income, net capital gain, or a return of capital to the Funds. The proper characterization of REIT distributions is generally not known until after the end of each calendar year. As such, estimates are used in reporting the character of income and distributions for financial statement purposes when information is not available.
Dividends and Distributions to Shareholders — Dividends arising from net investment income and net capital gain distributions, if any, are declared and paid at least annually to shareholders of the Arbitrage Fund and Event-Driven Fund. Dividends arising from net investment income, if any, are declared daily and paid monthly, and net capital gain distributions, if any, are declared and paid at least annually to shareholders of the Credit Opportunities Fund.
Cash — The Funds may invest a portion of their assets in cash or cash items. These cash items and other high-quality debt securities may include money market instruments, such as securities issued by the U.S. Government and its agencies, bankers' acceptances, commercial paper, bank certificates of deposit and investment companies that invest primarily in such instruments. As of May 31, 2023, cash held by the Funds represented cash held at a third-party custodian.
Annual Report | May 31, 2023
81
The Arbitrage Funds Notes to Financial Statements (continued)
Allocation Between Classes — Investment income earned, realized capital gains and losses, and unrealized appreciation and depreciation are allocated daily to each class of shares based upon the proportionate shares of total net assets of each Fund. Class-specific expenses are charged directly to the class incurring the expense. Common expenses which are not attributable to a specific class are allocated daily to each class of shares based upon the proportionate share of total net assets of each Fund.
Federal Income Tax — It is the Funds' policy to continue to comply with the special provisions of Subchapter M of the Code, as amended, applicable to regulated investment companies. As provided therein, in any fiscal year in which a fund so qualifies and distributes at least 90% of its taxable net income, a fund (but not the shareholders) will be relieved of Federal income tax on the income distributed. Accordingly, no provision for income taxes has been made.
As of and during the year ended May 31, 2023, the Funds did not have a liability for any unrecognized tax benefits. The Funds recognize interest and, if applicable, penalties for any uncertain tax positions. Interest and penalty expense will be recorded as a component of interest or other tax expense. No interest or penalties were recorded during the year ended May 31, 2023. The Funds file U.S. federal, state, and local tax returns as required. The Funds' tax returns are subject to examination by the relevant tax authorities until expiration of the applicable statute of limitations which is generally three years after the filing of the tax return. Tax returns for open years have incorporated no uncertain tax positions that require a provision for income taxes.
3. INVESTMENT TRANSACTIONS
During the year ended May 31, 2023, cost of purchases and proceeds from sales and maturities of investment securities, excluding short-term investments, U.S. government securities, equity swap contracts, purchased and written option contracts and securities sold short, were as follows:
| | | Arbitrage Fund | | Event-Driven Fund | | Credit Opportunities Fund | |
Purchases | | $ | 2,360,255,138 | | | $ | 232,076,567 | | | $ | 138,074,127 | | |
Sales and Maturities | | | 2,453,920,554 | | | | 214,826,043 | | | | 163,188,309 | | |
4. LINE OF CREDIT
The Trust, on behalf of the Funds, entered into an agreement which enables the Funds to participate in a $100,000,000 unsecured uncommitted revolving line of credit (the "Uncommitted Line") with State Street Bank and Trust Company (the "Custodian"). Borrowings under the Uncommitted Line are made solely to temporarily finance the purchase or sale of securities or to finance the redemption of the shares of an investor of the Funds. The Uncommitted Line has an upfront fee of $30,000, is held available on a discretionary demand basis and may be terminated by the Custodian or the Trust at any time for any or no reason. Such fees are included in the custodian bank and service fees on the Statements of Operations. Interest on the Uncommitted Line is charged to the Funds based on their borrowing at a rate equal to the higher of (a) the federal funds rate plus 1.35% and (b) the overnight bank funding rate plus 1.35%. For purposes of calculating the effective interest rate, if the federal funds rate or the overnight bank funding rate shall be less than zero, then such rate shall be deemed to be zero.
For the year ended May 31, 2023, the Event-Driven Fund and the Credit Opportunities Fund had average borrowings of $1,982,143 and $4,455,556, respectively, over a period of 28 days and 45 days, respectively, at a weighted average interest rate of 3.49% and 3.88%, respectively. Interest expense on the line of credit for the Event-Driven Fund and the Credit Opportunities
www.arbitragefunds.com | 1-800-295-4485
82
The Arbitrage Funds Notes to Financial Statements (continued)
Fund during the year ended May 31, 2023 is shown as line of credit interest expense on the Statements of Operations. The Funds had no outstanding borrowings at May 31, 2023.
5. ADVISORY FEES, ADMINISTRATION FEES AND OTHER AGREEMENTS
Investment Advisory Agreement
The Funds' investments are managed by the Adviser according to the terms of Investment Advisory Agreements. Under each of the Investment Advisory Agreements, fees are computed and accrued daily and paid monthly. Under the Investment Advisory Agreement between the Adviser and the Arbitrage Fund, as amended and restated on October 1, 2007, the Arbitrage Fund pays the Adviser an annual fee, of 1.25% on the first $250 million, 1.20% on the next $50 million, 1.15% on the next $50 million, 1.10% on the next $75 million, 1.05% on the next $75 million, and 1.00% on its average daily net assets in excess of $500 million. Effective November 1, 2019, the Event-Driven Fund pays the Adviser an annual fee of 1.10% based on the Event-Driven Fund's average daily net assets. Effective August 6, 2018, the Credit Opportunities Fund pays the Adviser an annual fee of 0.95% on the first $250 million, 0.90% on the next $500 million, and 0.85% on its average daily net assets in excess of $750 million.
Under an Amended and Restated Expense Waiver and Reimbursement Agreement for each of Arbitrage Fund, Event-Driven Fund and Credit Opportunities Fund, the Adviser has contractually agreed to waive its advisory fee and/or reimburse the Funds' other expenses to the extent that total operating expenses (exclusive of taxes, interest, dividends on short positions, brokerage commissions, acquired fund fees and expenses and other costs incurred in connection with the purchase or sale of portfolio securities) exceed the annual rate of the Funds' average daily net assets attributable to each share class as shown in the table below. The agreement remains in effect until September 30, 2023, unless terminated earlier by the Board.
| | | Arbitrage Fund | | Event-Driven Fund | | Credit Opportunities Fund | |
Class R | | | 1.69 | % | | | 1.69 | % | | | 1.23 | % | |
Class I | | | 1.44 | % | | | 1.44 | % | | | 0.98 | % | |
Class C | | | 2.44 | % | | | N/A | | | | N/A | | |
Class A | | | 1.69 | % | | | 1.69 | % | | | 1.23 | % | |
The Adviser agreed not to charge the Arbitrage Fund an advisory fee on the portion of its assets invested in the Event-Driven Fund. This resulted in $908,568 of advisory fees being waived during the year ended May 31, 2023.
For the year ended May 31, 2023, the aggregate net fee paid to the Adviser as a percentage of average net assets for the Arbitrage Fund, Event-Driven Fund and Credit Opportunities Fund was 1.00%, 1.13% and 0.63%, respectively.
The Adviser can recapture, with the exception of the advisory fees waived related to Arbitrage Fund's investment in the Event-Driven Fund, any waived amount from a Fund pursuant to the Amended and Restated Expense Waiver and Reimbursement Agreements if such recapture does not cause the Fund to exceed the expense limitations in effect at the time the amounts were waived, the recapture does not cause the Fund to exceed the current expense limitation, and the recapture is done within three years after the date on which the expense was waived. During the year ended May 31, 2023, the Adviser recaptured the following fees or expenses from the Event-Driven Fund. There were no amounts recaptured during the year ended May 31, 2023 for Arbitrage Fund and Credit Opportunities Fund.
Annual Report | May 31, 2023
83
The Arbitrage Funds Notes to Financial Statements (continued)
Event-Driven Fund | | Recaptured Amount | |
Class R | | $ | 1,128 | | |
Class I | | | 28,129 | | |
Class A | | | 575 | | |
As of May 31, 2023, the balances of waived expenses that are eligible for potential recapture for each Fund are as follows:
| | | Expiring
May 31, 2024 | | Expiring
May 31, 2025 | | Expiring
May 31, 2026 | | Total | |
Event-Driven Fund | |
Class R | | $ | 7,526 | | | $ | — | | | $ | — | | | $ | 7,526 | | |
Class I | | | 94,924 | | | | — | | | | — | | | | 94,924 | | |
Class A | | | 706 | | | | — | | | | — | | | | 706 | | |
Credit Opportunities Fund | |
Class R | | $ | 14,935 | | | $ | 27,491 | | | $ | 27,239 | | | $ | 69,665 | | |
Class I | | | 327,225 | | | | 360,709 | | | | 360,425 | | | | 1,048,359 | | |
Class A | | | 386 | | | | 309 | | | | 241 | | | | 936 | | |
Administration Agreement
State Street Bank and Trust Company serves as the Trust's administrator pursuant to an Administration Agreement with the Trust.
Distribution Agreement
ALPS Distributors, Inc. (the "Distributor") serves as the Funds' distributor. The Distributor acts as an agent for the Funds and the distributor of their shares. The Funds have adopted, with respect to their Class R, Class C shares and Class A shares, as applicable, a plan of distribution pursuant to Rule 12b-1 under the 1940 Act which permits each Fund to pay for expenses incurred in the distribution and promotion of the Funds' Class R shares, Class C shares and Class A shares and for services provided to shareholders. The Plan is a "reimbursement" plan. This means that a Fund's Class R shares, Class C shares and Class A shares only pay the 12b-1 fee to the extent that the Adviser, the Distributor or others have incurred expenses in the promotion and distribution of the shares, including but not limited to, the printing of prospectuses and reports used for sales purposes, expenses of preparation of sales literature and related expenses, advertisements, and other distribution-related expenses, as well as any distribution fees paid to securities dealers or others. Under the distribution plan, a Fund may pay compensation to any broker-dealer with whom the Distributor or the Funds has entered into a contract to distribute Class R shares, Class C shares or Class A shares, or to any other qualified financial services firm, for distribution and/or shareholder-related services with respect to shares held or purchased by their respective customers or in connection with the purchase of shares attributable to their efforts. The amount of payments under the Plan in any year shall not exceed 0.25% for Class R shares, 0.75% for Class C shares and 0.25% for Class A shares, respectively, of the average daily net assets allocable to a Fund's Class R shares, Class C shares and Class A shares, respectively. In addition, the Plan permits each Fund to make payments at an annual rate of up to 0.25% of the Fund's Class C shares for expenses incurred in connection with the provision of shareholder support or administrative services for the Fund's Class C shares.
During the year ended May 31, 2023, the Arbitrage Fund's Class R shares and Class A shares incurred $149,118 and $94,053 in distribution expenses, respectively, and Class C shares incurred
www.arbitragefunds.com | 1-800-295-4485
84
The Arbitrage Funds Notes to Financial Statements (continued)
$107,868 in distribution and shareholder support expenses, all of which were used to compensate broker-dealers. During the year ended May 31, 2023, the Event-Driven Fund's Class R shares and Class A shares incurred $10,868 and $5,529 in distribution expenses, respectively, all of which were used to compensate broker-dealers. During the year ended May 31, 2023, the Credit Opportunities Fund's Class R shares and Class A shares incurred $21,578 and $191 in distribution expenses, respectively, all of which were used to compensate broker-dealers.
Chief Compliance Officer
The Chief Compliance Officer ("CCO") of the Trust also serves as the CCO of the Adviser. The Trust pays a portion of the CCO's compensation as approved by the Board of Trustees. Information related to the CCO Fees can be found in the Funds' Statements of Operations.
Chief Financial Officer
Foreside Management Services, LLC provides Chief Financial Officer ("CFO") services to the Trust. Foreside Management Services, LLC is compensated by the Trust under a Fund CFO/Treasurer Agreement.
Transfer Agent and Shareholder Services Agreement
SS&C Global Investor and Distribution Solutions, Inc. ("SS&C GIDS," formerly known as DST Systems, Inc.) is the Funds' transfer agent, and per an agency agreement, maintains the records of each shareholder's account, answers shareholders' inquiries concerning their accounts, processes purchases and redemptions of the Funds shares, acts as dividend and distribution disbursing agent and performs other shareholder service functions.
6. RELATED PARTIES
The Adviser is a related party of the Funds and certain officers of the Trust are also officers of the Adviser. Fees payable to related parties are disclosed in Note 5 and accrued amounts are disclosed in the Statements of Operations.
7. AFFILIATED ISSUER TRANSACTIONS
A summary of affiliated transactions for the Arbitrage Fund for the year ended May 31, 2023 follows:
Affiliated
Issuer | | Beginning
Value
as of
May 31,
2022 | | Purchases
at
Cost | | Proceeds
from
Sales | | Net
Realized
Gain/
(Loss)
on
Sales | | Change
in
Unrealized
Appreciation/
Depreciation | | Ending
Value
as of
May 31,
2023 | | Shares
as of
May 31,
2023 | | Dividend
Income | | Capital
Gain
Distributions | |
Water Island
Event-Driven
Fund | | $ | 72,394,803 | | | $ | — | | | $ | — | | | $ | — | | | $ | (660,536 | ) | | $ | 71,734,267 | | | | 6,605,365 | | | $ | — | | | $ | — | | |
At May 31, 2023, Arbitrage Fund, an affiliated fund, owned 62.61% of Event-Driven Fund's shares.
Annual Report | May 31, 2023
85
The Arbitrage Funds Notes to Financial Statements (continued)
8. CAPITAL SHARE TRANSACTIONS
Proceeds and payments on capital shares as shown in the Statement of Changes in Net Assets are the result of the following capital share transactions for the periods shown:
| | | Year Ended
May 31, 2023 | | Year Ended
May 31, 2022 | |
Arbitrage Fund - Class R | | Shares | | Value | | Shares | | Value | |
Proceeds from shares sold | | | 875,065 | | | $ | 10,878,888 | | | | 1,682,625 | | | $ | 21,585,919 | | |
Shares issued in reinvestment of
distributions | | | 164,500 | | | | 2,001,965 | | | | 39,313 | | | | 499,276 | | |
Payments for shares redeemed | | | (3,550,659 | ) | | | (44,018,561 | ) | | | (2,985,174 | ) | | | (37,993,767 | ) | |
Net decrease | | | (2,511,094 | ) | | $ | (31,137,708 | ) | | | (1,263,236 | ) | | $ | (15,908,572 | ) | |
Arbitrage Fund - Class I | |
Proceeds from shares sold | | | 21,230,187 | | | $ | 273,656,279 | | | | 33,994,762 | | | $ | 451,556,693 | | |
Shares issued in reinvestment of
distributions | | | 3,154,548 | | | | 39,905,031 | | | | 462,945 | | | | 6,110,874 | | |
Payments for shares redeemed | | | (50,906,547 | ) | | | (654,658,365 | ) | | | (29,221,299 | ) | | | (386,744,281 | ) | |
Net increase/(decrease) | | | (26,521,812 | ) | | $ | (341,097,055 | ) | | | 5,236,408 | | | $ | 70,923,286 | | |
Arbitrage Fund - Class C | |
Proceeds from shares sold | | | 13,835 | | | $ | 158,817 | | | | 224,527 | | | $ | 2,685,087 | | |
Shares issued in reinvestment of
distributions | | | 21,082 | | | | 238,233 | | | | 6,547 | | | | 77,389 | | |
Payments for shares redeemed | | | (434,130 | ) | | | (5,001,828 | ) | | | (546,088 | ) | | | (6,468,684 | ) | |
Net decrease | | | (399,213 | ) | | $ | (4,604,778 | ) | | | (315,014 | ) | | $ | (3,706,208 | ) | |
Arbitrage Fund - Class A | |
Proceeds from shares sold | | | 588,071 | | | $ | 7,250,346 | | | | 1,416,227 | | | $ | 18,133,435 | | |
Shares issued in reinvestment of
distributions | | | 74,975 | | | | 909,449 | | | | 9,966 | | | | 126,265 | | |
Payments for shares redeemed | | | (1,706,721 | ) | | | (21,022,258 | ) | | | (561,906 | ) | | | (7,150,839 | ) | |
Net increase/(decrease) | | | (1,043,675 | ) | | $ | (12,862,463 | ) | | | 864,287 | | | $ | 11,108,861 | | |
Event-Driven Fund - Class R | |
Proceeds from shares sold | | | 25,875 | | | $ | 281,636 | | | | 72,562 | | | $ | 802,465 | | |
Payments for shares redeemed | | | (69,180 | ) | | | (753,009 | ) | | | (546,503 | ) | | | (5,986,060 | ) | |
Net decrease | | | (43,305 | ) | | $ | (471,373 | ) | | | (473,941 | ) | | $ | (5,183,595 | ) | |
Event-Driven Fund - Class I | |
Proceeds from shares sold | | | 1,846,566 | | | $ | 20,365,124 | | | | 1,162,749 | | | $ | 13,034,737 | | |
Payments for shares redeemed | | | (1,614,916 | ) | | | (17,754,925 | ) | | | (2,297,771 | ) | | | (25,475,126 | ) | |
Net increase/(decrease) | | | 231,650 | | | $ | 2,610,199 | | | | (1,135,022 | ) | | $ | (12,440,389 | ) | |
Event-Driven Fund - Class A | |
Proceeds from shares sold | | | 110,667 | | | $ | 1,210,619 | | | | 264,682 | | | $ | 2,879,635 | | |
Payments for shares redeemed | | | (148,105 | ) | | | (1,610,583 | ) | | | (173,800 | ) | | | (1,867,351 | ) | |
Net increase/(decrease) | | | (37,438 | ) | | $ | (399,964 | ) | | | 90,882 | | | $ | 1,012,284 | | |
www.arbitragefunds.com | 1-800-295-4485
86
The Arbitrage Funds Notes to Financial Statements (continued)
| | | Year Ended
May 31, 2023 | | Year Ended
May 31, 2022 | |
Credit Opportunities Fund - Class R | | Shares | | Value | | Shares | | Value | |
Proceeds from shares sold | | | 135,130 | | | $ | 1,297,962 | | | | 389,395 | | | $ | 3,924,678 | | |
Shares issued in reinvestment of
distributions | | | 36,521 | | | | 350,831 | | | | 23,145 | | | | 232,547 | | |
Payments for shares redeemed | | | (402,198 | ) | | | (3,872,353 | ) | | | (223,471 | ) | | | (2,237,808 | ) | |
Net increase/(decrease) | | | (230,547 | ) | | $ | (2,223,560 | ) | | | 189,069 | | | $ | 1,919,417 | | |
Credit Opportunities Fund - Class I | |
Proceeds from shares sold | | | 1,762,330 | | | $ | 16,850,541 | | | | 5,052,483 | | | $ | 50,828,009 | | |
Shares issued in reinvestment of
distributions | | | 319,282 | | | | 3,052,297 | | | | 288,204 | | | | 2,885,616 | | |
Payments for shares redeemed | | | (3,610,686 | ) | | | (34,442,728 | ) | | | (2,127,208 | ) | | | (21,106,410 | ) | |
Net increase/(decrease) | | | (1,529,074 | ) | | $ | (14,539,890 | ) | | | 3,213,479 | | | $ | 32,607,215 | | |
Credit Opportunities Fund - Class A | |
Proceeds from shares sold | | | — | | | $ | — | | | | 957 | | | $ | 9,675 | | |
Shares issued in reinvestment of
distributions | | | 318 | | | | 3,044 | | | | 262 | | | | 2,624 | | |
Payments for shares redeemed | | | (4,161 | ) | | | (39,889 | ) | | | — | | | | — | | |
Net increase/(decrease) | | | (3,843 | ) | | $ | (36,845 | ) | | | 1,219 | | | $ | 12,299 | | |
9. FOREIGN CURRENCY TRANSLATION
Amounts denominated in or expected to settle in foreign currencies are translated to U.S. dollars based on exchange rates on the basis outlined below:
A. The market values of investment securities and other assets and liabilities are translated at the closing rate of exchange each day.
B. Purchases and sales of investment securities and income and expenses are translated at the rate of exchange prevailing on the respective dates of such transactions.
C. The Funds do not isolate that portion of the results of operations caused by changes in foreign exchange rates on investments from those caused by changes in market prices of securities held. Such fluctuations are included with the net realized and unrealized gains or losses on investments. Reported net realized foreign exchange gains or losses arise from 1) purchases and sales of foreign currencies; 2) currency gains or losses realized between the trade and settlement dates on security transactions; and 3) the difference between the amounts of dividends, interest and foreign withholding taxes recorded on the Funds' books, and the U.S. dollar equivalent of the amounts actually received or paid. Reported net unrealized foreign exchange gains and losses arise from changes in the value of assets and liabilities, other than investment securities, resulting from changes in exchange rates.
10. CONTINGENCIES AND COMMITMENTS
The Funds indemnify the Trust's officers and trustees for certain liabilities that might arise from their performance of their duties to the Funds. Additionally, in the normal course of business, the Funds enter into contracts that contain a variety of representations and warranties and which provide general indemnifications. The Funds' maximum exposure under these arrangements is unknown, as this would involve future claims that may be made against the Funds that have not yet occurred. However, based on experience, the Funds expect the risk of loss to be remote.
Annual Report | May 31, 2023
87
The Arbitrage Funds Notes to Financial Statements (continued)
11. SECURITIES LENDING
To generate additional income, the Funds may, from time to time, lend portfolio securities to broker-dealers, banks or institutional borrowers of securities. At the time of the loan, the Funds must receive from the borrower 102% collateral in the form of cash or U.S. government securities. This collateral must be valued daily and, should the market value of the loaned securities increase, the borrower must furnish additional collateral to the Funds. During the time portfolio securities are on loan, the borrower pays the Funds any dividends or interest paid on such securities.
Loans are subject to termination by the Funds or the borrower at any time. While the Funds do not have the right to vote securities on loan, they have the right to terminate the loan and regain the right to vote if that is considered important with respect to the investment. In the event the borrower defaults in its obligation to the Fund, the Funds bear the risk of delay in the recovery of portfolio securities and the risk of loss of rights in the collateral.
The Funds may participate in a securities lending program under which the Funds' custodian, State Street Bank and Trust Company (the "Custodian") acting as securities lending agent, is authorized to lend Fund portfolio securities to qualified brokers/dealers and financial institutions that post appropriate collateral. The value of securities loaned will not exceed one-third of the value of the total assets of the Fund making the loan. The Custodian has agreed to indemnify the Fund in case of default of any security borrower.
Securities on loan are fully collateralized and the collateral was equal to or exceeded the securities on loan. Cash collateral is invested in the State Street Institutional U.S. Government Money Market Fund, Premier Class. The Custodian receives a portion of the interest earned on any reinvested collateral. Income received by the Funds in securities lending transactions during the year ended May 31, 2023, if any, is net of fees retained by the securities lending agent and is reflected as securities lending income in the Statement of Operations. There were no securities loaned during the year ended May 31, 2023.
12. FEDERAL TAX INFORMATION
In order to avoid imposition of the excise tax applicable to regulated investment companies, it is each Fund's intention to declare as dividends in each calendar year at least 98.0% of its net investment income (earned during the calendar year) and 98.2% of its net realized capital gains (earned during the twelve months ended October 31), plus undistributed amounts from prior years.
The amount of distributions from net investment income and net realized gains, if any, are determined in accordance with Federal income tax regulations which may differ from accounting principles generally accepted in the United States of America. These "book/tax" differences are either temporary or permanent in nature and permanent differences are charged or credited to undistributed net investment income (loss), accumulated net realized gain (loss) or paid-in capital as appropriate in the period that the differences arise.
Permanent differences between the Funds' financial statement and income tax reporting requirements are primarily attributable to gains and losses on certain foreign currency related transactions, short sale related dividend expense, investments in passive foreign investment companies, investments in swaps, premium amortization, net operating losses, ordinary loss netting to reduce short-term capital gains, convertible bonds, non-deductible excise tax activity and partnership basis adjustments. These have no effect on the Funds' net assets or net asset value per share.
www.arbitragefunds.com | 1-800-295-4485
88
The Arbitrage Funds Notes to Financial Statements (continued)
Fund | | Distributable
Earnings
(Accumulated Loss) | | Paid-in Capital | |
Arbitrage Fund | | $ | (9,885,338 | ) | | $ | 9,885,338 | | |
Event-Driven Fund | | | 2 | | | | (2 | ) | |
Credit Opportunities Fund | | | — | | | | — | | |
The tax character of dividends and distributions declared and paid during the years ended May 31, 2023 and May 31, 2022 was as follows:
Fund | | Year
Ended | | Ordinary
Income | | Long-Term
Capital Gains* | | Total
Distributions | |
Arbitrage Fund | | 5/31/2023 | | $ | 21,948,812 | | | $ | 30,340,622 | | | $ | 52,289,434 | | |
| | | 5/31/2022 | | | — | | | | 8,434,675 | | | | 8,434,675 | | |
Event-Driven Fund | | 5/31/2023 | | $ | — | | | $ | — | | | $ | — | | |
| | | 5/31/2022 | | | — | | | | — | | | | — | | |
Credit Opportunities Fund | | 5/31/2023 | | $ | 5,242,224 | | | $ | — | | | $ | 5,242,224 | | |
| | | 5/31/2022 | | | 3,596,180 | | | | — | | | | 3,596,180 | | |
* The Funds designate these distributions as long-term capital gains dividends per IRC code section 852(b)(3)(C).
As of May 31, 2023, the components of distributable earnings on a tax basis were as follows:
| | | Arbitrage
Fund | | Event-Driven Fund | | Credit
Opportunities
Fund | |
Undistributed ordinary income | | $ | 20,645,775 | | | $ | 7,391 | | | $ | 290,932 | | |
Accumulated capital gains/losses | | | — | | | | — | | | | — | | |
Unrealized appreciation/(depreciation) | | | (87,115,041 | ) | | | (9,472,268 | ) | | | (5,440,746 | ) | |
Capital loss carryover and late year
ordinary loss deferrals | | | — | | | | (32,530,611 | ) | | | (2,325,468 | ) | |
Total distributable earnings
(accumulated loss) | | $ | (66,469,266 | ) | | $ | (41,995,488 | ) | | $ | (7,475,282 | ) | |
As of May 31, 2023, the cost and aggregate gross unrealized appreciation/(depreciation) of long security positions, short security positions and derivative instruments for federal income tax purposes were as follows:
Fund | | Gross
Appreciation
(excess of value
over tax cost) | | Gross
Depreciation
(excess of tax
cost over value) | | Net Unrealized
Depreciation | | Aggregate Cost
of Investments
for Income Tax
Purposes | |
Arbitrage Fund | | $ | 35,646,699 | | | $ | (122,878,697 | ) | | $ | (87,231,998 | ) | | $ | 1,201,503,615 | | |
Event-Driven Fund | | | 3,116,692 | | | | (12,768,112 | ) | | | (9,651,420 | ) | | | 120,356,089 | | |
Credit Opportunities Fund | | | 2,296,433 | | | | (7,271,461 | ) | | | (4,975,028 | ) | | | 124,538,582 | | |
The differences between book-basis and tax-basis net unrealized appreciation/(depreciation) for the Funds are attributable to dividends related to non-real estate investment trust adjustments, passive foreign investment companies, wash sales, straddle loss deferrals, premium amortization, constructive gains and constructive sales adjustments, partnership basis adjustments and forward contracts mark to market.
Annual Report | May 31, 2023
89
The Arbitrage Funds Notes to Financial Statements (continued)
Capital Losses
As of May 31, 2023, the Event-Driven Fund had $27,443,202 of short term and $5,087,409 of long term capital loss carryforwards and the Credit Opportunities Fund had $158,334 of short term and $2,167,134 of long term capital loss carryforwards which may reduce the Funds' taxable income arising from future net realized gains on investments, if any, to the extent permitted by the Code and thus may reduce the amount of the distributions to shareholders which would otherwise be necessary to relieve the Funds of any liability for federal tax.
The Event-Driven Fund utilized $3,279,585 of capital loss carryforwards during the year ended May 31, 2023.
13. SUBSEQUENT EVENTS
Management has evaluated subsequent events for the Funds through the date the financial statements were issued, and has concluded that there are no recognized or non-recognized subsequent events relevant for financial statement disclosure.
www.arbitragefunds.com | 1-800-295-4485
90
Report of Independent Registered Public Accounting Firm
To the Shareholders and the Board of Trustees of
The Arbitrage Funds
Opinion on the Financial Statements
We have audited the accompanying statements of assets and liabilities of The Arbitrage Funds (the Trust) (comprising Arbitrage Fund, Water Island Event-Driven Fund, and Water Island Credit Opportunities Fund, (collectively referred to as the "Funds")), including the schedules of investments, as of May 31, 2023, and the related statements of operations for the year then ended, the statements of changes in net assets for each of the two years in the period then ended, the financial highlights for each of the five years in the period then ended and the related notes (collectively referred to as the "financial statements"). In our opinion, the financial statements present fairly, in all material respects, the financial position of each of the Funds comprising the Trust at May 31, 2023, the results of their operations for the year then ended, changes in their net assets for each of the two years in the period then ended and their financial highlights for each of the five years in the period then ended, in conformity with U.S. generally accepted accounting principles.
Basis for Opinion
These financial statements are the responsibility of the Trust's management. Our responsibility is to express an opinion on each of the Funds' financial statements based on our audits. We are a public accounting firm registered with the Public Company Accounting Oversight Board (United States) ("PCAOB") and are required to be independent with respect to the Trust in accordance with the U.S. federal securities laws and the applicable rules and regulations of the Securities and Exchange Commission and the PCAOB.
We conducted our audits in accordance with the standards of the PCAOB. Those standards require that we plan and perform the audit to obtain reasonable assurance about whether the financial statements are free of material misstatement, whether due to error or fraud. The Trust is not required to have, nor were we engaged to perform, an audit of the Trust's internal control over financial reporting. As part of our audits, we are required to obtain an understanding of internal control over financial reporting, but not for the purpose of expressing an opinion on the effectiveness of the Trust's internal control over financial reporting. Accordingly, we express no such opinion.
Our audits included performing procedures to assess the risks of material misstatement of the financial statements, whether due to error or fraud, and performing procedures that respond to those risks. Such procedures included examining, on a test basis, evidence regarding the amounts and disclosures in the financial statements. Our procedures included confirmation of securities owned as of May 31, 2023, by correspondence with the custodians, agent banks, and brokers or by other appropriate auditing procedures where replies from agent banks and brokers were not received. Our audits also included evaluating the accounting principles used and significant estimates made by management, as well as evaluating the overall presentation of the financial statements. We believe that our audits provide a reasonable basis for our opinion.

We have served as the auditor of one or more of the Water Island Capital investment companies since 2012.
Minneapolis, Minnesota
July 28, 2023
Annual Report | May 31, 2023
91
The Arbitrage Funds Disclosure of Fund Expenses
As a shareholder of a mutual fund you incur two types of costs: transaction costs, including sales charges (loads) on some share classes, and operating expenses. Your investment is affected by these ongoing costs, which include (among others) costs for portfolio management, administrative services, distribution (12b-1) expenses, redemption fees and shareholder reports like this one. It is important for you to understand the impact of these costs on your investment returns.
Operating expenses such as these are deducted from a mutual fund's gross income and directly reduce its final investment return. These expenses are expressed as a percentage of a mutual fund's average net assets; this percentage is known as a mutual fund's expense ratio.
The following examples use the expense ratio and are intended to help you understand the ongoing costs (in dollars) of investing in your Fund and to compare these costs with those of other mutual funds. The examples are based on an investment of $1,000 made at the beginning of the period shown and held for the entire period.
The table on the following page illustrates your Fund's cost in two ways:
Actual Fund Return. The section helps you to estimate the actual expenses after fee waivers that your Fund incurred over the period. The "Expenses Paid During Period" column shows the actual dollar expense cost incurred by a $1,000 investment in the Fund, and the "Ending Account Value" number is derived from deducting that expense cost from the Fund's gross investment return.
You can use this information, together with the actual amount you invested in the Fund, to estimate the expenses you paid over that period. Simply divide your actual account value by $1,000 to arrive at a ratio (for example, an $8,600 account value divided by $1,000 = 8.6), then multiply that ratio by the number shown for your Fund under "Expenses Paid During Period."
Hypothetical 5% Return. This section helps you compare your Fund's costs with those of other mutual funds. It assumes that the Fund had an annual 5% return before expenses during the period, but that expense ratio (Column 3) for the period is unchanged. This example is useful in making comparisons because the Securities and Exchange Commission requires all mutual funds to make this 5% calculation. You can assess your Fund's comparative cost by comparing the hypothetical result for your Fund in the "Expenses Paid During Period" column with those that appear in the same charts in the shareholder reports for other mutual funds.
Note: Because the return is set at 5% for comparison purposes — NOT your Fund's actual return — the account values shown may not apply to your specific investment.
www.arbitragefunds.com | 1-800-295-4485
92
The Arbitrage Funds Disclosure of Fund Expenses (continued)
| | | Beginning
Account Value
12/01/2022 | | Ending
Account Value
05/31/2023 | | Expense
Ratio(a) | | Expenses
Paid During
Period(b) | |
Arbitrage Fund | |
Class R | |
Actual | | $ | 1,000.00 | | | $ | 985.00 | | | | 1.44 | % | | $ | 7.13 | | |
Hypothetical (5% return before
expenses) | | $ | 1,000.00 | | | $ | 1,017.75 | | | | 1.44 | % | | $ | 7.24 | | |
Class I | |
Actual | | $ | 1,000.00 | | | $ | 987.20 | | | | 1.19 | % | | $ | 5.90 | | |
Hypothetical (5% return before
expenses) | | $ | 1,000.00 | | | $ | 1,019.00 | | | | 1.19 | % | | $ | 5.99 | | |
Class C | |
Actual | | $ | 1,000.00 | | | $ | 982.70 | | | | 2.19 | % | | $ | 10.83 | | |
Hypothetical (5% return before
expenses) | | $ | 1,000.00 | | | $ | 1,014.01 | | | | 2.19 | % | | $ | 11.00 | | |
Class A | |
Actual | | $ | 1,000.00 | | | $ | 985.50 | | | | 1.44 | % | | $ | 7.13 | | |
Hypothetical (5% return before
expenses) | | $ | 1,000.00 | | | $ | 1,017.75 | | | | 1.44 | % | | $ | 7.24 | | |
(a) Annualized, based on the Fund's most recent fiscal half-year expenses.
(b) Expenses are equal to the Fund's annualized ratio multiplied by the average account value over the period multiplied by the number of days in the most recent fiscal half year (182) divided by 365.
| | | Beginning
Account Value
12/01/2022 | | Ending
Account Value
05/31/2023 | | Expense
Ratio(a) | | Expenses
Paid During
Period(b) | |
Water Island Event-Driven Fund | |
Class R | |
Actual | | $ | 1,000.00 | | | $ | 982.60 | | | | 1.69 | % | | $ | 8.35 | | |
Hypothetical (5% return before
expenses) | | $ | 1,000.00 | | | $ | 1,016.50 | | | | 1.69 | % | | $ | 8.50 | | |
Class I | |
Actual | | $ | 1,000.00 | | | $ | 983.70 | | | | 1.44 | % | | $ | 7.12 | | |
Hypothetical (5% return before
expenses) | | $ | 1,000.00 | | | $ | 1,017.75 | | | | 1.44 | % | | $ | 7.24 | | |
Class A | |
Actual | | $ | 1,000.00 | | | $ | 983.50 | | | | 1.69 | % | | $ | 8.36 | | |
Hypothetical (5% return before
expenses) | | $ | 1,000.00 | | | $ | 1,016.50 | | | | 1.69 | % | | $ | 8.50 | | |
(a) Annualized,based on the Fund's most recent fiscal half-year expenses.
(b) Expenses are equal to the Fund's annualized ratio multiplied by the average account value over the period multiplied by the number of days in the most recent fiscal half year (182) divided by 365.
Annual Report | May 31, 2023
93
The Arbitrage Funds Disclosure of Fund Expenses (continued)
| | | Beginning
Account Value
12/01/2022 | | Ending
Account Value
05/31/2023 | | Expense
Ratio(a) | | Expenses
Paid During
Period(b) | |
Water Island Credit Opportunities Fund | |
Class R | |
Actual | | $ | 1,000.00 | | | $ | 1,019.70 | | | | 1.30 | % | | $ | 6.55 | | |
Hypothetical (5% return before
expenses) | | $ | 1,000.00 | | | $ | 1,018.45 | | | | 1.30 | % | | $ | 6.54 | | |
Class I | |
Actual | | $ | 1,000.00 | | | $ | 1,021.00 | | | | 1.05 | % | | $ | 5.29 | | |
Hypothetical (5% return before
expenses) | | $ | 1,000.00 | | | $ | 1,019.70 | | | | 1.05 | % | | $ | 5.29 | | |
Class A | |
Actual | | $ | 1,000.00 | | | $ | 1,019.70 | | | | 1.30 | % | | $ | 6.55 | | |
Hypothetical (5% return before
expenses) | | $ | 1,000.00 | | | $ | 1,018.45 | | | | 1.30 | % | | $ | 6.54 | | |
(a) Annualized, based on the Fund's most recent fiscal half-year expenses.
(b) Expenses are equal to the Fund's annualized ratio multiplied by the average account value over the period multiplied by the number of days in the most recent fiscal half year (182) divided by 365.
www.arbitragefunds.com | 1-800-295-4485
94
The Arbitrage Funds Additional Information
1. PROXY VOTING POLICIES AND VOTING RECORD
A description of the policies and procedures that the Funds use to determine how to vote proxies relating to portfolio securities is available without charge, upon request, by calling 1-800-295-4485 or on the Securities and Exchange Commission's ("SEC") website at http://www.sec.gov.
Information regarding how the Funds voted proxies relating to portfolio securities during the most recent 12-month period ended June 30 is available without charge upon request by calling 1-800-295-4485 or on the SEC's website at http://www.sec.gov.
2. QUARTERLY PORTFOLIO HOLDINGS
The Funds file a complete listing of their portfolio holdings with the SEC as of the first and third quarters of each fiscal year on Form N-PORT. The filings are available on the Funds' website at www.arbitragefunds.com/resources or upon request by calling 1-800-295-4485. Furthermore, you may obtain a copy of the filing on the SEC's website at http://www.sec.gov.
Annual Report | May 31, 2023
95
The Arbitrage Funds Approval of Investment Advisory Agreements
As required under the Investment Company Act of 1940 (the "1940 Act"), the Board of Trustees (the "Board") of The Arbitrage Funds (the "Trust"), which is comprised of Arbitrage Fund, Water Island Event-Driven Fund and Water Island Credit Opportunities Fund (each, a "Fund" and, collectively, the "Funds"), determines annually whether to continue each Fund's investment advisory agreement with Water Island Capital, LLC, the investment adviser to each Fund (the "Adviser"). In considering the renewal of the agreements, the Board, including a majority of those Trustees who are not "interested persons" of the Funds (the "Independent Trustees"), as defined in the 1940 Act, met with representatives of the Adviser on May 15, 2023 and on May 23, 2023 (the "Meetings") and in separate executive sessions in advance of and at the May 23, 2023 meeting and approved the continuation of the agreements after concluding that the continuation of the agreements was in the best interests of each Fund and its shareholders.
The Board requested and received materials relating to the agreements in advance of the Meetings. Among other things, the Board considered expense and performance comparisons with other mutual funds in each Fund's peer group as determined by Broadridge Financial Solutions Inc. ("Broadridge"), an independent provider of mutual fund industry data, as well as additional substantial material prepared by the Funds' management. Representatives of Broadridge discussed their report with the Board and responded to questions from the Independent Trustees at the May 15, 2023 meeting. The additional material prepared by management generally included Fund by Fund information including each Fund's average net assets; management fees; expense limitation arrangements; investment performance and risk metrics (in addition to the performance information prepared by Broadridge); information about services provided by the Adviser and profitability information. The Board also considered that it had reviewed the Funds' performance against comparable mutual funds as provided by the Adviser at the Meetings and at the Board's other meetings throughout the year, in addition to other information requested by the Independent Trustees and provided by the Adviser and other service providers at the Meetings and throughout the year. The Trustees were also continually aware of information provided by the Adviser and other service providers in response to the Board's requests, including from previous contract renewal periods, as well as certain information available to the Trustees from various other sources such as the Investment Company Institute, the Independent Directors Council and the Mutual Fund Directors Forum, among others.
In evaluating the agreements, the Board, including the Independent Trustees advised by independent legal counsel, considered the factors it deemed relevant, including the nature, quality and extent of services provided, the performance of each Fund, the profitability of the Adviser, expenses and fees, the potential for economies of scale that may be shared with each Fund and its shareholders as each Fund's assets grow, and any other benefits derived by the Adviser from its relationship with the Funds. In their deliberations, the Trustees did not identify any single factor which alone was responsible for the Board's decision to approve the agreement with respect to each Fund, and each Trustee may have given different weights to different factors and, thus, each Trustee may have had a different basis for his or her decision. In connection with its deliberations, the Board considered information provided by the Adviser throughout the year at regular Board meetings and between Board meetings, presentations from portfolio managers and other information, as well as information furnished at or in advance of the Meetings.
Nature, Extent and Quality of the Services under the Advisory Agreements
Based on the written and oral reports received by the Board prior to and at the Meetings, including in executive session, the Board considered the nature, quality, and extent of the services provided to each Fund by the Adviser under the advisory agreement for such Fund. The Board also noted information received at regular meetings and at other times throughout the year related to the services rendered by the Adviser. The Board reviewed information regarding the overall organization
www.arbitragefunds.com | 1-800-295-4485
96
The Arbitrage Funds Approval of Investment Advisory Agreements (continued)
and business functions of the Adviser and considered the background and experience of the Adviser's senior management. The Board also reviewed the qualifications, backgrounds and responsibilities of the portfolio managers primarily responsible for the day-to-day portfolio management of the Funds and the extent of the resources devoted to research and analysis of actual and potential investments. The Board considered that the Adviser provides a number of additional services, including oversight of Fund service providers, duties with respect to the Fund's valuations, and operation of the Fund's compliance program. The Board considered the steps that the Adviser had taken during the past year to improve performance, including, without limitation, hiring and changes in personnel, enhancements in technology, and the Adviser's focus on evaluating risk and performance for the Funds. The Board also received and considered available information about the nature, extent and quality of services and fee rates offered to other clients of the Adviser for advisory services. The Trustees and the Adviser discussed the differences between an adviser's duties and its risks incurred in offering a sponsored mutual fund versus the more limited duties and risks involved in acting as a sub-adviser to a mutual fund, and also in comparing a sponsor adviser's duties and risks incurred in offering a sponsored mutual fund versus the much more limited duties and risks incurred managing an institutional separate account. The Board also considered that the Adviser bears and assumes significant ongoing risks, including investment, operational, enterprise, litigation, regulatory and compliance risks, with respect to all the Funds.
Adviser Profitability
The Board was provided with information on the Adviser's profitability in serving as the investment adviser to each Fund. The Board recognized that it is difficult to make comparisons of profitability from fund management contracts because comparative information is not generally publicly available and is affected by numerous factors, including the structure of the particular adviser, the types of funds it manages, its business mix, numerous assumptions regarding allocations of expenses and the adviser's capital structure and cost of capital. Taking these factors into account, the Board concluded that the Adviser's profitability in relation to the services rendered was reasonable and that it was believed to be sufficient to continue to support investments to enhance services to the Funds and their shareholders.
Economies of Scale
The Board considered information regarding potential economies of scale with respect to the management of each Fund, whether the Fund has appropriately benefited from any economies of scale, and whether there is potential for realization of any further economies of scale. With respect to Arbitrage Fund, the Board noted that the management fee schedule for the Fund includes breakpoints, which have the effect of decreasing the fee rate as assets increase, and that at its current level of assets the Fund's effective fee rate reflected those rate reductions. The Board took note that the Fund's fee structure currently results in benefits to Fund shareholders whether or not the Adviser realizes any economies of scale. The Board noted that the advisory fee schedule for Water Island Event-Driven Fund does not contain breakpoints that would reduce the fee rate on assets above specified levels. The Board noted that the advisory fee for the Water Island Event-Driven Fund had been reduced effective November 1, 2019. The Board determined that, while fee breakpoints were not currently necessary for the Water Island Event-Driven Fund given the Fund's relatively smaller size, it would continue to review whether breakpoints should be incorporated as part of the fee structure. With respect to Water Island Credit Opportunities Fund, the Board noted that the Fund's management fee schedule includes breakpoints. The Independent Trustees also recognized that potential economies of scale may be shared acceptably with a Fund in many different manners such as fee breakpoints, fee waivers or caps, reinvestments in the Adviser's business above contractual levels, additional new product offerings, and pricing to scale from inception, among others. The
Annual Report | May 31, 2023
97
The Arbitrage Funds Approval of Investment Advisory Agreements (continued)
Trustees noted that each Fund is party to an expense limitation agreement with the Adviser, pursuant to which the Adviser has agreed to waive or reimburse expenses should they exceed certain contractually specified levels. The Independent Trustees recognized that is it extremely difficult to determine whether potential economies of scale in fact exist for any fund, or for a fund complex, and, or, at what point any potential economies of scale may begin to be reduced at some asset level, or possibly reverse and become diseconomies of scale. Thus, the Trustees were aware that they needed to use their business judgment and experience in evaluating whether any potential economies of scale might be equitably shared with the Funds.
Other Benefits to the Adviser
The Board considered other benefits received by the Adviser as a result of its relationship with the Funds. The Board concluded that the potential benefits to be derived by the Adviser included the ability to use soft dollar credits as well as the potential benefits consistent with those generally resulting from an increase in assets under management, specifically, potential access to additional research resources and benefits to its reputation. The Board concluded that the benefits derived by the Adviser were consistent with the types of benefits generally derived by investment advisers to mutual funds. The Board considered the standards applied in seeking best execution and reviewed the Adviser's method for and policies with respect to allocating portfolio investment opportunities among its advisory clients, including the Funds. The Independent Trustees considered these and any other potential fallout benefits and generally determined these to be not material to the consideration of the management and other fees and to the Adviser's profitability generally.
Other Factors and Broader Review
As discussed above, the Board considered detailed materials received from the Adviser as part of the annual review and at quarterly meetings throughout the year and over previous years. The Board also reviews and assesses the quality of the services that the Funds receive throughout the year. In this regard, the Board reviews reports of the Adviser at least quarterly, which include, among other things, detailed portfolio and market reviews, detailed Fund performance reports and compliance reports along with various reports and information evaluating the Adviser's supervisory oversight of third party service providers to the Funds.
Investment Advisory Fee Rates and Expenses and Performance
The Board reviewed and considered the contractual advisory fee rates for each Fund in light of the nature, extent and quality of the advisory services provided by the Adviser. The Board also reviewed and considered the expense limitation agreements currently in place for each Fund. The Board received and considered information on the contractual advisory fee rate and gross and net total operating expense ratios for each Fund in comparison to those of a group of funds within the Fund's Morningstar category selected independently by Broadridge (the "Peer Group") as well as to funds in the same Morningstar category (the "Category"). For each Fund, the Board considered information provided by Broadridge on the Fund's effective advisory fee rate — that is, the Fund's contractual advisory fee in comparison with the contractual advisory fee that would have been charged by other funds within a Peer Group and Category assuming the other funds were similar in size to the Fund. The contractual advisory fee analysis does not take into account any fee waivers or expense reimbursements. The comparisons placed each Fund in various quartiles, with the first quartile being the lowest cost mutual funds. The Broadridge expense data was based upon historical information taken from each Fund's audited annual report for the period ended May 31, 2022. Broadridge provided expense data for Class I shares of each Fund.
The performance of each Fund for the periods ended March 31, 2023, was compared to the performance of the funds within the same Morningstar Category, regardless of asset size or primary
www.arbitragefunds.com | 1-800-295-4485
98
The Arbitrage Funds Approval of Investment Advisory Agreements (continued)
channel of distribution ("Performance Category"). The comparisons placed each Fund in various quartiles, with the first quartile being the best performing funds. The Board also received and considered additional information provided by the Adviser on comparisons of the performance of each Fund to its prospectus benchmark and to additional securities indices that the Adviser deemed relevant to the Board's considerations. The Independent Trustees also reviewed performance in relation to certain measures of the degree of investment risk undertaken by the portfolio managers. The Independent Trustees also noted that they regularly engage in discussions with the Adviser and counsel with regard to the portfolio benchmark comparisons for each Fund.
In evaluating the Funds' performance, the Board generally considered long-term performance to be more important than short-term performance and also took into account factors including general market conditions, as well as particular market and regulatory conditions that impact the Funds' investment strategies; the "style" in which the Funds are managed, as applicable, and whether that style is in or out of favor in the market; the relative sizes of the Funds; and fund cash flows. In this regard, the Board also noted how changes in time periods for performance calculations (for example, whether a one-year period is from December-to-December or March-to-March) can significantly impact a Fund's returns and peer ranking on a relative basis. The Board also considered that variations in performance among a Fund's operating classes reflect variations in class expenses, which result in lower performance for higher expense classes.
The Board received a description of Broadridge's methodology for determining peer groups, and factored into its evaluation of each Fund's performance, fees and expenses the limitations inherent in the methodology for constructing peer groups and determining, from year to year, which mutual funds should be included in which peer groups, among other things. The Board recognized these inherent limitations and, taking into account commentary and information from management, also recognized that comparisons between a Fund and other mutual funds in a peer category may not be as relevant in certain circumstances, given that in some cases a Fund may notably differ (for example, in its management techniques or relative size) when compared to other mutual funds in the peer group. The Board also noted that the number of mutual funds included in a peer group may be relatively small and constituent mutual funds included in a peer group may differ from year to year, which, among other factors, can limit the relevance of the comparisons. While recognizing these inherent limitations, the Board believed the analysis conducted by Broadridge provided a useful measure of comparative performance.
Arbitrage Fund
The Fund's performance (Class I Shares, net of fees) was compared to that of funds comprising the Morningstar Event Driven Category. The Fund's net total return ranked in the third quartile of the Performance Category for the one-, five- and ten-year periods, and the fourth quartile for the three-year period. The Fund's performance was also compared to its prospectus benchmark index, the ICE BofA U.S. 3 Month Treasury Bill Index. The Fund outperformed its benchmark for the three-, five- and ten-year periods and since inception. The Fund's effective advisory fee was in the second quartile of its Category and Peer Group, and the Fund's net total operating expense ratio (i.e., the Fund's total operating expenses, net of any waivers/reimbursements) was in the second quartile for the Category and the Peer Group. It was noted that the Adviser had entered into an expense waiver and reimbursement agreement to limit fees through September 30, 2024, although the Fund's expenses did not currently reach a level to require the Adviser to waive fees or reimburse expenses.
The Board determined that, given all of the factors provided, it would be in the best interests of the Fund and its shareholders to continue the advisory agreement. The Fund's fee structure was considered reasonable.
Annual Report | May 31, 2023
99
The Arbitrage Funds Approval of Investment Advisory Agreements (continued)
Water Island Event-Driven Fund
The Fund's performance (Class I Shares, net of fees) was compared to that of funds comprising the Morningstar Event Driven Category. The Fund's net total return ranked in the third quartile of the Performance Category for the one-period, in the second quartile for the three- and five-year periods, and in the fourth quartile for the ten-year period. The Fund's performance was also compared to its prospectus benchmark index, the ICE BofA U.S. 3-Month Treasury Bill Index. The Fund outperformed its benchmark for the three-, five- and ten-year periods and since inception. The Fund's effective advisory fee was in the second quartile of its Category and Peer Group and the Fund's net total operating expense ratio (i.e., the Fund's total operating expenses, net of waivers/reimbursements) was in the second quartile of its Category and Peer Group. The Board considered that the Fund's contractual advisory fee rate had been reduced effective November 1, 2019 from 1.25% to 1.10%. It was further noted that the Adviser had entered into an expense waiver and reimbursement agreement to limit fund fees and expenses through September 30, 2024.
The Board determined that, given all of the factors provided, it would be in the best interests of the Fund and its shareholders to continue the advisory agreement. In light of the Fund's current size and fee rate, the Board concluded that the fee structure was reasonable and that the absence of breakpoints in the Fund's fee schedule was acceptable at this time, although the Board would continue to monitor whether breakpoints should be implemented for the Fund.
Water Island Credit Opportunities Fund
The Fund's performance (Class I Shares, net of fees) was compared to that of funds comprising the Morningstar Nontraditional Bond Category. The Fund's net total return ranked in the first quartile of the Performance Category for the one-, three-, five-, and ten-year periods. The Fund outperformed its prospectus benchmark, the ICE BofA U.S. 3-Month Treasury Bill Index, for the three-, five- and ten-year periods and since inception. The Fund outperformed its supplemental benchmark, the Bloomberg U.S. Aggregate Bond Index, for the three-, five- and ten-year periods and since inception. The Fund's effective advisory fee rate was in third quartile of its Category and in the second quartile of its Peer Group, and the Fund's net total operating expense ratio (i.e., the Fund's total operating expenses, net of waivers/reimbursements) was in the third quartile for the Category and the second quartile (at the median) for the Peer Group. It was noted that the median average net asset size of the funds in the Category and Peer Group was significantly larger than that of the Fund and that many of those funds appear to benefit from economies of scale. It was further noted that the Adviser had lowered the Fund's management fee and instituted a breakpoint to the Fund's management fee schedule in 2018 and had entered into an expense waiver and reimbursement agreement to further limit fund fees and expenses through September 30, 2024.
The Board determined, given all of the factors provided, that it would be in the best interests of the Fund and its shareholders to continue the advisory agreement. In light of the Fund's current size and fee rate, the Board concluded that the fee structure was reasonable.
www.arbitragefunds.com | 1-800-295-4485
100
The Arbitrage Funds Liquidity Risk
Annual Review of Liquidity Risk Management Program (the "LRMP") including Report from the Liquidity Risk Management Program Administrator
Consistent with Rule 22e-4 under the Investment Company Act of 1940 (the "Liquidity Rule"), the Funds have adopted and implemented a liquidity risk management program (the "Program"). The Program seeks to assess and manage each Fund's liquidity risk, which is defined as the risk that a Fund is unable to meet investor redemption requests without significantly diluting the remaining investors' interests in the Fund. The Funds' Board of Trustees (the "Board") has designated Water Island Capital, LLC, the Funds' investment adviser, as the administrator of the Program. The Program is implemented and monitored by the Operational Risk Committee, a committee comprised of representatives of Water Island Capital, LLC. As part of its responsibilities as administrator, Water Island Capital, LLC has retained a third party to perform certain functions, including providing market data and liquidity classification model information.
The Funds' Program includes a number of processes designed to support the assessment and management of its liquidity risk. In particular, the Program includes no less than annual assessments of factors that influence each Fund's liquidity risk; no less than monthly classifications of each Fund's investments into one of four liquidity classifications provided for in the Liquidity Rule; a 15% of net assets limit on the acquisition of "illiquid investments" (as defined under the Liquidity Rule); establishment of a minimum percentage of a Fund's assets to be invested in investments classified as "highly liquid" (as defined under the Liquidity Rule) if the Fund does not invest primarily in highly liquid investments; and periodic reporting to the Funds' Board.
At a meeting of the Board of Trustees on February 14, 2023, Water Island Capital, LLC provided a written report (the "Report") to the Board addressing the operation, adequacy, and effectiveness of the Funds' Program, including any material changes to the Program for the year ended December 31, 2022 ("Reporting Period"). The Report included a summary of the oversight of the Program and the system that is used to operate the Program, a discussion of the Funds' investment strategies and liquidity sources, reasonably anticipated trade sizes, historical redemptions, investor concentrations, liquidity events and liquidity classifications during the Reporting Period. The Report concluded that the Program was operating adequately and effectively in promoting effective liquidity risk management for the Funds during the Reporting Period. There were no material changes to the Program during the Reporting Period. The Report further concluded that each Fund's investment strategy continues to be appropriate given the Fund's status as an open-end fund.
There can be no assurance that the Program will achieve its objectives in the future. Additional information regarding risks of investing in each Fund, including liquidity risks presented by the Funds' investment portfolios, is found in the Funds' Prospectus and Statement of Additional Information.
Annual Report | May 31, 2023
101
The Arbitrage Funds Trustees & Officers
The Trustees serve for an indefinite term and the officers are elected annually. It is the policy of the Board that each Trustee, at the conclusion of the first meeting at which the Trustee has attained age 75, shall retire from the Board.
The Statement of Additional Information includes additional information about the Funds' Trustees and is available, without charge, upon request by calling toll-free 1-800-295-4485 or on the Funds' website at www.arbitragefunds.com/resources.
INTERESTED TRUSTEES:
Name, Address
and Year of Birth | | Length of
Time Served | | Position
with Trust | | Principal
Occupation
During the
Past Five Years | | Other
Directorships
During the Past
Five Years | | Number of
Portfolios in
the Fund
Complex
Overseen by
Trustee** | |
John S. Orrico, CFA*
41 Madison
Avenue, 42nd
Floor, New York,
NY 10010
(1960) | | Since 2000 | | President and Chairman of the Board of Trustees | | Managing Member, Water Island Capital, LLC, the Investment Adviser, since January 2000. | | None | | 5 | |
Christina Chew*
41 Madison
Avenue, 42nd
Floor, New York,
NY 10010
(1971) | | Since 2018 | | Trustee | | Senior Managing Partner of Water Island Capital, LLC, the Investment Adviser, since 2013. | | None | | 3 | |
* John S. Orrico and Christina Chew, as affiliated persons of the Adviser, are each an "interested person" of the Trust within the meaning of Section 2(a)(19) of the 1940 Act.
** The registered investment companies in the fund complex include the Trust and AltShares Trust.
www.arbitragefunds.com | 1-800-295-4485
102
The Arbitrage Funds Trustees & Officers (continued)
INDEPENDENT TRUSTEES*:
Name, Address
and Year of Birth | | Length of
Time Served | | Position
with Trust | | Principal
Occupation
During the
Past Five Years | | Other
Directorships
During the Past
Five Years | | Number of
Portfolios in
the Fund
Complex
Overseen by
Trustee** | |
John C. Alvarado
(1959) | | Since 2003 | | Lead Independent Trustee | | COO (2018 -present) and CFO (2016-present) of Magnum Development LLC, a privately held Utah-based integrated energy storage and power generation company. CFO of ACES Delts, LLC. Previously, Managing Director at Alvarado Energy Advisors LLC ("AEA"), a boutique investment banking firm providing financial advisory services to middle market energy companies (2014 - 2016); Managing Director for The Seaport Group, a credit-focused investment bank (2010 - 2014). | | None | | 3 | |
Annual Report | May 31, 2023
103
The Arbitrage Funds Trustees & Officers (continued)
Name, Address
and Year of Birth | | Length of
Time Served | | Position
with Trust | | Principal
Occupation
During the
Past Five Years | | Other
Directorships
During the Past
Five Years | | Number of
Portfolios in
the Fund
Complex
Overseen by
Trustee** | |
Robert P. Herrmann
(1962) | | Since 2012 | | Trustee | | CEO of EQIS Capital Management, Inc., a national financial advisory firm (2020-present). Independent Director of GeoWealth LLC, a technology provider in the financial services industry (2019 -present); Previously, President & CEO of Discovery Data, a leading financial services industry data provider (2009 - 2019). | | Independent Director and Chairman of Nominating and Governance Committee of TD Funds (USA) (2014 - 2019); Independent Director of FundChoice Holdings LLC (2014 - 2018); Chairman of the Board, Monmouth Medical Center (since 2012), Advisory Board Member, Monmouth University School of Science (since 2017). | | 3 | |
www.arbitragefunds.com | 1-800-295-4485
104
The Arbitrage Funds Trustees & Officers (continued)
Name, Address
and Year of Birth | | Length of
Time Served | | Position
with Trust | | Principal
Occupation
During the
Past Five Years | | Other
Directorships
During the Past
Five Years | | Number of
Portfolios in
the Fund
Complex
Overseen by
Trustee** | |
Stephen R. Byers
(1953) | | Since 2016 | | Trustee | | Independent Director (since 2011); Independent Consultant (since 2014). | | Independent Director, Barings BDC (BBDC), a business development company (Since 2022); Independent Chair (since November 2016), Trustee (since 2011), Lead Independent Trustee (2015 - 2016) and Audit Committee Chair (2011 - 2015), Deutsche Bank db-X ETF Trust (45 portfolios); Independent Director and Audit Committee Chair (2012 - 2022), Lead Independent Director (2019 - 2022), Chairman of Sierra Special Committee (2019 - 2022), Sierra Income Corporation; Trustee (2002 - 2011), The College of William and Mary, Graduate School of Business; Board Member (since 2016) and Audit Committee Chair (since 2019), Mutual Fund Directors Forum. | | 3 | |
Annual Report | May 31, 2023
105
The Arbitrage Funds Trustees & Officers (continued)
Name, Address
and Year of Birth | | Length of
Time Served | | Position
with Trust | | Principal
Occupation
During the
Past Five Years | | Other
Directorships
During the Past
Five Years | | Number of
Portfolios in
the Fund
Complex
Overseen by
Trustee** | |
Francis X. Tracy
(1957) | | Since 2016 | | Trustee | | Independent Director (since 2016). Previously, President, Chief Financial Officer, Treasurer, and Secretary for Batterymarch Financial Management, Inc. (1999 - 2014). | | Batterymarch Global Emerging Markets Fund (Luxembourg) (2010 - 2014). | | 5 | |
Nancy M. Morris
(1952) | | Since 2018 | | Trustee | | Independent Director (since 2019). Previously, Chief Compliance Officer and Managing Director, Wellington Management Company LLP (2012 - 2018). | | Director of Diamond Hill Funds (13 portfolios) (since 2019). | | 5 | |
www.arbitragefunds.com | 1-800-295-4485
106
The Arbitrage Funds Trustees & Officers (continued)
EXECUTIVE OFFICERS:
Name, Address
and Year of Birth | | Length of
Time Served | | Position
with Trust | | Principal
Occupation
During the
Past Five Years | | Other
Directorships
During the Past
Five Years | | Number of
Portfolios in
the Fund
Complex
Overseen by
Trustee** | |
William Keena
41 Madison
Avenue, 42nd
Floor, New York,
NY 10010
(1950) | | Anti-Money Laundering Officer since November 2019, Secretary since 2013 | | Anti-Money Laundering Officer, Secretary | | Anti-Money Laundering Officer (2019 - present), Compliance Officer (November 2021 - present), and Chief Administrative
Officer (2010 - October 2021), Water Island Capital, LLC. | | N/A | | N/A | |
Jonathon Hickey
41 Madison
Avenue, 42nd
Floor, New York,
NY 10010
(1980) | | Since 2013 | | Treasurer | | Chief Operating Officer (2016 -present); Director of Operations (2011 - 2016), Water Island Capital, LLC. | | N/A | | N/A | |
Monique Labbe
Foreside
Management
Services, LLC
211 Congress Street, 10th Floor, Suite 1010, Boston, MA 02110
(1973) | | Since 2015 | | Chief Financial Officer | | Fund Principal Financial Officer, Foreside Management Services, LLC*** (2014 - present). | | N/A | | N/A | |
Annual Report | May 31, 2023
107
The Arbitrage Funds Trustees & Officers (continued)
Name, Address
and Year of Birth | | Length of
Time Served | | Position
with Trust | | Principal
Occupation
During the
Past Five Years | | Other
Directorships
During the Past
Five Years | | Number of
Portfolios in
the Fund
Complex
Overseen by
Trustee** | |
Philip Channen
41 Madison
Avenue, 42nd
Floor, New York,
NY 10010
(1964) | | Since December
2019 | | Chief Compliance Officer | | Chief Compliance Officer, Water Island Capital, LLC. (2019 -present); Deputy Chief Compliance Officer, HarbourVest Partners, LLC (2017 - 2019); Chief Compliance Officer/Senior Advisor to the CCO, QS Investors, LLC (2014 - 2016). | | N/A | | N/A | |
* Each Independent Trustee may be contacted by writing to the Trustee c/o Fatima Sulaiman, K&L Gates LLP, 1601 K Street, NW, Washington, D.C. 20006-1600.
** The registered investment companies in the fund complex include the Trust and AltShares Trust.
*** Foreside Fund Services provides chief financial officer services to the Trust under a Fund CFO/Treasurer agreement with the Trust.
www.arbitragefunds.com | 1-800-295-4485
108

Arbitrage Fund
Water Island Event-Driven Fund
Water Island Credit Opportunities Fund
800-295-4485
www.arbitragefunds.com
Adviser
Water Island Capital, LLC
41 Madison Avenue, 42nd Floor
New York, NY 10010
Distributor
ALPS Distributors, Inc.
1290 Broadway, Suite 1100
Denver, CO 80203
Transfer Agent
SS&C GIDS
1055 Broadway
Kansas City, MO 64105
Custodian
State Street Bank and
Trust Company
One Congress Building,
One Congress Street, Suite 1
Boston, MA 02114-2016
This material must be preceded or accompanied by a prospectus. Please read it carefully before investing.
(b) Not applicable.
Item 2. Code of Ethics.
| (a) | The Registrant, as of the end of the period covered by the report, has adopted a code of ethics that applies to the Registrant's principal executive officer, principal financial officer, principal accounting officer or controller or any persons performing similar functions on behalf of the Registrant. |
| (c) | During the period covered by this report, no amendments were made to the provisions of the code of ethics adopted in 2(a) above. |
| (d) | During the period covered by this report, no implicit or explicit waivers to the provisions of the code of ethics adopted in 2(a) above were granted. |
(e) Not applicable.
(f) The Registrant's Code of Ethics is attached as an Exhibit hereto.
Item 3. Audit Committee Financial Expert.
| (a)(1) | The Registrant’s board of trustees has determined that the Registrant has at least one audit committee financial expert serving on the audit committee |
| (a)(2) | The audit committee financial experts are John C. Alvarado and Francis X. Tracy, who are each independent as defined in Form N-CSR Item 3(a)(2). |
Item 4. Principal Accountant Fees and Services.
| (a) | Audit Fees: For the Registrant’s fiscal years ended May 31, 2023 and May 31, 2022, the aggregate fees billed for professional services rendered by the principal accountant for the audit of the Registrant’s annual financial statements were $100,000 and $100,000, respectively. |
| (b) | Audit-Related Fees: For the Registrant’s fiscal years ended May 31, 2023 and May 31, 2022, the aggregate fees billed for assurance and related services by the principal accountant that are reasonably related to the performance of the audit of the Registrant’s financial statements and are not reported under paragraph (a) of this Item were $0 and $0, respectively. |
| (c) | Tax Fees: For the Registrant’s fiscal years ended May 31, 2023 and May 31, 2022, aggregate fees of $27,400 and $27,400, respectively, were billed for professional services rendered by the principal accountant for tax compliance, tax advice, and tax planning. Services for which fees in the Tax Fees category are billed include E&Y’s review of the registrant’s U.S. federal income tax returns and the required state corporate income tax returns, as well as E&Y’s review of excise tax distribution calculations and identification and analyzation of the passive foreign investment company status of foreign corporate equities. |
| (d) | All Other Fees: For the Registrant’s fiscal years ended May 31, 2023 and May 31, 2022, no fees were billed to the Registrant by the principal accountant for services other than the services reported in paragraphs (a) through (c) of this item. |
| (e)(1) | Audit Committee’s Pre-Approval Policies and Procedures: All services to be performed by the Registrant's principal auditors must be pre-approved by the Registrant's audit committee. |
| (e)(2) | No services described in paragraphs (b) through (d) were approved pursuant to paragraph (c)(7)(i)(C) of Rule 2-01 of Regulation S-X. |
(f) Not applicable.
| (g) | The aggregate non-audit fees billed by the Registrant’s principal accountant for the fiscal years ended May 31, 2023 and May 31, 2022 were $27,400 and $27,400, respectively. |
(h) Not applicable.
Item 5. Audit Committee of Listed Registrants.
Not applicable.
Item 6. Schedule of Investments.
The Schedule of Investments is included as part of the Report to Stockholders filed under Item 1 of this form.
Item 7. Disclosure of Proxy Voting Policies and Procedures for Closed-End Management Investment Companies.
Not applicable.
Item 8. Portfolio Managers of Closed-End Management Investment Companies.
Not applicable.
Item 9. Purchases of Equity Securities by Closed-End Management Investment
Company and Affiliated Purchasers.
Not applicable.
Item 10. Submission of Matters to Vote of Security Holders.
There have been no material changes to the procedures by which shareholders may recommend nominees to the registrant’s Board of Trustees.
Item 11. Controls and Procedures.
| (a) | The registrant’s principal executive officer and principal financial officer have evaluated the registrant’s disclosure controls and procedures (as defined in Rule 30a-3(c) under the Investment Company Act of 1940, as amended) within the most recent fiscal half-year of the filing date and have concluded that the registrant’s disclosure controls and procedures were effective, as of that date. |
| (b) | There was no change in the registrant’s internal control over financial reporting (as defined in Rule 30a-3(d) under the Investment Company Act of 1940, as amended) during the period covered by this report that has materially affected, or is reasonably likely to materially affect, the registrant’s internal control over financial reporting. |
Item 12. Disclosure of Securities Lending Activities for Closed-End Management
Investment Companies
Not applicable.
Item 13. Exhibits.
SIGNATURES
Pursuant to the requirements of the Securities Exchange Act of 1934 and the Investment Company Act of 1940, the registrant has duly caused this report to be signed on its behalf by the undersigned, thereunto duly authorized.
THE ARBITRAGE FUNDS
| By: | /s/ John S. Orrico | |
| | John S. Orrico | |
| | President (Principal Executive Officer) | |
| | | |
| Date: | August 4, 2023 | |
Pursuant to the requirements of the Securities Exchange Act of 1934 and the Investment Company Act of 1940, this report has been signed below by the following persons on behalf of the registrant and in the capacities and on the dates indicated.
| By: | /s/ John S. Orrico | |
| | John S. Orrico | |
| | President (Principal Executive Officer) | |
| | | |
| Date: | August 4, 2023 | |
| By: | /s/ Monique Labbe | |
| | Monique Labbe | |
| | Chief Financial Officer (Principal Financial Officer) | |
| | | |
| Date: | August 4, 2023 | |