UNITED STATES
SECURITIES AND EXCHANGE COMMISSION
Washington, D.C. 20549
FORM N-CSR
CERTIFIED SHAREHOLDER REPORT OF REGISTERED
MANAGEMENT INVESTMENT COMPANIES
Investment Company Act file number | 811-09815 |
|
THE ARBITRAGE FUNDS |
(Exact name of registrant as specified in charter) |
|
41 Madison Avenue, 42nd Floor, New York, NY | | 10010 |
(Address of principal executive offices) | | (Zip code) |
|
John S. Orrico Water Island Capital, LLC 41 Madison Avenue 42nd Floor New York, NY 10010 |
(Name and address of agent for service) |
|
Registrant’s telephone number, including area code: | 917-475-9252 | |
|
Date of fiscal year end: | May 31 | |
|
Date of reporting period: | May 31, 2016 | |
| | | | | | | | |
Item 1. Reports to Stockholders.

Annual Report
May 31, 2016
The Arbitrage Fund
The Arbitrage Event-Driven Fund
The Arbitrage Credit Opportunities Fund
The Arbitrage Tactical Equity Fund

TABLE OF CONTENTS
Shareholder Letter | | | 1 | | |
The Arbitrage Fund | |
Manager Commentary | | | 3 | | |
Portfolio Information | | | 5 | | |
Portfolio of Investments | | | 7 | | |
The Arbitrage Event-Driven Fund | |
Manager Commentary | | | 19 | | |
Portfolio Information | | | 21 | | |
Portfolio of Investments | | | 23 | | |
The Arbitrage Credit Opportunities Fund | |
Manager Commentary | | | 39 | | |
Portfolio Information | | | 41 | | |
Portfolio of Investments | | | 43 | | |
The Arbitrage Tactical Equity Fund | |
Manager Commentary | | | 52 | | |
Portfolio Information | | | 54 | | |
Portfolio of Investments | | | 57 | | |
Statements of Assets and Liabilities | | | 66 | | |
Statements of Operations | | | 70 | | |
Statements of Changes in Net Assets | | | 72 | | |
Financial Highlights | |
The Arbitrage Fund - Class R | | | 76 | | |
The Arbitrage Fund - Class I | | | 78 | | |
The Arbitrage Fund - Class C | | | 80 | | |
The Arbitrage Fund - Class A | | | 82 | | |
The Arbitrage Event-Driven Fund - Class R | | | 84 | | |
The Arbitrage Event-Driven Fund - Class I | | | 86 | | |
The Arbitrage Event-Driven Fund - Class C | | | 88 | | |
The Arbitrage Event-Driven Fund - Class A | | | 90 | | |
The Arbitrage Credit Opportunities Fund - Class R | | | 92 | | |
The Arbitrage Credit Opportunities Fund - Class I | | | 94 | | |
The Arbitrage Credit Opportunities Fund - Class C | | | 96 | | |
The Arbitrage Credit Opportunities Fund - Class A | | | 98 | | |
The Arbitrage Tactical Equity Fund - Class R | | | 100 | | |
The Arbitrage Tactical Equity Fund - Class I | | | 102 | | |
The Arbitrage Tactical Equity Fund - Class C | | | 104 | | |
The Arbitrage Tactical Equity Fund - Class A | | | 106 | | |
Notes to Financial Statements | | | 108 | | |
Report of Independent Registered Public Accounting Firm | | | 137 | | |
Disclosure of Fund Expenses | | | 138 | | |
Additional Information | | | 141 | | |
Results of Shareholder Meeting | | | 142 | | |
Trustees' Approval of Advisory Agreement | | | 143 | | |
Trustees & Officers | | | 147 | | |
The Arbitrage Funds Shareholder Letter
Dear Fellow Shareholders,
The fiscal year ended May 31, 2016 encompassed one of the most volatile market environments in recent memory. The CBOE Volatility Index (VIX), a measure of implied volatility in the domestic equity markets, closed above its historical average of 20 on nearly 30% of the trading days over the trailing 12-month period. By way of comparison, that was four times greater than the prior year, and the 2016 period contained almost twice as many days above 20 as the prior three years combined.
This shouldn't necessarily come as a surprise. Investors have had plenty of reason for worry, whether it be concerns over stagnant global economic growth, precipitous declines in oil prices, GREXIT, BREXIT, "will they or won't they?" debates over the likelihood of Federal Reserve interest rate hikes, or worries over the devaluation of China's currency. Tepid corporate earnings and diverging central bank policies around the world serve only to fuel the fire.
And yet, somehow, credit and equity markets continue to march toward new highs. While the S&P 500 Index and the BAML High Yield Index had fallen -10.3% and -5.1%, respectively, for the calendar year-to-date period through February 11, 2016, a combination of actions led to a sudden reversal that pushed markets into positive territory by the end of the first quarter. From mid-February, the European Central Bank provided a larger-than-expected expansion of monetary policy; Chinese officials at the G20 Meeting calmed worries around growth and currency policy; the world's major oil-producing countries hinted at production cuts and cooperation; US recession fears faded; and the Federal Reserve's tone turned considerably more dovish toward expected rate increases.
The second quarter of 2016 saw a strong continuation of the rally that began in mid-February. Credit products experienced dual tailwinds, aided by declines both in the 10-Year US Treasury yield and in high yield credit spreads. And while central bank support, under-investment, and significant cash balances conspired to provide ample stimulus for the markets, the environment has been punctuated by bouts of significant short-term volatility. Market sentiment seems to veer from risk-on to risk-off on a daily basis. Shortly after the end of the period, for example – in reaction to the UK Referendum to leave the EU – investors drove the S&P 500 Index down 5.3% in the four days after the vote, only to see it whipsaw back 5.0% over the following three days.
For event-driven investors like ourselves, recent years have admittedly presented a difficult environment. Yet while the first six months of the fiscal year showed little evidence of halting the trend, the period evolved into a tale of two halves. For the first half of the fiscal year, our Arbitrage, Arbitrage Event-Driven, Arbitrage Credit Opportunities, and Arbitrage Tactical Equity funds generated Sharpe ratios of -1.1, -3.5, -2.1, and -3.0, respectively. For the final six months, however, they generated Sharpe ratios of +4.9, +3.8, +1.6, and +0.8, respectively. This compares favorably to the second-half Sharpe ratios of the S&P 500 Index (+0.3) and the BAML High Yield Index (+1.1). Within the context of credit and equity markets rife with uncertainty, which nonetheless continue to climb, each of our strategies weathered the volatility admirably and provided downside protection in line with expectations. In markets such as these, we are truly able to exhibit the benefits of the non-correlated nature of our event-driven portfolios.
While the buoyancy in the markets indicates that investors have once again embraced the efforts of supportive central banks, our largest concern continues to be that this support is the result of
Annual Report | May 31, 2016
1
The Arbitrage Funds Shareholder Letter (continued)
deep worries of a deflationary trap and anemic growth. Central banks continue to subsidize risky assets while investors ignore underlying causes. We also find it curious that as recently as the first quarter of 2016, investors had begun to question the continued efficacy of zero and negative interest rate policies – the results of which may resurface again. While market participants and economists will continue to debate these issues, we will continue to seek investments that we believe to be more correlated to the outcomes of specific catalysts rather than to market direction. Across all our strategies, we have focused our portfolios on the investment opportunities that lay at the shorter end of the duration spectrum and at the more definitive end of the catalyst spectrum. We are also looking to maintain more balance in our credit opportunities and tactical equity portfolios by including both long and short alpha investments. This portfolio construction approach served us well in the second half of the fiscal year, and is a reflection of our expectations for continued bouts of volatility throughout 2016. We would be the first to admit that the current environment, with both equity and credit market indices hitting new highs, is perplexing. There is no precedent for what we are witnessing today, and as such, we'll remain cautious and opportunistic during the remainder of the year.
Sincerely,
The Investment Team Water Island Capital
The statements and opinions expressed are those of the author as of the date of this report. All information is historical and not indicative of future results and subject to change. This information is not a recommendation to buy or sell any security.
Definitions
S&P 500 Index: An index of US equities meant to reflect the risk/return characteristics of the large cap universe, and one of the most commonly used benchmarks for the overall US stock market.
BAML High Yield Index: A measure of the broad high yield market, commonly used as a benchmark for high yield corporate bonds.
G20 Meeting: A meeting of the G20, an international forum for the governments and central bank governors from 20 major economies. It was founded in 1999 with the aim of studying, reviewing, and promoting high-level discussion of policy issues pertaining to the promotion of international financial stability, and seeks to address issues that go beyond the responsibilities of any one organization.
Sharpe Ratio: A measure of risk-adjusted performance, calculated by subtracting the risk-free rate from the rate of return for a portfolio, and dividing the result by the standard deviation of the portfolio returns.
www.arbitragefunds.com | 1-800-295-4485
2
The Arbitrage Fund Manager Commentary
The Arbitrage Fund | Tickers: ARBFX, ARBNX, ARBCX, ARGAX
The Fund's Goal and Main Investments
Merger arbitrage is a sub-set of a broader event-driven investment strategy, which seeks to profit from investing in securities that are involved in corporate events such as mergers and acquisitions. Typically merger arbitrage is a low volatility strategy pursued by absolute-return-minded investors. At Water Island Capital, our goal is to capture a return stream with a low correlation to the overall markets.
Investment Strategy
The Fund seeks to achieve capital growth by engaging in merger arbitrage. The strategy's focus is to capture returns from corporate events, generate market neutral capital growth, preservation of capital, consistent and positive returns, and achieve low correlation, and low volatility. The Fund's general investment approach can be best described as risk averse, and many systems, policies, and procedures are in place to facilitate this low-risk approach. The Fund generally engages in active and frequent trading of portfolio securities to achieve its principal investment objective. In attempting to achieve its investment strategy, the Fund plans to invest at least 80% of its net assets in equity securities of companies (both U.S. and foreign) that are involved in publicly-announced mergers, takeovers, tender offers, leveraged buyouts, spin-offs, liquidations, and other corporate reorganizations. The Fund's investment adviser uses investment strategies designed to minimize market exposure, including short selling along with purchasing and selling options. The most common merger arbitrage activity, and the approach generally used by the Fund, involves purchasing the shares of an announced acquisition target company at a discount to their expected value upon the acquisition's completion. That difference, or "spread," is the primary driver of returns for this strategy. There is no limit to the number of stocks the Fund can hold; however, the Fund typically invests in 40 to 80 deals at any given time. Each deal will have one, or perhaps two, equity positions (a long and short position in a stock-for-stock deal) and, in many cases, associated derivative positions for hedging purposes.
Fiscal Year Highlights
The Arbitrage Fund (Class I shares: ARBNX) returned 1.16% for fiscal year 2016. Performance was equally driven by deals in the Americas and deals in the European region. Financials and consumer discretionary, each led by deals with competitive bidding scenarios, were the top performing sectors for the period. Conversely, the energy sector was the largest detractor due to the fallout from a terminated deal.
The Fund's top performing deal of the year was Exor's $6.4 billion acquisition of international multi-line reinsurer PartnerRe (PRE). PartnerRe had long favored a proposed deal with Axis Capital, despite multiple higher offers from Exor. When Exor bumped its bid one last time, offering its best and final proposal, a number of advisory services and a large PRE shareholder recommended that shareholders vote down the Axis deal. Investors heeded their advice, and PRE agreed to terms with Exor in August 2015. The deal closed successfully in March 2016, wrapping up this protracted bidding war.
The Fund's second highest contributor for the period was yet another topping bid situation. Anbang Insurance Group of China made an offer to acquire Starwood Hotels & Resorts Worldwide, disrupting Marriot International's bid for the company. Anbang bowed out at the end of Q1 2016, after Marriott raised its offer multiple times and agreed to a $14.9 billion deal with Starwood.
Annual Report | May 31, 2016
3
The Arbitrage Fund Manager Commentary (continued)
The Fund initiated a position in the deal early and profited nicely as the situation unfolded. We still hold the position in anticipation of a Q3 2016 close.
Competitive bidding scenarios are often the yin to a terminated transaction's yang, and just as the Fund's two best performing deals resulted from topping bids, the largest detractors for the period resulted from the only two broken deals the Fund experienced over the fiscal year: Pfizer's abandoned acquisition of Allergan, and the Williams Companies saga.
In June 2015, Williams Companies' roll-up of its master limited partnership (MLP) subsidiary, Williams Partners, was interrupted when Energy Transfer entered with a bid for the acquirer. Williams Companies rejected the Energy Transfer bid and subsequently entered into an official auction process. Energy Transfer participated in the auction process and eventually won out with its cash-and-stock bid; however, amidst the decline in oil prices from $60/barrel in June to $45/barrel at the end of September, what was once a deal valuing Williams at $64/share was now only worth $43.50/share. The Fund exited the position during the first quarter of 2016.
In November 2015, Pfizer entered into a definitive agreement to acquire fellow drugmaker Allergan (AGN), with the intention of redomiciling as an Irish company in order to realize significant corporate tax benefits (a strategy known as a tax inversion). The stock-for-stock transaction was worth $160 billion – the largest inversion on record. While the acquisition of AGN was clearly a high profile/high risk deal given the potential for US tax reform, the initial impression from the street was that any future actions by the U.S. Treasury Department (Treasury) would be unlikely to stop the deal. However, in April 2016 Treasury released new guidelines on inversions which would have eliminated the tax benefits Pfizer hoped to gain from the transaction. As a result, the two companies decided to abandon the merger.
www.arbitragefunds.com | 1-800-295-4485
4
The Arbitrage Fund Portfolio Information
Performance (annualized returns as of May 31, 2016)
| | One
Year | | Five
Year | | Ten
Year | | Since
Inception* | |
Arbitrage Fund, Class R | | | 0.87 | % | | | 1.65 | % | | | 2.88 | % | | | 4.25 | % | |
Arbitrage Fund, Class I | | | 1.16 | % | | | 1.89 | % | | | 3.12 | % | | | 3.08 | % | |
Arbitrage Fund, Class C** | | | 0.18 | % | | | N/A | | | | N/A | | | | 0.69 | % | |
Arbitrage Fund, Class A*** | | | 0.95 | % | | | N/A | | | | N/A | | | | 1.79 | % | |
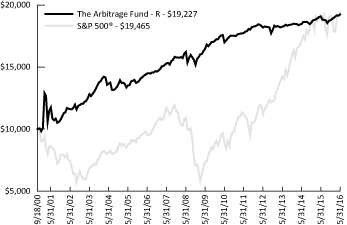
S&P 500® Index | | | 1.72 | % | | | 11.67 | % | | | 7.41 | % | | | 4.33 | % | |
HFRI Event Driven: Merger Arbitrage Index | | | 0.11 | % | | | 2.43 | % | | | 3.76 | % | | | 4.31 | % | |
Barclays Capital U.S. Aggregate Bond Index | | | 2.99 | % | | | 3.33 | % | | | 4.97 | % | | | 5.28 | % | |
Current performance may be higher or lower than performance quoted above. Any performance data quoted represents past performance and the investment return and principal value of an investment in the Fund will fluctuate so that an investor's shares, when redeemed, may be worth more or less than their original cost. Past performance is no guarantee of future results. Returns do not reflect a 2% redemption fee for shares that are redeemed from the fund within 30 days of purchase, which, if reflected, would reduce the performance quoted. Returns shown above include the reinvestment of all dividends and capital gains. You can obtain performance data current to the most recent month end by calling 1-800-295-4485 or going to www.arbitragefunds.com.
* Class R inception: 9/18/00; Class I inception: 10/17/03; Class C inception: 6/1/12; Class A inception: 6/1/13.
** Class C shares are subject to a 1.00% contingent deferred sales charge on all purchases redeemed in 12 months of purchase.
*** Class A shares are subject to a maximum front-end sales load of 2.50% on purchases up to $250,000. The shares are also subject to a deferred sales charge of up to 0.50% on purchases of $250,000 or more purchased without a front-end sales load and redeemed within 12 months of purchase.
The Total Annual Fund Operating Expenses for Class R, Class I, Class C and Class A are 2.31%, 2.06%, 3.06% and 2.31%, respectively. These expense ratios are as stated in the current prospectus and may differ from the expense ratios disclosed in the financial highlights in this report.
The S&P 500® Index is an unmanaged index consisting of 500 stocks.
The HFRI Event Driven: Merger Arbitrage Index is an index consisting of merger arbitrage strategies which employ an investment process primarily focused on opportunities in equity and equity related instruments of companies which are currently engaged in a corporate transaction. Merger Arbitrage involves primarily announced transactions, typically with limited or no exposure to situations which pre-, post-date or situations in which no formal announcement is expected to occur. Opportunities are frequently presented in cross border, collared and international transactions which incorporate multiple geographic regulatory institutions, with typically involve minimal exposure to corporate credits.
The Barclays Capital U.S. Aggregate Bond Index is a market value-weighted index of investment grade fixed-rated debt issues, including government, corporate, asset-backed and mortgage-backed securities with a maturity of one year or more.
An investor may not invest directly in an index.
Annual Report | May 31, 2016
5
The Arbitrage Fund Portfolio Information (continued)
Growth of $10,000 Investment
The chart represents historical performance of a hypothetical investment of $10,000 in the Class R shares of the Fund since inception. Past performance does not guarantee future results. This chart does not reflect the deduction of taxes that a shareholder would pay on Fund distributions or the redemption of Fund shares.
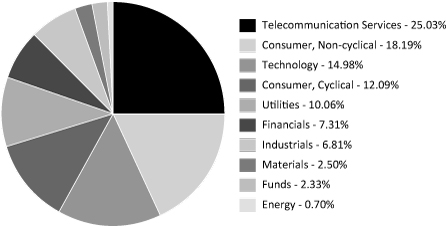
Sector Weighting
The following chart shows the sector weightings of The Arbitrage Fund's investments in common stock as of the report date.

www.arbitragefunds.com | 1-800-295-4485
6
The Arbitrage Fund Portfolio of Investments
| | | Shares | | Value | |
COMMON STOCKS - 70.16% | |
Banks - 1.82% | |
FirstMerit Corp.(a) | | | 1,499,765 | | | $ | 34,014,670 | | |
Beverages - 2.63% | |
SABMiller Plc | | | 788,698 | | | | 49,056,524 | | |
Biotechnology - 0.49% | |
Celator Pharmaceuticals, Inc.(b)(c) | | | 305,347 | | | | 9,184,838 | | |
Chemicals - 2.69% | |
Syngenta AG, ADR | | | 186,833 | | | | 14,739,255 | | |
Valspar Corp.(a)(b) | | | 328,452 | | | | 35,577,921 | | |
| | | | 50,317,176 | | |
Commercial Services - 2.91% | |
Electro Rent Corp. | | | 193,600 | | | | 2,536,160 | | |
ExamWorks Group, Inc.(c) | | | 369,020 | | | | 12,882,488 | | |
USG People N.V.(c) | | | 2,006,429 | | | | 39,000,968 | | |
| | | | 54,419,616 | | |
Computers & Computer Services - 0.38% | |
Brocade Communications Systems, Inc. | | | 784,617 | | | | 7,108,630 | | |
Construction Materials - 0.13% | |
Italcementi SpA(c) | | | 200,000 | | | | 2,332,115 | | |
Electric - 7.34% | |
Empire District Electric Co. | | | 116,061 | | | | 3,888,044 | | |
ITC Holdings Corp.(a) | | | 1,234,522 | | | | 54,960,919 | | |
NextEra Energy, Inc. | | | 58,205 | | | | 6,991,585 | | |
TECO Energy, Inc. | | | 2,322,771 | | | | 63,969,113 | | |
Westar Energy, Inc. | | | 130,987 | | | | 7,378,498 | | |
| | | | 137,188,159 | | |
Electrical Components & Equipment - 0.35% | |
Saft Groupe SA | | | 158,243 | | | | 6,452,933 | | |
Electronics - 1.90% | |
FEI Co. | | | 154,358 | | | | 16,585,767 | | |
Rofin-Sinar Technologies, Inc.(b)(c) | | | 302,462 | | | | 9,663,661 | | |
Tyco International Plc | | | 218,579 | | | | 9,315,837 | | |
| | | | 35,565,265 | | |
See Notes to Financial Statements.
Annual Report | May 31, 2016
7
The Arbitrage Fund Portfolio of Investments (continued)
| | | Shares | | Value | |
COMMON STOCKS - 70.16% (Continued) | |
Entertainment - 0.75% | |
DreamWorks Animation SKG, Inc., Class A(c) | | | 349,666 | | | $ | 14,070,560 | | |
Environmental Control - 1.60% | |
Progressive Waste Solutions Ltd.(a)(d) | | | 948,690 | | | | 29,906,314 | | |
Gas - 8.70% | |
AGL Resources, Inc.(a) | | | 913,411 | | | | 60,102,444 | | |
Piedmont Natural Gas Co., Inc.(a) | | | 613,668 | | | | 36,856,900 | | |
Questar Corp.(a) | | | 2,604,018 | | | | 65,647,294 | | |
| | | | 162,606,638 | | |
Healthcare - Products - 1.32% | |
Affymetrix, Inc.(c)(d)(e) | | | 679,125 | | | | 9,507,750 | | |
St Jude Medical, Inc. | | | 192,521 | | | | 15,085,945 | | |
| | | | 24,593,695 | | |
Home Furnishings - 1.44% | |
TiVo, Inc.(c) | | | 2,696,773 | | | | 26,832,891 | | |
Household Products/Wares - 1.26% | |
Tumi Holdings, Inc.(c) | | | 874,402 | | | | 23,460,206 | | |
Internet - 1.05% | |
Marketo, Inc.(c) | | | 394,336 | | | | 13,892,457 | | |
Textura Corp.(c) | | | 216,044 | | | | 5,617,144 | | |
| | | | 19,509,601 | | |
Leisure Time - 0.06% | |
Kuoni Reisen Holding AG(c) | | | 3,226 | | | | 1,195,957 | | |
Lodging - 4.67% | |
Interval Leisure Group, Inc. | | | 609,075 | | | | 8,746,317 | | |
Starwood Hotels & Resorts Worldwide, Inc.(a) | | | 1,069,823 | | | | 78,557,103 | | |
| | | | 87,303,420 | | |
Media - 7.21% | |
Cablevision Systems Corp., Class A(a) | | | 1,578,517 | | | | 54,742,970 | | |
Charter Communications, Inc., Class A(b)(c) | | | 287,328 | | | | 62,907,592 | | |
Media General, Inc.(c) | | | 951,044 | | | | 16,966,625 | | |
| | | | 134,617,187 | | |
See Notes to Financial Statements.
www.arbitragefunds.com | 1-800-295-4485
8
The Arbitrage Fund Portfolio of Investments (continued)
| | | Shares | | Value | |
COMMON STOCKS - 70.16% (Continued) | |
Mining - 0.25% | |
Kaminak Gold Corp., Class A(c) | | | 2,563,000 | | | $ | 4,671,194 | | |
Packaging & Containers - 1.65% | |
Rexam Plc | | | 3,391,111 | | | | 30,868,869 | | |
Pharmaceuticals - 6.03% | |
Allergan Plc(c) | | | 62,000 | | | | 14,616,500 | | |
Anacor Pharmaceuticals, Inc.(b)(c) | | | 141,348 | | | | 14,035,856 | | |
Baxalta, Inc.(a) | | | 1,612,408 | | | | 72,929,214 | | |
Shire Plc, ADR | | | 20,200 | | | | 3,760,432 | | |
XenoPort, Inc.(c) | | | 1,041,063 | | | | 7,381,137 | | |
| | | | 112,723,139 | | |
Pipelines - 3.71% | |
Columbia Pipeline Group, Inc.(a)(b) | | | 1,166,559 | | | | 29,793,917 | | |
TransCanada Corp. | | | 960,000 | | | | 39,524,459 | | |
| | | | 69,318,376 | | |
Real Estate Investment Trusts - 0.54% | |
Hatteras Financial Corp. | | | 337,004 | | | | 5,422,394 | | |
Rouse Properties, Inc. | | | 257,454 | | | | 4,698,537 | | |
| | | | 10,120,931 | | |
Retail - 0.30% | |
Krispy Kreme Doughnuts, Inc.(b)(c) | | | 262,227 | | | | 5,606,413 | | |
Savings & Loans - 0.97% | |
Astoria Financial Corp. | | | 737,465 | | | | 11,784,691 | | |
First Niagara Financial Group, Inc. | | | 579,047 | | | | 6,323,193 | | |
| | | | 18,107,884 | | |
Semiconductors - 2.13% | |
Fairchild Semiconductor International, Inc.(c) | | | 247,800 | | | | 4,923,786 | | |
KLA-Tencor Corp.(a) | | | 479,164 | | | | 34,945,430 | | |
| | | | 39,869,216 | | |
Software - 5.63% | |
Cegid Group SA | | | 72,147 | | | | 4,956,943 | | |
Cvent, Inc.(b)(c) | | | 1,647,651 | | | | 59,002,382 | | |
inContact, Inc.(c) | | | 479,017 | | | | 6,648,756 | | |
OPOWER, Inc.(c) | | | 1,014,538 | | | | 10,439,596 | | |
SciQuest, Inc.(c) | | | 520,000 | | | | 9,172,800 | | |
See Notes to Financial Statements.
Annual Report | May 31, 2016
9
The Arbitrage Fund Portfolio of Investments (continued)
| | | Shares | | Value | |
COMMON STOCKS - 70.16% (Continued) | |
Software - 5.63% (Continued) | |
Xura, Inc.(c) | | | 602,928 | | | $ | 14,964,673 | | |
| | | | 105,185,150 | | |
Telecommunications - 0.25% | |
Alliance Fiber Optic Products, Inc.(c) | | | 250,000 | | | | 4,630,000 | | |
TOTAL COMMON STOCKS
(Cost $1,263,142,049) | | | 1,310,837,567 | | |
RIGHTS - 0.51% | |
ArthroCare Corp. CVR, No expiration(c)(d)(e) | | | 2,685,721 | | | | 1,130,420 | | |
Casa Ley CVR, Expires 01/30/2018(c)(d)(e) | | | 6,223,326 | | | | 2,475,639 | | |
Chelsea Therapeutics CVR, Expires 03/31/2018(c)(d)(e) | | | 2,389,273 | | | | 137,861 | | |
Cubist Pharmaceuticals, Inc. CPR, Expires 07/01/2019(c)(d)(e) | | | 119,343 | | | | — | | |
Leap Wireless International CVR, Expires 03/13/2017(c)(e) | | | 1,783,190 | | | | 5,617,049 | | |
PDC CVR, Expires 12/31/2016(c)(d)(e) | | | 6,223,326 | | | | 143,759 | | |
Trius Therapeutics CVR, Expires 02/15/2017(c)(d)(e) | | | 1,034,403 | | | | 96,717 | | |
TOTAL RIGHTS
(Cost $12,160,385) | | | 9,601,445 | | |
Expiration
Date | | Exercise
Price | | Contracts | | Value | |
PURCHASED OPTIONS(c) - 0.15% | |
Call Options Purchased - 0.03% | |
Anacor Pharmaceuticals, Inc.: | |
| 08/2016 | | $ | 105.00 | | | | 1,332 | | | $ | 39,960 | | |
| 08/2016 | | | 110.00 | | | | 2,384 | | | | 41,720 | | |
Great Plains Energy, Inc.: | |
| | | 09/2016 | | | 30.00 | | | | 258 | | | | 22,575 | | |
| | | 12/2016 | | | 30.00 | | | | 193 | | | | 24,125 | | |
Huntington Bancshares, Inc. | | 07/2016 | | | 12.00 | | | | 24,349 | | | | 73,047 | | |
Krispy Kreme Doughnuts, Inc. | | 08/2016 | | | 22.00 | | | | 99 | | | | 1,485 | | |
Mylan N.V. | | 07/2016 | | | 50.00 | | | | 111 | | | | 3,108 | | |
Rovi Corp. | | 07/2016 | | | 17.50 | | | | 2,350 | | | | 217,375 | | |
Waste Connections, Inc. | | 06/2016 | | | 75.00 | | | | 691 | | | | 107,105 | | |
Xura, Inc. | | 07/2016 | | | 25.00 | | | | 512 | | | | 10,240 | | |
TOTAL CALL OPTIONS PURCHASED
(Cost $764,041) | | | 540,740 | | |
See Notes to Financial Statements.
www.arbitragefunds.com | 1-800-295-4485
10
The Arbitrage Fund Portfolio of Investments (continued)
| | | Expiration
Date | | Exercise
Price | | Contracts | | Value | |
PURCHASED OPTIONS(c) - 0.15% (Continued) | |
Put Options Purchased - 0.12% | |
Anacor Pharmaceuticals, Inc.: | |
| | | 08/2016 | | $ | 85.00 | | | | 1,148 | | | $ | 40,180 | | |
| | | 08/2016 | | | 90.00 | | | | 958 | | | | 45,505 | | |
Celator Pharmaceuticals, Inc.: | |
| | | 07/2016 | | | 24.00 | | | | 233 | | | | 1,747 | | |
| | | 10/2016 | | | 19.00 | | | | 218 | | | | 2,725 | | |
| | | 10/2016 | | | 20.00 | | | | 16 | | | | 200 | | |
| | | 10/2016 | | | 21.00 | | | | 115 | | | | 1,438 | | |
Charter Communications, Inc.,
Class A | | 06/2016 | | | 250.00 | | | | 344 | | | | 1,800,840 | | |
Columbia Pipeline Group, Inc. | | 10/2016 | | | 22.50 | | | | 4,512 | | | | 22,560 | | |
Cvent, Inc. | | 10/2016 | | | 30.00 | | | | 76 | | | | 1,520 | | |
Rofin-Sinar Technologies, Inc.: | |
| | | 09/2016 | | | 25.00 | | | | 761 | | | | 15,220 | | |
| | | 09/2016 | | | 30.00 | | | | 791 | | | | 61,302 | | |
Rovi Corp. | | 07/2016 | | | 15.00 | | | | 4,010 | | | | 230,575 | | |
TOTAL PUT OPTIONS PURCHASED
(Cost $2,271,043) | | | 2,223,812 | | |
TOTAL PURCHASED OPTIONS
(Cost $3,035,084) | | | 2,764,552 | | |
| | | Yield | | Shares | | Value | |
SHORT-TERM INVESTMENTS - 33.91% | |
Money Market Fund | |
State Street Institutional Liquid Reserves
Fund | | | 0.455 | %(f) | | | 633,462,131 | | | $ | 633,462,131 | | |
TOTAL SHORT-TERM INVESTMENTS
(Cost $633,462,131) | | | 633,462,131 | | |
Total Investments - 104.73%
(Cost $1,911,799,649) | | | 1,956,665,695 | | |
Liabilities in Excess of Other Assets - (4.73)%(g) | | | (88,316,684 | ) | |
NET ASSETS - 100.00% | | $ | 1,868,349,011 | | |
See Notes to Financial Statements.
Annual Report | May 31, 2016
11
The Arbitrage Fund Portfolio of Investments (continued)
Portfolio Footnotes
(a) Security, or a portion of security, is being held as collateral for short sales or written option contracts. At May 31, 2016, the aggregate market value of those securities was $234,167,000, representing 12.53% of net assets.
(b) Underlying security for a written/purchased call/put option.
(c) Non-income-producing security.
(d) Security fair valued using methods determined in good faith by the Pricing Committee. As of May 31, 2016, the total market value of these securities was $43,398,460, representing 2.32% of net assets.
(e) Security considered illiquid. On May 31, 2016, the total market value of these securities was $19,109,195, representing 1.02% of net assets.
(f) Rate shown is the 7-day effective yield as of May 31, 2016.
(g) Includes cash which is being held as collateral for short sales and written option contracts.
Securities are determined to be illiquid under the procedures approved by the Funds' Board of Trustees. Information related to the Fund's illiquid securities as of May 31, 2016 is as follows:
Date of
Purchase | | Security | | Cost | | Value | | % of Net Assets | |
01/01/2016 | | Affymetrix, Inc. | | $ | 9,338,481 | | | $ | 9,507,750 | | | | 0.51 | % | |
05/30/2014 | | ArthroCare Corp. CVR | | | 940,003 | | | | 1,130,420 | | | | 0.05 | | |
01/30/2015 | | Casa Ley CVR | | | 6,316,054 | | | | 2,475,639 | | | | 0.13 | | |
06/24/2014 | | Chelsea Therapeutics CVR | | | — | | | | 137,861 | | | | 0.01 | | |
12/12/2011 | | Cubist Pharmaceuticals, Inc. CPR | | | — | | | | — | | | | 0.00 | | |
03/14/2014 | | Leap Wireless International CVR | | | 4,600,630 | | | | 5,617,049 | | | | 0.30 | | |
01/30/2015 | | PDC CVR | | | 303,698 | | | | 143,759 | | | | 0.01 | | |
09/12/2013 | | Trius Therapeutics CVR | | | — | | | | 96,717 | | | | 0.01 | | |
| | | | | | | $ | 19,109,195 | | | | 1.02 | % | |
See Notes to Financial Statements.
www.arbitragefunds.com | 1-800-295-4485
12
The Arbitrage Fund Portfolio of Investments (continued)
SCHEDULE OF SECURITIES SOLD SHORT | | Shares | | Value | |
COMMON STOCKS - (22.05%) | |
Auto Parts & Equipment - (0.59%) | |
Johnson Controls, Inc. | | | (251,177 | ) | | $ | (11,089,464 | ) | |
Banks - (1.71%) | |
Huntington Bancshares, Inc. | | | (2,577,139 | ) | | | (26,931,102 | ) | |
KeyCorp | | | (393,751 | ) | | | (5,047,888 | ) | |
| | | | (31,978,990 | ) | |
Chemicals - (0.01%) | |
Valspar Corp. | | | (1,400 | ) | | | (151,648 | ) | |
Computers & Computer Services - (0.38%) | |
Brocade Communications Systems, Inc. | | | (784,617 | ) | | | (7,108,630 | ) | |
Electric - (1.97%) | |
Fortis, Inc. | | | (925,025 | ) | | | (28,935,468 | ) | |
Great Plains Energy, Inc. | | | (364 | ) | | | (10,622 | ) | |
Hawaiian Electric Industries, Inc. | | | (241,215 | ) | | | (7,919,088 | ) | |
| | | | (36,865,178 | ) | |
Environmental Control - (1.60%) | |
Waste Connections, Inc. | | | (456,716 | ) | | | (29,901,196 | ) | |
Healthcare - Products - (0.36%) | |
Abbott Laboratories | | | (167,654 | ) | | | (6,644,128 | ) | |
Lodging - (3.57%) | |
Interval Leisure Group, Inc. | | | (608,971 | ) | | | (8,744,824 | ) | |
Marriott International, Inc., Class A | | | (809,225 | ) | | | (53,441,219 | ) | |
Starwood Hotels & Resorts Worldwide, Inc. | | | (62,000 | ) | | | (4,552,660 | ) | |
| | | | (66,738,703 | ) | |
Media - (3.34%) | |
Charter Communications, Inc., Class A | | | (256,229 | ) | | | (56,098,777 | ) | |
Nexstar Broadcasting Group, Inc., Class A | | | (118,993 | ) | | | (6,332,808 | ) | |
| | | | (62,431,585 | ) | |
Mining - (0.25%) | |
Goldcorp, Inc. | | | (278,436 | ) | | | (4,681,827 | ) | |
Packaging & Containers - (0.60%) | |
Ball Corp. | | | (154,893 | ) | | | (11,198,764 | ) | |
See Notes to Financial Statements.
Annual Report | May 31, 2016
13
The Arbitrage Fund Portfolio of Investments (continued)
SCHEDULE OF SECURITIES SOLD SHORT | | Shares | | Value | |
COMMON STOCKS - (22.05%) (Continued) | |
Pharmaceuticals - (3.53%) | |
Allergan Plc | | | (62,000 | ) | | $ | (14,616,500 | ) | |
Baxalta, Inc. | | | (170,000 | ) | | | (7,689,100 | ) | |
Shire Plc, ADR | | | (234,051 | ) | | | (43,570,934 | ) | |
| | | | (65,876,534 | ) | |
Pipelines - (2.13%) | |
TransCanada Corp. | | | (960,000 | ) | | | (39,780,684 | ) | |
Real Estate Investment Trusts - (0.19%) | |
Annaly Capital Management, Inc. | | | (333,377 | ) | | | (3,527,129 | ) | |
Retail - (0.08%) | |
Rite Aid Corp. | | | (195,400 | ) | | | (1,504,580 | ) | |
Savings & Loans - (0.62%) | |
New York Community Bancorp, Inc. | | | (737,322 | ) | | | (11,605,448 | ) | |
Semiconductors - (1.12%) | |
Lam Research Corp. | | | (239,582 | ) | | | (19,839,785 | ) | |
Rovi Corp. | | | (60,855 | ) | | | (1,022,973 | ) | |
| | | | (20,862,758 | ) | |
TOTAL COMMON STOCKS
(Proceeds $396,672,194) | | | (411,947,246 | ) | |
RIGHTS - (0.00%)(a) | |
Chelsea Therapeutics CVR, Expires 03/31/2018 | | | (1,100 | ) | | | (65 | ) | |
TOTAL RIGHTS
(Proceeds $(1)) | | | (65 | ) | |
TOTAL SECURITIES SOLD SHORT
(Proceeds $396,672,195) | | $ | (411,947,311 | ) | |
(a) Less than 0.005% of net assets.
See Notes to Financial Statements.
www.arbitragefunds.com | 1-800-295-4485
14
The Arbitrage Fund Portfolio of Investments (continued)
WRITTEN OPTIONS | | Expiration
Date | | Exercise
Price | | Contracts | | Value | |
Written Call Options | |
Charter Communications, Inc.,
Class A | | 06/2016 | | $ | 250.00 | | | | (344 | ) | | $ | (75,680 | ) | |
Krispy Kreme Doughnuts, Inc. | | 08/2016 | | | 21.00 | | | | (392 | ) | | | (19,600 | ) | |
Microchip Technology, Inc. | | 08/2016 | | | 9.00 | | | | (60 | ) | | | (750 | ) | |
Valspar Corp. | | 07/2016 | | | 105.00 | | | | (490 | ) | | | (127,400 | ) | |
TOTAL WRITTEN CALL OPTIONS
(Premiums received $171,350) | | | (223,430 | ) | |
Written Put Options | |
Anacor Pharmaceuticals, Inc. | | 06/2016 | | | 95.00 | | | | (217 | ) | | | (2,713 | ) | |
Krispy Kreme Doughnuts, Inc. | | 06/2016 | | | 21.00 | | | | (392 | ) | | | (980 | ) | |
Rovi Corp.: | |
| | | 06/2016 | | | 15.00 | | | | (883 | ) | | | (17,660 | ) | |
| | | 07/2016 | | | 15.00 | | | | (52 | ) | | | (2,990 | ) | |
TOTAL WRITTEN PUT OPTIONS
(Premiums received $82,843) | | | (24,343 | ) | |
TOTAL WRITTEN OPTIONS
(Premiums received $254,193) | | $ | (247,773 | ) | |
OUTSTANDING FORWARD FOREIGN CURRENCY EXCHANGE CONTRACTS
Contract
Description | | Counterparty | | Contracts to
Deliver/Receive | | Purchase/Sale
Contract | | Expiration
Date | | Current Value | | Unrealized
Appreciation | |
AUD | | | | Goldman Sachs | | | 8,950,200 | | | Sale | | 06/15/2016 | | $ | 6,465,584 | | | $ | 179,800 | | |
CAD | | | | Goldman Sachs | | | 5,642,100 | | | Sale | | 06/15/2016 | | | 4,302,389 | | | | 49,760 | | |
CHF | | | | Goldman Sachs | | | 53,088,100 | | | Sale | | 06/15/2016 | | | 53,438,741 | | | | 1,497,161 | | |
EUR | | | | Goldman Sachs | | | 156,772,898 | | | Sale | | 06/15/2016 | | | 174,508,995 | | | | 1,839,655 | | |
GBP | | | | Goldman Sachs | | | 400,000 | | | Purchase | | 06/15/2016 | | | 579,385 | | | | 1,443 | | |
GBP | | | | Goldman Sachs | | | 3,101,100 | | | Sale | | 06/15/2016 | | | 4,491,823 | | | | 28,830 | | |
| | | $ | 3,596,649 | | |
Contract
Description | | Counterparty | | Contracts to
Deliver/Receive | | Purchase/Sale
Contract | | Expiration
Date | | Current Value | | Unrealized
Depreciation | |
AUD | Gol | dman Sachs | | 8,950,200 | | Purchase | | 06/15/2016 | | $6,465,584 | | $(386,896) | |
CAD | Gol | dman Sachs | | 49,150,300 | | Purchase | | 06/15/2016 | | 37,479,619 | | (400,068) | |
CAD | Gol | dman Sachs | | 43,312,600 | | Sale | | 06/15/2016 | | 33,028,073 | | (524,277) | |
CHF | Gol | dman Sachs | | 52,661,000 | | Purchase | | 06/15/2016 | | 53,008,819 | | (299,128) | |
EUR | Gol | dman Sachs | | 112,748,600 | | Purchase | | 06/15/2016 | | 125,504,121 | | (770,617) | |
EUR | Gol | dman Sachs | | 1,411,800 | | Sale | | 06/15/2016 | | 1,571,520 | | (553) | |
GBP | Gol | dman Sachs | | 45,298,600 | | Sale | | 06/15/2016 | | 65,613,266 | | (801,958) | |
| | | $ | (3,183,497 | ) | |
See Notes to Financial Statements.
Annual Report | May 31, 2016
15
The Arbitrage Fund Portfolio of Investments (continued)
The following is a summary of investments classified by country exposure:
Country | | % of Net Assets(a) | |
United Kingdom | | | 4.28 | % | |
Canada | | | 3.97 | % | |
Netherlands | | | 2.09 | % | |
Switzerland | | | 0.85 | % | |
France | | | 0.61 | % | |
Italy | | | 0.13 | % | |
United States | | | 92.80 | % | |
Liabilities in Excess of Other Assets | | | (4.73 | )% | |
| | | | 100.00 | % | |
(a) These percentages represent long positions only and are not net of short positions.
Abbreviations:
ADR - American Depositary Receipt
AG - Aktiengesellschaft is a German term that refers to a corporation that is limited by shares, i.e., owned by shareholders.
AUD - Australian dollar
CAD - Canadian dollar
CHF - Swiss franc
CPR - Conditional Prepayment Rate
CVR - Contingent Value Rights
EUR - Euro
GBP - British pound
Ltd. - Limited
N.V. - Naamloze Vennootschap is the Dutch term for a public limited liability corporation.
Plc - Public Limited Company
SA - Generally designates corporations in various countries, mostly those employing civil law. This translates literally in all languages mentioned as anonymous company.
SpA - Societa per Azione
See Notes to Financial Statements.
www.arbitragefunds.com | 1-800-295-4485
16
The Arbitrage Fund Portfolio of Investments (continued)
The following table summarizes The Arbitrage Fund's investments and derivative financial instruments categorized in the disclosure hierarchy as of May 31, 2016:
Investments in Securities at Value* | | Level 1 | | Level 2 | | Level 3 | | Total | |
Assets | |
Common Stocks | |
Banks | | $ | 34,014,670 | | | $ | — | | | $ | — | | | $ | 34,014,670 | | |
Beverages | | | 49,056,524 | | | | — | | | | — | | | | 49,056,524 | | |
Biotechnology | | | 9,184,838 | | | | — | | | | — | | | | 9,184,838 | | |
Chemicals | | | 50,317,176 | | | | — | | | | — | | | | 50,317,176 | | |
Commercial Services | | | 54,419,616 | | | | — | | | | — | | | | 54,419,616 | | |
Computers & Computer
Services | | | 7,108,630 | | | | — | | | | — | | | | 7,108,630 | | |
Construction Materials | | | 2,332,115 | | | | — | | | | — | | | | 2,332,115 | | |
Electric | | | 137,188,159 | | | | — | | | | — | | | | 137,188,159 | | |
Electrical Components &
Equipment | | | 6,452,933 | | | | — | | | | — | | | | 6,452,933 | | |
Electronics | | | 35,565,265 | | | | — | | | | — | | | | 35,565,265 | | |
Entertainment | | | 14,070,560 | | | | — | | | | — | | | | 14,070,560 | | |
Environmental Control | | | — | | | | 29,906,314 | | | | — | | | | 29,906,314 | | |
Gas | | | 162,606,638 | | | | — | | | | — | | | | 162,606,638 | | |
Healthcare – Products | | | 15,085,945 | | | | 9,507,750 | | | | — | | | | 24,593,695 | | |
Home Furnishings | | | 26,832,891 | | | | — | | | | — | | | | 26,832,891 | | |
Household Products/Wares | | | 23,460,206 | | | | — | | | | — | | | | 23,460,206 | | |
Internet | | | 19,509,601 | | | | — | | | | — | | | | 19,509,601 | | |
Leisure Time | | | 1,195,957 | | | | — | | | | — | | | | 1,195,957 | | |
Lodging | | | 87,303,420 | | | | — | | | | — | | | | 87,303,420 | | |
Media | | | 134,617,187 | | | | — | | | | — | | | | 134,617,187 | | |
Mining | | | 4,671,194 | | | | — | | | | — | | | | 4,671,194 | | |
Packaging & Containers | | | 30,868,869 | | | | — | | | | — | | | | 30,868,869 | | |
Pharmaceuticals | | | 112,723,139 | | | | — | | | | — | | | | 112,723,139 | | |
Pipelines | | | 69,318,376 | | | | — | | | | — | | | | 69,318,376 | | |
Real Estate Investment Trusts | | | 10,120,931 | | | | — | | | | — | | | | 10,120,931 | | |
Retail | | | 5,606,413 | | | | — | | | | — | | | | 5,606,413 | | |
Savings & Loans | | | 18,107,884 | | | | — | | | | — | | | | 18,107,884 | | |
Semiconductors | | | 39,869,216 | | | | — | | | | — | | | | 39,869,216 | | |
Software | | | 105,185,150 | | | | — | | | | — | | | | 105,185,150 | | |
Telecommunications | | | 4,630,000 | | | | — | | | | — | | | | 4,630,000 | | |
Rights | | | — | | | | 6,747,469 | | | | 2,853,976 | | | | 9,601,445 | | |
Purchased Options | | | 2,764,552 | | | | — | | | | — | | | | 2,764,552 | | |
Short-Term Investments | | | 633,462,131 | | | | — | | | | — | | | | 633,462,131 | | |
TOTAL | | $ | 1,907,650,186 | | | $ | 46,161,533 | | | $ | 2,853,976 | | | $ | 1,956,665,695 | | |
* Refer to footnote 2 where leveling hierarchy is defined.
See Notes to Financial Statements.
Annual Report | May 31, 2016
17
The Arbitrage Fund Portfolio of Investments (continued)
Other Financial Instruments*** | | Level 1 | | Level 2 | | Level 3 | | Total | |
Assets | |
Forward Foreign Currency
Exchange Contracts | | $ | — | | | $ | 3,596,649 | | | $ | — | | | $ | 3,596,649 | | |
Liabilities | |
Common Stocks** | | | (411,947,246 | ) | | | — | | | | — | | | | (411,947,246 | ) | |
Rights | | | — | | | | — | | | | (65 | ) | | | (65 | ) | |
Written Options | | | (247,773 | ) | | | — | | | | — | | | | (247,773 | ) | |
Forward Foreign Currency
Exchange Contracts | | | — | | | | (3,183,497 | ) | | | — | | | | (3,183,497 | ) | |
TOTAL | | $ | (412,195,019 | ) | | $ | 413,152 | | | $ | (65 | ) | | $ | (411,781,932 | ) | |
** Refer to Portfolio of Investments for sector information.
*** Other financial instruments are instruments such as written options, securities sold short, equity swaps and forward foreign currency exchange contracts.
The following is a reconciliation of the fair valuations using significant unobservable inputs (Level 3) for the Fund's assets and liabilities during the year ended May 31, 2016:
Investments
in Securities | | Balance as of
May 31, 2015 | | Realized
Gain/(Loss) | | Change in
Unrealized
Appreciation/
(Depreciation) | | Purchases | | Sales
Proceeds | | Transfers
into
Level 3 | | Transfers
out of
Level 3 | | Balance as of
May 31, 2016 | | Net change in
Unrealized
Appreciation/
(Depreciation)
included in the
Statement of
Operations
attributable to
Level 3
investments
held at
May 31, 2016 | |
Rights | | $ | 10,711,137 | | | $ | – | | | $ | 93,748 | | | $ | – | | | $ | – | | | $ | – | | | $ | (7,950,909 | ) | | $ | 2,853,976 | | | $ | 93,748 | | |
Total | | $ | 10,711,137 | | | $ | – | | | $ | 93,748 | | | $ | – | | | $ | – | | | $ | – | | | $ | (7,950,909 | ) | | $ | 2,853,976 | | | $ | 93,748 | | |
Other
Financial
Instruments | | Balance as of
May 31, 2015 | | Realized
Gain/(Loss) | | Change in
Unrealized
Appreciation/
(Depreciation) | | Purchases | | Sales
Proceeds | | Transfers
into
Level 3 | | Transfers
out of
Level 3 | | Balance as of
May 31, 2016 | | Net change in
Unrealized
Appreciation/
(Depreciation)
included in the
Statement of
Operations
attributable to
Level 3
investments
held at
May 31, 2016 | |
Rights | | $ | (90 | ) | | $ | – | | | $ | 25 | | | $ | – | | | $ | – | | | $ | – | | | $ | – | | | $ | (65 | ) | | $ | 25 | | |
Total | | $ | (90 | ) | | $ | – | | | $ | 25 | | | $ | – | | | $ | – | | | $ | – | | | $ | – | | | $ | (65 | ) | | $ | 25 | | |
See Notes to Financial Statements.
www.arbitragefunds.com | 1-800-295-4485
18
The Arbitrage Event-Driven Fund Manager Commentary
The Arbitrage Event-Driven Fund | Tickers: AEDFX, AEDNX, AEFCX, AGEAX
The Fund's Goal and Main Investments
The Fund seeks to provide capital growth by investing in credit and equity securities involved in specific corporate events, with a focus on low volatility and low correlation relative to the broader capital markets.
Investment Strategy
The Fund's investment process follows a disciplined, fundamental approach that values downside protection while identifying compelling risk/reward opportunities available to us as we screen catalyst-driven corporate events, such as mergers and acquisitions, restructurings, refinancings, recapitalizations, spin-offs, litigation, regulatory changes, and bankruptcy. We analyze these events through three core approaches: merger arbitrage, equity special situations, and credit opportunities. We seek to generate investment returns that have low volatility and low correlation compared to the broader capital markets. We do not manage against any particular benchmark, and believe that capital preservation in difficult markets is as important as generating positive returns within our low correlated, low volatility event-driven strategy. This process and approach has been an integral part of the culture at Water Island Capital since the firm's inception.
Fiscal Year Highlights
The Arbitrage Event-Driven Fund (Class I shares: AEDNX) returned -5.27% for fiscal year 2016. The merger arbitrage sleeve of the fund contributed to returns overall, while the equity special situations and credit opportunities sleeves were detractors. While the Fund experienced losses primarily in the Americas, the European region was a contributor overall. The Fund's top-performing sector was consumer discretionary. Conversely, the energy sector detracted the most from returns, which was impacted by both a terminated transaction in the merger arbitrage sleeve as well as a number of equity special situations investments that experienced deteriorating fundamentals amidst last year's severe decline in oil prices.
The Fund's top performing investment for the year was our equity special situations position in Media General (MEG). Our involvement in MEG began when the company completed its acquisition of LIN Media in December 2014. We continued to own the stock as we believed MEG could benefit from the synergies resulting from the LIN acquisition. However, after earnings misses over the course of the year, and following their announcement in August 2015 that they would pursue an acquisition of Meredith (a move viewed unfavorably by their shareholders) MEG's stock price plummeted. We held onto the position on the belief that the decrease in share price would either lead to shareholder activism or an acquisition offer. In September 2015, our thesis was confirmed as Nexstar made an offer for MEG contingent on them abandoning their Meredith acquisition. The Fund profited from this position as Nexstar made increasingly larger bids during Q4 2015 in an effort to lock down a definitive agreement (which it did in January 2016).
The next highest contributor for the Fund was Charter Communications' deal to purchase rival Time Warner Cable for $87.4 billion. In May 2015, Charter entered into a definitive agreement to acquire Time Warner, which had been the target of an attempted acquisition by Comcast that was blocked due to competition concerns a year prior. Charter, on the other hand, received all required regulatory approvals in a straightforward and timely fashion, and the deal closed successfully in May 2016.
Annual Report | May 31, 2016
19
The Arbitrage Event-Driven Fund Manager Commentary (continued)
The Fund's largest detractor for the year was our credit opportunities investment in NII Holdings (NIHD). NIHD is a wireless telecommunications service provider with a focus on markets in Brazil and Argentina, which filed for bankruptcy protection in September 2014. We established a position in NIHD's debt in early 2015 after a group of its largest creditors agreed on a reorganization plan that we believed offered NIHD creditors attractive risk-adjusted returns upon emergence from Chapter 11. Following its exit from bankruptcy during Q2 2015, where holders received cash and equity in the company, a combination of events, including weakness for Brazilian assets, motivated bond holders seeking to quickly exit the equity that they received as part of the reorganization process, and a poor earnings release shortly following exit from Chapter 11, all conspired to pressure prices of NIHD equity. As conditions in Brazil and the wireless sector rapidly deteriorated into late 2015, we sold our position in the Fund as we saw diminishing prospects for a clear or near-dated catalyst.
The Fund was also impacted by a broken deal in the merger arbitrage sleeve, the saga of Williams Companies. In June 2015, Williams Companies' roll-up of its master limited partnership (MLP) subsidiary, Williams Partners, was interrupted when Energy Transfer entered with a bid for the acquirer. Williams Companies rejected the Energy Transfer bid and subsequently entered into an official auction process. Energy Transfer participated in the auction process and eventually won out with its cash-and-stock bid; however, amidst the decline in oil prices from $60/barrel in June to $45/barrel at the end of September, what was once a deal valuing Williams at $64/share was now only worth $43.50/share. The Fund exited the position during the first quarter of 2016.
The Fund's worst performer in the equity special situations sleeve was our investment in Dynegy, an electric utility company operating both coal-fired and natural gas-fired power stations across the US. While, historically, a majority of Dynegy's exposure was to coal-fired plants, after emerging from bankruptcy in 2012, the company began an aggressive acquisition of natural gas-fired plants and now has a 50-50 split of coal and gas utility/exposure. The Fund experienced losses in this position during Q3 2015 as Franklin Resources, a bond income fund which owned Dynegy in bankruptcy and was a large shareholder of the company's equity, filed a 13D looking to potentially sell their position. The market reacted to this news with a sell-off as the prevailing belief was that because Franklin Resources was under duress (the company previously had significant exposure to distressed energy names as energy prices plummeted in the latter half of the year), they would sell their equity holdings at depressed levels in order to raise funds and that Dynegy's stock price would be negatively impacted. While we believe Dynegy was attractively valued, we chose to exit our position in the Q4 2015 as we believed the duration associated with a change in sentiment around Dynegy's fundamentals was no longer appropriate.
Definitions
13D: An SEC filing that must be submitted to the US Securities and Exchange Commission within 10 days, by anyone who acquires beneficial ownership of more than 5% of any class of publicly traded securities in a public company.
www.arbitragefunds.com | 1-800-295-4485
20
The Arbitrage Event-Driven Fund Portfolio Information
Performance (annualized returns as of May 31, 2016)
| | | One
Year | | Five
Year | | Since
Inception* | |
Arbitrage Event-Driven Fund, Class R | | | -5.55 | % | | | 0.25 | % | | | 0.82 | % | |
Arbitrage Event-Driven Fund, Class I | | | -5.27 | % | | | 0.50 | % | | | 1.06 | % | |
Arbitrage Event-Driven Fund, Class C** | | | -6.14 | % | | | N/A | | | | -0.78 | % | |
Arbitrage Event-Driven Fund, Class A*** | | | -5.54 | % | | | N/A | | | | -1.09 | % | |
Barclays Capital U.S. Aggregate Bond Index | | | 2.99 | % | | | 3.33 | % | | | 3.24 | % | |
HFRI Event Driven Index | | | -4.71 | % | | | 2.60 | % | | | 3.90 | % | |
Current performance may be higher or lower than performance quoted above. Any performance data quoted represents past performance, and the investment return and principal value of an investment in the Fund will fluctuate so that an investor's shares, when redeemed, may be worth more or less than their original cost. Past performance is no guarantee of future results. Returns do not reflect a 2% redemption fee for shares that are redeemed from the fund within 30 days of purchase, which, if reflected, would reduce the performance quoted. Returns shown above include the reinvestment of all dividends and capital gains. Contractual fee waivers are currently in effect. Without such fee waivers, performance numbers would be reduced. You can obtain performance data current to the most recent month end by calling 1-800-295-4485 or going to www.arbitragefunds.com.
* Class R and Class I inception: 10/1/10; Class C inception: 6/1/12; Class A inception: 6/1/13.
** Class C shares are subject to a 1.00% contingent deferred sales charge on all purchases redeemed in 12 months of purchase.
*** Class A shares are subject to a maximum front-end sales load of 3.25% on purchases up to $500,000. The shares are also subject to a deferred sales charge of up to 1.00% on purchases of $500,000 or more purchased without a front-end sales load and redeemed within 18 months of purchase.
The Total Annual Fund Operating Expenses for Class R, Class I, Class C and Class A are 2.52%, 2.27%, 3.27% and 2.52%, respectively. The Advisor has agreed to waive fees (not including the effects of interest, dividends on short positions, brokerage commissions, acquired fund fees and expenses, taxes, or other extraordinary expenses) in excess of 1.69%, 1.44%, 2.44% and 1.69% for Class R, Class I, Class C and Class A, respectively, until at least September 30, 2017. These expense ratios are as stated in the current prospectus and may differ from the expense ratios disclosed in the financial highlights in this report.
The Barclays Capital U.S. Aggregate Bond Index is a market value-weighted index of investment-grade fixed-rated debt issues, including government, corporate, asset-backed and mortgage-backed securities with a maturity of one year or more.
The HFRI Event Driven Index is an index of companies currently or prospectively involved in corporate transactions of a wide variety including but not limited to mergers, restructurings, financial distress, lender offers, shareholder buybacks, debt exchanges, security issuance or other capital structure adjustments. Security types can range from most senior in the capital structure to most junior or subordinated and frequently involve additional derivative securities. Event-Driven exposure includes a combination of sensitivities to equity markets, credit markets and idiosyncratic, company-specific developments.
An investor may not invest directly in an index.
Annual Report | May 31, 2016
21
The Arbitrage Event-Driven Fund Portfolio Information (continued)
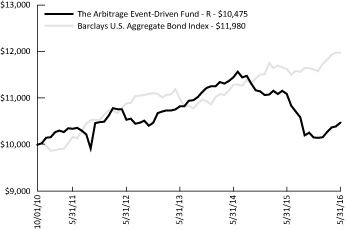
Growth of $10,000 Investment
The chart represents historical performance of a hypothetical investment of $10,000 in the Class R shares of the Fund since inception. Past performance does not guarantee future results. This chart does not reflect the deduction of taxes that a shareholder would pay on Fund distributions or the redemption of Fund shares.
Sector Weighting
The following chart shows the sector weightings of The Arbitrage Event-Driven Fund's investments in common stock, preferred stock, exchange-traded funds, corporate bonds and convertible corporate bonds as of the report date.
www.arbitragefunds.com | 1-800-295-4485
22
The Arbitrage Event-Driven Fund Portfolio of Investments
| | | Shares | | Value | |
COMMON STOCKS - 59.60% | |
Auto Parts & Equipment - 0.27% | |
Tower International, Inc. | | | 22,609 | | | $ | 489,937 | | |
Banks - 3.27% | |
FirstMerit Corp.(a) | | | 259,313 | | | | 5,881,219 | | |
Beverages - 2.64% | |
SABMiller Plc | | | 76,350 | | | | 4,748,923 | | |
Biotechnology - 0.49% | |
Celator Pharmaceuticals, Inc.(b)(c) | | | 29,417 | | | | 884,863 | | |
Chemicals - 2.69% | |
Syngenta AG, ADR | | | 17,968 | | | | 1,417,496 | | |
Valspar Corp.(a)(b) | | | 31,620 | | | | 3,425,078 | | |
| | | | 4,842,574 | | |
Commercial Services - 2.93% | |
ExamWorks Group, Inc.(c) | | | 35,698 | | | | 1,246,217 | | |
USG People N.V.(c) | | | 207,262 | | | | 4,028,759 | | |
| | | | 5,274,976 | | |
Computers & Computer Services - 2.29% | |
Accenture Plc, Class A | | | 1,885 | | | | 224,259 | | |
Brocade Communications Systems, Inc. | | | 72,323 | | | | 655,242 | | |
CGI Group, Inc., Class A(c) | | | 10,240 | | | | 479,027 | | |
Cognizant Technology Solutions Corp., Class A(c) | | | 3,568 | | | | 219,218 | | |
Electronics For Imaging, Inc.(c) | | | 19,746 | | | | 865,467 | | |
Genpact Ltd.(c) | | | 9,168 | | | | 258,446 | | |
Hewlett Packard Enterprise Co. | | | 76,341 | | | | 1,410,018 | | |
| | | | 4,111,677 | | |
Electric - 3.19% | |
ITC Holdings Corp.(a) | | | 113,057 | | | | 5,033,298 | | |
Westar Energy, Inc. | | | 12,620 | | | | 710,884 | | |
| | | | 5,744,182 | | |
Electrical Components & Equipment - 0.35% | |
Saft Groupe SA | | | 15,294 | | | | 623,668 | | |
See Notes to Financial Statements.
Annual Report | May 31, 2016
23
The Arbitrage Event-Driven Fund Portfolio of Investments (continued)
| | | Shares | | Value | |
COMMON STOCKS - 59.60% (Continued) | |
Electronics - 1.89% | |
FEI Co. | | | 14,871 | | | $ | 1,597,889 | | |
Rofin-Sinar Technologies, Inc.(b)(c) | | | 28,081 | | | | 897,188 | | |
Tyco International Plc | | | 21,143 | | | | 901,115 | | |
| | | | 3,396,192 | | |
Food - 0.67% | |
Illovo Sugar Ltd. | | | 165,800 | | | | 259,520 | | |
Nomad Foods Ltd.(c) | | | 98,036 | | | | 952,910 | | |
| | | | 1,212,430 | | |
Gas - 3.09% | |
AGL Resources, Inc. | | | 84,346 | | | | 5,549,967 | | |
Healthcare - Products - 1.27% | |
Affymetrix, Inc.(c)(d)(e) | | | 64,469 | | | | 902,566 | | |
St Jude Medical, Inc. | | | 17,714 | | | | 1,388,069 | | |
| | | | 2,290,635 | | |
Home Furnishings - 1.38% | |
TiVo, Inc.(c) | | | 249,053 | | | | 2,478,077 | | |
Household Products/Wares - 1.26% | |
Tumi Holdings, Inc.(c) | | | 84,794 | | | | 2,275,023 | | |
Internet - 3.43% | |
F5 Networks, Inc.(c) | | | 1,968 | | | | 216,874 | | |
Marketo, Inc.(c) | | | 38,220 | | | | 1,346,491 | | |
Yahoo!, Inc.(a)(c) | | | 121,640 | | | | 4,615,021 | | |
| | | | 6,178,386 | | |
Lodging - 4.11% | |
Interval Leisure Group, Inc. | | | 39,983 | | | | 574,156 | | |
Starwood Hotels & Resorts Worldwide, Inc.(a) | | | 92,780 | | | | 6,812,835 | | |
| | | | 7,386,991 | | |
Media - 7.37% | |
Cablevision Systems Corp., Class A(a) | | | 152,756 | | | | 5,297,578 | | |
Charter Communications, Inc., Class A(b)(c) | | | 29,047 | | | | 6,359,550 | | |
Nexstar Broadcasting Group, Inc., Class A(a)(b) | | | 30,172 | | | | 1,605,754 | | |
| | | | 13,262,882 | | |
See Notes to Financial Statements.
www.arbitragefunds.com | 1-800-295-4485
24
The Arbitrage Event-Driven Fund Portfolio of Investments (continued)
| | | Shares | | Value | |
COMMON STOCKS - 59.60% (Continued) | |
Mining - 0.00%(f) | |
Nevada Copper Corp.(c)(e) | | | 6,725 | | | $ | 3,333 | | |
Office/Business Equip - 0.48% | |
Canon, Inc., Sponsored ADR | | | 29,618 | | | | 854,479 | | |
Packaging & Containers - 1.67% | |
Rexam Plc | | | 329,607 | | | | 3,000,372 | | |
Pharmaceuticals - 5.73% | |
Allergan Plc(c) | | | 5,800 | | | | 1,367,350 | | |
Anacor Pharmaceuticals, Inc.(b)(c) | | | 13,618 | | | | 1,352,267 | | |
Baxalta, Inc. | | | 146,521 | | | | 6,627,145 | | |
Shire Plc, ADR | | | 1,300 | | | | 242,008 | | |
XenoPort, Inc.(c) | | | 100,738 | | | | 714,233 | | |
| | | | 10,303,003 | | |
Retail - 1.71% | |
Cabela's, Inc.(c) | | | 41,625 | | | | 2,021,310 | | |
Krispy Kreme Doughnuts, Inc.(b)(c) | | | 25,418 | | | | 543,437 | | |
Office Depot, Inc.(c) | | | 140,275 | | | | 502,184 | | |
| | | | 3,066,931 | | |
Semiconductors - 2.16% | |
KLA-Tencor Corp.(a) | | | 53,264 | | | | 3,884,544 | | |
Software - 5.18% | |
Cvent, Inc.(a)(b)(c) | | | 161,427 | | | | 5,780,701 | | |
inContact, Inc.(c) | | | 46,158 | | | | 640,673 | | |
Qlik Technologies, Inc.(c) | | | 30,003 | | | | 861,086 | | |
VMware, Inc., Class A(c) | | | 9,588 | | | | 580,649 | | |
Xura, Inc.(b)(c) | | | 58,308 | | | | 1,447,205 | | |
| | | | 9,310,314 | | |
Telecommunications - 0.08% | |
LogMeIn, Inc.(c) | | | 2,465 | | | | 151,031 | | |
TOTAL COMMON STOCKS
(Cost $103,052,963) | | | 107,206,609 | | |
See Notes to Financial Statements.
Annual Report | May 31, 2016
25
The Arbitrage Event-Driven Fund Portfolio of Investments (continued)
| | | Shares | | Value | |
EXCHANGE-TRADED FUNDS - 1.89% | |
Equity Funds - 1.89% | |
Consumer Staples Select Sector SPDR® Fund | | | 20,970 | | | $ | 1,105,539 | | |
SPDR® S&P® Homebuilders ETF | | | 29,145 | | | | 996,176 | | |
Industrial Select Sector SPDR® Fund | | | 14,067 | | | | 786,767 | | |
Technology Select Sector SPDR® Fund | | | 11,352 | | | | 501,872 | | |
| | | | 3,390,354 | | |
TOTAL EXCHANGE-TRADED FUNDS
(Cost $3,264,327) | | | 3,390,354 | | |
RIGHTS - 0.38% | |
ArthroCare Corp. CVR, No expiration(c)(d)(e) | | | 157,791 | | | | 66,414 | | |
Casa Ley CVR, Expires 01/30/2018(c)(d)(e) | | | 891,084 | | | | 354,473 | | |
Chelsea Therapeutics CVR, Expires 03/31/2018(c)(d)(e) | | | 434,520 | | | | 25,072 | | |
Cubist Pharmaceuticals, Inc. CPR, Expires 07/01/2019(c)(d)(e) | | | 34,500 | | | | — | | |
Leap Wireless International CVR, Expires 03/13/2017(c)(e) | | | 64,802 | | | | 204,126 | | |
PDC CVR, Expires 12/31/2016(c)(d)(e) | | | 891,084 | | | | 20,584 | | |
Trius Therapeutics CVR, Expires 02/15/2017(c)(d)(e) | | | 103,378 | | | | 9,666 | | |
TOTAL RIGHTS
(Cost $1,170,262) | | | 680,335 | | |
| | | Maturity
Date | | Rate | | Principal
Amount | | Value | |
CORPORATE BONDS - 11.98% | |
Computers & Computer Services - 1.00% | |
Western Digital Corp.(g) | |
| | | 04/01/2023 | | | 7.375 | % | | $ | 1,127,000 | | | $ | 1,174,898 | | |
| | | 04/01/2024 | | | 10.500 | % | | | 607,000 | | | | 628,245 | | |
| | | | 1,803,143 | | |
Electric - 1.45% | |
Energy Future Intermediate
Holding Co. LLC /
EFIH Finance, Inc.(g)(h) | | 03/01/2022 | | | 11.750 | % | | | 2,264,438 | | | | 2,609,764 | | |
Entertainment - 0.02% | |
Pinnacle Entertainment, Inc.(g) | | 05/01/2024 | | | 5.625 | % | | | 37,000 | | | | 36,168 | | |
Insurance - 1.78% | |
Ambac Assurance Corp.(g) | | 06/07/2020 | | | 5.100 | % | | | 2,837,988 | | | | 3,210,474 | | |
See Notes to Financial Statements.
www.arbitragefunds.com | 1-800-295-4485
26
The Arbitrage Event-Driven Fund Portfolio of Investments (continued)
| | | Maturity
Date | | Rate | | Principal
Amount | | Value | |
CORPORATE BONDS - 11.98% (Continued) | |
Media - 3.03% | |
LIN Television Corp.(a) | | 01/15/2021 | | | 6.375 | % | | $ | 1,926,000 | | | $ | 2,007,855 | | |
Neptune Finco Corp.(g) | | 10/15/2025 | | | 10.875 | % | | | 3,021,000 | | | | 3,436,387 | | |
| | | | 5,444,242 | | |
Miscellaneous Manufacturing - 1.69% | |
LSB Industries, Inc. | | 08/01/2019 | | | 7.750 | % | | | 2,974,000 | | | | 3,031,907 | | |
Telecommunications - 3.01% | |
Frontier Communications
Corp.(g) | | 09/15/2025 | | | 11.000 | % | | | 1,879,000 | | | | 1,911,882 | | |
Sprint Communications, Inc. | |
| | | 12/01/2016 | | | 6.000 | % | | | 2,780,000 | | | | 2,811,275 | | |
| | | 03/01/2017 | | | 9.125 | % | | | 669,000 | | | | 691,084 | | |
| | | | 5,414,241 | | |
TOTAL CORPORATE BONDS & NOTES
(Cost $20,799,109) | | | 21,549,939 | | |
CONVERTIBLE CORPORATE BONDS - 1.64% | |
Electric - 0.47% | |
Emera, Inc. | | 09/29/2025 | | | 4.000 | % | | | 2,565,000 | | | | 841,080 | | |
Home Furnishings - 1.17% | |
TiVo, Inc. | | 10/01/2021 | | | 2.000 | % | | | 2,146,000 | | | | 2,107,104 | | |
TOTAL CONVERTIBLE CORPORATE BONDS
(Cost $3,001,891) | | | 2,948,184 | | |
| | | Shares | | Value | |
PREFERRED STOCKS - 0.30% | |
Retail - 0.30% | |
RONA, Inc. | | | 34,344 | | | $ | 539,510 | | |
TOTAL PREFERRED STOCKS
(Cost $496,364) | | | 539,510 | | |
See Notes to Financial Statements.
Annual Report | May 31, 2016
27
The Arbitrage Event-Driven Fund Portfolio of Investments (continued)
| | | Expiration
Date | | Exercise
Price | | Contracts | | Value | |
PURCHASED OPTIONS(c) - 0.17% | |
Call Options Purchased - 0.04% | |
Anacor Pharmaceuticals, Inc.: | |
| | | 08/2016 | | $ | 105.00 | | | | 128 | | | $ | 3,840 | | |
| | | 08/2016 | | | 110.00 | | | | 230 | | | | 4,025 | | |
Great Plains Energy, Inc.: | |
| | | 09/2016 | | | 30.00 | | | | 25 | | | | 2,188 | | |
| | | 12/2016 | | | 30.00 | | | | 19 | | | | 2,375 | | |
Huntington Bancshares, Inc. | | 07/2016 | | | 12.00 | | | | 4,477 | | | | 13,431 | | |
Krispy Kreme Doughnuts, Inc. | | 08/2016 | | | 22.00 | | | | 10 | | | | 150 | | |
LSB Industries, Inc.: | |
| | | 06/2016 | | | 10.00 | | | | 46 | | | | 15,180 | | |
| | | 06/2016 | | | 12.50 | | | | 46 | | | | 6,325 | | |
Mylan N.V. | | 07/2016 | | | 50.00 | | | | 11 | | | | 308 | | |
Rovi Corp. | | 07/2016 | | | 17.50 | | | | 223 | | | | 20,627 | | |
Xura, Inc. | | 07/2016 | | | 25.00 | | | | 50 | | | | 1,000 | | |
TOTAL CALL OPTIONS PURCHASED
(Cost $111,577) | | | 69,449 | | |
Put Options Purchased - 0.13% | |
Anacor Pharmaceuticals, Inc.: | |
| | | 08/2016 | | | 85.00 | | | | 111 | | | | 3,885 | | |
| | | 08/2016 | | | 90.00 | | | | 92 | | | | 4,370 | | |
Celator Pharmaceuticals, Inc.: | |
| | | 07/2016 | | | 24.00 | | | | 22 | | | | 165 | | |
| | | 10/2016 | | | 19.00 | | | | 21 | | | | 263 | | |
| | | 10/2016 | | | 20.00 | | | | 2 | | | | 25 | | |
| | | 10/2016 | | | 21.00 | | | | 11 | | | | 138 | | |
Charter Communications, Inc.,
Class A | | 06/2016 | | | 250.00 | | | | 38 | | | | 198,930 | | |
Cvent, Inc. | | 10/2016 | | | 30.00 | | | | 7 | | | | 140 | | |
Rofin-Sinar Technologies, Inc.: | |
| | | 09/2016 | | | 25.00 | | | | 74 | | | | 1,480 | | |
| | | 09/2016 | | | 30.00 | | | | 124 | | | | 9,610 | | |
Rovi Corp. | | 07/2016 | | | 15.00 | | | | 367 | | | | 21,102 | | |
TOTAL PUT OPTIONS PURCHASED
(Cost $228,570) | | | 240,108 | | |
TOTAL PURCHASED OPTIONS
(Cost $340,147) | | | 309,557 | | |
See Notes to Financial Statements.
www.arbitragefunds.com | 1-800-295-4485
28
The Arbitrage Event-Driven Fund Portfolio of Investments (continued)
| | | Yield | | Shares | | Value | |
SHORT-TERM INVESTMENTS - 30.02% | |
Money Market Fund | |
State Street Institutional Liquid Reserves
Fund | | | 0.455 | %(i) | | | 53,994,504 | | | $ | 53,994,504 | | |
TOTAL SHORT-TERM INVESTMENTS
(Cost $53,994,504) | | | 53,994,504 | | |
Total Investments - 105.98%
(Cost $186,119,567) | | | 190,618,992 | | |
Liabilities in Excess of Other Assets - (5.98)%(j) | | | (10,750,378 | ) | |
NET ASSETS - 100.00% | | $ | 179,868,614 | | |
Portfolio Footnotes
(a) Security, or a portion of security, is being held as collateral for short sales or written option contracts. At May 31, 2016, the aggregate market value of those securities was $23,795,350, representing 13.23% of net assets.
(b) Underlying security for a written/purchased call/put option.
(c) Non-income-producing security.
(d) Security fair valued using methods determined in good faith by the Pricing Committee. As of May 31, 2016, the total market value of these securities was $1,378,775, representing 0.77% of net assets.
(e) Security considered illiquid. On May 31, 2016, the total market value of these securities was $1,586,234, representing 0.88% of net assets.
(f) Less than 0.005% of net assets.
(g) Security exempt from registration under Rule 144A of the Securities Act of 1933. These securities may be resold in transactions exempt from registration, normally to qualified institutional buyers. As of May 31, 2016, these securities had a total value of $13,007,818 or 7.23% of net assets.
(h) Security in default on interest payments.
(i) Rate shown is the 7-day effective yield as of May 31, 2016.
(j) Includes cash which is being held as collateral for short sales and written option contracts.
See Notes to Financial Statements.
Annual Report | May 31, 2016
29
The Arbitrage Event-Driven Fund Portfolio of Investments (continued)
Securities are determined to be illiquid under the procedures approved by the Funds' Board of Trustees. Information related to the Fund's illiquid securities as of May 31, 2016 is as follows:
Date of
Purchase | | Security | | Cost | | Value | | % of Net Assets | |
01/01/2016 | | Affymetrix, Inc. | | $ | 886,419 | | | $ | 902,566 | | | | 0.50 | % | |
05/30/2014 | | ArthroCare Corp. CVR | | | 55,227 | | | | 66,414 | | | | 0.04 | | |
01/30/2015 | | Casa Ley CVR | | | 904,361 | | | | 354,473 | | | | 0.20 | | |
06/24/2014 | | Chelsea Therapeutics CVR | | | — | | | | 25,072 | | | | 0.01 | | |
12/12/2011 | | Cubist Pharmaceuticals, Inc. CPR | | | — | | | | — | | | | 0.00 | | |
03/17/2014 | | Leap Wireless International CVR | | | 167,189 | | | | 204,126 | | | | 0.11 | | |
07/07/2011 | | Nevada Copper Corp. | | | 37,891 | | | | 3,333 | | | | 0.00 | | |
01/30/2015 | | PDC CVR | | | 43,485 | | | | 20,584 | | | | 0.01 | | |
09/12/2013 | | Trius Therapeutics CVR | | | — | | | | 9,666 | | | | 0.01 | | |
| | | | | | | $ | 1,586,234 | | | | 0.88 | % | |
SCHEDULE OF SECURITIES SOLD SHORT | | Shares | | Value | |
COMMON STOCKS - (29.37%) | |
Auto Parts & Equipment - (0.89%) | |
Autoliv, Inc. | | | (1,282 | ) | | $ | (157,186 | ) | |
BorgWarner, Inc. | | | (5,394 | ) | | | (183,558 | ) | |
Dana Holding Corp. | | | (5,096 | ) | | | (61,254 | ) | |
Johnson Controls, Inc. | | | (24,297 | ) | | | (1,072,712 | ) | |
Magna International, Inc. | | | (3,209 | ) | | | (130,061 | ) | |
| | | | (1,604,771 | ) | |
Banks - (2.60%) | |
Huntington Bancshares, Inc. | | | (447,658 | ) | | | (4,678,026 | ) | |
Beverages - (1.08%) | |
Molson Coors Brewing Co., Class B | | | (19,659 | ) | | | (1,949,780 | ) | |
Chemicals - (0.01%) | |
Valspar Corp. | | | (100 | ) | | | (10,832 | ) | |
Computers & Computer Services - (1.24%) | |
Brocade Communications Systems, Inc. | | | (72,322 | ) | | | (655,237 | ) | |
Computer Sciences Corp. | | | (24,958 | ) | | | (1,227,934 | ) | |
International Business Machines Corp. | | | (2,313 | ) | | | (355,601 | ) | |
| | | | (2,238,772 | ) | |
Construction Materials - (0.58%) | |
Armstrong World Industries, Inc. | | | (25,196 | ) | | | (1,041,855 | ) | |
See Notes to Financial Statements.
www.arbitragefunds.com | 1-800-295-4485
30
The Arbitrage Event-Driven Fund Portfolio of Investments (continued)
SCHEDULE OF SECURITIES SOLD SHORT | | Shares | | Value | |
COMMON STOCKS - (29.37%) (Continued) | |
Electric - (2.67%) | |
Emera, Inc. | | | (61,015 | ) | | $ | (2,150,077 | ) | |
Fortis, Inc. | | | (84,748 | ) | | | (2,650,980 | ) | |
Great Plains Energy, Inc. | | | (35 | ) | | | (1,021 | ) | |
| | | | (4,802,078 | ) | |
Healthcare - Products - (0.34%) | |
Abbott Laboratories | | | (15,426 | ) | | | (611,332 | ) | |
Internet - (2.24%) | |
Alibaba Group Holding Ltd., Sponsored ADR | | | (49,227 | ) | | | (4,036,614 | ) | |
Lodging - (3.12%) | |
Interval Leisure Group, Inc. | | | (39,974 | ) | | | (574,027 | ) | |
Marriott International, Inc., Class A | | | (69,935 | ) | | | (4,618,507 | ) | |
Starwood Hotels & Resorts Worldwide, Inc. | | | (5,700 | ) | | | (418,551 | ) | |
| | | | (5,611,085 | ) | |
Machinery - Diversified - (0.52%) | |
Manitowoc Foodservice, Inc. | | | (56,653 | ) | | | (933,075 | ) | |
Media - (5.08%) | |
Cable One, Inc. | | | (3,318 | ) | | | (1,625,787 | ) | |
Cablevision Systems Corp., Class A | | | (22,378 | ) | | | (776,069 | ) | |
Charter Communications, Inc., Class A | | | (25,612 | ) | | | (5,607,491 | ) | |
Gray Television, Inc. | | | (27,698 | ) | | | (327,390 | ) | |
Sinclair Broadcast Group, Inc., Class A | | | (13,157 | ) | | | (416,156 | ) | |
TEGNA, Inc. | | | (16,465 | ) | | | (378,037 | ) | |
| | | | (9,130,930 | ) | |
Mining - (0.00%)(a) | |
Nevada Copper Corp. | | | (6,725 | ) | | | (3,333 | ) | |
Miscellaneous Manufacturing - (0.07%) | |
LSB Industries, Inc. | | | (9,200 | ) | | | (120,980 | ) | |
Office/Business Equip - (0.98%) | |
Xerox Corp. | | | (176,298 | ) | | | (1,757,691 | ) | |
Packaging & Containers - (0.61%) | |
Ball Corp. | | | (15,056 | ) | | | (1,088,549 | ) | |
Pharmaceuticals - (3.21%) | |
Allergan Plc | | | (5,800 | ) | | | (1,367,350 | ) | |
See Notes to Financial Statements.
Annual Report | May 31, 2016
31
The Arbitrage Event-Driven Fund Portfolio of Investments (continued)
SCHEDULE OF SECURITIES SOLD SHORT | | Shares | | Value | |
COMMON STOCKS - (29.37%) (Continued) | |
Pharmaceuticals - (3.21%) (Continued) | |
Baxalta, Inc. | | | (7,000 | ) | | $ | (316,610 | ) | |
Shire Plc, ADR | | | (21,981 | ) | | | (4,091,983 | ) | |
| | | | (5,775,943 | ) | |
Real Estate Investment Trusts - (0.24%) | |
InnVest Real Estate Investment Trust | | | (85,872 | ) | | | (434,811 | ) | |
Retail - (0.10%) | |
Office Depot, Inc. | | | (47,900 | ) | | | (171,482 | ) | |
Semiconductors - (1.48%) | |
Intel Corp. | | | (11,054 | ) | | | (349,196 | ) | |
Lam Research Corp. | | | (26,632 | ) | | | (2,205,396 | ) | |
Rovi Corp. | | | (6,631 | ) | | | (111,467 | ) | |
| | | | (2,666,059 | ) | |
Software - (0.98%) | |
Citrix Systems, Inc. | | | (20,799 | ) | | | (1,766,251 | ) | |
Telecommunications - (1.33%) | |
Cisco Systems, Inc. | | | (12,062 | ) | | | (350,401 | ) | |
Frontier Communications Corp. | | | (28,561 | ) | | | (147,661 | ) | |
T-Mobile US, Inc. | | | (44,270 | ) | | | (1,892,985 | ) | |
| | | | (2,391,047 | ) | |
TOTAL COMMON STOCKS
(Proceeds $51,588,716) | | | (52,825,296 | ) | |
EXCHANGE-TRADED FUNDS - (0.63%) | |
Equity Funds - (0.63%) | |
Consumer Staples Select Sector SPDR® Fund | | | (12,641 | ) | | | (666,434 | ) | |
SPDR® S&P® Retail ETF | | | (10,966 | ) | | | (463,971 | ) | |
| | | | (1,130,405 | ) | |
TOTAL EXCHANGE-TRADED FUNDS
(Proceeds $1,096,068) | | | (1,130,405 | ) | |
RIGHTS - (0.00%)(a) | |
Chelsea Therapeutics CVR, Expires 03/31/2018 | | | (200 | ) | | | (12 | ) | |
TOTAL RIGHTS
(Proceeds $0) | | | (12 | ) | |
(a) Less than 0.005% of net assets.
See Notes to Financial Statements.
www.arbitragefunds.com | 1-800-295-4485
32
The Arbitrage Event-Driven Fund Portfolio of Investments (continued)
| | Maturity
Date | | Rate | | Principal
Amount | | Value | |
CORPORATE BONDS - (2.60%) | |
Computers & Computer Services - (0.40%) | |
Diamond 1 Finance Corp. /
Diamond 2 Finance Corp. | | 06/15/2023 | | | 5.450 | % | | $ | (282,000 | ) | | $ | (286,601 | ) | |
Seagate HDD Cayman | | 01/01/2025 | | | 4.750 | % | | | (554,000 | ) | | | (426,796 | ) | |
| | | | (713,397 | ) | |
Media - (1.07%) | |
CSC Holdings LLC | | 06/01/2024 | | | 5.250 | % | | | (2,148,000 | ) | | | (1,933,200 | ) | |
Oil & Gas Services - (0.76%) | |
National Oilwell Varco, Inc. | | 12/01/2022 | | | 2.600 | % | | | (1,531,000 | ) | | | (1,362,919 | ) | |
Telecommunications - (0.37%) | |
CenturyLink, Inc. | | 04/01/2025 | | | 5.625 | % | | | (763,000 | ) | | | (675,255 | ) | |
TOTAL CORPORATE BONDS
(Proceeds $4,745,275) | | | (4,684,771 | ) | |
TOTAL SECURITIES SOLD SHORT
(Proceeds $57,430,059) | | $ | (58,640,484 | ) | |
| WRITTEN OPTIONS | | Expiration
Date | | Exercise
Price | | Contracts | | Value | |
Written Call Options | |
Charter Communications, Inc.,
Class A | | 06/2016 | | $ | 250.00 | | | | (38 | ) | | $ | (8,360 | ) | |
Krispy Kreme Doughnuts, Inc. | | 08/2016 | | | 21.00 | | | | (36 | ) | | | (1,800 | ) | |
Microchip Technology, Inc. | | 08/2016 | | | 9.00 | | | | (8 | ) | | | (100 | ) | |
Nexstar Broadcasting Group, Inc.,
Class A | | 06/2016 | | | 50.00 | | | | (25 | ) | | | (9,250 | ) | |
T-Mobile US, Inc. | | 07/2016 | | | 43.00 | | | | (76 | ) | | | (11,058 | ) | |
Valspar Corp. | | 07/2016 | | | 105.00 | | | | (44 | ) | | | (11,440 | ) | |
TOTAL WRITTEN CALL OPTIONS
(Premiums received $30,514) | | | (42,008 | ) | |
See Notes to Financial Statements.
Annual Report | May 31, 2016
33
The Arbitrage Event-Driven Fund Portfolio of Investments (continued)
WRITTEN OPTIONS | | Expiration
Date | | Exercise
Price | | Contracts | | Value | |
Written Put Options | |
Anacor Pharmaceuticals, Inc. | | 06/2016 | | $ | 95.00 | | | | (21 | ) | | $ | (263 | ) | |
Krispy Kreme Doughnuts, Inc. | | 06/2016 | | | 21.00 | | | | (36 | ) | | | (90 | ) | |
LSB Industries, Inc. | | 06/2016 | | | 7.50 | | | | (46 | ) | | | (460 | ) | |
Rovi Corp.: | |
| | | 06/2016 | | | 15.00 | | | | (79 | ) | | | (1,580 | ) | |
| | | 07/2016 | | | 15.00 | | | | (4 | ) | | | (230 | ) | |
TOTAL WRITTEN PUT OPTIONS
(Premiums received $12,311) | | | (2,623 | ) | |
TOTAL WRITTEN OPTIONS
(Premiums received $42,825) | | $ | (44,631 | ) | |
See Notes to Financial Statements.
www.arbitragefunds.com | 1-800-295-4485
34
The Arbitrage Event-Driven Fund Portfolio of Investments (continued)
EQUITY SWAP CONTRACTS
Swap
Counterparty | | Reference
Obligation | | Rate Paid/Received
by the Fund | | Termination
Date | | Notional
Amount | | Unrealized
Appreciation | |
Morgan Stanley
| | Illovo Sugar, Ltd.
| | Paid 1 Month-SABOR
plus 120 bps | |
05/25/2017 | |
$(1,253,177) | | |
$ | 3 | |
Swap
Counterparty | | Reference
Obligation | | Rate Paid/Received
by the Fund | | Termination
Date | | Notional
Amount | | Unrealized
Depreciation | |
Goldman Sachs
& Co. | | Illovo Sugar, Ltd.
| | Paid 1 Month-JIBAR
plus 95 bps | |
05/31/2017 | |
$(1,460,295) | | |
$ | (386) | |
OUTSTANDING FORWARD FOREIGN CURRENCY EXCHANGE CONTRACTS
Contract
Description | | Counterparty | | Contracts to
Deliver/Receive | | Purchase/Sale
Contract | | Expiration
Date | | Current Value | | Unrealized
Appreciation | |
CAD | | | | Goldman Sachs | | | 557,800 | | | Purchase | | 06/15/2016 | | $ | 425,351 | | | $ | 705 | | |
CHF | | | | Goldman Sachs | | | 47,100 | | | Sale | | 06/15/2016 | | | 47,411 | | | | 363 | | |
EUR | | | | Goldman Sachs | | | 12,174,900 | | | Sale | | 06/15/2016 | | | 13,552,276 | | | | 85,471 | | |
GBP | | | | Goldman Sachs | | | 40,000 | | | Purchase | | 06/15/2016 | | | 57,939 | | | | 144 | | |
GBP | | | | Goldman Sachs | | | 259,700 | | | Sale | | 06/15/2016 | | | 376,166 | | | | 2,502 | | |
ZAR | | | | Goldman Sachs | | | 4,145,000 | | | Sale | | 06/15/2016 | | | 263,051 | | | | 19,272 | | |
| | | $ | 108,457 | | |
Contract
Description | | Counterparty | | Contracts to
Deliver/Receive | | Purchase/Sale
Contract | | Expiration
Date | | Current Value | | Unrealized
Depreciation | |
CAD | | | | Goldman Sachs | | | 6,933,500 | | | Purchase | | 06/15/2016 | | $ | 5,287,147 | | | $ | (75,640 | ) | |
CAD | | | | Goldman Sachs | | | 5,898,300 | | | Sale | | 06/15/2016 | | | 4,497,755 | | | | (77,189 | ) | |
CHF | | | | Goldman Sachs | | | 31,800 | | | Purchase | | 06/15/2016 | | | 32,010 | | | | (159 | ) | |
EUR | | | | Goldman Sachs | | | 8,172,900 | | | Purchase | | 06/15/2016 | | | 9,097,519 | | | | (64,767 | ) | |
EUR | | | | Goldman Sachs | | | 194,400 | | | Sale | | 06/15/2016 | | | 216,393 | | | | (76 | ) | |
GBP | | | | Goldman Sachs | | | 4,431,800 | | | Sale | | 06/15/2016 | | | 6,419,287 | | | | (74,785 | ) | |
| | | $ | (292,616 | ) | |
See Notes to Financial Statements.
Annual Report | May 31, 2016
35
The Arbitrage Event-Driven Fund Portfolio of Investments (continued)
The following is a summary of investments classified by country exposure:
Country | | % of Net Assets(a) | |
United Kingdom | | | 4.84 | % | |
Netherlands | | | 2.24 | % | |
Canada | | | 1.04 | % | |
Switzerland | | | 0.79 | % | |
Japan | | | 0.48 | % | |
France | | | 0.35 | % | |
South Africa | | | 0.14 | % | |
Ireland | | | 0.13 | % | |
United States | | | 95.97 | % | |
Liabilities in Excess of Other Assets | | | (5.98 | )% | |
| | | | 100.00 | % | |
(a) These percentages represent long positions only and are not net of short positions.
Abbreviations:
ADR - American Depositary Receipt
AG - Aktiengesellschaft is a German term that refers to a corporation that is limited by shares, i.e., owned by shareholders.
bps - Basis Points
CAD - Canadian dollar
CHF - Swiss franc
CPR - Conditional Prepayment Rate
CVR - Contingent Value Rights
ETF - Exchange-Traded Fund
EUR - Euro
GBP - British pound
JIBAR - Johannesburg Interbank Agreed Rate
LLC - Limited Liability Company
Ltd. - Limited
N.V. - Naamloze Vennootschap is the Dutch term for a public limited liability corporation.
Plc - Public Limited Company
SA - Generally designates corporations in various countries, mostly those employing civil law. This translates literally in all languages mentioned as anonymous company.
SABOR - South African Benchmark Overnight Rate
S&P - Standard & Poor's
SPDR - Standard & Poor's Depositary Receipt
ZAR - South African rand
See Notes to Financial Statements.
www.arbitragefunds.com | 1-800-295-4485
36
The Arbitrage Event-Driven Fund Portfolio of Investments (continued)
The following table summarizes The Arbitrage Event-Driven Fund's investments and derivative financial instruments categorized in the disclosure hierarchy as of May 31, 2016:
Investments in Securities at Value* | | Level 1 | | Level 2 | | Level 3 | | Total | |
Assets | |
Common Stocks | |
Auto Parts & Equipment | | $ | 489,937 | | | $ | — | | | $ | — | | | $ | 489,937 | | |
Banks | | | 5,881,219 | | | | — | | | | — | | | | 5,881,219 | | |
Beverages | | | 4,748,923 | | | | — | | | | — | | | | 4,748,923 | | |
Biotechnology | | | 884,863 | | | | — | | | | — | | | | 884,863 | | |
Chemicals | | | 4,842,574 | | | | — | | | | — | | | | 4,842,574 | | |
Commercial Services | | | 5,274,976 | | | | — | | | | — | | | | 5,274,976 | | |
Computers & Computer
Services | | | 4,111,677 | | | | — | | | | — | | | | 4,111,677 | | |
Electric | | | 5,744,182 | | | | — | | | | — | | | | 5,744,182 | | |
Electrical Components &
Equipment | | | 623,668 | | | | — | | | | — | | | | 623,668 | | |
Electronics | | | 3,396,192 | | | | — | | | | — | | | | 3,396,192 | | |
Food | | | 1,212,430 | | | | — | | | | — | | | | 1,212,430 | | |
Gas | | | 5,549,967 | | | | — | | | | — | | | | 5,549,967 | | |
Healthcare - Products | | | 1,388,069 | | | | 902,566 | | | | — | | | | 2,290,635 | | |
Home Furnishings | | | 2,478,077 | | | | — | | | | — | | | | 2,478,077 | | |
Household Products/Wares | | | 2,275,023 | | | | — | | | | — | | | | 2,275,023 | | |
Internet | | | 6,178,386 | | | | — | | | | — | | | | 6,178,386 | | |
Lodging | | | 7,386,991 | | | | — | | | | — | | | | 7,386,991 | | |
Media | | | 13,262,882 | | | | — | | | | — | | | | 13,262,882 | | |
Mining | | | 3,333 | | | | — | | | | — | | | | 3,333 | | |
Office/Business Equip | | | 854,479 | | | | — | | | | — | | | | 854,479 | | |
Packaging & Containers | | | 3,000,372 | | | | — | | | | — | | | | 3,000,372 | | |
Pharmaceuticals | | | 10,303,003 | | | | — | | | | — | | | | 10,303,003 | | |
Retail | | | 3,066,931 | | | | — | | | | — | | | | 3,066,931 | | |
Semiconductors | | | 3,884,544 | | | | — | | | | — | | | | 3,884,544 | | |
Software | | | 9,310,314 | | | | — | | | | — | | | | 9,310,314 | | |
Telecommunications | | | 151,031 | | | | — | | | | — | | | | 151,031 | | |
Exchange-Traded Funds** | | | 3,390,354 | | | | — | | | | — | | | | 3,390,354 | | |
Rights | | | — | | | | 270,540 | | | | 409,795 | | | | 680,335 | | |
Corporate Bonds** | | | — | | | | 21,549,939 | | | | — | | | | 21,549,939 | | |
Convertible Corporate Bonds** | | | — | | | | 2,948,184 | | | | — | | | | 2,948,184 | | |
Preferred Stocks** | | | 539,510 | | | | — | | | | — | | | | 539,510 | | |
Purchased Options | | | 309,557 | | | | — | | | | — | | | | 309,557 | | |
Short-Term Investments | | | 53,994,504 | | | | — | | | | — | | | | 53,994,504 | | |
TOTAL | | $ | 164,537,968 | | | $ | 25,671,229 | | | $ | 409,795 | | | $ | 190,618,992 | | |
* Refer to footnote 2 where leveling hierarchy is defined.
See Notes to Financial Statements.
Annual Report | May 31, 2016
37
The Arbitrage Event-Driven Fund Portfolio of Investments (continued)
Other Financial Instruments*** | | Level 1 | | Level 2 | | Level 3 | | Total | |
Assets | |
Forward Foreign Currency
Exchange Contracts | | $ | — | | | $ | 108,457 | | | $ | — | | | $ | 108,457 | | |
Equity Swaps | | | — | | | | 3 | | | | — | | | | 3 | | |
Liabilities | |
Common Stocks** | | | (52,825,296 | ) | | | — | | | | — | | | | (52,825,296 | ) | |
Exchange-Traded Funds** | | | (1,130,405 | ) | | | — | | | | — | | | | (1,130,405 | ) | |
Rights | | | — | | | | — | | | | (12 | ) | | | (12 | ) | |
Corporate Bonds** | | | — | | | | (4,684,771 | ) | | | — | | | | (4,684,771 | ) | |
Written Options | | | (44,631 | ) | | | — | | | | — | | | | (44,631 | ) | |
Forward Foreign Currency
Exchange Contracts | | | — | | | | (292,616 | ) | | | — | | | | (292,616 | ) | |
Equity Swaps | | | — | | | | (386 | ) | | | — | | | | (386 | ) | |
TOTAL | | $ | (54,000,332 | ) | | $ | (4,869,313 | ) | | $ | (12 | ) | | $ | (58,869,657 | ) | |
** Refer to Portfolio of Investments for sector information.
*** Other financial instruments are instruments such as written options, securities sold short, equity swaps and forward foreign currency exchange contracts.
The following is a reconciliation of the fair valuations using significant unobservable inputs (Level 3) for the Fund's assets and liabilities during the year ended May 31, 2016:
Investments
in Securities | | Balance as of
May 31, 2015 | | Change in
Unrealized
Depreciation | | Purchases | | Sales
Proceeds | | Transfers
into
Level 3 | | Transfers
out of
Level 3 | | Balance as of
May 31, 2016 | | Net change in
Unrealized
Depreciation
included in the
Statement of
Operations
attributable to
Level 3
investments
held at
May 31, 2016 | |
Rights | | $ | 697,911 | | | $ | 14,642 | | | $ | – | | | $ | – | | | $ | – | | | $ | (302,758 | ) | | $ | 409,795 | | | $ | 14,642 | | |
Total | | $ | 697,911 | | | $ | 14,642 | | | $ | – | | | $ | – | | | $ | – | | | $ | (302,758 | ) | | $ | 409,795 | | | $ | 14,642 | | |
Other Financial
Instruments | | Balance as of
May 31, 2015 | | Change in
Unrealized
Appreciation | | Purchases | | Sales
Proceeds | | Transfers
into
Level 3 | | Transfers
out of
Level 3 | | Balance as of
May 31, 2016 | | Net change in
Unrealized
Appreciation
included in the
Statement of
Operations
attributable to
Level 3
investments
held at
May 31, 2016 | |
Rights | | $ | (16 | ) | | $ | 4 | | | $ | – | | | $ | – | | | $ | – | | | $ | – | | | $ | (12 | ) | | $ | 4 | | |
Total $ (16) $ 4 $– $ – $ – $ – $ (12) $ 4
See Notes to Financial Statements.
www.arbitragefunds.com | 1-800-295-4485
38
The Arbitrage Credit Opportunities Fund Manager Commentary
The Arbitrage Credit Opportunities Fund | Tickers: ARCFX, ACFIX, ARCCX, AGCAX
The Fund's Goal and Main Investments
The Fund seeks to provide current income and capital growth by focusing on company-specific catalysts and events in order to generate returns that are more correlated to the outcomes and timelines of those events, rather than on overall market direction or changes in interest rates.
Investment Strategy
The Fund employs a fundamentally driven strategy combined with quantitative security analysis. The investment team screens catalyst-driven investments such as mergers, acquisitions, asset sales, spin-offs, refinancings, recapitalizations, corporate reorganizations, litigation, and regulatory changes. From this universe the team selects investments based on factors such as risk/reward profile, potential downside, and security liquidity. The team generates returns by holding outright long and short positions and by utilizing capital structure arbitrage, merger arbitrage, and convertible arbitrage techniques to exploit security mispricing or inefficiencies. This portfolio offers a pure-play credit implementation of Water Island Capital's broader event-driven style.
Fiscal Year Highlights
The Arbitrage Credit Opportunities Fund (Class I shares: ACFIX) returned 0.30% for fiscal year 2016. The Fund's returns were driven primarily from the Americas, with the consumer discretionary and information technology sectors contributing the most to returns. The Fund's worst performing sector was telecommunications services.
The Fund's best performer was our investment in Cablevision Systems (CVC), which we initiated in 2015 after Altice – a Dutch operator of cable and wireless services – announced it would be acquiring the company. Altice had recently expanded its global footprint through its 2015 acquisition of Cequel Communications, and was looking to do so again with CVC. As part of Altice's acquisition financing, CVC issued $4.8 billion of bonds during the Q4 2015. These bonds were unique because in the event that the company did not consummate its merger with Altice, then the company was required to redeem the bonds at par. This was an attractive feature because in the event of a deal break, the downside for the bonds would be limited to par. This compared very favorably to CVC's equity which arguably held a downside of over 40%. Another opportunity that emerged from this new bond issue was that forced selling due to outflows in the high yield market caused a wide spread to occur between the newly issued CVC debt and currently outstanding CVC debt. Consequently, we purchased the newly issued Cablevision bonds with a 10.875% coupon and implemented a hedge by shorting certain lower yielding and lower coupon debt which ranked pari passu in the company's capital structure. We also implemented an equity hedge as part of this position to further insulate the position in the event of a deal break. During Q2, the merger between the companies closed, and the spread between our long and short compressed leading to positive returns for the portfolio.
The second highest contributor was Frontier Communications (FTR), a provider of communications services to residential and business customers in rural areas and small and medium-sized towns and cities in the United States. In February 2015, FTR announced that it would acquire Verizon's wireline operations in California, Florida, and Texas for $10.5 billion. We believed the FTR's bonds represented an attractive delevering opportunity as the company integrated the Verizon assets and created additional cost synergies. During Q3 2015, the company completed financing for the transaction, and the deal itself closed during Q1 2016. Following the
Annual Report | May 31, 2016
39
The Arbitrage Credit Opportunities Fund Manager Commentary (continued)
close, the company published relatively positive pro-forma financials for the merged company which led to higher bond prices and positive contributions to the Fund. We continue to monitor the situation and await our pricing targets for future sales in the company's bonds.
The portfolio's largest detractor for the year was NII Holdings (NIHD). NIHD is a wireless telecommunications service provider with a focus on markets in Brazil and Argentina, which filed for bankruptcy protection in September 2014. We established a position in NIHD's debt in early 2015 after a group of its largest creditors agreed on a reorganization plan that we believed offered NIHD creditors attractive risk-adjusted returns upon emergence from Chapter 11. Following its exit from bankruptcy during Q2 2015, where holders received cash and equity in the company, a combination of events, including weakness for Brazilian assets, motivated bond holders seeking to quickly exit the equity that they received as part of the reorganization process, and a poor earnings release shortly following exit from Chapter 11, all conspired to pressure prices of NIHD equity. As conditions in Brazil and the wireless sector rapidly deteriorated into late 2015, we sold our position in the Fund as we saw diminishing prospects for a clear or near-dated catalyst.
The Fund also experienced losses in Clear Channel Outdoor Holdings (CCO). CCO provides billboards, transit displays, and other out-of-home advertising options in North America and Europe. Our thesis was that the company would pursue certain asset sales to de-lever its balance sheet. However, during Q4 2015, CCO issued additional debt from its international subsidiary and used the proceeds to pay a dividend to shareholders. This shareholder-friendly action led to a sharp decline in the company's bond prices during the quarter. We exited this position during Q1 2016 after prices partially recovered, as we felt that our catalyst had become less definitive and that management was not fully supportive of addressing creditor issues such as near-term de-levering.
www.arbitragefunds.com | 1-800-295-4485
40
The Arbitrage Credit Opportunities Fund Portfolio Information
Performance (annualized returns as of May 31, 2016)
| | One
Year | | Since
Inception* | |
Arbitrage Credit Opportunities Fund, Class R | | | 0.10 | % | | | 1.98 | % | |
Arbitrage Credit Opportunities Fund, Class I | | | 0.30 | % | | | 2.17 | % | |
Arbitrage Credit Opportunities Fund, Class C** | | | -0.72 | % | | | 1.26 | % | |
Arbitrage Credit Opportunities Fund, Class A*** | | | 0.02 | % | | | 1.60 | % | |
Barclays Capital U.S. Aggregate Bond Index | | | 2.99 | % | | | 2.18 | % | |
BofA Merrill Lynch High Yield Master II Index | | | -0.92 | % | | | 4.42 | % | |
Current performance may be higher or lower than performance quoted above. Any performance data quoted represents past performance and the investment return and principal value of an investment in the Fund will fluctuate so that an investor's shares, when redeemed, may be worth more or less than their original cost. Past performance is no guarantee of future results. Returns do not reflect a 2% redemption fee for shares that are redeemed from the fund within 60 days of purchase, which, if reflected, would reduce the performance quoted. Returns shown above include the reinvestment of all dividends and capital gains. Contractual fee waivers are currently in effect. Without such fee waivers, performance numbers would be reduced. You can obtain performance data current to the most recent month end by calling 1-800-295-4485 or going to www.arbitragefunds.com.
* Class R, Class I and Class C inception: 10/1/12; Class A inception: 6/1/13.
** Class C shares are subject to a 1.00% contingent deferred sales charge on all purchases redeemed in 12 months of purchase.
*** Class A shares are subject to a maximum front-end sales load of 3.25% on purchases up to $500,000. The shares are also subject to a deferred sales charge of up to 1.00% on purchases of $500,000 or more purchased without a front-end sales load and redeemed within 18 months of purchase.
The Total Annual Fund Operating Expenses for Class R, Class I, Class C and Class A are 2.30%, 2.05%, 3.05% and 2.30%, respectively. The Advisor has agreed to waive fees (not including the effects of interest, dividends on short positions, brokerage commissions, acquired fund fees and expenses, taxes, or other extraordinary expenses) in excess of 1.50%, 1.25%, 2.25% and 1.50% for Class R, Class I, Class C and Class A, respectively, until at least September 30, 2017. These expense ratios are as stated in the current prospectus and may differ from the expense ratios disclosed in the financial highlights in this report.
The Barclays Capital U.S. Aggregate Bond Index is a market value-weighted index of investment grade fixed-rated debt issues, including government, corporate, asset-backed and mortgage-backed securities with a maturity of one year or more.
The Bank of America (BofA) Merrill Lynch U.S. High Yield Master II Index is a measure of the broad high yield market, commonly used as a benchmark for high yield corporate bonds.
An investor may not invest directly in an index.
Annual Report | May 31, 2016
41
The Arbitrage Credit Opportunities Fund Portfolio Information (continued)
Growth of $10,000 Investment
The chart represents historical performance of a hypothetical investment of $10,000 in the Class R shares of the Fund since inception. Past performance does not guarantee future results. This chart does not reflect the deduction of taxes that a shareholder would pay on Fund distributions or the redemption of Fund shares.
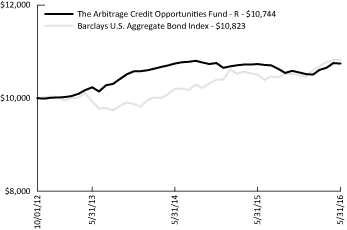
Sector Weighting
The following chart shows the sector weightings of The Arbitrage Credit Opportunities Fund's investments in common stock, corporate bonds and convertible corporate bonds as of the report date.

www.arbitragefunds.com | 1-800-295-4485
42
The Arbitrage Credit Opportunities Fund Portfolio of Investments
| | | Shares | | Value | |
COMMON STOCKS - 2.68% | |
Commercial Services - 0.62% | |
Macquarie Infrastructure Corp. | | | 4,800 | | | $ | 343,728 | | |
Oil & Gas - 0.24% | |
Continental Resources, Inc.(a) | | | 3,100 | | | | 130,386 | | |
Software - 1.82% | |
Red Hat, Inc.(a) | | | 4,800 | | | | 371,808 | | |
salesforce.com, Inc.(a) | | | 7,700 | | | | 644,567 | | |
| | | | 1,016,375 | | |
TOTAL COMMON STOCKS
(Cost $1,259,107) | | | 1,490,489 | | |
| | | Maturity
Date | | Rate | | Principal
Amount | | Value | |
CORPORATE BONDS - 61.15% | |
Aerospace & Defense - 1.79% | |
TransDigm, Inc. | | 07/15/2021 | | | 7.500 | % | | $ | 942,000 | | | $ | 997,642 | | |
Chemicals - 2.83% | |
Ashland, Inc. | | 04/15/2018 | | | 3.875 | % | | | 562,000 | | | | 576,050 | | |
Nexeo Solutions LLC/Nexeo
Solutions Finance Corp. | | 03/01/2018 | | | 8.375 | % | | | 1,000,000 | | | | 1,000,000 | | |
| | | | 1,576,050 | | |
Commercial Services - 1.64% | |
ExamWorks Group, Inc. | | 04/15/2023 | | | 5.625 | % | | | 851,000 | | | | 912,698 | | |
Computers & Computer Services - 4.57% | |
Denali Borrower LLC/Denali
Finance Corp.(b) | | 10/15/2020 | | | 5.625 | % | | | 845,000 | | | | 888,518 | | |
Western Digital Corp.(b) | |
| | | 04/01/2023 | | | 7.375 | % | | | 1,037,000 | | | | 1,081,072 | | |
| | | 04/01/2024 | | | 10.500 | % | | | 561,000 | | | | 580,635 | | |
| | | | 2,550,225 | | |
Diversified Financial Services - 2.43% | |
GFI Group, Inc. | | 07/19/2018 | | | 8.375 | % | | | 418,000 | | | | 443,603 | | |
Icahn Enterprises LP/Icahn
Enterprises Finance Corp. | | 03/15/2017 | | | 3.500 | % | | | 915,000 | | | | 912,712 | | |
| | | | 1,356,315 | | |
See Notes to Financial Statements.
Annual Report | May 31, 2016
43
The Arbitrage Credit Opportunities Fund Portfolio of Investments (continued)
| | | Maturity
Date | | Rate | | Principal
Amount | | Value | |
CORPORATE BONDS - 61.15% (Continued) | |
Electric - 1.44% | |
Energy Future Intermediate
Holding Co. LLC / EFIH
Finance, Inc.(b)(c) | | 03/01/2022 | | | 11.750 | % | | $ | 695,040 | | | $ | 801,034 | | |
Entertainment - 3.67% | |
DreamWorks Animation
SKG, Inc.(b) | | 08/15/2020 | | | 6.875 | % | | | 1,000,000 | | | | 1,061,250 | | |
Peninsula Gaming LLC/
Peninsula Gaming Corp.(b) | | 02/15/2018 | | | 8.375 | % | | | 900,000 | | | | 909,000 | | |
Pinnacle Entertainment, Inc.(b) | | 05/01/2024 | | | 5.625 | % | | | 76,000 | | | | 74,290 | | |
| | | | 2,044,540 | | |
Food - 5.28% | |
Bumble Bee Holdco., SCA,
PIK (10.38% PIK)(b)(d) | | 03/15/2018 | | | 9.625 | % | | | 250,000 | | | | 247,500 | | |
Bumble Bee Holdings, Inc.(b)(e) | | 12/15/2017 | | | 9.000 | % | | | 1,307,000 | | | | 1,323,337 | | |
Simmons Foods, Inc.(b) | | 10/01/2021 | | | 7.875 | % | | | 500,000 | | | | 455,000 | | |
US Foods, Inc. | | 06/30/2019 | | | 8.500 | % | | | 893,000 | | | | 915,325 | | |
| | | | 2,941,162 | | |
Food Service - 1.56% | |
Aramark Services, Inc. | | 03/15/2020 | | | 5.750 | % | | | 845,000 | | | | 871,934 | | |
Healthcare - Products - 2.41% | |
Alere, Inc. | | 06/15/2020 | | | 6.500 | % | | | 1,340,000 | | | | 1,343,350 | | |
Insurance - 3.35% | |
Ambac Assurance Corp.(b) | | 06/07/2020 | | | 5.100 | % | | | 1,648,813 | | | | 1,865,220 | | |
Lodging - 0.75% | |
Boyd Gaming Corp. | | 07/01/2020 | | | 9.000 | % | | | 400,000 | | | | 419,500 | | |
Machinery - Construction & Mining - 0.96% | |
Terex Corp. | | 05/15/2021 | | | 6.000 | % | | | 540,000 | | | | 533,925 | | |
Machinery - Diversified - 1.73% | |
SPX FLOW, Inc.(e) | | 09/01/2017 | | | 6.875 | % | | | 926,000 | | | | 964,198 | | |
See Notes to Financial Statements.
www.arbitragefunds.com | 1-800-295-4485
44
The Arbitrage Credit Opportunities Fund Portfolio of Investments (continued)
| | | Maturity
Date | | Rate | | Principal
Amount | | Value | |
CORPORATE BONDS - 61.15% (Continued) | |
Media - 6.22% | |
LIN Television Corp. | | 01/15/2021 | | | 6.375 | % | | $ | 753,000 | | | $ | 785,002 | | |
Neptune Finco Corp.(b)(e) | | 10/15/2025 | | | 10.875 | % | | | 1,992,000 | | | | 2,265,900 | | |
Univision
Communications, Inc.(b) | | 05/15/2021 | | | 8.500 | % | | | 400,000 | | | | 419,000 | | |
| | | | 3,469,902 | | |
Miscellaneous Manufacturing - 2.77% | |
LSB Industries, Inc.(e) | | 08/01/2019 | | | 7.750 | % | | | 1,517,000 | | | | 1,546,538 | | |
Oil & Gas - 1.14% | |
Whiting Petroleum Corp. | | 03/15/2021 | | | 5.750 | % | | | 750,000 | | | | 635,625 | | |
Packaging & Containers - 4.41% | |
Reynolds Group Issuer, Inc./
Reynolds Group Issuer LLC/
Reynolds Group Issuer
(Luxembourg) SA | | 04/15/2019 | | | 7.125 | % | | | 372,000 | | | | 378,975 | | |
Reynolds Group Issuer, Inc./
Reynolds Group
Issuer LLC/Reynolds
Group Issuer
(Luxembourg) SA(e) | | 08/15/2019 | | | 9.875 | % | | | 2,000,000 | | | | 2,077,500 | | |
| | | | 2,456,475 | | |
Retail - 4.74% | |
Rite Aid Corp.(e) | | 03/15/2020 | | | 9.250 | % | | | 1,000,000 | | | | 1,055,000 | | |
Rite Aid Corp.(b) | | 04/01/2023 | | | 6.125 | % | | | 1,500,000 | | | | 1,586,250 | | |
| | | | 2,641,250 | | |
Semiconductors - 0.36% | |
NXP BV / NXP Funding LLC(b) | | 09/15/2016 | | | 3.500 | % | | | 200,000 | | | | 200,560 | | |
Telecommunications - 7.10% | |
Cincinnati Bell, Inc. | | 10/15/2020 | | | 8.375 | % | | | 692,000 | | | | 721,410 | | |
FairPoint
Communications, Inc.(b) | | 08/15/2019 | | | 8.750 | % | | | 525,000 | | | | 505,313 | | |
Frontier
Communications Corp.(b) | | 09/15/2025 | | | 11.000 | % | | | 933,000 | | | | 949,327 | | |
Sprint Communications, Inc.(e) | | 12/01/2016 | | | 6.000 | % | | | 1,253,000 | | | | 1,267,096 | | |
Sprint Communications, Inc. | | 03/01/2017 | | | 9.125 | % | | | 500,000 | | | | 516,505 | | |
| | | | 3,959,651 | | |
TOTAL CORPORATE BONDS & NOTES
(Cost $33,677,580) | | | 34,087,794 | | |
See Notes to Financial Statements.
Annual Report | May 31, 2016
45
The Arbitrage Credit Opportunities Fund Portfolio of Investments (continued)
| | | Maturity
Date | | Rate | | Principal
Amount | | Value | |
CONVERTIBLE CORPORATE BONDS - 15.95% | |
Electric - 0.92% | |
Emera, Inc. | | 09/29/2025 | | | 4.000 | % | | $ | 1,560,000 | | | $ | 511,534 | | |
Home Furnishings - 4.32% | |
TiVo, Inc.(e) | | 10/01/2021 | | | 2.000 | % | | | 2,454,000 | | | | 2,409,521 | | |
Internet - 6.78% | |
Shutterfly, Inc. | | 05/15/2018 | | | 0.250 | % | | | 1,500,000 | | | | 1,515,000 | | |
Twitter, Inc. | | 09/15/2021 | | | 1.000 | % | | | 1,500,000 | | | | 1,258,125 | | |
Yahoo!, Inc.(e)(f) | | 12/01/2018 | | | 0.000 | % | | | 1,000,000 | | | | 1,005,625 | | |
| | | | 3,778,750 | | |
Software - 3.93% | |
inContact, Inc. | | 04/01/2022 | | | 2.500 | % | | | 1,000,000 | | | | 1,198,750 | | |
NetSuite, Inc. | | 06/01/2018 | | | 0.250 | % | | | 1,000,000 | | | | 990,625 | | |
| | | | 2,189,375 | | |
TOTAL CONVERTIBLE CORPORATE BONDS
(Cost $8,760,298) | | | 8,889,180 | | |
| | Expiration
Date | | Exercise
Price | | Contracts | | Value | |
PURCHASED OPTIONS(a) - 0.03% | |
Call Options Purchased - 0.02% | |
LSB Industries, Inc.: | |
| | | 06/2016 | | $ | 10.00 | | | | 26 | | | $ | 8,580 | | |
| | | 06/2016 | | | 12.50 | | | | 26 | | | | 3,575 | | |
TOTAL CALL OPTIONS PURCHASED
(Cost $11,227) | | | 12,155 | | |
Put Options Purchased - 0.01% | |
iShares Russell 2000 ETF | | 06/2016 | | | 108.00 | | | | 350 | | | | 7,175 | | |
TOTAL PURCHASED OPTIONS
(Cost $61,301) | | | 19,330 | | |
See Notes to Financial Statements.
www.arbitragefunds.com | 1-800-295-4485
46
The Arbitrage Credit Opportunities Fund Portfolio of Investments (continued)
See Notes to Financial Statements.
| | | Yield | | Shares | | Value | |
SHORT-TERM INVESTMENTS - 18.59% | |
Money Market Fund | |
State Street Institutional Liquid Reserves Fund | | | 0.455 | %(g) | | | 10,357,990 | | | $ | 10,357,990 | | |
Time Deposits | |
State Street Bank Time Deposit | | | | | 6,700 | | | | 6,700 | | |
TOTAL SHORT-TERM INVESTMENTS
(Cost $10,364,690) | | | 10,364,690 | | |
Total Investments - 98.40%
(Cost $54,122,976) | | | 54,851,483 | | |
Other Assets in Excess of Liabilities - 1.60%(h) | | | 891,316 | | |
NET ASSETS - 100.00% | | $ | 55,742,799 | | |
Portfolio Footnotes
(a) Non-income-producing security.
(b) Security exempt from registration under Rule 144A of the Securities Act of 1933. These securities may be resold in transactions exempt from registration, normally to qualified institutional buyers. As of May 31, 2016, these securities had a total value of $15,213,206 or 27.29% of net assets.
(c) Security in default on interest payments.
(d) Security considered illiquid. On May 31, 2016, the total market value of these securities was $247,500, representing 0.44% of net assets.
(e) Security, or a portion of security, is being held as collateral for short sales or written option contracts. At May 31, 2016, the aggregate market value of those securities was $9,466,034, representing 16.98% of net assets.
(f) Represents a zero coupon bond.
(g) Rate shown is the 7-day effective yield as of May 31, 2016.
(h) Includes cash which is being held as collateral for short sales and written option contracts.
Securities are determined to be illiquid under the procedures approved by the Funds' Board of Trustees. Information related to the Fund's illiquid securities as of May 31, 2016 is as follows:
Date of
Purchase | | Security | | Cost | | Value | | % of Net Assets | |
06/02/2015 | | Bumble Bee Holdco., SCA | | $ | 256,251 | | | $ | 247,500 | | | | 0.44 | % | |
Annual Report | May 31, 2016
47
The Arbitrage Credit Opportunities Fund Portfolio of Investments (continued)
SCHEDULE OF SECURITIES SOLD SHORT | | Shares | | Value | |
COMMON STOCKS - (6.26%) | |
Electric - (2.34%) | |
Emera, Inc. | | | (37,109 | ) | | $ | (1,307,665 | ) | |
Internet - (0.81%) | |
Shutterfly, Inc. | | | (5,900 | ) | | | (284,970 | ) | |
Twitter, Inc. | | | (3,900 | ) | | | (59,358 | ) | |
Yahoo!, Inc. | | | (2,800 | ) | | | (106,232 | ) | |
| | | | (450,560 | ) | |
Lodging - (0.08%) | |
Boyd Gaming Corp. | | | (2,500 | ) | | | (47,275 | ) | |
Media - (0.92%) | |
Cablevision Systems Corp., Class A | | | (14,755 | ) | | | (511,704 | ) | |
Miscellaneous Manufacturing - (0.12%) | |
LSB Industries, Inc. | | | (5,200 | ) | | | (68,380 | ) | |
Software - (1.86%) | |
inContact, Inc. | | | (59,700 | ) | | | (828,636 | ) | |
NetSuite, Inc. | | | (2,600 | ) | | | (206,206 | ) | |
| | | | (1,034,842 | ) | |
Telecommunications - (0.13%) | |
Frontier Communications Corp. | | | (14,182 | ) | | | (73,321 | ) | |
TOTAL COMMON STOCKS
(Proceeds $3,482,909) | | | (3,493,747 | ) | |
See Notes to Financial Statements.
www.arbitragefunds.com | 1-800-295-4485
48
The Arbitrage Credit Opportunities Fund Portfolio of Investments (continued)
| | | Maturity
Date | | Rate | | Principal
Amount | | Value | |
CORPORATE BONDS - (24.67%) | |
Chemicals - (2.40%) | |
Ashland, Inc. | | 08/15/2022 | | | 4.750 | % | | $ | (1,325,000 | ) | | $ | (1,340,370 | ) | |
Computers & Computer Services - (3.47%) | |
Diamond 1 Finance Corp./
Diamond 2 Finance Corp. | | 06/15/2023 | | | 5.450 | % | | | (259,000 | ) | | | (263,225 | ) | |
EMC Corp. | | 06/01/2020 | | | 2.650 | % | | | (1,370,000 | ) | | | (1,279,349 | ) | |
Seagate HDD Cayman | | 01/01/2025 | | | 4.750 | % | | | (510,000 | ) | | | (392,899 | ) | |
| | | | (1,935,473 | ) | |
Internet - (1.58%) | |
Symantec Corp. | | 09/15/2020 | | | 4.200 | % | | | (842,000 | ) | | | (877,948 | ) | |
Media - (2.29%) | |
CSC Holdings LLC | | 06/01/2024 | | | 5.250 | % | | | (1,417,000 | ) | | | (1,275,300 | ) | |
Oil & Gas - (5.61%) | |
Continental Resources, Inc. | | 09/15/2022 | | | 5.000 | % | | | (2,000,000 | ) | | | (1,890,000 | ) | |
Whiting Petroleum Corp. | | 04/01/2023 | | | 6.250 | % | | | (1,500,000 | ) | | | (1,237,500 | ) | |
| | | | (3,127,500 | ) | |
Oil & Gas Services - (0.40%) | |
National Oilwell Varco, Inc. | | 12/01/2022 | | | 2.600 | % | | | (248,000 | ) | | | (220,773 | ) | |
Packaging & Containers - (4.66%) | |
Reynolds Group Issuer, Inc./
Reynolds Group
Issuer LLC/Reynolds
Group Issuer
(Luxembourg) SA | | 02/15/2021 | | | 8.250 | % | | | (2,500,000 | ) | | | (2,597,000 | ) | |
Retail - (3.67%) | |
Nordstrom, Inc. | | 10/15/2021 | | | 4.000 | % | | | (1,194,000 | ) | | | (1,246,692 | ) | |
Walgreens Boots Alliance, Inc. | | 11/18/2024 | | | 3.800 | % | | | (770,000 | ) | | | (798,401 | ) | |
| | | | (2,045,093 | ) | |
Telecommunications - (0.59%) | |
CenturyLink, Inc. | | 04/01/2025 | | | 5.625 | % | | | (374,000 | ) | | | (330,990 | ) | |
TOTAL CORPORATE BONDS
(Proceeds $13,251,991) | | | (13,750,447 | ) | |
See Notes to Financial Statements.
Annual Report | May 31, 2016
49
The Arbitrage Credit Opportunities Fund Portfolio of Investments (continued)
| | | Maturity
Date | | Rate | | Principal
Amount | | Value | |
CONVERTIBLE CORPORATE BONDS - (4.61%) | |
Commercial Services - (1.54%) | |
Macquarie Infrastructure Corp. | | 07/15/2019 | | | 2.875 | % | | $ | (750,000 | ) | | $ | (860,156 | ) | |
Software - (3.07%) | |
Red Hat, Inc. | | 10/01/2019 | | | 0.250 | % | | | (550,000 | ) | | | (695,062 | ) | |
salesforce.com, Inc. | | 04/01/2018 | | | 0.250 | % | | | (750,000 | ) | | | (1,013,438 | ) | |
| | | | (1,708,500 | ) | |
TOTAL CONVERTIBLE CORPORATE BONDS
(Proceeds $2,269,954) | | | (2,568,656 | ) | |
TOTAL SECURITIES SOLD SHORT
(Proceeds $19,004,854) | | $ | (19,812,850 | ) | |
WRITTEN OPTIONS | | Expiration
Date | | Exercise
Price | | Contracts | | Value | |
Written Put Options | |
iShares Russell 2000 ETF | | 06/2016 | | $ | 105.00 | | | | (350 | ) | | $ | (3,675 | ) | |
| LSB Industries, Inc.06/20167.50(26) | | | (260 | ) | |
TOTAL WRITTEN PUT OPTIONS
(Premiums received $34,737) | | | (3,935 | ) | |
TOTAL WRITTEN OPTIONS
(Premiums received $34,737) | | $ | (3,935 | ) | |
OUTSTANDING FORWARD FOREIGN CURRENCY EXCHANGE CONTRACTS
Contract
Description | | Counterparty | | Contracts to
Deliver/Receive | | Purchase/Sale
Contract | | Expiration
Date | | Current Value | | Unrealized
Depreciation | |
CAD | Gol | dman Sachs | | 1,037,200 | | Purchase | | 06/15/2016 | | $790,918 | | $(25,632) | |
The following is a summary of investments classified by country exposure:
Country | | % of Net Assets(a) | |
Canada | | | 0.92 | % | |
Luxembourg | | | 0.44 | % | |
Netherlands | | | 0.36 | % | |
United States | | | 96.68 | % | |
Other Assets in Excess of Liabilities | | | 1.60 | % | |
| | | | 100.00 | % | |
(a) These percentages represent long positions only and are not net of short positions.
See Notes to Financial Statements.
www.arbitragefunds.com | 1-800-295-4485
50
The Arbitrage Credit Opportunities Fund Portfolio of Investments (continued)
Abbreviations:
BV - Besloten Vennootschap is the Dutch term for private limited liability company.
CAD - Canadian dollar
ETF - Exchange-Traded Fund
LLC - Limited Liability Company
LP - Limited Partnership
PIK - Payment-in-kind
SA - Generally designates corporations in various countries, mostly those employing civil law. This translates literally in all languages mentioned as anonymous company.
SCA - Societe en commandite par actions is the French term for limited liability partnership.
The following table summarizes The Arbitrage Credit Opportunities Fund's investments and derivative financial instruments categorized in the disclosure hierarchy as of May 31, 2016:
Investments in Securities at Value* | | Level 1 | | Level 2 | | Level 3 | | Total | |
Assets | |
Common Stocks** | | $ | 1,490,489 | | | $ | — | | | $ | — | | | $ | 1,490,489 | | |
Corporate Bonds** | | | — | | | | 34,087,794 | | | | — | | | | 34,087,794 | | |
Convertible Corporate Bonds** | | | — | | | | 8,889,180 | | | | — | | | | 8,889,180 | | |
Purchased Options | | | 19,330 | | | | — | | | | — | | | | 19,330 | | |
Short-Term Investments | | | 10,364,690 | | | | — | | | | — | | | | 10,364,690 | | |
TOTAL | | $ | 11,874,509 | | | $ | 42,976,974 | | | $ | — | | | $ | 54,851,483 | | |
Other Financial Instruments*** | |
Liabilities | |
Common Stocks** | | | (3,493,747 | ) | | | — | | | | — | | | | (3,493,747 | ) | |
Corporate Bonds** | | | — | | | | (13,750,447 | ) | | | — | | | | (13,750,447 | ) | |
Convertible Bonds** | | | — | | | | (2,568,656 | ) | | | — | | | | (2,568,656 | ) | |
Written Options | | | (3,935 | ) | | | — | | | | — | | | | (3,935 | ) | |
Forward Foreign Currency Exchange
Contracts | | | — | | | | (25,632 | ) | | | — | | | | (25,632 | ) | |
TOTAL | | $ | (3,497,682 | ) | | $ | (16,344,735 | ) | | $ | — | | | $ | (19,842,417 | ) | |
* Refer to footnote 2 where leveling hierarchy is defined.
** Refer to Portfolio of Investments for sector information.
*** Other financial instruments are instruments such as written options, securities sold short, equity swaps and forward foreign currency exchange contracts.
See Notes to Financial Statements.
Annual Report | May 31, 2016
51
The Arbitrage Tactical Equity Fund Manager Commentary
The Arbitrage Tactical Equity Fund | Tickers: ATQFX, ATQIX, ATQCX, ATQAX
The Fund's Goal and Main Investments
The Fund seeks to provide capital appreciation by exploiting security mispricings or market inefficiencies, with a focus on delivering a return stream with lower volatility than and low correlation to the broader equity markets.
Investment Strategy
The Fund seeks to profit from investing in securities of companies whose stock price trades significantly higher or lower from where we believe it should trade. We anticipate such differences may occur when news and events create misperception of a company's correct stock price. Examples of such news and events may include changes in industry or sector fundamentals, announcements or potential announcements of restructurings (bankruptcies, spinoffs, and asset sales), mergers and acquisitions, earnings results and outlook, regulatory changes, and litigation. Our investment approach is to identify these differences and to tactically purchase or sell short such securities in order to achieve the Fund's objective. The Fund may engage in active and frequent trading of portfolio securities to achieve its investment objective. In certain circumstances, the team may seek to proactively engage with company management to address opportunities that may further unlock value or discuss concerns.
Fiscal Year Highlights
The Arbitrage Tactical Equity Fund (Class I shares: ATQIX) returned -7.12% for fiscal year 2016. The Fund's returns were driven primarily from the Americas. Consumer discretionary and information technology were the top contributors on a sector basis. Conversely, industrials was the worst performing sector, followed by utilities and energy.
The Fund's largest contributor to returns during the period was our investment in Pinnacle Entertainment (PNK). After succumbing to pressure from a hostile bid from Gaming & Leisure Properties (GLPI), PNK announced in July 2015 a definitive agreement to sell its real estate casino assets to GLPI, while also spinning off its casino management business into a new company ("OpCo"). Our analysis indicated that should GLPI complete the transaction, the remaining OpCo was significantly undervalued relative to peers. As such, we established a synthetic position in OpCo prior to the GLPI transaction completing – thus benefiting from any price increase pre and post spin-off. During Q2 2016, the spin-off was completed and the OpCo re-rated from around $6.50 to around $11, leading to gains for the Fund.
The second best performer was Journal Media Group, which we'd owned since its spin-off from EW Scripps in April 2015, as we felt that the company provided an attractive opportunity to own assets in a consolidating sector. That thesis proved correct in October 2015 as shares of Journal Media Group gained 50% following a deal to be sold to Gannett for $12 per share. The transaction closed in April 2016, resulting in a profit for the Fund.
The Fund also realized gains in our position in Media General (MEG). Our involvement in MEG began after the company completed its acquisition of LIN Media in December 2014. We owned the stock as we believed MEG could benefit from the synergies resulting from the LIN acquisition. However, after earnings misses over the course of the year, and following their announcement in August 2015 that they would pursue an acquisition of Meredith (a move viewed unfavorably by their shareholders) MEG's stock price plummeted. We held onto the position on the belief that
www.arbitragefunds.com | 1-800-295-4485
52
The Arbitrage Tactical Equity Fund Manager Commentary (continued)
the decrease in share price would either lead to shareholder activism or an acquisition offer. In September 2015, our thesis was confirmed as Nexstar made an offer for MEG contingent on them abandoning their Meredith acquisition. The Fund profited from this position as Nexstar made increasingly larger bids during Q4 2015 in an effort to lock down a definitive agreement (which it did in January 2016).
The Fund's worst detractor for the fiscal year was our investment in HC2 Holdings. HC2 is an investment holding company that trades at a significant discount to its sum-of-the-parts valuation. The share price has declined as a result of technical pressure from original PIPE (Private Investment in Public Equity) investors exiting their stakes, negative commentary on the business after a failed hostile bid for MCG Capital (the target's defense involved convincing its shareholders not to accept HC2's "overvalued" stock) and an equity issuance at depressed levels. While the company trades at a significant discount to fair value today, it recently indicated it would like to raise additional capital that we believe could involve equity and be dilutive. Depending on the amount of capital raised, our margin-of-safety to fair value may be marginalized over time and we have therefore exited the position.
The second worst performer was Dynegy, an electric utility company operating both coal-fired and natural gas-fired power stations across the US. While, historically, a majority of Dynegy's exposure was to coal-fired plants, after emerging from bankruptcy in 2012, the company began an aggressive acquisition of natural gas-fired plants and now has a 50-50 split of coal and gas utility/exposure. The Fund experienced losses in this position during Q3 2015 as Franklin Resources, a bond income fund which owned Dynegy in bankruptcy and was a large shareholder of the company's equity, filed a 13D looking to potentially sell their position. The market reacted to this news with a sell-off as the prevailing belief was that because Franklin Resources was under duress (the Fund previously had significant exposure to distressed energy names as energy prices plummeted in the latter half of the year), they would sell their equity holdings at depressed levels in order to raise funds and that Dynegy's stock price would be negatively impacted. While we believe Dynegy was attractively valued, we chose to exit our position in the Q4 2015 as we believed the duration associated with a change in sentiment around Dynegy's fundamentals was no longer appropriate.
The portfolio also experienced losses in situations involving InfraREIT and Nomad Foods. Our investment thesis in InfraREIT (HIFR), a Texas-based transmission real estate investment trust (REIT) owned by the Hunt family, was predicated upon the family purchasing the assets of Energy Future Holdings during the latter company's bankruptcy process. Were the bankruptcy process successful, those assets were likely to be merged into InfraREIT, which could drive significant growth opportunities for the regulated asset. However, the position suffered losses in Q4 2015 as a result of a rising interest rate environment that reduced valuation multiples for dividend-yielding stocks. While we had hedged our position with a regulated utility exchange-traded fund (ETF) and a REIT ETF, neither saw the same negative move that HIFR sustained over the quarter. Nomad Foods is Europe's largest frozen food company, created through the merger of Iglo Foods and Findus Foods. While the frozen food category continues to face near term headwinds from private label, we believe the overhang is unwarranted and is more reflective of negative sentiment towards the company's top shareholder. By any reasonable metric, Nomad currently trades at a 50% discount to its intrinsic value – a valuation differential that we believe will dissipate over time as investors begin focusing on fundamentals. We admit the valuation uplift will take time, perhaps longer than our typical investment, but we believe the discrepancy is hard to ignore and are therefore sized accordingly.
Annual Report | May 31, 2016
53
The Arbitrage Tactical Equity Fund Portfolio Information
Performance (annualized returns as of May 31, 2016)
| | One
Year | | Since
Inception* | |
Arbitrage Tactical Equity Fund, Class R | | | -7.12 | % | | | -4.29 | % | |
Arbitrage Tactical Equity Fund, Class I | | | -7.12 | % | | | -4.29 | % | |
Arbitrage Tactical Equity Fund, Class C** | | | -7.12 | % | | | -4.29 | % | |
Arbitrage Tactical Equity Fund, Class A*** | | | -7.12 | % | | | -4.29 | % | |
S&P 500® Index | | | 1.72 | % | | | 2.75 | % | |
HFRI Event Driven: Special Situations Index | | | -4.89 | % | | | -0.08 | % | |
HFRI Equity Hedge (Total) Index | | | -5.32 | % | | | -0.53 | % | |
Current performance may be higher or lower than performance quoted above. Any performance data quoted represents past performance and the investment return and principal value of an investment in the Fund will fluctuate so that an investor's shares, when redeemed, may be worth more or less than their original cost. Past performance is no guarantee of future results. Returns do not reflect a 2% redemption fee for shares that are redeemed from the fund within 60 days of purchase, which, if reflected, would reduce the performance quoted. Returns shown above include the reinvestment of all dividends and capital gains. Contractual fee waivers are currently in effect. Without such fee waivers, performance numbers would be reduced. You can obtain performance data current to the most recent month end by calling 1-800-295-4485 or going to mnv.arbitragefunds.com.
* Class R, Class I Class C and Class A inception: 12/31/14.
** Class C shares are subject to a 1.00% contingent deferred sales charge on all purchases redeemed in 12 months of purchase.
*** Class A shares are subject to a maximum front-end sales load of 3.25% on purchases up to $500,000. The shares are also subject to a deferred sales charge of up to 1.00% on purchases of $500,000 or more purchased without a front-end sales load and redeemed within 18 months of purchase.
The Total Annual Fund Operating Expenses for Class R, Class 1, Class C and Class A are 6.07%, 5.82%, 6.82% and 6.07%, respectively. The Advisor has agreed to waive fees (not including the effects of interest, dividends on short positions, brokerage commissions, acquired fund fees and expenses, taxes, or other extraordinary expenses) in excess of 1.69%, 1.44%, 2.44% and 1.69%, for Class R, Class I, Class C and Class A, respectively, until at least December 31, 2017. These expense ratios are as stated in the current prospectus and may differ from the expense ratios disclosed in the financial highlights in this report.
The S&P 500® Index is an unmanaged index consisting of 500 stocks.
The HFRX Event Driven: Special Situations Index is an index that employs an investment process primarily focused on opportunities in equity and equity related instruments of companies which are currently engaged in a corporate transaction, security issuance/repurchase, asset sales, division spin-off or other catalyst oriented situation. These involve both announced transactions as well as situations which pre-, postdate or situations in which no formal announcement is expected to occur. Strategies employ an investment process focusing broadly on a wide spectrum of corporate life cycle investing, including but not limited to distressed, bankruptcy and post-bankruptcy security issuance, announced acquisitions and corporate division spin-offs, asset sales and other security issuance impacting an individual capital structure focusing primarily on situations identified via fundamental
www.arbitragefunds.com | 1-800-295-4485
54
The Arbitrage Tactical Equity Fund Portfolio Information (continued)
research which are likely to result in a corporate transactions or other realization of shareholder value through the occurrence of some identifiable catalyst. Strategies effectively employ primarily equity (greater than 60%) but also corporate debt exposure, and in general focus more broadly on post-bankruptcy equity exposure and exit of restructuring proceedings.
The HFRI Equity Hedge (Total) Index is an index where Investment Managers maintain positions both long and short in primarily equity and equity derivative securities. A wide variety of investment processes can be employed to arrive at an investment decision, including both quantitative and fundamental techniques; strategies can be broadly diversified or narrowly focused on specific sectors and can range broadly in terms of levels of net exposure, leverage employed, holding period, concentrations of market capitalizations and valuation ranges of typical portfolios. EH managers would typically maintain at least 50% exposure to, and may in some cases be entirely invested in, equities, both long and short.
An investor may not invest directly in an index.
Annual Report | May 31, 2016
55
The Arbitrage Tactical Equity Fund Portfolio Information (continued)
Growth of $10,000 Investment
The chart represents historical performance of a hypothetical investment of $10,000 in the Class R shares of the Fund since inception. Past performance does not guarantee future results. This chart does not reflect the deduction of taxes that a shareholder would pay on Fund distributions or the redemption of Fund shares.

Sector Weighting
The following chart shows the sector weightings of The Arbitrage Tactical Equity Fund's investments in common stock and exchange-traded funds as of the report date.
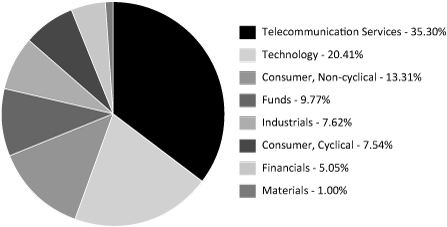
www.arbitragefunds.com | 1-800-295-4485
56
The Arbitrage Tactical Equity Fund Portfolio of Investments
| | | Shares | | Value | |
COMMON STOCKS - 34.90% | |
Aerospace & Defense - 1.18% | |
Harris Corp.(a) | | | 200 | | | $ | 15,754 | | |
Auto Parts & Equipment - 0.80% | |
Tower International, Inc. | | | 494 | | | | 10,705 | | |
Chemicals - 0.50% | |
Axiall Corp. | | | 287 | | | | 6,684 | | |
Computers & Computer Services - 4.37% | |
Accenture Plc, Class A | | | 28 | | | | 3,331 | | |
CGI Group, Inc., Class A(b) | | | 151 | | | | 7,064 | | |
Cognizant Technology Solutions Corp., Class A(b) | | | 53 | | | | 3,256 | | |
CSRA, Inc. | | | 285 | | | | 7,059 | | |
Electronics For Imaging, Inc.(b) | | | 291 | | | | 12,755 | | |
Genpact Ltd.(b) | | | 135 | | | | 3,806 | | |
Hewlett Packard Enterprise Co. | | | 1,126 | | | | 20,797 | | |
| | | | 58,068 | | |
Food - 1.53% | |
Nomad Foods Ltd.(a)(b) | | | 2,090 | | | | 20,315 | | |
Home Furnishings - 0.55% | |
TiVo, Inc.(b) | | | 730 | | | | 7,264 | | |
Internet - 5.60% | |
F5 Networks, Inc.(b) | | | 29 | | | | 3,196 | | |
Marketo, Inc.(b)(c) | | | 100 | | | | 3,523 | | |
Yahoo!, Inc.(a)(b) | | | 1,785 | | | | 67,723 | | |
| | | | 74,442 | | |
Media - 7.94% | |
Kabel Deutschland Holding AG | | | 568 | | | | 64,147 | | |
Nexstar Broadcasting Group, Inc., Class A | | | 592 | | | | 31,506 | | |
Viacom, Inc., Class B | | | 225 | | | | 9,983 | | |
| | | | 105,636 | | |
Office/Business Equip - 0.95% | |
Canon, Inc., Sponsored ADR | | | 436 | | | | 12,579 | | |
Pharmaceuticals - 4.26% | |
Allergan Plc(b) | | | 25 | | | | 5,894 | | |
Bayer AG | | | 104 | | | | 9,909 | | |
Celesio AG | | | 1,449 | | | | 40,894 | | |
| | | | 56,697 | | |
See Notes to Financial Statements.
Annual Report | May 31, 2016
57
The Arbitrage Tactical Equity Fund Portfolio of Investments (continued)
| | | Shares | | Value | |
COMMON STOCKS - 34.90% (Continued) | |
Real Estate Investment Trusts - 1.51% | |
Forest City Realty Trust, Inc., Class A | | | 882 | | | $ | 20,118 | | |
Retail - 2.78% | |
Cabela's, Inc.(b) | | | 609 | | | | 29,573 | | |
Office Depot, Inc.(b) | | | 2,052 | | | | 7,346 | | |
| | | | 36,919 | | |
Semiconductors - 0.69% | |
Rovi Corp.(b) | | | 550 | | | | 9,245 | | |
Software - 1.59% | |
Qlik Technologies, Inc.(b) | | | 442 | | | | 12,685 | | |
VMware, Inc., Class A(b) | | | 139 | | | | 8,418 | | |
| | | | 21,103 | | |
Telecommunications - 0.17% | |
LogMeIn, Inc.(b) | | | 36 | | | | 2,206 | | |
Transportation - 0.48% | |
Ansaldo STS SpA | | | 561 | | | | 6,404 | | |
TOTAL COMMON STOCKS
(Cost $450,365) | | | 464,139 | | |
EXCHANGE-TRADED FUNDS - 3.74% | |
Equity Funds - 3.74% | |
SPDR® S&P® Homebuilders ETF | | | 428 | | | | 14,629 | | |
Industrial Select Sector SPDR® Fund | | | 206 | | | | 11,521 | | |
Technology Select Sector SPDR® Fund | | | 165 | | | | 7,295 | | |
Consumer Staples Select Sector SPDR® Fund | | | 308 | | | | 16,238 | | |
| | | | 49,683 | | |
TOTAL EXCHANGE-TRADED FUNDS
(Cost $48,218) | | | 49,683 | | |
See Notes to Financial Statements.
www.arbitragefunds.com | 1-800-295-4485
58
The Arbitrage Tactical Equity Fund Portfolio of Investments (continued)
| | | Expiration
Date | | Exercise
Price | | Contracts | | Value | |
PURCHASED OPTIONS(b) - 0.34% | |
Call Option Purchased - 0.24% | |
Marketo, Inc. | | 07/2016 | | $ | 30.00 | | | | 6 | | | $ | 3,180 | | |
Put Options Purchased - 0.10% | |
Marketo, Inc. | | 07/2016 | | | 20.00 | | | | 2 | | | | 5 | | |
SPDR S&P500 ETF Trust | | 07/2016 | | | 195.00 | | | | 8 | | | | 660 | | |
Tribune Publishing Co.: | |
| | | 06/2016 | | | 10.00 | | | | 3 | | | | 113 | | |
| | | 10/2016 | | | 10.00 | | | | 5 | | | | 525 | | |
TOTAL PUT OPTIONS PURCHASED
(Cost $2,892) | | | 1,303 | | |
TOTAL PURCHASED OPTIONS
(Cost $4,202) | | | 4,483 | | |
| | Yield | | Shares | | Value | |
SHORT-TERM INVESTMENTS - 39.32% | |
Money Market Fund | |
State Street Institutional Liquid Reserves
Fund | | | 0.455 | %(d) | | | 522,932 | | | $ | 522,932 | | |
TOTAL SHORT-TERM INVESTMENTS
(Cost $522,932) | | | 522,932 | | |
Total Investments - 78.30%
(Cost $1,025,717) | | | 1,041,237 | | |
Other Assets in Excess of Liabilities - 21.70%(e) | | | 288,585 | | |
NET ASSETS - 100.00% | | $ | 1,329,822 | | |
Portfolio Footnotes
(a) Security, or a portion of security, is being held as collateral for short sales or written option contracts. At May 31, 2016, the aggregate market value of those securities was $74,652, representing 5.61% of net assets.
(b) Non-income-producing security.
(c) Underlying security for a written/purchased call/put option.
(d) Rate shown is the 7-day effective yield as of May 31, 2016.
(e) Includes cash which is being held as collateral for short sales and written option contracts.
See Notes to Financial Statements.
Annual Report | May 31, 2016
59
The Arbitrage Tactical Equity Fund Portfolio of Investments (continued)
SCHEDULE OF SECURITIES SOLD SHORT | | Shares | | Value | |
COMMON STOCKS - (27.21%) | |
Aerospace & Defense - (0.99%) | |
General Dynamics Corp. | | | (18 | ) | | $ | (2,554 | ) | |
Lockheed Martin Corp. | | | (11 | ) | | | (2,599 | ) | |
Northrop Grumman Corp. | | | (12 | ) | | | (2,552 | ) | |
Raytheon Co. | | | (23 | ) | | | (2,982 | ) | |
Rockwell Collins, Inc. | | | (28 | ) | | | (2,475 | ) | |
| | | | (13,162 | ) | |
Auto Parts & Equipment - (0.87%) | |
Autoliv, Inc. | | | (28 | ) | | | (3,433 | ) | |
BorgWarner, Inc. | | | (118 | ) | | | (4,016 | ) | |
Dana Holding Corp. | | | (111 | ) | | | (1,334 | ) | |
Magna International, Inc. | | | (70 | ) | | | (2,837 | ) | |
| | | | (11,620 | ) | |
Beverages - (2.15%) | |
Molson Coors Brewing Co., Class B | | | (289 | ) | | | (28,663 | ) | |
Chemicals - (0.19%) | |
Westlake Chemical Corp. | | | (56 | ) | | | (2,471 | ) | |
Commercial Services - (0.43%) | |
Booz Allen Hamilton Holding Corp. | | | (195 | ) | | | (5,708 | ) | |
Computers & Computer Services - (2.19%) | |
CACI International, Inc., Class A | | | (27 | ) | | | (2,721 | ) | |
Computer Sciences Corp. | | | (368 | ) | | | (18,106 | ) | |
International Business Machines Corp. | | | (34 | ) | | | (5,227 | ) | |
Science Applications International Corp. | | | (57 | ) | | | (3,110 | ) | |
| | | | (29,164 | ) | |
Construction Materials - (1.15%) | |
Armstrong World Industries, Inc. | | | (370 | ) | | | (15,299 | ) | |
Hand/Machine Tools - (0.42%) | |
Konecranes OYJ | | | (200 | ) | | | (5,532 | ) | |
Internet - (4.87%) | |
Alibaba Group Holding Ltd., Sponsored ADR | | | (722 | ) | | | (59,204 | ) | |
Marketo, Inc. | | | (159 | ) | | | (5,602 | ) | |
| | | | (64,806 | ) | |
See Notes to Financial Statements.
www.arbitragefunds.com | 1-800-295-4485
60
The Arbitrage Tactical Equity Fund Portfolio of Investments (continued)
| | | Shares | | Value | |
COMMON STOCKS - (27.21%) (Continued) | |
Machinery - Diversified - (1.03%) | |
Manitowoc Foodservice, Inc. | | | (828 | ) | | $ | (13,637 | ) | |
Media - (2.83%) | |
Cable One, Inc. | | | (32 | ) | | | (15,680 | ) | |
Gray Television, Inc. | | | (543 | ) | | | (6,418 | ) | |
Sinclair Broadcast Group, Inc., Class A | | | (258 | ) | | | (8,160 | ) | |
TEGNA, Inc. | | | (323 | ) | | | (7,416 | ) | |
| | | | (37,674 | ) | |
Office/Business Equip - (1.95%) | |
Xerox Corp. | | | (2,596 | ) | | | (25,882 | ) | |
Pharmaceuticals - (0.78%) | |
Merck KGaA | | | (104 | ) | | | (10,409 | ) | |
Real Estate Investment Trusts - (1.96%) | |
InnVest Real Estate Investment Trust | | | (3,780 | ) | | | (19,140 | ) | |
Seritage Growth Properties, Class A | | | (150 | ) | | | (6,931 | ) | |
| | | | (26,071 | ) | |
Retail - (0.19%) | |
Office Depot, Inc. | | | (700 | ) | | | (2,506 | ) | |
Semiconductors - (0.39%) | |
Intel Corp. | | | (163 | ) | | | (5,149 | ) | |
Software - (1.93%) | |
Citrix Systems, Inc. | | | (302 | ) | | | (25,646 | ) | |
Telecommunications - (2.89%) | |
CenturyLink, Inc. | | | (196 | ) | | | (5,316 | ) | |
Cisco Systems, Inc. | | | (178 | ) | | | (5,171 | ) | |
T-Mobile US, Inc. | | | (653 | ) | | | (27,922 | ) | |
| | | | (38,409 | ) | |
TOTAL COMMON STOCKS
(Proceeds $356,803) | | | (361,808 | ) | |
EXCHANGE-TRADED FUNDS - (2.99%) | |
Equity Funds - (2.99%) | |
Consumer Staples Select Sector SPDR® Fund | | | (269 | ) | | | (14,182 | ) | |
iShares® Nasdaq Biotechnology ETF | | | (4 | ) | | | (1,119 | ) | |
iShares® Russell 2000 Growth ETF | | | (10 | ) | | | (1,378 | ) | |
SPDR® S&P® Retail ETF | | | (160 | ) | | | (6,770 | ) | |
See Notes to Financial Statements.
Annual Report | May 31, 2016
61
The Arbitrage Tactical Equity Fund Portfolio of Investments (continued)
| | | Shares | | Value | |
EXCHANGE-TRADED FUNDS - (2.99%) (Continued) | |
Equity Funds - (2.99%) (Continued) | |
Vanguard REIT ETF | | | (195 | ) | | $ | (16,319 | ) | |
| | | | (39,768 | ) | |
TOTAL EXCHANGE-TRADED FUNDS
(Proceeds $38,739) | | | (39,768 | ) | |
TOTAL SECURITIES SOLD SHORT
(Proceeds $395,542) | | $ | (401,576 | ) | |
WRITTEN OPTIONS | | Expiration
Date | | Exercise
Price | | Contracts | | Value | |
Written Call Options | |
Marketo, Inc.: | |
| | | 07/2016 | | $ | 30.00 | | | | (2 | ) | | $ | (1,060 | ) | |
| | | 07/2016 | | | 35.00 | | | | (1 | ) | | | (45 | ) | |
T-Mobile US, Inc. | | 07/2016 | | | 43.00 | | | | (2 | ) | | | (291 | ) | |
TOTAL WRITTEN CALL OPTIONS
(Premiums received $1,298) | | | (1,396 | ) | |
Written Put Options | |
SPDR S&P500 ETF Trust | | 07/2016 | | | 185.00 | | | | (8 | ) | | | (268 | ) | |
TOTAL WRITTEN PUT OPTIONS
(Premiums received $1,193) | | | (268 | ) | |
TOTAL WRITTEN OPTIONS
(Premiums received $2,491) | | $ | (1,664 | ) | |
OUTSTANDING FORWARD FOREIGN CURRENCY EXCHANGE CONTRACTS
Contract
Description | | Counterparty | | Contracts to
Deliver/Receive | | Purchase/Sale
Contract | | Expiration
Date | | Current Value | | Unrealized
Appreciation | |
CAD | | | | Goldman Sachs | | | 26,160 | | | Purchase | | 06/15/2016 | | $ | 19,948 | | | $ | 33 | | |
CAD | | | | Goldman Sachs | | | 300 | | | Sale | | 06/15/2016 | | | 229 | | | | 1 | | |
EUR | | | | Goldman Sachs | | | 102,190 | | | Sale | | 06/15/2016 | | | 113,750 | | | | 2,214 | | |
HKD | | | | Goldman Sachs | | | 700 | | | Purchase | | 06/15/2016 | | | 91 | | | | 0 | | |
HKD | | | | Goldman Sachs | | | 10,600 | | | Sale | | 06/15/2016 | | | 1,365 | | | | 3 | | |
| | | $ | 2,251 | | |
See Notes to Financial Statements.
www.arbitragefunds.com | 1-800-295-4485
62
The Arbitrage Tactical Equity Fund Portfolio of Investments (continued)
Contract
Description | | Counterparty | | Contracts to
Deliver/Receive | | Purchase/Sale
Contract | | Expiration
Date | | Current Value | | Unrealized
Depreciation | |
CAD | | | | Goldman Sachs | | | 370 | | | Purchase | | 06/15/2016 | | $ | 282 | | | $ | (3 | ) | |
EUR | | | | Goldman Sachs | | | 6,890 | | | Purchase | | 06/15/2016 | | | 7,669 | | | | (86 | ) | |
HKD | | | | Goldman Sachs | | | 9,900 | | | Purchase | | 06/15/2016 | | | 1,274 | | | | (2 | ) | |
| | | $ | (91 | ) | |
The following is a summary of investments classified by country exposure:
Country | | % of Net Assets(a) | |
Germany | | | 8.64 | % | |
United Kingdom | | | 1.53 | % | |
Japan | | | 0.95 | % | |
Canada | | | 0.53 | % | |
Italy | | | 0.48 | % | |
Ireland | | | 0.25 | % | |
United States | | | 65.92 | % | |
Other Assets in Excess of Liabilities | | | 21.70 | % | |
| | | | 100.00 | % | |
(a) These percentages represent long positions only and are not net of short positions.
Abbreviations:
ADR - American Depositary Receipt
AG - Aktiengesellschaft is a German term that refers to a corporation that is limited by shares, i.e., owned by shareholders.
CAD - Canadian dollar
ETF - Exchange-Traded Fund
EUR - Euro
HKD - Hong Kong dollar
Ltd. - Limited
OYJ - Osakeyhtio is the Finnish equivalent of a public limited company
Plc - Public Limited Company
REIT - Real Estate Investment Trust
S&P - Standard & Poor's
SpA - Societa per Azione
SPDR - Standard & Poor's Depositary Receipt
See Notes to Financial Statements.
Annual Report | May 31, 2016
63
The Arbitrage Tactical Equity Fund Portfolio of Investments (continued)
See Notes to Financial Statements.
The following table summarizes The Arbitrage Tactical Equity Fund's investments and derivative financial instruments categorized in the disclosure hierarchy as of May 31, 2016:
Investments in Securities at Value* | | Level 1 | | Level 2 | | Level 3 | | Total | |
Assets | |
Common Stocks** | | $ | 464,139 | | | $ | — | | | $ | — | | | $ | 464,139 | | |
Exchange-Traded Funds** | | | 49,683 | | | | — | | | | — | | | | 49,683 | | |
Purchased Options | | | 4,483 | | | | — | | | | — | | | | 4,483 | | |
Short-Term Investments | | | 522,932 | | | | — | | | | — | | | | 522,932 | | |
TOTAL | | $ | 1,041,237 | | | $ | — | | | $ | — | | | $ | 1,041,237 | | |
Other Financial Instruments*** | |
Assets | |
Forward Foreign Currency Exchange Contracts | | $ | — | | | $ | 2,251 | | | $ | — | | | $ | 2,251 | | |
Liabilities | |
Common Stocks** | | | (361,808 | ) | | | — | | | | — | | | | (361,808 | ) | |
Exchange-Traded Funds** | | | (39,768 | ) | | | — | | | | — | | | | (39,768 | ) | |
Written Options | | | (1,664 | ) | | | — | | | | — | | | | (1,664 | ) | |
Forward Foreign Currency Exchange Contracts | | | — | | | | (91 | ) | | | — | | | | (91 | ) | |
TOTAL | | $ | (403,240 | ) | | $ | 2,160 | | | $ | — | | | $ | (401,080 | ) | |
* Refer to footnote 2 where leveling hierarchy is defined.
** Refer to Portfolio of Investments for sector information.
*** Other financial instruments are instruments such as written options, securities sold short, equity swaps and forward foreign currency exchange contracts.
www.arbitragefunds.com | 1-800-295-4485
64
This Page Intentionally Left Blank
| | | The Arbitrage
Fund | | The Arbitrage
Event-Driven
Fund | |
ASSETS | |
Investments: | |
At cost | | $ | 1,911,799,649 | | | $ | 186,119,567 | | |
At value (Note 2) | | $ | 1,956,665,695 | | | $ | 190,618,992 | | |
Cash denominated in foreign currency (Cost $10,104,125, $0, $0 and $0) | | | 10,102,233 | | | | – | | |
Deposits with brokers for securities sold short (Note 2) | | | 404,261,973 | | | | 54,357,696 | | |
Segregated cash for written options and securities sold short (Note 2) | | | – | | | | – | | |
Receivable for investment securities sold | | | 52,499,550 | | | | 7,786,053 | | |
Receivable for capital shares sold | | | 4,406,861 | | | | 231,851 | | |
Unrealized appreciation on forward foreign currency exchange contracts (Note 8) | | | 3,596,649 | | | | 108,457 | | |
Unrealized appreciation on swap contracts | | | – | | | | 3 | | |
Dividends and interest receivable | | | 2,408,019 | | | | 767,354 | | |
Receivable due from Adviser | | | – | | | | – | | |
Prepaid expenses and other assets | | | 165,502 | | | | 40,568 | | |
Total Assets | | | 2,434,106,482 | | | | 253,910,974 | | |
LIABILITIES | |
Securities sold short, at value (Note 2) (proceeds $396,672,195, $57,430,059, $19,004,854 and
$395,542) | | | 411,947,311 | | | | 58,640,484 | | |
Written options, at value (Note 2) (premiums received $254,193, $42,825, $34,737 and $2,491) | | | 247,773 | | | | 44,631 | | |
Payable for investment securities purchased | | | 144,551,005 | | | | 13,575,627 | | |
Unrealized depreciation on forward foreign currency exchange contracts (Note 8) | | | 3,183,497 | | | | 292,616 | | |
Unrealized depreciation on swap contracts | | | – | | | | 386 | | |
Payable for capital shares redeemed | | | 2,085,677 | | | | 879,830 | | |
Payable to Adviser (Note 6) | | | 1,710,392 | | | | 104,364 | | |
Dividends payable on securities sold short (Note 2) | | | 737,400 | | | | 61,825 | | |
Payable to Distributor (Note 6) | | | 121,581 | | | | 19,629 | | |
Payable to Administrator (Note 6) | | | 276,826 | | | | 51,095 | | |
Payable to Transfer Agent (Note 6) | | | 142,621 | | | | 45,307 | | |
Payable to Custodian | | | 191,503 | | | | 88,548 | | |
Interest expense payable | | | 280,158 | | | | 120,466 | | |
Audit and legal fees payable | | | 124,916 | | | | 35,995 | | |
Payable to Trustees | | | 41,343 | | | | 39,323 | | |
Payable to Chief Compliance Officer (Note 6) | | | 10,555 | | | | 978 | | |
Payable to Chief Financial Officer (Note 6) | | | 6,143 | | | | 1,202 | | |
Other accrued expenses and liabilities | | | 98,770 | | | | 40,054 | | |
Total Liabilities | | | 565,757,471 | | | | 74,042,360 | | |
NET ASSETS | | $ | 1,868,349,011 | | | $ | 179,868,614 | | |
NET ASSETS CONSIST OF: | |
Paid-in capital | | $ | 1,851,606,701 | | | $ | 245,523,234 | | |
Accumulated net investment income (loss) | | | (413,152 | ) | | | (1,033,436 | ) | |
Accumulated net realized loss on investments, swap contracts, securities sold short, written option
contracts and foreign currencies | | | (12,938,800 | ) | | | (67,722,683 | ) | |
Net unrealized appreciation (depreciation) on investments, swap contracts, securities sold short,
written option contracts and translation of assets and liabilities denominated in foreign currencies | | | 30,094,262 | | | | 3,101,499 | | |
NET ASSETS | | $ | 1,868,349,011 | | | $ | 179,868,614 | | |
See Notes to Financial Statements.
www.arbitragefunds.com | 1-800-295-4485
66
Statements of Assets and Liabilities
| | | The Arbitrage
Credit
Opportunities Fund | | The Arbitrage
Tactical Equity
Fund | |
ASSETS | |
Investments: | |
At cost | | $ | 54,122,976 | | | $ | 1,025,717 | | |
At value (Note 2) | | $ | 54,851,483 | | | $ | 1,041,237 | | |
Cash denominated in foreign currency (Cost $10,104,125, $0, $0 and $0) | | | – | | | | – | | |
Deposits with brokers for securities sold short (Note 2) | | | 19,581,877 | | | | 402,025 | | |
Segregated cash for written options and securities sold short (Note 2) | | | – | | | | 290,000 | | |
Receivable for investment securities sold | | | 1,035,136 | | | | 77,661 | | |
Receivable for capital shares sold | | | 53,680 | | | | – | | |
Unrealized appreciation on forward foreign currency exchange contracts (Note 8) | | | – | | | | 2,251 | | |
Unrealized appreciation on swap contracts | | | – | | | | – | | |
Dividends and interest receivable | | | 759,720 | | | | 447 | | |
Receivable due from Adviser | | | 12,029 | | | | 57,114 | | |
Prepaid expenses and other assets | | | 20,730 | | | | 14,093 | | |
Total Assets | | | 76,314,655 | | | | 1,884,828 | | |
LIABILITIES | |
Securities sold short, at value (Note 2) (proceeds $396,672,195, $57,430,059, $19,004,854 and
$395,542) | | | 19,812,850 | | | | 401,576 | | |
Written options, at value (Note 2) (premiums received $254,193, $42,825, $34,737 and $2,491) | | | 3,935 | | | | 1,664 | | |
Payable for investment securities purchased | | | 337,735 | | | | 58,873 | | |
Unrealized depreciation on forward foreign currency exchange contracts (Note 8) | | | 25,632 | | | | 91 | | |
Unrealized depreciation on swap contracts | | | – | | | | – | | |
Payable for capital shares redeemed | | | 48,171 | | | | – | | |
Payable to Adviser (Note 6) | | | – | | | | – | | |
Dividends payable on securities sold short (Note 2) | | | – | | | | 380 | | |
Payable to Distributor (Note 6) | | | 3,690 | | | | 12 | | |
Payable to Administrator (Note 6) | | | 24,214 | | | | 8,572 | | |
Payable to Transfer Agent (Note 6) | | | 16,573 | | | | 107 | | |
Payable to Custodian | | | 9,381 | | | | 21,642 | | |
Interest expense payable | | | 219,293 | | | | 43 | | |
Audit and legal fees payable | | | 20,546 | | | | 17,154 | | |
Payable to Trustees | | | 39,174 | | | | 39,109 | | |
Payable to Chief Compliance Officer (Note 6) | | | 300 | | | | 7 | | |
Payable to Chief Financial Officer (Note 6) | | | 752 | | | | 587 | | |
Other accrued expenses and liabilities | | | 9,610 | | | | 5,189 | | |
Total Liabilities | | | 20,571,856 | | | | 555,006 | | |
NET ASSETS | | $ | 55,742,799 | | | $ | 1,329,822 | | |
NET ASSETS CONSIST OF: | |
Paid-in capital | | $ | 58,624,182 | | | $ | 1,455,614 | | |
Accumulated net investment income (loss) | | | 192,667 | | | | (2,457 | ) | |
Accumulated net realized loss on investments, swap contracts, securities sold short, written option
contracts and foreign currencies | | | (2,999,815 | ) | | | (135,810 | ) | |
Net unrealized appreciation (depreciation) on investments, swap contracts, securities sold short,
written option contracts and translation of assets and liabilities denominated in foreign currencies | | | (74,235 | ) | | | 12,475 | | |
NET ASSETS | | $ | 55,742,799 | | | $ | 1,329,822 | | |
Annual Report | May 31, 2016
67
| | The Arbitrage
Fund | | The Arbitrage
Event-Driven
Fund | |
PRICING OF SHARES: | |
CLASS R SHARES: | |
Net assets applicable to Class R shares | | $ | 433,936,016 | | | $ | 80,113,954 | | |
Shares of beneficial interest outstanding (unlimited number of shares authorized, no par value) | | | 33,957,114 | | | | 8,919,846 | | |
Net asset value and offering price per share(a) | | $ | 12.78 | | | $ | 8.98 | | |
CLASS I SHARES: | |
Net assets applicable to Class I shares | | $ | 1,395,178,376 | | | $ | 95,154,798 | | |
Shares of beneficial interest outstanding (unlimited number of shares authorized, no par value) | | | 106,250,255 | | | | 10,525,195 | | |
Net asset value and offering price per share(a) | | $ | 13.13 | | | $ | 9.04 | | |
CLASS C SHARES: | |
Net assets applicable to Class C shares | | $ | 30,813,756 | | | $ | 2,537,682 | | |
Shares of beneficial interest outstanding (unlimited number of shares authorized, no par value) | | | 2,491,825 | | | | 284,968 | | |
Net asset value and offering price per share(a) | | $ | 12.37 | | | $ | 8.91 | | |
CLASS A SHARES: | |
Net assets applicable to Class A shares | | $ | 8,420,863 | | | $ | 2,062,180 | | |
Shares of beneficial interest outstanding (unlimited number of shares authorized, no par value) | | | 658,643 | | | | 229,540 | | |
Net asset value and offering price per share(a) | | $ | 12.79 | | | $ | 8.98 | | |
Maximum offering price per share (NAV/(100% — maximum sales charge)) | | $ | 13.12 | | | $ | 9.28 | | |
Maximum sales charge | | | 2.50 | % | | | 3.25 | % | |
(a) Redemption price varies based on length of time held (Note 1).
See Notes to Financial Statements.
www.arbitragefunds.com | 1-800-295-4485
68
Statements of Assets and Liabilities
| | | The Arbitrage
Credit
Opportunities Fund | | The Arbitrage
Tactical Equity
Fund | |
PRICING OF SHARES: | |
CLASS R SHARES: | |
Net assets applicable to Class R shares | | $ | 12,426,486 | | | $ | 9,395 | | |
Shares of beneficial interest outstanding (unlimited number of shares authorized, no par value) | | | 1,282,433 | | | | 1,010 | | |
Net asset value and offering price per share(a) | | $ | 9.69 | | | $ | 9.31 | | |
CLASS I SHARES: | |
Net assets applicable to Class I shares | | $ | 41,992,431 | | | $ | 1,301,638 | | |
Shares of beneficial interest outstanding (unlimited number of shares authorized, no par value) | | | 4,340,826 | | | | 139,835 | | |
Net asset value and offering price per share(a) | | $ | 9.67 | | | $ | 9.31 | | |
CLASS C SHARES: | |
Net assets applicable to Class C shares | | $ | 1,219,710 | | | $ | 9,394 | | |
Shares of beneficial interest outstanding (unlimited number of shares authorized, no par value) | | | 126,902 | | | | 1,010 | | |
Net asset value and offering price per share(a) | | $ | 9.61 | | | $ | 9.31 | | |
CLASS A SHARES: | |
Net assets applicable to Class A shares | | $ | 104,172 | | | $ | 9,395 | | |
Shares of beneficial interest outstanding (unlimited number of shares authorized, no par value) | | | 10,772 | | | | 1,009 | | |
Net asset value and offering price per share(a) | | $ | 9.67 | | | $ | 9.31 | | |
Maximum offering price per share (NAV/(100% — maximum sales charge)) | | $ | 9.99 | | | $ | 9.62 | | |
Maximum sales charge | | | 3.25 | % | | | 3.25 | % | |
Annual Report | May 31, 2016
69
| | | The Arbitrage
Fund | | The Arbitrage
Event-Driven
Fund | |
INVESTMENT INCOME | |
Dividend income | | $ | 26,788,742 | | | $ | 3,548,115 | | |
Foreign taxes withheld on dividends | | | (217,911 | ) | | | (15,912 | ) | |
Interest income | | | 1,257,849 | | | | 3,188,101 | | |
Total Investment Income | | | 27,828,680 | | | | 6,720,304 | | |
EXPENSES | |
Investment advisory fees (Note 6) | | | 20,888,619 | | | | 4,112,216 | | |
Distribution and service fees (Note 6) | |
Class R | | | 1,163,091 | | | | 294,208 | | |
Class C | | | 326,219 | | | | 35,612 | | |
Class A | | | 41,236 | | | | 7,808 | | |
Administrative fees (Note 6) | | | 392,195 | | | | 80,962 | | |
Chief Compliance Officer fees (Note 6) | | | 207,460 | | | | 31,581 | | |
Trustees' fees | | | 109,787 | | | | 85,533 | | |
Dividend expense | | | 6,797,256 | | | | 1,914,806 | | |
Interest rebate expense | | | 1,452,314 | | | | 563,108 | | |
Transfer agent fees (Note 6) | | | 1,219,481 | | | | 427,349 | | |
Custodian and bank service fees | | | 462,187 | | | | 143,583 | | |
Registration and filing fees | | | 95,646 | | | | 90,670 | | |
Printing of shareholder reports | | | 353,944 | | | | 138,241 | | |
Professional fees | | | 410,078 | | | | 89,203 | | |
Line of credit interest expense (Note 4) | | | – | | | | 51,731 | | |
Insurance expense | | | 91,035 | | | | 19,969 | | |
Chief Financial Officer fees (Note 6) | | | 45,964 | | | | 10,532 | | |
Offering costs | | | – | | | | – | | |
Other expenses | | | 122,346 | | | | 45,066 | | |
Total Expenses | | | 34,178,858 | | | | 8,142,178 | | |
Fees waived by the Adviser, Class R (Note 6) | | | – | | | | (193,596 | ) | |
Fees waived by the Adviser, Class I (Note 6) | | | – | | | | (332,746 | ) | |
Fees waived by the Adviser, Class C (Note 6) | | | – | | | | (5,871 | ) | |
Fees waived by the Adviser, Class A (Note 6) | | | – | | | | (5,132 | ) | |
Net Expenses | | | 34,178,858 | | | | 7,604,833 | | |
NET INVESTMENT INCOME (LOSS) | | | (6,350,178 | ) | | | (884,529 | ) | |
REALIZED AND UNREALIZED GAINS (LOSSES) ON INVESTMENTS AND FOREIGN CURRENCIES | |
Net realized gains (losses) from: | |
Investments | | | (42,523,714 | ) | | | (58,328,289 | ) | |
Swap contracts | | | 5,879,985 | | | | 1,095,052 | | |
Securities sold short | | | 28,409,348 | | | | 9,538,416 | | |
Written option contracts | | | 9,412,568 | | | | 4,570,661 | | |
Foreign currency transactions (Note 8) | | | (6,415,772 | ) | | | (669,306 | ) | |
Net change in unrealized appreciation (depreciation) on: | |
Investments | | | 47,088,404 | | | | 10,536,616 | | |
Swap contracts | | | (112,866 | ) | | | 14,649 | | |
Securities sold short | | | (21,190,678 | ) | | | (1,297,974 | ) | |
Written option contracts | | | (383,049 | ) | | | 36,407 | | |
Foreign currency transactions (Note 8) | | | 5,431,159 | | | | 363,689 | | |
NET REALIZED AND UNREALIZED GAINS (LOSSES) ON INVESTMENTS AND FOREIGN CURRENCIES | | | 25,595,385 | | | | (34,140,079 | ) | |
NET INCREASE (DECREASE) IN NET ASSETS RESULTING FROM OPERATIONS | | $ | 19,245,207 | | | $ | (35,024,608 | ) | |
See Notes to Financial Statements.
www.arbitragefunds.com | 1-800-295-4485
70
For the Year Ended May 31, 2016
| | | The Arbitrage
Credit
Opportunities Fund | | The Arbitrage
Tactical Equity
Fund | |
INVESTMENT INCOME | |
Dividend income | | $ | 12,655 | | | $ | 26,990 | | |
Foreign taxes withheld on dividends | | | – | | | | (26 | ) | |
Interest income | | | 2,729,974 | | | | 1,835 | | |
Total Investment Income | | | 2,742,629 | | | | 28,799 | | |
EXPENSES | |
Investment advisory fees (Note 6) | | | 640,958 | | | | 18,536 | | |
Distribution and service fees (Note 6) | |
Class R | | | 45,177 | | | | 23 | | |
Class C | | | 16,336 | | | | 94 | | |
Class A | | | 1,109 | | | | 23 | | |
Administrative fees (Note 6) | | | 29,852 | | | | 9,731 | | |
Chief Compliance Officer fees (Note 6) | | | 6,700 | | | | 161 | | |
Trustees' fees | | | 81,145 | | | | 80,217 | | |
Dividend expense | | | 24,169 | | | | 10,742 | | |
Interest rebate expense | | | 88,888 | | | | 3,538 | | |
Transfer agent fees (Note 6) | | | 47,466 | | | | 5,405 | | |
Custodian and bank service fees | | | 21,497 | | | | 28,486 | | |
Registration and filing fees | | | 53,819 | | | | 25,966 | | |
Printing of shareholder reports | | | 19,941 | | | | 5,979 | | |
Professional fees | | | 29,197 | | | | 11,733 | | |
Line of credit interest expense (Note 4) | | | – | | | | – | | |
Insurance expense | | | 2,263 | | | | 36 | | |
Chief Financial Officer fees (Note 6) | | | 6,281 | | | | 5,028 | | |
Offering costs | | | – | | | | 78,712 | | |
Other expenses | | | 20,183 | | | | 12,680 | | |
Total Expenses | | | 1,134,981 | | | | 297,090 | | |
Fees waived by the Adviser, Class R (Note 6) | | | (44,465 | ) | | | (1,665 | ) | |
Fees waived by the Adviser, Class I (Note 6) | | | (107,990 | ) | | | (256,320 | ) | |
Fees waived by the Adviser, Class C (Note 6) | | | (4,018 | ) | | | (1,665 | ) | |
Fees waived by the Adviser, Class A (Note 6) | | | (1,093 | ) | | | (1,665 | ) | |
Net Expenses | | | 977,415 | | | | 35,775 | | |
NET INVESTMENT INCOME (LOSS) | | | 1,765,214 | | | | (6,976 | ) | |
REALIZED AND UNREALIZED GAINS (LOSSES) ON INVESTMENTS AND FOREIGN CURRENCIES | |
Net realized gains (losses) from: | |
Investments | | | (2,722,508 | ) | | | (155,345 | ) | |
Swap contracts | | | 4,760 | | | | 1,864 | | |
Securities sold short | | | 71,167 | | | | 18,523 | | |
Written option contracts | | | 67,997 | | | | 17,026 | | |
Foreign currency transactions (Note 8) | | | 11,236 | | | | (709 | ) | |
Net change in unrealized appreciation (depreciation) on: | |
Investments | | | 1,195,263 | | | | 8,652 | | |
Swap contracts | | | 1,801 | | | | – | | |
Securities sold short | | | (569,877 | ) | | | (2,581 | ) | |
Written option contracts | | | 29,362 | | | | 1,232 | | |
Foreign currency transactions (Note 8) | | | (20,452 | ) | | | 2,180 | | |
NET REALIZED AND UNREALIZED GAINS (LOSSES) ON INVESTMENTS AND FOREIGN CURRENCIES | | | (1,931,251 | ) | | | (109,158 | ) | |
NET INCREASE (DECREASE) IN NET ASSETS RESULTING FROM OPERATIONS | | $ | (166,037 | ) | | $ | (116,134 | ) | |
Annual Report | May 31, 2016
71
| | The Arbitrage Fund | |
| | | Year Ended
May 31, 2016 | | Year Ended
May 31, 2015 | |
FROM OPERATIONS: | |
Net investment income (loss) | | $ | (6,350,178 | ) | | $ | (16,949,435 | ) | |
Net realized gains (losses) from: | |
Investments | | | (42,523,714 | ) | | | 293,123,691 | | |
Swap contracts | | | 5,879,985 | | | | (253,886 | ) | |
Securities sold short | | | 28,409,348 | | | | (222,961,312 | ) | |
Written option contracts | | | 9,412,568 | | | | 12,770,110 | | |
Foreign currency transactions | | | (6,415,772 | ) | | | 25,301,697 | | |
Net change in unrealized appreciation (depreciation) on: | |
Investments | | | 47,088,404 | | | | (61,391,553 | ) | |
Swap contracts | | | (112,866 | ) | | | (164,901 | ) | |
Securities sold short | | | (21,190,678 | ) | | | 48,301,456 | | |
Written option contracts | | | (383,049 | ) | | | 622 | | |
Foreign currency transactions | | | 5,431,159 | | | | (634,000 | ) | |
Net increase (decrease) in net assets resulting from operations | | | 19,245,207 | | | | 77,142,489 | | |
FROM DIVIDENDS AND DISTRIBUTIONS TO SHAREHOLDERS: | |
NET INVESTMENT INCOME | |
Distributions from net investment income, Class R | | | – | | | | – | | |
Distributions from net investment income, Class I | | | – | | | | – | | |
Distributions from net investment income, Class C | | | – | | | | – | | |
Distributions from net investment income, Class A | | | – | | | | – | | |
NET REALIZED GAINS | |
Distributions from net realized gains, Class R | | | (10,362,441 | ) | | | (1,270,987 | ) | |
Distributions from net realized gains, Class I | | | (33,308,237 | ) | | | (4,326,291 | ) | |
Distributions from net realized gains, Class C | | | (785,094 | ) | | | (79,686 | ) | |
Distributions from net realized gains, Class A | | | (410,119 | ) | | | (22,574 | ) | |
Decrease in net assets from distributions to shareholders | | | (44,865,891 | ) | | | (5,699,538 | ) | |
FROM CAPITAL SHARE TRANSACTIONS (NOTE 7): | |
Proceeds from shares sold | | | 750,332,263 | | | | 926,411,171 | | |
Shares issued in reinvestment of distributions | | | 35,336,364 | | | | 4,050,952 | | |
Proceeds from redemption fees collected (Note 2) | | | 15,245 | | | | 22,225 | | |
Payments for shares redeemed | | | (957,255,726 | ) | | | (1,449,499,845 | ) | |
Net increase (decrease) in net assets from capital share transactions | | | (171,571,854 | ) | | | (519,015,497 | ) | |
TOTAL INCREASE (DECREASE) IN NET ASSETS | | | (197,192,538 | ) | | | (447,572,546 | ) | |
NET ASSETS: | |
Beginning of year | | | 2,065,541,549 | | | | 2,513,114,095 | | |
End of year* | | $ | 1,868,349,011 | | | $ | 2,065,541,549 | | |
| | * Including accumulated net investment income (loss) of: | | | $ | (413,152 | ) | | $ | 4,869,445 | | |
See Notes to Financial Statements.
www.arbitragefunds.com | 1-800-295-4485
72
Statement of Changes in Net Assets
| | | The Arbitrage Event-Driven Fund | |
| | | Year Ended
May 31, 2016 | | Year Ended
May 31, 2015 | |
FROM OPERATIONS: | |
Net investment income (loss) | | $ | (884,529 | ) | | $ | 3,351,926 | | |
Net realized gains (losses) from: | |
Investments | | | (58,328,289 | ) | | | 13,840,851 | | |
Swap contracts | | | 1,095,052 | | | | 778,445 | | |
Securities sold short | | | 9,538,416 | | | | (36,254,971 | ) | |
Written option contracts | | | 4,570,661 | | | | 3,287,176 | | |
Foreign currency transactions | | | (669,306 | ) | | | 5,225,074 | | |
Net change in unrealized appreciation (depreciation) on: | |
Investments | | | 10,536,616 | | | | (16,801,049 | ) | |
Swap contracts | | | 14,649 | | | | (14,013 | ) | |
Securities sold short | | | (1,297,974 | ) | | | 4,425,595 | | |
Written option contracts | | | 36,407 | | | | (78,435 | ) | |
Foreign currency transactions | | | 363,689 | | | | 14,868 | | |
Net increase (decrease) in net assets resulting from operations | | | (35,024,608 | ) | | | (22,224,533 | ) | |
FROM DIVIDENDS AND DISTRIBUTIONS TO SHAREHOLDERS: | |
NET INVESTMENT INCOME | |
Distributions from net investment income, Class R | | | (2,171,603 | ) | | | (1,765,025 | ) | |
Distributions from net investment income, Class I | | | (4,633,283 | ) | | | (3,897,650 | ) | |
Distributions from net investment income, Class C | | | (43,575 | ) | | | (22,154 | ) | |
Distributions from net investment income, Class A | | | (63,342 | ) | | | (39,977 | ) | |
NET REALIZED GAINS | |
Distributions from net realized gains, Class R | | | (3,541 | ) | | | (3,673,053 | ) | |
Distributions from net realized gains, Class I | | | (6,279 | ) | | | (6,881,389 | ) | |
Distributions from net realized gains, Class C | | | (124 | ) | | | (100,341 | ) | |
Distributions from net realized gains, Class A | | | (103 | ) | | | (84,204 | ) | |
Decrease in net assets from distributions to shareholders | | | (6,921,850 | ) | | | (16,463,793 | ) | |
FROM CAPITAL SHARE TRANSACTIONS (NOTE 7): | |
Proceeds from shares sold | | | 58,275,506 | | | | 426,570,641 | | |
Shares issued in reinvestment of distributions | | | 4,703,095 | | | | 13,481,621 | | |
Proceeds from redemption fees collected (Note 2) | | | 9,361 | | | | 13,963 | | |
Payments for shares redeemed | | | (436,649,628 | ) | | | (309,016,808 | ) | |
Net increase (decrease) in net assets from capital share transactions | | | (373,661,666 | ) | | | 131,049,417 | | |
TOTAL INCREASE (DECREASE) IN NET ASSETS | | | (415,608,124 | ) | | | 92,361,091 | | |
NET ASSETS: | |
Beginning of year | | | 595,476,738 | | | | 503,115,647 | | |
End of year* | | $ | 179,868,614 | | | $ | 595,476,738 | | |
| | * Including accumulated net investment income (loss) of: | | | $ | (1,033,436 | ) | | $ | 554,230 | | |
Annual Report | May 31, 2016
73
| | | The Arbitrage Credit Opportunities Fund | |
| | | Year Ended
May 31, 2016 | | Year Ended
May 31, 2015 | |
FROM OPERATIONS: | |
Net investment income (loss) | | $ | 1,765,214 | | | $ | 1,505,436 | | |
Net realized gains (losses) from: | |
Investments | | | (2,722,508 | ) | | | (896,060 | ) | |
Swap contracts | | | 4,760 | | | | (3,089 | ) | |
Securities sold short | | | 71,167 | | | | 331,588 | | |
Written option contracts | | | 67,997 | | | | 6,041 | | |
Foreign currency transactions | | | 11,236 | | | | (3,180 | ) | |
Net change in unrealized appreciation (depreciation) on: | |
Investments | | | 1,195,263 | | | | (635,543 | ) | |
Swap contracts | | | 1,801 | | | | (1,801 | ) | |
Securities sold short | | | (569,877 | ) | | | (169,697 | ) | |
Written option contracts | | | 29,362 | | | | 355 | | |
Foreign currency transactions | | | (20,452 | ) | | | 14,361 | | |
Net increase (decrease) in net assets resulting from operations | | | (166,037 | ) | | | 148,411 | | |
FROM DIVIDENDS AND DISTRIBUTIONS TO SHAREHOLDERS: | |
NET INVESTMENT INCOME | |
Distributions from net investment income, Class R | | | (535,626 | ) | | | (235,746 | ) | |
Distributions from net investment income, Class I | | | (1,312,370 | ) | | | (1,045,525 | ) | |
Distributions from net investment income, Class C | | | (37,922 | ) | | | (37,249 | ) | |
Distributions from net investment income, Class A | | | (14,790 | ) | | | (10,070 | ) | |
NET REALIZED GAINS | |
Distributions from net realized gains, Class R | | | – | | | | – | | |
Distributions from net realized gains, Class I | | | – | | | | – | | |
Distributions from net realized gains, Class C | | | – | | | | – | | |
Distributions from net realized gains, Class A | | | – | | | | – | | |
Decrease in net assets from distributions to shareholders | | | (1,900,708 | ) | | | (1,328,590 | ) | |
FROM CAPITAL SHARE TRANSACTIONS (NOTE 7): | |
Proceeds from shares sold | | | 19,206,229 | | | | 65,269,484 | | |
Shares issued in reinvestment of distributions | | | 1,863,018 | | | | 1,320,031 | | |
Proceeds from redemption fees collected (Note 2) | | | – | | | | 234 | | |
Payments for shares redeemed | | | (34,755,910 | ) | | | (24,088,868 | ) | |
Net increase (decrease) in net assets from capital share transactions | | | (13,686,663 | ) | | | 42,500,881 | | |
TOTAL INCREASE (DECREASE) IN NET ASSETS | | | (15,753,408 | ) | | | 41,320,702 | | |
NET ASSETS: | |
Beginning of year | | | 71,496,207 | | | | 30,175,505 | | |
End of year* | | $ | 55,742,799 | | | $ | 71,496,207 | | |
| | * Including accumulated net investment income (loss) of: | | | $ | 192,667 | | | $ | 466,881 | | |
(a) Commenced operations on January 2, 2015.
See Notes to Financial Statements.
www.arbitragefunds.com | 1-800-295-4485
74
Statement of Changes in Net Assets
| | | The Arbitrage Tactical Equity Fund | |
| | | Year Ended
May 31, 2016 | | Period Ended
May 31, 2015(a) | |
FROM OPERATIONS: | |
Net investment income (loss) | | $ | (6,976 | ) | | $ | (8,588 | ) | |
Net realized gains (losses) from: | |
Investments | | | (155,345 | ) | | | 13,267 | | |
Swap contracts | | | 1,864 | | | | (269 | ) | |
Securities sold short | | | 18,523 | | | | (10,041 | ) | |
Written option contracts | | | 17,026 | | | | 3,655 | | |
Foreign currency transactions | | | (709 | ) | | | (119 | ) | |
Net change in unrealized appreciation (depreciation) on: | |
Investments | | | 8,652 | | | | 6,868 | | |
Swap contracts | | | – | | | | – | | |
Securities sold short | | | (2,581 | ) | | | (3,453 | ) | |
Written option contracts | | | 1,232 | | | | (405 | ) | |
Foreign currency transactions | | | 2,180 | | | | (18 | ) | |
Net increase (decrease) in net assets resulting from operations | | | (116,134 | ) | | | 897 | | |
FROM DIVIDENDS AND DISTRIBUTIONS TO SHAREHOLDERS: | |
NET INVESTMENT INCOME | |
Distributions from net investment income, Class R | | | – | | | | – | | |
Distributions from net investment income, Class I | | | – | | | | – | | |
Distributions from net investment income, Class C | | | – | | | | – | | |
Distributions from net investment income, Class A | | | – | | | | – | | |
NET REALIZED GAINS | |
Distributions from net realized gains, Class R | | | (88 | ) | | | – | | |
Distributions from net realized gains, Class I | | | (14,509 | ) | | | – | | |
Distributions from net realized gains, Class C | | | (88 | ) | | | – | | |
Distributions from net realized gains, Class A | | | (88 | ) | | | – | | |
Decrease in net assets from distributions to shareholders | | | (14,773 | ) | | | – | | |
FROM CAPITAL SHARE TRANSACTIONS (NOTE 7): | |
Proceeds from shares sold | | | 404,121 | | | | 1,415,609 | | |
Shares issued in reinvestment of distributions | | | 14,773 | | | | – | | |
Proceeds from redemption fees collected (Note 2) | | | – | | | | – | | |
Payments for shares redeemed | | | (374,608 | ) | | | (63 | ) | |
Net increase (decrease) in net assets from capital share transactions | | | 44,286 | | | | 1,415,546 | | |
TOTAL INCREASE (DECREASE) IN NET ASSETS | | | (86,621 | ) | | | 1,416,443 | | |
NET ASSETS: | |
Beginning of year | | | 1,416,443 | | | | – | | |
End of year* | | $ | 1,329,822 | | | $ | 1,416,443 | | |
| | * Including accumulated net investment income (loss) of: | | | $ | (2,457 | ) | | $ | 19 | | |
Annual Report | May 31, 2016
75
The Arbitrage Fund – Class R
Selected Per Share Data and Ratios for a Share Outstanding Throughout the Periods Presented:
| | | Year Ended
May 31, 2016 | | Year Ended
May 31, 2015 | | Year Ended
May 31, 2014 | |
Net asset value, beginning of period | | $ | 12.97 | | | $ | 12.58 | | | $ | 12.50 | | |
Income (loss) from investment operations | |
Net investment loss(a) | | | (0.06 | ) | | | (0.11 | ) | | | (0.09 | ) | |
Net realized and unrealized gains on investments and foreign currencies | | | 0.17 | | | | 0.53 | | | | 0.23 | | |
Total from investment operations | | | 0.11 | | | | 0.42 | | | | 0.14 | | |
Less distributions | |
From net investment income | | | – | | | | – | | | | – | | |
From net realized gains | | | (0.30 | ) | | | (0.03 | ) | | | (0.06 | ) | |
Total distributions | | | (0.30 | ) | | | (0.03 | ) | | | (0.06 | ) | |
Proceeds from redemption fees collected(b) | | | 0.00 | | | | 0.00 | | | | 0.00 | | |
Net asset value, end of period | | $ | 12.78 | | | $ | 12.97 | | | $ | 12.58 | | |
Total return(c) | | | 0.87 | % | | | 3.35 | % | | | 1.10 | % | |
Net assets, end of period (in 000s) | | $ | 433,936 | | | $ | 500,440 | | | $ | 760,750 | | |
RATIOS TO AVERAGE NET ASSETS: | |
Gross expenses(d) | | | 1.88 | % | | | 2.31 | % | | | 2.17 | % | |
Net expenses after advisory fees waived and expenses reimbursed(d)(e) | | | 1.88 | % | | | 2.31 | % | | | 2.17 | % | |
Net investment loss | | | (0.51 | %) | | | (0.87 | %) | | | (0.70 | %) | |
Portfolio turnover rate | | | 321 | % | | | 514 | % | | | 462 | % | |
(a) Per share amounts were calculated using average shares outstanding for the year.
(b) Amount rounds to less than $0.01 per share.
(c) Total return is a measure of the change in the value of an investment in the Fund over the years covered, which assumes any dividends or capital gains distributions are reinvested in shares of the Fund. Returns shown do not reflect the deduction of taxes a shareholder would pay on Fund distributions or the redemption of Fund shares.
(d) Dividend expense totaled 0.34%, 0.68%, 0.60%, 0.42% and 0.58% of average net assets for the years ended May 31, 2016, 2015, 2014, 2013 and 2012, respectively. Interest rebate expense and line of credit interest expense totaled 0.07%, 0.18%, 0.12%, 0.10% and 0.20% of average net assets for the years ended May 31, 2016, 2015, 2014, 2013 and 2012, respectively.
(e) Excluding dividend and interest expenses, the Fund's net expenses after advisory fees waived and expenses reimbursed would have been 1.47%, 1.45%, 1.45%, 1.45% and 1.45% of average net assets for the years ended May 31, 2016, 2015, 2014, 2013 and 2012, respectively.
See Notes to Financial Statements.
www.arbitragefunds.com | 1-800-295-4485
76
| | | Year Ended
May 31, 2013 | | Year Ended
May 31, 2012 | |
Net asset value, beginning of period | | $ | 12.80 | | | $ | 12.77 | | |
Income (loss) from investment operations | |
Net investment loss(a) | | | (0.10 | ) | | | (0.11 | ) | |
Net realized and unrealized gains on investments and foreign currencies | | | 0.15 | | | | 0.44 | | |
Total from investment operations | | | 0.05 | | | | 0.33 | | |
Less distributions | |
From net investment income | | | (0.09 | ) | | | – | | |
From net realized gains | | | (0.26 | ) | | | (0.30 | ) | |
Total distributions | | | (0.35 | ) | | | (0.30 | ) | |
Proceeds from redemption fees collected(b) | | | 0.00 | | | | 0.00 | | |
Net asset value, end of period | | $ | 12.50 | | | $ | 12.80 | | |
Total return(c) | | | 0.42 | % | | | 2.54 | % | |
Net assets, end of period (in 000s) | | $ | 916,677 | | | $ | 1,003,646 | | |
RATIOS TO AVERAGE NET ASSETS: | |
Gross expenses(d) | | | 1.97 | % | | | 2.23 | % | |
Net expenses after advisory fees waived and expenses reimbursed(d)(e) | | | 1.97 | % | | | 2.23 | % | |
Net investment loss | | | (0.78 | %) | | | (0.83 | %) | |
Portfolio turnover rate | | | 459 | % | | | 563 | % | |
Annual Report | May 31, 2016
77
The Arbitrage Fund – Class I
Selected Per Share Data and Ratios for a Share Outstanding Throughout the Periods Presented:
| | | Year Ended
May 31, 2016 | | Year Ended
May 31, 2015 | | Year Ended
May 31, 2014 | |
Net asset value, beginning of period | | $ | 13.28 | | | $ | 12.86 | | | $ | 12.74 | | |
Income (loss) from investment operations | |
Net investment loss(a) | | | (0.03 | ) | | | (0.09 | ) | | | (0.05 | ) | |
Net realized and unrealized gains on investments and foreign currencies | | | 0.18 | | | | 0.54 | | | | 0.23 | | |
Total from investment operations | | | 0.15 | | | | 0.45 | | | | 0.18 | | |
Less distributions | |
From net investment income | | | – | | | | – | | | | – | | |
From net realized gains | | | (0.30 | ) | | | (0.03 | ) | | | (0.06 | ) | |
Total distributions | | | (0.30 | ) | | | (0.03 | ) | | | (0.06 | ) | |
Proceeds from redemption fees collected(b) | | | 0.00 | | | | 0.00 | | | | 0.00 | | |
Net asset value, end of period | | $ | 13.13 | | | $ | 13.28 | | | $ | 12.86 | | |
Total return(c) | | | 1.16 | % | | | 3.51 | % | | | 1.39 | % | |
Net assets, end of period (in 000s) | | $ | 1,395,178 | | | $ | 1,514,685 | | | $ | 1,712,120 | | |
RATIOS TO AVERAGE NET ASSETS: | |
Gross expenses(d) | | | 1.63 | % | | | 2.06 | % | | | 1.92 | % | |
Net expenses after advisory fees waived and expenses reimbursed(d)(e) | | | 1.63 | % | | | 2.06 | % | | | 1.92 | % | |
Net investment loss | | | (0.24 | %) | | | (0.65 | %) | | | (0.42 | %) | |
Portfolio turnover rate | | | 321 | % | | | 514 | % | | | 462 | % | |
(a) Per share amounts were calculated using average shares outstanding for the year.
(b) Amount rounds to less than $0.01 per share.
(c) Total return is a measure of the change in the value of an investment in the Fund over the years covered, which assumes any dividends or capital gains distributions are reinvested in shares of the Fund. Returns shown do not reflect the deduction of taxes a shareholder would pay on Fund distributions or the redemption of Fund shares.
(d) Dividend expense totaled 0.34%, 0.68%, 0.60%, 0.42% and 0.58% of average net assets for the years ended May 31, 2016, 2015, 2014, 2013 and 2012, respectively. Interest rebate expense and line of credit interest expense totaled 0.07%, 0.18%, 0.12%, 0.10% and 0.20% of average net assets for the years ended May 31, 2016, 2015, 2014, 2013 and 2012, respectively.
(e) Excluding dividend and interest expenses, the Fund's net expenses after advisory fees waived and expenses reimbursed would have been 1.22%, 1.20%, 1.20%, 1.20% and 1.20% of average net assets for the years ended May 31, 2016, 2015, 2014, 2013 and 2012, respectively.
See Notes to Financial Statements.
www.arbitragefunds.com | 1-800-295-4485
78
| | | Year Ended
May 31, 2013 | | Year Ended
May 31, 2012 | |
Net asset value, beginning of period | | $ | 13.04 | | | $ | 12.98 | | |
Income (loss) from investment operations | |
Net investment loss(a) | | | (0.07 | ) | | | (0.07 | ) | |
Net realized and unrealized gains on investments and foreign currencies | | | 0.16 | | | | 0.43 | | |
Total from investment operations | | | 0.09 | | | | 0.36 | | |
Less distributions | |
From net investment income | | | (0.13 | ) | | | – | | |
From net realized gains | | | (0.26 | ) | | | (0.30 | ) | |
Total distributions | | | (0.39 | ) | | | (0.30 | ) | |
Proceeds from redemption fees collected(b) | | | 0.00 | | | | 0.00 | | |
Net asset value, end of period | | $ | 12.74 | | | $ | 13.04 | | |
Total return(c) | | | 0.67 | % | | | 2.74 | % | |
Net assets, end of period (in 000s) | | $ | 1,937,514 | | | $ | 2,084,530 | | |
RATIOS TO AVERAGE NET ASSETS: | |
Gross expenses(d) | | | 1.72 | % | | | 1.98 | % | |
Net expenses after advisory fees waived and expenses reimbursed(d)(e) | | | 1.72 | % | | | 1.98 | % | |
Net investment loss | | | (0.51 | %) | | | (0.56 | %) | |
Portfolio turnover rate | | | 459 | % | | | 563 | % | |
Annual Report | May 31, 2016
79
The Arbitrage Fund – Class C
Selected Per Share Data and Ratios for a Share Outstanding Throughout the Periods Presented:
| | | Year Ended
May 31, 2016 | | Year Ended
May 31, 2015 | |
Net asset value, beginning of period | | $ | 12.65 | | | $ | 12.37 | | |
Income (loss) from investment operations | |
Net investment loss(b) | | | (0.16 | ) | | | (0.20 | ) | |
Net realized and unrealized gains on investments and foreign currencies | | | 0.18 | | | | 0.51 | | |
Total from investment operations | | | 0.02 | | | | 0.31 | | |
Less distributions | |
From net investment income | | | – | | | | – | | |
From net realized gains | | | (0.30 | ) | | | (0.03 | ) | |
Total distributions | | | (0.30 | ) | | | (0.03 | ) | |
Proceeds from redemption fees collected | | | – | | | | – | | |
Net asset value, end of period | | $ | 12.37 | | | $ | 12.65 | | |
Total return(d) | | | 0.18 | % | | | 2.52 | % | |
Net assets, end of period (in 000s) | | $ | 30,814 | | | $ | 32,958 | | |
RATIOS TO AVERAGE NET ASSETS: | |
Gross expenses(e) | | | 2.63 | % | | | 3.06 | % | |
Net expenses after advisory fees waived and expenses reimbursed(e)(f) | | | 2.63 | % | | | 3.06 | % | |
Net investment loss | | | (1.28 | %) | | | (1.60 | %) | |
Portfolio turnover rate | | | 321 | % | | | 514 | % | |
(a) Commenced operations on June 1, 2012.
(b) Per share amounts were calculated using average shares outstanding for the year.
(c) Amount rounds to less than $0.01 per share.
(d) Total return is a measure of the change in the value of an investment in the Fund over the years covered, which assumes any dividends or capital gains distributions are reinvested in shares of the Fund. Returns shown do not reflect the deduction of taxes a shareholder would pay on Fund distributions or the redemption of Fund shares.
(e) Dividend expense totaled 0.34%, 0.68%, 0.60% and 0.42% of average net assets for the years ended May 31, 2016, 2015, 2014 and 2013, respectively. Interest rebate expense and line of credit interest expense totaled 0.07%, 0.18%, 0.12% and 0.11% of average net assets for the years ended May 31, 2016, 2015, 2014 and 2013, respectively.
(f) Excluding dividend and interest expenses, the Fund's net expenses after advisory fees waived and expenses reimbursed would have been 2.22%, 2.20%, 2.20% and 2.20% of average net assets for the years ended May 31, 2016, 2015, 2014, and 2013, respectively.
See Notes to Financial Statements.
www.arbitragefunds.com | 1-800-295-4485
80
| | | Year Ended
May 31, 2014 | | Year Ended
May 31, 2013(a) | |
Net asset value, beginning of period | | $ | 12.38 | | | $ | 12.80 | | |
Income (loss) from investment operations | |
Net investment loss(b) | | | (0.18 | ) | | | (0.23 | ) | |
Net realized and unrealized gains on investments and foreign currencies | | | 0.23 | | | | 0.20 | | |
Total from investment operations | | | 0.05 | | | | (0.03 | ) | |
Less distributions | |
From net investment income | | | – | | | | (0.13 | ) | |
From net realized gains | | | (0.06 | ) | | | (0.26 | ) | |
Total distributions | | | (0.06 | ) | | | (0.39 | ) | |
Proceeds from redemption fees collected | | | – | | | | 0.00 | (c) | |
Net asset value, end of period | | $ | 12.37 | | | $ | 12.38 | | |
Total return(d) | | | 0.38 | % | | | (0.27 | %) | |
Net assets, end of period (in 000s) | | $ | 33,589 | | | $ | 18,741 | | |
RATIOS TO AVERAGE NET ASSETS: | |
Gross expenses(e) | | | 2.92 | % | | | 2.75 | % | |
Net expenses after advisory fees waived and expenses reimbursed(e)(f) | | | 2.92 | % | | | 2.75 | % | |
Net investment loss | | | (1.45 | %) | | | (1.84 | %) | |
Portfolio turnover rate | | | 462 | % | | | 459 | % | |
Annual Report | May 31, 2016
81
The Arbitrage Fund – Class A
Selected Per Share Data and Ratios for a Share Outstanding Throughout the Periods Presented:
| | | Year Ended
May 31, 2016 | | Year Ended
May 31, 2015 | |
Net asset value, beginning of period | | $ | 12.97 | | | $ | 12.59 | | |
Income (loss) from investment operations | |
Net investment loss(b) | | | (0.07 | ) | | | (0.09 | ) | |
Net realized and unrealized gains on investments and foreign currencies | | | 0.19 | | | | 0.50 | | |
Total from investment operations | | | 0.12 | | | | 0.41 | | |
Less distributions | |
From net realized gains | | | (0.30 | ) | | | (0.03 | ) | |
Total distributions | | | (0.30 | ) | | | (0.03 | ) | |
Proceeds from redemption fees collected | | | – | | | | – | | |
Net asset value, end of period | | $ | 12.79 | | | $ | 12.97 | | |
Total return(d) | | | 0.95 | % | | | 3.27 | % | |
Net assets, end of period (in 000s) | | $ | 8,421 | | | $ | 17,458 | | |
RATIOS TO AVERAGE NET ASSETS: | |
Gross expenses(e) | | | 1.87 | % | | | 2.31 | % | |
Net expenses after advisory fees waived and expenses reimbursed(e)(f) | | | 1.87 | % | | | 2.31 | % | |
Net investment loss | | | (0.56 | %) | | | (0.70 | %) | |
Portfolio turnover rate | | | 321 | % | | | 514 | % | |
(a) Commenced operations on June 1, 2013.
(b) Per share amounts were calculated using average shares outstanding for the year.
(c) Amount rounds to less than $0.01 per share.
(d) Total return is a measure of the change in the value of an investment in the Fund over the years covered, which assumes any dividends or capital gains distributions are reinvested in shares of the Fund. Returns shown do not reflect the deduction of taxes a shareholder would pay on Fund distributions or the redemption of Fund shares.
(e) Dividend expense totaled 0.33%, 0.68% and 0.60% of average net assets for the years ended May 31, 2016, 2015 and 2014, respectively. Interest rebate expense and line of credit interest expense totaled 0.07%, 0.18% and 0.12% of average net assets for the years ended May 31, 2016, 2015 and 2014, respectively.
(f) Excluding dividend and interest expenses, the Fund's net expenses after advisory fees waived and expenses reimbursed would have been 1.47%, 1.45% and 1.46% of average net assets for the years ended May 31, 2016, 2015 and 2014, respectively.
See Notes to Financial Statements.
www.arbitragefunds.com | 1-800-295-4485
82
| | | Period Ended
May 31, 2014(a) | |
Net asset value, beginning of period | | $ | 12.50 | | |
Income (loss) from investment operations | |
Net investment loss(b) | | | (0.09 | ) | |
Net realized and unrealized gains on investments and foreign currencies | | | 0.24 | | |
Total from investment operations | | | 0.15 | | |
Less distributions | |
From net realized gains | | | (0.06 | ) | |
Total distributions | | | (0.06 | ) | |
Proceeds from redemption fees collected | | | 0.00 | (c) | |
Net asset value, end of period | | $ | 12.59 | | |
Total return(d) | | | 1.18 | % | |
Net assets, end of period (in 000s) | | $ | 6,655 | | |
RATIOS TO AVERAGE NET ASSETS: | |
Gross expenses(e) | | | 2.18 | % | |
Net expenses after advisory fees waived and expenses reimbursed(e)(f) | | | 2.18 | % | |
Net investment loss | | | (0.69 | %) | |
Portfolio turnover rate | | | 462 | % | |
Annual Report | May 31, 2016
83
The Arbitrage Event-Driven Fund – Class R
Selected Per Share Data and Ratios for a Share Outstanding Throughout the Periods Presented:
| | | Year Ended
May 31, 2016 | | Year Ended
May 31, 2015 | | Year Ended
May 31, 2014 | |
Net asset value, beginning of period | | $ | 9.73 | | | $ | 10.29 | | | $ | 9.80 | | |
Income (loss) from investment operations | |
Net investment income (loss)(a) | | | (0.02 | ) | | | 0.04 | | | | 0.10 | | |
Net realized and unrealized gains (losses) on investments and foreign currencies | | | (0.53 | ) | | | (0.36 | ) | | | 0.46 | | |
Total from investment operations | | | (0.55 | ) | | | (0.32 | ) | | | 0.56 | | |
Less distributions | |
From net investment income | | | (0.20 | ) | | | (0.08 | ) | | | (0.06 | ) | |
From net realized gains | | | (0.00 | )(b) | | | (0.16 | ) | | | (0.01 | ) | |
Total distributions | | | (0.20 | ) | | | (0.24 | ) | | | (0.07 | ) | |
Proceeds from redemption fees collected(b) | | | 0.00 | | | | 0.00 | | | | 0.00 | | |
Net asset value, end of period | | $ | 8.98 | | | $ | 9.73 | | | $ | 10.29 | | |
Total return(c) | | | (5.55 | %) | | | (3.12 | %) | | | 5.75 | % | |
Net assets, end of period (in 000s) | | $ | 80,114 | | | $ | 195,014 | | | $ | 204,055 | | |
RATIOS TO AVERAGE NET ASSETS: | |
Gross expenses(d) | | | 2.62 | % | | | 2.52 | % | | | 2.33 | % | |
Net expenses after advisory fees waived and expenses reimbursed(d)(e) | | | 2.46 | % | | | 2.50 | % | | | 2.31 | % | |
Net investment income (loss) | | | (0.27 | %) | | | 0.37 | % | | | 1.04 | % | |
Portfolio turnover rate | | | 350 | % | | | 451 | % | | | 340 | % | |
(a) Per share amounts were calculated using average shares outstanding for the year.
(b) Amount rounds to less than $0.01 per share.
(c) Total return is a measure of the change in the value of an investment in the Fund over the years covered, which assumes any dividends or capital gains distributions are reinvested in shares of the Fund. Returns shown do not reflect the deduction of taxes a shareholder would pay on Fund distributions or the redemption of Fund shares.
(d) Dividend expense totaled 0.58%, 0.55%, 0.49%, 0.36% and 0.27% of average net assets for the years ended May 31, 2016, 2015, 2014, 2013 and 2012, respectively. Interest rebate expense and line of credit interest expense totaled 0.19%, 0.26%, 0.13%, 0.13% and 0.21% of average net assets for the years ended May 31, 2016, 2015, 2014, 2013 and 2012, respectively.
(e) Excluding dividend and interest expenses, the Fund's net expenses after advisory fees waived and expenses reimbursed would have been 1.69%, 1.69%, 1.69%, 1.69% and 1.69% of average net assets for the years ended May 31, 2016, 2015, 2014, 2013 and 2012, respectively.
See Notes to Financial Statements.
www.arbitragefunds.com | 1-800-295-4485
84
| | | Year Ended
May 31, 2013 | | Year Ended
May 31, 2012 | |
Net asset value, beginning of period | | $ | 9.79 | | | $ | 10.23 | | |
Income (loss) from investment operations | |
Net investment income (loss)(a) | | | 0.15 | | | | 0.10 | | |
Net realized and unrealized gains (losses) on investments and foreign currencies | | | 0.11 | | | | 0.09 | | |
Total from investment operations | | | 0.26 | | | | 0.19 | | |
Less distributions | |
From net investment income | | | (0.10 | ) | | | (0.15 | ) | |
From net realized gains | | | (0.15 | ) | | | (0.48 | ) | |
Total distributions | | | (0.25 | ) | | | (0.63 | ) | |
Proceeds from redemption fees collected(b) | | | 0.00 | | | | 0.00 | | |
Net asset value, end of period | | $ | 9.80 | | | $ | 9.79 | | |
Total return(c) | | | 2.72 | % | | | 1.88 | % | |
Net assets, end of period (in 000s) | | $ | 10,080 | | | $ | 8,976 | | |
RATIOS TO AVERAGE NET ASSETS: | |
Gross expenses(d) | | | 2.55 | % | | | 2.67 | % | |
Net expenses after advisory fees waived and expenses reimbursed(d)(e) | | | 2.18 | % | | | 2.17 | % | |
Net investment income (loss) | | | 1.58 | % | | | 1.02 | % | |
Portfolio turnover rate | | | 336 | % | | | 490 | % | |
Annual Report | May 31, 2016
85
The Arbitrage Event-Driven Fund – Class I
Selected Per Share Data and Ratios for a Share Outstanding Throughout the Periods Presented:
| | | Year Ended
May 31, 2016 | | Year Ended
May 31, 2015 | | Year Ended
May 31, 2014 | |
Net asset value, beginning of period | | $ | 9.81 | | | $ | 10.37 | | | $ | 9.86 | | |
Income (loss) from investment operations | |
Net investment income (loss)(a) | | | (0.02 | ) | | | 0.06 | | | | 0.13 | | |
Net realized and unrealized gains (losses) on investments and foreign currencies | | | (0.51 | ) | | | (0.37 | ) | | | 0.46 | | |
Total from investment operations | | | (0.53 | ) | | | (0.31 | ) | | | 0.59 | | |
Less distributions | |
From net investment income | | | (0.24 | ) | | | (0.09 | ) | | | (0.07 | ) | |
From net realized gains | | | (0.00 | )(b) | | | (0.16 | ) | | | (0.01 | ) | |
Total distributions | | | (0.24 | ) | | | (0.25 | ) | | | (0.08 | ) | |
Proceeds from redemption fees collected(b) | | | 0.00 | | | | 0.00 | | | | 0.00 | | |
Net asset value, end of period | | $ | 9.04 | | | $ | 9.81 | | | $ | 10.37 | | |
Total return(c) | | | (5.27 | %) | | | (2.96 | %) | | | 6.02 | % | |
Net assets, end of period (in 000s) | | $ | 95,155 | | | $ | 390,102 | | | $ | 290,999 | | |
RATIOS TO AVERAGE NET ASSETS: | |
Gross expenses(d) | | | 2.37 | % | | | 2.27 | % | | | 2.11 | % | |
Net expenses after advisory fees waived and expenses reimbursed(d)(e) | | | 2.21 | % | | | 2.25 | % | | | 2.06 | % | |
Net investment income (loss) | | | (0.26 | %) | | | 0.62 | % | | | 1.31 | % | |
Portfolio turnover rate | | | 350 | % | | | 451 | % | | | 340 | % | |
(a) Per share amounts were calculated using average shares outstanding for the year.
(b) Amount rounds to less than $0.01 per share.
(c) Total return is a measure of the change in the value of an investment in the Fund over the years covered, which assumes any dividends or capital gains distributions are reinvested in shares of the Fund. Returns shown do not reflect the deduction of taxes a shareholder would pay on Fund distributions or the redemption of Fund shares.
(d) Dividend expense totaled 0.58%, 0.55%, 0.49%, 0.36% and 0.27% of average net assets for the years ended May 31, 2016, 2015, 2014, 2013 and 2012, respectively. Interest rebate expense and line of credit interest expense totaled 0.19%, 0.26%, 0.13%, 0.13% and 0.21% of average net assets for the years ended May 31, 2016, 2015, 2014, 2013 and 2012, respectively.
(e) Excluding dividend and interest expenses, the Fund's net expenses after advisory fees waived and expenses reimbursed would have been 1.44%, 1.44%, 1.44%, 1.44% and 1.44% of average net assets for the years ended May 31, 2016, 2015, 2014, 2013 and 2012, respectively.
See Notes to Financial Statements.
www.arbitragefunds.com | 1-800-295-4485
86
| | | Year Ended
May 31, 2013 | | Year Ended
May 31, 2012 | |
Net asset value, beginning of period | | $ | 9.82 | | | $ | 10.24 | | |
Income (loss) from investment operations | |
Net investment income (loss)(a) | | | 0.16 | | | | 0.12 | | |
Net realized and unrealized gains (losses) on investments and foreign currencies | | | 0.13 | | | | 0.09 | | |
Total from investment operations | | | 0.29 | | | | 0.21 | | |
Less distributions | |
From net investment income | | | (0.10 | ) | | | (0.15 | ) | |
From net realized gains | | | (0.15 | ) | | | (0.48 | ) | |
Total distributions | | | (0.25 | ) | | | (0.63 | ) | |
Proceeds from redemption fees collected(b) | | | 0.00 | | | | 0.00 | | |
Net asset value, end of period | | $ | 9.86 | | | $ | 9.82 | | |
Total return(c) | | | 3.04 | % | | | 2.09 | % | |
Net assets, end of period (in 000s) | | $ | 41,493 | | | $ | 21,389 | | |
RATIOS TO AVERAGE NET ASSETS: | |
Gross expenses(d) | | | 2.31 | % | | | 2.42 | % | |
Net expenses after advisory fees waived and expenses reimbursed(d)(e) | | | 1.93 | % | | | 1.92 | % | |
Net investment income (loss) | | | 1.68 | % | | | 1.25 | % | |
Portfolio turnover rate | | | 336 | % | | | 490 | % | |
Annual Report | May 31, 2016
87
The Arbitrage Event-Driven Fund – Class C
Selected Per Share Data and Ratios for a Share Outstanding Throughout the Periods Presented:
| | | Year Ended
May 31, 2016 | | Year Ended
May 31, 2015 | |
Net asset value, beginning of period | | $ | 9.62 | | | $ | 10.22 | | |
Income (loss) from investment operations | |
Net investment income (loss)(b) | | | (0.09 | ) | | | (0.04 | ) | |
Net realized and unrealized gains (losses) on investments and foreign currencies | | | (0.50 | ) | | | (0.36 | ) | |
Total from investment operations | | | (0.59 | ) | | | (0.40 | ) | |
Less distributions | |
From net investment income | | | (0.12 | ) | | | (0.04 | ) | |
From net realized gains | | | (0.00 | )(c) | | | (0.16 | ) | |
Total distributions | | | (0.12 | ) | | | (0.20 | ) | |
Net asset value, end of period | | $ | 8.91 | | | $ | 9.62 | | |
Total return(d) | | | (6.14 | %) | | | (3.95 | %) | |
Net assets, end of period (in 000s) | | $ | 2,538 | | | $ | 5,020 | | |
RATIOS TO AVERAGE NET ASSETS: | |
Gross expenses(e) | | | 3.37 | % | | | 3.27 | % | |
Net expenses after advisory fees waived and expenses reimbursed(e)(f) | | | 3.21 | % | | | 3.25 | % | |
Net investment income (loss) | | | (0.95 | %) | | | (0.37 | %) | |
Portfolio turnover rate | | | 350 | % | | | 451 | % | |
(a) Commenced operations on June 1, 2012.
(b) Per share amounts were calculated using average shares outstanding for the year.
(c) Amount rounds to less than $0.01 per share.
(d) Total return is a measure of the change in the value of an investment in the Fund over the years covered, which assumes any dividends or capital gains distributions are reinvested in shares of the Fund. Returns shown do not reflect the deduction of taxes a shareholder would pay on Fund distributions or the redemption of Fund shares.
(e) Dividend expense totaled 0.59%, 0.55%, 0.49% and 0.36% of average net assets for the years ended May 31, 2016, 2015, 2014 and 2013, respectively. Interest rebate expense and line of credit interest expense totaled 0.18%, 0.26%, 0.13% and 0.13% of average net assets for the years ended May 31, 2016, 2015, 2014 and 2013, respectively.
(f) Excluding dividend and interest expenses, the Fund's net expenses after advisory fees waived and expenses reimbursed would have been 2.44%, 2.44%, 2.44% and 2.44% of average net assets for the years ended May 31, 2016, 2015, 2014, and 2013, respectively.
See Notes to Financial Statements.
www.arbitragefunds.com | 1-800-295-4485
88
| | | Year Ended
May 31, 2014 | | Year Ended
May 31, 2013(a) | |
Net asset value, beginning of period | | $ | 9.78 | | | $ | 9.79 | | |
Income (loss) from investment operations | |
Net investment income (loss)(b) | | | 0.03 | | | | 0.09 | | |
Net realized and unrealized gains (losses) on investments and foreign currencies | | | 0.46 | | | | 0.13 | | |
Total from investment operations | | | 0.49 | | | | 0.22 | | |
Less distributions | |
From net investment income | | | (0.04 | ) | | | (0.08 | ) | |
From net realized gains | | | (0.01 | ) | | | (0.15 | ) | |
Total distributions | | | (0.05 | ) | | | (0.23 | ) | |
Net asset value, end of period | | $ | 10.22 | | | $ | 9.78 | | |
Total return(d) | | | 5.05 | % | | | 2.33 | % | |
Net assets, end of period (in 000s) | | $ | 4,232 | | | $ | 342 | | |
RATIOS TO AVERAGE NET ASSETS: | |
Gross expenses(e) | | | 3.12 | % | | | 3.31 | % | |
Net expenses after advisory fees waived and expenses reimbursed(e)(f) | | | 3.06 | % | | | 2.93 | % | |
Net investment income (loss) | | | 0.32 | % | | | 0.95 | % | |
Portfolio turnover rate | | | 340 | % | | | 336 | % | |
Annual Report | May 31, 2016
89
The Arbitrage Event-Driven Fund – Class A
Selected Per Share Data and Ratios for a Share Outstanding Throughout the Periods Presented:
| | | Year Ended
May 31, 2016 | | Year Ended
May 31, 2015 | |
Net asset value, beginning of period | | $ | 9.73 | | | $ | 10.30 | | |
Income (loss) from investment operations | |
Net investment income (loss)(b) | | | (0.03 | ) | | | 0.03 | | |
Net realized and unrealized gains (losses) on investments and foreign currencies | | | (0.52 | ) | | | (0.36 | ) | |
Total from investment operations | | | (0.55 | ) | | | (0.33 | ) | |
Less distributions | |
From net investment income | | | (0.20 | ) | | | (0.08 | ) | |
From net realized gains | | | (0.00 | )(c) | | | (0.16 | ) | |
Total distributions | | | (0.20 | ) | | | (0.24 | ) | |
Proceeds from redemption fees collected | | | – | | | | – | | |
Net asset value, end of period | | $ | 8.98 | | | $ | 9.73 | | |
Total return(d) | | | (5.54 | %) | | | (3.22 | %) | |
Net assets, end of period (in 000s) | | $ | 2,062 | | | $ | 5,341 | | |
RATIOS TO AVERAGE NET ASSETS: | |
Gross expenses(e) | | | 2.63 | % | | | 2.52 | % | |
Net expenses after advisory fees waived and expenses reimbursed(e)(f) | | | 2.47 | % | | | 2.50 | % | |
Net investment income (loss) | | | (0.28 | %) | | | 0.35 | % | |
Portfolio turnover rate | | | 350 | % | | | 451 | % | |
(a) Commenced operations on June 1, 2013.
(b) Per share amounts were calculated using average shares outstanding for the year.
(c) Amount rounds to less than $0.01 per share.
(d) Total return is a measure of the change in the value of an investment in the Fund over the years covered, which assumes any dividends or capital gains distributions are reinvested in shares of the Fund. Returns shown do not reflect the deduction of taxes a shareholder would pay on Fund distributions or the redemption of Fund shares.
(e) Dividend expense totaled 0.59%, 0.55% and 0.49% of average net assets for the years ended May 31, 2016, 2015 and 2014, respectively. Interest rebate expense and line of credit interest expense totaled 0.19%, 0.26% and 0.13% of average net assets for the years ended May 31, 2016, 2015 and 2014, respectively.
(f) Excluding dividend and interest expenses, the Fund's net expenses after advisory fees waived and expenses reimbursed would have been 1.69%, 1.69% and 1.69% of average net assets for the years ended May 31, 2016, 2015 and 2014, respectively.
See Notes to Financial Statements.
www.arbitragefunds.com | 1-800-295-4485
90
| | | Period Ended
May 31, 2014(a) | |
Net asset value, beginning of period | | $ | 9.80 | | |
Income (loss) from investment operations | |
Net investment income (loss)(b) | | | 0.10 | | |
Net realized and unrealized gains (losses) on investments and foreign currencies | | | 0.47 | | |
Total from investment operations | | | 0.57 | | |
Less distributions | |
From net investment income | | | (0.06 | ) | |
From net realized gains | | | (0.01 | ) | |
Total distributions | | | (0.07 | ) | |
Proceeds from redemption fees collected | | | 0.00 | (c) | |
Net asset value, end of period | | $ | 10.30 | | |
Total return(d) | | | 5.85 | % | |
Net assets, end of period (in 000s) | | $ | 3,830 | | |
RATIOS TO AVERAGE NET ASSETS: | |
Gross expenses(e) | | | 2.36 | % | |
Net expenses after advisory fees waived and expenses reimbursed(e)(f) | | | 2.31 | % | |
Net investment income (loss) | | | 0.98 | % | |
Portfolio turnover rate | | | 340 | % | |
Annual Report | May 31, 2016
91
The Arbitrage Credit Opportunities Fund – Class R
Selected Per Share Data and Ratios for a Share Outstanding Throughout the Periods Presented:
| | | Year Ended
May 31, 2016 | | Year Ended
May 31, 2015 | |
Net asset value, beginning of period | | $ | 9.95 | | | $ | 10.28 | | |
Income (loss) from investment operations | |
Net investment income(b) | | | 0.25 | | | | 0.28 | | |
Net realized and unrealized gains (losses) on investments and foreign currencies | | | (0.24 | ) | | | (0.29 | ) | |
Total from investment operations | | | 0.01 | | | | (0.01 | ) | |
Less distributions | |
From net investment income | | | (0.27 | ) | | | (0.32 | ) | |
Total distributions | | | (0.27 | ) | | | (0.32 | ) | |
Proceeds from redemption fees collected | | | – | | | | 0.00 | (c) | |
Net asset value, end of period | | $ | 9.69 | | | $ | 9.95 | | |
Total return(d) | | | 0.10 | % | | | (0.10 | %) | |
Net assets, end of period (in 000s) | | $ | 12,426 | | | $ | 22,728 | | |
RATIOS TO AVERAGE NET ASSETS: | |
Gross expenses(g) | | | 1.92 | % | | | 2.27 | % | |
Net expenses after advisory fees waived and expenses reimbursed(g)(h) | | | 1.67 | % | | | 2.03 | % | |
Net investment income | | | 2.62 | % | | | 2.84 | % | |
Portfolio turnover rate | | | 181 | % | | | 191 | % | |
(a) Commenced operations on October 1, 2012.
(b) Per share amounts were calculated using average shares outstanding for the year.
(c) Amount rounds to less than $0.01 per share.
(d) Total return is a measure of the change in the value of an investment in the Fund over the years covered, which assumes any dividends or capital gains distributions are reinvested in shares of the Fund. Returns shown do not reflect the deduction of taxes a shareholder would pay on Fund distributions or the redemption of Fund shares.
(e) Not annualized.
(f) Annualized.
(g) Dividend expense totaled 0.03%, 0.06%, 0.10% and 0.03% (annualized) of average net assets for the years ended May 31, 2016, 2015 and 2014 and the period ended May 31, 2013, respectively. Interest rebate expense and line of credit interest expense totaled 0.14%, 0.47%, 0.07% and 0.02% (annualized) of average net assets for the years ended May 31, 2016, 2015 and 2014 and the period ended May 31, 2013, respectively.
(h) Excluding dividend and interest expenses, the Fund's net expenses after advisory fees waived and expenses reimbursed would have been 1.50%, 1.50%, 1.50% and 1.50% (annualized) of average net assets for the years ended May 31, 2016, 2015 and 2014 and the period ended May 31, 2013, respectively.
See Notes to Financial Statements.
www.arbitragefunds.com | 1-800-295-4485
92
| | | Year Ended
May 31, 2014 | | Period Ended
May 31, 2013(a) | |
Net asset value, beginning of period | | $ | 10.18 | | | $ | 10.00 | | |
Income (loss) from investment operations | |
Net investment income(b) | | | 0.40 | | | | 0.17 | | |
Net realized and unrealized gains (losses) on investments and foreign currencies | | | 0.08 | | | | 0.06 | | |
Total from investment operations | | | 0.48 | | | | 0.23 | | |
Less distributions | |
From net investment income | | | (0.39 | ) | | | (0.05 | ) | |
Total distributions | | | (0.39 | ) | | | (0.05 | ) | |
Proceeds from redemption fees collected | | | 0.01 | | | | 0.00 | (c) | |
Net asset value, end of period | | $ | 10.28 | | | $ | 10.18 | | |
Total return(d) | | | 4.99 | % | | | 2.33 | %(e) | |
Net assets, end of period (in 000s) | | $ | 6,393 | | | $ | 1,671 | | |
RATIOS TO AVERAGE NET ASSETS: | |
Gross expenses(g) | | | 2.71 | % | | | 3.79 | %(f) | |
Net expenses after advisory fees waived and expenses reimbursed(g)(h) | | | 1.67 | % | | | 1.55 | %(f) | |
Net investment income | | | 3.97 | % | | | 2.49 | %(f) | |
Portfolio turnover rate | | | 181 | % | | | 92 | %(e) | |
Annual Report | May 31, 2016
93
The Arbitrage Credit Opportunities Fund – Class I
Selected Per Share Data and Ratios for a Share Outstanding Throughout the Periods Presented:
| | | Year Ended
May 31, 2016 | | Year Ended
May 31, 2015 | |
Net asset value, beginning of period | | $ | 9.93 | | | $ | 10.25 | | |
Income (loss) from investment operations | |
Net investment income(b) | | | 0.27 | | | | 0.33 | | |
Net realized and unrealized gains (losses) on investments and foreign currencies | | | (0.24 | ) | | | (0.31 | ) | |
Total from investment operations | | | 0.03 | | | | 0.02 | | |
Less distributions | |
From net investment income | | | (0.29 | ) | | | (0.34 | ) | |
Total distributions | | | (0.29 | ) | | | (0.34 | ) | |
Proceeds from redemption fees collected | | | – | | | | 0.00 | (c) | |
Net asset value, end of period | | $ | 9.67 | | | $ | 9.93 | | |
Total return(d) | | | 0.30 | % | | | 0.16 | % | |
Net assets, end of period (in 000s) | | $ | 41,992 | | | $ | 46,118 | | |
RATIOS TO AVERAGE NET ASSETS: | |
Gross expenses(g) | | | 1.68 | % | | | 2.04 | % | |
Net expenses after advisory fees waived and expenses reimbursed(g)(h) | | | 1.43 | % | | | 1.78 | % | |
Net investment income | | | 2.84 | % | | | 3.28 | % | |
Portfolio turnover rate | | | 181 | % | | | 191 | % | |
(a) Commenced operations on October 1, 2012.
(b) Per share amounts were calculated using average shares outstanding for the year.
(c) Amount rounds to less than $0.01 per share.
(d) Total return is a measure of the change in the value of an investment in the Fund over the years covered, which assumes any dividends or capital gains distributions are reinvested in shares of the Fund. Returns shown do not reflect the deduction of taxes a shareholder would pay on Fund distributions or the redemption of Fund shares.
(e) Not annualized.
(f) Annualized.
(g) Dividend expense totaled 0.04%, 0.06%, 0.10% and 0.03% (annualized) of average net assets for the years ended May 31, 2016, 2015 and 2014 and the period ended May 31, 2013, respectively. Interest rebate expense and line of credit interest expense totaled 0.14%, 0.47%, 0.07% and 0.01% (annualized) of average net assets for the years ended May 31, 2016, 2015 and 2014 and the period ended May 31, 2013, respectively.
(h) Excluding dividend and interest expenses, the Fund's net expenses after advisory fees waived and expenses reimbursed would have been 1.25%, 1.25%, 1.25% and 1.25% (annualized) of average net assets for the years ended May 31, 2016, 2015 and 2014 and the period ended May 31, 2013, respectively.
See Notes to Financial Statements.
www.arbitragefunds.com | 1-800-295-4485
94
| | | Year Ended
May 31, 2014 | | Period Ended
May 31, 2013(a) | |
Net asset value, beginning of period | | $ | 10.16 | | | $ | 10.00 | | |
Income (loss) from investment operations | |
Net investment income(b) | | | 0.42 | | | | 0.17 | | |
Net realized and unrealized gains (losses) on investments and foreign currencies | | | 0.08 | | | | 0.08 | | |
Total from investment operations | | | 0.50 | | | | 0.25 | | |
Less distributions | |
From net investment income | | | (0.41 | ) | | | (0.09 | ) | |
Total distributions | | | (0.41 | ) | | | (0.09 | ) | |
Proceeds from redemption fees collected | | | 0.00 | (c) | | | – | | |
Net asset value, end of period | | $ | 10.25 | | | $ | 10.16 | | |
Total return(d) | | | 5.08 | % | | | 2.49 | %(e) | |
Net assets, end of period (in 000s) | | $ | 23,039 | | | $ | 3,462 | | |
RATIOS TO AVERAGE NET ASSETS: | |
Gross expenses(g) | | | 2.37 | % | | | 3.64 | %(f) | |
Net expenses after advisory fees waived and expenses reimbursed(g)(h) | | | 1.42 | % | | | 1.29 | %(f) | |
Net investment income | | | 4.16 | % | | | 2.62 | %(f) | |
Portfolio turnover rate | | | 181 | % | | | 92 | %(e) | |
Annual Report | May 31, 2016
95
The Arbitrage Credit Opportunities Fund – Class C
Selected Per Share Data and Ratios for a Share Outstanding Throughout the Periods Presented:
| | | Year Ended
May 31, 2016 | | Year Ended
May 31, 2015 | |
Net asset value, beginning of period | | $ | 9.89 | | | $ | 10.23 | | |
Income (loss) from investment operations | |
Net investment income(b) | | | 0.18 | | | | 0.22 | | |
Net realized and unrealized gains (losses) on investments and foreign currencies | | | (0.25 | ) | | | (0.30 | ) | |
Total from investment operations | | | (0.07 | ) | | | (0.08 | ) | |
Less distributions | |
From net investment income | | | (0.21 | ) | | | (0.26 | ) | |
Total distributions | | | (0.21 | ) | | | (0.26 | ) | |
Net asset value, end of period | | $ | 9.61 | | | $ | 9.89 | | |
Total return(c) | | | (0.72 | %) | | | (0.76 | %) | |
Net assets, end of period (in 000s) | | $ | 1,220 | | | $ | 2,020 | | |
RATIOS TO AVERAGE NET ASSETS: | |
Gross expenses(f) | | | 2.68 | % | | | 3.05 | % | |
Net expenses after advisory fees waived and expenses reimbursed(f)(g) | | | 2.43 | % | | | 2.78 | % | |
Net investment income | | | 1.92 | % | | | 2.24 | % | |
Portfolio turnover rate | | | 181 | % | | | 191 | % | |
(a) Commenced operations on October 1, 2012.
(b) Per share amounts were calculated using average shares outstanding for the year.
(c) Total return is a measure of the change in the value of an investment in the Fund over the years covered, which assumes any dividends or capital gains distributions are reinvested in shares of the Fund. Returns shown do not reflect the deduction of taxes a shareholder would pay on Fund distributions or the redemption of Fund shares.
(d) Not annualized.
(e) Annualized.
(f) Dividend expense totaled 0.04%, 0.06%, 0.10% and 0.03% (annualized) of average net assets for the years ended May 31, 2016, 2015, 2014 and the period ended May 31, 2013, respectively. Interest rebate expense and line of credit interest expense totaled 0.14%, 0.47%, 0.07% and 0.01% (annualized) of average net assets for the years ended May 31, 2016, 2015 and 2014 and the period ended May 31, 2013, respectively.
(g) Excluding dividend and interest expenses, the Fund's net expenses after advisory fees waived and expenses reimbursed would have been 2.25%, 2.25%, 2.25% and 2.25% (annualized) of average net assets for the years ended May 31, 2016, 2015 and 2014 and the period ended May 31, 2013, respectively.
See Notes to Financial Statements.
www.arbitragefunds.com | 1-800-295-4485
96
| | | Year Ended
May 31, 2014 | | Period Ended
May 31, 2013(a) | |
Net asset value, beginning of period | | $ | 10.17 | | | $ | 10.00 | | |
Income (loss) from investment operations | |
Net investment income(b) | | | 0.34 | | | | 0.11 | | |
Net realized and unrealized gains (losses) on investments and foreign currencies | | | 0.07 | | | | 0.09 | | |
Total from investment operations | | | 0.41 | | | | 0.20 | | |
Less distributions | |
From net investment income | | | (0.35 | ) | | | (0.03 | ) | |
Total distributions | | | (0.35 | ) | | | (0.03 | ) | |
Net asset value, end of period | | $ | 10.23 | | | $ | 10.17 | | |
Total return(c) | | | 4.17 | % | | | 2.01 | %(d) | |
Net assets, end of period (in 000s) | | $ | 716 | | | $ | 26 | | |
RATIOS TO AVERAGE NET ASSETS: | |
Gross expenses(f) | | | 3.37 | % | | | 4.69 | %(e) | |
Net expenses after advisory fees waived and expenses reimbursed(f)(g) | | | 2.42 | % | | | 2.30 | %(e) | |
Net investment income | | | 3.37 | % | | | 1.58 | %(e) | |
Portfolio turnover rate | | | 181 | % | | | 92 | %(d) | |
Annual Report | May 31, 2016
97
The Arbitrage Credit Opportunities Fund – Class A
Selected Per Share Data and Ratios for a Share Outstanding Throughout the Periods Presented:
| | | Year Ended
May 31, 2016 | | Year Ended
May 31, 2015 | |
Net asset value, beginning of period | | $ | 9.93 | | | $ | 10.25 | | |
Income (loss) from investment operations | |
Net investment income(b) | | | 0.25 | | | | 0.29 | | |
Net realized and unrealized gains (losses) on investments and foreign currencies | | | (0.25 | ) | | | (0.29 | ) | |
Total from investment operations | | | – | | | | – | | |
Less distributions | |
From net investment income | | | (0.26 | ) | | | (0.32 | ) | |
Total distributions | | | (0.26 | ) | | | (0.32 | ) | |
Net asset value, end of period | | $ | 9.67 | | | $ | 9.93 | | |
Total return(c) | | | 0.02 | % | | | (0.01 | %) | |
Net assets, end of period (in 000s) | | $ | 104 | | | $ | 630 | | |
RATIOS TO AVERAGE NET ASSETS: | |
Gross expenses(d) | | | 1.91 | % | | | 2.29 | % | |
Net expenses after advisory fees waived and expenses reimbursed(d)(e) | | | 1.66 | % | | | 2.03 | % | |
Net investment income | | | 2.62 | % | | | 2.95 | % | |
Portfolio turnover rate | | | 181 | % | | | 191 | % | |
(a) Commenced operations on June 1, 2013.
(b) Per share amounts were calculated using average shares outstanding for the year.
(c) Total return is a measure of the change in the value of an investment in the Fund over the years covered, which assumes any dividends or capital gains distributions are reinvested in shares of the Fund. Returns shown do not reflect the deduction of taxes a shareholder would pay on Fund distributions or the redemption of Fund shares.
(d) Dividend expense totaled 0.02%, 0.06% and 0.10% of average net assets for the years ended May 31, 2016, 2015 and 2014, respectively. Interest rebate expense and line of credit interest expense totaled 0.14%, 0.47% and 0.07% of average net assets for the years ended May 31, 2016, 2015 and 2014, respectively.
(e) Excluding dividend and interest expenses, the Fund's net expenses after advisory fees waived and expenses reimbursed would have been 1.50%, 1.50% and 1.50% of average net assets for the years ended May 31, 2016, 2015 and 2014, respectively.
See Notes to Financial Statements.
www.arbitragefunds.com | 1-800-295-4485
98
| | | Period Ended
May 31, 2014(a) | |
Net asset value, beginning of period | | $ | 10.18 | | |
Income (loss) from investment operations | |
Net investment income(b) | | | 0.39 | | |
Net realized and unrealized gains (losses) on investments and foreign currencies | | | 0.09 | | |
Total from investment operations | | | 0.48 | | |
Less distributions | |
From net investment income | | | (0.41 | ) | |
Total distributions | | | (0.41 | ) | |
Net asset value, end of period | | $ | 10.25 | | |
Total return(c) | | | 4.86 | % | |
Net assets, end of period (in 000s) | | $ | 28 | | |
RATIOS TO AVERAGE NET ASSETS: | |
Gross expenses(d) | | | 2.77 | % | |
Net expenses after advisory fees waived and expenses reimbursed(d)(e) | | | 1.67 | % | |
Net investment income | | | 3.89 | % | |
Portfolio turnover rate | | | 181 | % | |
Annual Report | May 31, 2016
99
The Arbitrage Tactical Equity Fund – Class R
Selected Per Share Data and Ratios for a Share Outstanding Throughout the Periods Presented:
| | | Year Ended
May 31, 2016 | |
Net asset value, beginning of period | | $ | 10.12 | | |
Income (loss) from investment operations | |
Net investment loss(b) | | | (0.03 | ) | |
Net realized and unrealized gains (losses) on investments and foreign currencies | | | (0.69 | ) | |
Total from investment operations | | | (0.72 | ) | |
Less distributions | |
From net realized gains | | | (0.09 | ) | |
Total distributions | | | (0.09 | ) | |
Net asset value, end of period | | $ | 9.31 | | |
Total return(c) | | | (7.12 | %) | |
Net assets, end of period (in 000s) | | $ | 9 | | |
RATIOS TO AVERAGE NET ASSETS: | |
Gross expenses(f) | | | 20.24 | % | |
Net expenses after advisory fees waived and expenses reimbursed(f)(g) | | | 2.62 | % | |
Net investment loss | | | (0.34 | %) | |
Portfolio turnover rate | | | 416 | % | |
(a) Commenced operations on January 2, 2015.
(b) Per share amounts were calculated using average shares outstanding for the year.
(c) Total return is a measure of the change in the value of an investment in the Fund over the years covered, which assumes any dividends or capital gains distributions are reinvested in shares of the Fund. Returns shown do not reflect the deduction of taxes a shareholder would pay on Fund distributions or the redemption of Fund shares.
(d) Not annualized.
(e) Annualized.
(f) Dividend expense totaled 0.70% and 1.01% (annualized) of average net assets for the year ended May 31, 2016 and the period ended May 31, 2015, respectively. Interest rebate expense and line of credit interest expense totaled 0.23% and 0.15% (annualized) of average net assets for the year ended May 31, 2016 and the period ended May 31, 2015, respectively.
(g) Excluding dividend and interest expenses, the Fund's net expenses after advisory fees waived and expenses reimbursed would have been 1.69% and 1.69% (annualized) of average net assets for the year ended May 31, 2016 and the period ended May 31, 2015, respectively.
See Notes to Financial Statements.
www.arbitragefunds.com | 1-800-295-4485
100
| | | Period Ended
May 31, 2015(a) | |
Net asset value, beginning of period | | $ | 10.00 | | |
Income (loss) from investment operations | |
Net investment loss(b) | | | (0.10 | ) | |
Net realized and unrealized gains (losses) on investments and foreign currencies | | | 0.22 | | |
Total from investment operations | | | 0.12 | | |
Less distributions | |
From net realized gains | | | – | | |
Total distributions | | | – | | |
Net asset value, end of period | | $ | 10.12 | | |
Total return(c) | | | 1.20 | %(d) | |
Net assets, end of period (in 000s) | | $ | 10 | | |
RATIOS TO AVERAGE NET ASSETS: | |
Gross expenses(f) | | | 44.48 | %(e) | |
Net expenses after advisory fees waived and expenses reimbursed(f)(g) | | | 2.85 | %(e) | |
Net investment loss | | | (2.35 | %)(e) | |
Portfolio turnover rate | | | 235 | %(d) | |
Annual Report | May 31, 2016
101
The Arbitrage Tactical Equity Fund – Class I
Selected Per Share Data and Ratios for a Share Outstanding Throughout the Periods Presented:
| | | Year Ended
May 31, 2016 | |
Net asset value, beginning of period | | $ | 10.12 | | |
Income (loss) from investment operations | |
Net investment loss(b) | | | (0.04 | ) | |
Net realized and unrealized gains (losses) on investments and foreign currencies | | | (0.68 | ) | |
Total from investment operations | | | (0.72 | ) | |
Less distributions | |
From net realized gains | | | (0.09 | ) | |
Total distributions | | | (0.09 | ) | |
Net asset value, end of period | | $ | 9.31 | | |
Total return(c) | | | (7.12 | %) | |
Net assets, end of period (in 000s) | | $ | 1,302 | | |
RATIOS TO AVERAGE NET ASSETS: | |
Gross expenses(f) | | | 20.02 | % | |
Net expenses after advisory fees waived and expenses reimbursed(f)(g) | | | 2.40 | % | |
Net investment loss | | | (0.47 | %) | |
Portfolio turnover rate | | | 416 | % | |
(a) Commenced operations on January 2, 2015.
(b) Per share amounts were calculated using average shares outstanding for the year.
(c) Total return is a measure of the change in the value of an investment in the Fund over the years covered, which assumes any dividends or capital gains distributions are reinvested in shares of the Fund. Returns shown do not reflect the deduction of taxes a shareholder would pay on Fund distributions or the redemption of Fund shares.
(d) Not annualized.
(e) Annualized.
(f) Dividend expense totaled 0.72% and 1.01% (annualized) of average net assets for the year ended May 31, 2016 and the period ended May 31, 2015, respectively. Interest rebate expense and line of credit interest expense totaled 0.24% and 0.15% (annualized) of average net assets for the year ended May 31, 2016 and the period ended May 31, 2015, respectively.
(g) Excluding dividend and interest expenses, the Fund's net expenses after advisory fees waived and expenses reimbursed would have been 1.44% and 1.44% (annualized) of average net assets for the year ended May 31, 2016 and the period ended May 31, 2015, respectively.
See Notes to Financial Statements.
www.arbitragefunds.com | 1-800-295-4485
102
| | | Period Ended
May 31, 2015(a) | |
Net asset value, beginning of period | | $ | 10.00 | | |
Income (loss) from investment operations | |
Net investment loss(b) | | | (0.09 | ) | |
Net realized and unrealized gains (losses) on investments and foreign currencies | | | 0.21 | | |
Total from investment operations | | | 0.12 | | |
Less distributions | |
From net realized gains | | | – | | |
Total distributions | | | – | | |
Net asset value, end of period | | $ | 10.12 | | |
Total return(c) | | | 1.20 | %(d) | |
Net assets, end of period (in 000s) | | $ | 1,386 | | |
RATIOS TO AVERAGE NET ASSETS: | |
Gross expenses(f) | | | 28.08 | %(e) | |
Net expenses after advisory fees waived and expenses reimbursed(f)(g) | | | 2.60 | %(e) | |
Net investment loss | | | (2.15 | %)(e) | |
Portfolio turnover rate | | | 235 | %(d) | |
Annual Report | May 31, 2016
103
The Arbitrage Tactical Equity Fund – Class C
Selected Per Share Data and Ratios for a Share Outstanding Throughout the Periods Presented:
| | | Year Ended
May 31, 2016 | |
Net asset value, beginning of period | | $ | 10.12 | | |
Income (loss) from investment operations | |
Net investment loss(b) | | | (0.10 | ) | |
Net realized and unrealized gains (losses) on investments and foreign currencies | | | (0.62 | ) | |
Total from investment operations | | | (0.72 | ) | |
Less distributions | |
From net realized gains | | | (0.09 | ) | |
Total distributions | | | (0.09 | ) | |
Net asset value, end of period | | $ | 9.31 | | |
Total return(c) | | | (7.12 | %) | |
Net assets, end of period (in 000s) | | $ | 9 | | |
RATIOS TO AVERAGE NET ASSETS: | |
Gross expenses(f) | | | 20.99 | % | |
Net expenses after advisory fees waived and expenses reimbursed(f)(g) | | | 3.37 | % | |
Net investment loss | | | (1.09 | %) | |
Portfolio turnover rate | | | 416 | % | |
(a) Commenced operations on January 2, 2015.
(b) Per share amounts were calculated using average shares outstanding for the year.
(c) Total return is a measure of the change in the value of an investment in the Fund over the years covered, which assumes any dividends or capital gains distributions are reinvested in shares of the Fund. Returns shown do not reflect the deduction of taxes a shareholder would pay on Fund distributions or the redemption of Fund shares.
(d) Not annualized.
(e) Annualized.
(f) Dividend expense totaled 0.70% and 1.01% (annualized) of average net assets for the year ended May 31, 2016 and the period ended May 31, 2015, respectively. Interest rebate expense and line of credit interest expense totaled 0.23% and 0.15% (annualized) of average net assets for the year ended May 31, 2016 and the period ended May 31, 2015, respectively.
(g) Excluding dividend and interest expenses, the Fund's net expenses after advisory fees waived and expenses reimbursed would have been 2.44% and 2.44% (annualized) of average net assets for the year ended May 31, 2016 and the period ended May 31, 2015, respectively.
See Notes to Financial Statements.
www.arbitragefunds.com | 1-800-295-4485
104
| | | Period Ended
May 31, 2015(a) | |
Net asset value, beginning of period | | $ | 10.00 | | |
Income (loss) from investment operations | |
Net investment loss(b) | | | (0.13 | ) | |
Net realized and unrealized gains (losses) on investments and foreign currencies | | | 0.25 | | |
Total from investment operations | | | 0.12 | | |
Less distributions | |
From net realized gains | | | – | | |
Total distributions | | | – | | |
Net asset value, end of period | | $ | 10.12 | | |
Total return(c) | | | 1.20 | %(d) | |
Net assets, end of period (in 000s) | | $ | 10 | | |
RATIOS TO AVERAGE NET ASSETS: | |
Gross expenses(f) | | | 45.25 | %(e) | |
Net expenses after advisory fees waived and expenses reimbursed(f)(g) | | | 3.60 | %(e) | |
Net investment loss | | | (3.10 | %)(e) | |
Portfolio turnover rate | | | 235 | %(d) | |
Annual Report | May 31, 2016
105
The Arbitrage Tactical Equity Fund – Class A
Selected Per Share Data and Ratios for a Share Outstanding Throughout the Periods Presented:
| | | Year Ended
May 31, 2016 | |
Net asset value, beginning of period | | $ | 10.12 | | |
Income (loss) from investment operations | |
Net investment loss(b) | | | (0.03 | ) | |
Net realized and unrealized gains (losses) on investments and foreign currencies | | | (0.69 | ) | |
Total from investment operations | | | (0.72 | ) | |
Less distributions | |
From net realized gains | | | (0.09 | ) | |
Total distributions | | | (0.09 | ) | |
Net asset value, end of period | | $ | 9.31 | | |
Total return(c) | | | (7.12 | %) | |
Net assets, end of period (in 000s) | | $ | 9 | | |
RATIOS TO AVERAGE NET ASSETS: | |
Gross expenses(f) | | | 20.24 | % | |
Net expenses after advisory fees waived and expenses reimbursed(f)(g) | | | 2.62 | % | |
Net investment loss | | | (0.34 | %) | |
Portfolio turnover rate | | | 416 | % | |
(a) Commenced operations on January 2, 2015.
(b) Per share amounts were calculated using average shares outstanding for the year.
(c) Total return is a measure of the change in the value of an investment in the Fund over the years covered, which assumes any dividends or capital gains distributions are reinvested in shares of the Fund. Returns shown do not reflect the deduction of taxes a shareholder would pay on Fund distributions or the redemption of Fund shares.
(d) Not annualized.
(e) Annualized.
(f) Dividend expense totaled 0.70% and 1.01% (annualized) of average net assets for the year ended May 31, 2016 and the period ended May 31, 2015, respectively. Interest rebate expense and line of credit interest expense totaled 0.23% and 0.15% (annualized) of average net assets for the year ended May 31, 2016 and the period ended May 31, 2015, respectively.
(g) Excluding dividend and interest expenses, the Fund's net expenses after advisory fees waived and expenses reimbursed would have been 1.69% and 1.69% (annualized) of average net assets for the year ended May 31, 2016 and the period ended May 31, 2015, respectively.
See Notes to Financial Statements.
www.arbitragefunds.com | 1-800-295-4485
106
| | | Period Ended
May 31, 2015(a) | |
Net asset value, beginning of period | | $ | 10.00 | | |
Income (loss) from investment operations | |
Net investment loss(b) | | | (0.10 | ) | |
Net realized and unrealized gains (losses) on investments and foreign currencies | | | 0.22 | | |
Total from investment operations | | | 0.12 | | |
Less distributions | |
From net realized gains | | | – | | |
Total distributions | | | – | | |
Net asset value, end of period | | $ | 10.12 | | |
Total return(c) | | | 1.20 | %(d) | |
Net assets, end of period (in 000s) | | $ | 10 | | |
RATIOS TO AVERAGE NET ASSETS: | |
Gross expenses(f) | | | 44.49 | %(e) | |
Net expenses after advisory fees waived and expenses reimbursed(f)(g) | | | 2.85 | %(e) | |
Net investment loss | | | (2.35 | %)(e) | |
Portfolio turnover rate | | | 235 | %(d) | |
Annual Report | May 31, 2016
107
The Arbitrage Funds Notes to Financial Statements
1. ORGANIZATION
The Arbitrage Funds (the "Trust") is a Delaware statutory trust, which was organized on December 22, 1999 and is registered under the Investment Company Act of 1940, as amended (the "1940 Act"), as an open-end management investment company issuing its shares in series, each series representing a distinct portfolio with its own investment objective and policies. The four series presently authorized are The Arbitrage Fund (the "Arbitrage Fund"), The Arbitrage Event-Driven Fund (the "Event-Driven Fund"), The Arbitrage Credit Opportunities Fund (the "Credit Opportunities Fund") and The Arbitrage Tactical Equity Fund (the "Tactical Equity Fund"), each a "Fund" and collectively the "Funds", which offer four classes of shares. The Arbitrage Fund, the Event-Driven Fund and the Credit Opportunities Fund are each a diversified series of the Trust. The Tactical Equity Fund is a non-diversified series of the trust. The Funds' investments are managed by Water Island Capital, LLC (the "Adviser").
Fund | | Commencement of
Operations | |
Arbitrage Fund | | | |
Class R shares | | September 18, 2000 | |
Class I shares | | October 17, 2003 | |
Class C shares | | June 1, 2012 | |
Class A shares | | June 1, 2013 | |
Event-Driven Fund | | | |
Class R shares | | October 1, 2010 | |
Class I shares | | October 1, 2010 | |
Class C shares | | June 1, 2012 | |
Class A shares | | June 1, 2013 | |
Credit Opportunities Fund | | | |
Class R shares | | October 1, 2012 | |
Class I shares | | October 1, 2012 | |
Class C shares | | October 1, 2012 | |
Class A shares | | June 1, 2013 | |
Tactical Equity Fund | | | |
Class R shares | | January 2, 2015 | |
Class I shares | | January 2, 2015 | |
Class C shares | | January 2, 2015 | |
Class A shares | | January 2, 2015 | |
The investment objective of the Arbitrage Fund seeks to achieve capital growth by engaging in merger arbitrage. The investment objective of the Event-Driven Fund seeks to achieve capital growth by investing in companies that are impacted by corporate events such as mergers, acquisitions, restructurings, recapitalizations, refinancings, reorganizations and other special situations. The investment objective of the Credit Opportunities Fund seeks to provide current income and capital growth by investing in debt securities impacted by events such as reorganizations, restructurings, recapitalizations, debt maturities, refinancings, mergers, acquisitions, regulatory changes and other special situations. The investment objective of the Tactical Equity Fund seeks to achieve capital appreciation by investing in securities of companies where the market may not fully appreciate the impact of fundamental changes to the business, industry or regulatory environment.
The Funds' four classes of shares, Class R, Class I, Class C and Class A, represent interests in the same portfolio of investments and have the same rights, but differ primarily in the expenses to
www.arbitragefunds.com | 1-800-295-4485
108
The Arbitrage Funds Notes to Financial Statements (continued)
which they are subject and the investment eligibility requirements. Class R shares, Class C shares and Class A shares are subject to an annual distribution fee of up to 0.25%, 1.00% and 0.25%, respectively, of each Fund's average daily net assets attributable to Class R shares, Class C shares and Class A shares, respectively, whereas Class I shares are not subject to any distribution fees. Class C shares are also subject to a 1.00% contingent deferred sales charge on all purchases redeemed in 12 months of purchase. Class A shares of the Arbitrage Fund are sold subject to a maximum front-end sales load equal to 2.50% of the offering price and are also subject to a 0.50% contingent deferred sales load on purchases at or above $250,000, purchased without a front-end sales charge and redeemed within 12 months of purchase. Class A shares of the Event-Driven Fund, the Credit Opportunities Fund and the Tactical Equity Fund are sold subject to a maximum front-end sales load equal to 3.25% of the offering price and are also subject to a 1.00% contingent deferred sales load on purchases at or above $500,000, purchased without a front-end sales charge and redeemed within 18 months of purchase.
2. SIGNIFICANT ACCOUNTING POLICIES
The following is a summary of significant accounting policies followed by the Funds. These policies are in conformity with U.S. generally accepted accounting principles ("GAAP"). The Funds are considered investment companies for financial reporting purposes under GAAP and Accounting Standards Codification Topic 946 – Investment Companies.
Use of Estimates — The preparation of financial statements in conformity with GAAP requires management to make estimates and assumptions that affect the reported amounts of assets and liabilities at the date of the financial statements and the reported amounts of increases and decreases in net assets from operations during the reporting period. Actual results could differ from those estimates.
Valuation of Investments — The Funds' portfolio securities are valued as of the close of trading of the New York Stock Exchange ("NYSE") (normally 4:00 p.m., Eastern time). Common stocks and other securities, including open short positions that are traded on a securities exchange, are valued at the last quoted sales price at the close of regular trading on the day the valuation is made. Securities which are quoted by NASDAQ are valued at the NASDAQ Official Closing Price. Price information on listed stocks is taken from the exchange where the security is primarily traded. Securities which are listed on an exchange but which are not traded on the valuation date are valued at the mean of the most recent bid and asked prices. Put and call options and securities traded in the over-the-counter market are valued at the mean of the most recent bid and asked prices. When there is no bid price available, put and call options will be valued using the average of the last ask price and zero. Foreign currency forward contracts are valued at the current day's interpolated foreign exchange rate, as calculated using the current day's spot rate, and the thirty, sixty, ninety and one-hundred eighty day forward rates provided by an independent source.
Bank loans are valued at the composite mid-price which is calculated using the simple average of the dealer marks. If available, debt securities are priced based upon an evaluated bid provided by independent, third-party pricing agents. The third-party pricing agents may also value debt securities at an evaluated bid price by employing methodologies that utilize actual market transactions, broker-supplied valuations, or other methodologies designed to identify the market value for such securities. Unlisted securities for which market quotations are readily available are valued at the latest quoted bid price. Swap contracts that are listed or traded on a national securities exchange, commodities exchange, contract market or comparable over-the-counter market, and that are freely transferable, are valued at their closing settlement price on the exchange on which they are primarily traded or based upon the current settlement price for a
Annual Report | May 31, 2016
109
The Arbitrage Funds Notes to Financial Statements (continued)
like instrument acquired on the day on which the instrument is being valued. Over-the-counter swap contracts for which market quotations are readily available are valued based on quotes received from independent pricing services or one or more dealers that make markets in such securities.
Other assets and securities for which no quotations are readily available are valued at fair value as determined in good faith under the supervision of the Board of Trustees of the Trust. Some of the more common reasons that may necessitate that a security be valued at fair value include: the security's trading has been halted or suspended; the security has been delisted from a national exchange; the security's primary trading market is temporarily closed at a time when under normal conditions it would be open; the security has been acquired through completion of a merger/tender or the security's primary pricing source is not able or willing to provide a price. Such methods of fair valuation may include, but are not limited to: multiple of earnings, multiple of book value, discount from market of a similar freely traded security, purchase price of a security, subsequent private transactions in the security or related securities, or a combination of these and other factors. Foreign securities are translated from the local currency into U.S. dollars using currency exchange rates supplied by a quotation service (see Note 8).
Fair Value Measurements — In accordance with the authoritative guidance on fair value measurements under GAAP, the Funds disclose fair value of their investments in a hierarchy that prioritizes the inputs to valuation techniques used to measure the fair value. The objective of a fair value measurement is to determine the price that would be received to sell an asset or paid to transfer a liability in an orderly transaction between market participants at the measurement date (an exit price). Accordingly, the fair value hierarchy gives the highest priority to quoted prices (unadjusted) in active markets for identical assets or liabilities (Level 1) and the lowest priority to unobservable inputs (Level 3). The guidance establishes three levels of the fair value hierarchy as follows:
Level 1 — Unadjusted quoted prices in active markets for identical, unrestricted assets or liabilities that the Funds have the ability to access at the measurement date;
Level 2 — Observable inputs other than quoted prices included in Level 1 that are observable (either directly or indirectly) for substantially the full term of the asset or liability; and
Level 3 — Unobservable inputs for the asset or liability, to the extent relevant observable inputs are not available, representing each Fund's own assumption about the assumptions a market participant would use in valuing the asset or liability, and would be based on the best information available.
Investments are classified within the level of the lowest significant input considered in determining fair value. Investments classified within Level 3, whose fair value measurement considers several inputs, may include Level 1 or Level 2 inputs as components of the overall fair value measurement. The inputs or methodology used for valuing securities are not necessarily an indication of the risk associated with investing in those securities. The Funds recognize transfers between levels as of the beginning of the annual period in which the transfer occurred.
For the year ended May 31, 2016, there were no significant changes to the Funds' fair value methodologies. Additionally, during the year ended May 31, 2016, there were no transfers between Level 1 and 2 securities. Transfers for Level 3 securities, if any, are shown as part of the leveling table in the Portfolio of Investments.
www.arbitragefunds.com | 1-800-295-4485
110
The Arbitrage Funds Notes to Financial Statements (continued)
Share Valuation and Redemption Fees — The net asset value per share of each class of shares of the Funds is calculated daily by dividing the total value of a Fund's assets attributable to that class, less liabilities attributable to that class, by the number of shares of that class outstanding. The offering price and redemption price per share of each class of each Fund is equal to the net asset value per share, except that, shares of Class R, Class I and Class A are subject to a redemption fee of 2% if redeemed within 30 days for the Arbitrage Fund, Event-Driven Fund and Tactical Equity Fund and 60 days for the Credit Opportunities Fund from the date of purchase. The Class A redemption fee does not apply for purchases over $250,000 in the Arbitrage Fund and purchases over $500,000 in the Event-Driven Fund, Credit Opportunities Fund and Tactical Equity Fund, as these purchases are subject to a contingent deferred sales charge. Class C shares are not subject to a redemption fee. Proceeds from redemption fees for the year ended May 31, 2016 are disclosed in Note 7. The redemption fee is paid directly to each Fund rather than the Adviser and is allocated pro-rata to the shareholders based on net assets attributed to the class.
Security Transactions — Security transactions are accounted for on trade date. Gains and losses on securities sold are determined on a specific identification basis.
Short Positions — The Funds may sell securities short for economic hedging purposes. Subsequent fluctuations in the market prices of securities sold short may require purchasing the securities at prices which may differ from the market value reflected on the Portfolio of Investments. The Funds are liable for any dividends and interest payable on securities while those securities are in a short position. As collateral for their short positions, the Funds are required under the 1940 Act to maintain assets consisting of cash, cash equivalents or liquid securities. The amount of the collateral is required to be adjusted daily to reflect changes in the value of the securities sold short. The Funds are charged an interest rebate expense by the prime broker on securities sold short. The interest rebate expense is charged for the duration of time that a security is sold short and is shown on the Statements of Operations.
Derivative Instruments and Hedging Activities — The following discloses the Funds' use of derivative instruments and hedging activities.
The Funds' investment objectives not only permit the Funds to purchase investment securities, but they also allow certain Funds to enter into various types of derivative contracts, including, but not limited to, swap contracts, forward foreign currency exchange contracts, and purchased and written option contracts. In doing so, the Funds will employ strategies in differing combinations to permit them to increase, decrease, or change the level or types of exposure to market factors. Central to those strategies are features inherent to derivatives that make them more attractive for this purpose than equity or debt securities: they require little or no initial cash investment; they can focus exposure on only certain selected risk factors; and they may not require the ultimate receipt or delivery of the underlying security (or securities) to satisfy the contract. This may allow the Funds to pursue their objectives more quickly and efficiently than if they were to make direct purchases or sales of securities capable of effecting a similar response to market factors.
Market Risk Factors: In pursuit of their investment objectives, the Funds may seek to use derivatives to increase or decrease their exposure to the following market risk factors:
Equity Risk: Equity risk relates to the change in value of equity securities as they relate to increases or decreases in the general market.
Annual Report | May 31, 2016
111
The Arbitrage Funds Notes to Financial Statements (continued)
Interest Rate Risk: Interest rate risk refers to the fluctuations in value of fixed-income securities resulting from the inverse relationship between price and yield. For example, an increase in general interest rates will tend to reduce the market value of fixed income investments, and a decline in general interest rates will tend to increase the value of such investments. In addition, debt securities with longer maturities, which tend to have higher yields, are subject to potentially greater fluctuations in value from changes in interest rates than obligations with shorter maturities.
Foreign Exchange Rate Risk: Foreign exchange rate risk relates to the change in the U.S. dollar value of a security held that is denominated in a foreign currency. The value of a foreign currency denominated security will decrease as the dollar appreciates against the currency, while the value of the foreign currency denominated security will increase as the dollar depreciates against the currency.
Credit Risk: Credit risk relates to the ability of the issuer to meet interest and principal payments, or both, as they come due. In general, lower-grade, higher-yield bonds are subject to credit risk to a greater extent than lower-yield, higher-quality bonds.
Risk of Investing in Derivatives: The Funds' use of derivatives can result in losses due to unanticipated changes in the market risk factors and the overall market. In instances where the Funds are using derivatives to decrease or hedge exposures to market risk factors for securities held by the Funds, there are also risks that those derivatives may not perform as expected, resulting in losses for the combined or hedged positions.
Derivatives may have little or no initial cash investment relative to their market value exposure and therefore can produce significant gains or losses in excess of their cost. This use of embedded leverage allows the Funds to increase their market value exposure relative to their net assets and can substantially increase the volatility of the Funds' performance.
Additional associated risks from investing in derivatives also exist and potentially could have significant effects on the valuation of the derivative instruments and the Funds. Typically, the associated risks are not the risks that the Funds are attempting to increase or decrease exposure to, per their investment objectives, but are the additional risks from investing in derivatives.
Examples of these associated risks are liquidity risk, which is the risk that the Funds will not be able to sell the derivative in the open market in a timely manner, and counterparty credit risk, which is the risk that the counterparty to a transaction will not fulfill its obligation to the Funds. Associated risks can be different for each type of derivative and are discussed by derivative type in the notes that follow.
Option Writing/Purchasing: Certain Funds may write or purchase option contracts to adjust risk and return of their overall investment positions. When a Fund writes or purchases an option, an amount equal to the premium received or paid by the Fund is recorded as a liability or an asset and is subsequently adjusted to the current market value of the option written or purchased. Premiums received or paid from writing or purchasing options that expire unexercised are treated by the Fund on the expiration date as realized gains or losses. The difference between the premium and the amount paid or received on effecting a closing purchase or sale transaction, including brokerage commissions, is also treated as a realized gain or loss. If an option is exercised, the premium paid or received is added to the cost of the purchase or proceeds from the sale in determining whether the Fund has realized a gain or loss on investment transactions. Risks from
www.arbitragefunds.com | 1-800-295-4485
112
The Arbitrage Funds Notes to Financial Statements (continued)
entering into option transactions arise from the potential inability of counterparties to meet the terms of the contracts, the potential inability to enter into closing transactions because of an illiquid secondary market and from unexpected movements in security values.
A summary of put and call option contracts written during the year ended May 31, 2016, is as follows:
Arbitrage Fund | | Put
Contracts | | Put
Premiums | | Call
Contracts | | Call
Premiums | |
Options outstanding at beginning of year | | | 11,506 | | | $ | 656,452 | | | | 11,655 | | | $ | 993,663 | | |
Options written | | | 57,212 | | | | 6,978,548 | | | | 149,972 | | | | 11,116,640 | | |
Options closed | | | (26,752 | ) | | | (2,535,216 | ) | | | (46,871 | ) | | | (3,638,829 | ) | |
Options exercised | | | (30,076 | ) | | | (4,162,970 | ) | | | (29,649 | ) | | | (3,309,538 | ) | |
Options expired | | | (10,346 | ) | | | (853,971 | ) | | | (87,340 | ) | | | (4,990,586 | ) | |
Stock split | | | – | | | | – | | | | 3,519 | | | | – | | |
Options outstanding at end of year | | | 1,544 | | | $ | 82,843 | | | | 1,286 | | | $ | 171,350 | | |
Event-Driven Fund | | Put
Contracts | | Put
Premiums | | Call
Contracts | | Call
Premiums | |
Options outstanding at beginning of year | | | 11,297 | | | $ | 494,670 | | | | 12,095 | | | $ | 969,069 | | |
Options written | | | 38,173 | | | | 3,969,708 | | | | 54,263 | | | | 5,143,868 | | |
Options closed | | | (23,437 | ) | | | (2,613,043 | ) | | | (32,614 | ) | | | (3,465,763 | ) | |
Options exercised | | | (14,648 | ) | | | (981,049 | ) | | | (5,266 | ) | | | (531,872 | ) | |
Options expired | | | (11,199 | ) | | | (857,975 | ) | | | (28,625 | ) | | | (2,084,788 | ) | |
Stock split | | | – | | | | – | | | | 374 | | | | – | | |
Options outstanding at end of year | | | 186 | | | $ | 12,311 | | | | 227 | | | $ | 30,514 | | |
Credit Opportunities Fund | | Put
Contracts | | Put
Premiums | | Call
Contracts | | Call
Premiums | |
Options outstanding at beginning of year | | | 250 | | | $ | 7,315 | | | | – | | | $ | – | | |
Options written | | | 3,326 | | | | 215,078 | | | | 5 | | | | 546 | | |
Options closed | | | (1,522 | ) | | | (79,765 | ) | | | – | | | | – | | |
Options exercised | | | – | | | | – | | | | – | | | | – | | |
Options expired | | | (1,678 | ) | | | (107,891 | ) | | | (5 | ) | | | (546 | ) | |
Options outstanding at end of year | | | 376 | | | $ | 34,737 | | | | – | | | $ | – | | |
Tactical Equity Fund | | Put
Contracts | | Put
Premiums | | Call
Contracts | | Call
Premiums | |
Options outstanding at beginning of year | | | 9 | | | $ | 595 | | | | 12 | | | $ | 1,606 | | |
Options written | | | 136 | | | | 13,353 | | | | 175 | | | | 18,924 | | |
Options closed | | | (56 | ) | | | (6,738 | ) | | | (77 | ) | | | (13,228 | ) | |
Options exercised | | | (19 | ) | | | (1,618 | ) | | | (3 | ) | | | (221 | ) | |
Options expired | | | (62 | ) | | | (4,399 | ) | | | (102 | ) | | | (5,783 | ) | |
Options outstanding at end of year | | | 8 | | | $ | 1,193 | | | | 5 | | | $ | 1,298 | | |
Foreign Currency Exchange Contracts: The Funds may enter into forward foreign currency exchange contracts as a way of managing foreign exchange rate risk. The Funds may enter into these contracts for the purchase or sale of a specific foreign currency at a fixed price on a future
Annual Report | May 31, 2016
113
The Arbitrage Funds Notes to Financial Statements (continued)
date as a hedge or cross-hedge against either specific transactions or portfolio positions. The objective of the Funds' foreign currency hedging transactions is to reduce risk that the U.S. dollar value of the Funds' securities denominated in foreign currency will decline in value due to changes in foreign currency exchange rates.
Warrants/Rights: Each Fund may purchase or otherwise receive warrants or rights. Warrants and rights generally give the holder the right to receive, upon exercise, a security of the issuer at a set price. The Funds typically use warrants and rights in a manner similar to their use of purchased options on securities, as described in options above. Risks associated with the use of warrants and rights are generally similar to risks associated with the use of purchased options. However, warrants and rights often do not have standardized terms, and may have longer maturities and may be less liquid than exchange-traded options. In addition, the terms of warrants or rights may limit each Fund's ability to exercise the warrants or rights at such times and in such quantities as each Fund would otherwise wish. Warrants and rights generally pay no dividends and confer no voting or other rights other than to purchase the underlying security.
Swaps: Certain Funds may enter into interest rate, index, equity, total return and credit default swap agreements, for hedging and non-hedging purposes. These transactions would be entered into in an attempt to obtain a particular return when it is considered desirable to do so, possibly at a lower cost to a Fund than if the Fund had invested directly in the asset that yielded the desired return. Swap agreements may be executed in a multilateral or other trade facility program, such as a registered exchange ("centrally cleared swaps") or may be privately negotiated in the over-the counter market. The duration of a swap agreement typically ranges from a few weeks to more than one year. In a standard swap transaction, two parties agree to exchange the returns (or differentials in rates of return) earned or realized on particular predetermined investments or instruments, which may be adjusted for an interest factor. The gross returns to be exchanged or "swapped" between the parties are generally calculated with respect to a "notional amount" (i.e., the return on or increase in value of a particular dollar amount invested at a particular interest rate, in a particular foreign currency, or in a "basket" of securities representing a particular index). In a centrally cleared swap, immediately following execution of the swap agreement, the swap agreement is novated to a central counterparty (the "CCP") and the Fund's counterparty on the swap agreement becomes the CCP.
Forms of swap agreements include interest rate caps, under which, in return for a premium, one party agrees to make payments to the other to the extent that interest rates exceed a specified rate, or "cap"; interest rate floors, under which, in return for a premium, one party agrees to make payments to the other to the extent that interest rates fall below a specified level, or "floor"; and interest rate collars, under which a party sells a cap and purchases a floor, or vice versa, in an attempt to protect itself against interest rate movements exceeding given minimum or maximum levels.
Credit default swaps are a type of swap agreement in which the protection "buyer" is generally obligated to pay the protection "seller" an upfront and/ or a periodic stream of payments over the term of the contract provided that no credit event, such as a default, on a reference obligation has occurred. The credit default swap agreement may have as reference obligations one or more securities that are not currently held by a Fund. If a credit event occurs, the seller generally must pay the buyer the "par value" (full notional value) of the swap in exchange for an equal face amount of deliverable obligations of the reference entity described in the swap, or the seller may be required to deliver the related net cash amount if the swap is cash settled. A Fund may be either the buyer or seller in the transaction. If a Fund is a buyer and no credit event occurs, the
www.arbitragefunds.com | 1-800-295-4485
114
The Arbitrage Funds Notes to Financial Statements (continued)
Fund may recover nothing if the swap is held through its termination date. However, if a credit event occurs, the buyer generally may elect to receive the full notional value of the swap in exchange for an equal face amount of deliverable obligations of the reference entity whose value may have significantly decreased. As a seller, a Fund generally receives an upfront payment and/or a fixed rate of income throughout the term of the swap provided that there is no credit event. As the seller, a Fund would effectively add leverage to its portfolio because, in addition to its total net assets, the Fund would be subject to investment exposure on the notional amount of the swap. Credit default swap agreements involve greater risks than if a Fund had invested in the reference obligation directly since, in addition to general market risks, credit default swaps are subject to illiquidity risk, counterparty risk and credit risk. A Fund will enter into credit default swap agreements only with counterparties that meet certain standards of creditworthiness or that are centrally cleared.
Total return swap agreements are contracts in which one party agrees to make periodic payments based on the change in market value of underlying assets, which may include a specified security, basket of securities, defined portfolios of bonds, loans and mortgages, or securities indexes during the specified period in return for periodic payments based on a fixed or variable interest rate or the total return from other underlying assets or indices. Total return swap agreements may be used to obtain exposure to a security or market index without owning or taking physical custody of such security or component securities of a market index. Total return swap agreements may effectively add leverage to a Fund's portfolio because, in addition to its total net assets, the Fund would be subject to investment exposure on the notional amount of the swap. Total return swaps are a mechanism for the user to accept the economic benefits of asset ownership without utilizing the balance sheet. The other leg of the swap, usually the London Interbank Offered Rate (LIBOR), is spread to reflect the non-balance sheet nature of the product. Total return swaps can be designed with any underlying asset agreed upon between two parties. Typically no notional amounts are exchanged with total return swaps. Total return swap agreements entail the risk that a party will default on its payment obligations to a Fund thereunder. Swap agreements also entail the risk that a Fund will not be able to meet its obligation to the counterparty. Generally, a Fund will enter into total return swaps on a net basis (i.e., the two payment streams are netted out with the Fund receiving or paying, as the case may be, only the net amount of the two payments).
Most swap agreements entered into by a Fund calculate the obligations of the parties to the agreement on a "net basis." Consequently, a Fund's current obligations (or rights) under a swap agreement will generally be equal only to the net present value of amounts to be paid or received under the agreement based on the relative values of the positions held by each party to the agreement (the "net amount"). A Fund's current obligations under a swap agreement will be accrued daily (offset against amounts owed to the Fund), and any accrued but unpaid net amounts owed to a swap counterparty will be covered in accordance with applicable regulatory requirements to limit any potential leveraging of a Fund's portfolio. Any net amount accrued but not yet paid to a Fund by the counterparty under a swap agreement (i.e., the Fund's current rights under the swap agreement) is recorded as unrealized appreciation until the amount is paid to the Fund. The Fund's maximum risk of loss from counterparty credit risk is generally limited to the net payment to be received by the Fund and/or the termination value at the end of the contract. Obligations under swap agreements so covered will not be construed to be "senior securities" for purposes of the Funds' investment restriction concerning senior securities.
Whether a Fund's use of swap agreements will be successful in furthering its investment objective will depend on Management's ability to correctly predict whether certain types of investments are likely to produce greater returns than other investments. Swap agreements that cannot be
Annual Report | May 31, 2016
115
The Arbitrage Funds Notes to Financial Statements (continued)
terminated or sold within seven days may be considered to be illiquid investments. Moreover, a Fund bears the risk of loss of the amount expected to be received under a swap agreement in the event of the default or bankruptcy of a swap agreement counterparty. Although centrally cleared swaps typically present less counterparty risk than non-centrally cleared swaps, a Fund that has entered into centrally cleared swaps is subject to the risk of the failure of the CCP. A Fund will enter into swap agreements only with counterparties that meet certain standards for creditworthiness (generally, such counterparties would have to be eligible counterparties under the terms of the Fund's repurchase agreement guidelines) or that are centrally cleared. Certain restrictions imposed on the Funds by the Internal Revenue Code of 1986 as amended (the "Code") may limit a Fund's ability to use swap agreements. It is possible that developments in the swap market, including additional government regulation, could adversely affect a Fund's ability to terminate existing swap agreements or to realize amounts to be received under such agreements.
International Swaps and Derivatives Association, Inc. Master Agreements ("ISDA Master Agreements") govern over-the-counter financial derivative transactions entered into by a Fund and counterparty. The ISDA Master Agreements maintain provisions for general obligations, representations, agreements, collateral and events of default or termination. Events of termination include conditions that may entitle counterparties to elect to terminate early and cause settlement of all outstanding transactions under the applicable ISDA Master Agreement. Any election to terminate early could be material to the financial statements.
Swap agreements held by the Funds at May 31, 2016 are disclosed in the Portfolio of Investments.
Fair Value of Derivative Instruments — Fair values of derivatives presented in the financial statements are not netted with the fair value of other derivatives or with any collateral amounts posted by the Funds or any counterparty. The fair value of derivative instruments for the Funds as of the year ended May 31, 2016, was as follows:
Derivatives Not
Accounted For As
Hedging Instruments | | Asset
Derivatives
Statement of
Assets and
Liabilities
Location | | Fair Value | | Liability
Derivatives
Statement of
Assets and
Liabilities
Location | | Fair Value | |
Arbitrage Fund | |
Foreign Currency
Contracts
| | Unrealized
appreciation on
forward foreign
currency
exchange
contracts | | $ | 3,596,649 | | | Unrealized
depreciation on
forward foreign
currency
exchange
contracts | | $ | 3,183,497 | | |
Equity Contracts
(rights) | | Investments:
at value | | | 9,601,445 | | | Securities sold short,
at value | | | 65 | | |
Equity Contracts
(purchased
option contracts) | | Investments:
at value | | | 2,764,552 | | | | | | |
Equity Contracts
(written option
contracts) | | | | | | Written options,
at value | | | 247,773 | | |
| | | | | $ | 15,962,646 | | | | | $ | 3,431,335 | | |
www.arbitragefunds.com | 1-800-295-4485
116
The Arbitrage Funds Notes to Financial Statements (continued)
Derivatives Not
Accounted For As
Hedging Instruments | | Asset
Derivatives
Statement of
Assets and
Liabilities
Location | | Fair Value | | Liability
Derivatives
Statement of
Assets and
Liabilities
Location | | Fair Value | |
Event-Driven Fund | |
Foreign Currency
Contracts
| | Unrealized
appreciation on
forward foreign
currency
exchange
contracts | | $ | 108,457 | | | Unrealized
depreciation on
forward foreign
currency
exchange
contracts | | $ | 292,616 | | |
Equity Contracts
(swap contracts) | | Unrealized
appreciation on
swap contracts | | | 3 | | | Unrealized
depreciation on
swap contracts | | | 386 | | |
Equity Contracts
(rights) | | Investments:
at value | | | 680,335 | | | Securities sold short,
at value | | | 12 | | |
Equity Contracts
(purchased
option contracts) | | Investments:
at value | | | 309,557 | | | | | | |
Equity Contracts
(written option
contracts) | | | | | | Written options,
at value | | | 44,631 | | |
| | | | | $ | 1,098,352 | | | | | $ | 337,645 | | |
Derivatives Not
Accounted For As
Hedging Instruments | | Asset
Derivatives
Statement of
Assets and
Liabilities
Location | | Fair Value | | Liability
Derivatives
Statement of
Assets and
Liabilities
Location | | Fair Value | |
Credit Opportunities Fund | |
Foreign Currency
Contracts
| | Unrealized
appreciation on
forward foreign
currency
exchange
contracts | | $ | – | | | Unrealized
depreciation on
forward foreign
currency
exchange
contracts | | $ | 25,632 | | |
Equity Contracts
(purchased
option contracts) | | Investments:
at value | | | 19,330 | | | | | | | | |
Equity Contracts
(written option
contracts) | | | | | | Written options,
at value | | | 3,935 | | |
| | | | | $ | 19,330 | | | | | $ | 29,567 | | |
Annual Report | May 31, 2016
117
The Arbitrage Funds Notes to Financial Statements (continued)
Derivatives Not
Accounted For As
Hedging Instruments | | Asset
Derivatives
Statement of
Assets and
Liabilities
Location | | Fair Value | | Liability
Derivatives
Statement of
Assets and
Liabilities
Location | | Fair Value | |
Tactical Equity Fund | |
Foreign Currency
Contracts
| | Unrealized
appreciation on
forward foreign
currency
exchange
contracts | | $ | 2,251 | | | Unrealized
depreciation on
forward foreign
currency
exchange
contracts | | $ | 91 | | |
Equity Contracts
(purchased
option contracts) | | Investments:
at value | | | 4,483 | | | | | | | | |
Equity Contracts
(written option
contracts) | | | | | | Written options,
at value | | | 1,664 | | |
| | | | | $ | 6,734 | | | | | $ | 1,755 | | |
www.arbitragefunds.com | 1-800-295-4485
118
The Arbitrage Funds Notes to Financial Statements (continued)
The effect of derivative instruments on the Funds' Statement of Operations for the year ended May 31, 2016, was as follows:
Derivatives Not
Accounted For As
Hedging Instruments | | Location Of Gains/(Loss) On
Derivatives Recognized In Income | | Realized
Gain/(Loss)
On Derivatives
Recognized In
Income | | Change in
Unrealized
Gain/(Loss)
On Derivatives
Recognized In
Income | |
Arbitrage Fund | |
Foreign Currency
Contracts
| | Net realized gains (losses) from:
Foreign currency transactions / Net
change in unrealized appreciation
(depreciation) on: Foreign currency
transactions | | $ | (2,555,416 | ) | | $ | 5,406,034 | | |
Equity Contracts
(swap contracts)
| | Net realized gains (losses) from:
Swap contracts / Net change in
unrealized appreciation
(depreciation) on: Swap contracts | | | 5,879,985 | | | | (112,866 | ) | |
Equity Contracts Long
(rights)
| | Net realized gains (losses) from:
Investments / Net change in
unrealized appreciation
(depreciation) on: Investments | | | 37,555 | | | | (924,193 | ) | |
Equity Contracts Short
(rights)
| | Net realized gains (losses) from:
Investments / Net change in
unrealized appreciation
(depreciation) on: Securities sold
short | | | – | | | | 25 | | |
Equity Contracts
(purchased option
contracts)
| | Net realized gains (losses) from:
Investments / Net change in
unrealized appreciation
(depreciation) on: Investments | | | (10,370,971 | ) | | | 393,807 | | |
Equity Contracts
(written option
contracts)
| | Net realized gains (losses) from:
Written option contracts / Net
change in unrealized appreciation
(depreciation) on: Written option
contracts | | | 9,412,568 | | | | (383,049 | ) | |
| | | | | $ | 2,403,721 | | | $ | 4,379,758 | | |
Annual Report | May 31, 2016
119
The Arbitrage Funds Notes to Financial Statements (continued)
Derivatives Not
Accounted For As
Hedging Instruments | | Location Of Gains/(Loss) On
Derivatives Recognized In Income | | Realized
Gain/(Loss)
On Derivatives
Recognized In
Income | | Change in
Unrealized
Gain/(Loss)
On Derivatives
Recognized In
Income | |
Event-Driven Fund | |
Foreign Currency
Contracts
| | Net realized gains (losses) from:
Foreign currency transactions / Net
change in unrealized appreciation
(depreciation) on: Foreign currency
transactions | | $ | (728,514 | ) | | $ | 371,424 | | |
Credit Contracts
(swap contracts)
| | Net realized gains (losses) from:
Swap contracts / Net change in
unrealized appreciation
(depreciation) on: Swap contracts | | | 39,721 | | | | 15,032 | | |
Equity Contracts
(swap contracts)
| | Net realized gains (losses) from:
Swap contracts / Net change in
unrealized appreciation
(depreciation) on: Swap contracts | | | 1,055,331 | | | | (383 | ) | |
Equity Contracts Long
(rights)
| | Net realized gains (losses) from:
Investments / Net change in
unrealized appreciation
(depreciation) on: Investments | | | – | | | | (17,576 | ) | |
Equity Contracts Short
(rights)
| | Net realized gains (losses) from:
Investments / Net change in
unrealized appreciation
(depreciation) on: Securities sold
short | | | – | | | | 4 | | |
Equity Contracts
(purchased option
contracts)
| | Net realized gains (losses) from:
Investments / Net change in
unrealized appreciation
(depreciation) on: Investments | | | (8,232,537 | ) | | | 1,167,239 | | |
Equity Contracts
(written option
contracts)
| | Net realized gains (losses) from:
Written option contracts / Net
change in unrealized appreciation
(depreciation) on: Written option
contracts | | | 4,570,661 | | | | 36,407 | | |
| | | | | $ | (3,295,338 | ) | | $ | 1,572,147 | | |
www.arbitragefunds.com | 1-800-295-4485
120
The Arbitrage Funds Notes to Financial Statements (continued)
Derivatives Not
Accounted For As
Hedging Instruments | | Location Of Gains/(Loss) On
Derivatives Recognized In Income | | Realized
Gain/(Loss)
On Derivatives
Recognized In
Income | | Change in
Unrealized
Gain/(Loss)
On Derivatives
Recognized In
Income | |
Credit Opportunities Fund | |
Foreign Currency
Contracts
| | Net realized gains (losses) from:
Foreign currency transactions / Net
change in unrealized appreciation
(depreciation) on: Foreign currency
transactions | | $ | 5,316 | | | $ | (20,558 | ) | |
Credit Contracts
(swap contracts)
| | Net realized gains (losses) from:
Swap contracts / Net change in
unrealized appreciation
(depreciation) on: Swap contracts | | | 4,760 | | | | 1,801 | | |
Equity Contracts
(purchased option
contracts)
| | Net realized gains (losses) from:
Investments / Net change in
unrealized appreciation
(depreciation) on: Investments | | | (120,843 | ) | | | (40,161 | ) | |
Equity Contracts
(written option
contracts)
| | Net realized gains (losses) from:
Written option contracts / Net
change in unrealized appreciation
(depreciation) on: Written option
contracts | | | 67,997 | | | | 29,362 | | |
| | | | | $ | (42,770 | ) | | $ | (29,556 | ) | |
Annual Report | May 31, 2016
121
The Arbitrage Funds Notes to Financial Statements (continued)
Derivatives Not
Accounted For As
Hedging Instruments | | Location Of Gains/(Loss) On
Derivatives Recognized In Income | | Realized
Gain/(Loss)
On Derivatives
Recognized In
Income | | Change in
Unrealized
Gain/(Loss)
On Derivatives
Recognized In
Income | |
Tactical Equity Fund | |
Foreign Currency
Contracts
| | Net realized gains (losses) from:
Foreign currency transactions / Net
change in unrealized appreciation
(depreciation) on: Foreign currency
transactions | | $ | (902 | ) | | $ | 2,179 | | |
Equity Contracts
(swap contracts)
| | Net realized gains (losses) from:
Swap contracts / Net change in
unrealized appreciation
(depreciation) on: Swap contracts | | | 1,864 | | | | – | | |
Equity Contracts
(purchased option
contracts)
| | Net realized gains (losses) from:
Investments / Net change in
unrealized appreciation
(depreciation) on: Investments | | | (29,763 | ) | | | 4,021 | | |
Equity Contracts
(written option
contracts)
| | Net realized gains (losses) from:
Written option contracts / Net
change in unrealized appreciation
(depreciation) on: Written option
contracts | | | 17,026 | | | | 1,232 | | |
| | | | | $ | (11,775 | ) | | $ | 7,432 | | |
Volume of derivative instruments held by the Funds during the year ended May 31, 2016, was as follows:
Derivative Type | | Unit of Measurement | | Monthly Average | |
Arbitrage Fund | |
Swap Contracts | | Notional Quantity | | | 35,719,967 | | |
Forward Foreign Currency Exchange
Contracts | | Net Contracts to Deliver/(Receive)
| | | (202,655,264 | ) | |
Purchased Option Contracts | | Contracts | | | 34,250 | | |
Rights | | Shares | | | 20,944,415 | | |
Rights — Short | | Shares | | | (1,100 | ) | |
Written Option Contracts | | Contracts | | | (15,728 | ) | |
Derivative Type | | Unit of Measurement | | Monthly Average | |
Event-Driven Fund | |
Swap Contracts | | Notional Quantity | | | 3,451,173 | | |
Forward Foreign Currency Exchange
Contracts | | Net Contracts to Deliver/(Receive)
| | | (9,586,986 | ) | |
Purchased Option Contracts | | Contracts | | | 17,712 | | |
Rights | | Shares | | | 2,582,180 | | |
Rights — Short | | Shares | | | (200 | ) | |
Written Option Contracts | | Contracts | | | (5,970 | ) | |
www.arbitragefunds.com | 1-800-295-4485
122
The Arbitrage Funds Notes to Financial Statements (continued)
Derivative Type | | Unit of Measurement | | Monthly Average | |
Credit Opportunities Fund | |
Swap Contracts | | Notional Quantity | | | 529,650 | | |
Forward Foreign Currency Exchange
Contracts | | Net Contracts to Deliver/(Receive)
| | | 61,553 | | |
Purchased Option Contracts | | Contracts | | | 444 | | |
Written Option Contracts | | Contracts | | | (427 | ) | |
Derivative Type | | Unit of Measurement | | Monthly Average | |
Tactical Equity Fund | |
Swap Contracts | | Notional Quantity | | | 13,869 | | |
Forward Foreign Currency Exchange
Contracts | | Net Contracts to Deliver/(Receive)
| | | (21,875 | ) | |
Purchased Option Contracts | | Contracts | | | 75 | | |
Rights | | Shares | | | 197 | | |
Written Option Contracts | | Contracts | | | (24 | ) | |
Certain derivative contracts are executed under either standardized netting agreements or, for exchange-traded derivatives, the relevant contracts for a particular exchange which contain enforceable netting provisions. A derivative netting arrangement creates an enforceable right of set-off that becomes effective, and affects the realization of settlement on individual assets, liabilities and collateral amounts, only following a specified event of default or early termination. Default events may include the failure to make payments or deliver securities timely, material adverse changes in financial condition or insolvency, the breach of minimum regulatory capital requirements, or loss of license, charter or other legal authorization necessary to perform under the contract.
The following table presents financial instruments that are subject to enforceable netting arrangements or other similar agreements as of the year ended May 31, 2016.
Event-Driven Fund
| | | Gross | | Gross
Amounts
Offset in | | Net Amounts
Presented in | | Gross Amounts Not Offset in the
Statement of Assets and Liabilities | |
Description | | Amounts of
Recognized
Assets | | the Statements
of Assets and
Liabilities | | the Statement
of Assets and
Liabilities | | Financial
Instruments | | Cash
Collateral
Received | | Net
Amount | |
Equity Swaps | | $ | 3 | | | $ | – | | | $ | 3 | | | $ | – | | | $ | – | | | $ | 3 | | |
Total | | $ | 3 | | | $ | – | | | $ | 3 | | | $ | – | | | $ | – | | | $ | 3 | | |
| | | Gross | | Gross
Amounts
Offset in | | Net Amounts
Presented in | | Gross Amounts Not Offset in the
Statement of Assets and Liabilities | |
Description | | Amounts of
Recognized
Liabilities | | the Statements
of Assets and
Liabilities | | the Statement
of Assets and
Liabilities | | Financial
Instruments | | Cash
Collateral
Pledged | | Net
Amount | |
Equity Swaps | | $ | 386 | | | $ | – | | | $ | 386 | | | $ | – | | | $ | – | | | $ | 386 | | |
Total | | $ | 386 | | | $ | – | | | $ | 386 | | | $ | – | | | $ | – | | | $ | 386 | | |
Annual Report | May 31, 2016
123
The Arbitrage Funds Notes to Financial Statements (continued)
Security Transactions and Investment Income — Security transactions are accounted for on a trade date basis. Interest income, adjusted for amortization of premium and accretion of discount, is recorded on the accrual basis. Dividend income is recorded on the ex-dividend date, net of any non-reclaimable tax withholdings.
Dividends and Distributions to Shareholders — Dividends arising from net investment income and net capital gain distributions, if any, are declared and paid at least annually to shareholders of the Arbitrage Fund, Event-Driven Fund and Tactical Equity Fund. Dividends arising from net investment income, if any, are declared and paid quarterly, and net capital gain distributions, if any, are declared and paid at least annually to shareholders of the Credit Opportunities Fund.
Allocation Between Classes — Investment income earned, realized capital gains and losses, and unrealized appreciation and depreciation are allocated daily to each class of shares based upon the proportionate shares of total net assets of each Fund. Class-specific expenses are charged directly to the class incurring the expense. Common expenses which are not attributable to a specific class are allocated daily to each class of shares based upon the proportionate share of total net assets of each Fund.
Offering costs — Offering costs, including costs of printing initial prospectuses, legal and registration fees, have been amortized over twelve months from the inception date of the Tactical Equity Fund, and can be found in the Fund's Statement of Operations.
Federal Income Tax — It is the Funds' policy to continue to comply with the special provisions of Subchapter M of the Internal Revenue Code of 1986, as amended, applicable to regulated investment companies. As provided therein, in any fiscal year in which a fund so qualifies and distributes at least 90% of its taxable net income, a fund (but not the shareholders) will be relieved of Federal income tax on the income distributed. Accordingly, no provision for income taxes has been made.
As of and during the year ended May 31, 2016, the Funds did not have a liability for any unrecognized tax benefits. The Funds file U.S. federal, state, and local tax returns as required. The Funds' tax returns are subject to examination by the relevant tax authorities until expiration of the applicable statute of limitations which is generally three years after the filing of the tax return. Tax returns for open years have incorporated no uncertain tax positions that require a provision for income taxes.
3. INVESTMENT TRANSACTIONS
During the year ended May 31, 2016, cost of purchases and proceeds from sales and maturities of investment securities, excluding short-term investments, U.S. government securities, equity swap contracts, purchased and written option contracts and securities sold short, were as follows:
| | | Arbitrage Fund | | Event-Driven Fund | | Credit
Opportunities Fund | | Tactical Equity
Fund | |
Purchases | | $ | 6,783,321,655 | | | $ | 1,062,827,386 | | | $ | 93,169,140 | | | $ | 2,906,508 | | |
Sales and Maturities | | | 5,062,870,659 | | | | 1,309,184,505 | | | | 105,645,421 | | | | 3,153,173 | | |
4. LINE OF CREDIT
The Trust, on behalf of the Funds, entered into an agreement which enables the Arbitrage Fund, the Event-Driven Fund and the Credit Opportunities Fund to participate in a $300,000,000
www.arbitragefunds.com | 1-800-295-4485
124
The Arbitrage Funds Notes to Financial Statements (continued)
unsecured committed revolving line of credit (the "Credit Agreement") with State Street Bank and Trust Company (the "Custodian"). Borrowings are made solely to temporarily finance the purchase or sale of securities or to finance the redemption of the shares of an investor of the Funds. Interest is charged to the Funds based on their borrowings at a rate per annum of the higher of the LIBOR rate plus 1.25% and the overnight federal funds rate plus 1.25%. In addition, a commitment fee of 0.125% per annum is payable at the end of each calendar quarter.
Effective December 8, 2015, the Credit Agreement was terminated and was replaced by an agreement which enables the Arbitrage Fund, the Event-Driven Fund, the Credit Opportunities Fund and the Tactical Equity Fund to participate in a $100,000,000 unsecured committed revolving line of credit (the "Committed Line") and a $100,000,000 unsecured uncommitted revolving line of credit (the "Uncommitted Line," together with the Committed Line, the "New Credit Agreement"). Interest on borrowings under the New Credit Agreement is charged at a rate calculated using the same formula that was used for the Credit Agreement. The Committed Line has a commitment fee of 0.20% per annum on the unused portion of the Committed Line and is payable quarterly. The Uncommitted Line is held available on a discretionary demand basis and may be terminated by the Custodian or the Trust at any time for any or no reason. The Trust accrues, on behalf of each of the Funds, the commitment fee on the unused portion of the line of credit. Such fees are included in the custodian and bank service fees on the Statement of Operations.
The Arbitrage Fund, the Credit Opportunities Fund and the Tactical Equity Fund had no borrowings during the year ended May 31, 2016.
For the year ended May 31, 2016, the Event-Driven Fund had average borrowings of $15,773,125 over a period of 48 days at a weighted average interest rate of 1.45%. Interest expense on the line of credit for the Event-Driven Fund during the year ended May 31, 2016, is shown as line of credit interest expense on the Statement of Operations. The Event-Driven Fund had no outstanding borrowings at May 31, 2016.
5. LOAN PARTICIPATIONS AND ASSIGNMENTS
The Funds may invest in direct debt instruments which are interests in amounts owed to lenders or lending syndicates by corporate, governmental, or other borrowers. The Funds' investments in loans may be in the form of participations in loans or assignments of all or a portion of the loans from third parties. A loan is often administered by a bank or other financial institution (the "lender") that acts as agent for all holders. The agent administers the terms of the loan, as specified in the loan agreement. The Funds may invest in multiple series or tranches of a loan, which may have varying terms and carry different associated risks. The Funds generally have no right to enforce compliance with the terms of the loan agreement with the borrower. As a result, the Funds may be subject to the credit risk of both the borrower and the lender that is selling the loan agreement. When the Funds purchase assignments from lenders they acquire direct rights against the borrower of the loan. The Funds may enter into unfunded loan commitments, which are contractual obligations for future funding. Unfunded loan commitments represent a future obligation in full, even though a percentage of the notional loan amounts may not be utilized by the borrower. When investing in a loan participation, the Funds have the right to receive payments of principal, interest and any fees to which it is entitled only from the lender selling the loan agreement and only upon receipt of payments by the lender from the borrower. The Funds may receive a commitment fee based on the undrawn portion of the underlying line of credit portion of a floating rate loan. In certain circumstances, the Funds may receive a penalty
Annual Report | May 31, 2016
125
The Arbitrage Funds Notes to Financial Statements (continued)
fee upon the prepayment of a floating rate loan by a borrower. For the year ended May 31, 2016, no penalty fees were received by the Funds. Fees earned or paid are recorded as a component of interest income or interest expense, respectively, on the Statement of Operations, if applicable.
At May 31, 2016, the Arbitrage Fund, Event-Driven Fund, Credit Opportunities Fund and Tactical Equity Fund each had no outstanding loan commitments.
6. ADVISORY FEES, ADMINISTRATION FEES AND OTHER AGREEMENTS
Investment Advisory Agreement
The Funds' investments are managed by the Adviser according to the terms of Investment Advisory Agreements. Under the Investment Advisory Agreement between the Adviser and the Arbitrage Fund, as amended and restated on October 1, 2007, the Arbitrage Fund pays the Adviser an annual fee, which is computed and accrued daily and paid monthly, of 1.25% on the first $250 million, 1.20% on the next $50 million, 1.15% on the next $50 million, 1.10% on the next $75 million, 1.05% on the next $75 million and 1.00% for amounts over $500 million, based on the Arbitrage Fund's average daily net assets. Under the Investment Advisory Agreement between the Adviser and the Event-Driven Fund dated September 27, 2010, the Event-Driven Fund pays the Adviser an annual fee, which is computed and accrued daily and paid monthly, of 1.25% based on the Event-Driven Fund's average daily net assets. Under the Investment Advisory Agreement between the Adviser and the Credit Opportunities Fund dated October 1, 2012, the Credit Opportunities Fund pays the Adviser an annual fee, which is computed and accrued daily and paid monthly, of 1.00% based on the Credit Opportunities Fund's average daily net assets. Under the Investment Advisory Agreement between the Adviser and the Tactical Equity Fund dated December 22, 2014, the Tactical Equity Fund pays the Adviser an annual fee, which is computed and accrued daily and paid monthly, of 1.25% based on the Tactical Equity Fund's average daily net assets.
The Adviser has contractually agreed, at least until September 30, 2017 for the Arbitrage Fund, the Event-Driven Fund, the Credit Opportunities Fund, and December 31, 2017 for the Tactical Equity Fund, to waive its advisory fee and/or reimburse the Funds' other expenses to the extent that total operating expenses (exclusive of taxes, interest, dividends on short positions, brokerage commissions, acquired fund fees and expenses and other costs incurred in connection with the purchase or sale of portfolio securities) exceed the annual rate of the Funds' average daily net assets attributable to each share class as shown in the table below:
| | | Arbitrage Fund | | Event-Driven Fund | | Credit Opportunities Fund | | Tactical Equity Fund | |
Class R | | | 1.69 | % | | | 1.69 | % | | | 1.50 | % | | | 1.69 | % | |
Class I | | | 1.44 | % | | | 1.44 | % | | | 1.25 | % | | | 1.44 | % | |
Class C | | | 2.44 | % | | | 2.44 | % | | | 2.25 | % | | | 2.44 | % | |
Class A | | | 1.69 | % | | | 1.69 | % | | | 1.50 | % | | | 1.69 | % | |
For the year ended May 31, 2016, the aggregate net fee paid to the Adviser as a percentage of average net assets for the Arbitrage Fund, Event-Driven Fund, Credit Opportunities Fund and Tactical Equity Fund was 1.05%, 1.25%, 1.00% and 1.25%, respectively.
The Adviser is permitted to recapture fees waived and expenses reimbursed to the extent actual fees and expenses for a period are less than the expense limitation of each class, provided, however, that the Adviser shall only be entitled to recapture such amounts for a period of three years from the end of the fiscal year during which such amount was waived or reimbursed. The
www.arbitragefunds.com | 1-800-295-4485
126
The Arbitrage Funds Notes to Financial Statements (continued)
Adviser can recapture any fees it has waived within three fiscal years of the year in which fees were waived subject to the applicable annual rate of: 1.69% for Class R shares, 1.44% for Class I shares, 2.44% for Class C shares and 1.69% for Class A shares of the Arbitrage Fund, Event-Driven Fund and Tactical Equity Fund, 1.50% for Class R shares, 1.25% for Class I shares, 2.25% for Class C shares and 1.50% for Class A shares of the Credit Opportunities Fund.
As of the year ended May 31, 2016, the balances of future fee and expense recaptures for each Fund were as follows:
| | | Expiring
May 31, 2017 | | Expiring
May 31, 2018 | | Expiring
May 31, 2019 | | Total | |
Event-Driven Fund | |
Class R | | $ | 16,826 | | | $ | 42,377 | | | $ | 193,596 | | | $ | 252,799 | | |
Class I | | $ | 67,294 | | | $ | 96,022 | | | $ | 332,746 | | | $ | 496,062 | | |
Class C | | $ | 854 | | | $ | 1,230 | | | $ | 5,871 | | | $ | 7,955 | | |
Class A | | $ | 756 | | | $ | 1,377 | | | $ | 5,132 | | | $ | 7,265 | | |
Credit Opportunities Fund | |
Class R | | $ | 36,515 | | | $ | 25,136 | | | $ | 44,465 | | | $ | 106,116 | | |
Class I | | $ | 113,965 | | | $ | 92,962 | | | $ | 107,990 | | | $ | 314,917 | | |
Class C | | $ | 1,393 | | | $ | 4,587 | | | $ | 4,018 | | | $ | 9,998 | | |
Class A | | $ | 214 | | | $ | 1,194 | | | $ | 1,093 | | | $ | 2,501 | | |
Tactical Equity Fund | |
Class R | | | N/A | | | $ | 1,733 | | | $ | 1,665 | | | $ | 3,398 | | |
Class I | | | N/A | | | $ | 97,858 | | | $ | 256,320 | | | $ | 354,178 | | |
Class C | | | N/A | | | $ | 1,733 | | | $ | 1,665 | | | $ | 3,398 | | |
Class A | | | N/A | | | $ | 1,733 | | | $ | 1,665 | | | $ | 3,398 | | |
There were no amounts recaptured during the year ended May 31, 2016, for the Funds.
Administration Agreement
State Street Bank & Trust Company serves as the Trust's administrator pursuant to an Administration Agreement with the Trust. Prior to September 11, 2015, ALPS Fund Services, Inc. ("ALPS") served as the Trust's administrator.
Distribution Agreement
ALPS Distributors, Inc. (the "Distributor") serves as the Funds' distributor. The Distributor acts as an agent for the Funds and the distributor of their shares. The Funds have adopted, with respect to their Class R, Class C shares and Class A shares, a plan of distribution pursuant to Rule 12b-1 under the 1940 Act which permits each Fund to pay for expenses incurred in the distribution and promotion of the Funds' Class R shares, Class C shares and Class A shares and for services provided to shareholders. The Plan is a "reimbursement" plan. This means that a Fund's Class R shares, Class C shares and Class A shares only pay a particular 12b-1 fee to the extent that the Adviser, the Distributor or others have incurred expenses in the promotion and distribution of the shares, including but not limited to, the printing of prospectuses and reports used for sales purposes, expenses of preparation of sales literature and related expenses, advertisements, and other distribution-related expenses, as well as any distribution fees paid to securities dealers or others. Under the distribution plan, a Fund may pay compensation to any broker-dealer with whom the Distributor or the Funds has entered into a contract to distribute Class R shares, Class C shares or Class A shares, or to any other qualified financial services firm, for distribution and/or shareholder-related services with respect to shares held or purchased by their respective
Annual Report | May 31, 2016
127
The Arbitrage Funds Notes to Financial Statements (continued)
customers or in connection with the purchase of shares attributable to their efforts. The amount of payments under the Plan in any year shall not exceed 0.25% for Class R shares, 0.75% for Class C shares and 0.25% for Class A shares, respectively, of the average daily net assets allocable to a Fund's Class R shares, Class C shares and Class A shares, respectively. In addition, the Plan permits each Fund to make payments at an annual rate of up to 0.25% of the Fund's Class C shares for expenses incurred in connection with the provision of shareholder support or administrative services for the Fund's Class C shares.
During the year ended May 31, 2016, The Arbitrage Fund's Class R shares incurred $1,163,091, Class C shares incurred $326,219 and Class A shares incurred $41,236, respectively, in distribution expenses for Class R shares and Class A shares and distribution and shareholder support expenses for Class C shares, all of which was used to compensate broker-dealers. With respect to the Event-Driven Fund, during the year ended May 31, 2016, the Event-Driven Fund's Class R shares incurred $294,208, Class C shares incurred $35,612 and Class A shares incurred $7,808, respectively, in distribution expenses for Class R shares and Class A shares and distribution and shareholder support expenses for Class C shares, all of which was used to compensate broker-dealers. With respect to the Credit Opportunities Fund, during the year ended May 31, 2016, the Credit Opportunities Fund's Class R shares incurred $45,177, Class C shares incurred $16,336 and Class A shares incurred $1,109, respectively, in distribution expenses for Class R shares and Class A shares and distribution and shareholder support expenses for Class C shares, all of which was used to compensate broker-dealers. With respect to the Tactical Equity Fund, during the year ended May 31, 2016, the Tactical Equity Fund's Class R shares incurred $23, Class C shares incurred $94 and Class A shares incurred $23, respectively, in distribution expenses for Class R shares and Class A shares and distribution and shareholder support expenses for Class C shares, all of which was used to compensate broker-dealers.
Chief Compliance Officer
Ascendant Compliance Management, Inc. provides Chief Compliance Officer ("CCO") services to the Trust. Ascendant Compliance Management, Inc. is compensated by the Trust under a Consulting Services Agreement. Prior to May 31, 2016, the Adviser provided a CCO to the Trust who also served as the CCO of the Adviser. The Fund paid the Adviser between 50-60% of the CCO's salary for the CCO's provision of services to the Funds.
Chief Financial Officer
Foreside Management Services, LLC provides Chief Financial Officer ("CFO") services to the Trust. Foreside Management Services, LLC is compensated by the Trust under a Fund CFO/Treasurer Agreement. Prior to September 11, 2015, ALPS provided Principal Financial Officer services to the Trust.
Transfer Agent And Shareholder Services Agreement
DST Systems, Inc. ("DST") is the Funds' transfer agent, and per an agency agreement, maintains the records of each shareholder's account, answers shareholders' inquiries concerning their accounts, processes purchases and redemptions of the Funds shares, acts as dividend and distribution disbursing agent and performs other shareholder service functions.
www.arbitragefunds.com | 1-800-295-4485
128
The Arbitrage Funds Notes to Financial Statements (continued)
7. CAPITAL SHARE TRANSACTIONS
Proceeds and payments on capital shares as shown in the Statement of Changes in Net Assets are the result of the following capital share transactions for the periods shown:
| | | Year Ended
May 31, 2016 | | Year Ended
May 31, 2015 | |
Arbitrage Fund - Class R | | Shares | | Value | | Shares | | Value | |
Proceeds from shares sold | | | 10,329,274 | | | $ | 130,810,689 | | | | 11,255,277 | | | $ | 143,205,442 | | |
Shares issued in reinvestment of
distributions | | | 822,474 | | | | 10,264,483 | | | | 99,102 | | | | 1,254,629 | | |
Proceeds from redemption fees
collected | | | – | | | | 5,031 | | | | – | | | | 14,505 | | |
Payments for shares redeemed | | | (15,786,500 | ) | | | (200,571,773 | ) | | | (33,222,538 | ) | | | (422,530,774 | ) | |
Net decrease | | | (4,634,752 | ) | | $ | (59,491,570 | ) | | | (21,868,159 | ) | | $ | (278,056,198 | ) | |
Arbitrage Fund - Class I | |
Proceeds from shares sold | | | 46,706,866 | | | $ | 608,970,058 | | | | 58,430,496 | | | $ | 761,461,203 | | |
Shares issued in reinvestment of
distributions | | | 1,892,721 | | | | 24,245,751 | | | | 210,789 | | | | 2,731,828 | | |
Proceeds from redemption fees
collected | | | – | | | | 10,214 | | | | – | | | | 7,720 | | |
Payments for shares redeemed | | | (56,370,693 | ) | | | (735,261,059 | ) | | | (77,787,900 | ) | | | (1,014,256,381 | ) | |
Net decrease | | | (7,771,106 | ) | | $ | (102,035,036 | ) | | | (19,146,615 | ) | | $ | (250,055,630 | ) | |
Arbitrage Fund - Class C | |
Proceeds from shares sold | | | 500,812 | | | $ | 6,204,471 | | | | 661,256 | | | $ | 8,265,996 | | |
Shares issued in reinvestment of
distributions | | | 38,603 | | | | 467,867 | | | | 3,667 | | | | 45,478 | | |
Payments for shares redeemed | | | (652,449 | ) | | | (8,039,350 | ) | | | (775,588 | ) | | | (9,670,144 | ) | |
Net decrease | | | (113,034 | ) | | $ | (1,367,012 | ) | | | (110,665 | ) | | $ | (1,358,670 | ) | |
Arbitrage Fund - Class A | |
Proceeds from shares sold | | | 340,518 | | | $ | 4,347,045 | | | | 1,051,918 | | | $ | 13,478,530 | | |
Shares issued in reinvestment of
distributions | | | 28,684 | | | | 358,263 | | | | 1,501 | | | | 19,017 | | |
Payments for shares redeemed | | | (1,056,094 | ) | | | (13,383,544 | ) | | | (236,527 | ) | | | (3,042,546 | ) | |
Net increase/(decrease) | | | (686,892 | ) | | $ | (8,678,236 | ) | | | 816,892 | | | $ | 10,455,001 | | |
Annual Report | May 31, 2016
129
The Arbitrage Funds Notes to Financial Statements (continued)
| | | Year Ended
May 31, 2016 | | Year Ended
May 31, 2015 | |
Event-Driven Fund - Class R | | Shares | | Value | | Shares | | Value | |
Proceeds from shares sold | | | 2,496,545 | | | $ | 22,578,349 | | | | 10,854,265 | | | $ | 109,616,337 | | |
Shares issued in reinvestment of
distributions | | | 181,920 | | | | 1,577,249 | | | | 508,594 | | | | 4,943,527 | | |
Proceeds from redemption fees
collected | | | – | | | | 1,449 | | | | – | | | | 3,548 | | |
Payments for shares redeemed | | | (13,805,457 | ) | | | (125,836,833 | ) | | | (11,137,483 | ) | | | (111,326,249 | ) | |
Net increase/(decrease) | | | (11,126,992 | ) | | $ | (101,679,786 | ) | | | 225,376 | | | $ | 3,237,163 | | |
Event-Driven Fund - Class I | |
Proceeds from shares sold | | | 3,768,748 | | | $ | 34,981,398 | | | | 30,268,594 | | | $ | 309,977,406 | | |
Shares issued in reinvestment of
distributions | | | 346,601 | | | | 3,018,893 | | | | 847,412 | | | | 8,296,168 | | |
Proceeds from redemption fees
collected | | | – | | | | 7,912 | | | | – | | | | 10,415 | | |
Payments for shares redeemed | | | (33,339,072 | ) | | | (304,977,002 | ) | | | (19,422,828 | ) | | | (193,474,992 | ) | |
Net increase/(decrease) | | | (29,223,723 | ) | | $ | (266,968,799 | ) | | | 11,693,178 | | | $ | 124,808,997 | | |
Event-Driven Fund - Class C | |
Proceeds from shares sold | | | 60,431 | | | $ | 543,460 | | | | 335,583 | | | $ | 3,399,344 | | |
Shares issued in reinvestment of
distributions | | | 5,047 | | | | 43,509 | | | | 12,404 | | | | 119,703 | | |
Payments for shares redeemed | | | (302,131 | ) | | | (2,696,528 | ) | | | (240,429 | ) | | | (2,343,450 | ) | |
Net increase/(decrease) | | | (236,653 | ) | | $ | (2,109,559 | ) | | | 107,558 | | | $ | 1,175,597 | | |
Event-Driven Fund - Class A | |
Proceeds from shares sold | | | 18,634 | | | $ | 172,299 | | | | 354,278 | | | $ | 3,577,554 | | |
Shares issued in reinvestment of
distributions | | | 7,318 | | | | 63,444 | | | | 12,574 | | | | 122,223 | | |
Payments for shares redeemed | | | (345,160 | ) | | | (3,139,265 | ) | | | (190,018 | ) | | | (1,872,117 | ) | |
Net increase/(decrease) | | | (319,208 | ) | | $ | (2,903,522 | ) | | | 176,834 | | | $ | 1,827,660 | | |
www.arbitragefunds.com | 1-800-295-4485
130
The Arbitrage Funds Notes to Financial Statements (continued)
| | | Year Ended
May 31, 2016 | | Year Ended
May 31, 2015 | |
Credit Opportunities Fund - Class R | | Shares | | Value | | Shares | | Value | |
Proceeds from shares sold | | | 329,444 | | | $ | 3,203,618 | | | | 2,217,255 | | | $ | 22,101,038 | | |
Shares issued in reinvestment of
distributions | | | 53,795 | | | | 521,680 | | | | 23,448 | | | | 235,574 | | |
Proceeds from redemption fees
collected | | | – | | | | – | | | | – | | | | 210 | | |
Payments for shares redeemed | | | (1,384,361 | ) | | | (13,365,525 | ) | | | (579,108 | ) | | | (5,848,897 | ) | |
Net increase/(decrease) | | | (1,001,122 | ) | | $ | (9,640,227 | ) | | | 1,661,595 | | | $ | 16,487,925 | | |
Credit Opportunities Fund - Class I | |
Proceeds from shares sold | | | 1,623,325 | | | $ | 15,744,142 | | | | 4,060,080 | | | $ | 40,623,905 | | |
Shares issued in reinvestment of
distributions | | | 133,365 | | | | 1,289,012 | | | | 103,564 | | | | 1,037,613 | | |
Proceeds from redemption fees
collected | | | – | | | | – | | | | – | | | | 24 | | |
Payments for shares redeemed | | | (2,058,317 | ) | | | (19,839,217 | ) | | | (1,769,150 | ) | | | (17,616,249 | ) | |
Net increase/(decrease) | | | (301,627 | ) | | $ | (2,806,063 | ) | | | 2,394,494 | | | $ | 24,045,293 | | |
Credit Opportunities Fund - Class C | |
Proceeds from shares sold | | | 11,795 | | | $ | 113,168 | | | | 160,924 | | | $ | 1,619,345 | | |
Shares issued in reinvestment of
distributions | | | 3,931 | | | | 37,920 | | | | 3,722 | | | | 37,247 | | |
Payments for shares redeemed | | | (93,070 | ) | | | (893,117 | ) | | | (30,365 | ) | | | (301,086 | ) | |
Net increase/(decrease) | | | (77,344 | ) | | $ | (742,029 | ) | | | 134,281 | | | $ | 1,355,506 | | |
Credit Opportunities Fund - Class A | |
Proceeds from shares sold | | | 14,931 | | | $ | 145,301 | | | | 92,306 | | | $ | 925,196 | | |
Shares issued in reinvestment of
distributions | | | 1,489 | | | | 14,406 | | | | 961 | | | | 9,597 | | |
Payments for shares redeemed | | | (69,108 | ) | | | (658,051 | ) | | | (32,561 | ) | | | (322,636 | ) | |
Net increase/(decrease) | | | (52,688 | ) | | $ | (498,344 | ) | | | 60,706 | | | $ | 612,157 | | |
Annual Report | May 31, 2016
131
The Arbitrage Funds Notes to Financial Statements (continued)
| | | Year Ended
May 31, 2016 | | Period Ended
May 31, 2015(a) | |
Tactical Equity Fund - Class R | | Shares | | Value | | Shares | | Value | |
Proceeds from shares sold | | | – | | | $ | – | | | | 1,000 | | | $ | 10,000 | | |
Shares issued in reinvestment of
distributions | | | 10 | | | | 88 | | | | – | | | | – | | |
Net increase | | | 10 | | | $ | 88 | | | | 1,000 | | | $ | 10,000 | | |
Tactical Equity Fund - Class I | |
Proceeds from shares sold | | | 41,947 | | | $ | 404,121 | | | | 136,916 | | | $ | 1,385,609 | | |
Shares issued in reinvestment of
distributions | | | 1,588 | | | | 14,509 | | | | – | | | | – | | |
Payments for shares redeemed | | | (40,610 | ) | | | (374,608 | ) | | | (6 | ) | | | (63 | ) | |
Net increase | | | 2,925 | | | $ | 44,022 | | | | 136,910 | | | $ | 1,385,546 | | |
Tactical Equity Fund - Class C | |
Proceeds from shares sold | | | – | | | $ | – | | | | 1,000 | | | $ | 10,000 | | |
Shares issued in reinvestment of
distributions | | | 10 | | | | 88 | | | | – | | | | – | | |
Net increase | | | 10 | | | $ | 88 | | | | 1,000 | | | $ | 10,000 | | |
Tactical Equity Fund - Class A | |
Proceeds from shares sold | | | – | | | $ | – | | | | 1,000 | | | $ | 10,000 | | |
Shares issued in reinvestment of
distributions | | | 10 | | | | 88 | | | | – | | | | – | | |
Net increase | | | 10 | | | $ | 88 | | | | 1,000 | | | $ | 10,000 | | |
(a) Commenced operations on January 2, 2015.
8. FOREIGN CURRENCY TRANSLATION
Amounts denominated in or expected to settle in foreign currencies are translated to U.S. dollars based on exchange rates on the basis outlined below:
A. The market values of investment securities and other assets and liabilities are translated at the closing rate of exchange each day.
B. Purchases and sales of investment securities and income and expenses are translated at the rate of exchange prevailing on the respective dates of such transactions.
C. The Funds do not isolate that portion of the results of operations caused by changes in foreign exchange rates on investments from those caused by changes in market prices of securities held. Such fluctuations are included with the net realized and unrealized gains or losses on investments. Reported net realized foreign exchange gains or losses arise from 1) purchases and sales of foreign currencies; 2) currency gains or losses realized between the trade and settlement dates on security transactions; and 3) the difference between the amounts of dividends, interest and foreign withholding taxes recorded on the Funds' books, and the U.S. dollar equivalent of the amounts actually received or paid. Reported net unrealized foreign exchange gains and losses arise from changes in the value of assets and liabilities, other than investment securities, resulting from changes in exchange rates.
www.arbitragefunds.com | 1-800-295-4485
132
The Arbitrage Funds Notes to Financial Statements (continued)
9. CONTINGENCIES AND COMMITMENTS
The Funds indemnify the Trust's officers and trustees for certain liabilities that might arise from their performance of their duties to the Funds. Additionally, in the normal course of business, the Funds enter into contracts that contain a variety of representations and warranties and which provide general indemnifications. The Funds' maximum exposure under these arrangements is unknown, as this would involve future claims that may be made against the Funds that have not yet occurred. However, based on experience, the Funds expect the risk of loss to be remote.
10. SECURITIES LENDING
In order to generate additional income, the Funds may, from time to time, lend portfolio securities to broker-dealers, banks or institutional borrowers of securities. The Funds must receive 100% collateral in the form of cash or U.S. government securities. This collateral must be valued daily and, should the market value of the loaned securities increase, the borrower must furnish additional collateral to the Funds. During the time portfolio securities are on loan, the borrower pays the Funds any dividends or interest paid on such securities.
Loans are subject to termination by the Funds or the borrower at any time. While the Funds do not have the right to vote securities on loan they have the right to terminate the loan and regain the right to vote if that is considered important with respect to the investment. In the event the borrower defaults in its obligation to the Fund, the Funds bear the risk of delay in the recovery of portfolio securities and the risk of loss of rights in the collateral. The Fund did not engage in securities lending during the reporting period.
11. FEDERAL TAX INFORMATION
In order to avoid imposition of the excise tax applicable to regulated investment companies, it is also the Funds' intention to declare as dividends in each calendar year at least 98.0% of its net investment income (earned during the calendar year) and 98.2% of its net realized capital gains (earned during the twelve months ended October 31) plus undistributed amounts from prior years.
The amount of distributions from net investment income and net realized gains, if any, are determined in accordance with Federal income tax regulations which may differ from accounting principles generally accepted in the United States of America. These "book/tax" differences are either temporary or permanent in nature and permanent differences are charged or credited to undistributed net investment income (loss), accumulated net realized gain (loss) or paid-in capital as appropriate in the period that the differences arise.
Permanent differences between the Funds' financial statement and income tax reporting requirements are primarily attributable to gains and losses on certain foreign currency related transactions, short sale related dividend expense, investments in passive foreign investment companies, investments in swaps, consent fee income, net operating losses and partnership basis adjustments. These have no effect on the Funds' net assets or net asset value per share.
Annual Report | May 31, 2016
133
The Arbitrage Funds Notes to Financial Statements (continued)
Fund | | Undistributed Net
Investment
Income/(Loss) | | Accumulated
Realized Gain/(Loss) | | Paid-in Capital | |
Arbitrage Fund | | $ | 1,067,581 | | | $ | (1,061,857 | ) | | $ | (5,724 | ) | |
Event-Driven Fund | | | 6,208,666 | | | | 1,113,000 | | | | (7,321,666 | ) | |
Credit Opportunities Fund | | | (138,720 | ) | | | 138,720 | | | | – | | |
Tactical Equity Fund | | | 4,500 | | | | (3,009 | ) | | | (1,491 | ) | |
The tax character of dividends and distributions declared and paid during the years ended May 31, 2016 and May 31, 2015 was as follows:
Fund | | Year
Ended | | Ordinary
Income | | Long-Term
Capital Gains* | | Total
Distributions | |
Arbitrage Fund | | 5/31/2016 | | $ | 36,514,253 | | | $ | 8,351,638 | | | $ | 44,865,891 | | |
| | | 5/31/2015 | | | – | | | | 5,699,538 | | | | 5,699,538 | | |
Event-Driven Fund | | 5/31/2016 | | $ | 6,911,803 | | | $ | 10,047 | | | $ | 6,921,850 | | |
| | | 5/31/2015 | | | 16,463,793 | | | | – | | | | 16,463,793 | | |
Credit Opportunities Fund | | 5/31/2016 | | $ | 1,900,708 | | | $ | – | | | $ | 1,900,708 | | |
| | | 5/31/2015 | | | 1,328,590 | | | | – | | | | 1,328,590 | | |
Tactical Equity Fund | | 5/31/2016 | | $ | 14,738 | | | $ | 35 | | | $ | 14,773 | | |
| | | 5/31/2015 | | | – | | | | – | | | | – | | |
* The Funds designate these distributions as long-term capital gains dividends per IRC code section 852(b)(3)(C).
As of May 31, 2016, the components of distributable earnings on a tax basis were as follows:
| | | Arbitrage
Fund | | Event-Driven Fund | | Credit
Opportunities
Fund | | Tactical Equity
Fund | |
Undistributed ordinary
income | | $ | 1,559,965 | | | $ | – | | | $ | 178,577 | | | $ | – | | |
Accumulated capital
gains/losses | | | 1,990,600 | | | | – | | | | – | | | | – | | |
Unrealized appreciation/
(depreciation) | | | 13,191,745 | | | | 512,505 | | | | (69,796 | ) | | | (16,283 | ) | |
Loss deferral | | | – | | | | (28,330,349 | ) | | | (1,345,615 | ) | | | (61,246 | ) | |
Capital loss carryover | | | – | | | | (37,836,776 | ) | | | (1,644,549 | ) | | | (48,263 | ) | |
Total distributable
earnings | | $ | 16,742,310 | | | $ | (65,654,620 | ) | | $ | (2,881,383 | ) | | $ | (125,792 | ) | |
www.arbitragefunds.com | 1-800-295-4485
134
The Arbitrage Funds Notes to Financial Statements (continued)
The following information is computed on a tax basis for each item as of May 31, 2016:
Fund | | Gross
Appreciation
(excess of value
over tax cost) | | Gross
Depreciation
(excess of tax
cost over value) | | Net Appreciation/
(Depreciation)
of Foreign Currency
and Derivatives | | Net Unrealized
Appreciation
(Depreciation) | | Cost of
Investments for
Income Tax
Purposes | |
Arbitrage Fund | | $ | 37,756,096 | | | $ | (9,379,415 | ) | | $ | (15,184,936 | ) | | $ | 13,191,745 | | | $ | 1,928,289,014 | | |
Event-Driven Fund | | | 5,071,410 | | | | (3,345,521 | ) | | | (1,213,384 | ) | | | 512,505 | | | | 188,893,103 | | |
Credit Opportunities
Fund | | | 1,210,692 | | | | (503,378 | ) | | | (777,110 | ) | | | (69,796 | ) | | | 54,144,169 | | |
Tactical Equity Fund | | | 9,209 | | | | (20,288 | ) | | | (5,204 | ) | | | (16,283 | ) | | | 1,052,316 | | |
The differences between book-basis and tax-basis net unrealized appreciation/(depreciation) for the Funds are attributable to constructive sales, dividends related to short securities, investments in passive foreign investment companies, wash sales, convertible bonds, straddle loss deferrals and unsettled short sales.
Capital Losses
As of May 31, 2016, the Event-Driven Fund had $36,044,782 of short term and $1,791,994 of long term capital loss carryforwards, the Credit Opportunities Fund had $1,413,105 of short term and $231,444 of long term capital loss carryforwards and the Tactical Equity Fund had $48,263 of short term capital loss carryforwards which may reduce the Funds' taxable income arising from future net realized gains on investments, if any, to the extent permitted by the Code and thus may reduce the amount of the distributions to shareholders which would otherwise be necessary to relieve the Funds of any liability for federal tax.
Late Year Losses
The Event-Driven Fund, the Credit Opportunities Fund and the Tactical Equity Fund elect to defer to the period ending May 31, 2017, capital losses recognized during the period November 1, 2015 to May 31, 2016 in the amount of $27,112,371, $1,345,615 and $60,948, respectively.
The Event-Driven Fund and Tactical Equity Fund have elected to defer late-year ordinary losses of $1,217,978 and $298, respectively, as arising on June 1, 2016.
12. INFORMATION REGARDING LEGAL PROCEEDINGS
The Arbitrage Fund and dozens of other entities and individuals have been named as defendants in an adversary proceeding pending in the United States Bankruptcy Court for the Southern District of New York (Weisfelner, as Trustee of the LB Creditor Trust v. Fund 1, et al., Adv. Pro. No. 10-04609). The complaint alleges that payments made to shareholders of Lyondell Chemical Company ("Lyondell") in connection with the acquisition of Lyondell by Basell AF S.C.A. in a cash-out merger in or around December, 2007 constituted constructive or intentional "fraudulent transfers" under applicable state law and seeks to recover from the former Lyondell shareholders the payments received for the shares.
On January 14, 2014, the Court issued a decision and order on motions to dismiss granting in part, and denying in part, the motions. On April 9, 2014, plaintiff filed a Third Amended Complaint continuing to assert constructive or intentional fraudulent transfer claims under applicable state law. On August 1, 2014, defendants filed a motion to dismiss the Third Amended Complaint, and oral arguments on the motion to dismiss was held on January 14, 2015. On November 18, 2015, the Court issued a decision dismissing the intentional fraudulent transfer claim. The plaintiff
Annual Report | May 31, 2016
135
The Arbitrage Funds Notes to Financial Statements (continued)
appealed the November 18, 2015 decision, which was entered as a Final Judgment. On May 4, 2016, based on the March 29, 2016 decision of the U.S. Court of Appeal for the Second Circuit in In re Tribune Fraudulent Conveyance Litigation, defendants moved to dismiss the remaining constructive fraudulent transfer claims in the Creditor Action, or alternatively, to stay all discovery in that action pending the exhaustion of all appeal periods in the Tribune matter. The parties have fully briefed and argued the dismissal and stay issues, and the Court has taken the matter under advisement.
At this stage in the proceedings, it is not possible to assess with any reasonable certainty the probable outcome of the pending litigation. Consequently, at this time, management is unable to estimate the possible loss that may result.
13. SUBSEQUENT EVENTS
The Adviser has evaluated the need for disclosures and/or adjustments resulting from events and transactions subsequent to May 31, 2016, through the date the financial statements were issued. There were no such events or transactions requiring adjustments to or disclosure in the Funds' financial statements.
www.arbitragefunds.com | 1-800-295-4485
136
Report of Independent Registered Accounting Firm
The Board of Trustees and Shareholders of
The Arbitrage Funds
We have audited the accompanying statements of assets and liabilities, including the portfolios of investments, of The Arbitrage Funds (comprising, respectively, The Arbitrage Fund, The Arbitrage Event-Driven Fund, The Arbitrage Credit Opportunities Fund, and The Arbitrage Tactical Equity Fund) (the Funds) as of May 31, 2016, and the related statements of operations for the year then ended, changes in net assets for each of the two years in the period then ended, and the financial highlights for each of the periods indicated therein. These financial statements and financial highlights are the responsibility of the Funds' management. Our responsibility is to express an opinion on these financial statements and financial highlights based on our audits.
We conducted our audits in accordance with the standards of the Public Company Accounting Oversight Board (United States). Those standards require that we plan and perform the audit to obtain reasonable assurance about whether the financial statements and financial highlights are free of material misstatement. We were not engaged to perform an audit of the Funds' internal control over financial reporting. Our audits included consideration of internal control over financial reporting as a basis for designing audit procedures that are appropriate in the circumstances, but not for the purpose of expressing an opinion on the effectiveness of the Funds' internal control over financial reporting. Accordingly, we express no such opinion. An audit also includes examining, on a test basis, evidence supporting the amounts and disclosures in the financial statements and financial highlights, assessing the accounting principles used and significant estimates made by management, and evaluating the overall financial statement presentation. Our procedures included confirmation of securities owned as of May 31, 2016, by correspondence with the custodian, agent banks, and brokers, or by other appropriate auditing procedures where replies from agent banks and brokers were not received. We believe that our audits provide a reasonable basis for our opinion.
In our opinion, the financial statements and financial highlights audited by us as referred to above present fairly, in all material respects, the financial position of each of the respective portfolios constituting The Arbitrage Funds at May 31, 2016, the results of their operations, the changes in their net assets, and the financial highlights for each of the periods indicated therein, in conformity with U.S. generally accepted accounting principles.

Minneapolis, Minnesota
July 27, 2016
Annual Report | May 31, 2015
137
The Arbitrage Funds Disclosure of Fund Expenses
All mutual funds have operating expenses. As a shareholder of a mutual fund, your investment is affected by these ongoing costs, which include (among others) costs for portfolio management, administrative services, distribution (12b-1) expenses, redemption fees and shareholder reports like this one. It is important for you to understand the impact of these costs on your investment returns.
Operating expenses such as these are deducted from a mutual fund's gross income and directly reduce its final investment return. These expenses are expressed as a percentage of a mutual fund's average net assets; this percentage is known as a mutual fund's expense ratio.
The following examples use the expense ratio and are intended to help you understand the ongoing costs (in dollars) of investing in your Fund and to compare these costs with those of other mutual funds. The examples are based on an investment of $1,000 made at the beginning of the period shown and held for the entire period.
The table on the following page illustrates your Fund's cost in two ways:
Actual Fund Return. The section helps you to estimate the actual expenses after fee waivers that your Fund incurred over the period. The "Expenses Paid During Period" column shows the actual dollar expense cost incurred by a $1,000 investment in the Fund, and the "Ending Account Value" number is derived from deducting that expense cost from the Fund's gross investment return.
You can use this information, together with the actual amount you invested in the Fund, to estimate the expenses you paid over that period. Simply divide your actual account value by $1,000 to arrive at a ratio (for example, an $8,600 account value divided by $1,000 = 8.6), then multiply that ratio by the number shown for your Fund under "Expenses Paid During Period."
Hypothetical 5% Return. This section helps you compare your Fund's costs with those of other mutual funds. It assumes that the Fund had an annual 5% return before expenses during the period, but that expense ratio (Column 3) for the period is unchanged. This example is useful in making comparisons because the Securities and Exchange Commission requires all mutual funds to make this 5% calculation. You can assess your Fund's comparative cost by comparing the hypothetical result for your Fund in the "Expenses Paid During Period" column with those that appear in the same charts in the shareholder reports for other mutual funds.
Note: Because the return is set at 5% for comparison purposes — NOT your Fund's actual return — the account values shown may not apply to your specific investment.
www.arbitragefunds.com | 1-800-295-4485
138
The Arbitrage Funds Disclosure of Fund Expenses (continued)
| | | Beginning
Account Value
12/01/2015 | | Ending
Account Value
05/31/2016 | | Expense
Ratio(a) | | Expenses
Paid During
Period(b) | |
The Arbitrage Fund | |
Class R | |
Actual | | $ | 1,000.00 | | | $ | 1,025.30 | | | | 1.91 | % | | $ | 9.67 | | |
Hypothetical (5% return before
expenses) | | $ | 1,000.00 | | | $ | 1,015.45 | | | | 1.91 | % | | $ | 9.62 | | |
Class I | |
Actual | | $ | 1,000.00 | | | $ | 1,027.00 | | | | 1.65 | % | | $ | 8.36 | | |
Hypothetical (5% return before
expenses) | | $ | 1,000.00 | | | $ | 1,016.75 | | | | 1.65 | % | | $ | 8.32 | | |
Class C | |
Actual | | $ | 1,000.00 | | | $ | 1,022.00 | | | | 2.66 | % | | $ | 13.45 | | |
Hypothetical (5% return before
expenses) | | $ | 1,000.00 | | | $ | 1,011.70 | | | | 2.66 | % | | $ | 13.38 | | |
Class A | |
Actual | | $ | 1,000.00 | | | $ | 1,026.10 | | | | 1.87 | % | | $ | 9.47 | | |
Hypothetical (5% return before
expenses) | | $ | 1,000.00 | | | $ | 1,015.65 | | | | 1.87 | % | | $ | 9.42 | | |
(a) Annualized, based on the Fund's most recent fiscal half-year expenses.
(b) Expenses, are equal to the Fund's annualized ratio multiplied by the average account value over the period, multiplied by the number of days in the most recent fiscal half year (183), divided by 366.
| | | Beginning
Account Value
12/01/2015 | | Ending
Account Value
05/31/2016 | | Expense
Ratio(a) | | Expenses
Paid During
Period(b) | |
The Arbitrage Event-Driven Fund | |
Class R | |
Actual | | $ | 1,000.00 | | | $ | 1,031.40 | | | | 2.33 | % | | $ | 11.83 | | |
Hypothetical (5% return before
expenses) | | $ | 1,000.00 | | | $ | 1,013.35 | | | | 2.33 | % | | $ | 11.73 | | |
Class I | |
Actual | | $ | 1,000.00 | | | $ | 1,032.60 | | | | 2.10 | % | | $ | 10.67 | | |
Hypothetical (5% return before
expenses) | | $ | 1,000.00 | | | $ | 1,014.50 | | | | 2.10 | % | | $ | 10.58 | | |
Class C | |
Actual | | $ | 1,000.00 | | | $ | 1,028.40 | | | | 3.08 | % | | $ | 15.62 | | |
Hypothetical (5% return before
expenses) | | $ | 1,000.00 | | | $ | 1,009.60 | | | | 3.08 | % | | $ | 15.47 | | |
Class A | |
Actual | | $ | 1,000.00 | | | $ | 1,031.60 | | | | 2.34 | % | | $ | 11.88 | | |
Hypothetical (5% return before
expenses) | | $ | 1,000.00 | | | $ | 1,013.30 | | | | 2.34 | % | | $ | 11.78 | | |
(a) Annualized, based on the Fund's most recent fiscal half-year expenses.
(b) Expenses, are equal to the Fund's annualized ratio multiplied by the average account value over the period, multiplied by the number of days in the most recent fiscal half year (183), divided by 366.
Annual Report | May 31, 2016
139
The Arbitrage Funds Disclosure of Fund Expenses (continued)
| | | Beginning
Account Value
12/01/2015 | | Ending
Account Value
05/31/2016 | | Expense
Ratio(a) | | Expenses
Paid During
Period(b) | |
The Arbitrage Credit Opportunities Fund | |
Class R | |
Actual | | $ | 1,000.00 | | | $ | 1,017.90 | | | | 1.67 | % | | $ | 8.42 | | |
Hypothetical (5% return before
expenses) | | $ | 1,000.00 | | | $ | 1,016.65 | | | | 1.67 | % | | $ | 8.42 | | |
Class I | |
Actual | | $ | 1,000.00 | | | $ | 1,018.20 | | | | 1.43 | % | | $ | 7.22 | | |
Hypothetical (5% return before
expenses) | | $ | 1,000.00 | | | $ | 1,017.85 | | | | 1.43 | % | | $ | 7.21 | | |
Class C | |
Actual | | $ | 1,000.00 | | | $ | 1,013.20 | | | | 2.42 | % | | $ | 12.18 | | |
Hypothetical (5% return before
expenses) | | $ | 1,000.00 | | | $ | 1,012.90 | | | | 2.42 | % | | $ | 12.18 | | |
Class A | |
Actual | | $ | 1,000.00 | | | $ | 1,017.20 | | | | 1.65 | % | | $ | 8.32 | | |
Hypothetical (5% return before
expenses) | | $ | 1,000.00 | | | $ | 1,016.75 | | | | 1.65 | % | | $ | 8.32 | | |
(a) Annualized, based on the Fund's most recent fiscal half-year expenses.
(b) Expenses, are equal to the Fund's annualized ratio multiplied by the average account value over the period, multiplied by the number of days in the most recent fiscal half year (183), divided by 366.
| | | Beginning
Account Value
12/01/2015 | | Ending
Account Value
05/31/2016 | | Expense
Ratio(a) | | Expenses
Paid During
Period(b) | |
The Arbitrage Tactical Equity Fund | |
Class R | |
Actual | | $ | 1,000.00 | | | $ | 1,012.80 | | | | 2.45 | % | | $ | 12.33 | | |
Hypothetical (5% return before
expenses) | | $ | 1,000.00 | | | $ | 1,012.75 | | | | 2.45 | % | | $ | 12.33 | | |
Class I | |
Actual | | $ | 1,000.00 | | | $ | 1,012.80 | | | | 2.19 | % | | $ | 11.02 | | |
Hypothetical (5% return before
expenses) | | $ | 1,000.00 | | | $ | 1,014.05 | | | | 2.19 | % | | $ | 11.03 | | |
Class C | |
Actual | | $ | 1,000.00 | | | $ | 1,012.80 | | | | 3.20 | % | | $ | 16.10 | | |
Hypothetical (5% return before
expenses) | | $ | 1,000.00 | | | $ | 1,009.00 | | | | 3.20 | % | | $ | 16.07 | | |
Class A | |
Actual | | $ | 1,000.00 | | | $ | 1,012.80 | | | | 2.45 | % | | $ | 12.33 | | |
Hypothetical (5% return before
expenses) | | $ | 1,000.00 | | | $ | 1,012.75 | | | | 2.45 | % | | $ | 12.33 | | |
(a) Annualized, based on the Fund's most recent fiscal half-year expenses.
(b) Expenses, are equal to the Fund's annualized ratio multiplied by the average account value over the period, multiplied by the number of days in the most recent fiscal half year (183), divided by 366.
www.arbitragefunds.com | 1-800-295-4485
140
The Arbitrage Funds Additional Information
1. PROXY VOTING POLICIES AND VOTING RECORD
A description of the policies and procedures that the Funds use to vote proxies relating to portfolio securities is available without charge upon request by calling toll-free 1-800-295-4485, or on the Securities and Exchange Commission's ("SEC") website at http://www.sec.gov. Information regarding how the Funds voted proxies will be available without charge upon request by calling toll-free 1-800-295-4485, or on the SEC's website at http://www.sec.gov.
2. QUARTERLY PORTFOLIO HOLDINGS
The Funds file a complete listing of their portfolio holdings with the SEC as of the first and third quarters of each fiscal year on Form N-Q. The filings are available upon request by calling 1-800-295-4485. Furthermore, you may obtain a copy of the filing on the SEC's website at http://www.sec.gov. The Funds' Forms N-Q may also be reviewed and copied at the SEC's Public Reference Room in Washington, D.C., and information on the operation of the Public Reference Room may be obtained by calling 1-800-SEC-0330.
Annual Report | May 31, 2016
141
The Arbitrage Funds Results of Shareholder Meeting
Results of Shareholder Meeting held on February 2, 2016 (unaudited)
1. Election of Trustees – At a meeting held on February 2, 2016, the shareholders of the Funds elected John C. Alvarado, Stephen R. Byers, Jay N. Goldberg, Robert P. Herrmann, Burton Lehman, John S. Orrico and Francis X. Tracy as Trustees of the Trust. The results of the vote are presented below:
| | | For | | Withheld | |
John C. Alvarado | | | 132,248,615.044 | | | | 45,597,907.137 | | |
Stephen R. Byers | | | 176,370,074.883 | | | | 1,476,447.298 | | |
Jay N. Goldberg | | | 132,296,729.447 | | | | 45,549,792.734 | | |
Robert P. Herrmann | | | 132,281,354.621 | | | | 45,565,167.560 | | |
Burton Lehman | | | 176,166,605.954 | | | | 1,679,916.227 | | |
John S. Orrico | | | 130,090,125.066 | | | | 47,756,397.115 | | |
Francis X. Tracy | | | 176,405,070.167 | | | | 1,441,452.014 | | |
www.arbitragefunds.com | 1-800-295-4485
142
The Arbitrage Funds Trustees' Approval of Advisory Agreement
As required under the Investment Company Act of 1940 (the "1940 Act"), the Board of Trustees (the "Board") of The Arbitrage Funds (the "Trust"), which is comprised of The Arbitrage Fund, The Arbitrage Event-Driven Fund, The Arbitrage Credit Opportunities Fund and The Arbitrage Tactical Equity Fund (each, a "Fund" and, collectively, the "Funds"), determines annually whether to continue each Fund's investment advisory agreement with Water Island Capital, LLC, the investment adviser to each Fund (the "Adviser"). In considering the renewal of the agreements, the Board, including all of those Trustees who are not "interested persons" of the Funds, as defined in the 1940 Act, met on May 23, 2016 and approved the continuation of the agreements after concluding that the continuation of the agreements was in the best interests of each Fund and its shareholders.
The Board requested and received materials relating to the agreements in advance of the meeting. Among other things, the Board considered comparative fee information from the Adviser. Also, the Board considered expense and performance comparisons with other mutual funds in the Funds' peer groups as determined by Morningstar Associates, LLC ("Morningstar"), an independent source of mutual fund analysis, as further discussed below. The Board also considered that it had reviewed the Funds' performance against other comparable mutual funds as provided by the Adviser at the Board's meetings throughout the year.
In approving the agreements, the Board, including the Independent Trustees advised by independent legal counsel, considered the factors it deemed relevant, including the nature, quality and extent of services provided, the performance of each Fund, the profitability of the Adviser, expenses and fees, and the potential for economies of scale that may be shared with each Fund and its shareholders as each Fund's assets grow. In their deliberations, the Trustees did not identify any single factor which alone was responsible for the Board's decision to approve the agreement with respect to each Fund. In connection with its deliberations, the Board considered information provided by the Adviser throughout the year at regular Board meetings, presentations from portfolio managers and other information, as well as information furnished at or in advance of the meeting held on May 23, 2016.
Nature, Extent and Quality of the Services under the Advisory Agreements
The Board received and considered information regarding the nature, extent and quality of services provided to each Fund by the Adviser under the advisory agreement for the Fund. The Board also noted information received at regular meetings throughout the year related to the services rendered by the Adviser. The Board reviewed background information about the Adviser, including its Form ADV. The Board considered the background and experience of the Adviser's senior management and the qualifications, backgrounds and responsibilities of the portfolio managers primarily responsible for the day-to-day portfolio management of the Funds and the extent of the resources devoted to research and analysis of actual and potential investments. The Board considered the steps that the Adviser had taken during the past year to improve performance, including the hiring of additional personnel and the Adviser's focus on evaluating risk and performance for the Funds. The Board also received and considered information about the nature, extent and quality of services and fee rates offered to other clients of the Adviser for comparable services. The Board concluded that it was generally satisfied with the nature, extent and quality of the investment management services provided to each Fund by the Adviser and that, based on dialogue with management and counsel, the services provided by the Adviser under the advisory agreement for each Fund are typical of, and consistent with, those provided to similar mutual funds by other investment advisers.
Adviser Profitability
The Board was provided with information on the Adviser's profitability in serving as the investment adviser to each Fund. The Board recognized that it is difficult to make comparisons of profitability
Annual Report | May 31, 2016
143
The Arbitrage Funds Trustees' Approval of Advisory Agreement (continued)
from fund management contracts because comparative information is not generally publicly available and is affected by numerous factors, including the structure of the particular adviser, the types of funds it manages, its business mix, numerous assumptions regarding allocations and the adviser's capital structure and cost of capital. Taking these factors into account, the Board concluded that the Adviser's profitability in relation to the services rendered was reasonable.
Economies of Scale
The Board considered information regarding whether there have been economies of scale with respect to the management of each Fund, whether the Fund has appropriately benefited from any economies of scale, and whether there is potential for realization of any further economies of scale. With respect to The Arbitrage Fund, the Board noted that the management fee schedule for the Fund includes breakpoints, which have the effect of decreasing the fee rate as assets increase, and that at its current level of assets the Fund's effective fee rate reflected those rate reductions. The Board took note that the Fund's fee structure currently results in benefits to Fund shareholders whether or not the Adviser realizes any economies of scale. The Board noted that the advisory fee schedules for The Arbitrage Event-Driven Fund, The Arbitrage Credit Opportunities Fund and The Arbitrage Tactical Equity Fund do not contain breakpoints that would reduce the fee rate on assets above specified levels. The Board determined that, while fee breakpoints were not currently necessary for The Arbitrage Event-Driven Fund, The Arbitrage Credit Opportunities Fund or The Arbitrage Tactical Equity Fund given the smaller size of these Funds, they would continue to review whether breakpoints should be incorporated in the advisory fees for these Funds.
Other Benefits to the Adviser
The Board considered other benefits received by the Adviser as a result of its relationship with the Funds. The Board concluded that the potential benefits to be derived by the Adviser included the ability to use soft dollar credits as well as the potential benefits consistent with those generally resulting from an increase in assets under management, specifically, potential access to additional research resources and benefits to its reputation. The Board concluded that the benefits derived by the Adviser were consistent with the types of benefits generally derived by investment advisers to mutual funds. The Board considered the standards applied in seeking best execution and reviewed the Adviser's method for and policies with respect to allocating portfolio investment opportunities among its advisory clients.
Other Factors and Broader Review
As discussed above, the Board reviewed detailed materials received from the Adviser as part of the annual review. The Board also reviews and assesses the quality of the services that the Funds receive throughout the year. In this regard, the Board reviews reports of the Adviser at least quarterly, which include, among other things, detailed portfolio and market reviews, detailed Fund performance reports and compliance reports.
Investment Advisory Fee Rates and Expenses and Performance
The Board reviewed and considered the contractual advisory fee rates for each Fund in light of the extent and quality of the advisory services provided by the Adviser. The Board also reviewed and considered the contractual fee waivers and expense reimbursements currently in place for each Fund.
The Board also received and considered information comparing the effective advisory fee rates and gross and net total expenses for each Fund with those of a group of funds within the Fund's Morningstar category determined independently by Morningstar (the "Peer Group") as well as to
www.arbitragefunds.com | 1-800-295-4485
144
The Arbitrage Funds Trustees' Approval of Advisory Agreement (continued)
the funds in the same Morningstar category (the "Category Group"). The comparisons placed each Fund in various quartiles, with the first quartile being the lowest cost mutual funds.
The performance of each Fund for the periods ended March 31, 2016 was compared to the Peer Group as well as to the funds in the Category Group. The Board also received and considered additional information provided by the Adviser on other comparable mutual funds and comparisons of the performance of each Fund to additional securities indices that the Adviser deemed relevant to the Board's considerations.
The Arbitrage Fund
The Fund's performance was compared to a Peer Group composed of a small group of funds within Morningstar's Market Neutral and Long/Short categories that run a purely merger arbitrage strategy as well as to the Market Neutral Category Group. The Fund's total return ranked in the fourth quartile of the Peer Group for the one-, five- and ten-year period and in the third quartile of the Peer Group for the three-year period. The Trustees noted that for the five- and ten-year periods, the Peer Group included only one other fund, that the Morningstar report had noted that the Fund's Peer Group was smaller than Morningstar's typical peer group and that the Morningstar report's methodology stated that the inclusion of fewer peers in a group renders the medians and averages less meaningful. The Fund's total return ranked in the second quartile of the Category Group for the year-to-date, one-, five- and ten-year periods, as well as since inception. The Fund's total return was in the third quartile of the Category Group for the three-year period. The Fund also underperformed its benchmark, the S&P 500 Index, for all periods.
The Fund's effective advisory fee was in the second quartile of its Category Group. The Fund's net expenses and gross expenses were each in the second quartile in the Category Group. It was noted that the Adviser had entered into an expense waiver and reimbursement agreement to limit fees through September 30, 2017, although the Fund's expenses did not currently reach a level to require the Adviser to waive fees or reimburse expenses.
The Board determined that, notwithstanding the Fund's relative performance, it would be in the best interests of the Fund and its shareholders to continue the advisory agreement. The Fund's fee structure was considered reasonable.
The Arbitrage Event-Driven Fund
The Fund's performance was compared to a Peer Group composed of a small group of funds within Morningstar's Market Neutral and Multi-Alternative categories that do not pursue multi-alternative strategies and/or focus primarily on convertible arbitrage. The Fund's performance was also compared to the Event Driven (Institutional) Category Group. The Fund's total return for the one-, three- and five-year periods was in the third quartile of the Peer Group and in the fourth quartile of the Category Group. It was noted that the Fund had underperformed the Barclays U.S. Aggregate Bond Index for the one-, three- and five-year periods.
The Fund's effective advisory fee was in the fourth quartile of its Category Group. The Fund's net expenses and gross expenses were each in the second quartile in the Category Group. It was noted that the Adviser had entered into an expense waiver and reimbursement agreement to limit fees through September 30, 2017.
The Board determined that, notwithstanding the Fund's relative performance, it would be in the best interests of the Fund and its shareholders to continue the advisory agreement. In light of the Fund's current size and fee rate, the Board concluded that the fee structure was reasonable and that the
Annual Report | May 31, 2016
145
The Arbitrage Funds Trustees' Approval of Advisory Agreement (continued)
absence of breakpoints in the Fund's fee schedule was acceptable at this time, although the Board would continue to monitor whether breakpoints should be implemented for the Fund.
The Arbitrage Credit Opportunities Fund
The Fund's performance was compared to a Peer Group composed of a small group of funds within Morningstar's Nontraditional Bond category that primarily focus on credit opportunities to generate returns, implement an absolute return or strategic income strategy and have lower duration, as well as to the Nontraditional Bond Category Group. The Fund's total returns for the one- and three-year periods were in the first quartile of the Peer Group. The Fund's total return for the one-year period was in the second quartile of the Category Group and the return for the year-to-date and three-year periods were in the first quartile of the Category Group. The Fund lagged the Barclays U.S. Aggregate Bond Index for the one- and three-year periods. It was noted that the Fund's standard deviation (a measure of volatility) for the one- and three-year periods ranked in the first quartile (meaning lowest volatility) of both the Peer Group and the Category Group.
The Fund's effective advisory fee was in the fourth quartile of the Category Group. The Fund's net and gross expenses were in the fourth quartile of the Category Group. It was noted that the median asset size of the funds in the Peer Group was much larger than that of the Fund and that many of those funds appear to benefit from economies of scale. It was further noted that the Adviser had entered into an expense waiver and reimbursement agreement to limit fund fees and expenses through September 30, 2017.
The Board determined that it would be in the best interests of the Fund and its shareholders to continue the advisory agreement. In light of the Fund's current size and fee rate, the Board concluded that the fee structure was reasonable and that the absence of breakpoints in the Fund's fee schedule was acceptable at this time, although the Board would continue to monitor whether breakpoints should be implemented for the Fund.
The Arbitrage Tactical Equity Fund
The Fund's performance was compared to a Peer Group composed of a small group of Funds within Morningstar's Long/Short Equity category with primary investment strategy focused on fundamental research, more specifically focusing on funds that invest in companies that exhibit a catalyst for a corporate change. The Fund's returns for the year-to-date period were in the second quartile of the Category Group. The Fund's returns for the one-year period were in the fourth quartile of both the Peer Group and the Category Group. It was noted that the Fund's standard deviation (a measure of volatility) for the one-year period ranked in the first quartile (meaning lowest volatility) of the Peer Group and the Category Group.
The Fund's effective advisory fee was in the second quartile of the Category Group. The Fund's net expenses were in the second quartile of the Category Group, and the Fund's gross expenses were in the fourth quartile of the Category Group. It was further noted that the Adviser had entered into an expense waiver and reimbursement agreement to limit fund fees and expenses through December 31, 2017.
The Board determined that it would be in the best interests of the Fund and its shareholders to continue the advisory agreement. In light of the Fund's current size and fee rate, the Board concluded that the fee structure was reasonable and that the absence of breakpoints in the Fund's fee schedule was acceptable at this time, although the Board would continue to monitor whether breakpoints should be implemented for the Fund.
www.arbitragefunds.com | 1-800-295-4485
146
The Arbitrage Funds Trustees & Officers
The business of the Trust is managed under the direction of the Board in accordance with the Declaration of Trust of the Trust, which Declaration of Trust has been filed with the SEC and is available upon request. The Board consists of seven Trustees, six of whom are not considered "interested persons," as such term is defined in the Investment Company Act of 1940, as amended, of the Trust or the Adviser. The Trustees were elected to their positions by the Funds' shareholders in February 2016.
The Trustees serve for an indefinite term and the officers are elected annually. It is the policy of the Board that each Trustee, at the conclusion of the first meeting at which the Trustee has attained age 75, shall retire from the Board; provided, however, with respect to Messrs. Jay Goldberg and Burton Lehman, the mandatory retirement age is 77.
Pursuant to the Declaration of Trust, the Trustees elect the officers of the Trust to supervise its day- to-day operations. The Board retains the power to conduct, operate and carry on the business of the Trust and has the power to incur and pay any expenses which, in the opinion of the Board, are necessary or incidental to carry out any of the Trust's purposes.
The Trustees, officers and employees of the Trust, when acting in such capacities, shall not be subject to any personal liability except for his or her own bad faith, willful misfeasance, gross negligence or reckless disregard of his or her duties. Following is a list of the Trustees and executive officers of the Trust.
INTERESTED TRUSTEE:
Name, Address
and Age | | Length of
Time Served | | Position
with Trust | | Principal
Occupation
During the
Past Five Years | | Other
Directorships
During the Past
Five Years | | Number of
Portfolios in
the Fund
Complex
Overseen by
Trustee | |
John S. Orrico, CFA*
41 Madison
Avenue, 42nd
Floor, New York,
NY 10010
(Age 56) | | Since 2000 | | President, and Chairman of the Board of Trustees | | Managing Member, Water Island Capital, LLC, the Investment Adviser, since January 2000. | | None | | 4 | |
* John S. Orrico, as an affiliated person of the Adviser and as an officer of the Trust, is an "interested person" of the Trust within the meaning of Section 2(a)(19) of the 1940 Act.
Annual Report | May 31, 2016
147
The Arbitrage Funds Trustees & Officers (continued)
INDEPENDENT TRUSTEES:
Name, Address1
and Age | | Length of
Time Served | | Position
with Trust | | Principal
Occupation
During the
Past Five Years | | Other
Directorships
During the Past
Five Years | | Number of
Portfolios in
the Fund
Complex
Overseen by
Trustee | |
John C. Alvarado
(Age 56) | | Since 2003 | | Trustee | | Managing Director at Alvarado Energy Advisors LLC ("AEA"), a boutique investment banking firm providing financial advisory services to middle market energy companies (since 2014); Managing Director for The Seaport Group (2010 - 2014); Founder and Managing Member of Power Capital Partners, LLC, an energy related financial consulting firm (2000 - 2010). | | None | | 4 | |
www.arbitragefunds.com | 1-800-295-4485
148
The Arbitrage Funds Trustees & Officers (continued)
Name, Address1
and Age | | Length of
Time Served | | Position
with Trust | | Principal
Occupation
During the
Past Five Years | | Other
Directorships
During the Past
Five Years | | Number of
Portfolios in
the Fund
Complex
Overseen by
Trustee | |
Stephen R. Byers
(Age 62) | | Since 2016 | | Trustee | | Independent Consultant (2014 - present) | | Trustee (since 2011), Lead Independent Trustee (since February 2015) and Audit Committee Chair (2011 - 2015), Deutsche Bank db-X ETF Trust (34 portfolios); Independent Director and Audit Committee Chair (since 2012), Sierra Income Corporation; Trustee (2002 - 2011), The College of William and Mary, Graduate School of Business; Director, The Dreyfus Corporation; Director, Dreyfus Investment Advisors, Inc.; Director, Lighthouse Growth Advisors, LLC; Director, Founders Asset Management, LLC. | | 4 | |
Annual Report | May 31, 2016
149
The Arbitrage Funds Trustees & Officers (continued)
Name, Address1
and Age | | Length of
Time Served | | Position
with Trust | | Principal
Occupation
During the
Past Five Years | | Other
Directorships
During the Past
Five Years | | Number of
Portfolios in
the Fund
Complex
Overseen by
Trustee | |
Jay N. Goldberg
(Age 75) | | Since 2000 | | Lead Independent Trustee | | General Partner of Hudson Ventures (venture capital firm). | | Independent Trustee of Ramius Archview Credit & Distressed Fund and Ramius Archview Credit & Distressed Feeder Fund. | | 4 | |
Robert P. Herrmann
(Age 53) | | Since 2012 | | Trustee | | Executive Vice President, Global Asset & Wealth Management, Ipreo (2013 - present). Previously, Chairman & CEO of Discovery Data, a leading financial services industry data provider (2009 - 2013). | | Independent Director of TD Asset Management (USA). | | 4 | |
Burton Lehman
(Age 75) | | Since 2016 | | Trustee | | Of Counsel for Schulte, Roth & Zabel LLP (2006 - present) | | None | | 4 | |
Francis Tracy
(Age 58) | | Since 2016 | | Trustee | | President, Chief Financial Officer, Treasurer, and Secretary for Batterymarch Financial Management, Inc. (1999 - 2014). | | Batterymarch Global Emerging Markets Fund (Luxembourg) (2010 - 2014) | | 4 | |
1 The Independent Trustees may be contacted by writing to Joshua Deringer, Drinker Biddle & Reath LLP, One Logan Square, Suite 2000, Philadelphia, PA 19103-6996.
www.arbitragefunds.com | 1-800-295-4485
150
The Arbitrage Funds Trustees & Officers (continued)
EXECUTIVE OFFICERS:
Name, Address
and Age | | Length of
Time Served | | Position
with Trust | | Principal
Occupation
During the
Past Five Years | | Other
Directorships
During the Past
Five Years | | Number of
Portfolios in
the Fund
Complex
Overseen by
Trustee | |
Allison K. Fraser
(Age 58)
c/o Ascendant Compliance Management, Inc.,
546 Fifth Avenue, 18th Floor, New York, NY 10036 | | Since 2016 | | Chief Compliance Officer and Anti-Money Laundering Officer | | Compliance Services Consultant (since 2015), Ascendant Compliance Management, Inc.**; Senior Vice President – Compliance (2006 - 2015), Northern Trust Investments, Inc. | | None | | N/A | |
Jonathon Hickey
(Age 35)
41 Madison Avenue, 42nd Floor, New York, NY 10010 | | Since 2013 | | Treasurer | | Director of Operations (2011 - present), Water Island Capital; Fund Accounting Manager (2004 - 2011), SEI. | | None | | N/A | |
William Keena
(Age 65)
41 Madison Avenue, 42nd Floor, New York, NY 10010 | | Since 2013 | | Assistant Treasurer, Assistant Secretary | | Chief Administrative Officer (since 2010), Water Island Capital. | | None | | N/A | |
Annual Report | May 31, 2016
151
The Arbitrage Funds Trustees & Officers (continued)
Name, Address
and Age | | Length of
Time Served | | Position
with Trust | | Principal
Occupation
During the
Past Five Years | | Other
Directorships
During the Past
Five Years | | Number of
Portfolios in
the Fund
Complex
Overseen by
Trustee | |
Monique Labbe
(Age 42)
Foreside Management Services, LLC
10 High St. #302,
Boston, MA 02110 | | Since 2015 | | Principal Financial Officer | | Fund Principal Financial Officer, Foreside Management Services, LLC* (2014 - present); Principal/Assistant Vice President – Global Funds Management, State Street Global Advisors (2012 - 2014); Director/ Assistant Vice President, State Street Corporation (2005 - 2012). | | None | | N/A | |
Laura Wajs
(Age 39)
41 Madison Avenue, 42nd Floor, New York, NY 10010 | | Since 2016 | | Secretary | | Compliance Officer (since 2016), Water Island Capital; Chief Compliance Officer/Chief AML Officer (2006 - 2016), J.H. Whitney Investment Management, LLC | | None | | N/A | |
* Foreside Management Services, LLC provides chief financial officer services to the Trust under a CFO/Treasurer Agreement with the Trust. Ms. Labbe is not directly compensated by the Trust for her service as Principal Financial Officer of the Trust, but is compensated as an employee of Foreside Management Services, LLC.
** Ascendant Compliance Management, Inc. provides chief compliance officer services to the Trust under a Compliance Services Agreement with the Trust. Ms. Fraser is not directly compensated by the Trust for her service as Chief Compliance Officer of the Trust, but is compensated as an employee of Ascendant Compliance Management, Inc.
Additional information about members of the Board of Trustees and Officers is available in the Funds' Statement of Additional Information (SAI). To obtain a free copy of the SAI, please call 1-800-295-4485.
www.arbitragefunds.com | 1-800-295-4485
152
This Page Intentionally Left Blank
This Page Intentionally Left Blank

The Arbitrage Fund
The Arbitrage Event-Driven Fund
The Arbitrage Credit Opportunities Fund
The Arbitrage Tactical Equity Fund
800-295-4485
www.arbitragefunds.com
Adviser
Water Island Capital, LLC
41 Madison Avenue, 42nd Floor
New York, NY 10010
Distributor
ALPS Distributors, Inc.
1290 Broadway, Suite 1100
Denver, CO 80203
Transfer Agent
DST Systems, Inc.
P.O. Box 219842
Kansas City, MO 64121-9842
Custodian
State Street Bank & Trust
225 Liberty Street
New York, NY 10281
This material must be preceded or accompanied by a prospectus. Please read it carefully before investing.
Item 2. Code of Ethics.
(a) The Registrant, as of the end of the period covered by the report, has adopted a code of ethics that applies to the Registrant’s principal executive officer, principal financial officer, principal accounting officer or controller or any persons performing similar functions on behalf of the Registrant.
(b) Not applicable.
(c) During the period covered by this report, no amendments were made to the provisions of the code of ethics adopted in 2(a) above.
(d) During the period covered by this report, no implicit or explicit waivers to the provisions of the code of ethics adopted in 2(a) above were granted.
(e) Not applicable.
(f) The Registrant’s Code of Ethics is attached as an Exhibit hereto.
Item 3. Audit Committee Financial Expert.
(a)(1) The Registrant’s board of trustees has determined that the Registrant has at least one audit committee financial expert serving on the audit committee.
(a)(2) The audit committee financial expert is John C. Alvarado, who is independent as defined in Form N-CSR Item 3(a)(2).
Item 4. Principal Accountant Fees and Services.
(a) Audit Fees: For the Registrant’s fiscal years ended May 31, 2016 and May 31, 2015, the aggregate fees billed for professional services rendered by the principal accountant for the audit of the Registrant’s annual financial statements were $110,500 and $96,300, respectively.
(b) Audit-Related Fees: For the Registrant’s fiscal years ended May 31, 2016 and May 31, 2015, the aggregate fees billed for assurance and related services by the principal accountant that are reasonably related to the performance of the audit of the Registrant’s financial statements and are not reported under paragraph (a) of this Item were $0 and $0, respectively.
(c) Tax Fees: For the Registrant’s fiscal years ended May 31, 2016 and May 31, 2015, aggregate fees of $24,000 and $15,700, respectively, were billed for professional services rendered by the principal accountant for tax compliance, tax advice, and tax planning.
(d) All Other Fees: For the Registrant’s fiscal years ended May 31, 2016 and May 31, 2015, no fees were billed to Registrant by the principal accountant for services other than the services reported in paragraphs (a) through (c) of this item.
(e)(1) Audit Committee Pre-Approval Policies and Procedures: All services to be performed by the Registrant’s principal auditors must be pre-approved by the Registrant’s audit committee.
(e)(2) No services described in paragraphs (b) through (d) were approved pursuant to paragraph (c)(7)(i)(C) of Rule 2-01 of Regulation S-X.
(f) Not applicable.
(g) The aggregate non-audit fees billed by the Registrant’s principal accountant for the fiscal years ended May 31, 2016 and May 31, 2015 were $24,000 and $15,700, respectively.
(h) Not applicable.
Item 5. Audit Committee of Listed Registrants.
Not applicable.
Item 6. Schedule of Investments.
The Schedule of Investments is included as part of the Report to Stockholders filed under Item 1 of this form.
Item 7. Disclosure of Proxy Voting Policies and Procedures for Closed-End Management Investment Companies.
Not applicable
Item 8. Portfolio Managers of Closed-End Management Investment Companies.
Not applicable.
Item 9. Purchases of Equity Securities by Closed-End Management Investment Company and Affiliated Purchasers.
Not applicable.
Item 10. Submission of Matters to Vote of Security Holders.
There have been no material changes to the procedures by which shareholders may recommend nominees to the registrant’s Board of Trustees.
Item 11. Controls and Procedures.
(a) The registrant’s principal executive officer and principal financial officer have evaluated the registrant’s disclosure controls and procedures (as defined in Rule 30a-3(c) under the Investment Company Act of 1940, as amended) within 90 days of this filing and have concluded that the registrant’s disclosure controls and procedures were effective, as of that date.
(b) There was no change in the registrant’s internal control over financial reporting (as defined in Rule 30a-3(d) under the Investment Company Act of 1940, as amended) during the second fiscal quarter of the period covered by this report that has materially affected, or is reasonably likely to materially affect, the registrant’s internal control over financial reporting.
Item 12. Exhibits.
(a)(1) The code of ethics that applies to the registrant’s principal executive officer and principal financial officer is attached hereto as EX-12.A.1.
(a)(2) A separate certification for the principal executive officer and the principal financial officer of the registrant as required by Rule 30a-2(a) under the Investment Company Act of 1940, as amended (17 CFR 270.30a-2(a)), are attached hereto as exhibit Ex-99.CERT.
(a)(3) Not applicable.
(b) The certifications by the registrant’s principal executive officer and principal financial officer, as required by Rule 30a-2(b) of the Investment Company Act of 1940, as amended, and Section 906 of the Sarbanes-Oxley Act of 2002 are attached hereto as Ex-99.906CERT.
SIGNATURES
Pursuant to the requirements of the Securities Exchange Act of 1934 and the Investment Company Act of 1940, the registrant has duly caused this report to be signed on its behalf by the undersigned, thereunto duly authorized.
THE ARBITRAGE FUNDS
By: | /s/ John S. Orrico | |
| John S. Orrico | |
| President (Principal Executive Officer) | |
| | |
Date: | August 5, 2016 | |
Pursuant to the requirements of the Securities Exchange Act of 1934 and the Investment Company Act of 1940, this report has been signed below by the following persons on behalf of the registrant and in the capacities and on the dates indicated.
By: | /s/ John S. Orrico | |
| John S. Orrico | |
| President (Principal Executive Officer) | |
| | |
Date: | August 5, 2016 | |
| | |
| | |
By: | /s/ Monique Labbe | |
| Monique Labbe | |
| Chief Financial Officer (Principal Financial Officer) | |
| | |
Date: | August 5, 2016 | |