UNITED STATES
SECURITIES AND EXCHANGE COMMISSION
Washington, D.C. 20549
FORM N-CSR
CERTIFIED SHAREHOLDER REPORT OF REGISTERED
MANAGEMENT INVESTMENT COMPANIES
Investment Company Act file number: 811-09815
THE ARBITRAGE FUNDS
(exact name of registrant as specified in charter)
41 Madison Avenue, 42nd Floor, New York, NY 10010
(Address of principal executive offices) (Zip code)
John S. Orrico
Water Island Capital, LLC
41 Madison Avenue
42nd Floor
New York, NY 10010
(Name and address of agent for service)
Registrant’s telephone number, including area code: 212-259-2655
Date of fiscal year end: May 31
Date of reporting period: June 1, 2013 – May 31, 2014
Item 1. Reports to Stockholders.
| | |
ANNUAL REPORT | MAY 31 . 2014 THE ARBITRAGE FUND THE ARBITRAGE EVENT-DRIVEN FUND THE ARBITRAGE CREDIT OPPORTUNITIES FUND | |  |
| | |
 | | TABLE OF CONTENTS |
| | |
| | |
| The Arbitrage Funds | | Shareholder Letter |
May 31, 2014
Dear Fellow Shareholders,
For the fiscal year ending May 31, 2014, The Arbitrage Fund returned 1.10% (Class R, ARBFX), The Arbitrage Event-Driven Fund returned 5.75% (Class R, AEDFX), and The Arbitrage Credit Opportunities Fund returned 4.99% (Class R, ARCFX). The HFRI Merger Arbitrage Index returned 3.95%, HFRI Event-Driven Index returned 8.76%, and the Barclays Capital U.S. Aggregate Bond Index returned 2.71% over the same period. (See pages 7, 26, and 53 for standard performance).
A year ago, we would have been hard-pressed to predict the rollercoaster ride broad markets took investors on for much of the 12 months ending May 2014. As we looked out to the year ahead last summer, we expected an increase in volatility thanks largely to speculation over the end of the U.S Federal Reserve’s accommodative monetary policies. While markets became increasingly skittish in June 2013, any fears of the Fed’s policy changes related to Quantitative Easing soon evaporated. When the dust settled, the S&P 500 rose 18% and credit spreads tightened across the risk spectrum, for the 12-months through May 2014. The 10-Year Treasury yield, which went from 2.50 last summer to peaking at 3.03 at the start of 2014 to a low of 2.44 at the end of May, was seemingly as volatile as equity markets.
Meanwhile, the environment for mergers and acquisitions (M&A) became increasingly aggressive as 2014 unfolded. A number deals were characterized by hostile offers, bear hugs and topping bids. The credit markets continue to see spread compression as investors’ demand for income has pushed yields for Investment Grade and High Yield corporate credits to all-time lows. The associated credit spreads are well below historical median levels.
While we are always mindful of the performance of the equity and credit markets, our mandate is to find compelling corporate events capable of unlocking value and identifying the most promising part of the capital structure to realize our thesis. In that sense, there may be no better time to be event-driven investors. We have receptive markets ready to fund initial public offerings (IPOs), secondary offerings, private placements, lines of credit, high yield debt, and convertible securities, just to name a few, along with eager investors. We have numerous activists agitating for change and corporate managements becoming more receptive to their ideas for unlocking shareholder value.
That said, we also are aware that investors may not be well compensated for taking on the many potential pitfalls we face, including increased regulatory and political scrutiny on deals, geopolitical turmoil and an aging bull market.
Moreover, we would rather see this activity tied to fundamental analysis and strategic initiatives rather than fueled by the Fed’s cheap money and frothy capital markets. Wishful thinking aside, we do not believe that the forces that have reawakened animal spirits in the corporate world—relatively low financing costs, cash-rich companies, and the Fed’s money printing press—are going away anytime soon.
Thus, we will stay true to our discipline of capitalizing on corporate actions by understanding the rationale and underlying complexities of each event, sharing insights between our teams, using hedging to mitigate market influence, and building well-diversified portfolios. We believe through this approach, the Arbitrage Funds Family can generate attractive long-term results with lower volatility and correlation to broader markets.
| | |
| Annual Report | May 31, 2014 | | 1 |
| | |
| The Arbitrage Funds | | Shareholder Letter (continued) |
May 31, 2014
To that end, we’ve invested in our people, capabilities and infrastructure over the past year. We added two equity analysts and an experienced credit trader/analyst to help us source and research ideas. We also fortified our regulatory and compliance oversight with additional technologies and processes that put us on the forefront of the industry, all in an effort to serve you better.
As always, we are grateful for your continued trust and support.
Sincerely,
The Investment Team at Water Island Capital
High yield corporate credits are high paying bonds with a lower credit rating than investment-grade corporate bonds, Treasury bonds and municipal bonds. Because of the higher risk of default, these bonds pay a higher yield than investment grade bonds.
Investment grade is a rating that indicates that a municipal or corporate bond has a relatively low risk of default. Bond rating firms, such as Standard & Poor’s, use different designations consisting of upper- and lower-case letters ‘A’ and ‘B’ to identify a bond’s credit quality rating. ‘AAA’ and ‘AA’ (high credit quality) and ‘A’ and ‘BBB’ (medium credit quality) are considered investment grade. Credit ratings for bonds below these designations (‘BB’, ‘B’, ‘CCC’, etc.) are considered low credit quality, and are commonly referred to as “junk bonds.”
Quantitative easing is an unconventional monetary policy in which a central bank purchases government securities or other securities from the market in order to lower interest rates and increase the money supply. Quantitative easing increases the money supply by flooding financial institutions with capital in an effort to promote increased lending and liquidity. Quantitative easing is considered when short-term interest rates are at or approaching zero, and does not involve the printing of new banknotes.
The statements and opinions expressed are those of the author as of the date of this report. All information is historical and not indicative of future results and subject to change. This information is not a recommendation to buy or sell any security.
| | |
| 2 | | www.arbitragefunds.com | 1-800-295-4485 |
| | |
| The Arbitrage Fund | | Manager Commentary |
May 31, 2014 (Unaudited)
|
The Arbitrage Fund | NASDAQ | ARBNX, ARBFX, ARBCX, ARGAX The Fund’s Goal and Main Investments Merger arbitrage is a sub-set of a broader event-driven investment strategy, which seeks to profit from investing in securities that are involved in corporate events such as mergers and acquisitions. Typically merger arbitrage is a low volatility strategy pursued by absolute-return-minded investors. At Water Island Capital, our goal is to capture a return stream with a low correlation to the overall markets. |
Investment Strategy
The Fund seeks to achieve capital growth by engaging in merger arbitrage. The strategy’s focus is to capture returns from corporate events, generate market neutral capital growth, preservation of capital, consistent and positive returns, and achieve low correlation, and low volatility. The Fund’s general investment approach can be best described as risk averse, and many systems, policies, and procedures are in place to facilitate this low-risk approach. The Fund generally engages in active and frequent trading of portfolio securities to achieve its principal investment objective. In attempting to achieve its investment strategy, the Fund plans to invest at least 80% of its net assets in equity securities of companies (both U.S. and foreign) that are involved in publicly-announced mergers, takeovers, tender offers, leveraged buyouts, spin-offs, liquidations, and other corporate reorganizations. The Fund’s investment advisor uses investment strategies designed to minimize market exposure, including short selling along with purchasing and selling options. The most common merger arbitrage activity, and the approach generally used by the Fund, involves purchasing the shares of an announced acquisition target company at a discount to their expected value upon the acquisition’s completion. That difference, or “spread,” is the primary driver of returns for this strategy. There is no limit to the number of stocks the Fund can hold; however, the Fund typically invests in 40 to 80 deals at any given time. Each deal will have one, or perhaps two, equity positions (a long and short position in a stock-for-stock deal) and, in many cases, associated derivative positions for hedging purposes.
Commentary
We had muted expectations for a pick-up in merger and acquisition activity at the start of the Fund’s fiscal year last summer. While many of the factors for a surge in the number and value of deals were in place—relatively cheap financing, cash rich corporations and rising share prices—companies were sorely lacking in boardroom confidence.
As the efficacy of share buybacks and dividends on share prices started to wane, corporate boards and executives increasingly turned to M&A for growth during the third quarter of 2013. A number of well-recognized CEOs and companies openly talked about using M&A as a way to enter new regions and to boost core businesses, mainly in the pharmaceutical, media, and technology sectors. Private equity firms with record funding levels also started to put their cash balances to work.
Ultimately, the spark that ignited one of the most active periods for M&A since the private-equity-led frenzy of 2007 was a tactic known as tax inversions, which involves using M&A to re-domicile businesses in more favorable tax jurisdictions. This would lower the pro forma tax profile of the company, providing an earnings boost, and usually, a rerating of its price-earnings multiple.
| | |
| Annual Report | May 31, 2014 | | 3 |
| | |
| The Arbitrage Fund | | Manager Commentary (continued) |
May 31, 2014 (Unaudited)
Some of the biggest deals of the first half of 2014 were predicated on such tactics, including Pfizer-AstraZenaca’s $125 billion proposed merger, which was eventually scuttled due to vocal objections from lawmakers and regulators from both sides of the Atlantic. We believe the window of opportunity is closing on this strategy as it will certainly encounter resistance from lawmakers. However, we expect corporations that intend to use this ploy to accelerate the proposal of any such deals, which could make the usually quiet summer months much more active.
Finally, the return of hostile offers, bear hugs and topping bids was a trend from which we profited. According to Dealogic, in 2014 through May 31, 25 unsolicited offers worth $290 billion were made, the most since 2000. Most of them took place in slow growth industries where consolidation is driving mergers, such as pharmaceuticals, telecommunications and food processing. That said, the current aggressive merger and acquisition landscape also inserts uncertainty into definitively announced deals, which is our purview.
Fiscal Year Highlights
In fiscal 2014, the Arbitrage Fund returned 1.10%. The results were predominantly derived from companies residing in the Americas. In terms of sectors, consumer staples and health care companies were the top contributors, while energy and consumer discretionary sectors added the least to results.
One of the best performing investments of the year was the acquisition of Fidelity National Financial (FNF) of Lender Processing Services (LPS) nearly $4 billion. When FNF announced an agreement to acquire LPS, we viewed this as a very strategic deal. The combination brings together LPS’s mortgage transaction and data analytics with FNF’s title insurance business. The pro forma company would have significant opportunity to generate synergies to spur both revenues and profits. It would also benefit from an overall housing recovery. The complex nature of the deal created opportunity for dynamic trading around the position, which closed after minor divestitures led to regulatory approval.
Our participation in the bidding war for Hillshire Brands was a strong contributor to results. We recognized Hillshire Brands, a maker of well-known processed meats and foods, to be a scarce asset and a takeover target in the fast-consolidating food processing industry. When Hillshire announced its acquisition of Pinnacle Foods, we believed it was just the start of something bigger, which would include bids for Hillshire itself, and positioned the fund accordingly. After a bidding contest, Tyson Foods’ $8 billion bid, which was nearly 40% above the initial offer for Hillshire, ultimately won out.
We also profited from the tussle for Canadian gold miner Osisko. In January, Goldcorp announced a $2.9 billion hostile offer for Osisko, which was rebuffed as too low. Osisko also questioned Goldcorp’s motives and tactics while courting a friendly offer from Yamana Gold, which teamed with Agnico Eagle Mines to make the winning bid worth $3.5 billion in mid-April.
The derailed acquisition of Ohio-based Cooper Tire by Apollo Tyres of India, which would have created one of the largest global tire producers, was one of the biggest drags on performance. Given Apollo’s desire to enter the American tire market and the potential for competing bidders who also viewed Cooper as an attractive asset, we believed the deal made strategic sense and
| | |
| 4 | | www.arbitragefunds.com | 1-800-295-4485 |
| | |
| The Arbitrage Fund | | Manager Commentary (continued) |
May 31, 2014 (Unaudited)
posed an acceptable risk/reward profile. However, the transaction failed due to labor disputes at Cooper’s production facility in China and the inability of Apollo Tyres to obtain financing to close the deal.
Another deal that weighed on performance during the period was our position in Liberty Media’s (LMCA) January 3, 2014 proposal to acquire the 47% of Sirius XM (SIRI) it did not already own. The transaction would have allowed LMCA to capture 100% of the cash flow generated by SIRI. With a low initial offer, shareholder valuation complaints, and majority of the minority vote provisions, we believed LMCA would need to increase its offer in order to successfully acquire SIRI. However, on March 13, 2014, LMCA announced a plan to split LMCA into dual-trading stocks, rescinding its bid to acquire the portion of SIRI it did not already own.
While we were disappointed the deal fell through, we believed that the nearly 10% fall in SIRI’s stock was overdone. The shares have since rebounded and, as expected, SIRI announced plans for additional share buybacks totaling in excess of $2 billion. As of July, the Fund has recovered most of the losses experienced following the abandoned bid by Liberty.
Finally, the position we established following Cubist Pharmaceuticals’ acquisition of Optimer Pharma for $10.75 cash per share and 1 CVR (contingent value right) also weighed on the portfolio. The CVR payment could be worth up to $5 per share if it reached certain sales milestones on Optimer’s antibiotic drug DIFICID. After the deal closed, DIFICID missed sales targets and the CVR lost value in the marketplace for these instruments. We still hold the CVRs with the understanding that our time frame to realize their return potential has been extended. The portfolio incurred a small loss from this position.
Outlook
If we gleaned our insight solely from the newspapers and business news networks, we would be telling you about how the long-awaited resurgence of merger and acquisition (M&A) activity has finally arrived. The last nine months of our fiscal year were certainly active. For the first time since the private-equity-led merger frenzy of 2007, global announced deals topped $1 trillion in value during the second quarter and $1.83 trillion for the first half of 2014, according to Dealogic.
Yet all is not as a rosy as it seems. For one, the dollar value of deals withdrawn, or cancelled, is at $338 billion through the end of June, which is the highest level since first half of 2008, according to Dealogic. Additionally, buyers are paying more on average for their targets—13 times earnings before interest, taxes, depreciation, and amortization charges (EBITDA) versus 11.8 times EBITDA for the same period in 2013. Thanks to the market rally over the past year, the percentage of stock-only transactions is at a level not seen in nearly a decade. And while we are excited over several transformational transactions such as Time Warner Cable/Comcast, we have yet to see these types of strategically-driven deals reflected across all industries, geographies and market capitalization levels.
Historically, a hostile merger and acquisitions environment bolstered boardroom confidence enough to spur overall deal activity. We are hopeful that will be the case this time around, as an increase in the number of deals usually leads to a higher quality portfolio better diversified by geography, market capitalization size and sector.
| | |
| Annual Report | May 31, 2014 | | 5 |
| | |
| The Arbitrage Fund | | Manager Commentary (continued) |
May 31, 2014 (Unaudited)
However, more deals don’t necessarily alter our return targets, which are predicted on the level of short-term rates. For this to increase, we would still need to see the number of deals increase across the market capitalization spectrum and to occur in more diverse locales. We would also need to see interest rates at the short-end of the curve rise.
We plan to remain vigilant for opportunities, and to position the Fund for the resurgence of activity that usually begins in earnest in the second half of the calendar year.
Sincerely,
The Investment Team at Water Island Capital
| | |
| 6 | | www.arbitragefunds.com | 1-800-295-4485 |
| | |
| The Arbitrage Fund | | Portfolio Information |
May 31, 2014 (Unaudited)
Performance (annualized returns as of May 31, 2014)
| | | | | | | | | | | | | | | | |
| | | One Year | | | Five Year | | | Ten Year | | | Since Inception* | |
Arbitrage Fund, Class R | | | 1.10% | | | | 2.29% | | | | 3.05% | | | | 4.57% | |
Arbitrage Fund, Class I | | | 1.39% | | | | 2.55% | | | | 3.25% | | | | 3.22% | |
Arbitrage Fund, Class C** | | | -0.62% | | | | N/A | | | | N/A | | | | 0.05% | |
Arbitrage Fund, Class A*** | | | -1.35% | | | | N/A | | | | N/A | | | | -1.35% | |
HFRI Event Driven: Merger Arbitrage Index | | | 3.95% | | | | 4.16% | | | | 5.06% | | | | 4.73% | |
S&P 500® Index | | | 20.45% | | | | 18.40% | | | | 7.77% | | | | 4.11% | |
Barclays Capital U.S. Aggregate Bond Index | | | 2.71% | | | | 4.96% | | | | 4.99% | | | | 5.62% | |
Current performance may be higher or lower than performance quoted above. Any performance data quoted represents past performance and the investment return and principal value of an investment in the Fund will fluctuate so that an investor’s shares, when redeemed, may be worth more or less than their original cost. Past performance is no guarantee of future results. Returns do not reflect a 2% redemption fee for shares that are redeemed from the fund within 30 days of purchase, which, if reflected, would reduce the performance quoted. Returns shown above include the reinvestment of all dividends and capital gains. Contractual fee waivers are currently in effect. Without such fee waivers, performance numbers would be reduced. You can obtain performance data current to the most recent month end by calling 1-800-295-4485 or going to www.arbitragefunds.com.
* Class R inception: 9/17/00; Class I inception: 10/17/03; Class C inception: 6/1/12; Class A inception: 6/1/13.
** Class C shares are subject to a 1.00% contingent deferred sales charge on all purchases redeemed in 12 months of purchase.
*** Class A shares are subject to a maximum front-end sales load of 2.50% on purchases up to $250,000. The shares are also subject to a deferred sales charge of up to 0.50% on purchases of $250,000 or more purchased without a front-end sales load and redeemed within 12 months of purchase.
The Total Annual Fund Operating Expenses for Class R, Class I, Class C and Class A are 1.99%, 1.74%, 2.74% and 1.99%, respectively.
The HFRI Event Driven: Merger Arbitrage Index is an index consisting of merger arbitrage strategies which employ an investment process primarily focused on opportunities in equity and equity related instruments of companies which are currently engaged in a corporate transaction. Merger Arbitrage involves primarily announced transactions, typically with limited or no exposure to situations which pre-, post-date or situations in which no formal announcement is expected to occur. Opportunities are frequently presented in cross border, collared and international transactions which incorporate multiple geographic regulatory institutions, with typically involve minimal exposure to corporate credits.
The S&P 500® Index is an unmanaged index consisting of 500 stocks.
The Barclays Capital U.S. Aggregate Bond Index is a market value-weighted index of investment grade fixed-rated debt issues, including government, corporate, asset-backed and mortgage-backed securities with a maturity of one year or more.
An investor may not invest directly in an index.
| | |
| Annual Report | May 31, 2014 | | 7 |
| | |
| The Arbitrage Fund | | Portfolio Information (continued) |
May 31, 2014 (Unaudited)
Growth of $10,000 Investment
| | | | |
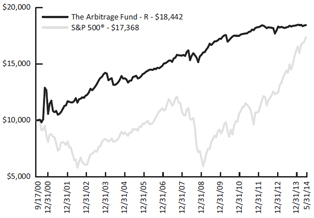 | | The chart represents historical performance of a hypothetical investment of $10,000 in the Class R shares of the Fund since inception. Past performance does not guarantee future results. This chart does not reflect the deduction of taxes that a shareholder would pay on Fund distributions or the redemption of Fund shares. | | |
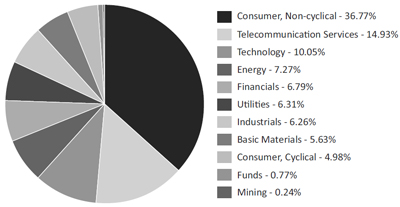
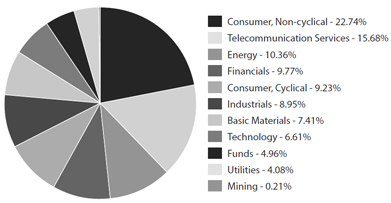
Sector Weighting
The following chart shows the sector weightings of the Arbitrage Fund’s investments in common stock, exchange-traded funds and limited partnerships as of the report date.
| | |
| 8 | | www.arbitragefunds.com | 1-800-295-4485 |
| | |
| The Arbitrage Fund | | Portfolio of Investments |
May 31, 2014
| | | | | | | | |
| | | Shares | | | Value | |
| |
COMMON STOCKS - 87.88% | | | | | | | | |
Aerospace & Defense - 0.00%(a) | | | | | | | | |
Allied Defense Group, Inc.(b)(c)(d) | | | 398,319 | | | $ | 21,230 | |
| | | | | | | | |
| | |
Banks - 1.27% | | | | | | | | |
1st United Bancorp, Inc. | | | 1,350,921 | | | | 11,280,190 | |
OmniAmerican Bancorp, Inc. | | | 542,683 | | | | 13,062,380 | |
Wing Hang Bank Ltd. | | | 474,723 | | | | 7,580,432 | |
| | | | | | | | |
| | | | | | | 31,923,002 | |
| | | | | | | | |
| | |
Biotechnology - 0.62% | | | | | | | | |
Chelsea Therapeutics International Ltd.(b)(e) | | | 2,379,228 | | | | 15,536,359 | |
| | | | | | | | |
| | |
Building Materials - 1.00% | | | | | | | | |
Texas Industries, Inc.(b) | | | 293,668 | | | | 25,223,145 | |
| | | | | | | | |
| | |
Diversified Financial Services - 0.66% | | | | | | | | |
DFC Global Corp.(b) | | | 1,463,602 | | | | 13,713,951 | |
SFG Australia Ltd. | | | 788,912 | | | | 640,589 | |
SWS Group, Inc.(b) | | | 325,302 | | | | 2,335,668 | |
| | | | | | | | |
| | | | | | | 16,690,208 | |
| | | | | | | | |
| | |
Electric - 7.58% | | | | | | | | |
Pepco Holdings, Inc. | | | 2,360,197 | | | | 65,377,457 | |
UNS Energy Corp.(f) | | | 2,064,333 | | | | 125,036,650 | |
| | | | | | | | |
| | | | | | | 190,414,107 | |
| | | | | | | | |
| | |
Electronics - 0.61% | | | | | | | | |
Zygo Corp.(b) | | | 793,105 | | | | 15,243,478 | |
| | | | | | | | |
| | |
Engineering & Construction - 5.21% | | | | | | | | |
Foster Wheeler AG(f) | | | 3,866,552 | | | | 130,921,451 | |
| | | | | | | | |
| | |
Food - 10.66% | | | | | | | | |
Hillshire Brands Co.(e) | | | 1,414,000 | | | | 75,337,920 | |
Loblaw Cos. Ltd. | | | 1,600,090 | | | | 67,439,005 | |
Pinnacle Foods, Inc. | | | 23,545 | | | | 737,194 | |
Safeway, Inc.(f) | | | 3,621,345 | | | | 124,356,987 | |
| | | | | | | | |
| | | | | | | 267,871,106 | |
| | | | | | | | |
| | |
Gas - 0.33% | | | | | | | | |
Envestra Ltd. | | | 6,483,495 | | | | 8,236,208 | |
| | | | | | | | |
See Notes to Financial Statements.
| | |
| Annual Report | May 31, 2014 | | 9 |
| | |
| The Arbitrage Fund | | Portfolio of Investments (continued) |
May 31, 2014
| | | | | | | | |
| | | Shares | | | Value | |
| |
COMMON STOCKS - 87.88% (Continued) | | | | | | | | |
Healthcare - Products - 2.17% | | | | | | | | |
Nordion, Inc.(b)(f) | | | 4,552,875 | | | $ | 54,406,856 | |
| | | | | | | | |
| | |
Healthcare - Services - 4.86% | | | | | | | | |
Emeritus Corp.(b)(f) | | | 3,907,361 | | | | 122,222,252 | |
| | | | | | | | |
| | |
Home Builders - 0.19% | | | | | | | | |
BWG Homes ASA | | | 1,981,300 | | | | 4,855,559 | |
| | | | | | | | |
| | |
Internet - 1.21% | | | | | | | | |
Vocus, Inc.(b) | | | 1,697,026 | | | | 30,512,527 | |
| | | | | | | | |
| | |
Media - 8.00% | | | | | | | | |
DIRECTV(b) | | | 740,108 | | | | 61,014,504 | |
Sirius XM Holdings, Inc.(b)(e) | | | 8,914,700 | | | | 29,240,216 | |
Time Warner Cable, Inc.(f) | | | 784,281 | | | | 110,709,106 | |
| | | | | | | | |
| | | | | | | 200,963,826 | |
| | | | | | | | |
| | |
Mining - 4.39% | | | | | | | | |
Osisko Mining Corp.(b) | | | 14,643,981 | | | | 108,989,142 | |
Yancoal Australia Ltd.(b) | | | 5,778,676 | | | | 1,425,147 | |
| | | | | | | | |
| | | | | | | 110,414,289 | |
| | | | | | | | |
| | |
Oil & Gas - 5.72% | | | | | | | | |
Aurora Oil & Gas Ltd.(b) | | | 11,141,303 | | | | 43,548,256 | |
Caracal Energy, Inc.(b) | | | 3,198,622 | | | | 29,220,218 | |
EPL Oil & Gas, Inc.(b) | | | 1,157,816 | | | | 43,892,805 | |
Heritage Oil Plc(b) | | | 5,070,889 | | | | 27,012,329 | |
| | | | | | | | |
| | | | | | | 143,673,608 | |
| | | | | | | | |
| | |
Pharmaceuticals - 14.34% | | | | | | | | |
Actavis Plc(b)(e) | | | 4,100 | | | | 867,314 | |
Forest Laboratories, Inc.(b)(f) | | | 2,883,598 | | | | 273,307,418 | |
Furiex Pharmaceuticals, Inc.(b)(e) | | | 412,230 | | | | 42,608,093 | |
Questcor Pharmaceuticals, Inc.(e) | | | 483,786 | | | | 43,603,632 | |
| | | | | | | | |
| | | | | | | 360,386,457 | |
| | | | | | | | |
| | |
Retail - 6.04% | | | | | | | | |
David Jones Ltd. | | | 2,180,943 | | | | 8,199,950 | |
Jos. A. Bank Clothiers, Inc.(b)(e) | | | 2,209,673 | | | | 143,518,261 | |
| | | | | | | | |
| | | | | | | 151,718,211 | |
| | | | | | | | |
See Notes to Financial Statements.
| | |
| 10 | | www.arbitragefunds.com | 1-800-295-4485 |
| | |
| The Arbitrage Fund | | Portfolio of Investments (continued) |
May 31, 2014
| | | | | | | | |
| | | Shares | | | Value | |
| |
COMMON STOCKS - 87.88% (Continued) | | | | | | | | |
Savings & Loans - 2.82% | | | | | | | | |
Hudson City Bancorp, Inc.(f) | | | 7,259,231 | | | $ | 70,922,687 | |
| | | | | | | | |
| | |
Semiconductors - 8.15% | | | | | | | | |
Aeroflex Holding Corp.(b) | | | 2,292,961 | | | | 24,030,231 | |
Tokyo Electron Ltd., Unsponsored ADR | | | 5,548,050 | | | | 83,831,036 | |
TriQuint Semiconductor, Inc.(b)(f) | | | 6,238,631 | | | | 97,073,098 | |
| | | | | | | | |
| | | | | | | 204,934,365 | |
| | | | | | | | |
| | |
Software - 0.81% | | | | | | | | |
ReadSoft AB, Class B | | | 849,089 | | | | 5,062,560 | |
Schawk, Inc.(f) | | | 756,532 | | | | 15,357,600 | |
| | | | | | | | |
| | | | | | | 20,420,160 | |
| | | | | | | | |
| | |
Telecommunications - 1.22% | | | | | | | | |
Cbeyond, Inc.(b)(f) | | | 1,875,493 | | | | 18,511,116 | |
Ziggo N.V. | | | 255,362 | | | | 12,039,006 | |
| | | | | | | | |
| | | | | | | 30,550,122 | |
| | | | | | | | |
| | |
Trucking & Leasing - 0.02% | | | | | | | | |
Goodpack Ltd. | | | 237,657 | | | | 462,316 | |
| | | | | | | | |
| | |
TOTAL COMMON STOCKS (Cost $2,144,365,871) | | | | | | | 2,208,523,529 | |
| | | | | | | | |
| | |
LIMITED PARTNERSHIPS - 0.47% | | | | | | | | |
Chemicals - 0.23% | | | | | | | | |
PetroLogistics LP | | | 400,771 | | | | 5,775,110 | |
| | | | | | | | |
| | |
Media - 0.24% | | | | | | | | |
LIN Media LLC, Class A(b) | | | 244,209 | | | | 6,139,415 | |
| | | | | | | | |
| | |
TOTAL LIMITED PARTNERSHIPS (Cost $12,074,653) | | | | | | | 11,914,525 | |
| | | | | | | | |
| | |
RIGHTS - 0.31% | | | | | | | | |
ArthroCare Corp., CVR(b)(c)(d) | | | 3,215,721 | | | | 1,052,505 | |
BMC Software, Inc., CVR(b)(c)(d) | | | 4,637,757 | | | | 401,630 | |
Cubist Pharmaceuticals, Inc., CPR(b)(c)(d) | | | 119,343 | | | | 44,097 | |
Cubist Pharmaceuticals, Inc., CVR(b) | | | 2,200,925 | | | | 363,153 | |
Leap Wireless International, CVR(b)(c)(d) | | | 2,231,034 | | | | 5,756,068 | |
See Notes to Financial Statements.
| | |
| Annual Report | May 31, 2014 | | 11 |
| | |
| The Arbitrage Fund | | Portfolio of Investments (continued) |
May 31, 2014
| | | | | | | | | | | | | | |
| | | | | | | | Shares | | | Value | |
| |
RIGHTS - 0.31% (Continued) | | | | | | | | | | | | | | |
Trius Therapeutics, CVR(b)(c)(d) | | | | | | | | | 1,034,403 | | | $ | 159,815 | |
| | | | | | | | | | | | | | |
| | | | |
TOTAL RIGHTS (Cost $11,773,126) | | | | | | | | | | | | | 7,777,268 | |
| | | | | | | | | | | | | | |
| | | | |
| | | Expiration
Date | | Exercise
Price | | | Contracts | | | Value | |
| |
PURCHASED OPTIONS(b)- 0.24% | | | | | | | | | | | | | | |
Put Options Purchased - 0.24% | | | | | | | | | | | | | | |
AT&T, Inc. | | 01/2015 | | $ | 35.00 | | | | 10,172 | | | $ | 2,253,098 | |
Questcor Pharmaceuticals, Inc.: | | | | | | | | | | | | | | |
| | 07/2014 | | | 80.00 | | | | 1,023 | | | | 654,720 | |
| | 07/2014 | | | 82.50 | | | | 490 | | | | 352,800 | |
| | 07/2014 | | | 85.00 | | | | 2,373 | | | | 1,874,670 | |
Sirius XM Holdings, Inc. | | 01/2015 | | | 3.00 | | | | 16,453 | | | | 320,834 | |
SPDR® S&P 500® ETF Trust: | | | | | | | | | | | | | | |
| | 06/2014 | | | 184.00 | | | | 770 | | | | 20,405 | |
| | 06/2014 | | | 185.00 | | | | 3,474 | | | | 114,642 | |
Valeant Pharmaceuticals International, Inc. | | 07/2014 | | | 125.00 | | | | 750 | | | | 318,750 | |
| | | | | | | | | | | | | | |
| | | | |
TOTAL PUT OPTIONS PURCHASED (Cost $6,724,079) | | | | | | | | | | | | | 5,909,919 | |
| | | | | | | | | | | | | | |
| | | | |
TOTAL PURCHASED OPTIONS (Cost $6,724,079) | | | | | | | | | | | | | 5,909,919 | |
| | | | | | | | | | | | | | |
| | | | |
| | | | | Yield | | | Shares | | | Value | |
| |
SHORT-TERM INVESTMENTS - 9.78% | | | | | | | | | | | | | | |
Money Market Fund | | | | | | | | | | | | | | |
State Street Institutional Liquid Reserves Fund(g) | | | | | 0.069% | | | | 245,699,350 | | | | 245,699,350 | |
| | | | | | | | | | | | | | |
| | | | |
TOTAL SHORT-TERM INVESTMENTS (Cost $245,699,350) | | | | | | | | | | | | | 245,699,350 | |
| | | | | | | | | | | | | | |
| | | | |
Total Investments - 98.68% (Cost $2,420,637,079) | | | | | | | | | | | | | 2,479,824,591 | |
| | | | |
Other Assets in Excess of Liabilities - 1.32% | | | | | | | | | | | | | 33,289,504 | |
| | | | | | | | | | | | | | |
| | | | |
NET ASSETS - 100.00% | | | | | | | | | | | | $ | 2,513,114,095 | |
| | | | | | | | | | | | | | |
See Notes to Financial Statements.
| | |
| 12 | | www.arbitragefunds.com | 1-800-295-4485 |
| | |
| The Arbitrage Fund | | Portfolio of Investments (continued) |
May 31, 2014
| (a) | Less than 0.005% of Net Assets. |
| (b) | Non-income-producing security. |
| (c) | Security considered illiquid. On May 31, 2014, the total market value of these securities was $7,435,345, representing 0.30% of net assets. |
| (d) | Security fair valued using methods determined in good faith by the Pricing Committee. As of May 31, 2014, the total market value of these securities was $7,435,345, representing 0.30% of net assets. |
| (e) | Underlying security for a written/purchased call/put option. |
| (f) | Security, or a portion of security, is being held as collateral for short sales or written option contracts. At period end, the aggregate market value of these securities was $486,406,000, representing 19.35% of net assets. |
| (g) | Rate shown is the 7-day effective yield as of May 31, 2014. |
Securities are determined to be illiquid under the procedures approved by the Funds’ Board of Trustees. Information related to the illiquid securities is as follows:
| | | | | | | | | | | | | | |
Date(s) of Purchase | | Security | | Cost | | | Market Value | | | % of Net Assets | |
| |
05/20/2010-12/28/2010 | | Allied Defense Group, Inc. | | $ | 20,354 | | | $ | 21,230 | | | | 0.00% | |
05/30/2014 | | AnthroCare Corp., CVR | | | 1,125,502 | | | | 1,052,505 | | | | 0.04 | |
09/10/2013 | | BMC Software, Inc., CVR | | | 0 | | | | 401,630 | | | | 0.02 | |
12/12/11 | | Cubist Pharmaceuticals, Inc., CPR | | | 0 | | | | 44,097 | | | | 0.00 | |
03/14/2014 | | Leap Wireless International, CVR | | | 5,756,068 | | | | 5,756,068 | | | | 0.23 | |
09/12/2013 | | Trius Therapeutics, CVR | | | 0 | | | | 159,815 | | | | 0.01 | |
| | | | | | | | | | |
| | | | | | | | $ | 7,435,345 | | | | 0.30% | |
| | | | | | | | | | |
See Notes to Financial Statements.
| | |
| Annual Report | May 31, 2014 | | 13 |
| | |
| The Arbitrage Fund | | Portfolio of Investments (continued) |
May 31, 2014
| | | | | | | | |
| SCHEDULE OF SECURITIES SOLD SHORT | | Shares | | | Value | |
| |
COMMON STOCKS - (35.89%) | | | | | | | | |
Banks - (3.66%) | | | | | | | | |
M&T Bank Corp. | | | (609,910) | | | $ | (74,024,777) | |
Southside Bancshares, Inc. | | | (242,048) | | | | (6,249,679) | |
Valley National Bancorp | | | (1,202,072) | | | | (11,648,078) | |
| | | | | | | | |
| | | | | | | (91,922,534) | |
| | | | | | | | |
| | |
Building Materials - (1.00%) | | | | | | | | |
Martin Marietta Materials, Inc. | | | (204,665) | | | | (25,132,862) | |
| | | | | | | | |
| | |
Commercial Services - (0.25%) | | | | | | | | |
Matthews International Corp., Class A | | | (155,583) | | | | (6,378,903) | |
| | | | | | | | |
| | |
Diversified Financial Services - (0.03%) | | | | | | | | |
IOOF Holdings Ltd. | | | (82,049) | | | | (648,286) | |
| | | | | | | | |
| | |
Healthcare - Services - (4.90%) | | | | | | | | |
Brookdale Senior Living, Inc. | | | (3,702,216) | | | | (123,135,704) | |
| | | | | | | | |
| | |
Insurance - (0.07%) | | | | | | | | |
Hilltop Holdings, Inc. | | | (81,220) | | | | (1,685,315) | |
| | | | | | | | |
| | |
Media - (3.98%) | | | | | | | | |
Comcast Corp., Class A | | | (1,688,173) | | | | (88,122,631) | |
Liberty Global, Inc. Plc, Class A | | | (58,275) | | | | (2,623,540) | |
Liberty Global, Inc. Plc, Series C | | | (143,767) | | | | (6,153,228) | |
Media General, Inc. | | | (177,958) | | | | (3,155,195) | |
| | | | | | | | |
| | | | | | | (100,054,594) | |
| | | | | | | | |
| | |
Mining - (2.72%) | | | | | | | | |
Agnico Eagle Mines Ltd. | | | (1,035,365) | | | | (31,501,145) | |
Agnico Eagle Mines Ltd. | | | (28,000) | | | | (846,720) | |
Osisko Spinco | | | (5,650,691) | | | | (7,400,148) | |
Yamana Gold, Inc. | | | (3,845,831) | | | | (28,693,879) | |
| | | | | | | | |
| | | | | | | (68,441,892) | |
| | | | | | | | |
| | |
Oil & Gas - (0.58%) | | | | | | | | |
Energy XXI Bermuda Ltd. | | | (676,003) | | | | (14,500,264) | |
| | | | | | | | |
| | |
Oil & Gas Services - (2.80%) | | | | | | | | |
AMEC Plc | | | (3,479,140) | | | | (70,447,060) | |
| | | | | | | | |
See Notes to Financial Statements.
| | |
| 14 | | www.arbitragefunds.com | 1-800-295-4485 |
| | |
| The Arbitrage Fund | | Portfolio of Investments (continued) |
May 31, 2014
| | | | | | | | |
| SCHEDULE OF SECURITIES SOLD SHORT | | Shares | | | Value | |
| |
COMMON STOCKS - (35.89%)(Continued) | | | | | | | | |
Pharmaceuticals - (8.24%) | | | | | | | | |
Actavis Plc | | | (916,630) | | | $ | (193,903,910) | |
Mallinckrodt Plc | | | (170,824) | | | | (13,283,274) | |
| | | | | | | | |
| | | | | | | (207,187,184) | |
| | | | | | | | |
| | |
Semiconductors - (3.62%) | | | | | | | | |
Applied Materials, Inc. | | | (4,507,714) | | | | (91,010,746) | |
| | | | | | | | |
| | |
Telecommunications - (4.04%) | | | | | | | | |
AT&T, Inc. | | | (89,485) | | | | (3,174,033) | |
RF Micro Devices, Inc. | | | (10,441,224) | | | | (98,251,918) | |
| | | | | | | | |
| | | | | | | (101,425,951) | |
| | | | | | | | |
TOTAL COMMON STOCKS (Proceeds $861,321,290) | | | | | | | (901,971,295) | |
| | | | | | | | |
| | |
EXCHANGE-TRADED FUNDS - (0.96%) | | | | | | | | |
Equity Fund - (0.96%) | | | | | | | | |
SPDR® S&P 500® ETF Trust | | | (125,545) | | | | (24,183,733) | |
| | | | | | | | |
| | |
TOTAL EXCHANGE-TRADED FUNDS (Proceeds $22,447,844) | | | | | | | (24,183,733) | |
| | | | | | | | |
| | |
TOTAL SECURITIES SOLD SHORT (Proceeds $883,769,134) | | | | | | $ | (926,155,028) | |
| | | | | | | | |
| | | | | | | | | | | | | | |
SCHEDULE OF WRITTEN OPTIONS | | Expiration
Date | | Exercise Price | | | Contracts | | | Value | |
| |
Written Call Options | | | | | | | | | | | | | | |
Actavis Plc: | | | | | | | | | | | | | | |
| | 06/2014 | | $ | 195.00 | | | | (122) | | | $ | (211,670) | |
| | 06/2014 | | | 200.00 | | | | (122) | | | | (154,940) | |
| | 06/2014 | | | 205.00 | | | | (166) | | | | (141,930) | |
Chelsea Therapeutics International Ltd. | | 09/2014 | | | 6.00 | | | | (47) | | | | (2,820) | |
Furiex Pharmaceuticals, Inc.: | | | | | | | | | | | | | | |
| | 06/2014 | | | 105.00 | | | | (120) | | | | (8,100) | |
| | 07/2014 | | | 105.00 | | | | (264) | | | | (13,200) | |
Hillshire Brands Co. | | 06/2014 | | | 55.00 | | | | (722) | | | | (59,565) | |
Jos. A. Bank Clothiers, Inc. | | 07/2014 | | | 65.00 | | | | (719) | | | | (1,797) | |
See Notes to Financial Statements.
| | |
| Annual Report | May 31, 2014 | | 15 |
| | |
| The Arbitrage Fund | | Portfolio of Investments (continued) |
May 31, 2014
| | | | | | | | | | | | | | |
SCHEDULE OF WRITTEN OPTIONS | | Expiration
Date | | Exercise Price | | | Contracts | | | Value | |
| |
Written Call Options (Continued) | | | | | | | | | | | | | | |
Mallinckrodt Plc: | | | | | | | | | | | | | | |
| | 06/2014 | | �� $ | 80.00 | | | | (85) | | | $ | (7,863) | |
| | 06/2014 | | | 81.00 | | | | (165) | | | | (14,850) | |
| | 06/2014 | | | 78.00 | | | | (47) | | | | (10,927) | |
| | 06/2014 | | | 79.00 | | | | (48) | | | | (8,400) | |
| | 06/2014 | | | 80.00 | | | | (47) | | | | (6,463) | |
| | 06/2014 | | | 82.00 | | | | (164) | | | | (27,470) | |
| | 06/2014 | | | 80.00 | | | | (1,154) | | | | (248,110) | |
Media General, Inc. | | 06/2014 | | | 17.50 | | | | (140) | | | | (11,550) | |
Sirius XM Holdings, Inc.: | | | | | | | | | | | | | | |
| | 06/2014 | | | 3.00 | | | | (774) | | | | (21,285) | |
| | 06/2014 | | | 4.50 | | | | (35) | | | | (35) | |
| | 01/2015 | | | 4.00 | | | | (16,453) | | | | (213,889) | |
Yamana Gold, Inc. | | 06/2014 | | | 7.00 | | | | (328) | | | | (15,252) | |
| | | | | | | | | | | | | | |
| | | | |
TOTAL WRITTEN CALL OPTIONS (Premiums received $1,569,952) | | | | | | | | | | | | | (1,180,116) | |
| | | | | | | | | | | | | | |
| | | | |
Written Put Options | | | | | | | | | | | | | | |
Hillshire Brands Co. | | 06/2014 | | | 50.00 | | | | (722) | | | | (32,490) | |
Valeant Pharmaceuticals International, Inc.: | | | | | | | | | | | | | | |
| | 06/2014 | | | 120.00 | | | | (50) | | | | (6,875) | |
| | 06/2014 | | | 125.00 | | | | (325) | | | | (69,875) | |
| | | | | | | | | | | | | | |
| | | | |
TOTAL WRITTEN PUT OPTIONS (Premiums received $108,251) | | | | | | | | | | | | | (109,240) | |
| | | | | | | | | | | | | | |
| | | | |
TOTAL WRITTEN OPTIONS (Premiums received $1,678,203) | | | | | | | | | | | | $ | (1,289,356) | |
| | | | | | | | | | | | | | |
See Notes to Financial Statements.
| | |
| 16 | | www.arbitragefunds.com | 1-800-295-4485 |
| | |
| The Arbitrage Fund | | Portfolio of Investments (continued) |
May 31, 2014
EQUITY SWAP CONTRACTS
| | | | | | | | | | | | | | |
Swap Counterparty | | Reference Obligation | | Rate Paid/Received by the Fund | | Termination
Dates | | Notional
Amount | | | Unrealized
Appreciation | |
| |
Goldman, Sachs & Co. | | UNS Energy Corp. | | 1 Month-LIBOR-BBA plus 0.50 bps | | 04/14/2015 | | $ | 20,208,792 | | | $ | 71,680 | |
UBS | | Jos. A. Bank Clothiers, Inc. | | 1 Month-LIBOR-BBA plus 1.10 bps | | 12/02/2016 | | | 37,124,800 | | | | 221,450 | |
| | | | | | | | | | |
| | | | | | | | $ | 57,333,592 | | | $ | 293,130 | |
| | | | | | | | | | |
| | | | | |
Swap Counterparty | | Reference Obligation | | Rate Paid/Received by the Fund | | Termination
Dates | | Notional
Amount | | | Unrealized
Depreciation | |
| |
Goldman, Sachs & Co. | | Wolfson Microelectronics Plc | | 1 Month-LIBOR plus 0.45 bps | | 05/06/2015 | | $ | 3,252,694 | | | $ | (15,363) | |
| | | | | | | | | | |
| | | | | | | | $ | 3,252,694 | | | $ | (15,363) | |
| | | | | | | | | | |
See Notes to Financial Statements.
| | |
| Annual Report | May 31, 2014 | | 17 |
| | |
| The Arbitrage Fund | | Portfolio of Investments (continued) |
May 31, 2014
OUTSTANDING FORWARD FOREIGN CURRENCY EXCHANGE CONTRACTS
| | | | | | | | | | | | | | | | |
Contract Description | | Contracts to
Deliver/Receive | | | Purchase/
Sale
Contract | | Expiration
Date | | Current Value | | | Unrealized
Appreciation | |
| |
AUD | | | 22,330,000 | | | Purchase | | 06/16/2014 | | | 20,756,961 | | | $ | 474,231 | |
AUD | | | 20,710,000 | | | Sale | | 06/16/2014 | | | 19,251,082 | | | | 103,175 | |
CAD | | | 52,840,000 | | | Purchase | | 06/16/2014 | | | 48,711,789 | | | | 574,234 | |
CAD | | | 2,200,000 | | | Sale | | 06/16/2014 | | | 2,028,121 | | | | 2,729 | |
EUR | | | 3,170,000 | | | Purchase | | 06/16/2014 | | | 4,321,081 | | | | 11,022 | |
EUR | | | 83,418,198 | | | Sale | | 06/16/2014 | | | 113,708,775 | | | | 1,967,761 | |
GBP | | | 17,513,700 | | | Purchase | | 06/16/2014 | | | 29,352,717 | | | | 320,859 | |
GBP | | | 27,516,000 | | | Sale | | 06/16/2014 | | | 46,116,433 | | | | 298,595 | |
NOK | | | 26,430,000 | | | Sale | | 06/16/2014 | | | 4,418,316 | | | | 28,680 | |
SEK | | | 206,564,000 | | | Sale | | 06/16/2014 | | | 30,857,480 | | | | 1,353,556 | |
| | | | | | | | | | | | | | | | |
| | | | | | | | | | | | | | $ | 5,134,842 | |
| | | | | | | | | | | | | | | | |
| | | | | |
Contract Description | | Contracts to
Deliver/Receive | | | Purchase/
Sale
Contract | | Expiration
Date | | Current Value | | | Unrealized
Depreciation | |
| |
AUD | | | 67,505,813 | | | Sale | | 06/16/2014 | | | 62,750,360 | | | $ | (1,566,115) | |
CAD | | | 1,700,000 | | | Purchase | | 06/16/2014 | | | 1,567,185 | | | | (375) | |
CAD | | | 170,284,316 | | | Sale | | 06/16/2014 | | | 156,980,579 | | | | (3,634,436) | |
EUR | | | 66,922,000 | | | Purchase | | 06/16/2014 | | | 91,222,525 | | | | (1,787,089) | |
GBP | | | 53,395,000 | | | Purchase | | 06/16/2014 | | | 89,489,277 | | | | (574,656) | |
GBP | | | 35,025,000 | | | Sale | | 06/16/2014 | | | 58,701,412 | | | | (444,434) | |
HKD | | | 252,190,000 | | | Purchase | | 06/16/2014 | | | 32,529,357 | | | | (8,370) | |
HKD | | | 310,960,000 | | | Sale | | 06/16/2014 | | | 40,109,952 | | | | (42,663) | |
SEK | | | 172,554,000 | | | Purchase | | 06/16/2014 | | | 25,776,909 | | | | (1,465,488) | |
SGD | | | 580,000 | | | Sale | | 06/16/2014 | | | 462,409 | | | | (33) | |
| | | | | | | | | | | | | | | | |
| | | | | | | | | | | | | | $ | (9,523,659) | |
| | | | | | | | | | | | | | | | |
See Notes to Financial Statements.
| | |
| 18 | | www.arbitragefunds.com | 1-800-295-4485 |
| | |
| The Arbitrage Fund | | Portfolio of Investments (continued) |
May 31, 2014
| | | | |
| Country | | % of Net Assets(a) | |
| |
Canada | | | 10.35% | |
Japan | | | 3.34% | |
Australia | | | 2.47% | |
Jersey | | | 1.08% | |
Netherlands | | | 0.48% | |
Hong Kong | | | 0.30% | |
Sweden | | | 0.20% | |
Norway | | | 0.19% | |
Singapore | | | 0.02% | |
United States | | | 80.25% | |
Other Assets in Excess of Liabilities | | | 1.32% | |
| | | | |
| | | 100.00% | |
| | | | |
| (a) | These percentages represent long positions only and are not net of short positions. |
Abbreviations:
AB - Arktiebolag is the Swedish term for a limited company
ADR - American Depositary Receipt
AG - Aktiengesellschaft is a German term that refers to a corporation that is limited by shares, i.e., owned by shareholders
ASA - Allmennaksjeselskap is the Norwegian term for public limited company
AUD - Australian Dollar
BBA - British Bankers Association
bps - Basis Points
CAD - Canadian Dollar
CPR - Conditional Prepayment Rate
CVR - Contingent Value Rights
ETF - Exchange-Traded Fund
EUR - Euro
GBP - British Pound
HKD - Hong Kong Dollar
LIBOR - London Interbank Offered Rate
LLC - Limited Liability Company
LP - Limited Partnership
Ltd. - Limited
NOK - Norwegian Kronor
N.V. - Naamloze Vennootschap is the Dutch term for a public limited liability corporation
Plc - Public Limited Liability
SEK - Swedish Kronor
SGD - Singapore Dollar
S&P - Standard & Poor’s
SPDR - Standard & Poor’s Depositary Receipt
See Notes to Financial Statements.
| | |
| Annual Report | May 31, 2014 | | 19 |
May 31, 2014
The following is a summary of the inputs used as of May 31, 2014, in valuing the Arbitrage Fund’s investments carried at value:
| | | | | | | | | | | | | | | | |
| Investments in Securities at Value | | | | | | | | | | | | |
| | | Level 1 | | | Level 2 | | | Level 3 | | | Total | |
| |
Assets | | | | | | | | | | | | | | | | |
Common Stocks | | | | | | | | | | | | | | | | |
Aerospace & Defense | | $ | – | | | $ | – | | | $ | 21,230 | | | $ | 21,230 | |
Banks | | | 31,923,002 | | | | – | | | | – | | | | 31,923,002 | |
Biotechnology | | | 15,536,359 | | | | – | | | | – | | | | 15,536,359 | |
Building Materials | | | 25,223,145 | | | | – | | | | – | | | | 25,223,145 | |
Diversified Financial Services | | | 16,690,208 | | | | – | | | | – | | | | 16,690,208 | |
Electric | | | 190,414,107 | | | | – | | | | – | | | | 190,414,107 | |
Electronics | | | 15,243,478 | | | | – | | | | – | | | | 15,243,478 | |
Engineering & Construction | | | 130,921,451 | | | | – | | | | – | | | | 130,921,451 | |
Food | | | 267,871,106 | | | | – | | | | – | | | | 267,871,106 | |
Gas | | | 8,236,208 | | | | – | | | | – | | | | 8,236,208 | |
Healthcare - Products | | | 54,406,856 | | | | – | | | | – | | | | 54,406,856 | |
Healthcare - Services | | | 122,222,252 | | | | – | | | | – | | | | 122,222,252 | |
Home Builders | | | 4,855,559 | | | | – | | | | – | | | | 4,855,559 | |
Internet | | | 30,512,527 | | | | – | | | | – | | | | 30,512,527 | |
Media | | | 200,963,826 | | | | – | | | | – | | | | 200,963,826 | |
Mining | | | 110,414,289 | | | | – | | | | – | | | | 110,414,289 | |
Oil & Gas | | | 100,125,352 | | | | 43,548,256 | | | | – | | | | 143,673,608 | |
Pharmaceuticals | | | 360,386,457 | | | | – | | | | – | | | | 360,386,457 | |
Retail | | | 151,718,211 | | | | – | | | | – | | | | 151,718,211 | |
Savings & Loans | | | 70,922,687 | | | | – | | | | – | | | | 70,922,687 | |
Semiconductors | | | 204,934,365 | | | | – | | | | – | | | | 204,934,365 | |
Software | | | 20,420,160 | | | | – | | | | – | | | | 20,420,160 | |
Telecommunications | | | 30,550,122 | | | | – | | | | – | | | | 30,550,122 | |
Trucking & Leasing | | | 462,316 | | | | – | | | | – | | | | 462,316 | |
Limited Partnerships | | | 11,914,525 | | | | – | | | | – | | | | 11,914,525 | |
Rights | | | 363,153 | | | | – | | | | 7,414,115 | | | | 7,777,268 | |
Purchased Options | | | 5,909,919 | | | | – | | | | – | | | | 5,909,919 | |
Short-Term Investments | | | 245,699,350 | | | | – | | | | – | | | | 245,699,350 | |
| |
TOTAL | | $ | 2,428,840,990 | | | $ | 43,548,256 | | | $ | 7,435,345 | | | $ | 2,479,824,591 | |
| |
| | | | | | | | | | | | | | | | |
| |
| Other Financial Instruments* | | | | | | | | | | | | |
| |
Assets | | | | | | | | | | | | | | | | |
Forward Foreign Currency Exchange Contracts | | $ | – | | | $ | 5,134,842 | | | $ | – | | | $ | 5,134,842 | |
Equity Swaps | | | 293,130 | | | | – | | | | – | | | | 293,130 | |
Liabilities | | | | | | | | | | | | | | | | |
Common Stocks** | | | (894,571,147) | | | | (7,400,148) | | | | – | | | | (901,971,295) | |
Exchange-Traded Funds | | | (24,183,733) | | | | – | | | | – | | | | (24,183,733) | |
See Notes to Financial Statements.
| | |
| 20 | | www.arbitragefunds.com | 1-800-295-4485 |
May 31, 2014
| | | | | | | | | | | | | | | | |
| Investments in Securities at Value (Continued) | |
| | | Level 1 | | | Level 2 | | | Level 3 | | | Total | |
| |
Written Options | | $ | (1,289,356) | | | $ | – | | | $ | – | | | $ | (1,289,356) | |
Forward Foreign Currency Exchange Contracts | | | – | | | | (9,523,659) | | | | – | | | | (9,523,659) | |
Equity Swaps | | | (15,363) | | | | – | | | | – | | | | (15,363) | |
| |
TOTAL | | $ | (919,766,469) | | | $ | (11,788,965) | | | $ | – | | | $ | (931,555,434) | |
| |
| * | Other financial instruments are instruments such as written options, securities sold short, equity swaps and forward foreign currency exchange contracts. |
| ** | Refer to Portfolio of Investments for sector information. |
See Notes to Financial Statements.
| | |
| Annual Report | May 31, 2014 | | 21 |
May 31, 2014
The following is a reconciliation of the fair valuations using significant unobservable inputs (Level 3) for the Fund’s assets and liabilities during the year ended May 31, 2014:
| | | | | | | | | | | | | | | | | | | | | | | | | | | | | | | | | | | | |
Investments in Securities | | Balance
as of
May 31, 2013 | | | Realized
Gain | | | Change in
Unrealized
Appreciation | | | Purchases | | | Sales
Proceeds | | | Transfer
into
Level 3 | | | Transfer
out of
Level 3 | | | Balance
as of
May 31, 2014 | | | Net change in
unrealized
appreciation
included in the
Statements of
Operations
attributable to
Level 3
investments
held at
May 31, 2014 | |
| |
Common Stocks | | $ | 796,638 | | | $ | 501,769 | | | $ | 758,233 | | | $ | – | | | $ | (2,035,410) | | | $ | – | | | $ | – | | | $ | 21,230 | | | $ | 758,233 | |
Rights | | | 0 | | | | – | | | | 532,545 | | | | 6,881,570 | | | | – | | | | – | | | | – | | | | 7,414,115 | | | | 532,545 | |
| |
Total | | $ | 796,638 | | | $ | 501,769 | | | $ | 1,290,778 | | | $ | 6,881,570 | | | $ | (2,035,410) | | | $ | – | | | $ | – | | | $ | 7,435,345 | | | $ | 1,290,778 | |
| |
See Notes to Financial Statements.
| | |
| 22 | | www.arbitragefunds.com | 1-800-295-4485 |
| | |
| The Arbitrage Event-Driven Fund | | Manager Commentary |
May 31, 2014 (Unaudited)
|
The Arbitrage Event-Driven Fund | NASDAQ | AEDNX, AEDFX, AEFCX, AGEAX The Fund’s Goal and Main Investments The fund seeks to provide capital growth and absolute returns by investing in credit and equity securities involved in specific corporate events, with a focus on low volatility and low correlation relative to the broader capital markets. |
Investment Strategy
The Fund’s investment process follows a disciplined, fundamental approach that values downside protection while identifying compelling risk/reward opportunities available to us as we screen catalyst-driven corporate events, such as mergers and acquisitions, restructuring, refinancing, recapitalization, spin-offs, litigation, regulatory changes, bankruptcy, and more. We analyze these events through four core approaches: Equity Merger Arbitrage, Equity Special Situations, Credit Special Situations, and Merger-Related Credit. We seek to generate investment returns that have low volatility and low correlation compared to the broader capital markets. We do not manage against any particular benchmark, and believe that capital preservation in difficult markets is as important as generating positive returns within our low correlated, low volatility event-driven strategy. This process and approach has been an integral part of the culture at Water Island Capital since the firm’s inception.
Commentary
When we surveyed the investment landscape at the start of our fiscal year, we were cautiously optimistic that corporate activity, be it mergers, spin-offs, restructurings or refinancings, to name a few, would pick up. After all, many companies had large cash balances earning paltry returns, and there were plenty of activist investors recommending ways corporate boards could unlock value. In addition, after years of cost cutting, companies needed to find other ways to boost the bottom line.
In 2014, we fully expected a significant pick up in corporate activity, as strong market performance generally emboldens boards and corporate management to take action. Yet, the first quarter proved to be a choppy backdrop for event-driven investing. On one hand, the environment was generally favorable for fixed income, particularly corporate credit. A decrease in underlying Treasury rates, a “good-enough-for credit” economic environment, and investors’ reach for yield generally supported demand for bonds. On the other, the equity markets, which were still digesting 2013’s run, had little to cheer about. Ongoing geopolitical risks in Ukraine, the Federal Reserve’s (Fed) unexpected hawkish language, and investors’ concerns that the bull market was starting to show signs of fatigue, unnerved equity investors.
But then in the Spring animal spirits returned to the markets with a vengeance. Boards became more receptive to suggestions from activist investors, and market participants approved by bidding up shares of those companies who demonstrated creative approaches to transformation, be it through divestitures, restructurings, refinancings, Real Estate Investment Trust conversions, or other corporate actions. Furthermore, hostile offers, bear hugs and topping bids, terms not frequently heard since 2007’s private-equity-led merger and acquisition frenzy, returned to the lexicon of investors. It seemed that almost any company in a slow-growth industry was potentially a target or acquirer. While this adds uncertainty in definitively announced deals, it is a terrific backdrop to deploy our analytical prowess to determine the best way to take advantage of this atmosphere.
| | |
| Annual Report | May 31, 2014 | | 23 |
| | |
| The Arbitrage Event-Driven Fund | | Manager Commentary (continued) |
May 31, 2014 (Unaudited)
Fiscal Year Highlights
In fiscal 2014, the Arbitrage Event-Driven Fund returned 5.75%. The results were predominantly derived from companies residing in the Americas. In terms of sectors, telecommunication services and financials led the way, contributing 45% of the returns, while consumer discretionary and utilities added the least to results. Our three substrategies—merger arbitrage, equity special situations and credit opportunities—generally contributed equally to performance, providing 28%, 35% and 37% of returns, respectively.
Our focus on idiosyncratic situations can be seen in our investment in Globalstar (GSAT), which provides mobile satellite services (MSS) including global voice and data communications. When we conducted our initial research on the company, GSAT had been in the process of restructuring its balance sheet due to a crucial near-term maturity for its convertible bonds. At the same time, however, GSAT was in the process of petitioning the Federal Communications Commission (FCC) to begin the approval process which would enable GSAT to convert a portion of its MSS spectrum in order to create a terrestrial network. The network that GSAT envisioned had the potential to free-up the nation’s WiFi “traffic jams” which implied significant revenue opportunities for the company.
After valuing corporate assets, understanding the motivations of management and creditors, assessing the likelihood of receiving FCC approval, and analyzing the value created by various bond restructuring scenarios, we purchased GSAT’s 5.75% Convertible Notes in February and March of 2013. In May, GSAT offered to exchange the Notes for a combination of cash, new 8% convertible senior notes, and common equity in the company. While the FCC has not formally approved GSAT’s request to convert spectrum, we are now at advanced stages of the FCC approval process, and believe the company will receive approval by the end of 2014. Thus far, our stock and bond holdings in GSAT have been strong contributors to performance.
Another highlight is Genworth Financial (GNW), which has been an investment since the end of 2012. The company provides insurance and investment products to U.S. retail and institutional customers, mortgage insurance in Canada, Australia, and Europe, and lifestyle protection products in Europe. Since our initial investment, GNW has effectively executed on several significant catalysts: the naming of a permanent CEO following the abrupt resignation of his predecessor; the successful divestment of non-core businesses, including its wealth management and alternative investments businesses; and the initial public offering of its Australian mortgage unit. A number of value-enhancing catalysts remain, including the potential for a return of capital to shareholders once GNW’s balance sheet is fully repaired. Thus, despite a sizeable appreciation since our initial investment in late 2012, we continue to see upside in the stock and retain a position in our portfolio.
Another top contributor during the year was our investment in the surplus notes of bond insurance companies Ambac Financial Group and Syncora Holdings. Prior to the financial crisis, bond insurance companies insured or “wrapped” pools of mortgages against the risk of default. As part of this securitization process, the mortgage originators provide guarantees, known as representations and warranties, that these mortgages meet an agreed-upon level of underwriting due diligence and credit-worthiness. As the financial crisis ensued and mortgage defaults skyrocketed, bond insurers came under serious financial stress because they were responsible for paying out claims to banks and investors for defaulted securities. However, the bond insurers claimed the originators failed to meet their representation and warranty obligations, and, as a result, the bond insurers had the right to “put back” impaired loans to the underwriting banks and mortgage originators.
| | |
| 24 | | www.arbitragefunds.com | 1-800-295-4485 |
| | |
| The Arbitrage Event-Driven Fund | | Manager Commentary (continued) |
May 31, 2014 (Unaudited)
Through prior investments, we had analyzed, and were familiar with, monoline insurance company litigation against mortgage underwriters. We believed precedent court rulings and legal settlements supported the respective cases of Ambac and Syncora to receive close to 100% of damage claims against the banks in outstanding court cases. Our analysis concluded that proceeds from expected counterparty settlements would cover Ambac and Syncora surplus notes by 3.9 and 1.5 times, respectively. The notes were trading at significant discounts to their accreted value, and offered a compelling risk/reward profile. Consequently, we purchased the notes at attractive prices, and have since seen our positions rise in value as positive news flow has given investors higher conviction over future settlements.
The largest drag on performance during the past year, besides the market hedges we employ as portfolio insurance, was our relative-value position where we went long the shares of General Motors (GM) while simultaneously shorting the shares of rival Ford. GM’s well-publicized recall of 29 million of its vehicles overwhelmed the many catalysts and improving fundamentals we believed would narrow the valuation gap between the two automakers. We still hold this relative-value position. We believe once the recall is addressed, investors will return to focus on GM’s attractive attributes. Other detractors to the portfolio this fiscal year included the aforementioned positions in Sirus XM and Cooper Tires’ failed transaction with India’s Apollo Tyre (see Arbitrage Fund commentary for more details).
Outlook
We believe it is a terrific time to be event-driven investors. We have receptive markets ready to fund IPOs, secondary offerings, private placements, lines of credit, high yield debt and convertible securities, just to name a few, along with eager investors. We have numerous activists agitating for change and corporate managements becoming even more receptive to their ideas for unleashing shareholder value.
We also fully understand that at current valuations investors may not be well compensated for increased regulatory and political scrutiny on deals, geopolitical turmoil, an aging bull market or any extraordinary event that may shake confidence.
We will stay true to our discipline of capitalizing on corporate actions by understanding the rationale and underlying complexities of each event, sharing insights between our teams, using hedges to mitigate market influence, and building well-diversified portfolios. We believe through this approach, the Arbitrage Event-Driven Fund can generate attractive long-term results with lower volatility and correlation to broader markets.
Sincerely,
The Investment Team at Water Island Capital
| | |
| Annual Report | May 31, 2014 | | 25 |
| | |
| The Arbitrage Event-Driven Fund | | Portfolio Information |
May 31, 2014 (Unaudited)
Performance (annualized returns as of May 31, 2014)
| | | | |
| | | One Year | | Since Inception* |
Arbitrage Event-Driven Fund, Class R | | 5.75% | | 3.76% |
Arbitrage Event-Driven Fund, Class I | | 6.02% | | 4.01% |
Arbitrage Event-Driven Fund, Class C** | | 4.05% | | 3.68% |
Arbitrage Event-Driven Fund, Class A*** | | 2.40% | | 2.40% |
HFRI Event Driven Index | | 8.76% | | 6.98% |
Barclays Capital US Aggregate Bond Index | | 2.71% | | 3.36% |
Current performance may be higher or lower than performance quoted above. Any performance data quoted represents past performance, and the investment return and principal value of an investment in the Fund will fluctuate so that an investor’s shares, when redeemed, may be worth more or less than their original cost. Past performance is no guarantee of future results. Returns do not reflect a 2% redemption fee for shares that are redeemed from the fund within 30 days of purchase, which, if reflected, would reduce the performance quoted. Returns shown above include the reinvestment of all dividends and capital gains. Contractual fee waivers are currently in effect. Without such fee waivers, performance numbers would be reduced. You can obtain performance data current to the most recent month end by calling 1-800-295-4485 or going to www.arbitragefunds.com.
* Class R and Class I inception: 10/1/10; Class C inception: 6/1/12; Class A inception: 6/1/13.
** Class C shares are subject to a 1.00% contingent deferred sales charge on all purchases redeemed in 12 months of purchase.
*** Class A shares are subject to a maximum front-end sales load of 3.25% on purchases up to $500,000. The shares are also subject to a deferred sales charge of up to 1.00% on purchases of $500,000 or more purchased without a front-end sales load and redeemed within 18 months of purchase.
The Total Annual Fund Operating Expenses for Class R, Class I, Class C and Class A are 2.55%, 2.30%, 3.30% and 2.55%, respectively. The Advisor has agreed to waive fees in excess of 1.69%, 1.44%, 2.44% and 1.69% for Class R, Class I, Class C and Class A, respectively, until at least August 31, 2016.
The HFRI Event Driven Index is an index of companies currently or prospectively involved in corporate transactions of a wide variety including but not limited to mergers, restructurings, financial distress, tender offers, shareholder buybacks, debt exchanges, security issuance or other capital structure adjustments. Security types can range from most senior in the capital structure to most junior or subordinated and frequently involve additional derivative securities. Event-Driven exposure includes a combination of sensitivities to equity markets, credit markets and idiosyncratic, company-specific developments.
The Barclays Capital U.S. Aggregate Bond Index is a market value-weighted index of investment-grade fixed-rated debt issues, including government, corporate, asset-backed and mortgage-backed securities with a maturity of one year or more.
An investor may not invest directly in an index.
| | |
| 26 | | www.arbitragefunds.com | 1-800-295-4485 |
| | |
| The Arbitrage Event-Driven Fund | | Portfolio Information (continued) |
May 31, 2014 (Unaudited)
Growth of $10,000 Investment
| | | | |
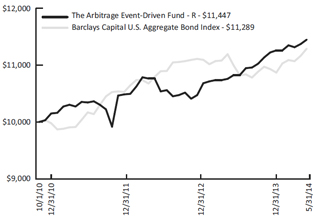 | | The chart represents historical performance of a hypothetical investment of $10,000 in the Class R shares of the Fund since inception. Past performance does not guarantee future results. This chart does not reflect the deduction of taxes that a shareholder would pay on Fund distributions or the redemption of Fund shares. | | |
Sector Weighting
The following chart shows the sector weightings of the Arbitrage Event-Driven Fund’s investments in common stock, preferred stock, corporate bonds, convertible corporate bonds, exchange-traded funds and limited partnerships as of the report date.
| | |
| Annual Report | May 31, 2014 | | 27 |
| | |
| The Arbitrage Event-Driven Fund | | Portfolio of Investments |
May 31, 2014
| | | | | | | | |
| | | Shares | | | Value | |
| |
COMMON STOCKS - 56.34% | | | | | | | | |
Aerospace & Defense - 0.38% | | | | | | | | |
Allied Defense Group, Inc.(a)(b)(c) | | | 5,000 | | | $ | 266 | |
B/E Aerospace, Inc.(a) | | | 19,862 | | | | 1,921,649 | |
| | | | | | | | |
| | | | | | | 1,921,915 | |
| | | | | | | | |
| | |
Airlines - 1.25% | | | | | | | | |
American Airlines Group, Inc.(a)(d) | | | 156,903 | | | | 6,301,224 | |
| | | | | | | | |
| | |
Auto Manufacturers - 0.80% | | | | | | | | |
General Motors Co.(d)(e) | | | 116,996 | | | | 4,045,722 | |
| | | | | | | | |
| | |
Biotechnology - 0.56% | | | | | | | | |
Chelsea Therapeutics International Ltd.(a)(e) | | | 434,520 | | | | 2,837,416 | |
| | | | | | | | |
| | |
Building Materials - 0.35% | | | | | | | | |
Armstrong World Industries, Inc.(a) | | | 33,611 | | | | 1,783,736 | |
| | | | | | | | |
| | |
Coal - 1.71% | | | | | | | | |
Alpha Natural Resources, Inc.(a) | | | 4,600 | | | | 15,548 | |
CONSOL Energy, Inc.(d)(e) | | | 113,553 | | | | 5,015,636 | |
Peabody Energy Corp. | | | 220,317 | | | | 3,560,323 | |
| | | | | | | | |
| | | | | | | 8,591,507 | |
| | | | | | | | |
| | |
Commercial Services - 0.11% | | | | | | | | |
Civeo Corp.(a)(f) | | | 23,024 | | | | 530,933 | |
| | | | | | | | |
| | |
Diversified Financial Services - 0.65% | | | | | | | | |
DFC Global Corp.(a) | | | 150,088 | | | | 1,406,324 | |
Outerwall, Inc.(a) | | | 26,142 | | | | 1,849,024 | |
| | | | | | | | |
| | | | | | | 3,255,348 | |
| | | | | | | | |
| | |
Electric - 4.49% | | | | | | | | |
NRG Energy, Inc.(d)(e) | | | 35,400 | | | | 1,261,656 | |
Pepco Holdings, Inc. | | | 177,551 | | | | 4,918,163 | |
UNS Energy Corp.(d) | | | 270,709 | | | | 16,396,844 | |
| | | | | | | | |
| | | | | | | 22,576,663 | |
| | | | | | | | |
| | |
Electronics - 0.13% | | | | | | | | |
Zygo Corp.(a) | | | 34,767 | | | | 668,222 | |
| | | | | | | | |
| | |
Engineering & Construction - 0.53% | | | | | | | | |
Foster Wheeler AG | | | 79,050 | | | | 2,676,633 | |
| | | | | | | | |
See Notes to Financial Statements.
| | |
| 28 | | www.arbitragefunds.com | 1-800-295-4485 |
| | |
| The Arbitrage Event-Driven Fund | | Portfolio of Investments (continued) |
May 31, 2014
| | | | | | | | |
| | | Shares | | | Value | |
| |
COMMON STOCKS - 56.34% (Continued) | | | | | | | | |
Food - 5.15% | | | | | | | | |
Hillshire Brands Co.(e) | | | 231,461 | | | $ | 12,332,242 | |
Hormel Foods Corp. | | | 2,926 | | | | 143,988 | |
Loblaw Cos. Ltd. | | | 200,471 | | | | 8,449,253 | |
Pinnacle Foods, Inc. | | | 4,130 | | | | 129,310 | |
Safeway, Inc. | | | 117,478 | | | | 4,034,195 | |
Tyson Foods, Inc., Class A | | | 19,011 | | | | 807,207 | |
| | | | | | | | |
| | | | | | | 25,896,195 | |
| | | | | | | | |
| | |
Gas - 0.05% | | | | | | | | |
Envestra Ltd. | | | 181,583 | | | | 230,671 | |
| | | | | | | | |
| | |
Healthcare - Products - 0.48% | | | | | | | | |
CareFusion Corp.(a) | | | 51,338 | | | | 2,203,941 | |
Smith & Nephew Plc, Sponsored ADR | | | 2,651 | | | | 232,678 | |
| | | | | | | | |
| | | | | | | 2,436,619 | |
| | | | | | | | |
| | |
Healthcare - Services - 2.37% | | | | | | | | |
Emeritus Corp.(a) | | | 380,523 | | | | 11,902,759 | |
| | | | | | | | |
| | |
Home Builders - 0.04% | | | | | | | | |
BWG Homes ASA | | | 90,363 | | | | 221,452 | |
| | | | | | | | |
| | |
Insurance - 1.28% | | | | | | | | |
Assured Guaranty Ltd.(d)(e) | | | 135,591 | | | | 3,311,132 | |
Genworth Financial, Inc., Class A(a)(d)(e) | | | 184,638 | | | | 3,137,000 | |
| | | | | | | | |
| | | | | | | 6,448,132 | |
| | | | | | | | |
| | |
Internet - 0.89% | | | | | | | | |
Rackspace Hosting, Inc.(a) | | | 7,534 | | | | 274,916 | |
TIBCO Software, Inc.(a) | | | 47,755 | | | | 1,027,210 | |
Vocus, Inc.(a) | | | 176,698 | | | | 3,177,030 | |
| | | | | | | | |
| | | | | | | 4,479,156 | |
| | | | | | | | |
| | |
Machinery - Diversified - 1.05% | | | | | | | | |
MAN SE | | | 2,176 | | | | 271,796 | |
Manitowoc Co., Inc.(e) | | | 184,631 | | | | 4,994,269 | |
| | | | | | | | |
| | | | | | | 5,266,065 | |
| | | | | | | | |
| | |
Media - 4.96% | | | | | | | | |
Charter Communications, Inc., Class A(a)(e) | | | 18,292 | | | | 2,618,317 | |
DIRECTV(a) | | | 8,000 | | | | 659,520 | |
Media General, Inc.(a) | | | 111,527 | | | | 1,977,374 | |
Sirius XM Holdings, Inc.(a)(d)(e) | | | 2,183,273 | | | | 7,161,135 | |
See Notes to Financial Statements.
| | |
| Annual Report | May 31, 2014 | | 29 |
| | |
| The Arbitrage Event-Driven Fund | | Portfolio of Investments (continued) |
May 31, 2014
| | | | | | | | |
| | | Shares | | | Value | |
| |
COMMON STOCKS - 56.34% (Continued) | | | | | | | | |
Media - 4.96% (Continued) | | | | | | | | |
Time Warner Cable, Inc.(d) | | | 89,003 | | | $ | 12,563,663 | |
| | | | | | | | |
| | | | | | | 24,980,009 | |
| | | | | | | | |
| | |
Mining - 3.82% | | | | | | | | |
Augusta Resource Corp.(a) | | | 130,886 | | | | 360,923 | |
Nevada Copper Corp.(a) | | | 6,725 | | | | 12,776 | |
Osisko Mining Corp.(a) | | | 2,528,490 | | | | 18,818,514 | |
Yancoal Australia Ltd.(a) | | | 131,238 | | | | 32,366 | |
| | | | | | | | |
| | | | | | | 19,224,579 | |
| | | | | | | | |
| | |
Miscellaneous Manufacturing - 1.29% | | | | | | | | |
Ingersoll-Rand Plc(d)(e) | | | 108,396 | | | | 6,484,249 | |
| | | | | | | | |
| | |
Oil & Gas - 2.28% | | | | | | | | |
Aurora Oil & Gas Ltd.(a) | | | 611,479 | | | | 2,390,101 | |
Caracal Energy, Inc.(a) | | | 152,036 | | | | 1,388,887 | |
EPL Oil & Gas, Inc.(a) | | | 77,900 | | | | 2,953,189 | |
Heritage Oil Plc(a) | | | 111,490 | | | | 593,901 | |
Ithaca Energy, Inc.(a) | | | 140,915 | | | | 322,299 | |
Noble Corp. Plc(d)(e) | | | 65,395 | | | | 2,057,327 | |
Talisman Energy, Inc.(e) | | | 169,856 | | | | 1,752,914 | |
| | | | | | | | |
| | | | | | | 11,458,618 | |
| | | | | | | | |
| | |
Oil & Gas Services - 1.65% | | | | | | | | |
National Oilwell Varco, Inc. | | | 7,189 | | | | 588,563 | |
Oil States International, Inc.(a)(e) | | | 71,858 | | | | 7,730,484 | |
| | | | | | | | |
| | | | | | | 8,319,047 | |
| | | | | | | | |
| | |
Pharmaceuticals - 8.58% | | | | | | | | |
Actavis Plc(a)(d)(e) | | | 15,505 | | | | 3,279,928 | |
Allergan, Inc. | | | 4,993 | | | | 836,128 | |
AstraZeneca Plc, Sponsored ADR | | | 12,444 | | | | 898,457 | |
Celesio AG | | | 50,747 | | | | 1,804,808 | |
Forest Laboratories, Inc.(a)(d) | | | 201,165 | | | | 19,066,419 | |
Furiex Pharmaceuticals, Inc.(a)(e) | | | 44,912 | | | | 4,642,104 | |
Mylan, Inc.(a) | | | 94,900 | | | | 4,729,816 | |
Questcor Pharmaceuticals, Inc.(e) | | | 22,519 | | | | 2,029,637 | |
Shire Plc, ADR | | | 23,527 | | | | 4,079,347 | |
Valeant Pharmaceuticals International, Inc.(a) | | | 13,616 | | | | 1,786,555 | |
| | | | | | | | |
| | | | | | | 43,153,199 | |
| | | | | | | | |
See Notes to Financial Statements.
| | |
| 30 | | www.arbitragefunds.com | 1-800-295-4485 |
| | |
| The Arbitrage Event-Driven Fund | | Portfolio of Investments (continued) |
May 31, 2014
| | | | | | | | |
| | | Shares | | | Value | |
| |
COMMON STOCKS - 56.34% (Continued) | | | | | | | | |
Real Estate - 0.43% | | | | | | | | |
Deutsche Wohnen AG(a) | | | 100,692 | | | $ | 2,175,559 | |
| | | | | | | | |
| | |
Retail - 4.05% | | | | | | | | |
Jos. A. Bank Clothiers, Inc.(a)(e) | | | 313,466 | | | | 20,359,617 | |
| | | | | | | | |
| | |
Savings & Loans - 0.72% | | | | | | | | |
Hudson City Bancorp, Inc.(d) | | | 369,164 | | | | 3,606,732 | |
| | | | | | | | |
| | |
Semiconductors - 3.21% | | | | | | | | |
Entegris, Inc.(a) | | | 126,913 | | | | 1,455,692 | |
Tokyo Electron Ltd., Unsponsored ADR(d) | | | 971,136 | | | | 14,673,865 | |
| | | | | | | | |
| | | | | | | 16,129,557 | |
| | | | | | | | |
| | |
Software - 0.07% | | | | | | | | |
ReadSoft AB, Class B | | | 58,367 | | | | 348,004 | |
| | | | | | | | |
| | |
Telecommunications - 3.01% | | | | | | | | |
Cbeyond, Inc.(a) | | | 200,931 | | | | 1,983,189 | |
DigitalGlobe, Inc.(a)(d) | | | 139,367 | | | | 4,231,182 | |
HC2 Holdings, Inc. | | | 45,748 | | | | 185,279 | |
Juniper Networks, Inc.(a)(d) | | | 166,098 | | | | 4,062,757 | |
T-Mobile US, Inc.(a)(d) | | | 48,239 | | | | 1,656,045 | |
Verizon Communications, Inc.(d) | | | 45,136 | | | | 2,254,995 | |
Ziggo N.V. | | | 16,428 | | | | 774,496 | |
| | | | | | | | |
| | | | | | | 15,147,943 | |
| | | | | | | | |
| | |
TOTAL COMMON STOCKS (Cost $273,009,478) | | | | | | | 283,457,481 | |
| | | | | | | | |
| | |
LIMITED PARTNERSHIPS - 0.12% | | | | | | | | |
Chemicals - 0.12% | | | | | | | | |
PetroLogistics LP | | | 40,151 | | | | 578,576 | |
| | | | | | | | |
| | |
TOTAL LIMITED PARTNERSHIPS (Cost $575,480) | | | | | | | 578,576 | |
| | | | | | | | |
See Notes to Financial Statements.
| | |
| Annual Report | May 31, 2014 | | 31 |
| | |
| The Arbitrage Event-Driven Fund | | Portfolio of Investments (continued) |
May 31, 2014
| | | | | | | | | | | | | | | | |
| | | | | | | | | Shares | | | Value | |
| |
PREFERRED STOCKS - 0.08% | | | | | | | | | | | | | | | | |
Real Estate Investment Trusts - 0.08% | | | | | | | | | | | | | | | | |
American Realty Capital Properties, Inc., Series F, 6.700% | | | | | | | | | | | 17,650 | | | $ | 422,717 | |
| | | | | | | | | | | | | | | | |
| | | | |
TOTAL PREFERRED STOCKS (Cost $372,525) | | | | | | | | | | | | | | | 422,717 | |
| | | | | | | | | | | | | | | | |
| | | | |
RIGHTS - 0.06% | | | | | | | | | | | | | | | | |
ArthroCare Corp., CVR(a)(b)(c) | | | | | | | | | | | 157,791 | | | | 51,645 | |
BMC Software, Inc., CVR(a)(b)(c) | | | | | | | | | | | 49,764 | | | | 4,309 | |
Cubist Pharmaceuticals, Inc., CPR(a)(b)(c) | | | | | | | | | | | 34,500 | | | | 12,748 | |
Cubist Pharmaceuticals, Inc., CVR(a) | | | | | | | | | | | 121,458 | | | | 20,041 | |
Leap Wireless International, CVR(a)(b)(c) | | | | | | | | | | | 81,078 | | | | 209,181 | |
Trius Therapeutics, CVR(a)(b)(c) | | | | | | | | | | | 103,378 | | | | 15,972 | |
| | | | | | | | | | | | | | | | |
| | | | |
TOTAL RIGHTS (Cost $532,904) | | | | | | | | | | | | | | | 313,896 | |
| | | | | | | | | | | | | | | | |
| | | | |
| | | Maturity Date | | | Rate | | | Principal
Amount | | | Value | |
| |
BANK LOANS - 3.73% | | | | | | | | | | | | | | | | |
Cengage Learning Acquisitions, Inc.(g) | | | 03/06/2020 | | | | 7.000 | % | | $ | 4,750,000 | | | $ | 4,824,813 | |
FairPoint Communications, Inc.(g) | | | 02/14/2019 | | | | 7.500 | % | | | 2,686,432 | | | | 2,778,966 | |
Station Casinos(g) | | | 03/01/2020 | | | | 4.250 | % | | | 2,505,452 | | | | 2,512,881 | |
Vantage Drilling Co.(g) | | | 03/28/2019 | | | | 5.750 | % | | | 5,903,747 | | | | 5,877,948 | |
Zayo Bandwidth LLC(g) | | | 06/14/2019 | | | | 4.000 | % | | | 2,756,087 | | | | 2,756,087 | |
| | | | | | | | | | | | | | | | |
| | | | |
TOTAL BANK LOANS (Cost $18,864,561) | | | | | | | | | | | | | | | 18,750,695 | |
| | | | | | | | | | | | | | | | |
| | | | |
CORPORATE BONDS - 24.34% | | | | | | | | | | | | | | | | |
Aerospace & Defense - 1.36% | | | | | | | | | | | | | | | | |
B/E Aerospace, Inc. | | | | | | | | | | | | | | | | |
| | | 10/01/2020 | | | | 6.875 | % | | | 891,000 | | | | 968,962 | |
| | | 04/01/2022 | | | | 5.250 | % | | | 1,114,000 | | | | 1,183,625 | |
TransDigm, Inc. | | | 12/15/2018 | | | | 7.750 | % | | | 4,380,000 | | | | 4,708,500 | |
| | | | | | | | | | | | | | | | |
| | | | | | | | | | | | | | | 6,861,087 | |
| | | | | | | | | | | | | | | | |
See Notes to Financial Statements.
| | |
| 32 | | www.arbitragefunds.com | 1-800-295-4485 |
| | |
| The Arbitrage Event-Driven Fund | | Portfolio of Investments (continued) |
May 31, 2014
| | | | | | | | | | | | | | | | |
| | | Maturity
Date | | | Rate | | | Principal
Amount | | | Value | |
| |
CORPORATE BONDS - 24.34% (Continued) | | | | | | | | | |
Banks - 1.60% | | | | | | | | | | | | | | | | |
PNC Preferred Funding Trust II(h)(i) | |
| Perpetual
Maturity |
| | | 1.456 | % | | $ | 4,712,000 | | | $ | 4,570,640 | |
Popular North America Capital Trust I | | | 09/15/2034 | | | | 6.564 | % | | | 654,000 | | | | 539,550 | |
Wells Fargo Capital X | | | 12/15/2036 | | | | 5.950 | % | | | 2,867,000 | | | | 2,917,172 | |
| | | | | | | | | | | | | | | | |
| | | | | | | | | | | | | | | 8,027,362 | |
| | | | | | | | | | | | | | | | |
Building Materials - 2.07% | | | | | | | | | | | | | | | | |
Texas Industries, Inc. | | | 08/15/2020 | | | | 9.250 | % | | | 9,176,000 | | | | 10,391,820 | |
| | | | | | | | | | | | | | | | |
| | | | |
Diversified Financial Services - 2.08% | | | | | | | | | | | | | | | | |
National Money Mart Co. | | | 12/15/2016 | | | | 10.375 | % | | | 3,425,000 | | | | 3,583,406 | |
Prospect Holding Co. LLC / Prospect Holding Finance Co.(i) | | | 10/01/2018 | | | | 10.250 | % | | | 3,019,000 | | | | 2,928,430 | |
ROC Finance LLC(i) | | | 09/01/2018 | | | | 12.125 | % | | | 3,653,000 | | | | 3,972,638 | |
| | | | | | | | | | | | | | | | |
| | | | | | | | | | | | | | | 10,484,474 | |
| | | | | | | | | | | | | | | | |
Energy - Alternate Sources - 0.62% | | | | | | | | | | | | | | | | |
First Wind Capital LLC(i) | | | 06/01/2018 | | | | 10.250 | % | | | 2,901,000 | | | | 3,089,565 | |
| | | | | | | | | | | | | | | | |
| | | | |
Food - 1.60% | | | | | | | | | | | | | | | | |
Safeway, Inc. | | | 08/15/2017 | | | | 6.350 | % | | | 1,263,000 | | | | 1,437,950 | |
US Foods, Inc. | | | 06/30/2019 | | | | 8.500 | % | | | 6,162,000 | | | | 6,614,907 | |
| | | | | | | | | | | | | | | | |
| | | | | | | | | | | | | | | 8,052,857 | |
| | | | | | | | | | | | | | | | |
Healthcare - Services - 0.94% | | | | | | | | | | | | | | | | |
MedImpact Holdings, Inc.(i) | | | 02/01/2018 | | | | 10.500 | % | | | 4,337,000 | | | | 4,749,015 | |
| | | | | | | | | | | | | | | | |
| | | | |
Household Products & Wares - 0.37% | | | | | | | | | | | | | | | | |
American Achievement Corp.(i) | | | 04/15/2016 | | | | 10.875 | % | | | 1,805,000 | | | | 1,877,200 | |
| | | | | | | | | | | | | | | | |
| | | | |
Insurance - 1.83% | | | | | | | | | | | | | | | | |
Ambac Assurance Corp.(d)(i) | | | 06/07/2020 | | | | 5.100 | % | | | 5,302,000 | | | | 5,997,888 | |
Syncora Holdings Ltd.(h) | | | | | | | | | | | | | | | | |
| |
| Perpetual
Maturity |
| | | 5.000 | % | | | 1,122,292 | | | | 965,171 | |
| |
| Perpetual
Maturity |
| | | 6.880 | % | | | 2,724,000 | | | | 2,260,920 | |
| | | | | | | | | | | | | | | | |
| | | | | | | | | | | | | | | 9,223,979 | |
| | | | | | | | | | | | | | | | |
See Notes to Financial Statements.
| | |
| Annual Report | May 31, 2014 | | 33 |
| | |
| The Arbitrage Event-Driven Fund | | Portfolio of Investments (continued) |
May 31, 2014
| | | | | | | | | | | | | | | | |
| | | Maturity
Date | | | Rate | | | Principal
Amount | | | Value | |
| |
CORPORATE BONDS - 24.34% (Continued) | | | | | | | | | |
Media - 3.56% | | | | | | | | | | | | | | | | |
Allbritton Communications Co.(d) | | | 05/15/2018 | | | | 8.000 | % | | $ | 2,745,000 | | | $ | 2,865,094 | |
CCO Holdings LLC / CCO Holdings Capital Corp. | | | 01/15/2019 | | | | 7.000 | % | | | 2,111,000 | | | | 2,232,382 | |
Entercom Radio LLC | | | 12/01/2019 | | | | 10.500 | % | | | 411,000 | | | | 469,568 | |
LIN Television Corp. | | | 04/15/2018 | | | | 8.375 | % | | | 2,664,000 | | | | 2,813,850 | |
Nara Cable Funding Ltd.(i) | | | 12/01/2018 | | | | 8.875 | % | | | 4,109,000 | | | | 4,417,175 | |
Reader’s Digest Association, Inc.(b)(c)(g)(j) | | | 02/15/2017 | | | | 9.500 | % | | | 274,000 | | | | 109,600 | |
Univision Communications, Inc.(i) | | | 05/15/2021 | | | | 8.500 | % | | | 3,535,000 | | | | 3,879,663 | |
YPG Financing, Inc.(i) | | | 11/30/2018 | | | | 9.250 | % | | | 1,115,902 | | | | 1,109,027 | |
| | | | | | | | | | | | | | | | |
| | | | | | | | | | | | | | | 17,896,359 | |
| | | | | | | | | | | | | | | | |
Mining - 1.16% | | | | | | | | | | | | | | | | |
Prince Mineral Holding Corp. | | | 12/15/2019 | | | | 11.500 | % | | | 5,155,000 | | | | 5,818,706 | |
| | | | | | | | | | | | | | | | |
| | | | |
Oil & Gas - 3.27% | | | | | | | | | | | | | | | | |
Aurora USA Oil & Gas, Inc.(i) | | | 02/15/2017 | | | | 9.875 | % | | | 4,339,000 | | | | 4,816,290 | |
Endeavour International Corp. | | | | | | | | | | | | | | | | |
| | | 03/01/2018 | | | | 12.000 | % | | | 1,835,000 | | | | 1,761,600 | |
| | | 06/01/2018 | | | | 12.000 | % | | | 1,570,000 | | | | 1,040,125 | |
Forest Oil Corp. | | | 06/15/2019 | | | | 7.250 | % | | | 2,409,000 | | | | 2,396,955 | |
Newfield Exploration Co. | | | 05/15/2018 | | | | 7.125 | % | | | 1,507,000 | | | | 1,550,326 | |
Sabine Oil & Gas LLC / Sabine Oil & Gas Finance Corp. | | | 02/15/2017 | | | | 9.750 | % | | | 2,944,000 | | | | 3,083,840 | |
Southern Pacific Resource Corp.(i) | | | 01/25/2018 | | | | 8.750 | % | | | 2,654,000 | | | | 1,817,389 | |
| | | | | | | | | | | | | | | | |
| | | | | | | | | | | | | | | 16,466,525 | |
| | | | | | | | | | | | | | | | |
Packaging & Containers - 0.07% | | | | | | | | | | | | | | | | |
ARD Finance SA, PIK(i) | | | 06/01/2018 | | | | 11.125 | % | | | 304,215 | | | | 325,510 | |
| | | | | | | | | | | | | | | | |
| | | | |
Pharmaceuticals - 0.01% | | | | | | | | | | | | | | | | |
Savient Pharmaceuticals, Inc.(b)(c)(i)(j)(k) | | | 05/09/2019 | | | | 3.000 | % | | | 1,157,000 | | | | 25,975 | |
| | | | | | | | | | | | | | | | |
| | | | |
Real Estate Investment Trusts - 0.99% | | | | | | | | | | | | | | | | |
NorthStar Realty Finance Corp. | | | 09/30/2014 | | | | 3.000 | % | | | 5,009,000 | | | | 4,998,982 | |
| | | | | | | | | | | | | | | | |
See Notes to Financial Statements.
| | |
| 34 | | www.arbitragefunds.com | 1-800-295-4485 |
| | |
| The Arbitrage Event-Driven Fund | | Portfolio of Investments (continued) |
May 31, 2014
| | | | | | | | | | | | | | | | |
| | | Maturity
Date | | | Rate | | | Principal
Amount | | | Value | |
| |
CORPORATE BONDS - 24.34% (Continued) | | | | | | | | | | | | | | | | |
Retail - 0.68% | | | | | | | | | | | | | | | | |
Brown Shoe Co., Inc. | | | 05/15/2019 | | | | 7.125 | % | | $ | 252,000 | | | $ | 266,180 | |
Cash America International, Inc. | | | 05/15/2018 | | | | 5.750 | % | | | 885,000 | | | | 907,125 | |
Dave & Buster’s Entertainment, Inc.(i)(l) | | | 02/15/2016 | | | | 0.000 | % | | | 2,630,000 | | | | 2,235,500 | |
| | | | | | | | | | | | | | | | |
| | | | | | | | | | | | | | | 3,408,805 | |
| | | | | | | | | | | | | | | | |
Semiconductors - 0.84% | | | | | | | | | | | | | | | | |
Freescale Semiconductor, Inc. | | | 08/01/2020 | | | | 10.750 | % | | | 3,729,000 | | | | 4,246,399 | |
| | | | | | | | | | | | | | | | |
| | | | |
Telecommunications - 1.29% | | | | | | | | | | | | | | | | |
T-Mobile USA, Inc. | | | 04/28/2019 | | | | 6.464 | % | | | 4,211,000 | | | | 4,458,396 | |
Windstream Corp. | | | 09/01/2018 | | | | 8.125 | % | | | 1,934,000 | | | | 2,035,535 | |
| | | | | | | | | | | | | | | | |
| | | | | | | | | | | | | | | 6,493,931 | |
| | | | | | | | | | | | | | | | |
| | | | |
TOTAL CORPORATE BONDS (Cost $122,253,882) | | | | | | | | | | | | | | | 122,438,551 | |
| | | | | | | | | | | | | | | | |
| | | | |
CONVERTIBLE CORPORATE BONDS - 5.83% | | | | | | | | | | | | | | | | |
Auto Parts & Equipment - 0.44% | | | | | | | | | | | | | | | | |
Meritor, Inc. | | | 03/01/2026 | | | | 7.875 | % | | | 1,351,000 | | | | 2,229,994 | |
| | | | | | | | | | | | | | | | |
| | | | |
Engineering & Construction - 0.27% | | | | | | | | | | | | | | | | |
Aecon Group, Inc. | | | 09/30/2014 | | | | 7.000 | % | | | 1,449,000 | | | | 1,363,073 | |
| | | | | | | | | | | | | | | | |
| | | | |
Lodging - 1.15% | | | | | | | | | | | | | | | | |
Morgans Hotel Group Co.(d) | | | 10/15/2014 | | | | 2.375 | % | | | 5,827,000 | | | | 5,761,446 | |
| | | | | | | | | | | | | | | | |
| | | | |
Media - 0.00% | | | | | | | | | | | | | | | | |
YPG Financing, Inc., PIK | | | 11/30/2022 | | | | 8.000 | % | | | 17,710 | | | | 18,159 | |
| | | | | | | | | | | | | | | | |
| | | | |
Mining - 1.03% | | | | | | | | | | | | | | | | |
Primero Mining Corp. | | | 03/31/2016 | | | | 6.500 | % | | | 5,201,000 | | | | 5,201,000 | |
| | | | | | | | | | | | | | | | |
| | | | |
Oil & Gas - 0.78% | | | | | | | | | | | | | | | | |
BPZ Resources, Inc. | | | 10/01/2017 | | | | 8.500 | % | | | 3,362,000 | | | | 3,910,426 | |
| | | | | | | | | | | | | | | | |
| | | | |
Semiconductors - 0.06% | | | | | | | | | | | | | | | | |
Rambus, Inc. | | | 06/15/2014 | | | | 5.000 | % | | | 300,000 | | | | 301,313 | |
| | | | | | | | | | | | | | | | |
See Notes to Financial Statements.
| | |
| Annual Report | May 31, 2014 | | 35 |
| | |
| The Arbitrage Event-Driven Fund | | Portfolio of Investments (continued) |
May 31, 2014
| | | | | | | | | | | | | | | | |
| | | Maturity
Date | | | Rate | | | Principal
Amount | | | Value | |
| |
CONVERTIBLE CORPORATE BONDS - 5.83% (Continued) | | | | | |
Telecommunications - 0.31% | | | | | | | | | |
Globalstar, Inc., PIK (2.25% PIK) | | | 04/01/2028 | | | | 8.000 | % | | $ | 226,769 | | | $ | 1,222,852 | |
Nortel Networks Corp.(j) | | | 04/15/2014 | | | | 2.125 | % | | | 316,000 | | | | 322,320 | |
| | | | | | | | | | | | | | | | |
| | | | | | | | | | | | | | | 1,545,172 | |
| | | | | | | | | | | | | | | | |
Transportation - 1.79% | | | | | | | | | | | | | | | | |
DryShips, Inc. | | | 12/01/2014 | | | | 5.000 | % | | | 4,132,000 | | | | 4,059,690 | |
YRC Worldwide, Inc., Series A, PIK | | | 03/31/2015 | | | | 10.000 | % | | | 4,918,676 | | | | 4,967,863 | |
| | | | | | | | | | | | | | | | |
| | | | | | | | | | | | | | | 9,027,553 | |
| | | | | | | | | | | | | | | | |
| | | | |
TOTAL CONVERTIBLE CORPORATE BONDS (Cost $28,038,820) | | | | | | | | | | | | | | | 29,358,136 | |
| | | | | | | | | | | | | | | | |
| | | | |
| | | Expiration
Date | | | Exercise
Price | | | Contracts | | | Value | |
| |
PURCHASED OPTIONS(a)- 0.17% | | | | | | | | | | | | | | | | |
Call Options Purchased - 0.08% | | | | | | | | | | | | | | | | |
AT&T, Inc. | | | 06/2014 | | | $ | 37.00 | | | | 1,045 | | | $ | 3,658 | |
Endeavour International Corp.: | | | | | | | | | | | | | | | | |
| | | 06/2014 | | | | 5.00 | | | | 1,247 | | | | 3,117 | |
| | | 06/2014 | | | | 5.00 | | | | 1,247 | | | | 374,100 | |
| | | | | | | | | | | | | | | | |
| | | | |
TOTAL CALL OPTIONS PURCHASED (Cost $273,755) | | | | | | | | | | | | | | | 380,875 | |
| | | | | | | | | | | | | | | | |
| | | | |
Put Options Purchased - 0.09% | | | | | | | | | | | | | | | | |
AT&T, Inc. | | | 01/2015 | | | | 35.00 | | | | 108 | | | | 23,922 | |
Charter Communications, Inc. | | | 06/2014 | | | | 105.00 | | | | 531 | | | | 5,310 | |
General Motors Co. | | | 06/2014 | | | | 30.00 | | | | 692 | | | | 3,806 | |
Ingersoll-Rand Plc | | | 06/2014 | | | | 50.00 | | | | 851 | | | | 6,383 | |
Noble Corp. Plc | | | 06/2014 | | | | 25.00 | | | | 425 | | | | 1,275 | |
Oil States International, Inc. | | | 06/2014 | | | | 80.00 | | | | 446 | | | | 5,575 | |
Questcor Pharmaceuticals, Inc.: | | | | | | | | | | | | | | | | |
| | | 07/2014 | | | | 80.00 | | | | 68 | | | | 43,520 | |
| | | 07/2014 | | | | 82.50 | | | | 78 | | | | 56,160 | |
| | | 07/2014 | | | | 85.00 | | | | 79 | | | | 62,410 | |
See Notes to Financial Statements.
| | |
| 36 | | www.arbitragefunds.com | 1-800-295-4485 |
| | |
| The Arbitrage Event-Driven Fund | | Portfolio of Investments (continued) |
May 31, 2014
| | | | | | | | | | | | | | | | |
| | | Expiration
Date | | | Exercise
Price | | | Contracts | | | Value | |
| |
PURCHASED OPTIONS(a)- 0.17% (Continued) | | | | | | | | | | | | | | | | |
Put Options Purchased (Continued) | | | | | | | | | | | | | | | | |
Sirius XM Holdings, Inc. | | | 01/2015 | | | $ | 3.00 | | | | 946 | | | $ | 18,447 | |
SPDR® S&P 500® ETF Trust: | | | | | | | | | | | | | | | | |
| | | 06/2014 | | | | 182.00 | | | | 968 | | | | 17,424 | |
| | | 06/2014 | | | | 183.00 | | | | 968 | | | | 20,812 | |
| | | 06/2014 | | | | 184.00 | | | | 1,044 | | | | 27,666 | |
| | | 06/2014 | | | | 185.00 | | | | 400 | | | | 13,200 | |
| | | 07/2014 | | | | 168.00 | | | | 2,421 | | | | 37,525 | |
| | | 08/2014 | | | | 180.00 | | | | 995 | | | | 126,863 | |
| | | | | | | | | | | | | | | | |
| | | | |
TOTAL PUT OPTIONS PURCHASED (Cost $1,485,904) | | | | | | | | | | | | | | | 470,298 | |
| | | | | | | | | | | | | | | | |
| | | | |
TOTAL PURCHASED OPTIONS (Cost $1,759,659) | | | | | | | | | | | | | | | 851,173 | |
| | | | | | | | | | | | | | | | |
| | | | |
| | | | | | Yield | | | Shares | | | Value | |
| |
SHORT-TERM INVESTMENTS - 10.35% | | | | | | | | | | | | | | | | |
Time Deposits | | | | | | | | | | | | | | | | |
Euro Time Deposit | | | | | | | 0.010% | | | | 52,096,284 | | | | 52,096,284 | |
| | | | | | | | | | | | | | | | |
| | | | |
TOTAL SHORT-TERM INVESTMENTS (Cost $52,096,284) | | | | | | | | | | | | | | | 52,096,284 | |
| | | | | | | | | | | | | | | | |
| | | | |
Total Investments - 101.02% (Cost $497,503,593) | | | | | | | | | | | | | | | 508,267,509 | |
| | | | |
Liabilities in Excess of Other Assets - (1.02%) | | | | | | | | | | | | | | | (5,151,862) | |
| | | | | | | | | | | | | | | | |
| | | | |
NET ASSETS - 100.00% | | | | | | | | | | | | | | $ | 503,115,647 | |
| | | | | | | | | | | | | | | | |
| (a) | Non-income-producing security. |
| (b) | Security considered illiquid. On May 31, 2014, the total market value of these securities was $429,696, representing 0.09% of net assets. |
| (c) | Security fair valued using methods determined in good faith by the Pricing Committee. As of May 31, 2014, the total market value of these securities was $429,696, representing 0.09% of net assets. |
| (d) | Security, or a portion of security, is being held as collateral for short sales or written option contracts. At period end, the aggregate market value of those securities was $85,225,884, representing 16.94% of net assets. |
| (e) | Underlying security for a written/purchased call/put option. |
See Notes to Financial Statements.
| | |
| Annual Report | May 31, 2014 | | 37 |
| | |
| The Arbitrage Event-Driven Fund | | Portfolio of Investments (continued) |
May 31, 2014
| (f) | When-issued security. A conditional transaction in a security authorized for issuance, but not yet issued. |
| (g) | Interest rate will change at a future date. Interest rate shown reflects the rate in effect at May 31, 2014. |
| (h) | This security has no contractual maturity date, is not redeemable and contractually pays an indefinite stream of interest. |
| (i) | Security exempt from registration under Rule 144A of the Securities Act of 1933. These securities may be resold in transactions exempt from registration, normally to qualified institutional buyers. As of May 31, 2014, these securities had a total value of $51,630,611 or 10.26% of net assets. |
| (j) | Security in default on interest payments. |
| (k) | Represents a step-up bond. Rate disclosed is as of May 31, 2014. |
| (l) | Represents a zero coupon bond. |
Securities determined to be illiquid under the procedures approved by the Funds’ Board of Trustees. Information related to the illiquid securities is as follows:
| | | | | | | | | | | | | | |
Date(s) of Purchase | | Security | | Cost | | | Market Value | | | % of Net Assets | |
| |
12/31/2010-01/05/2011 | | Allied Defense Group, Inc. | | $ | 256 | | | $ | 266 | | | | 0.00% | |
05/30/2014 | | AnthroCare Corp., CVR | | | 55,227 | | | | 51,645 | | | | 0.01 | |
09/10/2013 | | BMC Software, Inc., CVR | | | 0 | | | | 4,309 | | | | 0.00 | |
12/12/11 | | Cubist Pharmaceuticals, Inc., CPR | | | 0 | | | | 12,748 | | | | 0.00 | |
03/17/2014 | | Leap Wireless International, CVR | | | 209,181 | | | | 209,181 | | | | 0.04 | |
03/21/2012-05/16/2012 | | Reader’s Digest Association, Inc. | | | 252,557 | | | | 109,600 | | | | 0.02 | |
12/12/2013-12/20/2013 | | Savient Pharmaceuticals, Inc. | | | 34,783 | | | | 25,975 | | | | 0.01 | |
09/12/2013 | | Trius Therapeutics, CVR | | | 0 | | | | 15,972 | | | | 0.01 | |
| | | | | | | | | | |
| | | | | | | | $ | 429,696 | | | | 0.09% | |
| | | | | | | | | | |
See Notes to Financial Statements.
| | |
| 38 | | www.arbitragefunds.com | 1-800-295-4485 |
| | |
| The Arbitrage Event-Driven Fund | | Portfolio of Investments (continued) |
May 31, 2014
| | | | | | | | |
| SCHEDULE OF SECURITIES SOLD SHORT | | Shares | | | Value | |
| |
COMMON STOCKS - (17.86%) | | | | | | | | |
Aerospace & Defense - (0.28%) | | | | | | | | |
United Technologies Corp. | | | (12,269) | | | $ | (1,425,903) | |
| | | | | | | | |
| | |
Airlines - (0.89%) | | | | | | | | |
Delta Air Lines, Inc. | | | (60,995) | | | | (2,434,311) | |
United Continental Holdings, Inc. | | | (45,619) | | | | (2,024,115) | |
| | | | | | | | |
| | | | | | | (4,458,426) | |
| | | | | | | | |
| | |
Auto Manufacturers - (0.30%) | | | | | | | | |
Ford Motor Co. | | | (92,022) | | | | (1,512,842) | |
| | | | | | | | |
| | |
Auto Parts & Equipment - (0.23%) | | | | | | | | |
Meritor, Inc. | | | (83,940) | | | | (1,159,211) | |
| | | | | | | | |
| | |
Banks - (0.75%) | | | | | | | | |
M&T Bank Corp. | | | (31,021) | | | | (3,765,019) | |
| | | | | | | | |
| | |
Building Materials - (0.33%) | | | | | | | | |
Lennox International, Inc. | | | (19,457) | | | | (1,652,288) | |
| | | | | | | | |
| | |
Distributors & Wholesalers - (0.33%) | | | | | | | | |
Watsco, Inc. | | | (16,230) | | | | (1,633,225) | |
| | | | | | | | |
| | |
Engineering & Construction - (0.04%) | | | | | | | | |
Aecon Group, Inc. | | | (12,415) | | | | (192,929) | |
| | | | | | | | |
| | |
Healthcare - Services - (2.41%) | | | | | | | | |
Brookdale Senior Living, Inc. | | | (365,096) | | | | (12,143,093) | |
| | | | | | | | |
| | |
Media - (1.98%) | | | | | | | | |
Comcast Corp., Class A | | | (173,756) | | | | (9,070,063) | |
Gannett Co., Inc | | | (3,916) | | | | (108,826) | |
Liberty Global, Inc. Plc, Class A | | | (3,748) | | | | (168,735) | |
Liberty Global, Inc. Plc, Series C | | | (9,251) | | | | (395,943) | |
Nexstar Broadcasting Group, Inc., Class A | | | (2,967) | | | | (137,847) | |
Sinclair Broadcast Group, Inc., Class A | | | (3,389) | | | | (100,246) | |
| | | | | | | | |
| | | | | | | (9,981,660) | |
| | | | | | | | |
| | |
Mining - (2.34%) | | | | | | | | |
Agnico Eagle Mines Ltd. | | | (178,165) | | | | (5,420,698) | |
Agnico Eagle Mines Ltd. | | | (5,500) | | | | (166,320) | |
HudBay Minerals, Inc. | | | (7,112) | | | | (62,705) | |
See Notes to Financial Statements.
| | |
| Annual Report | May 31, 2014 | | 39 |
| | |
| The Arbitrage Event-Driven Fund | | Portfolio of Investments (continued) |
May 31, 2014
| | | | | | | | |
| SCHEDULE OF SECURITIES SOLD SHORT | | Shares | | | Value | |
| |
COMMON STOCKS - (17.86%)(Continued) | | | | | | | | |
Mining - (2.34%) (Continued) | | | | | | | | |
Nevada Copper Corp. | | | (6,725) | | | $ | (12,776) | |
Osisko Spinco | | | (902,500) | | | | (1,181,915) | |
Yamana Gold, Inc. | | | (662,906) | | | | (4,945,965) | |
| | | | | | | | |
| | | | | | | (11,790,379) | |
| | | | | | | | |
| | |
Oil & Gas - (0.85%) | | | | | | | | |
Atwood Oceanics, Inc. | | | (6,794) | | | | (335,284) | |
BPZ Resources, Inc. | | | (430,454) | | | | (1,317,189) | |
Diamond Offshore Drilling, Inc. | | | (5,954) | | | | (304,011) | |
Energy XXI Bermuda Ltd. | | | (45,494) | | | | (975,846) | |
Ensco Plc, Class A | | | (6,849) | | | | (360,669) | |
Hercules Offshore, Inc. | | | (83,037) | | | | (376,988) | |
Rowan Companies Plc, Class A | | | (10,005) | | | | (309,755) | |
Seadrill Ltd. | | | (8,048) | | | | (305,824) | |
| | | | | | | | |
| | | | | | | (4,285,566) | |
| | | | | | | | |
| | |
Oil & Gas Services - (0.29%) | | | | | | | | |
AMEC Plc | | | (71,129) | | | | (1,440,249) | |
| | | | | | | | |
| | |
Pharmaceuticals - (2.79%) | | | | | | | | |
Actavis Plc | | | (64,602) | | | | (13,665,907) | |
Mallinckrodt Plc | | | (4,600) | | | | (357,696) | |
| | | | | | | | |
| | | | | | | (14,023,603) | |
| | | | | | | | |
| | |
Real Estate - (0.44%) | | | | | | | | |
Deutsche Wohnen AG | | | (100,692) | | | | (2,233,208) | |
| | | | | | | | |
| | |
Semiconductors - (3.17%) | | | | | | | | |
Applied Materials, Inc. | | | (789,044) | | | | (15,930,798) | |
| | | | | | | | |
| | |
Telecommunications - (0.44%) | | | | | | | | |
AT&T, Inc. | | | (48,025) | | | | (1,703,447) | |
Globalstar, Inc. | | | (57,015) | | | | (197,272) | |
T-Mobile US, Inc. | | | (9,200) | | | | (315,836) | |
| | | | | | | | |
| | | | | | | (2,216,555) | |
| | | | | | | | |
| | |
TOTAL COMMON STOCKS (Proceeds $86,520,985) | | | | | | | (89,844,954) | |
| | | | | | | | |
| | |
EXCHANGE-TRADED FUNDS - (5.51%) | | | | | | | | |
Equity Fund - (5.51%) | | | | | | | | |
Consumer Staples Select Sector SPDR® Fund | | | (19,832) | | | | (892,440) | |
See Notes to Financial Statements.
| | |
| 40 | | www.arbitragefunds.com | 1-800-295-4485 |
| | |
| The Arbitrage Event-Driven Fund | | Portfolio of Investments (continued) |
May 31, 2014
| | | | | | | | | | | | | | | | |
| SCHEDULE OF SECURITIES SOLD SHORT | | | | | | | | Shares | | | Value | |
| |
EXCHANGE-TRADED FUNDS - (5.51%)(Continued) | | | | | | | | | | | | | | | | |
Equity Fund - (5.51%) (Continued) | | | | | | | | | | | | | | | | |
Health Care Select Sector SPDR® Fund | | | | | | | | | | | (68,449) | | | $ | (4,091,881) | |
Industrial Select Sector SPDR® Fund | | | | | | | | | | | (29,635) | | | | (1,601,772) | |
iShares® Nasdaq Biotechnology ETF | | | | | | | | | | | (6,506) | | | | (1,558,773) | |
iShares® Russell 2000 Growth ETF | | | | | | | | | | | (31,164) | | | | (4,062,228) | |
Market Vectors® Coal ETF | | | | | | | | | | | (62,021) | | | | (1,138,085) | |
Market Vectors® Oil Service ETF | | | | | | | | | | | (46,601) | | | | (2,475,445) | |
Market Vectors® Semiconductor ETF | | | | | | | | | | | (30,807) | | | | (1,427,596) | |
SPDR® Barclays High Yield Bond ETF Trust | | | | | | | | | | | (38,240) | | | | (1,588,107) | |
SPDR® S&P 500® ETF Trust | | | | | | | | | | | (37,633) | | | | (7,249,245) | |
SPDR® S&P 500® Insurance ETF Trust | | | | | | | | | | | (23,321) | | | | (1,464,092) | |
SPDR® S&P® Metals & Mining ETF | | | | | | | | | | | (4,078) | | | | (159,980) | |
| | | | | | | | | | | | | | | | |
| | | | | | | | | | | | | | | (27,709,644) | |
| | | | | | | | | | | | | | | | |
| | | | |
TOTAL EXCHANGE-TRADED FUNDS (Proceeds $26,758,307) | | | | | | | | | | | | | | | (27,709,644) | |
| | | | | | | | | | | | | | | | |
| | | | |
| | | Maturity Date | | | Rate | | | Principal Amount | | | Value | |
| |
CORPORATE BONDS - (1.03%) | | | | | | | | | | | | | | | | |
Pipelines - (0.06%) | | | | | | | | | | | | | | | | |
Kinder Morgan Energy Partners LP | | | 09/01/2022 | | | | 3.950% | | | $ | (330,000) | | | $ | (335,815) | |
| | | | | | | | | | | | | | | | |
| | | | |
Telecommunications - (0.97%) | | | | | | | | | | | | | | | | |
SoftBank Corp. | | | 04/15/2020 | | | | 4.500% | | | | (331,000) | | | | (335,137) | |
T-Mobile USA, Inc. | | | 04/01/2023 | | | | 6.625% | | | | (4,211,000) | | | | (4,547,880) | |
| | | | | | | | | | | | | | | | |
| | | | | | | | | | | | | | | (4,883,017) | |
| | | | | | | | | | | | | | | | |
| | | | |
TOTAL CORPORATE BONDS (Proceeds $5,156,092) | | | | | | | | | | | | | | | (5,218,832) | |
| | | | | | | | | | | | | | | | |
| | | | |
TOTAL SECURITIES SOLD SHORT (Proceeds $118,435,384) | | | | | | | | | | | | | | $ | (122,773,430) | |
| | | | | | | | | | | | | | | | |
| | | | | | | | | | | | | | | | |
SCHEDULE OF WRITTEN OPTIONS | | Expiration Date | | | Exercise Price | | | Contracts | | | Value | |
| |
Written Call Options | | | | | | | | | | | | | | | | |
Actavis Plc: | | | | | | | | | | | | | | | | |
| | | 06/2014 | | | $ | 195.00 | | | | (6) | | | $ | (10,410) | |
| | | 06/2014 | | | | 200.00 | | | | (6) | | | | (7,620) | |
| | | 06/2014 | | | | 205.00 | | | | (9) | | | | (7,695) | |
See Notes to Financial Statements.
| | |
| Annual Report | May 31, 2014 | | 41 |
| | |
| The Arbitrage Event-Driven Fund | | Portfolio of Investments (continued) |
May 31, 2014
| | | | | | | | | | | | | | | | |
SCHEDULE OF WRITTEN OPTIONS | | Expiration Date | | | Exercise Price | | | Contracts | | | Value | |
| |
Written Call Options (Continued) | | | | | | | | | | | | | | | | |
Assured Guaranty Ltd.: | | | | | | | | | | | | | | | | |
| | | 06/2014 | | | $ | 25.00 | | | | (156) | | | $ | (4,524) | |
| | | 06/2014 | | | | 26.00 | | | | (156) | | | | (1,248) | |
| | | 06/2014 | | | | 27.00 | | | | (61) | | | | (153) | |
Chelsea Therapeutics International Ltd. | | | 09/2014 | | | | 6.00 | | | | (9) | | | | (540) | |
CONSOL Energy, Inc.: | | | | | | | | | | | | | | | | |
| | | 06/2014 | | | | 44.00 | | | | (64) | | | | (7,008) | |
| | | 06/2014 | | | | 45.00 | | | | (187) | | | | (12,342) | |
| | | 06/2014 | | | | 46.00 | | | | (186) | | | | (6,789) | |
| | | 06/2014 | | | | 47.00 | | | | (95) | | | | (1,805) | |
Furiex Pharmaceuticals, Inc.: | | | | | | | | | | | | | | | | |
| | | 06/2014 | | | | 105.00 | | | | (14) | | | | (945) | |
| | | 07/2014 | | | | 105.00 | | | | (29) | | | | (1,450) | |
Genworth Financial, Inc., Class A: | | | | | | | | | | | | | | | | |
| | | 06/2014 | | | | 19.00 | | | | (19) | | | | (38) | |
| | | 06/2014 | | | | 19.00 | | | | (19) | | | | (76) | |
| | | 06/2014 | | | | 18.00 | | | | (38) | | | | (399) | |
Hillshire Brands Co. | | | 06/2014 | | | | 55.00 | | | | (125) | | | | (10,312) | |
Jos. A. Bank Clothiers, Inc. | | | 07/2014 | | | | 65.00 | | | | (108) | | | | (270) | |
Mallinckrodt Plc: | | | | | | | | | | | | | | | | |
| | | 06/2014 | | | | 81.00 | | | | (27) | | | | (2,430) | |
| | | 06/2014 | | | | 82.00 | | | | (26) | | | | (4,355) | |
Manitowoc Co., Inc: | | | | | | | | | | | | | | | | |
| | | 06/2014 | | | | 27.00 | | | | (52) | | | | (4,030) | |
| | | 06/2014 | | | | 28.00 | | | | (234) | | | | (8,190) | |
| | | 06/2014 | | | | 29.00 | | | | (350) | | | | (5,250) | |
| | | 06/2014 | | | | 30.00 | | | | (98) | | | | (735) | |
NRG Energy, Inc.: | | | | | | | | | | | | | | | | |
| | | 06/2014 | | | | 33.00 | | | | (91) | | | | (23,660) | |
| | | 06/2014 | | | | 34.00 | | | | (91) | | | | (15,698) | |
| | | 06/2014 | | | | 35.00 | | | | (86) | | | | (9,030) | |
| | | 06/2014 | | | | 36.00 | | | | (86) | | | | (4,085) | |
Sirius XM Holdings, Inc.: | | | | | | | | | | | | | | | | |
| | | 06/2014 | | | | 4.50 | | | | (3) | | | | (3) | |
| | | 01/2015 | | | | 4.00 | | | | (946) | | | | (12,298) | |
Talisman Energy, Inc. | | | 06/2014 | | | | 11.00 | | | | (92) | | | | (460) | |
Yamana Gold, Inc. | | | 06/2014 | | | | 7.00 | | | | (64) | | | | (2,976) | |
| | | | | | | | | | | | | | | | |
| | | | |
TOTAL WRITTEN CALL OPTIONS (Premiums received $203,576) | | | | | | | | | | | | | | | (166,824) | |
| | | | | | | | | | | | | | | | |
See Notes to Financial Statements.
| | |
| 42 | | www.arbitragefunds.com | 1-800-295-4485 |
| | |
| The Arbitrage Event-Driven Fund | | Portfolio of Investments (continued) |
May 31, 2014
| | | | | | | | | | | | | | | | |
SCHEDULE OF WRITTEN OPTIONS | | Expiration Date | | | Exercise Price | | | Contracts | | | Value | |
| |
| | | | |
Written Put Options | | | | | | | | | | | | | | | | |
CONSOL Energy, Inc.: | | | | | | | | | | | | | | | | |
| | | 06/2014 | | | $ | 39.00 | | | | (26) | | | $ | (195) | |
| | | 06/2014 | | | | 40.00 | | | | (26) | | | | (286) | |
Genworth Financial, Inc., Class A | | | 06/2014 | | | | 17.00 | | | | (38) | | | | (1,577) | |
Hillshire Brands Co. | | | 06/2014 | | | | 50.00 | | | | (125) | | | | (5,625) | |
| | | | | | | | | | | | | | | | |
| | | | |
TOTAL WRITTEN PUT OPTIONS (Premiums received $11,153) | | | | | | | | | | | | | | | (7,683) | |
| | | | | | | | | | | | | | | | |
| | | | |
TOTAL WRITTEN OPTIONS (Premiums received $214,729) | | | | | | | | | | | | | | $ | (174,507) | |
| | | | | | | | | | | | | | | | |
See Notes to Financial Statements.
| | |
| Annual Report | May 31, 2014 | | 43 |
| | |
| The Arbitrage Event-Driven Fund | | Portfolio of Investments (continued) |
May 31, 2014
EQUITY SWAP CONTRACTS
| | | | | | | | | | | | | | | | |
Swap Counterparty | | Reference Obligation | | Rate Paid/Received by the Fund | | Termination Dates | | | Notional Amount | | | Unrealized Appreciation | |
| |
Goldman, Sachs & Co. | | Wolfson Microelectronics Plc | | 1 Month-LIBOR
plus 0.45 bps | | | 05/06/2015 | | | $ | 215,732 | | | $ | (1,019) | |
| | | | | | | | | | | | |
| | | | | | | | | | $ | 215,732 | | | $ | (1,019) | |
| | | | | | | | | | | | |
See Notes to Financial Statements.
| | |
| 44 | | www.arbitragefunds.com | 1-800-295-4485 |
| | |
| The Arbitrage Event-Driven Fund | | Portfolio of Investments (continued) |
May 31, 2014
OUTSTANDING FORWARD FOREIGN CURRENCY EXCHANGE CONTRACTS
| | | | | | | | | | | | | | | | |
Contract
Description | | Contracts to Deliver/Receive | | | Purchase/ Sale Contract | | Expiration Date | | Current Value | | | Unrealized Appreciation | |
| |
| AUD | | | 1,390,000 | | | Purchase | | 06/16/2014 | | | 1,292,081 | | | $ | 13,347 | |
| AUD | | | 1,719,000 | | | Sale | | 06/16/2014 | | | 1,597,905 | | | | 8,036 | |
| CAD | | | 1,947,000 | | | Purchase | | 06/16/2014 | | | 1,794,887 | | | | 15,010 | |
| CAD | | | 560,000 | | | Sale | | 06/16/2014 | | | 516,249 | | | | 695 | |
| EUR | | | 167,000 | | | Purchase | | 06/16/2014 | | | 227,641 | | | | 427 | |
| EUR | | | 6,420,000 | | | Sale | | 06/16/2014 | | | 8,751,212 | | | | 155,338 | |
| GBP | | | 103,000 | | | Purchase | | 06/16/2014 | | | 172,627 | | | | 1,621 | |
| GBP | | | 1,001,000 | | | Sale | | 06/16/2014 | | | 1,677,662 | | | | 7,912 | |
| NOK | | | 1,350,000 | | | Sale | | 06/16/2014 | | | 225,680 | | | | 1,692 | |
| SEK | | | 14,522,800 | | | Sale | | 06/16/2014 | | | 2,169,483 | | | | 95,404 | |
| | | | | | | | | | | | | | | | |
| | | | | | | | | | | | | | $ | 299,482 | |
| | | | | | | | | | | | | | | | |
| | | | | |
Contract Description | | Contracts to Deliver/Receive | | | Purchase/ Sale Contract | | Expiration Date | | Current Value | | | Unrealized Depreciation | |
| |
| AUD | | | 646,000 | | | Purchase | | 06/16/2014 | | | 600,492 | | | $ | (2,980) | |
| AUD | | | 3,117,000 | | | Sale | | 06/16/2014 | | | 2,897,423 | | | | (99,663) | |
| CAD | | | 470,000 | | | Purchase | | 06/16/2014 | | | 433,280 | | | | (104) | |
| CAD | | | 24,052,500 | | | Sale | | 06/16/2014 | | | 22,173,359 | | | | (472,974) | |
| EUR | | | 4,586,000 | | | Purchase | | 06/16/2014 | | | 6,251,255 | | | | (109,191) | |
| GBP | | | 3,326,000 | | | Purchase | | 06/16/2014 | | | 5,574,330 | | | | (37,731) | |
| GBP | | | 2,754,000 | | | Sale | | 06/16/2014 | | | 4,615,666 | | | | (42,743) | |
| SEK | | | 12,187,800 | | | Purchase | | 06/16/2014 | | | 1,820,670 | | | | (103,510) | |
| | | | | | | | | | | | | | | | |
| | | | | | | | | | | | | | $ | (868,896) | |
| | | | | | | | | | | | | | | | |
See Notes to Financial Statements.
| | |
| Annual Report | May 31, 2014 | | 45 |
| | |
| The Arbitrage Event-Driven Fund | | Portfolio of Investments (continued) |
May 31, 2014
| | | | |
| Country | | % of Net Assets(a) | |
| |
Canada | | | 8.85% | |
Japan | | | 2.92% | |
Great Britain | | | 1.03% | |
Ireland | | | 0.94% | |
Germany | | | 0.84% | |
Marshall Islands | | | 0.81% | |
Bermuda | | | 0.66% | |
Australia | | | 0.53% | |
Netherlands | | | 0.15% | |
Jersey | | | 0.12% | |
Sweden | | | 0.07% | |
Norway | | | 0.04% | |
United States | | | 84.06% | |
Liabilities in Excess of Other Assets | | | (1.02)% | |
| | | | |
| | | 100.00% | |
| | | | |
| (a) | These percentages represent long positions only and are not net of short positions. |
Abbreviations:
AB - Arktiebolag is the Swedish term for a limited company
ADR - American Depositary Receipt
AG - Aktiengesellschaft is a German term that refers to a corporation that is limited by shares, i.e., owned by shareholders
ASA - Allmennaksjeselskap is the Norwegian term for a public limited company
AUD - Australian Dollar
bps - Basis Points
CAD - Canadian Dollar
CPR - Conditional Prepayment Rate
CVR - Contingent Value Rights
ETF - Exchange-Traded Fund
EUR - Euro
GBP - British Pound
LIBOR - London Interbank Offered Rate
LLC - Limited Liability Company
LP - Limited Partnership
Ltd. - Limited
NOK - Norwegian Kronor
N.V. - Naamloze Vennootschap is the Dutch term for a public limited liability corporation
PIK - Payment-in-kind
Plc - Public Limited Liability
| | |
SA - | | Generally designates corporations in various countries, mostly those employing civil law. This translates literally in all languages mentioned as anonymous company |
SE - SE Regulation. A European Company which can operate on a Europe-wide basis and be governed by Community law directly applicable in all Member States
SEK - Swedish Kronor
S&P - Standard & Poor’s
SPDR - Standard & Poor’s Depositary Receipt
See Notes to Financial Statements.
| | |
| 46 | | www.arbitragefunds.com | 1-800-295-4485 |
| | |
| The Arbitrage Event-Driven Fund | | |
May 31, 2014
The following is a summary of the inputs used as of May 31, 2014, in valuing the Arbitrage Event-Driven Fund’s investments carried at value:
Investments in Securities at Value
| | | | | | | | | | | | | | | | |
| | | Level 1 | | | Level 2 | | | Level 3 | | | Total | |
| |
Assets | | | | | | | | | | | | | | | | |
Common Stocks | | | | | | | | | | | | | | | | |
Aerospace & Defense | | $ | 1,921,649 | | | $ | – | | | $ | 266 | | | $ | 1,921,915 | |
Airlines | | | 6,301,224 | | | | – | | | | – | | | | 6,301,224 | |
Auto Manufacturers | | | 4,045,722 | | | | – | | | | – | | | | 4,045,722 | |
Biotechnology | | | 2,837,416 | | | | – | | | | – | | | | 2,837,416 | |
Building Materials | | | 1,783,736 | | | | – | | | | – | | | | 1,783,736 | |
Coal | | | 8,591,507 | | | | – | | | | – | | | | 8,591,507 | |
Commercial Services | | | 530,933 | | | | – | | | | – | | | | 530,933 | |
Diversified Financial Services | | | 3,255,348 | | | | – | | | | – | | | | 3,255,348 | |
Electric | | | 22,576,663 | | | | – | | | | – | | | | 22,576,663 | |
Electronics | | | 668,222 | | | | – | | | | – | | | | 668,222 | |
Engineering & Construction | | | 2,676,633 | | | | – | | | | – | | | | 2,676,633 | |
Food | | | 25,896,195 | | | | – | | | | – | | | | 25,896,195 | |
Gas | | | 230,671 | | | | – | | | | – | | | | 230,671 | |
Healthcare - Products | | | 2,436,619 | | | | – | | | | – | | | | 2,436,619 | |
Healthcare - Services | | | 11,902,759 | | | | – | | | | – | | | | 11,902,759 | |
Home Builders | | | 221,452 | | | | – | | | | – | | | | 221,452 | |
Insurance | | | 6,448,132 | | | | – | | | | – | | | | 6,448,132 | |
Internet | | | 4,479,156 | | | | – | | | | – | | | | 4,479,156 | |
Machinery - Diversified | | | 5,266,065 | | | | – | | | | – | | | | 5,266,065 | |
Media | | | 24,980,009 | | | | – | | | | – | | | | 24,980,009 | |
Mining | | | 19,224,579 | | | | – | | | | – | | | | 19,224,579 | |
Miscellaneous Manufacturing | | | 6,484,249 | | | | – | | | | – | | | | 6,484,249 | |
Oil & Gas | | | 9,068,517 | | | | 2,390,101 | | | | – | | | | 11,458,618 | |
Oil & Gas Services | | | 8,319,047 | | | | – | | | | – | | | | 8,319,047 | |
Pharmaceuticals | | | 43,153,199 | | | | – | | | | – | | | | 43,153,199 | |
Real Estate | | | 2,175,559 | | | | – | | | | – | | | | 2,175,559 | |
Retail | | | 20,359,617 | | | | – | | | | – | | | | 20,359,617 | |
Savings & Loans | | | 3,606,732 | | | | – | | | | – | | | | 3,606,732 | |
Semiconductors | | | 16,129,557 | | | | – | | | | – | | | | 16,129,557 | |
Software | | | 348,004 | | | | – | | | | – | | | | 348,004 | |
Telecommunications | | | 15,147,943 | | | | – | | | | – | | | | 15,147,943 | |
Limited Partnerships | | | 578,576 | | | | – | | | | – | | | | 578,576 | |
Preferred Stocks | | | 422,717 | | | | – | | | | – | | | | 422,717 | |
Rights | | | 20,041 | | | | – | | | | 293,855 | | | | 313,896 | |
Bank Loans | | | – | | | | 18,750,695 | | | | – | | | | 18,750,695 | |
Corporate Bonds | | | – | | | | 122,302,976 | | | | 135,575 | | | | 122,438,551 | |
Convertible Corporate Bonds | | | – | | | | 29,358,136 | | | | – | | | | 29,358,136 | |
Purchased Options | | | 851,173 | | | | – | | | | – | | | | 851,173 | |
Short-Term Investments | | | 52,096,284 | | | | – | | | | – | | | | 52,096,284 | |
| |
TOTAL | | $ | 335,035,905 | | | $ | 172,801,908 | | | $ | 429,696 | | | $ | 508,267,509 | |
| |
See Notes to Financial Statements.
| | |
| Annual Report | May 31, 2014 | | 47 |
| | |
| The Arbitrage Event-Driven Fund | | |
May 31, 2014
Investments in Securities at Value (Continued)
| | | | | | | | | | | | | | | | |
| | | Level 1 | | | Level 2 | | | Level 3 | | | Total | |
| |
| |
| |
Other Financial Instruments* | | | | | | | | | | | | | | | | |
| |
Assets | | | | | | | | | | | | | | | | |
Forward Foreign Currency Exchange Contracts | | $ | – | | | $ | 299,482 | | | $ | – | | | $ | 299,482 | |
Liabilities | | | | | | | | | | | | | | | | |
Common Stocks** | | | (88,663,039) | | | | (1,181,915) | | | | – | | | | (89,844,954) | |
Exchange-Traded Funds | | | (27,709,644) | | | | – | | | | – | | | | (27,709,644) | |
Corporate Bonds | | | – | | | | (5,218,832) | | | | – | | | | (5,218,832) | |
Written Options | | | (174,507) | | | | – | | | | – | | | | (174,507) | |
Forward Foreign Currency Exchange Contracts | | | – | | | | (868,896) | | | | – | | | | (868,896) | |
Equity Swaps | | | (1,019) | | | | – | | | | – | | | | (1,019) | |
| |
TOTAL | | $ | (116,548,209) | | | $ | (6,970,161) | | | $ | – | | | $ | (123,518,370) | |
| |
| * | Other financial instruments are instruments such as written options, securities sold short, equity swaps and forward foreign currency exchange contracts. |
| ** | Refer to Portfolio of Investments for sector information. |
See Notes to Financial Statements.
| | |
| 48 | | www.arbitragefunds.com | 1-800-295-4485 |
| | |
| The Arbitrage Event-Driven Fund | | |
May 31, 2014
The following is a reconciliation of the fair valuations using significant unobservable inputs (Level 3) for the Fund’s assets and liabilities during the year ended May 31, 2014:
| | | | | | | | | | | | | | | | | | | | | | | | | | | | | | | | | | | | | | | | |
Investments in Securities | | Balance as of May 31, 2013 | | | Return of Capital | | | Realized Gain | | | Change in Unrealized Appreciation/ (Depreciation) | | | Purchases | | | Sales Proceeds | | | Transfer into Level 3 | | | Transfer out of
Level 3 | | | Balance as of May 31, 2014 | | | Net change in unrealized appreciation/ (depreciation) included in the Statements of Operations attributable to
Level 3 investments held at May 31, 2014 | |
| |
Common Stocks | | $ | 10,000 | | | $ | – | | | $ | 9,272 | | | $ | 6,545 | | | $ | – | | | $ | (25,551) | | | $ | – | | | $ | – | | | $ | 266 | | | $ | 6,545 | |
Rights | | | 0 | | | | – | | | | – | | | | 29,447 | | | | 264,408 | | | | – | | | | – | | | | – | | | | 293,855 | | | | 29,447 | |
Corporate Bonds | | | – | | | | (767,830) | | | | – | | | | (15,659) | | | | 802,614 | | | | – | | | | 116,450 | | | | – | | | | 135,575 | | | | (21,299) | |
| |
Total | | $ | 10,000 | | | $ | (767,830) | | | $ | 9,272 | | | $ | 20,333 | | | $ | 1,067,022 | | | $ | (25,551) | | | $ | 116,450 | | | $ | – | | | $ | 429,696 | | | $ | 14,693 | |
| |
See Notes to Financial Statements.
| | |
| Annual Report | May 31, 2014 | | 49 |
| | |
| The Arbitrage Credit Opportunities Fund | | Manager Commentary |
May 31, 2014 (Unaudited)
|
The Arbitrage Credit Opportunities Fund | NASDAQ | ARCFX, ACFIX, ARCCX, AGCAX The Fund’s Goal and Main Investments The Fund seeks to provide current income and capital growth by focusing on company-specific catalysts and events in order to generate returns that are more correlated to the outcomes and timelines of those events rather than on overall market direction or changes in interest rates. |
Investment Strategy
The fund employs a fundamentally driven strategy combined with quantitative security analysis. The investment team screens catalyst-driven investments such as mergers, acquisitions, asset sales, spin-offs, refinancings, recapitalizations, corporate reorganizations, litigation and regulatory changes. From this universe the team selects investments based on factors such as risk and reward profile, potential downside, and security liquidity. The team generates returns by holding outright long and short positions and by utilizing capital structure arbitrage, merger arbitrage, and convertible arbitrage techniques to exploit security mispricing or inefficiencies. This portfolio offers a pure-play credit implementation of Water Island Capital’s broader event-driven style.
Commentary
What a difference a year makes. Twelve months ago, credit markets violently sold off as investors reacted to changes in the U.S. Federal Reserve’s (Fed) asset purchase program and the potential impact on rates and risk assets. In the first half of 2014, however, longer duration bonds, which are more sensitive to interest rate moves, came back in favor. With inflation concerns in check, and the continued support of central banks, the U.S. 10-year Treasury yield dropped to 2.44% in late May 2014 from 3.03% at the end of 2013. This move alone lead to an approximate 5% increase in the principal amount of the benchmark bond.
Yet as the 10-year rate declined in response to tepid economic growth and lower inflation expectations, shorter-term rates, which are more impacted by Fed policy, began to rise in response to indications of higher rates in 2015 and 2016. In March, Fed officials projected the benchmark federal funds rate would hit 1.125% by the end of 2015 and 2.40% by the end of 2016. In June, however, Fed officials projected this rate would hit 1.20% and 2.50% by the end of 2015 and 2016, respectively.
As a fund focused on shorter-duration catalysts and events, we have certainly not benefitted from this interest-rate tailwind. Our effective duration of approximately 1.1 years reflects our continuous goal of generating returns that are more correlated to the outcomes and timelines of specific events rather than on market direction or changes in rates. Even with a backdrop of fixed income volatility and strong equity-related returns, our concentration did not waver.
In fiscal 2014, the Arbitrage Credit Opportunities Fund returned 6.44%. The results were predominantly derived from companies residing in the Americas. In terms of sectors, telecommunication services accounted for nearly half of our performance, while other sectors contributed nearly equal results with utilities adding the least.
Fiscal Year Highlights
Our focus on idiosyncratic situations can be best illustrated in our investment in Globalstar (GSAT), which provides mobile satellite services (MSS) including global voice and data communications services. When we conducted our initial research on the company, GSAT had
| | |
| 50 | | www.arbitragefunds.com | 1-800-295-4485 |
| | |
| The Arbitrage Credit Opportunities Fund | | Manager Commentary (continued) |
May 31, 2014 (Unaudited)
been in the process of restructuring its balance sheet due to a crucial near-term maturity for its convertible bonds. At the same time, however, GSAT was petitioning the Federal Communications Commission (FCC) to begin the approval process which would enable GSAT to convert a portion of its MSS spectrum in order to create a terrestrial network. The network that GSAT envisioned had the potential to free-up the nation’s WiFi “traffic jams”, which implied significant revenue opportunities for the company.
After valuing corporate assets, understanding the motivations of management and creditors, assessing the likelihood of receiving FCC approval, and analyzing the value created by various bond restructuring scenarios, we purchased GSAT’s 5.750% Convertible Notes in February and March of 2013. In May, GSAT offered to exchange the Notes for a combination of cash, new 8% convertible senior notes, and common equity in the company. While the FCC has not formally approved GSAT’s request to convert spectrum, we are now at advanced stages of the FCC approval process, and believe the company will receive approval by the end of 2014. Thus far, our bond holdings in GSAT have been strong contributors to performance.
Another top contributor during the year was our investment in the surplus notes of bond insurance companies Ambac Financial Group and Syncora Holdings. Prior to the financial crisis, bond insurance companies insured or “wrapped” pools of mortgages against the risk of default. As part of this securitization process, the mortgage originators provide guarantees, known as representations and warranties, that these mortgages meet an agreed-upon level of underwriting due diligence and credit worthiness. As the financial crisis ensued and mortgage defaults skyrocketed, bond insurers came under serious financial stress, they were responsible for paying out claims to banks and investors for defaulted securities. However, the bond insurers claimed the originators failed to meet their representation and warranty obligations, and, as a result, the bond insurers had the right to “put back” impaired loans to the underwriting banks and mortgage originators.
Through prior investments, we had analyzed, and were familiar with, monoline insurance company litigation against mortgage underwriters. We believed precedent court rulings and legal settlements supported the respective cases of Ambac and Syncora to receive close to 100% of damage claims against the banks in outstanding court cases. Our analysis concluded that proceeds from expected counterparty settlements would cover Ambac and Syncora surplus notes by 3.9 and 1.5 times, respectively. The notes were trading at significant discounts to their accreted value, and offered a compelling risk/reward profile. Consequently, we purchased the notes at attractive prices, and have since seen our positions rise in value as positive news flow has given investors higher conviction over future settlements.
Another standout investment during the year was in Leap Wireless bonds, which we initially purchased in order to capture opportunities that we saw in a rapidly consolidating telecom sector. Leap held attractive spectrum assets and, in July 2013, AT&T announced its agreement to purchase the company. This resulted in the bonds trading up by approximately 14%, at which point we exited our position.
Lagging performers this year included Latin American wireless company NII Holdings. Although we used a hedge overlay for our bonds, delays in monetizing South American assets and operational challenges in Mexico pressured the firm’s capital structure, including our bonds. Another position that weighed on the portfolio was the investment in the bonds of Radio Shack.
| | |
| Annual Report | May 31, 2014 | | 51 |
| | |
| The Arbitrage Credit Opportunities Fund | | Manager Commentary (continued) |
May 31, 2014 (Unaudited)
Given the company’s operating difficulties and rumors surrounding its ability to refinance these bonds, we determined the risk/reward profile of this investment was no longer attractive and we exited the position.
Outlook
Supportive Central Bank policies combined with investor demand for income has pushed yields and credit spreads to historically low levels for fixed income products such as investment grade and high yield debt. Although we cannot predict with certainty whether yields and spreads will continue to grind tighter or reverse, we fully recognize that yields are at historically low levels, while duration risk remains high given the current global interest rate backdrop. It appears to us that many investors remain comfortable with the support of Central Bank policies and have chosen to ‘grind-out’ returns.
During periods where we feel the risks may outweigh the rewards, we take a two-step approach. First, we attempt to keep individual position sizes smaller than would be typical of our investments. We do this to maintain the ability to add to these positions at more-attractive prices. Secondly, we are even more focused on shorter-duration investment opportunities. This provides for a quicker return of capital when the investments pan out which, in turn, allows us to reinvest in new situations that may provide more attractive returns.
Sincerely,
The Investment Team at Water Island Capital
| | |
| 52 | | www.arbitragefunds.com | 1-800-295-4485 |
| | |
| The Arbitrage Credit Opportunities Fund | | Portfolio Information |
May 31, 2014 (Unaudited)
Performance (annualized returns as of May 31, 2014)
| | | | | | |
| | | One Year | | | Since Inception* |
Arbitrage Credit Opportunities Fund, Class R | | | 4.99% | | | 4.41% |
Arbitrage Credit Opportunities Fund, Class I | | | 5.08% | | | 4.56% |
Arbitrage Credit Opportunities Fund, Class C** | | | 3.17% | | | 3.72% |
Arbitrage Credit Opportunities Fund, Class A*** | | | 1.47% | | | 1.47% |
Barclays Capital U.S. Aggregate Bond Index | | | 2.71% | | | 1.15% |
Current performance may be higher or lower than performance quoted above. Any performance data quoted represents past performance and the investment return and principal value of an investment in the Fund will fluctuate so that an investor’s shares, when redeemed, may be worth more or less than their original cost. Past performance is no guarantee of future results. Returns do not reflect a 2% redemption fee for shares that are redeemed from the fund within 60 days of purchase, which, if reflected, would reduce the performance quoted. Returns shown above include the reinvestment of all dividends and capital gains. Contractual fee waivers are currently in effect. Without such fee waivers, performance numbers would be reduced. You can obtain performance data current to the most recent month end by calling 1-800-295-4485 or going to www.arbitragefunds.com.
* Class R, Class I and Class C inception: 10/1/12; Class A inception: 6/1/13.
** Class C shares are subject to a 1.00% contingent deferred sales charge on all purchases redeemed in 12 months of purchase.
*** Class A shares are subject to a maximum front-end sales load of 3.25% on purchases up to $500,000. The shares are also subject to a deferred sales charge of up to 1.00% on purchases of $500,000 or more purchased without a front-end sales load and redeemed within 18 months of purchase.
The Total Annual Fund Operating Expenses for Class R, Class I, Class C and Class A are 3.86%, 3.61%, 4.61% and 3.86%, respectively. The Advisor has agreed to waive fees in excess of 1.50%, 1.25%, 2.25% and 1.50% for Class R, Class I, Class C and Class A, respectively, until at least August 31, 2016.
The Barclays Capital U.S. Aggregate Bond Index is a market value-weighted index of investment grade fixed-rated debt issues, including government, corporate, asset-backed and mortgage-backed securities with a maturity of one year or more.
An investor may not invest directly in an index.
| | |
| Annual Report | May 31, 2014 | | 53 |
| | |
| The Arbitrage Credit Opportunities Fund | | Portfolio Information (continued) |
May 31, 2014 (Unaudited)
Growth of $10,000 Investment
| | | | |
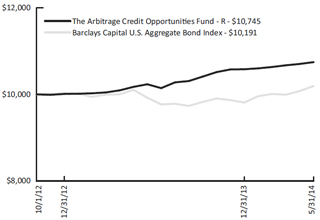 | | The chart represents historical performance of a hypothetical investment of $10,000 in the Class R shares of the Fund since inception. Past performance does not guarantee future results. This chart does not reflect the deduction of taxes that a shareholder would pay on Fund distributions or the redemption of Fund shares. | | |
Sector Weighting
The following chart shows the sector weightings of the Arbitrage Credit Opportunities Fund’s investments in common stock, corporate bonds, convertible corporate bonds, exchange-traded funds and preferred stocks as of the report date.
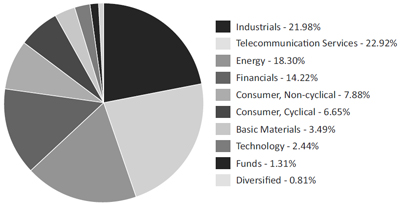
| | |
| 54 | | www.arbitragefunds.com | 1-800-295-4485 |
| | |
| The Arbitrage Credit Opportunities Fund | | Portfolio of Investments |
May 31, 2014
| | | | | | | | |
| | | Shares | | | Value | |
| |
COMMON STOCKS - 0.42% | | | | | | | | |
Oil & Gas Services - 0.42% | | | | | | | | |
Hornbeck Offshore Services, Inc.(a) | | | 2,800 | | | $ | 126,672 | |
| | | | | | | | |
| | |
TOTAL COMMON STOCKS (Cost $119,840) | | | | | | | 126,672 | |
| | | | | | | | |
| | |
PREFERRED STOCKS - 0.10% | | | | | | | | |
Real Estate Investment Trusts - 0.10% | | | | | | | | |
American Realty Capital Properties, Inc., Series F, 6.700% | | | 1,330 | | | | 31,853 | |
| | | | | | | | |
| | |
TOTAL PREFERRED STOCKS (Cost $28,071) | | | | | | | 31,853 | |
| | | | | | | | |
| | | | | | | | | | | | | | | | |
| | | Maturity Date | | | Rate | | | Principal
Amount | | | Value | |
| |
BANK LOANS - 8.22% | | | | | | | | | | | | | | | | |
Cengage Learning Acquisitions, Inc.(b) | | | 03/06/2020 | | | | 7.000 | % | | | $ 500,000 | | | | $ 507,875 | |
FairPoint Communications, Inc.(b) | | | 02/14/2019 | | | | 7.500 | % | | | 298,492 | | | | 308,774 | |
Station Casinos(b) | | | 03/01/2020 | | | | 4.250 | % | | | 385,454 | | | | 386,597 | |
Vantage Drilling Co.(b) | | | 03/28/2019 | | | | 5.750 | % | | | 572,361 | | | | 569,860 | |
Zayo Bandwidth LLC(b) | | | 06/14/2019 | | | | 4.000 | % | | | 707,292 | | | | 707,292 | |
| | | | |
TOTAL BANK LOANS (Cost $2,490,450) | | | | | | | | | | | | | | | 2,480,398 | |
| | | | | | | | | | | | | | | | |
| | | | |
CORPORATE BONDS - 58.39% | | | | | | | | | | | | | | | | |
Aerospace & Defense - 4.86% | | | | | | | | | | | | | | | | |
Alliant Techsystems, Inc. | | | 09/15/2020 | | | | 6.875 | % | | | 292,000 | | | | 317,550 | |
B/E Aerospace, Inc. | | | | | | | | | | | | | | | | |
| | | 10/01/2020 | | | | 6.875 | % | | | 109,000 | | | | 118,537 | |
| | | 04/01/2022 | | | | 5.250 | % | | | 136,000 | | | | 144,500 | |
TransDigm, Inc. | | | 12/15/2018 | | | | 7.750 | % | | | 824,000 | | | | 885,800 | |
| | | | | | | | | | | | | | | | |
| | | | | | | | | | | | | | | 1,466,387 | |
| | | | | | | | | | | | | | | | |
Banks - 2.83% | | | | | | | | | | | | | | | | |
PNC Preferred Funding Trust II(c)(d) | |
| Perpetual
Maturity |
| | | 1.456 | % | | | 323,000 | | | | 313,310 | |
Popular North America Capital Trust I | | | 09/15/2034 | | | | 6.564 | % | | | 367,000 | | | | 302,775 | |
Wells Fargo Capital X | | | 12/15/2036 | | | | 5.950 | % | | | 233,000 | | | | 237,077 | |
| | | | | | | | | | | | | | | | |
| | | | | | | | | | | | | | | 853,162 | |
| | | | | | | | | | | | | | | | |
See Notes to Financial Statements.
| | |
| Annual Report | May 31, 2014 | | 55 |
| | |
| The Arbitrage Credit Opportunities Fund | | Portfolio of Investments (continued) |
May 31, 2014
| | | | | | | | | | | | | | | | |
| | | Maturity
Date | | | Rate | | | Principal
Amount | | | Value | |
| |
CORPORATE BONDS - 58.39% (Continued) | | | | | | | | | | | | | | | | |
Building Materials - 3.15% | | | | | | | | | | | | | | | | |
Texas Industries, Inc. | | | 08/15/2020 | | | | 9.250 | % | | | $ 838,000 | | | $ | 949,035 | |
| | | | | | | | | | | | | | | | |
| | | | |
Computers - 0.53% | | | | | | | | | | | | | | | | |
SunGard Data Systems, Inc.(e) | | | 11/15/2020 | | | | 7.625 | % | | | 147,000 | | | | 161,149 | |
| | | | | | | | | | | | | | | | |
| | | | |
Diversified Financial Services - 2.67% | | | | | | | | | | | | | | | | |
National Money Mart Co. | | | 12/15/2016 | | | | 10.375 | % | | | 258,000 | | | | 269,932 | |
Prospect Holding Co. LLC / Prospect Holding Finance Co.(d) | | | 10/01/2018 | | | | 10.250 | % | | | 215,000 | | | | 208,550 | |
ROC Finance LLC(d) | | | 09/01/2018 | | | | 12.125 | % | | | 300,000 | | | | 326,250 | |
| | | | | | | | | | | | | | | | |
| | | | | | | | | | | | | | | 804,732 | |
| | | | | | | | | | | | | | | | |
Energy - Alternate Sources - 0.90% | | | | | | | | | | | | | | | | |
First Wind Capital LLC(d) | | | 06/01/2018 | | | | 10.250 | % | | | 255,000 | | | | 271,575 | |
| | | | | | | | | | | | | | | | |
| | | | |
Financial Services - 1.05% | | | | | | | | | | | | | | | | |
Marina District Finance Co., Inc. | | | 08/15/2018 | | | | 9.875 | % | | | 300,000 | | | | 317,250 | |
| | | | | | | | | | | | | | | | |
| | | | |
Food - 2.24% | | | | | | | | | | | | | | | | |
Safeway, Inc. | | | 08/15/2017 | | | | 6.350 | % | | | 192,000 | | | | 218,596 | |
US Foods, Inc. | | | 06/30/2019 | | | | 8.500 | % | | | 427,000 | | | | 458,384 | |
| | | | | | | | | | | | | | | | |
| | | | | | | | | | | | | | | 676,980 | |
| | | | | | | | | | | | | | | | |
Healthcare - Services - 1.12% | | | | | | | | | | | | | | | | |
MedImpact Holdings, Inc.(d) | | | 02/01/2018 | | | | 10.500 | % | | | 309,000 | | | | 338,355 | |
| | | | | | | | | | | | | | | | |
| | | | |
Household Products & Wares - 0.82% | | | | | | | | | | | | | | | | |
American Achievement Corp.(d) | | | 04/15/2016 | | | | 10.875 | % | | | 238,000 | | | | 247,520 | |
| | | | | | | | | | | | | | | | |
| | | | |
Insurance - 2.60% | | | | | | | | | | | | | | | | |
Ambac Assurance Corp.(d)(e) | | | 06/07/2020 | | | | 5.100 | % | | | 483,000 | | | | 546,394 | |
Syncora Holdings Ltd.(c) | | | | | | | | | | | | | | | | |
| | | Perpetual | | | | | | | | | | | | | |
| | | Maturity | | | | 5.000 | % | | | 75,000 | | | | 64,500 | |
| | | Perpetual | | | | | | | | | | | | | |
| | | Maturity | | | | 6.880 | % | | | 208,000 | | | | 172,640 | |
| | | | | | | | | | | | | | | | |
| | | | | | | | | | | | | | | 783,534 | |
| | | | | | | | | | | | | | | | |
See Notes to Financial Statements.
| | |
| 56 | | www.arbitragefunds.com | 1-800-295-4485 |
| | |
| The Arbitrage Credit Opportunities Fund | | Portfolio of Investments (continued) |
May 31, 2014
| | | | | | | | | | | | | | | | |
| | | Maturity
Date | | | Rate | | | Principal
Amount | | | Value | |
| |
CORPORATE BONDS - 58.39% (Continued) | | | | | | | | | | | | | | | | |
Media - 10.54% | | | | | | | | | | | | | | | | |
Allbritton Communications Co. | | | 05/15/2018 | | | | 8.000 | % | | | $ 860,000 | | | $ | 897,625 | |
CCO Holdings LLC / CCO Holdings Capital Corp.(e) | | | 01/15/2019 | | | | 7.000 | % | | | 424,000 | | | | 448,380 | |
Entercom Radio LLC | | | 12/01/2019 | | | | 10.500 | % | | | 180,000 | | | | 205,650 | |
LIN Television Corp. | | | 04/15/2018 | | | | 8.375 | % | | | 500,000 | | | | 528,125 | |
Nara Cable Funding Ltd.(d) | | | 12/01/2018 | | | | 8.875 | % | | | 548,000 | | | | 589,100 | |
Univision Communications, Inc.(d) | | | 05/15/2021 | | | | 8.500 | % | | | 273,000 | | | | 299,618 | |
YPG Financing, Inc.(d) | | | 11/30/2018 | | | | 9.250 | % | | | 212,278 | | | | 210,970 | |
| | | | | | | | | | | | | | | | |
| | | | | | | | | | | | | | | 3,179,468 | |
| | | | | | | | | | | | | | | | |
Mining - 1.39% | | | | | | | | | | | | | | | | |
Prince Mineral Holding Corp. | | | 12/15/2019 | | | | 11.500 | % | | | 372,000 | | | | 419,895 | |
| | | | | | | | | | | | | | | | |
| | | | |
Oil & Gas - 10.22% | | | | | | | | | | | | | | | | |
Aurora USA Oil & Gas, Inc.(d) | | | 02/15/2017 | | | | 9.875 | % | | | 339,000 | | | | 376,290 | |
Berry Petroleum Co. LLC | | | 06/01/2014 | | | | 10.250 | % | | | 270,000 | | | | 270,000 | |
Endeavour International Corp.(e) | | | | | | | | | | | | | | | | |
| | | 03/01/2018 | | | | 12.000 | % | | | 136,000 | | | | 130,560 | |
| | | 06/01/2018 | | | | 12.000 | % | | | 259,000 | | | | 171,587 | |
Forest Oil Corp. | | | 06/15/2019 | | | | 7.250 | % | | | 228,000 | | | | 226,860 | |
Newfield Exploration Co. | | | 05/15/2018 | | | | 7.125 | % | | | 555,000 | | | | 570,956 | |
Noble Holding International Ltd. | | | 03/01/2016 | | | | 3.050 | % | | | 709,000 | | | | 732,601 | |
Sabine Oil & Gas LLC / Sabine Oil & Gas Finance Corp. | | | 02/15/2017 | | | | 9.750 | % | | | 279,000 | | | | 292,253 | |
Sherritt International Corp. | | | 10/15/2015 | | | | 7.750 | % | | | 196,000 | | | | 186,141 | |
Southern Pacific Resource Corp.(d) | | | 01/25/2018 | | | | 8.750 | % | | | 187,000 | | | | 128,053 | |
| | | | | | | | | | | | | | | | |
| | | | | | | | | | | | | | | 3,085,301 | |
| | | | | | | | | | | | | | | | |
Packaging & Containers - 4.39% | | | | | | | | | | | | | | | | |
ARD Finance SA, PIK(d) | | | 06/01/2018 | | | | 11.125 | % | | | 502,802 | | | | 537,998 | |
Packaging Dynamics Corp.(d) | | | 02/01/2016 | | | | 8.750 | % | | | 767,000 | | | | 788,093 | |
| | | | | | | | | | | | | | | | |
| | | | | | | | | | | | | | | 1,326,091 | |
| | | | | | | | | | | | | | | | |
Pharmaceuticals - 0.02% | | | | | | | | | | | | | | | | |
Savient Pharmaceuticals, Inc.(d)(f)(g)(h)(i) | | | 05/09/2019 | | | | 3.000 | % | | | 267,000 | | | | 5,994 | |
| | | | | | | | | | | | | | | | |
See Notes to Financial Statements.
| | |
| Annual Report | May 31, 2014 | | 57 |
| | |
| The Arbitrage Credit Opportunities Fund | | Portfolio of Investments (continued) |
May 31, 2014
| | | | | | | | | | | | | | | | |
| | | Maturity
Date | | | Rate | | | Principal
Amount | | | Value | |
| |
CORPORATE BONDS - 58.39% (Continued) | | | | | | | | | | | | | | | | |
Real Estate Investment Trusts - 1.53% | | | | | | | | | | | | | | | | |
NorthStar Realty Finance Corp. | | | 09/30/2014 | | | | 3.000 | % | | | $ 462,000 | | | $ | 461,076 | |
| | | | | | | | | | | | | | | | |
| | | | |
Retail - 1.67% | | | | | | | | | | | | | | | | |
Brown Shoe Co., Inc. | | | 05/15/2019 | | | | 7.125 | % | | | 105,000 | | | | 110,909 | |
Cash America International, Inc. | | | 05/15/2018 | | | | 5.750 | % | | | 81,000 | | | | 83,025 | |
Darden Restaurants, Inc. | | | 11/01/2022 | | | | 3.350 | % | | | 160,000 | | | | 152,376 | |
Dave & Buster’s Entertainment, Inc.(d)(j) | | | 02/15/2016 | | | | 0.000 | % | | | 186,000 | | | | 158,100 | |
| | | | | | | | | | | | | | | | |
| | | | | | | | | | | | | | | 504,410 | |
| | | | | | | | | | | | | | | | |
Semiconductors - 1.32% | | | | | | | | | | | | | | | | |
Freescale Semiconductor, Inc. | | | 08/01/2020 | | | | 10.750 | % | | | 349,000 | | | | 397,424 | |
| | | | | | | | | | | | | | | | |
| | | | |
Telecommunications - 4.54% | | | | | | | | | | | | | | | | |
Cincinnati Bell, Inc. | | | 03/15/2018 | | | | 8.750 | % | | | 461,000 | | | | 483,474 | |
T-Mobile USA, Inc. | | | 04/28/2019 | | | | 6.464 | % | | | 403,000 | | | | 426,676 | |
West Corp. | | | 10/01/2018 | | | | 8.625 | % | | | 250,000 | | | | 265,000 | |
Windstream Corp. | | | 09/01/2018 | | | | 8.125 | % | | | 186,000 | | | | 195,765 | |
| | | | | | | | | | | | | | | | |
| | | | | | | | | | | | | | | 1,370,915 | |
| | | | | | | | | | | | | | | | |
| | | | |
TOTAL CORPORATE BONDS (Cost $17,651,186) | | | | | | | | | | | | | | | 17,620,253 | |
| | | | | | | | | | | | | | | | |
| | | | |
CONVERTIBLE CORPORATE BONDS - 11.96% | | | | | | | | | | | | | | | | |
Auto Parts & Equipment - 0.98% | | | | | | | | | | | | | | | | |
Meritor, Inc. | | | 03/01/2026 | | | | 7.875 | % | | | 180,000 | | | | 297,112 | |
| | | | | | | | | | | | | | | | |
| | | | |
Engineering & Construction - 1.18% | | | | | | | | | | | | | | | | |
Aecon Group, Inc. | | | 09/30/2014 | | | | 7.000 | % | | | 377,000 | | | | 354,644 | |
| | | | | | | | | | | | | | | | |
| | | | |
Lodging - 1.87% | | | | | | | | | | | | | | | | |
Morgans Hotel Group Co. | | | 10/15/2014 | | | | 2.375 | % | | | 570,000 | | | | 563,588 | |
| | | | | | | | | | | | | | | | |
| | | | |
Mining - 1.26% | | | | | | | | | | | | | | | | |
Primero Mining Corp. | | | 03/31/2016 | | | | 6.500 | % | | | 379,000 | | | | 379,000 | |
| | | | | | | | | | | | | | | | |
| | | | |
Oil & Gas - 1.36% | | | | | | | | | | | | | | | | |
BPZ Resources, Inc. | | | 10/01/2017 | | | | 8.500 | % | | | 352,000 | | | | 409,420 | |
| | | | | | | | | | | | | | | | |
See Notes to Financial Statements.
| | |
| 58 | | www.arbitragefunds.com | 1-800-295-4485 |
| | |
| The Arbitrage Credit Opportunities Fund | | Portfolio of Investments (continued) |
May 31, 2014
| | | | | | | | | | | | | | | | |
| | | Maturity
Date | | | Rate | | | Principal
Amount | | | Value | |
| |
CONVERTIBLE CORPORATE BONDS - 11.96% (Continued) | | | | | | | | | | | | | | | | |
Pharmaceuticals - 1.76% | | | | | | | | | | | | | | | | |
Omnicare, Inc. | | | 12/15/2035 | | | | 3.250 | % | | | $ 500,000 | | | $ | 531,875 | |
| | | | | | | | | | | | | | | | |
| | | | |
Telecommunications - 0.63% | | | | | | | | | | | | | | | | |
Globalstar, Inc., PIK (2.25% PIK) | | | 04/01/2028 | | | | 8.000 | % | | | 27,153 | | | | 146,423 | |
Nortel Networks Corp.(i) | | | 04/15/2014 | | | | 2.125 | % | | | 43,000 | | | | 43,860 | |
| | | | | | | | | | | | | | | | |
| | | | | | | | | | | | | | | 190,283 | |
| | | | | | | | | | | | | | | | |
Transportation - 2.92% | | | | | | | | | | | | | | | | |
DryShips, Inc. | | | 12/01/2014 | | | | 5.000 | % | | | 299,000 | | | | 293,767 | |
YRC Worldwide, Inc., Series A, PIK | | | 03/31/2015 | | | | 10.000 | % | | | 581,784 | | | | 587,602 | |
| | | | | | | | | | | | | | | | |
| | | | | | | | | | | | | | | 881,369 | |
| | | | | | | | | | | | | | | | |
| | | | |
TOTAL CONVERTIBLE CORPORATE BONDS (Cost $3,427,916) | | | | | | | | | | | | | | | 3,607,291 | |
| | | | | | | | | | | | | | | | |
| | | | |
| | | Expiration
Date | | | Exercise
Price | | | Contracts | | | Value | |
| |
PURCHASED OPTIONS(a)- 0.18% | | | | | | | | | | | | | | | | |
Call Options Purchased - 0.00%(k) | | | | | | | | | | | | | | | | |
Endeavour International Corp. | | | 06/2014 | | | $ | 5.00 | | | | 178 | | | $ | 445 | |
| | | | | | | | | | | | | | | | |
| | | | |
TOTAL CALL OPTIONS PURCHASED (Cost $1,902) | | | | | | | | | | | | | | | 445 | |
| | | | | | | | | | | | | | | | |
| | | | |
Put Options Purchased - 0.18% | | | | | | | | | | | | | | | | |
Endeavour International Corp. | | | 06/2014 | | | | 5.00 | | | | 178 | | | | 53,400 | |
| | | | | | | | | | | | | | | | |
| | | | |
TOTAL PUT OPTIONS PURCHASED (Cost $32,160) | | | | | | | | | | | | | | | 53,400 | |
| | | | | | | | | | | | | | | | |
| | | | |
TOTAL PURCHASED OPTIONS (Cost $34,062) | | | | | | | | | | | | | | | 53,845 | |
| | | | | | | | | | | | | | | | |
See Notes to Financial Statements.
| | |
| Annual Report | May 31, 2014 | | 59 |
| | |
| The Arbitrage Credit Opportunities Fund | | Portfolio of Investments (continued) |
May 31, 2014
| | | | | | | | | | | | |
| | | Yield | | | Shares | | | Value | |
| |
SHORT-TERM INVESTMENTS - 22.90% | | | | | | | | | | | | |
Time Deposits | | | | | | | | | | | | |
Euro Time Deposit | | | 0.010% | | | | 6,911,307 | | | $ | 6,911,307 | |
| | | | | | | | | | | | |
| | | |
TOTAL SHORT-TERM INVESTMENTS (Cost $6,911,307) | | | | | | | | | | | 6,911,307 | |
| | | | | | | | | | | | |
| | | |
Total Investments - 102.17% (Cost $30,662,832) | | | | | | | | | | | 30,831,619 | |
| | | |
Liabilities in Excess of Other Assets - (2.17%) | | | | | | | | | | | (656,114) | |
| | | | | | | | | | | | |
| | | |
NET ASSETS - 100.00% | | | | | | | | | | $ | 30,175,505 | |
| | | | | | | | | | | | |
| (a) | Non-income-producing security. |
| (b) | Interest rate will change at a future date. Interest rate shown reflects the rate in effect at May 31, 2014. |
| (c) | This security has no contractual maturity date, is not redeemable and contractually pays an indefinite stream of interest. |
| (d) | Security exempt from registration under Rule 144A of the Securities Act of 1933. These securities may be resold in transactions exempt from registration, normally to qualified institutional buyers. As of May 31, 2014, these securities had a total value of $5,766,065 or 19.11% of net assets. |
| (e) | Security, or a portion of security, is being held as collateral for short sales or written option contracts. At period end, the aggregate market value of those securities was $1,219,148, representing 4.04% of net assets. |
| (f) | Represents a step-up bond. Rate disclosed is as of May 31, 2014. |
| (g) | Security considered illiquid. On May 31, 2014, the total market value of these securities was $5,994, representing 0.02% of net assets. |
| (h) | Security fair valued using methods determined in good faith by the Pricing Committee. As of May 31, 2014, the total market value of these securities was $5,994, representing 0.02% of net assets. |
| (i) | Security in default on interest payments. |
| (j) | Represents a zero coupon bond. |
| (k) | Less than 0.005% of Net Assets. |
Securities determined to be illiquid under the procedures approved by the Funds’ Board of Trustees. Information related to the illiquid securities is as follows:
| | | | | | | | | | | | | | |
Date(s) of Purchase | | Security | | Cost | | | Market Value | | | % of Net Assets | |
| |
12/12/2013 | | Savient Pharmaceuticals, Inc. | | $ | 7,706 | | | $ | 5,994 | | | | 0.02% | |
| | | | | | | | | | |
| | | | | | | | $ | 5,994 | | | | 0.02% | |
| | | | | | | | | | |
See Notes to Financial Statements.
| | |
| 60 | | www.arbitragefunds.com | 1-800-295-4485 |
| | |
| The Arbitrage Credit Opportunities Fund | | Portfolio of Investments (continued) |
May 31, 2014
| | | | | | | | |
| SCHEDULE OF SECURITIES SOLD SHORT | | Shares | | | Value | |
| |
COMMON STOCKS - (1.20%) | | | | | | | | |
Auto Parts & Equipment - (0.51%) | | | | | | | | |
Meritor, Inc. | | | (11,179 | ) | | $ | (154,382) | |
| | | | | | | | |
| | |
Engineering & Construction - (0.16%) | | | | | | | | |
Aecon Group, Inc. | | | (3,160 | ) | | | (49,106) | |
| | | | | | | | |
| | |
Oil & Gas - (0.45%) | | | | | | | | |
BPZ Resources, Inc. | | | (44,049 | ) | | | (134,790) | |
| | | | | | | | |
| | |
Telecommunications - (0.08%) | | | | | | | | |
Globalstar, Inc. | | | (6,827 | ) | | | (23,622) | |
| | | | | | | | |
| | |
TOTAL COMMON STOCKS (Proceeds $321,638) | | | | | | | (361,900) | |
| | | | | | | | |
| | |
EXCHANGE-TRADED FUNDS - (0.99%) | | | | | | | | |
Equity Fund - (0.99%) | | | | | | | | |
SPDR® Barclays High Yield Bond ETF Trust | | | (7,200 | ) | | | (299,016) | |
| | | | | | | | |
| | |
TOTAL EXCHANGE-TRADED FUNDS (Proceeds $282,679) | | | | | | | (299,016) | |
| | | | | | | | |
| | | | | | | | | | | | | | | | |
| | | Maturity Date | | | Rate | | | Principal
Amount | | | Value | |
| |
CORPORATE BONDS - (1.72%) | | | | | | | | | | | | | | | | |
Pipelines - (0.14%) | | | | | | | | | | | | | | | | |
Kinder Morgan Energy Partners LP | | | 09/01/2022 | | | | 3.950% | | | | $ (42,000) | | | $ | (42,740) | |
| | | | | | | | | | | | | | | | |
| | | | |
Telecommunications - (1.58%) | | | | | | | | | | | | | | | | |
SoftBank Corp. | | | 04/15/2020 | | | | 4.500% | | | | (41,000) | | | | (41,513) | |
T-Mobile USA, Inc. | | | 04/01/2023 | | | | 6.625% | | | | (403,000) | | | | (435,240) | |
| | | | | | | | | | | | | | | | |
| | | | | | | | | | | | | | | (476,753) | |
| | | | | | | | | | | | | | | | |
| | | | |
TOTAL CORPORATE BONDS (Proceeds $513,579) | | | | | | | | | | | | | | | (519,493) | |
| | | | | | | | | | | | | | | | |
See Notes to Financial Statements.
| | |
| Annual Report | May 31, 2014 | | 61 |
| | |
| The Arbitrage Credit Opportunities Fund | | Portfolio of Investments (continued) |
May 31, 2014
| | | | | | | | | | | | | | | | |
| | | Maturity Date | | | Rate | | | Principal
Amount | | | Value | |
| |
CONVERTIBLE CORPORATE BONDS - (0.99%) | | | | | | | | | | | | | | | | |
Oil & Gas Services - (0.99%) | | | | | | | | | | | | | | | | |
Hornbeck Offshore Services, Inc. | | | 09/01/2019 | | | | 1.500% | | | $ | (250,000) | | | $ | (299,687) | |
| | | | | | | | | | | | | | | | |
| | | | |
TOTAL CONVERTIBLE CORPORATE BONDS (Proceeds $292,951) | | | | | | | | | | | | | | | (299,687) | |
| | | | | | | | | | | | | | | | |
| | | | |
TOTAL SECURITIES SOLD SHORT (Proceeds $1,410,847) | | | | | | | | | | | | | | $ | (1,480,096) | |
| | | | | | | | | | | | | | | | |
| | | | |
SCHEDULE OF WRITTEN OPTIONS | | Expiration
Date | | | Exercise Price | | | Contracts | | | Value | |
| |
Written Call Options | | | | | | | | | | | | | | | | |
Omnicare, Inc. | | | 06/2014 | | | | $ 65.00 | | | | (22) | | | $ | (1,100) | |
| | | | | | | | | | | | | | | | |
| | | | |
TOTAL WRITTEN CALL OPTIONS (Premiums received $2,185) | | | | | | | | | | | | | | $ | (1,100) | |
| | | | | | | | | | | | | | | | |
See Notes to Financial Statements.
| | |
| 62 | | www.arbitragefunds.com | 1-800-295-4485 |
| | |
| The Arbitrage Credit Opportunities Fund | | Portfolio of Investments (continued) |
May 31, 2014
OUTSTANDING FORWARD FOREIGN CURRENCY EXCHANGE CONTRACTS
| | | | | | | | | | | | | | | | |
Contract
Description | | Contracts to
Deliver/Receive | | | Purchase/
Sale
Contract | | Expiration
Date | | Current Value | | | Unrealized
Appreciation | |
| |
CAD | | | 15,000 | | | Purchase | | 06/16/2014 | | | 13,828 | | | $ | 47 | |
| | | | | | | | | | | | | | | | |
| | | | | | | | | | | | | | $ | 47 | |
| | | | | | | | | | | | | | | | |
| | | | | |
Contract
Description | | Contracts to
Deliver/Receive | | | Purchase/
Sale
Contract | | Expiration
Date | | Current Value | | | Unrealized
Depreciation | |
| |
CAD | | | 914,000 | | | Sale | | 06/16/2014 | | | 842,592 | | | $ | (18,874) | |
| | | | | | | | | | | | | | | | |
| | | | | | | | | | | | | | $ | (18,874) | |
| | | | | | | | | | | | | | | | |
See Notes to Financial Statements.
| | |
| Annual Report | May 31, 2014 | | 63 |
| | |
| The Arbitrage Credit Opportunities Fund | | Portfolio of Investments (continued) |
May 31, 2014
| | | | |
| Country | | % of Net Assets(a) | |
| |
Canada | | | 5.21% | |
Ireland | | | 3.73% | |
Cayman Islands | | | 2.43% | |
Marshall Islands | | | 0.97% | |
United States | | | 89.83% | |
Liabilities in Excess of Other Assets | | | (2.17)% | |
| | | | |
| | | 100.00% | |
| | | | |
| (a) | These percentages represent long positions only and are not net of short positions. |
Abbreviations:
CAD - Canadian Dollar
ETF - Exchange-Traded Fund
LLC - Limited Liability Company
LP - Limited Partnership
Ltd. - Limited
PIK - Payment-in-kind
SA - Generally designates corporations in various countries, mostly those employing civil law. This translates literally in all languages mentioned as anonymous
company
SPDR - Standard & Poor’s Depositary Receipt
See Notes to Financial Statements.
| | |
| 64 | | www.arbitragefunds.com | 1-800-295-4485 |
| | |
| The Arbitrage Credit Opportunities Fund | | |
May 31, 2014
The following is a summary of the inputs used as of May 31, 2014, in valuing the Arbitrage Credit Opportunities Fund’s investments carried at value:
Investments in Securities at Value
| | | | | | | | | | | | | | | | |
| | | Level 1 | | | Level 2 | | | Level 3 | | | Total | |
| |
Assets | | | | | | | | | | | | | | | | |
Common Stocks** | | $ | 126,672 | | | $ | – | | | $ | – | | | $ | 126,672 | |
Preferred Stocks | | | 31,853 | | | | – | | | | – | | | | 31,853 | |
Bank Loans | | | – | | | | 2,480,398 | | | | – | | | | 2,480,398 | |
Corporate Bonds | | | – | | | | 17,614,259 | | | | 5,994 | | | | 17,620,253 | |
Convertible Corporate Bonds | | | – | | | | 3,607,291 | | | | – | | | | 3,607,291 | |
Purchased Options | | | 53,845 | | | | – | | | | – | | | | 53,845 | |
Short-Term Investments | | | 6,911,307 | | | | – | | | | – | | | | 6,911,307 | |
| |
TOTAL | | $ | 7,123,677 | | | $ | 23,701,948 | | | $ | 5,994 | | | $ | 30,831,619 | |
| |
| | | | | | | | | | | | | | | | |
| |
Other Financial Instruments* | | | | | | | | | | | | | | | | |
| |
Assets | | | | | | | | | | | | | | | | |
Forward Foreign Currency Exchange Contracts | | $ | – | | | $ | 47 | | | $ | – | | | $ | 47 | |
Liabilities | | | | | | | | | | | | | | | | |
Common Stocks** | | | (361,900) | | | | – | | | | – | | | | (361,900) | |
Exchange-Traded Funds | | | (299,016) | | | | – | | | | – | | | | (299,016) | |
Corporate Bonds | | | – | | | | (519,493) | | | | – | | | | (519,493) | |
Convertible Corporate Bonds | | | – | | | | (299,687) | | | | – | | | | (299,687) | |
Written Options | | | (1,100) | | | | – | | | | – | | | | (1,100) | |
Forward Foreign Currency Exchange Contracts | | | – | | | | (18,874) | | | | – | | | | (18,874) | |
| |
TOTAL | | $ | (662,016) | | | $ | (858,007) | | | $ | – | | | $ | (1,500,023) | |
| |
| * | Other financial instruments are instruments such as written options, securities sold short, swaps and forward foreign currency exchange contracts. |
| ** | Refer to Portfolio of Investments for sector information. |
See Notes to Financial Statements.
| | |
| Annual Report | May 31, 2014 | | 65 |
| | |
| The Arbitrage Credit Opportunities Fund | | |
May 31, 2014
The following is a reconciliation of the fair valuations using significant unobservable inputs (Level 3) for the Fund’s assets and liabilities during the year ended May 31, 2014:
| | | | | | | | | | | | | | | | | | | | | | | | | | | | | | | | | | | | | | | | |
Investments in Securities | | Balance
as of
May 31, 2013 | | | Return of
Capital | | | Realized
Gain/(Loss) | | | Change in
Unrealized
Depreciation | | | Purchases | | | Sales
Proceeds | | | Transfer
into
Level 3 | | | Transfer
out of
Level 3 | | | Balance as of
May 31, 2014 | | | Net change in
unrealized
depreciation
included in
the
Statements of
Operations
attributable to
Level 3
investments
held at
May 31, 2014 | |
| |
Corporate Bonds | | $ | – | | | $ | (177,192 | ) | | $ | – | | | $ | (1,712 | ) | | $ | 184,898 | | | $ | – | | | $ | – | | | $ | – | | | $ | 5,994 | | | $ | (1,712) | |
| |
Total | | $ | – | | | $ | (177,192 | ) | | $ | – | | | $ | (1,712 | ) | | $ | 184,898 | | | $ | – | | | $ | – | | | $ | – | | | $ | 5,994 | | | $ | (1,712) | |
| |
See Notes to Financial Statements.
| | |
| 66 | | www.arbitragefunds.com | 1-800-295-4485 |
| | |
| The Arbitrage Fund | | Statement of Assets and Liabilities |
May 31, 2014
| | | | |
ASSETS | | | | |
Investments: | | | | |
At cost | | $ | 2,420,637,079 | |
| | | | |
At value (Note 2) | | $ | 2,479,824,591 | |
Cash | | | 151,441,127 | |
Cash denominated in foreign currency (Cost $8,416,852) | | | 8,413,472 | |
Deposits with brokers for securities sold short (Note 2) | | | 794,510,222 | |
Deposits with brokers for swaps (Note 2) | | | 40,310,983 | |
Receivable for investment securities sold | | | 108,216,718 | |
Receivable for capital shares sold | | | 9,542,044 | |
Unrealized appreciation on forward foreign currency exchange contracts (Note 8) | | | 5,134,842 | |
Unrealized appreciation on equity swap contracts | | | 293,130 | |
Dividends and interest receivable | | | 1,148,030 | |
Prepaid expenses and other assets | | | 124,628 | |
| | | | |
Total Assets | | | 3,598,959,787 | |
| | | | |
LIABILITIES | | | | |
Securities sold short, at value (Note 2) (proceeds $883,769,134) | | | 926,155,028 | |
Written options, at value (Note 2) (premiums received $1,678,203) | | | 1,289,356 | |
Payable to custodian | | | 31,828 | |
Payable for investment securities purchased | | | 132,885,907 | |
Payable for swap contract payments | | | 20,163 | |
Unrealized depreciation on forward foreign currency exchange contracts (Note 8) | | | 9,523,659 | |
Unrealized depreciation on equity swap contracts | | | 15,363 | |
Payable for capital shares redeemed | | | 9,494,476 | |
Payable to Advisor (Note 6) | | | 2,236,199 | |
Dividends payable on securities sold short (Note 2) | | | 3,152,551 | |
Payable to Distributor (Note 6) | | | 192,670 | |
Payable to Administrator (Note 6) | | | 227,486 | |
Interest expense payable | | | 325,617 | |
Payable to Trustees | | | 43,868 | |
Payable to Chief Compliance Officer (Note 6) | | | 56,586 | |
Other accrued expenses and liabilities | | | 194,935 | |
| | | | |
Total Liabilities | | | 1,085,845,692 | |
| | | | |
NET ASSETS | | $ | 2,513,114,095 | |
| | | | |
NET ASSETS CONSIST OF: | | | | |
Paid-in capital | | $ | 2,542,199,993 | |
Accumulated net investment loss | | | (13,485,183) | |
Accumulated net realized loss on investments, equity swap contracts, securities sold short, written option contracts and foreign currencies | | | (28,750,383) | |
Net unrealized appreciation on investments, equity swap contracts, securities sold short, written option contracts and translation of assets and liabilities denominated in foreign currencies | | | 13,149,668 | |
| | | | |
NET ASSETS | | $ | 2,513,114,095 | |
| | | | |
See Notes to Financial Statements.
| | |
| Annual Report | May 31, 2014 | | 67 |
| | |
| The Arbitrage Fund | | Statement of Assets and Liabilities |
May 31, 2014
| | | | |
PRICING OF SHARES: | | | | |
CLASS R SHARES: | | | | |
Net assets applicable to Class R shares | | $ | 760,749,719 | |
Shares of beneficial interest outstanding (unlimited number of shares authorized, no par value) | | | 60,460,025 | |
Net asset value and offering price per share(a) | | $ | 12.58 | |
CLASS I SHARES: | | | | |
Net assets applicable to Class I shares | | $ | 1,712,119,772 | |
Shares of beneficial interest outstanding (unlimited number of shares authorized, no par value) | | | 133,167,976 | |
Net asset value and offering price per share(a) | | $ | 12.86 | |
CLASS C SHARES: | | | | |
Net assets applicable to Class C shares | | $ | 33,589,270 | |
Shares of beneficial interest outstanding (unlimited number of shares authorized, no par value) | | | 2,715,524 | |
Net asset value and offering price per share(a) | | $ | 12.37 | |
CLASS A SHARES: | | | | |
Net assets applicable to Class A shares | | $ | 6,655,334 | |
Shares of beneficial interest outstanding (unlimited number of shares authorized, no par value) | | | 528,643 | |
Net asset value and offering price per share(a) | | $ | 12.59 | |
Maximum offering price per share (NAV/0.975, based on maximum sales charge of 2.50% of the offering price) | | $ | 12.91 | |
| (a) | Redemption price varies based on length of time held (Note 1). |
See Notes to Financial Statements.
| | |
| 68 | | www.arbitragefunds.com | 1-800-295-4485 |
| | |
| The Arbitrage Event-Driven Fund | | Statement of Assets and Liabilities |
May 31, 2014
| | | | |
ASSETS | | | | |
Investments: | | | | |
At cost | | $ | 497,503,593 | |
| | | | |
At value (Note 2) | | $ | 508,267,509 | |
Cash | | | 1,761 | |
Deposits with brokers for securities sold short (Note 2) | | | 122,363,859 | |
Deposits with brokers for swaps (Note 2) | | | 335,603 | |
Receivable for investment securities sold | | | 13,841,883 | |
Receivable for capital shares sold | | | 4,290,763 | |
Unrealized appreciation on forward foreign currency exchange contracts (Note 8) | | | 299,482 | |
Dividends and interest receivable | | | 3,463,909 | |
Prepaid expenses and other assets | | | 64,922 | |
| | | | |
Total Assets | | | 652,929,691 | |
| | | | |
LIABILITIES | | | | |
Securities sold short, at value (Note 2) (proceeds $118,435,384) | | | 122,773,430 | |
Written options, at value (Note 2) (premiums received $214,729) | | | 174,507 | |
Payable to custodian | | | 7,636 | |
Payable to foreign custodian (Cost $459,242) | | | 461,281 | |
Payable for investment securities purchased | | | 24,218,180 | |
Payable for swap contract payments | | | 161 | |
Unrealized depreciation on forward foreign currency exchange contracts (Note 8) | | | 868,896 | |
Unrealized depreciation on equity swap contracts | | | 1,019 | |
Payable for capital shares redeemed | | | 466,975 | |
Payable to Advisor (Note 6) | | | 444,868 | |
Dividends payable on securities sold short (Note 2) | | | 199,668 | |
Payable to Distributor (Note 6) | | | 46,471 | |
Payable to Administrator (Note 6) | | | 24,421 | |
Interest expense payable | | | 49,745 | |
Payable to Trustees | | | 7,687 | |
Payable to Chief Compliance Officer (Note 6) | | | 9,462 | |
Other accrued expenses and liabilities | | | 59,637 | |
| | | | |
Total Liabilities | | | 149,814,044 | |
| | | | |
NET ASSETS | | $ | 503,115,647 | |
| | | | |
NET ASSETS CONSIST OF: | | | | |
Paid-in capital | | $ | 493,981,206 | |
Accumulated net investment income | | | 1,688,131 | |
Accumulated net realized gain on investments, equity swap contracts, securities sold short, written option contracts and foreign currencies | | | 1,545,164 | |
Net unrealized appreciation on investments, equity swap contracts, securities sold short, written option contracts and translation of assets and liabilities denominated in foreign currencies | | | 5,901,146 | |
| | | | |
NET ASSETS | | $ | 503,115,647 | |
| | | | |
See Notes to Financial Statements.
| | |
| Annual Report | May 31, 2014 | | 69 |
| | |
| The Arbitrage Event-Driven Fund | | Statement of Assets and Liabilities |
May 31, 2014
| | | | |
PRICING OF SHARES: | | | | |
CLASS R SHARES: | | | | |
Net assets applicable to Class R shares | | $ | 204,055,085 | |
Shares of beneficial interest outstanding (unlimited number of shares authorized, no par value) | | | 19,821,462 | |
Net asset value and offering price per share(a) | | $ | 10.29 | |
CLASS I SHARES: | | | | |
Net assets applicable to Class I shares | | $ | 290,998,646 | |
Shares of beneficial interest outstanding (unlimited number of shares authorized, no par value) | | | 28,055,740 | |
Net asset value and offering price per share(a) | | $ | 10.37 | |
CLASS C SHARES: | | | | |
Net assets applicable to Class C shares | | $ | 4,231,591 | |
Shares of beneficial interest outstanding (unlimited number of shares authorized, no par value) | | | 414,063 | |
Net asset value and offering price per share(a) | | $ | 10.22 | |
CLASS A SHARES: | | | | |
Net assets applicable to Class A shares | | $ | 3,830,325 | |
Shares of beneficial interest outstanding (unlimited number of shares authorized, no par value) | | | 371,914 | |
Net asset value and offering price per share(a) | | $ | 10.30 | |
Maximum offering price per share (NAV/0.975, based on maximum sales charge of 2.50% of the offering price) | | $ | 10.56 | |
| (a) | Redemption price varies based on length of time held (Note 1). |
See Notes to Financial Statements.
| | |
| 70 | | www.arbitragefunds.com | 1-800-295-4485 |
| | |
| The Arbitrage Credit Opportunities Fund | | Statement of Assets and Liabilities |
May 31, 2014
| | | | |
ASSETS | | | | |
Investments: | | | | |
At cost | | $ | 30,662,832 | |
| | | | |
At value (Note 2) | | $ | 30,831,619 | |
Deposits with brokers for securities sold short (Note 2) | | | 1,471,121 | |
Receivable for capital shares sold | | | 154,212 | |
Unrealized appreciation on forward foreign currency exchange contracts (Note 8) | | | 47 | |
Dividends and interest receivable | | | 451,159 | |
Receivable due from Advisor | | | 3,849 | |
Prepaid expenses and other assets | | | 19,110 | |
| | | | |
Total Assets | | | 32,931,117 | |
| | | | |
LIABILITIES | | | | |
Securities sold short, at value (Note 2) (proceeds $1,410,847) | | | 1,480,096 | |
Written options, at value (Note 2) (premiums received $2,185) | | | 1,100 | |
Payable to custodian | | | 1,031 | |
Payable for investment securities purchased | | | 947,023 | |
Unrealized depreciation on forward foreign currency exchange contracts (Note 8) | | | 18,874 | |
Payable for capital shares redeemed | | | 261,835 | |
Payable to Distributor (Note 6) | | | 1,677 | |
Payable to Administrator (Note 6) | | | 6,776 | |
Interest expense payable | | | 918 | |
Audit and legal fees payable | | | 30,080 | |
Payable to Trustees | | | 498 | |
Payable to Chief Compliance Officer (Note 6) | | | 619 | |
Other accrued expenses and liabilities | | | 5,085 | |
| | | | |
Total Liabilities | | | 2,755,612 | |
| | | | |
NET ASSETS | | $ | 30,175,505 | |
| | | | |
NET ASSETS CONSIST OF: | | | | |
Paid-in capital | | $ | 29,811,563 | |
Accumulated net investment income | | | 302,126 | |
Accumulated net realized loss on investments, securities sold short, written option contracts and foreign currencies | | | (20,177) | |
Net unrealized appreciation on investments, securities sold short, written option contracts and translation of assets and liabilities denominated in foreign currencies | | | 81,993 | |
| | | | |
NET ASSETS | | $ | 30,175,505 | |
| | | | |
See Notes to Financial Statements.
| | |
| Annual Report | May 31, 2014 | | 71 |
| | |
| The Arbitrage Credit Opportunities Fund | | Statement of Assets and Liabilities |
May 31, 2014
| | | | |
PRICING OF SHARES: | | | | |
CLASS R SHARES: | | | | |
Net assets applicable to Class R shares | | $ | 6,392,736 | |
Shares of beneficial interest outstanding (unlimited number of shares authorized, no par value) | | | 621,960 | |
Net asset value and offering price per share(a) | | $ | 10.28 | |
CLASS I SHARES: | | | | |
Net assets applicable to Class I shares | | $ | 23,038,999 | |
Shares of beneficial interest outstanding (unlimited number of shares authorized, no par value) | | | 2,247,959 | |
Net asset value and offering price per share(a) | | $ | 10.25 | |
CLASS C SHARES: | | | | |
Net assets applicable to Class C shares | | $ | 715,536 | |
Shares of beneficial interest outstanding (unlimited number of shares authorized, no par value) | | | 69,965 | |
Net asset value and offering price per share(a) | | $ | 10.23 | |
CLASS A SHARES: | | | | |
Net assets applicable to Class A shares | | $ | 28,234 | |
Shares of beneficial interest outstanding (unlimited number of shares authorized, no par value) | | | 2,754 | |
Net asset value and offering price per share(a) | | $ | 10.25 | |
Maximum offering price per share (NAV/0.975, based on maximum sales charge of 2.50% of the offering price) | | $ | 10.51 | |
| (a) | Redemption price varies based on length of time held (Note 1). |
See Notes to Financial Statements.
| | |
| 72 | | www.arbitragefunds.com | 1-800-295-4485 |
| | |
| The Arbitrage Fund | | Statement of Operations |
For the Year Ended May 31, 2014
| | | | |
INVESTMENT INCOME | | | | |
Dividends | | $ | 41,712,997 | |
Foreign taxes withheld | | | (683,333) | |
Interest income | | | 8,664 | |
| | | | |
Total Income | | | 41,038,328 | |
| | | | |
EXPENSES | | | | |
Investment advisory fees (Note 6) | | | 28,402,946 | |
Distribution and service fees (Note 6) | | | | |
Class R | | | 2,159,660 | |
Class C | | | 296,242 | |
Class A | | | 7,314 | |
Administrative fees (Note 6) | | | 534,373 | |
Chief Compliance Officer fees (Note 6) | | | 370,706 | |
Trustees’ fees | | | 230,659 | |
Dividend expense | | | 16,634,782 | |
Interest rebate expense | | | 3,145,579 | |
Transfer agent fees (Note 6) | | | 2,028,348 | |
Custodian and bank service fees | | | 217,752 | |
Registration and filing fees | | | 113,853 | |
Printing of shareholder reports | | | 315,359 | |
Professional fees | | | 276,718 | |
Line of credit interest expense (Note 4) | | | 347,865 | |
Insurance expense | | | 124,766 | |
Principal Financial Officer fees (Note 6) | | | 9,292 | |
Other expenses | | | 77,223 | |
| | | | |
Total Expenses | | | 55,293,437 | |
NET INVESTMENT LOSS | | | (14,255,109) | |
| | | | |
REALIZED AND UNREALIZED GAINS (LOSSES) ON INVESTMENTS AND FOREIGN CURRENCIES | | | | |
Net realized gains (losses) from: | | | | |
Investments | | | 166,698,999 | |
Equity swap contracts | | | 3,195,833 | |
Securities sold short | | | (161,504,776) | |
Written option contracts | | | 7,982,820 | |
Foreign currency transactions (Note 8) | | | (11,922,084) | |
Net change in unrealized appreciation (depreciation) on: | | | | |
Investments | | | 47,545,817 | |
Equity swap contracts | | | (812,504) | |
Securities sold short | | | 5,706,869 | |
Written option contracts | | | 4,001,952 | |
Foreign currency transactions (Note 8) | | | (11,101,045) | |
| | | | |
NET REALIZED AND UNREALIZED GAINS ON INVESTMENTS AND FOREIGN CURRENCIES | | | | |
| | | 49,791,881 | |
| | | | |
NET INCREASE IN NET ASSETS RESULTING FROM OPERATIONS | | $ | 35,536,772 | |
| | | | |
See Notes to Financial Statements.
| | |
| Annual Report | May 31, 2014 | | 73 |
| | |
| The Arbitrage Event-Driven Fund | | Statement of Operations |
For the Year Ended May 31, 2014
| | | | |
INVESTMENT INCOME | | | | |
Dividends | | $ | 1,734,270 | |
Foreign taxes withheld | | | (32,312) | |
Interest income | | | 4,917,344 | |
| | | | |
Total Income | | | 6,619,302 | |
| | | | |
EXPENSES | | | | |
Investment advisory fees (Note 6) | | | 2,462,220 | |
Distribution and service fees (Note 6) | | | | |
Class R | | | 179,606 | |
Class C | | | 13,884 | |
Class A | | | 3,829 | |
Administrative fees (Note 6) | | | 50,324 | |
Chief Compliance Officer fees (Note 6) | | | 26,999 | |
Trustees’ fees | | | 19,761 | |
Dividend expense | | | 958,034 | |
Interest rebate expense | | | 258,366 | |
Transfer agent fees (Note 6) | | | 154,150 | |
Custodian and bank service fees | | | 30,525 | |
Registration and filing fees | | | 78,291 | |
Printing of shareholder reports | | | 14,023 | |
Professional fees | | | 54,793 | |
Line of credit interest expense (Note 4) | | | 322 | |
Insurance expense | | | 2,561 | |
Principal Financial Officer fees (Note 6) | | | 654 | |
Other expenses | | | 27,906 | |
| | | | |
Total Expenses | | | 4,336,248 | |
Fees waived by the Advisor, Class R (Note 6) | | | (16,826) | |
Fees waived by the Advisor, Class I (Note 6) | | | (67,294) | |
Fees waived by the Advisor, Class C (Note 6) | | | (854) | |
Fees waived by the Advisor, Class A (Note 6) | | | (756) | |
| | | | |
Net Expenses | | | 4,250,518 | |
| | | | |
See Notes to Financial Statements.
| | |
| 74 | | www.arbitragefunds.com | 1-800-295-4485 |
| | |
| The Arbitrage Event-Driven Fund | | Statement of Operations |
For the Year Ended May 31, 2014
| | | | |
NET INVESTMENT INCOME | | | 2,368,784 | |
| | | | |
REALIZED AND UNREALIZED GAINS (LOSSES) ON INVESTMENTS AND FOREIGN CURRENCIES | | | | |
Net realized gains (losses) from: | | | | |
Investments | | | 8,782,816 | |
Equity swap contracts | | | 42,732 | |
Securities sold short | | | (7,485,992) | |
Written option contracts | | | 1,120,840 | |
Foreign currency transactions (Note 8) | | | (35,564) | |
Net change in unrealized appreciation (depreciation) on: | | | | |
Investments | | | 10,391,083 | |
Equity swap contracts | | | (19,250) | |
Securities sold short | | | (3,833,021) | |
Written option contracts | | | 81,261 | |
Foreign currency transactions (Note 8) | | | (682,178) | |
| | | | |
NET REALIZED AND UNREALIZED GAINS ON INVESTMENTS AND FOREIGN CURRENCIES | | | | |
| | | 8,362,727 | |
| | | | |
NET INCREASE IN NET ASSETS RESULTING FROM OPERATIONS | | $ | 10,731,511 | |
| | | | |
See Notes to Financial Statements.
| | |
| Annual Report | May 31, 2014 | | 75 |
| | |
| The Arbitrage Credit Opportunities Fund | | Statement of Operations |
For the Year Ended May 31, 2014
| | | | |
INVESTMENT INCOME | | | | |
Dividends | | $ | 4,993 | |
Interest income | | | 871,367 | |
| | | | |
Total Income | | | 876,360 | |
| | | | |
EXPENSES | | | | |
Investment advisory fees (Note 6) | | | 156,841 | |
Distribution and service fees (Note 6) | | | | |
Class R | | | 8,742 | |
Class C | | | 1,426 | |
Class A | | | 48 | |
Administrative fees (Note 6) | | | 10,103 | |
Chief Compliance Officer fees (Note 6) | | | 2,291 | |
Trustees’ fees | | | 1,561 | |
Dividend expense | | | 14,715 | |
Interest rebate expense | | | 11,266 | |
Transfer agent fees (Note 6) | | | 54,898 | |
Custodian and bank service fees | | | 5,016 | |
Registration and filing fees | | | 52,123 | |
Printing of shareholder reports | | | 1,851 | |
Professional fees | | | 35,067 | |
Insurance expense | | | 187 | |
Offering cost | | | 9,778 | |
Principal Financial Officer fees (Note 6) | | | 54 | |
Other expenses | | | 18,406 | |
| | | | |
Total Expenses | | | 384,373 | |
Fees waived by the Advisor, Class R (Note 6) | | | (36,515) | |
Fees waived by the Advisor, Class I (Note 6) | | | (113,965) | |
Fees waived by the Advisor, Class C (Note 6) | | | (1,393) | |
Fees waived by the Advisor, Class A (Note 6) | | | (214) | |
| | | | |
Net Expenses | | | 232,286 | |
| | | | |
NET INVESTMENT INCOME | | | 644,074 | |
| | | | |
REALIZED AND UNREALIZED GAINS (LOSSES) ON INVESTMENTS AND FOREIGN CURRENCIES | | | | |
Net realized gains (losses) from: | | | | |
Investments | | | 5,433 | |
Securities sold short | | | (18,728) | |
Written option contracts | | | 3,477 | |
Foreign currency transactions (Note 8) | | | 21,902 | |
Long-term capital gains from other investment companies | | | 1,068 | |
Net change in unrealized appreciation (depreciation) on: | | | | |
Investments | | | 126,399 | |
Securities sold short | | | (69,806) | |
Written option contracts | | | 1,085 | |
Foreign currency transactions (Note 8) | | | (22,330) | |
| | | | |
NET REALIZED AND UNREALIZED GAINS ON INVESTMENTS AND FOREIGN CURRENCIES | | | 48,500 | |
| | | | |
NET INCREASE IN NET ASSETS RESULTING FROM OPERATIONS | | $ | 692,574 | |
| | | | |
See Notes to Financial Statements.
| | |
| 76 | | www.arbitragefunds.com | 1-800-295-4485 |
| | |
| The Arbitrage Fund | | Statements of Changes in Net Assets |
| | | | | | | | |
| | | Year Ended | | | Year Ended | |
| | | May 31, 2014 | | | May 31, 2013 | |
| |
| | |
FROM OPERATIONS: | | | | | | | | |
Net investment loss | | $ | (14,255,109) | | | $ | (18,376,785) | |
Net realized gains (losses) from: | | | | | | | | |
Investments and equity swap contracts | | | 169,894,832 | | | | 150,085,954 | |
Securities sold short | | | (161,504,776) | | | | (129,289,719) | |
Written option contracts | | | 7,982,820 | | | | 19,279,647 | |
Foreign currency transactions | | | (11,922,084) | | | | (1,755,446) | |
Long-term capital gains from other investment companies | | | – | | | | N/A | |
Net change in unrealized appreciation (depreciation) on: | | | | | | | | |
Investments and equity swap contracts | | | 46,733,313 | | | | 76,337,378 | |
Securities sold short | | | 5,706,869 | | | | (58,720,755) | |
Written option contracts | | | 4,001,952 | | | | (5,734,824) | |
Foreign currency transactions | | | (11,101,045) | | | | (16,844,153) | |
| | | | |
Net increase in net assets resulting from operations | | | 35,536,772 | | | | 14,981,297 | |
| | | | |
FROM DIVIDENDS AND DISTRIBUTIONS TO SHAREHOLDERS: | | | | | |
NET INVESTMENT INCOME | | | | | | | | |
Distributions from net investment income, Class R | | | – | | | | (7,357,507) | |
Distributions from net investment income, Class I | | | – | | | | (19,481,923) | |
Distributions from net investment income, Class C | | | – | | | | (53,643) | |
NET REALIZED GAINS | | | | | | | | |
Distributions from net realized gains, Class R | | | (4,128,037) | | | | (20,078,884) | |
Distributions from net realized gains, Class I | | | (8,030,095) | | | | (39,477,805) | |
Distributions from net realized gains, Class C | | | (148,724) | | | | (108,702) | |
Distributions from net realized gains, Class A | | | (12,942) | | | | – | |
| | | | |
Decrease in net assets from distributions to shareholders | | | (12,319,798) | | | | (86,558,464) | |
| | | | |
See Notes to Financial Statements.
| | |
| Annual Report | May 31, 2014 | | 77 |
| | |
| The Arbitrage Fund | | Statements of Changes in Net Assets |
| | | | | | | | |
| | | Year Ended | | | Year Ended | |
| | | May 31, 2014 | | | May 31, 2013 | |
| |
| | |
FROM CAPITAL SHARE TRANSACTIONS (NOTE 7): | | | | | | | | |
CLASS R | | | | | | | | |
Proceeds from shares sold | | | 363,576,930 | | | | 402,159,958 | |
Shares issued in reinvestment of distributions | | | 4,086,744 | | | | 27,131,307 | |
Proceeds from redemption fees collected (Note 2) | | | 46,167 | | | | 38,339 | |
Payments for shares redeemed | | | (529,535,717) | | | | (492,205,896) | |
| | | | |
Net decrease in net assets from Class R share transactions | | | (161,825,876) | | | | (62,876,292) | |
| | | | |
CLASS I | | | | | | | | |
Proceeds from shares sold | | | 725,650,546 | | | | 946,778,145 | |
Shares issued in reinvestment of distributions | | | 4,762,186 | | | | 33,907,193 | |
Proceeds from redemption fees collected (Note 2) | | | 26,523 | | | | 28,661 | |
Payments for shares redeemed | | | (973,253,859) | | | | (1,080,428,416) | |
| | | | |
Net decrease in net assets from Class I share transactions | | | (242,814,604) | | | | (99,714,417) | |
| | | | |
CLASS C | | | | | | | | |
Proceeds from shares sold | | | 22,491,991 | | | | 19,595,035 | |
Shares issued in reinvestment of distributions | | | 87,489 | | | | 161,720 | |
Proceeds from redemption fees collected (Note 2) | | | – | | | | 231 | |
Payments for shares redeemed | | | (7,628,851) | | | | (833,208) | |
| | | | |
Net increase in net assets from Class C share transactions | | | 14,950,629 | | | | 18,923,778 | |
| | | | |
CLASS A | | | | | | | | |
Proceeds from shares sold | | | 8,035,832 | | | | – | |
Shares issued in reinvestment of distributions | | | 10,028 | | | | – | |
Proceeds from redemption fees collected (Note 2) | | | 1 | | | | – | |
Payments for shares redeemed | | | (1,390,984) | | | | – | |
| | | | |
Net increase in net assets from Class A share transactions | | | 6,654,877 | | | | – | |
| | | | |
TOTAL DECREASE IN NET ASSETS | | | (359,818,000) | | | | (215,244,098) | |
| | | | |
NET ASSETS: | | | | | | | | |
Beginning of year | | | 2,872,932,095 | | | | 3,088,176,193 | |
| | | | |
End of year * | | $ | 2,513,114,095 | | | $ | 2,872,932,095 | |
| | | | |
*Including accumulated net investment loss of: | | $ | (13,485,183) | | | $ | (8,468,313) | |
See Notes to Financial Statements.
| | |
| 78 | | www.arbitragefunds.com | 1-800-295-4485 |
| | |
| The Arbitrage Event-Driven Fund | | Statements of Changes in Net Assets |
| | | | | | | | |
| | | Year Ended | | | Year Ended | |
| | | May 31, 2014 | | | May 31, 2013 | |
| |
| | |
FROM OPERATIONS: | | | | | | | | |
Net investment income | | $ | 2,368,784 | | | $ | 696,474 | |
Net realized gains (losses) from: | | | | | | | | |
Investments and equity swap contracts | | | 8,825,548 | | | | 843,286 | |
Securities sold short | | | (7,485,992) | | | | (1,531,907) | |
Written option contracts | | | 1,120,840 | | | | 535,188 | |
Foreign currency transactions | | | (35,564) | | | | (41,552) | |
Long-term capital gains from other investment companies | | | – | | | | N/A | |
Net change in unrealized appreciation (depreciation) on: | | | | | | | | |
Investments and equity swap contracts | | | 10,371,833 | | | | 1,718,772 | |
Securities sold short | | | (3,833,021) | | | | (721,995) | |
Written option contracts | | | 81,261 | | | | (79,784) | |
Foreign currency transactions | | | (682,178) | | | | (98,534) | |
| | | | |
Net increase in net assets resulting from operations | | | 10,731,511 | | | | 1,319,948 | |
| | | | |
FROM DIVIDENDS AND DISTRIBUTIONS TO SHAREHOLDERS: | | | | | |
NET INVESTMENT INCOME | | | | | | | | |
Distributions from net investment income, Class R | | | (183,416) | | | | (69,098) | |
Distributions from net investment income, Class I | | | (679,917) | | | | (353,713) | |
Distributions from net investment income, Class C | | | (5,736) | | | | (1,031) | |
Distributions from net investment income, Class A | | | (6,382) | | | | – | |
NET REALIZED GAINS | | | | | | | | |
Distributions from net realized gains, Class R | | | (24,853) | | | | (107,560) | |
Distributions from net realized gains, Class I | | | (80,307) | | | | (540,904) | |
Distributions from net realized gains, Class C | | | (1,126) | | | | (1,943) | |
Distributions from net realized gains, Class A | | | (879) | | | | – | |
| | | | |
Decrease in net assets from distributions to shareholders | | | (982,616) | | | | (1,074,249) | |
| | | | |
See Notes to Financial Statements.
| | |
| Annual Report | May 31, 2014 | | 79 |
| | |
| The Arbitrage Event-Driven Fund | | Statements of Changes in Net Assets |
| | | | | | | | |
| | | Year Ended | | | Year Ended | |
| | | May 31, 2014 | | | May 31, 2013 | |
| |
| | |
FROM CAPITAL SHARE TRANSACTIONS (NOTE 7): | | | | | | | | |
CLASS R | | | | | | | | |
Proceeds from shares sold | | | 208,070,695 | | | | 6,778,284 | |
Shares issued in reinvestment of distributions | | | 201,589 | | | | 163,355 | |
Proceeds from redemption fees collected (Note 2) | | | 11,178 | | | | 1,136 | |
Payments for shares redeemed | | | (17,865,980) | | | | (5,848,204) | |
| | | | |
Net increase in net assets from Class R share transactions | | | 190,417,482 | | | | 1,094,571 | |
| | | | |
CLASS I | | | | | | | | |
Proceeds from shares sold | | | 275,888,988 | | | | 38,368,173 | |
Shares issued in reinvestment of distributions | | | 321,032 | | | | 628,267 | |
Proceeds from redemption fees collected (Note 2) | | | 20,288 | | | | 15,946 | |
Payments for shares redeemed | | | (32,791,940) | | | | (19,143,328) | |
| | | | |
Net increase in net assets from Class I share transactions | | | 243,438,368 | | | | 19,869,058 | |
| | | | |
CLASS C | | | | | | | | |
Proceeds from shares sold | | | 3,849,767 | | | | 347,531 | |
Shares issued in reinvestment of distributions | | | 6,761 | | | | 2,973 | |
Payments for shares redeemed | | | (22,570) | | | | (10,000) | |
| | | | |
Net increase in net assets from Class C share transactions | | | 3,833,958 | | | | 340,504 | |
| | | | |
CLASS A | | | | | | | | |
Proceeds from shares sold | | | 3,916,984 | | | | – | |
Shares issued in reinvestment of distributions | | | 7,260 | | | | – | |
Proceeds from redemption fees collected (Note 2) | | | 466 | | | | – | |
Payments for shares redeemed | | | (162,556) | | | | – | |
| | | | |
Net increase in net assets from Class A share transactions | | | 3,762,154 | | | | – | |
| | | | |
TOTAL INCREASE IN NET ASSETS | | | 451,200,857 | | | | 21,549,832 | |
| | | | |
NET ASSETS: | | | | | | | | |
Beginning of year | | | 51,914,790 | | | | 30,364,958 | |
| | | | |
End of year * | | $ | 503,115,647 | | | $ | 51,914,790 | |
| | | | |
*Including accumulated net investment income (loss) of: | | $ | 1,688,131 | | | $ | (126,591) | |
See Notes to Financial Statements.
| | |
| 80 | | www.arbitragefunds.com | 1-800-295-4485 |
| | |
| The Arbitrage Credit Opportunities Fund | | |
Statements of Changes in Net Assets
| | | | | | | | |
| | | Year Ended | | | Period Ended | |
| | | May 31, 2014 | | | May 31, 2013(a) | |
| |
| | |
FROM OPERATIONS: | | | | | | | | |
Net investment income | | $ | 644,074 | | | $ | 82,256 | |
Net realized gains (losses) from: | | | | | | | | |
Investments | | | 5,433 | | | | (1,047) | |
Securities sold short | | | (18,728) | | | | (10,086) | |
Written option contracts | | | 3,477 | | | | 91 | |
Foreign currency transactions | | | 21,902 | | | | 1,414 | |
Long-term capital gains from other investment companies | | | 1,068 | | | | N/A | |
Net change in unrealized appreciation (depreciation) on: | | | | | | | | |
Investments | | | 126,399 | | | | 42,388 | |
Securities sold short | | | (69,806) | | | | 1,384 | |
Written option contracts | | | 1,085 | | | | – | |
Foreign currency transactions | | | (22,330) | | | | 2,873 | |
| | | | |
Net increase in net assets resulting from operations | | | 692,574 | | | | 119,273 | |
| | | | |
FROM DIVIDENDS AND DISTRIBUTIONS TO SHAREHOLDERS: | | | | | |
NET INVESTMENT INCOME | | | | | | | | |
Distributions from net investment income, Class R | | | (108,553) | | | | (7,862) | |
Distributions from net investment income, Class I | | | (328,945) | | | | (28,735) | |
Distributions from net investment income, Class C | | | (2,418) | | | | (77) | |
Distributions from net investment income, Class A | | | (610) | | | | – | |
| | | | |
Decrease in net assets from distributions to shareholders | | | (440,526) | | | | (36,674) | |
| | | | |
See Notes to Financial Statements.
| | |
| Annual Report | May 31, 2014 | | 81 |
| | |
| The Arbitrage Credit Opportunities Fund | | |
Statements of Changes in Net Assets
| | | | | | | | |
| | | Year Ended | | | Period Ended | |
| | | May 31, 2014 | | | May 31, 2013(a) | |
| |
| | |
FROM CAPITAL SHARE TRANSACTIONS (NOTE 6): | | | | | | | | |
CLASS R | | | | | | | | |
Proceeds from shares sold | | | 7,376,673 | | | | 1,704,124 | |
Shares issued in reinvestment of distributions | | | 108,551 | | | | 7,862 | |
Proceeds from redemption fees collected (Note 2) | | | 4,056 | | | | 20 | |
Payments for shares redeemed | | | (2,819,415) | | | | (70,525) | |
| | | | |
Net increase in net assets from Class R share transactions | | | 4,669,865 | | | | 1,641,481 | |
| | | | |
CLASS I | | | | | | | | |
Proceeds from shares sold | | | 22,971,820 | | | | 3,391,866 | |
Shares issued in reinvestment of distributions | | | 328,535 | | | | 16,969 | |
Proceeds from redemption fees collected (Note 2) | | | 301 | | | | – | |
Payments for shares redeemed | | | (3,921,140) | | | | – | |
| | | | |
Net increase in net assets from Class I share transactions | | | 19,379,516 | | | | 3,408,835 | |
| | | | |
CLASS C | | | | | | | | |
Proceeds from shares sold | | | 720,475 | | | | 25,145 | |
Shares issued in reinvestment of distributions | | | 2,416 | | | | 77 | |
Payments for shares redeemed | | | (34,971) | | | | – | |
| | | | |
Net increase in net assets from Class C share transactions | | | 687,920 | | | | 25,222 | |
| | | | |
CLASS A | | | | | | | | |
Proceeds from shares sold | | | 27,607 | | | | – | |
Shares issued in reinvestment of distributions | | | 412 | | | | – | |
| | | | |
Net increase in net assets from Class A share transactions | | | 28,019 | | | | – | |
| | | | |
TOTAL INCREASE IN NET ASSETS | | | 25,017,368 | | | | 5,158,137 | |
| | | | |
NET ASSETS: | | | | | | | | |
Beginning of period | | | 5,158,137 | | | | – | |
| | | | |
End of year * | | $ | 30,175,505 | | | $ | 5,158,137 | |
| | | | |
*Including accumulated net investment income of: | | $ | 302,126 | | | $ | 70,257 | |
| (a) | Commenced operations on October 1, 2012. |
See Notes to Financial Statements.
| | |
| 82 | | www.arbitragefunds.com | 1-800-295-4485 |
Page Intentionally Left Blank
| | |
| The Arbitrage Fund – Class R | | |
Selected Per Share Data and Ratios for a Share Outstanding Throughout the Periods Presented:
|
|
Net asset value, beginning of period |
Income (loss) from investment operations |
Net investment loss(a) |
Net realized and unrealized gains on investments and foreign currencies |
Total from investment operations |
|
Less distributions |
From net investment income |
From net realized gains |
Total distributions |
Proceeds from redemption fees collected |
|
Net asset value, end of period |
|
Total return(c) |
|
Net assets, end of period (in 000s) |
|
RATIOS TO AVERAGE NET ASSETS: |
Expenses including interest and dividend expense |
Expenses excluding interest and dividend expense(d)(e) |
Expenses after advisory fees waived and expenses reimbursed excluding interest and dividend expense(d)(e) |
Net investment loss |
|
Portfolio turnover rate |
|
| (a) | Per share amounts were calculated using average shares for the year. |
| (b) | Amount rounds to less than $0.01 per share. |
| (c) | Total return is a measure of the change in the value of an investment in the Fund over the years covered, which assumes any dividends or capital gains distributions are reinvested in shares of the Fund. Returns shown do not reflect the deduction of taxes a shareholder would pay on Fund distributions or the redemption of Fund shares. |
| (d) | Dividend expense totaled 0.60%, 0.42%, 0.58%, 0.51% and 0.88%, of average net assets for the years ended May 31, 2014, 2013, 2012, 2011 and 2010, respectively. |
| (e) | Interest rebate expense and line of credit interest expense totaled 0.12%, 0.10%, 0.20%, 0.13% and 0.29%, of average net assets for the years ended May 31, 2014, 2013, 2012, 2011 and 2010, respectively. |
See Notes to Financial Statements.
| | |
| 84 | | www.arbitragefunds.com | 1-800-295-4485 |
| | | | | | | | |
Year Ended
May 31, 2014 | | Year Ended
May 31, 2013 | | Year Ended
May 31, 2012 | | Year Ended
May 31, 2011 | | Year Ended
May 31, 2010 |
|
| $12.50 | | $12.80 | | $12.77 | | $12.50 | | $12.43 |
| | | | | | | | |
| (0.09) | | (0.10) | | (0.11) | | (0.12) | | (0.14) |
| 0.23 | | 0.15 | | 0.44 | | 0.66 | | 0.52 |
|
| 0.14 | | 0.05 | | 0.33 | | 0.54 | | 0.38 |
|
| | | | |
| | | | | | | | |
| – | | (0.09) | | – | | – | | (0.05) |
| (0.06) | | (0.26) | | (0.30) | | (0.27) | | (0.26) |
|
| (0.06) | | (0.35) | | (0.30) | | (0.27) | | (0.31) |
|
| 0.00(b) | | 0.00(b) | | 0.00(b) | | 0.00(b) | | 0.00(b) |
|
| | | | |
| $12.58 | | $12.50 | | $12.80 | | $12.77 | | $12.50 |
|
| | | | |
| 1.10% | | 0.42% | | 2.54% | | 4.37% | | 3.08% |
| | | | |
| $760,750 | | $916,677 | | $1,003,646 | | $866,885 | | $759,235 |
| | | | |
| | | | | | | | |
| 2.17% | | 1.97% | | 2.23% | | 2.16% | | 2.80% |
| 1.45% | | 1.45% | | 1.45% | | 1.52% | | 1.63% |
| 1.45% | | 1.45% | | 1.44% | | 1.52% | | 1.63% |
| (0.70)% | | (0.78)% | | (0.83)% | | (0.93)% | | (1.12)% |
| | | | |
| 462% | | 459% | | 563% | | 389% | | 371% |
|
| | |
| Annual Report | May 31, 2014 | | 85 |
| | |
| The Arbitrage Fund – Class I | | |
Selected Per Share Data and Ratios for a Share Outstanding Throughout the Periods Presented:
|
|
Net asset value, beginning of period |
Income (loss) from investment operations |
Net investment loss(a) |
Net realized and unrealized gains on investments and foreign currencies |
Total from investment operations |
|
Less distributions |
From net investment income |
From net realized gains |
Total distributions |
Proceeds from redemption fees collected |
|
Net asset value, end of period |
|
Total return(c) |
|
Net assets, end of period (in 000s) |
|
RATIOS TO AVERAGE NET ASSETS: |
Expenses including interest and dividend expense |
Expenses excluding interest and dividend expense(d)(e) |
Expenses after advisory fees waived and expenses reimbursed excluding interest and dividend expense(d)(e) |
Net investment loss |
|
Portfolio turnover rate |
|
| (a) | Per share amounts were calculated using average shares for the year. |
| (b) | Amount rounds to less than $0.01 per share. |
| (c) | Total return is a measure of the change in the value of an investment in the Fund over the years covered, which assumes any dividends or capital gains distributions are reinvested in shares of the Fund. Returns shown do not reflect the deduction of taxes a shareholder would pay on Fund distributions or the redemption of Fund shares. |
| (d) | Dividend expense totaled 0.60%, 0.42%, 0.58%, 0.51% and 0.88%, of average net assets for the years ended May 31, 2014, 2013, 2012, 2011 and 2010, respectively. |
| (e) | Interest rebate expense and line of credit interest expense totaled 0.12%, 0.10%, 0.20%, 0.13% and 0.29%, of average net assets for the years ended May 31, 2014, 2013, 2012, 2011 and 2010, respectively. |
See Notes to Financial Statements.
| | |
| 86 | | www.arbitragefunds.com | 1-800-295-4485 |
| | | | | | | | |
Year Ended
May 31, 2014 | | Year Ended
May 31, 2013 | | Year Ended
May 31, 2012 | | Year Ended
May 31, 2011 | | Year Ended
May 31, 2010 |
|
| $12.74 | | $13.04 | | $12.98 | | $12.68 | | $12.60 |
| | | | | | | | |
| (0.05) | | (0.07) | | (0.07) | | (0.08) | | (0.11) |
| 0.23 | | 0.16 | | 0.43 | | 0.67 | | 0.52 |
|
| 0.18 | | 0.09 | | 0.36 | | 0.59 | | 0.41 |
|
| | | | |
| | | | | | | | |
| – | | (0.13) | | – | | (0.02) | | (0.07) |
| (0.06) | | (0.26) | | (0.30) | | (0.27) | | (0.26) |
|
| (0.06) | | (0.39) | | (0.30) | | (0.29) | | (0.33) |
|
| 0.00(b) | | 0.00(b) | | 0.00(b) | | 0.00(b) | | 0.00(b) |
|
| | | | |
| $12.86 | | $12.74 | | $13.04 | | $12.98 | | $12.68 |
|
| | | | |
| 1.39% | | 0.67% | | 2.74% | | 4.74% | | 3.28% |
| | | | |
| $1,712,120 | | $1,937,514 | | $2,084,530 | | $1,346,801 | | $582,460 |
| | | | |
| | | | | | | | |
| 1.92% | | 1.72% | | 1.98% | | 1.91% | | 2.55% |
| 1.20% | | 1.20% | | 1.20% | | 1.27% | | 1.38% |
| 1.20% | | 1.20% | | 1.20% | | 1.27% | | 1.38% |
| (0.42)% | | (0.51)% | | (0.56)% | | (0.62)% | | (0.85)% |
| | | | |
| 462% | | 459% | | 563% | | 389% | | 371% |
|
| | |
| Annual Report | May 31, 2014 | | 87 |
| | |
| The Arbitrage Fund – Class C | | |
Selected Per Share Data and Ratios for a Share Outstanding Throughout the Periods Presented:
|
|
Net asset value, beginning of period |
Income (loss) from investment operations |
Net investment loss(b) |
Net realized and unrealized gains on investments and foreign currencies |
Total from investment operations |
|
Less distributions |
From net investment income |
From net realized gains |
Total distributions |
Proceeds from redemption fees collected |
|
Net asset value, end of period |
|
Total return(d) |
|
Net assets, end of period (in 000s) |
|
RATIOS TO AVERAGE NET ASSETS: |
Expenses including interest and dividend expense |
Expenses excluding interest and dividend expense(e)(f) |
Expenses after advisory fees waived and expenses reimbursed excluding interest and dividend expense(e)(f) |
Net investment loss |
|
Portfolio turnover rate |
|
| (a) | Commenced operations on June 1, 2012. |
| (b) | Per share amounts were calculated using average shares for the year. |
| (c) | Amount rounds to less than $0.01 per share. |
| (d) | Total return is a measure of the change in the value of an investment in the Fund over the years covered, which assumes any dividends or capital gains distributions are reinvested in shares of the Fund. Returns shown do not reflect the deduction of taxes a shareholder would pay on Fund distributions or the redemption of Fund shares. |
| (e) | Dividend expense totaled 0.60% and 0.42% of average net assets for the years ended May 31, 2014 and 2013, respectively. |
| (f) | Interest rebate expense and line of credit interest expense totaled 0.12% and 0.11% of average net assets for the years ended May 31, 2014 and 2013, respectively. |
See Notes to Financial Statements.
| | |
| 88 | | www.arbitragefunds.com | 1-800-295-4485 |
| | |
Year Ended
May 31, 2014 | | Year Ended
May 31, 2013(a) |
|
| $12.38 | | $12.80 |
| | |
| (0.18) | | (0.23) |
| 0.23 | | 0.20 |
|
| 0.05 | | (0.03) |
|
| |
| | |
| – | | (0.13) |
| (0.06) | | (0.26) |
|
| (0.06) | | (0.39) |
|
| – | | 0.00(c) |
|
| |
| $12.37 | | $12.38 |
|
| |
| 0.38% | | (0.27%) |
| |
| $33,589 | | $18,741 |
| |
| | |
| 2.92% | | 2.75% |
| 2.20% | | 2.20% |
| 2.20% | | 2.20% |
| (1.45)% | | (1.84)% |
| |
| 462% | | 459% |
|
| | |
| Annual Report | May 31, 2014 | | 89 |
| | |
| The Arbitrage Fund – Class A | | |
Selected Per Share Data and Ratios for a Share Outstanding Throughout the Period Presented:
| | |
| | | Year Ended
May 31, 2014(a) |
|
Net asset value, beginning of period | | $12.50 |
Income (loss) from investment operations | | |
Net investment loss(b) | | (0.09) |
Net realized and unrealized gains on investments and foreign currencies | | 0.24 |
| | |
Total from investment operations | | 0.15 |
| | |
| |
Less distributions | | |
From net realized gains | | (0.06) |
| | |
Total distributions | | (0.06) |
| | |
Proceeds from redemption fees collected | | 0.00(c) |
| | |
| |
Net asset value, end of period | | $12.59 |
| | |
| |
Total return(d) | | 1.18% |
| |
Net assets, end of period (in 000s) | | $6,655 |
| |
RATIOS TO AVERAGE NET ASSETS: | | |
Expenses including interest and dividend expense | | 2.18% |
Expenses excluding interest and dividend expense(e)(f) | | 1.46% |
Expenses after advisory fees waived and expenses reimbursed excluding interest and dividend expense(e)(f) | | 1.46% |
Net investment loss | | (0.69)% |
| |
Portfolio turnover rate | | 462% |
|
| (a) | Commenced operations on June 1, 2013. |
| (b) | Per share amounts were calculated using average shares for the year. |
| (c) | Amount rounds to less than $0.01 per share. |
| (d) | Total return is a measure of the change in the value of an investment in the Fund over the years covered, which assumes any dividends or capital gains distributions are reinvested in shares of the Fund. Returns shown do not reflect the deduction of taxes a shareholder would pay on Fund distributions or the redemption of Fund shares. |
| (e) | Dividend expense totaled 0.60% of average net assets for the year ended May 31, 2014. |
| (f) | Interest rebate expense and line of credit interest expense totaled 0.12% of average net assets for the year ended May 31, 2014. |
See Notes to Financial Statements.
| | |
| 90 | | www.arbitragefunds.com | 1-800-295-4485 |
Page Intentionally Left Blank
| | |
| The Arbitrage Event-Driven Fund – Class R | | |
Selected Per Share Data and Ratios for a Share Outstanding Throughout the Periods Presented:
|
|
Net asset value, beginning of period |
Income (loss) from investment operations |
Net investment income (loss)(b) |
Net realized and unrealized gains on investments and foreign currencies |
Total from investment operations |
|
Less distributions |
From net investment income |
From net realized gains |
Total distributions |
Proceeds from redemption fees collected |
|
Net asset value, end of period |
|
Total return(d) |
|
Net assets, end of period (in 000s) |
|
RATIOS TO AVERAGE NET ASSETS: |
Expenses including interest and dividend expense |
Expenses excluding interest and dividend expense(g)(h) |
Expenses after advisory fees waived and expenses reimbursed excluding interest and dividend expense(g)(h) |
Net investment income (loss) |
|
Portfolio turnover rate |
|
| (a) | Commenced operations on October 1, 2010. |
| (b) | Per share amounts were calculated using average shares for the year. |
| (c) | Amount rounds to less than $0.01 per share. |
| (d) | Total return is a measure of the change in the value of an investment in the Fund over the years covered, which assumes any dividends or capital gains distributions are reinvested in shares of the Fund. Returns shown do not reflect the deduction of taxes a shareholder would pay on Fund distributions or the redemption of Fund shares. |
| (g) | Dividend expense totaled 0.49%, 0.36%, 0.27% and 0.28% (annualized) of average net assets for the years ended May 31, 2014, 2013, 2012 and the period ended May 31, 2011, respectively. |
| (h) | Interest rebate expense and line of credit interest expense totaled 0.13%, 0.13%, 0.21% and 0.21% (annualized) of average net assets for the years ended May 31, 2014, 2013, 2012 and the period ended May 31, 2011, respectively. |
See Notes to Financial Statements.
| | |
| 92 | | www.arbitragefunds.com | 1-800-295-4485 |
| | | | | | |
Year Ended
May 31, 2014 | | Year Ended
May 31, 2013 | | Year Ended
May 31, 2012 | | Period Ended
May 31, 2011(a) |
|
| $9.80 | | $9.79 | | $10.23 | | $10.00 |
| | | | | | |
| 0.10 | | 0.15 | | 0.10 | | (0.02) |
| 0.46 | | 0.11 | | 0.09 | | 0.36 |
|
| 0.56 | | 0.26 | | 0.19 | | 0.34 |
|
| | | |
| | | | | | |
| (0.06) | | (0.10) | | (0.15) | | (0.01) |
| (0.01) | | (0.15) | | (0.48) | | (0.10) |
|
| (0.07) | | (0.25) | | (0.63) | | (0.11) |
|
| 0.00(c) | | 0.00(c) | | 0.00(c) | | 0.00(c) |
|
| | | |
| $10.29 | | $9.80 | | $9.79 | | $10.23 |
|
| | | |
| 5.75% | | 2.72% | | 1.88% | | 3.43%(e) |
| | | |
| $204,055 | | $10,080 | | $8,976 | | $4,867 |
| | | |
| | | | | | |
| 2.33% | | 2.55% | | 2.67% | | 4.33%(f) |
| 1.71% | | 2.06% | | 2.19% | | 3.84%(f) |
| 1.69% | | 1.69% | | 1.69% | | 1.69%(f) |
| 1.04% | | 1.58% | | 1.02% | | (0.26)%(f) |
| | | |
| 340% | | 336% | | 490% | | 298%(e) |
|
| | |
| Annual Report | May 31, 2014 | | 93 |
| | |
| The Arbitrage Event-Driven Fund – Class I | | |
Selected Per Share Data and Ratios for a Share Outstanding Throughout the Periods Presented:
|
|
Net asset value, beginning of period |
Income (loss) from investment operations |
Net investment income(b) |
Net realized and unrealized gains on investments and foreign currencies |
Total from investment operations |
|
Less distributions |
From net investment income |
From net realized gains |
Total distributions |
Proceeds from redemption fees collected |
|
Net asset value, end of period |
|
Total return(d) |
|
Net assets, end of period (in 000s) |
|
RATIOS TO AVERAGE NET ASSETS: |
Expenses including interest and dividend expense |
Expenses excluding interest and dividend expense(g)(h) |
Expenses after advisory fees waived and expenses reimbursed excluding interest and dividend expense(g)(h) |
Net investment income |
|
Portfolio turnover rate |
|
| (a) | Commenced operations on October 1, 2010. |
| (b) | Per share amounts were calculated using average shares for the year. |
| (c) | Amount rounds to less than $0.01 per share. |
| (d) | Total return is a measure of the change in the value of an investment in the Fund over the years covered, which assumes any dividends or capital gains distributions are reinvested in shares of the Fund. Returns shown do not reflect the deduction of taxes a shareholder would pay on Fund distributions or the redemption of Fund shares. |
| (g) | Dividend expense totaled 0.49%, 0.36%, 0.27% and 0.28% (annualized) of average net assets for the years ended May 31, 2014, 2013, 2012 and the period ended May 31, 2011, respectively. |
| (h) | Interest rebate expense and line of credit interest expense totaled 0.13%, 0.13%, 0.21% and 0.21% (annualized) of average net assets for the years ended May 31, 2014, 2013, 2012 and the period ended May 31, 2011, respectively. |
See Notes to Financial Statements.
| | |
| 94 | | www.arbitragefunds.com | 1-800-295-4485 |
| | | | | | |
Year Ended
May 31, 2014 | | Year Ended
May 31, 2013 | | Year Ended
May 31, 2012 | | Period Ended
May 31, 2011(a) |
|
| $9.86 | | $9.82 | | $10.24 | | $10.00 |
| | | | | | |
| 0.13 | | 0.16 | | 0.12 | | 0.01 |
| 0.46 | | 0.13 | | 0.09 | | 0.35 |
|
| 0.59 | | 0.29 | | 0.21 | | 0.36 |
|
| | | |
| | | | | | |
| (0.07) | | (0.10) | | (0.15) | | (0.02) |
| (0.01) | | (0.15) | | (0.48) | | (0.10) |
|
| (0.08) | | (0.25) | | (0.63) | | (0.12) |
|
| 0.00(c) | | 0.00(c) | | 0.00(c) | | 0.00(c) |
|
| | | |
| $10.37 | | $9.86 | | $9.82 | | $10.24 |
|
| | | |
| 6.02% | | 3.04% | | 2.09% | | 3.57%(e) |
| | | |
| $290,999 | | $41,493 | | $21,389 | | $11,701 |
| | | |
| | | | | | |
| 2.11% | | 2.31% | | 2.42% | | 4.73%(f) |
| 1.49% | | 1.82% | | 1.94% | | 4.24%(f) |
| 1.44% | | 1.44% | | 1.44% | | 1.44%(f) |
| 1.31% | | 1.68% | | 1.25% | | 0.12%(f) |
| | | |
| 340% | | 336% | | 490% | | 298%(e) |
|
| | |
| Annual Report | May 31, 2014 | | 95 |
| | |
| The Arbitrage Event-Driven Fund – Class C | | |
Selected Per Share Data and Ratios for a Share Outstanding Throughout the Periods Presented:
| | |
|
Net asset value, beginning of period | | |
Income (loss) from investment operations | | |
Net investment income(b) | | |
Net realized and unrealized gains on investments and foreign currencies | | |
Total from investment operations | | |
| |
Less distributions | | |
From net investment income | | |
From net realized gains | | |
Total distributions | | |
| |
Net asset value, end of period | | |
| |
Total return(c) | | |
| |
Net assets, end of period (in 000s) | | |
| |
RATIOS TO AVERAGE NET ASSETS: | | |
Expenses including interest and dividend expense | | |
Expenses excluding interest and dividend expense(d)(e) | | |
Expenses after advisory fees waived and expenses reimbursed excluding interest and dividend expense(d)(e) | | |
Net investment income | | |
| |
Portfolio turnover rate | | |
|
| (a) | Commenced operations on June 1, 2012. |
| (b) | Per share amounts were calculated using average shares for the year. |
| (c) | Total return is a measure of the change in the value of an investment in the Fund over the years covered, which assumes any dividends or capital gains distributions are reinvested in shares of the Fund. Returns shown do not reflect the deduction of taxes a shareholder would pay on Fund distributions or the redemption of Fund shares. |
| (d) | Dividend expense totaled 0.49% and 0.36% of average net assets for the years ended May 31, 2014 and 2013, respectively. |
| (e) | Interest rebate expense and line of credit interest expense totaled 0.13% and 0.13% of average net assets for the years ended May 31, 2014 and 2013, respectively. |
See Notes to Financial Statements.
| | |
| 96 | | www.arbitragefunds.com | 1-800-295-4485 |
| | |
Year Ended May 31, 2014 | | Year Ended
May 31, 2013(a) |
|
| $9.78 | | $9.79 |
| | |
| 0.03 | | 0.09 |
| 0.46 | | 0.13 |
|
| 0.49 | | 0.22 |
|
| |
| | |
| (0.04) | | (0.08) |
| (0.01) | | (0.15) |
|
| (0.05) | | (0.23) |
|
| |
| $10.22 | | $9.78 |
|
| |
| 5.05% | | 2.33% |
| |
| $4,232 | | $342 |
| |
| | |
| 3.12% | | 3.31% |
| 2.50% | | 2.82% |
| 2.44% | | 2.44% |
| 0.32% | | 0.95% |
| |
| 340% | | 336% |
|
| | |
| Annual Report | May 31, 2014 | | 97 |
| | |
| The Arbitrage Event-Driven Fund – Class A | | |
Selected Per Share Data and Ratios for a Share Outstanding Throughout the Period Presented:
| | |
| | | Year Ended
May 31, 2014(a) |
|
Net asset value, beginning of period | | $9.80 |
Income (loss) from investment operations | | |
Net investment income(b) | | 0.10 |
Net realized and unrealized gains on investments and foreign currencies | | 0.47 |
| | |
Total from investment operations | | 0.57 |
| | |
| |
Less distributions | | |
From net investment income | | (0.06) |
From net realized gains | | (0.01) |
| | |
Total distributions | | (0.07) |
| | |
Proceeds from redemption fees collected | | 0.00(c) |
| | |
| |
Net asset value, end of period | | $10.30 |
| | |
| |
Total return(d) | | 5.85% |
| |
Net assets, end of period (in 000s) | | $3,830 |
| |
RATIOS TO AVERAGE NET ASSETS: | | |
Expenses including interest and dividend expense | | 2.36% |
Expenses excluding interest and dividend expense(e)(f) | | 1.74% |
Expenses after advisory fees waived and expenses reimbursed excluding interest and dividend expense(e)(f) | | 1.69% |
Net investment income | | 0.98% |
| |
Portfolio turnover rate | | 340% |
|
| (a) | Commenced operations on June 1, 2013. |
| (b) | Per share amounts were calculated using average shares for the year. |
| (c) | Amount rounds to less than $0.01 per share. |
| (d) | Total return is a measure of the change in the value of an investment in the Fund over the years covered, which assumes any dividends or capital gains distributions are reinvested in shares of the Fund. Returns shown do not reflect the deduction of taxes a shareholder would pay on Fund distributions or the redemption of Fund shares. |
| (e) | Dividend expense totaled 0.49% of average net assets for the year ended May 31, 2014. |
| (f) | Interest rebate expense and line of credit interest expense totaled 0.13% of average net assets for the year ended May 31, 2014. |
See Notes to Financial Statements.
| | |
| 98 | | www.arbitragefunds.com | 1-800-295-4485 |
Page Intentionally Left Blank
| | |
| The Arbitrage Credit Opportunities Fund – Class R | | |
Selected Per Share Data and Ratios for a Share Outstanding Throughout the Periods Presented:
|
|
Net asset value, beginning of period |
Income (loss) from investment operations |
Net investment income(b) |
Net realized and unrealized gains on investments and foreign currencies |
Total from investment operations |
|
Less distributions |
From net investment income |
Total distributions |
Proceeds from redemption fees collected |
|
Net asset value, end of period |
|
Total return(d) |
|
Net assets, end of period (in 000s) |
|
RATIOS TO AVERAGE NET ASSETS: |
Expenses including interest and dividend expense |
Expenses excluding interest and dividend expense(g)(h) |
Expenses after advisory fees waived and expenses reimbursed excluding interest and dividend expense(g)(h) |
Net investment income |
|
Portfolio turnover rate |
|
| (a) | Commenced operations on October 1, 2012. |
| (b) | Per share amounts were calculated using average shares for the year. |
| (c) | Amount rounds to less than $0.01 per share. |
| (d) | Total return is a measure of the change in the value of an investment in the Fund over the years covered, which assumes any dividends or capital gains distributions are reinvested in shares of the Fund. Returns shown do not reflect the deduction of taxes a shareholder would pay on Fund distributions or the redemption of Fund shares. |
| (g) | Dividend expense totaled 0.10% and 0.03% (annualized) of average net assets for the year ended May 31, 2014 and the period ended May 31, 2013, respectively. |
| (h) | Interest rebate expense totaled 0.07% and 0.02% (annualized) of average net assets for the year ended May 31, 2014 and the period ended May, 31 2013, respectively. |
See Notes to Financial Statements.
| | |
| 100 | | www.arbitragefunds.com | 1-800-295-4485 |
| | |
Year Ended
May 31, 2014 | | Period Ended
May 31, 2013(a) |
|
| $10.18 | | $10.00 |
| |
| 0.40 | | 0.17 |
| 0.08 | | 0.06 |
|
| 0.48 | | 0.23 |
|
| |
| (0.39) | | (0.05) |
| (0.39) | | (0.05) |
|
| 0.01 | | 0.00(c) |
|
| |
| $10.28 | | $10.18 |
|
| |
| 4.99% | | 2.33%(e) |
| |
| $6,393 | | $1,671 |
| |
| 2.71% | | 3.79%(f) |
| 2.54% | | 3.74%(f) |
| |
| 1.50% | | 1.50%(f) |
| |
| 3.97% | | 2.49%(f) |
| |
| 181% | | 92%(e) |
|
|
| | |
| Annual Report | May 31, 2014 | | 101 |
| | |
| The Arbitrage Credit Opportunities Fund – Class I | | |
Selected Per Share Data and Ratios for a Share Outstanding Throughout the Periods Presented:
|
|
Net asset value, beginning of period |
Income (loss) from investment operations |
Net investment income(b) |
Net realized and unrealized gains on investments and foreign currencies |
Total from investment operations |
|
Less distributions |
From net investment income |
Total distributions |
Proceeds from redemption fees collected |
|
Net asset value, end of period |
|
Total return(d) |
|
Net assets, end of period (in 000s) |
|
RATIOS TO AVERAGE NET ASSETS: |
Expenses including interest and dividend expense |
Expenses excluding interest and dividend expense(g)(h) |
Expenses after advisory fees waived and expenses reimbursed excluding interest and dividend expense(g)(h) |
Net investment income |
|
Portfolio turnover rate |
|
| (a) | Commenced operations on October 1, 2012. |
| (b) | Per share amounts were calculated using average shares for the year. |
| (c) | Amount rounds to less than $0.01 per share. |
| (d) | Total return is a measure of the change in the value of an investment in the Fund over the years covered, which assumes any dividends or capital gains distributions are reinvested in shares of the Fund. Returns shown do not reflect the deduction of taxes a shareholder would pay on Fund distributions or the redemption of Fund shares. |
| (g) | Dividend expense totaled 0.10% and 0.03% (annualized) of average net assets for the year ended May 31, 2014 and the period ended May 31, 2013, respectively. |
| (h) | Interest rebate expense totaled 0.07% and 0.01% (annualized) of average net assets for the year ended May 31, 2014 and the period ended May, 31 2013, respectively. |
See Notes to Financial Statements.
| | |
| 102 | | www.arbitragefunds.com | 1-800-295-4485 |
| | |
Year Ended
May 31, 2014 | | Period Ended
May 31, 2013(a) |
|
| $10.16 | | $10.00 |
| |
| 0.42 | | 0.17 |
| 0.08 | | 0.08 |
|
| 0.50 | | 0.25 |
|
| |
| (0.41) | | (0.09) |
| (0.41) | | (0.09) |
|
| 0.00(c) | | – |
|
| |
| $10.25 | | $10.16 |
|
| |
| 5.08% | | 2.49%(e) |
| |
| $23,039 | | $3,462 |
| |
| 2.37% | | 3.64%(f) |
| 2.20% | | 3.60%(f) |
| |
| 1.25% | | 1.25%(f) |
| |
| 4.16% | | 2.62%(f) |
| |
| 181% | | 92%(e) |
|
| | |
| Annual Report | May 31, 2014 | | 103 |
| | |
| The Arbitrage Credit Opportunities Fund – Class C | | |
Selected Per Share Data and Ratios for a Share Outstanding Throughout the Periods Presented:
|
|
Net asset value, beginning of period |
Income (loss) from investment operations |
Net investment income(b) |
Net realized and unrealized gains on investments and foreign currencies |
Total from investment operations |
|
Less distributions |
From net investment income |
Total distributions |
|
Net asset value, end of period |
|
Total return(c) |
|
Net assets, end of period (in 000s) |
|
RATIOS TO AVERAGE NET ASSETS: |
Expenses including interest and dividend expense |
Expenses excluding interest and dividend expense(f)(g) |
Expenses after advisory fees waived and expenses reimbursed excluding interest and dividend expense(f)(g) |
Net investment income |
|
Portfolio turnover rate |
|
| (a) | Commenced operations on October 1, 2012. |
| (b) | Per share amounts were calculated using average shares for the year. |
| (c) | Total return is a measure of the change in the value of an investment in the Fund over the years covered, which assumes any dividends or capital gains distributions are reinvested in shares of the Fund. Returns shown do not reflect the deduction of taxes a shareholder would pay on Fund distributions or the redemption of Fund shares. |
| (f) | Dividend expense totaled 0.10% and 0.03% (annualized) of average net assets for the year ended May 31, 2014 and the period ended May 31, 2013, respectively. |
| (g) | Interest rebate expense totaled 0.07% and 0.01% (annualized) of average net assets for the year ended May 31, 2014 and the period ended May, 31 2013, respectively. |
See Notes to Financial Statements.
| | |
| 104 | | www.arbitragefunds.com | 1-800-295-4485 |
| | |
Year Ended
May 31, 2014 | | Period Ended
May 31, 2013(a) |
|
| $10.17 | | $10.00 |
| |
| 0.34 | | 0.11 |
| 0.07 | | 0.09 |
|
| 0.41 | | 0.20 |
|
| |
| (0.35) | | (0.03) |
| (0.35) | | (0.03) |
|
| |
| $10.23 | | $10.17 |
|
| |
| 4.17% | | 2.01%(d) |
| |
| $716 | | $26 |
| |
| 3.37% | | 4.69%(e) |
| 3.20% | | 4.64%(e) |
| |
| 2.25% | | 2.25%(e) |
| |
| 3.37% | | 1.58%(e) |
| |
| 181% | | 92%(d) |
|
| | |
| Annual Report | May 31, 2014 | | 105 |
| | |
| The Arbitrage Credit Opportunities Fund – Class A | | |
Selected Per Share Data and Ratios for a Share Outstanding Throughout the Period Presented:
| | |
| | | Year Ended
May 31, 2014(a) |
|
Net asset value, beginning of period | | $10.18 |
Income (loss) from investment operations | | |
Net investment income(b) | | 0.39 |
Net realized and unrealized gains on investments and foreign currencies | | 0.09 |
| | |
Total from investment operations | | 0.48 |
| | |
| |
Less distributions | | |
From net investment income | | (0.41) |
| | |
Total distributions | | (0.41) |
| | |
| |
Net asset value, end of period | | $10.25 |
| | |
| |
Total return(c) | | 4.86% |
| |
Net assets, end of period (in 000s) | | $28 |
| |
RATIOS TO AVERAGE NET ASSETS: | | |
Expenses including interest and dividend expense | | 2.77% |
Expenses excluding interest and dividend expense(d)(e) | | 2.60% |
Expenses after advisory fees waived and expenses reimbursed excluding interest and dividend expense(d)(e) | | 1.50% |
Net investment income | | 3.89% |
| |
Portfolio turnover rate | | 181% |
|
| (a) | Commenced operations on June 1, 2013. |
| (b) | Per share amounts were calculated using average shares for the year. |
| (c) | Total return is a measure of the change in the value of an investment in the Fund over the years covered, which assumes any dividends or capital gains distributions are reinvested in shares of the Fund. Returns shown do not reflect the deduction of taxes a shareholder would pay on Fund distributions or the redemption of Fund shares. |
| (d) | Dividend expense totaled 0.10% of average net assets for the year ended May 31, 2014. |
| (e) | Interest rebate expense totaled 0.07% of average net assets for the year ended May 31, 2014. |
See Notes to Financial Statements.
| | |
| 106 | | www.arbitragefunds.com | 1-800-295-4485 |
| | |
| The Arbitrage Funds | | Notes to Financial Statements |
May 31, 2014
1. ORGANIZATION
The Arbitrage Funds (the “Trust”) was organized as a Delaware business trust on December 22, 1999, and is registered under the Investment Company Act of 1940, as amended (the “1940 Act”), as an open-end management investment company issuing its shares in series, each series representing a distinct portfolio with its own investment objective and policies. The three series presently authorized are The Arbitrage Fund (the “Arbitrage Fund”), The Arbitrage Event-Driven Fund (the “Event-Driven Fund”) and The Arbitrage Credit Opportunities Fund (“Credit Opportunities Fund”) (each a “Fund” and collectively the “Funds”) each a diversified investment portfolio, which offers four classes of shares. Class R shares, Class I shares, Class C shares and Class A shares of the Arbitrage Fund commenced operations on September 18, 2000, October 17, 2003, June 1, 2012 and June 1, 2013, respectively. Class R shares, Class I shares, Class C shares, and Class A shares of the Event-Driven Fund commenced operations on October 1, 2010, October 1, 2010, June 1, 2012 and June 1, 2013, respectively. Class R shares, Class I and Class C shares of the Credit Opportunities Fund commenced operations on October 1, 2012 and Class A shares commenced operations on June 1, 2013.
The investment objective of the Arbitrage Fund is to achieve capital growth by engaging in merger arbitrage. The investment objective of the Event-Driven Fund is to achieve capital growth by investing in companies that are impacted by corporate events such as mergers, acquisitions, restructurings, recapitalizations, refinancings, reorganizations and other special situations. The investment objective of the Credit Opportunities Fund is to provide current income and capital growth by investing in debt securities impacted by events such as reorganizations, restructurings, recapitalizations, debt maturities, refinancings, mergers, acquisitions, regulatory changes and other special situations.
The Funds’ four classes of shares, Class R, Class I, Class C and Class A represent interests in the same portfolio of investments with respect to a Fund and have the same rights, but differ primarily in the expenses to which they are subject and the investment eligibility requirements. Class R shares, Class C shares and Class A shares are subject to an annual distribution fee of up to 0.25%, 1.00% and 0.25% respectively, of each Fund’s average daily net assets attributable to Class R shares, Class C shares and Class A shares, respectively, whereas Class I shares are not subject to any distribution fees. Class C shares are also subject to a 1.00% contingent deferred sales charge on all purchases redeemed in 12 months of purchase. Class A shares of the Arbitrage Fund are sold subject to a maximum front-end sales load equal to 2.50% of the offering price and are also subject to a 0.50% contingent deferred sales load on purchases at or above $250,000, purchased without a front-end sales charge and redeemed within 12 months of purchase. Class A shares of the Event-Driven Fund and the Credit Opportunities Fund are sold subject to a maximum front-end sales load equal to 3.25% of the offering price and are also subject to a 1.00% contingent deferred sales load on purchases at or above $500,000, purchased without a front-end sales charge and redeemed within 18 months of purchase.
2. SIGNIFICANT ACCOUNTING POLICIES
The following is a summary of significant accounting policies followed by the Funds. These policies are in conformity with U.S. generally accepted accounting principles (“GAAP”).
Use of Estimates — The preparation of financial statements in conformity with U.S. generally accepted accounting principles (“GAAP”) requires management to make estimates and
| | |
| Annual Report | May 31, 2014 | | 107 |
| | |
| The Arbitrage Funds | | Notes to Financial Statements (continued) |
May 31, 2014
assumptions that affect the reported amounts of assets and liabilities at the date of the financial statements and the reported amounts of increases and decreases in net assets from operations during the reporting period. Actual results could differ from those estimates.
Valuation of Investments — The Funds’ portfolio securities are valued as of the close of trading of the New York Stock Exchange (“NYSE”) (normally 4:00 p.m., Eastern time). Common stocks and other securities, including open short positions that are traded on a securities exchange, are valued at the last quoted sales price at the close of regular trading on the day the valuation is made. Securities which are quoted by NASDAQ are valued at the NASDAQ Official Closing Price. Price information on listed stocks is taken from the exchange where the security is primarily traded. Securities which are listed on an exchange but which are not traded on the valuation date are valued at the mean of the most recent bid and asked prices. Put and call options and securities traded in the over-the-counter market are valued at the mean of the most recent bid and asked prices. When there is no bid price available, put and call options will be valued using the average of the last ask price and zero. Foreign currency forward contracts are valued at the current day’s interpolated foreign exchange rate, as calculated using the current day’s spot rate, and the thirty, sixty, ninety and one-hundred eighty day forward rates provided by an independent source. Bank loans are valued at the composite mid-price which is calculated using the simple average of the dealer marks. If available, debt securities are priced based upon an evaluated bid provided by independent, third-party pricing agents. The third-party pricing agents may also value debt securities at an evaluated bid price by employing methodologies that utilize actual market transactions, broker-supplied valuations, or other methodologies designed to identify the market value for such securities. Unlisted securities for which market quotations are readily available are valued at the latest quoted bid price. Swap contracts that are listed or traded on a national securities exchange, commodities exchange, contract market or comparable over-the-counter market, and that are freely transferable, are valued at their closing settlement price on the exchange on which they are primarily traded or based upon the current settlement price for a like instrument acquired on the day on which the instrument is being valued. Over-the-counter swap contracts for which market quotations are readily available are valued based on quotes received from independent pricing services or one or more dealers that make markets in such securities. Other assets and securities for which no quotations are readily available are valued at fair value as determined in good faith under the supervision of the Board of Trustees of the Trust. Some of the more common reasons that may necessitate that a security be valued at fair value include: the security’s trading has been halted or suspended; the security has been delisted from a national exchange; the security’s primary trading market is temporarily closed at a time when under normal conditions it would be open; or the security’s primary pricing source is not able or willing to provide a price. Such methods of fair valuation may include, but are not limited to: multiple of earnings, multiple of book value, discount from market of a similar freely traded security, purchase price of a security, subsequent private transactions in the security or related securities, or a combination of these and other factors. Foreign securities are translated from the local currency into U.S. dollars using currency exchange rates supplied by a quotation service (see Note 8).
Fair Value Measurements — In accordance with the authoritative guidance on fair value measurements under GAAP, the Funds disclose fair value of their investments in a hierarchy that prioritizes the inputs to valuation techniques used to measure the fair value. The objective of a fair value measurement is to determine the price that would be received to sell an asset or paid to transfer a liability in an orderly transaction between market participants at the measurement date (an exit price). Accordingly, the fair value hierarchy gives the highest priority to quoted prices
| | |
| 108 | | www.arbitragefunds.com | 1-800-295-4485 |
| | |
| The Arbitrage Funds | | Notes to Financial Statements (continued) |
May 31, 2014
(unadjusted) in active markets for identical assets or liabilities (Level 1) and the lowest priority to unobservable inputs (Level 3). The guidance establishes three levels of the fair value hierarchy as follows:
| | | | |
Level 1 | | — | | Unadjusted quoted prices in active markets for identical, unrestricted assets or liabilities that the Funds have the ability to access at the measurement date; |
Level 2 | | — | | Observable inputs other than quoted prices included in Level 1 that are observable (either directly or indirectly) for substantially the full term of the asset or liability; and |
Level 3 | | — | | Unobservable inputs for the asset or liability, to the extent relevant observable inputs are not available, representing each Fund’s own assumption about the assumptions a market participant would use in valuing the asset or liability, and would be based on the best information available. |
Investments are classified within the level of the lowest significant input considered in determining fair value. Investments classified within Level 3, whose fair value measurement considers several inputs, may include Level 1 or Level 2 inputs as components of the overall fair value measurement. The inputs or methodology used for valuing securities are not necessarily an indication of the risk associated with investing in those securities. The Funds recognize transfers between levels as of the beginning of the annual period in which the transfer occurred.
For the year ended May 31, 2014, there were no significant changes to the Funds’ fair value methodologies. Additionally, during the year ended May 31, 2014, there were no transfers between level 1 and 2 securities. Transfers for level 3 securities, if any, are shown as part of the leveling table in the Portfolio of Investments.
Share Valuation and Redemption Fees — The net asset value per share of each class of shares of the Funds is calculated daily by dividing the total value of a Fund’s assets attributable to that class, less liabilities attributable to that class, by the number of shares of that class outstanding. The offering price and redemption price per share of each class of each Fund is equal to the net asset value per share, except that, shares of Class R, Class I and Class A are subject to a redemption fee of 2% if redeemed within 30 days for the Arbitrage Fund and Event-Driven Fund and 60 days for the Credit Opportunities Fund from the date of purchase. The Class A redemption fee does not apply for purchases over $250,000 in the Arbitrage Fund and purchases over $500,000 in the Event-Driven Fund and Credit Opportunities Fund, as these purchases are subject to a contingent deferred sales charge. Class C shares are not subject to a redemption fee. For the year ended May 31, 2014, proceeds from redemption fees in the Arbitrage Fund were $46,167 in Class R, $26,523 in Class I and $1 in Class A. For the year ended May 31, 2014, proceeds from redemption fees in the Event-Driven Fund were $11,178 in Class R, $20,288 in Class I and $466 in Class A. For the year ended May 31, 2014, proceeds from redemption fees in the Credit Opportunities Fund were $4,056 in Class R, $301 in Class I and $0 in Class A. The redemption fee is paid directly to each Fund rather than the Adviser and is allocated pro-rata to the shareholders based on net assets attributed to the class.
Security Transactions — Security transactions are accounted for on trade date. Gains and losses on securities sold are determined on a specific identification basis.
Short Positions — The Funds may sell securities short for economic hedging purposes. Subsequent fluctuations in the market prices of securities sold short may require purchasing the
| | |
| Annual Report | May 31, 2014 | | 109 |
| | |
| The Arbitrage Funds | | Notes to Financial Statements (continued) |
May 31, 2014
securities at prices which may differ from the market value reflected on the Portfolio of Investments. The Funds are liable for any dividends and interest payable on securities while those securities are in a short position. As collateral for their short positions, the Funds are required under the 1940 Act to maintain assets consisting of cash, cash equivalents or liquid securities. The amount of the collateral is required to be adjusted daily to reflect changes in the value of the securities sold short. The Funds are charged an interest rebate expense by the prime broker on securities sold short. The interest rebate expense is charged for the duration of time that a security is sold short and is shown on the Statements of Operations.
Derivative Instruments and Hedging Activities — The following discloses the Funds’ use of derivative instruments and hedging activities.
The Funds’ investment objectives not only permit the Funds to purchase investment securities, but they also allow certain Funds to enter into various types of derivative contracts, including, but not limited to swap contracts, forward foreign currency exchange contracts, and purchased and written options. In doing so, the Funds will employ strategies in differing combinations to permit them to increase, decrease, or change the level or types of exposure to market factors. Central to those strategies are features inherent to derivatives that make them more attractive for this purpose than equity or debt securities: they require little or no initial cash investment; they can focus exposure on only certain selected risk factors; and they may not require the ultimate receipt or delivery of the underlying security (or securities) to satisfy the contract. This may allow the Funds to pursue their objectives more quickly and efficiently than if they were to make direct purchases or sales of securities capable of effecting a similar response to market factors.
Market Risk Factors: In pursuit of their investment objectives, the Funds may seek to use derivatives to increase or decrease their exposure to the following market risk factors:
Equity Risk: Equity risk relates to the change in value of equity securities as they relate to increases or decreases in the general market.
Interest Rate Risk: Interest rate risk refers to the fluctuations in value of fixed-income securities resulting from the inverse relationship between price and yield. For example, an increase in general interest rates will tend to reduce the market value of fixed income investments, and a decline in general interest rates will tend to increase the value of such investments. In addition, debt securities with longer maturities, which tend to have higher yields, are subject to potentially greater fluctuations in value from changes in interest rates than obligations with shorter maturities.
Foreign Exchange Rate Risk: Foreign exchange rate risk relates to the change in the U.S. dollar value of a security held that is denominated in a foreign currency. The value of a foreign currency denominated security will decrease as the dollar appreciates against the currency, while the value of the foreign currency denominated security will increase as the dollar depreciates against the currency.
Risk of Investing in Derivatives: The Funds’ use of derivatives can result in losses due to unanticipated changes in the market risk factors and the overall market. In instances where the Funds are using derivatives to decrease or hedge exposures to market risk factors for securities held by the Funds, there are also risks that those derivatives may not perform as expected, resulting in losses for the combined or hedged positions.
| | |
| 110 | | www.arbitragefunds.com | 1-800-295-4485 |
| | |
| The Arbitrage Funds | | Notes to Financial Statements (continued) |
May 31, 2014
Derivatives may have little or no initial cash investment relative to their market value exposure and therefore can produce significant gains or losses in excess of their cost. This use of embedded leverage allows the Funds to increase their market value exposure relative to their net assets and can substantially increase the volatility of the Funds’ performance.
Additional associated risks from investing in derivatives also exist and potentially could have significant effects on the valuation of the derivative instruments and the Funds. Typically, the associated risks are not the risks that the Funds are attempting to increase or decrease exposure to, per their investment objectives, but are the additional risks from investing in derivatives.
Examples of these associated risks are liquidity risk, which is the risk that the Funds will not be able to sell the derivative in the open market in a timely manner, and counterparty credit risk, which is the risk that the counterparty to a transaction will not fulfill its obligation to the Funds. Associated risks can be different for each type of derivative and are discussed by derivative type in the notes that follow.
Option Writing/Purchasing: Certain Funds may write or purchase option contracts to adjust risk and return of their overall investment positions. When a Fund writes or purchases an option, an amount equal to the premium received or paid by the Fund is recorded as a liability or an asset and is subsequently adjusted to the current market value of the option written or purchased. Premiums received or paid from writing or purchasing options that expire unexercised are treated by the Fund on the expiration date as realized gains or losses. The difference between the premium and the amount paid or received on effecting a closing purchase or sale transaction, including brokerage commissions, is also treated as a realized gain or loss. If an option is exercised, the premium paid or received is added to the cost of the purchase or proceeds from the sale in determining whether the Fund has realized a gain or loss on investment transactions. Risks from entering into option transactions arise from the potential inability of counterparties to meet the terms of the contracts, the potential inability to enter into closing transactions because of an illiquid secondary market and from unexpected movements in security values.
A summary of put and call option contracts written in the Arbitrage Fund during the year ended May 31, 2014, is as follows:
| | | | | | | | | | | | | | | | |
| | | Put Contracts | | | Put Premiums | | | Call Contracts | | | Call Premiums | |
| | | | |
Options outstanding at beginning of year | | | 2,493 | | | $ | 140,837 | | | | 94,373 | | | $ | 2,466,604 | |
Options written | | | 129,135 | | | | 4,805,545 | | | | 338,050 | | | | 20,482,907 | |
Options closed | | | (18,175) | | | | (1,220,500 | ) | | | (30,633) | | | | (2,472,163) | |
Options exercised | | | (37,587) | | | | (1,411,791 | ) | | | (156,432) | | | | (12,752,416) | |
Options expired | | | (74,769) | | | | (2,205,840 | ) | | | (223,636) | | | | (6,154,980) | |
| | | | |
Options outstanding at end of year | | | 1,097 | | | $ | 108,251 | | | | 21,722 | | | $ | 1,569,952 | |
| | | | |
| | |
| Annual Report | May 31, 2014 | | 111 |
| | |
| The Arbitrage Funds | | Notes to Financial Statements (continued) |
May 31, 2014
A summary of put and call option contracts written in the Event-Driven Fund during the year ended May 31, 2014, is as follows:
| | | | | | | | | | | | | | | | |
| | | Put Contracts | | | Put Premiums | | | Call Contracts | | | Call Premiums | |
| | | | |
Options outstanding at beginning of year | | | 291 | | | $ | 25,068 | | | | 1,304 | | | $ | 46,909 | |
Options written | | | 15,397 | | | | 754,335 | | | | 47,722 | | | | 2,574,443 | |
Options closed | | | (1,731) | | | | (95,728) | | | | (4,259) | | | | (167,120) | |
Options exercised | | | (3,719) | | | | (239,255) | | | | (20,963) | | | | (1,495,345) | |
Options expired | | | (10,023) | | | | (433,267) | | | | (20,271) | | | | (755,311) | |
| | | | |
Options outstanding at end of year | | | 215 | | | $ | 11,153 | | | | 3,533 | | | $ | 203,576 | |
| | | | |
A summary of put and call option contracts written in the Credit Opportunities Fund during the year ended May 31, 2014, is as follows:
| | | | | | | | | | | | | | | | |
| | | Put Contracts | | | Put Premiums | | | Call Contracts | | | Call Premiums | |
| | | | |
Options outstanding at beginning of year | | | – | | | $ | – | | | | – | | | $ | – | |
Options written | | | – | | | | – | | | | 200 | | | | 7,565 | |
Options closed | | | – | | | | – | | | | (178) | | | | (5,380) | |
| | | | |
Options outstanding at end of year | | | – | | | $ | – | | | | 22 | | | $ | 2,185 | |
| | | | |
Foreign Currency Exchange Contracts: The Funds may enter into forward foreign currency exchange contracts as a way of managing foreign exchange rate risk. The Funds may enter into these contracts for the purchase or sale of a specific foreign currency at a fixed price on a future date as a hedge or cross-hedge against either specific transactions or portfolio positions. The objective of the Funds’ foreign currency hedging transactions is to reduce risk that the U.S. dollar value of the Funds’ securities denominated in foreign currency will decline in value due to changes in foreign currency exchange rates.
Warrants and Rights: The Funds may invest in warrants. A Fund may purchase warrants issued by domestic and foreign companies to purchase newly created equity securities consisting of common and preferred stock. Warrants are securities that give the holder the right, but not the obligation to purchase equity issues of the company issuing the warrants, or a related company, at a fixed price either on a date certain or during a set period. The equity security underlying a warrant is authorized at the time the warrant is issued or is issued together with the warrant.
Investing in warrants can provide a greater potential for profit or loss than an equivalent investment in the underlying security, and thus can be a speculative investment. At the time of issue, the cost of a warrant is substantially less than the cost of the underlying security itself, and price movements in the underlying security are generally magnified in the price movements of the warrant. This leveraging effect enables the investor to gain exposure to the underlying security with a relatively low capital investment. This leveraging increases an investor’s risk, however, and in the event of a decline in the value of the underlying security, a complete loss of the amount invested in the warrant may result. In addition, the price of a warrant tends to be more volatile than, and may not correlate exactly to, the price of the underlying security. If the market price of
| | |
| 112 | | www.arbitragefunds.com | 1-800-295-4485 |
| | |
| The Arbitrage Funds | | Notes to Financial Statements (continued) |
May 31, 2014
the underlying security is below the exercise price of the warrant on its expiration date, the warrant will generally expire without value. The value of a warrant may decline because of a decline in the value of the underlying security, the passage of time, changes in interest rates or in the dividend or other policies of the company whose equity underlies the warrant or a change in the perception as to the future price of the underlying security, or any combination thereof. Warrants generally pay no dividends and confer no voting or other rights other than to purchase the underlying security.
Equity Swap Contracts: The Funds may invest in swaps for the purpose of managing exposure to interest rate, credit or market risk. Additionally, the Funds may enter into equity swap agreements for the purpose of attempting to obtain a desired return on, or exposure to, certain equity securities or equity indices in an expedited manner or at a lower cost to the Funds than if the Funds had invested directly in such securities. An equity swap contract entitles the Funds to receive from the counterparty any appreciation and dividends paid on an individual security, while obligating the Funds to pay the counterparty any depreciation on the security. Fluctuations in the value of an open contract are recorded daily as a net unrealized gain or loss. The Funds will realize a gain or loss upon termination or reset of the contract. Either party, under certain conditions, may terminate the contract prior to the contract’s expiration date. Collateral, in the form of cash or securities, may be required to be held in segregated accounts with the Funds’ custodian and/or the counterparty’s broker. Risks may exceed amounts recognized on the Statements of Assets and Liabilities. These risks include changes in the returns of the underlying instruments, failure of the counterparties to perform under the contracts’ terms and the possible lack of liquidity with respect to the swap agreements.
Whether a Fund’s use of swap agreements will be successful in furthering its investment objective will depend on Management’s ability to correctly predict whether certain types of investments are likely to produce greater returns than other investments. Because they are two-party contracts and because they may have terms of greater than seven days, swap agreements may be considered to be illiquid investments. Moreover, a Fund bears the risk of loss of the amount expected to be received under a swap agreement in the event of the default or bankruptcy of a swap agreement counterparty. A Fund will enter into swap agreements only with counterparties that meet certain standards for creditworthiness (generally, such counterparties would have to be eligible counterparties under the terms of the Fund’s repurchase agreement guidelines).
International Swaps and Derivatives Association, Inc. Master Agreements (“ISDA Master Agreements”) govern over-the-counter financial derivative transactions entered into by a Fund and those counterparties. The ISDA Master Agreements maintain provisions for general obligations, representations, agreements, collateral and events of default or termination. Events of termination include conditions that may entitle counterparties to elect to terminate early and cause settlement of all outstanding transactions under the applicable ISDA Master Agreement. Pursuant to the Funds’ derivative ISDA Master Agreements, the Funds are required to maintain sufficient collateral or maintain a predetermined level of net assets. Any election to terminate early could be material to the financial statements. The values of all derivative instruments with credit risk-related contingent features that are in a net liability position at May 31, 2014, in the tables below exclude the effects of cash collateral received or posted pursuant to these derivative contracts and, therefore, are not representative of the Funds’ net exposure.
| | |
| Annual Report | May 31, 2014 | | 113 |
| | |
| The Arbitrage Funds | | Notes to Financial Statements (continued) |
May 31, 2014
Fair Value of Derivative Instruments — Fair values of derivatives presented in the financial statements are not netted with the fair value of other derivatives or with any collateral amounts posted by the Funds or any counterparty. The fair value of derivative instruments for the Funds as of May 31, 2014, was as follows:
| | | | | | | | | | | | |
Derivatives Not Accounted For As Hedging Instruments | | Asset Derivatives Statement of Assets and Liabilities Location | | Fair Value | | | Liability Derivatives Statement of Assets and Liabilities Location | | Fair Value | |
| |
Arbitrage Fund | | | | | | | | | | | | |
Foreign Currency Contracts | | Unrealized appreciation on forward foreign currency exchange contracts | | $ | 5,134,842 | | | Unrealized depreciation on forward foreign currency exchange contracts | | $ | 9,523,659 | |
Equity Contracts (swap contracts) | | Unrealized appreciation on equity swap contracts | | | 293,130 | | | Unrealized depreciation on equity swap contracts | | | 15,363 | |
Equity Contracts (rights) | | Investments: at value | | | 7,777,268 | | | | | | | |
Equity Contracts (purchased option contracts) | | Investments: at value | | $ | 5,909,919 | | | | | | | |
Equity Contracts (written option contracts) | | | | | | | | Written options, at value | | $ | 1,289,356 | |
| | | | | | | | | | | | |
| | | | $ | 19,115,159 | | | | | $ | 10,828,378 | |
| | | | | | | | | | | | |
| | |
| 114 | | www.arbitragefunds.com | 1-800-295-4485 |
| | |
| The Arbitrage Funds | | Notes to Financial Statements (continued) |
May 31, 2014
| | | | | | | | | | | | |
Derivatives Not Accounted For As Hedging Instruments | | Asset Derivatives Statement of Assets and Liabilities Location | | Fair Value | | | Liability Derivatives Statement of Assets and Liabilities Location | | Fair Value | |
| |
Event-Driven Fund | | | | | | | | | | | | |
Foreign Currency Contracts | | Unrealized appreciation on forward foreign currency exchange contracts | | $ | 299,482 | | | Unrealized depreciation on forward foreign currency exchange contracts | | $ | 868,896 | |
Equity Contracts (swap contracts) | | | | | | | | Unrealized depreciation on equity swap contracts | | | 1,019 | |
Equity Contracts (rights) | | Investments: at value | | | 313,896 | | | | | | | |
Equity Contracts (purchased option contracts) | | Investments: at value | | | 851,173 | | | | | | | |
Equity Contracts (written option contracts) | | | | | | | | Written options, at value | | | 174,507 | |
| | | | | | | | | | | | |
| | | | $ | 1,464,551 | | | | | $ | 1,044,422 | |
| | | | | | | | | | | | |
| | | | |
Derivatives Not Accounted For As Hedging Instruments | | Asset Derivatives Statement of Assets and Liabilities Location | | Fair Value | | | Liability Derivatives Statement of Assets and Liabilities Location | | Fair Value | |
| |
Credit Opportunities Fund | | | | | | | | | | | | |
Foreign Currency Contracts | | Unrealized appreciation on forward foreign currency exchange contracts | | $ | 47 | | | Unrealized depreciation on forward foreign currency exchange contracts | | $ | 18,874 | |
Equity Contracts (purchased option contracts) | | Investments: at value | | | 53,845 | | | | | | | |
Equity Contracts (written option contracts) | | | | | | | | Written options, at value | | | 1,100 | |
| | | | | | | | | | | | |
| | | | $ | 53,892 | | | | | $ | 19,974 | |
| | | | | | | | | | | | |
| | |
| Annual Report | May 31, 2014 | | 115 |
| | |
| The Arbitrage Funds | | Notes to Financial Statements (continued) |
May 31, 2014
The effect of derivative instruments on the Funds’ Statement of Operations for the year ended May 31, 2014, was as follows:
| | | | | | | | | | |
Derivatives Not Accounted For As Hedging Instruments | | Location Of Gains/(Loss) On Derivatives Recognized In Income | | Realized Gain/(Loss) On Derivatives Recognized In Income | | | Changed In Unrealized Gain/(Loss) On Derivatives Recognized In Income | |
| |
Arbitrage Fund | | | | | | | | | | |
Foreign Currency Contracts | | Net realized gains (losses) from: Foreign currency transactions / Net change in unrealized appreciation (depreciation) on: Foreign currency transactions | | $ | (4,089,121) | | | $ | (11,129,366) | |
Equity Contracts (swap contracts) | | Net realized gains (losses) from: Equity swap contracts / Net change in unrealized appreciation (depreciation) on: Equity swap contracts | | | 3,195,833 | | | | (812,504) | |
Equity Contracts Long (rights) | | Net realized gains (losses) from: Investments / Net change in unrealized appreciation (depreciation) on: Investments | | | (445,294) | | | | (3,822,545) | |
Equity Contracts Short (rights) | | Net realized gains (losses) from: Investments / Net change in unrealized appreciation (depreciation) on: Securities sold short | | | 145,438 | | | | – | |
Equity Contracts (purchased option contracts) | | Net realized gains (losses) from: Investments / Net change in unrealized appreciation (depreciation) on: Investments | | | (1,198,750) | | | | 1,924,568 | |
Equity Contracts (written option contracts) | | Net realized gains (losses) from: Written option contracts / Net change in unrealized appreciation (depreciation) on: Written option contracts | | | 7,982,820 | | | | 4,001,952 | |
| | | | | | |
| | | | $ | 5,590,926 | | | $ | (9,837,895) | |
| | | | | | |
| | |
| 116 | | www.arbitragefunds.com | 1-800-295-4485 |
| | |
| The Arbitrage Funds | | Notes to Financial Statements (continued) |
May 31, 2014
| | | | | | | | | | |
Derivatives Not Accounted For As Hedging Instruments | | Location Of Gains/(Loss) On
Derivatives Recognized In Income | | Realized Gain/(Loss) On Derivatives Recognized In Income | | | Changed In Unrealized Gain/(Loss) On
Derivatives Recognized In Income | |
| |
Event-Driven Fund | | | | | | | | | | |
Foreign Currency Contracts | | Net realized gains (losses) from: Foreign currency transactions / Net change in unrealized appreciation (depreciation) on: Foreign currency transactions | | $ | 129,944 | | | $ | (689,102) | |
Equity Contracts (swap contracts) | | Net realized gains (losses) from: Equity swap contracts / Net change in unrealized appreciation (depreciation) on: Equity swap contracts | | | 42,732 | | | | (19,250) | |
Equity Contracts Long (rights) | | Net realized gains (losses) from: Investments / Net change in unrealized appreciation (depreciation) on: Investments | | | (2,871) | | | | (218,846) | |
Equity Contracts Short (rights) | | Net realized gains (losses) from: Investments / Net change in unrealized appreciation (depreciation) on: Securities sold short | | | 1,113 | | | | – | |
Equity Contracts (purchased option contracts) | | Net realized gains (losses) from: Investments / Net change in unrealized appreciation (depreciation) on: Investments | | | (1,406,229) | | | | (868,707) | |
Equity Contracts (written option contracts) | | Net realized gains (losses) from: Written option contracts / Net change in unrealized appreciation (depreciation) on: Written option contracts | | $ | 1,120,840 | | | $ | 81,261 | |
| | | | | | |
| | | | $ | (114,471) | | | $ | (1,714,644) | |
| | | | | | |
| | |
| Annual Report | May 31, 2014 | | 117 |
| | |
| The Arbitrage Funds | | Notes to Financial Statements (continued) |
May 31, 2014
| | | | | | | | | | |
Derivatives Not Accounted For As Hedging Instruments | | Location Of Gains/(Loss) On Derivatives Recognized In Income | | Realized Gain/(Loss) On Derivatives Recognized In Income | | | Changed In Unrealized Gain/(Loss) On Derivatives Recognized In Income | |
| |
Credit Opportunities Fund | | | | | | | | | | |
Foreign Currency Contracts | | Net realized gains (losses) from: Foreign currency transactions / Net change in unrealized appreciation (depreciation) on: Foreign currency transactions | | $ | 23,767 | | | $ | (21,700) | |
Equity Contracts (purchased option contracts) | | Net realized gains (losses) from: Investments / Net change in unrealized appreciation (depreciation) on: Investments | | | – | | | | 19,783 | |
Equity Contracts (written option contracts) | | Net realized gains (losses) from: Written option contracts / Net change in unrealized appreciation (depreciation) on: Written option contracts | | | 3,477 | | | | 1,085 | |
| | | | | | |
| | | | $ | 27,244 | | | $ | (832) | |
| | | | | | |
Volume of Derivative Instruments for the Funds during the year ended May 31, 2014, was as follows:
| | | | | | |
| Derivative Type | | Unit of Measurement | | Monthly Average | |
| |
Arbitrage Fund | | | | | | |
Equity Swap Contracts | | Notional Quantity | | | 30,130,395 | |
Forward Foreign Currency Exchange Contracts | | Net Contracts to Deliver/Receive | | | (1,222,104,185) | |
Purchased Option Contracts | | Contracts | | | 20,556 | |
Rights | | Shares | | | 5,830,248 | |
Written Option Contracts | | Contracts | | | (57,333) | |
| | |
| Derivative Type | | Unit of Measurement | | Monthly Average | |
| |
Event-Driven Fund | | | | | | |
Equity Swap Contracts | | Notional Quantity | | | 574,907 | |
Forward Foreign Currency Exchange Contracts | | Net Contracts to Deliver/Receive | | | (38,053,283) | |
Purchased Option Contracts | | Contracts | | | 6,090 | |
Rights | | Shares | | | 255,722 | |
Written Option Contracts | | Contracts | | | (4,340) | |
| | |
| 118 | | www.arbitragefunds.com | 1-800-295-4485 |
| | |
| The Arbitrage Funds | | Notes to Financial Statements (continued) |
May 31, 2014
| | | | | | |
| Derivative Type | | Unit of Measurement | | Monthly Average | |
| |
Credit Opportunities Fund | | | | | | |
Forward Foreign Currency Exchange Contracts | | Net Contracts to Deliver/Receive | | | (394,167) | |
Purchased Option Contracts | | Contracts | | | 59 | |
Written Option Contracts | | Contracts | | | (4) | |
Certain derivative contracts are executed under either standardized netting agreements or, for exchange-traded derivatives, the relevant contracts for a particular exchange which contain enforceable netting provisions. A derivative netting arrangement creates an enforceable right of set-off that becomes effective, and affects the realization of settlement on individual assets, liabilities and collateral amounts, only following a specified event of default or early termination. Default events may include the failure to make payments or deliver securities timely, material adverse changes in financial condition or insolvency, the breach of minimum regulatory capital requirements, or loss of license, charter or other legal authorization necessary to perform under the contract.
The following table presents financial instruments that are subject to enforceable netting arrangements or other similar agreements as of May 31, 2014:
Offsetting of Financial Assets and Derivative Assets:
| | | | | | | | | | | | | | | | | | | | | | | | |
| Arbitrage Fund | | | | | | | | | | | | | | | | | | |
| |
| | | | | | | | | | | | Gross Amounts Not Offset in the Statement of Assets and Liabilities | |
| | | | | | | | | | | | | | | | |
| Description | | Gross
Amounts of
Recognized
Assets | | | Gross
Amounts
Offset in the
Statement of
Assets and
Liabilities | | | Net Amounts
Presented in
the
Statement of
Assets and
Liabilities | | | Financial
Instruments(a) | | | Cash
Collateral
Received(a) | | | Net Amount | |
| |
Equity Swap Contracts | | $ | 293,130 | | | $ | – | | | $ | 293,130 | | | $ | – | | | $ | – | | | $ | 293,130 | |
| |
Total | | $ | 293,130 | | | $ | – | | | $ | 293,130 | | | $ | – | | | $ | – | | | $ | 293,130 | |
| |
| | |
| Annual Report | May 31, 2014 | | 119 |
| | |
| The Arbitrage Funds | | Notes to Financial Statements (continued) |
May 31, 2014
Offsetting of Financial Liabilities and Derivative Liabilities:
| | | | | | | | | | | | | | | | | | | | | | | | |
| Arbitrage Fund | |
| |
| | | | | | | | | | | | Gross Amounts Not Offset in the Statement of Assets and Liabilities | |
| | | | | | | | | | | | | | | | |
| Description | | Gross
Amounts of
Recognized
Liabilities | | | Gross
Amounts
Offset in the
Statement of
Assets and
Liabilities | | | Net Amounts
Presented in
the
Statement of
Assets and
Liabilities | | | Financial
Instruments(a) | | | Cash
Collateral
Pledged(a) | | | Net Amount | |
| |
Equity Swap Contracts | | $ | 15,363 | | | $ | – | | | $ | 15,363 | | | $ | – | | | $ | (15,363) | | | $ | – | |
| |
Total | | $ | 15,363 | | | $ | – | | | $ | 15,363 | | | $ | – | | | $ | (15,363) | | | $ | – | |
| |
|
| Event-Driven Fund | |
| |
| | | | | | | | | | | | Gross Amounts Not Offset in the Statement of Assets and Liabilities | |
| | | | | | | | | | | | | | | | |
| Description | | Gross
Amounts of
Recognized
Liabilities | | | Gross
Amounts
Offset in the
Statement of
Assets and
Liabilities | | | Net Amounts
Presented in
the
Statement of
Assets and
Liabilities | | | Financial
Instruments(a) | | | Cash
Collateral
Pledged(a) | | | Net Amount | |
| |
Equity Swap Contracts | | $ | 1,019 | | | $ | – | | | $ | 1,019 | | | $ | – | | | $ | (1,019) | | | $ | – | |
| |
Total | | $ | 1,019 | | | $ | – | | | $ | 1,019 | | | $ | – | | | $ | (1,019) | | | $ | – | |
| |
| (a) | These amounts are limited to the derivative asset/liability balance and, accordingly, do not include excess collateral received/pledged. |
Investment Income — Interest income and interest rebate expense is accrued as earned. Dividend income and expense are recorded on the ex-dividend date, net of any non-reclaimable tax withholdings.
| | |
| 120 | | www.arbitragefunds.com | 1-800-295-4485 |
| | |
| The Arbitrage Funds | | Notes to Financial Statements (continued) |
May 31, 2014
Dividends and Distributions to Shareholders — Dividends arising from net investment income and net capital gain distributions, if any, are declared and paid at least annually to shareholders of the Arbitrage Fund and Event-Driven Fund. Dividends arising from net investment income, if any, are declared and paid quarterly, and net capital gain distributions, if any, are declared and paid at least annually to shareholders of the Credit Opportunities Fund.
Allocation Between Classes — Investment income earned, realized capital gains and losses, and unrealized appreciation and depreciation are allocated daily to each class of shares based upon the proportionate shares of total net assets of each Fund. Class-specific expenses are charged directly to the class incurring the expense. Common expenses which are not attributable to a specific class are allocated daily to each class of shares based upon the proportionate share of total net assets of each Fund.
Offering Costs — Offering costs, including costs of printing initial prospectuses, legal and registration fees, have been amortized over twelve months from the inception date of the Credit Opportunities Fund. As of May 31, 2014, the offering costs have been fully amortized.
Federal Income Tax — It is the Funds’ policy to continue to comply with the special provisions of Subchapter M of the Internal Revenue Code of 1986, as amended, applicable to regulated investment companies. As provided therein, in any fiscal year in which a fund so qualifies and distributes at least 90% of its taxable net income, a fund (but not the shareholders) will be relieved of Federal income tax on the income distributed. Accordingly, no provision for income taxes has been made.
As of and during the year ended May 31, 2014, the Funds did not have a liability for any unrecognized tax benefits. The Funds file U.S. federal, state, and local tax returns as required. The Funds’ tax returns are subject to examination by the relevant tax authorities until expiration of the applicable statute of limitations which is generally three years after the filing of the tax return. Tax returns for open years have incorporated no uncertain tax positions that require a provision for income taxes.
3. INVESTMENT TRANSACTIONS
During the year ended May 31, 2014 for the Arbitrage Fund, the Event-Driven Fund, and the Credit Opportunities Fund, cost of purchases and proceeds from sales and maturities of investment securities, other than short-term investments, U.S. government securities, equity swap contracts, purchased and written option contracts and securities sold short, were as follows:
| | | | | | | | | | | | |
| | | Arbitrage Fund | | | Event-Driven Fund | | | Credit Opportunities Fund | |
Purchases | | $ | 10,888,290,293 | | | $ | 1,011,519,567 | | | $ | 41,578,365 | |
Sales and Maturities | | | 11,634,574,172 | | | | 625,456,064 | | | | 22,212,731 | |
4. LINE OF CREDIT
The Trust, on behalf of the Funds, entered into an agreement which enables the Funds to participate in a $300,000,000 unsecured committed revolving line of credit with State Street Bank and Trust Company (the “Custodian”). Borrowings will be made solely to temporarily finance the purchase or sale of securities or to finance the redemption of the shares of an investor of the
| | |
| Annual Report | May 31, 2014 | | 121 |
| | |
| The Arbitrage Funds | | Notes to Financial Statements (continued) |
May 31, 2014
Funds. Interest is charged to the Funds based on their borrowings at a rate per annum of the higher of the LIBOR rate plus 1.25% and the overnight federal funds rate plus 1.25%. In addition, a commitment fee of 0.10% per annum is payable at the end of each calendar quarter. The Trust accrues, on behalf of each of the Funds, the commitment fee on the unused portion of the line of credit. Such fees are included in custodian and bank service fees on the Statements of Operations.
The Arbitrage Fund did not have outstanding borrowings at May 31, 2014. For the year ended May 31, 2014, the Arbitrage Fund had average borrowings of $57,300,000 over a period of 14 days at a weighted average interest rate of 1.36%. Interest expense on the line of credit for the Arbitrage Fund during the year ended May 31, 2014, is shown as line of credit interest expense on the Arbitrage Fund’s Statement of Operations.
The Event-Driven Fund did not have outstanding borrowings at May 31, 2014. For the year ended May 31, 2014, the Event-Driven Fund had average borrowings of $1,200,000 over a period of 7 days at a weighted average interest rate of 1.38%. Interest expense on the line of credit for the Event-Driven Fund during the year ended May 31, 2014, is shown as line of credit interest expense on the Event-Driven Fund’s Statement of Operations.
For the year ended May 31, 2014, the Credit Opportunities Fund had no borrowings.
5. LOAN PARTICIPATIONS AND ASSIGNMENTS
The Funds may invest in direct debt instruments which are interests in amounts owed to lenders or lending syndicates by corporate, governmental, or other borrowers. The Funds’ investments in loans may be in the form of participations in loans or assignments of all or a portion of loans from third parties. A loan is often administered by a bank or other financial institution (the “lender”) that acts as agent for all holders. The agent administers the terms of the loan, as specified in the loan agreement. The Funds may invest in multiple series or tranches of a loan, which may have varying terms and carry different associated risks. The Funds generally have no right to enforce compliance with the terms of the loan agreement with the borrower. As a result, the Funds may be subject to the credit risk of both the borrower and the lender that is selling the loan agreement. When the Funds purchase assignments from lenders they acquire direct rights against the borrower of the loan. The Funds may enter into unfunded loan commitments, which are contractual obligations for future funding. Unfunded loan commitments represent a future obligation in full, even though a percentage of the notional loan amounts may not be utilized by the borrower. When investing in a loan participation, the Funds have the right to receive payments of principal, interest and any fees to which it is entitled only from the lender selling the loan agreement and only upon receipt of payments by the lender from the borrower. The Funds may receive a commitment fee based on the undrawn portion of the underlying line of credit portion of a floating rate loan. In certain circumstances, the Funds may receive a penalty fee upon the prepayment of a floating rate loan by a borrower. Fees earned or paid are recorded as a component of interest income or interest expense, respectively, on the Statement of Operations. At May 31, 2014, the Arbitrage Fund, Event-Driven Fund and Credit Opportunities Fund had $0, $18,750,695 and $2,480,398, respectively, in outstanding loan commitments.
| | |
| 122 | | www.arbitragefunds.com | 1-800-295-4485 |
| | |
| The Arbitrage Funds | | Notes to Financial Statements (continued) |
May 31, 2014
6. ADVISORY FEES, ADMINISTRATION FEES AND OTHER AGREEMENTS
Investment Advisory Agreement
The Funds’ investments are managed by Water Island Capital, LLC (the “Adviser”) under the terms of Investment Advisory Agreements. Under the Investment Advisory Agreement between the Adviser and the Arbitrage Fund, as amended and restated on October 1, 2007, the Arbitrage Fund pays the Adviser an annual fee, which is computed and accrued daily and paid monthly, of 1.25% on the first $250 million, 1.20% on the next $50 million, 1.15% on the next $50 million, 1.10% on the next $75 million, 1.05% on the next $75 million and 1.00% for amounts over $500 million, based on the Arbitrage Fund’s average daily net assets. Under the Investment Advisory Agreement between the Adviser and the Event-Driven Fund dated September 27, 2010, the Event-Driven Fund pays the Adviser an annual fee, which is computed and accrued daily and paid monthly, of 1.25% based on the Event-Driven Fund’s average daily net assets. Under the Investment Advisory Agreement between the Adviser and the Credit Opportunities Fund dated October 1, 2012, the Credit Opportunities Fund pays the Adviser an annual fee, which is computed and accrued daily and paid monthly, of 1.00% based on the Credit Opportunities Fund’s average daily net assets.
The Adviser has contractually agreed, at least until August 31, 2016, to waive its advisory fee and/or reimburse the Funds’ other expenses to the extent that total operating expenses (exclusive of interest, taxes, dividends on short positions, brokerage commissions, acquired fund fees and expenses and other costs incurred in connection with the purchase or sale of portfolio securities) exceed the annual rate of the Funds’ average daily net assets attributable to each share class as shown in the table below:
| | | | | | |
| | | Arbitrage Fund | | Event-Driven Fund | | Credit Opportunities Fund |
Class R | | 1.69% | | 1.69% | | 1.50% |
Class I | | 1.44% | | 1.44% | | 1.25% |
Class C | | 2.44% | | 2.44% | | 2.25% |
Class A | | 1.69% | | 1.69% | | 1.50% |
For the year ended May 31, 2014, the aggregate net fee paid to the Adviser as a percentage of average net assets for the Arbitrage Fund, Event-Driven Fund and Credit Opportunities Fund was 1.03%, 1.21% and 0.03%, respectively.
The Adviser is permitted to recapture fees waived and expenses reimbursed to the extent actual fees and expenses for a period are less than the expense limitation of each class, provided, however, that the Adviser shall only be entitled to recapture such amounts for a period of three years from the end of the fiscal year during which such amount was waived or reimbursed. The Adviser can recapture any fees it has waived within three fiscal years of the year in which fees were waived period subject to the applicable annual rate of: 1.69% for Class R shares, 1.44% for Class I shares, 2.44% for Class C shares and 1.69% for Class A shares for Event-Driven Fund and 1.50% for Class R shares, 1.25% for Class I shares, 2.25% for Class C shares and 1.50% for Class A shares for Credit Opportunities Fund, respectively.
| | |
| Annual Report | May 31, 2014 | | 123 |
| | |
| The Arbitrage Funds | | Notes to Financial Statements (continued) |
May 31,2014
As of May 31, 2014, the balances of future recapture for each Fund were as follows:
| | | | | | | | | | | | | | | | |
| | | Expiring May 31, 2015 | | | Expiring May 31, 2016 | | | Expiring May 31, 2017 | | | Total | |
Event-Driven Fund | | | | | | | | | | | | | | | | |
Class R | | $ | 37,027 | | | $ | 30,441 | | | $ | 16,826 | | | $ | 84,294 | |
Class I | | $ | 78,860 | | | $ | 127,460 | | | $ | 67,294 | | | $ | 273,614 | |
Class C | | | N/A | | | $ | 620 | | | $ | 854 | | | $ | 1,474 | |
Class A | | | N/A | | | | N/A | | | $ | 756 | | | $ | 756 | |
Credit Opportunities Fund | | | | | | | | | | | | | | | | |
Class R | | | N/A | | | $ | 22,353 | | | $ | 36,515 | | | $ | 58,868 | |
Class I | | | N/A | | | $ | 51,089 | | | $ | 113,965 | | | $ | 165,054 | |
Class C | | | N/A | | | $ | 399 | | | $ | 1,393 | | | $ | 1,792 | |
Class A | | | N/A | | | | N/A | | | $ | 214 | | | $ | 214 | |
There were no amounts recaptured during the year ended May 31, 2014, for the Funds.
Certain officers of the Trust are also officers of the Adviser. The Chief Compliance Officer (“CCO”) of the Trust also serves as the CCO of the Adviser. The Funds pay the Adviser 95% of the CCO’s salary for providing CCO services.
Administration Agreement
ALPS Fund Services, Inc. (“ALPS” and the “Administrator”) serves as the Trust’s administrator pursuant to an Administration, Bookkeeping and Pricing Services Agreement (“Administration Agreement”) with the Trust. As compensation for its services to the Trust, ALPS receives an annual administration fee based on the annual minimum fee of $370,000. The Administrator is also reimbursed by the Trust for certain out-of-pocket expenses. Certain officers of the Trust are also officers of the Administrator.
Distribution Agreement
ALPS Distributors, Inc. (the “Distributor”) serves as the Funds’ distributors. The Distributor acts as an agent for the Funds and the distributor of their shares.
The Funds have adopted, with respect to their Class R, Class C shares and Class A shares, a plan of distribution pursuant to Rule 12b-1 under the 1940 Act which permits each Fund to pay for expenses incurred in the distribution and promotion of the Funds’ Class R shares, Class C shares and Class A shares and for services provided to shareholders. The Plan is a “reimbursement” plan. This means that a Fund’s Class R shares, Class C shares and Class A shares only pay a particular 12b-1 fee to the extent that the Adviser, the Distributor or others have incurred expenses in the promotion and distribution of the shares, including but not limited to, the printing of prospectuses and reports used for sales purposes, expenses of preparation of sales literature and related expenses, advertisements, and other distribution-related expenses, as well as any distribution fees paid to securities dealers or others. Under the distribution plan, a Fund may pay compensation to any broker-dealer with whom the Distributor or the Funds has entered into a contract to distribute Class R shares, Class C shares or Class A shares, or to any other qualified financial services firm, for distribution and/or shareholder-related services with respect to shares held or purchased by their respective customers or in connection with the purchase of shares attributable to their efforts. The amount of payments under the Plan in any year shall not exceed 0.25% for Class R shares, 0.75%
| | |
| 124 | | www.arbitragefunds.com | 1-800-295-4485 |
| | |
| The Arbitrage Funds | | Notes to Financial Statements (continued) |
May 31, 2014
for Class C shares and 0.25% for Class A shares, respectively, of the average daily net assets allocable to a Fund’s Class R shares, Class C shares and Class A shares, respectively. In addition, the Plan permits each Fund to make payments at an annual rate of up to 0.25% of the Fund’s Class C shares for expenses incurred in connection with the provision of shareholder support or administrative services for the Fund’s Class C shares. During the year ended May 31, 2014, The Arbitrage Fund’s Class R shares incurred $2,159,660, Class C shares incurred $296,242 and Class A shares incurred $7,314, respectively, in distribution expenses for Class R shares and Class A shares and distribution and shareholder support expenses for Class C shares, all of which was used to compensate broker-dealers. With respect to the Event-Driven Fund, during the year ended May 31, 2014, the Event-Driven Fund’s Class R shares incurred $179,606, Class C shares incurred $13,884 and Class A shares incurred $3,829, respectively, in distribution expenses for Class R shares and Class A shares and distribution and shareholder support expenses for Class C shares, all of which was used to compensate broker-dealers. With respect to the Credit Opportunities Fund, during the year ended May 31, 2014, the Credit Opportunities Fund’s Class R shares incurred $8,742, Class C shares incurred $1,426 and Class A shares incurred $48, respectively, in distribution expenses for Class R shares and Class A shares and distribution and shareholder support expenses for Class C shares, all of which was used to compensate broker-dealers.
Principal Financial Officer
ALPS receives an annual fee of $10,000 for providing Principal Financial Officer (“PFO”) services to the Trust. ALPS is compensated by the trust under a PFO Services Agreement.
Transfer Agent And Shareholder Services Agreement
DST Systems, Inc. (“DST”) maintains the records of each shareholder’s account, answers shareholders’ inquiries concerning their accounts, processes purchases and redemptions of the Funds shares, acts as dividend and distribution disbursing agent and performs other shareholder service functions.
Under the terms of the amended Transfer Agent and Shareholder Services Agreement between the Trust and DST, DST receives from the Funds a monthly complex minimum fee, including three CUSIPS (i.e., first CUSIP in a Fund), at an annual rate of $90,000 per year. For each CUSIP thereafter, an additional fee is applied at a minimum fee of $10,000 per CUSIP per year. There were nine additional CUSIPS added during the fiscal year ended May 31, 2014. In addition, the Funds pay out-of-pocket expenses, including but not limited to, postage, envelopes, checks, drafts, forms, reports, telephone services, record storage and communication lines. These out-of-pocket expenses are included in transfer agent fees on the Funds Statement of Operations.
| | |
| Annual Report | May 31, 2014 | | 125 |
| | |
| The Arbitrage Funds | | Notes to Financial Statements (continued) |
May 31, 2014
7. CAPITAL SHARE TRANSACTIONS
Proceeds and payments on capital shares as shown in the Statements of Changes in Net Assets are the result of the following capital share transactions for the periods shown:
| | | | | | | | |
| | | Year Ended May 31, 2014 | | | Year Ended May 31, 2013 | |
| Arbitrage Fund - Class R | | | | | | |
| |
Shares sold | | | 28,923,212 | | | | 31,786,403 | |
Shares issued in reinvestment of dividends | | | 324,860 | | | | 2,177,472 | |
Shares redeemed | | | (42,117,648) | | | | (39,071,802) | |
| | | | |
Net decrease in shares outstanding | | | (12,869,576) | | | | (5,107,927) | |
| | | | |
Shares outstanding at beginning of period | | | 73,329,601 | | | | 78,437,528 | |
| | | | |
Shares outstanding at end of period | | | 60,460,025 | | | | 73,329,601 | |
| | | | |
| Arbitrage Fund - Class I | | | | | | |
| |
Shares sold | | | 56,548,797 | | | | 73,503,353 | |
Shares issued in reinvestment of dividends | | | 370,899 | | | | 2,674,069 | |
Shares redeemed | | | (75,823,038) | | | | (84,020,838) | |
| | | | |
Net decrease in shares outstanding | | | (18,903,342) | | | | (7,843,416) | |
| | | | |
Shares outstanding at beginning of period | | | 152,071,318 | | | | 159,914,734 | |
| | | | |
Shares outstanding at end of period | | | 133,167,976 | | | | 152,071,318 | |
| | | | |
| Arbitrage Fund - Class C(a) | | | | | | |
| |
Shares sold | | | 1,810,652 | | | | 1,567,850 | |
Shares issued in reinvestment of dividends | | | 7,056 | | | | 13,063 | |
Shares redeemed | | | (615,921) | | | | (67,176) | |
| | | | |
Net increase in shares outstanding | | | 1,201,787 | | | | 1,513,737 | |
| | | | |
Shares outstanding at beginning of period | | | 1,513,737 | | | | – | |
| | | | |
Shares outstanding at end of period | | | 2,715,524 | | | | 1,513,737 | |
| | | | |
| Arbitrage Fund - Class A(b) | | | | | | |
| |
Shares sold | | | 638,242 | | | | – | |
Shares issued in reinvestment of dividends | | | 797 | | | | – | |
Shares redeemed | | | (110,396) | | | | – | |
| | | | |
Net increase in shares outstanding | | | 528,643 | | | | – | |
| | | | |
Shares outstanding at beginning of period | | | – | | | | – | |
| | | | |
Shares outstanding at end of period | | | 528,643 | | | | – | |
| | | | |
| | |
| 126 | | www.arbitragefunds.com | 1-800-295-4485 |
| | |
| The Arbitrage Funds | | Notes to Financial Statements (continued) |
May 31, 2014
| | | | | | | | |
| | | Year Ended May 31, 2014 | | | Year Ended May 31, 2013 | |
| Event-Driven Fund - Class R | | | | | | |
| |
Shares sold | | | 20,533,072 | | | | 696,518 | |
Shares issued in reinvestment of dividends | | | 19,940 | | | | 17,016 | |
Shares redeemed | | | (1,760,311) | | | | (602,065) | |
| | | | |
Net increase in shares outstanding | | | 18,792,701 | | | | 111,469 | |
| | | | |
Shares outstanding at beginning of period | | | 1,028,761 | | | | 917,292 | |
| | | | |
Shares outstanding at end of period | | | 19,821,462 | | | | 1,028,761 | |
| | | | |
| Event-Driven Fund - Class I | | | | | | |
| |
Shares sold | | | 27,051,554 | | | | 3,921,901 | |
Shares issued in reinvestment of dividends | | | 31,536 | | | | 65,105 | |
Shares redeemed | | | (3,236,214) | | | | (1,956,757) | |
| | | | |
Net increase in shares outstanding | | | 23,846,876 | | | | 2,030,249 | |
| | | | |
Shares outstanding at beginning of period | | | 4,208,864 | | | | 2,178,615 | |
| | | | |
Shares outstanding at end of period | | | 28,055,740 | | | | 4,208,864 | |
| | | | |
| Event-Driven Fund - Class C(a) | | | | | | |
| |
Shares sold | | | 380,682 | | | | 35,656 | |
Shares issued in reinvestment of dividends | | | 672 | | | | 309 | |
Shares redeemed | | | (2,230) | | | | (1,026) | |
| | | | |
Net increase in shares outstanding | | | 379,124 | | | | 34,939 | |
| | | | |
Shares outstanding at beginning of period | | | 34,939 | | | | – | |
| | | | |
Shares outstanding at end of period | | | 414,063 | | | | 34,939 | |
| | | | |
| Event-Driven Fund - Class A(b) | | | | | | |
| |
Shares sold | | | 387,229 | | | | – | |
Shares issued in reinvestment of dividends | | | 718 | | | | – | |
Shares redeemed | | | (16,033) | | | | – | |
| | | | |
Net increase in shares outstanding | | | 371,914 | | | | – | |
| | | | |
Shares outstanding at beginning of period | | | – | | | | – | |
| | | | |
Shares outstanding at end of period | | | 371,914 | | | | – | |
| | | | |
| | |
| Annual Report | May 31, 2014 | | 127 |
| | |
| The Arbitrage Funds | | Notes to Financial Statements (continued) |
May 31, 2014
| | | | | | | | |
| | | Year Ended
May 31, 2014 | | | Period Ended
May 31, 2013(c) | |
| Credit Opportunities Fund - Class R | | | | | | |
| |
Shares sold | | | 723,248 | | | | 170,405 | |
Shares issued in reinvestment of dividends | | | 10,735 | | | | 786 | |
Shares redeemed | | | (276,188) | | | | (7,026) | |
| | | | |
Net increase in shares outstanding | | | 457,795 | | | | 164,165 | |
| | | | |
Shares outstanding at beginning of period | | | 164,165 | | | | – | |
| | | | |
Shares outstanding at end of period | | | 621,960 | | | | 164,165 | |
| | | | |
| Credit Opportunities Fund - Class I | | | | | | |
| |
Shares sold | | | 2,259,583 | | | | 339,129 | |
Shares issued in reinvestment of dividends | | | 32,519 | | | | 1,700 | |
Shares redeemed | | | (384,972) | | | | – | |
| | | | |
Net increase in shares outstanding | | | 1,907,130 | | | | 340,829 | |
| | | | |
Shares outstanding at beginning of period | | | 340,829 | | | | – | |
| | | | |
Shares outstanding at end of period | | | 2,247,959 | | | | 340,829 | |
| | | | |
| Credit Opportunities Fund - Class C | | | | | | |
| |
Shares sold | | | 70,670 | | | | 2,510 | |
Shares issued in reinvestment of dividends | | | 239 | | | | 8 | |
Shares redeemed | | | (3,462) | | | | – | |
| | | | |
Net increase in shares outstanding | | | 67,447 | | | | 2,518 | |
| | | | |
Shares outstanding at beginning of period | | | 2,518 | | | | – | |
| | | | |
Shares outstanding at end of period | | | 69,965 | | | | 2,518 | |
| | | | |
| Credit Opportunities Fund - Class A(a) | | | | | | |
| |
Shares sold | | | 2,713 | | | | – | |
Shares issued in reinvestment of dividends | | | 41 | | | | – | |
Net increase in shares outstanding | | | 2,754 | | | | – | |
| | | | |
Shares outstanding at beginning of period | | | – | | | | – | |
| | | | |
Shares outstanding at end of period | | | 2,754 | | | | – | |
| | | | |
| (a) | Commenced operations on June 1, 2012. |
| (b) | Commenced operations on June 1, 2013. |
| (c) | Commenced operations on October 1, 2012. |
8. FOREIGN CURRENCY TRANSLATION
Amounts denominated in or expected to settle in foreign currencies are translated to U.S. dollars based on exchange rates on the following basis:
A. The market values of investment securities and other assets and liabilities are translated at the closing rate of exchange each day.
B. Purchases and sales of investment securities and income and expenses are translated at the rate of exchange prevailing on the respective dates of such transactions.
C. The Funds do not isolate that portion of the results of operations caused by changes in foreign exchange rates on investments from those caused by changes in market prices of securities held.
| | |
| 128 | | www.arbitragefunds.com | 1-800-295-4485 |
| | |
| The Arbitrage Funds | | Notes to Financial Statements (continued) |
May 31, 2014
Such fluctuations are included with the net realized and unrealized gains or losses on investments. Reported net realized foreign exchange gains or losses arise from 1) purchases and sales of foreign currencies; 2) currency gains or losses realized between the trade and settlement dates on securities transactions; and 3) the difference between the amounts of dividends, interest and foreign withholding taxes recorded on the Funds’ books, and the U.S. dollar equivalent of the amounts actually received or paid. Reported net unrealized foreign exchange gains and losses arise from changes in the value of assets and liabilities, other than investment securities, resulting from changes in exchange rates.
9. CONTINGENCIES AND COMMITMENTS
The Funds indemnify the Trust’s officers and trustees for certain liabilities that might arise from their performance of their duties to the Funds. Additionally, in the normal course of business the Funds enter into contracts that contain a variety of representations and warranties and which provide general indemnifications. The Funds’ maximum exposure under these arrangements is unknown, as this would involve future claims that may be made against the Funds that have not yet occurred. However, based on experience, the Funds expect the risk of loss to be remote.
10. SECURITIES LENDING
In order to generate additional income, the Funds may, from time to time, lend portfolio securities to broker-dealers, banks or institutional borrowers of securities. The Funds must receive 100% collateral in the form of cash or U.S. government securities. This collateral must be valued daily and, should the market value of the loaned securities increase, the borrower must furnish additional collateral to the Funds. During the time portfolio securities are on loan, the borrower pays the Funds any dividends or interest paid on such securities.
Loans are subject to termination by the Funds or the borrower at any time. While the Funds do not have the right to vote securities on loan, they have the right to terminate the loan and regain the right to vote if that is considered important with respect to the investment. In the event the borrower defaults in its obligation to the Funds, the Funds bear the risk of delay in the recovery of portfolio securities and the risk of loss of rights in the collateral. There were no securities on loan in the Funds during the year ended May 31, 2014.
11. FEDERAL TAX INFORMATION
In order to avoid imposition of the excise tax applicable to regulated investment companies, it is also the Funds’ intention to declare as dividends in each calendar year at least 98% of its net investment income (earned during the calendar year) and 98.2% of its net realized capital gains (earned during the twelve months ended October 31) plus undistributed amounts from prior years.
The amount of distributions from net investment income and net realized gains, if any, are determined in accordance with Federal income tax regulations which may differ from accounting principles generally accepted in the United States of America. These “book/tax” differences are either temporary or permanent in nature and permanent differences are charged or credited to undistributed net investment income (loss), accumulated net realized gain (loss) or paid-in capital as appropriate in the period that the differences arise.
| | |
| Annual Report | May 31, 2014 | | 129 |
| | |
| The Arbitrage Funds | | Notes to Financial Statements (continued) |
May 31, 2014
Permanent differences between the Funds’ financial statement and income tax reporting requirements are primarily attributable to gains and losses on certain foreign currency related transactions, short sale related dividend expense, investments in passive foreign investment companies, and investments in swaps. These have no effect on the Funds’ net assets or net asset value per share.
| | | | | | | | | | | | |
| Fund | | Undistributed Net
Investment Income | | | Accumulated
Realized Loss | | | Paid-in Capital | |
| |
The Arbitrage Fund | | $ | 9,238,239 | | | $ | (1,804,331) | | | $ | (7,433,908) | |
The Arbitrage Event-Driven Fund | | | 321,389 | | | | (377,388) | | | | 55,999 | |
The Arbitrage Credit Opportunities Fund | | | 28,321 | | | | (22,280) | | | | (6,041) | |
Included in the amounts reclassified was a net operating loss offset to paid-in capital of $7,433,915 for The Arbitrage Fund.
The tax character of dividends and distributions delared during the years ended May 31, 2014 and May 31, 2013 was as follows:
| | | | | | | | | | | | | | |
Fund | | Year Ended | | Ordinary
Income | | | Long-Term Capital
Gains* | | | Total Distributions | |
| |
The Arbitrage Fund | | 5/31/2014 | | $ | – | | | $ | 12,319,798 | | | $ | 12,319,798 | |
The Arbitrage Fund | | 5/31/2013 | | | 86,556,164 | | | | 2,300 | | | | 86,558,464 | |
The Arbitrage Event-Driven Fund | | 5/31/2014 | | | 982,616 | | | | – | | | | 982,616 | |
The Arbitrage Event-Driven Fund | | 5/31/2013 | | | 1,074,249 | | | | – | | | | 1,074,249 | |
The Arbitrage Credit Opportunities Fund | | 5/31/2014 | | | 440,526 | | | | – | | | | 440,526 | |
The Arbitrage Credit Opportunities Fund | | 5/31/2013 | | | 36,674 | | | | – | | | | 36,674 | |
| * | The Funds designate these distributions as long-term capital gains dividends per IRC code section 852(b)(3)(C). |
As of May 31, 2014, the components of distributable earnings on a tax basis were as follows:
| | | | | | | | | | | | |
| | | The Arbitrage Fund | | | The Arbitrage Event-
Driven Fund | | | The Arbitrage Credit
Opportunities Fund | |
Undistributed ordinary income | | $ | – | | | $ | 6,333,194 | | | $ | 302,174 | |
Accumulated capital losses | | | (11,516,700) | | | | – | | | | (18,179) | |
Unrealized appreciation | | | 1,702,579 | | | | 3,731,340 | | | | 79,995 | |
Other cumulative timing differences | | | (19,271,777) | | | | (930,093) | | | | (48) | |
| |
Total distributable earnings | | $ | (29,085,898) | | | $ | 9,134,441 | | | $ | 363,942 | |
| |
| | |
| 130 | | www.arbitragefunds.com | 1-800-295-4485 |
| | |
| The Arbitrage Funds | | Notes to Financial Statements (continued) |
May 31, 2014
The following information is computed on a tax basis for each item as of May 31, 2014:
| | | | | | | | | | | | | | | | | | | | |
| Fund | | Gross
Appreciation
(excess of
value over tax
cost) | | | Gross
Depreciation
(excess of tax
cost over value) | | | Net Depreciation
of Foreign
Currency and
Derivatives | | | Net Unrealized
Appreciation | | | Cost of
Investments for
Income Tax
Purposes | |
| |
The Arbitrage Fund | | $ | 77,366,642 | | | $ | (29,626,219) | | | $ | (46,037,844) | | | $ | 1,702,579 | | | $ | 2,432,084,168 | |
The Arbitrage Event-Driven Fund | | | 15,153,513 | | | | (6,559,402) | | | | (4,862,770) | | | | 3,731,340 | | | | 499,673,398 | |
The Arbitrage Credit Opportunities Fund | | | 386,458 | | | | (219,669) | | | | (86,794) | | | | 79,995 | | | | 30,664,830 | |
The differences between book–basis and tax–basis net unrealized appreciation/(depreciation) for the Arbitrage Fund, the Event-Driven Fund and the Credit Opportunities Fund are attributable to constructive sales, dividends related to short securities, investments in passive foreign investment companies, and wash sales.
Capital Loss Carryovers:
Capital loss carryovers used during the period ended May 31, 2014, were $3,738 for the Arbitrage Credit Opportunities Fund.
Post-Enactment Capital Losses:
Under the recently enacted Regulated Investment Company Modernization Act of 2010, Funds are permitted to carry forward capital losses incurred in taxable years beginning after December 22, 2010, for an unlimited period. Post-enactment capital losses that are carried forward will retain their character as either short-term or long-term capital.
The Arbitrage Fund has elected to defer Long Term capital losses in the amount of $11,516,700 to the next tax year.
The Arbitrage Credit Opportunities Fund has elected to defer Short Term capital losses in the amount of $7,187 to the next tax year.
Late Year Losses:
The Arbitrage Credit Opportunities Fund elects to defer to the period ending May 31, 2015, capital losses recognized during the period November 1, 2013 to May 31, 2014 in the amount of $10,992.
The Arbitrage Fund elects to defer to the period ending May 31, 2015, late year ordinary losses in the amount of $17,479,638.
| | |
| Annual Report | May 31, 2014 | | 131 |
| | |
| The Arbitrage Funds | | Notes to Financial Statements (continued) |
May 31, 2014
12. RECENT ACCOUNTING PRONOUNCEMENT
In June 2013, the Financial Accounting Standards Board (FASB) issued Accounting Standards Update (ASU) No. 2013-08, Financial Services-Investment Companies (Topic 946): Amendments to the Scope, Measurement, and Disclosure Requirements. The FASB standard identifies characteristics a company must assess to determine whether it is considered an investment company for financial reporting purposes. This ASU is effective for fiscal years beginning after December 15, 2013. The Funds believe the adoption of this ASU will not have a material impact on the financial statements.
| | |
| 132 | | www.arbitragefunds.com | 1-800-295-4485 |
|
| Report of Independent Registered Public Accounting Firm |
The Board of Trustees and Shareholders of
The Arbitrage Funds
We have audited the accompanying statements of assets and liabilities, including the portfolios of investments, of The Arbitrage Funds (comprising, respectively, The Arbitrage Fund, The Arbitrage Event-Driven Fund, and The Arbitrage Credit Opportunities Fund) (the Funds) as of May 31, 2014, and the related statements of operations for the year then ended, the statements of changes in net assets for each of the two years in the period then ended, and the financial highlights for each of the three years in the period then ended (except for The Credit Opportunities Fund which is for each of the two years in the period then ended). These financial statements and financial highlights are the responsibility of the Funds’ management. Our responsibility is to express an opinion on these financial statements and financial highlights based on our audits. The financial highlights of the Funds for the periods presented through May 31, 2011, were audited by other auditors whose report dated August 1, 2011, expressed an unqualified opinion on those financial highlights.
We conducted our audits in accordance with the standards of the Public Company Accounting Oversight Board (United States). Those standards require that we plan and perform the audit to obtain reasonable assurance about whether the financial statements and financial highlights are free of material misstatement. We were not engaged to perform an audit of the Funds’ internal control over financial reporting. Our audits included consideration of internal control over financial reporting as a basis for designing audit procedures that are appropriate in the circumstances, but not for the purpose of expressing an opinion on the effectiveness of the Funds’ internal control over financial reporting. Accordingly, we express no such opinion. An audit also includes examining, on a test basis, evidence supporting the amounts and disclosures in the financial statements and financial highlights, assessing the accounting principles used and significant estimates made by management, and evaluating the overall financial statement presentation. Our procedures included confirmation of securities owned as of May 31, 2014, by correspondence with the custodian, agent banks, and brokers, or by other appropriate auditing procedures where replies from agent bank and brokers were not received. We believe that our audits provide a reasonable basis for our opinion.
In our opinion, the financial statements and financial highlights audited by us as referred to above present fairly, in all material respects, the financial position of each of the respective portfolios constituting the Arbitrage Funds at May 31, 2014, the results of their operations for the year then ended, the changes in their net assets for each of the two years in the period then ended, and the financial highlights for each of the three years in the period then ended (except for The Credit Opportunities Fund which is for each of the two years in the period then ended), in conformity with U.S. generally accepted accounting principles.

Minneapolis, Minnesota
July 30, 2014
| | |
| Annual Report | May 31, 2014 | | 133 |
| | |
| The Arbitrage Funds | | Disclosure of Fund Expenses |
All mutual funds have operating expenses. As a shareholder of a mutual fund, your investment is affected by these ongoing costs, which include (among others) costs for portfolio management, administrative services, distribution (12b-1) expenses, redemption fees and shareholder reports like this one. It is important for you to understand the impact of these costs on your investment returns.
Operating expenses such as these are deducted from a mutual fund’s gross income and directly reduce its final investment return. These expenses are expressed as a percentage of a mutual fund’s average net assets; this percentage is known as a mutual fund’s expense ratio.
The following examples use the expense ratio and are intended to help you understand the ongoing costs (in dollars) of investing in your Fund and to compare these costs with those of other mutual funds. The examples are based on an investment of $1,000 made at the beginning of the period shown and held for the entire period.
The table on the following page illustrates your Fund’s costs in two ways.
Actual Fund Return. This section helps you to estimate the actual expenses after fee waivers that your Fund incurred over the period. The “Expenses Paid During Period” column shows the actual dollar expense cost incurred by a $1,000 investment in the Fund, and the “Ending Account Value” number is derived from deducting that expense cost from the Fund’s gross investment return.
You can use this information, together with the actual amount you invested in the Fund, to estimate the expenses you paid over that period. Simply divide your actual account value by $1,000 to arrive at a ratio (for example, an $8,600 account value divided by $1,000 = 8.6), then multiply that ratio by the number shown for your Fund under “Expenses Paid During Period.”
Hypothetical 5% Return. This section helps you compare your Fund’s costs with those of other mutual funds. It assumes that the Fund had an annual 5% return before expenses during the period, but that the expense ratio (Column 3) for the period is unchanged. This example is useful in making comparisons because the Securities and Exchange Commission requires all mutual funds to make this 5% calculation. You can assess your Fund’s comparative cost by comparing the hypothetical result for your Fund in the “Expenses Paid During Period” column with those that appear in the same charts in the shareholder reports for other mutual funds.
Note: Because the return is set at 5% for comparison purposes — NOT your Fund’s actual return — the account values shown may not apply to your specific investment.
| | |
| 134 | | www.arbitragefunds.com | 1-800-295-4485 |
| | |
| The Arbitrage Funds | | Disclosure of Fund Expenses (continued) |
May 31, 2014 (Unaudited)
| | | | | | | | |
| | | Beginning
Account Value
12/01/2013 | | Ending
Account Value
05/31/2014 | | Expense
Ratio(a) | | Expenses
Paid During
Period(b) |
The Arbitrage Fund | | | | | | | | |
Class R | | | | | | | | |
Actual | | $1,000.00 | | $1,002.20 | | 2.50% | | $12.48 |
Hypothetical (5% return before expenses) | | $1,000.00 | | $1,012.47 | | 2.50% | | $12.54 |
Class I | | | | | | | | |
Actual | | $1,000.00 | | $1,003.70 | | 2.25% | | $11.24 |
Hypothetical (5% return before expenses) | | $1,000.00 | | $1,013.71 | | 2.25% | | $11.30 |
Class C | | | | | | | | |
Actual | | $1,000.00 | | $998.20 | | 3.15% | | $15.69 |
Hypothetical (5% return before expenses) | | $1,000.00 | | $1,009.22 | | 3.15% | | $15.78 |
Class A | | | | | | | | |
Actual | | $1,000.00 | | $1,002.20 | | 2.50% | | $12.48 |
Hypothetical (5% return before expenses) | | $1,000.00 | | $1,012.47 | | 2.50% | | $12.54 |
| | | | |
The Arbitrage Event-Driven Fund | | | | | | | | |
Class R | | | | | | | | |
Actual | | $1,000.00 | | $1,020.10 | | 2.33% | | $11.73 |
Hypothetical (5% return before expenses) | | $1,000.00 | | $1,013.31 | | 2.33% | | $11.70 |
Class I | | | | | | | | |
Actual | | $1,000.00 | | $1,021.80 | | 2.13% | | $10.74 |
Hypothetical (5% return before expenses) | | $1,000.00 | | $1,014.31 | | 2.13% | | $10.70 |
Class C | | | | | | | | |
Actual | | $1,000.00 | | $1,017.20 | | 3.11% | | $15.64 |
Hypothetical (5% return before expenses) | | $1,000.00 | | $1,009.42 | | 3.11% | | $15.58 |
Class A | | | | | | | | |
Actual | | $1,000.00 | | $1,020.90 | | 2.36% | | $11.89 |
Hypothetical (5% return before expenses) | | $1,000.00 | | $1,013.16 | | 2.36% | | $11.85 |
| | | | |
The Arbitrage Credit Opportunities Fund | | | | | | | | |
Class R | | | | | | | | |
Actual | | $1,000.00 | | $1,015.90 | | 1.65% | | $8.29 |
Hypothetical (5% return before expenses) | | $1,000.00 | | $1,016.70 | | 1.65% | | $8.30 |
Class I | | | | | | | | |
Actual | | $1,000.00 | | $1,016.80 | | 1.41% | | $7.09 |
Hypothetical (5% return before expenses) | | $1,000.00 | | $1,017.90 | | 1.41% | | $7.09 |
| | |
| Annual Report | May 31, 2014 | | 135 |
| | |
| The Arbitrage Funds | | Disclosure of Fund Expenses (continued) |
May 31, 2014 (Unaudited)
| | | | | | | | |
| | | Beginning
Account Value
12/01/2013 | | Ending
Account Value
05/31/2014 | | Expense
Ratio(a) | | Expenses
Paid During
Period(b) |
Class C | | | | | | | | |
Actual | | $1,000.00 | | $1,013.10 | | 2.41% | | $12.10 |
Hypothetical (5% return before expenses) | | $1,000.00 | | $1,012.91 | | 2.41% | | $12.09 |
Class A | | | | | | | | |
Actual | | $1,000.00 | | $1,015.10 | | 1.65% | | $8.29 |
Hypothetical (5% return before expenses) | | $1,000.00 | | $1,016.70 | | 1.65% | | $8.30 |
| (a) | Annualized, based on the Fund’s most recent fiscal half-year expenses. |
| (b) | Expenses are equal to the Fund’s annualized ratio multiplied by the average account value over the period, multiplied by the number of days in the most recent fiscal half year (182), divided by 365. |
| | |
| 136 | | www.arbitragefunds.com | 1-800-295-4485 |
| | |
| The Arbitrage Funds | | Additional Information |
May 31, 2014 (Unaudited)
1. PROXY VOTING POLICIES AND VOTING RECORD
A description of the policies and procedures that the Funds use to vote proxies relating to portfolio securities is available without charge upon request by calling toll-free 1-800-295-4485, or on the Securities and Exchange Commission’s (“SEC”) website at http://www.sec.gov. Information regarding how the Funds voted proxies relating to portfolio securities during the most recent fiscal year ending June 30th will be available without charge upon request by calling toll-free 1-800-295-4485, or on the SEC’s website at http://www.sec.gov.
2. QUARTERLY PORTFOLIO HOLDINGS
The Funds file a complete listing of their portfolio holdings with the SEC as of the first and third quarters of each fiscal year on Form N-Q. The filings are available upon request by calling 1-800-295-4485. Furthermore, you may obtain a copy of the filing on the SEC’s website at http://www.sec.gov. The Funds’ Forms N-Q may also be reviewed and copied at the SEC’s Public Reference Room in Washington, D.C., and information on the operation of the Public Reference Room may be obtained by calling 1-800-SEC-0330.
3. TAX INFORMATION
The Funds designated the following for federal income tax purposes for distributions made during the calendar year ended December 31, 2014:
| | | | | | | | | | |
| Fund | | Dividends
Received Deduction | | Qualified
Dividend Income |
The Arbitrage Fund | | | | 0.00 | % | | | | 0.00 | % |
The Arbitrage Event-Driven Fund | | | | 38.75 | % | | | | 49.83 | % |
The Arbitrage Credit Opportunities Fund | | | | 0.00 | % | | | | 0.00 | % |
In early 2014, if applicable, shareholders of record received this information for the distributions paid to them by the Funds during the calendar year 2013 via form 1099. The funds will notify shareholders in early 2015 of amounts paid to them by the Funds, if any, during the calendar year 2014.
| | |
| Annual Report | May 31, 2014 | | 137 |
| | |
| The Arbitrage Funds | | Trustees’ Approval of Advisory Agreement |
May 31, 2014 (Unaudited)
As required under the Investment Company Act of 1940 (the “1940 Act”), the Board of Trustees (the “Board”) of The Arbitrage Funds (the “Trust”), which is comprised of The Arbitrage Fund, The Arbitrage Event-Driven Fund and The Arbitrage Credit Opportunities Fund (each, a “Fund” and, collectively, the “Funds”), determines annually whether to continue each Fund’s investment advisory agreement with Water Island Capital, LLC, the investment adviser to each Fund (the “Adviser”). In considering the renewal of the agreements, the Board, including all of those Trustees who are not “interested persons” of the Funds, as defined in the 1940 Act, met on May 20, 2014 and approved the continuation of the agreements, after concluding that the continuation of the agreements was in the best interests of each Fund and its shareholders.
The Board requested and received materials relating to the agreements In advance of the meeting. Among other things, the Board considered comparative fee information from the Adviser. Also, the Board considered expense and performance comparisons with other mutual funds in the Funds’ peer groups as determined by Morningstar Associates, LLC (“Morningstar”), an independent source of mutual fund analysis, as further discussed below.
In approving the agreements, the Board, including the Independent Trustees advised by independent legal counsel, considered the factors it deemed relevant, including the nature, quality and extent of services provided, the performance of each Fund, the profitability of the Adviser, expenses and fees, and the potential for economies of scale that may be shared with each Fund and its shareholders as each Fund’s assets grow. In their deliberations, the Trustees did not identify any single factor which alone was responsible for the Board’s decision to approve the agreement with respect to each Fund. In connection with its deliberations, the Board considered information provided by the Adviser throughout the year at regular Board meetings, presentations from portfolio managers and other information, as well as information furnished at or in advance of the meeting held on May 20, 2014.
Nature, Extent and Quality of the Services under the Advisory Agreements
The Board received and considered information regarding the nature, extent and quality of services provided to each Fund by the Adviser under the advisory agreement for the Fund. The Board also noted information received at regular meetings throughout the year related to the services rendered by the Adviser. The Board reviewed background information about the Adviser, including its Form ADV. The Board considered the background and experience of the Adviser’s senior management and the qualifications, backgrounds and responsibilities of the portfolio managers primarily responsible for the day-to-day portfolio management of the Funds and the extent of the resources devoted to research and analysis of actual and potential investments. The Board also received and considered information about the nature, extent and quality of services and fee rates offered to other clients of the Adviser for comparable services. The Board concluded that it was satisfied with the nature, extent and quality of the investment management services provided to each Fund by the Adviser and that, based on dialogue with management and counsel, the services provided by the Adviser under the advisory agreement for each Fund are typical of, and consistent with, those provided to similar mutual funds by other investment advisers.
Adviser Profitability
The Board was provided with information on the Adviser’s profitability in serving as the investment adviser to each Fund. The Board recognized that it is difficult to make comparisons of profitability from fund management contracts because comparative information is not generally publicly available and is affected by numerous factors, including the structure of the particular
| | |
| 138 | | www.arbitragefunds.com | 1-800-295-4485 |
| | |
| The Arbitrage Funds | | Trustees’ Approval of Advisory Agreement (continued) |
May 31, 2014 (Unaudited)
adviser, the types of funds it manages, its business mix, numerous assumptions regarding allocations and the adviser’s capital structure and cost of capital. Taking these factors into account, the Board concluded that the Adviser’s profitability in relation to the services rendered was reasonable.
Economies of Scale
The Board considered information regarding whether there have been economies of scale with respect to the management of each Fund, whether the Fund has appropriately benefited from any economies of scale, and whether there is potential for realization of any further economies of scale. With respect to The Arbitrage Fund, the Board noted that the management fee schedule for the Fund includes breakpoints, which have the effect of decreasing the fee rate as assets increase, and that at its current level of assets the Fund’s effective fee rate reflected those rate reductions. The Board took note that the Fund’s fee structure currently results in benefits to Fund shareholders whether or not the Adviser realizes any economies of scale. The Board noted that the advisory fee schedules for The Arbitrage Event-Driven Fund and The Arbitrage Credit Opportunities Fund do not contain breakpoints that would reduce the fee rate on assets above specified levels. The Board recognized the inherent limitations of any analysis of economies of scale, stemming largely from the Board’s understanding that most of the Adviser’s costs are not specific to individual funds.
Other Benefits to the Adviser
The Board considered other benefits received by the Adviser as a result of its relationship with the Funds. The Board concluded that the potential benefits to be derived by the Adviser included the ability to use soft dollar credits as well as the potential benefits consistent with those generally resulting from an increase in assets under management, specifically, potential access to additional research resources and benefits to its reputation. The Board concluded that the benefits derived by the Adviser were consistent with the types of benefits generally derived by investment advisers to mutual funds. The Board considered the standards applied in seeking best execution and reviewed the Adviser’s method for allocating portfolio investment opportunities among its advisory clients.
Other Factors and Broader Review
As discussed above, the Board reviews detailed materials received from the Adviser as part of the annual review. The Board also reviews and assesses the quality of the services that the Funds receive throughout the year. In this regard, the Board reviews reports of the Adviser at least quarterly, which include, among other things, detailed portfolio and market reviews, detailed Fund performance reports and compliance reports.
Investment Advisory Fee Rates and Expenses and Performance
The Board reviewed and considered the contractual advisory fee rates for each Fund in light of the extent and quality of the advisory services provided by the Adviser. The Board also reviewed and considered the contractual fee waivers and expense reimbursements currently in place for each Fund.
The Board also received and considered information comparing the effective advisory fee rates and gross and net total expenses for each Fund with those of a group of funds within the Fund’s Morningstar category determined independently by Morningstar (the “Peer Group”) as well as to the funds in the same Morningstar category (the “Category Group”). The comparisons placed each Fund in various quartiles, with the first quartile being the lowest cost mutual funds.
| | |
| Annual Report | May 31, 2014 | | 139 |
| | |
| The Arbitrage Funds | | Trustees’ Approval of Advisory Agreement (continued) |
May 31, 2014 (Unaudited)
The performance of each Fund for the periods ended March 31, 2014 was compared to the Peer Group as well as to the funds in the Category Group. The comparisons placed each Fund in various quartiles, with the first quartile being the best performing mutual funds.
The Arbitrage Fund
The Fund’s performance was compared to a Peer Group composed of a small group of funds within Morningstar’s Market Neutral and Long/Short categories that run a purely merger arbitrage strategy as well as to the Market Neutral Category Group. The Fund’s total return for the one-, three-, five- and ten-year periods ranked in the lowest quartile of the Peer Group, although it was noted that for all but the one-year period, the Peer Group included only one other fund. The Fund’s total return in the Category Group ranked in the fourth quartile for the one- and three-year periods and in the third quartile for the five- and ten-year periods. The Fund also underperformed its benchmark, the S&P 500 Index, for all periods. It was noted that the Fund’s underperformance compared to the Category Group was a result of its more concentrated style but that the Fund’s style also produced standard deviation (a measure of volatility) that was the lowest in both the Peer Group and Category Group for the one-year period and in the first quartile (meaning lowest volatility) of the Category Group for the three-, five- and ten-year periods.
The Fund’s effective advisory fee was in the second quartile of its Category Group. The Fund’s net and gross expenses were in the first quartile in the Category Group. It was noted that the Adviser had entered into an expense waiver and reimbursement agreement to limit fees through August 31, 2016.
The Board determined that it would be in the best interests of the Fund and its shareholders to continue the advisory agreement. The Fund’s fee structure was considered reasonable.
The Arbitrage Event-Driven Fund
The Fund’s performance was compared to a Peer Group composed of a small group of funds within Morningstar’s Market Neutral and Long/Short categories that do not pursue multi-alternative strategies and/or focus primarily on convertible arbitrage, as well as to the Market Neutral Category Group. The Fund’s total return for the one- and three-year periods was in the third quartile of the Peer Group and Category Group. It was noted that the Fund had underperformed the HFRI Event Driven Index, for the one- and three-year periods. It was also noted that the Fund’s standard deviation (a measure of volatility) ranked in the first quartile for both the Peer Group and the Category Group for the one-year period and in the first quartile for the Peer Group and the second quartile for the Category Group for the three-year period.
The Fund’s effective advisory fee was the third quartile of its Category Group. The Fund’s net and gross expenses were in the second quartile in the Category Group. It was noted that the Adviser had entered into an expense waiver and reimbursement agreement to limit fees through August 31, 2016.
The Board determined that it would be in the best interests of the Fund and its shareholders to continue the advisory agreement. In light of the Fund’s current size and fee rate, the Board concluded that the fee structure was reasonable and that the absence of breakpoints in the Fund’s fee schedule was acceptable at this time.
| | |
| 140 | | www.arbitragefunds.com | 1-800-295-4485 |
| | |
| The Arbitrage Funds | | Trustees’ Approval of Advisory Agreement (continued) |
May 31, 2014 (Unaudited)
The Arbitrage Credit Opportunities Fund
The Fund’s performance was compared to a Peer Group composed of a small group of funds within Morningstar’s Non-Traditional Bond category that primarily focus on credit opportunities to generate returns, implement an absolute return or strategic income strategy and have lower duration, as well as to the Non-Traditional Bond Category Group. The Fund’s total return for the one-year period was in the first quartile of both the Peer Group and the Category Group. The Fund also outperformed the Barclays U.S. Aggregate Bond Index, for the one-year period. It was noted that the Fund’s standard deviation (a measure of volatility) ranked in the first quartile (meaning lowest volatility) of the Peer Group and the Category Group.
The Fund’s effective advisory fee was in the fourth quartile of the Category Group. The Fund’s net and gross expenses were in the fourth quartile of the Category Group. It was noted that the median asset size of the funds in the Peer Group was much larger than that of the Fund and that many of those funds appear to benefit from economies of scale. It was further noted that the Adviser had entered into an expense waiver and reimbursement agreement to limit fund fees and expenses through August 31, 2016.
The Board determined that it would be in the best interests of the Fund and its shareholders to continue the advisory agreement. In light of the Fund’s current size and fee rate, the Board concluded that the fee structure was reasonable and that the absence of breakpoints in the Fund’s fee schedule was acceptable at this time.
| | |
| Annual Report | May 31, 2014 | | 141 |
| | |
| The Arbitrage Funds | | Trustees & Officers |
May 31, 2014 (Unaudited)
The business of the Trust is managed under the direction of the Board in accordance with the Declaration of Trust of the Trust, which Declaration of Trust has been filed with the SEC and is available upon request. In May 2012, the Board voted to increase the number of Trustees from five to six, and elected Robert Herrmann to fill the vacancy created by increasing the number of Trustees. The Board also voted to appoint Burton Lehman as an adviser to the Board. As an adviser, Mr. Lehman attends meetings of the Board and acts as a non-voting participant. The Board voted to appoint Mr. Lehman as an adviser to the Board with the expectation that, in the future, it will call a meeting of shareholders to elect Trustees and Mr. Lehman will be one of the nominees.
The Trustees serve for an indefinite term and the officers are elected annually. It is the policy of the Board that each Trustee, at the conclusion of the first meeting at which the Trustee has attained age 75, shall retire from the Board; provided, however, with respect to Messrs. Burtt Ehrlich, Jay Goldberg, and Burton Lehman (if elected a Trustee), the mandatory retirement age is 77.
Pursuant to the Declaration of Trust, the Trustees elect the officers of the Trust to supervise its day-to-day operations. The Board retains the power to conduct, operate and carry on the business of the Trust and has the power to incur and pay any expenses which, in the opinion of the Board, are necessary or incidental to carry out any of the Trust’s purposes.
The Trustees, officers and employees of the Trust, when acting in such capacities, shall not be subject to any personal liability except for his or her own bad faith, willful misfeasance, gross negligence or reckless disregard of his or her duties. Following is a list of the Trustees and executive officers of the Trust.
INTERESTED TRUSTEE:
| | | | | | | | | | |
|
Name, Address and Age | | Length of Time Served | | Position with Trust | | Principal Occupation During the Past Five Years | | Other
Directorships
During the Past
Five Years | | Number of
Portfolios in
the Fund
Complex
Overseen by
Trustee |
|
John S. Orrico, CFA* 41 Madison Avenue, 42nd Floor, New York, NY 10010 (Age 53) | | Since May 2000 | | President, and Trustee | | Managing Member, Water Island Capital, LLC, the Investment Adviser, since January 2000. | | None | | 3 |
|
| * | John S. Orrico, as an affiliated person of the Adviser and as an officer of the Trust, is an “interested person” of the Trust within the meaning of Section 2(a)(19) of the 1940 Act. |
| | |
| 142 | | www.arbitragefunds.com | 1-800-295-4485 |
| | |
| The Arbitrage Funds | | Trustees & Officers (continued) |
May 31, 2014 (Unaudited)
INDEPENDENT TRUSTEES AND ADVISER TO THE BOARD:
| | | | | | | | | | |
|
Name, Address and Age | | Length of Time Served | | Position with Trust | | Principal Occupation During the Past Five Years | | Other Directorships
During the Past Five Years | | Number of
Portfolios in the Fund Complex
Overseen by
Trustee |
|
Burtt R. Ehrlich 41 Madison Avenue, 42nd Floor, New York, NY 10010 (Age 75) | | Since March 2005 | | Trustee | | Retired. | | Member of the Board of Directors of Clarus Corporation (marketing firm) and P.C. Group FWC until 2010. | | 3 |
|
Jay N. Goldberg Hudson Venture Partners 535 Fifth Avenue 14th Floor New York, NY 10017 (Age 71) | | Since May 2000 | | Trustee | | General Partner of Hudson Ventures (venture capital firm). | | None | | 3 |
|
John C. Alvarado The Seaport Group 1200 Smith Street Suite 1600 Houston, TX 77002 (Age 55) | | Since December 2003 | | Trustee | | Managing Director of Energy Related Corporate Finance for The Seaport Group, a credit focused investment bank. Prior to joining The Seaport Group, Mr. Alvarado was Founder and Managing Member of PowerCapital Partners, LLC, an energy related financial consulting firm (2000 - 2010). | | None | | 3 |
|
Robert P. Herrmann 41 Madison Avenue, 42nd Floor, New York, NY 10010 (Age 52) | | Since May 2012 | | Trustee | | Chairman & CEO of Discovery Data, a leading financial services industry data provider (2009 - present). Previously, CEO and director of Loring Ward International, Ltd. and President of SA Funds- Investment Trust (2005 - 2009). | | None | | 3 |
|
| | |
| Annual Report | May 31, 2014 | | 143 |
| | |
| The Arbitrage Funds | | Trustees & Officers (continued) |
May 31, 2014 (Unaudited)
| | | | | | | | | | |
Name, Address and Age | | Length of Time Served | | Position with Trust | | Principal Occupation During the Past Five Years | | Other Directorships During the Past Five Years | | Number of Portfolios in the Fund Complex Overseen by Trustee |
|
Burton Lehman 919 Third Avenue, New York, NY 10022 (Age 73) | | Since May 2012 | | Adviser to the Board | | Of Counsel for Schulte, Roth & Zabel LLP (2006 - present). Previously, Senior Advisor and General Counsel of Tishman Speyer Properties (2003 - 2006) and Partner at Schulte Roth & Zabel (1969 - 2003). | | None | | 3 |
|
EXECUTIVE OFFICERS:
| | | | | | | | | | |
|
Name, Address and Age | | Length of Time Served | | Position with Trust | | Principal Occupation During the Past Five Years | | Other Directorships During the Past Five Years | | Number of Portfolios in the Fund Complex Overseen by Trustee |
|
Jennifer Avicolli 41 Madison Avenue, 42nd Floor, New York, NY 10010 (Age 41) | | Since November 2013 | | Secretary, Anti-Money Laundering Officer, Chief Compliance Officer | | UBP Asset Management as CCO (2004 - 2008), Cadogan Management (2011 - 2012), Associate General Counsel & Director of Compliance; Water Island Capital (2012 - present) General Counsel and Chief Compliance Officer. | | N/A | | N/A |
|
William Keena 41 Madison Avenue, 42nd Floor, New York, NY 10010 (Age 63) | | Since November 2013 | | Assistant Treasurer, Assistant Secretary | | Consultant (2009 - 2010), Chief Administrative Officer Water Island Capital (2010 - present). | | N/A | | N/A |
|
Jonathon Hickey 41 Madison Avenue, 42nd Floor, New York, NY 10010 (Age 33) | | Since November 2013 | | Treasurer | | Fund Accounting Manager (SEI 2004 - 2011). | | N/A | | N/A |
|
| | |
| 144 | | www.arbitragefunds.com | 1-800-295-4485 |
| | |
| The Arbitrage Funds | | Trustees & Officers (continued) |
May 31, 2014 (Unaudited)
| | | | | | | | | | |
Name, Address and Age | | Length of Time Served | | Position
with Trust | | Principal Occupation During the Past Five Years | | Other Directorships During the Past Five Years | | Number of Portfolios in the Fund Complex Overseen by Trustee |
|
Kim Storms ALPS Fund Services, Inc. 1290 Broadway Suite 1100 Denver, CO 80203 (Age 42) | | Since August 2011 | | Chief Financial Officer | | Director of Fund Administration (2004 - present), Senior Vice President (2009 - present) and Vice President (2005-2009), ALPS Fund Services, Inc.; Treasurer of ALPS ETF Trust (2008 - 2012); Treasurer of Liberty All-Star Equity Fund, Liberty All-Star Growth Fund, Inc., Financial Investors Trust, ALPS Series Trust and BPV Family of Funds. | | N/A | | N/A |
|
| * | ALPS Fund Services, Inc. is the Administrator, Bookkeeping and Pricing Agent for the Funds, and is an affiliated person of ALPS Distributors, Inc., the distributor of the Funds. | |
Additional information about members of the Board of Trustees and Officers is available in the Statement of Additional Information (SAI). To obtain a free copy of the SAI, please call 1-800-295-4485.
| | |
| Annual Report | May 31, 2014 | | 145 |
Page Intentionally Left Blank
Page Intentionally Left Blank
| | | | |
 | | | | The Arbitrage Fund |
| | | | The Arbitrage Event-Driven Fund |
| | | | The Arbitrage Credit Opportunities Fund |
| | | | 800-295-4485 |
| | | | www.arbitragefunds.com |
| Adviser | | | | Water Island Capital, LLC |
| | | | 41 Madison Avenue, 42nd Floor |
| | | | New York, NY 10010 |
| Distributor | | | | ALPS Distributors, Inc. |
| | | | 1290 Broadway, Suite 1100 |
| | | | Denver, CO 80203 |
| Transfer Agent | | | | DST Systems, Inc. |
| | | | P.O. Box 219842 |
| | | | Kansas City, MO 64121-9842 |
| Custodian | | | | State Street Bank & Trust |
| | | | 225 Liberty Street |
| | | | New York, NY 10281 |

This material must be preceded or accompanied by a prospectus. Please read it carefully before investing.
Item 2. Code of Ethics.
| | (a) | The Registrant, as of the end of the period covered by the report, has adopted a code of ethics that applies to the Registrant’s principal executive officer, principal financial officer, principal accounting officer or controller or any persons performing similar functions on behalf of the Registrant. |
| | (c) | During the period covered by this report, no amendments were made to the provisions of the code of ethics adopted in 2(a) above. |
| | (d) | During the period covered by this report, no implicit or explicit waivers to the provisions of the code of ethics adopted in 2(a) above were granted. |
| | (f) | The Registrant’s Code of Ethics is attached as an Exhibit hereto. |
Item 3. Audit Committee Financial Expert.
| | (a)(1) | The Registrant’s board of trustees has determined that the Registrant has at least one audit committee financial expert serving on the audit committee. |
| | (a)(2) | The audit committee financial expert is John C. Alvarado, who is independent as defined in Form N-CSR Item 3(a)(2). |
Item 4. Principal Accountant Fees and Services.
| | (a) | Audit Fees: For the Registrant’s fiscal years ended May 31, 2014 and May 31, 2013, the aggregate fees billed for professional services rendered by the principal accountant for the audit of the Registrant’s annual financial statements were $75,700 and $69,700, respectively. |
| | (b) | Audit-Related Fees: For the Registrant’s fiscal years ended May 31, 2014 and May 31, 2013, the aggregate fees billed for professional services rendered by the principal accountant for consent procedures related to the update to the Registrant’s Prospectus and Statement of Additional Information were $0 and $5,000, respectively. |
| | (c) | Tax Fees: For the Registrant’s fiscal years ended May 31, 2014 and May 31, 2013, aggregate fees of $11,300, and $10,700, respectively, were billed for professional services rendered by the principal accountant for tax compliance, tax advice, and tax planning. |
| | (d) | All Other Fees: For the Registrant’s fiscal years ended May 31, 2014 and May 31, 2013, no fees were billed to Registrant by the principal accountant for services other than the services reported in paragraphs (a) through (c) of this item. |
| | (e)(1) | Audit Committee Pre-Approval Policies and Procedures: All services to be performed by the Registrant’s principal auditors must be pre-approved by the Registrant’s audit committee. |
| | (e)(2) | No services described in paragraphs (b) through (d) were approved pursuant to paragraph (c)(7)(i)(C) of Rule 2-01 of Regulation S-X. |
| | (g) | The aggregate non-audit fees billed by the Registrant’s principle accountant for the fiscal years ended May 31, 2014 and May 31, 2013 were $0 and $0, respectively. |
Item 5. Audit Committee of Listed Registrants.
Not applicable.
Item 6. Schedule of Investments.
The Schedule of Investments is included as part of the Report to Stockholders filed under Item 1 of this form.
Item 7. Disclosure of Proxy Voting Policies and Procedures for Closed-End Management Investment Companies.
Not applicable
Item 8. Portfolio Managers of Closed-End Management Investment Companies.
Not applicable.
Item 9. Purchases of Equity Securities by Closed-End Management Investment Company and Affiliated Purchasers.
Not applicable.
Item 10. Submission of Matters to Vote of Security Holders.
There have been no material changes to the procedures by which shareholders may recommend nominees to the registrant’s Board of Trustees.
Item 11. Controls and Procedures.
| | (a) | The registrant’s principal executive officer and principal financial officer have evaluated the registrant’s disclosure controls and procedures (as defined in Rule 30a-3(c) under the Investment Company Act of 1940, as amended) within 90 days of this filing and have concluded that the registrant’s disclosure controls and procedures were effective, as of that date. |
| | (b) | There was no change in the registrant’s internal control over financial reporting (as defined in Rule 30a-3(d) under the Investment Company Act of 1940, as amended) during the second fiscal quarter of the period covered by this report that has materially affected, or is reasonably likely to materially affect, the registrant’s internal control over financial reporting. |
Item 12. Exhibits.
| | (a)(1) | The code of ethics that applies to the registrant’s principal executive officer and principal financial officer is attached hereto as EX-12.A.1. |
| | (a)(2) | A separate certification for the principal executive officer and the principal financial officer of the registrant as required by Rule 30a-2(a) under the Investment Company Act of 1940, as amended (17 CFR 270.30a-2(a)), are filed herewith. |
| | (b) | The certifications by the registrant’s Principal Executive Officer and Principal Financial Officer, as required by Rule 30a-2(b) of the Investment Company Act of 1940, as amended, and Section 906 of the Sarbanes-Oxley Act of 2002 are attached hereto as Ex99.906Cert. |
SIGNATURES
Pursuant to the requirements of the Securities Exchange Act of 1934 and the Investment Company Act of 1940, the registrant has duly caused this report to be signed on its behalf by the undersigned, thereunto duly authorized.
THE ARBITRAGE FUNDS
| | | | |
| By: | | /s/ John S. Orrico | | |
| | John S. Orrico | | |
| | President and Treasurer | | |
| | |
| Date: | | August 7, 2014 | | |
Pursuant to the requirements of the Securities Exchange Act of 1934 and the Investment Company Act of 1940, this report has been signed below by the following persons on behalf of the registrant and in the capacities and on the dates indicated.
| | | | |
| By: | | /s/ John S. Orrico | | |
| | John S. Orrico | | |
| | President and Treasurer | | |
| | |
| Date: | | August 7, 2014 | | |
| | | | |
| By: | | /s/ Kim Storms | | |
| | Kim Storms | | |
| | Chief Financial Officer | | |
| | |
| Date: | | August 7, 2014 | | |