UNITED STATES
SECURITIES AND EXCHANGE COMMISSION
Washington, D.C. 20549
FORM N-CSR
CERTIFIED SHAREHOLDER REPORT OF REGISTERED
MANAGEMENT INVESTMENT COMPANIES
Investment Company Act file number: 811-09815
THE ARBITRAGE FUNDS
(exact name of registrant as specified in charter)
41 Madison Avenue, 42nd Floor, New York, NY 10010
(Address of principal executive offices) (Zip code)
John S. Orrico
Water Island Capital, LLC
41 Madison Avenue
42nd Floor
New York, NY 10010
(Name and address of agent for service)
Registrant’s telephone number, including area code: 212-259-2655
Date of fiscal year end: May 31
Date of reporting period: June 1, 2012 – May 31, 2013
| Item 1. | Reports to Stockholders. |
| | |
 | | TABLE OF CONTENTS |
| | |
| | |
The Arbitrage Funds | | Shareholder Letter |
| |
| | May 31, 2013 |
Dear Fellow Shareholders,
For the fiscal year ending May 31, 2013, The Arbitrage Fund returned 0.42% (Class R, ARBFX), The Arbitrage Event-Driven Fund returned 2.72% (Class R, AEDFX), and The Arbitrage Credit Opportunities Fund – newly launched on October 1, 2012 – returned 2.33% since inception (Class R, ARCFX). The HFRI Event Driven: Merger Arbitrage Index returned 3.64% and the HFRI Event Driven Index returned 13.78% for the twelve month period, and the Barclays Capital U.S. Aggregate Bond Index returned - 0.77% since 10/1/12. (See pages 5, 23, and 44 for standard performance).
The Arbitrage Fund
Low interest rates continued to keep merger arbitrage spreads in check for a third year in a row. This, in concert with a lackluster deal environment and volatility derived from a handful of terminated or delayed transactions, constrained The Arbitrage Fund’s performance. That said, the Fund’s volatility (as measured by annualized three-year standard deviation) reached an all-time low of 2.59% as of May 31, 2013. Moreover, the Fund’s correlations to the broader fixed income and equity markets (as measured by the Barclays Capital U.S. Aggregate Bond Index and the S&P 500 Index) are near all time lows as well, at 0.15 and 0.04, respectively. While equity markets have reached record highs as of late, the dislocation experienced shortly after fiscal year-end illustrates the value of maintaining an allocation to low volatility, low correlation, alternative strategies in one’s portfolio.
Investors have been looking for the mergers and acquisitions environment to improve for almost three years now, anticipating that the combination of low interest rates, cash-rich balance sheets, and rising stock prices would underpin an uptick in deal flow. But one ingredient (and an important one) had not yet made its way into the mix: confidence. Confidence on the part of corporate executives and board members to pull the trigger on mergers and acquisitions has been notably absent over this time frame. Given the uncertainties around the direction of interest rates, global macroeconomic conditions, and ever-changing fiscal and regulatory policy making, it’s no wonder that executives have hit the pause button ahead of moving forward on acquisition activity. Corporate acquirers have been playing it safe, focusing on smaller transactions that are less dependent on broader macroeconomic conditions to successfully integrate. In addition, staying independent often remains a stronger option for target companies in this ultra-low interest rate environment, where high investor demand for corporate debt opens the door for even the least creditworthy borrowers.
According to Dealogic, 510 deals with values totaling $377.3B were announced during the first five months of 2013: $195.2B in the Americas, $113.2B in Europe/Middle East/Africa (EMEA), and $68.9B in Asia-Pacific (APAC). While EMEA and APAC saw declines compared to the year-ago period (down 17% from $136.8B and down 15% from $81.1B, respectively), activity in the Americas region grew over 35% from the $144.5B announced in the first five months of 2012. This led to an overall increase in worldwide deal flow of 4% for the period.
Given these signs, have we turned a corner? We think yes, but we remain in the early stages of a move to more robust deal flow. Investors are beginning to witness the early signs of stabilization in Europe, and although most Asia-Pacific economies have shown signs of slowing, the continued modest growth in North America appears to be picking up the slack. Competitive bidding in the telecom space in the U.S. (Sprint, Clearwire, PCS), in the cable space in Europe (Virgin Media, Kabel Deutschland), and some acceleration of consolidation in the biotech/healthcare sector (Warner Chilcott PLC, Life Technologies, Onyx Pharm, etc.) bode well for our prediction.
| | |
| | | |
Annual Report | May 31, 2013 | | 1 |
| | |
The Arbitrage Funds | | Shareholder Letter (continued) |
| |
| | May 31, 2013 |
The Arbitrage Event-Driven Fund
The Arbitrage Event-Driven Fund, which combines optimized sleeves of our merger arbitrage and credit opportunities strategies with a third equity special situations strategy, returned 0.62% during the volatile final month of the fiscal year. The merger arbitrage and credit opportunities sleeves of this Fund take a more concentrated approach compared to their pure-play counterparts in The Arbitrage Fund and The Arbitrage Credit Opportunities Fund. For the Fund’s third sleeve, we focus on an expanded universe of corporate events in the equity markets – not strictly limited to mergers and acquisitions. In the current market environment, our equity special situations team sees corporations under pressure to maximize shareholder value, leading to activist scenarios, split-offs, and tax-efficient restructurings like Real Estate Investment Trust conversions, and in the near term we expect such events to be primary areas of opportunity.
The Arbitrage Credit Opportunities Fund
Short-term interest rates have historically been one of the building blocks of merger arbitrage returns, and while a return to more “normalized” interest rates may contribute positively to merger arbitrage spreads – and we saw how quickly such a reversion could occur at the tail end of the fiscal year – the associated disruption to the overall credit markets could be significant. Point of fact: as the yield on the 10-year U.S. Treasury increased from 1.67% on April 30, 2013 to 2.16% at fiscal year-end on May 31, the Barclays U.S. Aggregate Bond Index declined -1.78%, the Bank of America Merrill Lynch Corporate Master Index returned -2.28%, and the Bank of America Merrill Lynch High Yield Master II Index was down -0.53%.
For that same month of May, the newest member of The Arbitrage Funds Series Trust – The Arbitrage Credit Opportunities Fund (Class R) – returned 0.59%. In addition, the Fund, which launched on October 1, 2012, has returned 2.33% since inception, while the Barclays Capital U.S. Aggregate Bond Index has returned -0.77% for the same period. The recent dislocation in the credit markets has not changed our investment theses. We simply have different entry points due to the market correction. We have added groups of names mainly in the merger-related space and post reorganization refinancing space. In particular, the increase in merger deals over the last two months has increased our universe of merger-related credit opportunities, and we have added these positions at more attractive prices. These trades range from three to six months in duration, and we believe they will hold up well in a volatile market. For our positions that are longer in duration or with softer catalysts, we have increased our market hedges to help mitigate further downward moves in those specific names.
Outlook
We believe global equity and credit markets will remain volatile as the Federal Reserve transitions its policies to accommodate any changes in economic growth. Any stability in the U.S. Treasury market (particularly the 10-Year), would be influential in, and a sign of, lessening fear among global investors. More volatile markets typically provide us with attractive entry points in many of the deals and events we track around the globe. Rising interest rates, when they do materialize, should serve to buttress merger arbitrage returns, and if accompanied by strengthening macroeconomic conditions, will likely mean a more robust deal environment as well. Market action towards the end of the fiscal year gave us the opportunity to demonstrate how the drivers of returns in merger arbitrage are so uniquely distinct and counter to the behavior of other asset
| | |
| | | |
2 | | www.arbitragefunds.com | 1-800-295-4485 |
| | |
The Arbitrage Funds | | Shareholder Letter (continued) |
| |
| | May 31, 2013 |
classes. For our credit strategies, we remain focused on positions that we believe will hold up well in a volatile market. Our equity special situations team will focus on maintaining hedging strategies to mitigate market beta exposure. While these hedges may reduce potential gains in bull markets, they also serve to reduce volatility in down markets and adhere to the strategy’s fundamental market neutral core. We will continue to avoid those transactions for which our risk-taking is not well compensated, and remain focused on solid, strategic transactions underpinned by strong strategic rationales.
Sincerely,
The Investment Team
Water Island Capital
| | |
| | | |
Annual Report | May 31, 2013 | | 3 |
| | |
| The Arbitrage Fund | | Manager Commentary |
| |
| | May 31, 2013 (Unaudited) |
|
The Arbitrage Fund | NASDAQ Ticker Symbols | ARBNX, ARBFX, ARBCX, ARGAX The Fund’s Goal and Main Investments Merger arbitrage is a sub-set of a broader event-driven strategy, which seeks to profit from investing in securities that are involved in corporate events such as mergers and acquisitions. Typically merger arbitrage is a low volatility strategy pursued by absolute-return-minded investors. At Water Island Capital, our goal is to capture a return stream with a low correlation to the overall markets. |
Investment Strategy
The Fund seeks to achieve capital growth by engaging in merger arbitrage. The strategy’s focus is to capture returns from corporate events, generate market neutral capital growth, preservation of capital, consistent and positive returns, and achieve low correlation, and low volatility. The Fund’s general investment approach can be best described as risk averse, and many systems, policies, and procedures are in place to facilitate this low-risk approach. The Fund generally engages in active and frequent trading of portfolio securities to achieve its principal investment objective. In attempting to achieve its investment strategy, the Fund plans to invest at least 80% of its net assets in equity securities of companies (both U.S. and foreign) that are involved in publicly announced mergers, takeovers, tender offers, leveraged buyouts, spin-offs, liquidations, and other corporate reorganizations. The Fund’s investment advisor uses investment strategies designed to minimize market exposure, including short selling along with purchasing and selling options. The most common merger arbitrage activity, and the approach generally used by the Fund, involves purchasing the shares of an announced acquisition target company at a discount to their expected value upon the acquisition’s completion. That difference, or “spread,” is the primary driver of returns for this strategy. There is no limit to the number of stocks the Fund can hold, however, the Fund typically invests in 40-80 deals at any given time. Each deal will have one, or perhaps two, equity positions (a long and short position in a stock-for-stock deal) and, in many cases, associated derivative positions for hedging purposes.
| | |
| | | |
4 | | www.arbitragefunds.com | 1-800-295-4485 |
| | |
The Arbitrage Fund | | Portfolio Information |
| |
| | May 31, 2013 (Unaudited) |
Performance (annualized returns as of May 31, 2013)
| | | | | | | | |
| | | One
Year | | Five
Year | | Ten
Year | | Since
Inception* |
Arbitrage Fund, Class R | | 0.42% | | 2.40% | | 3.61% | | 4.85% |
Arbitrage Fund, Class I | | 0.67% | | 2.61% | | – | | 3.42% |
Arbitrage Fund, Class C** | | -1.24% | | – | | – | | -1.24% |
HFRI Event Driven: Merger Arbitrage Index | | 3.64% | | 3.16% | | 5.17% | | 4.80% |
S&P 500® Index | | 27.27% | | 5.43% | | 7.58% | | 2.92% |
Barclays Capital U.S. Aggregate Bond Index | | 0.91% | | 5.50% | | 4.66% | | 5.85% |
Current performance may be higher or lower than performance quoted above. Any performance data quoted represents past performance and the investment return and principal value of an investment in the Fund will fluctuate so that an investor’s shares, when redeemed, may be worth more or less than their original cost. Past performance is no guarantee of future results. Returns do not reflect a 2% redemption fee for shares that are redeemed from the fund within 30 days of purchase, which, if reflected, would reduce the performance quoted. Returns shown above include the reinvestment of all dividends and capital gains. Contractual fee waivers are currently in effect. Without such fee waivers, performance numbers would be reduced. You can obtain performance data current to the most recent month end by calling 1-800-295-4485 or going to www.arbitragefunds.com.
* Class R inception: 9/17/00; Class I inception: 10/17/03; Class C inception: 6/1/12.
** Class C shares are also subject to a 1.00% contingent deferred sales charge on all purchases redeemed in 12 months of purchase.
The Total Annual Fund Operating Expenses for Class R, Class I and Class C are 2.25%, 2.00% and 3.00%, respectively.
The HFRI Event Driven: Merger Arbitrage Index is an index consisting of merger arbitrage strategies which employ an investment process primarily focused on opportunities in equity and equity related instruments of companies which are currently engaged in a corporate transaction. Merger Arbitrage involves primarily announced transactions, typically with limited or no exposure to situations which pre-, post-date or situations in which no formal announcement is expected to occur. Opportunities are frequently presented in cross border, collared and international transactions which incorporate multiple geographic regulatory institutions, with typically involve minimal exposure to corporate credits.
The S&P 500® Index is an unmanaged index consisting of 500 stocks.
The Barclays Capital U.S. Aggregate Bond Index is a market value-weighted index of investment grade fixed-rated debt issues, including government, corporate, asset-backed and mortgage-backed securities with a maturity of one year or more.
An investor may not invest directly in an index.
| | |
| | | |
Annual Report | May 31, 2013 | | 5 |
| | |
The Arbitrage Fund | | Portfolio Information (continued) |
| |
| | May 31, 2013 (Unaudited)
|
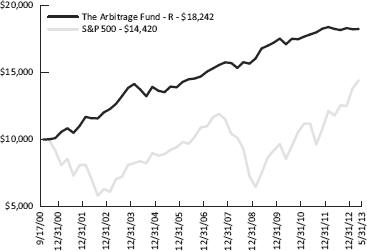
Growth of $10,000 Investment
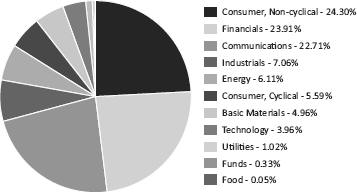
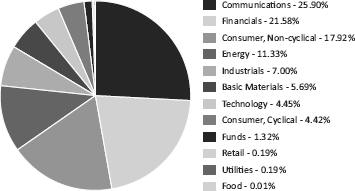
Sector Weighting
The following chart shows the sector weightings of the Arbitrage Fund’s investments in common stock and exchange-traded funds as of the report date.
| | |
| | | |
6 | | www.arbitragefunds.com | 1-800-295-4485 |
| | |
| The Arbitrage Fund | | Portfolio of Investments |
| |
| | May 31, 2013 |
| | | | | | | | |
| | | Shares | | | Value | |
| |
COMMON STOCKS - 97.08% | | | | | | | | |
Aerospace & Defense - 0.03% | | | | | | | | |
Allied Defense Group, Inc.(a)(b)(e) | | | 398,319 | | | $ | 796,638 | |
| | | | | | | | |
| | |
Agriculture - 2.19% | | | | | | | | |
GrainCorp Ltd., Class A | | | 5,185,361 | | | | 63,025,500 | |
| | | | | | | | |
| | |
Apparel - 1.29% | | | | | | | | |
True Religion Apparel, Inc.(c) | | | 1,163,461 | | | | 37,044,598 | |
| | | | | | | | |
| | |
Auto Parts & Equipment - 0.14% | | | | | | | | |
Nidec-Tosok Corp. | | | 476,900 | | | | 4,025,795 | |
| | | | | | | | |
| | |
Banks - 0.41% | | | | | | | | |
Sterling Bancorp | | | 977,267 | | | | 11,678,341 | |
| | | | | | | | |
| | |
Beverages - 5.32% | | | | | | | | |
DE Master Blenders 1753 N.V.(a) | | | 7,720,179 | | | | 121,465,033 | |
Grupo Modelo SAB de CV, Series C | | | 3,464,958 | | | | 31,281,087 | |
| | | | | | | | |
| | | | | | | 152,746,120 | |
| | | | | | | | |
| | |
Biotechnology - 4.43% | | | | | | | | |
Life Technologies Corp.(a)(c) | | | 1,717,369 | | | | 127,257,043 | |
| | | | | | | | |
| | |
Chemicals - 0.13% | | | | | | | | |
Ferro Corp.(a)(c) | | | 532,184 | | | | 3,650,782 | |
| | | | | | | | |
| | |
Coal - 0.18% | | | | | | | | |
Whitehaven Coal Ltd. | | | 2,324,408 | | | | 5,072,018 | |
| | | | | | | | |
| | |
Commercial Services - 3.19% | | | | | | | | |
Lender Processing Services, Inc. | | | 1,512,557 | | | | 50,050,511 | |
Stewart Enterprises, Inc., Class A | | | 3,207,395 | | | | 41,696,135 | |
| | | | | | | | |
| | | | | | | 91,746,646 | |
| | | | | | | | |
| | |
Computers - 0.46% | | | | | | | | |
Stonesoft OYJ(a) | | | 2,294,522 | | | | 13,301,058 | |
| | | | | | | | |
| | |
Diversified Financial Services - 9.52% | | | | | | | | |
Asset Acceptance Capital Corp.(a) | | | 1,307,277 | | | | 8,876,411 | |
National Financial Partners Corp.(a) | | | 1,535,920 | | | | 38,720,543 | |
Netspend Holdings, Inc.(a)(d) | | | 4,103,170 | | | | 65,691,752 | |
NYSE Euronext(d) | | | 3,980,752 | | | | 160,145,653 | |
| | | | | | | | |
| | | | | | | 273,434,359 | |
| | | | | | | | |
| | |
See Notes to Financial Statements. | | |
| |
Annual Report | May 31, 2013 | | 7 |
| | |
| The Arbitrage Fund | | Portfolio of Investments (continued) |
| |
| | May 31, 2013 |
| | | | | | | | |
| | | Shares | | | Value | |
| |
COMMON STOCKS - 97.08% (Continued) | | | | | | | | |
Electric - 1.05% | | | | | | | | |
NV Energy, Inc. | | | 1,286,364 | | | $ | 30,152,372 | |
| | | | | | | | |
| | |
Electrical Components & Equipment - 1.82% | | | | | | | | |
Power-One, Inc.(a) | | | 8,275,799 | | | | 52,385,808 | |
| | | | | | | | |
| | |
Engineering & Construction - 0.65% | | | | | | | | |
Gemina SpA(a) | | | 9,835,216 | | | | 18,586,919 | |
| | | | | | | | |
| | |
Food - 5.79% | | | | | | | | |
Copeinca ASA | | | 1,409,751 | | | | 13,932,601 | |
H.J. Heinz Co.(c)(d) | | | 1,929,120 | | | | 139,591,123 | |
Smithfield Foods, Inc.(a) | | | 390,503 | | | | 12,863,169 | |
| | | | | | | | |
| | | | | | | 166,386,893 | |
| | | | | | | | |
| | |
Forest Products & Paper - 2.21% | | | | | | | | |
Buckeye Technologies, Inc. | | | 1,705,848 | | | | 63,576,955 | |
| | | | | | | | |
| | |
Healthcare - Products - 2.92% | | | | | | | | |
Conceptus, Inc.(a) | | | 2,247,192 | | | | 69,618,008 | |
Palomar Medical Technologies, Inc.(a) | | | 1,058,001 | | | | 14,314,754 | |
| | | | | | | | |
| | | | | | | 83,932,762 | |
| | | | | | | | |
| | |
Household Products & Wares - 0.37% | | | | | | | | |
American Greetings Corp., Class A | | | 572,861 | | | | 10,540,642 | |
| | | | | | | | |
| | |
Insurance - 1.80% | | | | | | | | |
Great-West Lifeco, Inc.(a) | | | 1,848,620 | | | | 51,727,481 | |
| | | | | | | | |
| | |
Internet - 1.74% | | | | | | | | |
Acquity Group Ltd., Sponsored ADR(a) | | | 354,604 | | | | 4,556,661 | |
Softchoice Corp. | | | 1,255,942 | | | | 24,167,874 | |
Websense, Inc.(a)(c) | | | 857,894 | | | | 21,318,666 | |
| | | | | | | | |
| | | | | | | 50,043,201 | |
| | | | | | | | |
| | |
Iron & Steel - 0.28% | | | | | | | | |
Sundance Resources Ltd.(a) | | | 89,795,434 | | | | 7,992,282 | |
| | | | | | | | |
| | |
Machinery - Diversified - 4.34% | | | | | | | | |
Gardner Denver, Inc.(d) | | | 1,653,325 | | | | 124,826,037 | |
| | | | | | | | |
| | |
Media - 4.62% | | | | | | | | |
Astral Media, Inc., Class A | | | 2,417,304 | | | | 113,316,590 | |
Fisher Communications, Inc. | | | 223,636 | | | | 9,193,676 | |
| | |
See Notes to Financial Statements. | | |
| |
8 | | www.arbitragefunds.com | 1-800-295-4485 |
| | |
The Arbitrage Fund | | Portfolio of Investments (continued) |
| |
| | May 31, 2013 |
| | | | | | | | |
| | | Shares | | | Value | |
| |
COMMON STOCKS - 97.08% (Continued) | | | | | | | | |
Media - 4.62% (Continued) | | | | | | | | |
Liberty Global, Inc., Class A(a)(c) | | | 138,712 | | | $ | 10,223,074 | |
| | | | | | | | |
| | | | | | | 132,733,340 | |
| | | | | | | | |
| | |
Metal Fabricate & Hardware - 0.27% | | | | | | | | |
Hoganas AB, Class B | | | 161,397 | | | | 7,870,825 | |
| | | | | | | | |
| | |
Mining - 3.53% | | | | | | | | |
Aurizon Mines Ltd.(a) | | | 10,506,222 | | | | 45,382,218 | |
Flinders Mines Ltd.(a) | | | 46,335,055 | | | | 1,906,829 | |
Freeport-McMoRan Copper & Gold, Inc. | | | 1,497,223 | | | | 46,488,788 | |
Rainy River Resources Ltd.(a) | | | 2,046,985 | | | | 7,186,907 | |
Yancoal Australia Ltd.(a) | | | 25,903 | | | | 17,353 | |
Yancoal Australia Ltd., CVR(a) | | | 166,860 | | | | 431,171 | |
| | | | | | | | |
| | | | | | | 101,413,266 | |
| | | | | | | | |
| | |
Oil & Gas - 1.53% | | | | | | | | |
McMoRan Exploration Co.(a)(d) | | | 2,648,628 | | | | 44,046,684 | |
| | | | | | | | |
| | |
Oil & Gas Services - 4.58% | | | | | | | | |
Lufkin Industries, Inc.(c) | | | 1,491,116 | | | | 131,605,898 | |
| | | | | | | | |
| | |
Real Estate Investment Trusts - 1.09% | | | | | | | | |
CapLease, Inc. | | | 2,499,567 | | | | 21,546,268 | |
MPG Office Trust, Inc.(a) | | | 3,085,640 | | | | 9,658,053 | |
| | | | | | | | |
| | | | | | | 31,204,321 | |
| | | | | | | | |
| | |
Retail - 3.50% | | | | | | | | |
Hot Topic, Inc.(c) | | | 3,275,176 | | | | 45,819,712 | |
OfficeMax, Inc.(c) | | | 3,250,286 | | | | 42,351,227 | |
rue21, Inc.(a) | | | 295,399 | | | | 12,403,804 | |
| | | | | | | | |
| | | | | | | 100,574,743 | |
| | | | | | | | |
| | |
Savings & Loans - 4.11% | | | | | | | | |
Hudson City Bancorp, Inc.(d) | | | 13,890,099 | | | | 118,065,842 | |
| | | | | | | | |
| | |
Semiconductors - 6.98% | | | | | | | | |
ASML Holding N.V., New York Registered Shares | | | 2,467,630 | | | | 200,544,280 | |
| | | | | | | | |
| | |
Software - 3.61% | | | | | | | | |
BMC Software, Inc.(a)(c) | | | 1,932,981 | | | | 87,554,374 | |
| | |
See Notes to Financial Statements. | | |
| |
Annual Report | May 31, 2013 | | 9 |
| | |
The Arbitrage Fund | | Portfolio of Investments (continued) |
| |
| | May 31, 2013 |
| | | | | | | | | | | | | | |
| | | | | | | | Shares | | | Value | |
| |
COMMON STOCKS - 97.08% (Continued) | | | | | | | | | | | | | | |
Software - 3.61% (Continued) | | | | | | | | | | | | | | |
Market Leader, Inc.(a) | | | | | | | | | 1,509,044 | | | $ | 16,146,771 | |
| | | | | | | | | | | | | | |
| | | | | | | | | | | | | 103,701,145 | |
| | | | | | | | | | | | | | |
| | | | |
Telecommunications - 13.00% | | | | | | | | | | | | | | |
Clearwire Corp., Class A(a)(c) | | | | | | | | | 8,786,698 | | | | 39,364,407 | |
Sprint Nextel Corp.(a)(c) | | | | | | | | | 14,368,540 | | | | 104,890,342 | |
Virgin Media, Inc.(d) | | | | | | | | | 4,613,361 | | | | 229,099,507 | |
| | | | | | | | | | | | | | |
| | | | | | | | | | | | | 373,354,256 | |
| | | | | | | | | | | | | | |
| | | | |
TOTAL COMMON STOCKS (Cost $2,774,491,115) | | | | | | | | | | | | | 2,789,044,850 | |
| | | | | | | | | | | | | | |
| | | | |
RIGHTS - 0.00% | | | | | | | | | | | | | | |
Cubist Pharmaceuticals, Inc.(a)(b)(e) | | | | | | | | | 119,343 | | | | 0 | |
Emergent Biosolutions, Inc.(a)(b)(e) | | | | | | | | | 595,405 | | | | 0 | |
| | | | | | | | | | | | | | |
| | | | |
TOTAL RIGHTS (Cost $173,313) | | | | | | | | | | | | | 0 | |
| | | | | | | | | | | | | | |
| | | | |
| | | Expiration Date | | Exercise Price | | | Contracts | | | Value | |
| |
PURCHASED OPTIONS(a) - 0.14% | | | | | | | | | | | | | | |
Call Options Purchased - 0.02% | | | | | | | | | | | | | | |
Sprint Nextel Corp. | | 08/2013 | | | $7.00 | | | | 12,124 | | | $ | 691,068 | |
| | | | | | | | | | | | | | |
| | | | |
TOTAL CALL OPTIONS PURCHASED (Cost $580,572) | | | | | | | | | | | | | 691,068 | |
| | | | | | | | | | | | | | |
| | | | |
Put Options Purchased - 0.12% | | | | | | | | | | | | | | |
Liberty Global, Inc., Class A: | | | | | | | | | | | | | | |
| | 07/2013 | | | 80.00 | | | | 3,169 | | | | 2,249,990 | |
| | 07/2013 | | | 85.00 | | | | 786 | | | | 903,900 | |
| | |
See Notes to Financial Statements. | | |
| |
10 | | www.arbitragefunds.com | 1-800-295-4485 |
| | |
The Arbitrage Fund | | Portfolio of Investments (continued) |
| |
| | May 31, 2013 |
| | | | | | | | | | | | | | | | |
| | | Expiration Date | | | Exercise Price | | | Contracts | | | Value | |
| |
PURCHASED OPTIONS (a)- 0.14% (Continued) | | | | | | | | | | | | | | | | |
Put Options Purchased - 0.12% (Continued) | | | | | | | | | | | | | | | | |
Sprint Nextel Corp. | | | 08/2013 | | | | $7.00 | | | | 4,061 | | | $ | 160,410 | |
| | | | | | | | | | | | | | | | |
| | | | |
TOTAL PUT OPTIONS PURCHASED (Cost $6,163,524) | | | | | | | | | | | | | | | 3,314,300 | |
| | | | | | | | | | | | | | | | |
| | | | |
TOTAL PURCHASED OPTIONS (Cost $6,744,096) | | | | | | | | | | | | | | | 4,005,368 | |
| | | | | | | | | | | | | | | | |
| | | | |
| | | | | | Yield | | | Shares | | | Value | |
| |
SHORT-TERM INVESTMENTS - 6.58% | | | | | | | | | | | | | | | | |
Money Market Fund | | | | | | | | | | | | | | | | |
State Street Institutional Liquid Reserves Fund(f) | | | | | | | 0.093% | | | | 124,059,643 | | | $ | 124,059,643 | |
| | | | | | | | | | | | | | | | |
| | | | |
Time Deposits | | | | | | | | | | | | | | | | |
Euro Time Deposit | | | | | | | 0.010% | | | | 64,885,408 | | | | 64,885,408 | |
| | | | | | | | | | | | | | | | |
| | | | |
TOTAL SHORT-TERM INVESTMENTS (Cost $188,945,051) | | | | | | | | | | | | | | | 188,945,051 | |
| | | | | | | | | | | | | | | | |
| | | | |
Total Investments - 103.80% (Cost $2,970,353,575) | | | | | | | | | | | | | | | 2,981,995,269 | |
| | | | |
Liabilities in Excess of Other Assets - (3.80%) | | | | | | | | | | | | | | | (109,063,174) | |
| | | | | | | | | | | | | | | | |
| | | | |
NET ASSETS - 100.00% | | | | | | | | | | | | | | $ | 2,872,932,095 | |
| | | | | | | | | | | | | | | | |
| (a) | Non-income-producing security. |
| (b) | Security fair valued using methods determined in good faith by the Pricing Committee. As of May 31, 2013, the total market value of these securities was $796,638, representing 0.03% of net assets. |
| (c) | Underlying security for a written/purchased call/put option. |
| (d) | Security, or a portion of security, is being held as collateral for short sales, or written option contracts. At period end, the aggregate market value of those securities was $485,770,000, representing 16.91% of net assets. |
| (e) | Security considered illiquid. On May 31, 2013, the total market value of these securities was $796,638, representing 0.03% of net assets. |
| (f) | Rate shown is the 7-day effective yield as of May 31, 2013. |
| | |
See Notes to Financial Statements. | | |
| |
Annual Report | May 31, 2013 | | 11 |
| | |
The Arbitrage Fund | | Portfolio of Investments (continued) |
| |
| | May 31, 2013 |
Securities determined to be illiquid under the procedures approved by the Funds’ Board of Trustees. Information related to the illiquid securities is as follows:
| | | | | | | | | | | | | | |
Date(s) of Purchase | | Security | | Cost | | | Market Value | | | % of Net
Assets | |
| |
05/20/2010 – 12/28/2010 | | Allied Defense Group, Inc. | | $ | 1,553,995 | | | $ | 796,638 | | | | 0.03% | |
12/12/2011 | | Cubist Pharmaceuticals, Inc. | | | 0 | | | | 0 | | | | 0.00 | |
08/13/2010 – 09/02/2010 | | Emergent Biosolutions, Inc. | | | 173,313 | | | | 0 | | | | 0.00 | |
| | | | | | | | | | |
| | | | | | | | $ | 796,638 | | | | 0.03% | |
| | | | | | | | | | |
| | | | | | | | |
SCHEDULE OF SECURITIES SOLD SHORT | | | Shares | | | | Value | |
| |
COMMON STOCKS | | | | | | | | |
Banks | | | | | | | | |
M&T Bank Corp. | | | (1,167,129) | | | | $ (122,431,832) | |
| | | | | | | | |
| | |
Commercial Services | | | | | | | | |
Atlantia SpA | | | (1,092,696) | | | | (18,690,217) | |
| | | | | | | | |
| | |
Diversified Financial Services | | | | | | | | |
Encore Capital Group, Inc. | | | (70,615) | | | | (2,518,837) | |
IntercontinentalExchange, Inc. | | | (677,934) | | | | (116,069,080) | |
| | | | | | | | |
| | | | | | | (118,587,917) | |
| | | | | | | | |
| | |
Electrical Components & Equipment | | | | | | | | |
Nidec Corp. | | | (58,900) | | | | (4,057,419) | |
| | | | | | | | |
| | |
Healthcare - Products | | | | | | | | |
Cynosure, Inc., Class A | | | (203,358) | | | | (5,065,648) | |
| | | | | | | | |
| | |
Insurance | | | | | | | | |
Fidelity National Financial, Inc. | | | (788,318) | | | | (20,740,647) | |
Great-West Lifeco, Inc. | | | (1,848,523) | | | | (51,671,277) | |
| | | | | | | | |
| | | | | | | (72,411,924) | |
| | | | | | | | |
| | |
Internet | | | | | | | | |
Trulia, Inc. | | | (169,009) | | | | (5,195,336) | |
| | | | | | | | |
| | |
Media | | | | | | | | |
Liberty Global, Inc., Class A | | | (1,160,451) | | | | (85,525,238) | |
Liberty Global, Inc., Series C | | | (663,520) | | | | (45,577,189) | |
| | | | | | | | |
| | | | | | | (131,102,427) | |
| | | | | | | | |
| | |
See Notes to Financial Statements. | | |
| |
12 | | www.arbitragefunds.com | 1-800-295-4485 |
| | |
The Arbitrage Fund | | Portfolio of Investments (continued) |
| |
| | May 31, 2013 |
| | | | | | | | |
| SCHEDULE OF SECURITIES SOLD SHORT | | Shares | | | Value | |
| |
COMMON STOCKS (Continued) | | | | | | | | |
Mining | | | | | | | | |
Freeport-McMoRan Copper & Gold, Inc. | | | (1,449,446) | | | $ | (45,005,298) | |
Hecla Mining Co. | | | (3,084,644) | | | | (11,814,187) | |
New Gold, Inc. | | | (511,747) | | | | (3,479,929) | |
| | | | | | | | |
| | | | | | | (60,299,414) | |
| | | | | | | | |
| | |
Oil & Gas | | | | | | | | |
McMoRan Exploration Co. | | | (27,779) | | | | (45,413) | |
| | | | | | | | |
| | |
Retail | | | | | | | | |
Office Depot, Inc. | | | (5,351,100) | | | | (23,598,351) | |
OfficeMax, Inc. | | | (1,700) | | | | (22,151) | |
| | | | | | | | |
| | | | | | | (23,620,502) | |
| | | | | | | | |
| | |
Savings & Loans | | | | | | | | |
Provident New York Bancorp | | | (1,234,795) | | | | (11,360,114) | |
| | | | | | | | |
| | |
Semiconductors | | | | | | | | |
ASML Holding N.V., New York Registered Shares | | | (2,467,236) | | | | (200,512,270) | |
| | | | | | | | |
| | |
Telecommunications | | | | | | | | |
BCE, Inc. | | | (2,200) | | | | (98,865) | |
Clearwire Corp., Class A | | | (46,800) | | | | (209,664) | |
| | | | | | | | |
| | | | | | | (308,529) | |
| | | | | | | | |
| | |
TOTAL COMMON STOCKS (Proceeds $725,813,495) | | | | | | | (773,688,962) | |
| | | | | | | | |
| | |
EXCHANGE-TRADED FUNDS | | | | | | | | |
Equity Fund | | | | | | | | |
SPDR® S&P 500® ETF Trust | | | (59,541) | | | | (9,719,473) | |
| | | | | | | | |
| | |
TOTAL EXCHANGE-TRADED FUNDS (Proceeds $9,502,177) | | | | | | | (9,719,473) | |
| | | | | | | | |
| | |
TOTAL SECURITIES SOLD SHORT (Proceeds $735,315,672) | | | | | | | (783,408,435) | |
| | | | | | | | |
| | | | | | | | |
| | |
See Notes to Financial Statements. | | |
| |
Annual Report | May 31, 2013 | | 13 |
| | |
The Arbitrage Fund | | Portfolio of Investments (continued) |
| |
| | May 31, 2013 |
| | | | | | | | | | | | | | |
SCHEDULE OF WRITTEN OPTIONS | | Expiration Date | | Exercise Price | | | Contracts | | | Value | |
| |
Written Call Options | | | | | | | | | | | | | | |
BMC Software, Inc.: | | | | | | | | | | | | | | |
| | 06/2013 | | $ | 46.00 | | | | (223) | | | $ | (1,673) | |
| | 08/2013 | | | 46.00 | | | | (858) | | | | (15,015) | |
| | 08/2013 | | | 47.00 | | | | (430) | | | | (2,150) | |
Clearwire Corp., Class A: | | | | | | | | | | | | | | |
| | 06/2013 | | | 3.00 | | | | (9,767) | | | | (1,440,632) | |
| | 06/2013 | | | 3.50 | | | | (9,487) | | | | (924,982) | |
| | 06/2013 | | | 4.00 | | | | (455) | | | | (26,163) | |
| | 07/2013 | | | 3.50 | | | | (8,039) | | | | (783,803) | |
DISH Network Corp.: | | | | | | | | | | | | | | |
| | 06/2013 | | | 41.00 | | | | (1,688) | | | | (88,620) | |
| | 06/2013 | | | 42.00 | | | | (1,684) | | | | (58,940) | |
Ferro Corp. | | 06/2013 | | | 7.50 | | | | (22) | | | | (110) | |
Fidelity National Financial, Inc. | | 07/2013 | | | 25.00 | | | | (1,821) | | | | (286,808) | |
H.J. Heinz Co.: | | | | | | | | | | | | | | |
| | 06/2013 | | | 75.00 | | | | (3,862) | | | | (9,655) | |
| | 09/2013 | | | 75.00 | | | | (9,146) | | | | (22,865) | |
Hot Topic, Inc. | | 08/2013 | | | 14.00 | | | | (869) | | | | (2,172) | |
Life Technologies Corp.: | | | | | | | | | | | | | | |
| | 06/2013 | | | 75.00 | | | | (980) | | | | (12,250) | |
| | 07/2013 | | | 75.00 | | | | (274) | | | | (6,165) | |
| | 08/2013 | | | 75.00 | | | | (228) | | | | (6,840) | |
Lufkin Industries, Inc. | | 06/2013 | | | 90.00 | | | | (1,230) | | | | (3,075) | |
Office Depot, Inc.: | | | | | | | | | | | | | | |
| | 06/2013 | | | 3.50 | | | | (246) | | | | (22,755) | |
| | 06/2013 | | | 4.00 | | | | (6,354) | | | | (285,930) | |
| | 06/2013 | | | 4.50 | | | | (258) | | | | (2,580) | |
| | 07/2013 | | | 4.00 | | | | (256) | | | | (13,440) | |
| | 07/2013 | | | 4.50 | | | | (51) | | | | (1,147) | |
OfficeMax, Inc.: | | | | | | | | | | | | | | |
| | 06/2013 | | | 11.00 | | | | (4,439) | | | | (887,800) | |
| | 06/2013 | | | 12.00 | | | | (6,903) | | | | (742,072) | |
| | 06/2013 | | | 13.00 | | | | (965) | | | | (36,188) | |
Sprint Nextel Corp.: | | | | | | | | | | | | | | |
| | 06/2013 | | | 7.50 | | | | (2,262) | | | | (16,965) | |
| | 08/2013 | | | 8.00 | | | | (19,839) | | | | (337,263) | |
True Religion Apparel, Inc. | | 07/2013 | | | 32.00 | | | | (303) | | | | (3,788) | |
Trulia, Inc. | | 06/2013 | | | 30.00 | | | | (436) | | | | (88,290) | |
Websense, Inc. | | 06/2013 | | | 25.00 | | | | (998) | | | | (12,475) | |
| | | | | | | | | | | | | | |
| | | | |
TOTAL WRITTEN CALL OPTIONS | | | | | | | | | | | | | | |
(Premiums received $2,466,604) | | | | | | | | | | | | | (6,142,611) | |
| | | | | | | | | | | | | | |
| | |
See Notes to Financial Statements. | | |
| |
14 | | www.arbitragefunds.com | 1-800-295-4485 |
| | |
The Arbitrage Fund | | Portfolio of Investments (continued) |
| |
| | May 31, 2013 |
| | | | | | | | | | | | | | |
SCHEDULE OF WRITTEN OPTIONS | | Expiration Date | | Exercise Price | | | Contracts | | | Value | |
| |
| | | | |
Written Put Options | | | | | | | | | | | | | | |
H.J. Heinz Co.: | | | | | | | | | | | | | | |
| | 06/2013 | | $ | 70.00 | | | | (2,088) | | | $ | (15,660) | |
| | 06/2013 | | | 75.00 | | | | (241) | | | | (61,455) | |
Lufkin Industries, Inc. | | 06/2013 | | | 85.00 | | | | (164) | | | | (820) | |
| | | | | | | | | | | | | | |
| | | | |
TOTAL WRITTEN PUT OPTIONS | | | | | | | | | | | | | | |
(Premiums received $140,837) | | | | | | | | | | | | | (77,935) | |
| | | | | | | | | | | | | | |
| | | | |
TOTAL WRITTEN OPTIONS | | | | | | | | | | | | | | |
(Premiums received $2,607,441) | | | | | | | | | | | | | $ (6,220,546) | |
| | | | | | | | | | | | | | |
| | |
See Notes to Financial Statements. | | |
| |
Annual Report | May 31, 2013 | | 15 |
| | |
The Arbitrage Fund | | Portfolio of Investments (continued) |
| |
| | May 31, 2013 |
EQUITY SWAP CONTRACTS
| | | | | | | | | | | | | | |
Swap Counterparty | | Reference Obligation | | Rate Paid/Received by the Fund | | Termination
Dates | | Notional
Amount | | | Unrealized
Appreciation | |
| |
Goldman, Sachs & Co. | | Gardner Denver, Inc. | | 1 Month-LIBOR-BBA plus 0.50 bps | | 05/05/2014 | | $ | 21,791,739 | | | $ | 103,261 | |
Goldman, Sachs & Co. | | MAY Gurney Integrated Services Plc | | 1 Month-LIBOR-BBA plus 0.45 bps | | 05/14/2014 | | | 1,096,944 | | | | 28,535 | |
Goldman, Sachs & Co. | | Mikuni Coca-Cola Bottling Co. Ltd. | | LIBOR-BBA plus 0.50 bps | | 05/09/2014 -
06/05/2014 | | | 4,692,342 | | | | 189,680 | |
Goldman, Sachs & Co. | | Yancoal Australia Ltd. | | 1 Month-BBSW-REUTERS plus 0.50 bps | | 05/31/2014 | | | 3,877 | | | | 23 | |
Goldman, Sachs & Co. | | Yancoal Australia Rights Ltd. | | 1 Month-BBSW-REUTERS plus 0.50 bps | | 05/07/2014 | | | 8,300,050 | | | | 350,007 | |
Goldman, Sachs & Co. | | Yanzhou Coal
Mining Co. | | 1 Month-HIBOR-REUTERS minus 1.0 bps | | 05/30/2014 | | | (522,101) | | | | 27,306 | |
UBS | | Mikuni Coca-Cola Bottling Co. Ltd. | | 1 Month-LIBOR-BBA plus 0.40 bps | | Monthly Reset | | | 8,461,458 | | | | 555,588 | |
UBS | | Yancoal Australia Rights Ltd. | | 1 Month-BBSW-REUTERS plus 0.55 bps | | Monthly Reset | | | 16,473,946 | | | | 828,949 | |
UBS | | Yanzhou Coal
Mining Co. | | 1 Month-HIBOR-REUTERS plus 0.4 bps | | Monthly Reset | | | (20,105) | | | | 1,055 | |
| | | | | | | | | | |
| | | | | | | | $ | 60,278,150 | | | $ | 2,084,404 | |
| | | | | | | | | | |
| | | | | |
Swap Counterparty | | Reference Obligation | | Rate Paid/Received by the Fund | | Termination
Dates | | Notional
Amount | | | Unrealized
Depreciation | |
| |
Goldman, Sachs & Co. | | Coca-Cola Central Japan Co. Ltd. | | LIBOR-BBA minus 2.00 bps - 2.136 bps | | 05/09/2014 -
06/05/2014 | | $ | (7,076,958) | | | $ | (190,613) | |
Goldman, Sachs & Co. | | H.J. Heinz Co. | | 1 Month-LIBOR-BBA plus 0.50 bps | | 05/05/2014 | | | 98,825,193 | | | | (102,998) | |
Goldman, Sachs & Co. | | Kier Group Plc | | 1 Month-LIBOR-BBA minus 3.0 bps - 3.025 bps | | 05/14/2014 | | | (917,385) | | | | (31,232) | |
UBS | | Coca-Cola Central Japan Co. Ltd. | | 1 Month-LIBOR-BBA minus 0.40 bps | | Monthly Reset | | | (6,244,006) | | | | (280,748) | |
UBS | | Flinders Mines Ltd | | 1 Month-BBSW-REUTERS plus 0.55 bps | | Monthly Reset | | | 3,063,136 | | | | (319,077) | |
UBS | | H.J. Heinz Co. | | 1 Month-LIBOR-BBA plus 0.70 bps | | Monthly Reset | | | 7,178,003 | | | | (9,876) | |
UBS | | Yancoal Australia Ltd. | | 1 Month-BBSW-REUTERS plus 0.55 bps | | Monthly Reset | | | 4,581,583 | | | | (59,590) | |
| | | | | | | | | | |
| | | | | | | | $ | 99,409,566 | | | $ | (994,134) | |
| | | | | | | | | | |
| | |
See Notes to Financial Statements. | | |
| |
16 | | www.arbitragefunds.com | 1-800-295-4485 |
| | |
The Arbitrage Fund | | Portfolio of Investments (continued) |
| |
| | May 31, 2013 |
OUTSTANDING FORWARD FOREIGN CURRENCY EXCHANGE CONTRACTS
| | | | | | | | | | | | | | | | |
Contract Description | | Contracts to
Deliver/Receive | | | Purchase/ Sale Contract | | Expiration Date | | Current Value | | | Unrealized
Appreciation | |
| |
AUD | | | 86,495,613 | | | Sale | | 6/17/2013 | | | 82,675,508 | | | $ | 3,360,427 | |
CAD | | | 176,796,316 | | | Sale | | 6/17/2013 | | | 170,461,348 | | | | 3,984,778 | |
EUR | | | 230,000 | | | Sale | | 6/17/2013 | | | 298,971 | | | | 1,148 | |
JPY | | | 40,730,000 | | | Purchase | | 6/17/2013 | | | 405,483 | | | | 5,684 | |
NOK | | | 61,240,000 | | | Sale | | 6/17/2013 | | | 10,428,382 | | | | 78,034 | |
| | | | | | | | | | | | | | | | |
| | | | | | | | | | | | | | $ | 7,430,071 | |
| | | | | | | | | | | | | | | | |
| | | | | |
Contract Description | | Contracts to
Deliver/Receive | | | Purchase/ Sale Contract | | Expiration Date | | Current Value | | | Unrealized
Depreciation | |
| |
AUD | | | 4,660,000 | | | Purchase | | 6/17/2013 | | | 4,454,190 | | | $ | (97,703) | |
CAD | | | 1,590,000 | | | Purchase | | 6/17/2013 | | | 1,533,027 | | | | (9,927) | |
EUR | | | 103,068,197 | | | Sale | | 6/17/2013 | | | 133,975,495 | | | | (502,400) | |
JPY | | | 48,610,000 | | | Sale | | 6/17/2013 | | | 483,932 | | | | (5,817) | |
NOK | | | 1,780,000 | | | Purchase | | 6/17/2013 | | | 303,111 | | | | (1,675) | |
NOK | | | 22,280,000 | | | Sale | | 6/17/2013 | | | 3,793,997 | | | | (14,472) | |
SEK | | | 51,970,000 | | | Sale | | 6/17/2013 | | | 7,843,255 | | | | (57,528) | |
| | | | | | | | | | | | | | | | |
| | | | | | | | | | | | | | $ | (689,522) | |
| | | | | | | | | | | | | | | | |
| | |
See Notes to Financial Statements. | | |
| |
Annual Report | May 31, 2013 | | 17 |
| | |
The Arbitrage Fund | | Portfolio of Investments (continued) |
| |
| | May 31, 2013 |
| | | | |
| Country | | % of Net Assets | |
| |
Netherlands | | | 11.21% | |
Canada | | | 8.42% | |
Australia | | | 2.73% | |
Mexico | | | 1.09% | |
Italy | | | 0.65% | |
Spain | | | 0.56% | |
Norway | | | 0.49% | |
Finland | | | 0.46% | |
Sweden | | | 0.27% | |
Hong Kong | | | 0.16% | |
Japan | | | 0.14% | |
United States | | | 77.62% | |
Liabilities in Excess of Other Assets | | | (3.80%) | |
| | | | |
| | | 100.00% | |
| | | | |
| | | | |
Abbreviations:
AB - Arktiebolag is the Swedish term for a limited company
ADR - American Depositary Receipt
ASA - Allmennaksjeselskap is the Norwegian term for a public limited company
AUD - Australian Dollar
BBA - British Bankers Association
BBSW - Australian Bank Bill Swap Reference Rate
bps - Basis Points
CAD - Canadian Dollar
CVR - Contingent Value Rights
ETF - Exchange Traded Fund
EUR - Euro
HIBOR - Hong Kong Interbank Offer Rate
JPY - Japanese Yen
LIBOR - London Interbank Offered Rate
Ltd. - Limited
NOK - Norwegian Krone
N.V. - Naamloze Vennootschap is the Dutch term for a public limited liability corporation
OYJ - Osakeyhtio is the Finnish equivalent of a public limited company
Plc - Public Limited Liability
| SA - | Generally designates corporations in various countries, mostly those employing civil law. This translates literally in all languages mentioned as anonymous company |
SAB de CV - A variable capital company
SEK - Swedish Krona
S&P - Standard & Poor’s
SpA - Societa per Azione
SPDR - Standard & Poor’s Depositary Receipt
| | |
See Notes to Financial Statements. | | |
| |
18 | | www.arbitragefunds.com | 1-800-295-4485 |
| | |
The Arbitrage Fund | | |
| |
| | May 31, 2013 |
The following is a summary of the inputs used as of May 31, 2013, in valuing the Arbitrage Fund’s investments carried at value:
Investments in Securities at Value
| | | | | | | | | | | | | | | | |
| | | Level 1 | | | Level 2 | | | Level 3 | | | Total | |
Assets | | | | | | | | | | | | | | | | |
Common Stocks | | | | | | | | | | | | | | | | |
Aerospace & Defense | | $ | – | | | $ | – | | | $ | 796,638 | | | $ | 796,638 | |
Agriculture | | | 63,025,500 | | | | – | | | | – | | | | 63,025,500 | |
Apparel | | | 37,044,598 | | | | – | | | | – | | | | 37,044,598 | |
Auto Parts & Equipment | | | 4,025,795 | | | | – | | | | – | | | | 4,025,795 | |
Banks | | | 11,678,341 | | | | – | | | | – | | | | 11,678,341 | |
Beverages | | | 152,746,120 | | | | – | | | | – | | | | 152,746,120 | |
Biotechnology | | | 127,257,043 | | | | – | | | | – | | | | 127,257,043 | |
Chemicals | | | 3,650,782 | | | | – | | | | – | | | | 3,650,782 | |
Coal | | | 5,072,018 | | | | – | | | | – | | | | 5,072,018 | |
Commercial Services | | | 91,746,646 | | | | – | | | | – | | | | 91,746,646 | |
Computers | | | 13,301,058 | | | | – | | | | – | | | | 13,301,058 | |
Diversified Financial Services | | | 273,434,359 | | | | – | | | | – | | | | 273,434,359 | |
Electric | | | 30,152,372 | | | | – | | | | – | | | | 30,152,372 | |
Electrical Components & Equipment | | | 52,385,808 | | | | – | | | | – | | | | 52,385,808 | |
Engineering & Construction | | | 18,586,919 | | | | – | | | | – | | | | 18,586,919 | |
Food | | | 166,386,893 | | | | – | | | | – | | | | 166,386,893 | |
Forest Products & Paper | | | 63,576,955 | | | | – | | | | – | | | | 63,576,955 | |
Healthcare - Products | | | 83,932,762 | | | | – | | | | – | | | | 83,932,762 | |
Household Products & Wares | | | 10,540,642 | | | | – | | | | – | | | | 10,540,642 | |
Insurance | | | 51,727,481 | | | | – | | | | – | | | | 51,727,481 | |
Internet | | | 50,043,201 | | | | – | | | | – | | | | 50,043,201 | |
Iron & Steel | | | 7,992,282 | | | | – | | | | – | | | | 7,992,282 | |
Machinery - Diversified | | | 124,826,037 | | | | – | | | | – | | | | 124,826,037 | |
Media | | | 132,733,340 | | | | – | | | | – | | | | 132,733,340 | |
Metal Fabricate & Hardware | | | 7,870,825 | | | | – | | | | – | | | | 7,870,825 | |
Mining | | | 56,031,048 | | | | 45,382,218 | | | | – | | | | 101,413,266 | |
Oil & Gas | | | 44,046,684 | | | | – | | | | – | | | | 44,046,684 | |
Oil & Gas Services | | | 131,605,898 | | | | – | | | | – | | | | 131,605,898 | |
Real Estate Investment Trusts | | | 31,204,321 | | | | – | | | | – | | | | 31,204,321 | |
Retail | | | 100,574,743 | | | | – | | | | – | | | | 100,574,743 | |
Savings & Loans | | | 118,065,842 | | | | – | | | | – | | | | 118,065,842 | |
Semiconductors | | | 200,544,280 | | | | – | | | | – | | | | 200,544,280 | |
Software | | | 103,701,145 | | | | – | | | | – | | | | 103,701,145 | |
| | |
See Notes to Financial Statements. | | |
| |
Annual Report | May 31, 2013 | | 19 |
| | |
The Arbitrage Fund | | |
| |
| | May 31, 2013 |
Investments in Securities at Value (Continued)
| | | | | | | | | | | | | | | | |
| | | | Level 1 | | | | Level 2 | | | | Level 3 | | | | Total | |
Telecommunications | | $ | 373,354,256 | | | $ | – | | | $ | – | | | $ | 373,354,256 | |
Rights | | | – | | | | – | | | | 0 | | | | 0 | |
Purchased Options | | | 4,005,368 | | | | – | | | | – | | | | 4,005,368 | |
Short-Term Investments | | | 188,945,051 | | | | – | | | | – | | | | 188,945,051 | |
TOTAL | | $ | 2,935,816,413 | | | $ | 45,382,218 | | | $ | 796,638 | | | $ | 2,981,995,269 | |
| | | | | | | | | | | | | | | | | |
| | | | | | | | | | | | | | | | |
Other Financial Instruments* | | | | | | | | | | | | | | | | |
Assets | | | | | | | | | | | | | | | | |
Forward Foreign | | | | | | | | | | | | | | | | |
Currency Exchange | | | | | | | | | | | | | | | | |
Contracts | | $ | – | | | $ | 7,430,071 | | | | – | | | $ | 7,430,071 | |
Equity Swaps | | | 2,084,404 | | | | – | | | | – | | | | 2,084,404 | |
Liabilities | | | | | | | | | | | | | | | | |
Common Stocks** | | | (773,643,549) | | | | (45,413) | | | | – | | | | (773,688,962) | |
Exchange-Traded Funds | | | (9,719,473) | | | | – | | | | – | | | | (9,719,473) | |
Written Options | | | (6,220,546) | | | | – | | | | – | | | | (6,220,546) | |
Forward Foreign | | | | | | | | | | | | | | | | |
Currency Exchange | | | | | | | | | | | | | | | | |
Contracts | | | – | | | | (689,522) | | | | – | | | | (689,522) | |
Equity Swaps | | | (994,134) | | | | – | | | | – | | | | (994,134) | |
Total | | $ | (788,493,298) | | | $ | 6,695,136 | | | $ | – | | | $ | (781,798,162) | |
| | | | | | | | | | | | | | | | | |
| * | Other financial instruments are instruments such as written options, securities sold short, equity swaps and forward foreign currency exchange contracts. |
| ** | Refer to Portfolio of Investments for sector information. |
| | |
See Notes to Financial Statements. | | |
| |
20 | | www.arbitragefunds.com | 1-800-295-4485 |
| | |
The Arbitrage Fund | | |
| |
| | May 31, 2013 |
The following is a reconciliation of the fair valuations using significant unobservable inputs (Level 3) for the Fund’s assets and liabilities during the year ended May 31, 2013:
| | | | | | | | | | | | | | | | | | | | | | | | | | | | | | | | | | | | |
Investments in
Securities | | Balance as of
May 31, 2012* | | | Realized Gain | | | Change in
Unrealized
Depreciation | | | Purchases | | | Sale Proceeds | | | Transfer into
Level 3 | | | Transfer out
of Level 3 | | | Balance as of
May 31, 2013 | | | Net change in
unrealized
appreciation/
(depreciation)
included in the
Statements of
Operations
attributable to
Level 3
investments
still held at
May 31, 2013 | |
Common Stocks | | $ | 796,638 | | | $ | – | | | $ | – | | | $ | – | | | $ | – | | | $ | – | | | $ | – | | | $ | 796,638 | | | $ | – | |
Rights | | | 0 | | | | – | | | | – | | | | – | | | | – | | | | – | | | | – | | | | 0 | | | | – | |
TOTAL | | $ | 796,638 | | | $ | – | | | $ | – | | | $ | – | | | $ | – | | | $ | – | | | $ | – | | | $ | 796,638 | | | $ | – | |
| | | | | | | | | | | | | | | | | | | | | | | | | | | | | | | | | | | | | |
| * | Certain Investments, with a total value of $4,288,136, were reclassified from an investment to a receivable during the current year. |
| | |
See Notes to Financial Statements. | | |
| |
Annual Report | May 31, 2013 | | 21 |
| | |
The Arbitrage Event-Driven Fund | | Manager Commentary |
| |
| | May 31, 2013 (Unaudited) |
|
| The Arbitrage Event-Driven Fund | NASDAQ Ticker Symbols | AEDNX, AEDFX, AEFCX, AGEAX |
|
The Fund’s Goal and Main Investments |
The Fund seeks capital growth with its highly specialized investment strategy designed to profit from the often predictable behaviors of equity and fixed income securities involved in the standard timelines of specific corporate events such as asset sales, corporate distress, mergers and acquisitions, recapitalization, restructuring, bankruptcy, litigation, proxy fights, refinancing, and spin-offs. The event-driven strategy invests in Water Island Capital’s best investment ideas across the event-driven universe, regardless of security type, event type, or geography (however, at the present time any publicly traded vehicles following this strategy will not have significant exposure to distressed/illiquid securities). The “best ideas” strategy is our most flexible and diversified approach to allocating capital and is a logical and natural extension of the style that has been our focus for more than a decade. |
Investment Strategy
The Fund’s investment process follows a disciplined, fundamental approach that values downside protection while identifying compelling risk/reward opportunities available to us as we screen catalyst-driven corporate events, such as mergers and acquisitions, restructuring, refinancing, recapitalization, spin-offs, litigation, regulatory changes, bankruptcy, and more. We approach these events through four core strategies: Equity Merger Arbitrage, Equity Special Situations, Credit Special Situations, and Merger-Related Credit. We seek to generate investment returns that have low volatility and low correlation compared to the broader capital markets. We do not manage against any particular benchmark, and believe that capital preservation in difficult markets is as important as generating positive returns within our low correlated, low volatility event-driven strategy. This process and approach has been an integral part of the culture at Water Island Capital since the firm’s inception.
| | |
| | |
| |
22 | | www.arbitragefunds.com | 1-800-295-4485 |
| | |
The Arbitrage Event-Driven Fund | | Portfolio Information |
| |
| | May 31, 2013 (Unaudited) |
Performance (annualized returns as of May 31, 2013)
| | | | | | |
| | | One Year | | | Since Inception* |
Arbitrage Event-Driven Fund, Class R | | | 2.72% | | | 3.02% |
Arbitrage Event-Driven Fund, Class I | | | 3.04% | | | 3.27% |
Arbitrage Event-Driven Fund, Class C** | | | 1.33% | | | 1.33% |
HFRI Event Driven Index | | | 13.78% | | | 6.32% |
Barclays Capital U.S. Aggregate Bond Index | | | 0.91% | | | 3.61% |
Current performance may be higher or lower than performance quoted above. Any performance data quoted represents past performance, and the investment return and principal value of an investment in the Fund will fluctuate so that an investor’s shares, when redeemed, may be worth more or less than their original cost. Past performance is no guarantee of future results. Returns do not reflect a 2% redemption fee for shares that are redeemed from the fund within 30 days of purchase, which, if reflected, would reduce the performance quoted. Returns shown above include the reinvestment of all dividends and capital gains. Contractual fee waivers are currently in effect. Without such fee waivers, performance numbers would be reduced. You can obtain performance data current to the most recent month end by calling 1-800-295-4485 or going to www.arbitragefunds.com.
* Class R and Class I inception: 10/1/10; Class C inception: 6/1/12.
** Class C shares are also subject to a 1.00% contingent deferred sales charge on all purchases redeemed in 12 months of purchase.
The Total Annual Fund Operating Expenses for Class R, Class I and Class C are 2.67%, 2.42% and 3.42%, respectively. The Advisor has agreed to waive fees in excess of 1.69%, 1.44% and 2.44% for Class R, Class I and Class C, respectively, until at least August 31, 2015.
The HFRI Event Driven Index is an index of companies currently or prospectively involved in corporate transactions of a wide variety including but not limited to mergers, restructurings, financial distress, tender offers, shareholder buybacks, debt exchanges, security issuance or other capital structure adjustments. Security types can range from most senior in the capital structure to most junior or subordinated and frequently involve additional derivative securities. Event-Driven exposure includes a combination of sensitivities to equity markets, credit markets and idiosyncratic, company-specific developments.
The Barclays Capital U.S. Aggregate Bond Index is a market value-weighted index of investment-grade fixed-rated debt issues, including government, corporate, asset-backed and mortgage-backed securities with a maturity of one year or more.
An investor may not invest directly in an index.
| | |
| | | |
Annual Report | May 31, 2013 | | 23 |
| | |
The Arbitrage Event-Driven Fund | | Portfolio Information (continued) |
| |
| | May 31, 2013 (Unaudited) |
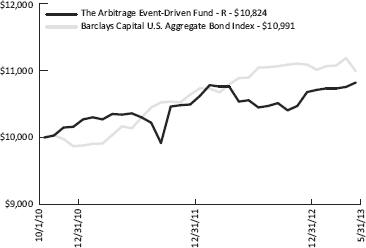
Growth of $10,000 Investment
Sector Weighting
The following chart shows the sector weightings of the Arbitrage Event-Driven Fund’s investments in common stock, corporate bonds, convertible corporate bonds and exchange-traded funds as of the report date.
| | |
| | | |
24 | | www.arbitragefunds.com | 1-800-295-4485 |
| | |
The Arbitrage Event-Driven Fund | | Portfolio of Investments |
| |
| | May 31, 2013 |
| | | | | | | | |
| | | Shares | | | Value | |
| |
COMMON STOCKS - 57.05% | | | | | | | | |
Aerospace & Defense - 1.49% | | | | | | | | |
Aerosonic Corp.(a) | | | 98,689 | | | $ | 764,840 | |
Allied Defense Group, Inc.(a)(b)(f) | | | 5,000 | | | | 10,000 | |
| | | | | | | | |
| | | | | | | 774,840 | |
| | | | | | | | |
| | |
Agriculture - 1.80% | | | | | | | | |
GrainCorp Ltd., Class A | | | 76,999 | | | | 935,885 | |
| | | | | | | | |
| | |
Beverages - 1.69% | | | | | | | | |
DE Master Blenders 1753 N.V.(a) | | | 55,594 | | | | 874,685 | |
| | | | | | | | |
| | |
Biotechnology - 1.67% | | | | | | | | |
Life Technologies Corp.(a)(c) | | | 10,229 | | | | 757,969 | |
PROLOR Biotech, Inc.(a) | | | 17,185 | | | | 108,265 | |
| | | | | | | | |
| | | | | | | 866,234 | |
| | | | | | | | |
| | |
Building Materials - 0.54% | | | | | | | | |
Vulcan Materials Co.(c) | | | 5,200 | | | | 278,616 | |
| | | | | | | | |
| | |
Chemicals - 0.22% | | | | | | | | |
Ferro Corp.(a) | | | 16,290 | | | | 111,749 | |
| | | | | | | | |
| | |
Coal - 0.30% | | | | | | | | |
Whitehaven Coal Ltd. | | | 72,502 | | | | 158,204 | |
| | | | | | | | |
| | |
Commercial Services - 1.02% | | | | | | | | |
Stewart Enterprises, Inc., Class A | | | 40,875 | | | | 531,375 | |
| | | | | | | | |
| | |
Computers - 0.51% | | | | | | | | |
Stonesoft OYJ(a) | | | 45,597 | | | | 264,320 | |
| | | | | | | | |
| | |
Diversified Financial Services - 6.02% | | | | | | | | |
Asset Acceptance Capital Corp.(a) | | | 112,188 | | | | 761,756 | |
NYSE Euronext(d) | | | 58,720 | | | | 2,362,306 | |
| | | | | | | | |
| | | | | | | 3,124,062 | |
| | | | | | | | |
| | |
Entertainment - 0.19% | | | | | | | | |
Club Mediterranee SA(a) | | | 4,188 | | | | 96,184 | |
| | | | | | | | |
| | |
Environmental Control - 0.93% | | | | | | | | |
Met-Pro Corp. | | | 36,072 | | | | 484,447 | |
| | | | | | | | |
| | |
Food - 3.55% | | | | | | | | |
Cermaq ASA | | | 6,462 | | | | 120,020 | |
| | |
See Notes to Financial Statements. | | |
| |
Annual Report | May 31, 2013 | | 25 |
| | |
The Arbitrage Event-Driven Fund | | Portfolio of Investments (continued) |
| |
| | May 31, 2013 |
| | | | | | | | |
| | | Shares | | | Value | |
| |
COMMON STOCKS - 57.05% (Continued) | | | | | | | | |
Food - 3.55% (Continued) | | | | | | | | |
Copeinca ASA | | | 20,853 | | | $ | 206,091 | |
H.J. Heinz Co.(c)(d) | | | 17,795 | | | | 1,287,646 | |
Smithfield Foods, Inc.(a) | | | 7,005 | | | | 230,745 | |
| | | | | | | | |
| | | | | | | 1,844,502 | |
| | | | | | | | |
| | |
Forest Products & Paper - 0.51% | | | | | | | | |
Buckeye Technologies, Inc. | | | 7,115 | | | | 265,176 | |
| | | | | | | | |
| | |
Healthcare - Products - 2.06% | | | | | | | | |
Conceptus, Inc.(a) | | | 28,684 | | | | 888,630 | |
Palomar Medical Technologies, Inc.(a) | | | 13,255 | | | | 179,340 | |
| | | | | | | | |
| | | | | | | 1,067,970 | |
| | | | | | | | |
| | |
Household Products & Wares - 0.97% | | | | | | | | |
American Greetings Corp., Class A | | | 27,400 | | | | 504,160 | |
| | | | | | | | |
| | |
Insurance - 0.92% | | | | | | | | |
Genworth Financial, Inc., Class A(a)(c) | | | 44,312 | | | | 479,013 | |
| | | | | | | | |
| | |
Iron & Steel - 0.17% | | | | | | | | |
Sundance Resources Ltd.(a) | | | 999,923 | | | | 88,999 | |
| | | | | | | | |
| | |
Machinery - Diversified - 1.43% | | | | | | | | |
Gardner Denver, Inc. | | | 9,136 | | | | 689,768 | |
MAN SE(a) | | | 471 | | | | 52,409 | |
| | | | | | | | |
| | | | | | | 742,177 | |
| | | | | | | | |
| | |
Media - 4.40% | | | | | | | | |
Astral Media, Inc., Class A | | | 40,364 | | | | 1,892,154 | |
Fisher Communications, Inc. | | | 6,300 | | | | 258,993 | |
Liberty Global, Inc., Class A(a)(c) | | | 1,800 | | | | 132,660 | |
| | | | | | | | |
| | | | | | | 2,283,807 | |
| | | | | | | | |
| | |
Metal Fabricate & Hardware - 0.25% | | | | | | | | |
Hoganas AB, Class B | | | 2,661 | | | | 129,769 | |
| | | | | | | | |
| | |
Mining - 2.39% | | | | | | | | |
Aurizon Mines Ltd.(a) | | | 171,033 | | | | 738,787 | |
Freeport-McMoRan Copper & Gold, Inc. | | | 15,638 | | | | 485,554 | |
Nevada Copper Corp.(a) | | | 6,725 | | | | 15,049 | |
| | | | | | | | |
| | | | | | | 1,239,390 | |
| | | | | | | | |
| | |
See Notes to Financial Statements. | | |
| |
26 | | www.arbitragefunds.com | 1-800-295-4485 |
| | |
The Arbitrage Event-Driven Fund | | Portfolio of Investments (continued) |
| |
| | May 31, 2013 |
| | | | | | | | |
| | | Shares | | | Value | |
| |
COMMON STOCKS - 57.05% (Continued) | | | | | | | | |
Oil & Gas - 1.34% | | | | | | | | |
McMoRan Exploration Co.(a)(d) | | | 30,427 | | | $ | 506,001 | |
SandRidge Energy, Inc.(a)(c) | | | 20,200 | | | | 104,434 | |
TORC Oil & Gas Ltd.(a) | | | 65,779 | | | | 87,557 | |
| | | | | | | | |
| | | | | | | 697,992 | |
| | | | | | | | |
| | |
Oil & Gas Services - 1.16% | | | | | | | | |
Lufkin Industries, Inc. | | | 6,815 | | | | 601,492 | |
| | | | | | | | |
| | |
Pharmaceuticals - 1.89% | | | | | | | | |
Actavis, Inc.(a)(c) | | | 6,528 | | | | 804,837 | |
Valeant Pharmaceuticals International, Inc.(a)(c) | | | 1,920 | | | | 174,950 | |
| | | | | | | | |
| | | | | | | 979,787 | |
| | | | | | | | |
| | |
Retail - 2.61% | | | | | | | | |
Hot Topic, Inc. | | | 33,330 | | | | 466,287 | |
OfficeMax, Inc.(c)(d) | | | 59,789 | | | | 779,051 | |
Siam Makro Public Co. | | | 4,197 | | | | 107,576 | |
| | | | | | | | |
| | | | | | | 1,352,914 | |
| | | | | | | | |
| | |
Savings & Loans - 4.30% | | | | | | | | |
Hudson City Bancorp, Inc.(d) | | | 262,757 | | | | 2,233,434 | |
| | | | | | | | |
| | |
Semiconductors - 1.84% | | | | | | | | |
ASML Holding N.V., New York Registered Shares | | | 11,776 | | | | 957,036 | |
| | | | | | | | |
| | |
Software - 1.94% | | | | | | | | |
BMC Software, Inc.(a)(c)(d) | | | 22,200 | | | | 1,005,549 | |
| | | | | | | | |
| | |
Telecommunications - 8.94% | | | | | | | | |
Clearwire Corp., Class A(a)(c) | | | 147,165 | | | | 659,299 | |
Globalstar, Inc.(a) | | | 179,913 | | | | 96,254 | |
Sprint Nextel Corp.(a)(c) | | | 119,514 | | | | 872,452 | |
Telular Corp. | | | 82,946 | | | | 1,040,143 | |
Virgin Media, Inc.(d) | | | 39,715 | | | | 1,972,247 | |
| | | | | | | | |
| | | | | | | 4,640,395 | |
| | | | | | | | |
| | |
TOTAL COMMON STOCKS (Cost $29,283,648) | | | | | | | 29,614,163 | |
| | | | | | | | |
| | |
See Notes to Financial Statements. | | |
| |
Annual Report | May 31, 2013 | | 27 |
| | |
The Arbitrage Event-Driven Fund | | Portfolio of Investments (continued) |
| |
| | May 31, 2013 |
| | | | | | | | |
| | | Shares | | | Value | |
| |
PREFERRED STOCKS - 1.19% | | | | | | | | |
Banks - 0.68% | | | | | | | | |
Citizens Funding Trust I, 7.500% | | | 1,213 | | | $ | 30,871 | |
GMAC Capital Trust I, 8.125%(e) | | | 12,067 | | | | 321,224 | |
| | | | | | | | |
| | | | | | | 352,095 | |
| | | | | | | | |
| | |
Financial Services - 0.51% | | | | | | | | |
Citigroup Capital IX, 6.000% | | | 10,617 | | | | 266,911 | |
| | | | | | | | |
| | |
TOTAL PREFERRED STOCKS (Cost $584,091) | | | | | | | 619,006 | |
| | | | | | | | |
| | |
RIGHTS - 0.00% | | | | | | | | |
Cubist Pharmaceuticals, Inc.(a)(b)(f) | | | 34,500 | | | | 0 | |
Emergent Biosolutions, Inc.(a)(b)(f) | | | 546 | | | | 0 | |
| | | | | | | | |
| | |
TOTAL RIGHTS (Cost $162) | | | | | | | 0 | |
| | | | | | | | |
| | |
See Notes to Financial Statements. | | |
| |
28 | | www.arbitragefunds.com | 1-800-295-4485 |
| | |
The Arbitrage Event-Driven Fund | | Portfolio of Investments (continued) |
| |
| | May 31, 2013 |
| | | | | | | | | | | | | | | | |
| | | Maturity Date | | | Rate | | | Principal
Amount | | | Value | |
| |
CORPORATE BONDS - 33.52% | | | | | | | | | | | | | | | | |
Alere, Inc. | | | 10/01/2018 | | | | 8.625 | % | | $ | 537,000 | | | $ | 581,302 | |
ARD Finance SA | | | 06/01/2018 | | | | 11.125 | % | | | 273,000 | | | | 298,935 | |
BMC Software, Inc. | | | 12/01/2022 | | | | 4.500 | % | | | 311,000 | | | | 317,970 | |
BMC Software, Inc. | | | 02/15/2022 | | | | 4.250 | % | | | 311,000 | | | | 315,090 | |
Bresnan Broadband Holdings LLC(g) | | | 12/15/2018 | | | | 8.000 | % | | | 290,000 | | | | 313,925 | |
Brown Shoe Co., Inc. | | | 05/15/2019 | | | | 7.125 | % | | | 252,000 | | | | 266,490 | |
Chaparral Energy, Inc. | | | 09/01/2021 | | | | 8.250 | % | | | 621,000 | | | | 686,205 | |
Cincinnati Bell, Inc. | | | 03/15/2018 | | | | 8.750 | % | | | 539,000 | | | | 552,475 | |
Clearwire Communications LLC / Clearwire Finance, Inc.(g) | | | 12/01/2015 | | | | 12.000 | % | | | 391,000 | | | | 417,901 | |
Coleman Cable, Inc. | | | 02/15/2018 | | | | 9.000 | % | | | 466,000 | | | | 502,115 | |
Copano Energy LLC / Copano Energy Finance Corp. | | | 04/01/2021 | | | | 7.125 | % | | | 824,000 | | | | 949,660 | |
Cricket Communications, Inc. | | | 10/15/2020 | | | | 7.750 | % | | | 447,000 | | | | 445,882 | |
Dean Foods Co. | | | 12/15/2018 | | | | 9.750 | % | | | 724,000 | | | | 834,410 | |
DynCorp International, Inc. | | | 07/01/2017 | | | | 10.375 | % | | | 271,000 | | | | 277,775 | |
Endeavour International Corp. | | | 03/01/2018 | | | | 12.000 | % | | | 411,000 | | | | 386,340 | |
Entercom Radio LLC | | | 12/01/2019 | | | | 10.500 | % | | | 411,000 | | | | 479,842 | |
Fifth Third Capital Trust IV(e) | | | 04/15/2037 | | | | 6.500 | % | | | 679,000 | | | | 680,697 | |
Icahn Enterprises LP / Icahn Enterprises Finance Corp. | | | 01/15/2016 | | | | 7.750 | % | | | 383,000 | | | | 396,405 | |
Intelsat Luxembourg SA(e) | | | 02/04/2017 | | | | 11.250 | % | | | 484,000 | | | | 512,072 | |
MacDermid, Inc.(g) | | | 04/15/2017 | | | | 9.500 | % | | | 750,000 | | | | 776,250 | |
Marina District Finance Co., Inc. | | | 08/15/2018 | | | | 9.875 | % | | | 245,000 | | | | 263,069 | |
McMoRan Exploration Co. | | | 11/15/2014 | | | | 11.875 | % | | | 744,000 | | | | 781,200 | |
Midwest Vanadium Pty Ltd.(g) | | | 02/15/2018 | | | | 11.500 | % | | | 135,000 | | | | 89,100 | |
Newfield Exploration Co. | | | 05/15/2018 | | | | 7.125 | % | | | 218,000 | | | | 224,540 | |
NII Capital Corp. | | | 04/01/2021 | | | | 7.625 | % | | | 684,000 | | | | 569,430 | |
Nortel Networks Ltd.(h) | | | 07/15/2016 | | | | 10.750 | % | | | 301,000 | | | | 339,377 | |
NOVA Chemicals Corp. | | | 11/01/2019 | | | | 8.625 | % | | | 385,000 | | | | 430,238 | |
NRG Energy, Inc. | | | 06/15/2019 | | | | 8.500 | % | | | 95,000 | | | | 103,787 | |
NXP BV / NXP Funding LLC(g) | | | 08/01/2018 | | | | 9.750 | % | | | 226,000 | | | | 255,380 | |
Offshore Group Investment Ltd. | | | 11/01/2019 | | | | 7.500 | % | | | 261,000 | | | | 281,880 | |
Packaging Dynamics Corp.(g) | | | 02/01/2016 | | | | 8.750 | % | | | 338,000 | | | | 353,633 | |
Quicksilver Resources, Inc. | | | 01/01/2016 | | | | 11.750 | % | | | 761,000 | | | | 806,660 | |
Spectrum Brands, Inc. | | | 06/15/2018 | | | | 9.500 | % | | | 212,000 | | | | 234,525 | |
The Reader’s Digest Association, Inc.(e)(h) | | | 02/15/2017 | | | | 9.500 | % | | | 274,000 | | | | 116,450 | |
United Rentals North America, Inc. | | | 09/15/2020 | | | | 8.375 | % | | | 407,000 | | | | 443,630 | |
Univision Communications, Inc.(g) | | | 05/15/2021 | | | | 8.500 | % | | | 208,000 | | | | 225,160 | |
Virgin Media Finance Plc | | | 02/15/2022 | | | | 4.875 | % | | | 488,000 | | | | 492,270 | |
Windstream Corp. | | | 03/15/2019 | | | | 7.000 | % | | | 657,000 | | | | 670,140 | |
| | |
See Notes to Financial Statements. | | |
| |
Annual Report | May 31, 2013 | | 29 |
| | |
The Arbitrage Event-Driven Fund | | Portfolio of Investments (continued) |
| |
| | May 31, 2013 |
| | | | | | | | | | | | | | | | |
| | | Maturity Date | | | Rate | | | Principal Amount | | | Value | |
| |
CORPORATE BONDS - 33.52% (Continued) | | | | | | | | | | | | | | | | |
YPG Financing, Inc.(g) | | | 11/30/2018 | | | | 9.250 | % | | $ | 734,255 | | | $ | 731,245 | |
| | | | | | | | | | | | | | | | |
| | | | |
TOTAL CORPORATE BONDS (Cost $17,542,033) | | | | | | | | | | | | | | | 17,403,455 | |
| | | | | | | | | | | | | | | | |
| | | | |
CONVERTIBLE CORPORATE BONDS - 4.58% | | | | | | | | | | | | | | | | |
Clearwire Communications LLC / Clearwire Finance, Inc.(g) | | | 12/01/2040 | | | | 8.250 | % | | | 155,000 | | | | 171,178 | |
Globalstar, Inc., PIK | | | 04/01/2028 | | | | 8.000 | % | | | 324,062 | | | | 272,212 | |
McMoRan Exploration Co. | | | 10/06/2013 | | | | 5.250 | % | | | 394,000 | | | | 410,745 | |
Nortel Networks Corp.(h) | | | 04/15/2014 | | | | 2.125 | % | | | 316,000 | | | | 306,125 | |
RadioShack Corp.(g) | | | 08/01/2013 | | | | 2.500 | % | | | 422,000 | | | | 417,780 | |
Rambus, Inc. | | | 06/15/2014 | | | | 5.000 | % | | | 320,000 | | | | 330,400 | |
United States Steel Corp. | | | 05/15/2014 | | | | 4.000 | % | | | 440,000 | | | | 451,550 | |
YPG Financing, Inc. | | | 11/30/2022 | | | | 8.000 | % | | | 17,710 | | | | 15,547 | |
| | | | | | | | | | | | | | | | |
| | | | |
TOTAL CONVERTIBLE CORPORATE BONDS (Cost $2,189,615) | | | | | | | | | | | | | | | 2,375,537 | |
| | | | | | | | | | | | | | | | |
| | | | |
| | | Expiration Date | | | Exercise Price | | | Contracts | | | Value | |
| |
PURCHASED OPTIONS (a)- 0.14% | | | | | | | | | | | | | | | | |
Call Options Purchased - 0.02% | | | | | | | | | | | | | | | | |
Martin Marietta Materials, Inc. | | | 06/2013 | | | $ | 110.00 | | | | 9 | | | $ | 1,935 | |
Sprint Nextel Corp. | | | 08/2013 | | | | 7.00 | | | | 114 | | | | 6,498 | |
| | | | | | | | | | | | | | | | |
| | | | |
TOTAL CALL OPTIONS PURCHASED (Cost $7,034) | | | | | | | | | | | | | | | 8,433 | |
| | | | | | | | | | | | | | | | |
| | | | |
Put Options Purchased - 0.12% | | | | | | | | | | | | | | | | |
Actavis, Inc.: | | | | | | | | | | | | | | | | |
| | | 08/2013 | | | | 115.00 | | | | 17 | | | | 5,313 | |
| | | 11/2013 | | | | 110.00 | | | | 15 | | | | 5,925 | |
Genworth Financial, Inc., Class A: | | | | | | | | | | | | | | | | |
| | | 06/2013 | | | | 8.00 | | | | 96 | | | | 336 | |
| | | 09/2013 | | | | 9.00 | | | | 104 | | | | 3,640 | |
Liberty Global, Inc., Class A: | | | | | | | | | | | | | | | | |
| | | 07/2013 | | | | 80.00 | | | | 22 | | | | 15,620 | |
| | | 07/2013 | | | | 85.00 | | | | 9 | | | | 10,350 | |
| | |
See Notes to Financial Statements. | | |
30 | | www.arbitragefunds.com | 1-800-295-4485 |
| | |
The Arbitrage Event-Driven Fund | | Portfolio of Investments (continued) |
| |
| | May 31, 2013 |
| | | | | | | | | | | | | | |
| | | Expiration Date | | Exercise Price | | | Contracts | | | Value | |
| |
PURCHASED OPTIONS (a)- 0.14% (Continued) | | | | | | | | | | | | | | |
Put Options Purchased - 0.12% (Continued) | | | | | | | | | | | | | | |
SandRidge Energy, Inc. | | 06/2013 | | $ | 5.00 | | | | 202 | | | $ | 2,929 | |
Sprint Nextel Corp. | | 08/2013 | | | 7.00 | | | | 28 | | | | 1,106 | |
Valeant Pharmaceuticals International, Inc.: | | | | | | | | | | | | | | |
| | 08/2013 | | | 87.50 | | | | 16 | | | | 8,240 | |
| | 08/2013 | | | 90.00 | | | | 16 | | | | 10,000 | |
Vulcan Materials Co. | | 06/2013 | | | 50.00 | | | | 13 | | | | 520 | |
Warner Chilcott Plc | | 07/2013 | | | 17.00 | | | | 52 | | | | 1,430 | |
| | | | | | | | | | | | | | |
| | | | |
TOTAL PUT OPTIONS PURCHASED (Cost $106,587) | | | | | | | | | | | | | 65,409 | |
| | | | | | | | | | | | | | |
| | | | |
TOTAL PURCHASED OPTIONS (Cost $113,621) | | | | | | | | | | | | | 73,842 | |
| | | | | | | | | | | | | | |
| | | | |
| | | | | Yield | | | Shares | | | Value | |
| |
SHORT-TERM INVESTMENTS - 2.13% | | | | | | | | | | | | | | |
Time Deposits | | | | | | | | | | | | | | |
Euro Time Deposit | | | | | 0.010% | | | | 1,108,410 | | | | 1,108,410 | |
| | | | | | | | | | | | | | |
| | | | |
TOTAL SHORT-TERM INVESTMENTS (Cost $1,108,410) | | | | | | | | | | | | | 1,108,410 | |
| | | | | | | | | | | | | | |
| | | | |
Total Investments - 98.61% (Cost $50,821,580) | | | | | | | | | | | | | 51,194,413 | |
| | | |
Other Assets in Excess of Liabilities - 1.39% | | | | | | | | | | | 720,377 | |
| | | | | | | | | | | | | | |
| | | | |
NET ASSETS - 100.00% | | | | | | | | | | | | $ | 51,914,790 | |
| | | | | | | | | | | | | | |
| (a) | Non-income-producing security. |
| (b) | Security fair valued using methods determined in good faith by the Pricing Committee. As of May 31, 2013, the total market value of these securities was $10,000, representing 0.02% of net assets. |
| (c) | Underlying security for a written/purchased call/put option. |
| (d) | Security, or a portion of security, is being held as collateral for short sales, or written option contracts. At period end, the aggregate market value of those securities was $8,602,650, representing 16.57% of net assets. |
| (e) | Interest rate will change at a future date. Interest rate shown reflects the rate in effect at May 31, 2013. |
| (f) | Security considered illiquid. On May 31, 2013, the total market value of these securities was $10,000, representing 0.02% of net assets. |
| | |
See Notes to Financial Statements. | | |
Annual Report | May 31, 2013 | | 31 |
| | |
The Arbitrage Event-Driven Fund | | Portfolio of Investments (continued) |
| |
| | May 31, 2013 |
| (g) | Security exempt from registration under Rule 144A of the Securities Act of 1933. These may be resold in transactions exempt from registration, normally to qualified institutional buyers. As of May 31, 2013, these securities had a total value of $3,751,552 or 7.23% of net assets. |
| (h) | Security in default on interest payments. |
Securities determined to be illiquid under the procedures approved by the Funds’ Board of Trustees. Information related to the illiquid securities is as follows:
| | | | | | | | | | | | |
Date(s) of Purchase | | Security | | Cost | | | Market Value | | | % of Net Assets |
|
12/31/2010 – 01/05/2011 | | Allied Defense Group, Inc. | | $ | 16,534 | | | $ | 10,000 | | | 0.02% |
12/12/2011 | | Cubist Pharmaceuticals, Inc. | | | 0 | | | | 0 | | | 0.00 |
10/04/2010 – 10/22/2010 | | Emergent Biosolutions, Inc. | | | 162 | | | | 0 | | | 0.00 |
| | | | | | | | | |
| | | | | | | | $ | 10,000 | | | 0.02% |
| | | | | | | | | |
| | |
| See Notes to Financial Statements. | | |
32 | | www.arbitragefunds.com | 1-800-295-4485 |
| | |
The Arbitrage Event-Driven Fund | | Portfolio of Investments (continued) |
| |
| | May 31, 2013 |
| | | | | | | | |
| SCHEDULE OF SECURITIES SOLD SHORT | | Shares | | | Value | |
| |
COMMON STOCKS | | | | | | | | |
Banks | | | | | | | | |
M&T Bank Corp. | | | (22,080) | | | $ | (2,316,192) | |
| | | | | | | | |
| | |
Building Materials | | | | | | | | |
Martin Marietta Materials, Inc. | | | (2,700) | | | | (294,381) | |
| | | | | | | | |
| | |
Diversified Financial Services | | | | | | | | |
Encore Capital Group, Inc. | | | (6,065) | | | | (216,339) | |
IntercontinentalExchange, Inc. | | | (10,000) | | | | (1,712,100) | |
| | | | | | | | |
| | | | | | | (1,928,439) | |
| | | | | | | | |
| | |
Environmental Control | | | | | | | | |
Ceco Environmental Corp. | | | (3,861) | | | | (46,602) | |
| | | | | | | | |
| | |
Healthcare - Products | | | | | | | | |
Cynosure, Inc., Class A | | | (2,501) | | | | (62,300) | |
| | | | | | | | |
| | |
Iron & Steel | | | | | | | | |
United States Steel Corp. | | | (966) | | | | (17,089) | |
| | | | | | | | |
| | |
Media | | | | | | | | |
Liberty Global, Inc., Class A | | | (9,830) | | | | (724,471) | |
Liberty Global, Inc., Series C | | | (6,593) | | | | (452,873) | |
| | | | | | | | |
| | | | | | | (1,177,344) | |
| | | | | | | | |
| | |
Mining | | | | | | | | |
Freeport-McMoRan Copper & Gold, Inc. | | | (14,838) | | | | (460,720) | |
Hecla Mining Co. | | | (50,009) | | | | (191,534) | |
Nevada Copper Corp. | | | (6,725) | | | | (15,049) | |
| | | | | | | | |
| | | | | | | (667,303) | |
| | | | | | | | |
| | |
Pharmaceuticals | | | | | | | | |
Actavis, Inc. | | | (200) | | | | (24,658) | |
| | | | | | | | |
| | |
Retail | | | | | | | | |
Office Depot, Inc. | | | (98,372) | | | | (433,821) | |
| | | | | | | | |
| | |
Semiconductors | | | | | | | | |
ASML Holding N.V., New York Registered Shares | | | (11,801) | | | | (959,067) | |
| | | | | | | | |
| | |
| See Notes to Financial Statements. | | |
Annual Report | May 31, 2013 | | 33 |
| | |
The Arbitrage Event-Driven Fund | | Portfolio of Investments (continued) |
| |
| | May 31, 2013 |
| | | | | | | | | | | | | | |
| SCHEDULE OF SECURITIES SOLD SHORT | | | | | Shares | | | Value | |
| |
COMMON STOCKS (Continued) | | | | | | | | | | | | | | |
Telecommunications | | | | | | | | | | | | | | |
Clearwire Corp., Class A | | | | | | | | | (400) | | | $ | (1,792) | |
| | | | | | | | | | | | | | |
| | | | |
TOTAL COMMON STOCKS (Proceeds $7,399,336) | | | | | | | | | | | | | (7,928,988) | |
| | | | | | | | | | | | | | |
| | | | |
EXCHANGE TRADED FUNDS | | | | | | | | | | | | | | |
Equity Fund | | | | | | | | | | | | | | |
Health Care Select Sector SPDR® Fund | | | | | | | (7,171) | | | | (345,212) | |
iShares® S&P®/TSX Capped Energy Index Fund | | | | | | | (9,339) | | | | (143,317) | |
SPDR® S&P 500® ETF Trust | | | | | | | | | (1,500) | | | | (244,860) | |
| | | | | | | | | | | | | | |
| | | | | | | | | | | | | (733,389) | |
| | | | | | | | | | | | | | |
| | | | |
TOTAL EXCHANGE TRADED FUNDS (Proceeds $752,687) | | | | | | | | | | | | | (733,389) | |
| | | | | | | | | | | | | | |
| | | | |
| Corporate Bonds | | Maturity Date | | Rate | | | Principal Amount | | | Value | |
| |
Kinder Morgan Energy Partners LP | | 09/01/2022 | | | 3.950% | | | $ | (330,000) | | | $ | (341,596) | |
TOTAL CORPORATE BONDS (Proceeds $346,925) | | | | | | | | | | | | | (341,596) | |
| | | | | | | | | | | | | | |
| | | | |
TOTAL SECURITIES SOLD SHORT (Proceeds $8,498,948) | | | | | | | | | | | | $ | (9,003,973) | |
| | | | | | | | | | | | | | |
| | | | |
SCHEDULE OF WRITTEN OPTIONS | | Expiration Date | | Exercise Price | | | Contracts | | | Value | |
| |
Written Call Options | | | | | | | | | | | | | | |
Actavis, Inc. | | 06/2013 | | $ | 140.00 | | | | (17) | | | $ | (127) | |
BMC Software, Inc.: | | | | | | | | | | | | | | |
| | 06/2013 | | | 46.00 | | | | (2) | | | | (15) | |
| | 08/2013 | | | 46.00 | | | | (15) | | | | (263) | |
| | 08/2013 | | | 47.00 | | | | (7) | | | | (35) | |
Clearwire Corp., Class A: | | | | | | | | | | | | | | |
| | 06/2013 | | | 3.00 | | | | (86) | | | | (12,685) | |
| | 06/2013 | | | 3.50 | | | | (145) | | | | (14,137) | |
| | 06/2013 | | | 4.00 | | | | (4) | | | | (230) | |
| | 07/2013 | | | 3.50 | | | | (142) | | | | (13,845) | |
DISH Network Corp.: | | | | | | | | | | | | | | |
| | 06/2013 | | | 41.00 | | | | (7) | | | | (367) | |
| | 06/2013 | | | 42.00 | | | | (7) | | | | (245) | |
| | |
| See Notes to Financial Statements. | | |
34 | | www.arbitragefunds.com | 1-800-295-4485 |
| | |
The Arbitrage Event-Driven Fund | | Portfolio of Investments (continued) |
| |
| | May 31, 2013 |
| | | | | | | | | | | | | | |
SCHEDULE OF WRITTEN OPTIONS | | Expiration
Date | | Exercise Price | | | Contracts | | | Value | |
| |
Written Call Options (Continued) | | | | | | | | | | | | | | |
Genworth Financial, Inc., Class A: | | | | | | | | | | | | | | |
| | 06/2013 | | $ | 10.00 | | | | (15) | | | $ | (1,372) | |
| | 06/2013 | | | 11.00 | | | | (107) | | | | (2,996) | |
| | 07/2013 | | | 12.00 | | | | (104) | | | | (1,872) | |
H.J. Heinz Co. | | 09/2013 | | | 75.00 | | | | (71) | | | | (178) | |
Life Technologies Corp.: | | | | | | | | | | | | | | |
| | 06/2013 | | | 75.00 | | | | (6) | | | | (75) | |
| | 07/2013 | | | 75.00 | | | | (1) | | | | (23) | |
| | 08/2013 | | | 75.00 | | | | (1) | | | | (30) | |
Office Depot, Inc.: | | | | | | | | | | | | | | |
| | 06/2013 | | | 3.50 | | | | (4) | | | | (370) | |
| | 06/2013 | | | 4.00 | | | | (108) | | | | (4,860) | |
| | 06/2013 | | | 4.50 | | | | (4) | | | | (40) | |
| | 07/2013 | | | 4.00 | | | | (5) | | | | (262) | |
OfficeMax, Inc.: | | | | | | | | | | | | | | |
| | 06/2013 | | | 11.00 | | | | (85) | | | | (17,000) | |
| | 06/2013 | | | 12.00 | | | | (108) | | | | (11,610) | |
| | 06/2013 | | | 13.00 | | | | (8) | | | | (300) | |
Sprint Nextel Corp.: | | | | | | | | | | | | | | |
| | 06/2013 | | | 7.50 | | | | (19) | | | | (143) | |
| | 08/2013 | | | 8.00 | | | | (152) | | | | (2,584) | |
Valeant Pharmaceuticals International, Inc.: | | | | | | | | | | | | | | |
| | 06/2013 | | | 95.00 | | | | (32) | | | | (5,360) | |
| | 06/2013 | | | 100.00 | | | | (16) | | | | (1,000) | |
Vulcan Materials Co.: | | | | | | | | | | | | | | |
| | 06/2013 | | | 50.00 | | | | (13) | | | | (5,200) | |
| | 06/2013 | | | 55.00 | | | | (13) | | | | (1,138) | |
| | | | | | | | | | | | | | |
| | | | |
TOTAL WRITTEN CALL OPTIONS (Premiums received $46,909) | | | | | | | | | | | | | (98,362) | |
| | | | | | | | | | | | | | |
| | | | |
Written Put Options | | | | | | | | | | | | | | |
Actavis, Inc.: | | | | | | | | | | | | | | |
| | 06/2013 | | | 110.00 | | | | (17) | | | | (595) | |
| | 06/2013 | | | 115.00 | | | | (15) | | | | (1,088) | |
Genworth Financial, Inc., Class A: | | | | | | | | | | | | | | |
| | 06/2013 | | | 10.00 | | | | (107) | | | | (1,177) | |
| | 06/2013 | | | 11.00 | | | | (92) | | | | (4,324) | |
Martin Marietta Materials, Inc. | | 06/2013 | | | 100.00 | | | | (9) | | | | (360) | |
| | |
| See Notes to Financial Statements. | | |
Annual Report | May 31, 2013 | | 35 |
| | |
The Arbitrage Event-Driven Fund | | Portfolio of Investments (continued) |
| |
| | May 31, 2013 |
| | | | | | | | | | | | | | |
SCHEDULE OF WRITTEN OPTIONS | | Expiration
Date | | Exercise Price | | | Contracts | | | Value | |
| |
| | | | |
Written Put Options (Continued) | | | | | | | | | | | | | | |
Valeant Pharmaceuticals International, Inc.: | | | | | | | | | | | | | | |
| | 06/2013 | | $ | 87.50 | | | | (16) | | | $ | (2,720) | |
| | 06/2013 | | | 90.00 | | | | (16) | | | | (4,200) | |
Warner Chilcott Plc | | 06/2013 | | | 17.00 | | | | (19) | | | | (190) | |
| | | | | | | | | | | | | | |
| | | | |
TOTAL WRITTEN PUT OPTIONS (Premiums received $ 25,068) | | | | | | | | | | | | | (14,654) | |
| | | | | | | | | | | | | | |
| | | | |
TOTAL WRITTEN OPTIONS (Premiums received $ 71,977) | | | | | | | | | | | | $ | (113,016) | |
| | | | | | | | | | | | | | |
| | |
| See Notes to Financial Statements. | | |
36 | | www.arbitragefunds.com | 1-800-295-4485 |
| | |
The Arbitrage Event-Driven Fund | | Portfolio of Investments (continued) |
| |
| | May 31, 2013 |
| | | | | | | | | | | | | | |
| EQUITY SWAP CONTRACTS | | | | | | | | | | | | | | |
| | | | | |
Swap Counterparty | | Reference Obligation | | Rate Paid/Received by the Fund | | Termination Dates | | Notional Amount | | | Unrealized Appreciation | |
| |
Goldman, Sachs & Co. | | Hoganas AB | | 1 Month-STIBOR plus 0.45 bps | | 05/06/2014 | | $ | 242,849 | | | $ | 10,593 | |
Goldman, Sachs & Co. | | Yancoal Australia Rights Ltd. | | 1 Month-BBSW- REUTERS plus 0.50 bps | | 05/07/2014 | | | 81,283 | | | | 3,452 | |
Goldman, Sachs & Co. | | Yanzhou Coal Mining Co. | | 1 Month-HIBOR- REUTERS minus 1.0 bps | | 05/30/2014 | | | (4,772) | | | | 250 | |
UBS | | Ithaca Energy, Inc. | | 1 Month-LIBOR-BBA plus 0.35 bps | | Monthly Reset | | | 23,739 | | | | 3,415 | |
UBS | | Yancoal Australia Rights Ltd. | | 1 Month-BBSW- REUTERS plus 0.55 bps | | Monthly Reset | | | 143,045 | | | | 6,658 | |
| | | | | | | | | | |
| | | | | | | | $ | 486,144 | | | $ | 24,368 | |
| | | | | | | | | | |
| | | | | |
Swap Counterparty | | Reference Obligation | | Rate Paid/Received by the Fund | | Termination Dates | | Notional Amount | | | Unrealized Depreciation | |
| |
UBS | | Flinders Mines Ltd. | | 1 Month-BBSW- REUTERS plus 0.55 bps | | Monthly Reset | | $ | 53,955 | | | $ | (5,620) | |
UBS | | Yancoal Australia Ltd. | | 1 Month-BBSW- REUTERS plus 0.55 bps | | Monthly Reset | | | 40,264 | | | | (517) | |
| | | | | | | | | | |
| | | | | | | | $ | 94,219 | | | $ | (6,137) | |
| | | | | | | | | | |
| | |
| See Notes to Financial Statements. | | |
Annual Report | May 31, 2013 | | 37 |
| | |
The Arbitrage Event-Driven Fund | | Portfolio of Investments (continued) |
| |
| | May 31, 2013 |
| | | | | | | | | | | | | | | | | | |
OUTSTANDING FORWARD FOREIGN CURRENCY EXCHANGE CONTRACTS | |
| | | | | |
Contract Description | | Contracts to Deliver/Receive | | | Purchase/ Sale Contract | | Expiration Date | | | Current Value | | | Unrealized Appreciation | |
| |
AUD | | | 1,363,900 | | | Sale | | | 6/17/2013 | | | | 1,303,663 | | | $ | 55,300 | |
CAD | | | 3,366,500 | | | Sale | | | 6/17/2013 | | | | 3,245,872 | | | | 74,644 | |
NOK | | | 735,000 | | | Sale | | | 6/17/2013 | | | | 125,161 | | | | 1,157 | |
THB | | | 3,220,000 | | | Sale | | | 6/17/2013 | | | | 106,256 | | | | 1,548 | |
| | | | | | | | | | | | | | | | | | |
| | | | | | | | | | | | | | | | $ | 132,649 | |
| | | | | | | | | | | | | | | | | | |
| | | | | |
Contract Description | | Contracts to Deliver/Receive | | | Purchase/ Sale Contract | | Expiration Date | | | Current Value | | | Unrealized Depreciation | |
| |
AUD | | | 136,000 | | | Purchase | | | 6/17/2013 | | | | 129,994 | | | $ | (3,158 | ) |
CAD | | | 153,000 | | | Purchase | | | 6/17/2013 | | | | 147,518 | | | | (2,639 | ) |
EUR | | | 25,000 | | | Purchase | | | 6/17/2013 | | | | 32,497 | | | | (125 | ) |
EUR | | | 1,018,000 | | | Sale | | | 6/17/2013 | | | | 1,323,270 | | | | (5,737 | ) |
NOK | | | 1,180,000 | | | Sale | | | 6/17/2013 | | | | 200,939 | | | | (844 | ) |
SEK | | | 860,000 | | | Sale | | | 6/17/2013 | | | | 129,790 | | | | (458 | ) |
| | | | | | | | | | | | | | | | | | |
| | | | | | | | | | | | | | | | $ | (12,961 | ) |
| | | | | | | | | | | | | | | | | | |
| | |
| See Notes to Financial Statements. | | |
38 | | www.arbitragefunds.com | 1-800-295-4485 |
| | |
The Arbitrage Event-Driven Fund | | Portfolio of Investments (continued) |
| |
| | May 31, 2013 |
| | | | |
| Country | | % of Net Assets | |
| |
Canada | | | 8.78% | |
Netherlands | | | 4.02% | |
Australia | | | 2.45% | |
Bermuda | | | 0.99% | |
Great Britain | | | 0.95% | |
Norway | | | 0.63% | |
Ireland | | | 0.57% | |
Cayman Islands | | | 0.54% | |
Finland | | | 0.51% | |
Sweden | | | 0.25% | |
Thailand | | | 0.21% | |
France | | | 0.18% | |
Germany | | | 0.10% | |
United States | | | 78.43% | |
Other Assets in Excess of Liabilities | | | 1.39% | |
| | | | |
| | | 100.00% | |
| | | | |
| |
| Assets | | % of Net Assets | |
| |
Corporate Bonds | | | 33.52% | |
Banks | | | 1.89% | |
Mining | | | 0.17% | |
Semiconductors | | | 0.49% | |
Oil & Gas | | | 6.09% | |
Packaging & Containers | | | 0.68% | |
Household Products & Wares | | | 0.45% | |
Media | | | 3.59% | |
Software | | | 1.22% | |
Telecommunications | | | 7.71% | |
Pipelines | | | 1.83% | |
Retail | | | 0.51% | |
Diversified Financial Services | | | 0.76% | |
Electric | | | 0.20% | |
Chemicals | | | 2.33% | |
Commercial Services | | | 1.39% | |
Food | | | 1.61% | |
Healthcare - Products | | | 1.12% | |
Electrical Components & Equipment | | | 0.97% | |
Financial Services | | | 0.51% | |
| |
Convertible Corporate Bonds | | | 4.58% | |
Media | | | 0.03% | |
Semiconductors | | | 0.64% | |
Telecommunications | | | 1.44% | |
Retail | | | 0.81% | |
Iron & Steel | | | 0.87% | |
Oil & Gas | | | 0.79% | |
| |
| Liabilities | | % of Net Assets | |
| |
Corporate Bonds | | | (0.66 | )% |
Pipelines | | | (0.66 | )% |
| | |
| See Notes to Financial Statements. | | |
Annual Report | May 31, 2013 | | 39 |
| | |
The Arbitrage Event-Driven Fund | | Portfolio of Investments (continued) |
| |
| | May 31, 2013 |
Abbreviations:
AB - Arktiebolag is the Swedish term for a limited company
ASA - Allmennaksjeselskap is the Norwegian term for a public limited company
AUD - Australian Dollar
BBSW - Australian Bank Bill Swap Reference Rate
bps - Basis Points
CAD - Canadian Dollar
ETF - Exchange Traded Fund
EUR - Euro
HIBOR - Hong Kong Interbank Offered Rate
LIBOR - London Interbank Offered Rate
LLC - Limited Liability Company
Ltd. - Limited
NOK - Norwegian Krone
N.V. - Naamloze Vennootschap is the Dutch term for a public limited liability corporation
OYJ - Osakeyhtio is the Finnish equivalent of a public limited company
PIK - Payment-in-kind
Plc - Public Limited Liability
SA - Generally designates corporations in various countries, mostly those employing civil law. This
translates literally in all languages mentioned as anonymous company
SE - SE Regulation. A European Company which can operate on a Europe-wide basis and be
governed by Community law directly applicable in all Member States
SEK - Swedish Krona
S&P - Standard & Poor’s
SPDR - Standard & Poor’s Depositary Receipt
STIBOR - Stockholm Interbank Offer Rate
THB - Thai Baht
| | |
| See Notes to Financial Statements. | | |
40 | | www.arbitragefunds.com | 1-800-295-4485 |
| | |
| The Arbitrage Event-Driven Fund | | |
| | May 31, 2013 |
The following is a summary of the inputs used as of May 31, 2013, in valuing the Arbitrage Event-Driven Fund’s investments carried at value:
| | | | | | | | | | | | | | | | |
Investments in Securities at Value | | | | | | | | | | | | | | | | |
| | | | |
| | | Level 1 | | | Level 2 | | | Level 3 | | | Total | |
Assets | | | | | | | | | | | | | | | | |
Common Stocks | | | | | | | | | | | | | | | | |
Aerospace & Defense | | $ | 764,840 | | | $ | – | | | $ | 10,000 | | | $ | 774,840 | |
Agriculture | | | 935,885 | | | | – | | | | – | | | | 935,885 | |
Beverages | | | 874,685 | | | | – | | | | – | | | | 874,685 | |
Biotechnology | | | 866,234 | | | | – | | | | – | | | | 866,234 | |
Building Materials | | | 278,616 | | | | – | | | | – | | | | 278,616 | |
Chemicals | | | 111,749 | | | | – | | | | – | | | | 111,749 | |
Coal | | | 158,204 | | | | – | | | | – | | | | 158,204 | |
Commercial Services | | | 531,375 | | | | – | | | | – | | | | 531,375 | |
Computers | | | 264,320 | | | | – | | | | – | | | | 264,320 | |
Diversified Financial Services | | | 3,124,062 | | | | – | | | | – | | | | 3,124,062 | |
Entertainment | | | 96,184 | | | | – | | | | – | | | | 96,184 | |
Environmental Control | | | 484,447 | | | | – | | | | – | | | | 484,447 | |
Food | | | 1,844,502 | | | | – | | | | – | | | | 1,844,502 | |
Forest Products & Paper | | | 265,176 | | | | – | | | | – | | | | 265,176 | |
Healthcare - Products | | | 1,067,970 | | | | – | | | | – | | | | 1,067,970 | |
Household Products & Wares | | | 504,160 | | | | – | | | | – | | | | 504,160 | |
Insurance | | | 479,013 | | | | – | | | | – | | | | 479,013 | |
Iron & Steel | | | 88,999 | | | | – | | | | – | | | | 88,999 | |
Machinery - Diversified | | | 742,177 | | | | – | | | | – | | | | 742,177 | |
Media | | | 2,283,807 | | | | – | | | | – | | | | 2,283,807 | |
Metal Fabricate & Hardware | | | 129,769 | | | | – | | | | – | | | | 129,769 | |
Mining | | | 500,603 | | | | 738,787 | | | | – | | | | 1,239,390 | |
Oil & Gas | | | 697,992 | | | | – | | | | – | | | | 697,992 | |
Oil & Gas Services | | | 601,492 | | | | – | | | | – | | | | 601,492 | |
Pharmaceuticals | | | 979,787 | | | | – | | | | – | | | | 979,787 | |
Retail | | | 1,245,338 | | | | 107,576 | | | | – | | | | 1,352,914 | |
Savings & Loans | | | 2,233,434 | | | | – | | | | – | | | | 2,233,434 | |
Semiconductors | | | 957,036 | | | | – | | | | – | | | | 957,036 | |
Software | | | 1,005,549 | | | | – | | | | – | | | | 1,005,549 | |
Telecommunications | | | 4,640,395 | | | | – | | | | – | | | | 4,640,395 | |
| | | | |
Preferred Stocks | | | 619,006 | | | | – | | | | – | | | | 619,006 | |
Rights | | | – | | | | – | | | | 0 | | | | 0 | |
Corporate Bonds | | | – | | | | 17,403,455 | | | | – | | | | 17,403,455 | |
Convertible Corporate Bonds | | | – | | | | 2,375,537 | | | | – | | | | 2,375,537 | |
Purchased Options | | | 73,842 | | | | – | | | | – | | | | 73,842 | |
Short-Term Investments | | | 1,108,410 | | | | – | | | | – | | | | 1,108,410 | |
TOTAL | | $ | 30,559,058 | | | $ | 20,625,355 | | | $ | 10,000 | | | $ | 51,194,413 | |
| | | | | | | | | | | | | | | | | |
| | |
See Notes to Financial Statements. | | |
| |
Annual Report | May 31, 2013 | | 41 |
| | |
| The Arbitrage Event-Driven Fund | | |
| |
| | May 31, 2013 |
| | | | | | | | | | | | | | | | |
Investments in Securities at Value (Continued) | | | | | | | | | | | | | | | | |
| | | Level 1 | | | Level 2 | | | Level 3 | | | Total | |
Other Financial Instruments* | | | | | | | | | | | | | | | | |
Assets | | | | | | | | | | | | | | | | |
Forward Foreign Currency Exchange Contracts | | $ | – | | | $ | 132,649 | | | $ | – | | | $ | 132,649 | |
Equity Swaps | | | 24,368 | | | | – | | | | – | | | | 24,368 | |
Liabilities | | | | | | | | | | | | | | | | |
Common Stocks** | | | (7,928,988) | | | | – | | | | – | | | | (7,928,988) | |
Exchange-Traded Funds | | | (733,389) | | | | – | | | | – | | | | (733,389) | |
Corporate Bonds | | | – | | | | (341,596) | | | | – | | | | (341,596) | |
Written Options | | | (113,016) | | | | – | | | | – | | | | (113,016) | |
Forward Foreign Currency Exchange Contracts | | | – | | | | (12,961) | | | | – | | | | (12,961) | |
Equity Swaps | | | (6,137) | | | | – | | | | – | | | | (6,137) | |
Total | | $ | (8,757,162) | | | $ | (221,908) | | | $ | – | | | $ | (8,979,070) | |
| | | | | | | | | | | | | | | | | |
| * | Other financial instruments are written options, securities sold short, equity swaps and forward foreign currency exchange contracts. |
| ** | Refer to Portfolio of Investments for sector information. |
The following is a reconciliation of the fair valuations using significant unobservable inputs (Level 3) for the Fund’s assets and liabilities during the year ended May 31, 2013:
| | | | | | | | | | | | | | | | | | | | | | | | | | | | | | | | | | | | |
Investments in
Securities | | Balance as of
May 31, 2012* | | | Realized Gain | | | Change in
Unrealized
Depreciation | | | Purchases | | | Sale Proceeds | | | Transfer into
Level 3 | | | Transfer out of
Level 3 | | | Balance as of
May 31, 2013 | | | Net change in
unrealized
appreciation/
(depreciation)
included in the
Statements of
Operations
attributable to
Level 3
investments
still held at
May 31, 2013 | |
Common Stock | | $ | 10,000 | | | $ | – | | | $ | – | | | $ | – | | | $ | – | | | $ | – | | | $ | – | | | $ | 10,000 | | | $ | – | |
Rights | | | – | | | | – | | | | – | | | | – | | | | – | | | | – | | | | – | | | | – | | | | – | |
TOTAL | | $ | 10,000 | | | $ | – | | | $ | – | | | $ | – | | | $ | – | | | $ | – | | | $ | – | | | $ | 10,000 | | | $ | – | |
| | | | | | | | | | | | | | | | | | | | | | | | | | | | | | | | | | | | | |
| * | Certain investments with a total value of $15,561, were reclassified from an investment to a receivable during the current year. |
| | |
See Notes to Financial Statements. | | |
| |
42 | | www.arbitragefunds.com | 1-800-295-4485 |
| | |
| The Arbitrage Credit Opportunities Fund | | Manager Commentary |
| |
| | May 31, 2013 (Unaudited) |
|
| The Arbitrage Credit Opportunities Fund | NASDAQ Ticker Symbols | ARCFX, ACFIX, ARCCX, AGCAX |
|
| The Fund’s Goal and Main Investments |
The Fund pursues an alternative credit-based strategy that seeks to provide current income and capital growth from specific catalysts or company-specific events that are less correlated to overall market direction or interest rates. |
Investment Strategy
This non-traditional bond funds’ objective is to generate returns by holding outright long and short positions and by utilizing capital structure arbitrage, merger arbitrage, and convertible arbitrage techniques to exploit security mispricing or inefficiencies. This portfolio offers a pure-play credit implementation of Water Island Capital’s broader event-driven style.
| | |
| | | |
Annual Report | May 31, 2013 | | 43 |
| | |
The Arbitrage Credit Opportunities Fund | | Portfolio Information |
| |
| | May 31, 2013 (Unaudited) |
Performance (annualized returns as of May 31, 2013)
| | |
| | | Since Inception* |
Arbitrage Credit Opportunities Fund, Class R | | 2.33% |
Arbitrage Credit Opportunities Fund, Class I | | 2.49% |
Arbitrage Credit Opportunities Fund, Class C** | | 1.01% |
Barclays Capital U.S. Aggregate Bond Index | | -0.77% |
Current performance may be higher or lower than performance quoted above. Any performance data quoted represents past performance and the investment return and principal value of an investment in the Fund will fluctuate so that an investor’s shares, when redeemed, may be worth more or less than their original cost. Past performance is no guarantee of future results. Returns do not reflect a 2% redemption fee for shares that are redeemed from the fund within 60 days of purchase, which, if reflected, would reduce the performance quoted. Returns shown above include the reinvestment of all dividends and capital gains. Contractual fee waivers are currently in effect. Without such fee waivers, performance numbers would be reduced. You can obtain performance data current to the most recent month end by calling 1-800-295-4485 or going to www.arbitragefunds.com.
* Class R, Class I and Class C inception: 10/1/12.
** Class C shares are also subject to a 1.00% contingent deferred sales charge on all purchases redeemed in 12 months of purchase.
The Total Annual Fund Operating Expenses for Class R, Class I and Class C are 1.81%, 1.56% and 2.56%, respectively. The Advisor has agreed to waive fees in excess of 1.50%, 1.25% and 2.25% for Class R, Class I and Class C, respectively, until at least August 31, 2015.
The Barclays Capital U.S. Aggregate Bond Index is a market value-weighted index of investment grade fixed-rated debt issues, including government, corporate, asset-backed and mortgage-backed securities with a maturity of one year or more.
An investor may not invest directly in an index.
| | |
| | | |
44 | | www.arbitragefunds.com | 1-800-295-4485 |
| | |
The Arbitrage Credit Opportunities Fund | | Portfolio Information (continued) |
| |
| | May 31, 2013 (Unaudited) |
Growth of $10,000 Investment
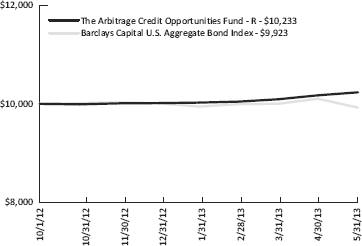
Sector Weighting
The following chart shows the sector weightings of the Arbitrage Credit Opportunities Fund’s investments in common stock, corporate bonds, convertible corporate bonds and exchange-traded funds as of the report date.
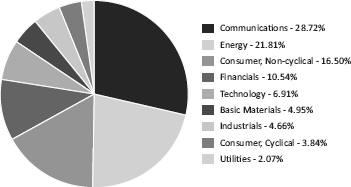
| | |
| | | |
Annual Report | May 31, 2013 | | 45 |
| | |
The Arbitrage Credit Opportunities Fund | | Portfolio of Investments |
| |
| | May 31, 2013 |
| | | | | | | | |
| | | Shares | | | Value | |
COMMON STOCKS - 0.43% | | | | | | | | |
Telecommunications - 0.43% | | | | | | | | |
Globalstar, Inc.(a) | | | 41,625 | | | $ | 22,269 | |
| | | | | | | | |
| | |
TOTAL COMMON STOCKS (Cost $13,320) | | | | | | | 22,269 | |
| | | | | | | | |
| | |
PREFERRED STOCKS - 1.76% | | | | | | | | |
Banks - 0.77% | | | | | | | | |
GMAC Capital Trust I, 8.125%(b)(c) | | | 1,500 | | | | 39,930 | |
| | | | | | | | |
| | |
Real Estate Investment Trusts - 0.99% | | | | | | | | |
CapLease, Inc., Series A, 8.125% | | | 2,000 | | | | 50,900 | |
| | | | | | | | |
| | |
TOTAL PREFERRED STOCKS (Cost $88,844) | | | | | | | 90,830 | |
| | | | | | | | |
| | |
See Notes to Financial Statements. | | |
| |
46 | | www.arbitragefunds.com | 1-800-295-4485 |
| | |
The Arbitrage Credit Opportunities Fund | | Portfolio of Investments (continued) |
| |
| | May 31, 2013 |
| | | | | | | | | | | | | | | | |
| | | Maturity Date | | | Rate | | | Principal
Amount | | | Value | |
CORPORATE BONDS - 77.70% | | | | | | | | | | | | | | | | |
Alere, Inc. | | | 10/01/2018 | | | | 8.625 | % | | $ | 123,000 | | | $ | 133,147 | |
ARAMARK Corp.(d) | | | 03/15/2020 | | | | 5.750 | % | | | 100,000 | | | | 103,500 | |
ARD Finance SA | | | 06/01/2018 | | | | 11.125 | % | | | 42,000 | | | | 45,990 | |
BMC Software, Inc. | | | 12/01/2022 | | | | 4.500 | % | | | 31,000 | | | | 31,695 | |
BMC Software, Inc. | | | 02/15/2022 | | | | 4.250 | % | | | 31,000 | | | | 31,408 | |
Bresnan Broadband Holdings LLC(b)(d) | | | 12/15/2018 | | | | 8.000 | % | | | 95,000 | | | | 102,837 | |
Brown Shoe Co., Inc. | | | 05/15/2019 | | | | 7.125 | % | | | 55,000 | | | | 58,162 | |
Chaparral Energy, Inc. | | | 09/01/2021 | | | | 8.250 | % | | | 107,000 | | | | 118,235 | |
Cincinnati Bell, Inc. | | | 03/15/2018 | | | | 8.750 | % | | | 111,000 | | | | 113,775 | |
Clearwire Communications LLC / Clearwire Finance, Inc.(d) | | | 12/01/2015 | | | | 12.000 | % | | | 47,000 | | | | 50,234 | |
Coleman Cable, Inc. | | | 02/15/2018 | | | | 9.000 | % | | | 100,000 | | | | 107,750 | |
Copano Energy LLC / Copano Energy Finance Corp. | | | 04/01/2021 | | | | 7.125 | % | | | 105,000 | | | | 121,012 | |
Cricket Communications, Inc. | | | 10/15/2020 | | | | 7.750 | % | | | 78,000 | | | | 77,805 | |
Dean Foods Co.(b) | | | 12/15/2018 | | | | 9.750 | % | | | 125,000 | | | | 144,062 | |
Denbury Resources, Inc. | | | 02/15/2020 | | | | 8.250 | % | | | 125,000 | | | | 140,000 | |
DynCorp International, Inc. | | | 07/01/2017 | | | | 10.375 | % | | | 54,000 | | | | 55,350 | |
Endeavour International Corp. | | | 03/01/2018 | | | | 12.000 | % | | | 63,000 | | | | 59,220 | |
Entercom Radio LLC | | | 12/01/2019 | | | | 10.500 | % | | | 89,000 | | | | 103,907 | |
Entravision Communications Corp. | | | 08/01/2017 | | | | 8.750 | % | | | 82,000 | | | | 87,945 | |
Fifth Third Capital Trust IV(c) | | | 04/15/2037 | | | | 6.500 | % | | | 121,000 | | | | 121,303 | |
Gastar Exploration USA, Inc.(d) | | | 05/15/2018 | | | | 8.625 | % | | | 100,000 | | | | 99,000 | |
Helix Energy Solutions Group, Inc.(d) | | | 01/15/2016 | | | | 9.500 | % | | | 75,000 | | | | 77,063 | |
Icahn Enterprises LP / Icahn Enterprises Finance Corp. | | | 01/15/2016 | | | | 7.750 | % | | | 75,000 | | | | 77,625 | |
Intelsat Luxembourg SA(c) | | | 02/04/2017 | | | | 11.250 | % | | | 95,000 | | | | 100,510 | |
MacDermid, Inc.(d) | | | 04/15/2017 | | | | 9.500 | % | | | 94,000 | | | | 97,290 | |
McMoRan Exploration Co. | | | 11/15/2014 | | | | 11.875 | % | | | 83,000 | | | | 87,150 | |
Midwest Vanadium Pty Ltd.(d) | | | 02/15/2018 | | | | 11.500 | % | | | 33,000 | | | | 21,780 | |
Newfield Exploration Co. | | | 05/15/2018 | | | | 7.125 | % | | | 90,000 | | | | 92,700 | |
NII Capital Corp. | | | 04/01/2021 | | | | 7.625 | % | | | 95,000 | | | | 79,088 | |
Nortel Networks Ltd.(e) | | | 07/15/2016 | | | | 10.750 | % | | | 38,000 | | | | 42,845 | |
NOVA Chemicals Corp. | | | 11/01/2019 | | | | 8.625 | % | | | 55,000 | | | | 61,463 | |
NRG Energy, Inc. | | | 06/15/2019 | | | | 8.500 | % | | | 90,000 | | | | 98,325 | |
NXP BV / NXP Funding LLC(d) | | | 08/01/2018 | | | | 9.750 | % | | | 92,000 | | | | 103,960 | |
Offshore Group Investment Ltd. | | | 11/01/2019 | | | | 7.500 | % | | | 50,000 | | | | 54,000 | |
Packaging Dynamics Corp.(d) | | | 02/01/2016 | | | | 8.750 | % | | | 65,000 | | | | 68,006 | |
Quicksilver Resources, Inc. | | | 01/01/2016 | | | | 11.750 | % | | | 90,000 | | | | 95,400 | |
Realogy Group LLC(d) | | | 02/15/2019 | | | | 7.875 | % | | | 100,000 | | | | 109,750 | |
Spectrum Brands, Inc. | | | 06/15/2018 | | | | 9.500 | % | | | 110,000 | | | | 121,688 | |
SunGard Data Systems, Inc.(b) | | | 11/15/2020 | | | | 7.625 | % | | | 147,000 | | | | 161,700 | |
| | |
See Notes to Financial Statements. | | |
| |
Annual Report | May 31, 2013 | | 47 |
| | |
The Arbitrage Credit Opportunities Fund | | Portfolio of Investments (continued) |
| |
| | May 31, 2013 |
| | | | | | | | | | | | | | | | |
| | | Maturity Date | | | Rate | | | Principal
Amount | | | Value | |
CORPORATE BONDS - 77.70% (Continued) | | | | | | | | | | | | | | | | |
United Rentals North America, Inc. | | | 09/15/2020 | | | | 8.375% | | | $ | 90,000 | | | $ | 98,100 | |
Univision Communications, Inc.(d) | | | 05/15/2021 | | | | 8.500% | | | | 100,000 | | | | 108,250 | |
Virgin Media Finance Plc | | | 02/15/2022 | | | | 4.875% | | | | 76,000 | | | | 76,665 | |
Windstream Corp. | | | 03/15/2019 | | | | 7.000% | | | | 140,000 | | | | 142,800 | |
YPG Financing, Inc.(d) | | | 11/30/2018 | | | | 9.250% | | | | 126,000 | | | | 125,483 | |
| | | | | | | | | | | | | | | | |
| | | | |
TOTAL CORPORATE BONDS (Cost $4,014,875) | | | | | | | | | | | | | | | 4,007,978 | |
| | | | | | | | | | | | | | | | |
| | | | |
CONVERTIBLE CORPORATE BONDS - 11.52% | | | | | | | | | | | | | | | | |
Annaly Capital Management, Inc. | | | 05/15/2015 | | | | 5.000% | | | | 100,000 | | | | 101,813 | |
Clearwire Communications LLC / Clearwire Finance, Inc.(d) | | | 12/01/2040 | | | | 8.250% | | | | 25,000 | | | | 27,610 | |
Globalstar, Inc., PIK | | | 04/01/2028 | | | | 8.000% | | | | 74,976 | | | | 62,980 | |
McMoRan Exploration Co. | | | 10/06/2013 | | | | 5.250% | | | | 50,000 | | | | 52,125 | |
Nortel Networks Corp.(e) | | | 04/15/2014 | | | | 2.125% | | | | 43,000 | | | | 41,656 | |
Omnicare, Inc. | | | 12/15/2035 | | | | 3.250% | | | | 125,000 | | | | 129,531 | |
RadioShack Corp.(d) | | | 08/01/2013 | | | | 2.500% | | | | 126,000 | | | | 124,740 | |
United States Steel Corp. | | | 05/15/2014 | | | | 4.000% | | | | 52,000 | | | | 53,365 | |
| | | | | | | | | | | | | | | | |
| | | | |
TOTAL CONVERTIBLE CORPORATE BONDS (Cost $555,470) | | | | | | | | | | | | | | | 593,820 | |
| | | | | | | | | | | | | | | | |
| | | | |
| | | | | | Yield | | | Shares | | | Value | |
SHORT-TERM INVESTMENTS - 7.76% | | | | | | | | | | | | | | | | |
Time Deposits | | | | | | | | | | | | | | | | |
Euro Time Deposit | | | | | | | 0.010% | | | | 400,378 | | | $ | 400,378 | |
| | | | | | | | | | | | | | | | |
| | | | |
TOTAL SHORT-TERM INVESTMENTS (Cost $400,378) | | | | | | | | | | | | | | | 400,378 | |
| | | | | | | | | | | | | | | | |
| | | | |
Total Investments - 99.17% (Cost $5,072,887) | | | | | | | | | | | | | | | 5,115,275 | |
| | | | |
Other Assets in Excess of Liabilities - 0.83% | | | | | | | | | | | | | | | 42,862 | |
| | | | | | | | | | | | | | | | |
| | | | |
NET ASSETS - 100.00% | | | | | | | | | | | | | | $ | 5,158,137 | |
| | | | | | | | | | | | | | | | |
| (a) | Non-income-producing security. |
| (b) | Security, or a portion of security, is being held as collateral for short sales, or written option contracts. At period end, the aggregate market value of those securities was $448,529, representing 8.70% of net assets. |
| | |
See Notes to Financial Statements. | | |
| |
48 | | www.arbitragefunds.com | 1-800-295-4485 |
| | |
The Arbitrage Credit Opportunities Fund | | Portfolio of Investments (continued) |
| |
| | May 31, 2013 |
| (c) | Interest rate will change at a future date. Interest rate shown reflects the rate in effect at May 31, 2013. |
| (d) | Security exempt from registration under Rule 144A of the Securities Act of 1933. These may be resold in transactions exempt from registration, normally to qualified institutional buyers. As of May 31, 2013, these securities had a total value of $1,219,503 or 23.64% of net assets. |
| (e) | Security in default on interest payments. |
| | | | | | | | | | | | | | | | |
| SCHEDULE OF SECURITIES SOLD SHORT | | | | | | | | Shares | | | Value | |
COMMON STOCKS | | | | | | | | | | | | | | | | |
Iron & Steel | | | | | | | | | | | | | | | | |
United States Steel Corp. | | | | | | | | | | | (114) | | | $ | (2,017) | |
| | | | | | | | | | | | | | | | |
| | | | |
TOTAL COMMON STOCKS (Proceeds $2,723) | | | | | | | | | | | | | | | (2,017) | |
| | | | | | | | | | | | | | | | |
| | | | |
| Corporate Bonds | | Maturity Date | | | Rate | | | Principal
Amount | | | Value | |
Kinder Morgan Energy Partners LP | | | 09/01/2022 | | | | 3.950% | | | $ | (42,000) | | | $ | (43,476) | |
TOTAL CORPORATE BONDS (Proceeds $44,154) | | | | | | | | | | | | | | | (43,476) | |
| | | | | | | | | | | | | | | | |
| | | | |
TOTAL SECURITIES SOLD SHORT (Proceeds $46,877) | | | | | | | | | | | | | | | (45,493) | |
| | | | | | | | | | | | | | | | |
| | |
See Notes to Financial Statements. | | |
| |
Annual Report | May 31, 2013 | | 49 |
| | |
The Arbitrage Credit Opportunities Fund | | Portfolio of Investments (continued) |
| |
| | May 31, 2013 |
OUTSTANDING FORWARD FOREIGN CURRENCY EXCHANGE CONTRACTS
| | | | | | | | | | | | |
Contract Description | | Contracts to
Deliver/Receive | | Purchase/
Sale
Contract | | Expiration
Date | | Current
Value | | Unrealized
Appreciation | |
CAD | | 127,000 | | Sale | | 6/17/2013 | | 122,449 | | $ | 2,880 | |
| | | | | | | | | | | | |
| | | | | | | | | | $ | 2,880 | |
| | | | | | | | | | | | |
| | | | | |
Contract Description | | Contracts to
Deliver/Receive | | Purchase/
Sale
Contract | | Expiration
Date | | Current
Value | | Unrealized
Depreciation | |
CAD | | 3,000 | | Sale | | 6/17/2013 | | 2,893 | | $ | (7) | |
| | | | | | | | | | | | |
| | | | | | | | | | $ | (7) | |
| | | | | | | | | | | | |
| | |
See Notes to Financial Statements. | | |
| |
50 | | www.arbitragefunds.com | 1-800-295-4485 |
| | |
The Arbitrage Credit Opportunities Fund | | Portfolio of Investments (continued) |
| |
| | May 31, 2013 |
| | | | |
| Country | | % of Net Assets | |
| |
Canada | | | 5.26% | |
Netherlands | | | 2.01% | |
Bermuda | | | 1.95% | |
Great Britain | | | 1.49% | |
Cayman Islands | | | 1.05% | |
Ireland | | | 0.89% | |
Australia | | | 0.42% | |
United States | | | 86.10% | |
Other Assets in Excess of Liabilities | | | 0.83% | |
| | | | |
| | | 100.00% | |
| | | | |
| | | | |
| |
| Assets | | % of Net Assets | |
| |
Corporate Bonds | | | 77.70% | |
Banks | | | 3.24% | |
Mining | | | 0.42% | |
Semiconductors | | | 2.02% | |
Oil & Gas Services | | | 1.49% | |
Packaging & Containers | | | 1.32% | |
Media | | | 10.24% | |
Oil & Gas | | | 14.46% | |
Pipelines | | | 2.35% | |
Software | | | 1.22% | |
Telecommunications | | | 13.26% | |
Real Estate | | | 2.13% | |
Retail | | | 1.13% | |
Computers | | | 3.13% | |
Diversified Financial Services | | | 1.50% | |
Chemicals | | | 3.08% | |
Commercial Services | | | 2.97% | |
Electric | | | 1.91% | |
Healthcare - Products | | | 2.58% | |
Household Products & Wares | | | 2.36% | |
Electrical Components & Equipment | | | 2.09% | |
Food | | | 4.80% | |
| |
Convertible Corporate Bonds | | | 11.52% | |
Real Estate Investment Trusts | | | 1.97% | |
Retail | | | 2.42% | |
Telecommunications | | | 2.57% | |
Iron & Steel | | | 1.04% | |
Oil & Gas | | | 1.01% | |
Pharmaceuticals | | | 2.51% | |
| |
| Liabilities | | % of Net Assets | |
| |
Corporate Bonds | | | (0.84)% | |
Pipelines | | | (0.84)% | |
| | |
See Notes to Financial Statements. | | |
| |
Annual Report | May 31, 2013 | | 51 |
| | |
The Arbitrage Credit Opportunities Fund | | Portfolio of Investments (continued) |
| |
| | May 31, 2013 |
Abbreviations:
CAD - Canadian Dollar
LLC - Limited Liability Company
LP - Limited Partnership
Ltd. - Limited
PIK - Payment-in-kind
Plc - Public Limited Company
SA - Generally designates corporations in various countries, mostly those employing civil law. This translates literally in all languages mentioned as anonymous company.
| | |
See Notes to Financial Statements. | | |
| |
52 | | www.arbitragefunds.com | 1-800-295-4485 |
| | |
The Arbitrage Credit Opportunities Fund | | |
| |
| | May 31, 2013 |
The following is a summary of the inputs used as of May 31, 2013, in valuing the Arbitrage Credit Opportunities Fund’s investments carried at value:
Investments in Securities at Value
| | | | | | | | | | | | | | | | |
| | | Level 1 | | | Level 2 | | | Level 3 | | | Total | |
| |
Assets | | | | | | | | | | | | | | | | |
Common Stocks | | | | | | | | | | | | | | | | |
Telecommunications | | $ | 22,269 | | | $ | – | | | $ | – | | | $ | 22,269 | |
| | | | |
Preferred Stocks | | | 90,830 | | | | – | | | | – | | | | 90,830 | |
Corporate Bonds | | | – | | | | 4,007,978 | | | | – | | | | 4,007,978 | |
Convertible Corporate Bonds | | | – | | | | 593,820 | | | | – | | | | 593,820 | |
Short-Term Investments | | | 400,378 | | | | – | | | | – | | | | 400,378 | |
| |
TOTAL | | $ | 513,477 | | | $ | 4,601,798 | | | $ | – | | | $ | 5,115,275 | |
| |
| | | | | | | | | | | | | | | | |
| |
Other Financial Instruments* | | | | | | | | | | | | | | | | |
| |
Assets | | | | | | | | | | | | | | | | |
Forward Foreign Currency Exchange Contracts | | $ | – | | | $ | 2,880 | | | $ | – | | | $ | 2,880 | |
Liabilities | | | | | | | | | | | | | | | | |
Common Stocks** | | | (2,017) | | | | – | | | | – | | | | (2,017) | |
Corporate Bonds | | | – | | | | (43,476) | | | | – | | | | (43,476) | |
Forward Foreign Currency Exchange Contacts | | | – | | | | (7) | | | | – | | | | (7) | |
| |
Total | | $ | (2,017) | | | $ | (40,603) | | | $ | – | | | $ | (42,620) | |
| |
| * | Other financial instruments are securities sold short and forward foreign currency exchange contracts. |
| ** | Refer to Portfolio of Investments for sector information. |
| | |
See Notes to Financial Statements. | | |
| |
Annual Report | May 31, 2013 | | 53 |
| | |
The Arbitrage Fund | | Statement of Assets and Liabilities |
| |
| | May 31, 2013 |
| | | | |
ASSETS | | | | |
Investments: | | | | |
At cost | | $ | 2,970,353,575 | |
| | | | |
At value (Note 2) | | $ | 2,981,995,269 | |
Cash | | | 165,767,287 | |
Cash denominated in foreign currency (Cost $4,217,073) | | | 4,240,751 | |
Deposits with brokers for securities sold short (Note 2) | | | 599,015,085 | |
Deposits with brokers for swaps (Note 2) | | | 55,001,380 | |
Receivable for investment securities sold | | | 50,389,117 | |
Receivable for capital shares sold | | | 10,901,449 | |
Unrealized appreciation on forward foreign currency exchange contracts (Note 7) | | | 7,430,071 | |
Unrealized appreciation on equity swap contracts | | | 2,084,404 | |
Dividends and interest receivable | | | 650,480 | |
Prepaid expenses and other assets | | | 1,671,733 | |
| | | | |
Total Assets | | | 3,879,147,026 | |
| | | | |
LIABILITIES | | | | |
Securities sold short, at value (Note 2) (proceeds $735,315,672) | | | 783,408,435 | |
Written options, at value (Note 2) (premiums received $2,607,441) | | | 6,220,546 | |
Payable to custodian | | | 59,766 | |
Payable for investment securities purchased | | | 199,552,262 | |
Payable for swap contract payments | | | 159,392 | |
Unrealized depreciation on forward foreign currency exchange contracts (Note 7) | | | 689,522 | |
Unrealized depreciation on equity swap contracts | | | 994,134 | |
Payable for capital shares redeemed | | | 9,668,448 | |
Payable to Advisor (Note 5) | | | 2,548,937 | |
Dividends payable on securities sold short (Note 2) | | | 1,508,047 | |
Payable to Distributor (Note 5) | | | 212,766 | |
Payable to Administrator (Note 5) | | | 487,528 | |
Interest expense payable | | | 442,419 | |
Payable to Trustees | | | 52,455 | |
Payable to Chief Compliance Officer (Note 5) | | | 57,411 | |
Other accrued expenses and liabilities | | | 152,863 | |
| | | | |
Total Liabilities | | | 1,006,214,931 | |
| | | | |
NET ASSETS | | $ | 2,872,932,095 | |
| | | | |
NET ASSETS CONSIST OF: | | | | |
Paid-in capital | | $ | 2,932,668,875 | |
Accumulated net investment loss | | | (8,468,313) | |
Accumulated net realized loss on investments, equity swap contracts, securities sold short, written option contracts and foreign currencies | | | (19,077,046) | |
Net unrealized depreciation on investments, equity swap contracts, securities sold short, written option contracts and translation of assets and liabilities denominated in foreign currencies | | | (32,191,421) | |
| | | | |
NET ASSETS | | $ | 2,872,932,095 | |
| | | | |
| | |
See Notes to Financial Statements. | | |
| |
54 | | www.arbitragefunds.com | 1-800-295-4485 |
| | |
The Arbitrage Fund | | Statement of Assets and Liabilities |
| |
| | May 31, 2013 |
| | | | |
PRICING OF SHARES: | | | | |
CLASS R SHARES: | | | | |
Net assets applicable to Class R shares | | $ | 916,677,105 | |
Shares of beneficial interest outstanding (unlimited number of shares authorized, no par value) | | | 73,329,601 | |
Net asset value and offering price per share(a) | | $ | 12.50 | |
CLASS I SHARES: | | | | |
Net assets applicable to Class I shares | | $ | 1,937,513,607 | |
Shares of beneficial interest outstanding (unlimited number of shares authorized, no par value) | | | 152,071,318 | |
Net asset value and offering price per share(a) | | $ | 12.74 | |
CLASS C SHARES: | | | | |
Net assets applicable to Class C shares | | $ | 18,741,383 | |
Shares of beneficial interest outstanding (unlimited number of shares authorized, no par value) | | | 1,513,737 | |
Net asset value and offering price per share(a) | | $ | 12.38 | |
| (a) | Redemption price varies based on length of time held (Note 1). |
| | |
See Notes to Financial Statements. | | |
| |
Annual Report | May 31, 2013 | | 55 |
| | |
The Arbitrage Event-Driven Fund | | Statement of Assets and Liabilities |
| |
| | May 31, 2013 |
| | | | |
ASSETS | | | | |
Investments: | | | | |
At cost | | $ | 50,821,580 | |
| | | | |
At value (Note 2) | | $ | 51,194,413 | |
Cash | | | 577,698 | |
Cash denominated in foreign currency (Cost $18,874) | | | 18,883 | |
Deposits with brokers for securities sold short (Note 2) | | | 8,608,432 | |
Deposits with brokers for swaps (Note 2) | | | 223,403 | |
Receivable for investment securities sold | | | 591,448 | |
Receivable for capital shares sold | | | 752,783 | |
Unrealized appreciation on forward foreign currency exchange contracts (Note 7) | | | 132,649 | |
Unrealized appreciation on equity swap contracts | | | 24,368 | |
Dividends and interest receivable | | | 375,124 | |
Prepaid expenses and other assets | | | 38,527 | |
| | | | |
Total Assets | | | 62,537,728 | |
| | | | |
LIABILITIES | | | | |
Securities sold short, at value (Note 2) (proceeds $8,498,948) | | | 9,003,973 | |
Written options, at value (Note 2) (premiums received $71,977) | | | 113,016 | |
Payable to custodian | | | 12,215 | |
Payable for investment securities purchased | | | 1,271,152 | |
Payable for swap contract payments | | | 689 | |
Unrealized depreciation on forward foreign currency exchange contracts (Note 7) | | | 12,961 | |
Unrealized depreciation on equity swap contracts | | | 6,137 | |
Payable for capital shares redeemed | | | 94,557 | |
Payable to Advisor (Note 5) | | | 31,200 | |
Dividends payable on securities sold short (Note 2) | | | 25,215 | |
Payable to Distributor (Note 5) | | | 2,274 | |
Payable to Administrator (Note 5) | | | 13,562 | |
Interest expense payable | | | 5,069 | |
Payable to Trustees | | | 925 | |
Payable to Chief Compliance Officer (Note 5) | | | 991 | |
Other accrued expenses and liabilities | | | 29,002 | |
| | | | |
Total Liabilities | | | 10,622,938 | |
| | | | |
NET ASSETS | | $ | 51,914,790 | |
| | | | |
NET ASSETS CONSIST OF: | | | | |
Paid-in capital | | $ | 52,473,245 | |
Accumulated net investment loss | | | (126,591) | |
Accumulated net realized loss on investments, equity swap contracts, securities sold short, written option contracts and foreign currencies | | | (395,115) | |
Net unrealized depreciation on investments, equity swap contracts, securities sold short, written option contracts and translation of assets and liabilities denominated in foreign currencies | | | (36,749) | |
| | | | |
NET ASSETS | | $ | 51,914,790 | |
| | |
See Notes to Financial Statements. | | |
| |
56 | | www.arbitragefunds.com | 1-800-295-4485 |
| | |
The Arbitrage Event-Driven Fund | | Statement of Assets and Liabilities |
| |
| | May 31, 2013 |
| | | | |
PRICING OF SHARES: | | | | |
CLASS R SHARES: | | | | |
Net assets applicable to Class R shares | | $ | 10,079,992 | |
Shares of beneficial interest outstanding (unlimited number of shares authorized, no par value) | | | 1,028,761 | |
Net asset value and offering price per share(a) | | $ | 9.80 | |
CLASS I SHARES: | | | | |
Net assets applicable to Class I shares | | $ | 41,492,984 | |
Shares of beneficial interest outstanding (unlimited number of shares authorized, no par value) | | | 4,208,864 | |
Net asset value and offering price per share(a) | | $ | 9.86 | |
CLASS C SHARES: | | | | |
Net assets applicable to Class C shares | | $ | 341,814 | |
Shares of beneficial interest outstanding (unlimited number of shares authorized, no par value) | | | 34,939 | |
Net asset value and offering price per share(a) | | $ | 9.78 | |
| (a) | Redemption price varies based on length of time held (Note 1). |
| | |
See Notes to Financial Statements. | | |
| |
Annual Report | May 31, 2013 | | 57 |
| | |
The Arbitrage Credit Opportunities Fund | | Statement of Assets and Liabilities |
| |
| | May 31, 2013 |
| | | | |
ASSETS | | | | |
Investments: | | | | |
At cost | | $ | 5,072,887 | |
| | | | |
At value (Note 2) | | $ | 5,115,275 | |
Cash denominated in foreign currency (Cost $2,810) | | | 2,810 | |
Deposits with brokers for securities sold short (Note 2) | | | 36,423 | |
Unrealized appreciation on forward foreign currency exchange contracts (Note 7) | | | 2,880 | |
Dividends and interest receivable | | | 83,809 | |
Prepaid expenses and other assets | | | 29,682 | |
| | | | |
Total Assets | | | 5,270,879 | |
| | | | |
LIABILITIES | | | | |
Securities sold short, at value (Note 2) (proceeds $46,877) | | | 45,493 | |
Payable to custodian | | | 759 | |
Payable for investment securities purchased | | | 18,058 | |
Unrealized depreciation on forward foreign currency exchange contracts (Note 7) | | | 7 | |
Payable to Advisor (Note 5) | | | 21,664 | |
Dividends payable on securities sold short (Note 2) | | | 6 | |
Payable to Distributor (Note 5) | | | 374 | |
Payable to Administrator (Note 5) | | | 1,757 | |
Interest expense payable | | | 17 | |
Audit and legal fees payable | | | 23,665 | |
Payable to Trustees | | | 90 | |
Payable to Chief Compliance Officer (Note 5) | | | 98 | |
Other accrued expenses and liabilities | | | 754 | |
| | | | |
Total Liabilities | | | 112,742 | |
| | | | |
NET ASSETS | | $ | 5,158,137 | |
| | | | |
NET ASSETS CONSIST OF: | | | | |
Paid-in capital | | $ | 5,052,284 | |
Accumulated net investment income | | | 70,257 | |
Accumulated net realized loss on investments, securities sold short, written option contracts and foreign currencies | | | (11,049) | |
Net unrealized appreciation on investments, securities sold short and translation of assets and liabilities denominated in foreign currencies | | | 46,645 | |
| | | | |
NET ASSETS | | $ | 5,158,137 | |
| | | | |
| | |
See Notes to Financial Statements. | | |
| |
58 | | www.arbitragefunds.com | 1-800-295-4485 |
| | |
The Arbitrage Credit Opportunities Fund | | Statement of Assets and Liabilities |
| |
| | May 31, 2013 |
| | | | |
PRICING OF SHARES: | | | | |
CLASS R SHARES: | | | | |
Net assets applicable to Class R shares | | $ | 1,671,035 | |
Shares of beneficial interest outstanding (unlimited number of shares authorized, no par value) | | | 164,165 | |
Net asset value and offering price per share(a) | | $ | 10.18 | |
CLASS I SHARES: | | | | |
Net assets applicable to Class I shares | | $ | 3,461,509 | |
Shares of beneficial interest outstanding (unlimited number of shares authorized, no par value) | | | 340,829 | |
Net asset value and offering price per share(a) | | $ | 10.16 | |
CLASS C SHARES: | | | | |
Net assets applicable to Class C shares | | $ | 25,593 | |
Shares of beneficial interest outstanding (unlimited number of shares authorized, no par value) | | | 2,518 | |
Net asset value and offering price per share(a) | | $ | 10.17 | |
| (a) | Redemption price varies based on length of time held (Note 1). |
| | |
See Notes to Financial Statements. | | |
| |
Annual Report | May 31, 2013 | | 59 |
| | |
The Arbitrage Fund | | Statement of Operations |
| |
| | For the Year Ended May 31, 2013 |
| | | | |
INVESTMENT INCOME | | | | |
Dividends | | $ | 37,434,917 | |
Foreign taxes withheld | | | (584,030) | |
Interest income | | | 92,049 | |
| | | | |
Total Income | | | 36,942,936 | |
| | | | |
EXPENSES | | | | |
Investment advisory fees (Note 5) | | | 31,518,150 | |
Distribution and service fees (Note 5) | | | | |
Class R | | | 2,492,556 | |
Class C | | | 69,228 | |
Administrative fees (Note 5) | | | 589,986 | |
Chief Compliance Officer fees (Note 5) | | | 345,639 | |
Trustees’ fees | | | 246,868 | |
Dividend expense | | | 13,003,106 | |
Interest rebate expense | | | 2,984,795 | |
Transfer agent fees (Note 5) | | | 2,721,273 | |
Custodian and bank service fees | | | 282,571 | |
Registration and filing fees | | | 192,531 | |
Printing of shareholder reports | | | 267,291 | |
Professional fees | | | 143,937 | |
Line of credit interest expense (Note 4) | | | 314,381 | |
Insurance expense | | | 102,059 | |
Principal Financial Officer fees (Note 5) | | | 9,845 | |
Other expenses | | | 35,505 | |
| | | | |
Total Expenses | | | 55,319,721 | |
NET INVESTMENT LOSS | | | (18,376,785) | |
| | | | |
REALIZED AND UNREALIZED GAINS (LOSSES) ON INVESTMENTS AND FOREIGN CURRENCIES | | | | |
Net realized gains (losses) from: | | | | |
Investments | | | 173,922,010 | |
Equity swap contracts | | | (23,836,056) | |
Securities sold short | | | (129,289,719) | |
Written option contracts | | | 19,279,647 | |
Foreign currency transactions (Note 7) | | | (1,755,446) | |
Net change in unrealized appreciation (depreciation) on: | | | | |
Investments | | | 58,595,435 | |
Equity swap contracts | | | 17,741,943 | |
Securities sold short | | | (58,720,755) | |
Written option contracts | | | (5,734,824) | |
Foreign currency transactions (Note 7) | | | (16,844,153) | |
| | | | |
NET REALIZED AND UNREALIZED GAINS ON INVESTMENTS AND FOREIGN CURRENCIES | | | | |
| | | 33,358,082 | |
| | | | |
NET INCREASE IN NET ASSETS RESULTING FROM OPERATIONS | | $ | 14,981,297 | |
| | | | |
| | |
See Notes to Financial Statements. | | |
| |
60 | | www.arbitragefunds.com | 1-800-295-4485 |
| | |
The Arbitrage Event-Driven Fund | | Statement of Operations |
| |
| | For the Year Ended May 31, 2013 |
| | | | |
INVESTMENT INCOME | | | | |
Dividends | | $ | 494,124 | |
Foreign taxes withheld | | | (3,910) | |
Interest income | | | 1,039,054 | |
| | | | |
Total Income | | | 1,529,268 | |
| | | | |
EXPENSES | | | | |
Investment advisory fees (Note 5) | | | 525,387 | |
Distribution and service fees (Note 5) | | | | |
Class R | | | 20,326 | |
Class C | | | 1,593 | |
Administrative fees (Note 5) | | | 19,721 | |
Chief Compliance Officer fees (Note 5) | | | 4,982 | |
Trustees’ fees | | | 3,692 | |
Dividend expense | | | 151,832 | |
Interest rebate expense | | | 45,159 | |
Transfer agent fees (Note 5) | | | 50,623 | |
Custodian and bank service fees | | | 55,409 | |
Registration and filing fees | | | 61,433 | |
Printing of shareholder reports | | | 4,573 | |
Professional fees | | | 25,244 | |
Line of credit interest expense (Note 4) | | | 8,642 | |
Insurance expense | | | 1,165 | |
Principal Financial Officer fees (Note 5) | | | 144 | |
Other expenses | | | 11,390 | |
| | | | |
Total Expenses | | | 991,315 | |
Fees waived by the Advisor, Class R (Note 5) | | | (30,441) | |
Fees waived by the Advisor, Class I (Note 5) | | | (127,460) | |
Fees waived by the Advisor, Class C (Note 5) | | | (620) | |
| | | | |
Net Expenses | | | 832,794 | |
| | | | |
NET INVESTMENT INCOME | | | 696,474 | |
| | | | |
REALIZED AND UNREALIZED GAINS (LOSSES) ON INVESTMENTS AND FOREIGN CURRENCIES | | | | |
Net realized gains (losses) from: | | | | |
Investments | | | 1,255,302 | |
Equity swap contracts | | | (412,016) | |
Securities sold short | | | (1,531,907) | |
Written option contracts | | | 535,188 | |
Foreign currency transactions (Note 7) | | | (41,552) | |
Net change in unrealized appreciation (depreciation) on: | | | | |
Investments | | | 1,529,145 | |
Equity swap contracts | | | 189,627 | |
Securities sold short | | | (721,995) | |
Written option contracts | | | (79,784) | |
Foreign currency transactions (Note 7) | | | (98,534) | |
| | | | |
NET REALIZED AND UNREALIZED GAINS ON INVESTMENTS AND FOREIGN CURRENCIES | | | | |
| | | 623,474 | |
| | | | |
NET INCREASE IN NET ASSETS RESULTING FROM OPERATIONS | | $ | 1,319,948 | |
| | | | |
| | |
See Notes to Financial Statements. | | |
| |
Annual Report | May 31, 2013 | | 61 |
| | |
The Arbitrage Credit Opportunities Fund | | Statement of Operations |
| |
| | For the Period October 1, 2012 (commencement of operations) to May 31, 2013 |
| | | | |
INVESTMENT INCOME | | | | |
Dividends | | $ | 2,298 | |
Interest income | | | 124,069 | |
| | | | |
Total Income | | | 126,367 | |
| | | | |
EXPENSES | | | | |
Investment advisory fees (Note 5) | | | 31,932 | |
Distribution and service fees (Note 5) | | | | |
Class R | | | 2,497 | |
Class C | | | 167 | |
Administrative fees (Note 5) | | | 1,946 | |
Chief Compliance Officer fees (Note 5) | | | 380 | |
Trustees’ fees | | | 307 | |
Dividend expense | | | 1,099 | |
Interest rebate expense | | | 432 | |
Transfer agent fees (Note 5) | | | 3,982 | |
Custodian and bank service fees | | | 1,020 | |
Registration and filing fees | | | 1,703 | |
Printing of shareholder reports | | | 506 | |
Professional fees | | | 23,703 | |
Insurance expense | | | 135 | |
Offering cost | | | 44,764 | |
Principal Financial Officer fees (Note 5) | | | 11 | |
Other expenses | | | 3,368 | |
| | | | |
Total Expenses | | | 117,952 | |
Fees waived by the Advisor, Class R (Note 5) | | | (22,353) | |
Fees waived by the Advisor, Class I (Note 5) | | | (51,089) | |
Fees waived by the Advisor, Class C (Note 5) | | | (399) | |
| | | | |
Net Expenses | | | 44,111 | |
| | | | |
NET INVESTMENT INCOME | | | 82,256 | |
| | | | |
REALIZED AND UNREALIZED GAINS (LOSSES) ON INVESTMENTS AND FOREIGN CURRENCIES | | | | |
Net realized gains (losses) from: | | | | |
Investments | | | (1,047) | |
Securities sold short | | | (10,086) | |
Written option contracts | | | 91 | |
Foreign currency transactions (Note 7) | | | 1,414 | |
Net change in unrealized appreciation on: | | | | |
Investments | | | 42,388 | |
Securities sold short | | | 1,384 | |
Foreign currency transactions (Note 7) | | | 2,873 | |
| | | | |
NET REALIZED AND UNREALIZED GAINS ON INVESTMENTS AND FOREIGN CURRENCIES | | | | |
| | | 37,017 | |
| | | | |
NET INCREASE IN NET ASSETS RESULTING FROM OPERATIONS | | $ | 119,273 | |
| | | | |
| | |
See Notes to Financial Statements. | | |
| |
62 | | www.arbitragefunds.com | 1-800-295-4485 |
| | |
The Arbitrage Fund | | Statement of Changes in Net Assets |
| |
| | |
| | | | | | | | |
| | | Year Ended May 31, 2013 | | | Year Ended May 31, 2012 | |
| |
| | |
FROM OPERATIONS: | | | | | | | | |
Net investment loss | | $ | (18,376,785) | | | $ | (17,331,886) | |
Net realized gains (losses) from: | | | | | | | | |
Investments and equity swap contracts | | | 150,085,954 | | | | 118,918,981 | |
Securities sold short | | | (129,289,719) | | | | (16,315,889) | |
Written option contracts | | | 19,279,647 | | | | 36,741,453 | |
Foreign currency transactions | | | (1,755,446) | | | | (32,265,222) | |
Net change in unrealized appreciation (depreciation) on: | | | | | | | | |
Investments and equity swap contracts | | | 76,337,378 | | | | (108,642,391) | |
Securities sold short | | | (58,720,755) | | | | 25,718,371 | |
Written option contracts | | | (5,734,824) | | | | 3,634,869 | |
Foreign currency transactions | | | (16,844,153) | | | | 44,995,129 | |
| | | | |
Net increase in net assets resulting from operations | | | 14,981,297 | | | | 55,453,415 | |
| | | | |
FROM DIVIDENDS AND DISTRIBUTIONS TO SHAREHOLDERS: | | | | | | | | |
NET INVESTMENT INCOME | | | | | | | | |
Distributions from net investment income, Class R | | | (7,357,507) | | | | – | |
Distributions from net investment income, Class I | | | (19,481,923) | | | | – | |
Distributions from net investment income, Class C | | | (53,643) | | | | – | |
NET REALIZED GAINS | | | | | | | | |
Distributions from net realized gains, Class R | | | (20,078,884) | | | | (23,687,810) | |
Distributions from net realized gains, Class I | | | (39,477,805) | | | | (33,819,578) | |
Distributions from net realized gains, Class C | | | (108,702) | | | | – | |
| | | | |
Decrease in net assets from distributions to shareholders | | | (86,558,464) | | | | (57,507,388) | |
| | | | |
| | |
See Notes to Financial Statements. | | |
| |
Annual Report | May 31, 2013 | | 63 |
| | |
The Arbitrage Fund | | Statement of Changes in Net Assets |
| |
| | |
| | | | | | | | |
| | | Year Ended May 31, 2013 | | | Year Ended May 31, 2012 | |
| |
| | |
FROM CAPITAL SHARE TRANSACTIONS (NOTE 6): | | | | | | | | |
CLASS R | | | | | | | | |
Proceeds from shares sold | | | 402,159,958 | | | | 660,474,386 | |
Shares issued in reinvestment of distributions | | | 27,131,307 | | | | 23,114,090 | |
Proceeds from redemption fees collected (Note 2) | | | 38,339 | | | | 28,121 | |
Payments for shares redeemed | | | (492,205,896) | | | | (546,985,289) | |
| | | | |
Net increase/(decrease) in net assets from Class R share transactions | | | (62,876,292) | | | | 136,631,308 | |
| | | | |
CLASS I | | | | | | | | |
Proceeds from shares sold | | | 946,778,145 | | | | 1,198,168,361 | |
Shares issued in reinvestment of distributions | | | 33,907,193 | | | | 20,982,182 | |
Proceeds from redemption fees collected (Note 2) | | | 28,661 | | | | 22,731 | |
Payments for shares redeemed | | | (1,080,428,416) | | | | (479,260,004) | |
| | | | |
Net increase/(decrease) in net assets from Class I share transactions | | | (99,714,417) | | | | 739,913,270 | |
| | | | |
CLASS C | | | | | | | | |
Proceeds from shares sold | | | 19,595,035 | | | | – | |
Shares issued in reinvestment of distributions | | | 161,720 | | | | – | |
Proceeds from redemption fees collected (Note 2) | | | 231 | | | | – | |
Payments for shares redeemed | | | (833,208) | | | | – | |
| | | | |
Net increase in net assets from Class C share transactions | | | 18,923,778 | | | | – | |
| | | | |
TOTAL INCREASE/(DECREASE) IN NET ASSETS | | | (215,244,098) | | | | 874,490,605 | |
| | | | |
NET ASSETS: | | | | | | | | |
Beginning of year | | | 3,088,176,193 | | | | 2,213,685,588 | |
| | | | |
End of year * | | | $2,872,932,095 | | | | $3,088,176,193 | |
| | | | |
| | | | |
*Including accumulated net investment (loss) of : | | | $(8,468,313) | | | | $(420,119) | |
| | |
See Notes to Financial Statements. | | |
| |
64 | | www.arbitragefunds.com | 1-800-295-4485 |
| | |
The Arbitrage Event-Driven Fund | | Statement of Changes in Net Assets |
| |
| | |
| | | | | | | | |
| | | Year Ended May 31, 2013 | | | Year Ended May 31, 2012 | |
| |
| | |
FROM OPERATIONS: | | | | | | | | |
Net investment income | | $ | 696,474 | | | $ | 274,727 | |
Net realized gains (losses) from: | | | | | | | | |
Investments and equity swap contracts | | | 843,286 | | | | 374,940 | |
Securities sold short | | | (1,531,907) | | | | (162,733) | |
Written option contracts | | | 535,188 | | | | 888,291 | |
Foreign currency transactions | | | (41,552) | | | | (256,018) | |
Net change in unrealized appreciation (depreciation) on: | | | | | | | | |
Investments and equity swap contracts | | | 1,718,772 | | | | (1,450,906) | |
Securities sold short | | | (721,995) | | | | 271,537 | |
Written option contracts | | | (79,784) | | | | 52,194 | |
Foreign currency transactions | | | (98,534) | | | | 362,251 | |
| | | | |
Net increase in net assets resulting from operations | | | 1,319,948 | | | | 354,283 | |
| | | | |
FROM DIVIDENDS AND DISTRIBUTIONS TO SHAREHOLDERS: | | | | | | | | |
NET INVESTMENT INCOME | | | | | | | | |
Distributions from net investment income, Class R | | | (69,098) | | | | (115,815) | |
Distributions from net investment income, Class I | | | (353,713) | | | | (206,028) | |
Distributions from net investment income, Class C | | | (1,031) | | | | – | |
NET REALIZED GAINS | | | | | | | | |
Distributions from net realized gains, Class R | | | (107,560) | | | | (371,036) | |
Distributions from net realized gains, Class I | | | (540,904) | | | | (655,595) | |
Distributions from net realized gains, Class C | | | (1,943) | | | | – | |
| | | | |
Decrease in net assets from distributions to shareholders | | | (1,074,249) | | | | (1,348,474) | |
| | | | |
| | |
See Notes to Financial Statements. | | |
| |
Annual Report | May 31, 2013 | | 65 |
| | |
The Arbitrage Event-Driven Fund | | Statement of Changes in Net Assets |
| |
| | |
| | | | | | | | |
| | | Year Ended May 31, 2013 | | | Year Ended May 31, 2012 | |
| |
FROM CAPITAL SHARE TRANSACTIONS (NOTE 6): | | | | | | | | |
CLASS R | | | | | | | | |
Proceeds from shares sold | | | 6,778,284 | | | | 8,825,434 | |
Shares issued in reinvestment of distributions | | | 163,355 | | | | 457,817 | |
Proceeds from redemption fees collected (Note 2) | | | 1,136 | | | | 811 | |
Payments for shares redeemed | | | (5,848,204) | | | | (4,806,739) | |
| | | | |
Net increase in net assets from Class R share transactions | | | 1,094,571 | | | | 4,477,323 | |
| | | | |
CLASS I | | | | | | | | |
Proceeds from shares sold | | | 38,368,173 | | | | 15,439,192 | |
Shares issued in reinvestment of distributions | | | 628,267 | | | | 810,048 | |
Proceeds from redemption fees collected (Note 2) | | | 15,946 | | | | 182 | |
Payments for shares redeemed | | | (19,143,328) | | | | (5,935,647) | |
| | | | |
Net increase in net assets from Class I share transactions | | | 19,869,058 | | | | 10,313,775 | |
| | | | |
CLASS C | | | | | | | | |
Proceeds from shares sold | | | 347,531 | | | | – | |
Shares issued in reinvestment of distributions | | | 2,973 | | | | – | |
Payments for shares redeemed | | | (10,000) | | | | – | |
| | | | |
Net increase in net assets from Class C share transactions | | | 340,504 | | | | – | |
| | | | |
TOTAL INCREASE IN NET ASSETS | | | 21,549,832 | | | | 13,796,907 | |
| | | | |
NET ASSETS: | | | | | | | | |
Beginning of year | | | 30,364,958 | | | | 16,568,051 | |
| | | | |
End of year * | | | $51,914,790 | | | | $30,364,958 | |
| | | | |
| | | | |
*Including accumulated net investment income (loss) of : | | | $(126,591) | | | | $140,484 | |
| | |
See Notes to Financial Statements. | | |
| |
66 | | www.arbitragefunds.com | 1-800-295-4485 |
| | |
The Arbitrage Credit Opportunities Fund | | |
| |
Statement of Changes in Net Assets | | |
| | | | |
| | | Period Ended May 31, 2013(a) | |
| |
| |
FROM OPERATIONS: | | | | |
Net investment income | | $ | 82,256 | |
Net realized gains (losses) from: | | | | |
Investments | | | (1,047) | |
Securities sold short | | | (10,086) | |
Written option contracts | | | 91 | |
Foreign currency transactions | | | 1,414 | |
Net change in unrealized appreciation on: | | | | |
Investments | | | 42,388 | |
Securities sold short | | | 1,384 | |
Foreign currency transactions | | | 2,873 | |
| | | | |
Net increase in net assets resulting from operations | | | 119,273 | |
| | | | |
FROM DIVIDENDS AND DISTRIBUTIONS TO SHAREHOLDERS: | | | | |
NET INVESTMENT INCOME | | | | |
Distributions from net investment income, Class R | | | (7,862) | |
Distributions from net investment income, Class I | | | (28,735) | |
Distributions from net investment income, Class C | | | (77) | |
| | | | |
Decrease in net assets from distributions to shareholders | | | (36,674) | |
| | | | |
FROM CAPITAL SHARE TRANSACTIONS (NOTE 6): | | | | |
CLASS R | | | | |
Proceeds from shares sold | | | 1,704,124 | |
Shares issued in reinvestment of distributions | | | 7,862 | |
Proceeds from redemption fees collected (Note 2) | | | 20 | |
Payments for shares redeemed | | | (70,525) | |
| | | | |
Net increase in net assets from Class R share transactions | | | 1,641,481 | |
| | | | |
CLASS I | | | | |
Proceeds from shares sold | | | 3,391,866 | |
Shares issued in reinvestment of distributions | | | 16,969 | |
| | | | |
Net increase in net assets from Class I share transactions | | | 3,408,835 | |
| | | | |
CLASS C | | | | |
Proceeds from shares sold | | | 25,145 | |
Shares issued in reinvestment of distributions | | | 77 | |
| | | | |
Net increase in net assets from Class C share transactions | | | 25,222 | |
| | | | |
TOTAL INCREASE IN NET ASSETS | | | 5,158,137 | |
| | | | |
NET ASSETS: | | | | |
Beginning of period | | | – | |
| | | | |
End of period * | | | $5,158,137 | |
| | | | |
| | | | |
*Including accumulated net investment income of : | | | $70,257 | |
(a) Commenced operations on October 1, 2012.
| | |
See Notes to Financial Statements. | | |
| |
Annual Report | May 31, 2013 | | 67 |
| | |
The Arbitrage Fund – Class R | | |
| |
| | |
Selected Per Share Data and Ratios for a Share Outstanding
Throughout the Periods Presented:
|
| |
|
Net asset value, beginning of period |
Income (loss) from investment operations |
Net investment loss(a) |
Net realized and unrealized gains on investments and foreign currencies |
Total from investment operations |
|
Less distributions |
From net investment income |
From net realized gains |
Total distributions |
Proceeds from redemption fees collected |
|
Net asset value, end of period |
|
Total return(c) |
|
Net assets, end of period (in 000s) |
|
RATIOS TO AVERAGE NET ASSETS: |
Expenses including interest and dividend expense |
Expenses excluding interest and dividend expense(d)(e) |
Expenses after advisory fees waived and expenses reimbursed excluding interest and dividend expense(d)(e) |
Net investment loss |
|
Portfolio turnover rate |
|
| (a) | Per share amounts were calculated using average shares for the year. |
| (b) | Amount rounds to less than $0.01 per share. |
| (c) | Total return is a measure of the change in the value of an investment in the Fund over the years covered, which assumes any dividends or capital gains distributions are reinvested in shares of the Fund. Returns shown do not reflect the deduction of taxes a shareholder would pay on Fund distributions or the redemption of Fund shares. |
| (d) | Dividend expense totaled 0.42%, 0.58%, 0.51%, 0.88% and 0.74%, respectively, of average net assets for the years ended May 31, 2013, 2012, 2011, 2010 and 2009, respectively. |
| (e) | Interest rebate expense and line of credit interest expense totaled 0.10%, 0.20%, 0.13%, 0.29% and 0.58%, respectively, of average net assets for the years ended May 31, 2013, 2012, 2011, 2010 and 2009, respectively. |
| | |
See Notes to Financial Statements. | | |
| |
68 | | www.arbitragefunds.com | 1-800-295-4485 |
| | | | | | | | |
Year Ended May 31, 2013 | | Year Ended May 31, 2012 | | Year Ended May 31, 2011 | | Year Ended May 31, 2010 | | Year Ended May 31, 2009 |
|
| $12.80 | | $12.77 | | $12.50 | | $12.43 | | $12.79 |
| | | | | | | | |
| (0.10) | | (0.11) | | (0.12) | | (0.14) | | (0.16) |
| 0.15 | | 0.44 | | 0.66 | | 0.52 | | 0.30 |
|
| 0.05 | | 0.33 | | 0.54 | | 0.38 | | 0.14 |
|
| | | | |
| | | | | | | | |
| (0.09) | | – | | – | | (0.05) | | – |
| (0.26) | | (0.30) | | (0.27) | | (0.26) | | (0.52) |
|
| (0.35) | | (0.30) | | (0.27) | | (0.31) | | (0.52) |
|
| 0.00(b) | | 0.00(b) | | 0.00(b) | | 0.00(b) | | 0.02 |
|
| | | | |
| $12.50 | | $12.80 | | $12.77 | | $12.50 | | $12.43 |
|
|
| | | | |
| 0.42% | | 2.54% | | 4.37% | | 3.08% | | 1.64% |
| | | | |
| $916,677 | | $1,003,646 | | $866,885 | | $759,235 | | $219,338 |
| | | | |
| | | | | | | | |
| 1.97% | | 2.23% | | 2.16% | | 2.80% | | 3.28% |
| 1.45% | | 1.45% | | 1.52% | | 1.63% | | 1.95% |
| 1.45% | | 1.44% | | 1.52% | | 1.63% | | 1.95% |
| (0.78)% | | (0.83)% | | (0.93)% | | (1.12)% | | (1.34)% |
| | | | |
| 459% | | 563% | | 389% | | 371% | | 709% |
|
| | |
| | | |
Annual Report | May 31, 2013 | | 69 |
| | |
The Arbitrage Fund – Class I | | |
| |
| | |
Selected Per Share Data and Ratios for a Share Outstanding
Throughout the Periods Presented:
|
|
|
Net asset value, beginning of period |
Income (loss) from investment operations |
Net investment loss(a) |
Net realized and unrealized gains on investments and foreign currencies |
Total from investment operations |
|
Less distributions |
From net investment income |
From net realized gains |
Total distributions |
Proceeds from redemption fees collected |
|
Net asset value, end of period |
|
Total return(c) |
|
Net assets, end of period (in 000s) |
|
RATIOS TO AVERAGE NET ASSETS: |
Expenses including interest and dividend expense |
Expenses excluding interest and dividend expense(d)(e) |
Expenses after advisory fees waived and expenses reimbursed excluding interest and dividend expense(d)(e) |
Net investment loss |
|
| Portfolio turnover rate |
|
| (a) | Per share amounts were calculated using average shares for the period. |
| (b) | Amount rounds to less than $0.01 per share. |
| (c) | Total return is a measure of the change in the value of an investment in the Fund over the years covered, which assumes any dividends or capital gains distributions are reinvested in shares of the Fund. Returns shown do not reflect the deduction of taxes a shareholder would pay on Fund distributions or the redemption of Fund shares. |
| (d) | Dividend expense totaled 0.42%, 0.58%, 0.51%, 0.88% and 0.74%, respectively, of average net assets for the years ended May 31, 2013, 2012, 2011, 2010 and 2009, respectively. |
| (e) | Interest rebate expense and line of credit interest expense totaled 0.10%, 0.20%, 0.13%, 0.29% and 0.58%, respectively, of average net assets for the and the years ended May 31, 2013, 2012, 2011, 2010 and 2009, respectively. |
| | |
See Notes to Financial Statements. | | |
| |
70 | | www.arbitragefunds.com | 1-800-295-4485 |
| | | | | | | | |
Year Ended May 31, 2013 | | Year Ended May 31, 2012 | | Year Ended May 31, 2011 | | Year Ended May 31, 2010 | | Year Ended May 31, 2009 |
|
| $13.04 | | $12.98 | | $12.68 | | $12.60 | | $12.95 |
| | | | | | | | | |
| (0.07) | | (0.07) | | (0.08) | | (0.11) | | (0.11) |
| 0.16 | | 0.43 | | 0.67 | | 0.52 | | 0.28 |
|
| 0.09 | | 0.36 | | 0.59 | | 0.41 | | 0.17 |
|
| | | | |
| | | | | | | | | |
| (0.13) | | – | | (0.02) | | (0.07) | | – |
| (0.26) | | (0.30) | | (0.27) | | (0.26) | | (0.52) |
|
| (0.39) | | (0.30) | | (0.29) | | (0.33) | | (0.52) |
|
| 0.00(b) | | 0.00(b) | | 0.00(b) | | 0.00(b) | | 0.00(b) |
|
| | | | |
| $12.74 | | $13.04 | | $12.98 | | $12.68 | | $12.60 |
|
|
| | | | |
| 0.67% | | 2.74% | | 4.74% | | 3.28% | | 1.69% |
| | | | |
| $1,937,514 | | $2,084,530 | | $1,346,801 | | $582,460 | | $108,780 |
| | | | |
| | | | | | | | | |
| 1.72% | | 1.98% | | 1.91% | | 2.55% | | 3.03% |
| 1.20% | | 1.20% | | 1.27% | | 1.38% | | 1.70% |
| 1.20% | | 1.20% | | 1.27% | | 1.38% | | 1.70% |
| (0.51)% | | (0.56)% | | (0.62)% | | (0.85)% | | (0.87)% |
| | | | |
| 459% | | 563% | | 389% | | 371% | | 709% |
|
| | |
| | | |
Annual Report | May 31, 2013 | | 71 |
| | |
The Arbitrage Fund – Class C | | |
| |
| | |
Selected Per Share Data and Ratios for a Share Outstanding
Throughout the Period Presented:
| | |
| | | Year Ended May 31, 2013 (a) |
|
Net asset value, beginning of period | | $12.80 |
Income (loss) from investment operations | | |
Net investment loss(b) | | (0.23) |
Net realized and unrealized gains on investments and foreign currencies | | 0.20 |
| | |
Total from investment operations | | (0.03) |
| | |
| |
Less distributions | | |
From net investment income | | (0.13) |
From net realized gains | | (0.26) |
| | |
Total distributions | | (0.39) |
| | |
Proceeds from redemption fees collected | | 0.00(c) |
| | |
| |
Net asset value, end of period | | $12.38 |
| | |
| | |
| |
Total return(d) | | (0.27%) |
| |
Net assets, end of period (in 000s) | | $18,741 |
| |
RATIOS TO AVERAGE NET ASSETS: | | |
Expenses including interest and dividend expense | | 2.75% |
Expenses excluding interest and dividend expense(e)(f) | | 2.20% |
Expenses after advisory fees waived and expenses reimbursed excluding interest and dividend expense(e)(f) | | 2.20% |
Net investment loss | | (1.84)% |
| |
Portfolio turnover rate | | 459% |
|
| (a) | Commenced operations on June 1, 2012. |
| (b) | Per share amounts were calculated using average shares for the period. |
| (c) | Amount rounds to less than $0.01 per share. |
| (d) | Total return is a measure of the change in the value of an investment in the Fund over the years covered, which assumes any dividends or capital gains distributions are reinvested in shares of the Fund. Returns shown do not reflect the deduction of taxes a shareholder would pay on Fund distributions or the redemption of Fund shares. |
| (e) | Dividend expense totaled 0.42% of average net assets for the period ended May 31, 2013. |
| (f) | Interest rebate expense and line of credit interest expense totaled 0.11% of average net assets for the period ended May 31, 2013. |
| | |
See Notes to Financial Statements. | | |
| |
72 | | www.arbitragefunds.com | 1-800-295-4485 |
Page Intentionally Left Blank
| | |
The Arbitrage Event-Driven Fund – Class R | | |
| |
| | |
Selected Per Share Data and Ratios for a Share Outstanding
Throughout the Periods Presented:
|
| Net asset value, beginning of period |
Income (loss) from investment operations |
Net investment income (loss)(b) |
Net realized and unrealized gains on investments and foreign currencies |
Total from investment operations |
|
Less distributions |
From net investment income |
From net realized gains |
Total distributions |
Proceeds from redemption fees collected |
|
Net asset value, end of period |
|
Total return(d) |
|
Net assets, end of period (in 000s) |
|
RATIOS TO AVERAGE NET ASSETS: |
Expenses including interest and dividend expense |
Expenses excluding interest and dividend expense(g)(h) |
Expenses after advisory fees waived and expenses reimbursed excluding interest and dividend expense(g)(h) |
Net investment income (loss) |
|
Portfolio turnover rate |
| (a) | Commenced operations on October 1, 2010. |
| (b) | Per share amounts were calculated using average shares for the period. |
| (c) | Amount rounds to less than $0.01 per share. |
| (d) | Total return is a measure of the change in the value of an investment in the Fund over the years covered, which assumes any dividends or capital gains distributions are reinvested in shares of the Fund. Returns shown do not reflect the deduction of taxes a shareholder would pay on Fund distributions or the redemption of Fund shares. |
| (g) | Dividend expense totaled 0.36%, 0.27% and 0.28% (annualized), respectively, of average net assets for the years ended May 31, 2013, 2012 and the period ended May 31, 2011, respectively. |
| (h) | Interest rebate expense and line of credit interest expense totaled 0.13%, 0.21% and 0.21% (annualized) of average net assets for the years ended May 31, 2013, 2012 and the period ended May 31, 2011, respectively. |
| | |
See Notes to Financial Statements. | | |
| |
74 | | www.arbitragefunds.com | 1-800-295-4485 |
| | | | |
Year Ended May 31, 2013 | | Year Ended May 31, 2012 | | Period Ended
May 31, 2011(a) |
|
$9.79 | | $10.23 | | $10.00 |
| | |
0.15 | | 0.10 | | (0.02) |
0.11 | | 0.09 | | 0.36 |
|
0.26 | | 0.19 | | 0.34 |
|
| | |
(0.10) | | (0.15) | | (0.01) |
(0.15) | | (0.48) | | (0.10) |
|
(0.25) | | (0.63) | | (0.11) |
|
0.00(c) | | 0.00(c) | | 0.00(c) |
|
| | |
$9.80 | | $9.79 | | $10.23 |
|
|
| | |
2.72% | | 1.88% | | 3.43%(e) |
| | |
$10,080 | | $8,976 | | $4,867 |
| | |
2.55% | | 2.67% | | 4.33%(f) |
2.06% | | 2.19% | | 3.84%(f) |
| | |
1.69% | | 1.69% | | 1.69%(f) |
| | |
1.58% | | 1.02% | | (0.26)%(f) |
| | |
336% | | 490% | | 298%(e) |
|
| | |
| | |
| |
Annual Report | May 31, 2013 | | 75 |
| | |
The Arbitrage Event-Driven Fund – Class I | | |
| |
| | |
Selected Per Share Data and Ratios for a Share Outstanding
Throughout the Periods Presented:
|
Net asset value, beginning of period |
Income (loss) from investment operations |
Net investment income(b) |
Net realized and unrealized gains on investments and foreign currencies |
Total from investment operations |
|
Less distributions |
From net investment income |
From net realized gains |
Total distributions |
Proceeds from redemption fees collected |
|
Net asset value, end of period |
|
Total return(d) |
|
Net assets, end of period (in 000s) |
|
RATIOS TO AVERAGE NET ASSETS: |
Expenses including interest and dividend expense |
Expenses excluding interest and dividend expense(g)(h) |
Expenses after advisory fees waived and expenses reimbursed excluding interest and dividend expense(g)(h) |
Net investment income |
|
| Portfolio turnover rate |
| (a) | Commenced operations on October 1, 2010. |
| (b) | Per share amounts were calculated using average shares for the period. |
| (c) | Amount rounds to less than $0.01 per share. |
| (d) | Total return is a measure of the change in the value of an investment in the Fund over the years covered, which assumes any dividends or capital gains distributions are reinvested in shares of the Fund. Returns shown do not reflect the deduction of taxes a shareholder would pay on Fund distributions or the redemption of Fund shares. |
| (g) | Dividend expense totaled 0.36%, 0.27% and 0.28% (annualized), respectively, of average net assets for the years ended May 31, 2013, 2012 and the period ended May 31, 2011, respectively. |
| (h) | Interest rebate expense and line of credit interest expense totaled 0.13%, 0.21% and 0.21% (annualized) of average net assets for the years ended May 31, 2013, 2012 and the period ended May 31, 2011, respectively. |
| | |
See Notes to Financial Statements. | | |
| |
76 | | www.arbitragefunds.com | 1-800-295-4485 |
| | | | |
Year Ended May 31, 2013 | | Year Ended May 31, 2012 | | Period Ended
May 31, 2011(a) |
|
$9.82 | | $10.24 | | $10.00 |
| | |
0.16 | | 0.12 | | 0.01 |
0.13 | | 0.09 | | 0.35 |
|
0.29 | | 0.21 | | 0.36 |
|
| | |
(0.10) | | (0.15) | | (0.02) |
(0.15) | | (0.48) | | (0.10) |
|
(0.25) | | (0.63) | | (0.12) |
|
0.00(c) | | 0.00(c) | | 0.00(c) |
|
| | |
$9.86 | | $9.82 | | $10.24 |
|
|
| | |
3.04% | | 2.09% | | 3.57%(e) |
| | |
$41,493 | | $21,389 | | $11,701 |
| | |
2.31% | | 2.42% | | 4.73%(f) |
1.82% | | 1.94% | | 4.24%(f) |
| | |
1.44% | | 1.44% | | 1.44%(f) |
| | |
1.68% | | 1.25% | | 0.12%(f) |
| | |
336% | | 490% | | 298%(e) |
|
| | |
| | |
| |
Annual Report | May 31, 2013 | | 77 |
| | |
The Arbitrage Event-Driven Fund – Class C | | |
| |
| | |
Selected Per Share Data and Ratios for a Share Outstanding
Throughout the Period Presented:
| | |
| | | Year Ended May 31, 2013 (a) |
|
Net asset value, beginning of period | | $9.79 |
| |
Income (loss) from investment operations | | |
Net investment income(b) | | 0.09 |
Net realized and unrealized gains on investments and foreign currencies | | 0.13 |
| | |
Total from investment operations | | 0.22 |
| | |
| |
Less distributions | | |
From net investment income | | (0.08) |
From net realized gains | | (0.15) |
| | |
Total distributions | | (0.23) |
| | |
| |
Net asset value, end of period | | $9.78 |
| | |
| | |
| |
Total return(c) | | 2.33% |
| |
Net assets, end of period (in 000s) | | $342 |
| |
RATIOS TO AVERAGE NET ASSETS: | | |
Expenses including interest and dividend expense | | 3.31% |
Expenses excluding interest and dividend expense(d)(e) | | 2.82% |
Expenses after advisory fees waived and expenses reimbursed excluding interest and dividend expense(d)(e) | | 2.44% |
Net investment income | | 0.95% |
| |
Portfolio turnover rate | | 336% |
|
| (a) | Commenced operations on June 1, 2012. |
| (b) | Per share amounts were calculated using average shares for the period. |
| (c) | Total return is a measure of the change in the value of an investment in the Fund over the years covered, which assumes any dividends or capital gains distributions are reinvested in shares of the Fund. Returns shown do not reflect the deduction of taxes a shareholder would pay on Fund distributions or the redemption of Fund shares. |
| (d) | Dividend expense totaled 0.36% of average net assets for the year ended May 31, 2013. |
| (e) | Interest rebate expense and line of credit interest expense totaled 0.13% of average net assets for the year ended May 31, 2013. |
| | |
See Notes to Financial Statements. | | |
| |
78 | | www.arbitragefunds.com | 1-800-295-4485 |
| | |
The Arbitrage Credit Opportunities Fund – Class R | | Financial Highlights |
| |
| | |
Selected Per Share Data and Ratios for a Share Outstanding
Throughout the Period Presented:
| | |
| | | Period Ended
May 31, 2013 (a) |
|
Net asset value, beginning of period | | $10.00 |
| |
Income (loss) from investment operations | | |
Net investment income(b) | | 0.17 |
Net realized and unrealized gains on investments and foreign currencies | | 0.06 |
| | |
Total from investment operations | | 0.23 |
| | |
| |
Less distributions | | |
From net investment income | | (0.05) |
| | |
Total distributions | | (0.05) |
| | |
| Proceeds from redemption fees collected | | 0.00(c) |
| | |
| |
Net asset value, end of period | | $10.18 |
| | |
| | |
| |
Total return(d) | | 2.33%(e) |
| |
| Net assets, end of period (in 000s) | | $1,671 |
| |
| RATIOS TO AVERAGE NET ASSETS: | | |
Expenses including interest and dividend expense | | 3.79%(f) |
Expenses excluding interest and dividend expense(g)(h) | | 3.74%(f) |
Expenses after advisory fees waived and expenses reimbursed excluding interest and dividend expense(g)(h) | | 1.50%(f) |
Net investment income | | 2.49%(f) |
| |
Portfolio turnover rate | | 92%(e) |
|
| (a) | Commenced operations on October 1, 2012. |
| (b) | Per share amounts were calculated using average shares for the period. |
| (c) | Amount rounds to less than $0.01 per share. |
| (d) | Total return is a measure of the change in the value of an investment in the Fund over the years covered, which assumes any dividends or capital gains distributions are reinvested in shares of the Fund. Returns shown do not reflect the deduction of taxes a shareholder would pay on Fund distributions or the redemption of Fund shares. |
| (g) | Dividend expense totaled 0.03% (annualized) of average net assets for the period ended May 31, 2013. |
| (h) | Interest rebate expense totaled 0.02% (annualized) of average net assets for the period ended May 31, 2013. |
| | |
See Notes to Financial Statements. | | |
| |
Annual Report | May 31, 2013 | | 79 |
| | |
The Arbitrage Credit Opportunities Fund – Class I | | Financial Highlights |
| |
| | |
Selected Per Share Data and Ratios for a Share Outstanding
Throughout the Period Presented:
| | |
| | | Period Ended
May 31, 2013 (a) |
|
Net asset value, beginning of period | | $10.00 |
| |
Income (loss) from investment operations | | |
Net investment income(b) | | 0.17 |
Net realized and unrealized gains on investments and foreign currencies | | 0.08 |
| | |
Total from investment operations | | 0.25 |
| | |
| |
Less distributions | | |
From net investment income | | (0.09) |
| | |
Total distributions | | (0.09) |
| | |
| |
Net asset value, end of period | | $10.16 |
| | |
| | |
| |
Total return(c) | | 2.49%(d) |
| |
Net assets, end of period (in 000s) | | $3,462 |
| |
RATIOS TO AVERAGE NET ASSETS: | | |
Expenses including interest and dividend expense | | 3.64%(e) |
Expenses excluding interest and dividend expense(f)(g) | | 3.60%(e) |
Expenses after advisory fees waived and expenses reimbursed excluding interest and dividend expense(f)(g) | | 1.25%(e) |
Net investment income | | 2.62%(e) |
| |
Portfolio turnover rate | | 92%(d) |
|
| (a) | Commenced operations on October 1, 2012. |
| (b) | Per share amounts were calculated using average shares for the period. |
| (c) | Total return is a measure of the change in the value of an investment in the Fund over the years covered, which assumes any dividends or capital gains distributions are reinvested in shares of the Fund. Returns shown do not reflect the deduction of taxes a shareholder would pay on Fund distributions or the redemption of Fund shares. |
| (f) | Dividend expense totaled 0.03% (annualized) of average net assets for the period ended May 31, 2013. |
| (g) | Interest rebate expense totaled 0.01% (annualized) of average net assets for the period ended May 31, 2013. |
| | |
See Notes to Financial Statements. | | |
| |
80 | | www.arbitragefunds.com | 1-800-295-4485 |
| | |
The Arbitrage Credit Opportunities Fund – Class C | | Financial Highlights |
| |
| | |
Selected Per Share Data and Ratios for a Share Outstanding
Throughout the Period Presented:
| | |
| | | Period Ended May 31, 2013 (a) |
|
| Net asset value, beginning of period | | $10.00 |
| |
| Income (loss) from investment operations | | |
Net investment income(b) | | 0.11 |
Net realized and unrealized gains on investments and foreign currencies | | 0.09 |
| | |
Total from investment operations | | 0.20 |
| | |
| |
Less distributions | | |
From net investment income | | (0.03) |
| | |
Total distributions | | (0.03) |
| | |
| |
| Net asset value, end of period | | $10.17 |
| | |
| | |
| |
| Total return(c) | | 2.01%(d) |
| |
| Net assets, end of period (in 000s) | | $26 |
| |
| RATIOS TO AVERAGE NET ASSETS: | | |
Expenses including interest and dividend expense | | 4.69%(e) |
Expenses excluding interest and dividend expense(f)(g) | | 4.64%(e) |
Expenses after advisory fees waived and expenses reimbursed excluding interest and dividend expense(f)(g) | | 2.25%(e) |
Net investment income | | 1.58%(e) |
| |
| Portfolio turnover rate | | 92%(d) |
|
| (a) | Commenced operations on October 1, 2012. |
| (b) | Per share amounts were calculated using average shares for the period. |
| (c) | Total return is a measure of the change in the value of an investment in the Fund over the years covered, which assumes any dividends or capital gains distributions are reinvested in shares of the Fund. Returns shown do not reflect the deduction of taxes a shareholder would pay on Fund distributions or the redemption of Fund shares. |
| (f) | Dividend expense totaled 0.03% (annualized) of average net assets for the period ended May 31, 2013. |
| (g) | Interest rebate expense totaled 0.02% (annualized) of average net assets for the period ended May 31, 2013. |
| | |
See Notes to Financial Statements. | | |
| |
Annual Report | May 31, 2013 | | 81 |
| | |
The Arbitrage Funds | | Notes to Financial Statements |
| |
| | May 31, 2013 |
1. ORGANIZATION
The Arbitrage Funds (the “Trust”) was organized as a Delaware business trust on December 22, 1999, and is registered under the Investment Company Act of 1940, as amended (the “1940 Act”), as an open-end management investment company issuing its shares in series, each series representing a distinct portfolio with its own investment objective and policies. The three series presently authorized are The Arbitrage Fund (the “Arbitrage Fund”), The Arbitrage Event-Driven Fund (the “Event-Driven Fund”) and The Arbitrage Credit Opportunities Fund (“Credit Opportunities Fund”), each a “Fund” and collectively the “Funds”, each a diversified series, which offer three classes of shares. Class R shares, Class I shares and Class C shares of the Arbitrage Fund commenced operations on September 18, 2000, October 17, 2003 and June 1, 2012, respectively. Class R shares, Class I shares and Class C shares of the Event-Driven Fund commenced operations on October 1, 2010, October 1, 2010 and June 1, 2012, respectively. Class R shares, Class I and Class C shares of the Credit Opportunities Fund commenced operations on October 1, 2012.
The investment objective of the Arbitrage Fund seeks to achieve capital growth by engaging in merger arbitrage. The investment objective of the Event-Driven Fund seeks to achieve capital growth by investing in companies that are impacted by corporate events such as mergers, acquisitions, restructurings, recapitalizations, refinancings, reorganizations and other special situations. The investment objective of the Credit Opportunities Fund seeks to provide current income and capital growth by investing in debt securities impacted by events such as reorganizations, restructurings, recapitalizations, debt maturities, refinancings, mergers, acquisitions, regulatory changes and other special situations.
The Funds’ three classes of shares, Class R, Class I and Class C, represent interests in the same portfolio of investments and have the same rights, but differ primarily in the expenses to which they are subject and the investment eligibility requirements. Class R shares and Class C shares are subject to an annual distribution fee of up to 0.25% and 1.00%, respectively, of each Fund’s average daily net assets attributable to Class R shares and Class C shares, respectively, whereas Class I shares are not subject to any distribution fees. Class C shares are also subject to a 1.00% contingent deferred sales charge on all purchases redeemed in 12 months of purchase.
2. SIGNIFICANT ACCOUNTING POLICIES
The following is a summary of significant accounting policies followed by the Funds. These policies are in conformity with U.S. generally accepted accounting principles (“GAAP”).
Use of estimates — The preparation of financial statements in conformity with U.S. generally accepted accounting principles (“GAAP”) requires management to make estimates and assumptions that affect the reported amounts of assets and liabilities at the date of the financial statements and the reported amounts of increases and decreases in net assets from operations during the reporting period. Actual results could differ from those estimates.
Valuation of investments — The Funds’ portfolio securities are valued as of the close of trading of the New York Stock Exchange (“NYSE”) (normally 4:00 p.m., Eastern time). Common stocks and other securities, including open short positions that are traded on a securities exchange, are valued at the last quoted sales price at the close of regular trading on the day the valuation is made. Securities which are quoted by NASDAQ are valued at the NASDAQ Official Closing Price. Price information on listed stocks is taken from the exchange where the security is primarily
| | |
| | | |
82 | | www.arbitragefunds.com | 1-800-295-4485 |
| | |
The Arbitrage Funds | | Notes to Financial Statements (continued) |
| |
| | May 31, 2013 |
traded. Securities which are listed on an exchange but which are not traded on the valuation date are valued at the mean of the most recent bid and asked prices. Put and call options and securities traded in the over-the-counter market are valued at the mean of the most recent bid and asked prices. Unlisted securities for which market quotations are readily available are valued at the latest quoted bid price. Swap contracts that are listed or traded on a national securities exchange, commodities exchange, contract market or comparable over-the-counter market, and that are freely transferable, are valued at their closing settlement price on the exchange on which they are primarily traded or based upon the current settlement price for a like instrument acquired on the day on which the instrument is being valued. Over-the-counter swap contracts for which market quotations are readily available are valued based on quotes received from independent pricing services or one or more dealers that make markets in such securities. Other assets and securities for which no quotations are readily available are valued at fair value as determined in good faith under the supervision of the Board of Trustees of the Trust. Some of the more common reasons that may necessitate that a security be valued at fair value include: the security’s trading has been halted or suspended; the security has been delisted from a national exchange; the security’s primary trading market is temporarily closed at a time when under normal conditions it would be open; or the security’s primary pricing source is not able or willing to provide a price. Such methods of fair valuation may include, but are not limited to: multiple of earnings, multiple of book value, discount from market of a similar freely traded security, purchase price of a security, subsequent private transactions in the security or related securities, or a combination of these and other factors. Foreign securities are translated from the local currency into U.S. dollars using currency exchange rates supplied by a quotation service (see Note 7).
Fair value measurements — In accordance with the authoritative guidance on fair value measurements under GAAP, the Funds disclose fair value of their investments in a hierarchy that prioritizes the inputs to valuation techniques used to measure the fair value. The objective of a fair value measurement is to determine the price that would be received to sell an asset or paid to transfer a liability in an orderly transaction between market participants at the measurement date (an exit price). Accordingly, the fair value hierarchy gives the highest priority to quoted prices (unadjusted) in active markets for identical assets or liabilities (Level 1) and the lowest priority to unobservable inputs (Level 3). The guidance establishes three levels of the fair value hierarchy as follows:
| | | | |
Level 1 | | — | | Unadjusted quoted prices in active markets for identical, unrestricted assets or liabilities that the Funds have the ability to access at the measurement date; |
Level 2 | | — | | Observable inputs other than quoted prices included in Level 1 that are observable (either directly or indirectly) for substantially the full term of the asset or liability; and |
Level 3 | | — | | Unobservable inputs for the asset or liability, to the extent relevant observable inputs are not available, representing each Fund’s own assumption about the assumptions a market participant would use in valuing the asset or liability, and would be based on the best information available. |
Investments are classified within the level of the lowest significant input considered in determining fair value. Investments classified within Level 3, whose fair value measurement considers several inputs, may include Level 1 or Level 2 inputs as components of the overall fair value measurement. The inputs or methodology used for valuing securities are not necessarily an indication of the risk associated with investing in those securities. The Funds recognize transfers between levels as of the beginning of the annual period in which the transfer occurred.
| | |
| | | |
Annual Report | May 31, 2013 | | 83 |
| | |
The Arbitrage Funds | | Notes to Financial Statements (continued) |
| |
| | May 31, 2013 |
For the period ended May 31, 2013, there have been no significant changes to the Funds’ fair value methodologies. Additionally, during the period ended May 31, 2013, there were no transfers between level 1 and 2 securities. Transfers for level 3 securities, if any, are shown as part of the leveling table in the Portfolio of Investments.
Share valuation and redemption fees — The net asset value per share of each class of shares of the Funds is calculated daily by dividing the total value of a Fund’s assets attributable to that class, less liabilities attributable to that class, by the number of shares of that class outstanding. The offering price and redemption price per share of each class of each Fund is equal to the net asset value per share, except that, shares of Class R and Class I are subject to a redemption fee of 2% if redeemed within 30 days for the Arbitrage Fund and Event-Driven Fund and 60 days for the Credit Opportunities Fund from the date of purchase. For the year ended May 31, 2013, proceeds from redemption fees in the Arbitrage Fund were $38,339 in Class R, $28,661 in Class I and $231 in Class C. For the year ended May 31, 2013, proceeds from redemption fees in the Event-Driven Fund were $1,136 in Class R, $15,946 in Class I and $0 in Class C. For the period ended May 31, 2013, proceeds from redemption fees in the Credit Opportunities Fund were $20 in Class R, $0 in Class I and $0 in Class C. The redemption fee is paid directly to each Fund rather than the Adviser and is allocated pro-rata to the shareholders based on net assets.
Security Transactions — Security transactions are accounted for on trade date. Gains and losses on securities sold are determined on a specific identification basis.
Short Positions — The Funds may sell securities short for economic hedging purposes. Subsequent fluctuations in the market prices of securities sold, but not yet purchased, may require purchasing the securities at prices which may differ from the market value reflected on the Portfolio of Investments. The Funds are liable for any dividends payable on securities while those securities are in a short position. As collateral for their short positions, the Funds are required under the 1940 Act to maintain assets consisting of cash, cash equivalents or liquid securities. The amount of the collateral is required to be adjusted daily to reflect changes in the value of the securities sold short. The Funds are charged an interest rebate expense by the prime broker on securities sold short. The interest rebate expense is charged for the duration of time that a security is sold short and is shown on the Statements of Operations.
Derivative Instruments and Hedging Activities — The following discloses the Funds’ use of derivative instruments and hedging activities.
The Funds’ investment objectives not only permit the Funds to purchase investment securities, they also allow certain Funds to enter into various types of derivative contracts, including, but not limited to swap contracts, forward foreign currency exchange contracts, and purchased and written options. In doing so, the Funds will employ strategies in differing combinations to permit them to increase, decrease, or change the level or types of exposure to market factors. Central to those strategies are features inherent to derivatives that make them more attractive for this purpose than equity or debt securities; they require little or no initial cash investment, they can focus exposure on only certain selected risk factors, and they may not require the ultimate receipt or delivery of the underlying security (or securities) to the contract. This may allow the Funds to pursue their objectives more quickly and efficiently than if they were to make direct purchases or sales of securities capable of effecting a similar response to market factors.
| | |
| | | |
84 | | www.arbitragefunds.com | 1-800-295-4485 |
| | |
The Arbitrage Funds | | Notes to Financial Statements (continued) |
| |
| | May 31, 2013 |
Market Risk Factors: In pursuit of their investment objectives, the Funds may seek to use derivatives to increase or decrease their exposure to the following market risk factors:
Equity Risk: Equity risk relates to the change in value of equity securities as they relate to increases or decreases in the general market.
Interest Rate Risk: Interest rate risk refers to the fluctuations in value of fixed-income securities resulting from the inverse relationship between price and yield. For example, an increase in general interest rates will tend to reduce the market value of fixed income investments, and a decline in general interest rates will tend to increase the value of such investments. In addition, debt securities with longer maturities, which tend to have higher yields, are subject to potentially greater fluctuations in value from changes in interest rates than obligations with shorter maturities.
Foreign Exchange Rate Risk: Foreign exchange rate risk relates to the change in the U.S. dollar value of a security held that is denominated in a foreign currency. The value of a foreign currency denominated security will decrease as the dollar appreciates against the currency, while the value of the foreign currency denominated security will increase as the dollar depreciates against the currency.
Risk of Investing in Derivatives: The Funds’ use of derivatives can result in losses due to unanticipated changes in the market risk factors and the overall market. In instances where the Funds are using derivatives to decrease or hedge exposures to market risk factors for securities held by the Funds, there are also risks that those derivatives may not perform as expected, resulting in losses for the combined or hedged positions.
Derivatives may have little or no initial cash investment relative to their market value exposure and therefore can produce significant gains or losses in excess of their cost. This use of embedded leverage allows the Funds to increase their market value exposure relative to their net assets and can substantially increase the volatility of the Funds’ performance.
Additional associated risks from investing in derivatives also exist and potentially could have significant effects on the valuation of the derivative and the Funds. Typically, the associated risks are not the risks that the Funds are attempting to increase or decrease exposure to, per their investment objectives, but are the additional risks from investing in derivatives.
Examples of these associated risks are liquidity risk, which is the risk that the Funds will not be able to sell the derivative in the open market in a timely manner, and counterparty credit risk, which is the risk that the counterparty will not fulfill its obligation to the Funds. Associated risks can be different for each type of derivative and are discussed by each derivative type in the notes that follow.
Option Writing/Purchasing: Certain Funds may write or purchase option contracts to adjust risk and return of their overall investment positions. When a Fund writes or purchases an option, an amount equal to the premium received or paid by the Fund is recorded as a liability or an asset and is subsequently adjusted to the current market value of the option written or purchased. Premiums received or paid from writing or purchasing options that expire unexercised are treated by the Fund on the expiration date as realized gains or losses. The difference between the
| | |
| | | |
Annual Report | May 31, 2013 | | 85 |
| | |
The Arbitrage Funds | | Notes to Financial Statements (continued) |
| |
| | May 31, 2013 |
premium and the amount paid or received on effecting a closing purchase or sale transaction, including brokerage commissions, is also treated as a realized gain or loss. If an option is exercised, the premium paid or received is added to the cost of the purchase or proceeds from the sale in determining whether the Fund has realized a gain or loss on investment transactions. Risks from entering into option transactions arise from the potential inability of counterparties to meet the terms of the contracts, the potential inability to enter into closing transactions because of an illiquid secondary market and from unexpected movements in security values.
A summary of put and call option contracts written in the Arbitrage Fund during the year ended May 31, 2013, is as follows:
| | | | | | | | | | | | | | | | |
| | | Put Contracts | | | Put Premiums | | | Call Contracts | | | Call Premiums | |
| | | | |
Options outstanding at beginning of year | | | 10,025 | | | $ | 600,083 | | | | 85,292 | | | $ | 5,157,617 | |
Options written | | | 303,092 | | | | 11,184,964 | | | | 740,080 | | | | 34,344,193 | |
Options closed | | | (24,904 | ) | | | (2,204,891 | ) | | | (25,195 | ) | | | (2,453,259 | ) |
Options exercised | | | (77,401 | ) | | | (2,534,634 | ) | | | (303,663 | ) | | | (21,443,368 | ) |
Options expired | | | (208,319 | ) | | | (6,904,685 | ) | | | (402,141 | ) | | | (13,138,579 | ) |
| | | | |
Options outstanding at end of year | | | 2,493 | | | $ | 140,837 | | | | 94,373 | | | $ | 2,466,604 | |
| | | | |
|
| A summary of put and call option contracts written in the Event-Driven Fund during the year ended May 31, 2013, is as follows: | |
| | | | |
| | | Put Contracts | | | Put Premiums | | | Call Contracts | | | Call Premiums | |
| | | | |
Options outstanding at beginning of year | | | 432 | | | $ | 33,371 | | | | 1,231 | | | $ | 53,523 | |
Options written | | | 6,451 | | | | 310,353 | | | | 16,774 | | | | 748,203 | |
Options closed | | | (777 | ) | | | (29,710 | ) | | | (1,475 | ) | | | (54,883 | ) |
Options exercised | | | (1,497 | ) | | | (81,183 | ) | | | (6,930 | ) | | | (396,632 | ) |
Options expired | | | (4,318 | ) | | | (207,763 | ) | | | (8,296 | ) | | | (303,302 | ) |
| | | | |
Options outstanding at end of year | | | 291 | | | $ | 25,068 | | | | 1,304 | | | $ | 46,909 | |
| | | | |
|
| A summary of put and call option contracts written in the Credit Opportunities Fund during the period ended May 31, 2013, is as follows: | |
| | | | |
| | | Put Contracts | | | Put Premiums | | | Call Contracts | | | Call Premiums | |
| | | | |
Options outstanding at beginning of period | | | – | | | $ | – | | | | – | | | $ | – | |
Options written | | | 1 | | | | 84 | | | | 1 | | | | 91 | |
Options closed | | | (1 | ) | | | (84 | ) | | | – | | | | – | |
Options exercised | | | – | | | | – | | | | – | | | | – | |
Options expired | | | – | | | | – | | | | (1 | ) | | | (91 | ) |
| | | | |
Options outstanding at end of period | | | – | | | $ | – | | | | – | | | $ | – | |
| | | | |
| | |
| | | |
86 | | www.arbitragefunds.com | 1-800-295-4485 |
| | |
The Arbitrage Funds | | Notes to Financial Statements (continued) |
| |
| | May 31, 2013 |
Foreign currency exchange contracts: The Funds may enter into forward foreign currency exchange contracts as a way of managing foreign exchange rate risk. The Funds may enter into these contracts for the purchase or sale of a specific foreign currency at a fixed price on a future date as a hedge or cross-hedge against either specific transactions or portfolio positions. The objective of the Funds’ foreign currency hedging transactions is to reduce risk that the U.S. dollar value of the Funds’ securities denominated in foreign currency will decline in value due to changes in foreign currency exchange rates.
Warrants and Rights: The Funds may invest in warrants. A Fund may purchase warrants issued by domestic and foreign companies to purchase newly created equity securities consisting of common and preferred stock. Warrants are securities that give the holder the right, but not the obligation to purchase equity issues of the company issuing the warrants, or a related company, at a fixed price either on a date certain or during a set period. The equity security underlying a warrant is authorized at the time the warrant is issued or is issued together with the warrant.
Investing in warrants can provide a greater potential for profit or loss than an equivalent investment in the underlying security, and, thus, can be a speculative investment. At the time of issue, the cost of a warrant is substantially less than the cost of the underlying security itself, and price movements in the underlying security are generally magnified in the price movements of the warrant. This leveraging effect enables the investor to gain exposure to the underlying security with a relatively low capital investment. This leveraging increases an investor’s risk, however, in the event of a decline in the value of the underlying security, a complete loss of the amount invested in the warrant may result. In addition, the price of a warrant tends to be more volatile than, and may not correlate exactly to, the price of the underlying security. If the market price of the underlying security is below the exercise price of the warrant on its expiration date, the warrant will generally expire without value. The value of a warrant may decline because of a decline in the value of the underlying security, the passage of time, changes in interest rates or in the dividend or other policies of the company whose equity underlies the warrant or a change in the perception as to the future price of the underlying security, or any combination thereof. Warrants generally pay no dividends and confer no voting or other rights other than to purchase the underlying security.
Equity swap contracts: The Funds may invest in swaps for the purpose of managing exposure to interest rate, credit or market risk. Additionally, the Funds enter into equity swap agreements for the purpose of attempting to obtain a desired return on, or exposure to, certain equity securities or equity indices in an expedited manner or at a lower cost to the Funds than if the Funds had invested directly in such securities. An equity swap contract entitles the Funds to receive from the counterparty any appreciation and dividends paid on an individual security, while obligating the Funds to pay the counterparty any depreciation on the security. Fluctuations in the value of an open contract are recorded daily as a net unrealized gain or loss. The Funds will realize a gain or loss upon termination or reset of the contract. Either party, under certain conditions, may terminate the contract prior to the contract’s expiration date. Collateral, in the form of cash or securities, may be required to be held in segregated accounts with the Funds’ custodian and/or counterparty’s broker. Risks may exceed amounts recognized on the Statements of Assets and Liabilities. These risks include changes in the returns of the underlying instruments, failure of the counterparties to perform under the contracts’ terms and the possible lack of liquidity with respect to the swap agreements.
| | |
| | | |
Annual Report | May 31, 2013 | | 87 |
| | |
The Arbitrage Funds | | Notes to Financial Statements (continued) |
| |
| | May 31, 2013 |
Whether a Fund’s use of swap agreements will be successful in furthering its investment objective will depend on Management’s ability to correctly predict whether certain types of investments are likely to produce greater returns than other investments. Because they are two-party contracts and because they may have terms of greater than seven days, swap agreements may be considered to be illiquid investments. Moreover, a Fund bears the risk of loss of the amount expected to be received under a swap agreement in the event of the default or bankruptcy of a swap agreement counterparty. A Fund will enter into swap agreements only with counterparties that meet certain standards for creditworthiness (generally, such counterparties would have to be eligible counterparties under the terms of the Fund’s repurchase agreement guidelines).
International Swaps and Derivatives Association, Inc. Master Agreements (“ISDA Master Agreements”) govern OTC financial derivative transactions entered into by a Fund and those counterparties. The ISDA Master Agreements maintain provisions for general obligations, representations, agreements, collateral and events of default or termination. Events of termination include conditions that may entitle counterparties to elect to terminate early and cause settlement of all outstanding transactions under the applicable ISDA Master Agreement. Pursuant to the Funds’ derivative ISDA Master Agreements, the Funds are required to maintain sufficient collateral or maintain a predetermined level of net assets. Any election to terminate early could be material to the financial statements. The values of all derivative instruments with credit-risk-related contingent features that are in a net liability position at May 31, 2013, in the tables below exclude the effects of cash collateral received or posted pursuant to these derivative contracts and, therefore, are not representative of the Funds’ net exposure.
Fair Value of Derivative Instruments — Fair values of derivatives presented in the financial statements are not netted with the fair value of other derivatives or with any collateral amounts posted by the Funds or any counterparty. The fair value of derivative instruments for the Funds as of May 31, 2013, was as follows:
| | | | | | | | | | |
Derivatives Not Accounted For As Hedging Instruments | | Asset Derivatives Statement of Assets and Liabilities Location | | Fair Value | | Liability Derivatives Statement of Assets and Liabilities Location | | Fair Value | |
| |
Arbitrage Fund | | | | | | | | | | |
Foreign Currency Contracts | | Unrealized appreciation on forward foreign currency exchange contracts | | $ 7,430,071 | | Unrealized depreciation on forward foreign currency exchange contracts | | $ | 689,522 | |
Equity Contracts
(swap contracts) | | Unrealized appreciation on equity swap contracts | | 2,084,404 | | Unrealized depreciation on equity swap contracts | | | 994,134 | |
Equity Contracts
(rights) | | Investments: at value | | 0 | | | | | | |
| | |
| | | |
88 | | www.arbitragefunds.com | 1-800-295-4485 |
| | |
The Arbitrage Funds | | Notes to Financial Statements (continued) |
| |
| | May 31, 2013 |
| | | | | | | | | | | | |
Derivatives Not Accounted For As Hedging Instruments | | Asset Derivatives Statement of Assets and Liabilities Location | | Fair Value | | | Liability Derivatives Statement of Assets and Liabilities Location | | Fair Value | |
| |
Arbitrage Fund | | | | | | | | | | | | |
Equity Contracts
(purchased option contracts) | | Investments: at value | | $ | 4,005,368 | | | | | | | |
Equity Contracts | | | | | | | | | | | | |
(written option contracts) | | | | | | | | Written options, at value | | $ | 6,220,546 | |
| | | | | | | | | | | | |
| | | | $ | 13,519,843 | | | | | $ | 7,904,202 | |
| | | | | | | | | | | | |
| | | | |
Derivatives Not Accounted For As Hedging Instruments | | Asset Derivatives Statement of Assets and Liabilities Location | | Fair Value | | | Liability Derivatives Statement of Assets and Liabilities Location | | Fair Value | |
| |
Event-Driven Fund | | | | | | | | | | | | |
Foreign currency contracts | | Unrealized appreciation on forward foreign currency exchange contracts | | $ | 132,649 | | | Unrealized depreciation on forward foreign currency exchange contracts | | $ | 12,961 | |
Equity Contracts
(swap contracts) | | Unrealized appreciation on equity swap contracts | | | 24,368 | | | Unrealized depreciation on equity swap contracts | | | 6,137 | |
Equity Contracts
(rights) | | Investments: at value | | | 0 | | | | | | | |
Equity Contracts
(purchased option contracts) | | Investments: at value | | | 73,842 | | | | | | | |
Equity Contracts | | | | | | | | | | | | |
(written option contracts) | | | | | | | | Written options, at value | | | 113,016 | |
| | | | | | | | | | | | |
| | | | $ | 230,859 | | | | | $ | 132,114 | |
| | | | | | | | | | | | |
| | |
| | | |
Annual Report | May 31, 2013 | | 89 |
| | |
The Arbitrage Funds | | Notes to Financial Statements (continued) |
| |
| | May 31, 2013 |
| | | | | | | | | | | | |
Derivatives Not Accounted For As Hedging Instruments | | Asset Derivatives Statement of Assets and Liabilities Location | | Fair Value | | | Liability Derivatives Statement of Assets and Liabilities Location | | Fair Value | |
| |
Credit Opportunities Fund | | | | | | | | | | | | |
Foreign currency contracts | | Unrealized appreciation on forward foreign currency exchange contracts | | $ | 2,880 | | | Unrealized depreciation on forward foreign currency exchange contracts | | $ | 7 | |
| | | | | | | | | | | | |
| | | | $ | 2,880 | | | | | $ | 7 | |
| | | | | | | | | | | | |
|
The effect of derivative instruments on the Funds’ Statement of Operations for the period ended May 31, 2013, was as follows: | |
| | | | | | | | | | |
Derivatives Not Accounted For As Hedging Instruments | | Location Of Gains/(Loss) On Derivatives Recognized In Income | | Realized Gain/(Loss) On Derivatives
Recognized In
Income | | | Changed In
Unrealized
Gain/(Loss) On
Derivatives
Recognized In
Income | |
| |
Arbitrage Fund | | | | | | | | | | |
Foreign Currency Contracts | | Net realized gains (losses) from: Foreign currency transactions / Net change in unrealized appreciation (depreciation) on: Foreign currency transactions | | $ | 4,716,290 | | | | $ (16,984,074 | ) |
Equity Contracts
(swap contracts) | | Net realized gains (losses) from: Equity swap contracts / Net change in unrealized appreciation (depreciation) on: Equity swap contracts | | | (23,836,056 | ) | | | 17,741,943 | |
Equity Contracts Long
(rights and warrants) | | Net realized gains (losses) from: Investments / Net change in unrealized appreciation (depreciation) on: Investments | | | 334,679 | | | | (1,673,397 | ) |
Equity Contracts Short
(rights and warrants) | | Net realized gains (losses) from: Investments / Net change in unrealized appreciation (depreciation) on: Securities sold short | | | 585,351 | | | | 748,287 | |
| | |
| | | |
90 | | www.arbitragefunds.com | 1-800-295-4485 |
| | |
The Arbitrage Funds | | Notes to Financial Statements (continued) |
| |
| | May 31, 2013 |
| | | | | | | | | | |
Derivatives Not Accounted For As Hedging Instruments | | Location Of Gains/(Loss) On Derivatives Recognized In Income | | Realized Gain/(Loss) On
Derivatives
Recognized In
Income | | | Changed In
Unrealized
Gain/(Loss) On
Derivatives
Recognized In
Income | |
| |
Arbitrage Fund | | | | | | | | | | |
Equity Contracts (purchased option contracts) | | Net realized gains (losses) from: Investments / Net change in unrealized appreciation (depreciation) on: Investments | | $ | (23,473,887 | ) | | $ | 558,737 | |
Equity Contracts (written option contracts) | | Net realized gains (losses) from: Written option contracts / Net change in unrealized appreciation (depreciation) on: Written option contracts | | | 19,279,647 | | | | (5,734,824 | ) |
| | | | | | |
| | | | $ | (22,393,976 | ) | | $ | (5,343,328 | ) |
| | | | | | |
| | | |
Derivatives Not Accounted For As Hedging Instruments | | Location Of Gains/(Loss) On Derivatives Recognized In Income | | Realized Gain/(Loss) On
Derivatives
Recognized In
Income | | | Changed In
Unrealized
Gain/(Loss) On
Derivatives
Recognized In
Income | |
| |
Event-Driven Fund | | | | | | | | | | |
Foreign Currency Contracts | | Net realized gains (losses) from: Foreign currency transactions / Net change in unrealized appreciation (depreciation) on: Foreign currency transactions | | $ | 95,013 | | | $ | (99,564 | ) |
Equity Contracts
(swap contracts) | | Net realized gains (losses) from: Equity swap contracts / Net change in unrealized appreciation (depreciation) on: Equity swap contracts | | | (412,016 | ) | | | 189,627 | |
Equity Contracts Long
(rights and warrants) | | Net realized gains (losses) from: Investments / Net change in unrealized appreciation (depreciation) on: Investments | | | 2,426 | | | | (12,131 | ) |
Equity Contracts Short
(rights and warrants) | | Net realized gains (losses) from: Investments / Net change in unrealized appreciation (depreciation) on: Securities sold short | | | 778 | | | | 8,863 | |
Equity Contracts
(purchased option contracts) | | Net realized gains (losses) from: Investments /Net change in unrealized appreciation (depreciation) on: Investments | | | (1,103,191 | ) | | | (25,732 | ) |
| | |
| | | |
Annual Report | May 31, 2013 | | 91 |
| | |
The Arbitrage Funds | | Notes to Financial Statements (continued) |
| |
| | May 31, 2013 |
| | | | | | | | | | |
Derivatives Not Accounted For As Hedging Instruments | | Location Of Gains/(Loss) On Derivatives Recognized In Income | | Realized
Gain/(Loss) On
Derivatives
Recognized In
Income | | | Changed In
Unrealized
Gain/(Loss) On
Derivatives
Recognized In
Income | |
| |
Event-Driven Fund | | | | | | | | | | |
Equity Contracts
(written option contracts) | | Net realized gains (losses) from: Written option contracts / Net change in unrealized appreciation (depreciation) on: Written option contracts | | $ | 535,188 | | | $ | (79,784 | ) |
| | | | | | |
| | | | $ | (881,802 | ) | | $ | (18,721 | ) |
| | | | | | |
| | | |
Derivatives Not Accounted For As Hedging Instruments | | Location Of Gains/(Loss) On Derivatives Recognized In Income | | Realized Gain/(Loss) On
Derivatives
Recognized In
Income | | | Changed In
Unrealized
Gain/(Loss) On
Derivatives
Recognized In
Income | |
| |
Credit Opportunities Fund | | | | | | | | | | |
Foreign currency contracts | | Net realized gains (losses) from: Foreign currency transactions / Net change in unrealized appreciation (depreciation) on: Foreign currency transactions | | $ | 1,049 | | | $ | 2,873 | |
Equity Contracts
(written option contracts) | | Net realized gains (losses) from: Written option contracts / Net change in unrealized appreciation (depreciation) on: Written option contracts | | | 91 | | | | – | |
| | | | | | |
| | | | $ | 1,140 | | | $ | 2,873 | |
| | | | | | |
Volume of Derivative Instruments for the Funds during the period ended May 31, 2013 was as follows:
| | | | | | |
| Derivative Type | | Unit of Measurement | | Monthly Average | |
| |
Arbitrage Fund | | | | | | |
Equity Swap Contracts | | Notional Quantity | | | 143,582,199 | |
Forward Foreign Currency Exchange Contracts | | Net Contracts to Deliver/Receive | | | (7,165,778,863 | ) |
Purchased Option Contracts | | Contracts | | | 45,859 | |
Rights | | Shares | | | 824,408 | |
Written Option Contracts | | Contracts | | | (105,499 | ) |
| | |
| | | |
92 | | www.arbitragefunds.com | 1-800-295-4485 |
| | |
The Arbitrage Funds | | Notes to Financial Statements (continued) |
| |
| | May 31, 2013 |
| | | | | | |
| Derivative Type | | Unit of Measurement | | Monthly Average | |
| |
Event-Driven Fund | | | | | | |
Equity Swap Contracts | | Notional Quantity | | | 1,965,383 | |
Forward Foreign Currency Exchange Contracts | | Net Contracts to Deliver/Receive | | | (29,989,867 | ) |
Purchased Option Contracts | | Contracts | | | 1,424 | |
Rights | | Shares | | | 35,332 | |
Written Option Contracts | | Contracts | | | (2,017 | ) |
| | |
| Derivative Type | | Unit of Measurement | | Monthly Average | |
| |
Credit Opportunities Fund | | | | | | |
Forward Foreign Currency Exchange Contracts | | Net Contracts to Deliver/Receive | | | (114,000 | ) |
Written Option Contracts | | Contracts | | | 0 | |
Investment income — Interest income and interest rebate expense is accrued as earned. Dividend income and expense are recorded on the ex-dividend date, net of any non-reclaimable tax withholdings.
Dividends and distributions to shareholders — Dividends arising from net investment income and net capital gain distributions, if any, are declared and paid at least annually to shareholders of the Arbitrage Fund and Event-Driven Fund. Dividends arising from net investment income, if any, are declared and paid quarterly, and net capital gain distributions, if any, are declared and paid at least annually to shareholders of the Credit Opportunities Fund.
Allocation between classes — Investment income earned, realized capital gains and losses, and unrealized appreciation and depreciation are allocated daily to each class of shares based upon the proportionate shares of total net assets of each Fund. Class specific expenses are charged directly to the class incurring the expense. Common expenses which are not attributable to a specific class are allocated daily to each class of shares based upon the proportionate share of total net assets of each Fund.
Offering costs — Offering costs, including costs of printing initial prospectuses, legal and registration fees, have been amortized over twelve months from the inception date of the Credit Opportunities Fund. As of May 31, 2013, the offering costs remaining to be amortized are $9,778, which are included in prepaid expenses and other assets.
Federal income tax — It is the Funds’ policy to continue to comply with the special provisions of Subchapter M of the Internal Revenue Code of 1986, as amended, applicable to regulated investment companies. As provided therein, in any fiscal year in which a fund so qualifies and distributes at least 90% of its taxable net income, a fund (but not the shareholders) will be relieved of Federal income tax on the income distributed. Accordingly, no provision for income taxes has been made.
As of and during the period ended May 31, 2013, the Funds did not have a liability for any unrecognized tax benefits. The Funds file U.S. federal, state, and local tax returns as required. The Funds’ tax returns are subject to examination by the relevant tax authorities until expiration of the applicable statute of limitations which is generally three years after the filing of the tax return. Tax returns for open years have incorporated no uncertain tax positions that require a provision for income taxes.
| | |
| | | |
Annual Report | May 31, 2013 | | 93 |
| | |
The Arbitrage Funds | | Notes to Financial Statements (continued) |
| |
| | May 31, 2013 |
3. INVESTMENT TRANSACTIONS
During the period ended May 31, 2013 for the Arbitrage Fund, the Event-Driven Fund, and the Credit Opportunities Fund, cost of purchases and proceeds from sales and maturities of investment securities, other than short-term investments, U.S. government securities, equity swap contracts, purchased and written option contracts and securities sold short, were as follows:
| | | | | | | | | | | | |
| | | Arbitrage Fund | | | Event-Driven Fund | | | Credit Opportunities
Fund | |
Purchases | | $ | 11,194,980,893 | | | $ | 152,786,876 | | | $ | 7,249,457 | |
Sales and Maturities | | | 11,073,068,577 | | | | 139,413,120 | | | | 2,561,871 | |
4. LINE OF CREDIT
The Trust, on behalf of the Funds, entered into an agreement which enables the Funds to participate in a $300,000,000 unsecured committed revolving line of credit with State Street Bank and Trust Company (the “Custodian”). Borrowings will be made solely to temporarily finance the purchase or sale of securities or to finance the redemption of the shares of an investor of the Funds. Interest is charged to the Funds based on their borrowings at a rate per annum of the higher of the LIBOR rate plus 1.25% and the overnight federal funds rate plus 1.25%. In addition, a commitment fee of 0.11% per annum is payable at the end of each calendar quarter. The Trust accrues, on behalf of each of the Funds, the commitment fee on the unused portion of the line of credit. Such fees are included in custodian and bank service fees on the Statements of Operations.
As of and for the year ended May 31, 2013, the Arbitrage Fund had no borrowings. Interest expense of $0 and commitment fees of $314,381 accrued under the line of credit for the Arbitrage Fund during the year ended May 31, 2013 and are included in line of credit interest expense on the Arbitrage Fund’s Statement of Operations.
The Event-Driven Fund did not have outstanding borrowings at May 31, 2013. For the year ended May 31, 2013, the Event-Driven Fund had average borrowings of $1,815,126 over a period of 119 days at a weighted average interest rate of 1.432%. Interest expense on the line of credit for the Event-Driven Fund during the year ended May 31, 2013 is shown as line of credit interest expense on the Event-Driven Fund’s Statement of Operations.
For the period ended May 31, 2013, the Credit Opportunities Fund had no borrowings.
5. ADVISORY FEES, ADMINISTRATION FEES AND OTHER AGREEMENTS
Investment Advisory Agreement
The Funds’ investments are managed by Water Island Capital, LLC (the “Adviser”) under the terms of Investment Advisory Agreements. Under the Investment Advisory Agreement between the Adviser and the Arbitrage Fund, as amended and restated on October 1, 2007, the Arbitrage Fund pays the Adviser an annual fee, which is computed and accrued daily and paid monthly, of 1.25% on the first $250 million, 1.20% on the next $50 million, 1.15% on the next $50 million, 1.10% on the next $75 million, 1.05% on the next $75 million and 1.00% for amounts over $500 million, based on the Arbitrage Fund’s average daily net assets. Under the Investment Advisory Agreement
| | |
| | | |
94 | | www.arbitragefunds.com | 1-800-295-4485 |
| | |
The Arbitrage Funds | | Notes to Financial Statements (continued) |
| |
| | May 31, 2013 |
between the Adviser and the Event-Driven Fund dated September 27, 2010, the Event-Driven Fund pays the Adviser an annual fee, which is computed and accrued daily and paid monthly, of 1.25% based on the Event-Driven Fund’s average daily net assets. Under the Investment Advisory Agreement between the Adviser and the Credit Opportunities Fund dated October 1, 2012, the Credit Opportunities Fund pays the Adviser an annual fee, which is computed and accrued daily and paid monthly, of 1.00% based on the Credit Opportunities Fund’s average daily net assets.
The Adviser has contractually agreed, at least until August 31, 2015, to waive its advisory fee and/or reimburse the Funds’ other expenses to the extent that total operating expenses (exclusive of interest, taxes, dividends on short positions, brokerage commissions, acquired fund fees and expenses and other costs incurred in connection with the purchase or sale of portfolio securities) exceed the annual rate of the Funds’ average daily net assets attributable to each share class as shown in the table below:
| | | | | | |
| | | Arbitrage Fund | | Event-Driven Fund | | Credit Opportunities Fund |
Class R | | 1.69% | | 1.69% | | 1.50% |
Class I | | 1.44% | | 1.44% | | 1.25% |
Class C | | 2.44% | | 2.44% | | 2.25% |
The Adviser is permitted to recapture fees waived and expenses reimbursed to the extent actual fees and expenses for a period are less than the expense limitation of each class, provided, however, that the Adviser shall only be entitled to recapture such amounts for a period of three years from the end of the fiscal year during which such amount was waived or reimbursed. The Adviser can recapture any fees it has waived within the three-year period subject to the applicable annual rate of: 1.69% for Class R shares, 1.44% for Class I shares and 2.44% for Class C shares for Event-Driven Fund and 1.50% for Class R shares, 1.25% for Class I shares and 2.25% for Class C shares for Credit Opportunities Fund, respectively.
As of May 31, 2013, the balances of future recapture for each Fund were as follows:
| | | | | | | | | | | | |
| | | Expiring
May 31, 2015 | | | Expiring
May 31, 2016 | | | Total | |
Event-Driven Fund | | | | | | | | | | | | |
Class R | | $ | 37,027 | | | $ | 30,441 | | | $ | 67,468 | |
Class I | | $ | 78,860 | | | $ | 127,460 | | | $ | 206,320 | |
Class C | | $ | N/A | | | $ | 620 | | | $ | 620 | |
Credit Opportunities Fund | | | | | | | | | | | | |
Class R | | | N/A | | | $ | 22,353 | | | $ | 22,353 | |
Class I | | | N/A | | | $ | 51,089 | | | $ | 51,089 | |
Class C | | | N/A | | | $ | 399 | | | $ | 399 | |
There were no amounts recaptured during the period ended May 31, 2013 for the Funds.
Certain officers of the Trust are also officers of the Adviser. The Vice President of the Trust also serves as Chief Compliance Officer (“CCO”) of the Trust and of the Adviser. The Funds pay the Adviser 60% of the CCO’s salary for providing CCO services.
| | |
| | |
| |
Annual Report | May 31, 2013 | | 95 |
| | |
The Arbitrage Funds | | Notes to Financial Statements (continued) |
| |
| | May 31, 2013 |
Administration Agreement
ALPS Fund Services, Inc. (“ALPS” and the “Administrator”) serves as the Trust’s administrator pursuant to an Administration, Bookkeeping and Pricing Services Agreement (“Administration Agreement”) with the Trust. As compensation for its services to the Trust, ALPS receives an annual administration fee based on the annual minimum fee of $370,000. Prior to October 1, 2012, the annual minimum fee was $300,000. The Administrator is also reimbursed by the Trust for certain out-of-pocket expenses. Certain officers of the Trust are also officers of the Administrator.
Distribution Agreement
ALPS Distributors, Inc. (the “Distributor”) serves as the Funds’ distributors. The Distributor acts as an agent for the Funds and the distributor of their shares.
The Funds have adopted, with respect to its Class R and Class C shares, a plan of distribution pursuant to Rule 12b-1 under the 1940 Act which permits each Fund to pay for expenses incurred in the distribution and promotion of the Funds’ Class R shares and Class C shares and for services provided to shareholders. The Plan is a “reimbursement” plan. This means that a Fund’s Class R shares and Class C shares only pay a particular 12b-1 fee to the extent that the Adviser, the Distributor or others have incurred expenses in the promotion and distribution of the shares, including but not limited to, the printing of prospectuses and reports used for sales purposes, expenses of preparation of sales literature and related expenses, advertisements, and other distribution-related expenses, as well as any distribution fees paid to securities dealers or others. Under the distribution plan, a Fund may pay compensation to any broker-dealer with whom the Distributor or the Funds has entered into a contract to distribute Class R shares or Class C shares, or to any other qualified financial services firm, for distribution and/or shareholder-related services with respect to shares held or purchased by their respective customers or in connection with the purchase of shares attributable to their efforts. The amount of payments under the Plan in any year shall not exceed 0.25% for Class R shares and 0.75% for Class C shares, respectively, annually of the average daily net assets allocable to a Fund’s Class R shares and Class C shares, respectively. In addition, the Plan permits each Fund to make payments at an annual rate of up to 0.25% of the Fund’s Class C shares for expenses incurred in connection with the provision of shareholder support or administrative services for the Fund’s Class C shares. During the year ended May 31, 2013, The Arbitrage Fund’s Class R shares incurred $2,492,556 and Class C shares incurred $69,228, respectively, in distribution expenses for Class R shares and distribution and shareholder support expenses for Class C shares, all of which was used to compensate broker-dealers. With respect to the Event-Driven Fund, during the year ended May 31, 2013, the Event-Driven Fund’s Class R shares incurred $20,326 and Class C shares incurred $1,593, respectively, in distribution expenses for Class R shares and distribution and shareholder support expenses for Class C shares, all of which was used to compensate broker-dealers. With respect to the Credit Opportunities Fund, during the period ended May 31, 2013, the Credit Opportunities Fund’s Class R shares incurred $2,497 and Class C shares incurred $167, respectively, in distribution expenses for Class R shares and distribution and shareholder support expenses for Class C shares, all of which was used to compensate broker-dealers.
Principal Financial Officer
ALPS receives an annual fee of $10,000 for providing Principal Financial Officer (“PFO”) services to the Trust. ALPS is compensated by the trust under the PFO Services Agreement.
| | |
| | |
| |
96 | | www.arbitragefunds.com | 1-800-295-4485 |
| | |
The Arbitrage Funds | | Notes to Financial Statements (continued) |
| |
| | May 31, 2013 |
Transfer Agent And Shareholder Services Agreement
DST Systems, Inc. (“DST”) maintains the records of each shareholder’s account, answers shareholders’ inquiries concerning their accounts, processes purchases and redemptions of the Funds shares, acts as dividend and distribution disbursing agent and performs other shareholder service functions.
Under the terms of the amended Transfer Agent and Shareholder Services Agreement between the Trust and DST, DST receives from the Funds a monthly complex minimum fee, including four cusips (i.e., an individual share class), at an annual rate of $67,795 per year. For each cusip thereafter, an additional fee is applied at a minimum fee of $10,430 per cusip per year. There were five additional cusips for the year ended May 31, 2013. In addition, the Funds pay out-of-pocket expenses, including but not limited to, postage, envelopes, checks, drafts, forms, reports, telephone services, record storage and communication lines. These out-of-pocket expenses are included in transfer agent fees on the Funds Statement of Operations.
| | |
| | | |
Annual Report | May 31, 2013 | | 97 |
| | |
The Arbitrage Funds | | Notes to Financial Statements (continued) |
| |
| | May 31, 2013 |
6. CAPITAL SHARE TRANSACTIONS
Proceeds and payments on capital shares as shown in the Statements of Changes in Net Assets are the result of the following capital share transactions for the periods shown:
| | | | | | | | |
| | | Year Ended May 31, 2013 | | | Year Ended May 31, 2012 | |
Arbitrage Fund - Class R | | | | | | | | |
| |
Shares sold | | | 31,786,403 | | | | 51,063,016 | |
Shares issued in reinvestment of dividends | | | 2,177,472 | | | | 1,802,971 | |
Shares redeemed | | | (39,071,802) | | | | (42,289,064) | |
| | | | |
Net increase/(decrease) in shares outstanding | | | (5,107,927) | | | | 10,576,923 | |
| | | | |
Shares outstanding at beginning of period | | | 78,437,528 | | | | 67,860,605 | |
| | | | |
Shares outstanding at end of period | | | 73,329,601 | | | | 78,437,528 | |
| | | | |
| | | | |
Arbitrage Fund - Class I | | | | | | | | |
| |
Shares sold | | | 73,503,353 | | | | 90,987,731 | |
Shares issued in reinvestment of dividends | | | 2,674,069 | | | | 1,607,830 | |
Shares redeemed | | | (84,020,838) | | | | (36,469,014) | |
| | | | |
Net increase/(decrease) in shares outstanding | | | (7,843,416) | | | | 56,126,547 | |
| | | | |
Shares outstanding at beginning of period | | | 159,914,734 | | | | 103,788,187 | |
| | | | |
Shares outstanding at end of period | | | 152,071,318 | | | | 159,914,734 | |
| | | | |
| | | | |
Arbitrage Fund - Class C (a) | | | | | | | | |
| |
Shares sold | | | 1,567,850 | | | | – | |
Shares issued in reinvestment of dividends | | | 13,063 | | | | – | |
Shares redeemed | | | (67,176) | | | | – | |
| | | | |
Net increase in shares outstanding | | | 1,513,737 | | | | – | |
| | | | |
Shares outstanding at beginning of period | | | – | | | | – | |
| | | | |
Shares outstanding at end of period | | | 1,513,737 | | | | – | |
| | | | |
| | | | |
Event-Driven Fund - Class R | | | | | | | | |
| |
Shares sold | | | 696,518 | | | | 878,057 | |
Shares issued in reinvestment of dividends | | | 17,016 | | | | 47,344 | |
Shares redeemed | | | (602,065) | | | | (483,842) | |
| | | | |
Net increase in shares outstanding | | | 111,469 | | | | 441,559 | |
| | | | |
Shares outstanding at beginning of period | | | 917,292 | | | | 475,733 | |
| | | | |
Shares outstanding at end of period | | | 1,028,761 | | | | 917,292 | |
| | | | |
| | | | |
Event-Driven Fund - Class I | | | | | | | | |
| |
Shares sold | | | 3,921,901 | | | | 1,541,957 | |
Shares issued in reinvestment of dividends | | | 65,105 | | | | 83,596 | |
Shares redeemed | | | (1,956,757) | | | | (589,183) | |
| | | | |
Net increase in shares outstanding | | | 2,030,249 | | | | 1,036,370 | |
| | | | |
Shares outstanding at beginning of period | | | 2,178,615 | | | | 1,142,245 | |
| | | | |
Shares outstanding at end of period | | | 4,208,864 | | | | 2,178,615 | |
| | | | |
| | | | |
Event-Driven Fund - Class C (a) | | | | | | | | |
| |
Shares sold | | | 35,656 | | | | – | |
Shares issued in reinvestment of dividends | | | 309 | | | | – | |
Shares redeemed | | | (1,026) | | | | – | |
| | | | |
Net increase in shares outstanding | | | 34,939 | | | | – | |
| | | | |
Shares outstanding at beginning of period | | | – | | | | – | |
| | | | |
Shares outstanding at end of period | | | 34,939 | | | | – | |
| | | | |
| | | | |
(a) Commenced operations on June 1, 2012.
| | |
| | | |
98 | | www.arbitragefunds.com | 1-800-295-4485 |
| | |
The Arbitrage Funds | | Notes to Financial Statements (continued) |
| |
| | May 31, 2013 |
| | | | |
| | | Period Ended May 31, 2013 (b) | |
Credit Opportunities Fund - Class R | | | | |
| |
Shares sold | | | 170,405 | |
Shares issued in reinvestment of dividends | | | 786 | |
Shares redeemed | | | (7,026) | |
| | | | |
Net increase in shares outstanding | | | 164,165 | |
| | | | |
Shares outstanding at beginning of period | | | – | |
| | | | |
Shares outstanding at end of period | | | 164,165 | |
| | | | |
| | | | |
Credit Opportunities Fund - Class I | | | | |
| |
Shares sold | | | 339,129 | |
Shares issued in reinvestment of dividends | | | 1,700 | |
| | | | |
Net increase in shares outstanding | | | 340,829 | |
| | | | |
Shares outstanding at beginning of period | | | – | |
| | | | |
Shares outstanding at end of period | | | 340,829 | |
| | | | |
| | | | |
Credit Opportunities Fund - Class C | | | | |
| |
Shares sold | | | 2,510 | |
Shares issued in reinvestment of dividends | | | 8 | |
| | | | |
Net increase in shares outstanding | | | 2,518 | |
| | | | |
Shares outstanding at beginning of period | | | – | |
| | | | |
Shares outstanding at end of period | | | 2,518 | |
| | | | |
| | | | |
(b) Commenced operations on October 1, 2012.
7. FOREIGN CURRENCY TRANSLATION
Amounts denominated in or expected to settle in foreign currencies are translated to U.S. dollars based on exchange rates on the following basis:
A. The market values of investment securities and other assets and liabilities are translated at the closing rate of exchange each day.
B. Purchases and sales of investment securities and income and expenses are translated at the rate of exchange prevailing on the respective dates of such transactions.
C. The Funds do not isolate that portion of the results of operations caused by changes in foreign exchange rates on investments from those caused by changes in market prices of securities held. Such fluctuations are included with the net realized and unrealized gains or losses on investments. Reported net realized foreign exchange gains or losses arise from 1) purchases and sales of foreign currencies; 2) currency gains or losses realized between the trade and settlement dates on securities transactions; and 3) the difference between the amounts of dividends, interest and foreign withholding taxes recorded on the Funds’ books, and the U.S. dollar equivalent of the amounts actually received or paid. Reported net unrealized foreign exchange gains and losses arise from changes in the value of assets and liabilities, other than investment securities, resulting from changes in exchange rates.
| | |
| | | |
Annual Report | May 31, 2013 | | 99 |
| | |
The Arbitrage Funds | | Notes to Financial Statements (continued) |
| |
| | May 31, 2013 |
8. CONTINGENCIES AND COMMITMENTS
The Funds indemnify the Trust’s officers and trustees for certain liabilities that might arise from their performance of their duties to the Funds. Additionally, in the normal course of business the Funds enter into contracts that contain a variety of representations and warranties and which provide general indemnifications. The Funds’ maximum exposure under these arrangements is unknown, as this would involve future claims that may be made against the Funds that have not yet occurred. However, based on experience, the Funds expect the risk of loss to be remote.
9. SECURITIES LENDING
In order to generate additional income, the Funds may, from time to time, lend portfolio securities to broker-dealers, banks or institutional borrowers of securities. The Funds must receive 100% collateral in the form of cash or U.S. government securities. This collateral must be valued daily and, should the market value of the loaned securities increase, the borrower must furnish additional collateral to the Funds. During the time portfolio securities are on loan, the borrower pays the Funds any dividends or interest paid on such securities.
Loans are subject to termination by the Funds or the borrower at any time. While the Funds do not have the right to vote securities on loan, they have the right to terminate the loan and regain the right to vote if that is considered important with respect to the investment. In the event the borrower defaults in its obligation to the Funds, the Funds bear the risk of delay in the recovery of portfolio securities and the risk of loss of rights in the collateral. The Funds will only enter into loan arrangements with broker-dealers, banks or other institutions which the Adviser has determined are creditworthy under guidelines established by the Trustees. There were no securities on loan in the Funds during the period ended May 31, 2013.
10. FEDERAL TAX INFORMATION
In order to avoid imposition of the excise tax applicable to regulated investment companies, it is also the Funds’ intention to declare as dividends in each calendar year at least 98% of its net investment income (earned during the calendar year) and 98.2% of its net realized capital gains (earned during the twelve months ended October 31) plus undistributed amounts from prior years.
The amount of distributions from net investment income and net realized gains, if any, are determined in accordance with Federal income tax regulations which may differ from accounting principles generally accepted in the United States of America. These “book/tax” differences are either temporary or permanent in nature and permanent differences are charged or credited to undistributed net investment income (loss), accumulated net realized gain (loss) or paid—in capital as appropriate in the period that the differences arise.
Permanent differences between the Funds’ financial statement and income tax reporting requirements are primarily attributable to gains and losses on certain foreign currency related transactions, short sale related dividend expense, investments in passive foreign investment companies, and investments in swaps. These have no effect on the Funds’ net assets or net asset value per share.
| | |
| | | |
100 | | www.arbitragefunds.com | 1-800-295-4485 |
| | |
The Arbitrage Funds | | Notes to Financial Statements (continued) |
| |
| | May 31, 2013 |
The following permanent differences have been reclassified to/(from) the following accounts in the Arbitrage Fund as of May 31, 2013:
| | | | |
Undistributed Net Investment Income | | Accumulated Realized Loss | | Paid-in-capital |
|
$ 37,221,664 | | $ (29,165,402) | | $ (8,056,262) |
|
Included in the amounts reclassified was a net operating loss offset to paid-in capital of $8,055,787.
The following permanent differences have been reclassified to/(from) the following accounts in the Event-Driven Fund as of May 31, 2013:
| | | | |
Undistributed Net Investment Loss | | Accumulated Realized Gains | | Paid-in-capital |
|
$ (539,707) | | $ 595,775 | | $ (56,068) |
|
Included in the amounts reclassified was a net operating loss offset to paid-in capital of $56,001.
The following permanent differences have been reclassified to/(from) the following accounts in the Credit Opportunities Fund as of May 31, 2013:
| | | | |
Undistributed Net Investment Income | | Accumulated Realized Loss | | Paid-in-capital |
|
$ 24,675 | | $ (1,421) | | $ (23,254) |
|
The tax character of dividends and distributions declared during the year ended May 31, 2013 for the Arbitrage Fund was as follows:
| | | | | | | | | | | | |
| Year Ended | | Ordinary Income | | | Long-Term Capital Gains* | | | Total Distributions | |
| |
5/31/13 | | $ | 86,556,164 | | | $ | 2,300 | | | $ | 86,558,464 | |
| |
5/31/12 | | $ | 57,040,655 | | | $ | 466,733 | | | $ | 57,507,388 | |
| |
The tax character of dividends and distributions declared during the year ended May 31, 2013 for the Event-Driven Fund was as follows: | |
| Year Ended | | Ordinary Income | | | Long-Term Capital Gains* | | | Total Distributions | |
| |
5/31/13 | | $ | 1,074,249 | | | $ | – | | | $ | 1,074,249 | |
| |
5/31/12 | | $ | 1,348,474 | | | $ | – | | | $ | 1,348,474 | |
| |
| | |
| | | |
Annual Report | May 31, 2013 | | 101 |
| | |
The Arbitrage Funds | | Notes to Financial Statements (continued) |
| |
| | May 31, 2013 |
The tax character of dividends and distributions declared during the period ended May 31, 2013 for the Credit Opportunities Fund was as follows:
| | | | | | | | | | | | |
| Period Ended | | Ordinary Income | | | Long-Term Capital Gains* | | | Total Distributions | |
5/31/13 | | $ | 36,674 | | | $ | – | | | $ | 36,674 | |
| * | The Funds designate these distributions as long-term capital gain dividends per IRC code section 852(b)(3)(C). |
As of May 31, 2013, the Funds’ components of distributable earnings on a tax basis were as follows:
| | | | | | | | | | | | |
| | | Arbitrage Fund | | | Event-Driven Fund | | | Credit
Opportunities | |
Undistributed Ordinary Income | | $ | – | | | $ | – | | | $ | 72,858 | |
Accumulated Capital Gains/(Losses) | | | 12,319,318 | | | | – | | | | (10,925 | ) |
Unrealized Appreciation/Depreciation | | | (59,523,417 | ) | | | (256,857 | ) | | | 46,521 | |
Other Cumulative Effect of Timing Differences | | | (12,532,681 | ) | | | (301,598 | ) | | | (2,601 | ) |
| | | | |
Total | | $ | (59,736,780 | ) | | $ | (558,455 | ) | | $ | 105,853 | |
| | | | |
The following information is computed on a tax basis for each item as of May 31, 2013:
| | | | | | | | | | | | | | | | | | | | |
| Fund | | Cost of
Investments | | | Gross
Unrealized
Appreciation | | | Gross
Unrealized
(Depreciation) | | | Net
Unrealized
Appreciation/
(Depreciation)
of foreign
currency and
derivatives | | | Net
Unrealized
Appreciation/
(Depreciation) | |
Arbitrage Fund | | $ | 2,997,685,571 | | | $ | 62,017,850 | | | $ | (77,708,152 | ) | | $ | (43,833,115 | ) | | $ | (59,523,417 | ) |
Event-Driven Fund | | $ | 51,041,688 | | | $ | 1,309,650 | | | $ | (1,156,925 | ) | | $ | (409,582 | ) | | $ | (256,857 | ) |
Credit Opportunities Fund | | $ | 5,073,011 | | | $ | 79,512 | | | $ | (37,248 | ) | | $ | 4,257 | | | $ | 46,521 | |
The differences between book–basis and tax–basis net unrealized appreciation/(depreciation) for the Arbitrage Fund, the Event-Driven Fund and the Credit Opportunities Fund are attributable to constructive sales, dividends related to short securities, investments in passive foreign investment companies, and wash sales.
Post-Enactment Capital Losses:
Under the recently enacted Regulated Investment Company Modernization Act of 2010, Funds are permitted to carry forward capital losses incurred in taxable years beginning after December 22, 2010, for an unlimited period. Post-enactment capital losses that are carried forward will retain their character as either short-term or long-term capital.
The Arbitrage Credit Fund has elected to defer Short Term capital losses in the amount of $10,925 to the next tax year.
| | |
| | | |
102 | | www.arbitragefunds.com | 1-800-295-4485 |
| | |
The Arbitrage Funds | | Notes to Financial Statements (continued) |
| |
| | May 31, 2013 |
11. RECENT ACCOUNTING PRONOUNCEMENT
In December 2011, Financial Accounting Standards Board (“FASB”) issued an Accounting Standards Update (“ASU”) to enhance disclosures requiring improved information about financial instruments and derivative instruments that are subject to offsetting (“netting”) on the Statements of Assets and Liabilities. This information will enable users of the entity’s financial statements to evaluate the effect or potential effect of netting arrangements on the entity’s financial position. The ASU is effective prospectively during interim or annual periods beginning on or after January 1, 2013. At this time, management is evaluating the implications of these changes on the financial statements.
12. SUBSEQUENT EVENTS
The Funds have evaluated the need for disclosures and/or adjustments resulting from subsequent events through the date the financial statements were available to be issued. Based on this evaluation, no adjustments were required to the financial statements. However, effective June 1, 2013, the Funds offered a new A share class. Class A differs from the Funds’ existing share classes only in its ongoing fees.
| | |
| | | |
Annual Report | May 31, 2013 | | 103 |
| | |
| | | Report of Independent Registered Public Accounting Firm |
| |
| | |
To the Board of Trustees and Shareholders of
The Arbitrage Funds
We have audited the accompanying statements of assets and liabilities, including the schedules of investments, of The Arbitrage Funds (comprising, respectively, The Arbitrage Fund, The Arbitrage Event-Driven Fund, and The Arbitrage Credit Opportunities Fund) (the Funds) as of May 31, 2013, and the related statements of operations, the statements of changes in net assets, and the financial highlights for each period indicated therein. These financial statements and financial highlights are the responsibility of the Funds’ management. Our responsibility is to express an opinion on these financial statements and financial highlights based on our audits. The financial highlights of the Funds for the periods presented through May 31, 2011, were audited by other auditors whose report dated August 1, 2011, expressed an unqualified opinion on those financial highlights.
We conducted our audits in accordance with the standards of the Public Company Accounting Oversight Board (United States). Those standards require that we plan and perform the audit to obtain reasonable assurance about whether the financial statements and financial highlights are free of material misstatement. We were not engaged to perform an audit of the Funds’ internal control over financial reporting. Our audits included consideration of internal control over financial reporting as a basis for designing audit procedures that are appropriate in the circumstances, but not for the purpose of expressing an opinion on the effectiveness of the Funds’ internal control over financial reporting. Accordingly, we express no such opinion. An audit also includes examining, on a test basis, evidence supporting the amounts and disclosures in the financial statements and financial highlights, assessing the accounting principles used and significant estimates made by management, and evaluating the overall financial statement presentation. Our procedures included confirmation of securities owned as of May 31, 2013, by correspondence with the custodian and brokers, or by other appropriate auditing procedures where replies from brokers were not received. We believe that our audits provide a reasonable basis for our opinion.
In our opinion, the financial statements and financial highlights audited by us as referred to above present fairly, in all material respects, the financial position of each of the respective portfolios constituting the Arbitrage Funds at May 31, 2013, the results of their operations, the changes in their net assets, and the financial highlights for the periods indicated therein, in conformity with U.S. generally accepted accounting principles.

Minneapolis, Minnesota
July 30, 2013
| | |
| | | |
104 | | www.arbitragefunds.com | 1-800-295-4485 |
| | |
The Arbitrage Funds | | Disclosure of Fund Expenses |
| |
| | May 31, 2013 (Unaudited) |
All mutual funds have operating expenses. As a shareholder of a mutual fund, your investment is affected by these ongoing costs, which include (among others) costs for portfolio management, administrative services, distribution (12b-1) expenses, redemption fees and shareholder reports like this one. It is important for you to understand the impact of these costs on your investment returns.
Operating expenses such as these are deducted from a mutual fund’s gross income and directly reduce its final investment return. These expenses are expressed as a percentage of a mutual fund’s average net assets; this percentage is known as a mutual fund’s expense ratio.
The following examples use the expense ratio and are intended to help you understand the ongoing costs (in dollars) of investing in your Fund and to compare these costs with those of other mutual funds. The examples are based on an investment of $1,000 made at the beginning of the period shown and held for the entire period.
The table on the following page illustrates your Fund’s costs in two ways.
Actual Fund Return. This section helps you to estimate the actual expenses after fee waivers that your Fund incurred over the period. The “Expenses Paid During Period” column shows the actual dollar expense cost incurred by a $1,000 investment in the Fund, and the “Ending Account Value” number is derived from deducting that expense cost from the Fund’s gross investment return.
You can use this information, together with the actual amount you invested in the Fund, to estimate the expenses you paid over that period. Simply divide your actual account value by $1,000 to arrive at a ratio (for example, an $8,600 account value divided by $1,000 = 8.6), then multiply that ratio by the number shown for your Fund under “Expenses Paid During Period.”
Hypothetical 5% Return. This section helps you compare your Fund’s costs with those of other mutual funds. It assumes that the Fund had an annual 5% return before expenses during the period, but that the expense ratio (Column 3) for the period is unchanged. This example is useful in making comparisons because the Securities and Exchange Commission requires all mutual funds to make this 5% calculation. You can assess your Fund’s comparative cost by comparing the hypothetical result for your Fund in the “Expenses Paid During Period” column with those that appear in the same charts in the shareholder reports for other mutual funds.
Note: Because the return is set at 5% for comparison purposes — NOT your Fund’s actual return — the account values shown may not apply to your specific investment.
| | |
| | | |
Annual Report | May 31, 2013 | | 105 |
| | |
The Arbitrage Funds | | Disclosure of Fund Expenses (continued) |
| |
| | May 31, 2013 (Unaudited) |
| | | | | | | | |
| | | Beginning
Account Value
12/01/2012 | | Ending
Account Value
05/31/2013 | | Expense
Ratio(a) | | Expenses
Paid During
Period(b) |
The Arbitrage Fund | | | | | | | | |
Class R | | | | | | | | |
Actual | | $1,000.00 | | $1,015.30 | | 1.47% | | $7.39 |
Hypothetical (5% return before expenses) | | $1,000.00 | | $1,017.60 | | 1.47% | | $7.39 |
Class I | | | | | | | | |
Actual | | $1,000.00 | | $1,016.80 | | 1.22% | | $6.13 |
Hypothetical (5% return before expenses) | | $1,000.00 | | $1,018.85 | | 1.22% | | $6.14 |
Class C | | | | | | | | |
Actual | | $1,000.00 | | $1,011.50 | | 2.22% | | $11.13 |
Hypothetical (5% return before expenses) | | $1,000.00 | | $1,013.86 | | 2.22% | | $11.15 |
| | | | |
The Arbitrage Event-Driven Fund | | | | | | | | |
Class R | | | | | | | | |
Actual | | $1,000.00 | | $1,033.50 | | 1.69% | | $8.57 |
Hypothetical (5% return before expenses) | | $1,000.00 | | $1,016.50 | | 1.69% | | $8.50 |
Class I | | | | | | | | |
Actual | | $1,000.00 | | $1,034.60 | | 1.44% | | $7.30 |
Hypothetical (5% return before expenses) | | $1,000.00 | | $1,017.75 | | 1.44% | | $7.24 |
Class C | | | | | | | | |
Actual | | $1,000.00 | | $1,029.60 | | 2.44% | | $12.35 |
Hypothetical (5% return before expenses) | | $1,000.00 | | $1,012.76 | | 2.44% | | $12.24 |
| | | | |
The Arbitrage Credit Opportunities Fund | | | | | | | | |
Class R | | | | | | | | |
Actual | | $1,000.00 | | $1,022.30 | | 1.50% | | $7.56 |
Hypothetical (5% return before expenses) | | $1,000.00 | | $1,017.45 | | 1.50% | | $7.54 |
Class I | | | | | | | | |
Actual | | $1,000.00 | | $1,023.90 | | 1.25% | | $6.31 |
Hypothetical (5% return before expenses) | | $1,000.00 | | $1,018.70 | | 1.25% | | $6.29 |
Class C | | | | | | | | |
Actual | | $1,000.00 | | $1,019.10 | | 2.25% | | $11.33 |
Hypothetical (5% return before expenses) | | $1,000.00 | | $1,013.71 | | 2.25% | | $11.30 |
| (a) | Annualized, based on the Fund’s most recent fiscal half-year expenses. |
| (b) | Expenses are equal to the Fund’s annualized ratio multiplied by the average account value over the period, multiplied by the number of days in the most recent fiscal half year (182), divided by 365. |
| | |
| | | |
106 | | www.arbitragefunds.com | 1-800-295-4485 |
| | |
The Arbitrage Funds | | Additional Information |
| |
| | May 31, 2013 (Unaudited) |
1. PROXY VOTING POLICIES AND VOTING RECORD
A description of the policies and procedures that the Funds use to vote proxies relating to portfolio securities is available without charge upon request by calling toll-free 1-800-295-4485, or on the Securities and Exchange Commission’s (“SEC”) website at http://www.sec.gov. Information regarding how the Funds voted proxies relating to portfolio securities during the most recent 12-month period ended June 30th is available without charge upon request by calling toll-free 1-800-295-4485, or on the SEC’s website at http://www.sec.gov.
2. QUARTERLY PORTFOLIO HOLDINGS
The Funds file a complete listing of their portfolio holdings with the SEC as of the first and third quarters of each fiscal year on Form N-Q. The filings are available upon request by calling 1-800-295-4485. Furthermore, you may obtain a copy of the filing on the SEC’s website at http://www.sec.gov. The Funds’ Forms N-Q may also be reviewed and copied at the SEC’s Public Reference Room in Washington, D.C., and information on the operation of the Public Reference Room may be obtained by calling 1-800-SEC-0330.
3. TAX INFORMATION
The Funds designated the following for federal income tax purposes for distributions made during the calendar year ended December 31, 2012:
| | | | |
| Fund Income | | Dividends Received
Deduction | | Qualified Dividend |
Arbitrage Fund | | 3.21% | | 10.35% |
Arbitrage Event-Driven Fund | | 0% | | 3.55% |
Arbitrage Credit Opportunities Fund | | 0% | | 0% |
In early 2013, if applicable, shareholders of record received this information for the distributions paid to them by the Funds during the calendar year 2012 via Form 1099. The Funds will notify shareholders in early 2014 of amounts paid to them by the Funds, if any, during the calendar year 2013.
| | |
| | | |
Annual Report | May 31, 2013 | | 107 |
| | |
The Arbitrage Funds | | Trustees’ Approval of Advisory Agreement |
| |
| | May 31, 2013 (Unaudited) |
On May 14, 2013, the Board of Trustees (the “Board”) of The Arbitrage Funds (the “Trust”), including a majority of its independent trustees, approved the continuation of the Trust’s investment advisory agreements for The Arbitrage Fund and The Arbitrage Event-Driven Fund (each, a “Fund” and, collectively, the “Funds”) with Water Island Capital, LLC, the Fund’s investment adviser (hereafter referred to as the “Adviser”). The Board determined that continuation of the investment advisory agreements was in the best interests of the Funds and their shareholders. The Board based its decision upon its most recent review of the Adviser’s investment personnel, portfolio management process, and performance. The Board discussed the factors below, among others. However, no single factor determined whether the Board approved the continuation of the investment advisory agreements. Rather, it was the totality of the factors that led to the decision.
Nature, Extent and Quality of Service
The Board reviewed the services provided by the Adviser and the qualifications and backgrounds of the persons responsible for managing and providing services to the Funds. They also considered the financial information regarding the Adviser that had been provided to them to assess whether adequate resources were available to provide the level of service expected to be provided to the Funds. The Board determined that the Adviser and its personnel are well-qualified to provide all required services to the Funds and are providing services that are of high quality, and that it has appropriate resources to continue to provide such services.
Performance
The Board reviewed the performance of the Funds relative to mutual funds in the Funds’ peer groups, including any periods of outperformance or underperformance of relevant benchmarks and peer groups. The Board determined that the Funds’ investment strategies were performing as anticipated and that the investment methodology being employed in management of the Funds was delivering value to the Funds and their shareholders.
Cost
The Board considered each Fund’s overall expense ratio, comparing it to other similarly managed mutual funds. In its consideration of each Fund’s overall expense ratio, the Board also considered the Adviser’s long term commitment to cap operating expenses, reflected first in its decision to waive a portion of its advisory fee, and then, with respect to the Arbitrage Fund, in its decision to permanently lower its advisory fee. The Board recognized that each Fund’s overall expense ratio is competitive with comparably managed funds and concluded that shareholders are receiving quality investment options for a reasonable price. The Board also concluded that, although the advisory fees payable to the Adviser are slightly higher than the average of fees for other comparably managed funds, the fees are reasonable given the quality of services provided by the Adviser and the complexity of investment strategies implemented by the Adviser.
Profitability of the Adviser
The Board considered the Adviser’s profitability with regard to its management of the Funds, concluding that the Adviser’s profitability was not excessive and therefore was a secondary factor in connection with the evaluation of advisory fees paid by the Funds.
The Board considered the Funds’ short-and long-term performance, including any periods of outperformance or underperformance of relevant benchmarks and peer groups. The Board concluded that the Funds’ performance warranted continuation of the investment advisory agreements.
| | |
| | |
| |
108 | | www.arbitragefunds.com | 1-800-295-4485 |
| | |
The Arbitrage Funds Trustees’ Approval of Advisory Agreement (continued) |
| |
| | May 31, 2013 (Unaudited) |
Economics of Scale and Ancillary Benefits
The Board concluded that the breakpoints incorporated in the advisory agreements reflect economics of scale realized as the Funds grow.
The Board also considered the “ancillary benefits” to the Adviser, viewing these as secondary factors in connection with the evaluation of the reasonableness of the advisory fees paid by the Funds. The Board did consider the level of soft dollar activity, concluding that research derived from these trades was useful to the Funds and their shareholders.
| | |
| | |
| |
Annual Report | May 31, 2013 | | 109 |
| | |
The Arbitrage Funds | | Trustees & Officers |
| |
| | May 31, 2013 (Unaudited) |
The business of the Trust is managed under the direction of the Board of Trustees in accordance with the Declaration of Trust of the Trust, which Declaration of Trust has been filed with the Securities and Exchange Commission (“SEC”) and is available upon request. In May 2012, the Board voted to increase the number of Trustees from five to six, and elected Robert Herrmann to fill the vacancy created by increasing the number of Trustees. The Board also voted to appoint Burton Lehman as an adviser to the Board. As an adviser, Mr. Lehman attends meetings of the Board and acts as a non-voting participant. The Board voted to appoint Mr. Lehman as an adviser to the Board with the expectation that, within a couple of years, it will call a meeting of shareholders to elect trustees and Mr. Lehman will be one of the nominees. Subsequent to these events, Joel Ackerman resigned from the Board, effective May 22, 2012.
The Trustees serve for an indefinite term and the officers are elected annually. It is the policy of the Board that each Trustee, at the conclusion of the first meeting at which the Trustee has attained age 75, shall retire from the Board; provided, however, with respect to Messrs. Burtt Ehrlich, Jay Goldberg, and Burton Lehman (if elected a Trustee), the mandatory retirement age is 77.
Pursuant to the Declaration of Trust, the Trustees elect the officers of the Trust to supervise its day-to-day operations. The Board of Trustees retains the power to conduct, operate and carry on the business of the Trust and has the power to incur and pay any expenses which, in the opinion of the Board, are necessary or incidental to carry out any of the Trust’s purposes.
The Trustees, officers and employees of the Trust, when acting in such capacities, shall not be subject to any personal liability except for his or her own bad faith, willful misfeasance, gross negligence or reckless disregard of his or her duties. Following is a list of the Trustees and executive officers of the Trust.
INTERESTED TRUSTEES:
| | | | | | | | | | |
Name, Address and Age | | Length of
Time Served | | Position with Trust | | Principal Occupation During the Past Five Years | | Other
Directorships
During the Past
Five Years | | Number of
Portfolios in
the Fund
Complex
Overseen by
Trustee |
John S. Orrico, CFA* 41 Madison Avenue, 42nd Floor, New York, NY 10010 (Age 52) | | Since May 2000 | | President, Secretary, Treasurer and Trustee | | General Partner, Water Island Capital, LLC, the Investment Adviser, since January 2000. | | None | | 3 |
| * | John S. Orrico, as an affiliated person of the Adviser and as an officer of the Trust, is an “interested person” of the Trust within the meaning of Section 2(a)(19) of the 1940 Act. |
| | |
| | |
| |
110 | | www.arbitragefunds.com | 1-800-295-4485 |
| | |
The Arbitrage Funds | | Trustees & Officers (continued) |
| |
| | May 31, 2013 (Unaudited) |
INDEPENDENT TRUSTEES AND ADVISER TO THE BOARD:
| | | | | | | | | | |
Name, Address and Age | | Length of
Time Served | | Position with Trust | | Principal Occupation During the Past Five Years | | Other
Directorships
During the Past
Five Years | | Number of
Portfolios in
the Fund
Complex
Overseen by
Trustee |
Burtt R. Ehrlich 636 Riversville Road, Greenwich, Connecticut 06831 (Age 73) | | Since March 2005 | | Trustee | | Retired. | | Member of the Board of Directors of Clarus Corporation and P.C. Group FWC until 2010. | | 3 |
Jay N. Goldberg Hudson Venture Partners 535 Fifth Avenue 14th Floor New York, NY 10017 (Age 69) | | Since May 2000 | | Trustee | | General Partner of Hudson Ventures (venture capital firm). | | None | | 3 |
John C. Alvarado The Seaport Group 1200 Smith Street Suite 1600 Houston, TX 77002 (Age 53) | | Since December 2003 | | Trustee | | Managing Director of Energy Related Corporate Finance for The Seaport Group, a credit focused investment bank. Prior to joining The Seaport Group, Mr. Alvarado was Founder and Managing Member of PowerCapital Partners, LLC, an energy related financial consulting firm (2000 - 2010). | | None | | 3 |
Robert P. Herrmann 59 Rumson Road, Rumson, NJ 07760 (Age 50) | | Since May 2012 | | Trustee | | Chairman & CEO of Discovery Data, a leading financial services industry data provider (2009 - present). Previously, CEO and director of Loring Ward International, Ltd. and President of SA Funds-Investment Trust (2005 - 2009). | | None | | 3 |
| | |
| | |
| |
Annual Report | May 31, 2013 | | 111 |
| | |
The Arbitrage Funds | | Trustees & Officers (continued) |
| |
| | May 31, 2013 (Unaudited) |
| | | | | | | | | | |
Name, Address and Age | | Length of
Time Served | | Position with Trust | | Principal Occupation During the Past Five Years | | Other
Directorships
During the Past
Five Years | | Number of
Portfolios in
the Fund
Complex
Overseen by
Trustee |
Burton Lehman 919 Third Avenue, New York, NY 10022 (Age 71) | | Since May 2012 | | Adviser to the Board | | Of Counsel for Schulte, Roth & Zabel (2007 - 2012). Previously, Senior Advisor and General Counsel of Tishman Speyer Properties (2003 - 2006) and Partner at Schulte Roth & Zabel (1969 - 2003). | | None | | 3 |
EXECUTIVE OFFICERS:
| | | | | | | | | | |
Name, Address and Age | | Length of
Time Served | | Position with Trust | | Principal Occupation During the Past Five Years | | Other
Directorships
During the Past Five Years | | Number of
Portfolios in
the Fund
Complex
Overseen by
Trustee |
Matthew Hemberger 41 Madison Avenue, 42nd Floor, New York, NY 10010 (Age 53) | | Since May 2000 | | Vice President, Anti-Money Laundering Officer, Chief Compliance Officer | | CFO (2002 - present) and Chief Compliance Officer (2000 - January 2012) of Water Island Capital, LLC. | | N.A. | | N.A. |
Kim Storms ALPS Fund Services, Inc. 1290 Broadway Suite 1100 Denver, CO 80203 (Age 41) | | Since August 2011 | | Chief Financial Officer | | Director of Fund Administration (2004 - Present), Senior Vice President (2009 - Present) and Vice President (2005 - 2009), ALPS Fund Services, Inc. Treasurer of ALPS ETF Trust; Assistant Treasurer of Liberty All-Star Equity Fund, Liberty All-Star Growth Fund, Inc., Tilson Investment Trust, and Financial Investors Trust, and Assistant Secretary of Ameristock Mutual Fund, Inc.* | | N.A. | | N.A. |
| * | ALPS Fund Services, Inc. is the Administrator, Bookkeeping and Pricing Agent for the Funds, and is an affiliated person of ALPS Distributors, Inc., the distributor of the Funds. |
Additional information about members of the Board of Trustees and Officers is available in the Statement of Additional Information (SAI). To obtain a free copy of the SAI, please call 1-800-295-4485.
| | |
| | |
| |
112 | | www.arbitragefunds.com | 1-800-295-4485 |
| | (a) | The Registrant, as of the end of the period covered by the report, has adopted a code of ethics that applies to the Registrant’s principal executive officer, principal financial officer, principal accounting officer or controller or any persons performing similar functions on behalf of the Registrant. |
| | (c) | During the period covered by this report, no amendments were made to the provisions of the code of ethics adopted in 2(a) above. |
| | (d) | During the period covered by this report, no implicit or explicit waivers to the provisions of the code of ethics adopted in 2(a) above were granted. |
| | (f) | The Registrant’s Code of Ethics is attached as an Exhibit hereto. |
| Item 3. | Audit Committee Financial Expert. |
| | (a)(1) | The Registrant’s board of trustees has determined that the Registrant has at least one audit committee financial expert serving on the audit committee. |
| | (a)(2) | The audit committee financial expert is John C. Alvarado, who is independent as defined in Form N-CSR Item 3(a)(2). | |
| Item 4. | Principal Accountant Fees and Services. |
| | (a) | Audit Fees: For the Registrant’s fiscal years ended May 31, 2013 and May 31, 2012, the aggregate fees billed for professional services rendered by the principal accountant for the audit of the Registrant’s annual financial statements were $69,700 and $39,900, respectively. |
| | (b) | Audit-Related Fees: For the Registrant’s fiscal years ended May 31, 2013 and May 31, 2012, the aggregate fees billed for professional services rendered by the principal accountant for consent procedures related to the update to the Registrant’s Prospectus and Statement of Additional Information were $5,000 and $0, respectively. |
| | (c) | Tax Fees: For the Registrant’s fiscal years ended May 31, 2013 and May 31, 2012, aggregate fees of $13,200, and $7,000, respectively, were billed for professional services rendered by the principal accountant for tax compliance, tax advice, and tax planning. |
| | (d) | All Other Fees: For the Registrant’s fiscal years ended May 31, 2013 and May 31, 2012, no fees were billed to Registrant by the principal accountant for services other than the services reported in paragraphs (a) through (c) of this item. |
| | (e)(1) | Audit Committee Pre-Approval Policies and Procedures: All services to be performed by the Registrant’s principal auditors must be pre-approved by the Registrant’s audit committee. |
| | (e)(2) | No services described in paragraphs (b) through (d) were approved pursuant to paragraph (c)(7)(i)(C) of Rule 2-01 of Regulation S-X. |
| | (g) | The aggregate non-audit fees billed by the Registrant’s principle accountant for the fiscal years ended May 31, 2013 and May 31, 2012 were $0 and $0, respectively. |
| Item 5. | Audit Committee of Listed Registrants. |
Not applicable.
| Item 6. | Schedule of Investments. |
The Schedule of Investments is included as part of the Report to Stockholders filed under Item 1 of this form.
| Item 7. | Disclosure of Proxy Voting Policies and Procedures for Closed-End Management Investment Companies. |
Not applicable
| Item 8. | Portfolio Managers of Closed-End Management Investment Companies. |
Not applicable.
| Item 9. | Purchases of Equity Securities by Closed-End Management Investment |
Company and Affiliated Purchasers.
Not applicable.
| Item 10. | Submission of Matters to Vote of Security Holders. |
There have been no material changes to the procedures by which shareholders may recommend nominees to the registrant’s Board of Trustees.
| Item 11. | Controls and Procedures. |
| | (a) | The registrant’s principal executive officer and principal financial officer have evaluated the registrant’s disclosure controls and procedures (as defined in Rule 30a-3(c) under the Investment Company Act of 1940, as amended) within 90 days of this filing and have concluded that the registrant’s disclosure controls and procedures were effective, as of that date. |
| | (b) | There was no change in the registrant’s internal control over financial reporting (as defined in Rule 30a-3(d) under the Investment Company Act of 1940, as amended) during the second fiscal quarter of the period covered by this report that has materially affected, or is reasonably likely to materially affect, the registrant’s internal control over financial reporting. |
| | (a)(1) | The code of ethics that applies to the registrant’s principal executive officer and principal financial officer is attached hereto as EX-12.A.1. |
| | (a)(2) | A separate certification for the principal executive officer and the principal financial officer of the registrant as required by Rule 30a-2(a) under the Investment Company Act of 1940, as amended (17 CFR 270.30a-2(a)), are filed herewith. |
| | (b) | The certifications by the registrant’s Principal Executive Officer and Principal Financial Officer, as required by Rule 30a-2(b) of the Investment Company Act of 1940, as amended, and Section 906 of the Sarbanes-Oxley Act of 2002 are attached hereto as Ex99.906Cert. |
SIGNATURES
Pursuant to the requirements of the Securities Exchange Act of 1934 and the Investment Company Act of 1940, the registrant has duly caused this report to be signed on its behalf by the undersigned, thereunto duly authorized.
THE ARBITRAGE FUNDS
| | |
| By: | | /s/ John S. Orrico |
| | John S. Orrico |
| | President and Treasurer |
| |
| Date: | | August 9, 2013 |
Pursuant to the requirements of the Securities Exchange Act of 1934 and the Investment Company Act of 1940, this report has been signed below by the following persons on behalf of the registrant and in the capacities and on the dates indicated.
| | |
| By: | | /s/ John S. Orrico |
| | John S. Orrico |
| | President and Treasurer |
| |
| Date: | | August 9, 2013 |
| | |
| By: | | /s/ Kim Storms |
| | Kim Storms |
| | Chief Financial Officer |
| |
| Date: | | August 9, 2013 |