UNITED STATES
SECURITIES AND EXCHANGE COMMISSION
Washington, D.C. 20549
FORM N-CSR
CERTIFIED SHAREHOLDER REPORT OF REGISTERED
MANAGEMENT INVESTMENT COMPANIES
Investment Company Act file number: 811-09815
THE ARBITRAGE FUNDS
(exact name of registrant as specified in charter)
41 Madison Avenue, 42nd Floor, New York, NY 10010
(Address of principal executive offices) (Zip code)
John S. Orrico
Water Island Capital, LLC
41 Madison Avenue
42nd Floor
New York, NY 10010
(Name and address of agent for service)
Registrant’s telephone number, including area code: 212-584-2366
Date of fiscal year end: May 31
Date of reporting period: June 1, 2014 – May 31, 2015
Item 1. Reports to Stockholders.

| Shareholder Letter | | 1 |
| The Arbitrage Fund | | |
| Manager Commentary | | 3 |
| Portfolio Information | | 6 |
| Portfolio of Investments | | 8 |
| The Arbitrage Event-Driven Fund | | |
| Manager Commentary | | 20 |
| Portfolio Information | | 23 |
| Portfolio of Investments | | 25 |
| The Arbitrage Credit Opportunities Fund | | |
| Mana ger Commentary | | 47 |
| Portfolio Information | | 50 |
| Portfolio of Investments | | 52 |
| The Arbitrage Tactical Equity Fund | | |
| Mana ger Commentary | | 65 |
| Portfolio Information | | 67 |
| Portfolio of Investments | | 69 |
| Statement of Assets and Liabilities | | |
| The Arbitrage Fund | | 81 |
| The Arbitrage Event-Driven Fund | | 83 |
| The Arbitrage Credit Opportunities Fund | | 85 |
| The Arbitrage Tactical Equity Fund | | 87 |
| Statement of Operations | | |
| The Arbitrage Fund | | 89 |
| The Arbitrage Event-Driven Fund | | 90 |
| The Arbitrage Credit Opportunities Fund | | 92 |
| The Arbitrage Tactical Equity Fund | | 94 |
| Statements of Changes in Net Assets | | |
| The Arbitrage Fund | | 96 |
| The Arbitrage Event-Driven Fund | | 98 |
| The Arbitrage Credit Opportunities Fund | | 100 |
| The Arbitrage Tactical Equity Fund | | 102 |
| Financial Highlights | | |
| The Arbitrage Fund - Class R | | 104 |
| The Arbitrage Fund - Class I | | 106 |
| The Arbitrage Fund - Class C | | 108 |
| The Arbitrage Fund - Class A | | 110 |
| The Arbitrage Event-Driven Fund - Class R | | 112 |
| The Arbitrage Event-Driven Fund - Class I | | 114 |
| The Arbitrage Event-Driven Fund - Class C | | 116 |
| The Arbitrage Event-Driven Fund - Class A | | 118 |
| The Arbitrage Credit Opportunities Fund - Class R | | 120 |
| The Arbitrage Credit Opportunities Fund - Class I | | 122 |
| The Arbitrage Credit Opportunities Fund - Class C | | 124 |
| The Arbitrage Credit Opportunities Fund - Class A | | 126 |
| The Arbitrage Tactical Equity Fund - Class R | | 128 |
| The Arbitrage Tactical Equity Fund - Class I | | 129 |
| The Arbitrage Tactical Equity Fund - Class C | | 130 |
| The Arbitrage Tactical Equity Fund - Class A | | 131 |
| Notes to Financial Statements | | 132 |
| Report of Independent Registered Public Accounting Firm | | 164 |
| Disclosure of Fund Expenses | | 165 |
| Additional Information | | 168 |
| Trustees’ Approval of Advisory Agreement | | 169 |
| Trustees & Officers | | 173 |
| The Arbitrage Fund | Shareholder Letter |
| | May 31, 2015 |
Dear Fellow Shareholders,
For event-driven investors, 2014 was a challenging year – but not for want of opportunities. A slow-growth global economy, attractive financing terms, cash-rich balance sheets, and rich acquisition currency reignited efforts to unlock shareholder value, whether through spin-offs, restructurings, refinancings, acquisitions or other corporate actions. Amidst the positive trends, macroeconomic uncertainties – from falling energy prices to geopolitical uncertainties in Europe and Asia – elongated many corporate event timelines and made it difficult for event-driven managers to recognize positive returns for investors in the near-term.
Yet much of the opportunity set we saw ahead of us a year ago remains intact today. Both shareholder activism and mergers and acquisitions (M&A) activity are reaching record levels in 2015. Corporate management teams, increasingly turning to M&A as an avenue for growth, have driven global M&A volume in the first half of calendar year 2015 to $2.3 trillion. This is the second-highest volume for a six-month period in history, behind only the first half of 2007, according to Dealogic. Much of this deal flow is in the large cap space, with transactions greater than $10 billion reaching an all-time high.
More importantly, amidst the increasing deal flow, we’re witnessing a broadening of activity throughout sectors and market caps. While certain sectors such as health care, telecom and technology continue to lead the charge, deal flow is increasing across the board. In addition, whereas last year we saw acquisition activity concentrated amongst larger, well-established players, we are now beginning to see more acquisitions sourced from the lower end of the market cap spectrum, as well as a pickup in activity in Europe. This, finally, is the healthy environment for M&A we’ve been waiting for. On top of it all, we are still seeing elevated deal spreads relative to what we witnessed in the period leading up to the Shire/AbbVie deal break in October 2014. That terminated transaction reverberated throughout the merger arbitrage space, causing a re-pricing of risk that remains today. With a healthy amount of deal flow in front of us and a more optimal spread environment than we’ve seen in years, we feel confident our merger arbitrage team will be able to focus on constructing a portfolio that avoids deals at the riskiest end of the spectrum yet still offers favorable rates of return.
On the equity special situations side, M&A is delivering both pre-arbitrage situations as well as post-deal re-rating situations. Combined with a flood of shareholder activism and spin-off activity, we see ample opportunity in the equity markets. While a number of our equity special situations trades have experienced elevated levels of volatility relative to our other strategies – which is to be expected – we have high conviction in these names, we believe our theses are sound, and we feel patience is warranted as we wait for these situations to play out.
For our credit opportunities team, the fiscal year began with wide-open credit markets. Fears of imminent increases in interest rates failed to materialize – and likely won’t until September 2015 at the earliest. The severe decline in oil prices in the second half of 2014, however, caused a more significant disruption that rippled throughout the high yield markets – particularly in companies associated with the energy sector. While energy failed to stage a substantial recovery, credit markets nonetheless stabilized and moved higher in a fairly orderly fashion.
| | |
| Annual Report | May 31, 2015 | 1 |
| The Arbitrage Fund | Shareholder Letter (continued) |
| | May 31, 2015 |
Following the dislocation in oil prices, we foresee a large universe of opportunities looming in the energy and commodities space. While these situations are highly dependent on the direction of commodity prices such as oil, iron ore, and coal, capital structures for many companies in these sectors have been severely weakened. At the other end of the spectrum, we anticipate the increase in M&A activity will translate into more merger-related debt opportunities for us. We also expect that activist pressure on corporate managements and boards will translate into more spin-offs and asset sales, which, in turn, can lead to more refinancing and deleveraging activity from which to choose. We are particularly fond of these types of investments as their firmer catalysts and shorter durations can help produce lower correlated and less volatile returns.
While the timeline for rising interest rates continues to be extended, it is not a pipe dream – eventually, rates will rise. Investors are keenly aware of what could occur to the credit markets once the Federal Reserve finally begins to ratchet rates upward, and we continue to take steps to reduce potential liquidity risks in our portfolios, particularly by focusing on the aforementioned firmer, shorter-dated catalysts; increasing the number of short credit ideas we implement; tempering the pace at which we build positions in bonds with high exchange-traded fund (ETF) ownership; maintaining higher cash levels; and increasing our opportunistic hedging programs.
Amidst these factors, our investment teams remain anchored to our discipline of capitalizing on corporate catalysts by understanding the rationale and underlying complexities of each event, sharing insights between our teams, using hedging to mitigate market influence, and building well-diversified portfolios. As always, we maintain a focus on risk management, with a keen eye toward downside protection. We believe through this approach, the Arbitrage Funds family can generate attractive long-term results with lower volatility and lower correlation to the broader equity and credit markets.
We are grateful for your continued trust and support.
Sincerely,
The Investment Team at Water Island Capital
The statements and opinions expressed are those of the author as of the date of this report. All information is historical and not indicative of future results and subject to change. This information is not a recommendation to buy or sell any security.
Definitions
A spread, or deal spread, is the difference between the price at which a target company’s shares currently trade, and the price an acquiring company has agreed to pay.
Deal flow refers to the volume of announced mergers and acquisitions activity.
Taper Tantrum refers to the period during the summer of 2013 when investor fear caused market volatility and Treasury yields to spike in response to the Federal Reserve publicly discussing plans to potentially taper its quantitative easing program, a bond buying program designed to stimulate the economy.
The Bank of America Merrill Lynch U.S. High Yield Master II Index measures the broad U.S. high yield market, and is commonly used as a benchmark for high yield corporate bonds.
| | |
| 2 | www.arbitragefunds.com | 1-800-295-4485 |
| The Arbitrage Fund | Manager Commentary (continued) |
| | May 31, 2015 (Unaudited) |
The Arbitrage Fund | Tickers: ARBNX, ARBFX, ARBCX, ARGAX
The Fund’s Goal and Main Investments Merger arbitrage is a sub‐set of a broader event‐driven investment strategy, which seeks to profit from investing in securities that are involved in corporate events such as mergers and acquisitions. Typically merger arbitrage is a low volatility strategy pursued by absolute‐return‐minded investors. At Water Island Capital, our goal is to capture a return stream with a low correlation to the overall markets. |
Investment Strategy
The Fund seeks to achieve capital growth by engaging in merger arbitrage. The strategy’s focus is to capture returns from corporate events, generate market neutral capital growth, preservation of capital, consistent and positive returns, and achieve low correlation, and low volatility. The Fund’s general investment approach can be best described as risk averse, and many systems, policies, and procedures are in place to facilitate this low‐risk approach. The Fund generally engages in active and frequent trading of portfolio securities to achieve its principal investment objective. In attempting to achieve its investment strategy, the Fund plans to invest at least 80% of its net assets in equity securities of companies (both U.S. and foreign) that are involved in publicly‐announced mergers, takeovers, tender offers, leveraged buyouts, spin‐offs, liquidations, and other corporate reorganizations. The Fund’s investment advisor uses investment strategies designed to minimize market exposure, including short selling along with purchasing and selling options. The most common merger arbitrage activity, and the approach generally used by the Fund, involves purchasing the shares of an announced acquisition target company at a discount to their expected value upon the acquisition’s completion. That difference, or “spread,” is the primary driver of returns for this strategy. There is no limit to the number of stocks the Fund can hold; however, the Fund typically invests in 40 to 80 deals at any given time. Each deal will have one, or perhaps two, equity positions (a long and short position in a stock‐for‐stock deal) and, in many cases, associated derivative positions for hedging purposes.
Commentary
Last year began with hostile offers, topping bids, and auction processes peppering the M&A landscape, including 2014’s largest proposed transaction: Pfizer’s unsolicited $118 billion bid for AstraZeneca. This benign environment of moderate deal flow and few deal disruptions was upended by the return of volatility to the merger arbitrage space in the second half of 2014, leading to spreads widening in long-dated deals and the re-pricing of risk on newly announced deals. This turmoil created the most attractive entry points for arbitrageurs in nearly four years.
The fallout was brought on by a recent trend in acquiring companies engaging in transactions predicated on tax inversions, whereby a corporation domiciled in a high-tax jurisdictions (primarily the U.S.) will purchase a company in an area with lower corporate taxes, such as the U.K. or Netherlands, and then re-domicile the combined entity in the lesser-tax jurisdiction. This peculiarity of M&A activity ground to a screeching halt in October, when the board of Shire recommended that shareholders vote against an agreed-to takeover by AbbVie. Prior to this, tax inversions were popular in the pharmaceutical industry, where nearly half of $650 billion in deals in the sector – including Medtronic’s $46 billion bid for Covidien; Valeant Pharmaceutical’s $47 billion hostile offer for Allergan (which in November agreed to a $65 billion deal with Actavis, fresh off its acquisition of Forest Laboratories); and of course AbbVie’s $55 billion offer for Shire – were contingent on this maneuver. But in late September 2014, the U.S. Treasury proposed new rules designed to curtail the financial benefits of tax inversions, hoping to curb the flow of tax dollars overseas. Spreads on these deals widened as the prospect of further government intervention gave investors pause.
| | |
| Annual Report | May 31, 2015 | 3 |
| The Arbitrage Fund | Manager Commentary (continued) |
| | May 31, 2015 (Unaudited) |
These fears were justified when AbbVie withdrew its offer for Shire in October, just weeks after Treasury’s announcement, citing the proposed new rules as a reason. The demise of this popular trade reverberated widely, ushering the return of volatility and a re-pricing of risk in the merger arbitrage space. Speculators and arbitrageurs with outsized, unhedged exposure to this transaction were forced to reduce portfolio risk by selling positions in complicated, long-dated deals, and crowded into transactions with a perceived high degree of certainty of closing. As a result, new deals started to be attractively priced. The net effect was that average deal spreads widened to levels not seen since 2011. To date, though they have narrowed somewhat from the immediate aftermath, spreads have remained at elevated levels. When combined with record-breaking amounts of deal flow announced in the opening months of calendar year 2015, we foresee a promising environment for the strategy.
Fiscal Year Highlights
In fiscal 2015, the Arbitrage Fund (ARBNX) returned 3.51%. The results were predominantly derived from companies residing in the Americas. In terms of sectors, consumer staples and health care companies were the top contributors, while energy and utilities sectors added the least to results.
One of the best performing investments of the year was the acquisition of Allergan by Actavis for $65 billion. In April 2014, Valeant and Pershing Square Capital, Allergan’s largest shareholder, combined efforts for a $47 billion hostile offer to purchase Allergan. Allergan sports a robust portfolio of medical aesthetic drugs and products, the most well known being Botox. Despite Valeant increasing its bid in late May, another company, Actavis, entered with a topping bid in November and Valeant walked away a few days later. The deal closed in March and the Fund profited by holding a core position in Allergan.
Our participation in the bidding war for Hillshire Brands was also a strong contributor to results. We recognized Hillshire Brands, a maker of well‐known processed meats and foods, to be a scarce asset and a takeover target in the fast‐consolidating food processing industry. When Hillshire announced its acquisition of Pinnacle Foods, we believed it could be the start of something much bigger – something that could ultimately include bids for Hillshire itself – and we positioned the Fund accordingly. After a bidding contest, Tyson Foods’ $8 billion bid (which was nearly 40% above the initial offer from competitor Pilgrim’s Pride) ultimately won out.
We also profited from another health care deal which resulted from Valeant’s spurned bid for Allergan. After losing the battle for Allergan in November 2014, Valeant began searching for its next acquisition target, eventually settling on Salix Pharmaceuticals. Soon after Valeant announced their acquisition intentions in late February, Endo International emerged with a topping bid. The bidding war ended in Valeant’s favor, along with an added condition that the deal close quickly. The Fund benefited from the quick deal turnaround (the deal closed April 1) as well as the topping bid.
| | |
| 4 | www.arbitragefunds.com | 1-800-295-4485 |
| The Arbitrage Fund | Manager Commentary (continued) |
| | May 31, 2015 (Unaudited) |
The aforementioned derailed acquisition of Shire by AbbVie, was the Fund’s biggest drag on performance. In June 2014, U.S.-based pharmaceutical company AbbVie made an unsolicited offer to acquire Shire, a U.K.-based pharmaceutical company. AbbVie intended to utilize a tax inversion strategy to re-domicile in the U.K. upon completing the transaction. This deal was terminated during the fourth quarter of 2014 when efforts by the U.S. government to stem the tide of tax inversions led AbbVie’s board to recommend that shareholders vote against the deal, causing AbbVie to walk away from the transaction.
Another deal that weighed on performance during the period was our position in Steris’ proposal to acquire Synergy Health. In May 2015, the U.S. Department of Justice (DOJ) sued to block this transaction, citing competition concerns. While Steris is currently litigating the decision, and we expect the company to come to an agreement with the DOJ, given that the timeline on this transaction has now been significantly extended we have reduced our exposure.
Outlook
As acquisitions continue to replace share buybacks, dividend increases, and cost-cutting efforts – particularly in slow growth, global industries – deal volume should remain elevated. The momentum from large- and mega-cap transaction activity usually cascades to other capitalization levels, which would give us a broader opportunity set, and we have started to witness the early innings of this trend occurring.
The return of volatility to the merger arbitrage space has led to spreads widening in long-dated deals and the re-pricing of risk on newly announced deals. We believe this marks the beginning of a more normalized spread environment, whereby investors begin to price risk appropriately. Furthermore, while the specter of rising interest rates – which have historically provided a tailwind for merger arbitrage returns – has loomed on the horizon for some time now, even if short-term rates remain at historically low levels, as long as volatility persists we believe our approach to investing in definitive, announced merger deals should yield attractive risk-adjusted returns.
Sincerely,
The Investment Team at Water Island Capital
| | |
| Annual Report | May 31, 2015 | 5 |
Performance (annualized returns as of May 31, 2015)
| | One
Year | Five
Year | Ten
Year | Since
Inception* |
| Arbitrage Fund, Class R | 3.35% | 2.35% | 3.50% | 4.49% |
| Arbitrage Fund, Class I | 3.51% | 2.60% | 3.73% | 3.25% |
| Arbitrage Fund, Class C ** | 1.52% | N/A | N/A | 0.87% |
| Arbitrage Fund, Class A*** | 0.71% | N/A | N/A | 0.93% |
| HFRI Event Driven: Merger Arbitrage Index | 4.63% | 3.74% | 5.09% | 4.73% |
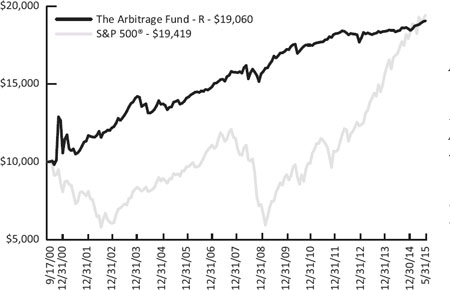
S&P 500® Index | 11.81% | 16.54% | 8.12% | 4.62% |
| Barclays Capital U.S. Aggregate Bond Index | 3.03% | 3.90% | 4.61% | 5.44% |
Current performance may be higher or lower than performance quoted above. Any performance data quoted represents past performance and the investment return and principal value of an investment in the Fund will fluctuate so that an investor’s shares, when redeemed, may be worth more or less than their original cost. Past performance is no guarantee of future results. Returns do not reflect a 2% redemption fee for shares that are redeemed from the fund within 30 days of purchase, which, if reflected, would reduce the performance quoted. Returns shown above include the reinvestment of all dividends and capital gains. Contractual fee waivers are currently in effect. Without such fee waivers, performance numbers would be reduced. You can obtain performance data current to the most recent month end by calling 1-800-295-4485 or going to www.arbitragefunds.com.
* Class R inception: 9/17/00; Class I inception: 10/17/03; Class C inception: 6/1/12; Class A
inception: 6/1/13.
** Class C shares are subject to a 1.00% contingent deferred sales charge on all purchases redeemed in 12 months of purchase.
*** Class A shares are subject to a maximum front-end sales load of 2.50% on purchases up to $250,000. The shares are also subject to a deferred sales charge of up to 0.50% on purchases of $250,000 or more purchased without a front-end sales load and redeemed within 12 months of purchase.
The Total Annual Fund Operating Expenses for Class R, Class I, Class C and Class A are 2.17%, 1.92%, 2.92% and 2.17%, respectively.
The HFRI Event Driven: Merger Arbitrage Index is an index consisting of merger arbitrage strategies which employ an investment process primarily focused on opportunities in equity and equity related instruments of companies which are currently engaged in a corporate transaction. Merger Arbitrage involves primarily announced transactions, typically with limited or no exposure to situations which pre-, post-date or situations in which no formal announcement is expected to occur. Opportunities are frequently presented in cross border, collared and international transactions which incorporate multiple geographic regulatory institutions, with typically involve minimal exposure to corporate credits.
The S&P 500® Index is an unmanaged index consisting of 500 stocks.
The Barclays Capital U.S. Aggregate Bond Index is a market value-weighted index of investment grade fixed-rated debt issues, including government, corporate, asset-backed and mortgage-backed securities with a maturity of one year or more.
An investor may not invest directly in an index.
| | |
| 6 | www.arbitragefunds.com | 1-800-295-4485 |
| The Arbitrage Fund | Portfolio Information (continued) |
| | May 31, 2015 (Unaudited) |
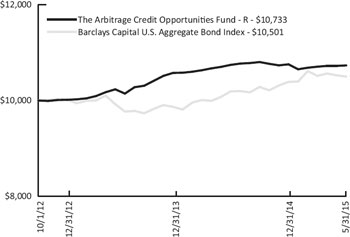
Growth of $10,000 Investment
The chart represents historical performance of a hypothetical investment of $10,000 in the Class R shares of the Fund since inception. Past performance does not guarantee future results. This chart does not reflect the deduction of taxes that a shareholder would pay on Fund distributions or the redemption of Fund shares.
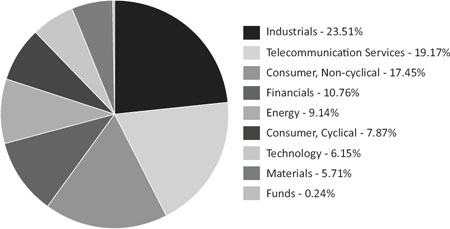
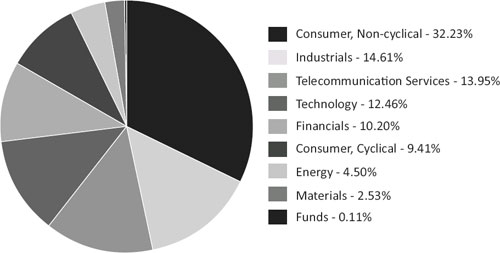
Sector Weighting
The following chart shows the sector weightings of the Arbitrage Fund’s investments in common stock and limited partnerships as of the report date.
| | |
| Annual Report | May 31, 2015 | 7 |
| The Arbitrage Fund | Portfolio of Investments (continued) |
| | May 31, 2015 |
| | | Shares | | | Value | |
| COMMON STOCKS - 79.64% | |
| Banks - 3.60% | |
Bank of Kentucky Financial Corp.(a) | | | 256,265 | | | $ | 12,636,427 | |
| City National Corp. | | | 408,652 | | | | 37,669,541 | |
Hudson Valley Holding Corp.(a) | | | 361,039 | | | | 9,329,248 | |
Susquehanna Bancshares, Inc.(a) | | | 1,058,556 | | | | 14,703,343 | |
| | | | | | | | 74,338,559 | |
| | | | | | | | | |
| Biotechnology - 0.48% | |
Synageva BioPharma Corp.(b)(c) | | | 46,895 | | | | 10,007,862 | |
| | | | | | | | | |
| Chemicals - 4.15% | |
Sigma-Aldrich Corp.(a) | | | 592,279 | | | | 82,504,465 | |
| Zep, Inc. | | | 157,436 | | | | 3,142,422 | |
| | | | | | | | 85,646,887 | |
| | | | | | | | | |
| Computers - 0.25% | |
IGATE Corp.(b) | | | 108,000 | | | | 5,131,080 | |
| | | | | | | | | |
| Food - 0.23% | |
Kraft Foods Group, Inc.(c) | | | 56,752 | | | | 4,792,706 | |
| | | | | | | | | |
| Forest Products & Paper - 7.87% | |
MeadWestvaco Corp.(a) | | | 3,218,711 | | | | 162,673,654 | |
| | | | | | | | | |
| Healthcare - Products - 1.20% | |
| Synergy Health Plc | | | 888,814 | | | | 24,764,786 | |
| | | | | | | | | |
| Insurance - 3.04% | |
PartnerRe Ltd.(a)(c) | | | 478,716 | | | | 62,917,644 | |
| | | | | | | | | |
| Internet - 0.80% | |
AOL, Inc.(b)(c) | | | 116,131 | | | | 5,807,711 | |
ClickSoftware Technologies Ltd.(b) | | | 846,318 | | | | 10,646,681 | |
| | | | | | | | 16,454,392 | |
| | | | | | | | | |
| Leisure Time - 4.60% | |
Life Time Fitness, Inc.(a)(b) | | | 1,321,874 | | | | 95,042,741 | |
| | | | | | | | | |
| Media - 8.34% | |
DIRECTV(a)(b) | | | 1,893,567 | | | | 172,390,340 | |
| | | | | | | | | |
| Metal Fabricate & Hardware - 2.74% | |
RTI International Metals, Inc.(a)(b) | | | 1,604,054 | | | | 56,574,985 | |
| | | | | | | | | |
| See Notes to Financial Statements. | |
| 8 | www.arbitragefunds.com | 1-800-295-4485 |
| The Arbitrage Fund | Portfolio of Investments (continued) |
| | May 31, 2015 |
| | | Shares | | | Value | |
| COMMON STOCKS - 79.64% (Continued) | |
| Mining - 0.01% | |
Yancoal Australia Ltd.(b) | | | 1,491,115 | | | $ | 171,005 | |
| | | | | | | | | |
| Miscellaneous Manufacturing - 5.13% | |
Pall Corp.(a)(c) | | | 417,870 | | | | 51,999,743 | |
Polypore International, Inc.(a)(b) | | | 900,663 | | | | 53,958,720 | |
| | | | | | | | 105,958,463 | |
| | | | | | | | | |
| Oil & Gas - 2.22% | |
Rosetta Resources, Inc.(b) | | | 1,962,345 | | | | 45,840,379 | |
| | | | | | | | | |
| Pharmaceuticals - 14.37% | |
| AbbVie, Inc. | | | 566,947 | | | | 37,753,001 | |
Catamaran Corp.(a)(b)(c) | | | 1,544,087 | | | | 92,413,607 | |
Hospira, Inc.(a)(b)(c) | | | 1,359,737 | | | | 120,227,945 | |
Omnicare, Inc.(c) | | | 487,079 | | | | 46,413,758 | |
| | | | | | | | 296,808,311 | |
| | | | | | | | | |
| Real Estate Investment Trusts - 3.04% | |
Associated Estates Realty Corp.(a) | | | 1,295,583 | | | | 37,040,718 | |
| Excel Trust, Inc. | | | 1,615,769 | | | | 25,674,569 | |
| | | | | | | | 62,715,287 | |
| | | | | | | | | |
| Retail - 3.61% | |
ANN, Inc.(b) | | | 1,294,803 | | | | 60,532,040 | |
World Duty Free SpA(b) | | | 1,263,329 | | | | 13,986,144 | |
| | | | | | | | 74,518,184 | |
| | | | | | | | | |
| Semiconductors - 2.03% | |
| Broadcom Corp., Class A | | | 407,598 | | | | 23,171,946 | |
| CSR Plc | | | 152,433 | | | | 2,057,201 | |
| Micrel, Inc. | | | 1,196,366 | | | | 16,653,415 | |
| | | | | | | | 41,882,562 | |
| | | | | | | | | |
| Software - 4.03% | |
Informatica Corp.(a)(b) | | | 1,524,318 | | | | 73,776,991 | |
Rally Software Development Corp.(b) | | | 483,314 | | | | 9,385,958 | |
| | | | | | | | 83,162,949 | |
| | | | | | | | | |
| Telecommunications - 5.15% | |
| Harris Corp. | | | 312,045 | | | | 24,720,185 | |
Jazztel Plc(b) | | | 5,090,899 | | | | 72,491,654 | |
| See Notes to Financial Statements. | |
| Annual Report | May 31, 2015 | 9 |
| The Arbitrage Fund | Portfolio of Investments (continued) |
| | May 31, 2015 |
| | | Shares | | | Value | |
| COMMON STOCKS - 79.64% (Continued) | |
| Telecommunications - 5.15% (Continued) | |
Procera Networks, Inc.(b) | | | 806,331 | | | $ | 9,272,806 | |
| | | | | | | | 106,484,645 | |
| | | | | | | | | |
| Transportation - 2.75% | |
| Ansaldo STS SpA | | | 3,066,265 | | | | 31,639,344 | |
| Norbert Dentressangle SA | | | 33,911 | | | | 8,178,882 | |
| TNT Express N.V. | | | 2,007,410 | | | | 16,932,392 | |
| | | | | | | | 56,750,618 | |
| | | | | | | | | |
| TOTAL COMMON STOCKS | | | | | | | | |
| (Cost $1,643,238,950) | | | | | | | 1,645,028,039 | |
| | | | | | | | | |
| LIMITED PARTNERSHIPS - 2.97% | |
| Pipelines - 2.97% | |
Williams Partners LP(a) | | | 1,099,296 | | | | 61,428,660 | |
| | | | | | | | | |
| TOTAL LIMITED PARTNERSHIPS | | | | | | | | |
| (Cost $63,122,705) | | | | | | | 61,428,660 | |
| | | | | | | | | |
| RIGHTS - 0.52% | |
ArthroCare Corp., CVR(b)(d)(e) | | | 3,215,721 | | | | 1,085,627 | |
Casa Ley, CVR(b)(d)(e) | | | 6,223,326 | | | | 2,249,732 | |
Chelsea Therapeutics, CVR(b)(d)(e) | | | 2,389,273 | | | | 194,726 | |
Cubist Pharmaceuticals, Inc., CPR(b)(d)(e) | | | 119,343 | | | | 0 | |
Leap Wireless International, CVR(b)(d)(e) | | | 1,783,190 | | | | 6,865,282 | |
PDC, CVR(b)(d)(e) | | | 6,223,326 | | | | 140,025 | |
Trius Therapeutics, CVR(b)(d)(e) | | | 1,034,403 | | | | 175,745 | |
| | | | | | | | | |
| TOTAL RIGHTS | | | | | | | | |
| (Cost $12,345,884) | | | | | | | 10,711,137 | |
| | | | | | | | | |
| | | Expiration
Date | | | Exercise
Price | | | Contracts | | | Value | |
PURCHASED OPTIONS(b)- 0.15% | |
| Call Options Purchased - 0.08% | |
| AT&T, Inc. | | | 06/2015 | | | $ | 35.00 | | | | 39,416 | | | $ | 1,458,392 | |
| Catamaran Corp. | | | 10/2015 | | | | 62.50 | | | | 418 | | | | 2,090 | |
| Kraft Foods Group, Inc. | | | 09/2015 | | | | 90.00 | | | | 383 | | | | 24,895 | |
| Noble Energy, Inc.: | | | | | | | | | | | | | | | | |
| | | | 06/2015 | | | | 47.50 | | | | 2,086 | | | | 41,720 | |
| | | | 08/2015 | | | | 50.00 | | | | 1,321 | | | | 69,353 | |
| See Notes to Financial Statements. | |
| 10 | www.arbitragefunds.com | 1-800-295-4485 |
| The Arbitrage Fund | Portfolio of Investments (continued) |
| | May 31, 2015 |
| | | Expiration
Date | | | Exercise
Price | | | Contracts | | | Value | |
PURCHASED OPTIONS(b)- 0.15% (Continued) | |
| Call Options Purchased - 0.08% (Continued) | |
| Omnicare, Inc. | | | 09/2015 | | | $ | 100.00 | | | | 128 | | | $ | 960 | |
| | | | | | | | | | | | | | | | | |
| TOTAL CALL OPTIONS PURCHASED | | | | | | | | | | | | | |
| (Cost $2,247,234) | | | | | | | | | | | | | | | 1,597,410 | |
| | | | | | | | | | | | | | | | | |
| Put Options Purchased - 0.07% | |
| Alcoa, Inc. | | | 06/2015 | | | | 12.00 | | | | 16,226 | | | | 186,599 | |
| Avago Technologies Ltd.: | | | | | | | | | | | | | | | | |
| | | | 06/2015 | | | | 135.00 | | | | 57 | | | | 4,275 | |
| | | | 06/2015 | | | | 140.00 | | | | 57 | | | | 9,120 | |
| Axis Capital Holdings Ltd. | | | 09/2015 | | | | 50.00 | | | | 1,243 | | | | 71,473 | |
| Catamaran Corp. | | | 10/2015 | | | | 57.50 | | | | 153 | | | | 14,535 | |
| Dresser-Rand Group, Inc. | | | 06/2015 | | | | 75.00 | | | | 146 | | | | 730 | |
| Family Dollar Stores, Inc. | | | 07/2015 | | | | 72.50 | | | | 2,860 | | | | 107,250 | |
| Hospira, Inc. | | | 08/2015 | | | | 70.00 | | | | 2 | | | | 5 | |
| Kraft Foods Group, Inc. | | | 09/2015 | | | | 82.50 | | | | 2,139 | | | | 454,537 | |
| Microchip Technology, Inc. | | | 10/2015 | | | | 46.00 | | | | 72 | | | | 11,880 | |
| Orbitz Worldwide, Inc.: | | | | | | | | | | | | | | | | |
| | | | 08/2015 | | | | 10.00 | | | | 6,554 | | | | 81,925 | |
| | | | 01/2016 | | | | 10.00 | | | | 1,156 | | | | 28,900 | |
| Synageva BioPharma Corp.: | | | | | | | | | | | | | | | | |
| | | | 07/2015 | | | | 165.00 | | | | 480 | | | | 280,800 | |
| | | | 07/2015 | | | | 170.00 | | | | 287 | | | | 185,115 | |
| ZF TRW Automotive Holdings Corp. | | | 07/2015 | | | | 95.00 | | | | 923 | | | | 0 | |
| | | | | | | | | | | | | | | | | |
| TOTAL PUT OPTIONS PURCHASED | | | | | | | | | | | | | |
| (Cost $1,451,659) | | | | | | | | | | | | | | | 1,437,144 | |
| | | | | | | | | | | | | | | | | |
| | | | | | | | | | | | | | | | | |
| TOTAL PURCHASED OPTIONS | | | | | | | | | | | | | |
| (Cost $3,698,893) | | | | | | | | | | | | | | | 3,034,554 | |
| See Notes to Financial Statements. | |
| Annual Report | May 31, 2015 | 11 |
| The Arbitrage Fund | Portfolio of Investments (continued) |
| | May 31, 2015 |
| | | Yield | | | Shares | | | Value | |
| SHORT-TERM INVESTMENTS - 17.05% | |
| Money Market Fund | |
| State Street Institutional Liquid Reserves Fund | | | 0.100 | %(f) | | | 352,115,204 | | | $ | 352,115,204 | |
| | | | | | | | | | | | | |
| TOTAL SHORT-TERM INVESTMENTS | | | | | | | | | | | | |
| (Cost $352,115,204) | | | | | | | | | | | 352,115,204 | |
| | | | | | | | | | | | | |
Total Investments - 100.33% (Cost $2,074,521,636) | | | | | | | | | | | 2,072,317,594 | |
| | | | | | | | | | | | | |
| Liabilities in Excess of Other Assets - (0.33%) | | | | | | | | | | | (6,776,045 | )(g) |
| | | | | | | | | | | | | |
| NET ASSETS - 100.00% | | | | | | | | | | $ | 2,065,541,549 | |
| (a) | Security, or a portion of security, is being held as collateral for short sales or written option contracts. At period end, the aggregate market value of those securities was $485,877,750, representing 23.52% of net assets. |
| (b) | Non-income-producing security. |
| (c) | Underlying security for a written/purchased call/put option. |
| (d) | Security considered illiquid. On May 31, 2015, the total market value of these securities was $10,711,137, representing 0.52% of net assets. |
| (e) | Security fair valued using methods determined in good faith by the Pricing Committee. As of May 31, 2015, the total market value of these securities was $10,711,137, representing 0.52% of net assets. |
| (f) | Rate shown is the 7-day effective yield as of May 31, 2015. |
| (g) | Includes cash which is being held as collateral for short sales and written option contracts. |
Securities are determined to be illiquid under the procedures approved by the Funds’ Board of Trustees. Information related to the illiquid securities is as follows:
| Date of Purchase | Security | | Cost | | | Market Value | | | % of Net Assets | |
| 05/30/2014 | ArthroCare Corp., CVR | | $ | 1,125,502 | | | $ | 1,085,627 | | | | 0.05 | % |
| 01/30/2015 | Casa Ley, CVR | | | 6,316,054 | | | | 2,249,732 | | | | 0.11 | |
| 06/24/2014 | Chelsea Therapeutics, CVR | | | 0 | | | | 194,726 | | | | 0.01 | |
| 12/12/2011 | Cubist Pharmaceuticals, Inc., CPR | | | 0 | | | | 0 | | | | 0.00 | |
| 03/14/2014 | Leap Wireless International, CVR | | | 4,600,630 | | | | 6,865,282 | | | | 0.33 | |
| 01/30/2015 | PDC, CVR | | | 303,698 | | | | 140,025 | | | | 0.01 | |
| 09/12/2013 | Trius Therapeutics, CVR | | | 0 | | | | 175,745 | | | | 0.01 | |
| | | | | | | | $ | 10,711,137 | | | | 0.52 | % |
| See Notes to Financial Statements. | |
| 12 | www.arbitragefunds.com | 1-800-295-4485 |
| The Arbitrage Fund | Portfolio of Investments (continued) |
| | May 31, 2015 |
| SCHEDULE OF SECURITIES SOLD SHORT | | Shares | | | Value | |
| COMMON STOCKS - (29.42%) | |
| Banks - (1.95%) | |
| BB&T Corp. | | | (526,985 | ) | | $ | (20,800,098 | ) |
| Royal Bank of Canada | | | (305,981 | ) | | | (19,469,571 | ) |
| | | | | | | | (40,269,669 | ) |
| | | | | | | | | |
| Biotechnology - (0.24%) | |
| Alexion Pharmaceuticals, Inc. | | | (30,864 | ) | | | (5,056,758 | ) |
| | | | | | | | | |
| Healthcare - Products - (1.24%) | |
| STERIS Corp. | | | (382,876 | ) | | | (25,587,603 | ) |
| | | | | | | | | |
| Mining - (2.26%) | |
| Alcoa, Inc. | | | (3,730,572 | ) | | | (46,632,150 | ) |
| | | | | | | | | |
| Oil & Gas - (2.04%) | |
| Noble Energy, Inc. | | | (963,429 | ) | | | (42,178,921 | ) |
| | | | | | | | | |
| Packaging & Containers - (7.92%) | |
| Rock-Tenn Co., Class A | | | (2,509,826 | ) | | | (163,490,066 | ) |
| | | | | | | | | |
| Pharmaceuticals - (1.83%) | |
| AbbVie, Inc. | | | (566,947 | ) | | | (37,753,001 | ) |
| | | | | | | | | |
| Pipelines - (3.03%) | |
| Williams Companies, Inc. | | | (1,225,688 | ) | | | (62,632,657 | ) |
| | | | | | | | | |
| Retail - (0.63%) | |
| Ascena Retail Group, Inc. | | | (880,337 | ) | | | (13,011,381 | ) |
| | | | | | | | | |
| Savings & Loans - (0.45%) | |
| Sterling Bancorp | | | (693,093 | ) | | | (9,363,686 | ) |
| | | | | | | | | |
| Semiconductors - (0.60%) | |
| Avago Technologies Ltd. | | | (83,490 | ) | | | (12,362,364 | ) |
| | | | | | | | | |
| Telecommunications - (7.23%) | |
| AT&T, Inc. | | | (3,607,318 | ) | | | (124,596,764 | ) |
| See Notes to Financial Statements. | |
| Annual Report | May 31, 2015 | 13 |
| The Arbitrage Fund | Portfolio of Investments (continued) |
| | May 31, 2015 |
| SCHEDULE OF SECURITIES SOLD SHORT | | Shares | | | Value | |
| COMMON STOCKS - (29.42%)(Continued) | |
| Telecommunications - (7.23%) (Continued) | |
| Harris Corp. | | | (312,052 | ) | | $ | (24,720,759 | ) |
| | | | | | | | (149,317,523 | ) |
| | | | | | | | | |
| TOTAL COMMON STOCKS | | | | | | | | |
| (Proceeds $613,737,060) | | | | | | | (607,655,779 | ) |
| | | | | | | | | |
| EXCHANGE-TRADED FUNDS - (0.27%) | |
| Equity Funds - (0.27%) | |
SPDR® S&P 500® ETF Trust | | | (26,087 | ) | | | (5,507,748 | ) |
| | | | | | | | | |
| TOTAL EXCHANGE-TRADED FUNDS | | | | | | | | |
| (Proceeds $5,342,119) | | | | | | | (5,507,748 | ) |
| | | | | | | | | |
RIGHTS - (0.00%)(a) | |
| Chelsea Therapeutics, CVR | | | (1,100 | ) | | | (90 | ) |
| | | | | | | | | |
| TOTAL RIGHTS | | | | | | | | |
| (Proceeds $0) | | | | | | | (90 | ) |
| | | | | | | | | |
| TOTAL SECURITIES SOLD SHORT - (29.69%) | | | | | |
| (Proceeds $619,079,179) | | | | | | $ | (613,163,617 | ) |
(a) | Less than (0.005%) of net assets. |
SCHEDULE OF
WRITTEN OPTIONS | | Expiration
Date | | | Exercise Price | | | Contracts | | | Value | |
| Written Call Options | |
| Alcoa, Inc. | | | 06/2015 | | | $ | 13.00 | | | | (8,113 | ) | | $ | (85,186 | ) |
| AOL, Inc.: | | | | | | | | | | | | | | | | |
| | | | 06/2015 | | | | 50.00 | | | | (144 | ) | | | (1,440 | ) |
| | | | 07/2015 | | | | 50.00 | | | | (1,161 | ) | | | (17,415 | ) |
| Avago Technologies Ltd. | | | 06/2015 | | | | 145.00 | | | | (57 | ) | | | (33,060 | ) |
| Catamaran Corp. | | | 07/2015 | | | | 65.00 | | | | (153 | ) | | | (383 | ) |
| Hospira, Inc. | | | 08/2015 | | | | 90.00 | | | | (350 | ) | | | (1,750 | ) |
| Kraft Foods Group, Inc.: | | | | | | | | | | | | | | | | |
| | | | 06/2015 | | | | 85.00 | | | | (164 | ) | | | (13,940 | ) |
| | | | 09/2015 | | | | 85.00 | | | | (356 | ) | | | (80,100 | ) |
| Microchip Technology, Inc. | | | 10/2015 | | | | 50.00 | | | | (72 | ) | | | (16,560 | ) |
| Noble Energy, Inc. | | | 06/2015 | | | | 45.00 | | | | (384 | ) | | | (31,680 | ) |
| Pall Corp. | | | 06/2015 | | | | 125.00 | | | | (380 | ) | | | (2,850 | ) |
| See Notes to Financial Statements. | |
| 14 | www.arbitragefunds.com | 1-800-295-4485 |
| The Arbitrage Fund | Portfolio of Investments (continued) |
| | May 31, 2015 |
SCHEDULE OF
WRITTEN OPTIONS | | Expiration
Date | | | Exercise Price | | | Contracts | | | Value | |
| Written Call Options (Continued) | |
| ZF TRW Automotive Holdings Corp. | | | 07/2015 | | | $ | 105.00 | | | | (321 | ) | | $ | 0 | |
| | | | | | | | | | | | | | | | | |
| TOTAL WRITTEN CALL OPTIONS | | | | | | | | | | | | | |
| (Premiums received $993,663) | | | | (284,364 | ) |
| Written Put Options | |
| Alcoa, Inc. | | | 06/2015 | | | | 13.00 | | | | (8,113 | ) | | | (478,667 | ) |
| Avago Technologies Ltd. | | | 06/2015 | | | | 145.00 | | | | (269 | ) | | | (75,320 | ) |
| Catamaran Corp. | | | 07/2015 | | | | 57.50 | | | | (153 | ) | | | (4,973 | ) |
| Kraft Foods Group, Inc.: | | | | | | | | | | | | | | | | |
| | | | 06/2015 | | | | 82.50 | | | | (66 | ) | | | (3,135 | ) |
| | | | 06/2015 | | | | 83.50 | | | | (40 | ) | | | (3,000 | ) |
| | | | 06/2015 | | | | 85.00 | | | | (306 | ) | | | (42,840 | ) |
| | | | 09/2015 | | | | 87.50 | | | | (399 | ) | | | (191,520 | ) |
| Noble Energy, Inc. | | | 06/2015 | | | | 42.50 | | | | (1,461 | ) | | | (105,922 | ) |
| Omnicare, Inc. | | | 06/2015 | | | | 95.00 | | | | (135 | ) | | | (6,075 | ) |
| Pall Corp. | | | 06/2015 | | | | 120.00 | | | | (362 | ) | | | (2,715 | ) |
| PartnerRe Ltd. | | | 08/2015 | | | | 130.00 | | | | (202 | ) | | | (62,115 | ) |
| | | | | | | | | | | | | | | | | |
| TOTAL WRITTEN PUT OPTIONS | | | | | | | | | | | | | |
| (Premiums received $656,452) | | | | (976,282 | ) |
| | | | | | | | | | | | | | | | | |
| TOTAL WRITTEN OPTIONS | | | | | | | | | | | | | |
| (Premiums received $1,650,115) | | | $ | (1,260,646 | ) |
| See Notes to Financial Statements. | |
| Annual Report | May 31, 2015 | 15 |
| The Arbitrage Fund | Portfolio of Investments (continued) |
| | May 31, 2015 |
EQUITY SWAP CONTRACTS
| Swap Counterparty | Reference
Obligation | Rate
Paid/Received
by the Fund | Termination
Dates | | Notional
Amount | | | Unrealized
Appreciation | |
| Goldman, Sachs & Co. | Brit Plc | 1 Month-LIBOR
plus 0.45 bps | 04/12/2016 | | $ | 18,131,985 | | | $ | 73,938 | |
| Morgan Stanley | Brit Plc | 1 Day-SONIA
minus 0.90 bps | 02/17/2017 | | | 12,048,241 | | | | 38,851 | |
| Goldman, Sachs & Co. | Domino Printing Sciences Plc | 1 Month-LIBOR
plus 0.45 bps | 05/31/2016 | | | 39,986 | | | | 77 | |
| | | | | | $ | 30,220,212 | | | $ | 112,866 | |
OUTSTANDING FORWARD FOREIGN CURRENCY EXCHANGE CONTRACTS
Contract
Description | | Contracts to
Deliver/Receive | | Purchase/Sale
Contract | Expiration
Date | | Current Value | | | Unrealized
Appreciation | |
| AUD | | | 85,509,113 | | Sale | 06/15/2015 | | $ | 65,316,959 | | | $ | 77,029 | |
| CAD | | | 2,035,616 | | Purchase | 06/15/2015 | | | 1,636,415 | | | | 45,701 | |
| EUR | | | 93,602,600 | | Purchase | 06/15/2015 | | | 102,826,651 | | | | 2,726,705 | |
| NOK | | | 53,047,200 | | Purchase | 06/15/2015 | | | 6,822,825 | | | | 142,808 | |
| SEK | | | 255,742,400 | | Purchase | 06/15/2015 | | | 30,003,512 | | | | 742,442 | |
| SGD | | | 2,609,200 | | Purchase | 06/15/2015 | | | 1,934,741 | | | | 51,205 | |
| | | | | | | | | | | | | $ | 3,785,890 | |
Contract
Description | | Contracts to
Deliver/Receive | | Purchase/Sale
Contract | Expiration
Date | | Current Value | | | Unrealized
Depreciation | |
| AUD | | | 85,285,400 | | Purchase | 06/15/2015 | | $ | 65,146,073 | | | $ | (326,711 | ) |
| CAD | | | 2,035,616 | | Sale | 06/15/2015 | | | 1,636,415 | | | | (37,122 | ) |
| EUR | | | 225,317,398 | | Sale | 06/15/2015 | | | 247,521,260 | | | | (5,238,611 | ) |
| GBP | | | 5,310,400 | | Sale | 06/15/2015 | | | 8,115,424 | | | | (2,429,875 | ) |
| NOK | | | 56,524,500 | | Sale | 06/15/2015 | | | 7,270,068 | | | | (375,894 | ) |
| SEK | | | 255,742,400 | | Sale | 06/15/2015 | | | 30,003,512 | | | | (308,783 | ) |
| SGD | | | 2,609,200 | | Sale | 06/15/2015 | | | 1,934,741 | | | | (61,776 | ) |
| | | | | | | | | | | | | $ | (8,778,772 | ) |
| See Notes to Financial Statements. | |
| 16 | www.arbitragefunds.com | 1-800-295-4485 |
| The Arbitrage Fund | Portfolio of Investments (continued) |
| | May 31, 2015 |
The following is a summary of investments classified by foreign country exposure:
| Country | | % of Net Assets(a) | |
| Great Britain | | | 4.71 | % |
| Bermuda | | | 3.05 | % |
| Italy | | | 2.21 | % |
| Netherlands | | | 0.82 | % |
| Israel | | | 0.51 | % |
| France | | | 0.40 | % |
| United Kingdom | | | 0.10 | % |
| Australia | | | 0.01 | % |
| United States | | | 88.52 | % |
| Liabilities in Excess of Other Assets | | | (0.33 | )% |
| | | | 100.00 | % |
(a) | These percentages represent long positions only and are not net of short positions. |
| Abbreviations: |
| |
| AUD - Australian Dollar |
| bps - Basis Points |
| CAD - Canadian Dollar |
| CPR - Conditional Prepayment Rate |
| CVR - Contingent Value Rights |
| ETF - Exchange-Traded Fund |
| EUR - Euro |
| GBP - British Pound |
| LIBOR - London Interbank Offered Rate |
| LP - Limited Partnership |
| Ltd. - Limited |
| NOK - Norwegian Kronor |
| N.V. - Naamloze Vennootschap is the Dutch term for a public limited liability corporation |
| Plc - Public Limited Company |
| SA - Generally designates corporations in various countries, mostly those employing civil law. This translates literally in all languages mentioned as anonymous company |
| SEK - Swedish Kronor |
| SGD - Singapore Dollar |
| SONIA - Sterling OverNight Index Average |
| S&P - Standard & Poor’s |
| SpA - Societa per Azione |
| SPDR - Standard & Poor’s Depositary Receipt |
| See Notes to Financial Statements. | |
| Annual Report | May 31, 2015 | 17 |
| The Arbitrage Fund | |
| | May 31, 2015 |
The following table summarizes the Arbitrage Fund’s investments and derivative financial instruments categorized in the disclosure hierarchy as of May 31, 2015:
| | | | | | | | | | | | | |
Investments in Securities at Value* | | | | | | | | | | | | |
| | | Level 1 | | | Level 2 | | | Level 3 | | | Total | |
| Assets | | | | | | | | | | | | |
Common Stocks** | | $ | 1,645,028,039 | | | $ | – | | | $ | – | | | $ | 1,645,028,039 | |
| Limited Partnerships | | | 61,428,660 | | | | – | | | | – | | | | 61,428,660 | |
| Rights | | | – | | | | – | | | | 10,711,137 | | | | 10,711,137 | |
| Purchased Options | | | 3,034,554 | | | | 0 | | | | – | | | | 3,034,554 | |
| Short-Term Investments | | | 352,115,204 | | | | – | | | | – | | | | 352,115,204 | |
| TOTAL | | $ | 2,061,606,457 | | | $ | 0 | | | $ | 10,711,137 | | | $ | 2,072,317,594 | |
| | | | | | | | | | | | | | | | | |
Other Financial Instruments*** | | | | | | | | | | | | | | | | |
| Assets | | | | | | | | | | | | | | | | |
| Equity Swap Contracts | | $ | 112,866 | | | $ | – | | | $ | – | | | $ | 112,866 | |
| Forward Foreign Currency Exchange Contracts | | | – | | | | 3,785,890 | | | | – | | | | 3,785,890 | |
| Liabilities | | | | | | | | | | | | | | | | |
Common Stocks** | | | (607,655,779 | ) | | | – | | | | – | | | | (607,655,779 | ) |
| Exchange-Traded Funds | | | (5,507,748 | ) | | | – | | | | – | | | | (5,507,748 | ) |
| Rights | | | – | | | | – | | | | (90 | ) | | | (90 | ) |
| Written Options | | | (1,260,646 | ) | | | 0 | | | | – | | | | (1,260,646 | ) |
| Forward Foreign Currency Exchange Contracts | | | – | | | | (8,778,772 | ) | | | – | | | | (8,778,772 | ) |
| TOTAL | | $ | (614,311,307 | ) | | $ | (4,992,882 | ) | | $ | (90 | ) | | $ | (619,304,279 | ) |
| * | Refer to footnote 2 where leveling hierarchy is defined. |
| ** | Refer to Portfolio of Investments for sector information. |
| *** | Other financial instruments are instruments such as securities sold short, written options, equity swap contracts, and forward foreign currency contracts. |
| See Notes to Financial Statements. | |
| 18 | www.arbitragefunds.com | 1-800-295-4485 |
| The Arbitrage Fund | |
| | May 31, 2015 |
The following is a reconciliation of the fair valuations using significant unobservable inputs (Level 3) for the Fund’s assets and liabilities during the year ended May 31, 2015:
| | | | | | | | | | | | | | | | | | | | | | | | | | | | |
Investments
in Securities | | Balance as
of May 31, 2014 | | | Realized
Gain | | | Change in
Unrealized
Depreciation | | | Purchases | | | Sales
Proceeds | | | Transfer
into
Level 3 | | | Transfer out of Level 3 | | | Balance as
of May 31,
2015 | | | Net change in
unrealized
depreciation
included in the
Statements of
Operations
attributable to
Level 3
investments
held at
May 31, 2015 | |
| Common Stocks | | $ | 21,230 | | | $ | 19,478 | | | $ | (876 | ) | | $ | – | | | $ | (39,832 | ) | | $ | – | | | $ | – | | | $ | – | | | $ | – | |
| Rights | | | 7,414,115 | | | | 948,995 | | | | (2,167,292 | ) | | | 6,619,752 | | | | (2,104,433 | ) | | | – | | | | – | | | | 10,711,137 | | | | (1,765,662 | ) |
| Total | | $ | 7,435,345 | | | $ | 968,473 | | | $ | (2,168,168 | ) | | $ | 6,619,752 | | | $ | (2,144,265 | ) | | $ | – $– | | | $ | 10,711,137 | | | $ | (1,765,662 | ) | | | | |
| | | | | | | | | | | | | | | | | | | | | | | | | | | | | | | | | | | | | |
Other
Financial
Instruments | | Balance as
of May 31,
2014 | | | Realized
Gain | | | Change in
Unrealized
Depreciation | | | Purchases | | | Sales
Proceeds | | | Transfer
into
Level 3 | | | Transfer out of
Level 3 | | | Balance as
of May 31,
2015 | | | Net change in
unrealized
depreciation
included in the
Statements of
Operations
attributable to
Level 3
investments
held at
May 31, 2015 | |
| Rights | | $ | – | | | $ | – | | | $ | (90 | ) | | $ | – | | | $ | – | | | $ | – $– | | | $ | (90 | ) | | $ | (90 | ) | | | | |
| Total | | $ | – | | | $ | – | | | $ | (90 | ) | | $ | – | | | $ | – | | | $ | – | | | $ | – | | | $ | (90 | ) | | $ | (90 | ) |
| See Notes to Financial Statements. | |
| Annual Report | May 31, 2015 | 19 |
| The Arbitrage Event-Driven Fund | Manager Commentary |
| | May 31, 2015 |
The Arbitrage Event‐Driven Fund | Tickers: AEDNX, AEDFX, AEFCX, AGEAX
The Fund’s Goal and Main Investments The Fund seeks to provide capital growth by investing in credit and equity securities involved in specific corporate events, with a focus on low volatility and low correlation relative to the broader capital markets. |
Investment Strategy
The Fund’s investment process follows a disciplined, fundamental approach that values downside protection while identifying compelling risk/reward opportunities available to us as we screen catalyst‐driven corporate events, such as mergers and acquisitions, restructurings, refinancings, recapitalizations, spin‐offs, litigation, regulatory changes, bankruptcy, and more. We analyze these events through three core approaches: merger arbitrage, equity special situations, and credit opportunities. We seek to generate investment returns that have low volatility and low correlation compared to the broader capital markets. We do not manage against any particular benchmark, and believe that capital preservation in difficult markets is as important as generating positive returns within our low correlated, low volatility event‐driven strategy. This process and approach has been an integral part of the culture at Water Island Capital since the firm’s inception.
Commentary
For event-driven investors, 2014 was a challenging year – but not for want of opportunities. A slow-growth global economy, attractive financing terms, cash-rich balance sheets, and rich acquisition currency reignited efforts to unlock shareholder value, whether through spin-offs, restructurings, refinancings, acquisitions or other corporate actions. We witnessed the return of hostile offers, topping bids, and acquirers becoming targets. Activist investors agitated boards into complicated corporate restructuring maneuvers fueled by insatiable demand for high yield paper and leveraged loans. Amidst these positive trends, macroeconomic uncertainties – from falling energy prices, to geopolitical uncertainties in Europe and Asia – elongated many corporate event timelines and made it difficult for event-driven managers to recognize positive returns for investors in the near term.
Fiscal Year Highlights
In fiscal 2015, the Arbitrage Event‐Driven Fund (AEDNX) returned -2.96%. This result was predominantly derived from companies residing in the Americas. In terms of sectors, health care and consumer staples were the largest contributors, while energy and financials were the largest detractors. Of our three sub-strategies – merger arbitrage, equity special situations, and credit opportunities – merger arbitrage provided a positive contribution over the period, while credit opportunities and equity special situations detracted from returns.
Our largest contributor during the fiscal year was our equity special situations investment in Mylan. We initially became involved with Mylan in calendar year 2014 on our view that the company would either successfully lower taxes through an inversion via its acquisition of Abbot Laboratories’ generic pharmaceuticals business, or fail to invert and become a take-out target itself. We believed either scenario would cause the stock to re-rate to a higher valuation. While our analysis of the Treasury notice on inversions concluded that Mylan would not be affected due to its unique transaction structure, the market was happy to short this perennial sector underperformer as an ‘inversion hedge’ to investments in other inversion-related positions. In October, the company publicly re-committed to the inversion transaction and increased their earnings forecast, causing investors to take a less favorable view to shorting the stock. We subsequently sold out of the position on the move higher, but continued to monitor in anticipation of another catalyst occurring.
| | |
| 20 | www.arbitragefunds.com | 1-800-295-4485 |
| The Arbitrage Event-Driven Fund | Manager Commentary (continued) |
| | May 31, 2015 (Unaudited) |
That new catalyst occurred in April when Mylan initiated an unsolicited bid for Perrigo Company, an Ireland-based over-the-counter pharmaceutical maker. The deal would be accretive for Mylan, yet to date, Perrigo has rebuffed Mylan’s offer. In turn, Mylan has received its own unsolicited acquisition offer, from Teva Pharmaceuticals of Israel. We see potential upside for Mylan in either situation and have re-initiated a position in the stock.
Actavis’ $65 billion acquisition of Allergan was also one of the largest contributors for the period. In April 2014, Valeant and Pershing Square Capital, Allergan’s largest shareholder, combined efforts for a $47 billion hostile offer to purchase Allergan. Allergan sports a robust portfolio of medical aesthetic drugs and products, the most well-known being Botox. Despite Valeant increasing its bid in late May, another company, Actavis, entered with a topping bid in November and Valeant walked away a few days later. The deal closed in March and the Fund profited by holding a core position in Allergan.
Another positive contributor was our investment in T-Mobile. Positive sentiment thanks to increasing subscriber growth and rumors that Deutsche Telekom AG, the largest shareholder of T-Mobile, was looking to sell its stake contributed to a rise in T-Mobile’s share price over the period. DISH has been rumored as the most likely bidder for the company, and the Fund continues to hold a position on the belief that a merger could come to fruition sometime in the near future.
The largest drag on performance during the past year was our position in Genworth. Following a disappointing earnings release in the summer of 2014, shares of Genworth, a life insurance and mortgage insurance company, fell by 35%. Despite our view that Genworth’s mortgage insurance division would be the key driver of shareholder value over the years ahead, we were disappointed by the struggling long-term care results and we believed the overhang would remove the positive momentum from the mortgage insurance business for the foreseeable future. While we believe there is a clear case for shareholders to agitate for a break-up into two separate public companies – one owning the mortgage insurance division and the other holding the life insurance and long-term care units – we believe that scenario is unlikely to occur until the long-term care business is self-sustainable and thus have exited the position.
Our investment in the Sabine-Forest Oil merger also detracted from performance over the period. Our thesis for this investment was that Sabine would refinance their 2017 9.75% bonds to extend the runway for the post-merger company from their planned acquisition of Forest Oil. While the deal closed in December, due to lower oil prices and a lack of attractive financing terms, the 9.75% bonds remained outstanding. Consequently, we were subject to the high yield market’s lack of liquidity and widening price action for this position.
| | |
| Annual Report | May 31, 2015 | 21 |
| The Arbitrage Event-Driven Fund | Manager Commentary (continued) |
| | May 31, 2015 (Unaudited) |
Outlook
As acquisitions continue to replace share buybacks, dividend increases, and cost-cutting efforts – particularly in slow growth, global industries – M&A deal volume should remain elevated. The momentum from large- and mega-cap transaction activity usually cascades to other capitalization levels, which would give us a broader opportunity set in our merger arbitrage sleeve of the Fund, and we have started to witness the early innings of this trend occurring. The return of volatility to the merger arbitrage space has led to spreads widening in long-dated deals and the re-pricing of risk on newly announced deals. We believe this marks the beginning of a more normalized spread environment, whereby investors begin to price risk appropriately. Furthermore, while the specter of rising interest rates – which have historically provided a tailwind for merger arbitrage returns – has loomed on the horizon for some time now, and even if short-term rates remain at historically low levels, as long as volatility persists we believe our approach to investing in definitive, announced merger deals should yield attractive risk-adjusted returns.
In our equity special situations sleeve, we feel we are in the middle innings of a number of our investment opportunities. Following the dislocation in equity markets caused in part by the Shire/AbbVie deal break and the collapse in oil prices in October of 2014, we had the opportunity to build positions in distressed energy names at favorable entry points. We felt consolidation in the space would be a necessary outcome of the steep decline in commodity prices. While these names have seen increased volatility as of late, these positions remain some of our highest conviction ideas as we feel their shares will see significant upside once their particular catalysts are realized. As markets began to rebound in Q1 2015, we felt the pendulum of investor sentiment had perhaps swung too far in the opposite direction, providing an opportunity to capitalize on what we saw as investor complacency. We initiated a number of short positions on the catalyst-driven ideas we believed had become overvalued. These weren’t necessarily events we believed would not create value for the companies involved, but rather situations where we felt the markets had priced in too much of the value of the catalyst too soon. Many of these situations are still pending, but some have already begun to pay off. These situations, in addition to a number of catalysts predicated on record amounts of shareholder activism and a lack of organic growth options for many corporations, are providing ample opportunity for our equity special situations team.
In the credit opportunities sleeve of the Fund, we anticipate increased mergers and acquisitions activity will translate into more merger-related debt opportunities for us. We also expect that activist pressure on corporate managements and boards will translate into more spin-offs and asset sales, which, in turn, can lead to more refinancing and deleveraging activity from which to choose. We are particularly fond of these types of investments as their firmer catalysts and shorter durations can help produce lower correlated and less volatile returns for the portfolio.
As we embark on fiscal year 2016, we will stay true to our discipline of capitalizing on corporate events by understanding the rationale and underlying complexities of each situation, sharing insights between our teams, using hedges to mitigate market influence, and building well-diversified portfolios. We believe through this approach, the Arbitrage Event-Driven Fund can generate attractive long-term results with lower volatility and correlation to broader markets.
Sincerely,
The Investment Team at Water Island Capital
| | |
| 22 | www.arbitragefunds.com | 1-800-295-4485 |
| The Arbitrage Event-Driven Fund | Portfolio Information |
| | May 31, 2015 (Unaudited) |
Performance (annualized returns as of May 31, 2015)
| | One Year | Since Inception* |
| Arbitrage Event-Driven Fund, Class R | -3.12% | 2.24% |
| Arbitrage Event-Driven Fund, Class I | -2.96% | 2.48% |
| Arbitrage Event-Driven Fund, Class C** | -4.89% | 1.07% |
| Arbitrage Event-Driven Fund, Class A*** | -6.40% | -0.45% |
| HFRI Event Driven Index | 1.99% | 5.87% |
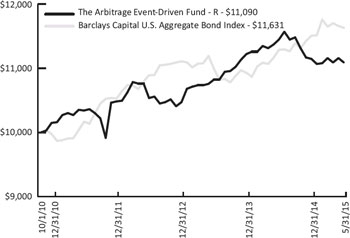
| Barclays Capital U.S. Aggregate Bond Index | 3.03% | 3.29% |
Current performance may be higher or lower than performance quoted above. Any performance data quoted represents past performance, and the investment return and principal value of an investment in the Fund will fluctuate so that an investor’s shares, when redeemed, may be worth more or less than their original cost. Past performance is no guarantee of future results. Returns do not reflect a 2% redemption fee for shares that are redeemed from the fund within 30 days of purchase, which, if reflected, would reduce the performance quoted. Returns shown above include the reinvestment of all dividends and capital gains. Contractual fee waivers are currently in effect. Without such fee waivers, performance numbers would be reduced. You can obtain
performance data current to the most recent month end by calling 1-800-295-4485 or going
to www.arbitragefunds.com.
| * | Class R and Class I inception: 10/1/10; Class C inception: 6/1/12; Class A inception: 6/1/13. |
| ** | Class C shares are subject to a 1.00% contingent deferred sales charge on all purchases redeemed in 12 months of purchase. |
| *** | Class A shares are subject to a maximum front-end sales load of 3.25% on purchases up to $500,000. The shares are also subject to a deferred sales charge of up to 1.00% on purchases of $500,000 or more purchased without a front-end sales load and redeemed within 18 months of purchase. |
The Total Annual Fund Operating Expenses for Class R, Class I, Class C and Class A are 2.36%, 2.11%, 3.11% and 2.36%, respectively. The Advisor has agreed to waive fees in excess of 1.69%, 1.44%, 2.44% and 1.69% for Class R, Class I, Class C and Class A, respectively, until at least August 31, 2016.
The HFRI Event Driven Index is an index of companies currently or prospectively involved in corporate transactions of a wide variety including but not limited to mergers, restructurings, financial distress, tender offers, shareholder buybacks, debt exchanges, security issuance or other capital structure adjustments. Security types can range from most senior in the capital structure to most junior or subordinated and frequently involve additional derivative securities. Event-Driven exposure includes a combination of sensitivities to equity markets, credit markets and idiosyncratic, company-specific developments.
The Barclays Capital U.S. Aggregate Bond Index is a market value-weighted index of investment-grade fixed-rated debt issues, including government, corporate, asset-backed and mortgage-backed securities with a maturity of one year or more.
An investor may not invest directly in an index.
| | |
| Annual Report | May 31, 2015 | 23 |
| The Arbitrage Event-Driven Fund | Portfolio Information (continued) |
| | May 31, 2015 (Unaudited) |
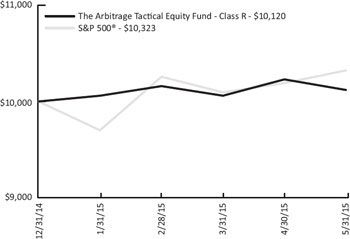
Growth of $10,000 Investment
The chart represents historical performance of a hypothetical investment of $10,000 in the Class R shares of the Fund since inception. Past performance does not guarantee future results. This chart does not reflect the deduction of taxes that a shareholder would pay on Fund distributions or the redemption of Fund shares.
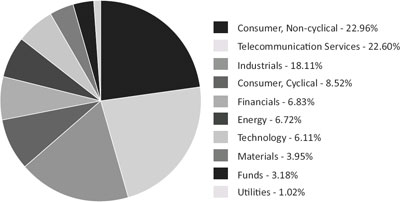
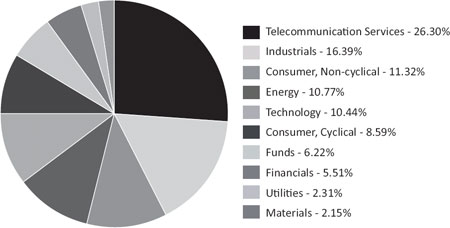
Sector Weighting
The following chart shows the sector weightings of the Arbitrage Event-Driven Fund’s investments in common stock, corporate bonds, convertible corporate bonds and exchange-traded funds as of the report date.
| | |
| 24 | www.arbitragefunds.com | 1-800-295-4485 |
| The Arbitrage Event-Driven Fund | Portfolio of Investments |
| | May 31, 2015 |
| | | Shares | | | Value | |
| COMMON STOCKS - 79.85% | | | | | | |
| Aerospace & Defense - 2.65% | | | | | | |
B/E Aerospace, Inc.(a)(b) | | | 166,940 | | | $ | 9,572,340 | |
KLX, Inc.(b)(c) | | | 142,322 | | | | 6,239,396 | |
| | | | | | | | 15,811,736 | |
| | | | | | | | | |
| Auto Parts & Equipment - 0.56% | | | | | | | | |
Visteon Corp.(c) | | | 30,701 | | | | 3,362,374 | |
| | | | | | | | | |
| Banks - 0.17% | | | | | | | | |
Hudson Valley Holding Corp.(a) | | | 39,673 | | | | 1,025,150 | |
| | | | | | | | | |
| Beverages - 0.70% | | | | | | | | |
Molson Coors Brewing Co., Class B(b) | | | 56,532 | | | | 4,148,318 | |
| | | | | | | | | |
| Biotechnology - 1.97% | | | | | | | | |
Synageva BioPharma Corp.(b)(c) | | | 55,040 | | | | 11,746,086 | |
| | | | | | | | | |
| Chemicals - 2.53% | | | | | | | | |
Axalta Coating Systems Ltd.(a)(b)(c) | | | 218,959 | | | | 7,499,346 | |
| Sigma-Aldrich Corp. | | | 43,268 | | | | 6,027,232 | |
| Zep, Inc. | | | 75,886 | | | | 1,514,685 | |
| | | | | | | | 15,041,263 | |
| | | | | | | | | |
| Coal - 1.90% | | | | | | | | |
Cloud Peak Energy, Inc.(a)(b)(c) | | | 162,049 | | | | 935,023 | |
CONSOL Energy, Inc.(a)(b) | | | 346,684 | | | | 9,651,682 | |
Peabody Energy Corp.(a)(b) | | | 217,474 | | | | 735,062 | |
| | | | | | | | 11,321,767 | |
| | | | | | | | | |
| Computers - 1.63% | | | | | | | | |
EMC Corp.(a)(b) | | | 369,708 | | | | 9,738,109 | |
| | | | | | | | | |
| Computers & Computer Services - 1.61% | | | | | | | | |
Hewlett-Packard Co.(a)(b) | | | 286,504 | | | | 9,569,234 | |
| | | | | | | | | |
| Cosmetics & Personal Care - 0.14% | | | | | | | | |
| Coty, Inc., Class A | | | 32,629 | | | | 813,441 | |
| | | | | | | | | |
| Electric - 1.36% | | | | | | | | |
Dynegy, Inc.(a)(b)(c) | | | 251,103 | | | | 8,120,671 | |
| | | | | | | | | |
| Food - 0.07% | | | | | | | | |
Kraft Foods Group, Inc.(b) | | | 4,963 | | | | 419,125 | |
| See Notes to Financial Statements. | |
| Annual Report | May 31, 2015 | 25 |
| The Arbitrage Event-Driven Fund | Portfolio of Investments (continued) |
| | May 31, 2015 |
| | | Shares | | | Value | |
| COMMON STOCKS - 79.85% (Continued) | | | | | | |
| Healthcare - Products - 1.09% | | | | | | |
| Synergy Health Plc | | | 232,215 | | | $ | 6,470,144 | |
| | | | | | | | | |
| Home Furnishings - 0.04% | | | | | | | | |
| Ethan Allen Interiors, Inc. | | | 10,357 | | | | 259,961 | |
| | | | | | | | | |
| Insurance - 1.49% | | | | | | | | |
PartnerRe Ltd.(b) | | | 67,313 | | | | 8,846,948 | |
| | | | | | | | | |
| Internet - 2.06% | | | | | | | | |
Borderfree, Inc.(c) | | | 110,452 | | | | 1,545,223 | |
ClickSoftware Technologies Ltd.(c) | | | 17,241 | | | | 216,892 | |
Yahoo!, Inc.(a)(c) | | | 244,252 | | | | 10,486,960 | |
| | | | | | | | 12,249,075 | |
| | | | | | | | | |
| Leisure Time - 1.74% | | | | | | | | |
Life Time Fitness, Inc.(c) | | | 144,305 | | | | 10,375,529 | |
| | | | | | | | | |
| Lodging - 3.30% | | | | | | | | |
MGM Resorts International(b)(c) | | | 541,042 | | | | 10,847,892 | |
Starwood Hotels & Resorts Worldwide, Inc.(b) | | | 106,189 | | | | 8,788,202 | |
| | | | | | | | 19,636,094 | |
| | | | | | | | | |
| Media - 10.04% | | | | | | | | |
Charter Communications, Inc., Class A(b)(c) | | | 40,002 | | | | 7,161,158 | |
DIRECTV(a)(c) | | | 328,617 | | | | 29,917,292 | |
DISH Network Corp., Class A(b)(c) | | | 138,203 | | | | 9,783,390 | |
Media General, Inc.(b)(c) | | | 339,889 | | | | 5,628,562 | |
Viacom, Inc., Class B(b) | | | 108,819 | | | | 7,277,815 | |
| | | | | | | | 59,768,217 | |
| | | | | | | | | |
| Metal Fabricate & Hardware - 2.04% | | | | | | | | |
RTI International Metals, Inc.(c) | | | 343,687 | | | | 12,121,840 | |
| | | | | | | | | |
Mining - 0.00% (d) | | | | | | | | |
Nevada Copper Corp.(c) | | | 6,725 | | | | 10,166 | |
Yancoal Australia Ltd.(c) | | | 198,487 | | | | 22,763 | |
| | | | | | | | 32,929 | |
| | | | | | | | | |
| Miscellaneous Manufacturing - 8.16% | | | | | | | | |
Pall Corp.(b) | | | 158,700 | | | | 19,748,628 | |
Polypore International, Inc.(a)(c) | | | 291,995 | | | | 17,493,420 | |
| See Notes to Financial Statements. | |
| 26 | www.arbitragefunds.com | 1-800-295-4485 |
| The Arbitrage Event-Driven Fund | Portfolio of Investments (continued) |
| | May 31, 2015 |
| | | Shares | | | Value | |
| COMMON STOCKS - 79.85% (Continued) | | | | | | |
| Miscellaneous Manufacturing - 8.16% (Continued) | | | | |
| SPX Corp.(b) | | | 152,793 | | | $ | 11,354,048 | |
| | | | | | | | 48,596,096 | |
| | | | | | | | | |
| Oil & Gas - 0.06% | | | | | | | | |
| Cobalt International Energy, Inc.(b)(c) | | | 36,255 | | | | 368,351 | |
| | | | | | | | | |
| Oil & Gas Services - 1.58% | | | | | | | | |
| Exterran Holdings, Inc.(a)(b) | | | 191,407 | | | | 6,327,915 | |
| Weatherford International Plc(a)(b)(c) | | | 221,757 | | | | 3,064,682 | |
| | | | | | | | 9,392,597 | |
| | | | | | | | | |
| Packaging & Containers - 3.45% | | | | | | | | |
| Ball Corp.(b) | | | 165,570 | | | | 11,753,815 | |
| Berry Plastics Group, Inc.(a)(b)(c) | | | 262,192 | | | | 8,775,566 | |
| | | | | | | | 20,529,381 | |
| | | | | | | | | |
| Pharmaceuticals - 14.82% | | | | | | | | |
| AbbVie, Inc. | | | 239,289 | | | | 15,934,254 | |
| Actavis Plc(b)(c) | | | 32,043 | | | | 9,831,113 | |
| Catamaran Corp.(b)(c) | | | 126,396 | | | | 7,564,801 | |
| Hospira, Inc.(a)(b)(c) | | | 255,085 | | | | 22,554,616 | |
| Mylan N.V.(b)(c) | | | 36,829 | | | | 2,674,890 | |
| Omnicare, Inc.(b) | | | 124,287 | | | | 11,843,308 | |
| Perrigo Co., Plc(b) | | | 30,282 | | | | 5,762,665 | |
Teva Pharmaceutical Industries Ltd., Sponsored ADR(a)(b) | | | 201,074 | | | | 12,084,547 | |
| | | | | | | | 88,250,194 | |
| | | | | | | | | |
| Real Estate - 1.53% | | | | | | | | |
| Forest City Enterprises, Inc., Class A(c) | | | 395,487 | | | | 9,119,930 | |
| | | | | | | | | |
| Real Estate Investment Trusts - 1.64% | | | | | | | | |
| InfraREIT, Inc. | | | 36,371 | | | | 1,102,042 | |
| Macerich Co. | | | 105,830 | | | | 8,689,701 | |
| | | | | | | | 9,791,743 | |
| | | | | | | | | |
| Retail - 2.87% | | | | | | | | |
| ANN, Inc.(c) | | | 155,278 | | | | 7,259,246 | |
| Bob Evans Farms, Inc.(a)(b) | | | 90,730 | | | | 4,167,229 | |
| Staples, Inc.(b) | | | 342,567 | | | | 5,640,366 | |
| | | | | | | | 17,066,841 | |
| See Notes to Financial Statements. | |
| Annual Report | May 31, 2015 | 27 |
| The Arbitrage Event-Driven Fund | Portfolio of Investments (continued) |
| | May 31, 2015 |
| | | Shares | | | Value | |
| COMMON STOCKS - 79.85% (Continued) | | | | | | |
| Semiconductors - 1.13% | | | | | | |
| Broadcom Corp., Class A | | | 118,381 | | | $ | 6,729,960 | |
| | | | | | | | | |
| Software - 1.21% | | | | | | | | |
Informatica Corp.(a)(c) | | | 67,346 | | | | 3,259,547 | |
Salesforce.com, Inc.(b)(c) | | | 54,131 | | | | 3,938,030 | |
| | | | | | | | 7,197,577 | |
| | | | | | | | | |
| Telecommunications - 4.82% | | | | | | | | |
Cyan, Inc.(c) | | | 613,319 | | | | 3,244,458 | |
| Frontier Communications Corp. | | | 1,002,601 | | | | 5,163,395 | |
Harris Corp.(b) | | | 136,064 | | | | 10,779,024 | |
HC2 Holdings, Inc.(c) | | | 316,259 | | | | 3,532,613 | |
T-Mobile US, Inc.(a)(b)(c) | | | 154,165 | | | | 5,993,935 | |
| | | | | | | | 28,713,425 | |
| | | | | | | | | |
| Transportation - 1.49% | | | | | | | | |
| Ansaldo STS SpA | | | 272,086 | | | | 2,807,527 | |
| TNT Express N.V. | | | 133,039 | | | | 1,122,176 | |
XPO Logistics, Inc.(b)(c) | | | 100,604 | | | | 4,945,693 | |
| | | | | | | | 8,875,396 | |
| | | | | | | | | |
| TOTAL COMMON STOCKS | | | | | | | | |
| (Cost $471,744,306) | | | | | | | 475,509,502 | |
| | | | | | | | | |
| LIMITED PARTNERSHIPS - 0.75% | | | | | | | | |
| Pipelines - 0.75% | | | | | | | | |
| Williams Partners LP | | | 79,779 | | | | 4,458,051 | |
| | | | | | | | | |
| TOTAL LIMITED PARTNERSHIPS | | | | | | | | |
| (Cost $4,522,285) | | | | | | | 4,458,051 | |
| | | | | | | | | |
| EXCHANGE-TRADED NOTES - 0.04% | | | | | | | | |
| Specialty Funds - 0.04% | | | | | | | | |
iPath® S&P 500® VIX Short-Term Futures™ ETN(c) | | | 14,471 | | | | 274,949 | |
| | | | | | | | | |
| TOTAL EXCHANGE-TRADED NOTES | | | | | | | | |
| (Cost $344,848) | | | | | | | 274,949 | |
| | | | | | | | | |
| RIGHTS - 0.12% | | | | | | | | |
ArthroCare Corp., CVR(c)(e)(f) | | | 157,791 | | | | 53,270 | |
Casa Ley, CVR(c)(e)(f) | | | 891,084 | | | | 322,127 | |
Chelsea Therapeutics, CVR(c)(e)(f) | | | 434,520 | | | | 35,413 | |
| See Notes to Financial Statements. | |
| 28 | www.arbitragefunds.com | 1-800-295-4485 |
| The Arbitrage Event-Driven Fund | Portfolio of Investments (continued) |
| | May 31, 2015 |
| | | Shares | | | Value | |
| RIGHTS - 0.12% (Continued) | | | | | | |
Cubist Pharmaceuticals, Inc., CPR(c)(e)(f) | | | 34,500 | | | $ | 0 | |
Leap Wireless International, CVR(c)(e)(f) | | | 64,802 | | | | 249,488 | |
PDC, CVR(c)(e)(f) | | | 891,084 | | | | 20,049 | |
Trius Therapeutics, CVR(c)(e)(f) | | | 103,378 | | | | 17,564 | |
| | | | | | | | | |
| TOTAL RIGHTS | | | | | | | | |
| (Cost $1,170,262) | | | | | | | 697,911 | |
| | | | Maturity Date | | Rate(g) | | | Principal Amount | | | Value | |
| BANK LOANS - 2.21% | | | | | | | | | | | | |
| FairPoint Communications, Inc. | | | 02/14/2019 | | | 7.500 | % | | $ | 2,659,296 | | | $ | 2,687,565 | |
| OSG Bulk Ships, Inc. | | | 07/22/2019 | | | 5.250 | % | | | 5,309,875 | | | | 5,343,061 | |
| Station Casinos | | | 03/01/2020 | | | 4.250 | % | | | 2,381,187 | | | | 2,390,867 | |
| Zayo Bandwidth LLC | | | 05/06/2021 | | | 4.000 | % | | | 2,728,065 | | | | 2,728,679 | |
| | | | | | | | | | | | | | | | |
| | | | | | | | | | | | | | | | |
| TOTAL BANK LOANS | | | | | | | | | | | | | | | |
| (Cost $13,175,402) | | | | | | | | | | | | | | 13,150,172 | |
| | | | | | | | | | | | | | | | |
| CORPORATE BONDS - 20.12% | | | | | | | | | | | | | | | |
| Auto Parts & Equipment - 0.70% | | | | | | | | | | | | | | | |
| TRW Automotive, Inc.(h) | | | 03/01/2021 | | | 4.500 | % | | | 4,121,000 | | | | 4,172,513 | |
| | | | | | | | | | | | | | | | |
| Banks - 0.30% | | | | | | | | | | | | | | | |
| Wells Fargo Capital X | | | 12/15/2036 | | | 5.950 | % | | | 1,768,000 | | | | 1,798,940 | |
| | | | | | | | | | | | | | | | |
| Chemicals - 0.39% | | | | | | | | | | | | | | | |
| Ashland, Inc. | | | 04/15/2018 | | | 3.875 | % | | | 2,275,000 | | | | 2,343,705 | |
| | | | | | | | | | | | | | | | |
| Diversified Financial Services - 1.26% | | | | | | | | | | | | | | | |
| Ally Financial, Inc. | | | 03/15/2020 | | | 8.000 | % | | | 3,240,000 | | | | 3,831,300 | |
Prospect Holding Co., LLC / Prospect Holding Finance Co.(h) | | | 10/01/2018 | | | 10.250 | % | | | 5,321,000 | | | | 3,671,490 | |
| | | | | | | | | | | | | | | 7,502,790 | |
| Electronics - 1.30% | | | | | | | | | | | | | | | |
Viasystems, Inc.(h) | | | 05/01/2019 | | | 7.875 | % | | | 7,317,000 | | | | 7,756,020 | |
| | | | | | | | | | | | | | | | |
| Entertainment - 0.72% | | | | | | | | | | | | | | | |
| Pinnacle Entertainment, Inc. | | | 04/01/2022 | | | 7.750 | % | | | 3,855,000 | | | | 4,259,775 | |
| See Notes to Financial Statements. | |
| Annual Report | May 31, 2015 | 29 |
| The Arbitrage Event-Driven Fund | Portfolio of Investments (continued) |
| | May 31, 2015 |
| | | | Maturity Date | | Rate(g) | | | Principal Amount | | | Value | |
| CORPORATE BONDS - 20.12% (Continued) | | | | |
| Food - 2.20% | | | | | | | | | | | | |
HJ Heinz Co.(h) | | | 02/15/2025 | | | 4.875 | % | | $ | 3,894,000 | | | $ | 4,195,785 | |
| US Foods, Inc. | | | 06/30/2019 | | | 8.500 | % | | | 8,501,000 | | | | 8,883,545 | |
| | | | | | | | | | | | | | | 13,079,330 | |
| Healthcare - Products - 2.93% | | | | | | | | | | | | |
| Biomet, Inc. | | | 10/01/2020 | | | 6.500 | % | | | 16,600,000 | | | | 17,434,980 | |
| | | | | | | | | | | | | | | | |
| Healthcare - Services - 1.34% | | | | | | | | | | | | |
MedImpact Holdings, Inc.(a)(h) | | | 02/01/2018 | | | 10.500 | % | | | 7,576,000 | | | | 7,992,680 | |
| | | | | | | | | | | | | | | | |
| Insurance - 1.73% | | | | | | | | | | | | | | | |
Ambac Assurance Corp.(a)(h) | | | 06/07/2020 | | | 5.100 | % | | | 5,228,536 | | | | 6,078,173 | |
Ambac Assurance Corp.(h) | | | 08/28/2039 | | | 5.100 | % | | | 1,598,000 | | | | 1,278,400 | |
Syncora Holdings Ltd.(i) | | | | | | | | | | | | | | | |
| | | | | | | | | | | | | | | | |
| Perpetual Maturity | | | 5.000 | % | | | 989,868 | | | | 743,818 | |
| Perpetual Maturity | | | 6.000 | % | | | 2,724,000 | | | | 2,183,741 | |
| | | | | | | | | | | | | | | 10,284,132 | |
| Machinery - Diversified - 0.69% | | | | | | | | | | | | |
| Manitowoc Co., Inc. | | | 10/15/2022 | | | 5.875 | % | | | 3,774,000 | | | | 4,075,920 | |
| | | | | | | | | | | | | | | | |
| Media - 1.00% | | | | | | | | | | | | | | | |
| CCO Holdings LLC / CCO | | | | | | | | | | | | | | | |
| Holdings Capital Corp. | | | 01/15/2019 | | | 7.000 | % | | | 2,099,000 | | | | 2,181,648 | |
Univision Communications, Inc.(h) | | | 05/15/2021 | | | 8.500 | % | | | 3,516,000 | | | | 3,748,935 | |
| | | | | | | | | | | | | | | 5,930,583 | |
| Miscellaneous Manufacturing - 1.07% | | | | | | | | | | | | |
| LSB Industries, Inc. | | | 08/01/2019 | | | 7.750 | % | | | 6,015,000 | | | | 6,390,937 | |
| | | | | | | | | | | | | | | | |
| Oil & Gas - 0.03% | | | | | | | | | | | | | | | |
Southern Pacific Resource Corp.(h)(j) | | | 01/25/2018 | | | 8.750 | % | | | 4,828,000 | | | | 194,114 | |
| | | | | | | | | | | | | | | | |
| Oil & Gas Services - 0.06% | | | | | | | | | | | | | | | |
| Exterran Holdings, Inc. | | | 12/01/2018 | | | 7.250 | % | | | 368,000 | | | | 379,960 | |
| See Notes to Financial Statements. | |
| 30 | www.arbitragefunds.com | 1-800-295-4485 |
| The Arbitrage Event-Driven Fund | Portfolio of Investments (continued) |
| | May 31, 2015 |
| | | | Maturity Date | | Rate(g) | | | Principal Amount | | | Value | |
| CORPORATE BONDS - 20.12% (Continued) | |
| Semiconductors - 0.90% | | | | | | | | | | | | |
| Freescale Semiconductor, Inc. | | | 08/01/2020 | | | 10.750 | % | | $ | 5,008,000 | | | $ | 5,352,300 | |
| | | | | | | | | | | | | | | | |
| Telecommunications - 3.02% | | | | | | | | | | | | |
| AT&T, Inc. | | | 08/15/2016 | | | 2.400 | % | | | 2,890,000 | | | | 2,931,787 | |
NII Capital Corp.(j) | | | 04/01/2021 | | | 7.625 | % | | | 11,089,000 | | | | 3,014,822 | |
NII International Telecom SCA(h)(j) | | | 08/15/2019 | | | 7.875 | % | | | 7,766,000 | | | | 7,183,550 | |
| T-Mobile USA, Inc. | | | 04/28/2019 | | | 6.464 | % | | | 4,713,000 | | | | 4,869,118 | |
| | | | | | | | | | | | | | | 17,999,277 | |
| Transportation - 0.48% | | | | | | | | | | | | | | | |
| Overseas Shipholding Group, Inc. | | | 03/30/2018 | | | 8.125 | % | | | 2,734,000 | | | | 2,855,321 | |
| | | | | | | | | | | | | | | | |
| TOTAL CORPORATE BONDS | | | | | | | | | | | | | | | |
| (Cost $124,323,969) | | | | | | | | | | | | | | 119,803,277 | |
| | | | | | | | | | | | | | | | |
| CONVERTIBLE CORPORATE BONDS - 1.11% | | | | | | | | | | | | |
| Engineering & Construction - 0.30% | | | | | | | | | | | | | | | |
| Aecon Group, Inc. | | | 10/31/2015 | | | 6.250 | % | | | 2,210,000 | | | | 1,803,755 | |
| | | | | | | | | | | | | | | | |
| Mining - 0.72% | | | | | | | | | | | | | | | |
| Primero Mining Corp. | | | 03/31/2016 | | | 6.500 | % | | | 4,298,000 | | | | 4,295,851 | |
| | | | | | | | | | | | | | | | |
| Oil & Gas Services - 0.09% | | | | | | | | | | | | | | | |
Cal Dive International, Inc.(j) | | | 07/15/2017 | | | 5.000 | % | | | 5,128,000 | | | | 528,825 | |
| | | | | | | | | | | | | | | | |
| TOTAL CONVERTIBLE CORPORATE BONDS | | | | | | | | | | | | |
| (Cost $10,080,525) | | | | | | | | | | | | | | 6,628,431 | |
| | | Expiration
Date | | | Exercise
Price | | | Contracts | | | Value | |
PURCHASED OPTIONS(c)- 0.60% | | | | | | | | | | | | |
| Call Options Purchased - 0.30% | | | | | | | | | | | | |
| Altera Corp.: | | | | | | | | | | | | |
| | | | 06/2015 | | | $ | 45.00 | | | | 625 | | | $ | 334,375 | |
| | | | 06/2015 | | | | 50.00 | | | | 1,380 | | | | 282,900 | |
| Applied Materials, Inc. | | | 01/2016 | | | | 22.00 | | | | 597 | | | | 54,028 | |
| AT&T, Inc. | | | 06/2015 | | | | 35.00 | | | | 6,933 | | | | 256,521 | |
| Catamaran Corp. | | | 10/2015 | | | | 62.50 | | | | 29 | | | | 145 | |
| See Notes to Financial Statements. | |
| Annual Report | May 31, 2015 | 31 |
| The Arbitrage Event-Driven Fund | Portfolio of Investments (continued) |
| | May 31, 2015 |
| | | Expiration
Date | | | Exercise
Price | | | Contracts | | | Value | |
PURCHASED OPTIONS(c)- 0.60% (Continued) | |
| Call Options Purchased - 0.30% (Continued) | |
| CommScope Holding Co., Inc. | | | 06/2015 | | | $ | 35.00 | | | | 447 | | | $ | 7,823 | |
| Expedia, Inc.: | | | | | | | | | | | | | | | | |
| | | | 06/2015 | | | | 116.00 | | | | 61 | | | | 2,745 | |
| | | | 06/2015 | | | | 117.00 | | | | 306 | | | | 10,710 | |
| | | | 06/2015 | | | | 120.00 | | | | 901 | | | | 15,767 | |
| Kraft Foods Group, Inc.: | | | | | | | | | | | | | | | | |
| | | | 06/2015 | | | | 90.00 | | | | 612 | | | | 3,060 | |
| | | | 09/2015 | | | | 90.00 | | | | 39 | | | | 2,535 | |
| Mylan N.V. | | | 07/2015 | | | | 72.50 | | | | 1,655 | | | | 678,550 | |
| Omnicare, Inc. | | | 09/2015 | | | | 100.00 | | | | 37 | | | | 278 | |
| Peabody Energy Corp.: | | | | | | | | | | | | | | | | |
| | | | 06/2015 | | | | 3.50 | | | | 105 | | | | 1,628 | |
| | | | 06/2015 | | | | 4.00 | | | | 105 | | | | 472 | |
| | | | 06/2015 | | | | 4.50 | | | | 1,052 | | | | 2,630 | |
| Staples, Inc. | | | 01/2016 | | | | 17.00 | | | | 718 | | | | 95,135 | |
| | | | | | | | | | | | | | | | | |
| TOTAL CALL OPTIONS PURCHASED | | | | | | | | | | | | | |
| (Cost $1,753,250) | | | | | | | | | | | | | | | 1,749,302 | |
| | | | | | | | | | | | | | | | | |
| Put Options Purchased - 0.30% | | | | | | | | | | | | | | | | |
| Actavis Plc | | | 06/2015 | | | | 275.00 | | | | 302 | | | | 7,550 | |
| Alcoa, Inc. | | | 06/2015 | | | | 12.00 | | | | 14,716 | | | | 169,234 | |
| Associated Estates Realty Corp. | | | 06/2015 | | | | 22.50 | | | | 909 | | | | 2,273 | |
| Avago Technologies Ltd.: | | | | | | | | | | | | | | | | |
| | | | 06/2015 | | | | 135.00 | | | | 16 | | | | 1,200 | |
| | | | 06/2015 | | | | 140.00 | | | | 16 | | | | 2,560 | |
| Axalta Coating Systems Ltd.: | | | | | | | | | | | | | | | | |
| | | | 06/2015 | | | | 25.00 | | | | 657 | | | | 6,570 | |
| | | | 07/2015 | | | | 30.00 | | | | 1,536 | | | | 76,800 | |
| Axis Capital Holdings Ltd. | | | 09/2015 | | | | 50.00 | | | | 145 | | | | 8,338 | |
| B/E Aerospace, Inc. | | | 06/2015 | | | | 55.00 | | | | 953 | | | | 61,945 | |
| Ball Corp. | | | 06/2015 | | | | 65.00 | | | | 900 | | | | 11,250 | |
| Berry Plastics Group, Inc. | | | 06/2015 | | | | 30.00 | | | | 1,855 | | | | 37,100 | |
| Bob Evans Farms, Inc. | | | 06/2015 | | | | 40.00 | | | | 1,138 | | | | 31,295 | |
| Catamaran Corp. | | | 10/2015 | | | | 57.50 | | | | 14 | | | | 1,330 | |
| Charter Communications, Inc., Class A | | | 06/2015 | | | | 175.00 | | | | 295 | | | | 63,425 | |
| Cobalt International Energy, Inc. | | | 06/2015 | | | | 9.00 | | | | 1,187 | | | | 14,837 | |
| See Notes to Financial Statements. | |
| 32 | www.arbitragefunds.com | 1-800-295-4485 |
| The Arbitrage Event-Driven Fund | Portfolio of Investments (continued) |
| | May 31, 2015 |
| | | Expiration
Date | | | Exercise
Price | | | Contracts | | | Value | |
PURCHASED OPTIONS(c)- 0.60% (Continued) | | | | | | | | | | | | |
| Put Options Purchased - 0.30% (Continued) | | | | | | | | | | | | |
| DISH Network Corp., Class A | | | 06/2015 | | | $ | 60.00 | | | | 1,573 | | | $ | 7,865 | |
| Dynegy, Inc.: | | | | | | | | | | | | | | | | |
| | | | 06/2015 | | | | 30.00 | | | | 1,098 | | | | 38,430 | |
| | | | 07/2015 | | | | 30.00 | | | | 470 | | | | 36,425 | |
| EMC Corp.: | | | | | | | | | | | | | | | | |
| | | | 06/2015 | | | | 24.00 | | | | 2,379 | | | | 7,137 | |
| | | | 06/2015 | | | | 25.00 | | | | 1,189 | | | | 8,323 | |
| Exterran Holdings, Inc. | | | 06/2015 | | | | 30.00 | | | | 549 | | | | 23,333 | |
| Family Dollar Stores, Inc. | | | 07/2015 | | | | 72.50 | | | | 408 | | | | 15,300 | |
| Harris Corp. | | | 06/2015 | | | | 70.00 | | | | 565 | | | | 8,475 | |
| Hewlett-Packard Co.: | | | | | | | | | | | | | | | | |
| | | | 06/2015 | | | | 30.00 | | | | 1,676 | | | | 8,380 | |
| | | | 07/2015 | | | | 32.00 | | | | 631 | | | | 33,443 | |
| Juniper Networks, Inc. | | | 06/2015 | | | | 23.00 | | | | 231 | | | | 1,501 | |
| KLX, Inc. | | | 06/2015 | | | | 40.00 | | | | 1,562 | | | | 39,050 | |
| Kraft Foods Group, Inc. | | | 09/2015 | | | | 82.50 | | | | 199 | | | | 42,287 | |
| Media General, Inc.: | | | | | | | | | | | | | | | | |
| | | | 06/2015 | | | | 12.50 | | | | 1,583 | | | | 27,702 | |
| | | | 06/2015 | | | | 15.00 | | | | 465 | | | | 5,813 | |
| MGM Resorts International | | | 06/2015 | | | | 18.00 | | | | 3,183 | | | | 31,830 | |
| Molson Coors Brewing Co., Class B | | | 06/2015 | | | | 7.50 | | | | 369 | | | | 4,612 | |
| Mylan N.V. | | | 07/2015 | | | | 62.50 | | | | 594 | | | | 46,332 | |
| Nokia OYJ | | | 06/2015 | | | | 6.00 | | | | 3,038 | | | | 3,038 | |
| Perrigo Co., Plc | | | 06/2015 | | | | 170.00 | | | | 740 | | | | 20,350 | |
| Royal Dutch Shell Plc | | | 10/2015 | | | | 57.50 | | | | 490 | | | | 96,775 | |
| Salesforce.com, Inc. | | | 07/2015 | | | | 67.50 | | | | 904 | | | | 143,736 | |
| Seadrill Partners LLC | | | 06/2015 | | | | 10.00 | | | | 299 | | | | 1,495 | |
| SPX Corp. | | | 06/2015 | | | | 70.00 | | | | 671 | | | | 36,905 | |
| Starwood Hotels & Resorts Worldwide, Inc. | | | 06/2015 | | | | 77.50 | | | | 634 | | | | 18,069 | |
| Synageva BioPharma Corp.: | | | | | | | | | | | | | | | | |
| | | | 07/2015 | | | | 165.00 | | | | 429 | | | | 250,965 | |
| | | | 07/2015 | | | | 170.00 | | | | 183 | | | | 118,035 | |
| Teva Pharmaceutical Industries Ltd., Sponsored ADR | | | 06/2015 | | | | 55.00 | | | | 996 | | | | 16,932 | |
| See Notes to Financial Statements. | |
| Annual Report | May 31, 2015 | 33 |
| The Arbitrage Event-Driven Fund | Portfolio of Investments (continued) |
| | May 31, 2015 |
| | | Expiration Date | | | Exercise
Price | | | Contracts | | | Value | |
PURCHASED OPTIONS(c)- 0.60% (Continued) | |
| Put Options Purchased - 0.30% (Continued) | |
| T-Mobile US, Inc.: | | | | | | | | | | | | |
| | | | 06/2015 | | | $ | 30.00 | | | | 1,197 | | | $ | 14,963 | |
| | | | 07/2015 | | | | 35.00 | | | | 628 | | | | 26,062 | |
| Viacom, Inc., Class B: | | | | | | | | | | | | | | | | |
| | | | 06/2015 | | | | 62.50 | | | | 600 | | | | 15,000 | |
| | | | 06/2015 | | | | 65.00 | | | | 750 | | | | 56,250 | |
| Weatherford International Plc: | | | | | | | | | | | | | | | | |
| | | | 06/2015 | | | | 12.00 | | | | 897 | | | | 6,279 | |
| | | | 06/2015 | | | | 13.00 | | | | 2,428 | | | | 47,346 | |
| XPO Logistics, Inc.: | | | | | | | | | | | | | | | | |
| | | | 06/2015 | | | | 44.00 | | | | 570 | | | | 22,800 | |
| | | | 06/2015 | | | | 45.00 | | | | 570 | | | | 27,075 | |
| ZF TRW Automotive Holdings Corp. | | | 07/2015 | | | | 95.00 | | | | 4 | | | | 0 | |
| | | | | | | | | | | | | | | | | |
| TOTAL PUT OPTIONS PURCHASED | | | | | | | | | | | | | | | | |
| (Cost $2,997,901) | | | | | | | | | | | | | | | 1,804,020 | |
| | | | | | | | | | | | | | | | | |
| TOTAL PURCHASED OPTIONS | | | | | | | | | | | | | | | | |
| (Cost $4,751,151) | | | | | | | | | | | | | | | 3,553,322 | |
| | | | | | | | | | | | | | | | | |
| Total Investments - 104.80% | | | | | | | | | | | | | | | | |
| (Cost $630,112,748) | | | | | | | | | | | | | | | 624,075,615 | |
| | | | | | | | | | | | | | | | | |
| | | | | | | | | | | | | | | | (28,598,877 | )(k) |
| Liabilities in Excess of Other Assets - (4.80%) | | | | | | | | | | | | | |
| | | | | | | | | | | | | | | | | |
| NET ASSETS - 100.00% | | | | | | | | | | | | | | $ | 595,476,738 | |
(a) | Security, or a portion of security, is being held as collateral for short sales or written option contracts. At period end, the aggregate market value of those securities was $86,036,335, representing 14.45% of net assets. |
(b) | Underlying security for a written/purchased call/put option |
(c) | Non-income-producing security. |
(d) | Less than 0.005% of net assets. |
(e) | Security considered illiquid. As of May 31, 2015, the total market value of these securities was $697,911, representing 0.12% of net assets. |
(f) | Security fair valued using methods determined in good faith by the Pricing Committee. As of May 31, 2015, the total market value of these securities was $697,911, representing 0.12% of net assets. |
(g) | Interest rate will change at a future date. Interest rate shown reflects the rate in effect at May 31, 2015. |
| See Notes to Financial Statements. | |
| 34 | www.arbitragefunds.com | 1-800-295-4485 |
| The Arbitrage Event-Driven Fund | Portfolio of Investments (continued) |
| | May 31, 2015 |
(h) | Security exempt from registration under Rule 144A of the Securities Act of 1933. These securities may be resold in transactions exempt from registration, normally to qualified institutional buyers. As of May 31, 2015, these securities had a total value of $46,271,660 or 7.77% of net assets. |
(i) | This security has no contractual maturity date, is not redeemable and contractually pays an indefinite stream of interest. |
(j) | Security in default on interest payments. |
(k) | Includes cash which is being held as collateral for short sales and written option contracts. |
| See Notes to Financial Statements. | |
| Annual Report | May 31, 2015 | 35 |
| The Arbitrage Event-Driven Fund | Portfolio of Investments (continued) |
| | May 31, 2015 |
Securities are determined to be illiquid under the procedures approved by the Funds’ Board of Trustees. Information related to the illiquid securities is as follows:
| Date of Purchase | | | Security | | Cost | | | Market Value | | | % of Net Assets | |
| 05/30/2014 | | | ArthroCare Corp., CVR | | $ | 55,227 | | | $ | 53,270 | | | | 0.01 | % |
| 01/30/2015 | | | Casa Ley, CVR | | | 904,361 | | | | 322,127 | | | | 0.05 | |
| 06/24/2014 | | | Chelsea Therapeutics, CVR | | | 0 | | | | 35,413 | | | | 0.01 | |
| 12/12/2011 | | | Cubist Pharmaceuticals, Inc., CPR | | | 0 | | | | 0 | | | | 0.00 | |
| 03/17/2014 | | | Leap Wireless International, CVR | | | 167,189 | | | | 249,488 | | | | 0.04 | |
| 01/30/2015 | | | PDC, CVR | | | 43,485 | | | | 20,049 | | | | 0.01 | |
| 09/12/2013 | | | Trius Therapeutics, CVR | | | 0 | | | | 17,564 | | | | 0.00 | |
| | | | | | | | | | $ | 697,911 | | | | 0.12 | % |
| SCHEDULE OF SECURITIES SOLD SHORT | | Shares | | | Value | |
| COMMON STOCKS - (23.58%) | | | | | | |
| Aerospace & Defense - (0.73%) | | | | | | |
| Boeing Co. | | | (5,925 | ) | | $ | (832,581 | ) |
| Rockwell Collins, Inc. | | | (9,181 | ) | | | (873,940 | ) |
| Spirit AeroSystems Holdings, Inc., Class A | | | (17,529 | ) | | | (956,908 | ) |
| TransDigm Group, Inc. | | | (4,006 | ) | | | (905,516 | ) |
| Triumph Group, Inc. | | | (11,267 | ) | | | (751,396 | ) |
| | | | | | | | (4,320,341 | ) |
| | | | | | | | | |
| Auto Parts & Equipment - (0.21%) | | | | | | | | |
| Autoliv, Inc. | | | (3,714 | ) | | | (468,521 | ) |
| BorgWarner, Inc. | | | (6,984 | ) | | | (420,088 | ) |
| Delphi Automotive Plc | | | (3,961 | ) | | | (344,528 | ) |
| | | | | | | | (1,233,137 | ) |
| | | | | | | | | |
| Beverages - (0.05%) | | | | | | | | |
| Anheuser-Busch InBev N.V., Sponsored ADR | | | (2,506 | ) | | | (302,123 | ) |
| Boston Beer Co., Inc., Class A | | | (1 | ) | | | (264 | ) |
| | | | | | | | (302,387 | ) |
| | | | | | | | | |
| Biotechnology - (1.00%) | | | | | | | | |
| Alexion Pharmaceuticals, Inc. | | | (36,192 | ) | | | (5,929,697 | ) |
| | | | | | | | | |
| Coal - (0.13%) | | | | | | | | |
| Peabody Energy Corp. | | | (230,482 | ) | | | (779,029 | ) |
| | | | | | | | | |
| Distributors & Wholesalers - (0.17%) | | | | | | | | |
| WESCO International, Inc. | | | (14,219 | ) | | | (1,021,777 | ) |
| | | | | | | | | |
| Food - (0.52%) | | | | | | | | |
| ConAgra Foods, Inc. | | | (4,754 | ) | | | (183,552 | ) |
| Hormel Foods Corp. | | | (6,534 | ) | | | (373,875 | ) |
| See Notes to Financial Statements. | |
| 36 | www.arbitragefunds.com | 1-800-295-4485 |
| The Arbitrage Event-Driven Fund | Portfolio of Investments (continued) |
| | May 31, 2015 |
| SCHEDULE OF SECURITIES SOLD SHORT | | Shares | | | Value | |
| COMMON STOCKS - (23.58%)(Continued) | | | | | | |
| Food - (0.52%) (Continued) | | | | | | |
| Kraft Foods Group, Inc. | | | (30,259 | ) | | $ | (2,555,373 | ) |
| | | | | | | | (3,112,800 | ) |
| | | | | | | | | |
| Healthcare - Products - (1.12%) | | | | | | | | |
| STERIS Corp. | | | (99,923 | ) | | | (6,677,854 | ) |
| | | | | | | | | |
| Home Furnishings - (0.07%) | | | | | | | | |
| Harman International Industries, Inc. | | | (3,623 | ) | | | (436,644 | ) |
| | | | | | | | | |
| Internet - (2.91%) | | | | | | | | |
| Alibaba Group Holding Ltd., Sponsored ADR | | | (98,897 | ) | | | (8,833,480 | ) |
| Expedia, Inc. | | | (79,088 | ) | | | (8,482,979 | ) |
| | | | | | | | (17,316,459 | ) |
| | | | | | | | | |
| Lodging - (0.42%) | | | | | | | | |
| Melco Crown Entertainment Ltd., ADR | | | (40,015 | ) | | | (773,890 | ) |
| Wynn Resorts Ltd. | | | (17,206 | ) | | | (1,732,472 | ) |
| | | | | | | | (2,506,362 | ) |
| | | | | | | | | |
| Media - (0.26%) | | | | | | | | |
| Gannett Co., Inc | | | (15,006 | ) | | | (537,065 | ) |
| Nexstar Broadcasting Group, Inc., Class A | | | (11,012 | ) | | | (626,473 | ) |
| Sinclair Broadcast Group, Inc., Class A | | | (12,916 | ) | | | (387,996 | ) |
| | | | | | | | (1,551,534 | ) |
| | | | | | | | | |
| Mining - (0.50%) | | | | | | | | |
| Alcoa, Inc. | | | (237,300 | ) | | | (2,966,250 | ) |
| Nevada Copper Corp. | | | (6,725 | ) | | | (10,167 | ) |
| | | | | | | | (2,976,417 | ) |
| | | | | | | | | |
| Miscellaneous Manufacturing - (0.34%) | | | | | | | | |
| AptarGroup, Inc. | | | (17,697 | ) | | | (1,128,538 | ) |
| Hexcel Corp. | | | (17,862 | ) | | | (879,525 | ) |
| | | | | | | | (2,008,063 | ) |
| | | | | | | | | |
| Oil & Gas - (0.98%) | | | | | | | | |
| Antero Resources Corp. | | | (44,517 | ) | | | (1,781,125 | ) |
| Cabot Oil & Gas Corp. | | | (62,756 | ) | | | (2,131,194 | ) |
| EQT Corp. | | | (22,845 | ) | | | (1,943,424 | ) |
| | | | | | | | (5,855,743 | ) |
| See Notes to Financial Statements. | |
| Annual Report | May 31, 2015 | 37 |
| The Arbitrage Event-Driven Fund | Portfolio of Investments (continued) |
| | May 31, 2015 |
| SCHEDULE OF SECURITIES SOLD SHORT | | Shares | | | Value | |
| COMMON STOCKS - (23.58%)(Continued) | | | | | | |
| Oil & Gas Services - (0.95%) | | | | | | |
| Enerflex Ltd. | | | (88,253 | ) | | $ | (1,002,746 | ) |
| Frank’s International N.V. | | | (16,109 | ) | | | (319,281 | ) |
| RPC, Inc. | | | (160,891 | ) | | | (2,326,484 | ) |
| Schlumberger Ltd. | | | (9,934 | ) | | | (901,709 | ) |
| Superior Energy Services, Inc. | | | (46,735 | ) | | | (1,079,111 | ) |
| | | | | | | | (5,629,331 | ) |
| | | | | | | | | |
| Packaging & Containers - (1.45%) | | | | | | | | |
| Ball Corp. | | | (7,734 | ) | | | (549,037 | ) |
| Bemis Co., Inc. | | | (4,246 | ) | | | (195,061 | ) |
| Crown Holdings, Inc. | | | (121,101 | ) | | | (6,695,674 | ) |
| Silgan Holdings, Inc. | | | (22,549 | ) | | | (1,225,313 | ) |
| | | | | | | | (8,665,085 | ) |
| | | | | | | | | |
| Pharmaceuticals - (2.68%) | | | | | | | | |
| AbbVie, Inc. | | | (239,290 | ) | | | (15,934,321 | ) |
| | | | | | | | | |
| Pipelines - (0.76%) | | | | | | | | |
| Williams Companies, Inc. | | | (88,961 | ) | | | (4,545,907 | ) |
| | | | | | | | | |
| Real Estate Investment Trusts - (0.82%) | | | | | | | | |
| Simon Property Group, Inc. | | | (26,860 | ) | | | (4,872,404 | ) |
| | | | | | | | | |
| Retail - (0.48%) | | | | | | | | |
| Ascena Retail Group, Inc. | | | (105,588 | ) | | | (1,560,590 | ) |
| Cracker Barrel Old Country Store, Inc. | | | (4,071 | ) | | | (574,337 | ) |
| Denny’s Corp. | | | (35,039 | ) | | | (365,457 | ) |
| Texas Roadhouse, Inc. | | | (10,588 | ) | | | (370,792 | ) |
| | | | | | | | (2,871,176 | ) |
| | | | | | | | | |
| Savings & Loans - (0.17%) | | | | | | | | |
| Sterling Bancorp | | | (76,206 | ) | | | (1,029,543 | ) |
| | | | | | | | | |
| Semiconductors - (0.76%) | | | | | | | | |
| Avago Technologies Ltd. | | | (30,401 | ) | | | (4,501,476 | ) |
| | | | | | | | | |
| Software - (0.91%) | | | | | | | | |
| VMware, Inc., Class A | | | (62,347 | ) | | | (5,444,140 | ) |
| See Notes to Financial Statements. | |
| 38 | www.arbitragefunds.com | 1-800-295-4485 |
| The Arbitrage Event-Driven Fund | Portfolio of Investments (continued) |
| | May 31, 2015 |
| SCHEDULE OF SECURITIES SOLD SHORT | | Shares | | | Value | |
| COMMON STOCKS - (23.58%)(Continued) | | | | | | |
| Storage & Warehousing - (0.08%) | | | | | | |
| Wesco Aircraft Holdings, Inc. | | | (30,719 | ) | | $ | (453,412 | ) |
| | | | | | | | | |
| Telecommunications - (5.11%) | | | | | | | | |
| AT&T, Inc. | | | (625,974 | ) | | | (21,621,142 | ) |
| Ciena Corp. | | | (137,425 | ) | | | (3,314,691 | ) |
| CommScope Holding Co., Inc. | | | (28,354 | ) | | | (883,794 | ) |
| Harris Corp. | | | (58,441 | ) | | | (4,629,696 | ) |
| | | | | | | | (30,449,323 | ) |
| | | | | | | | | |
| TOTAL COMMON STOCKS | | | | | | | | |
| (Proceeds $140,524,489) | | | | | | | (140,424,362 | ) |
| | | | | | | | | |
| LIMITED PARTNERSHIPS - (0.56%) | | | | | | | | |
| Coal - (0.17%) | | | | | | | | |
| Alliance Resource Partners LP | | | (33,297 | ) | | | (998,577 | ) |
| | | | | | | | | |
| Oil & Gas Services - (0.39%) | | | | | | | | |
| Exterran Partners LP | | | (90,799 | ) | | | (2,350,786 | ) |
| | | | | | | | | |
| TOTAL LIMITED PARTNERSHIPS | | | | | | | | |
| (Proceeds $3,498,158) | | | | | | | (3,349,363 | ) |
| | | | | | | | | |
| EXCHANGE-TRADED FUNDS - (4.24%) | | | | | | | | |
| Debt Funds - (0.01%) | | | | | | | | |
SPDR® Barclays High Yield Bond ETF | | | (1,266 | ) | | | (49,906 | ) |
| | | | | | | | | |
| Equity Funds - (4.23%) | | | | | | | | |
| Alerian MLP ETF | | | (41,696 | ) | | | (690,069 | ) |
Consumer Staples Select Sector SPDR® Fund | | | (14,271 | ) | | | (696,282 | ) |
Health Care Select Sector SPDR® Fund | | | (4,336 | ) | | | (325,200 | ) |
iShares® Nasdaq Biotechnology ETF | | | (5,019 | ) | | | (1,832,086 | ) |
iShares® Russell 2000 Growth ETF | | | (30,566 | ) | | | (4,658,258 | ) |
SPDR® S&P 500® ETF Trust | | | (16,473 | ) | | | (3,477,944 | ) |
SPDR® S&P® Retail ETF | | | (25,460 | ) | | | (2,489,733 | ) |
Utilities Select Sector SPDR® Fund | | | (91,652 | ) | | | (4,078,514 | ) |
| Vanguard REIT ETF | | | (87,798 | ) | | | (6,948,334 | ) |
| | | | | | | | (25,196,420 | ) |
| | | | | | | | | |
| TOTAL EXCHANGE-TRADED FUNDS | | | | | | | | |
| (Proceeds $24,956,676) | | | | | | | (25,246,326 | ) |
| See Notes to Financial Statements. | |
| Annual Report | May 31, 2015 | 39 |
| The Arbitrage Event-Driven Fund | Portfolio of Investments (continued) |
| | May 31, 2015 |
| SCHEDULE OF SECURITIES SOLD SHORT | | Shares | | | Value | |
| EXCHANGE-TRADED NOTES - (0.23%) | | | | | | |
| Equity Funds - (0.23%) | | | | | | |
| JPMorgan Alerian MLP Index ETN | | | (31,181 | ) | | $ | (1,349,202 | ) |
| | | | | | | | | |
| TOTAL EXCHANGE-TRADED NOTES | | | | | | | | |
| (Proceeds $1,419,718) | | | | | | | (1,349,202 | ) |
| | | | | | | | | |
RIGHTS - (0.00%)(a) | | | | | | | | |
| Chelsea Therapeutics, CVR | | | (200 | ) | | | (16 | ) |
| | | | | | | | | |
| TOTAL RIGHTS | | | | | | | | |
| (Proceeds $0) | | | | | | | (16 | ) |
| | | | Maturity Date | | Rate | | | Principal Amount | | | Value | |
| CORPORATE BONDS - (3.15%) | | | | | | | | | | | | |
| Chemicals - (0.83%) | | | | | | | | | | | | |
| Ashland, Inc. | | | 08/15/2022 | | | 4.750 | % | | $ | (4,862,000 | ) | | $ | (4,959,240 | ) |
| | | | | | | | | | | | | | | | |
| Iron & Steel - (0.30%) | | | | | | | | | | | | | | | |
| Vale SA | | | 09/11/2042 | | | 5.625 | % | | | (2,004,000 | ) | | | (1,751,055 | ) |
| | | | | | | | | | | | | | | | |
| Oil & Gas - (0.85%) | | | | | | | | | | | | | | | |
| Ensco Plc | | | 03/15/2021 | | | 4.700 | % | | | (4,874,000 | ) | | | (5,037,947 | ) |
| | | | | | | | | | | | | | | | |
| Oil & Gas Services - (0.25%) | | | | | | | | | | | | |
| National Oilwell Varco, Inc. | | | 12/01/2022 | | | 2.600 | % | | | (1,531,000 | ) | | | (1,483,358 | ) |
| | | | | | | | | | | | | | | | |
| Telecommunications - (0.92%) | | | | | | | | | | | | |
| AT&T, Inc. | | | 03/11/2024 | | | 3.900 | % | | | (5,338,000 | ) | | | (5,494,927 | ) |
| | | | | | | | | | | | | | | | |
| TOTAL CORPORATE BONDS | | | | | | | | | | | | | | | |
| (Proceeds $18,784,304) | | | | | | | | | | | | | | (18,726,527 | ) |
| | | | | | | | | | | | | | | | |
| TOTAL SECURITIES SOLD SHORT - (31.53%) | | | | | | | | | | | | |
| (Proceeds $189,183,345) | | | | | | | | | | | | | $ | (189,095,796 | ) |
| SCHEDULE OF WRITTEN OPTIONS | | Expiration
Date | | | Exercise Price | | | Contracts | | | Value | |
| Written Call Options | | | | | | | | | | | | |
| Actavis Plc | | | 06/2015 | | | $ | 330.00 | | | | (91 | ) | | $ | (2,957 | ) |
| Alcoa, Inc. | | | 06/2015 | | | | 13.00 | | | | (7,359 | ) | | | (77,269 | ) |
| Applied Materials, Inc. | | | 01/2016 | | | | 32.00 | | | | (597 | ) | | | (896 | ) |
| See Notes to Financial Statements. | |
| 40 | www.arbitragefunds.com | 1-800-295-4485 |
| The Arbitrage Event-Driven Fund | Portfolio of Investments (continued) |
| | May 31, 2015 |
SCHEDULE OF
WRITTEN OPTIONS | | Expiration
Date | | | Exercise Price | | | Contracts | | | Value | |
| Written Call Options (Continued) | | | | | | | | | | |
| Avago Technologies Ltd.: | | | | | | | | | | | | |
| | | | 06/2015 | | | $ | 145.00 | | | | (170 | ) | | $ | (98,600 | ) |
| | | | 06/2015 | | | | 150.00 | | | | (184 | ) | | | (64,400 | ) |
| | | | 06/2015 | | | | 155.00 | | | | (306 | ) | | | (55,080 | ) |
| Catamaran Corp. | | | 07/2015 | | | | 65.00 | | | | (14 | ) | | | (35 | ) |
| Cloud Peak Energy, Inc. | | | 06/2015 | | | | 7.50 | | | | (178 | ) | | | (1,335 | ) |
| CONSOL Energy, Inc. | | | 06/2015 | | | | 34.00 | | | | (85 | ) | | | (297 | ) |
| Expedia, Inc. | | | 06/2015 | | | | 113.00 | | | | (60 | ) | | | (5,250 | ) |
| Hospira, Inc. | | | 08/2015 | | | | 90.00 | | | | (44 | ) | | | (220 | ) |
| Kraft Foods Group, Inc.: | | | | | | | | | | | | | | | | |
| | | | 06/2015 | | | | 85.00 | | | | (16 | ) | | | (1,360 | ) |
| | | | 09/2015 | | | | 85.00 | | | | (33 | ) | | | (7,425 | ) |
| Mylan N.V. | | | 07/2015 | | | | 77.50 | | | | (1,655 | ) | | | (366,583 | ) |
| Pall Corp. | | | 06/2015 | | | | 125.00 | | | | (112 | ) | | | (840 | ) |
| Salesforce.com, Inc. | | | 06/2015 | | | | 82.50 | | | | (158 | ) | | | (4,819 | ) |
| Staples, Inc. | | | 01/2016 | | | | 22.00 | | | | (718 | ) | | | (16,155 | ) |
| T-Mobile US, Inc. | | | 06/2015 | | | | 40.00 | | | | (314 | ) | | | (18,997 | ) |
| ZF TRW Automotive Holdings Corp. | | | 07/2015 | | | | 105.00 | | | | (1 | ) | | | 0 | |
| | | | | | | | | | | | | | | | | |
| TOTAL WRITTEN CALL OPTIONS | | | | | | | | | | | | | | | | |
| (Premiums received $969,069) | | | | | | | | | | | | | | | (722,518 | ) |
| | | | | | | | | | | | | | | | | |
| Written Put Options | | | | | | | | | | | | | | | | |
| Alcoa, Inc. | | | 06/2015 | | | | 13.00 | | | | (7,359 | ) | | | (434,181 | ) |
| Avago Technologies Ltd. | | | 06/2015 | | | | 145.00 | | | | (78 | ) | | | (21,840 | ) |
| Catamaran Corp. | | | 07/2015 | | | | 57.50 | | | | (14 | ) | | | (455 | ) |
| Charter Communications, Inc., Class A | | | 06/2015 | | | | 155.00 | | | | (590 | ) | | | (8,850 | ) |
| Expedia, Inc.: | | | | | | | | | | | | | | | | |
| | | | 06/2015 | | | | 108.00 | | | | (120 | ) | | | (22,800 | ) |
| | | | 06/2015 | | | | 109.00 | | | | (120 | ) | | | (30,900 | ) |
| | | | 06/2015 | | | | 110.00 | | | | (120 | ) | | | (38,700 | ) |
| | | | 06/2015 | | | | 109.00 | | | | (90 | ) | | | (32,850 | ) |
| Kraft Foods Group, Inc.: | | | | | | | | | | | | | | | | |
| | | | 06/2015 | | | | 82.50 | | | | (7 | ) | | | (332 | ) |
| | | | 06/2015 | | | | 83.50 | | | | (4 | ) | | | (300 | ) |
| | | | 06/2015 | | | | 85.00 | | | | (30 | ) | | | (4,200 | ) |
| | | | 09/2015 | | | | 87.50 | | | | (40 | ) | | | (19,200 | ) |
| Omnicare, Inc. | | | 06/2015 | | | | 95.00 | | | | (40 | ) | | | (1,800 | ) |
| Pall Corp. | | | 06/2015 | | | | 120.00 | | | | (107 | ) | | | (803 | ) |
| PartnerRe Ltd. | | | 08/2015 | | | | 130.00 | | | | (19 | ) | | | (5,843 | ) |
| See Notes to Financial Statements. | |
| Annual Report | May 31, 2015 | 41 |
| The Arbitrage Event-Driven Fund | Portfolio of Investments (continued) |
| | May 31, 2015 |
| SCHEDULE OF WRITTEN OPTIONS | | Expiration
Date | | | Exercise Price | | | Contracts | | | Value | |
| Written Put Options (Continued) | | | | | | | | | | |
| Peabody Energy Corp.: | | | | | | | | | | | | |
| | | | 06/2015 | | | $ | 3.00 | | | | (43 | ) | | $ | (365 | ) |
| | | | 06/2015 | | | | 3.50 | | | | (1,157 | ) | | | (31,818 | ) |
| Royal Dutch Shell Plc: | | | | | | | | | | | | | | | | |
| | | | 06/2015 | | | | 60.00 | | | | (143 | ) | | | (9,295 | ) |
| | | | 06/2015 | | | | 62.50 | | | | (347 | ) | | | (78,075 | ) |
| Salesforce.com, Inc. | | | 06/2015 | | | | 72.50 | | | | (151 | ) | | | (35,032 | ) |
| Staples, Inc. | | | 06/2015 | | | | 15.00 | | | | (718 | ) | | | (1,795 | ) |
| | | | | | | | | | | | | | | | | |
| TOTAL WRITTEN PUT OPTIONS | | | | | | | | | | | | | | | | |
| (Premiums received $494,670) | | | | | | | | | | | | | | | (779,434 | ) |
| | | | | | | | | | | | | | | | | |
| TOTAL WRITTEN OPTIONS | | | | | | | | | | | | | | | | |
| (Premiums received $1,463,739) | | | | | | | | | | | $ | (1,501,952 | ) |
(a) | Less than (0.005%) of net assets. |
CREDIT DEFAULT SWAP CONTRACTS
Swap
Counterparty | | | Reference
Obligation | | | Buy Credit
Protection(a) | | Implied
Credit
Spread at
May 31,
2015(b) | | | Notional
Amount(c) | | | Rate
Received by
the Fund | | Termination
Date | | Upfront
Payment
Received | | | Unrealized
Depreciation | |
Morgan
Stanley | | | CDX North American High Yield Index
Series 24 | | | Buy | | | 3.39 | % | | $ | (4,465,000 | ) | | | 5.00 | % | 06/20/2020 | | $ | 300,718 | | | $ | (15,032 | ) |
| | | | | | | | | | | | | | | | | | | | | | $ | 300,718 | | | $ | (15,032 | ) |
| (a) | If the Fund is a buyer of protection and a credit event occurs, as defined under the terms of that particular swap agreement, the Fund will either (i) receive from the seller of protection an amount equal to the notional amount of the swap and deliver the referenced obligation or underlying securities comprising the referenced index or (ii) receive a net settlement amount in the form of cash or securities equal to the notional amount of the swap less the recovery value of the referenced obligation or underlying securities comprising the referenced index. |
| (b) | Implied credit spreads, represented in absolute terms, utilized in determining the market value of credit default swap agreements on corporate issues, sovereign issues of an emerging country, U.S. municipal issues, and U.S. Treasury obligation issues as of period end serve as an indicator of the current status of the payment/performance risk and represent the likelihood or risk of default for the credit derivative. The implied credit spread of a particular referenced entity reflects the cost of buying/selling protection and may include upfront payments required to be made to enter into the agreement. Wider credit spreads represent a deterioration of the referenced entity’s credit soundness and a greater likelihood or risk of default or other credit event occurring as defined under the terms of the agreement. |
| See Notes to Financial Statements. | |
| 42 | www.arbitragefunds.com | 1-800-295-4485 |
| The Arbitrage Event-Driven Fund | Portfolio of Investments (continued) |
| | May 31, 2015 |
| (c) | The maximum potential amount the Fund could be required to pay as a seller of credit protection or receive as a buyer of credit protection if a credit event occurs as defined under the terms of that particular swap agreement. |
OUTSTANDING FORWARD FOREIGN CURRENCY EXCHANGE CONTRACTS
| Contract Description | | Contracts to Deliver/Receive | | Purchase/Sale
Contract | Expiration
Date | | Current Value | | | Unrealized
Appreciation | |
| AUD | | | 10,916,300 | | Sale | 06/15/2015 | | $ | 8,338,521 | | | $ | 80,046 | |
| EUR | | | 34,842,800 | | Purchase | 06/15/2015 | | | 38,276,377 | | | | 685,993 | |
| GBP | | | 757,000 | | Purchase | 06/15/2015 | | | 1,156,858 | | | | 28,875 | |
| SEK | | | 30,985,500 | | Purchase | 06/15/2015 | | | 3,635,196 | | | | 88,299 | |
| SGD | | | 334,100 | | Purchase | 06/15/2015 | | | 247,738 | | | | 6,557 | |
| | | | | | | | | | | | | $ | 889,770 | |
| Contract Description | | Contracts to
Deliver/Receive | | Purchase/Sale
Contract | Expiration
Date | | Current Value | | | Unrealized
Depreciation | |
| AUD | | | 10,886,500 | | Purchase | 06/15/2015 | | $ | 8,315,758 | | | $ | (5,791 | ) |
| CAD | | | 1,251,200 | | Sale | 06/15/2015 | | | 1,005,829 | | | | (26,236 | ) |
| EUR | | | 38,489,900 | | Sale | 06/15/2015 | | | 42,282,880 | | | | (1,352,366 | ) |
| GBP | | | 1,776,309 | | Sale | 06/15/2015 | | | 2,714,579 | | | | (18,713 | ) |
| SEK | | | 30,985,500 | | Sale | 06/15/2015 | | | 3,635,196 | | | | (34,337 | ) |
| SGD | | | 334,100 | | Sale | 06/15/2015 | | | 247,738 | | | | (7,910 | ) |
| | | | | | | | | | | | | $ | (1,445,353 | ) |
The following is a summary of investments classified by foreign country exposure:
| Country | % of Net Assets(a) | |
| Bermuda | | | 2.74 | % |
| Israel | | | 2.06 | % |
| Luxembourg | | | 1.21 | % |
| Great Britain | | | 1.09 | % |
| Canada | | | 1.06 | % |
| Italy | | | 0.47 | % |
| Netherlands | | | 0.19 | % |
| Australia | | | 0.00 | %(b) |
| United States | | | 95.98 | % |
| Liabilities in Excess of Other Assets | | | (4.80 | )% |
| | | | 100.00 | % |
| (a) | These percentages represent long positions only and are not net of short positions. |
| (b) | Less than 0.005% of net assets. |
| See Notes to Financial Statements. | |
| Annual Report | May 31, 2015 | 43 |
| The Arbitrage Event-Driven Fund | Portfolio of Investments (continued) |
| | May 31, 2015 |
| Abbreviations: |
| |
| ADR - American Depositary Receipt |
| AUD - Australian Dollar |
| CAD - Canadian Dollar |
| CPR - Conditional Prepayment Rate |
| CVR - Contingent Value Rights |
| ETF - Exchange-Traded Fund |
| ETN - Exchange-Traded Note |
| EUR - Euro |
| GBP - British Pound |
| LLC - Limited Liability Company |
| LP - Limited Partnership |
| Ltd. - Limited |
| MLP - Master Limited Partnership |
| N.V. - Naamloze Vennootschap is the Dutch term for a public limited liability corporation |
| OYJ - Osakeyhtio is the Finnish equivalent of a public limited company |
| Plc - Public Limited Company |
| REIT - Real Estate Investment Trust |
| SA - Generally designates corporations in various countries, mostly those employing civil law. This translates literally in all languages mentioned as anonymous company |
| SCA - Societe en commandite pe actiuni is the Romanian term for limited liability partnership |
| SEK - Swedish Kronor |
| SGD - Singapore Dollar |
| S&P - Standard & Poor’s |
| SpA - Societa per Azione |
| SPDR - Standard & Poor’s Depositary Receipt |
| VIX - Chicago Board Options Exchange Market Volatility Index |
| See Notes to Financial Statements. | |
| 44 | www.arbitragefunds.com | 1-800-295-4485 |
| The Arbitrage Event-Driven Fund | |
| May 31, 2015 |
The following table summarizes the Arbitrage Event-Driven Fund’s investments and derivative financial instruments categorized in the disclosure hierarchy as of May 31, 2015:
Investments in Securities at Value* | | | | | | | | | | |
| | | Level 1 | | | Level 2 | | | Level 3 | | | Total | |
| Assets | | | | | | | | | | | | |
Common Stocks** | | $ | 475,509,502 | | | $ | – | | | $ | – | | | $ | 475,509,502 | |
| Limited Partnerships | | | 4,458,051 | | | | – | | | | – | | | | 4,458,051 | |
| Exchange‐Traded Notes | | | 274,949 | | | | – | | | | – | | | | 274,949 | |
| Rights | | | – | | | | – | | | | 697,911 | | | | 697,911 | |
| Bank Loans | | | – | | | | 13,150,172 | | | | – | | | | 13,150,172 | |
| Corporate Bonds | | | – | | | | 119,803,277 | | | | – | | | | 119,803,277 | |
| Convertible Corporate Bonds | | | – | | | | 6,628,431 | | | | – | | | | 6,628,431 | |
| Purchased Options | | | 3,553,322 | | | | 0 | | | | – | | | | 3,553,322 | |
| TOTAL | | $ | 483,795,824 | | | $ | 139,581,880 | | | $ | 697,911 | | | $ | 624,075,615 | |
Other Financial Instruments*** | | | | | | | | | | | | |
| Assets | | | | | | | | | | | | |
| Forward Foreign Currency Exchange Contracts | | $ | – | | | $ | 889,770 | | | $ | – | | | $ | 889,770 | |
| Liabilities | | | | | | | | | | | | | | | | |
Common Stocks** | | | (140,424,362 | ) | | | – | | | | – | | | | (140,424,362 | ) |
| Limited Partnerships | | | (3,349,363 | ) | | | – | | | | – | | | | (3,349,363 | ) |
| Exchange‐Traded Funds | | | (25,246,326 | ) | | | – | | | | – | | | | (25,246,326 | ) |
| Exchange‐Traded Notes | | | (1,349,202 | ) | | | – | | | | – | | | | (1,349,202 | ) |
| Rights | | | – | | | | – | | | | (16 | ) | | | (16 | ) |
| Corporate Bonds | | | – | | | | (18,726,527 | ) | | | – | | | | (18,726,527 | ) |
| Written Options | | | (1,501,952 | ) | | | 0 | | | | – | | | | (1,501,952 | ) |
| Credit Default Swap Contracts | | | – | | | | (15,032 | ) | | | – | | | | (15,032 | ) |
| Forward Foreign Currency Exchange Contracts | | | – | | | | (1,445,353 | ) | | | – | | | | (1,445,353 | ) |
| TOTAL | | $ | (171,871,205 | ) | | $ | (19,297,142 | ) | | $ | (16 | ) | | $ | (191,168,363 | ) |
| * | Refer to footnote 2 where leveling hierarchy is defined. |
| ** | Refer to Portfolio of Investments for sector information. |
| *** | Other financial instruments are instruments such as securities sold short, written options, credit default swap contracts, and forward foreign currency exchange contracts. |
| See Notes to Financial Statements. | |
| Annual Report | May 31, 2015 | 45 |
| The Arbitrage Event-Driven Fund | |
| May 31, 2015 |
The following is a reconciliation of the fair valuations using significant unobservable inputs (Level 3) for the Fund’s assets and liabilities during the year ended May 31, 2015:
| | | | | | | | | | | | | | | | | | | | | | | | | | | | | | Net change in | |
| | | | | | | | | | | | | | | | | | | | | | | | | | | | | | unrealized | |
| | | | | | | | | | | | | | | | | | | | | | | | | | | | | | depreciation | |
| | | | | | | | | | | | | | | | | | | | | | | | | | | | | | included in the | |
| | | | | | | | | | | | | | | | | | | | | | | | | | | | | | Statements of | |
| | | | | | | | | | | | | | | | | | | | | | | | | | | | | | Operations | |
| | | | | | | | | | | | | | | | | | | | | | | | | | | | | | attributable to | |
| | | | | | | | | | | | | | | | | | | | | | | | | | | | | | Level 3 | |
| | | | | Return | | | | | | | | | | | | | | | Transfer | | | Transfer | | | | | | | |
| | Balance as of May 31, 2014 | | | of Capital | | | | | | Appreciation/ (Depreciation) | | | Purchases | | | | | | into Level 3 | | | | | | May 31, 2015 | | | May 31, 2015 | |
| Common Stocks | | $ | 266 | | | $ | – | | | $ | 244 | | | $ | (10 | ) | | $ | – | | | $ | (500 | ) | | $ | – | | | $ | – | | | $ | – | | | $ | – | |
| Rights | | | 293,855 | | | | – | | | | 23,890 | | | | (501,798 | ) | | | 947,846 | | | | (65,882 | ) | | | – | | | | – | | | | 697,911 | | | | (497,489 | ) |
| Corporate Bonds | | | 135,575 | | | | (33,695 | ) | | | – | | | | 151,766 | | | | – | | | | (253,646 | ) | | | – | | | | – | | | | – | | | | – | |
| Total | | $ | 429,696 | | | $ | (33,695 | ) | | $ | 24,134 | | | $ | (350,042 | ) | | $ | 947,846 | | | $ | (320,028 | ) | | $ | – | | | $ | – | | | $ | 697,911 | | | $ | (497,489 | ) |
| | | | | | | | | | | | | | | | | | | | | | | | | | | | | | Net change in | |
| | | | | | | | | | | | | | | | | | | | | | | | | | | | | | unrealized | |
| | | | | | | | | | | | | | | | | | | | | | | | | | | | | | depreciation | |
| | | | | | | | | | | | | | | | | | | | | | | | | | | | | | included in the | |
| | | | | | | | | | | | | | | | | | | | | | | | | | | | | | Statements of | |
| | | | | | | | | | | | | | | | | | | | | | | | | | | | | | Operations | |
| | | | | | | | | | | | | | | | | | | | | | | | | | | | | | attributable to | |
| | | | | | | | | | | | | | | | | | | | | | | | | | | | | | Level 3 | |
| | | | | | | | | | | | | | | | | | | | | | | | | | | | | investments | |
| Other Financial | | Balance as of | | | Return of | | | Realized | | | | | | | | | Sales | | | | | | | | | | | | held at May 31, | |
| Instruments | | May 31, 2014 | | | Capital | | | Gain | | | Depreciation | | | Purchases | | | Proceeds | | | Level 3 | | | Level 3 | | | May 31, 2015 | | | 2015 | |
| Rights | | $ | – | | | $ | – | | | $ | – | | | $ | (16 | ) | | $ | – | | | $ | – | | | $ | – | | | $ | – | | | $ | (16 | ) | | $ | (16 | ) |
| Total | | $ | – | | | $ | – | | | $ | – | | | $ | (16 | ) | | $ | – | | | $ | – | | | $ | – | | | $ | – | | | $ | (16 | ) | | $ | (16 | ) |
| See Notes to Financial Statements. | |
| 46 | www.arbitragefunds.com | 1-800-295-4485 |
| The Arbitrage Credit Opportunities Fund | Manager Commentary |
| May 31, 2015 (Unaudited) |
The Arbitrage Credit Opportunities Fund | Tickers: ACFIX, ARCFX, ARCCX, AGCAX
The Fund’s Goal and Main Investments The Fund seeks to provide current income and capital growth by focusing on company‐specific catalysts and events in order to generate returns that are more correlated to the outcomes and timelines of those events, rather than on overall market direction or changes in interest rates. |
Investment Strategy
The Fund employs a fundamentally driven strategy combined with quantitative security analysis. The investment team screens catalyst‐driven investments such as mergers, acquisitions, asset sales, spin‐offs, refinancings, recapitalizations, corporate reorganizations, litigation, and regulatory changes. From this universe the team selects investments based on factors such as risk/reward profile, potential downside, and security liquidity. The team generates returns by holding outright long and short positions and by utilizing capital structure arbitrage, merger arbitrage, and convertible arbitrage techniques to exploit security mispricing or inefficiencies. This portfolio offers a pure‐play credit implementation of Water Island Capital’s broader event‐driven style.
Commentary
2015 was generally a good year for long duration, interest-rate sensitive credit strategies, but a challenging year for high yield corporate credit and event-driven investing. As a fund focused on shorter-duration catalysts and events, we have certainly not benefitted from this interest-rate tailwind. However, we believe that volatility in the commodities and energy sectors as well as other parts of the high yield market has created numerous idiosyncratic opportunities in 2015.
One year ago, fixed income investors were fixated on rising interest rates. Their concerns were unfounded, however, as lower Treasury yields bolstered returns for rate-sensitive products and strategies. Lower interest rates were supported by continued central bank actions in Europe and Japan and by sporadic flights to quality brought about by geopolitical events in Russia and the Middle East. With this decline in interest rates, investors’ reach for yield continued, and the Bank of America Merrill Lynch U.S. High Yield Master II Index and the CCC-rated sub-index returned 5.6% and 6.1%, respectively, through the first six months of calendar year 2014.
However, it wasn’t long before market sentiment changed dramatically. The robust total returns further stretched valuations, leaving corporate credit markets more vulnerable to adversity. As the second half of the year unfolded, global economic growth concerns, increased geopolitical tensions, and a heightened focus on the Federal Reserve’s evolving interest rate policy contributed to increased volatility. Other events, including the U.S. Treasury’s actions to curb tax inversion transactions and a large supply of new bond issuance, prompted investors to adopt a ‘risk-off’ mentality, reduce allocations to high yield (HY) credit, and demand increased yields for riskier names. As a result, the HY index declined by nearly 3% and exhibited drawdowns not seen since 2011 following the U.S. debt limit confrontation and subsequent downgrade of the U.S. sovereign credit rating.
Following significant volatility mid-year, and amidst a precipitous decline in oil prices, high-yield market outflows and energy-related selling continued into January. However, this negative momentum quickly abated on January 22, when the European Central Bank (ECB) announced the launch of an open-ended €60 billion per month bond-buying program. This program, which amounts to €1 trillion in total purchases, exceeded market expectations and served as a positive catalyst for risk sentiment across many asset classes. Markets rallied through February, but again began to sell-off in early March as a combination of outflows, profit-taking, and short-selling emerged. Through March 18, for example, the Bank of America Merrill Lynch High Yield Master II index was down -1.4% for the month. However, on March 18 selling was once again curtailed when the Federal Reserve (Fed) issued dovish statements deemed to be more supportive of fixed income markets.
| | |
| Annual Report | May 31, 2015 | 47 |
| The Arbitrage Event-Driven Fund | Manager Commentary (continued) |
| May 31, 2015 (Unaudited) |
Although market expectations for interest rate increases were pushed out from June to September following these statements, investors continue to express concerns about what could occur once the Fed ultimately begins to raise rates. Investors are keenly aware of the impact that rising rates can have on fixed income portfolios, and we think that recent fund flow volatility directly reflects this caution. Although another ‘race to the exits’ mentality has not struck the broader fixed income markets since the Taper Tantrum in Q2 of 2013, we continue to take steps in our credit portfolios to reduce potential liquidity risks. These steps include continuing to focus on firmer, shorter-dated catalyst investments characterized by higher portfolio roll; increasing the number of short credit ideas; tempering the pace at which we build positions in bonds with high ETF ownership; maintaining higher cash levels; and increasing our opportunistic hedging programs.
Fiscal Year Highlights
In fiscal 2015, the Arbitrage Credit Opportunities Fund (ACFIX) returned 0.16%. The results were predominantly derived from companies residing in the Americas. In terms of sectors, consumer discretionary and telecommunication services were the largest contributors, while energy was the largest detractor.
Our investment in Fortescue proved to be the largest contributor during the period. Fortescue is a global iron ore producer based in Australia that focuses solely on iron ore production, and is smaller in size and more levered than its industry peers. We believed that deteriorating industry fundamentals, including surging global iron ore production and slowing demand for steel production, would lead to a significant decline in Fortescue’s operating and financial profile in 2015. Based on these factors, we believed that Fortescue’s longer-dated bonds were over-valued relative to its shorter-dated bonds. Consequently, we established a short position in Fortescue’s 2022 bonds and a long position in Fortescue’s 2019 bonds during the fourth quarter of 2014. During the quarter, iron ore pricing continued to decline, which pushed the prices of Fortescue’s 2022 bonds lower relative to its 2019 bonds, resulting in a gain on
this investment.
Another contributor over the period was our investment in B/E Aerospace. B/E Aerospace is a manufacturer and distributor of cabin interior products for the commercial aircraft and business jet industries. In June 2014, the company announced it would separate into two separate companies – one focused on manufacturing and the other focused on distribution and logistics services. Our analysis indicated that the company would be required to redeem its outstanding bonds at a premium price in order to complete a spin-off. Given our view of the spin-off’s strategic rationale and the likelihood it would be completed by the end of Q1 2015, we viewed an investment in B/E debt as a high-conviction idea, and established a long position in the company’s 5.25% bond. B/E tendered for the bonds at the end of December, providing an attractive return on this position.
Ardagh, a privately-owned global manufacturer of glass and metal containers, was also a contributor over the period. During Q4 2014, the company announced it would pursue an IPO of its metal container business, and use the resulting proceeds to reduce debt and de-lever its capital structure. In addition, operating and financial synergies from a recent acquisition have been realized, contributing to a reduction in Ardagh’s leverage, and a gain on this investment.
Our largest detractor over the period was our investment in the Sabine-Forest Oil merger. Our thesis for this investment was that Sabine would refinance their 2017 9.75% bonds to extend the runway for the post-merger company that would result after their acquisition of Forest Oil. While the deal closed in December, due to lower oil prices and a lack of attractive financing terms, the 9.75% bonds remained outstanding. Consequently, we were subject to the high yield market’s lack of liquidity and widening price action for this position.
| | |
| 48 | www.arbitragefunds.com | 1-800-295-4485 |
| The Arbitrage Event-Driven Fund | Manager Commentary (continued) |
| May 31, 2015 (Unaudited) |
Another detractor for the period was our position in Cal Dive International, a marine contracting company. The company provides services including manned diving, pipe laying, and pipe burial services to the offshore oil and natural gas industry. We entered this investment through the company’s convertible bonds in Q3 2014 with the thesis that a rollover of the company’s first lien debt, with a syndicate led by Bank of America, would extend the company’s liquidity runway and allow the company to complete projects with its largest customer, Petroleos Mexicanos (Pemex). Soon after initiating this position, however, it appeared that Bank of America was looking to exit its first lien relationship with Cal Dive. This lack of financing commitment caused Cal Dive’s bonds to decline during the period.
Southern Pacific Resources, a Canada-based oil exploration and production company, also proved to be a detractor over the period. Southern Pacific experienced lower production at its Canadian oil sands sites while raising capital to extend liquidity and taking other measures to increase production. The bonds traded lower after the company announced that it was no longer seeking strategic alternatives.
Outlook
As we approach the third anniversary of the Arbitrage Credit Opportunities Fund in October, we anticipate increased mergers and acquisitions activity will translate into more merger-related debt opportunities for us. We also expect that activist pressure on corporate managements and boards will translate into more spin-offs and asset sales, which, in turn, can lead to more refinancing and deleveraging activity from which to choose. We are particularly fond of these types of investments as their firmer catalysts and shorter durations can help produce lower correlated and less volatile returns for the portfolio. At the other end of the investing spectrum, we foresee a large universe of opportunities in the energy and commodities space. While these situations are highly dependent on the direction of commodity prices such as oil, iron ore, and coal, capital structures for many companies in these sectors have been severely weakened. Our flexibility to invest from either the long side or the short side (or both) can help us assemble an attractive mix of investments as prices and yields move in response to changing operations, liquidity and leverage. All of this makes us optimistic about the opportunities in the months ahead.
Sincerely,
The Investment Team at Water Island Capital
| | |
| Annual Report | May 31, 2015 | 49 |
The Arbitrage Credit Opportunities Fund | Portfolio Information |
| May 31, 2015 (Unaudited) |
Performance (annualized returns as of May 31, 2015)
| | One Year | Since Inception* |
| Arbitrage Credit Opportunities Fund, Class R | ‐0.10% | 2.69% |
| Arbitrage Credit Opportunities Fund, Class I | 0.16% | 2.89% |
| Arbitrage Credit Opportunities Fund, Class C** | ‐1.73% | 2.01% |
| Arbitrage Credit Opportunities Fund, Class A*** | ‐3.22% | 0.73% |
| Barclays Capital U.S. Aggregate Bond Index | 3.03% | 1.85% |
Current performance may be higher or lower than performance quoted above. Any performance data quoted represents past performance and the investment return and principal value of an investment in the Fund will fluctuate so that an investor's shares, when redeemed, may be worth more or less than their original cost. Past performance is no guarantee of future results. Returns do not reflect a 2% redemption fee for shares that are redeemed from the fund within 60 days of purchase, which, if reflected, would reduce the performance quoted. Returns shown above include the reinvestment of all dividends and capital gains. Contractual fee waivers are currently in effect. Without such fee waivers, performance numbers would be reduced. You can obtain
performance data current to the most recent month end by calling 1-800-295-4485 or going
to www.arbitragefunds.com.
* | Class R, Class I and Class C inception: 10/1/12; Class A inception: 6/1/13. |
** | Class C shares are subject to a 1.00% contingent deferred sales charge on all purchases redeemed in 12 months of purchase. |
*** | Class A shares are subject to a maximum front-end sales load of 3.25% on purchases up to $500,000. The shares are also subject to a deferred sales charge of up to 1.00% on purchases of $500,000 or more purchased without a front-end sales load and redeemed within 18 months of purchase. |
The Total Annual Fund Operating Expenses for Class R, Class I, Class C and Class A are 2.62%, 2.37%, 3.37% and 2.62%, respectively. The Advisor has agreed to waive fees in excess of 1.50%, 1.25%, 2.25% and 1.50% for Class R, Class I, Class C and Class A, respectively, until at least August 31, 2016.
The Barclays Capital U.S. Aggregate Bond Index is a market value-weighted index of investment grade fixed-rated debt issues, including government, corporate, asset-backed and mortgage-backed securities with a maturity of one year or more.
An investor may not invest directly in an index.
| | |
| 50 | www.arbitragefunds.com | 1-800-295-4485 |
The Arbitrage Credit Opportunities Fund | Portfolio Information (continued) |
| May 31, 2015 (Unaudited) |
Growth of $10,000 Investment
The chart represents historical performance of a hypothetical investment of $10,000 in the Class R shares of the
Fund since inception. Past performance does not guarantee future results. This chart does not reflect the deduction of taxes that a shareholder would pay on Fund distributions or the redemption of Fund shares.
Sector Weighting
The following chart shows the sector weightings of the Arbitrage Credit Opportunities Fund’s investments in common stock, corporate bonds, convertible corporate bonds and exchange-traded funds as of the report date.
| | |
| Annual Report | May 31, 2015 | 51 |
The Arbitrage Credit Opportunities Fund | Portfolio of Information |
| May 31, 2015 |
| | | Shares | | | Value | |
| COMMON STOCKS ‐ 3.54% | | | | | | |
| Biotechnology ‐ 0.52% | | | | | | |
Illumina, Inc.(a) | | | 1,800 | | | $ | 370,944 | |
| | | | | | | | | |
| Commercial Services ‐ 0.52% | | | | | | | | |
| Macquarie Infrastructure Co., LLC | | | 4,400 | | | | 372,416 | |
| | | | | | | | | |
| Internet ‐ 0.49% | | | | | | | | |
Priceline Group, Inc.(a) | | | 300 | | | | 351,612 | |
| | | | | | | | | |
| Software ‐ 2.01% | | | | | | | | |
Akamai Technologies, Inc.(a) | | | 3,900 | | | | 297,453 | |
Citrix Systems, Inc.(a) | | | 3,300 | | | | 214,533 | |
Red Hat, Inc.(a) | | | 4,700 | | | | 363,169 | |
Salesforce.com, Inc.(a) | | | 7,700 | | | | 560,175 | |
| | | | | | | | 1,435,330 | |
| | | | | | | | | |
| TOTAL COMMON STOCKS | | | | | | | | |
| (Cost $2,329,305) | | | | | | | 2,530,302 | |
| | | | | | | | | |
| EXCHANGE‐TRADED NOTES ‐ 0.06% | | | | | | | | |
| Specialty Funds ‐ 0.06% | | | | | | | | |
iPath® S&P 500® VIX Short‐Term Futures™ ETN(a) | | | 2,257 | | | | 42,883 | |
| | | | | | | | | |
| TOTAL EXCHANGE‐TRADED NOTES | | | | | | | | |
| (Cost $53,881) | | | | | | | 42,883 | |
| | | | | | | | | |
| PREFERRED STOCKS ‐ 0.61% | | | | | | | | |
| Insurance ‐ 0.61% | | | | | | | | |
| Montpelier Re Holdings Ltd., Series A, 8.875% | | | 16,300 | | | | 432,276 | |
| | | | | | | | | |
| TOTAL PREFERRED STOCKS | | | | | | | | |
| (Cost $429,546) | | | | | | | 432,276 | |
| See Notes to Financial Statements. | |
| 52 | www.arbitragefunds.com | 1-800-295-4485 |
The Arbitrage Credit Opportunities Fund | Portfolio of Information (continued) |
| May 31, 2015 |
| | | | | | | | | Principal | | | | |
| | | Maturity Date | | | Rate(b) | | | Amount | | | Value | |
| BANK LOANS ‐ 2.82% | | | | | | | | | | | | |
| FairPoint Communications, Inc. | | 02/14/2019 | | | | 7.500 | % | | $ | 295,477 | | | $ | 298,618 | |
| OSG Bulk Ships, Inc. | | 07/22/2019 | | | | 5.250 | % | | | 645,125 | | | | 649,157 | |
| Station Casinos | | 03/01/2020 | | | | 4.250 | % | | | 366,336 | | | | 367,826 | |
| Zayo Bandwidth LLC | | 05/06/2021 | | | | 4.000 | % | | | 700,101 | | | | 700,258 | |
| | | | | | | | | | | | | | | | |
| TOTAL BANK LOANS | | | | | | | | | | | | | | | |
| (Cost $2,021,095) | | | | | | | | | | | | | | 2,015,859 | |
| | | | | | | | | | | | | | | | |
| CORPORATE BONDS ‐ 74.55% | | | | | | | | | | | | | | | |
| Aerospace & Defense ‐ 1.12% | | | | | | | | | | | | | |
| TransDigm, Inc. | | 07/15/2021 | | | | 7.500 | % | | | 742,000 | | | | 801,360 | |
| | | | | | | | | | | | | | | | |
| Auto Parts & Equipment ‐ 0.78% | | | | | | | | | | | | | |
TRW Automotive, Inc.(c)(d) | | 03/01/2021 | | | | 4.500 | % | | | 550,000 | | | | 556,875 | |
| | | | | | | | | | | | | | | | |
| Banks ‐ 0.98% | | | | | | | | | | | | | | | |
| CIT Group, Inc. | | 08/15/2017 | | | | 4.250 | % | | | 550,000 | | | | 561,660 | |
| Wells Fargo Capital X | | 12/15/2036 | | | | 5.950 | % | | | 136,000 | | | | 138,380 | |
| | | | | | | | | | | | | | | 700,040 | |
| Chemicals ‐ 0.50% | | | | | | | | | | | | | | | |
| Ashland, Inc. | | 04/15/2018 | | | | 3.875 | % | | | 345,000 | | | | 355,419 | |
| | | | | | | | | | | | | | | | |
| Computers ‐ 1.33% | | | | | | | | | | | | | | | |
SunGard Data Systems, Inc.(c) | | 11/15/2020 | | | | 7.625 | % | | | 896,000 | | | | 947,520 | |
| | | | | | | | | | | | | | | | |
| Distribution & Wholesale ‐ 2.08% | | | | | | | | | | | | | | | | |
Brightstar Corp.(d) | | 12/01/2016 | | | | 9.500 | % | | | 1,435,000 | | | | 1,484,364 | |
| | | | | | | | | | | | | | | | | |
| Diversified Financial Services ‐ 3.03% | | | | | | | | | | | | | |
| Ally Financial, Inc. | | | | | | | | | | | | | | | | |
| | | 02/15/2017 | | | | 5.500 | % | | | 650,000 | | | | 679,250 | |
| | | 03/15/2020 | | | | 8.000 | % | | | 566,000 | | | | 669,295 | |
| GFI Group, Inc. | | 07/19/2018 | | | | 10.375 | % | | | 443,000 | | | | 492,837 | |
Prospect Holding Co., LLC / Prospect Holding Finance Co.(d) | | 10/01/2018 | | | | 10.250 | % | | | 475,000 | | | | 327,750 | |
| | | | | | | | | | | | | | | | 2,169,132 | |
| Electronics ‐ 2.55% | | | | | | | | | | | | | | | | |
Viasystems, Inc.(c)(d) | | 05/01/2019 | | | | 7.875 | % | | | 1,723,000 | | | | 1,826,380 | |
| See Notes to Financial Statements. | |
| Annual Report | May 31, 2015 | 53 |
The Arbitrage Credit Opportunities Fund | Portfolio of Information (continued) |
| May 31, 2015 |
| | | | | | | Principal | | | | |
| | Maturity Date | | Rate(b) | | | Amount | | | Value | |
| CORPORATE BONDS ‐ 74.55% (Continued) | | | | | | | | | | |
| Entertainment ‐ 3.50% | | | | | | | | | | |
Mohegan Tribal Gaming Authority(d) | 09/15/2018 | | | 11.000 | % | | $ | 500,000 | | | $ | 500,625 | |
Peninsula Gaming LLC / Peninsula Gaming Corp.(d) | 02/15/2018 | | | 8.375 | % | | | 650,000 | | | | 683,312 | |
| Pinnacle Entertainment, Inc. | | | | | | | | | | | | | |
| | 08/01/2021 | | | 6.375 | % | | | 250,000 | | | | 266,875 | |
| 04/01/2022 | | | 7.750 | % | | | 955,000 | | | | 1,055,275 | |
| | | | | | | | | | | | | 2,506,087 | |
| Financial Services ‐ 1.96% | | | | | | | | | | | | | |
| Marina District Finance Co., Inc. | 08/15/2018 | | | 9.875 | % | | | 1,350,000 | | | | 1,400,625 | |
| | | | | | | | | | | | | | |
| Food ‐ 8.48% | | | | | | | | | | | | | |
Bumble Bee Holdings, Inc.(d) | 12/15/2017 | | | 9.000 | % | | | 1,000,000 | | | | 1,050,000 | |
| Chiquita Brands International, Inc. / Chiquita Brands LLC(c) | 02/01/2021 | | | 7.875 | % | | | 1,700,000 | | | | 1,848,750 | |
| Dean Holding Co. | 10/15/2017 | | | 6.900 | % | | | 150,000 | | | | 160,500 | |
| HJ Heinz Co. | 10/15/2020 | | | 4.250 | % | | | 700,000 | | | | 716,625 | |
HJ Heinz Co.(d) | 02/15/2025 | | | 4.875 | % | | | 884,000 | | | | 952,510 | |
| US Foods, Inc. | 06/30/2019 | | | 8.500 | % | | | 1,275,000 | | | | 1,332,375 | |
| | | | | | | | | | | | | 6,060,760 | |
| Food Service ‐ 1.23% | | | | | | | | | | | | | |
| Aramark Services, Inc. | 03/15/2020 | | | 5.750 | % | | | 845,000 | | | | 881,969 | |
| | | | | | | | | | | | | | |
| Healthcare ‐ Products ‐ 8.01% | | | | | | | | | | | | | |
| Alere, Inc. | 10/01/2018 | | | 8.625 | % | | | 1,000,000 | | | | 1,038,125 | |
| Baxter International, Inc. | 06/01/2018 | | | 5.375 | % | | | 1,571,000 | | | | 1,738,369 | |
| Biomet, Inc. | 10/01/2020 | | | 6.500 | % | | | 2,809,000 | | | | 2,950,293 | |
| | | | | | | | | | | | | 5,726,787 | |
| Healthcare ‐ Services ‐ 4.40% | | | | | | | | | | | | | |
| Catamaran Corp. | 03/15/2021 | | | 4.750 | % | | | 195,000 | | | | 216,938 | |
| CHS / Community Health Systems, Inc. | 11/15/2019 | | | 8.000 | % | | | 854,000 | | | | 907,375 | |
MedImpact Holdings, Inc.(d) | 02/01/2018 | | | 10.500 | % | | | 881,000 | | | | 929,455 | |
| United Surgical Partners International, Inc. | 04/01/2020 | | | 9.000 | % | | | 1,016,000 | | | | 1,089,660 | |
| | | | | | | | | | | | | 3,143,428 | |
| See Notes to Financial Statements. | |
| 54 | www.arbitragefunds.com | 1-800-295-4485 |
The Arbitrage Credit Opportunities Fund | Portfolio of Information (continued) |
| May 31, 2015 |
| | | | | | | Principal | | | | |
| | Maturity Date | | Rate(b) | | | Amount | | | Value | |
| CORPORATE BONDS ‐ 74.55% (Continued) | | | | | | | | | | |
| Household Products & Wares‐ 2.93% | | | | | | | | | | |
| Armored Autogroup, Inc. | 11/01/2018 | | | 9.250 | % | | $ | 2,000,000 | | | $ | 2,097,200 | |
| | | | | | | | | | | | | | |
| Insurance ‐ 1.77% | | | | | | | | | | | | | |
Ambac Assurance Corp.(c)(d) | 06/07/2020 | | | 5.100 | % | | | 802,688 | | | | 933,124 | |
Ambac Assurance Corp.(d) | 08/28/2039 | | | 5.100 | % | | | 146,000 | | | | 116,800 | |
Syncora Holdings Ltd.(e) | | | | | | | | | | | | | |
| Perpetual | | | | | | | | | | | | |
| Maturity | | | 5.000 | % | | | 66,155 | | | | 49,712 | |
| Perpetual | | | | | | | | | | | | |
| Maturity | | | 6.000 | % | | | 208,000 | | | | 166,747 | |
| | | | | | | | | | | | | 1,266,383 | |
| Lodging ‐ 0.31% | | | | | | | | | | | | | |
| MGM Resorts International | 07/15/2015 | | | 6.625 | % | | | 224,000 | | | | 225,120 | |
| | | | | | | | | | | | | | |
| Machinery ‐ Diversified ‐ 2.41% | | | | | | | | | | | | | |
| CNH Industrial Capital LLC | 11/01/2015 | | | 3.875 | % | | | 750,000 | | | | 754,688 | |
| Manitowoc Co., Inc. | 10/15/2022 | | | 5.875 | % | | | 897,000 | | | | 968,760 | |
| | | | | | | | | | | | | 1,723,448 | |
| Media ‐ 5.07% | | | | | | | | | | | | | |
| CCO Holdings LLC / CCO Holdings Capital Corp. | 01/15/2019 | | | 7.000 | % | | | 396,000 | | | | 411,592 | |
| Clear Channel Worldwide Holdings, Inc., Series B | 03/15/2020 | | | 7.625 | % | | | 375,000 | | | | 396,562 | |
Entercom Radio LLC(c) | 12/01/2019 | | | 10.500 | % | | | 1,005,000 | | | | 1,092,938 | |
| Gray Television, Inc. | 10/01/2020 | | | 7.500 | % | | | 100,000 | | | | 106,500 | |
Univision Communications, Inc.(d) | 05/15/2021 | | | 8.500 | % | | | 815,000 | | | | 868,994 | |
| WideOpenWest Finance LLC / WideOpenWest Capital Corp. | 07/15/2019 | | | 10.250 | % | | | 700,000 | | | | 747,250 | |
| | | | | | | | | | | | | 3,623,836 | |
| Miscellaneous Manufacturing‐ 4.15% | | | | | | | | | | | | | |
| LSB Industries, Inc. | 08/01/2019 | | | 7.750 | % | | | 1,365,000 | | | | 1,450,313 | |
SPX Corp.(c) | 09/01/2017 | | | 6.875 | % | | | 1,390,000 | | | | 1,515,100 | |
| | | | | | | | | | | | | 2,965,413 | |
| Oil & Gas ‐ 0.80% | | | | | | | | | | | | | |
| EPL Oil & Gas, Inc. | 02/15/2018 | | | 8.250 | % | | | 800,000 | | | | 560,000 | |
Southern Pacific Resource Corp.(d)(f) | 01/25/2018 | | | 8.750 | % | | | 356,000 | | | | 14,313 | |
| | | | | | | | | | | | | 574,313 | |
| See Notes to Financial Statements. | |
| Annual Report | May 31, 2015 | 55 |
The Arbitrage Credit Opportunities Fund | Portfolio of Information (continued) |
| May 31, 2015 |
| | | | | | | Principal | | | | |
| | Maturity Date | | Rate(b) | | | Amount | | | Value | |
| CORPORATE BONDS ‐ 74.55% (Continued) | | | | | | | | | | |
| Oil & Gas Services ‐ 1.53% | | | | | | | | | | |
| Exterran Holdings, Inc. | 12/01/2018 | | | 7.250 | % | | $ | 1,057,000 | | | $ | 1,091,353 | |
| | | | | | | | | | | | | | |
| Packaging & Containers ‐ 2.65% | | | | | | | | | | | | | |
Ardagh Finance Holdings SA, PIK(d) | 06/15/2019 | | | 8.625 | % | | | 771,921 | | | | 792,361 | |
| Reynolds Group Issuer, Inc./ Reynolds Group Issuer LLC / Reynolds Group Issuer (Luxembourg) SA | 04/15/2019 | | | 7.125 | % | | | 372,000 | | | | 384,555 | |
Sealed Air Corp.(d) | 09/15/2021 | | | 8.375 | % | | | 635,000 | | | | 714,375 | |
| | | | | | | | | | | | | 1,891,291 | |
| Real Estate Investment Trusts‐ 1.41% | | | | | | | | | | | | | |
| Iron Mountain, Inc. | 08/15/2021 | | | 8.375 | % | | | 970,000 | | | | 1,009,770 | |
| | | | | | | | | | | | | | |
| Retail ‐ 1.10% | | | | | | | | | | | | | |
| Brown Shoe Co., Inc. | 05/15/2019 | | | 7.125 | % | | | 755,000 | | | | 783,312 | |
| | | | | | | | | | | | | | |
| Semiconductors ‐ 1.70% | | | | | | | | | | | | | |
| Freescale Semiconductor, Inc. | 08/01/2020 | | | 10.750 | % | | | 949,000 | | | | 1,014,244 | |
NXP BV / NXP Funding LLC(d) | 09/15/2016 | | | 3.500 | % | | | 200,000 | | | | 203,250 | |
| | | | | | | | | | | | | 1,217,494 | |
| Software ‐ 2.33% | | | | | | | | | | | | | |
Eagle Midco, Inc.(c)(d) | 06/15/2018 | | | 9.000 | % | | | 700,000 | | | | 714,000 | |
| First Data Corp. | 08/15/2021 | | | 11.750 | % | | | 835,000 | | | | 955,031 | |
| | | | | | | | | | | | | 1,669,031 | |
| Telecommunications ‐ 5.61% | | | | | | | | | | | | | |
| AT&T, Inc. | 08/15/2016 | | | 2.400 | % | | | 373,000 | | | | 378,393 | |
| Cincinnati Bell, Inc. | 10/15/2020 | | | 8.375 | % | | | 855,000 | | | | 905,231 | |
FairPoint Communications, Inc.(d) | 08/15/2019 | | | 8.750 | % | | | 30,000 | | | | 31,725 | |
NII Capital Corp.(f) | 04/01/2021 | | | 7.625 | % | | | 1,882,000 | | | | 511,669 | |
NII International Telecom SCA(d)(f) | 08/15/2019 | | | 7.875 | % | | | 1,354,000 | | | | 1,252,450 | |
| T‐Mobile USA, Inc. | 04/28/2019 | | | 6.464 | % | | | 901,000 | | | | 930,846 | |
| | | | | | | | | | | | | 4,010,314 | |
| See Notes to Financial Statements. | |
| 56 | www.arbitragefunds.com | 1-800-295-4485 |
The Arbitrage Credit Opportunities Fund | Portfolio of Information (continued) |
| May 31, 2015 |
| | | | | | | Principal | | | | |
| | Maturity Date | | Rate(b) | | | Amount | | | Value | |
| CORPORATE BONDS ‐ 74.55% (Continued) | | | | | | | | | | |
| Transportation ‐ 0.83% | | | | | | | | | | |
| Overseas Shipholding Group, Inc. | 03/30/2018 | | | 8.125 | % | | $ | 569,000 | | | $ | 594,249 | |
| | | | | | | | | | | | | | |
| TOTAL CORPORATE BONDS | | | | | | | | | | | | | |
| (Cost $53,721,876) | | | | | | | | | | | | 53,303,273 | |
| | | | | | | | | | | | | | |
| CONVERTIBLE CORPORATE BONDS‐ 2.78% | | | | | | | | | | | | | |
| Engineering & Construction ‐0.27% | | | | | | | | | | | | | |
| Aecon Group, Inc. | 10/31/2015 | | | 6.250 | % | | | 235,000 | | | | 191,802 | |
| | | | | | | | | | | | | | |
| Mining ‐ 0.45% | | | | | | | | | | | | | |
| Primero Mining Corp. | 03/31/2016 | | | 6.500 | % | | | 325,000 | | | | 324,838 | |
| | | | | | | | | | | | | | |
| Oil & Gas Services ‐ 0.05% | | | | | | | | | | | | | |
Cal Dive International, Inc.(f) | 07/15/2017 | | | 5.000 | % | | | 314,000 | | | | 32,381 | |
| | | | | | | | | | | | | | |
| Pharmaceuticals ‐ 2.01% | | | | | | | | | | | | | |
| Omnicare, Inc. | 02/15/2044 | | | 3.500 | % | | | 1,000,000 | | | | 1,438,125 | |
| | | | | | | | | | | | | | |
| TOTAL CONVERTIBLE CORPORATE BONDS | | | | | | | | | | | | | |
| (Cost $2,220,982) | | | | | | | | | | | | 1,987,146 | |
| | | Expiration | | | Exercise | | | | | | | |
| | | Date | | | Price | | | Contracts | | | Value | |
PURCHASED OPTIONS(a)‐ 0.02% | | | | | | | | | | | | |
| Put Options Purchased ‐ 0.02% | | | | | | | | | | | | |
| SPDR® S&P 500® ETF Trust | | | 06/2015 | | | $ | 202.00 | | | | 250 | | | $ | 16,625 | |
| | | | | | | | | | | | | | | | | |
| TOTAL PUT OPTIONS PURCHASED | | | | | | | | | | | | | | | | |
| (Cost $18,435) | | | | | | | | | | | | | | | 16,625 | |
| See Notes to Financial Statements. | |
| Annual Report | May 31, 2015 | 57 |
The Arbitrage Credit Opportunities Fund | Portfolio of Information (continued) |
| May 31, 2015 |
| | | Yield | | | Shares | | | Value | |
| SHORT‐TERM INVESTMENTS ‐ 18.05% | | | | | | | | | |
| Money Market Fund | | | | | | | | | |
| State Street Institutional Liquid Reserves Fund | | | 0.100 | %(g) | | | 12,906,753 | | | $ | 12,906,753 | |
| | | | | | | | | | | | | |
| TOTAL SHORT‐TERM INVESTMENTS | | | | | | | | | | | | |
| (Cost $12,906,753) | | | | | | | | | | | 12,906,753 | |
| | | | | | | | | | | | | |
| Total Investments ‐ 102.43% | | | | | | | | | | | | |
| (Cost $73,701,873) | | | | | | | | | | | 73,235,117 | |
| | | | | | | | | | | | | |
| Liabilities in Excess of Other Assets ‐ (2.43%) | | | | | | | | | | | (1,738,910 | )(h) |
| | | | | | | | | | | | | |
| NET ASSETS ‐ 100.00% | | | | | | | | | | $ | 71,496,207 | |
(a) | Non-income-producing security. |
(b) | Interest rate will change at a future date. Interest rate shown reflects the rate in effect at May 31, 2015. |
(c) | Security, or a portion of security, is being held as collateral for short sales or written option contracts. At period end, the aggregate market value of those securities was $6,436,090, representing 9.00% of net assets. |
(d) | Security exempt from registration under Rule 144A of the Securities Act of 1933. These securities may be resold in transactions exempt from registration, normally to qualified institutional buyers. As of May 31, 2015, these securities had a total value of $13,952,663 or 19.52% of net assets. |
(e) | This security has no contractual maturity date, is not redeemable and contractually pays an indefinite stream of interest. |
(f) | Security in default on interest payments. |
(g) | Rate shown is the 7-day effective yield as of May 31, 2015. |
(h) | Includes cash which is being held as collateral for short sales and written option contracts. |
| See Notes to Financial Statements. | |
| 58 | www.arbitragefunds.com | 1-800-295-4485 |
The Arbitrage Credit Opportunities Fund | Portfolio of Investments (continued) |
| May 31, 2015 |
| | | | | | | | | | | |
| SCHEDULE OF SECURITIES SOLD SHORT | | | | | Shares | | | Value | |
| COMMON STOCKS ‐ (0.79%) | | | | | | | | | | |
| Pharmaceuticals ‐ (0.79%) | | | | | | | | | | |
| Omnicare, Inc. | | | | | | | (5,900 | ) | | $ | (562,211 | ) |
| | | | | | | | | | | | | |
| TOTAL COMMON STOCKS | | | | | | | | | | | | |
| (Proceeds $565,210) | | | | | | | | | | | (562,211 | ) |
| | | | | | | | | | | | | |
| EXCHANGE‐TRADED FUNDS ‐ (0.10%) | | | | | | | | | | | |
| Debt Funds ‐ (0.10%) | | | | | | | | | | | | |
| SPDR® Barclays High Yield Bond ETF | | | | | | (1,896 | ) | | | (74,740 | ) |
| | | | | | | | | | | | | |
| TOTAL EXCHANGE‐TRADED FUNDS | | | | | | | | | | | |
| (Proceeds $75,733) | | | | | | | | | | | (74,740 | ) |
| | | | | | | | | | | | | |
| | Maturity Date | | Rate | | Principal Amount | | | Value | |
| CORPORATE BONDS ‐ (5.04%) | | | | | | | | | | | | |
| Chemicals ‐ (1.05%) | | | | | | | | | | | | |
| Ashland, Inc. | 08/15/2022 | | | 4.750 | % | | $ | (738,000 | ) | | $ | (752,760 | ) |
| | | | | | | | | | | | | | |
| Commercial Services ‐ (0.66%) | | | | | | | | | | | | |
| Block Financial LLC | 11/01/2022 | | | 5.500 | % | | | (429,000 | ) | | | (468,643 | ) |
| | | | | | | | | | | | | | |
| Iron & Steel ‐ (0.41%) | | | | | | | | | | | | | |
| Vale SA | 09/11/2042 | | | 5.625 | % | | | (339,000 | ) | | | (296,211 | ) |
| | | | | | | | | | | | | | |
| Oil & Gas ‐ (1.59%) | | | | | | | | | | | | | |
| Ensco Plc | 03/15/2021 | | | 4.700 | % | | | (1,103,000 | ) | | | (1,140,102 | ) |
| | | | | | | | | | | | | | |
| Oil & Gas Services ‐ (0.34%) | | | | | | | | | | | | | |
| National Oilwell Varco, | | | | | | | | | | | | | |
| Inc. | 12/01/2022 | | | 2.600 | % | | | (248,000 | ) | | | (240,283 | ) |
| | | | | | | | | | | | | | |
| Telecommunications ‐ (0.99%) | | | | | | | | | | | | |
| AT&T, Inc. | 03/11/2024 | | | 3.900 | % | | | (688,000 | ) | | | (708,226 | ) |
| | | | | | | | | | | | | | |
| TOTAL CORPORATE BONDS | | | | | | | | | | | | | |
| (Proceeds $3,604,426) | | | | | | | | | | | | (3,606,225 | ) |
| | | | | | | | | | | | | | |
| CONVERTIBLE CORPORATE BONDS ‐(8.25%) | | | | | | | | | | | | |
| Biotechnology ‐ (1.27%) | | | | | | | | | | | | | |
Illumina, Inc.(a) | 06/15/2021 | | | 0.500 | % | | | (750,000 | ) | | | (907,500 | ) |
See Notes to Financial Statements. |
| Annual Report | May 31, 2015 | 59 |
The Arbitrage Credit Opportunities Fund | Portfolio of Investments (continued) |
| May 31, 2015 |
| | Maturity Date | Rate | | Principal Amount | | Value | |
| CONVERTIBLE CORPORATE BONDS ‐(8.25%)(Continued) | | | | | | | |
| Commercial Services ‐ (1.25%) | | | | | | | |
| Macquarie Infrastructure | | | | | | | |
| Co., LLC | 07/15/2019 | | | 2.875 | % | | $ | (750,000 | ) | | $ | (894,844 | ) |
| | | | | | | | | | | | | | |
| Internet ‐ (1.19%) | | | | | | | | | | | | | |
| Priceline Group, Inc. | 06/15/2020 | | | 0.350 | % | | | (750,000 | ) | | | (847,031 | ) |
| | | | | | | | | | | | | | |
| Software ‐ (4.54%) | | | | | | | | | | | | | |
| Akamai Technologies, | | | | | | | | | | | | | |
Inc.(b) | 02/15/2019 | | | 0.000 | % | | | (750,000 | ) | | | (828,281 | ) |
| Citrix Systems, Inc. | 04/15/2019 | | | 0.500 | % | | | (750,000 | ) | | | (791,250 | ) |
Red Hat, Inc.(a) | 10/01/2019 | | | 0.250 | % | | | (550,000 | ) | | | (691,281 | ) |
| Salesforce.com, Inc. | 04/01/2018 | | | 0.250 | % | | | (750,000 | ) | | | (937,969 | ) |
| | | | | | | | | | | | | (3,248,781 | ) |
| | | | | | | | | | | | | | |
| | | | | | | | | | | | | | |
| TOTAL CONVERTIBLE CORPORATE BONDS | | | | | | | | | | | | |
| (Proceeds $5,657,844) | | | | | | | | | | | | (5,898,156 | ) |
| | | | | | | | | | | | | | |
| TOTAL SECURITIES SOLD SHORT | ‐(14.18%) | | | | | | | | | | | | |
| (Proceeds $9,903,213) | | | | | | | | | | | $ | (10,141,332 | ) |
| | | | | | | | | | | | | | |
| SCHEDULE OF | Expiration | | | | | | | | | | | | |
| WRITTEN OPTIONS | Date | Exercise Price | | Contracts | | Value | |
| | | | | | | | | | | | | | |
| Written Put Options | | | | | | | | | | | | | |
SPDR® S&P 500® ETF Trust | 06/2015 | | $ | 195.00 | | | | (250 | ) | | $ | (5,875 | ) |
| | | | | | | | | | | | | | |
| TOTAL WRITTEN PUT OPTIONS | | | | | | | | | | | | | |
| (Premiums received $7,315) | | | | | | | | | | | | (5,875 | ) |
| (a) | Security exempt from registration under Rule 144A of the Securities Act of 1933. These securities may be resold in transactions exempt from registration, normally to qualified institutional buyers. As of May 31, 2015, these securities had a total value of $(1,598,781) or (2.24%) of net assets. |
| (b) | Represents a zero coupon bond. |
See Notes to Financial Statements. |
| 60 | www.arbitragefunds.com | 1-800-295-4485 |
The Arbitrage Credit Opportunities Fund | Portfolio of Investments (continued) |
| May 31, 2015 |
CREDIT DEFAULT SWAP CONTRACTS
| | | | Implied | | | | | | | | | | |
| | | | Credit | | | | | | | | | | |
| | | | Spread at | | | | Rate | | | Upfront | | | |
| Swap | Reference | Buy Credit | May 31, | | Notional | | Received by | | Termination | Payment | | Unrealized | |
| Counterparty | Obligation | Protection(a) | 2015(b) | | Amount(c) | | the Fund | | Date | Received | | Depreciation | |
| CDX North | | | | | | | | | | | | |
| American High | | | | | | | | | | | | |
| Morgan | Yield Index | | | | | | | | | | | | |
| Stanley | Series 24 | Buy | | | 3.39 | % | | $ | (535,000 | ) | | | 5.00 | % | 06/20/2020 | | $ | 36,032 | | | $ | (1,801 | ) |
| | | | | | | | | | | | | | | | | | $ | 36,032 | | | $ | (1,801 | ) |
| (a) | If the Fund is a buyer of protection and a credit event occurs, as defined under the terms of that particular swap agreement, the Fund will either (i) receive from the seller of protection an amount equal to the notional amount of the swap and deliver the referenced obligation or underlying securities comprising the referenced index or (ii) receive a net settlement amount in the form of cash or securities equal to the notional amount of the swap less the recovery value of the referenced obligation or underlying securities comprising the referenced index. |
| (b) | Implied credit spreads, represented in absolute terms, utilized in determining the market value of credit default swap agreements on corporate issues, sovereign issues of an emerging country, U.S. municipal issues, and U.S. Treasury obligation issues as of period end serve as an indicator of the current status of the payment/performance risk and represent the likelihood or risk of default for the credit derivative. The implied credit spread of a particular referenced entity reflects the cost of buying/selling protection and may include upfront payments required to be made to enter into the agreement. Wider credit spreads represent a deterioration of the referenced entity’s credit soundness and a greater likelihood or risk of default or other credit event occurring as defined under the terms of the agreement. |
| (c) | The maximum potential amount the Fund could be required to pay as a seller of credit protection or receive as a buyer of credit protection if a credit event occurs as defined under the terms of that particular swap agreement. |
OUTSTANDING FORWARD FOREIGN CURRENCY EXCHANGE CONTRACTS
| | | | | Purchase/ | | | | | | | |
| Contract | | Contracts to | | Sale | Expiration | | | | Unrealized | |
| Description | | Deliver/Receive | | Contract | Date | Current Value | | Depreciation | |
| CAD | | | 256,300 | | Sale | 06/15/2015 | | $ | 206,037 | | | $ | (5,074 | ) |
| | | | | | | | | | | | | $ | (5,074 | ) |
See Notes to Financial Statements. |
| Annual Report | May 31, 2015 | 61 |
The Arbitrage Credit Opportunities Fund | Portfolio of Investments (continued) |
| May 31, 2015 |
| The following is a summary of investments classified by foreign country exposure: |
| Country | % of Net Assets(a) | |
| Luxembourg | | | 2.86 | % |
| Canada | | | 0.74 | % |
| Bermuda | | | 0.61 | % |
| Netherlands | | | 0.28 | % |
| United States | | | 97.94 | % |
| Liabilities in Excess of Other Assets | | | (2.43 | )% |
| | | | 100.00 | % |
| | | | | |
(a) These percentages represent long positions only and are not net of short positions.
Abbreviations:
BV -Besloten Vennootschap is the Dutch term for private limited liability company
CAD -Canadian Dollar
ETF Exchange-Traded Fund
ETN -Exchange-Traded Note
LLC -Limited Liability Company Ltd. - Limited
PIK -Payment-in-kind
Plc -Public Limited Company
| SA - | Generally designates corporations in various countries, mostly those employing civil law. This translates literally in all languages mentioned as anonymous company |
SCA -Societe en commandite pe actiuni is the Romanian term for limited liability partnership
S&P -Standard & Poor's
SPDR -Standard & Poor's Depositary Receipt
VIX -Chicago Board Options Exchange Market Volatility Index
See Notes to Financial Statements. |
| 62 | www.arbitragefunds.com | 1-800-295-4485 |
The Arbitrage Credit Opportunities Fund |
| May 31, 2015 |
The following table summarizes the Arbitrage Credit Opportunities Fund’s investments and derivative financial instruments categorized in the disclosure hierarchy as of May 31, 2015:
Investments in Securities at Value* | | | | | | | | | | | | |
| | | Level 1 | | | Level 2 | | | Level 3 | | | Total | |
| Assets | | | | | | | | | | | | |
Common Stocks** | | $ | 2,530,302 | | | $ | – | | | $ | – | | | $ | 2,530,302 | |
| Exchange‐Traded Notes | | | 42,883 | | | | – | | | | – | | | | 42,883 | |
| Preferred Stocks | | | 432,276 | | | | – | | | | – | | | | 432,276 | |
| Bank Loans | | | – | | | | 2,015,859 | | | | – | | | | 2,015,859 | |
| Corporate Bonds | | | – | | | | 53,303,273 | | | | – | | | | 53,303,273 | |
| Convertible Corporate Bonds | | | – | | | | 1,987,146 | | | | – | | | | 1,987,146 | |
| Purchased Options | | | 16,625 | | | | – | | | | – | | | | 16,625 | |
| Short‐Term Investments | | | 12,906,753 | | | | – | | | | – | | | | 12,906,753 | |
| TOTAL | | $ | 15,928,839 | | | $ | 57,306,278 | | | $ | – | | | $ | 73,235,117 | |
| | | | | | | | | | | | | | | | | |
Other Financial Instruments*** | | | | | | | | | | | | | | | | |
| Liabilities | | | | | | | | | | | | | | | | |
Common Stocks** | | $ | (562,211 | ) | | $ | – | | | $ | – | | | $ | (562,211 | ) |
| Exchange‐Traded Funds | | | (74,740 | ) | | | – | | | | – | | | | (74,740 | ) |
| Corporate Bonds | | | – | | | | (3,606,225 | ) | | | – | | | | (3,606,225 | ) |
| Convertible Corporate Bonds | | | – | | | | (5,898,156 | ) | | | – | | | | (5,898,156 | ) |
| Written Options | | | (5,875 | ) | | | – | | | | – | | | | (5,875 | ) |
| Credit Default Swap Contracts | | | – | | | | (1,801 | ) | | | – | | | | (1,801 | ) |
| Forward Foreign Currency | | | | | | | | | | | | | | | | |
| Exchange Contracts | | | – | | | | (5,074 | ) | | | – | | | | (5,074 | ) |
| TOTAL | | $ | (642,826 | ) | | $ | (9,511,256 | ) | | $ | – | | | $ | (10,154,082 | ) |
| * | Refer to footnote 2 where leveling hierarchy is defined. |
| ** | Refer to Portfolio of Investments for sector information. |
| *** | Other financial instruments are instruments such as securities sold short, written options, credit default swap contracts, and forward foreign currency exchange contracts. |
See Notes to Financial Statements. |
| Annual Report | May 31, 2015 | 63 |
The Arbitrage Credit Opportunities Fund |
| May 31, 2015 |
The following is a reconciliation of the fair valuations using significant unobservable inputs (Level 3) for the Fund’s assets and liabilities during the year ended May 31, 2015:
| | | | | | | | | | | | | | | | | | | | | | | | | | | | | | | |
| | | | | | | | | | | | | | | | | | | | | | | | | | | | | | Net change in | |
| | | | | | | | | | | | | | | | | | | | | | | | | | | | | | unrealized | |
| | | | | | | | | | | | | | | | | | | | | | | | | | | | | | depreciation | |
| | | | | | | | | | | | | | | | | | | | | | | | | | | | | | included in the | |
| | | | | | | | | | | | | | | | | | | | | | | | | | | | | | Statements of | |
| | | | | | | | | | | | | | | | | | | | | | | | | | | | | | Operations | |
| | | | | | | | | | | | | | | | | | | | | | | | | | | | | | attributable to | |
| | | | | | | | | | | | | | | | | | | | | | | | | | | | | | Level 3 | |
| | | | | | | | | | | | Change in | | | | | | | | Transfer | | Transfer | | | | | | investments
held at | |
| Investments | Balance as of | | | Return of | | Realized | | | Unrealized | | | | | | Sales | | | into | | out of | | Balance as of | | | May 31, | |
| in Securities | May 31, 2014 | | | Capital | | Gain/(Loss) | | | Appreciation | | | Purchases | | | Proceeds | | | Level 3 | | Level 3 | | May 31, 2015 | | | 2015 | |
| Corporate | | | | | | | | | | | | | | | | | | | | | | | | | | | | | | |
| Bonds | | $ | 5,994 | | | $ | (7,706 | ) | | $ | – | | | $ | 1,712 | | | $ | – | | | $ | – | | | $ | – | | | $ | – | | | $ | – | | | $ | – | |
| Total | | $ | 5,994 | | | $ | (7,706 | ) | | $ | – | | | $ | 1,712 | | | $ | – | | | $ | – | | | $ | – | | | $ | – | | | $ | – | | | $ | – | |
| | | | | | | | | | | | | | | | | | | | | | | | | | | | | | | | | | | | | | | | | |
See Notes to Financial Statements. |
| 64 | www.arbitragefunds.com | 1-800-295-4485 |
The Arbitrage Tactical Equity Fund | Manager Commentary |
| May 31, 2015 (Unaudited) |
The Arbitrage Tactical Equity Fund | Tickers: ATQIX, ATQFX, ATQCX, ATQAX
The Fund’s Goal and Main Investments The Fund seeks to provide capital appreciation by capitalizing on security mispricings or market inefficiencies, with a focus on delivering a return stream with lower volatility than and low correlation to the broader equity markets. |
Investment Strategy
The Fund seeks to profit from investing in securities of companies whose stock price trades significantly higher or lower from where we believe it should trade. We anticipate such differences may occur when news and events create misperception of a company’s correct stock price. Examples of such news and events may include changes in industry or sector fundamentals, announcements or potential announcements of restructurings (bankruptcies, spinoffs, and asset sales), mergers and acquisitions, earnings results and outlook, regulatory changes, and litigation. Our investment approach is to identify these differences and to tactically purchase or sell short such securities in order to achieve the Fund’s objective. The Fund may engage in active and frequent trading of portfolio securities to achieve its investment objective. In certain circumstances, the team may seek to proactively engage with company management to address opportunities that may further unlock value or discuss concerns.
Commentary
The Arbitrage Tactical Equity Fund, the newest fund in the Arbitrage Funds family, launched on December 31, 2014. In this fund, our equity special situations team takes an expanded approach to their investment universe. We are excited to bring this strategy to market on a stand‐alone basis, and look forward to sharing more in the coming months.
Fiscal Year Highlights
The Arbitrage Tactical Equity Fund (ATQIX) returned 1.20% from inception through the end of the fiscal year. The results were predominantly derived from companies residing in the Americas. In terms of sectors, health care and industrials were the largest contributors to returns, while consumer staples and consumer discretionary were the largest detractors.
One of the Fund’s top contributors during the fiscal year was our investment in Mylan. We were familiar with Mylan after having invested in the company last year in other portfolios on our view that the firm would either successfully lower taxes through an inversion via its acquisition of Abbot Laboratories’ generic pharmaceuticals business, or fail to invert and become a take‐out target itself. After Mylan succeeded in acquiring Abbot, we continued to monitor the company in anticipation of another catalyst occurring. That new catalyst occurred in April when Mylan initiated an unsolicited bid for Perrigo Company, an Ireland‐based over‐the‐counter pharmaceutical maker. The deal would be accretive for Mylan, yet to date, Perrigo has rebuffed Mylan’s offer. In turn, Mylan has received its own unsolicited acquisition offer, from Teva Pharmaceuticals of Israel. We see potential upside for Mylan in either situation and have initiated a long position in the stock as a result.
One of the Fund’s largest detractors for the period was our investment in Expedia. We were short Expedia on the thesis that, first, the benefits of their pending acquisition of Orbitz were being priced in too quickly second, that margins in the hotel space would erode given the frequency of price cuts in the industry and third, that potential anti‐trust issues may prevent the Orbitz/Expedia deal from closing. However, in May Expedia announced the sale of its majority stake in eLong (a China‐based online travel agency) which led to a spike in its share price. Additionally, Expedia was able to increase its volume in hotel rooms enough to counter the shrinking margins in the space. We are still short Expedia on the belief that they will not be able to continue to offer enough rooms to offset their shrinking margins, and we maintain our skepticism around what we see as continued irrational exuberance regarding the pending Orbitz transaction.
|
| Annual Report | May 31, 2015 | 65 |
The Arbitrage Tactical Equity Fund | Manager Commentary (continued) |
| May 31, 2015 (Unaudited) |
Outlook
Looking ahead, we see many favorable opportunities to own equity assets, but we believe one must do so prudently. As such, our team is on the lookout for short positions associated with catalyst‐driven ideas we believe are overvalued, and we expect this universe of opportunities will stem from value‐creating events that have simply priced in too much of benefits too soon. These situations, along with abundant catalysts to choose from where we may position the Fund using a more traditional view, should provide plentiful opportunities for our team in the year ahead. Sticking close to our risk averse culture, we remain cognizant of the risks present in the broader market, and will continue to implement hedges as part of our process to remove as much market exposure as possible in our attempt to deliver on the Fund’s investment objective.
Sincerely,
The Investment Team at Water Island Capital
|
| 66 | www.arbitragefunds.com | 1-800-295-4485 |
The Arbitrage Tactical Equity Fund | Portfolio Information |
| May 31, 2015 (Unaudited) |
Performance (annualized returns as of May 31, 2015)
| | | Since Inception* |
| Arbitrage Tactical Equity Fund, Class R | | | 1.20 | % |
| Arbitrage Tactical Equity Fund, Class I | | | 1.20 | % |
| Arbitrage Tactical Equity Fund, Class C** | | | 0.20 | % |
| Arbitrage Tactical Equity Fund, Class A*** | | ‐2.13 | % |
| HFRX Event Driven: Special Situations Index | | | 2.39 | % |
| HFRI Equity Hedge (Total) Index | | | 5.01 | % |
S&P 500® Index | | | 3.23 | % |
Current performance may be higher or lower than performance quoted above. Any performance data quoted represents past performance and the investment return and principal value of an investment in the Fund will fluctuate so that an investor’s shares, when redeemed, may be worth more or less than their original cost. Past performance is no guarantee of future results. Returns do not reflect a 2% redemption fee for shares that are redeemed from the fund within 60 days of purchase, which, if reflected, would reduce the performance quoted. Returns shown above include the reinvestment of all dividends and capital gains. Contractual fee waivers are currently in effect. Without such fee waivers, performance numbers would be reduced. You can obtain performance data current to the most recent month end by calling 1-800-295-4485 or going to www.arbitragefunds.com.
| * | Class R, Class I Class C and Class A inception: 12/31/14. |
| ** | Class C shares are subject to a 1.00% contingent deferred sales charge on all purchases redeemed in 12 months of purchase. |
| *** | Class A shares are subject to a maximum front-end sales load of 3.25% on purchases up to $500,000. The shares are also subject to a deferred sales charge of up to 1.00% on purchases of $500,000 or more purchased without a front-end sales load and redeemed within 18 months of purchase. |
The Total Annual Fund Operating Expenses for Class R, Class I, Class C and Class A are 6.07%, 5.82%, 6.82% and 6.07%, respectively. The Advisor has agreed to waive fees in excess of 1.69%, 1.44%, 2.44% and 1.69% for Class R, Class I, Class C and Class A, respectively, until at least December 31, 2017.
The HFRX Event Driven: Special Situations Index is an index that employs an investment process primarily focused on opportunities in equity and equity related instruments of companies which are currently engaged in a corporate transaction, security issuance/repurchase, asset sales, division spin-off or other catalyst oriented situation. These involve both announced transactions as well as situations which pre-, post-date or situations in which no formal announcement is expected to occur. Strategies employ an investment process focusing broadly on a wide spectrum of corporate life cycle investing, including but not limited to distressed, bankruptcy and post-bankruptcy security issuance, announced acquisitions and corporate division spin-offs, asset sales and other security issuance impacting an individual capital structure focusing primarily on situations identified via fundamental research which are likely to result in a corporate transactions or other realization of shareholder value through the occurrence of some identifiable catalyst. Strategies effectively employ primarily equity (greater than 60%) but also corporate debt exposure, and in general focus more broadly on post-bankruptcy equity exposure and exit of restructuring proceedings.
The HFRI Equity Hedge (Total) Index is an index where Investment Managers maintain positions both long and short in primarily equity and equity derivative securities. A wide variety of investment processes can be employed to arrive at an investment decision, including both quantitative and fundamental techniques; strategies can be broadly diversified or narrowly focused on specific sectors and can range broadly in terms of levels of net exposure, leverage employed, holding period, concentrations of market capitalizations and valuation ranges of typical portfolios. EH managers would typically maintain at least 50% exposure to, and may in some cases be entirely invested in, equities, both long and short.
The S&P 500® Index is an unmanaged index consisting of 500 stocks.
An investor may not invest directly in an index.
|
| Annual Report | May 31, 2015 | 67 |
The Arbitrage Tactical Equity Fund | Portfolio Information (continued) |
| May 31, 2015 (Unaudited) |
Growth of $10,000 Investment
The chart represents historical performance of a hypothetical investment of $10,000 in the Class R shares of the Fund since inception. Past performance does not guarantee future results. This chart does not reflect the deduction of taxes that a shareholder would pay on Fund distributions or the redemption of Fund shares.
Sector Weighting
The following chart shows the sector weightings of the Arbitrage Credit Opportunities Fund’s investments in common stock, corporate bonds, convertible corporate bonds and exchange‐traded funds as of the report date.
|
| 68 | www.arbitragefunds.com | 1-800-295-4485 |
The Arbitrage Tactical Equity Fund | Portfolio of Investments |
| May 31, 2015 (Unaudited) |
| | | Shares | | | Value | |
| COMMON STOCKS ‐ 64.22% | | | | | | |
| Advertising ‐ 2.68% | | | | | | |
| Journal Media Group, Inc. | | | 4,742 | | | $ | 37,983 | |
| | | | | | | | | |
| Aerospace & Defense ‐ 2.65% | | | | | | | | |
B/E Aerospace, Inc.(a)(b) | | | 397 | | | | 22,764 | |
KLX, Inc.(a)(b)(c) | | | 336 | | | | 14,730 | |
| | | | | | | | 37,494 | |
| | | | | | | | | |
| Auto Parts & Equipment ‐ 0.70% | | | | | | | | |
Visteon Corp.(c) | | | 91 | | | | 9,966 | |
| | | | | | | | | |
| Beverages ‐ 1.38% | | | | | | | | |
Molson Coors Brewing Co., Class B(b) | | | 266 | | | | 19,519 | |
| | | | | | | | | |
| Chemicals ‐ 1.86% | | | | | | | | |
Axalta Coating Systems Ltd.(b)(c) | | | 768 | | | | 26,304 | |
| | | | | | | | | |
| Coal ‐ 1.39% | | | | | | | | |
CONSOL Energy, Inc.(a) | | | 707 | | | | 19,683 | |
| | | | | | | | | |
| Commercial Services ‐ 0.62% | | | | | | | | |
Quanta Services, Inc.(c) | | | 300 | | | | 8,796 | |
| | | | | | | | | |
| Computers ‐ 3.79% | | | | | | | | |
EMC Corp.(a)(b) | | | 1,297 | | | | 34,163 | |
Teradata Corp.(c) | | | 500 | | | | 19,470 | |
| | | | | | | | 53,633 | |
| | | | | | | | | |
| Computers & Computer Services ‐2.39% | | | | | | | | |
Hewlett‐Packard Co.(a)(b) | | | 1,014 | | | | 33,868 | |
| | | | | | | | | |
| Cosmetics & Personal Care ‐0.39% | | | | | | | | |
| Coty, Inc., Class A | | | 224 | | | | 5,584 | |
| | | | | | | | | |
| Electric ‐ 2.00% | | | | | | | | |
Dynegy, Inc.(b)(c) | | | 877 | | | | 28,362 | |
| | | | | | | | | |
| Electronics ‐ 0.74% | | | | | | | | |
| Honeywell International, Inc. | | | 100 | | | | 10,420 | |
| | | | | | | | | |
| Internet ‐ 2.63% | | | | | | | | |
Yahoo!, Inc.(a)(c) | | | 868 | | | | 37,268 | |
| | | | | | | | | |
See Notes to Financial Statements. |
| Annual Report | May 31, 2015 | 69 |
The Arbitrage Tactical Equity Fund | Portfolio of Investments (continued) |
| May 31, 2015 |
| | | Shares | | | Value | |
| COMMON STOCKS ‐ 64.22% (Continued) | | | | | | |
| Lodging ‐ 2.91% | | | | | | |
MGM Resorts International(b)(c) | | | 1,035 | | | $ | 20,752 | |
Starwood Hotels & Resorts Worldwide, Inc.(b) | | | 247 | | | | 20,441 | |
| | | | | | | | 41,193 | |
| | | | | | | | | |
| Media ‐ 6.28% | | | | | | | | |
Charter Communications, Inc., Class A(b)(c) | | | 136 | | | | 24,347 | |
DISH Network Corp., Class A(a)(b)(c) | | | 323 | | | | 22,865 | |
Media General, Inc.(a)(b)(c) | | | 1,329 | | | | 22,008 | |
Viacom, Inc., Class B(a)(b) | | | 296 | | | | 19,797 | |
| | | | | | | | 89,017 | |
| | | | | | | | | |
| Miscellaneous Manufacturing ‐2.13% | | | | | | | | |
SPX Corp.(b) | | | 406 | | | | 30,170 | |
| | | | | | | | | |
| Oil & Gas ‐ 0.71% | | | | | | | | |
Cobalt International Energy, Inc.(a)(b)(c) | | | 991 | | | | 10,069 | |
| | | | | | | | | |
| Oil & Gas Services ‐ 3.30% | | | | | | | | |
Exterran Holdings, Inc.(a)(b) | | | 863 | | | | 28,531 | |
Weatherford International Plc(a)(b)(c) | | | 1,314 | | | | 18,159 | |
| | | | | | | | 46,690 | |
| | | | | | | | | |
| Packaging & Containers ‐ 4.11% | | | | | | | | |
Ball Corp.(b) | | | 388 | | | | 27,544 | |
Berry Plastics Group, Inc.(a)(b)(c) | | | 916 | | | | 30,659 | |
| | | | | | | | 58,203 | |
| | | | | | | | | |
| Pharmaceuticals ‐ 6.72% | | | | | | | | |
Actavis Plc(b)(c) | | | 112 | | | | 34,363 | |
Mylan N.V.(b)(c) | | | 101 | | | | 7,336 | |
Perrigo Co., Plc(b) | | | 142 | | | | 27,022 | |
| Teva Pharmaceutical Industries Ltd., | | | | | | | | |
Sponsored ADR(a)(b) | | | 440 | | | | 26,444 | |
| | | | | | | | 95,165 | |
| | | | | | | | | |
| Real Estate ‐ 2.25% | | | | | | | | |
Forest City Enterprises, Inc., Class A(c) | | | 1,381 | | | | 31,846 | |
| | | | | | | | | |
| Real Estate Investment Trusts ‐1.71% | | | | | | | | |
| InfraREIT, Inc. | | | 130 | | | | 3,939 | |
| Macerich Co. | | | 247 | | | | 20,281 | |
| | | | | | | | 24,220 | |
| | | | | | | | | |
| See Notes to Financial Statements. |
| 70 | www.arbitragefunds.com | 1-800-295-4485 |
The Arbitrage Tactical Equity Fund | Portfolio of Investments (continued) |
| May 31, 2015 |
| | | | | | | | | Shares | | | Value | |
| COMMON STOCKS ‐ 64.22% (Continued) | | | | | | | | | | |
| Retail ‐ 2.53% | | | | | | | | | | | | |
Bob Evans Farms, Inc.(a)(b) | | | | | | | | | 345 | | | $ | 15,846 | |
Staples, Inc.(a)(b) | | | | | | | | | 1,214 | | | | 19,988 | |
| | | | | | | | | | | | | | 35,834 | |
| | | | | | | | | | | | | | | |
| Software ‐ 1.31% | | | | | | | | | | | | | | |
Salesforce.com, Inc.(b)(c) | | | | | | | | | 256 | | | | 18,624 | |
| | | | | | | | | | | | | | | |
| Telecommunications ‐ 5.51% | | | | | | | | | | | | | | |
| Frontier Communications Corp. | | | | | | | | | 4,733 | | | | 24,375 | |
Harris Corp.(a)(b) | | | | | | | | | 362 | | | | 28,678 | |
HC2 Holdings, Inc.(c) | | | | | | | | | 967 | | | | 10,801 | |
T‐Mobile US, Inc.(a)(b)(c) | | | | | | | | | 364 | | | | 14,152 | |
| | | | | | | | | | | | | | 78,006 | |
| | | | | | | | | | | | | | | |
| Transportation ‐ 1.53% | | | | | | | | | | | | | | |
XPO Logistics, Inc.(b)(c) | | | | | | | | | 441 | | | | 21,680 | |
| | | | | | | | | | | | | | | |
| TOTAL COMMON STOCKS | | | | | | | | | | | | | | |
| (Cost $898,989) | | | | | | | | | | | | | 909,597 | |
| | | | | | | | | | | | | | | |
| | | Expiration | | Exercise | | | | | | | | | |
| | | Date | | | Price | | | Contracts | | | Value | |
PURCHASED OPTIONS(c)‐ 0.58% | | | | | | | | | | | | | | |
| Call Options Purchased ‐ 0.32% | | | | | | | | | | | | | | |
| Altera Corp.: | | | | | | | | | | | | | | |
| | | | 06/2015 | | | $ | 45.00 | | | | 2 | | | $ | 1,070 | |
| | | | 06/2015 | | | | 50.00 | | | | 4 | | | | 820 | |
| Applied Materials, Inc. | | | 01/2016 | | | | 22.00 | | | | 2 | | | | 181 | |
| CommScope Holding Co., Inc. | | | 06/2015 | | | | 35.00 | | | | 1 | | | | 17 | |
| Expedia, Inc.: | | | | | | | | | | | | | | | | |
| | | | 06/2015 | | | | 117.00 | | | | 1 | | | | 35 | |
| | | | 06/2015 | | | | 120.00 | | | | 4 | | | | 70 | |
| Kraft Foods Group, Inc. | | | 06/2015 | | | | 90.00 | | | | 1 | | | | 5 | |
| Mylan N.V. | | | 07/2015 | | | | 72.50 | | | | 5 | | | | 2,050 | |
| Peabody Energy Corp. | | | 06/2015 | | | | 4.50 | | | | 2 | | | | 5 | |
| Staples, Inc. | | | 01/2016 | | | | 17.00 | | | | 2 | | | | 265 | |
| | | | | | | | | | | | | | | | | |
| TOTAL CALL OPTIONS PURCHASED | | | | | | | | | | | | | | | | |
| (Cost $4,354) | | | | | | | | | | | | | | | 4,518 | |
| | | | | | | | | | | | | | | | | |
| Put Options Purchased ‐ 0.26% | | | | | | | | | | | | | | | | |
| Actavis Plc | | | 06/2015 | | | | 275.00 | | | | 1 | | | | 25 | |
See Notes to Financial Statements. |
| Annual Report | May 31, 2015 | 71 |
The Arbitrage Tactical Equity Fund | Portfolio of Investments (continued) |
| May 31, 2015 |
| | | | | | | | | | | | | |
| | | Expiration | | | Exercise | | | | | | | |
| | | Date | | | Price | | | Contracts | | | Value | |
PURCHASED OPTIONS(c)‐ 0.58% (Continued) | | | | | | | | | | |
| Put Options Purchased ‐ 0.26% (Continued) | | | | | | | | | | |
| | | | | | | | | | | | |
| Associated Estates Realty Corp. | | | 06/2015 | | | $ | 22.50 | | | | 2 | | | $ | 5 | |
| Axalta Coating Systems Ltd.: | | | | | | | | | | | | | | | | |
| | | | 06/2015 | | | | 25.00 | | | | 1 | | | | 10 | |
| | | | 07/2015 | | | | 30.00 | | | | 4 | | | | 200 | |
| B/E Aerospace, Inc. | | | 06/2015 | | | | 55.00 | | | | 2 | | | | 130 | |
| Ball Corp. | | | 06/2015 | | | | 65.00 | | | | 2 | | | | 25 | |
| Berry Plastics Group, Inc. | | | 06/2015 | | | | 30.00 | | | | 6 | | | | 120 | |
| Bob Evans Farms, Inc. | | | 06/2015 | | | | 40.00 | | | | 3 | | | | 83 | |
| Charter Communications, Inc., Class A | | | 06/2015 | | | | 175.00 | | | | 1 | | | | 215 | |
| Cobalt International Energy, Inc. | | | 06/2015 | | | | 9.00 | | | | 7 | | | | 87 | |
| DISH Network Corp., Class A | | | 06/2015 | | | | 60.00 | | | | 4 | | | | 20 | |
| Dynegy, Inc.: | | | | | | | | | | | | | | | | |
| | | | 06/2015 | | | | 30.00 | | | | 4 | | | | 140 | |
| | | | 07/2015 | | | | 30.00 | | | | 2 | | | | 155 | |
| EMC Corp.: | | | | | | | | | | | | | | | | |
| | | | 06/2015 | | | | 24.00 | | | | 8 | | | | 24 | |
| | | | 06/2015 | | | | 25.00 | | | | 4 | | | | 28 | |
| Exterran Holdings, Inc. | | | 06/2015 | | | | 30.00 | | | | 3 | | | | 128 | |
| Harris Corp. | | | 06/2015 | | | | 70.00 | | | | 3 | | | | 45 | |
| Hewlett‐Packard Co.: | | | | | | | | | | | | | | | | |
| | | | 06/2015 | | | | 30.00 | | | | 5 | | | | 25 | |
| | | | 07/2015 | | | | 32.00 | | | | 1 | | | | 53 | |
| Juniper Networks, Inc. | | | 06/2015 | | | | 23.00 | | | | 1 | | | | 6 | |
| KLX, Inc. | | | 06/2015 | | | | 40.00 | | | | 3 | | | | 75 | |
| Media General, Inc.: | | | | | | | | | | | | | | | | |
| | | | 06/2015 | | | | 12.50 | | | | 5 | | | | 88 | |
| | | | 06/2015 | | | | 15.00 | | | | 2 | | | | 25 | |
| MGM Resorts International | | | 06/2015 | | | | 18.00 | | | | 6 | | | | 60 | |
| Molson Coors Brewing Co., | | | | | | | | | | | | | | | | |
| Class B | | | 06/2015 | | | | 7.50 | | | | 2 | | | | 25 | |
| Mylan N.V. | | | 07/2015 | | | | 62.50 | | | | 2 | | | | 156 | |
| Nokia OYJ | | | 06/2015 | | | | 6.00 | | | | 12 | | | | 12 | |
| Perrigo Co., Plc | | | 06/2015 | | | | 170.00 | | | | 2 | | | | 55 | |
| Salesforce.com, Inc. | | | 07/2015 | | | | 67.50 | | | | 4 | | | | 636 | |
| Seadrill Partners LLC | | | 06/2015 | | | | 10.00 | | | | 1 | | | | 5 | |
| SPX Corp. | | | 06/2015 | | | | 70.00 | | | | 5 | | | | 275 | |
| Starwood Hotels & Resorts Worldwide, Inc. | | | 06/2015 | | | | 77.50 | | | | 1 | | | | 28 | |
| See Notes to Financial Statements. |
| 72 | www.arbitragefunds.com | 1-800-295-4485 |
The Arbitrage Tactical Equity FundPortfolio of Investments (continued) |
| May 31, 2015 |
| | | Expiration | | | Exercise | | | | | | | |
| | | Date | | | Price | | | Contracts | | | Value | |
PURCHASED OPTIONS(c)‐ 0.58% (Continued) | | | | | | | | | | |
| Put Options Purchased ‐ 0.26% (Continued) | | | | | | | | | | |
| Teva Pharmaceutical | | | | | | | | | | | | |
| Industries Ltd., | | | | | | | | | | | | |
| Sponsored ADR | | | 06/2015 | | | $ | 55.00 | | | | 5 | | | $ | 85 | |
| T‐Mobile US, Inc.: | | | | | | | | | | | | | | | | |
| | | | 06/2015 | | | | 30.00 | | | | 4 | | | | 50 | |
| | | | 07/2015 | | | | 35.00 | | | | 1 | | | | 41 | |
| Viacom, Inc., Class B: | | | | | | | | | | | | | | | | |
| | | | 06/2015 | | | | 62.50 | | | | 2 | | | | 50 | |
| | | | 06/2015 | | | | 65.00 | | | | 2 | | | | 150 | |
| Weatherford International Plc: | | | | | | | | | | | | | | | | |
| | | | 06/2015 | | | | 12.00 | | | | 4 | | | | 28 | |
| | | | 06/2015 | | | | 13.00 | | | | 9 | | | | 176 | |
| XPO Logistics, Inc.: | | | | | | | | | | | | | | | | |
| | | | 06/2015 | | | | 44.00 | | | | 2 | | | | 80 | |
| | | | 06/2015 | | | | 45.00 | | | | 2 | | | | 95 | |
| | | | | | | | | | | | | | | | | |
| TOTAL PUT OPTIONS PURCHASED | | | | | | | | | | | | | | | | |
| (Cost $7,623) | | | | | | | | | | | | | | | 3,719 | |
| | | | | | | | | | | | | | | | | |
| TOTAL PURCHASED OPTIONS | | | | | | | | | | | | | | | | |
| (Cost $11,977) | | | | | | | | | | | | | | | 8,237 | |
| | | | | | | | | | | | | | | | | |
| | | | | | | Yield | | | Shares | | | Value | |
| SHORT‐TERM INVESTMENTS ‐ 31.88% | | | | | | | | | | | | | |
| Money Market Fund | | | | | | | | | | | | | | | | |
| State Street Institutional Liquid Reserves Fund | | | | | | | 0.100 | %(d) | | | 451,555 | | | $ | 451,555 | |
| TOTAL SHORT‐TERM INVESTMENTS | | | | | | | | | | | | | | | | |
| (Cost $451,555) | | | | | | | | | | | | | | | 451,555 | |
| | | | | | | | | | | | | | | | | |
| Total Investments ‐ 96.68% | | | | | | | | | | | | | | | | |
| (Cost $1,362,521) | | | | | | | | | | | | | | | 1,369,389 | |
| | | | | | | | | | | | | | | | | |
| | | | | | | | | | | | | | | | 47,054 | (e) |
| Other Assets in Excess of Liabilities ‐ 3.32% | | | | | | | | | | | | | | | |
| | | | | | | | | | | | | | | | | |
| NET ASSETS ‐ 100.00% | | | | | | | | | | | | | | $ | 1,416,443 | |
| | | | | | | | | | | | | | | | | |
See Notes to Financial Statements. |
| Annual Report | May 31, 2015 | 73 |
The Arbitrage Tactical Equity Fund | Portfolio of Investments (continued) |
| May 31, 2015 |
| (a) | Security, or a portion of security, is being held as collateral for short sales or written option contracts. At period end, the aggregate market value of those securities was $185,884, representing 13.12% of net assets. |
| (b) | Underlying security for a written/purchased call/put option. (c) Non-income-producing security. |
| (c) | Rate shown is the 7-day effective yield as of May 31, 2015. |
| (d) | Includes cash which is being held as collateral for short sales and written option contracts. |
| SCHEDULE OF SECURITIES SOLD SHORT | | Shares | | | Value | |
| COMMON STOCKS ‐ (16.01%) | | | | | | |
| Aerospace & Defense ‐ (0.74%) | | | | | | |
| Boeing Co. | | | (14 | ) | | $ | (1,967 | ) |
| Rockwell Collins, Inc. | | | (22 | ) | | | (2,094 | ) |
| Spirit AeroSystems Holdings, Inc., Class A | | | (42 | ) | | | (2,293 | ) |
| TransDigm Group, Inc. | | | (10 | ) | | | (2,260 | ) |
| Triumph Group, Inc. | | | (27 | ) | | | (1,801 | ) |
| | | | | | | | (10,415 | ) |
| | | | | | | | | |
| Auto Parts & Equipment ‐ (0.26%) | | | | | | | | |
| Autoliv, Inc. | | | (11 | ) | | | (1,388 | ) |
| BorgWarner, Inc. | | | (21 | ) | | | (1,263 | ) |
| Delphi Automotive Plc | | | (12 | ) | | | (1,044 | ) |
| | | | | | | | (3,695 | ) |
| | | | | | | | | |
| Beverages ‐ (0.10%) | | | | | | | | |
| Anheuser‐Busch InBev N.V., Sponsored ADR | | | (12 | ) | | | (1,447 | ) |
| | | | | | | | | |
| Coal ‐ (0.13%) | | | | | | | | |
| Peabody Energy Corp. | | | (537 | ) | | | (1,815 | ) |
| | | | | | | | | |
| Distributors & Wholesalers ‐(0.17%) | | | | | | | | |
| WESCO International, Inc. | | | (34 | ) | | | (2,443 | ) |
| | | | | | | | | |
| Food ‐ (0.58%) | | | | | | | | |
| ConAgra Foods, Inc. | | | (18 | ) | | | (695 | ) |
| Hormel Foods Corp. | | | (25 | ) | | | (1,431 | ) |
| Kraft Foods Group, Inc. | | | (72 | ) | | | (6,080 | ) |
| | | | | | | | (8,206 | ) |
| | | | | | | | | |
| Home Furnishings ‐ (0.09%) | | | | | | | | |
| Harman International Industries, Inc. | | | (11 | ) | | | (1,326 | ) |
| | | | | | | | | |
| Internet ‐ (5.06%) | | | | | | | | |
| Alibaba Group Holding Ltd., Sponsored ADR | | | (351 | ) | | | (31,351 | ) |
| See Notes to Financial Statements. |
| 74 | www.arbitragefunds.com | 1-800-295-4485 |
| The Arbitrage Tactical Equity Fund | Portfolio of Investments (continued) |
| | May 31, 2015 |
| SCHEDULE OF SECURITIES SOLD SHORT | | Shares | | | Value | |
| COMMON STOCKS ‐ (16.01%)(Continued) | | | | | | |
| Internet ‐ (5.06%) (Continued) | | | | | | |
| Expedia, Inc. | | | (376 | ) | | $ | (40,330 | ) |
| | | | | | | | (71,681 | ) |
| | | | | | | | | |
| Lodging ‐ (0.34%) | | | | | | | | |
| Melco Crown Entertainment Ltd., ADR | | | (77 | ) | | | (1,489 | ) |
| Wynn Resorts Ltd. | | | (33 | ) | | | (3,323 | ) |
| | | | | | | | (4,812 | ) |
| | | | | | | | | |
| Media ‐ (0.41%) | | | | | | | | |
| Gannett Co., Inc | | | (59 | ) | | | (2,112 | ) |
| Nexstar Broadcasting Group, Inc., Class A | | | (43 | ) | | | (2,446 | ) |
| Sinclair Broadcast Group, Inc., Class A | | | (43 | ) | | | (1,292 | ) |
| | | | | | | | (5,850 | ) |
| | | | | | | | | |
| Miscellaneous Manufacturing ‐ (0.42%) | | | | | | | | |
| AptarGroup, Inc. | | | (62 | ) | | | (3,954 | ) |
| Hexcel Corp. | | | (42 | ) | | | (2,068 | ) |
| | | | | | | | (6,022 | ) |
| | | | | | | | | |
| Oil & Gas ‐ (0.96%) | | | | | | | | |
| Antero Resources Corp. | | | (104 | ) | | | (4,161 | ) |
| Cabot Oil & Gas Corp. | | | (146 | ) | | | (4,958 | ) |
| EQT Corp. | | | (53 | ) | | | (4,509 | ) |
| | | | | | | | (13,628 | ) |
| | | | | | | | | |
| Oil & Gas Services ‐ (1.92%) | | | | | | | | |
| Enerflex Ltd. | | | (398 | ) | | | (4,522 | ) |
| Frank’s International N.V. | | | (95 | ) | | | (1,883 | ) |
| RPC, Inc. | | | (746 | ) | | | (10,787 | ) |
| Schlumberger Ltd. | | | (50 | ) | | | (4,539 | ) |
| Superior Energy Services, Inc. | | | (235 | ) | | | (5,426 | ) |
| | | | | | | | (27,157 | ) |
| | | | | | | | | |
| Packaging & Containers ‐ (1.87%) | | | | | | | | |
| Ball Corp. | | | (27 | ) | | | (1,917 | ) |
| Bemis Co., Inc. | | | (15 | ) | | | (689 | ) |
| Crown Holdings, Inc. | | | (354 | ) | | | (19,572 | ) |
| Silgan Holdings, Inc. | | | (79 | ) | | | (4,293 | ) |
| | | | | | | | (26,471 | ) |
| See Notes to Financial Statements. | |
| Annual Report | May 31, 2015 | 75 |
| The Arbitrage Tactical Equity Fund | Portfolio of Investments (continued) |
| | May 31, 2015 |
| SCHEDULE OF SECURITIES SOLD SHORT | | Shares | | | Value | |
| COMMON STOCKS ‐ (16.01%)(Continued) | | | | | | |
| Real Estate Investment Trusts ‐ (0.81%) | | | | | | |
| Simon Property Group, Inc. | | | (63 | ) | | $ | (11,428 | ) |
| | | | | | | | | |
| Retail ‐ (0.35%) | | | | | | | | |
| Cracker Barrel Old Country Store, Inc. | | | (15 | ) | | | (2,116 | ) |
| Denny’s Corp. | | | (133 | ) | | | (1,387 | ) |
| Texas Roadhouse, Inc. | | | (40 | ) | | | (1,401 | ) |
| | | | | | | | (4,904 | ) |
| | | | | | | | | |
| Semiconductors ‐ (0.19%) | | | | | | | | |
| Avago Technologies Ltd. | | | (18 | ) | | | (2,665 | ) |
| | | | | | | | | |
| Software ‐ (1.35%) | | | | | | | | |
| VMware, Inc., Class A | | | (219 | ) | | | (19,123 | ) |
| | | | | | | | | |
| Storage & Warehousing ‐ (0.08%) | | | | | | | | |
| Wesco Aircraft Holdings, Inc. | | | (73 | ) | | | (1,077 | ) |
| | | | | | | | | |
| Telecommunications ‐ (0.18%) | | | | | | | | |
| CommScope Holding Co., Inc. | | | (82 | ) | | | (2,556 | ) |
| | | | | | | | | |
| TOTAL COMMON STOCKS | | | | | | | | |
| (Proceeds $223,517) | | | | | | | (226,721 | ) |
| | | | | | | | | |
| LIMITED PARTNERSHIPS ‐ (0.91%) | | | | | | | | |
| Coal ‐ (0.16%) | | | | | | | | |
| Alliance Resource Partners LP | | | (78 | ) | | | (2,339 | ) |
| | | | | | | | | |
| Oil & Gas Services ‐ (0.75%) | | | | | | | | |
| Exterran Partners LP | | | (409 | ) | | | (10,589 | ) |
| | | | | | | | | |
| TOTAL LIMITED PARTNERSHIPS | | | | | | | | |
| (Proceeds $12,785) | | | | | | | (12,928 | ) |
| | | | | | | | | |
| EXCHANGE‐TRADED FUNDS ‐ (5.39%) | | | | | | | | |
| Equity Funds ‐ (5.39%) | | | | | | | | |
| Alerian MLP ETF | | | (188 | ) | | | (3,111 | ) |
| Consumer Staples Select Sector SPDR® Fund | | | (67 | ) | | | (3,269 | ) |
Energy Select Sector SPDR® Fund | | | (3 | ) | | | (235 | ) |
Health Care Select Sector SPDR® Fund | | | (12 | ) | | | (900 | ) |
| Industrial Select Sector SPDR® Fund | | | (10 | ) | | | (558 | ) |
iShares® Nasdaq Biotechnology ETF | | | (18 | ) | | | (6,571 | ) |
iShares® Russell 2000 Growth ETF | | | (66 | ) | | | (10,058 | ) |
| See Notes to Financial Statements. | |
| 76 | www.arbitragefunds.com | 1-800-295-4485 |
| The Arbitrage Tactical Equity Fund | Portfolio of Investments (continued) |
| | May 31, 2015 |
| SCHEDULE OF SECURITIES SOLD SHORT | | Shares | | | Value | |
| EXCHANGE‐TRADED FUNDS ‐ (5.39%)(Continued) | | | | | | |
| Equity Funds ‐ (5.39%) (Continued) | | | | | | |
SPDR® S&P 500® ETF Trust | | | (29 | ) | | $ | (6,123 | ) |
SPDR® S&P® Retail ETF | | | (71 | ) | | | (6,943 | ) |
Utilities Select Sector SPDR® Fund | | | (320 | ) | | | (14,240 | ) |
| Vanguard REIT ETF | | | (307 | ) | | | (24,296 | ) |
| | | | | | | | (76,304 | ) |
| | | | | | | | | |
| TOTAL EXCHANGE‐TRADED FUNDS | | | | | | | | |
| (Proceeds $76,021) | | | | | | | (76,304 | ) |
| | | | | | | | | |
| EXCHANGE‐TRADED NOTES ‐ (0.22%) | | | | | | | | |
| Equity Funds ‐ (0.22%) | | | | | | | | |
| JPMorgan Alerian MLP Index ETN | | | (73 | ) | | | (3,159 | ) |
| | | | | | | | | |
| TOTAL EXCHANGE‐TRADED NOTES | | | | | | | | |
| (Proceeds $3,336) | | | | | | | (3,159 | ) |
| | | | | | | | | |
| TOTAL SECURITIES SOLD SHORT ‐ (22.53%) | | | | | | | | |
| (Proceeds $315,659) | | | | | | $ | (319,112 | ) |
| SCHEDULE OF | | Expiration | | | | | | | | | | |
| WRITTEN OPTIONS | | Date | | | Exercise Price | | | Contracts | | | Value | |
| Written Call Options | | | | | | | | | | | | |
| Applied Materials, Inc. | | | 01/2016 | | | $ | 32.00 | | | | (2 | ) | | $ | (3 | ) |
| Avago Technologies Ltd.: | | | | | | | | | | | | | | | | |
| | | | 06/2015 | | | | 150.00 | | | | (1 | ) | | | (350 | ) |
| | | | 06/2015 | | | | 155.00 | | | | (1 | ) | | | (180 | ) |
| Mylan N.V. | | | 07/2015 | | | | 77.50 | | | | (5 | ) | | | (1,107 | ) |
| Staples, Inc. | | | 01/2016 | | | | 22.00 | | | | (2 | ) | | | (45 | ) |
| T‐Mobile US, Inc. | | | 06/2015 | | | | 40.00 | | | | (1 | ) | | | (61 | ) |
| | | | | | | | | | | | | | | | | |
| TOTAL WRITTEN CALL OPTIONS | | | | | | | | | | | | | | | | |
| (Premiums received $1,606) | | | | | | | | | | | | | | | (1,746 | ) |
| | | | | | | | | | | | | | | | | |
| Written Put Options | | | | | | | | | | | | | | | | |
| Charter Communications, Inc., | | | | | | | | | | | | | | | | |
| Class A | | | 06/2015 | | | | 155.00 | | | | (2 | ) | | | (30 | ) |
| Expedia, Inc.: | | | | | | | | | | | | | | | | |
| | | | 06/2015 | | | | 108.00 | | | | (1 | ) | | | (190 | ) |
| | | | 06/2015 | | | | 109.00 | | | | (1 | ) | | | (257 | ) |
| | | | 06/2015 | | | | 110.00 | | | | (1 | ) | | | (323 | ) |
| Peabody Energy Corp. | | | 06/2015 | | | | 3.50 | | | | (2 | ) | | | (55 | ) |
| See Notes to Financial Statements. | |
| Annual Report | May 31, 2015 | 77 |
| The Arbitrage Tactical Equity Fund | Portfolio of Investments (continued) |
| | May 31, 2015 |
| SCHEDULE OF | | Expiration | | | | | | | | | | |
| WRITTEN OPTIONS | | Date | | | Exercise Price | | | Contracts | | | Value | |
| | | | | | | | | | | | | |
| Written Put Options (Continued) | | | | | | | | | | | | |
| Staples, Inc. | | | 06/2015 | | | $ | 15.00 | | | | (2 | ) | | $ | (5 | ) |
| | | | | | | | | | | | | | | | | |
| TOTAL WRITTEN PUT OPTIONS | | | | | | | | | | | | | | | | |
| (Premiums received $595) | | | | | | | | | | | | | | | (860 | ) |
| | | | | | | | | | | | | | | | | |
| TOTAL WRITTEN OPTIONS | | | | | | | | | | | | | | | | |
| (Premiums received $2,201) | | | | | | | | | | | | | | $ | (2,606 | ) |
OUTSTANDING FORWARD FOREIGN CURRENCY EXCHANGE CONTRACTS
| Contract | | Contracts to | | Purchase/Sale | Expiration | | | | Unrealized | |
| Description | | Deliver/Receive | | Contract | Date | Current Value | | Appreciation | |
| CAD | | | 7,720 | | Purchase | 06/15/2015 | | $ | 6,206 | | | $ | 27 | |
| EUR | | | 1,830 | | Purchase | 06/15/2015 | | | 2,010 | | | | 2 | |
| | | | | | | | | | | | | $ | 29 | |
| | | | | | | | | | | | | | | |
| Contract | | Contracts to | | Purchase/Sale | Expiration | | | | | Unrealized | |
| Description | | Deliver/Receive | | Contract | Date | Current Value | | Depreciation | |
| CAD | | | 2,150 | | Sale | 06/15/2015 | | $ | 1,728 | | | $ | (6 | ) |
| EUR | | | 1,830 | | Sale | 06/15/2015 | | | 2,010 | | | | (42 | ) |
| | | | | | | | | | | | | $ | (48 | ) |
The following is a summary of investments classified by foreign country exposure:
| Country | % of Net Assets(a) | |
| Israel | | | 1.87 | % |
| Bermuda | | | 1.86 | % |
| United States | | | 92.95 | % |
| Other Assets in Excess of Liabilities | | | 3.32 | % |
| | | | 100.00 | % |
(a) These percentages represent long positions only and are not net of short positions.
Abbreviations:
ADR - American Depositary Receipt
CAD - Canadian Dollar
ETF - Exchange-Traded Fund
ETN - Exchange-Traded Note
EUR - Euro
LLC - Limited Liability Company
| See Notes to Financial Statements. | |
| 78 | www.arbitragefunds.com | 1-800-295-4485 |
| The Arbitrage Tactical Equity Fund | Portfolio of Investments (continued) |
| | May 31, 2015 |
LP - Limited Partnership
Ltd. - Limited
MLP - Master Limited Partnership
N.V. - Naamloze Vennootschap is the Dutch term for a public limited liability corporation
OYJ - Osakeyhtio is the Finnish equivalent of a public limited company
Plc - Public Limited Company
REIT - Real Estate Investment Trust
S&P - Standard & Poor’s
SPDR - Standard & Poor’s Depositary Receipt
| See Notes to Financial Statements. | |
| Annual Report | May 31, 2015 | 79 |
| The Arbitrage Tactical Equity Fund | |
| | May 31, 2015 |
The following table summarizes the Arbitrage Tactical Equity Fund’s investments and derivative financial instruments categorized in the disclosure hierarchy as of May 31, 2015:
Investments in Securities at Value*
| | | Level 1 | | | Level 2 | | | Level 3 | | | Total | |
| Assets | | | | | | | | | | | | |
Common Stocks** | | $ | 909,597 | | | $ | – | | | $ | – | | | $ | 909,597 | |
| Purchased Options | | | 8,237 | | | | – | | | | – | | | | 8,237 | |
| Short‐Term Investments | | | 451,555 | | | | – | | | | – | | | | 451,555 | |
| TOTAL | | $ | 1,369,389 | | | $ | – | | | $ | – | | | $ | 1,369,389 | |
| | | | | | | | | | | | | | | | | |
Other Financial Instruments*** | | | | | | | | | | | | | | | | |
| Assets | | | | | | | | | | | | | | | | |
| Forward Foreign Currency | | | | | | | | | | | | | | | | |
| Exchange Contracts | | $ | – | | | $ | 29 | | | $ | – | | | $ | 29 | |
| Liabilities | | | | | | | | | | | | | | | | |
Common Stocks** | | | (226,721 | ) | | | – | | | | – | | | | (226,721 | ) |
| Limited Partnerships | | | (12,928 | ) | | | – | | | | – | | | | (12,928 | ) |
| Exchange‐Traded Funds | | | (76,304 | ) | | | – | | | | – | | | | (76,304 | ) |
| Exchange‐Traded Notes | | | (3,159 | ) | | | – | | | | – | | | | (3,159 | ) |
| Written Options | | | (2,606 | ) | | | – | | | | – | | | | (2,606 | ) |
| Forward Foreign Currency | | | | | | | | | | | | | | | | |
| Exchange Contracts | | | – | | | | (48 | ) | | | – | | | | (48 | ) |
| TOTAL | | $ | (321,718 | ) | | $ | (19 | ) | | $ | – | | | $ | (321,737 | ) |
| * | Refer to footnote 2 where leveling hierarchy is defined. |
| ** | Refer to Portfolio of Investments for sector information. |
| *** | Other financial instruments are instruments such as securities sold short, written options, and forward foreign currency exchange contracts. |
| See Notes to Financial Statements. | |
| 80 | www.arbitragefunds.com | 1-800-295-4485 |
| The Arbitrage Fund | Statement of Assets and Liabilities |
| | May 31, 2015 |
| ASSETS | | | |
| Investments: | | | |
| At cost | | $ | 2,074,521,636 | |
| At value (Note 2) | | $ | 2,072,317,594 | |
| Cash denominated in foreign currency (Cost $53,642,366) | | | 53,621,028 | |
| Deposits with brokers for securities sold short (Note 2) | | | 576,127,155 | |
| Segregated cash for swaps (Note 2) | | | 3,130,000 | |
| Receivable for investment securities sold | | | 124,070,804 | |
| Receivable for capital shares sold | | | 18,531,666 | |
| Unrealized appreciation on forward foreign currency exchange contracts | | | | |
| (Note 8) | | | 3,785,890 | |
| Unrealized appreciation on swap contracts | | | 112,866 | |
| Dividends and interest receivable | | | 1,148,628 | |
| Prepaid expenses and other assets | | | 107,325 | |
| Total Assets | | | 2,852,952,956 | |
| LIABILITIES | | | | |
| Securities sold short, at value (Note 2) (proceeds $619,079,179) | | | 613,163,617 | |
| Written options, at value (Note 2) (premiums received $1,650,115) | | | 1,260,646 | |
| Payable to custodian | | | 102,656 | |
| Payable for investment securities purchased | | | 157,904,750 | |
| Payable for swap contract payments | | | 24,895 | |
| Unrealized depreciation on forward foreign currency exchange contracts | | | | |
| (Note 8) | | | 8,778,772 | |
| Payable for capital shares redeemed | | | 3,087,601 | |
| Payable to Advisor (Note 6) | | | 1,821,882 | |
| Dividends payable on securities sold short (Note 2) | | | 422,751 | |
| Payable to Distributor (Note 6) | | | 137,811 | |
| Payable to Administrator (Note 6) | | | 236,354 | |
| Interest expense payable | | | 180,798 | |
| Payable to Trustees | | | 38,094 | |
| Payable to Chief Compliance Officer (Note 6) | | | 75,789 | |
| Other accrued expenses and liabilities | | | 174,991 | |
| Total Liabilities | | | 787,411,407 | |
| NET ASSETS | | $ | 2,065,541,549 | |
| NET ASSETS CONSIST OF: | | | | |
| Paid‐in capital | | $ | 2,023,184,279 | |
| Accumulated net investment income | | | 4,869,445 | |
| Accumulated net realized gain on investments, swap contracts, securities sold | | | | |
| short, written option contracts and foreign currencies | | | 38,226,533 | |
| Net unrealized depreciation on investments, swap contracts, securities sold | | | | |
| short, written option contracts and translation of assets and liabilities | | | | |
| denominated in foreign currencies | | | (738,708 | ) |
| NET ASSETS | | $ | 2,065,541,549 | |
| See Notes to Financial Statements. | |
| Annual Report | May 31, 2015 | 81 |
| The Arbitrage Fund | Statement of Assets and Liabilities |
| | May 31, 2015 |
| PRICING OF SHARES: | | | |
| CLASS R SHARES: | | | |
| Net assets applicable to Class R shares | | $ | 500,440,057 | |
| Shares of beneficial interest outstanding (unlimited number of shares | | | | |
| authorized, no par value) | | | 38,591,866 | |
Net asset value and offering price per share(a) | | $ | 12.97 | |
| CLASS I SHARES: | | | | |
| Net assets applicable to Class I shares | | $ | 1,514,685,236 | |
| Shares of beneficial interest outstanding (unlimited number of shares | | | | |
| authorized, no par value) | | | 114,021,361 | |
Net asset value and offering price per share(a) | | $ | 13.28 | |
| CLASS C SHARES: | | | | |
| Net assets applicable to Class C shares | | $ | 32,958,355 | |
| Shares of beneficial interest outstanding (unlimited number of shares | | | | |
| authorized, no par value) | | | 2,604,859 | |
Net asset value and offering price per share(a) | | $ | 12.65 | |
| CLASS A SHARES: | | | | |
| Net assets applicable to Class A shares | | $ | 17,457,901 | |
| Shares of beneficial interest outstanding (unlimited number of shares | | | | |
| authorized, no par value) | | | 1,345,535 | |
Net asset value and offering price per share(a) | | $ | 12.97 | |
| Maximum offering price per share (NAV/0.9750, based on maximum sales | | | | |
| charge of 2.50% of the offering price) | | | 13.30 | |
| | | | | |
(a) Redemption price varies based on length of time held (Note 1).
| See Notes to Financial Statements. | |
| 82 | www.arbitragefunds.com | 1-800-295-4485 |
| The Arbitrage Event-Driven Fund | Statement of Assets and Liabilities |
| | May 31, 2015 |
| ASSETS | | | |
| Investments: | | | |
| At cost | | $ | 630,112,748 | |
| At value (Note 2) | | $ | 624,075,615 | |
| Cash denominated in foreign currency (Cost $4,136,640) | | | 4,140,505 | |
| Deposits with brokers for securities sold short (Note 2) | | | 178,340,118 | |
| Segregated cash for swaps (Note 2) | | | 579,713 | |
| Receivable for investment securities sold | | | 37,813,738 | |
| Receivable for capital shares sold | | | 1,065,790 | |
| Unrealized appreciation on forward foreign currency exchange contracts | | | | |
| (Note 8) | | | 889,770 | |
| Dividends and interest receivable | | | 2,802,224 | |
| Prepaid expenses and other assets | | | 56,359 | |
| Total Assets | | | 849,763,832 | |
| LIABILITIES | | | | |
| Securities sold short, at value (Note 2) (proceeds $189,183,345) | | | 189,095,796 | |
| Written options, at value (Note 2) (premiums received $1,463,739) | | | 1,501,952 | |
| Loan Payable (Note 4) | | | 8,500,000 | |
| Payable to custodian | | | 195,764 | |
| Payable for investment securities purchased | | | 51,269,134 | |
| Payable for swap contract payments | | | 343,507 | |
| Unrealized depreciation on forward foreign currency exchange contracts | | | | |
| (Note 8) | | | 1,445,353 | |
| Unrealized depreciation on swap contracts | | | 15,032 | |
| Payable for capital shares redeemed | | | 904,834 | |
| Payable to Advisor (Note 6) | | | 542,591 | |
| Dividends payable on securities sold short (Note 2) | | | 103,181 | |
| Payable to Distributor (Note 6) | | | 47,534 | |
| Payable to Administrator (Note 6) | | | 84,130 | |
| Interest expense payable | | | 110,696 | |
| Payable to Trustees | | | 11,511 | |
| Payable to Chief Compliance Officer (Note 6) | | | 22,891 | |
| Other accrued expenses and liabilities | | | 93,188 | |
| Total Liabilities | | | 254,287,094 | |
| NET ASSETS | | $ | 595,476,738 | |
| NET ASSETS CONSIST OF: | | | | |
| Paid‐in capital | | $ | 626,506,566 | |
| Accumulated net investment income | | | 554,230 | |
| Accumulated net realized loss on investments, swap contracts, securities sold | | | | |
| short, written option contracts and foreign currencies | | | (25,032,170 | ) |
| Net unrealized depreciation on investments, swap contracts, securities sold | | | | |
| short, written option contracts and translation of assets and liabilities | | | | |
| denominated in foreign currencies | | | (6,551,888 | ) |
| NET ASSETS | | $ | 595,476,738 | |
| See Notes to Financial Statements. | |
| Annual Report | May 31, 2015 | 83 |
| The Arbitrage Event-Driven Fund | Statement of Assets and Liabilities |
| | May 31, 2015 |
| PRICING OF SHARES: | | | |
| CLASS R SHARES: | | | |
| Net assets applicable to Class R shares | | $ | 195,014,289 | |
| Shares of beneficial interest outstanding (unlimited number of shares | | | | |
| authorized, no par value) | | | 20,046,838 | |
Net asset value and offering price per share(a) | | $ | 9.73 | |
| CLASS I SHARES: | | | | |
| Net assets applicable to Class I shares | | $ | 390,101,914 | |
| Shares of beneficial interest outstanding (unlimited number of shares | | | | |
| authorized, no par value) | | | 39,748,918 | |
Net asset value and offering price per share(a) | | $ | 9.81 | |
| CLASS C SHARES: | | | | |
| Net assets applicable to Class C shares | | $ | 5,019,947 | |
| Shares of beneficial interest outstanding (unlimited number of shares | | | | |
| authorized, no par value) | | | 521,621 | |
Net asset value and offering price per share(a) | | $ | 9.62 | |
| CLASS A SHARES: | | | | |
| Net assets applicable to Class A shares | | $ | 5,340,588 | |
| Shares of beneficial interest outstanding (unlimited number of shares | | | | |
| authorized, no par value) | | | 548,748 | |
Net asset value and offering price per share(a) | | $ | 9.73 | |
| Maximum offering price per share (NAV/0.9675, based on maximum sales | | | | |
| charge of 3.25% of the offering price) | | | 10.06 | |
(a) Redemption price varies based on length of time held (Note 1).
| See Notes to Financial Statements. | |
| 84 | www.arbitragefunds.com | 1-800-295-4485 |
| The Arbitrage Credit Opportunities Fund | Statement of Assets and Liabilities |
| | May 31, 2015 |
| ASSETS | | | |
| Investments: | | | |
| At cost | | $ | 73,701,873 | |
| At value (Note 2) | | $ | 73,235,117 | |
| Deposits with brokers for securities sold short (Note 2) | | | 10,406,144 | |
| Segregated cash for swaps (Note 2) | | | 69,462 | |
| Receivable for investment securities sold | | | 770,625 | |
| Receivable for capital shares sold | | | 317,235 | |
| Dividends and interest receivable | | | 986,652 | |
| Prepaid expenses and other assets | | | 20,174 | |
| Total Assets | | | 85,805,409 | |
| LIABILITIES | | | | |
| Securities sold short, at value (Note 2) (proceeds $9,903,213) | | | 10,141,332 | |
| Written options, at value (Note 2) (premiums received $7,315) | | | 5,875 | |
| Payable to custodian | | | 5,806 | |
| Payable for investment securities purchased | | | 3,952,853 | |
| Payable for swap contract payments | | | 41,159 | |
| Unrealized depreciation on forward foreign currency exchange contracts (Note 8) | | | 5,074 | |
| Unrealized depreciation on swap contracts | | | 1,801 | |
| Payable for capital shares redeemed | | | 30,598 | |
| Payable to Advisor (Note 6) | | | 42,727 | |
| Payable to Distributor (Note 6) | | | 6,684 | |
| Payable to Administrator (Note 6) | | | 17,073 | |
| Interest expense payable | | | 17,327 | |
| Audit and legal fees payable | | | 30,939 | |
| Payable to Trustees | | | 1,334 | |
| Payable to Chief Compliance Officer (Note 6) | | | 2,530 | |
| Other accrued expenses and liabilities | | | 6,090 | |
| Total Liabilities | | | 14,309,202 | |
| NET ASSETS | | $ | 71,496,207 | |
| NET ASSETS CONSIST OF: | | | | |
| Paid‐in capital | | $ | 72,310,845 | |
| Accumulated net investment income | | | 466,881 | |
| Accumulated net realized loss on investments, swap contracts, securities sold short and foreign currencies | | | (571,187 | ) |
| Net unrealized depreciation on investments, swap contracts, securities sold short, written option contracts and translation of assets and liabilities denominated in foreign currencies | | | (710,332 | ) |
| NET ASSETS | | $ | 71,496,207 | |
| See Notes to Financial Statements. | |
| Annual Report | May 31, 2015 | 85 |
| The Arbitrage Credit Opportunities Fund | Statement of Assets and Liabilities |
| | May 31, 2015 |
| PRICING OF SHARES: | | | |
| CLASS R SHARES: | | | |
| Net assets applicable to Class R shares | | $ | 22,728,472 | |
| Shares of beneficial interest outstanding (unlimited number of shares authorized, no par value) | | | 2,283,555 | |
Net asset value and offering price per share(a) | | $ | 9.95 | |
| CLASS I SHARES: | | | | |
| Net assets applicable to Class I shares | | $ | 46,117,973 | |
| Shares of beneficial interest outstanding (unlimited number of shares authorized, no par value) | | | 4,642,453 | |
Net asset value and offering price per share(a) | | $ | 9.93 | |
| CLASS C SHARES: | | | | |
| Net assets applicable to Class C shares | | $ | 2,019,756 | |
| Shares of beneficial interest outstanding (unlimited number of shares authorized, no par value) | | | 204,246 | |
Net asset value and offering price per share(a) | | $ | 9.89 | |
| CLASS A SHARES: | | | | |
| Net assets applicable to Class A shares | | $ | 630,006 | |
| Shares of beneficial interest outstanding (unlimited number of shares authorized, no par value) | | | 63,460 | |
Net asset value and offering price per share(a) | | $ | 9.93 | |
| Maximum offering price per share (NAV/0.9675, based on maximum sales charge of 3.25% of the offering price) | | | 10.26 | |
(a) | Redemption price varies based on length of time held (Note 1). |
| See Notes to Financial Statements. | |
| 86 | www.arbitragefunds.com | 1-800-295-4485 |
| The Arbitrage Tactical Equity Fund | Statement of Assets and Liabilities |
| | May 31, 2015 |
| ASSETS | | | |
| Investments: | | | |
| At cost | | $ | 1,362,521 | |
| At value (Note 2) | | $ | 1,369,389 | |
| Deposits with brokers for securities sold short (Note 2) | | | 313,927 | |
| Receivable for investment securities sold | | | 24,991 | |
| Unrealized appreciation on forward foreign currency exchange contracts (Note 8) | | | 29 | |
| Dividends and interest receivable | | | 1,448 | |
| Receivable due from Advisor | | | 37,580 | |
| Prepaid offering costs | | | 78,712 | |
| Prepaid expenses and other assets | | | 4,773 | |
| Total Assets | | | 1,830,849 | |
| LIABILITIES | | | | |
| Securities sold short, at value (Note 2) (proceeds $315,659) | | | 319,112 | |
| Written options, at value (Note 2) (premiums received $2,201) | | | 2,606 | |
| Payable to custodian | | | 7,849 | |
| Payable for investment securities purchased | | | 52,181 | |
| Unrealized depreciation on forward foreign currency exchange contracts (Note 8) | | | 48 | |
| Dividends payable on securities sold short (Note 2) | | | 242 | |
| Payable to Distributor (Note 6) | | | 13 | |
| Payable to Administrator (Note 6) | | | 1,122 | |
| Interest expense payable | | | 188 | |
| Payable to Trustees | | | 22 | |
| Payable to Chief Compliance Officer (Note 6) | | | 41 | |
| Audit fee payable | | | 24,333 | |
| Other accrued expenses and liabilities | | | 6,649 | |
| Total Liabilities | | | 414,406 | |
| NET ASSETS | | $ | 1,416,443 | |
| NET ASSETS CONSIST OF: | | | | |
| Paid‐in capital | | $ | 1,412,819 | |
| Accumulated net investment income | | | 19 | |
| Accumulated net realized gain on investments, swap contracts, securities sold short, written option contracts and foreign currencies | | | 613 | |
| Net unrealized appreciation on investments, securities sold short, written option contracts and translation of assets and liabilities denominated in foreign currencies | | | 2,992 | |
| NET ASSETS | | $ | 1,416,443 | |
| See Notes to Financial Statements. | |
| Annual Report | May 31, 2015 | 87 |
| The Arbitrage Tactical Equity Fund | Statement of Assets and Liabilities |
| | May 31, 2015 |
| PRICING OF SHARES: | | | |
| CLASS R SHARES: | | | |
| Net assets applicable to Class R shares | | $ | 10,122 | |
| Shares of beneficial interest outstanding (unlimited number of shares authorized, no par value) | | | 1,000 | |
Net asset value and offering price per share(a) | | $ | 10.12 | |
| CLASS I SHARES: | | | | |
| Net assets applicable to Class I shares | | $ | 1,386,077 | |
| Shares of beneficial interest outstanding (unlimited number of shares authorized, no par value) | | | 136,910 | |
Net asset value and offering price per share(a) | | $ | 10.12 | |
| CLASS C SHARES: | | | | |
| Net assets applicable to Class C shares | | $ | 10,122 | |
| Shares of beneficial interest outstanding (unlimited number of shares authorized, no par value) | | | 1,000 | |
Net asset value and offering price per share(a) | | $ | 10.12 | |
| CLASS A SHARES: | | | | |
| Net assets applicable to Class A shares | | $ | 10,122 | |
| Shares of beneficial interest outstanding (unlimited number of shares authorized, no par value) | | | 1,000 | |
Net asset value and offering price per share(a) | | $ | 10.12 | |
| Maximum offering price per share (NAV/0.9675, based on maximum sales charge of 3.25% of the offering price) | | | 10.46 | |
(a) | Redemption price varies based on length of time held (Note 1). |
| See Notes to Financial Statements. | |
| 88 | www.arbitragefunds.com | 1-800-295-4485 |
| The Arbitrage Fund | Statement of Operations |
| | May 31, 2015 |
| INVESTMENT INCOME | | | |
| Dividend income | | $ | 33,897,418 | |
| Foreign taxes withheld on dividends | | | (470,181 | ) |
| Interest income | | | 7,021 | |
| Total Investment Income | | | 33,434,258 | |
| EXPENSES | | | | |
| Investment advisory fees (Note 6) | | | 24,530,283 | |
| Distribution and service fees (Note 6) | | | | |
| Class R | | | 1,431,113 | |
| Class C | | | 329,574 | |
| Class A | | | 26,665 | |
| Administrative fees (Note 6) | | | 458,139 | |
| Chief Compliance Officer fees (Note 6) | | | 314,654 | |
| Trustees' fees | | | 200,672 | |
| Dividend expense | | | 16,042,274 | |
| Interest rebate expense | | | 4,019,727 | |
| Transfer agent fees (Note 6) | | | 1,583,549 | |
| Custodian and bank service fees | | | 410,004 | |
| Registration and filing fees | | | 110,876 | |
| Printing of shareholder reports | | | 131,618 | |
| Professional fees | | | 301,084 | |
| Line of credit interest expense (Note 4) | | | 252,526 | |
| Insurance expense | | | 111,229 | |
| Principal Financial Officer fees (Note 6) | | | 7,756 | |
| Other expenses | | | 121,950 | |
| Total Expenses | | | 50,383,693 | |
| NET INVESTMENT LOSS | | | (16,949,435 | ) |
| REALIZED AND UNREALIZED GAINS (LOSSES) ON INVESTMENTS AND FOREIGN CURRENCIES | | | | |
| Net realized gains (losses) from: | | | | |
| Investments | | | 293,123,691 | |
| Swap contracts | | | (253,886 | ) |
| Securities sold short | | | (222,961,312 | ) |
| Written option contracts | | | 12,770,110 | |
| Foreign currency transactions (Note 8) | | | 25,301,697 | |
| Net change in unrealized appreciation (depreciation) on: | | | | |
| Investments | | | (61,391,553 | ) |
| Swap contracts | | | (164,901 | ) |
| Securities sold short | | | 48,301,456 | |
| Written option contracts | | | 622 | |
| Foreign currency transactions (Note 8) | | | (634,000 | ) |
| | | | | |
| NET REALIZED AND UNREALIZED GAINS ON INVESTMENTS AND FOREIGN CURRENCIES | | | 94,091,924 | |
| NET INCREASE IN NET ASSETS RESULTING FROM OPERATIONS | | $ | 77,142,489 | |
| See Notes to Financial Statements. | |
| Annual Report | May 31, 2015 | 89 |
| The Arbitrage Event-Driven Fund | Statement of Operations |
| | For the Year Ended May 31, 2015 |
| INVESTMENT INCOME | | | |
| Dividend Income | | $ | 5,592,927 | |
| Foreign taxes withheld on dividends | | | (91,676 | ) |
| Interest income | | | 12,857,791 | |
| Total Investment Income | | | 18,359,042 | |
| EXPENSES | | | | |
| Investment advisory fees (Note 6) | | | 7,999,233 | |
| Distribution and service fees (Note 6) | | | | |
| Class R | | | 527,963 | |
| Class C | | | 57,003 | |
| Class A | | | 13,832 | |
| Administrative fees (Note 6) | | | 139,817 | |
| Chief Compliance Officer fees (Note 6) | | | 86,669 | |
| Trustees' fees | | | 56,829 | |
| Dividend expense | | | 3,543,930 | |
| Interest rebate expense | | | 1,557,250 | |
| Transfer agent fees (Note 6) | | | 469,134 | |
| Custodian and bank service fees | | | 166,674 | |
| Registration and filing fees | | | 145,132 | |
| Printing of shareholder reports | | | 105,588 | |
| Professional fees | | | 116,114 | |
| Line of credit interest expense (Note 4) | | | 92,022 | |
| Insurance expense | | | 17,298 | |
| Principal Financial Officer fees (Note 6) | | | 2,128 | |
| Other expenses | | | 51,506 | |
| Total Expenses | | | 15,148,122 | |
| Fees waived/reimbursed by the Advisor, Class R (Note 6) | | | (42,377 | ) |
| Fees waived/reimbursed by the Advisor, Class I (Note 6) | | | (96,022 | ) |
| Fees waived/reimbursed by the Advisor, Class C (Note 6) | | | (1,230 | ) |
| Fees waived/reimbursed by the Advisor, Class A (Note 6) | | | (1,377 | ) |
| Net Expenses | | | 15,007,116 | |
| NET INVESTMENT INCOME | | | 3,351,926 | |
| See Notes to Financial Statements. | |
| 90 | www.arbitragefunds.com | 1-800-295-4485 |
| The Arbitrage Event-Driven Fund | Statement of Operations |
| | For the Year Ended May 31, 2015 |
| REALIZED AND UNREALIZED GAINS (LOSSES) ON INVESTMENTS AND FOREIGN CURRENCIES | | | |
| Net realized gains (losses) from: | | | |
| Investments | | $ | 13,840,851 | |
| Swap contracts | | | 778,445 | |
| Securities sold short | | | (36,254,971 | ) |
| Written option contracts | | | 3,287,176 | |
| Foreign currency transactions (Note 8) | | | 5,225,074 | |
| Net change in unrealized appreciation (depreciation) on: | | | | |
| Investments | | | (16,801,049 | ) |
| Swap contracts | | | (14,013 | ) |
| Securities sold short | | | 4,425,595 | |
| Written option contracts | | | (78,435 | ) |
| Foreign currency transactions (Note 8) | | | 14,868 | |
| NET REALIZED AND UNREALIZED LOSSES ON INVESTMENTS AND FOREIGN CURRENCIES | | | (25,576,459 | ) |
| NET DECREASE IN NET ASSETS RESULTING FROM OPERATIONS | | $ | (22,224,533 | ) |
| See Notes to Financial Statements. | |
| Annual Report | May 31, 2015 | 91 |
| The Arbitrage Credit Opportunities Fund | Statement of Operations |
| | For the Year Ended May 31, 2015 |
| | | | |
| INVESTMENT INCOME | | | |
| Dividend Income | | $ | 14,101 | |
| Interest income | | | 2,389,119 | |
| Total Investment Income | | | 2,403,220 | |
| EXPENSES | | | | |
| Investment advisory fees (Note 6) | | | 479,488 | |
| Distribution and service fees (Note 6) | | | | |
| Class R | | | 26,304 | |
| Class C | | | 17,250 | |
| Class A | | | 1,140 | |
| Administrative fees (Note 6) | | | 18,496 | |
| Chief Compliance Officer fees (Note 6) | | | 6,753 | |
| Trustees' fees | | | 4,421 | |
| Dividend expense | | | 28,200 | |
| Interest rebate expense | | | 225,529 | |
| Transfer agent fees (Note 6) | | | 79,742 | |
| Custodian and bank service fees | | | 18,109 | |
| Registration and filing fees | | | 56,021 | |
| Printing of shareholder reports | | | 3,590 | |
| Professional fees | | | 34,948 | |
| Insurance expense | | | 1,160 | |
| Principal Financial Officer fees (Note 6) | | | 162 | |
| Other expenses | | | 20,350 | |
| Total Expenses | | | 1,021,663 | |
| Fees waived/reimbursed by the Advisor, Class R (Note 6) | | | (25,136 | ) |
| Fees waived/reimbursed by the Advisor, Class I (Note 6) | | | (92,962 | ) |
| Fees waived/reimbursed by the Advisor, Class C (Note 6) | | | (4,587 | ) |
| Fees waived/reimbursed by the Advisor, Class A (Note 6) | | | (1,194 | ) |
| Net Expenses | | | 897,784 | |
| NET INVESTMENT INCOME | | | 1,505,436 | |
| See Notes to Financial Statements. | |
| 92 | www.arbitragefunds.com | 1-800-295-4485 |
| The Arbitrage Credit Opportunities Fund | Statement of Operations |
| | For the Year Ended May 31, 2015 |
| REALIZED AND UNREALIZED GAINS (LOSSES) ON INVESTMENTS AND FOREIGN CURRENCIES | | | |
| Net realized gains (losses) from: | | | |
| Investments | | $ | (896,060 | ) |
| Swap contracts | | | (3,089 | ) |
| Securities sold short | | | 331,588 | |
| Written option contracts | | | 6,041 | |
| Foreign currency transactions (Note 8) | | | (3,180 | ) |
| Net change in unrealized appreciation (depreciation) on: | | | | |
| Investments | | | (635,543 | ) |
| Swap contracts | | | (1,801 | ) |
| Securities sold short | | | (169,697 | ) |
| Written option contracts | | | 355 | |
| Foreign currency transactions (Note 8) | | | 14,361 | |
| NET REALIZED AND UNREALIZED LOSSES ON INVESTMENTS AND FOREIGN CURRENCIES | | | (1,357,025 | ) |
| NET INCREASE IN NET ASSETS RESULTING FROM OPERATIONS | | $ | 148,411 | |
| See Notes to Financial Statements. | |
| Annual Report | May 31, 2015 | 93 |
| The Arbitrage Tactical Equity Fund | Statement of Operations |
| | For the Year Ended May 31, 2015 |
| | | | |
| INVESTMENT INCOME | | | |
| Dividend Income | | $ | 1,848 | |
| Foreign taxes withheld on dividends | | | (72 | ) |
| Total Investment Income | | | 1,776 | |
| EXPENSES | | | | |
| Investment advisory fees (Note 6) | | | 4,957 | |
| Distribution and service fees (Note 6) | | | | |
| Class R | | | 11 | |
| Class C | | | 42 | |
| Class A | | | 11 | |
| Administrative fees (Note 6) | | | 1,383 | |
| Chief Compliance Officer fees (Note 6) | | | 55 | |
| Trustees' fees | | | 46 | |
| Dividend expense | | | 4,010 | |
| Interest rebate expense | | | 581 | |
| Transfer agent fees (Note 6) | | | 10,597 | |
| Custodian and bank service fees | | | 7,849 | |
| Registration and filing fees | | | 1,136 | |
| Printing of shareholder reports | | | 32 | |
| Professional fees | | | 28,328 | |
| Offering cost (Note 2) | | | 49,031 | |
| Other expenses | | | 5,352 | |
| Total Expenses | | | 113,421 | |
| Fees waived/reimbursed by the Advisor, Class R (Note 6) | | | (1,733 | ) |
| Fees waived/reimbursed by the Advisor, Class I (Note 6) | | | (97,858 | ) |
| Fees waived/reimbursed by the Advisor, Class C (Note 6) | | | (1,733 | ) |
| Fees waived/reimbursed by the Advisor, Class A (Note 6) | | | (1,733 | ) |
| Net Expenses | | | 10,364 | |
| NET INVESTMENT LOSS | | | (8,588 | ) |
| See Notes to Financial Statements. | |
| 94 | www.arbitragefunds.com | 1-800-295-4485 |
| The Arbitrage Tactical Equity Fund | Statement of Operations |
| | For the Period Ended May 31, 2015(a) |
| REALIZED AND UNREALIZED GAINS (LOSSES) ON INVESTMENTS | | | |
| AND FOREIGN CURRENCIES | | | |
| Net realized gains (losses) from: | | | |
| Investments | | $ | 13,267 | |
| Swap contracts | | | (269 | ) |
| Securities sold short | | | (10,041 | ) |
| Written option contracts | | | 3,655 | |
| Foreign currency transactions (Note 8) | | | (119 | ) |
| Net change in unrealized appreciation (depreciation) on: | | | | |
| Investments | | | 6,868 | |
| Securities sold short | | | (3,453 | ) |
| Written option contracts | | | (405 | ) |
| Foreign currency transactions (Note 8) | | | (18 | ) |
| NET REALIZED AND UNREALIZED GAINS ON INVESTMENTS AND | | | | |
| FOREIGN CURRENCIES | | | | |
| | | | 9,485 | |
| NET INCREASE IN NET ASSETS RESULTING FROM OPERATIONS | | $ | 897 | |
(a) Commenced operations on January 2, 2015.
| See Notes to Financial Statements. | |
| Annual Report | May 31, 2015 | 95 |
| The Arbitrage Fund | Statements of Changes in Net Assets |
| | | | | | | |
| | | Year Ended | | | Year Ended | |
| | | May 31, 2015 | | | May 31, 2014 | |
| | | | | | | |
| FROM OPERATIONS: | | | | | | |
| Net investment loss | | $ | (16,949,435 | ) | | $ | (14,255,109 | ) |
| Net realized gains (losses) from: | | | | | | | | |
| Investments | | | 293,123,691 | | | | 166,698,999 | |
| Swap contracts | | | (253,886 | ) | | | 3,195,833 | |
| Securities sold short | | | (222,961,312 | ) | | | (161,504,776 | ) |
| Written option contracts | | | 12,770,110 | | | | 7,982,820 | |
| Foreign currency transactions | | | 25,301,697 | | | | (11,922,084 | ) |
| Net change in unrealized appreciation (depreciation) on: | | | | | | | | |
| Investments | | | (61,391,553 | ) | | | 47,545,817 | |
| Swap contracts | | | (164,901 | ) | | | (812,504 | ) |
| Securities sold short | | | 48,301,456 | | | | 5,706,869 | |
| Written option contracts | | | 622 | | | | 4,001,952 | |
| Foreign currency transactions | | | (634,000 | ) | | | (11,101,045 | ) |
| Net increase in net assets resulting from operations | | | 77,142,489 | | | | 35,536,772 | |
| FROM DIVIDENDS AND DISTRIBUTIONS TO SHAREHOLDERS: | | | | | |
| NET REALIZED GAINS | | | | | | | | |
| Distributions from net realized gains, Class R | | | (1,270,987 | ) | | | (4,128,037 | ) |
| Distributions from net realized gains, Class I | | | (4,326,291 | ) | | | (8,030,095 | ) |
| Distributions from net realized gains, Class C | | | (79,686 | ) | | | (148,724 | ) |
| Distributions from net realized gains, Class A | | | (22,574 | ) | | | (12,942 | ) |
| Decrease in net assets from distributions to shareholders | | | (5,699,538 | ) | | | (12,319,798 | ) |
| See Notes to Financial Statements. | |
| 96 | www.arbitragefunds.com | 1-800-295-4485 |
| The Arbitrage Fund | Statements of Changes in Net Assets |
| | | Year Ended | | | Year Ended | |
| | | May 31, 2015 | | | May 31, 2014 | |
| | | | | | | |
| FROM CAPITAL SHARE TRANSACTIONS (NOTE 7): | | | | | | |
| CLASS R | | | | | | |
| Proceeds from shares sold | | $ | 143,205,442 | | | $ | 363,576,930 | |
| Shares issued in reinvestment of distributions | | | 1,254,629 | | | | 4,086,744 | |
| Proceeds from redemption fees collected (Note 2) | | | 14,505 | | | | 46,167 | |
| Payments for shares redeemed | | | (422,530,774 | ) | | | (529,535,717 | ) |
| Net decrease in net assets from Class R share transactions | | | (278,056,198 | ) | | | (161,825,876 | ) |
| CLASS I | | | | | | | | |
| Proceeds from shares sold | | | 761,461,203 | | | | 725,650,546 | |
| Shares issued in reinvestment of distributions | | | 2,731,828 | | | | 4,762,186 | |
| Proceeds from redemption fees collected (Note 2) | | | 7,720 | | | | 26,523 | |
| Payments for shares redeemed | | | (1,014,256,381 | ) | | | (973,253,859 | ) |
| Net decrease in net assets from Class I share transactions | | | (250,055,630 | ) | | | (242,814,604 | ) |
| CLASS C | | | | | | | | |
| Proceeds from shares sold | | | 8,265,996 | | | | 22,491,991 | |
| Shares issued in reinvestment of distributions | | | 45,478 | | | | 87,489 | |
| Payments for shares redeemed | | | (9,670,144 | ) | | | (7,628,851 | ) |
| Net increase/(decrease) in net assets from Class C share transactions | | | (1,358,670 | ) | | | 14,950,629 | |
| CLASS A | | | | | | | | |
| Proceeds from shares sold | | | 13,478,530 | | | | 8,035,832 | |
| Shares issued in reinvestment of distributions | | | 19,017 | | | | 10,028 | |
| Proceeds from redemption fees collected (Note 2) | | | – | | | | 1 | |
| Payments for shares redeemed | | | (3,042,546 | ) | | | (1,390,984 | ) |
| Net increase in net assets from Class A share transactions | | | 10,455,001 | | | | 6,654,877 | |
| TOTAL DECREASE IN NET ASSETS | | | (447,572,546 | ) | | | (359,818,000 | ) |
| NET ASSETS: | | | | | | | | |
| Beginning of year | | | 2,513,114,095 | | | | 2,872,932,095 | |
| End of year * | | $ | 2,065,541,549 | | | $ | 2,513,114,095 | |
| *Including accumulated net investment income (loss) of: | | $ | 4,869,445 | | | $ | (13,485,183 | ) |
| See Notes to Financial Statements. | |
| Annual Report | May 31, 2015 | 97 |
| The Arbitrage Event-Driven Fund | Statements of Changes in Net Assets |
| | | Year Ended | | | Year Ended | |
| | | May 31, 2015 | | | May 31, 2014 | |
| | | | | | | |
| FROM OPERATIONS: | | | | | | |
| Net investment income | | $ | 3,351,926 | | | $ | 2,368,784 | |
| Net realized gains (losses) from: | | | | | | | | |
| Investments | | | 13,840,851 | | | | 8,782,816 | |
| Swap contracts | | | 778,445 | | | | 42,732 | |
| Securities sold short | | | (36,254,971 | ) | | | (7,485,992 | ) |
| Written option contracts | | | 3,287,176 | | | | 1,120,840 | |
| Foreign currency transactions | | | 5,225,074 | | | | (35,564 | ) |
| Net change in unrealized appreciation (depreciation) on: | | | | | | | | |
| Investments | | | (16,801,049 | ) | | | 10,391,083 | |
| Swap contracts | | | (14,013 | ) | | | (19,250 | ) |
| Securities sold short | | | 4,425,595 | | | | (3,833,021 | ) |
| Written option contracts | | | (78,435 | ) | | | 81,261 | |
| Foreign currency transactions | | | 14,868 | | | | (682,178 | ) |
| Net increase/(decrease) in net assets resulting from operations | | | (22,224,533 | ) | | | 10,731,511 | |
| FROM DIVIDENDS AND DISTRIBUTIONS TO SHAREHOLDERS: | | | | | |
| NET INVESTMENT INCOME | | | | | | | | |
| Distributions from net investment income, Class R | | | (1,765,025 | ) | | | (183,416 | ) |
| Distributions from net investment income, Class I | | | (3,897,650 | ) | | | (679,917 | ) |
| Distributions from net investment income, Class C | | | (22,154 | ) | | | (5,736 | ) |
| Distributions from net investment income, Class A | | | (39,977 | ) | | | (6,382 | ) |
| NET REALIZED GAINS | | | | | | | | |
| Distributions from net realized gains, Class R | | | (3,673,053 | ) | | | (24,853 | ) |
| Distributions from net realized gains, Class I | | | (6,881,389 | ) | | | (80,307 | ) |
| Distributions from net realized gains, Class C | | | (100,341 | ) | | | (1,126 | ) |
| Distributions from net realized gains, Class A | | | (84,204 | ) | | | (879 | ) |
| Decrease in net assets from distributions to shareholders | | | (16,463,793 | ) | | | (982,616 | ) |
| See Notes to Financial Statements. | |
| 98 | www.arbitragefunds.com | 1-800-295-4485 |
| The Arbitrage Event-Driven Fund | Statements of Changes in Net Assets |
| | | Year Ended | | | Year Ended | |
| | | May 31, 2015 | | | May 31, 2014 | |
| | | | | | | |
| FROM CAPITAL SHARE TRANSACTIONS (NOTE 7): | | | | | | |
| CLASS R | | | | | | |
| Proceeds from shares sold | | $ | 109,616,337 | | | $ | 208,070,695 | |
| Shares issued in reinvestment of distributions | | | 4,943,527 | | | | 201,589 | |
| Proceeds from redemption fees collected (Note 2) | | | 3,548 | | | | 11,178 | |
| Payments for shares redeemed | | | (111,326,249 | ) | | | (17,865,980 | ) |
| Net increase in net assets from Class R share transactions | | | 3,237,163 | | | | 190,417,482 | |
| CLASS I | | | | | | | | |
| Proceeds from shares sold | | | 309,977,406 | | | | 275,888,988 | |
| Shares issued in reinvestment of distributions | | | 8,296,168 | | | | 321,032 | |
| Proceeds from redemption fees collected (Note 2) | | | 10,415 | | | | 20,288 | |
| Payments for shares redeemed | | | (193,474,992 | ) | | | (32,791,940 | ) |
| Net increase in net assets from Class I share transactions | | | 124,808,997 | | | | 243,438,368 | |
| CLASS C | | | | | | | | |
| Proceeds from shares sold | | | 3,399,344 | | | | 3,849,767 | |
| Shares issued in reinvestment of distributions | | | 119,703 | | | | 6,761 | |
| Payments for shares redeemed | | | (2,343,450 | ) | | | (22,570 | ) |
| Net increase in net assets from Class C share transactions | | | 1,175,597 | | | | 3,833,958 | |
| CLASS A | | | | | | | | |
| Proceeds from shares sold | | | 3,577,554 | | | | 3,916,984 | |
| Shares issued in reinvestment of distributions | | | 122,223 | | | | 7,260 | |
| Proceeds from redemption fees collected (Note 2) | | | – | | | | 466 | |
| Payments for shares redeemed | | | (1,872,117 | ) | | | (162,556 | ) |
| Net increase in net assets from Class A share transactions | | | 1,827,660 | | | | 3,762,154 | |
| TOTAL INCREASE IN NET ASSETS | | | 92,361,091 | | | | 451,200,857 | |
| NET ASSETS: | | | | | | | | |
| Beginning of year | | | 503,115,647 | | | | 51,914,790 | |
| End of year * | | $ | 595,476,738 | | | $ | 503,115,647 | |
| *Including accumulated net investment income of: | | $ | 554,230 | | | $ | 1,688,131 | |
| See Notes to Financial Statements. | |
| Annual Report | May 31, 2015 | 99 |
| The Arbitrage Credit Opportunities Fund |
| Statements of Changes in Net Assets |
| | | Year Ended | | | Year Ended | |
| | | May 31, 2015 | | | May 31, 2014 | |
| FROM OPERATIONS: | | | | | | |
| Net investment income | | $ | 1,505,436 | | | $ | 644,074 | |
| Net realized gains (losses) from: | | | | | | | | |
| Investments | | | (896,060 | ) | | | 5,433 | |
| Swap contracts | | | (3,089 | ) | | | – | |
| Securities sold short | | | 331,588 | | | | (18,728 | ) |
| Written option contracts | | | 6,041 | | | | 3,477 | |
| Foreign currency transactions | | | (3,180 | ) | | | 21,902 | |
| Long‐term capital gains from other investment companies | | | – | | | | 1,068 | |
| Net change in unrealized appreciation (depreciation) on: | | | | | | | | |
| Investments | | | (635,543 | ) | | | 126,399 | |
| Swap contracts | | | (1,801 | ) | | | – | |
| Securities sold short | | | (169,697 | ) | | | (69,806 | ) |
| Written option contracts | | | 355 | | | | 1,085 | |
| Foreign currency transactions | | | 14,361 | | | | (22,330 | ) |
| Net increase in net assets resulting from operations | | | 148,411 | | | | 692,574 | |
| FROM DIVIDENDS AND DISTRIBUTIONS TO SHAREHOLDERS: | | | | | |
| NET INVESTMENT INCOME | | | | | | | | |
| Distributions from net investment income, Class R | | | (235,746 | ) | | | (108,553 | ) |
| Distributions from net investment income, Class I | | | (1,045,525 | ) | | | (328,945 | ) |
| Distributions from net investment income, Class C | | | (37,249 | ) | | | (2,418 | ) |
| Distributions from net investment income, Class A | | | (10,070 | ) | | | (610 | ) |
| Decrease in net assets from distributions to shareholders | | | (1,328,590 | ) | | | (440,526 | ) |
| See Notes to Financial Statements. | |
| 100 | www.arbitragefunds.com | 1-800-295-4485 |
| The Arbitrage Credit Opportunities Fund |
| Statements of Changes in Net Assets |
| | | Year Ended | | | Year Ended | |
| | | May 31, 2015 | | | May 31, 2014 | |
| | | | | | | |
| FROM CAPITAL SHARE TRANSACTIONS (NOTE 6): | | | | | | |
| CLASS R | | | | | | |
| Proceeds from shares sold | | $ | 22,101,038 | | | $ | 7,376,673 | |
| Shares issued in reinvestment of distributions | | | 235,574 | | | | 108,551 | |
| Proceeds from redemption fees collected (Note 2) | | | 210 | | | | 4,056 | |
| Payments for shares redeemed | | | (5,848,897 | ) | | | (2,819,415 | ) |
| Net increase in net assets from Class R share transactions | | | 16,487,925 | | | | 4,669,865 | |
| CLASS I | | | | | | | | |
| Proceeds from shares sold | | | 40,623,905 | | | | 22,971,820 | |
| Shares issued in reinvestment of distributions | | | 1,037,613 | | | | 328,535 | |
| Proceeds from redemption fees collected (Note 2) | | | 24 | | | | 301 | |
| Payments for shares redeemed | | | (17,616,249 | ) | | | (3,921,140 | ) |
| Net increase in net assets from Class I share transactions | | | 24,045,293 | | | | 19,379,516 | |
| CLASS C | | | | | | | | |
| Proceeds from shares sold | | | 1,619,345 | | | | 720,475 | |
| Shares issued in reinvestment of distributions | | | 37,247 | | | | 2,416 | |
| Payments for shares redeemed | | | (301,086 | ) | | | (34,971 | ) |
| Net increase in net assets from Class C share transactions | | | 1,355,506 | | | | 687,920 | |
| CLASS A | | | | | | | | |
| Proceeds from shares sold | | | 925,196 | | | | 27,607 | |
| Shares issued in reinvestment of distributions | | | 9,597 | | | | 412 | |
| Payments for shares redeemed | | | (322,636 | ) | | | – | |
| Net increase in net assets from Class A share transactions | | | 612,157 | | | | 28,019 | |
| TOTAL INCREASE IN NET ASSETS | | | 41,320,702 | | | | 25,017,368 | |
| NET ASSETS: | | | | | | | | |
| Beginning of year | | | 30,175,505 | | | | 5,158,137 | |
| End of year * | | $ | 71,496,207 | | | $ | 30,175,505 | |
| *Including accumulated net investment income of : | | $ | 466,881 | | | $ | 302,126 | |
| See Notes to Financial Statements. | |
| Annual Report | May 31, 2015 | 101 |
| The Arbitrage Tactical Equity Fund | Statement of Changes in Net Assets |
| | | Period Ended | |
| | | May 31, 2015(a) | |
| | | | |
| FROM OPERATIONS: | | | |
| Net investment loss | | $ | (8,588 | ) |
| Net realized gains (losses) from: | | | | |
| Investments | | | 13,267 | |
| Swap contracts | | | (269 | ) |
| Securities sold short | | | (10,041 | ) |
| Written option contracts | | | 3,655 | |
| Foreign currency transactions | | | (119 | ) |
| Net change in unrealized appreciation (depreciation) on: | | | | |
| Investments | | | 6,868 | |
| Securities sold short | | | (3,453 | ) |
| Written option contracts | | | (405 | ) |
| Foreign currency transactions | | | (18 | ) |
| Net increase in net assets resulting from operations | | | 897 | |
| FROM CAPITAL SHARE TRANSACTIONS (NOTE 7): | | | | |
| CLASS R | | | | |
| Proceeds from shares sold | | | 10,000 | |
| Net increase in net assets from Class R share transactions | | | 10,000 | |
| CLASS I | | | | |
| Proceeds from shares sold | | | 1,385,609 | |
| Payments for shares redeemed | | | (63 | ) |
| Net increase in net assets from Class I share transactions | | | 1,385,546 | |
| CLASS C | | | | |
| Proceeds from shares sold | | | 10,000 | |
| Net increase in net assets from Class C share transactions | | | 10,000 | |
| CLASS A | | | | |
| Proceeds from shares sold | | | 10,000 | |
| Net increase in net assets from Class A share transactions | | | 10,000 | |
| TOTAL INCREASE IN NET ASSETS | | | 1,416,443 | |
| NET ASSETS: | | | | |
| Beginning of period | | | – | |
| End of period * | | $ | 1,416,443 | |
| *Including accumulated net investment income of: | | $ | 19 | |
(a) Commenced operations on January 2, 2015.
| See Notes to Financial Statements. | |
| 102 | www.arbitragefunds.com | 1-800-295-4485 |
This Page Intentionally Left Blank
| The Arbitrage Fund – Class R |
Selected Per Share Data and Ratios for a Share Outstanding Throughout the Periods Presented:
| |
| Net asset value, beginning of period |
| Income (loss) from investment operations |
Net investment loss(a) |
| Net realized and unrealized gains on investments and foreign currencies |
| Total from investment operations |
| |
| Less distributions |
| From net investment income |
| From net realized gains |
| Total distributions |
| Proceeds from redemption fees collected |
| |
| Net asset value, end of period |
| |
Total return(c) |
| |
| Net assets, end of period (in 000s) |
| |
| RATIOS TO AVERAGE NET ASSETS: |
| Expenses including interest and dividend expense |
Expenses excluding interest and dividend expense(d)(e) |
Expenses after advisory fees waived and expenses reimbursed excluding interest and dividend expense(d)(e) |
| Net investment loss |
| |
| Portfolio turnover rate |
(a) | Per share amounts were calculated using average shares outstanding for the year. |
(b) | Amount rounds to less than $0.01 per share. |
(c) | Total return is a measure of the change in the value of an investment in the Fund over the years covered, which assumes any dividends or capital gains distributions are reinvested in shares of the Fund. Returns shown do not reflect the deduction of taxes a shareholder would pay on Fund distributions or the redemption of Fund shares. |
(d) | Dividend expense totaled 0.68%, 0.60%, 0.42%, 0.58% and 0.51%, of average net assets for the years ended May 31, 2015, 2014, 2013, 2012 and 2011, respectively. |
(e) | Interest rebate expense and line of credit interest expense totaled 0.18%, 0.12%, 0.10%, 0.20% and 0.13%, of average net assets for the years ended May 31, 2015, 2014, 2013, 2012 and 2011, respectively. |
| See Notes to Financial Statements. | |
| 104 | www.arbitragefunds.com | 1-800-295-4485 |
Year Ended
May 31, 2015 | | | Year Ended
May 31, 2014 | | | Year Ended
May 31, 2013 | | | Year Ended
May 31, 2012 | | | Year Ended
May 31, 2011 | |
| $ | 12.58 | | | $ | 12.50 | | | $ | 12.80 | | | $ | 12.77 | | | $ | 12.50 | |
| | | | | | | | | | | | | | | | | | | |
| | (0.11 | ) | | | (0.09 | ) | | | (0.10 | ) | | | (0.11 | ) | | | (0.12 | ) |
| | 0.53 | | | | 0.23 | | | | 0.15 | | | | 0.44 | | | | 0.66 | |
| | 0.42 | | | | 0.14 | | | | 0.05 | | | | 0.33 | | | | 0.54 | |
| | | | | | | | | | | | | | | | | | | |
| | | | | | | | | | | | | | | | | | | |
| | – | | | | – | | | | (0.09 | ) | | | – | | | | – | |
| | (0.03 | ) | | | (0.06 | ) | | | (0.26 | ) | | | (0.30 | ) | | | (0.27 | ) |
| | (0.03 | ) | | | (0.06 | ) | | | (0.35 | ) | | | (0.30 | ) | | | (0.27 | ) |
| | 0.00 | (b) | | | 0.00 | (b) | | | 0.00 | (b) | | | 0.00 | (b) | | | 0.00 | (b) |
| | | | | | | | | | | | | | | | | | | |
| $ | 12.97 | | | $ | 12.58 | | | $ | 12.50 | | | $ | 12.80 | | | $ | 12.77 | |
| | | | | | | | | | | | | | | | | | | |
| | 3.35 | % | | | 1.10 | % | | | 0.42 | % | | | 2.54 | % | | | 4.37 | % |
| | | | | | | | | | | | | | | | | | | |
| $ | 500,440 | | | $ | 760,750 | | | $ | 916,677 | | | $ | 1,003,646 | | | $ | 866,885 | |
| | | | | | | | | | | | | | | | | | | |
| | | | | | | | | | | | | | | | | | | |
| | 2.31 | % | | | 2.17 | % | | | 1.97 | % | | | 2.23 | % | | | 2.16 | % |
| | 1.45 | % | | | 1.45 | % | | | 1.45 | % | | | 1.45 | % | | | 1.52 | % |
| | 1.45 | % | | | 1.45 | % | | | 1.45 | % | | | 1.44 | % | | | 1.52 | % |
| | (0.87 | )% | | | (0.70 | )% | | | (0.78 | )% | | | (0.83 | )% | | | (0.93 | )% |
| | | | | | | | | | | | | | | | | | | |
| | 514 | % | | | 462 | % | | | 459 | % | | | 563 | % | | | 389 | % |
| Annual Report | May 31, 2015 | 105 |
| The Arbitrage Fund – Class I |
Selected Per Share Data and Ratios for a Share Outstanding Throughout the Periods Presented:
| |
| Net asset value, beginning of period |
| Income (loss) from investment operations |
Net investment loss(a) |
| Net realized and unrealized gains on investments and foreign currencies |
| Total from investment operations |
| |
| Less distributions |
| From net investment income |
| From net realized gains |
| Total distributions |
| Proceeds from redemption fees collected |
| |
| Net asset value, end of period |
| |
Total return(c) |
| |
| Net assets, end of period (in 000s) |
| |
| RATIOS TO AVERAGE NET ASSETS: |
| Expenses including interest and dividend expense |
Expenses excluding interest and dividend expense(d)(e) |
Expenses after advisory fees waived and expenses reimbursed excluding interest and dividend expense(d)(e) |
| Net investment loss |
| |
| Portfolio turnover rate |
(a) | Per share amounts were calculated using average shares outstanding for the year. |
(b) | Amount rounds to less than $0.01 per share. |
(c) | Total return is a measure of the change in the value of an investment in the Fund over the years covered, which assumes any dividends or capital gains distributions are reinvested in shares of the Fund. Returns shown do not reflect the deduction of taxes a shareholder would pay on Fund distributions or the redemption of Fund shares. |
(d) | Dividend expense totaled 0.68%, 0.60%, 0.42%, 0.58% and 0.51%, of average net assets for the years ended May 31, 2015, 2014, 2013, 2012 and 2011, respectively. |
(e) | Interest rebate expense and line of credit interest expense totaled 0.18%, 0.12%, 0.10%, 0.20% and 0.13%, of average net assets for the years ended May 31, 2015, 2014, 2013, 2012 and 2011, respectively. |
| See Notes to Financial Statements. | |
| 106 | www.arbitragefunds.com | 1-800-295-4485 |
Year Ended
May 31, 2015 | | | Year Ended
May 31, 2014 | | | Year Ended
May 31, 2013 | | | Year Ended
May 31, 2012 | | | Year Ended
May 31, 2011 | |
| $ | 12.86 | | | $ | 12.74 | | | $ | 13.04 | | | $ | 12.98 | | | $ | 12.68 | |
| | | | | | | | | | | | | | | | | | | |
| | (0.09 | ) | | | (0.05 | ) | | | (0.07 | ) | | | (0.07 | ) | | | (0.08 | ) |
| | 0.54 | | | | 0.23 | | | | 0.16 | | | | 0.43 | | | | 0.67 | |
| | 0.45 | | | | 0.18 | | | | 0.09 | | | | 0.36 | | | | 0.59 | |
| | | | | | | | | | | | | | | | | | | |
| | | | | | | | | | | | | | | | | | | |
| | – | | | | – | | | | (0.13 | ) | | | – | | | | (0.02 | ) |
| | (0.03 | ) | | | (0.06 | ) | | | (0.26 | ) | | | (0.30 | ) | | | (0.27 | ) |
| | (0.03 | ) | | | (0.06 | ) | | | (0.39 | ) | | | (0.30 | ) | | | (0.29 | ) |
| | 0.00 | (b) | | | 0.00 | (b) | | | 0.00 | (b) | | | 0.00 | (b) | | | 0.00 | (b) |
| | | | | | | | | | | | | | | | | | | |
| $ | 13.28 | | | $ | 12.86 | | | $ | 12.74 | | | $ | 13.04 | | | $ | 12.98 | |
| | | | | | | | | | | | | | | | | | | |
| | 3.51 | % | | | 1.39 | % | | | 0.67 | % | | | 2.74 | % | | | 4.74 | % |
| | | | | | | | | | | | | | | | | | | |
| $ | 1,514,685 | | | $ | 1,712,120 | | | $ | 1,937,514 | | | $ | 2,084,530 | | | $ | 1,346,801 | |
| | | | | | | | | | | | | | | | | | | |
| | | | | | | | | | | | | | | | | | | |
| | 2.06 | % | | | 1.92 | % | | | 1.72 | % | | | 1.98 | % | | | 1.91 | % |
| | 1.20 | % | | | 1.20 | % | | | 1.20 | % | | | 1.20 | % | | | 1.27 | % |
| | 1.20 | % | | | 1.20 | % | | | 1.20 | % | | | 1.20 | % | | | 1.27 | % |
| | (0.65 | )% | | | (0.42 | )% | | | (0.51 | )% | | | (0.56 | )% | | | (0.62 | )% |
| | | | | | | | | | | | | | | | | | | |
| | 514 | % | | | 462 | % | | | 459 | % | | | 563 | % | | | 389 | % |
| Annual Report | May 31, 2015 | 107 |
| The Arbitrage Fund – Class C |
Selected Per Share Data and Ratios for a Share Outstanding Throughout the Periods Presented:
| |
| Net asset value, beginning of period |
| Income (loss) from investment operations |
Net investment loss(b) |
| Net realized and unrealized gains on investments and foreign currencies |
| Total from investment operations |
| |
| Less distributions |
| From net investment income |
| From net realized gains |
| Total distributions |
| Proceeds from redemption fees collected |
| |
| Net asset value, end of period |
| |
Total return(d) |
| |
| Net assets, end of period (in 000s) |
| |
| RATIOS TO AVERAGE NET ASSETS: |
| Expenses including interest and dividend expense |
Expenses excluding interest and dividend expense(e)(f) |
Expenses after advisory fees waived and expenses reimbursed excluding interest and dividend expense(e)(f) |
| Net investment loss |
| |
| Portfolio turnover rate |
(a) | Commenced operations on June 1, 2012. |
(b) | Per share amounts were calculated using average shares outstanding for the year. |
(c) | Amount rounds to less than $0.01 per share. |
(d) | Total return is a measure of the change in the value of an investment in the Fund over the years covered, which assumes any dividends or capital gains distributions are reinvested in shares of the Fund. Returns shown do not reflect the deduction of taxes a shareholder would pay on Fund distributions or the redemption of Fund shares. |
(e) | Dividend expense totaled 0.68%, 0.60% and 0.42% of average net assets for the years ended May 31, 2015, 2014 and 2013, respectively. |
(f) | Interest rebate expense and line of credit interest expense totaled 0.18%, 0.12% and 0.11% of average net assets for the years ended May 31, 2015, 2014 and 2013, respectively. |
| See Notes to Financial Statements. | |
| 108 | www.arbitragefunds.com | 1-800-295-4485 |
Year Ended
May 31, 2015 | | | Year Ended
May 31, 2014 | | | Year Ended
May 31, 2013(a) | |
| $ | 12.37 | | | $ | 12.38 | | | $ | 12.80 | |
| | | | | | | | | | | |
| | (0.20 | ) | | | (0.18 | ) | | | (0.23 | ) |
| | 0.51 | | | | 0.23 | | | | 0.20 | |
| | 0.31 | | | | 0.05 | | | | (0.03 | ) |
| | | | | | | | | | | |
| | | | | | | | | | | |
| | – | | | | – | | | | (0.13 | ) |
| | (0.03 | ) | | | (0.06 | ) | | | (0.26 | ) |
| | (0.03 | ) | | | (0.06 | ) | | | (0.39 | ) |
| | – | | | | – | | | | 0.00 | (c) |
| | | | | | | | | | | |
| $ | 12.65 | | | $ | 12.37 | | | $ | 12.38 | |
| | | | | | | | | | | |
| | 2.52 | % | | | 0.38 | % | | | (0.27 | %) |
| | | | | | | | | | | |
| $ | 32,958 | | | $ | 33,589 | | | $ | 18,741 | |
| | | | | | | | | | | |
| | | | | | | | | | | |
| | 3.06 | % | | | 2.92 | % | | | 2.75 | % |
| | 2.20 | % | | | 2.20 | % | | | 2.20 | % |
| | 2.20 | % | | | 2.20 | % | | | 2.20 | % |
| | (1.60 | )% | | | (1.45 | )% | | | (1.84 | )% |
| | | | | | | | | | | |
| | 514 | % | | | 462 | % | | | 459 | % |
| Annual Report | May 31, 2015 | 109 |
| The Arbitrage Fund – Class A |
Selected Per Share Data and Ratios for a Share Outstanding Throughout the Periods Presented:
| |
| Net asset value, beginning of period |
| Income (loss) from investment operations |
Net investment loss(b) |
| Net realized and unrealized gains on investments and foreign currencies |
| Total from investment operations |
| |
| Less distributions |
| From net realized gains |
| Total distributions |
| Proceeds from redemption fees collected |
| |
| Net asset value, end of period |
| |
Total return(d) |
| |
| Net assets, end of period (in 000s) |
| |
| RATIOS TO AVERAGE NET ASSETS: |
| Expenses including interest and dividend expense |
Expenses excluding interest and dividend expense(e)(f) |
Expenses after advisory fees waived and expenses reimbursed excluding interest and dividend expense(e)(f) |
| Net investment loss |
| |
| Portfolio turnover rate |
(a) | Commenced operations on June 1, 2013. |
(b) | Per share amounts were calculated using average shares outstanding for the year. |
(c) | Amount rounds to less than $0.01 per share. |
(d) | Total return is a measure of the change in the value of an investment in the Fund over the years covered, which assumes any dividends or capital gains distributions are reinvested in shares of the Fund. Returns shown do not reflect the deduction of taxes a shareholder would pay on Fund distributions or the redemption of Fund shares. |
(e) | Dividend expense totaled 0.68% and 0.60% of average net assets for the years ended May 31, 2015 and 2014, respectively. |
(f) | Interest rebate expense and line of credit interest expense totaled 0.18% and 0.12% of average net assets for the years ended May 31, 2015 and 2014, respectively. |
| See Notes to Financial Statements. | |
| 110 | www.arbitragefunds.com | 1-800-295-4485 |
Year Ended
May 31, 2015 | | | Year Ended
May 31, 2014(a) | |
| $ | 12.59 | | | $ | 12.50 | |
| | | | | | | |
| | (0.09 | ) | | | (0.09 | ) |
| | 0.50 | | | | 0.24 | |
| | 0.41 | | | | 0.15 | |
| | | | | | | |
| | | | | | | |
| | (0.03 | ) | | | (0.06 | ) |
| | (0.03 | ) | | | (0.06 | ) |
| | – | | | | 0.00 | (c) |
| | | | | | | |
| $ | 12.97 | | | $ | 12.59 | |
| | | | | | | |
| | 3.27 | % | | | 1.18 | % |
| | | | | | | |
| $ | 17,458 | | | $ | 6,655 | |
| | | | | | | |
| | | | | | | |
| | 2.31 | % | | | 2.18 | % |
| | 1.45 | % | | | 1.46 | % |
| | 1.45 | % | | | 1.46 | % |
| | (0.70 | )% | | | (0.69 | )% |
| | | | | | | |
| | 514 | % | | | 462 | % |
| Annual Report | May 31, 2015 | 111 |
| The Arbitrage Event-Driven Fund – Class R |
Selected Per Share Data and Ratios for a Share Outstanding Throughout the Periods Presented:
| |
| Net asset value, beginning of period |
| Income (loss) from investment operations |
Net investment income (loss)(b) |
| Net realized and unrealized gains (losses) on investments and foreign currencies |
| Total from investment operations |
| |
| Less distributions |
| From net investment income |
| From net realized gains |
| Total distributions |
| Proceeds from redemption fees collected |
| |
| Net asset value, end of period |
| |
Total return(d) |
| |
| Net assets, end of period (in 000s) |
| |
| RATIOS TO AVERAGE NET ASSETS: |
| Expenses including interest and dividend expense |
Expenses excluding interest and dividend expense(g)(h) |
Expenses after advisory fees waived and expenses reimbursed excluding interest and dividend expense(g)(h) |
| Net investment income (loss) |
| |
| Portfolio turnover rate |
(a) | Commenced operations on October 1, 2010. |
(b) | Per share amounts were calculated using average shares outstanding for the year. |
(c) | Amount rounds to less than $0.01 per share. |
(d) | Total return is a measure of the change in the value of an investment in the Fund over the years covered, which assumes any dividends or capital gains distributions are reinvested in shares of the Fund. Returns shown do not reflect the deduction of taxes a shareholder would pay on Fund distributions or the redemption of Fund shares. |
(g) | Dividend expense totaled 0.55%, 0.49%, 0.36%, 0.27% and 0.28% (annualized) of average net assets for the years ended May 31, 2015, 2014, 2013, 2012 and the period ended May 31, 2011, respectively. |
(h) | Interest rebate expense and line of credit interest expense totaled 0.26%, 0.13%, 0.13%, 0.21% and 0.21% (annualized) of average net assets for the years ended May 31, 2015, 2014, 2013, 2012 and the period ended May 31, 2011, respectively. |
| See Notes to Financial Statements. | |
| 112 | www.arbitragefunds.com | 1-800-295-4485 |
Year Ended
May 31, 2015 | | | Year Ended
May 31, 2014 | | | Year Ended
May 31, 2013 | | | Year Ended
May 31, 2012 | | | Period Ended
May 31, 2011(a) | |
| $ | 10.29 | | | $ | 9.80 | | | $ | 9.79 | | | $ | 10.23 | | | $ | 10.00 | |
| | | | | | | | | | | | | | | | | | | |
| | 0.04 | | | | 0.10 | | | | 0.15 | | | | 0.10 | | | | (0.02 | ) |
| | (0.36 | ) | | | 0.46 | | | | 0.11 | | | | 0.09 | | | | 0.36 | |
| | (0.32 | ) | | | 0.56 | | | | 0.26 | | | | 0.19 | | | | 0.34 | |
| | | | | | | | | | | | | | | | | | | |
| | | | | | | | | | | | | | | | | | | |
| | (0.08 | ) | | | (0.06 | ) | | | (0.10 | ) | | | (0.15 | ) | | | (0.01 | ) |
| | (0.16 | ) | | | (0.01 | ) | | | (0.15 | ) | | | (0.48 | ) | | | (0.10 | ) |
| | (0.24 | ) | | | (0.07 | ) | | | (0.25 | ) | | | (0.63 | ) | | | (0.11 | ) |
| | 0.00 | (c) | | | 0.00 | (c) | | | 0.00 | (c) | | | 0.00 | (c) | | | 0.00 | (c) |
| | | | | | | | | | | | | | | | | | | |
| $ | 9.73 | | | $ | 10.29 | | | $ | 9.80 | | | $ | 9.79 | | | $ | 10.23 | |
| | | | | | | | | | | | | | | | | | | |
| | (3.12 | %) | | | 5.75 | % | | | 2.72 | % | | | 1.88 | % | | | 3.43 | %(e) |
| | | | | | | | | | | | | | | | | | | |
| $ | 195,014 | | | $ | 204,055 | | | $ | 10,080 | | | $ | 8,976 | | | $ | 4,867 | |
| | | | | | | | | | | | | | | | | | | |
| | | | | | | | | | | | | | | | | | | |
| | 2.52 | % | | | 2.33 | % | | | 2.55 | % | | | 2.67 | % | | | 4.33 | %(f) |
| | 1.71 | % | | | 1.71 | % | | | 2.06 | % | | | 2.19 | % | | | 3.84 | %(f) |
| | 1.69 | % | | | 1.69 | % | | | 1.69 | % | | | 1.69 | % | | | 1.69 | %(f) |
| | 0.37 | % | | | 1.04 | % | | | 1.58 | % | | | 1.02 | % | | | (0.26 | )%(f) |
| | | | | | | | | | | | | | | | | | | |
| | 451 | % | | | 340 | % | | | 336 | % | | | 490 | % | | | 298 | %(e) |
| Annual Report | May 31, 2015 | 113 |
| The Arbitrage Event-Driven Fund – Class I |
| Selected Per Share Data and Ratios for a Share Outstanding Throughout the Periods Presented: |
| |
| Net asset value, beginning of period |
| Income (loss) from investment operations |
Net investment income(b) |
| Net realized and unrealized gains (losses) on investments and foreign currencies |
| Total from investment operations |
| |
| Less distributions |
| From net investment income |
| From net realized gains |
| Total distributions |
| Proceeds from redemption fees collected |
| |
| Net asset value, end of period |
| |
Total return(d) |
| |
| Net assets, end of period (in 000s) |
| |
| RATIOS TO AVERAGE NET ASSETS: |
| Expenses including interest and dividend expense |
Expenses excluding interest and dividend expense(g)(h) |
Expenses after advisory fees waived and expenses reimbursed excluding interest and dividend expense(g)(h) |
| Net investment income |
| |
| Portfolio turnover rate |
(a) | Commenced operations on October 1, 2010. |
(b) | Per share amounts were calculated using average shares outstanding for the year. |
(c) | Amount rounds to less than $0.01 per share. |
(d) | Total return is a measure of the change in the value of an investment in the Fund over the years covered, which assumes any dividends or capital gains distributions are reinvested in shares of the Fund. Returns shown do not reflect the deduction of taxes a shareholder would pay on Fund distributions or the redemption of Fund shares. |
(e) | Not Annualized. |
(f) | Annualized. |
(g) | Dividend expense totaled 0.55%, 0.49%, 0.36%, 0.27% and 0.28% (annualized) of average net assets for the years ended May 31, 2015, 2014, 2013, 2012 and the period ended May 31, 2011, respectively. |
(h) | Interest rebate expense and line of credit interest expense totaled 0.26%, 0.13%, 0.13%, 0.21% and 0.21% (annualized) of average net assets for the years ended May 31, 2015, 2014, 2013, 2012 and the period ended May 31, 2011, respectively. |
| See Notes to Financial Statements. | |
| 114 | www.arbitragefunds.com | 1-800-295-4485 |
| Year Ended | | | Year Ended | | | Year Ended | | | Year Ended | | | Period Ended | |
| May 31, 2015 | | | May 31, 2014 | | | May 31, 2013 | | | May 31, 2012 | | | May 31, 2011(a) | |
| $ | 10.37 | | | $ | 9.86 | | | $ | 9.82 | | | $ | 10.24 | | | $ | 10.00 | |
| | | | | | | | | | | | | | | | | | | |
| | 0.06 | | | | 0.13 | | | | 0.16 | | | | 0.12 | | | | 0.01 | |
| | (0.37 | ) | | | 0.46 | | | | 0.13 | | | | 0.09 | | | | 0.35 | |
| | (0.31 | ) | | | 0.59 | | | | 0.29 | | | | 0.21 | | | | 0.36 | |
| | | | | | | | | | | | | | | | | | | |
| | (0.09 | ) | | | (0.07 | ) | | | (0.10 | ) | | | (0.15 | ) | | | (0.02 | ) |
| | (0.16 | ) | | | (0.01 | ) | | | (0.15 | ) | | | (0.48 | ) | | | (0.10 | ) |
| | (0.25 | ) | | | (0.08 | ) | | | (0.25 | ) | | | (0.63 | ) | | | (0.12 | ) |
| | 0.00 | (c) | | | 0.00 | (c) | | | 0.00 | (c) | | | 0.00 | (c) | | | 0.00 | (c) |
| | | | | | | | | | | | | | | | | | | |
| $ | 9.81 | | | $ | 10.37 | | | $ | 9.86 | | | $ | 9.82 | | | $ | 10.24 | |
| | | | | | | | | | | | | | | | | | | |
| | (2.96 | %) | | | 6.02 | % | | | 3.04 | % | | | 2.09 | % | | | 3.57 | %(e) |
| | | | | | | | | | | | | | | | | | | |
| $ | 390,102 | | | $ | 290,999 | | | $ | 41,493 | | | $ | 21,389 | | | $ | 11,701 | |
| | | | | | | | | | | | | | | | | | | |
| | 2.27 | % | | | 2.11 | % | | | 2.31 | % | | | 2.42 | % | | | 4.73 | %(f) |
| | 1.46 | % | | | 1.49 | % | | | 1.82 | % | | | 1.94 | % | | | 4.24 | %(f) |
| | 1.44 | % | | | 1.44 | % | | | 1.44 | % | | | 1.44 | % | | | 1.44 | %(f) |
| | 0.62 | % | | | 1.31 | % | | | 1.68 | % | | | 1.25 | % | | | 0.12 | %(f) |
| | | | | | | | | | | | | | | | | | | |
| | 451 | % | | | 340 | % | | | 336 | % | | | 490 | % | | | 298 | %(e) |
| | |
| Annual Report | May 31, 2015 | 115 |
| The Arbitrage Event-Driven Fund – Class C |
| Selected Per Share Data and Ratios for a Share Outstanding Throughout the Periods Presented: |
| |
| Net asset value, beginning of period |
| Income (loss) from investment operations |
Net investment income (loss)(b) |
| Net realized and unrealized gains (losses) on investments and foreign currencies |
| Total from investment operations |
| |
| Less distributions |
| From net investment income |
| From net realized gains |
| Total distributions |
| |
| Net asset value, end of period |
| |
Total return(c) |
| |
| Net assets, end of period (in 000s) |
| |
| RATIOS TO AVERAGE NET ASSETS: |
| Expenses including interest and dividend expense |
Expenses excluding interest and dividend expense(d)(e) |
Expenses after advisory fees waived and expenses reimbursed excluding interest and dividend expense(d)(e) |
| Net investment income (loss) |
| |
| Portfolio turnover rate |
(a) | Commenced operations on June 1, 2012. |
(b) | Per share amounts were calculated using average shares outstanding for the year. |
(c) | Total return is a measure of the change in the value of an investment in the Fund over the years covered, which assumes any dividends or capital gains distributions are reinvested in shares of the Fund. Returns shown do not reflect the deduction of taxes a shareholder would pay on Fund distributions or the redemption of Fund shares. |
(d) | Dividend expense totaled 0.55%, 0.49% anTd 0.36% of average net assets for the years ended May 31, 2015, 2014 and 2013, respectively. |
(e) | Interest rebate expense and line of credit interest expense totaled 0.26%, 0.13% and 0.13% of average net assets for the years ended May 31, 2015, 2014 and 2013, respectively. |
(f) | The amount shown for a share outstanding throughout the period may not correlate with the Statement of Operations for the period due to timing of sales and redemptions of Fund shares in relation to income earned and/or fluctuating market value of the investments of the Fund. |
| See Notes to Financial Statements. | |
| 116 | www.arbitragefunds.com | 1-800-295-4485 |
| Year Ended | | | Year Ended | | | Year Ended | |
| May 31, 2015 | | | May 31, 2014 | | | May 31, 2013(a) | |
| $ | 10.22 | | | $ | 9.78 | | | $ | 9.79 | |
| | | | | | | | | | | |
| | (0.04 | ) | | | 0.03 | | | | 0.09 | |
| | (0.36 | ) | | | 0.46 | | | | 0.13 | |
| | (0.40 | ) | | | 0.49 | | | | 0.22 | |
| | | | | | | | | | | |
| | | | | | | | | | | |
| | (0.04 | ) | | | (0.04 | ) | | | (0.08 | ) |
| | (0.16 | ) | | | (0.01 | ) | | | (0.15 | ) |
| | (0.20 | ) | | | (0.05 | ) | | | (0.23 | ) |
| | | | | | | | | | | |
| $ | 9.62 | | | $ | 10.22 | | | $ | 9.78 | |
| | | | | | | | | | | |
| | (3.95 | %) | | | 5.05 | % | | | 2.33 | % |
| | | | | | | | | | | |
| $ | 5,020 | | | $ | 4,232 | | | $ | 342 | |
| | | | | | | | | | | |
| | | | | | | | | | | |
| | 3.27 | % | | | 3.12 | % | | | 3.31 | % |
| | 2.46 | % | | | 2.50 | % | | | 2.82 | % |
| | 2.44 | % | | | 2.44 | % | | | 2.44 | % |
| | (0.37 | )%(f) | | | 0.32 | % | | | 0.95 | % |
| | | | | | | | | | | |
| | 451 | % | | | 340 | % | | | 336 | % |
| | |
| Annual Report | May 31, 2015 | 117 |
| The Arbitrage Event-Driven Fund – Class A |
| Selected Per Share Data and Ratios for a Share Outstanding Throughout the Periods Presented: |
| |
| Net asset value, beginning of period |
| Income (loss) from investment operations |
Net investment income (loss)(b) |
| Net realized and unrealized gains (losses) on investments and foreign currencies |
| Total from investment operations |
| |
| Less distributions |
| From net investment income |
| From net realized gains |
| Total distributions |
| |
| Net asset value, end of period |
| |
Total return(c) |
| |
| Net assets, end of period (in 000s) |
| |
| RATIOS TO AVERAGE NET ASSETS: |
| Expenses including interest and dividend expense |
Expenses excluding interest and dividend expense(g)(f) |
Expenses after advisory fees waived and expenses reimbursed excluding interest and dividend expense(g)(f) |
| Net investment income (loss) |
| |
| Portfolio turnover rate |
(a) | Commenced operations on June 1, 2013. |
(b) | Per share amounts were calculated using average shares outstanding for the year. |
(c) | Amount rounds to less than $0.01 per share. |
(d) | Total return is a measure of the change in the value of an investment in the Fund over the years covered, which assumes any dividends or capital gains distributions are reinvested in shares of the Fund. Returns shown do not reflect the deduction of taxes a shareholder would pay on Fund distributions or the redemption of Fund shares. |
(e) | Dividend expense totaled 0.55% and 0.49% of average net assets for the years ended May 31, 2015 and 2014, respectively. |
(f) | Interest rebate expense and line of credit interest expense totaled 0.26% and 0.13% of average net assets for the years ended May 31, 2015 and 2014, respectively. |
(g) | The amount shown for a share outstanding throughout the period may not correlate with the Statement of Operations for the period due to timing of sales and redemptions of Fund shares in relation to income earned and/or fluctuating market value of the investments of the Fund. |
| See Notes to Financial Statements. | |
| 118 | www.arbitragefunds.com | 1-800-295-4485 |
| Year Ended | | | Year Ended | |
| May 31, 2015 | | | May 31, 2014(a) | |
| $ | 10.30 | | | $ | 9.80 | |
| | | | | | | |
| | 0.03 | | | | 0.10 | |
| | (0.36 | ) | | | 0.47 | |
| | (0.33 | ) | | | 0.57 | |
| | | | | | | |
| | (0.08 | ) | | | (0.06 | ) |
| | (0.16 | ) | | | (0.01 | ) |
| | (0.24 | ) | | | (0.07 | ) |
| | – | | | | 0.00 | (c) |
| | | | | | | |
| $ | 9.73 | | | $ | 10.30 | |
| | | | | | | |
| | (3.22 | %) | | | 5.85 | % |
| | | | | | | |
| $ | 5,341 | | | $ | 3,830 | |
| | | | | | | |
| | 2.52 | % | | | 2.36 | % |
| | 1.71 | % | | | 1.74 | % |
| | 1.69 | % | | | 1.69 | % |
| | 0.35 | %(g) | | | 0.98 | % |
| | | | | | | |
| | 451 | % | | | 340 | % |
| | |
| Annual Report | May 31, 2015 | 119 |
| The Arbitrage Credit Opportunities Fund – Class R |
| Selected Per Share Data and Ratios for a Share Outstanding Throughout the Periods Presented: |
| |
| Net asset value, beginning of period |
| Income (loss) from investment operations |
Net investment income (loss)(b) |
| Net realized and unrealized gains (losses) on investments and foreign currencies |
| Total from investment operations |
| |
| Less distributions |
| From net investment income |
| From net realized gains |
| Total distributions |
| |
| Net asset value, end of period |
| |
Total return(c) |
| |
| Net assets, end of period (in 000s) |
| |
| RATIOS TO AVERAGE NET ASSETS: |
| Expenses including interest and dividend expense |
Expenses excluding interest and dividend expense(g)(f) |
| Expenses after advisory fees waived and expenses reimbursed excluding interest and dividend expense(g)(f) |
| Net investment income (loss) |
| |
| Portfolio turnover rate |
(a) | Commenced operations on October 1, 2012. |
(b) | Per share amounts were calculated using average shares outstanding for the year. |
(c) | Amount rounds to less than $0.01 per share. |
(d) | Total return is a measure of the change in the value of an investment in the Fund over the years covered, which assumes any dividends or capital gains distributions are reinvested in shares of the Fund. Returns shown do not reflect the deduction of taxes a shareholder would pay on Fund distributions or the redemption of Fund shares. |
(e) | Not Annualized. |
(f) | Annualized. |
(g) | Dividend expense totaled 0.06%, 0.10% and 0.03% (annualized) of average net assets for the years ended May 31, 2015, 2014 and the period ended May 31, 2013, respectively. |
(h) | Interest rebate expense and line of credit interest expense totaled 0.47%, 0.07% and 0.02% (annualized) of average net assets for the years ended May 31, 2015, 2014 and the period ended May 31, 2013, respectively. |
| See Notes to Financial Statements. | |
| 120 | www.arbitragefunds.com | 1-800-295-4485 |
| Year Ended | | | Year Ended | | | Period Ended | |
| May 31, 2015 | | | May 31, 2014 | | | May 31, 2013(a) | |
| $ | 10.28 | | | $ | 10.18 | | | $ | 10.00 | |
| | | | | | | | | | | |
| | 0.28 | | | | 0.40 | | | | 0.17 | |
| | (0.29 | ) | | | 0.08 | | | | 0.06 | |
| | (0.01 | ) | | | 0.48 | | | | 0.23 | |
| | | | | | | | | | | |
| | (0.32 | ) | | | (0.39 | ) | | | (0.05 | ) |
| | (0.32 | ) | | | (0.39 | ) | | | (0.05 | ) |
| | 0.00 | (c) | | | 0.01 | | | | 0.00 | (c) |
| | | | | | | | | | | |
| $ | 9.95 | | | $ | 10.28 | | | $ | 10.18 | |
| | | | | | | | | | | |
| | (0.10 | %) | | | 4.99 | % | | | 2.33 | %(e) |
| | | | | | | | | | | |
| $ | 22,728 | | | $ | 6,393 | | | $ | 1,671 | |
| | | | | | | | | | | |
| | 2.27 | % | | | 2.71 | % | | | 3.79 | %(f) |
| | 1.74 | % | | | 2.54 | % | | | 3.74 | %(f) |
| | 1.50 | % | | | 1.50 | % | | | 1.50 | %(f) |
| | 2.84 | % | | | 3.97 | % | | | 2.49 | %(f) |
| | | | | | | | | | | |
| | 191 | % | | | 181 | % | | | 92 | %(e) |
| | |
| Annual Report | May 31, 2015 | 121 |
| The Arbitrage Credit Opportunities Fund – Class I |
| Selected Per Share Data and Ratios for a Share Outstanding Throughout the Periods Presented: |
| |
| Net asset value, beginning of period |
| Income (loss) from investment operations |
Net investment income (loss)(b) |
| Net realized and unrealized gains (losses) on investments and foreign currencies |
| Total from investment operations |
| |
| Less distributions |
| From net investment income |
| From net realized gains |
| Total distributions |
| |
| Net asset value, end of period |
| |
Total return(c) |
| |
| Net assets, end of period (in 000s) |
| |
| RATIOS TO AVERAGE NET ASSETS: |
| Expenses including interest and dividend expense |
Expenses excluding interest and dividend expense(g)(f) |
| Expenses after advisory fees waived and expenses reimbursed excluding interest and dividend expense(g)(f) |
| Net investment income (loss) |
| |
| Portfolio turnover rate |
(a) | Commenced operations on October 1, 2012. |
(b) | Per share amounts were calculated using average shares outstanding for the year. |
(c) | Amount rounds to less than $0.01 per share. |
(d) | Total return is a measure of the change in the value of an investment in the Fund over the years covered, which assumes any dividends or capital gains distributions are reinvested in shares of the Fund. Returns shown do not reflect the deduction of taxes a shareholder would pay on Fund distributions or the redemption of Fund shares. |
(e) | Not Annualized. |
(f) | Annualized. |
(g) | Dividend expense totaled 0.06%, 0.10% and 0.03% (annualized) of average net assets for the years ended May 31, 2015, 2014 and the period ended May 31, 2013, respectively. |
(h) | Interest rebate expense and line of credit interest expense totaled 0.47%, 0.07% and 0.01% (annualized) of average net assets for the years ended May 31, 2015, 2014 and the period ended May 31, 2013, respectively. |
| See Notes to Financial Statements. | |
| 122 | www.arbitragefunds.com | 1-800-295-4485 |
| Year Ended | | | Year Ended | | | Period Ended | |
| May 31, 2015 | | | May 31, 2014 | | | May 31, 2013(a) | |
| $ | 10.25 | | | $ | 10.16 | | | $ | 10.00 | |
| | | | | | | | | | | |
| | 0.33 | | | | 0.42 | | | | 0.17 | |
| | (0.31 | ) | | | 0.08 | | | | 0.08 | |
| | 0.02 | | | | 0.50 | | | | 0.25 | |
| | | | | | | | | | | |
| | (0.34 | ) | | | (0.41 | ) | | | (0.09 | ) |
| | (0.34 | ) | | | (0.41 | ) | | | (0.09 | ) |
| | 0.00 | (c) | | | 0.00 | (c) | | | – | |
| | | | | | | | | | | |
| $ | 9.93 | | | $ | 10.25 | | | $ | 10.16 | |
| | | | | | | | | | | |
| | 0.16 | % | | | 5.08 | % | | | 2.49 | %(e) |
| | | | | | | | | | | |
| $ | 46,118 | | | $ | 23,039 | | | $ | 3,462 | |
| | | | | | | | | | | |
| | 2.04 | % | | | 2.37 | % | | | 3.64 | %(f) |
| | 1.51 | % | | | 2.20 | % | | | 3.60 | %(f) |
| | 1.25 | % | | | 1.25 | % | | | 1.25 | %(f) |
| | 3.28 | % | | | 4.16 | % | | | 2.62 | %(f) |
| | | | | | | | | | | |
| | 191 | % | | | 181 | % | | | 92 | %(e) |
| | |
| Annual Report | May 31, 2015 | 123 |
| The Arbitrage Credit Opportunities Fund – Class C |
| Selected Per Share Data and Ratios for a Share Outstanding Throughout the Periods Presented: |
| |
| Net asset value, beginning of period |
| Income (loss) from investment operations |
Net investment income (loss)(b) |
| Net realized and unrealized gains (losses) on investments and foreign currencies |
| Total from investment operations |
| |
| Less distributions |
| From net investment income |
| From net realized gains |
| Total distributions |
| |
| Net asset value, end of period |
| |
Total return(c) |
| |
| Net assets, end of period (in 000s) |
| |
| RATIOS TO AVERAGE NET ASSETS: |
| Expenses including interest and dividend expense |
Expenses excluding interest and dividend expense(h)(g) |
Expenses after advisory fees waived and expenses reimbursed excluding interest and dividend expense(h)(g) |
| Net investment income (loss) |
| |
| Portfolio turnover rate |
(a) | Commenced operations on October 1, 2012. |
(b) | Per share amounts were calculated using average shares outstanding for the year. |
(c) | Total return is a measure of the change in the value of an investment in the Fund over the years covered, which assumes any dividends or capital gains distributions are reinvested in shares of the Fund. Returns shown do not reflect the deduction of taxes a shareholder would pay on Fund distributions or the redemption of Fund shares. |
(d) | Not Annualized. |
(e) | Annualized. |
(f) | Dividend expense totaled 0.06%, 0.10% and 0.03% (annualized) of average net assets for the years ended May 31, 2015, 2014 and the period ended May 31, 2013, respectively. |
(g) | Interest rebate expense and line of credit interest expense totaled 0.47%, 0.07% and 0.01% (annualized) of average net assets for the years ended May 31, 2015, 2014 and the period ended May 31, 2013, respectively. |
| See Notes to Financial Statements. | |
| 124 | www.arbitragefunds.com | 1-800-295-4485 |
| Year Ended | | | Year Ended | | | Period Ended | |
| May 31, 2015 | | | May 31, 2014 | | | May 31, 2013(a) | |
| $ | 10.23 | | | $ | 10.17 | | | $ | 10.00 | |
| | | | | | | | | | | |
| | 0.22 | | | | 0.34 | | | | 0.11 | |
| | (0.30 | ) | | | 0.07 | | | | 0.09 | |
| | (0.08 | ) | | | 0.41 | | | | 0.20 | |
| | | | | | | | | | | |
| | (0.26 | ) | | | (0.35 | ) | | | (0.03 | ) |
| | (0.26 | ) | | | (0.35 | ) | | | (0.03 | ) |
| | | | | | | | | | | |
| $ | 9.89 | | | $ | 10.23 | | | $ | 10.17 | |
| | | | | | | | | | | |
| | (0.76 | %) | | | 4.17 | % | | | 2.01 | %(d) |
| | | | | | | | | | | |
| $ | 2,020 | | | $ | 716 | | | $ | 26 | |
| | | | | | | | | | | |
| | 3.05 | % | | | 3.37 | % | | | 4.69 | %(e) |
| | 2.52 | % | | | 3.20 | % | | | 4.64 | %(e) |
| | 2.25 | % | | | 2.25 | % | | | 2.25 | %(e) |
| | 2.24 | % | | | 3.37 | % | | | 1.58 | %(e) |
| | | | | | | | | | | |
| | 191 | % | | | 181 | % | | | 92 | %(d) |
| | |
| Annual Report | May 31, 2015 | 125 |
| The Arbitrage Credit Opportunities Fund – Class A |
Selected Per Share Data and Ratios for a Share Outstanding Throughout the Periods Presented:
| Net asset value, beginning of period |
| Income (loss) from investment operations |
Net investment income(b) |
| Net realized and unrealized gains (losses) on investments and foreign currencies |
| Total from investment operations |
| |
| Less distributions |
| From net investment income |
| Total distributions |
| |
| Net asset value, end of period |
| |
Total return(c) |
| |
| Net assets, end of period (in 000s) |
| |
| RATIOS TO AVERAGE NET ASSETS: |
| Expenses including interest and dividend expense |
Expenses excluding interest and dividend expense(d)(e) |
Expenses after advisory fees waived and expenses reimbursed excluding interest and dividend expense(d)(e) |
| Net investment income |
| Portfolio turnover rate |
(a) | Commenced operations on June 1, 2013. |
(b) | Per share amounts were calculated using average shares outstanding for the year. |
(c) | Total return is a measure of the change in the value of an investment in the Fund over the years covered, which assumes any dividends or capital gains distributions are reinvested in shares of the Fund. Returns shown do not reflect the deduction of taxes a shareholder would pay on Fund distributions or the redemption of Fund shares. |
(d) | Dividend expense totaled 0.06% and 0.10% of average net assets for the years ended May 31, 2015 and 2014, respectively. |
(e) | Interest rebate expense and line of credit interest expense totaled 0.47% and 0.07% of average net assets for the years ended May 31, 2015 and 2014, respectively. |
| See Notes to Financial Statements. | |
| 126 | www.arbitragefunds.com | 1-800-295-4485 |
| Year Ended | | | Year Ended | |
| May 31, 2015 | | | May 31, 2014(a) | |
| $ | 10.25 | | | $ | 10.18 | |
| | | | | | | |
| | 0.29 | | | | 0.39 | |
| | (0.29 | ) | | | 0.09 | |
| | – | | | | 0.48 | |
| | | | | | | |
| | (0.32 | ) | | | (0.41 | ) |
| | (0.32 | ) | | | (0.41 | ) |
| | | | | | | |
| $ | 9.93 | | | $ | 10.25 | |
| | | | | | | |
| | (0.01 | )% | | | 4.86 | % |
| | | | | | | |
| $ | 630 | | | $ | 28 | |
| | | | | | | |
| | | | | | | |
| | 2.29 | % | | | 2.77 | % |
| | 1.76 | % | | | 2.60 | % |
| | 1.50 | % | | | 1.50 | % |
| | 2.95 | % | | | 3.89 | % |
| | | | | | | |
| | 191 | % | | | 181 | % |
| Annual Report | May 31, 2015 | 127 |
| The Arbitrage Tactical Equity Fund – Class R | Financial Highlights |
| Selected Per Share Data and Ratios for a Share Outstanding Throughout the Period Presented: | | | |
| | | Period Ended | |
| | | May 31, 2015(a) | |
| Net asset value, beginning of period | | $ | 10.00 | |
| Income (loss) from investment operations | | | | |
Net investment loss(b) | | | (0.10 | ) |
| Net realized and unrealized gains on investments and foreign currencies | | | 0.22 | |
| Total from investment operations | | | 0.12 | |
| | | | | |
| Net asset value, end of period | | $ | 10.12 | |
| | | | | |
Total return(c) | | | 1.20 | %(d) |
| | | | | |
| Net assets, end of period (in 000s) | | $ | 10 | |
| | | | | |
| RATIOS TO AVERAGE NET ASSETS: | | | | |
| Expenses including interest and dividend expense | | | 44.48 | %(e) |
Expenses excluding interest and dividend expense(f)(g) | | | 43.32 | %(e) |
Expenses after advisory fees waived and expenses reimbursed excluding interest and dividend expense(f)(g) | | | 1.69 | %(e) |
| Net investment loss | | | (2.35 | )%(e) |
| | | | | |
| Portfolio turnover rate | | | 235 | %(d) |
(a) | Commenced operations on January 2, 2015. |
(b) | Per share amount was calculated using average shares outstanding for the period. |
(c) | Total return is a measure of the change in the value of an investment in the Fund over the years covered, which assumes any dividends or capital gains distributions are reinvested in shares of the Fund. Return shown does not reflect the deduction of taxes a shareholder would pay on Fund distributions or the redemption of Fund shares. |
(d) | Not annualized. |
(e) | Annualized. |
(f) | Dividend expense totaled 1.01% (annualized) of average net assets for the period ended May 31, 2015. |
(g) | Interest rebate expense and line of credit interest expense totaled 0.15% (annualized) of average net assets for the period ended May 31, 2015. |
| See Notes to Financial Statements. | |
| 128 | www.arbitragefunds.com | 1-800-295-4485 |
| The Arbitrage Tactical Equity Fund – Class I | Financial Highlights |
| Selected Per Share Data and Ratios for a Share Outstanding Throughout the Period Presented: | | | |
| | | Period Ended | |
| | | May 31, 2015(a) | |
| Net asset value, beginning of period | | $ | 10.00 | |
| Income (loss) from investment operations | | | | |
Net investment loss(b) | | | (0.09 | ) |
| Net realized and unrealized gains on investments and foreign currencies | | | 0.21 | |
| Total from investment operations | | | 0.12 | |
| | | | | |
| Net asset value, end of period | | $ | 10.12 | |
| | | | | |
Total return(c) | | | 1.20 | %(d) |
| | | | | |
| Net assets, end of period (in 000s) | | $ | 1,386 | |
| | | | | |
| RATIOS TO AVERAGE NET ASSETS: | | | | |
| Expenses including interest and dividend expense | | | 28.08 | %(e) |
Expenses excluding interest and dividend expense(f)(g) | | | 26.92 | %(e) |
Expenses after advisory fees waived and expenses reimbursed excluding interest and dividend expense(f)(g) | | | 1.44 | %(e) |
| Net investment loss | | | (2.15 | )%(e) |
| | | | | |
| Portfolio turnover rate | | | 235 | %(d) |
(a) | Commenced operations on January 2, 2015. |
(b) | Per share amount was calculated using average shares outstanding for the period. |
(c) | Total return is a measure of the change in the value of an investment in the Fund over the years covered, which assumes any dividends or capital gains distributions are reinvested in shares of the Fund. Return shown does not reflect the deduction of taxes a shareholder would pay on Fund distributions or the redemption of Fund shares. |
(d) | Not annualized. |
(e) | Annualized. |
(f) | Dividend expense totaled 1.01% (annualized) of average net assets for the period ended May 31, 2015. |
(g) | Interest rebate expense and line of credit interest expense totaled 0.15% (annualized) of average net assets for the period ended May 31, 2015. |
| See Notes to Financial Statements. | |
| Annual Report | May 31, 2015 | 129 |
| The Arbitrage Tactical Equity Fund – Class C | Financial Highlights |
| Selected Per Share Data and Ratios for a Share Outstanding Throughout the Period Presented: | | | |
| | | Period Ended | |
| | | May 31, 2015(a) | |
| Net asset value, beginning of period | | $ | 10.00 | |
| Income (loss) from investment operations | | | | |
Net investment loss(b) | | | (0.13 | ) |
| Net realized and unrealized gains on investments and foreign currencies | | | 0.25 | |
| Total from investment operations | | | 0.12 | |
| | | | | |
| Net asset value, end of period | | $ | 10.12 | |
| | | | | |
Total return(c) | | | 1.20 | %(d) |
| | | | | |
| Net assets, end of period (in 000s) | | $ | 10 | |
| | | | | |
| RATIOS TO AVERAGE NET ASSETS: | | | | |
| Expenses including interest and dividend expense | | | 45.25 | %(e) |
Expenses excluding interest and dividend expense(f)(g) | | | 44.09 | %(e) |
Expenses after advisory fees waived and expenses reimbursed excluding interest and dividend expense(f)(g) | | | 2.44 | %(e) |
| Net investment loss | | | (3.10 | )%(e) |
| | | | | |
| Portfolio turnover rate | | | 235 | %(d) |
(a) | Commenced operations on January 2, 2015. |
(b) | Per share amount was calculated using average shares outstanding for the period. |
(c) | Total return is a measure of the change in the value of an investment in the Fund over the years covered, which assumes any dividends or capital gains distributions are reinvested in shares of the Fund. Return shown does not reflect the deduction of taxes a shareholder would pay on Fund distributions or the redemption of Fund shares. |
(d) | Not annualized. |
(e) | Annualized. |
(f) | Dividend expense totaled 1.01% (annualized) of average net assets for the period ended May 31, 2015. |
(g) | Interest rebate expense and line of credit interest expense totaled 0.15% (annualized) of average net assets for the period ended May 31, 2015. |
| See Notes to Financial Statements. | |
| 130 | www.arbitragefunds.com | 1-800-295-4485 |
| The Arbitrage Tactical Equity Fund – Class A | Financial Highlights |
| Selected Per Share Data and Ratios for a Share Outstanding Throughout the Period Presented: | | | |
| | | Period Ended | |
| | | May 31, 2015(a) | |
| Net asset value, beginning of period | | $ | 10.00 | |
| Income (loss) from investment operations | | | | |
Net investment loss(b) | | | (0.10 | ) |
| Net realized and unrealized gains on investments and foreign currencies | | | 0.22 | |
| Total from investment operations | | | 0.12 | |
| | | | | |
| Net asset value, end of period | | $ | 10.12 | |
| | | | | |
Total return(c) | | | 1.20 | %(d) |
| | | | | |
| Net assets, end of period (in 000s) | | $ | 10 | |
| | | | | |
| RATIOS TO AVERAGE NET ASSETS: | | | | |
| Expenses including interest and dividend expense | | | 44.49 | %(e) |
Expenses excluding interest and dividend expense(f)(g) | | | 43.33 | %(e) |
Expenses after advisory fees waived and expenses reimbursed excluding interest and dividend expense(f)(g) | | | 1.69 | %(e) |
| Net investment loss | | | (2.35 | )%(e) |
| | | | | |
| Portfolio turnover rate | | | 235 | %(d) |
(a) | Commenced operations on January 2, 2015. |
(b) | Per share amount was calculated using average shares outstanding for the period. |
(c) | Total return is a measure of the change in the value of an investment in the Fund over the years covered, which assumes any dividends or capital gains distributions are reinvested in shares of the Fund. Return shown does not reflect the deduction of taxes a shareholder would pay on Fund distributions or the redemption of Fund shares. |
(d) | Not annualized. |
(e) | Annualized. |
(f) | Dividend expense totaled 1.01% (annualized) of average net assets for the period ended May 31, 2015. |
(g) | Interest rebate expense and line of credit interest expense totaled 0.15% (annualized) of average net assets for the period ended May 31, 2015. |
| See Notes to Financial Statements. | |
| Annual Report | May 31, 2015 | 131 |
| The Arbitrage Funds | Notes to Financial Statements |
| | May 31, 2015 |
The Arbitrage Funds (the “Trust”) was organized as a Delaware business trust on December 22, 1999 and is registered under the Investment Company Act of 1940, as amended (the “1940 Act”), as an open-end management investment company issuing its shares in series, each series representing a distinct portfolio with its own investment objective and policies. The four series presently authorized are The Arbitrage Fund (the “Arbitrage Fund”), The Arbitrage Event-Driven Fund (the “Event-Driven Fund”), The Arbitrage Credit Opportunities Fund (the “Credit Opportunities Fund”) and The Arbitrage Tactical Equity Fund (the “Tactical Equity Fund”), each a “Fund” and collectively the “Funds”, which offer four classes of shares. The Arbitrage Fund, the Event-Driven Fund and the Credit Opportunities Fund are each a diversified series of the Trust. The Tactical Equity Fund is a non-diversified series of the trust. Class R shares, Class I shares, Class C shares and Class A shares of the Arbitrage Fund commenced operations on September 18, 2000, October 17, 2003 June 1, 2012, and June 1, 2013, respectively. Class R shares, Class I shares, Class C shares and Class A shares of the Event-Driven Fund commenced operations on October 1, 2010, October 1, 2010, June 1, 2012 and June 1, 2013, respectively. Class R shares, Class I and Class C shares of the Credit Opportunities Fund commenced operations on October 1, 2012 and Class A shares commenced operations on June 1, 2013. Class R shares, Class I shares, Class C shares and Class A shares of the Tactical Equity Fund commenced operations on January 2, 2015.
The investment objective of the Arbitrage Fund seeks to achieve capital growth by engaging in merger arbitrage. The investment objective of the Event-Driven Fund seeks to achieve capital growth by investing in companies that are impacted by corporate events such as mergers, acquisitions, restructurings, recapitalizations, refinancings, reorganizations and other special situations. The investment objective of the Credit Opportunities Fund seeks to provide current income and capital growth, by investing in debt securities impacted by events such as reorganizations, restructurings, recapitalizations, debt maturities, refinancings, mergers, acquisitions, regulatory changes and other special situations. The investment objective of the Tactical Equity Fund seeks to achieve capital appreciation by investing in securities of companies where the market may not fully appreciate the impact of fundamental changes to the business, industry or regulatory environment.
The Funds’ four classes of shares, Class R, Class I, Class C and Class A, represent interests in the same portfolio of investments and have the same rights, but differ primarily in the expenses to which they are subject and the investment eligibility requirements. Class R shares, Class C shares and Class A shares are subject to an annual distribution fee of up to 0.25%, 1.00% and 0.25%, respectively, of each Fund’s average daily net assets attributable to Class R shares, Class C shares and Class A shares, respectively, whereas Class I shares are not subject to any distribution fees. Class C shares are also subject to a 1.00% contingent deferred sales charge on all purchases redeemed in 12 months of purchase. Class A shares of the Arbitrage Fund are sold subject to a maximum front-end sales load equal to 2.50% of the offering price and are also subject to a 0.50% contingent deferred sales load on purchases at or above $250,000, purchased without a front-end sales charge and redeemed within 12 months of purchase. Class A shares of the Event-Driven Fund, the Credit Opportunities Fund and the Tactical Equity Fund are sold subject to a maximum front-end sales load equal to 3.25% of the offering price and are also subject to a 1.00% contingent deferred sales load on purchases at or above $500,000, purchased without a front-end sales charge and redeemed within 18 months of purchase.
| | |
| 132 | www.arbitragefunds.com | 1-800-295-4485 |
| The Arbitrage Funds | Notes to Financial Statements (continued) |
| | May 31, 2015 |
| 2. SIGNIFICANT ACCOUNTING POLICIES |
The following is a summary of significant accounting policies followed by the Funds. These policies are in conformity with U.S. generally accepted accounting principles (“GAAP”). The Funds are considered investment companies for financial reporting purposes under GAAP and Accounting Standards Codification Topic 946 - Investment Companies.
Use of Estimates — The preparation of financial statements in conformity with GAAP requires management to make estimates and assumptions that affect the reported amounts of assets and liabilities at the date of the financial statements and the reported amounts of increases and decreases in net assets from operations during the reporting period. Actual results could differ from those estimates.
Valuation of Investments — The Funds’ portfolio securities are valued as of the close of trading of the New York Stock Exchange (“NYSE”) (normally 4:00 p.m., Eastern time). Common stocks and other securities, including open short positions that are traded on a securities exchange, are valued at the last quoted sales price at the close of regular trading on the day the valuation is made. Securities which are quoted by NASDAQ are valued at the NASDAQ Official Closing Price. Price information on listed stocks is taken from the exchange where the security is primarily traded. Securities which are listed on an exchange but which are not traded on the valuation date are valued at the mean of the most recent bid and asked prices. Put and call options and securities traded in the over-the-counter market are valued at the mean of the most recent bid and asked prices. When there is no bid price available, put and call options will be valued using the average of the last ask price and zero. Foreign currency forward contracts are valued at the current day’s interpolated foreign exchange rate, as calculated using the current day’s spot rate, and the thirty, sixty, ninety and one-hundred eighty day forward rates provided by an independent source. Bank loans are valued at the composite mid-price which is calculated using the simple average of the dealer marks. If available, debt securities are priced based upon an evaluated bid provided by independent, third-party pricing agents. The third-party pricing agents may also value debt securities at an evaluated bid price by employing methodologies that utilize actual market transactions, broker-supplied valuations, or other methodologies designed to identify the market value for such securities. Unlisted securities for which market quotations are readily available are valued at the latest quoted bid price. Swap contracts that are listed or traded on a national securities exchange, commodities exchange, contract market or comparable over-the-counter market, and that are freely transferable, are valued at their closing settlement price on the exchange on which they are primarily traded or based upon the current settlement price for a like instrument acquired on the day on which the instrument is being valued. Over-the-counter swap contracts for which market quotations are readily available are valued based on quotes received from independent pricing services or one or more dealers that make markets in such securities. Other assets and securities for which no quotations are readily available are valued at fair value as determined in good faith under the supervision of the Board of Trustees of the Trust. Some of the more common reasons that may necessitate that a security be valued at fair value include: the security’s trading has been halted or suspended; the security has been delisted from a national exchange; the security’s primary trading market is temporarily closed at a time when under normal conditions it would be open; or the security’s primary pricing source is not able or willing to provide a price. Such methods of fair valuation may include, but are not limited to: multiple of earnings, multiple of book value, discount from market of a similar freely traded security, purchase price of a security, subsequent private transactions in the security or related securities, or a combination of these and other factors. Foreign securities are translated from the local currency into U.S. dollars using currency exchange rates supplied by a quotation service (see Note 8).
| Annual Report | May 31, 2015 | 133 |
| The Arbitrage Funds | Notes to Financial Statements (continued) |
| | May 31, 2015 |
Fair Value Measurements — In accordance with the authoritative guidance on fair value measurements under GAAP, the Funds disclose fair value of their investments in a hierarchy that prioritizes the inputs to valuation techniques used to measure the fair value. The objective of a fair value measurement is to determine the price that would be received to sell an asset or paid to transfer a liability in an orderly transaction between market participants at the measurement date (an exit price). Accordingly, the fair value hierarchy gives the highest priority to quoted prices (unadjusted) in active markets for identical assets or liabilities (Level 1) and the lowest priority to unobservable inputs (Level 3). The guidance establishes three levels of the fair value hierarchy as follows:
Level 1 — | Unadjusted quoted prices in active markets for identical, unrestricted assets or liabilities that the Funds have the ability to access at the measurement date; |
Level 2 — | Observable inputs other than quoted prices included in Level 1 that are observable (either directly or indirectly) for substantially the full term of the asset or liability; and |
Level 3 — | Unobservable inputs for the asset or liability, to the extent relevant observable inputs are not available, representing each Fund’s own as sumption about the assumptions a market participant would use in valuing the asset or liability, and would be based on the best information available. |
Investments are classified within the level of the lowest significant input considered in determining fair value. Investments classified within Level 3, whose fair value measurement considers several inputs, may include Level 1 or Level 2 inputs as components of the overall fair value measurement. The inputs or methodology used for valuing securities are not necessarily an indication of the risk associated with investing in those securities. The Funds recognize transfers between levels as of the beginning of the annual period in which the transfer occurred.
For the period ended May 31, 2015, there were no significant changes to the Funds’ fair value methodologies. Additionally, during the period ended May 31, 2015, there were no transfers between level 1 and 2 securities. Transfers for level 3 securities, if any, are shown as part of the leveling table in the Portfolio of Investments.
Share Valuation and Redemption Fees — The net asset value per share of each class of shares of the Funds is calculated daily by dividing the total value of a Fund’s assets attributable to that class, less liabilities attributable to that class, by the number of shares of that class outstanding. The offering price and redemption price per share of each class of each Fund is equal to the net asset value per share, except that, shares of Class R, Class I and Class A are subject to a redemption fee of 2% if redeemed within 30 days for the Arbitrage Fund, Event-Driven Fund and Tactical Equity Fund and 60 days for the Credit Opportunities Fund from the date of purchase. The Class A redemption fee does not apply for purchases over $250,000 in the Arbitrage Fund and purchases over $500,000 in the Event-Driven Fund, Credit Opportunities Fund and Tactical Equity Fund, as these purchases are subject to a contingent deferred sales charge. Class C shares are not subject to a redemption fee. For the year ended May 31, 2015, proceeds from redemption fees in the Arbitrage Fund were $14,505 in Class R, $7,720 in Class I and $0 in Class A. For the year ended May 31, 2015, proceeds from redemption fees in the Event-Driven Fund were $3,548 in Class R, $10,415 in Class I and $0 in Class A. For the year ended May 31, 2015, proceeds from redemption fees in the Credit Opportunities Fund were $210 in Class R, $24 in Class I and $0 in Class A. For the period ended May 31, 2015, there were no proceeds from redemption fees in the Tactical Equity Fund. The redemption fee is paid directly to each Fund rather than the Adviser and is allocated pro-rata to the shareholders based on net assets attributed to the class.
| 134 | www.arbitragefunds.com | 1-800-295-4485 |
| The Arbitrage Funds | Notes to Financial Statements (continued) |
| | May 31, 2015 |
Security Transactions — Security transactions are accounted for on trade date. Gains and losses on securities sold are determined on a specific identification basis.
Short Positions — The Funds may sell securities short for economic hedging purposes. Subsequent fluctuations in the market prices of securities sold short may require purchasing the securities at prices which may differ from the market value reflected on the Portfolio of Investments. The Funds are liable for any dividends and interest payable on securities while those securities are in a short position. As collateral for their short positions, the Funds are required under the 1940 Act to maintain assets consisting of cash, cash equivalents or liquid securities. The amount of the collateral is required to be adjusted daily to reflect changes in the value of the securities sold short. The Funds are charged an interest rebate expense by the prime broker on securities sold short. The interest rebate expense is charged for the duration of time that a security is sold short and is shown on the Statements of Operations.
Derivative Instruments and Hedging Activities — The following discloses the Funds’ use of derivative instruments and hedging activities.
The Funds’ investment objectives not only permit the Funds to purchase investment securities, but they also allow certain Funds to enter into various types of derivative contracts, including, but not limited to, swap contracts, forward foreign currency exchange contracts, and purchased and written options. In doing so, the Funds will employ strategies in differing combinations to permit them to increase, decrease, or change the level or types of exposure to market factors. Central to those strategies are features inherent to derivatives that make them more attractive for this purpose than equity or debt securities: they require little or no initial cash investment; they can focus exposure on only certain selected risk factors; and they may not require the ultimate receipt or delivery of the underlying security (or securities) to satisfy the contract. This may allow the Funds to pursue their objectives more quickly and efficiently than if they were to make direct purchases or sales of securities capable of effecting a similar response to market factors.
Market Risk Factors: In pursuit of their investment objectives, the Funds may seek to use derivatives to increase or decrease their exposure to the following market risk factors:
Equity Risk: Equity risk relates to the change in value of equity securities as they relate to increases or decreases in the general market.
Interest Rate Risk: Interest rate risk refers to the fluctuations in value of fixed-income securities resulting from the inverse relationship between price and yield. For example, an increase in general interest rates will tend to reduce the market value of fixed income investments, and a decline in general interest rates will tend to increase the value of such investments. In addition, debt securities with longer maturities, which tend to have higher yields, are subject to potentially greater fluctuations in value from changes in interest rates than obligations with shorter maturities.
| | |
| Annual Report | May 31, 2015 | 135 |
| The Arbitrage Funds | Notes to Financial Statements (continued) |
| | May 31, 2015 |
Foreign Exchange Rate Risk: Foreign exchange rate risk relates to the change in the U.S. dollar value of a security held that is denominated in a foreign currency. The value of a foreign currency denominated security will decrease as the dollar appreciates against the currency, while the value of the foreign currency denominated security will increase as the dollar depreciates against the currency.
Credit Risk: Credit risk relates to the ability of the issuer to meet interest and principal payments, or both, as they come due. In general, lower‐grade, higher‐yield bonds are subject to credit risk to a greater extent than lower‐yield, higher‐quality bonds.
Risk of Investing in Derivatives: The Funds’ use of derivatives can result in losses due to unanticipated changes in the market risk factors and the overall market. In instances where the Funds are using derivatives to decrease or hedge exposures to market risk factors for securities held by the Funds, there are also risks that those derivatives may not perform as expected, resulting in losses for the combined or hedged positions.
Derivatives may have little or no initial cash investment relative to their market value exposure and therefore can produce significant gains or losses in excess of their cost. This use of embedded leverage allows the Funds to increase their market value exposure relative to their net assets and can substantially increase the volatility of the Funds’ performance.
Additional associated risks from investing in derivatives also exist and potentially could have significant effects on the valuation of the derivative instruments and the Funds. Typically, the associated risks are not the risks that the Funds are attempting to increase or decrease exposure to, per their investment objectives, but are the additional risks from investing in derivatives.
Examples of these associated risks are liquidity risk, which is the risk that the Funds will not be able to sell the derivative in the open market in a timely manner, and counterparty credit risk, which is the risk that the counterparty to a transaction will not fulfill its obligation to the Funds. Associated risks can be different for each type of derivative and are discussed by derivative type in the notes that follow.
Option Writing/Purchasing: Certain Funds may write or purchase option contracts to adjust risk and return of their overall investment positions. When a Fund writes or purchases an option, an amount equal to the premium received or paid by the Fund is recorded as a liability or an asset and is subsequently adjusted to the current market value of the option written or purchased. Premiums received or paid from writing or purchasing options that expire unexercised are treated by the Fund on the expiration date as realized gains or losses. The difference between the premium and the amount paid or received on effecting a closing purchase or sale transaction, including brokerage commissions, is also treated as a realized gain or loss. If an option is exercised, the premium paid or received is added to the cost of the purchase or proceeds from the sale in determining whether the Fund has realized a gain or loss on investment transactions. Risks from entering into option transactions arise from the potential inability of counterparties to meet the terms of the contracts, the potential inability to enter into closing transactions because of an illiquid secondary market and from unexpected movements in security values.
| 136 | www.arbitragefunds.com | 1-800-295-4485 |
The Arbitrage Funds | Notes to Financial Statements (continued) |
| May 31, 2015 |
A summary of put and call option contracts written in the Arbitrage Fund during the year ended May 31, 2015, is as follows:
| | | Put Contracts | | | Put Premiums | | | Call Contracts | | | Call Premiums | |
| Options outstanding at beginning of year | | | 1,097 | | | $ | 108,251 | | | | 21,722 | | | $ | 1,569,952 | |
| Options written | | | 107,190 | | | | 8,410,683 | | | | 163,244 | | | | 20,156,576 | |
| Options closed | | | (32,255 | ) | | | (4,260,819 | ) | | | (58,463 | ) | | | (4,997,666 | ) |
| Options exercised | | | (7,604 | ) | | | (937,463 | ) | | | (65,049 | ) | | | (10,021,603 | ) |
| Options expired | | | (56,922 | ) | | | (2,664,200 | ) | | | (49,799 | ) | | | (5,713,596 | ) |
| Options outstanding at end of year | | | 11,506 | | | $ | 656,452 | | | | 11,655 | | | $ | 993,663 | |
A summary of put and call option contracts written in the Event-Driven Fund during the year ended May 31, 2015, is as follows:
| | | Put Contracts | | | Put Premiums | | | Call Contracts | | | Call Premiums | |
| Options outstanding at beginning of year | | | 215 | | | $ | 11,153 | | | | 3,533 | | | $ | 203,576 | |
| Options written | | | 42,549 | | | | 3,334,819 | | | | 96,662 | | | | 6,939,104 | |
| Options closed | | | (10,212 | ) | | | (1,216,627 | ) | | | (18,982 | ) | | | (1,439,658 | ) |
| Options exercised | | | (7,182 | ) | | | (771,275 | ) | | | (30,526 | ) | | | (2,611,679 | ) |
| Options expired | | | (14,073 | ) | | | (863,400 | ) | | | (38,592 | ) | | | (2,122,274 | ) |
| Options outstanding at end of year | | | 11,297 | | | $ | 494,670 | | | | 12,095 | | | $ | 969,069 | |
A summary of put and call option contracts written in the Credit Opportunities Fund during the year ended May 31, 2015, is as follows:
| | | Put Contracts | | | Put Premiums | | | Call Contracts | | | Call Premiums | |
| Options outstanding at beginning of year | | | – | | | $ | – | | | | 22 | | | $ | 2,185 | |
| Options written | | | 250 | | | | 7,315 | | | | 40 | | | | 12,570 | |
| Options closed | | | – | | | | – | | | | (40 | ) | | | (12,570 | ) |
| Options exercised | | | – | | | | – | | | | (22 | ) | | | (2,185 | ) |
| Options outstanding at end of year | | | 250 | | | $ | 7,315 | | | | – | | | $ | – | |
| | |
| Annual Report | May 31, 2015 | 137 |
The Arbitrage Funds | Notes to Financial Statements (continued) |
| May 31, 2015 |
A summary of put and call option contracts written in the Tactical Equity Fund during the period ended May 31, 2015, is as follows:
| | | Put Contracts | | | Put Premiums | | | Call Contracts | | | Call Premiums | |
| Options outstanding at beginning of period | | | – | | | $ | – | | | | – | | | $ | – | |
| Options written | | | 35 | | | | 3,416 | | | | 53 | | | | 3,937 | |
| Options closed | | | (9 | ) | | | (1,234 | ) | | | (15 | ) | | | (698 | ) |
| Options exercised | | | (4 | ) | | | (462 | ) | | | (6 | ) | | | (378 | ) |
| Options expired | | | (13 | ) | | | (1,125 | ) | | | (20 | ) | | | (1,255 | ) |
| Options outstanding at end of period | | | 9 | | | $ | 595 | | | | 12 | | | $ | 1,606 | |
Foreign Currency Exchange Contracts: The Funds may enter into forward foreign currency exchange contracts as a way of managing foreign exchange rate risk. The Funds may enter into these contracts for the purchase or sale of a specific foreign currency at a fixed price on a future date as a hedge or cross-hedge against either specific transactions or portfolio positions. The objective of the Funds’ foreign currency hedging transactions is to reduce risk that the U.S. dollar value of the Funds’ securities denominated in foreign currency will decline in value due to changes in foreign currency exchange rates.
Warrants/Rights: Each Fund may purchase or otherwise receive warrants or rights. Warrants and rights generally give the holder the right to receive, upon exercise, a security of the issuer at a set price. Funds typically use warrants and rights in a manner similar to their use of purchased options on securities, as described in options above. Risks associated with the use of warrants and rights are generally similar to risks associated with the use of purchased options. However, warrants and rights often do not have standardized terms, and may have longer maturities and may be less liquid than exchange-traded options. In addition, the terms of warrants or rights may limit each Fund’s ability to exercise the warrants or rights at such times and in such quantities as each Fund would otherwise wish. Warrants and rights generally pay no dividends and confer no voting or other rights other than to purchase the underlying security.
Swaps: Certain Funds may enter into interest rate, index, equity, total return and credit default swap agreements, for hedging and non-hedging purposes. These transactions would be entered into in an attempt to obtain a particular return when it is considered desirable to do so, possibly at a lower cost to a Fund than if the Fund had invested directly in the asset that yielded the desired return. Swap agreements may be executed in a multilateral or other trade facility program, such as a registered exchange (“centrally cleared swaps”) or may be privately negotiated in the over-the counter market. The duration of a swap agreement typically ranges from a few weeks to more than one year. In a standard swap transaction, two parties agree to exchange the returns (or differentials in rates of return) earned or realized on particular predetermined investments or instruments, which may be adjusted for an interest factor. The gross returns to be exchanged or “swapped” between the parties are generally calculated with respect to a “notional amount” (i.e., the return on or increase in value of a particular dollar amount invested at a particular interest rate, in a particular foreign currency, or in a “basket” of securities representing a particular index). In a centrally cleared swap, immediately following execution of the swap agreement, the swap agreement is novated to a central counterparty (the “CCP”) and the Fund’s counterparty on the swap agreement becomes the CCP.
| | |
| 138 | www.arbitragefunds.com | 1-800-295-4485 |
The Arbitrage Funds | Notes to Financial Statements (continued) |
| May 31, 2015 |
Forms of swap agreements include interest rate caps, under which, in return for a premium, one party agrees to make payments to the other to the extent that interest rates exceed a specified rate, or “cap”; interest rate floors, under which, in return for a premium, one party agrees to make payments to the other to the extent that interest rates fall below a specified level, or “floor”; and interest rate collars, under which a party sells a cap and purchases a floor, or vice versa, in an attempt to protect itself against interest rate movements exceeding given minimum or maximum levels.
Credit default swaps are a type of swap agreement in which the protection “buyer” is generally obligated to pay the protection “seller” an upfront and/ or a periodic stream of payments over the term of the contract provided that no credit event, such as a default, on a reference obligation has occurred. The credit default swap agreement may have as reference obligations one or more securities that are not currently held by a Fund. If a credit event occurs, the seller generally must pay the buyer the “par value” (full notional value) of the swap in exchange for an equal face amount of deliverable obligations of the reference entity described in the swap, or the seller may be required to deliver the related net cash amount if the swap is cash settled. A Fund may be either the buyer or seller in the transaction. If a Fund is a buyer and no credit event occurs, the Fund may recover nothing if the swap is held through its termination date. However, if a credit event occurs, the buyer generally may elect to receive the full notional value of the swap in exchange for an equal face amount of deliverable obligations of the reference entity whose value may have significantly decreased. As a seller, a Fund generally receives an upfront payment and/or a fixed rate of income throughout the term of the swap provided that there is no credit event. As the seller, a Fund would effectively add leverage to its portfolio because, in addition to its total net assets, the Fund would be subject to investment exposure on the notional amount of the swap. Credit default swap agreements involve greater risks than if a Fund had invested in the reference obligation directly since, in addition to general market risks, credit default swaps are subject to illiquidity risk, counterparty risk and credit risk. A Fund will enter into credit default swap agreements only with counterparties that meet certain standards of creditworthiness or that are centrally cleared.
Total return swap agreements are contracts in which one party agrees to make periodic payments based on the change in market value of underlying assets, which may include a specified security, basket of securities, defined portfolios of bonds, loans and mortgages, or securities indexes during the specified period in return for periodic payments based on a fixed or variable interest rate or the total return from other underlying assets or indices. Total return swap agreements may be used to obtain exposure to a security or market index without owning or taking physical custody of such security or component securities of amarket index. Total return swap agreements may effectively add leverage to a Fund’s portfolio because, in addition to its total net assets, the Fund would be subject to investment exposure on the notional amount of the swap. Total return swaps are a mechanism for the user to accept the economic benefits of asset ownership without utilizing the balance sheet. The other leg of the swap, usually the London Interbank Offered Rate (LIBOR), is spread to reflect the non-balance sheet nature of the product. Total return swaps can be designed with any underlying asset agreed upon between two parties. Typically no notional amounts are exchanged with total return swaps. Total return swap agreements entail the risk that a party will default on its payment obligations to a Fund thereunder. Swap agreements also entail the risk that a Fund will not be able to meet its obligation to the counterparty. Generally, a Fund will enter into total return swaps on a net basis (i.e., the two payment streams are netted out with the Fund receiving or paying, as the case may be, only the net amount of the two payments).
| | |
| Annual Report | May 31, 2015 | 139 |
The Arbitrage Funds | Notes to Financial Statements (continued) |
| May 31, 2015 |
Most swap agreements entered into by a Fund calculate the obligations of the parties to the agreement on a “net basis.” Consequently, a Fund’s current obligations (or rights) under a swap agreement will generally be equal only to the net present value of amounts to be paid or received under the agreement based on the relative values of the positions held by each party to the agreement (the “net amount”). A Fund’s current obligations under a swap agreement will be accrued daily (offset against amounts owed to the Fund), and any accrued but unpaid net amounts owed to a swap counterparty will be covered in accordance with applicable regulatory requirements to limit any potential leveraging of a Fund’s portfolio. Any net amount accrued but not yet paid to a Fund by the counterparty under a swap agreement (i.e., the Fund’s current rights under the swap agreement) is recorded as unrealized appreciation until the amount is paid to the Fund. The Fund’s maximum risk of loss from counterparty credit risk is generally limited to the net payment to be received by the Fund and/or the termination value at the end of the contract. Obligations under swap agreements so covered will not be construed to be “senior securities” for purposes of the Funds’ investment restriction concerning senior securities.
Whether a Fund’s use of swap agreements will be successful in furthering its investment objective will depend on Management’s ability to correctly predict whether certain types of investments are likely to produce greater returns than other investments. Swap agreements that cannot be terminated or sold within seven days may be considered to be illiquid investments. Moreover, a Fund bears the risk of loss of the amount expected to be received under a swap agreement in the event of the default or bankruptcy of a swap agreement counterparty. Although centrally cleared swaps typically present less counterparty risk than non-centrally cleared swaps, a Fund that has entered into centrally cleared swaps is subject to the risk of the failure of the CCP. A Fund will enter into swap agreements only with counterparties that meet certain standards for creditworthiness (generally, such counterparties would have to be eligible counterparties under the terms of the Fund’s repurchase agreement guidelines) or that are centrally cleared. Certain restrictions imposed on the Funds by the Code may limit a Fund’s ability to use swap agreements. It is possible that developments in the swap market, including additional government regulation, could adversely affect a Fund’s ability to terminate existing swap agreements or to realize amounts to be received under such agreements.
International Swaps and Derivatives Association, Inc. Master Agreements (“ISDA Master Agreements”) govern over-the-counter financial derivative transactions entered into by a Fund and counterparty. The ISDA Master Agreements maintain provisions for general obligations, representations, agreements, collateral and events of default or termination. Events of termination include conditions that may entitle counterparties to elect to terminate early and cause settlement of all outstanding transactions under the applicable ISDA Master Agreement. Any election to terminate early could be material to the financial statements.
Swap agreements held at May 31, 2015 are disclosed in the Portfolio of Investments.
| | |
| 140 | www.arbitragefunds.com | 1-800-295-4485 |
The Arbitrage Funds | Notes to Financial Statements (continued) |
| May 31, 2015 |
Fair Value of Derivative Instruments — Fair values of derivatives presented in the financial statements are not netted with the fair value of other derivatives or with any collateral amounts posted by the Funds or any counterparty. The fair value of derivative instruments for the Funds as of May 31, 2015, was as follows:
Derivatives Not Accounted For As Hedging Instruments | | Asset Derivatives Statement of Assets and Liabilities Location | | Fair Value | | Liability Derivatives Statement of Assets
and Liabilities
Location | | Fair Value | |
| Arbitrage Fund | | | | | | | | | |
| Foreign Currency Contracts | | Unrealized appreciation on forward foreign currency exchange contracts | | $ | 3,785,890 | | Unrealized depreciation on forward foreign currency exchange contracts | | $ | 8,778,772 | |
Equity Contracts
(swap contracts) | | Unrealized appreciation on swap contracts | | | 112,866 | | | | | | |
| Equity Contracts (rights) | | Investments:
at value | | | 10,711,137 | | Investments:
at value | | | 90 | |
| Equity Contracts (purchased option contracts) | | Investments:
at value | | | 3,034,554 | | | | | | |
| Equity Contracts (written option contracts) | | | | | | | Written options, at value | | | 1,260,646 | |
| | | | | $ | 17,644,447 | | | | $ | 10,039,508 | |
| | |
| Annual Report | May 31, 2015 | 141 |
The Arbitrage Funds | Notes to Financial Statements (continued) |
| May 31, 2015 |
Derivatives Not Accounted For As Hedging Instruments | | Asset Derivatives Statement of Assets and Liabilities Location | | Fair Value | | Liability Derivatives Statement of Assets
and Liabilities
Location | | Fair Value | |
| Event-Driven Fund | | | | | | | | | |
| Foreign Currency Contracts | | Unrealized appreciation on forward foreign currency exchange contracts | | $ | 889,770 | | Unrealized depreciation on forward foreign currency exchange contracts | | $ | 1,445,353 | |
Credit Contracts
(swap contracts) | | | | | | | Unrealized depreciation on swap contracts | | | 15,032 | |
| Equity Contracts (rights) | | Investments:
at value | | | 697,911 | | Investments:
at value | | | 16 | |
| Equity Contracts (purchased option contracts) | | Investments:
at value | | | 3,553,322 | | | | | | |
| Equity Contracts (written option contracts) | | | | | | | Written options, at value | | | 1,501,952 | |
| | | | | $ | 5,141,003 | | | | $ | 2,962,353 | |
| | |
| 142 | www.arbitragefunds.com | 1-800-295-4485 |
The Arbitrage Funds | Notes to Financial Statements (continued) |
| May 31, 2015 |
Derivatives Not Accounted For As Hedging Instruments | Asset Derivatives Statement of Assets and Liabilities Location | | Fair Value | | Liability Derivatives Statement of Assets
and Liabilities
Location | | Fair Value | |
| Credit Opportunities Fund | | | | | | | |
| Foreign Currency Contracts | | | | | Unrealized depreciation on forward foreign currency exchange contracts | | $ | 5,074 | |
Credit Contracts
(swap contracts) | | | | | Unrealized depreciation on swap contracts | | | 1,801 | |
Equity Contracts
(purchased option contracts) | Investments:
at value | | $ | 16,625 | | | | | | |
Equity Contracts
(written option contracts) | | | | | | Written options, at value | | | 5,875 | |
| | | | $ | 16,625 | | | | $ | 12,750 | |
Derivatives Not Accounted For As Hedging Instruments | Asset Derivatives Statement of Assets and Liabilities Location | | Fair Value | | Liability Derivatives Statement of Assets
and Liabilities
Location | | Fair Value | |
| Tactical Equity Fund | | | | | | | |
| Foreign Currency Contracts | Unrealized appreciation on forward foreign currency exchange contracts | | $ | 29 | | Unrealized depreciation on forward foreign currency exchange contracts | | $ | 48 | |
Equity Contracts
(purchased option contracts) | Investments:
at value | | | 8,237 | | | | | | |
Equity Contracts
(written option contracts) | | | | | | Written options, at value | | | 2,606 | |
| | | | $ | 8,266 | | | | $ | 2,654 | |
| | |
| Annual Report | May 31, 2015 | 143 |
The Arbitrage Funds | Notes to Financial Statements (continued) |
| May 31, 2015 |
The effect of derivative instruments on the Funds’ Statement of Operations for the year ended May 31, 2015, was as follows:
Derivatives Not Accounted For As Hedging Instruments | Location Of Gains/(Loss) On Derivatives Recognized In Income | | Realized Gain/(Loss) On Derivatives Recognized In Income | | | Changed In Unrealized Gain/(Loss) On Derivatives Recognized In Income | |
| Arbitrage Fund | | | | | | | |
| Foreign Currency Contracts | Net realized gains (losses) from: Foreign currency transactions / Net change in unrealized appreciation (depreciation) on: Foreign currency transactions | | $ | 28,828,121 | | | $ | (604,065 | ) |
Equity Contracts
(swap contracts) | Net realized gains (losses) from: Swap contracts / Net change in unrealized appreciation (depreciation) on: Swap contracts | | | (253,886 | ) | | | (164,901 | ) |
| Equity Contracts Long (rights) | Net realized gains (losses) from: Investments / Net change in unrealized appreciation (depreciation) on: Investments | | | (3,812,211 | ) | | | 2,361,111 | |
| Equity Contracts Short (rights) | Net realized gains (losses) from: Investments / Net change in unrealized appreciation (depreciation) on: Securities sold short | | | – | | | | (90 | ) |
| Equity Contracts (purchased option contracts) | Net realized gains (losses) from: Investments / Net change in unrealized appreciation (depreciation) on: Investments | | | (22,607,439 | ) | | | 149,821 | |
| Equity Contracts (written option contracts) | Net realized gains (losses) from: Written option contracts / Net change in unrealized appreciation (depreciation) on: Written option contracts | | | 12,770,110 | | | | 622 | |
| | | | $ | 14,924,695 | | | $ | 1,742,498 | |
| | |
| 144 | www.arbitragefunds.com | 1-800-295-4485 |
The Arbitrage Funds | Notes to Financial Statements (continued) |
| May 31, 2015 |
Derivatives Not Accounted For As Hedging Instruments | Location Of Gains/(Loss) On Derivatives Recognized In Income | | Realized Gain/(Loss) On Derivatives Recognized In Income | | | Changed In Unrealized Gain/(Loss) On Derivatives Recognized In Income | |
| Event-Driven Fund | | | | | | | |
| Foreign Currency Contracts | Net realized gains (losses) from: Foreign currency transactions / Net change in unrealized appreciation (depreciation) on: Foreign currency transactions | | $ | 5,802,800 | | | $ | 13,831 | |
Credit Contracts
(swap contracts) | Net realized gains (losses) from: Swap contracts / Net change in unrealized appreciation (depreciation) on: Swap contracts | | | (25,927 | ) | | | (15,032 | ) |
Equity Contracts
(swap contracts) | Net realized gains (losses) from: Swap contracts / Net change in unrealized appreciation (depreciation) on: Swap contracts | | | 804,372 | | | | 1,019 | |
| Equity Contracts Long (rights) | Net realized gains (losses) from: Investments / Net change in unrealized appreciation (depreciation) on: Investments | | | (237,412 | ) | | | (253,343 | ) |
| Equity Contracts Short (rights) | Net realized gains (losses) from: Investments / Net change in unrealized appreciation (depreciation) on: Securities sold short | | | – | | | | (16 | ) |
| Equity Contracts (purchased option contracts) | Net realized gains (losses) from: Investments / Net change in unrealized appreciation (depreciation) on: Investments | | | (14,190,708 | ) | | | (289,343 | ) |
| Equity Contracts (written option contracts) | Net realized gains (losses) from: Written option contracts / Net change in unrealized appreciation (depreciation) on: Written option contracts | | | 3,287,176 | | | | (78,435 | ) |
| | | | $ | (4,559,699 | ) | | $ | (621,319 | ) |
| | |
| Annual Report | May 31, 2015 | 145 |
The Arbitrage Funds | Notes to Financial Statements (continued) |
| May 31, 2015 |
Derivatives Not Accounted For As Hedging Instruments | Location Of Gains/(Loss) On Derivatives Recognized In Income | | Realized Gain/(Loss) On Derivatives Recognized In Income | | | Changed In Unrealized Gain/(Loss) On Derivatives Recognized In Income | |
| Credit Opportunities Fund | | | | | | | |
| Foreign Currency Contracts | Net realized gains (losses) from: Foreign currency transactions / Net change in unrealized appreciation (depreciation) on: Foreign currency transactions | | $ | 48,944 | | | $ | 13,753 | |
Credit Contracts
(swap contracts) | Net realized gains (losses) from: Swap contracts/Net change in unrealized appreciation (depreciation) on:
Swap contracts | | | (3,089 | ) | | | (1,801 | ) |
| Equity Contracts (purchased option contracts) | Net realized gains (losses) from: Investments / Net change in unrealized appreciation (depreciation) on: Investments | | | (17,563 | ) | | | (21,593 | ) |
| Equity Contracts (written option contracts) | Net realized gains (losses) from: Written option contracts / Net change in unrealized appreciation (depreciation) on: Written option contracts | | | 6,041 | | | | 355 | |
| | | | $ | 34,333 | | | $ | (9,286 | ) |
| | |
| 146 | www.arbitragefunds.com | 1-800-295-4485 |
The Arbitrage Funds | Notes to Financial Statements (continued) |
| May 31, 2015 |
Derivatives Not Accounted For As Hedging Instruments | Location Of Gains/(Loss) On Derivatives Recognized In Income | | Realized Gain/(Loss) On Derivatives Recognized In Income | | | Changed In Unrealized Gain/(Loss) On Derivatives Recognized In Income | |
| Tactical Equity Fund | | | | | | | |
| Foreign Currency Contracts | Net realized gains (losses) from: Foreign currency transactions / Net change in unrealized appreciation (depreciation) on: Foreign currency transactions | | $ | (2 | ) | | $ | (19 | ) |
Equity Contracts
(swap contracts) | Net realized gains (losses) from: Swap contracts/Net change in unrealized appreciation (depreciation) on: Swap contracts | | | (269 | ) | | | – | |
| Equity Contracts (purchased option contracts) | Net realized gains (losses) from: Investments / Net change in unrealized appreciation (depreciation) on: Investments | | | (13,616 | ) | | | (3,740 | ) |
| Equity Contracts (written option contracts) | Net realized gains (losses) from: Written option contracts / Net change in unrealized appreciation (depreciation) on: Written option contracts | | | 3,655 | | | | (405 | ) |
| | | | $ | (10,232 | ) | | $ | (4,164 | ) |
Volume of Derivative Instruments for the Funds during the year ended May 31, 2015, was
as follows:
| Derivative Type | Unit of Measurement | | Monthly Average | |
| Arbitrage Fund | | | | |
| Swap Contracts | Notional Quantity | | | 1,788,597 | |
| Forward Foreign Currency Exchange Contracts | Net Contracts to Deliver/(Receive) | | | (284,026,298 | ) |
| Purchased Option Contracts | Contracts | | | 60,223 | |
| Rights | Shares | | | 20,104,402 | |
| Rights - Short | Shares | | | (1,100 | ) |
| Written Option Contracts | Contracts | | | (31,324 | ) |
| | |
| Annual Report | May 31, 2015 | 147 |
The Arbitrage Funds | Notes to Financial Statements (continued) |
| May 31, 2015 |
| Derivative Type | Unit of Measurement | | Monthly Average | |
| Event-Driven Fund | | | | |
| Swap Contracts | Notional Quantity | | | (1,238,783 | ) |
| Forward Foreign Currency Exchange Contracts | Net Contracts to Deliver/(Receive) | | | (38,278,473 | ) |
| Purchased Option Contracts | Contracts | | | 46,446 | |
| Rights | Shares | | | 1,777,137 | |
| Rights - Short | Shares | | | (200 | ) |
| Written Option Contracts | Contracts | | | (9,429 | ) |
| Derivative Type | Unit of Measurement | | Monthly Average | |
| Credit Opportunities Fund | | | | |
| Swap Contracts | Notional Quantity | | | (178,333 | ) |
| Forward Foreign Currency Exchange Contracts | Net Contracts to Deliver/(Receive) | | | (635,000 | ) |
| Purchased Option Contracts | Contracts | | | 25 | |
| Written Option Contracts | Contracts | | | (2 | ) |
| Derivative Type | Unit of Measurement | | Monthly Average | |
| Tactical Equity Fund | | | | |
| Swap Contracts | Notional Quantity | | | 5 | |
| Forward Foreign Currency Exchange Contracts | Net Contracts to Deliver/(Receive) | | | 8,314 | |
| Purchased Option Contracts | Contracts | | | 113 | |
| Written Option Contracts | Contracts | | | (17 | ) |
Certain derivative contracts are executed under either standardized netting agreements or, for exchange-traded derivatives, the relevant contracts for a particular exchange which contain enforceable netting provisions. A derivative netting arrangement creates an enforceable right of set-off that becomes effective, and affects the realization of settlement on individual assets, liabilities and collateral amounts, only following a specified event of default or early termination. Default events may include the failure to make payments or deliver securities timely, material adverse changes in financial condition or insolvency, the breach of minimum regulatory capital requirements, or loss of license, charter or other legal authorization necessary to perform under the contract.
| | |
| 148 | www.arbitragefunds.com | 1-800-295-4485 |
The Arbitrage Funds | Notes to Financial Statements (continued) |
| May 31, 2015 |
The following table presents financial instruments that are subject to enforceable netting arrangements or other similar agreements as of May 31, 2015:
Offsetting of Financial Assets and Derivative Assets:
| Arbitrage Fund | |
| | | | | | | | | | | | | | | Gross Amounts Not Offset in the Statement of Assets and Liabilities | | | | |
| Description | | Gross Amounts of Recognized Assets | | | Gross Amounts Offset in the Statement of Assets and Liabilities | | | Net Amounts Presented in the Statement of Assets and Liabilities | | | Financial Instruments (a) | | | Cash Collateral Received(a) | | | Net Amount | |
| Swap Contracts | | $ | 112,866 | | | $ | – | | | $ | 112,866 | | | $ | – | | | $ | – | | | $ | 112,866 | |
| Total | | $ | 112,866 | | | $ | – | | | $ | 112,866 | | | $ | – | | | $ | – | | | $ | 112,866 | |
| | |
| Annual Report | May 31, 2015 | 149 |
The Arbitrage Funds | Notes to Financial Statements (continued) |
| May 31, 2015 |
Offsetting of Financial Liabilities and Derivative Liabilities:
| Event-Driven Fund | |
| | | | | | | | | | | | | | | Gross Amounts Not Offset in the Statement of Assets and Liabilities | | | | |
| Description | | Gross Amounts of Recognized Liabilities | | | Gross Amounts Offset in the Statement of Assets and Liabilities | | | Net Amounts Presented in the Statement of Assets and Liabilities | | | Financial Instruments (a) | | | Cash Collateral Pledged(a) | | | Net Amount | |
| Swap Contracts | | $ | 15,032 | | | $ | – | | | $ | 15,032 | | | $ | – | | | $ | (15,032 | ) | | $ | – | |
| Total | | $ | 15,032 | | | $ | – | | | $ | 15,032 | | | $ | – | | | $ | (15,032 | ) | | $ | – | |
| Credit Opportunities Fund | |
| | | | | | | | | | | | | | | Gross Amounts Not Offset in the Statement of Assets and Liabilities | | | | |
| Description | | Gross Amounts of Recognized Liabilities | | | Gross Amounts Offset in the Statement of Assets and Liabilities | | | Net Amounts Presented in the Statement of Assets and Liabilities | | | Financial Instruments (a) | | | Cash Collateral Pledged(a) | | | Net Amount | |
| Swap Contracts | | $ | 1,801 | | | $ | – | | | $ | 1,801 | | | $ | – | | | $ | (1,801 | ) | | $ | – | |
| Total | | $ | 1,801 | | | $ | – | | | $ | 1,801 | | | $ | – | | | $ | (1,801 | ) | | $ | – | |
(a) | These amounts are limited to the derivative asset/liability balance and, accordingly, do not include excess collateral received/pledged. |
Security Transactions and Investment Income: Security transactions are accounted for on a trade date basis. Interest income, adjusted for amortization of premium and accretion of discount, is recorded on the accrual basis. Dividend income is recorded on the ex‐dividend date, net of any non-reclaimable tax withholdings.
| | |
| 150 | www.arbitragefunds.com | 1-800-295-4485 |
The Arbitrage Funds | Notes to Financial Statements (continued) |
| May 31, 2015 |
Dividends and Distributions to Shareholders — Dividends arising from net investment income and net capital gain distributions, if any, are declared and paid at least annually to shareholders of the Arbitrage Fund, Event-Driven Fund and Tactical Equity Fund. Dividends arising from net investment income, if any, are declared and paid quarterly, and net capital gain distributions, if any, are declared and paid at least annually to shareholders of the Credit Opportunities Fund.
Allocation Between Classes — Investment income earned, realized capital gains and losses, and unrealized appreciation and depreciation are allocated daily to each class of shares based upon the proportionate shares of total net assets of each Fund. Class-specific expenses are charged directly to the class incurring the expense. Common expenses which are not attributable to a specific class are allocated daily to each class of shares based upon the proportionate share of total net assets of each Fund.
Offering costs — Offering costs, including costs of printing initial prospectuses, legal and registration fees, have been amortized over twelve months from the inception date of the Tactical Opportunities Fund. As of May 31, 2015, the offering costs remaining to be amortized are $78,712.
Federal Income Tax — It is the Funds’ policy to continue to comply with the special provisions of Subchapter M of the Internal Revenue Code of 1986, as amended, applicable to regulated investment companies. As provided therein, in any fiscal year in which a fund so qualifies and distributes at least 90% of its taxable net income, a fund (but not the shareholders) will be relieved of Federal income tax on the income distributed. Accordingly, no provision for income taxes has been made.
As of and during the period ended May 31, 2015, the Funds did not have a liability for any unrecognized tax benefits. The Funds file U.S. federal, state, and local tax returns as required. The Funds’ tax returns are subject to examination by the relevant tax authorities until expiration of the applicable statute of limitations which is generally three years after the filing of the tax return. Tax returns for open years have incorporated no uncertain tax positions that require a provision for income taxes.
3. INVESTMENT TRANSACTIONS
During the period ended May 31, 2015 for the Arbitrage Fund, the Event-Driven Fund, the Credit Opportunities Fund and the Tactical Equity Fund, cost of purchases and proceeds from sales and maturities of investment securities, other than short-term investments, U.S. government securities, equity swap contracts, purchased and written option contracts and securities sold short, were as follows:
| | | Arbitrage Fund | | | Event-Driven Fund | | | Credit Opportunities Fund | | | Tactical Equity Fund | |
| Purchases | | $ | 11,368,027,360 | | | $ | 2,898,552,454 | | | $ | 113,609,114 | | | $ | 2,263,267 | |
| Sales and Maturities | | | 12,128,502,922 | | | | 2,743,311,014 | | | | 75,308,437 | | | | 1,391,135 | |
4. LINE OF CREDIT
The Trust, on behalf of the Funds, entered into an agreement which enables the Arbitrage Fund, the Event-Driven Fund and the Credit Opportunities Fund to participate in a $300,000,000 unsecured committed revolving line of credit with State Street Bank and Trust Company (the “Custodian”). The Arbitrage Tactical Equity Fund is not a party to this agreement. Borrowings will be made solely to temporarily finance the purchase or sale of securities or to finance the redemption of the shares of an investor of the Funds. Interest is charged to the Funds based on their borrowings at a rate per annum of the higher of the LIBOR rate plus 1.25% and the overnight federal funds rate plus 1.25%. In addition, a commitment fee of 0.125% per annum is payable at the end of each calendar quarter. The Trust accrues, on behalf of each of the Funds, the commitment fee on the unused portion of the line of credit. Such fees are included in custodian and bank service fees on the Statements of Operations.
| | |
| Annual Report | May 31, 2015 | 151 |
The Arbitrage Funds | Notes to Financial Statements (continued) |
| May 31, 2015 |
The Arbitrage Fund had outstanding borrowings of $0 at May 31, 2015. For the year ended May 31, 2015, the Arbitrage Fund had average borrowings of $18,543,562 over a period of 85 days at a weighted average interest rate of 1.37%. Interest expense on the line of credit for the Arbitrage Fund during the year ended May 31, 2015, is shown as line of credit interest expense on the Arbitrage Fund’s Statement of Operations.
The Event-Driven Fund had outstanding borrowings of $8,500,000 at May 31, 2015. For the year ended May 31, 2015, the Event-Driven Fund had average borrowings of $29,397,590 over a period of 83 days at a weighted average interest rate of 1.37%. Interest expense on the line of credit for the Event-Driven Fund during the year ended May 31, 2015, is shown as line of credit interest expense on the Event-Driven Fund’s Statement of Operations.
For the period ended May 31, 2015, the Credit Opportunities Fund had no borrowings.
5. LOAN PARTICIPATIONS AND ASSIGNMENTS
The Funds may invest in direct debt instruments which are interests in amounts owed to lenders or lending syndicates by corporate, governmental, or other borrowers. The Funds’ investments in loans may be in the form of participations in loans or assignments of all or a portion of loans from third parties. A loan is often administered by a bank or other financial institution (the “lender”) that acts as agent for all holders. The agent administers the terms of the loan, as specified in the loan agreement. The Funds may invest in multiple series or tranches of a loan, which may have varying terms and carry different associated risks. The Funds generally have no right to enforce compliance with the terms of the loan agreement with the borrower. As a result, the Funds may be subject to the credit risk of both the borrower and the lender that is selling the loan agreement. When the Funds purchase assignments from lenders they acquire direct rights against the borrower of the loan. The Funds may enter into unfunded loan commitments, which are contractual obligations for future funding. Unfunded loan commitments represent a future obligation in full, even though a percentage of the notional loan amounts may not be utilized by the borrower. When investing in a loan participation, the Funds have the right to receive payments of principal, interest and any fees to which it is entitled only from the lender selling the loan agreement and only upon receipt of payments by the lender from the borrower. The Funds may receive a commitment fee based on the undrawn portion of the underlying line of credit portion of a floating rate loan. In certain circumstances, the Funds may receive a penalty fee upon the prepayment of a floating rate loan by a borrower. Fees earned or paid are recorded as a component of interest income or interest expense, respectively, on the Statement of Operations. At May 31, 2015, the Arbitrage Fund, Event-Driven Fund, Credit Opportunities Fund and Tactical Equity Fund had $0, $13,150,172, $2,015,859 and $0, respectively, in outstanding loan commitments.
| | |
| 152 | www.arbitragefunds.com | 1-800-295-4485 |
The Arbitrage Funds | Notes to Financial Statements (continued) |
| May 31, 2015 |
6. ADVISORY FEES, ADMINISTRATION FEES AND OTHER AGREEMENTS
Investment Advisory Agreement
The Funds’ investments are managed by Water Island Capital, LLC (the “Adviser”) under the terms of Investment Advisory Agreements. Under the Investment Advisory Agreement between the Adviser and the Arbitrage Fund, as amended and restated on October 1, 2007, the Arbitrage Fund pays the Adviser an annual fee, which is computed and accrued daily and paid monthly, of 1.25% on the first $250 million, 1.20% on the next $50 million, 1.15% on the next $50 million, 1.10% on the next $75 million, 1.05% on the next $75 million and 1.00% for amounts over $500 million, based on the Arbitrage Fund’s average daily net assets. Under the Investment Advisory Agreement between the Adviser and the Event-Driven Fund dated September 27, 2010, the Event-Driven Fund pays the Adviser an annual fee, which is computed and accrued daily and paid monthly, of 1.25% based on the Event-Driven Fund’s average daily net assets. Under the Investment Advisory Agreement between the Adviser and the Credit Opportunities Fund dated October 1, 2012, the Credit Opportunities Fund pays the Adviser an annual fee, which is computed and accrued daily and paid monthly, of 1.00% based on the Credit Opportunities Fund’s average daily net assets. Under the Investment Advisory Agreement between the Adviser and the Tactical Equity Fund dated December 22, 2014, the Tactical Equity Fund pays the Adviser an annual fee, which is computed and accrued daily and paid monthly, of 1.25% based on the Tactical Equity Fund’s average daily net assets.
The Adviser has contractually agreed, at least until August 31, 2016 for the Arbitrage Fund, the Event-Driven Fund and the Credit Opportunities Fund, and December 31, 2017 for the Tactical Equity Fund, to waive its advisory fee and/or reimburse the Funds’ other expenses to the extent that total operating expenses (exclusive of interest, taxes, dividends on short positions, brokerage commissions, acquired fund fees and expenses and other costs incurred in connection with the purchase or sale of portfolio securities) exceed the annual rate of the Funds’ average daily net assets attributable to each share class as shown in the table below:
| | Arbitrage Fund | Event-Driven Fund | Credit Opportunities Fund | Tactical Equity Fund |
| Class R | 1.69% | 1.69% | 1.50% | 1.69% |
| Class I | 1.44% | 1.44% | 1.25% | 1.44% |
| Class C | 2.44% | 2.44% | 2.25% | 2.44% |
| Class A | 1.69% | 1.69% | 1.50% | 1.69% |
For the period ended May 31, 2015, the aggregate net fee paid to the Adviser as a percentage of average net assets for the Arbitrage Fund, Event-Driven Fund, Credit Opportunities Fund and Tactical Equity Fund was 1.04%, 1.23%, 0.74% and 0.00%, respectively.
The Adviser is permitted to recapture fees waived and expenses reimbursed to the extent actual fees and expenses for a period are less than the expense limitation of each class, provided, however, that the Adviser shall only be entitled to recapture such amounts for a period of three years from the end of the fiscal year during which such amount was waived or reimbursed. The Adviser can recapture any fees it has waived within three fiscal years of the year in which fees were waived period subject to the applicable annual rate of: 1.69% for Class R shares, 1.44% for Class I shares, 2.44% for Class C shares and 1.69% for Class A shares for Event-Driven Fund, 1.50% for Class R shares, 1.25% for Class I shares, 2.25% for Class C shares and 1.50% for Class A shares for Credit Opportunities Fund and 1.69% for Class R shares, 1.44% for Class I shares, 2.44% for Class C shares and 1.69% for Class A shares for Tactical Equity Fund, respectively.
| | |
| Annual Report | May 31, 2015 | 153 |
The Arbitrage Funds | Notes to Financial Statements (continued) |
| May 31, 2015 |
As of May 31, 2015, the balances of future recapture for each Fund were as follows:
| | Expiring May 31, 2016 | Expiring May 31, 2017 | Expiring May 31, 2018 | Total |
| Event-Driven Fund | | | | |
| Class R | $30,441 | $16,826 | $42,377 | $89,644 |
| Class I | $127,460 | $67,294 | $96,022 | $290,776 |
| Class C | $ 620 | $ 854 | $1,230 | $2,704 |
| Class A | N/A | $ 756 | $1,377 | $2,133 |
| Credit Opportunities Fund | | | |
| Class R | $22,353 | $36,515 | $25,136 | $84,004 |
| Class I | $51,089 | $113,965 | $92,962 | $258,016 |
| Class C | $ 399 | $1,393 | $4,587 | $6,379 |
| Class A | N/A | $ 214 | $1,194 | $1,408 |
| Tactical Equity Fund | | | |
| Class R | N/A | N/A | $1,733 | $1,733 |
| Class I | N/A | N/A | $97,858 | $97,858 |
| Class C | N/A | N/A | $1,733 | $1,733 |
| Class A | N/A | N/A | $1,733 | $1,733 |
There were no amounts recaptured during the period ended May 31, 2015, for the Funds.
Certain officers of the Trust are also officers of the Adviser. The Chief Compliance Officer (“CCO”) of the Trust also serves as the CCO of the Adviser. The Funds pay the Adviser 60% of the CCO’s salary for providing CCO services to the Funds.
Administration Agreement
ALPS Fund Services, Inc. (“ALPS” and the “Administrator”) serves as the Trust’s administrator pursuant to an Administration, Bookkeeping and Pricing Services Agreement (“Administration Agreement”) with the Trust. Certain officers of the Trust are also officers of the Administrator.
Distribution Agreement
ALPS Distributors, Inc. (the “Distributor”) serves as the Funds’ distributors. The Distributor acts as an agent for the Funds and the distributor of their shares.
| | |
| 154 | www.arbitragefunds.com | 1-800-295-4485 |
The Arbitrage Funds | Notes to Financial Statements (continued) |
| May 31, 2015 |
The Funds have adopted, with respect to their Class R, Class C shares and Class A shares, a plan of distribution pursuant to Rule 12b-1 under the 1940 Act which permits each Fund to pay for expenses incurred in the distribution and promotion of the Funds’ Class R shares, Class C shares and Class A shares and for services provided to shareholders. The Plan is a “reimbursement” plan. This means that a Fund’s Class R shares, Class C shares and Class A shares only pay a particular 12b-1 fee to the extent that the Adviser, the Distributor or others have incurred expenses in the promotion and distribution of the shares, including but not limited to, the printing of prospectuses and reports used for sales purposes, expenses of preparation of sales literature and related expenses, advertisements, and other distribution-related expenses, as well as any distribution fees paid to securities dealers or others. Under the distribution plan, a Fund may pay compensation to any broker-dealer with whom the Distributor or the Funds has entered into a contract to distribute Class R shares, Class C shares or Class A shares, or to any other qualified financial services firm, for distribution and/or shareholder-related services with respect to shares held or purchased by their respective customers or in connection with the purchase of shares attributable to their efforts. The amount of payments under the Plan in any year shall not exceed 0.25% for Class R shares, 0.75% for Class C shares and 0.25% for Class A shares, respectively, of the average daily net assets allocable to a Fund’s Class R shares, Class C shares and Class A shares, respectively. In addition, the Plan permits each Fund to make payments at an annual rate of up to 0.25% of the Fund’s Class C shares for expenses incurred in connection with the provision of shareholder support or administrative services for the Fund’s Class C shares. During the year ended May 31, 2015, The Arbitrage Fund’s Class R shares incurred $1,431,113, Class C shares incurred $329,574 and Class A shares incurred $26,665, respectively, in distribution expenses for Class R shares and Class A shares and distribution and shareholder support expenses for Class C shares, all of which was used to compensate broker-dealers. With respect to the Event-Driven Fund, during the year ended May 31, 2015, the Event-Driven Fund’s Class R shares incurred $527,963, Class C shares incurred $57,003 and Class A shares incurred $13,832, respectively, in distribution expenses for Class R shares and Class A shares and distribution and shareholder support expenses for Class C shares, all of which was used to compensate broker-dealers. With respect to the Credit Opportunities Fund, during the year ended May 31, 2015, the Credit Opportunities Fund’s Class R shares incurred $26,304, Class C shares incurred $17,250 and Class A shares incurred $1,140, respectively, in distribution expenses for Class R shares and Class A shares and distribution and shareholder support expenses for Class C shares, all of which was used to compensate broker-dealers. With respect to the Tactical Equity Fund, during the period ended May 31, 2015, the Tactical Equity Fund’s Class R shares incurred $11, Class C shares incurred $42 and Class A shares incurred $11, respectively, in distribution expenses for Class R shares and Class A shares and distribution and shareholder support expenses for Class C shares, all of which was used to compensate broker-dealers.
Principal Financial Officer
ALPS provides Principal Financial Officer (“PFO”) services to the Trust. ALPS is compensated by the trust under a PFO Services Agreement.
Transfer Agent And Shareholder Services Agreement
DST Systems, Inc. (“DST”) maintains the records of each shareholder’s account, answers shareholders’ inquiries concerning their accounts, processes purchases and redemptions of the Funds shares, acts as dividend and distribution disbursing agent and performs other shareholder service functions.
| | |
| Annual Report | May 31, 2015 | 155 |
The Arbitrage Funds | Notes to Financial Statements (continued) |
| May 31, 2015 |
7. CAPITAL SHARE TRANSACTIONS
Proceeds and payments on capital shares as shown in the Statements of Changes in Net Assets are the result of the following capital share transactions for the periods shown:
| | | Year
Ended
May 31, 2015 | | | Year
Ended
May 31, 2014 | |
| Arbitrage Fund - Class R | | | | | | |
| Shares sold | | | 11,255,277 | | | | 28,923,212 | |
| Shares issued in reinvestment of dividends | | | 99,102 | | | | 324,860 | |
| Shares redeemed | | | (33,222,538 | ) | | | (42,117,648 | ) |
| Net decrease in shares outstanding | | | (21,868,159 | ) | | | (12,869,576 | ) |
| Shares outstanding at beginning of period | | | 60,460,025 | | | | 73,329,601 | |
| Shares outstanding at end of period | | | 38,591,866 | | | | 60,460,025 | |
| Arbitrage Fund - Class I | | | | | | | | |
| Shares sold | | | 58,430,496 | | | | 56,548,797 | |
| Shares issued in reinvestment of dividends | | | 210,789 | | | | 370,899 | |
| Shares redeemed | | | (77,787,900 | ) | | | (75,823,038 | ) |
| Net decrease in shares outstanding | | | (19,146,615 | ) | | | (18,903,342 | ) |
| Shares outstanding at beginning of period | | | 133,167,976 | | | | 152,071,318 | |
| Shares outstanding at end of period | | | 114,021,361 | | | | 133,167,976 | |
| Arbitrage Fund - Class C | | | | | | | | |
| Shares sold | | | 661,256 | | | | 1,810,652 | |
| Shares issued in reinvestment of dividends | | | 3,667 | | | | 7,056 | |
| Shares redeemed | | | (775,588 | ) | | | (615,921 | ) |
| Net increase/(decrease) in shares outstanding | | | (110,665 | ) | | | 1,201,787 | |
| Shares outstanding at beginning of period | | | 2,715,524 | | | | 1,513,737 | |
| Shares outstanding at end of period | | | 2,604,859 | | | | 2,715,524 | |
| Arbitrage Fund - Class A | | | | | | | | |
| Shares sold | | | 1,051,918 | | | | 638,242 | |
| Shares issued in reinvestment of dividends | | | 1,501 | | | | 797 | |
| Shares redeemed | | | (236,527 | ) | | | (110,396 | ) |
| Net increase in shares outstanding | | | 816,892 | | | | 528,643 | |
| Shares outstanding at beginning of period | | | 528,643 | | | | – | |
| Shares outstanding at end of period | | | 1,345,535 | | | | 528,643 | |
| | |
| 156 | www.arbitragefunds.com | 1-800-295-4485 |
The Arbitrage Funds | Notes to Financial Statements (continued) |
| May 31, 2015 |
| | | Year
Ended
May 31, 2015 | | | Year
Ended
May 31, 2014 | |
| Event-Driven Fund - Class R | | | | | | |
| Shares sold | | | 10,854,265 | | | | 20,533,072 | |
| Shares issued in reinvestment of dividends | | | 508,594 | | | | 19,940 | |
| Shares redeemed | | | (11,137,483 | ) | | | (1,760,311 | ) |
| Net increase in shares outstanding | | | 225,376 | | | | 18,792,701 | |
| Shares outstanding at beginning of period | | | 19,821,462 | | | | 1,028,761 | |
| Shares outstanding at end of period | | | 20,046,838 | | | | 19,821,462 | |
| Event-Driven Fund - Class I | | | | | | | | |
| Shares sold | | | 30,268,594 | | | | 27,051,554 | |
| Shares issued in reinvestment of dividends | | | 847,412 | | | | 31,536 | |
| Shares redeemed | | | (19,422,828 | ) | | | (3,236,214 | ) |
| Net increase in shares outstanding | | | 11,693,178 | | | | 23,846,876 | |
| Shares outstanding at beginning of period | | | 28,055,740 | | | | 4,208,864 | |
| Shares outstanding at end of period | | | 39,748,918 | | | | 28,055,740 | |
| Event-Driven Fund - Class C | | | | | | | | |
| Shares sold | | | 335,583 | | | | 380,682 | |
| Shares issued in reinvestment of dividends | | | 12,404 | | | | 672 | |
| Shares redeemed | | | (240,429 | ) | | | (2,230 | ) |
| Net increase in shares outstanding | | | 107,558 | | | | 379,124 | |
| Shares outstanding at beginning of period | | | 414,063 | | | | 34,939 | |
| Shares outstanding at end of period | | | 521,621 | | | | 414,063 | |
| Event-Driven Fund - Class A | | | | | | | | |
| Shares sold | | | 354,278 | | | | 387,229 | |
| Shares issued in reinvestment of dividends | | | 12,574 | | | | 718 | |
| Shares redeemed | | | (190,018 | ) | | | (16,033 | ) |
| Net increase in shares outstanding | | | 176,834 | | | | 371,914 | |
| Shares outstanding at beginning of period | | | 371,914 | | | | – | |
| Shares outstanding at end of period | | | 548,748 | | | | 371,914 | |
| | |
| Annual Report | May 31, 2015 | 157 |
The Arbitrage Funds | Notes to Financial Statements (continued) |
| May 31, 2015 |
| | | Year
Ended
May 31, 2015 | | | Year
Ended
May 31, 2014 | |
| Credit Opportunities Fund - Class R | | | | | | |
| Shares sold | | | 2,217,255 | | | | 723,248 | |
| Shares issued in reinvestment of dividends | | | 23,448 | | | | 10,735 | |
| Shares redeemed | | | (579,108 | ) | | | (276,188 | ) |
| Net increase in shares outstanding | | | 1,661,595 | | | | 457,795 | |
| Shares outstanding at beginning of period | | | 621,960 | | | | 164,165 | |
| Shares outstanding at end of period | | | 2,283,555 | | | | 621,960 | |
| Credit Opportunities Fund - Class I | | | | | | | | |
| Shares sold | | | 4,060,080 | | | | 2,259,583 | |
| Shares issued in reinvestment of dividends | | | 103,564 | | | | 32,519 | |
| Shares redeemed | | | (1,769,150 | ) | | | (384,972 | ) |
| Net increase in shares outstanding | | | 2,394,494 | | | | 1,907,130 | |
| Shares outstanding at beginning of period | | | 2,247,959 | | | | 340,829 | |
| Shares outstanding at end of period | | | 4,642,453 | | | | 2,247,959 | |
| Credit Opportunities Fund - Class C | | | | | | | | |
| Shares sold | | | 160,924 | | | | 70,670 | |
| Shares issued in reinvestment of dividends | | | 3,722 | | | | 239 | |
| Shares redeemed | | | (30,365 | ) | | | (3,462 | ) |
| Net increase in shares outstanding | | | 134,281 | | | | 67,447 | |
| Shares outstanding at beginning of period | | | 69,965 | | | | 2,518 | |
| Shares outstanding at end of period | | | 204,246 | | | | 69,965 | |
| Credit Opportunities Fund - Class A | | | | | | | | |
| Shares sold | | | 92,306 | | | | 2,713 | |
| Shares issued in reinvestment of dividends | | | 961 | | | | 41 | |
| Shares redeemed | | | (32,561 | ) | | | – | |
| Net increase in shares outstanding | | | 60,706 | | | | 2,754 | |
| Shares outstanding at beginning of period | | | 2,754 | | | | – | |
| Shares outstanding at end of period | | | 63,460 | | | | 2,754 | |
| | |
| 158 | www.arbitragefunds.com | 1-800-295-4485 |
The Arbitrage Funds | Notes to Financial Statements (continued) |
| May 31, 2015 |
| | | Period Ended
May 31, 2015(a) | |
| Tactical Equity Fund - Class R | | | |
| Shares sold | | | 1,000 | |
| Net increase in shares outstanding | | | 1,000 | |
| Shares outstanding at beginning of period | | | – | |
| Shares outstanding at end of period | | | 1,000 | |
| Tactical Equity Fund - Class I | | | | |
| Shares sold | | | 136,916 | |
| Shares redeemed | | | (6 | ) |
| Net increase in shares outstanding | | | 136,910 | |
| Shares outstanding at beginning of period | | | – | |
| Shares outstanding at end of period | | | 136,910 | |
| Tactical Equity Fund - Class C | | | | |
| Shares sold | | | 1,000 | |
| Net increase in shares outstanding | | | 1,000 | |
| Shares outstanding at beginning of period | | | – | |
| Shares outstanding at end of period | | | 1,000 | |
| Tactical Equity Fund - Class A | | | | |
| Shares sold | | | 1,000 | |
| Net increase in shares outstanding | | | 1,000 | |
| Shares outstanding at beginning of period | | | – | |
| Shares outstanding at end of period | | | 1,000 | |
(a) | Commenced operations on January 2, 2015. |
8. FOREIGN CURRENCY TRANSLATION
Amounts denominated in or expected to settle in foreign currencies are translated to U.S. dollars based on exchange rates on the following basis:
A. The market values of investment securities and other assets and liabilities are translated at the closing rate of exchange each day.
B. Purchases and sales of investment securities and income and expenses are translated at the rate of exchange prevailing on the respective dates of such transactions.
C. The Funds do not isolate that portion of the results of operations caused by changes in foreign exchange rates on investments from those caused by changes in market prices of securities held. Such fluctuations are included with the net realized and unrealized gains or losses on investments. Reported net realized foreign exchange gains or losses arise from 1) purchases and sales of foreign currencies; 2) currency gains or losses realized between the trade and settlement dates on securities transactions; and 3) the difference between the amounts of dividends, interest and foreign withholding taxes recorded on the Funds’ books, and the U.S. dollar equivalent of the amounts actually received or paid. Reported net unrealized foreign exchange gains and losses arise from changes in the value of assets and liabilities, other than investment securities, resulting from changes in exchange rates.
| | |
| Annual Report | May 31, 2015 | 159 |
The Arbitrage Funds | Notes to Financial Statements (continued) |
| May 31, 2015 |
9. CONTINGENCIES AND COMMITMENTS
The Funds indemnify the Trust’s officers and trustees for certain liabilities that might arise from their performance of their duties to the Funds. Additionally, in the normal course of business, the Funds enter into contracts that contain a variety of representations and warranties and which provide general indemnifications. The Funds’ maximum exposure under these arrangements is unknown, as this would involve future claims that may be made against the Funds that have not yet occurred. However, based on experience, the Funds expect the risk of loss to be remote.
10. SECURITIES LENDING
In order to generate additional income, the Funds may, from time to time, lend portfolio securities to broker-dealers, banks or institutional borrowers of securities. The Funds must receive 100% collateral in the form of cash or U.S. government securities. This collateral must be valued daily and, should the market value of the loaned securities increase, the borrower must furnish additional collateral to the Funds. During the time portfolio securities are on loan, the borrower pays the Funds any dividends or interest paid on such securities.
Loans are subject to termination by the Funds or the borrower at any time. While the Funds do not have the right to vote securities on loan, they have the right to terminate the loan and regain the right to vote if that is considered important with respect to the investment. In the event the borrower defaults in its obligation to the Funds, the Funds bear the risk of delay in the recovery of portfolio securities and the risk of loss of rights in the collateral. There were no securities on loan in the Funds during the period ended May 31, 2015.
11. FEDERAL TAX INFORMATION
In order to avoid imposition of the excise tax applicable to regulated investment companies, it is also the Funds’ intention to declare as dividends in each calendar year at least 98% of its net investment income (earned during the calendar year) and 98.2% of its net realized capital
gains (earned during the twelve months ended October 31) plus undistributed amounts from
prior years.
The amount of distributions from net investment income and net realized gains, if any, are determined in accordance with Federal income tax regulations which may differ from accounting principles generally accepted in the United States of America. These “book/tax” differences are either temporary or permanent in nature and permanent differences are charged or credited to undistributed net investment income (loss), accumulated net realized gain (loss) or paid-in capital as appropriate in the period that the differences arise.
Permanent differences between the Funds’ financial statement and income tax reporting requirements are primarily attributable to gains and losses on certain foreign currency related transactions, short sale related dividend expense, investments in passive foreign investment companies, investments in swaps and certain other investments. These have no effect on the Funds’ net assets or net asset value per share.
| | |
| 160 | www.arbitragefunds.com | 1-800-295-4485 |
The Arbitrage Funds | Notes to Financial Statements (continued) |
| May 31, 2015 |
| Fund | | Undistributed Net Investment Income/(Loss) | | | Accumulated Realized Gain/(Loss) | | | Paid-in Capital | |
| The Arbitrage Fund | | $ | 35,304,063 | | | $ | (35,303,846 | ) | | $ | (217 | ) |
| The Arbitrage Event-Driven Fund | | | 1,238,979 | | | | (2,714,922 | ) | | | 1,475,943 | |
| The Arbitrage Credit Opportunities Fund | | | (12,091 | ) | | | 13,690 | | | | (1,599 | ) |
| The Arbitrage Tactical Equity Fund | | | 8,607 | | | | (5,880 | ) | | | (2,727 | ) |
| | | | | | | | | | | | | |
| The tax character of dividends and distributions declared and paid during the year ended May 31, 2015 and May 31, 2014 was as follows: | |
| | | |
| Fund | Year Ended | | Ordinary Income | | | Long-Term Capital Gains* | | | Total Distributions | |
| The Arbitrage Fund | | | | | | | | | | |
| | 5/31/2015 | | $ | – | | | $ | 5,699,538 | | | $ | 5,699,538 | |
| | 5/31/2014 | | | – | | | | 12,319,798 | | | | 12,319,798 | |
| The Arbitrage Event-Driven Fund | | | | | | | | | | | | | |
| 5/31/2015 | | $ | 16,463,793 | | | $ | – | | | $ | 16,463,793 | |
| 5/31/2014 | | | 982,616 | | | | – | | | | 982,616 | |
| The Arbitrage Credit Opportunities Fund | | | | | | | | | | | | | |
| 5/31/2015 | | $ | 1,328,590 | | | $ | – | | | $ | 1,328,590 | |
| 5/31/2014 | | | 440,526 | | | | – | | | | 440,526 | |
| The Arbitrage Tactical Equity Fund | | | | | | | | | | | | | |
| 5/31/2015 | | $ | – | | | $ | – | | | $ | – | |
* | The Funds designate these distributions as long-term capital gains dividends per IRC code section 852(b)(3)(C). |
| | |
| Annual Report | May 31, 2015 | 161 |
The Arbitrage Funds | Notes to Financial Statements (continued) |
| May 31, 2015 |
| As of May 31, 2015, the components of distributable earnings on a tax basis were as follows: | |
| | | | |
| | | The Arbitrage Fund | | | The Arbitrage Event-Driven Fund | | | The Arbitrage Credit Opportunities Fund | | | The Arbitrage Tactical Equity Fund | |
| Undistributed ordinary income | | $ | 36,514,253 | | | $ | – | | | $ | 461,807 | | | $ | 14,738 | |
| Accumulated capital gains/(losses) | | | 8,349,338 | | | | 10,013 | | | | (548,080 | ) | | | 35 | |
| Unrealized depreciation | | | (5,373,276 | ) | | | (11,919,949 | ) | | | (733,439 | ) | | | (1,936 | ) |
| Other cumulative timing differences | | | 2,866,955 | | | | (19,119,892 | ) | | | 5,074 | | | | (9,213 | ) |
| Total distributable earnings | | $ | 42,357,270 | | | $ | (31,029,828 | ) | | $ | (814,638 | ) | | $ | 3,624 | |
| The following information is computed on a tax basis for each item as of May 31, 2015: | |
| | | | |
| Fund | | Gross Appreciation (excess of value over tax cost) | | | Gross Depreciation (excess of tax cost over value) | | | Net Appreciation/
(Depreciation) of Foreign Currency and Derivatives | | | Net Unrealized Depreciation | | | Cost of Investments for Income Tax Purposes | |
| The Arbitrage Fund | | $ | 24,147,892 | | | $ | (30,986,502 | ) | | $ | 1,465,334 | | | $ | (5,373,276 | ) | | $ | 2,079,156,204 | |
| The Arbitrage Event-Driven Fund | | | 10,772,381 | | | | (22,177,575 | ) | | | (514,755 | ) | | | (11,919,949 | ) | | | 635,480,809 | |
| The Arbitrage Credit Opportunities Fund | | 511,471 | | | | (1,001,334 | ) | | | (243,576 | ) | | | (733,439 | ) | | | 73,724,980 | |
| The Arbitrage Tactical Equity Fund | | | 25,552 | | | | (23,612 | ) | | | (3,876 | ) | | | (1,936 | ) | | | 1,367,449 | |
The differences between book–basis and tax–basis net unrealized appreciation/(depreciation) for the Arbitrage Fund, the Event-Driven Fund and the Credit Opportunities Fund are attributable to constructive sales, dividends related to short securities, investments in passive foreign investment companies, and wash sales.
Capital Loss Carryovers:
Capital loss carryovers used during the period ended May 31, 2015, were $11,516,700 for the Arbitrage Fund.
| | |
| 162 | www.arbitragefunds.com | 1-800-295-4485 |
The Arbitrage Funds | Notes to Financial Statements (continued) |
| May 31, 2015 |
Capital Losses:
As of May 31, 2015, the Arbitrage Credit Opportunities Fund had $116,168 of short term and $13,297 of long term capital loss carryforwards which may reduce the Funds’ taxable income arising from future net realized gains on investments, if any, to the extent permitted by the Code and thus may reduce the amount of the distributions to shareholders which would otherwise be necessary to relieve the Funds of any liability for federal tax.
Late Year Losses:
The Arbitrage Event-Driven Fund and the Arbitrage Credit Opportunities Fund elects to defer to the period ending May 31, 2016, capital losses recognized during the period November 1, 2014 to May 31, 2015 in the amount of $13,264,810 and $418,615, respectively.
12. INFORMATION REGARDING LEGAL PROCEEDINGS
The Arbitrage Fund and dozens of other entities and individuals have been named as defendants in an adversary proceeding pending in the United States Bankruptcy Court for the Southern District of New York (Weisfelner, as Trustee of the LB Creditor Trust v. Fund 1, et al., Adv. Pro. No. 10-04609). The complaint alleges that payments made to shareholders of Lyondell Chemical Company (“Lyondell”) in connection with the acquisition of Lyondell by Basell AF S.C.A. in a cash-out merger in or around December, 2007 constituted constructive or intentional “fraudulent transfers” under applicable state law and seeks to recover from the former Lyondell shareholders the payments received for the shares.
On January 14, 2014, the Court issued a decision and order on motions to dismiss granting in part, and denying in part, the motions. On April 9, 2014, plaintiff filed a Third Amended Complaint continuing to assert constructive or intentional fraudulent transfer claims under applicable state law. On August 1, 2014, defendants filed a motion to dismiss the Third Amended Complaint, and oral arguments on the motion to dismiss was held on January 14, 2015. A decision on the motion to dismiss is still pending.
At this stage in the proceedings, it is not possible to assess with any reasonable certainty the probable outcome of the pending litigation. Consequently, at this time, management is unable to estimate the possible loss that may result.
13. SUBSEQUENT EVENTS
The Adviser has evaluated the need for disclosures and/or adjustments resulting from subsequent events relating to the Funds. There were no such events or transactions requiring adjustments to or disclosure in the Funds’ financial statements.
| | |
| Annual Report | May 31, 2015 | 163 |
The Board of Trustees and Shareholders of
The Arbitrage Funds
We have audited the accompanying statements of assets and liabilities, including the portfolios of investments, of The Arbitrage Funds (comprising, respectively, The Arbitrage Fund, The Arbitrage Event-Driven Fund, The Arbitrage Credit Opportunities Fund, and The Arbitrage Tactical Equity Fund) (the Funds) as of May 31, 2015, and the related statements of operations for the year then ended (except for The Arbitrage Tactical Equity Fund which is for the period from January 2, 2015 through May 31, 2015), changes in net assets for the two years in the period then ended (except for The Arbitrage Tactical Equity Fund which is for the period from January 2, 2015 through May 31, 2015), and the financial highlights for each of the four years in the period then ended for The Arbitrage Fund and The Arbitrage Event-Driven Fund, for the three years in the period then ended for The Arbitrage Credit Opportunities Fund, and for the period January 2, 2015 through May 31, 2015 for The Arbitrage Tactical Equity Fund. These financial statements and financial highlights are the responsibility of the Funds’ management. Our responsibility is to express an opinion on these financial statements and financial highlights based on our audits. The financial highlights of The Arbitrage Fund and The Arbitrage Event-Driven Fund for the periods presented through May 31, 2011, were audited by other auditors whose report, dated August 1, 2011, expressed an unqualified opinion on those financial highlights.
We conducted our audits in accordance with the standards of the Public Company Accounting Oversight Board (United States). Those standards require that we plan and perform the audit to obtain reasonable assurance about whether the financial statements and financial highlights are free of material misstatement. We were not engaged to perform an audit of the Funds’ internal control over financial reporting. Our audits included consideration of internal control over financial reporting as a basis for designing audit procedures that are appropriate in the circumstances, but not for the purpose of expressing an opinion on the effectiveness of the Funds’ internal control over financial reporting. Accordingly, we express no such opinion. An audit also includes examining, on a test basis, evidence supporting the amounts and disclosures in the financial statements and financial highlights, assessing the accounting principles used and significant estimates made by management, and evaluating the overall financial statement presentation. Our procedures included confirmation of securities owned as of May 31, 2015, by correspondence with the custodian, agent banks, and brokers, or by other appropriate auditing procedures where replies from agent banks and brokers were not received. We believe that our audits provide a reasonable basis for our opinion.
In our opinion, the financial statements and financial highlights audited by us as referred to above present fairly, in all material respects, the financial position of each of the respective portfolios constituting The Arbitrage Funds at May 31, 2015, the results of their operations, the changes in their net assets, and the financial highlights for each of the periods indicated herein, in conformity with U.S. generally accepted accounting principles.
Minneapolis, Minnesota
July 30, 2015
| | |
| 164 | www.arbitragefunds.com | 1-800-295-4485 |
All mutual funds have operating expenses. As a shareholder of a mutual fund, your investment is affected by these ongoing costs, which include (among others) costs for portfolio management, administrative services, distribution (12b-1) expenses, redemption fees and shareholder reports like this one. It is important for you to understand the impact of these costs on your
investment returns.
Operating expenses such as these are deducted from a mutual fund’s gross income and directly reduce its final investment return. These expenses are expressed as a percentage of a mutual fund’s average net assets; this percentage is known as a mutual fund’s expense ratio.
The following examples use the expense ratio and are intended to help you understand the ongoing costs (in dollars) of investing in your Fund and to compare these costs with those of other mutual funds. The examples are based on an investment of $1,000 made at the beginning of the period shown and held for the entire period.
The table on the following page illustrates your Fund’s costs in two ways:
Actual Fund Return. This section helps you to estimate the actual expenses after fee waivers that your Fund incurred over the period. The “Expenses Paid During Period” column shows the actual dollar expense cost incurred by a $1,000 investment in the Fund, and the “Ending Account Value” number is derived from deducting that expense cost from the Fund’s gross investment return.
You can use this information, together with the actual amount you invested in the Fund, to estimate the expenses you paid over that period. Simply divide your actual account value by $1,000 to arrive at a ratio (for example, an $8,600 account value divided by $1,000 = 8.6), then multiply that ratio by the number shown for your Fund under “Expenses Paid During Period.”
Hypothetical 5% Return. This section helps you compare your Fund’s costs with those of other mutual funds. It assumes that the Fund had an annual 5% return before expenses during the period, but that the expense ratio (Column 3) for the period is unchanged. This example is useful in making comparisons because the Securities and Exchange Commission requires all mutual funds to make this 5% calculation. You can assess your Fund’s comparative cost by comparing the hypothetical result for your Fund in the “Expenses Paid During Period” column with those that appear in the same charts in the shareholder reports for other mutual funds.
Note: Because the return is set at 5% for comparison purposes — NOT your Fund’s actual return — the account values shown may not apply to your specific investment.
| | |
| Annual Report | May 31, 2015 | 165 |
| | Beginning
Account Value
12/01/2014 | Ending
Account Value
05/31/2015 | Expense
Ratio(a) | Expenses
Paid During
Period(b) |
| The Arbitrage Fund |
| Class R |
| Actual | $1,000.00 | $1,027.00 | 2.45% | $12.38 |
| Hypothetical (5% return before expenses) | $1,000.00 | $1,012.72 | 2.45% | $12.29 |
| Class I |
| Actual | $1,000.00 | $1,027.10 | 2.18% | $11.02 |
| Hypothetical (5% return before expenses) | $1,000.00 | $1,014.06 | 2.18% | $10.95 |
| Class C |
| Actual | $1,000.00 | $1,022.70 | 3.17% | $15.99 |
| Hypothetical (5% return before expenses) | $1,000.00 | $1,009.12 | 3.17% | $15.88 |
| Class A |
| Actual | $1,000.00 | $1,026.10 | 2.37% | $11.97 |
| Hypothetical (5% return before expenses) | $1,000.00 | $1,013.11 | 2.37% | $11.90 |
| | | | | |
| The Arbitrage Event-Driven Fund |
| Class R |
| Actual | $1,000.00 | $994.90 | 2.69% | $13.38 |
| Hypothetical (5% return before expenses) | $1,000.00 | $1,011.52 | 2.69% | $13.49 |
| Class I |
| Actual | $1,000.00 | $995.40 | 2.45% | $12.19 |
| Hypothetical (5% return before expenses) | $1,000.00 | $1,012.72 | 2.45% | $12.29 |
| Class C |
| Actual | $1,000.00 | $990.60 | 3.46% | $17.17 |
| Hypothetical (5% return before expenses) | $1,000.00 | $1,007.68 | 3.46% | $17.32 |
| Class A |
| Actual | $1,000.00 | $993.90 | 2.67% | $13.27 |
| Hypothetical (5% return before expenses) | $1,000.00 | $1,011.62 | 2.67% | $13.39 |
| | | | | |
| The Arbitrage Credit Opportunities Fund |
| Class R |
| Actual | $1,000.00 | $997.90 | 2.13% | $10.61 |
| Hypothetical (5% return before expenses) | $1,000.00 | $1,014.31 | 2.13% | $10.70 |
| Class I |
| Actual | $1,000.00 | $999.00 | 1.96% | $9.77 |
| Hypothetical (5% return before expenses) | $1,000.00 | $1,015.16 | 1.96% | $9.85 |
| | |
| 166 | www.arbitragefunds.com | 1-800-295-4485 |
The Arbitrage Funds | Disclosure of Fund Expenses (continued) |
| May 31, 2015 |
| | Beginning
Account Value
12/01/2014 | Ending
Account Value
05/31/2015 | Expense
Ratio(a) | Expenses
Paid During
Period(b) |
| Class C |
| Actual | $1,000.00 | $995.30 | 2.96% | $14.72 |
| Hypothetical (5% return before expenses) | $1,000.00 | $1,010.17 | 2.96% | $14.83 |
| Class A |
| Actual | $1,000.00 | $998.00 | 2.18% | $10.86 |
| Hypothetical (5% return before expenses) | $1,000.00 | $1,014.06 | 2.18% | $10.95 |
| | | | | |
The Arbitrage Tactical Equity Fund(c) |
| Class R |
| Actual | $1,000.00 | $1,012.00 | 2.85% | $11.78 |
| Hypothetical (5% return before expenses) | $1,000.00 | $1,010.72 | 2.85% | $14.29 |
| Class I |
| Actual | $1,000.00 | $1,012.00 | 2.60% | $10.75 |
| Hypothetical (5% return before expenses) | $1,000.00 | $1,011.97 | 2.60% | $13.04 |
| Class C |
| Actual | $1,000.00 | $1,012.00 | 3.60% | $14.88 |
| Hypothetical (5% return before expenses) | $1,000.00 | $1,006.98 | 3.60% | $18.01 |
| Class A |
| Actual | $1,000.00 | $1,012.00 | 2.85% | $11.78 |
| Hypothetical (5% return before expenses) | $1,000.00 | $1,010.72 | 2.85% | $14.29 |
(a) | Annualized, based on the Fund's most recent fiscal half-year expenses. |
(b) | Expenses are equal to the Fund's annualized ratio multiplied by the average account value over the period, multiplied by the number of days in the most recent fiscal half year (182), divided by 365. |
(c) | The Fund commenced operations on January 2, 2015. Actual expenses on this class are equal to the Fund’s annualized expense ratio multiplied by the average account value over the period, multiplied by the number of days since the fund commenced operations (150), then divided by 365. |
| | |
| Annual Report | May 31, 2015 | 167 |
1. PROXY VOTING POLICIES AND VOTING RECORD
A description of the policies and procedures that the Funds use to vote proxies relating to portfolio securities is available without charge upon request by calling toll-free 1-800-295-4485, or on the Securities and Exchange Commission’s (“SEC”) website at http://www.sec.gov. Information regarding how the Funds voted proxies relating to portfolio securities during the most recent
fiscal year ending June 30th will be available without charge upon request by calling toll-free
1-800-295-4485, or on the SEC’s website at http://www.sec.gov.
2. QUARTERLY PORTFOLIO HOLDINGS
The Funds file a complete listing of their portfolio holdings with the SEC as of the first and third quarters of each fiscal year on Form N-Q. The filings are available upon request by calling
1-800-295-4485. Furthermore, you may obtain a copy of the filing on the SEC’s website at http://www.sec.gov. The Funds’ Forms N-Q may also be reviewed and copied at the SEC’s Public Reference Room in Washington, D.C., and information on the operation of the Public Reference Room may be obtained by calling 1-800-SEC-0330.
3. TAX INFORMATION
Pursuant to Section 852(b)(3) of the Internal Revenue Code, The Arbitrage Fund designated $5,699,538 as long-term capital gain dividends.
In early 2015, if applicable, shareholders of record received information for the distributions paid to them by the Funds during the calendar year 2014 via form 1099. The Funds will notify shareholders in early 2016 of amounts paid to them by the Funds, if any, during the calendar
year 2015.
| | |
| 168 | www.arbitragefunds.com | 1-800-295-4485 |
The Arbitrage Funds | Trustees’ Approval of Advisory Agreement |
| May 31, 2015 |
The Board requested and received materials relating to the agreements in advance of the meeting. Among other things, the Board considered comparative fee information from the Adviser. Also, the Board considered expense and performance comparisons with other mutual funds in the Funds’ peer groups as determined by Morningstar Associates, LLC (“Morningstar”), an independent source of mutual fund analysis, as further discussed below.
In approving the agreements, the Board, including the Independent Trustees advised by independent legal counsel, considered the factors it deemed relevant, including the nature, quality and extent of services provided, the performance of each Fund, the profitability of the Adviser, expenses and fees, and the potential for economies of scale that may be shared with each Fund and its shareholders as each Fund’s assets grow. In their deliberations, the Trustees did not identify any single factor which alone was responsible for the Board’s decision to approve the agreement with respect to each Fund. In connection with its deliberations, the Board considered information provided by the Adviser throughout the year at regular Board meetings, presentations from portfolio managers and other information, including a telephonic meeting on May 4, 2015 with the Adviser to review its response to the Board’s request for information in connection with the continuation of the advisory agreements, as well as information furnished at or in advance of the meeting held on May 19, 2015 (including information provided in response to requests on the May 4, 2015 telephonic call).
Nature, Extent and Quality of the Services under the Advisory Agreements
The Board received and considered information regarding the nature, extent and quality of services provided to each Fund by the Adviser under the advisory agreement for the Fund. The Board also noted information received at regular meetings throughout the year related to the services rendered by the Adviser. The Board reviewed background information about the Adviser, including its Form ADV. The Board considered the background and experience of the Adviser’s senior management and the qualifications, backgrounds and responsibilities of the portfolio managers primarily responsible for the day-to-day portfolio management of the Funds and the extent of the resources devoted to research and analysis of actual and potential investments. The Board also received and considered information about the nature, extent and quality of services and fee rates offered to other clients of the Adviser for comparable services. The Board concluded that it was generally satisfied with the nature, extent and quality of the investment management services provided to each Fund by the Adviser and that, based on dialogue with management and counsel, the services provided by the Adviser under the advisory agreement for each Fund are typical of, and consistent with, those provided to similar mutual funds by other investment advisers.
| | |
| Annual Report | May 31, 2015 | 169 |
Adviser Profitability
The Board was provided with information on the Adviser’s profitability in serving as the investment adviser to each Fund. The Board recognized that it is difficult to make comparisons of profitability from fund management contracts because comparative information is not generally publicly available and is affected by numerous factors, including the structure of the particular adviser, the types of funds it manages, its business mix, numerous assumptions regarding allocations and the adviser’s capital structure and cost of capital. Taking these factors into account, the Board concluded that the Adviser’s profitability in relation to the services rendered was reasonable.
Economies of Scale
The Board considered information regarding whether there have been economies of scale with respect to the management of each Fund, whether the Fund has appropriately benefited from any economies of scale, and whether there is potential for realization of any further economies of scale. With respect to The Arbitrage Fund, the Board noted that the management fee schedule for the Fund includes breakpoints, which have the effect of decreasing the fee rate as assets increase, and that at its current level of assets the Fund’s effective fee rate reflected those rate reductions. The Board took note that the Fund’s fee structure currently results in benefits to Fund shareholders whether or not the Adviser realizes any economies of scale. The Board noted that the advisory fee schedules for The Arbitrage Event-Driven Fund, The Arbitrage Credit Opportunities Fund and The Arbitrage Tactical Equity Fund do not contain breakpoints that would reduce the fee rate on assets above specified levels. The Board determined that, while fee breakpoints were not currently necessary for The Arbitrage Event-Driven Fund, The Arbitrage Credit Opportunities Fund or The Arbitrage Tactical Equity Fund, they would continue to review whether breakpoints should be incorporated in the advisory fees for these Funds.
Other Benefits to the Adviser
The Board considered other benefits received by the Adviser as a result of its relationship with the Funds. The Board concluded that the potential benefits to be derived by the Adviser included the ability to use soft dollar credits as well as the potential benefits consistent with those generally resulting from an increase in assets under management, specifically, potential access to additional research resources and benefits to its reputation. The Board concluded that the benefits derived by the Adviser were consistent with the types of benefits generally derived by investment advisers to mutual funds. The Board considered the standards applied in seeking best execution and reviewed the Adviser’s method for allocating portfolio investment opportunities among its advisory clients.
Other Factors and Broader Review
As discussed above, the Board reviewed detailed materials received from the Adviser as part of the annual review. The Board also reviews and assesses the quality of the services that the Funds receive throughout the year. In this regard, the Board reviews reports of the Adviser at least quarterly, which include, among other things, detailed portfolio and market reviews, detailed Fund performance reports and compliance reports.
| | |
| 170 | www.arbitragefunds.com | 1-800-295-4485 |
The Arbitrage Funds | Trustees’ Approval of Advisory Agreement (continued) |
| May 31, 2015 |
Investment Advisory Fee Rates and Expenses and Performance
The Board reviewed and considered the contractual advisory fee rates for each Fund in light of the extent and quality of the advisory services provided by the Adviser. The Board also reviewed and considered the contractual fee waivers and expense reimbursements currently in place for each Fund.
The Board also received and considered information comparing the effective advisory fee rates and gross and net total expenses for each Fund with those of a group of funds within the Fund’s Morningstar category determined independently by Morningstar (the “Peer Group”) as well as to the funds in the same Morningstar category (the “Category Group”). The comparisons placed each Fund in various quartiles, with the first quartile being the lowest cost mutual funds.
The performance of each Fund for the periods ended March 31, 2015 was compared to the Peer Group as well as to the funds in the Category Group. The comparisons placed each Fund in various quartiles, with the first quartile being the best performing mutual funds.
The Arbitrage Fund
The Fund’s performance was compared to a Peer Group composed of a small group of funds within Morningstar’s Market Neutral and Long/Short categories that run a purely merger arbitrage strategy as well as to the Market Neutral Category Group. The Fund’s total return ranked in the second quartile of the Peer Group for the one-year period and in the fourth quartile of the Peer Group for the three-, five- and ten-year periods, although it was noted that for the five- and ten-year periods, the Peer Group included only one other fund. The Fund’s total return in the Category Group ranked in the second quartile for the one-, five- and ten-year periods and in the third quartile for the three-year period. The Fund also underperformed its benchmark, the S&P 500 Index, for all periods.
The Fund’s effective advisory fee was in the second quartile of its Category Group. The Fund’s net and gross expenses were in the second quartile in the Category Group. It was noted that the Adviser had entered into an expense waiver and reimbursement agreement to limit fees through September 30, 2016, although the Fund’s expenses did not currently reach a level to require the Adviser to waive fees or reimburse expenses.
The Board determined that it would be in the best interests of the Fund and its shareholders to continue the advisory agreement. The Fund’s fee structure was considered reasonable.
The Arbitrage Event-Driven Fund
The Fund’s performance was compared to a Peer Group composed of a small group of funds within Morningstar’s Market Neutral and Long/Short categories that do not pursue multi-alternative strategies and/or focus primarily on convertible arbitrage, as well as to the Market Neutral Category Group. The Fund’s total return for the one- and three-year periods was in the third quartile of the Peer Group and in the fourth quartile of the Category Group. It was noted that the Fund had underperformed the HFRI Event Driven Index, for the one- and three-year periods. It was also noted that the Fund’s standard deviation (a measure of volatility) ranked in the first quartile for both the Peer Group and the Category Group for the one- and three-year periods.
The Fund’s effective advisory fee was at the median of its Category Group. The Fund’s net and gross expenses were in the second quartile in the Category Group. It was noted that the Adviser had entered into an expense waiver and reimbursement agreement to limit fees through September 30, 2016.
| | |
| Annual Report | May 31, 2015 | 171 |
The Board determined that it would be in the best interests of the Fund and its shareholders to continue the advisory agreement. In light of the Fund’s current size and fee rate, the Board concluded that the fee structure was reasonable and that the absence of breakpoints in the Fund’s fee schedule was acceptable at this time.
The Arbitrage Credit Opportunities Fund
The Fund’s performance was compared to a Peer Group composed of a small group of funds within Morningstar’s Nontraditional Bond category that primarily focus on credit opportunities to generate returns, implement an absolute return or strategic income strategy and have lower duration, as well as to the Nontraditional Bond Category Group. The Fund’s total return for the one-year period was in the third quartile of both the Peer Group and the Category Group. The Fund lagged the Barclays U.S. Aggregate Bond Index for the one-year period. It was noted that the Fund’s standard deviation (a measure of volatility) ranked in the first quartile (meaning lowest volatility) of the Peer Group and the Category Group.
The Fund’s effective advisory fee was in the third quartile of the Category Group. The Fund’s net and gross expenses were in the fourth quartile of the Category Group. It was noted that the median asset size of the funds in the Peer Group was much larger than that of the Fund and that many of those funds appear to benefit from economies of scale. It was further noted that the Adviser had entered into an expense waiver and reimbursement agreement to limit fund fees and expenses through September 30, 2016.
The Board determined that it would be in the best interests of the Fund and its shareholders to continue the advisory agreement. In light of the Fund’s current size and fee rate, the Board concluded that the fee structure was reasonable and that the absence of breakpoints in the Fund’s fee schedule was acceptable at this time.
The Arbitrage Tactical Equity Fund
The Arbitrage Tactical Equity Fund had limited performance, with a return for only the first quarter of 2015. The Fund’s total return for the quarter ended March 31, 2015 was in the third quartile of the Market Neutral Category.
The Fund’s effective advisory fee was in the third quartile of the Category Group. The Fund’s net expenses were in the second quartile of the Category Group, and its gross expenses were in the first quartile.
The Board determined that it would be in the best interests of the Fund and its shareholders to continue the advisory agreement. In light of the Fund’s current size and fee rate, the Board concluded that the fee structure was reasonable and that the absence of breakpoints in the Fund’s fee schedule was acceptable at this time.
| | |
| 172 | www.arbitragefunds.com | 1-800-295-4485 |
The Arbitrage Funds | Trustees & Officers |
| May 31, 2015 |
The business of the Trust is managed under the direction of the Board in accordance with the Declaration of Trust of the Trust, which Declaration of Trust has been filed with the SEC and is available upon request. In May 2012, the Board voted to increase the number of Trustees from five to six, and elected Robert Herrmann to fill the vacancy created by increasing the number of Trustees. The Board also voted to appoint Burton Lehman as an adviser to the Board. As an adviser, Mr. Lehman attends meetings of the Board and acts as a non-voting participant. The Board voted to appoint Mr. Lehman as an adviser to the Board with the expectation that, in the future, it will call a meeting of shareholders to elect Trustees and Mr. Lehman will be one of the nominees.
The Trustees serve for an indefinite term and the officers are elected annually. It is the policy of the Board that each Trustee, at the conclusion of the first meeting at which the Trustee has attained age 75, shall retire from the Board; provided, however, with respect to Messrs. Burtt Ehrlich, Jay Goldberg, and Burton Lehman (if elected a Trustee), the mandatory retirement age is 77.
Pursuant to the Declaration of Trust, the Trustees elect the officers of the Trust to supervise its day-to-day operations. The Board retains the power to conduct, operate and carry on the business of the Trust and has the power to incur and pay any expenses which, in the opinion of the Board, are necessary or incidental to carry out any of the Trust’s purposes.
The Trustees, officers and employees of the Trust, when acting in such capacities, shall not be subject to any personal liability except for his or her own bad faith, willful misfeasance, gross negligence
or reckless disregard of his or her duties. Following is a list of the Trustees and executive officers of
the Trust.
INTERESTED TRUSTEE:
| Name, Address and Age | Length of Time Served | Position
with Trust | Principal Occupation
During the
Past Five Years | Other Directorships
During the Past Five Years | Number of Portfolios in the Fund Complex Overseen by Trustee |
John S. Orrico, CFA* 41 Madison Avenue, 42nd Floor, New York, NY 10010 (Age 54) | Since
May 2000 | President, and Trustee | Managing Member, Water Island Capital, LLC, the Investment Adviser, since January 2000. | None | 4 |
| * | John S. Orrico, as an affiliated person of the Adviser and as an officer of the Trust, is an “interested person” of the Trust within the meaning of Section 2(a)(19) of the 1940 Act. |
| | |
| Annual Report | May 31, 2015 | 173 |
INDEPENDENT TRUSTEES AND ADVISER TO THE BOARD:
| Name, Address and Age | Length of Time Served | Position
with Trust | Principal Occupation
During the
Past Five Years | Other Directorships
During the Past Five Years | Number of Portfolios in the Fund Complex Overseen by Trustee |
Burtt R. Ehrlich 41 Madison Avenue, 42nd Floor, New York, NY 10010 (Age 76) | Since
March 2005 | Trustee | Retired. | Member of the Board of Directors of Clarus Corporation (marketing firm) and P.C. Group FWC until 2010. | 4 |
Jay N. Goldberg
Hudson Venture Partners
535 Fifth Avenue 14th Floor
New York, NY 10017 (Age 72) | Since
May 2000 | Trustee | General Partner of Hudson Ventures (venture capital firm). | None | 4 |
John C. Alvarado
2504 Helena Street Houston, TX 77006 (Age 56) | Since December 2003 | Trustee | Mr. Alvarado is Managing Director at Alvarado Energy Advisors LLC. Alvarado Energy Advisors LLC is a boutique investment banking firm providing financial advisory services to middle market energy companies. Mr. Alvarado's primary focus is placement of private debt and equity securities. Prior to forming Alvarado Energy Advisors LLC, Mr. Alvarado was Managing Director of Energy Related Corporate Finance for The Seaport Group, a credit focused investment bank. Prior to joining The Seaport Group, Mr. Alvarado was Founder and Managing Member of Power Capital Partners, LLC, an energy related financial consulting
firm (2000 ‐ 2010). | None | 4 |
| | |
| 174 | www.arbitragefunds.com | 1-800-295-4485 |
The Arbitrage Funds | Trustees & Officers (continued) |
| May 31, 2015 (Unaudited) |
| Name, Address and Age | Length of Time Served | Position
with Trust | Principal Occupation
During the
Past Five Years | Other Directorships
During the Past Five Years | Number of Portfolios in the Fund Complex Overseen by Trustee |
Robert P. Herrmann 41 Madison Avenue, 42nd Floor, New York, NY 10010 (Age 53) | Since
May 2012 | Trustee | Chairman & CEO of Discovery Data, a leading financial services industry
data provider (2009 - present). Previously, CEO and director of Loring Ward International, Ltd. and President of SA Funds-Investment Trust (2005 - 2009). | None | 4 |
Burton Lehman 919 Third Avenue, New York, NY 10022 (Age 74) | Since
May 2012 | Adviser to
the Board | Of Counsel for Schulte, Roth & Zabel LLP (2006 - present). Previously, Senior Advisor and General Counsel of Tishman Speyer Properties (2003 - 2006) and Partner at Schulte Roth & Zabel (1969 - 2003). | None | 4 |
EXECUTIVE OFFICERS:
| Name, Address and Age | Length of Time Served | Position
with Trust | Principal Occupation
During the
Past Five Years | Other Directorships
During the Past Five Years | Number of Portfolios in the Fund Complex Overseen by Trustee |
Jennifer Avicolli 41 Madison Avenue, 42nd Floor, New York, NY 10010 (Age 42) | Since November 2013 | Secretary, Anti-Money Laundering Officer, Chief Compliance Officer | UBP Asset Management as
CCO (2004 - 2008), Cadogan Management (2011 - 2012), Associate General Counsel & Director of Compliance; Water Island Capital (2012 - present) General Counsel and Chief Compliance Officer. | N/A | N/A |
| | |
| Annual Report | May 31, 2015 | 175 |
| Name, Address and Age | Length of Time Served | Position
with Trust | Principal Occupation
During the
Past Five Years | Other Directorships
During the Past Five Years | Number of Portfolios in the Fund Complex Overseen by Trustee |
William Keena 41 Madison Avenue, 42nd Floor, New York, NY 10010 (Age 64) | Since November 2013 | Assistant Treasurer, Assistant Secretary | Consultant (2009 - 2010), Chief Administrative Officer Water Island Capital (2010 - present). | N/A | N/A |
Jonathon Hickey 41 Madison Avenue, 42nd Floor, New York, NY 10010 (Age 34) | Since November 2013 | Treasurer | Fund Accounting Manager (SEI 2004 - 2011). | N/A | N/A |
Kim Storms ALPS Fund Services, Inc. 1290 Broadway Suite 1100 Denver, CO 80203 (Age 43) | Since August 2011 | Chief
Financial Officer | Director of Fund Administration
(2004 - present), Senior Vice President (2009 -present) and Vice President (2005-2009), ALPS Fund Services, Inc.; Treasurer of ALPS ETF Trust (2008 - 2012); Treasurer of Liberty All-Star Equity Fund, Liberty All-Star Growth Fund, Inc., Financial Investors Trust, ALPS Series Trust and BPV Family
of Funds. | N/A | N/A |
| * | ALPS Fund Services, Inc. is the Administrator, Bookkeeping and Pricing Agent for the Funds, and is an affiliated person of ALPS Distributors, Inc., the distributor of the Funds. |
Additional information about members of the Board of Trustees and Officers is available in the Statement of Additional Information (SAI). To obtain a free copy of the SAI, please call 1-800-295-4485.
| | |
| 176 | www.arbitragefunds.com | 1-800-295-4485 |
This Page Intentionally Left Blank
Item 2. Code of Ethics.
| (a) | The Registrant, as of the end of the period covered by the report, has adopted a code of ethics that applies to the Registrant's principal executive officer, principal financial officer, principal accounting officer or controller or any persons performing similar functions on behalf of the Registrant. |
| (c) | During the period covered by this report, no amendments were made to the provisions of the code of ethics adopted in 2(a) above. |
| (d) | During the period covered by this report, no implicit or explicit waivers to the provisions of the code of ethics adopted in 2(a) above were granted. |
| (f) | The Registrant's Code of Ethics is attached as an Exhibit hereto. |
Item 3. Audit Committee Financial Expert.
(a)(1) The Registrant’s board of trustees has determined that the Registrant has at least one audit committee financial expert serving on the audit committee.
(a)(2) The audit committee financial expert is John C. Alvarado, who is independent as defined in Form N-CSR Item 3(a)(2).
Item 4. Principal Accountant Fees and Services.
| (a) | Audit Fees: For the Registrant’s fiscal years ended May 31, 2015 and May 31, 2014, the aggregate fees billed for professional services rendered by the principal accountant for the audit of the Registrant’s annual financial statements were $96,300 and $75,700, respectively. |
| (b) | Audit-Related Fees: For the Registrant’s fiscal years ended May 31, 2015 and May 31, 2014, the aggregate fees billed for professional services rendered by the principal accountant for consent procedures related to the update to the Registrant’s Prospectus and Statement of Additional Information were $0 and $0, respectively. |
| (c) | Tax Fees: For the Registrant’s fiscal years ended May 31, 2015 and May 31, 2014, aggregate fees of $15,700, and $11,300, respectively, were billed for professional services rendered by the principal accountant for tax compliance, tax advice, and tax planning. |
| (d) | All Other Fees: For the Registrant’s fiscal years ended May 31, 2015 and May 31, 2014, no fees were billed to Registrant by the principal accountant for services other than the services reported in paragraphs (a) through (c) of this item. |
(e)(1) Audit Committee Pre-Approval Policies and Procedures: All services to be performed by the Registrant's principal auditors must be pre-approved by the Registrant's audit committee.
(e)(2) No services described in paragraphs (b) through (d) were approved pursuant to paragraph (c)(7)(i)(C) of Rule 2-01 of Regulation S-X.
| (g) | The aggregate non-audit fees billed by the Registrant’s principle accountant for the fiscal years ended May 31, 2015 and May 31, 2014 were $0 and $0, respectively. |
Item 5. Audit Committee of Listed Registrants.
Not applicable.
Item 6. Schedule of Investments.
The Schedule of Investments is included as part of the Report to Stockholders filed under Item 1 of this form.
Item 7. Disclosure of Proxy Voting Policies and Procedures for Closed-End Management Investment Companies.
Not applicable
Item 8. Portfolio Managers of Closed-End Management Investment Companies.
Not applicable.
Item 9. Purchases of Equity Securities by Closed-End Management Investment Company and Affiliated Purchasers.
Not applicable.
Item 10. Submission of Matters to Vote of Security Holders.
There have been no material changes to the procedures by which shareholders may recommend nominees to the registrant’s Board of Trustees.
Item 11. Controls and Procedures.
| (a) | The registrant’s principal executive officer and principal financial officer have evaluated the registrant’s disclosure controls and procedures (as defined in Rule 30a-3(c) under the Investment Company Act of 1940, as amended) within 90 days of this filing and have concluded that the registrant’s disclosure controls and procedures were effective, as of that date. |
| (b) | There was no change in the registrant’s internal control over financial reporting (as defined in Rule 30a-3(d) under the Investment Company Act of 1940, as amended) during the second fiscal quarter of the period covered by this report that has materially affected, or is reasonably likely to materially affect, the registrant’s internal control over financial reporting. |
Item 12. Exhibits.
(a)(1) The code of ethics that applies to the registrant's principal executive officer and principal financial officer is attached hereto as EX-12.A.1.
(a)(2) A separate certification for the principal executive officer and the principal financial officer of the registrant as required by Rule 30a-2(a) under the Investment Company Act of 1940, as amended (17 CFR 270.30a-2(a)), are filed herewith.
(a)(3) Not applicable.
| (b) | The certifications by the registrant’s Principal Executive Officer and Principal Financial Officer, as required by Rule 30a-2(b) of the Investment Company Act of 1940, as amended, and Section 906 of the Sarbanes-Oxley Act of 2002 are attached hereto as Ex99.906Cert. |
SIGNATURES
Pursuant to the requirements of the Securities Exchange Act of 1934 and the Investment Company Act of 1940, the registrant has duly caused this report to be signed on its behalf by the undersigned, thereunto duly authorized.
THE ARBITRAGE FUNDS
| By: | /s/ John S. Orrico | |
| | John S. Orrico | |
| | President | |
| | | |
| Date: | August 5, 2015 | |
Pursuant to the requirements of the Securities Exchange Act of 1934 and the Investment Company Act of 1940, this report has been signed below by the following persons on behalf of the registrant and in the capacities and on the dates indicated.
| By: | /s/ John S. Orrico | |
| | John S. Orrico | |
| | President | |
| | | |
| Date: | August 5, 2015 | |
| By: | /s/ Kim Storms | |
| | Kim Storms | |
| | Chief Financial Officer | |
| | | |
| Date: | August 5, 2015 |