UNITED STATES
SECURITIES AND EXCHANGE COMMISSION
Washington, D.C. 20549
FORM N-CSR
CERTIFIED SHAREHOLDER REPORT OF REGISTERED
MANAGEMENT INVESTMENT COMPANIES
Investment Company Act file number: 811-09815
the arbitrage funds
(exact name of registrant as specified in charter)
41 Madison Avenue, 42nd Floor, New York, NY 10010
(Address of principal executive offices) (Zip code)
John S. Orrico
Water Island Capital, LLC
41 Madison Avenue
42nd Floor
New York, NY 10010
(Name and address of agent for service)
Registrant’s telephone number, including area code: 800-295-4485
Date of fiscal year end: May 31
Date of reporting period: November 30, 2020
Item 1. Reports to Stockholders.

Semi-Annual Report
November 30, 2020
Arbitrage Fund
Water Island Event-Driven Fund
Water Island Credit Opportunities Fund
Water Island Long/Short Fund

TABLE OF CONTENTS
Arbitrage Fund | |
Portfolio Information | | | 1 | | |
Portfolio of Investments | | | 3 | | |
Water Island Event-Driven Fund | |
Portfolio Information | | | 16 | | |
Portfolio of Investments | | | 18 | | |
Water Island Credit Opportunities Fund | |
Portfolio Information | | | 33 | | |
Portfolio of Investments | | | 35 | | |
Water Island Long/Short Fund | |
Portfolio Information | | | 45 | | |
Portfolio of Investments | | | 47 | | |
Statements of Assets and Liabilities | | | 56 | | |
Statements of Operations | | | 60 | | |
Statements of Changes in Net Assets | | | 64 | | |
Financial Highlights | |
Arbitrage Fund - Class R | | | 68 | | |
Arbitrage Fund - Class I | | | 70 | | |
Arbitrage Fund - Class C | | | 72 | | |
Arbitrage Fund - Class A | | | 74 | | |
Water Island Event-Driven Fund - Class R | | | 76 | | |
Water Island Event-Driven Fund - Class I | | | 78 | | |
Water Island Event-Driven Fund - Class C | | | 80 | | |
Water Island Event-Driven Fund - Class A | | | 82 | | |
Water Island Credit Opportunities Fund - Class R | | | 84 | | |
Water Island Credit Opportunities Fund - Class I | | | 86 | | |
Water Island Credit Opportunities Fund - Class C | | | 88 | | |
Water Island Credit Opportunities Fund - Class A | | | 90 | | |
Water Island Long/Short Fund - Class R | | | 92 | | |
Water Island Long/Short Fund - Class I | | | 94 | | |
Notes to Financial Statements | | | 96 | | |
Disclosure of Fund Expenses | | | 122 | | |
Additional Information | | | 125 | | |
Arbitrage Fund Portfolio Information
November 30, 2020 (Unaudited)
Performance (annualized returns as of November 30, 2020)
| | One
Year | | Five
Year | | Ten
Year | | Since
Inception* | |
Arbitrage Fund, Class R | | | 4.45 | % | | | 3.24 | % | | | 2.31 | % | | | 3.98 | % | |
Arbitrage Fund, Class I | | | 4.76 | % | | | 3.50 | % | | | 2.56 | % | | | 3.13 | % | |
Arbitrage Fund, Class C** | | | 3.62 | % | | | 2.46 | % | | | N/A | | | | 1.51 | % | |
Arbitrage Fund, Class A*** | | | 4.46 | % | | | 3.23 | % | | | N/A | | | | 2.52 | % | |
ICE BofA Merrill Lynch U.S. 3-Month
Treasury Bill Index**** | | | 0.80 | % | | | 1.20 | % | | | 0.64 | % | | | 1.58 | % | |
Current performance may be higher or lower than performance quoted above. Any performance data quoted represents past performance and the investment return and principal value of an investment in the Fund will fluctuate so that an investor's shares, when redeemed, may be worth more or less than their original cost. Past performance is no guarantee of future results. Returns shown above include the reinvestment of all dividends and capital gains. Performance results do not include adjustments made for financial reporting purposes in accordance with U.S. generally accepted accounting principles and may differ from the amount reported in the Financial Highlights. You can obtain performance data current to the most recent month end by calling 1-800-295-4485 or going to www.arbitragefunds.com.
* Class R inception: 9/18/00; Class I inception: 10/17/03; Class C inception: 6/1/12; Class A inception: 6/1/13. The "Since Inception" returns for securities indices are for the inception date of Class R shares.
** Class C shares are subject to a 1.00% contingent deferred sales charge on all purchases redeemed within 12 months of purchase.
*** Class A shares are subject to a maximum front-end sales load of 2.75% on purchases up to $250,000. The shares are also subject to a deferred sales charge of up to 1.00% on purchases of $250,000 or more purchased without a front-end sales charge and redeemed within 18 months of purchase.
**** Merger arbitrage and event-driven investing are market neutral investment strategies, which typically exhibit low betas and low correlations to broad equity and credit market indices. As such, the adviser has determined that a more appropriate benchmark for Arbitrage Fund is a measure of the risk-free rate, in this case the ICE Bank of America (BofA) Merrill Lynch U.S. 3-Month Treasury Bill Index.
The Total Annual Fund Operating Expenses for Class R, Class I, Class C and Class A are 1.71%, 1.46%, 2.46% and 1.71%, respectively. These expense ratios are as stated in the current prospectus and may differ from the expense ratios disclosed in the financial highlights in this report.
The ICE BofA Merrill Lynch U.S. 3-Month Treasury Bill Index tracks the performance of the U.S. dollar denominated U.S. Treasury Bills publicly issued in the U.S. domestic market with a remaining term to final maturity of less than 3 months.
An investor may not invest directly in an index.
Semi-Annual Report | November 30, 2020
1
Arbitrage Fund Portfolio Information (continued)
November 30, 2020 (Unaudited)
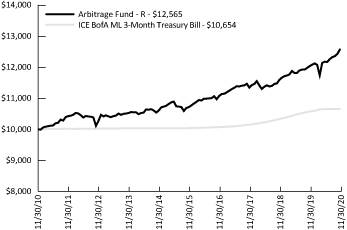
Growth of $10,000 Investment
The chart represents historical performance of a hypothetical investment of $10,000 in the Class R shares of the Fund. Past performance does not guarantee future results. This chart does not reflect the deduction of taxes that a shareholder would pay on Fund distributions or the redemption of Fund shares.
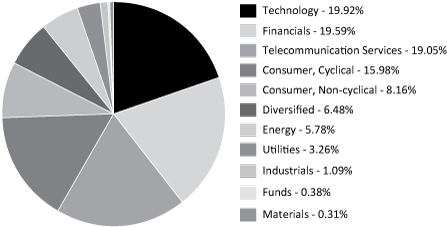
Sector Weighting
The following chart shows the sector weightings of the Arbitrage Fund's investments (including short sales and excluding derivatives) as of the report date.

www.arbitragefunds.com | 1-800-295-4485
2
Arbitrage Fund Portfolio of Investments
November 30, 2020 (unaudited)
| | | Shares | | Value | |
COMMON STOCKS - 84.15% | |
Auto Manufacturers - 2.46% | |
Fiat Chrysler Automobiles N.V.(a) | | | 873,683 | | | $ | 13,617,035 | | |
Navistar International Corp.(a) | | | 484,031 | | | | 21,423,212 | | |
| | | | 35,040,247 | | |
Auto Parts & Equipment - 0.19% | |
Velodyne Lidar, Inc.(a) | | | 170,402 | | | | 2,712,800 | | |
Banks - 0.97% | |
CIT Group, Inc.(b) | | | 412,973 | | | | 13,830,466 | | |
Beverages - 0.50% | |
Coca-Cola Amatil Ltd. | | | 765,099 | | | | 7,104,505 | | |
Commercial Services - 1.04% | |
Cpl Resources Plc | | | 98,001 | | | | 1,309,286 | | |
Devoteam SA(a) | | | 71,221 | | | | 8,308,697 | | |
Horizon Discovery Group Plc(a) | | | 639,674 | | | | 1,616,021 | | |
IHS Markit Ltd. | | | 35,934 | | | | 3,573,996 | | |
Worldline SA(a)(c) | | | 1 | | | | 55 | | |
| | | �� | 14,808,055 | | |
Computers & Computer Services - 4.39% | |
58.COM, Inc., Class A(a)(d) | | | 1,487,130 | | | | 41,639,640 | | |
Virtusa Corp.(a) | | | 418,282 | | | | 20,947,562 | | |
| | | | 62,587,202 | | |
Construction Materials - 0.30% | |
Norbord, Inc. | | | 114,505 | | | | 4,292,946 | | |
Distribution/Wholesale - 2.99% | |
HD Supply Holdings, Inc.(a) | | | 762,341 | | | | 42,523,381 | | |
Diversified Financial Services - 6.03% | |
Eaton Vance Corp.(b) | | | 1,121,375 | | | | 75,109,698 | | |
Genworth MI Canada, Inc. | | | 320,425 | | | | 10,762,253 | | |
| | | | 85,871,951 | | |
Electric - 3.68% | |
PNM Resources, Inc. | | | 1,066,192 | | | | 52,360,689 | | |
Entertainment - 0.82% | |
William Hill Plc | | | 3,281,677 | | | | 11,733,665 | | |
Forest Products & Paper - 0.36% | |
Ahlstrom-Munksjo Oyj | | | 236,395 | | | | 5,075,710 | | |
Hand/Machine Tools - 0.33% | |
IMA Industria Macchine Automatiche SpA(a) | | | 57,332 | | | | 4,643,580 | | |
See Notes to Financial Statements.
Semi-Annual Report | November 30, 2020
3
Arbitrage Fund Portfolio of Investments (continued)
November 30, 2020 (unaudited)
| | | Shares | | Value | |
COMMON STOCKS - 84.15% (Continued) | |
Healthcare - Products - 3.81% | |
Varian Medical Systems, Inc.(a) | | | 311,860 | | | $ | 54,257,403 | | |
Household Products - 0.91% | |
Unilever Plc, ADR | | | 212,814 | | | | 12,994,423 | | |
Insurance - 9.81% | |
National General Holdings Corp. | | | 1,741,195 | | | | 59,339,925 | | |
TOWER Ltd.(a) | | | 9,485,696 | | | | 4,024,078 | | |
Watford Holdings Ltd.(a)(b) | | | 564,785 | | | | 19,609,335 | | |
Willis Towers Watson Plc(b) | | | 272,278 | | | | 56,685,557 | | |
| | | | 139,658,895 | | |
Internet - 2.58% | |
Endurance International Group Holdings, Inc.(a)(b) | | | 937,764 | | | | 8,890,003 | | |
Grubhub, Inc.(a)(b) | | | 396,544 | | | | 27,892,905 | | |
| | | | 36,782,908 | | |
Oil & Gas - 2.90% | |
Concho Resources, Inc.(b) | | | 511,676 | | | | 29,411,136 | | |
Parsley Energy, Inc., Class A(b) | | | 493,326 | | | | 6,181,375 | | |
WPX Energy, Inc.(a)(b) | | | 799,113 | | | | 5,689,685 | | |
| | | | 41,282,196 | | |
Pharmaceuticals - 0.77% | |
BioSpecifics Technologies Corp.(a) | | | 123,794 | | | | 10,943,390 | | |
Real Estate - 0.41% | |
McCarthy & Stone Plc(a)(c) | | | 3,743,581 | | | | 5,839,184 | | |
Real Estate Investment Trusts - 3.31% | |
Front Yard Residential Corp.(b) | | | 1,161,935 | | | | 18,962,779 | | |
Taubman Centers, Inc.(b) | | | 661,145 | | | | 28,244,114 | | |
| | | | 47,206,893 | | |
Retail - 9.53% | |
BMC Stock Holdings, Inc.(a) | | | 410,238 | | | | 20,077,048 | | |
Dunkin' Brands Group, Inc. | | | 466,907 | | | | 49,650,890 | | |
Foundation Building Materials, Inc.(a) | | | 469,012 | | | | 9,023,791 | | |
Tiffany & Co. | | | 432,793 | | | | 56,903,624 | | |
| | | | 135,655,353 | | |
Semiconductors - 6.94% | |
AVX Corp.(a)(d) | | | 1,022,500 | | | | 6,390,625 | | |
Maxim Integrated Products, Inc.(b) | | | 672,510 | | | | 55,845,231 | | |
Xilinx, Inc.(b) | | | 251,855 | | | | 36,657,495 | | |
| | | | 98,893,351 | | |
See Notes to Financial Statements.
www.arbitragefunds.com | 1-800-295-4485
4
Arbitrage Fund Portfolio of Investments (continued)
November 30, 2020 (unaudited)
| | | Shares | | Value | |
COMMON STOCKS - 84.15% (Continued) | |
Software - 3.44% | |
Codemasters Group Holdings Plc(a) | | | 584,609 | | | $ | 3,928,033 | | |
MINDBODY, Inc., Class A(a)(d) | | | 843,793 | | | | 30,798,444 | | |
MobileIron, Inc.(a) | | | 2,035,789 | | | | 14,331,955 | | |
Onemarket Ltd.(a)(d) | | | 111,800 | | | | — | | |
| | | | 49,058,432 | | |
Special Purpose Acquisition Companies - 0.23% | |
Fast Acquisition Corp.(a) | | | 148,872 | | | | 1,540,825 | | |
Fusion Acquisition Corp.(a) | | | 162,368 | | | | 1,704,864 | | |
| | | | 3,245,689 | | |
Telecommunications - 15.45% | |
Acacia Communications, Inc.(a)(b) | | | 956,172 | | | | 66,626,065 | | |
Altice Europe N.V.(a) | | | 293,688 | | | | 1,547,740 | | |
Cincinnati Bell, Inc.(a)(b) | | | 1,380,047 | | | | 20,990,515 | | |
GCI Liberty, Inc., Class A(a)(b) | | | 660,966 | | | | 60,227,222 | | |
Gilat Satellite Networks Ltd. | | | 250,950 | | | | 1,520,757 | | |
LogMeIn, Inc.(a)(d) | | | 778,758 | | | | 69,044,684 | | |
| | | | 219,956,983 | | |
TOTAL COMMON STOCKS
(Cost $1,133,332,581) | | | 1,198,360,297 | | |
RIGHTS - 0.11% | |
Bristol-Myers Squibb Co.(a) | | | 408,177 | | | | 481,649 | | |
Contra Pfenex, Inc.(d) | | | 1,108,177 | | | | 844,431 | | |
Elanco Animal Health, Inc. CVR(d) | | | 1,124,589 | | | | — | | |
Media General, Inc. CVR(d) | | | 613,589 | | | | — | | |
NewStar Financial, Inc. CVR(d) | | | 1,514,945 | | | | — | | |
Stemline Therapeutics, Inc. CVR(d) | | | 693,435 | | | | 239,373 | | |
TOTAL RIGHTS
(Cost $1,429,232) | | | 1,565,453 | | |
| | | Maturity
Date | | Rate | | Principal
Amount | | Value | |
CORPORATE BONDS - 0.37% | |
Entertainment - 0.37% | |
Stars Group Holdings B.V. /
Stars Group US
Co-Borrower LLC(c) | | 07/15/2026 | | | 7.000 | % | | $ | 4,949,000 | | | $ | 5,233,568 | | |
TOTAL CORPORATE BONDS
(Cost $5,236,584) | | | 5,233,568 | | |
See Notes to Financial Statements.
Semi-Annual Report | November 30, 2020
5
Arbitrage Fund Portfolio of Investments (continued)
November 30, 2020 (unaudited)
| | | Shares | | Value | |
MUTUAL FUNDS - 4.95% | |
Water Island Event-Driven Fund, Class I(e) | | | 6,589,384 | | | $ | 70,506,411 | | |
TOTAL MUTUAL FUNDS
(Cost $60,459,409) | | | | | 70,506,411 | | |
PRIVATE INVESTMENTS(d)(f) - 0.07% | |
Fast Capital LLC(a) | | | 290,700 | | | | 290,700 | | |
Fuse LLC(a) | | | 725,800 | | | | 659,818 | | |
Fuse Sponsor Capital, Z2 Shares(a) | | | 72,580 | | | | 65,982 | | |
TOTAL PRIVATE INVESTMENTS
(Cost $1,033,484) | | | | | 1,016,500 | | |
| | | Expiration
Date | | Exercise
Price | | Notional
Amount | | Contracts | | Value | |
PURCHASED OPTIONS(a) - 0.06% | |
Call Options Purchased - 0.05% | |
Devon Energy Corp. | | 01/2021 | | $ | 13.74 | | | $ | 4,935,672 | | | | 3,528 | | | $ | 458,640 | | |
S&P Global, Inc. | | 01/2021 | | | 350.00 | | | | 2,743,884 | | | | 78 | | | | 115,440 | | |
Taubman Centers, Inc. | |
| | | 01/2021 | | | 40.00 | | | | 2,114,640 | | | | 495 | | | | 148,500 | | |
| | | 01/2021 | | | 45.00 | | | | 8,526,912 | | | | 1,996 | | | | 0 | | |
TOTAL CALL OPTIONS PURCHASED
(Cost $619,848) | | | 722,580 | | |
Put Options Purchased - 0.01% | |
iShares iBoxx $ Investment
Grade Corporate
Bond ETF | | 01/2021 | | | 130.00 | | | | 20,051,904 | | | | 1,448 | | | | 32,580 | | |
iShares Russell 2000 ETF | |
| | | 01/2021 | | | 142.00 | | | | 2,896,320 | | | | 160 | | | | 7,200 | | |
| | | 01/2021 | | | 145.00 | | | | 2,842,014 | | | | 157 | | | | 8,792 | | |
TOTAL PUT OPTIONS PURCHASED
(Cost $501,138) | | | 48,572 | | |
TOTAL PURCHASED OPTIONS
(Cost $1,120,986) | | | 771,152 | | |
See Notes to Financial Statements.
www.arbitragefunds.com | 1-800-295-4485
6
Arbitrage Fund Portfolio of Investments (continued)
November 30, 2020 (unaudited)
| | | Yield | | Shares | | Value | |
SHORT-TERM INVESTMENTS - 7.70% | |
Money Market Funds | |
Morgan Stanley Institutional Liquidity
Fund Government Portfolio,
Institutional Class | | | 0.020 | %(g) | | | 54,814,881 | | | $ | 54,814,881 | | |
State Street Institutional U.S.
Government Money Market
Fund, Premier Class | | | 0.132 | %(g) | | | 54,814,882 | | | | 54,814,882 | | |
| | | | | | | | 109,629,763 | | |
TOTAL SHORT-TERM INVESTMENTS
(Cost $109,629,763) | | | 109,629,763 | | |
Total Investments - 97.41%
(Cost $1,312,242,039) | | | 1,387,083,144 | | |
Other Assets in Excess of Liabilities - 2.59%(h) | | | 36,950,960 | | |
NET ASSETS - 100.00% | | $ | 1,424,034,104 | | |
Portfolio Footnotes
(a) Non-income-producing security.
(b) Security, or a portion of security, is being held as collateral for short sales or forward foreign currency exchange contracts. At November 30, 2020, the aggregate fair market value of those securities was $278,072,980, representing 19.53% of net assets.
(c) Security exempt from registration under Rule 144A of the Securities Act of 1933. These securities may be resold in transactions exempt from registration, normally to qualified institutional buyers. As of November 30, 2020, these securities had a total value of $11,072,807 or 0.78% of net assets.
(d) Security fair valued using significant unobservable inputs and classified as a Level 3 security. As of November 30, 2020, the total fair market value of these securities was $149,973,697, representing 10.53% of net assets.
(e) Affiliated investment.
(f) Represents a holding that is a direct investment into a private company and is not a listed or publicly traded entity.
(g) Rate shown is the 7-day effective yield as of November 30, 2020.
(h) Includes cash held as collateral for short sales.
SCHEDULE OF SECURITIES SOLD SHORT | | Shares | | Value | |
COMMON STOCKS - (19.92%) | |
Auto Manufacturers - (0.83%) | |
Peugeot SA | | | (501,540 | ) | | $ | (11,824,653 | ) | |
Banks - (1.13%) | |
First Citizens BancShares, Inc., Class A | | | (25,605 | ) | | | (13,534,547 | ) | |
Morgan Stanley | | | (41,020 | ) | | | (2,536,267 | ) | |
| | | | (16,070,814 | ) | |
See Notes to Financial Statements.
Semi-Annual Report | November 30, 2020
7
Arbitrage Fund Portfolio of Investments (continued)
November 30, 2020 (unaudited)
SCHEDULE OF SECURITIES SOLD SHORT | | Shares | | Value | |
Commercial Services - (0.25%) | |
S&P Global, Inc. | | | (10,198 | ) | | $ | (3,587,452 | ) | |
Construction Materials - (1.42%) | |
Builders FirstSource, Inc. | | | (538,511 | ) | | | (20,145,697 | ) | |
Food - (1.98%) | |
Just Eat Takeaway.com N.V. | | | (266,079 | ) | | | (28,260,626 | ) | |
Forest Products & Paper - (0.30%) | |
West Fraser Timber Co. Ltd. | | | (77,366 | ) | | | (4,283,814 | ) | |
Media - (4.23%) | |
Liberty Broadband Corp. | | | (383,121 | ) | | | (60,284,089 | ) | |
Oil & Gas - (2.92%) | |
ConocoPhillips | | | (747,047 | ) | | | (29,553,179 | ) | |
Devon Energy Corp. | | | (412,655 | ) | | | (5,773,043 | ) | |
Pioneer Natural Resources Co. | | | (61,765 | ) | | | (6,212,324 | ) | |
| | | | (41,538,546 | ) | |
Semiconductors - (6.65%) | |
Advanced Micro Devices, Inc. | | | (434,047 | ) | | | (40,218,795 | ) | |
Analog Devices, Inc. | | | (391,982 | ) | | | (54,516,857 | ) | |
| | | | (94,735,652 | ) | |
Software - (0.21%) | |
Take-Two Interactive Software, Inc. | | | (16,567 | ) | | | (2,990,509 | ) | |
TOTAL COMMON STOCKS
(Proceeds $249,087,538) | | | (283,721,852 | ) | |
EXCHANGE-TRADED FUNDS - (0.54%) | |
Equity Funds - (0.54%) | |
Health Care Select Sector SPDR® Fund | | | (15,687 | ) | | | (1,721,491 | ) | |
iShares MSCI Australia ETF | | | (149,874 | ) | | | (3,405,137 | ) | |
iShares Russell 2000 Growth ETF | | | (6,806 | ) | | | (1,787,188 | ) | |
iShares Russell 2000 Value ETF | | | (5,920 | ) | | | (725,911 | ) | |
| | | | (7,639,727 | ) | |
TOTAL EXCHANGE-TRADED FUNDS
(Proceeds $6,930,245) | | | (7,639,727 | ) | |
TOTAL SECURITIES SOLD SHORT
(Proceeds $256,017,783) | | $ | (291,361,579 | ) | |
See Notes to Financial Statements.
www.arbitragefunds.com | 1-800-295-4485
8
Arbitrage Fund Portfolio of Investments (continued)
November 30, 2020 (unaudited)
EQUITY SWAP CONTRACTS
Swap
Counterparty/
Payment
Frequency | | Reference
Obligation | | Rate
Paid/
Received
by the
Fund | | Termination
Date | | Upfront
Payments
Paid | | Upfront
Payments
Received | | Market
Value | | Notional
Amount | | Unrealized
Appreciation | |
Morgan
Stanley &
Co./
Monthly
| | Unilever
Plc
| | Received
1 Month
SONIA
Minus
35 bps
(-0.054%) | | 06/16/2021 | | $ | — | | | $ | — | | | $ | — | | |
GBP
1,013,985 | | $ | — | | |
Goldman
Sachs &
Co./
Monthly
| | Unilever
Plc
| | Received
1 Week
GBP LIBOR
Minus
40 bps
(-0.036%) | | 06/17/2021 | | | — | | | | — | | | | — | | |
GBP
8,713,743 | | | — | | |
Morgan
Stanley &
Co./
Monthly
| | Analog
Devices,
Inc.
| | Received
1 Month-
Federal
Rate
Minus
40 bps
(-0.320%) | | 08/12/2021 | | | — | | | | — | | | | — | | |
USD
4,406,889 | | | — | | |
Morgan
Stanley &
Co./
Monthly
| | Aon Plc
| | Received
1 Month-
Federal
Rate
Minus
40 bps
(-0.320%) | | 08/12/2021 | | | — | | | | — | | | | — | | |
USD
60,249,749 | | | — | | |
Goldman
Sachs &
Co./
Monthly
| | William
Hill Plc
| | Paid
1 Month
GBP LIBOR
Plus
45 bps
(0.440%) | | 10/19/2021 | | | — | | | | — | | | | — | | |
GBP
9,538,528 | | | — | | |
Goldman
Sachs &
Co./
Monthly
| | Morgan
Stanley
| | Received
1 Month
LIBOR
Minus
40 bps
(-0.260%) | | 10/28/2021 | | | — | | | | — | | | | — | | |
USD
37,906,551 | | | — | | |
See Notes to Financial Statements.
Semi-Annual Report | November 30, 2020
9
Arbitrage Fund Portfolio of Investments (continued)
November 30, 2020 (unaudited)
Swap
Counterparty/
Payment
Frequency | | Reference
Obligation | | Rate
Paid/
Received
by the
Fund | | Termination
Date | | Upfront
Payments
Paid | | Upfront
Payments
Received | | Market
Value | | Notional
Amount | | Unrealized
Appreciation | |
Goldman
Sachs &
Co./
Monthly
| | Kaz
Minerals Plc
| | Paid
1 Month
GBP
LIBOR
Plus
45 bps
(0.639%) | |
11/01/2021 | | $ | — | | | $ | — | | | $ | — | | |
GBP
2,208,146 | | $ | — | | |
Goldman
Sachs &
Co./
Monthly
| | Alternative
Credit
Investments
| | Paid
1 Month
GBP
LIBOR
Plus
70 bps
(0.743%) | |
11/05/2021 | | | — | | | | — | | | | — | | |
GBP
1,951,045 | | | — | | |
Goldman
Sachs &
Co./
Monthly
| | Cpl
Resources
Plc
| | Paid
1 Month
EURIBOR
Plus
90 bps
(0.350%) | |
11/08/2021 | | | — | | | | — | | | | — | | |
EUR
1,914,662 | | | — | | |
Goldman
Sachs &
Co./
Monthly
| | Urban &
Civic Plc
| | Paid
1 Month
GBP
LIBOR
Plus
60 bps
(1.000%) | |
11/10/2021 | | | — | | | | — | | | | — | | |
GBP
6,693,134 | | | — | | |
Morgan
Stanley &
Co./
Monthly
| | RSA
Insurance
Group Plc
| | Paid
1 Month
LIBOR
Plus
50 bps
(0.554%) | |
08/05/2022 | | | — | | | | — | | | | — | | |
GBP
6,421,030 | | | — | | |
| | | | | | | | | | | | | $ | — | | | | | $ | — | | |
See Notes to Financial Statements.
www.arbitragefunds.com | 1-800-295-4485
10
Arbitrage Fund Portfolio of Investments (continued)
November 30, 2020 (unaudited)
OUTSTANDING FORWARD FOREIGN CURRENCY EXCHANGE CONTRACTS
Currency
Purchased | | Currency Sold | | Counterparty | | Settlement
Date | | Unrealized
Appreciation | |
AUD | 107,100 | | | USD | 77,958 | | | Morgan Stanley & Co. | | 12/15/2020 | | $ | 670 | | |
CAD | 371,700 | | | USD | 285,293 | | | Morgan Stanley & Co. | | 12/15/2020 | | | 941 | | |
USD | 175,418 | | | CAD | 227,500 | | | Morgan Stanley & Co. | | 12/15/2020 | | | 228 | | |
CHF | 18,922,100 | | | USD | 20,763,022 | | | Morgan Stanley & Co. | | 12/15/2020 | | | 69,271 | | |
USD | 557,829 | | | CHF | 505,400 | | | Morgan Stanley & Co. | | 12/15/2020 | | | 1,409 | | |
EUR | 31,143,800 | | | USD | 36,673,029 | | | Morgan Stanley & Co. | | 12/15/2020 | | | 491,261 | | |
GBP | 6,120,042 | | | USD | 8,035,696 | | | Morgan Stanley & Co. | | 12/15/2020 | | | 124,679 | | |
USD | 1,682,374 | | | GBP | 1,258,900 | | | Morgan Stanley & Co. | | 12/15/2020 | | | 3,775 | | |
NZD | 16,402,800 | | | USD | 10,939,967 | | | Morgan Stanley & Co. | | 12/15/2020 | | | 561,984 | | |
USD | 99,847 | | | NZD | 142,200 | | | Morgan Stanley & Co. | | 12/15/2020 | | | 134 | | |
SEK | 39,783,300 | | | USD | 4,534,919 | | | Morgan Stanley & Co. | | 12/15/2020 | | | 104,744 | | |
| | | $ | 1,359,096 | | |
Currency
Purchased | | Currency Sold | | Counterparty | | Settlement
Date | | Unrealized
Depreciation | |
USD | 7,066,364 | | | AUD | 9,724,400 | | | Morgan Stanley & Co. | | 12/15/2020 | | $ | (72,834 | ) | |
USD | 10,704,804 | | | CAD | 14,117,900 | | | Morgan Stanley & Co. | | 12/15/2020 | | | (166,917 | ) | |
CHF | 252,700 | | | USD | 279,171 | | | Morgan Stanley & Co. | | 12/15/2020 | | | (961 | ) | |
USD | 20,471,393 | | | CHF | 18,669,400 | | | Morgan Stanley & Co. | | 12/15/2020 | | | (82,691 | ) | |
EUR | 173,000 | | | USD | 206,910 | | | Morgan Stanley & Co. | | 12/15/2020 | | | (467 | ) | |
USD | 47,582,707 | | | EUR | 40,238,000 | | | Morgan Stanley & Co. | | 12/15/2020 | | | (433,805 | ) | |
USD | 38,363,176 | | | GBP | 29,164,973 | | | Morgan Stanley & Co. | | 12/15/2020 | | | (524,980 | ) | |
NZD | 237,100 | | | USD | 166,335 | | | Morgan Stanley & Co. | | 12/15/2020 | | | (76 | ) | |
USD | 14,951,712 | | | NZD | 22,236,500 | | | Morgan Stanley & Co. | | 12/15/2020 | | | (640,939 | ) | |
PLN | 54,095,200 | | | USD | 14,478,257 | | | Morgan Stanley & Co. | | 12/15/2020 | | | (64,481 | ) | |
USD | 13,992,910 | | | PLN | 54,095,200 | | | Morgan Stanley & Co. | | 12/15/2020 | | | (420,866 | ) | |
USD | 4,554,148 | | | SEK | 39,783,300 | | | Morgan Stanley & Co. | | 12/15/2020 | | | (85,513 | ) | |
| | | $ | (2,494,530 | ) | |
See Notes to Financial Statements.
Semi-Annual Report | November 30, 2020
11
Arbitrage Fund Portfolio of Investments (continued)
November 30, 2020 (unaudited)
The following is a summary of investments classified by country exposure:
Country | | % of Net Assets(a) | |
United Kingdom | | | 7.71 | % | |
Cayman Islands | | | 2.92 | % | |
Bermuda | | | 1.38 | % | |
United States Virgin Islands | | | 1.33 | % | |
Canada | | | 1.06 | % | |
France | | | 0.59 | % | |
Australia | | | 0.50 | % | |
Netherlands | | | 0.48 | % | |
Finland | | | 0.36 | % | |
Italy | | | 0.33 | % | |
New Zealand | | | 0.28 | % | |
Israel | | | 0.11 | % | |
Ireland | | | 0.09 | % | |
United States | | | 80.27 | % | |
Other Assets in Excess of Liabilities | | | 2.59 | % | |
| | | | 100.00 | % | |
(a) These percentages represent long positions only and are not net of short positions.
Abbreviations:
ADR - American Depositary Receipt
AUD - Australian dollar
bps - Basis Points. 100 Basis Points is equal to 1 percentage point.
B.V. - Besloten Vennootschap is the Dutch term for private limited liability company.
CAD - Canadian dollar
CHF - Swiss franc
CVR - Contingent Value Rights
ETF - Exchange-Traded Fund
EUR - Euro
EURIBOR - Euro Interbank Offered Rate
GBP - British pound
GBP LIBOR - London Interbank Offered Rate denominated in British Pounds
LIBOR - London Interbank Offered Rate
LLC - Limited Liability Company
Ltd. - Limited
MSCI - Morgan Stanley Capital International
N.V. - Naamloze Vennootschap is the Dutch term for a public limited liability corporation.
NZD - New Zealand dollar
Oyj - Osakeyhtio is the Finnish equivalent of a public limited company.
Plc - Public Limited Company
PLN - Polish zloty
SA - Generally designates corporations in various countries, mostly those employing civil law. This translates literally in all languages mentioned as anonymous company.
SEK - Swedish krona
See Notes to Financial Statements.
www.arbitragefunds.com | 1-800-295-4485
12
Arbitrage Fund Portfolio of Investments (continued)
November 30, 2020 (unaudited)
SONIA - Sterling OverNight Index Average
S&P - Standard & Poor's
SpA - Societa per Azione
SPDR - Standard & Poor's Depositary Receipt
USD - United States Dollar
The following table summarizes the Arbitrage Fund's investments and derivative financial instruments categorized in the fair value hierarchy as of November 30, 2020:
Investments in Securities at Value* | | Level 1 | | Level 2 | | Level 3 | | Total | |
Assets | |
Common Stocks | |
Auto Manufacturers | | $ | 35,040,247 | | | $ | — | | | $ | — | | | $ | 35,040,247 | | |
Auto Parts & Equipment | | | 2,712,800 | | | | — | | | | — | | | | 2,712,800 | | |
Banks | | | 13,830,466 | | | | — | | | | — | | | | 13,830,466 | | |
Beverages | | | 7,104,505 | | | | — | | | | — | | | | 7,104,505 | | |
Commercial Services | | | 14,808,055 | | | | — | | | | — | | | | 14,808,055 | | |
Computers & Computer
Services | | | 20,947,562 | | | | — | | | | 41,639,640 | | | | 62,587,202 | | |
Construction Materials | | | 4,292,946 | | | | — | | | | — | | | | 4,292,946 | | |
Distribution/Wholesale | | | 42,523,381 | | | | — | | | | — | | | | 42,523,381 | | |
Diversified Financial Services | | | 85,871,951 | | | | — | | | | — | | | | 85,871,951 | | |
Electric | | | 52,360,689 | | | | — | | | | — | | | | 52,360,689 | | |
Entertainment | | | 11,733,665 | | | | — | | | | — | | | | 11,733,665 | | |
Forest Products & Paper | | | 5,075,710 | | | | — | | | | — | | | | 5,075,710 | | |
Hand/Machine Tools | | | 4,643,580 | | | | — | | | | — | | | | 4,643,580 | | |
Healthcare - Products | | | 54,257,403 | | | | — | | | | — | | | | 54,257,403 | | |
Household Products | | | 12,994,423 | | | | — | | | | — | | | | 12,994,423 | | |
Insurance | | | 139,658,895 | | | | — | | | | — | | | | 139,658,895 | | |
Internet | | | 36,782,908 | | | | — | | | | — | | | | 36,782,908 | | |
Oil & Gas | | | 41,282,196 | | | | — | | | | — | | | | 41,282,196 | | |
Pharmaceuticals | | | 10,943,390 | | | | — | | | | — | | | | 10,943,390 | | |
Real Estate | | | 5,839,184 | | | | — | | | | — | | | | 5,839,184 | | |
Real Estate Investment Trusts | | | 47,206,893 | | | | — | | | | — | | | | 47,206,893 | | |
Retail | | | 135,655,353 | | | | — | | | | — | | | | 135,655,353 | | |
Semiconductors | | | 92,502,726 | | | | — | | | | 6,390,625 | | | | 98,893,351 | | |
Software | | | 18,259,988 | | | | — | | | | 30,798,444 | | | | 49,058,432 | | |
Special Purpose Acquisition
Companies | | | 3,245,689 | | | | — | | | | — | | | | 3,245,689 | | |
Telecommunications | | | 150,912,299 | | | | — | | | | 69,044,684 | | | | 219,956,983 | | |
Rights | | | 481,649 | | | | — | | | | 1,083,804 | | | | 1,565,453 | | |
Corporate Bonds** | | | — | | | | 5,233,568 | | | | — | | | | 5,233,568 | | |
Mutual Funds | | | 70,506,411 | | | | — | | | | — | | | | 70,506,411 | | |
See Notes to Financial Statements.
Semi-Annual Report | November 30, 2020
13
Arbitrage Fund Portfolio of Investments (continued)
November 30, 2020 (unaudited)
Investments in Securities at Value* | | Level 1 | | Level 2 | | Level 3 | | Total | |
Private Investments | | $ | — | | | $ | — | | | $ | 1,016,500 | | | $ | 1,016,500 | | |
Purchased Options | | | 771,152 | | | | — | | | | — | | | | 771,152 | | |
Short-Term Investments | | | 109,629,763 | | | | — | | | | — | | | | 109,629,763 | | |
TOTAL | | $ | 1,231,875,879 | | | $ | 5,233,568 | | | $ | 149,973,697 | | | $ | 1,387,083,144 | | |
Other Financial Instruments*** | |
Assets | |
Forward Foreign Currency
Exchange Contracts | | $ | — | | | $ | 1,359,096 | | | $ | — | | | $ | 1,359,096 | | |
Equity Swaps | | | 0 | | | | — | | | | — | | | | 0 | | |
Liabilities | |
Common Stocks** | | | (283,721,852 | ) | | | — | | | | — | | | | (283,721,852 | ) | |
Exchange-Traded Funds | | | (7,639,727 | ) | | | — | | | | — | | | | (7,639,727 | ) | |
Forward Foreign Currency
Exchange Contracts | | | — | | | | (2,494,530 | ) | | | — | | | | (2,494,530 | ) | |
TOTAL | | $ | (291,361,579 | ) | | $ | (1,135,434 | ) | | $ | — | | | $ | (292,497,013 | ) | |
* Refer to footnote 2 where leveling hierarchy is defined.
** Refer to Portfolio of Investments for sector information.
*** Other financial instruments are instruments such as securities sold short, equity swaps and forward foreign currency exchange contracts.
The following is a reconciliation of the fair valuations using significant unobservable inputs (Level 3) for the Fund's assets and liabilities during the period ended November 30, 2020:
Investments
in Securities | | Balance as of
May 31, 2020 | | Realized
Gain
(Loss) | | Change in
Unrealized
Appreciation
(Depreciation) | | Purchases | | Sales
Proceeds | | Transfers
into
Level 3 | | Transfers
out of
Level 3 | | Balance as of
November 30,
2020 | | Net change in
Unrealized
Appreciation
(Depreciation)
from
investments
still held
as of
November 30,
2020 | |
Common
Stocks | | $ | 65,345,698 | | | $ | 676,691 | | | $ | 3,733,066 | | | $ | 70,906,111 | | | $ | (72,154,391 | ) | | $ | 79,366,218 | | | $ | — | | | $ | 147,873,393 | | | $ | 4,063,781 | | |
Rights | | | 840,340 | | | | 567,862 | | | | (450,718 | ) | | | 1,059,966 | | | | (933,646 | ) | | | — | | | | — | | | | 1,083,804 | | | | (450,718 | ) | |
Private
Investments | | | 0 | | | | — | | | | (16,984 | ) | | | 1,033,484 | | | | — | | | | — | | | | — | | | | 1,016,500 | | | | (16,984 | ) | |
Total | | $ | 66,186,038 | | | $ | 1,244,553 | | | $ | 3,265,364 | | | $ | 72,999,561 | | | $ | (73,088,037 | ) | | $ | 79,366,218 | | | $ | — | | | $ | 149,973,697 | | | $ | 3,596,079 | | |
See Notes to Financial Statements.
www.arbitragefunds.com | 1-800-295-4485
14
Arbitrage Fund Portfolio of Investments (continued)
November 30, 2020 (unaudited)
The following table summarizes the quantitative inputs used for investments categorized as Level 3 of the fair value hierarchy as of November 30, 2020:
Investments in
Securities | | Fair Value at
November 30,
2020 | | Valuation
Technique | | Unobservable
Input | | Range of
Values | | Weighted
Average | |
Common Stocks
| | $ | 147,873,393
| | | Deal Value,
Liquidation
Value
| | Final
determination
on Dissent,
Final
Liquidation
Value | | $6.25-$88.66, 0 AUD
| | $35.7858, 0
| |
Rights
| | $ | 1,083,804
| | | Discounted,
probability
adjusted
value | | Discount
Rate,
Probability
| | 10%, 38.28%-42.25%
| | $0.6016
| |
Private
Investments | | $ | 1,016,500
| | | Cost
| | Cost
| | $.091-$1
| | $0.933
| |
See Notes to Financial Statements.
Semi-Annual Report | November 30, 2020
15
Water Island Event-Driven Fund Portfolio Information
November 30, 2020 (Unaudited)
Performance (annualized returns as of November 30, 2020)
| | One
Year | | Five
Year | | Ten
Year | | Since
Inception* | |
Water Island Event-Driven Fund Class R | | | 10.40 | % | | | 4.42 | % | | | 2.19 | % | | | 2.31 | % | |
Water Island Event-Driven Fund Class I | | | 10.82 | % | | | 4.69 | % | | | 2.45 | % | | | 2.56 | % | |
Water Island Event-Driven Fund, Class C** | | | 9.68 | % | | | 3.66 | % | | | N/A | | | | 1.43 | % | |
Water Island Event-Driven Fund, Class A*** | | | 10.54 | % | | | 4.45 | % | | | N/A | | | | 2.07 | % | |
ICE BofA Merrill Lynch U.S. 3-Month
Treasury Bill Index**** | | | 0.80 | % | | | 1.20 | % | | | 0.64 | % | | | 0.63 | % | |
Current performance may be higher or lower than performance quoted above. Any performance data quoted represents past performance, and the investment return and principal value of an investment in the Fund will fluctuate so that an investor's shares, when redeemed, may be worth more or less than their original cost. Past performance is no guarantee of future results. Returns shown above include the reinvestment of all dividends and capital gains. Performance results do not include adjustments made for financial reporting purposes in accordance with U.S. generally accepted accounting principles and may differ from the amount reported in the Financial Highlights. Contractual fee waivers are currently in effect. Without such fee waivers, performance numbers would be reduced. You can obtain performance data current to the most recent month end by calling 1-800-295-4485 or going to www.arbitragefunds.com.
* Class R and Class I inception: 10/1/10; Class C inception: 6/1/12; Class A inception: 6/1/13. The "Since Inception" returns for securities indices are for the inception date of Class R and Class I shares.
** Class C shares are subject to a 1.00% contingent deferred sales charge on all purchases redeemed within 12 months of purchase.
*** Class A shares are subject to a maximum front-end sales load of 3.25% of the offering price and are also subject to a 1.00% contingent deferred sales load on purchases at or above $250,000 purchased without a front-end sales charge and redeemed within 18 months of purchase.
**** Merger arbitrage and event-driven investing are market neutral investment strategies, which typically exhibit low betas and low correlations to broad equity and credit market indices. As such, the adviser has determined that a more appropriate benchmark for Water Island Event-Driven Fund is a measure of the risk-free rate, in this case the ICE Bank of America (BofA) Merrill Lynch U.S. 3-Month Treasury Bill Index.
The Total Annual Fund Operating Expenses for Class R, Class I, Class C and Class A are 2.06%, 1.81%, 2.81% and 2.06%, respectively. The Adviser has agreed to waive fees (not including the effects of interest, dividends on short positions, brokerage commissions, acquired fund fees and expenses, taxes, or other extraordinary expenses) in excess of 1.69%, 1.44%, 2.44% and 1.69% for Class R, Class I, Class C and Class A, respectively, until at least September 30, 2021. These expense ratios are as stated in the current prospectus and may differ from the expense ratios disclosed in the financial highlights in this report.
The ICE BofA Merrill Lynch U.S. 3-Month Treasury Bill Index tracks the performance of the U.S. dollar denominated U.S. Treasury Bills publicly issued in the U.S. domestic market with a remaining term to final maturity of less than 3 months.
An investor may not invest directly in an index.
www.arbitragefunds.com | 1-800-295-4485
16
Water Island Event-Driven Fund Portfolio Information (continued)
November 30, 2020 (Unaudited)
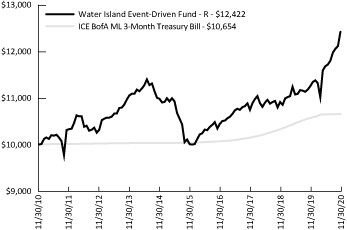
Growth of $10,000 Investment
The chart represents historical performance of a hypothetical investment of $10,000 in the Class R shares of the Fund since inception. Past performance does not guarantee future results. This chart does not reflect the deduction of taxes that a shareholder would pay on Fund distributions or the redemption of Fund shares.
Sector Weighting
The following chart shows the sector weightings of the Water Island Event-Driven Fund's investments (including short sales and excluding derivatives) as of the report date.
Semi-Annual Report | November 30, 2020
17
Water Island Event-Driven Fund Portfolio of Investments
November 30, 2020 (Unaudited)
| | | Shares | | Value | |
COMMON STOCKS - 87.27% | |
Auto Manufacturers - 2.42% | |
Fiat Chrysler Automobiles N.V.(a) | | | 66,757 | | | $ | 1,040,460 | | |
Navistar International Corp.(a) | | | 36,915 | | | | 1,633,858 | | |
| | | | 2,674,318 | | |
Auto Parts & Equipment - 0.62% | |
Telenav, Inc.(a) | | | 56,293 | | | | 267,392 | | |
Velodyne Lidar, Inc.(a) | | | 26,577 | | | | 423,106 | | |
| | | | 690,498 | | |
Banks - 0.94% | |
CIT Group, Inc.(b) | | | 31,038 | | | | 1,039,463 | | |
Beverages - 0.69% | |
Coca-Cola Amatil Ltd. | | | 82,035 | | | | 761,755 | | |
Commercial Services - 0.60% | |
CoreLogic, Inc.(b) | | | 4,941 | | | | 382,928 | | |
IHS Markit Ltd. | | | 2,787 | | | | 277,195 | | |
| | | | 660,123 | | |
Computers & Computer Services - 6.71% | |
58.COM, Inc., Class A(a)(c) | | | 194,588 | | | | 5,448,464 | | |
Perspecta, Inc.(b) | | | 18,997 | | | | 425,913 | | |
Virtusa Corp.(a) | | | 31,071 | | | | 1,556,035 | | |
| | | | 7,430,412 | | |
Distribution/Wholesale - 2.94% | |
HD Supply Holdings, Inc.(a) | | | 58,308 | | | | 3,252,420 | | |
Diversified Financial Services - 6.21% | |
Eaton Vance Corp.(b) | | | 86,955 | | | | 5,824,246 | | |
GCM Grosvenor, Inc., Class A(a) | | | 24,177 | | | | 229,681 | | |
Genworth MI Canada, Inc. | | | 24,321 | | | | 816,880 | | |
| | | | 6,870,807 | | |
Electric - 3.60% | |
PNM Resources, Inc. | | | 81,038 | | | | 3,979,776 | | |
Energy - Alternate Sources - 0.23% | |
Championx Corp.(a) | | | 21,541 | | | | 255,907 | | |
Engineering & Construction - 0.61% | |
AECOM(a) | | | 12,995 | | | | 674,311 | | |
See Notes to Financial Statements.
www.arbitragefunds.com | 1-800-295-4485
18
Water Island Event-Driven Fund Portfolio of Investments (continued)
November 30, 2020 (Unaudited)
| | | Shares | | Value | |
COMMON STOCKS - 87.27% (Continued) | |
Entertainment - 0.76% | |
Cineplex, Inc. | | | 23,327 | | | $ | 186,803 | | |
William Hill Plc(a) | | | 182,835 | | | | 653,728 | | |
| | | | 840,531 | | |
Food - 0.31% | |
Whole Earth Brands, Inc.(a) | | | 41,352 | | | | 342,808 | | |
Forest Products & Paper - 0.34% | |
Ahlstrom-Munksjo Oyj | | | 17,569 | | | | 377,229 | | |
Healthcare - Products - 0.37% | |
Oxford Immunotec Global Plc(a) | | | 28,742 | | | | 410,148 | | |
Healthcare - Services - 0.46% | |
Cellular Biomedicine Group, Inc.(a) | | | 27,757 | | | | 510,451 | | |
Insurance - 9.16% | |
National General Holdings Corp. | | | 133,565 | | | | 4,551,895 | | |
Watford Holdings Ltd.(a)(b) | | | 38,089 | | | | 1,322,450 | | |
Willis Towers Watson Plc(b) | | | 20,486 | | | | 4,264,981 | | |
| | | | 10,139,326 | | |
Internet - 3.49% | |
Endurance International Group Holdings, Inc.(a) | | | 69,910 | | | | 662,747 | | |
Grubhub, Inc.(a)(b) | | | 45,490 | | | | 3,199,766 | | |
| | | | 3,862,513 | | |
Leisure Time - 0.17% | |
Callaway Golf Co.(b) | | | 8,734 | | | | 185,598 | | |
Media - 0.31% | |
TEGNA, Inc.(b) | | | 24,165 | | | | 348,218 | | |
Oil & Gas - 2.81% | |
Concho Resources, Inc.(b) | | | 38,243 | | | | 2,198,208 | | |
Parsley Energy, Inc., Class A(b) | | | 37,451 | | | | 469,261 | | |
WPX Energy, Inc.(a)(b) | | | 61,966 | | | | 441,198 | | |
| | | | 3,108,667 | | |
Pharmaceuticals - 0.93% | |
BioSpecifics Technologies Corp.(a) | | | 9,496 | | | | 839,446 | | |
Paratek Pharmaceuticals, Inc.(a) | | | 31,231 | | | | 193,320 | | |
| | | | 1,032,766 | | |
See Notes to Financial Statements.
Semi-Annual Report | November 30, 2020
19
Water Island Event-Driven Fund Portfolio of Investments (continued)
November 30, 2020 (Unaudited)
| | | Shares | | Value | |
COMMON STOCKS - 87.27% (Continued) | |
Real Estate - 0.72% | |
Entra ASA(d) | | | 17,422 | | | $ | 348,209 | | |
McCarthy & Stone Plc(a)(d) | | | 284,539 | | | | 443,820 | | |
| | | | 792,029 | | |
Real Estate Investment Trusts - 3.29% | |
Front Yard Residential Corp.(b) | | | 89,596 | | | | 1,462,207 | | |
Taubman Centers, Inc. | | | 50,878 | | | | 2,173,508 | | |
| | | | 3,635,715 | | |
Retail - 8.00% | |
Dunkin' Brands Group, Inc. | | | 35,675 | | | | 3,793,679 | | |
Foundation Building Materials, Inc.(a) | | | 36,369 | | | | 699,740 | | |
Tiffany & Co.(b) | | | 33,139 | | | | 4,357,116 | | |
| | | | 8,850,535 | | |
Semiconductors - 5.78% | |
Maxim Integrated Products, Inc.(b) | | | 25,686 | | | | 2,132,966 | | |
Xilinx, Inc.(b) | | | 29,295 | | | | 4,263,887 | | |
| | | | 6,396,853 | | |
Software - 3.31% | |
Cloudera, Inc.(a)(b) | | | 11,456 | | | | 133,806 | | |
Codemasters Group Holdings Plc(a) | | | 44,669 | | | | 300,134 | | |
MINDBODY, Inc., Class A(a)(c) | | | 48,463 | | | | 1,768,900 | | |
MobileIron, Inc.(a) | | | 152,209 | | | | 1,071,551 | | |
Slack Technologies, Inc., Class A(a) | | | 8,942 | | | | 383,433 | | |
| | | | 3,657,824 | | |
Special Purpose Acquisition Companies - 7.14% | |
Alpha Healthcare Acquisition Corp.(a) | | | 20,250 | | | | 201,893 | | |
Artius Acquisition, Inc., Class A(a) | | | 16,206 | | | | 161,250 | | |
Bull Horn Holdings Corp.(a) | | | 40,295 | | | | 402,950 | | |
CC Neuberger Principal Holdings I, Class A(a) | | | 46,017 | | | | 475,356 | | |
CC Neuberger Principal Holdings II, Class A(a) | | | 16,172 | | | | 161,720 | | |
Churchill Capital Corp. IV, Class A(a) | | | 26,955 | | | | 266,315 | | |
DPCM Capital, Inc.(a) | | | 33,703 | | | | 342,085 | | |
Fast Acquisition Corp.(a) | | | 22,409 | | | | 231,933 | | |
Flying Eagle Acquisition Corp., Class A(a) | | | 18,648 | | | | 289,044 | | |
Foley Trasimene Acquisition Corp., Class A(a) | | | 21,186 | | | | 216,097 | | |
Fusion Acquisition Corp.(a) | | | 21,193 | | | | 222,527 | | |
Hennessy Capital Acquisition Corp. IV, Class A(a) | | | 9,426 | | | | 122,538 | | |
Hudson Executive Investment Corp., Class A(a) | | | 26,482 | | | | 262,966 | | |
Kingswood Acquisition Corp.(a) | | | 33,750 | | | | 340,538 | | |
Lefteris Acquisition Corp.(a) | | | 27,053 | | | | 270,259 | | |
See Notes to Financial Statements.
www.arbitragefunds.com | 1-800-295-4485
20
Water Island Event-Driven Fund Portfolio of Investments (continued)
November 30, 2020 (Unaudited)
| | | Shares | | Value | |
COMMON STOCKS - 87.27% (Continued) | |
Special Purpose Acquisition Companies - 7.14% (Continued) | |
LF Capital Acquisition Corp., Class A(a) | | | 26,916 | | | $ | 285,310 | | |
Live Oak Acquisition Corp., Class A(a) | | | 27,745 | | | | 346,813 | | |
Longview Acquisition Corp., Class A(a) | | | 13,787 | | | | 217,145 | | |
Oaktree Acquisition Corp. II(a) | | | 26,432 | | | | 269,342 | | |
Omnichannel Acquisition Corp.(a) | | | 27,132 | | | | 272,677 | | |
Pivotal Investment Corp. II, Class A(a) | | | 9,410 | | | | 132,116 | | |
Reinvent Technology Partners(a) | | | 26,432 | | | | 309,254 | | |
Roman DBDR Tech Acquisition Corp.(a) | | | 26,980 | | | | 276,545 | | |
Seaport Global Acquisition Corp.(a) | | | 43,285 | | | | 432,850 | | |
Spartacus Acquisition Corp.(a) | | | 26,962 | | | | 277,574 | | |
Sustainable Opportunities Acquisition Corp., Class A(a) | | | 13,337 | | | | 138,972 | | |
Trebia Acquisition Corp., Class A(a) | | | 21,186 | | | | 212,707 | | |
Trine Acquisition Corp., Class A(a) | | | 37,638 | | | | 484,777 | | |
Vy Global Growth(a) | | | 26,962 | | | | 280,944 | | |
| | | | 7,904,497 | | |
Telecommunications - 14.35% | |
Acacia Communications, Inc.(a)(b) | | | 78,051 | | | | 5,438,594 | | |
Altice Europe N.V.(a) | | | 21,818 | | | | 114,981 | | |
Cincinnati Bell, Inc.(a)(b) | | | 109,283 | | | | 1,662,194 | | |
Gilat Satellite Networks Ltd. | | | 60,181 | | | | 364,697 | | |
LogMeIn, Inc.(a)(c) | | | 93,555 | | | | 8,294,586 | | |
| | | | 15,875,052 | | |
TOTAL COMMON STOCKS
(Cost $91,491,626) | | | 96,560,550 | | |
RIGHTS - 0.05% | |
Bristol-Myers Squibb Co. | | | 15,737 | | | | 18,570 | | |
Stemline Therapeutics, Inc. CVR(c) | | | 121,306 | | | | 41,875 | | |
TOTAL RIGHTS
(Cost $53,176) | | | 60,445 | | |
| | | Maturity
Date | | Rate | | Principal
Amount | | Value | |
CORPORATE BONDS - 5.20% | |
Commercial Services - 0.93% | |
Nielsen Co. Luxembourg SARL
(The)(d) | | 10/01/2021 | | | 5.500 | % | | $ | 386,000 | | | $ | 384,070 | | |
Refinitiv US Holdings, Inc.(d) | | 05/15/2026 | | | 6.250 | % | | | 608,000 | | | | 649,040 | | |
| | | | | | | | | | 1,033,110 | | |
See Notes to Financial Statements.
Semi-Annual Report | November 30, 2020
21
Water Island Event-Driven Fund Portfolio of Investments (continued)
November 30, 2020 (Unaudited)
| | | Maturity
Date | | Rate | | Principal
Amount | | Value | |
CORPORATE BONDS - 5.20% (Continued) | |
Entertainment - 1.52% | |
Stars Group Holdings B.V. /
Stars Group US
Co-Borrower LLC(d) | | 07/15/2026 | | | 7.000 | % | | $ | 1,585,000 | | | $ | 1,676,137 | | |
Internet - 1.25% | |
EIG Investors Corp. | | 02/01/2024 | | | 10.875 | % | | | 1,333,000 | | | | 1,386,987 | | |
Oil & Gas - 0.28% | |
Northern Oil and Gas, Inc.,
(8.50% Cash + 1.00% PIK) | | 05/15/2023 | | | 8.500 | % | | | 366,000 | | | | 308,355 | | |
Telecommunications - 1.22% | |
Cincinnati Bell, Inc.(d) | | 07/15/2024 | | | 7.000 | % | | | 1,305,000 | | | | 1,349,070 | | |
TOTAL CORPORATE BONDS
(Cost $5,805,902) | | | 5,753,659 | | |
CONVERTIBLE CORPORATE BONDS - 1.62% | |
Entertainment - 0.31% | |
Cineplex, Inc.(d) | | 09/30/2025 | | | 5.750 | % | | | 392,000 | | | | 347,116 | | |
Pharmaceuticals - 1.31% | |
Dermira, Inc. | | 05/15/2022 | | | 3.000 | % | | | 1,430,000 | | | | 1,444,300 | | |
TOTAL CONVERTIBLE CORPORATE BONDS
(Cost $1,729,690) | | | 1,791,416 | | |
| | | Shares | | Value | |
WARRANTS - 0.28% | |
Special Purpose Acquisition Companies - 0.26% | |
Artius Acquisition, Inc., Class A, Exercise Price $11.50,
Expires 07/13/2026(a) | | | 5,402 | | | $ | 7,671 | | |
CC Neuberger Principal Holdings I, Class A,
Exercise Price $11.50, Expires 12/31/2025(a) | | | 15,339 | | | | 25,309 | | |
CC Neuberger Principal Holdings II, Class A,
Exercise Price $11.50, Expires 07/29/2025(a) | | | 4,043 | | | | 4,932 | | |
Churchill Capital Corp. IV, Class A, Exercise Price $11.50,
Expires 09/18/2025(a) | | | 5,391 | | | | 6,254 | | |
Foley Trasimene Acquisition Corp., Class A,
Exercise Price $11.50, Expires 07/17/2025(a) | | | 7,062 | | | | 11,793 | | |
Hudson Executive Investment Corp.,Class A,
Exercise Price $11.50, Expires 06/21/2025(a) | | | 13,241 | | | | 13,506 | | |
Live Oak Acquisition Corp., Class A, Exercise Price $11.50,
Expires 05/08/2027(a) | | | 53,988 | | | | 173,841 | | |
Sustainable Opportunities Acquisition Corp.,Class A,
Exercise Price $11.50, Expires 06/26/2025(a) | | | 20,245 | | | | 31,801 | | |
See Notes to Financial Statements.
www.arbitragefunds.com | 1-800-295-4485
22
Water Island Event-Driven Fund Portfolio of Investments (continued)
November 30, 2020 (Unaudited)
| | | Shares | | Value | |
WARRANTS - 0.28% (Continued) | |
Special Purpose Acquisition Companies - 0.26% (Continued) | |
Trebia Acquisition Corp., Class A, Exercise Price $11.50,
Expires 12/31/2025(a) | | | 7,062 | | | $ | 9,887 | | |
| | | | 284,994 | | |
Telecommunications - 0.02% | |
Avaya Holdings Corp., Exercise Price $25.55,
Expires 12/15/2022(a) | | | 5,548 | | | | 21,776 | | |
TOTAL WARRANTS
(Cost $147,928) | | | 306,770 | | |
PREFERRED STOCKS - 0.08% | |
Insurance - 0.08% | |
National General Holdings Corp., Series B, 7.500% | | | 3,430 | | | | 87,191 | | |
TOTAL PREFERRED STOCKS
(Cost $86,474) | | | 87,191 | | |
PRIVATE INVESTMENTS (c)(e) - 0.07% | |
Fast Capital LLC(a) | | | 22,800 | | | | 22,800 | | |
Fuse LLC(a) | | | 56,600 | | | | 51,455 | | |
Fuse Sponsor Capital, Z2 Shares(a) | | | 5,660 | | | | 5,145 | | |
TOTAL PRIVATE INVESTMENTS
(Cost $80,728) | | | 79,400 | | |
| | | Expiration
Date | | Exercise
Price | | Notional
Amount | | Contracts | | Value | |
PURCHASED OPTIONS(a) - 0.07% | |
Call Options Purchased - 0.06% | |
Devon Energy Corp. | | 01/2021 | | $ | 13.74 | | | $ | 383,326 | | | | 274 | | | $ | 35,620 | | |
Maxeon Solar
Technologies Ltd. | | 12/2020 | | | 30.00 | | | | 297,924 | | | | 122 | | | | 8,540 | | |
S&P Global, Inc. | | 01/2021 | | | 350.00 | | | | 211,068 | | | | 6 | | | | 8,880 | | |
Taubman Centers, Inc. | |
| | | 01/2021 | | | 40.00 | | | | 162,336 | | | | 38 | | | | 11,400 | | |
| | | 01/2021 | | | 45.00 | | | | 657,888 | | | | 154 | | | | 0 | | |
TOTAL CALL OPTIONS PURCHASED
(Cost $60,477) | | | 64,440 | | |
See Notes to Financial Statements.
Semi-Annual Report | November 30, 2020
23
Water Island Event-Driven Fund Portfolio of Investments (continued)
November 30, 2020 (Unaudited)
| | | Expiration
Date | | Exercise
Price | | Notional
Amount | | Contracts | | Value | |
PURCHASED OPTIONS(a) - 0.07% (Continued) | |
Put Options Purchased - 0.01% | |
iShares iBoxx $
Investment
Grade Corporate
Bond ETF | | 01/2021 | | $ | 130.00 | | | $ | 3,018,864 | | | | 218 | | | $ | 4,905 | | |
iShares Russell 2000 ETF | |
| | | 01/2021 | | | 142.00 | | | | 434,448 | | | | 24 | | | | 1,080 | | |
| | | 01/2021 | | | 145.00 | | | | 434,448 | | | | 24 | | | | 1,344 | | |
TOTAL PUT OPTIONS PURCHASED
(Cost $74,935) | | | 7,329 | | |
TOTAL PURCHASED OPTIONS
(Cost $135,412) | | | 71,769 | | |
| | | Yield | | Shares | | Value | |
SHORT-TERM INVESTMENTS - 4.48% | |
Money Market Funds | |
Morgan Stanley Institutional Liquidity Fund
Government Portfolio, Institutional Class | | | 0.020 | %(f) | | | 2,479,945 | | | $ | 2,479,945 | | |
State Street Institutional U.S. Government
Money Market Fund, Premier Class | | | 0.132 | %(f) | | | 2,479,945 | | | | 2,479,945 | | |
| | | | | | | | 4,959,890 | | |
TOTAL SHORT-TERM INVESTMENTS
(Cost $4,959,890) | | | 4,959,890 | | |
Total Investments - 99.12%
(Cost $104,490,826) | | | | | | | 109,671,090 | | |
Other Assets in Excess of Liabilities - 0.88%(g) | | | | | | | 977,086 | | |
NET ASSETS - 100.00% | | $ | 110,648,176 | | |
Portfolio Footnotes
(a) Non-income-producing security.
(b) Security, or a portion of security, is being held as collateral for short sales or forward foreign currency exchange contracts. At November 30, 2020, the aggregate fair market value of those securities was $30,737,696, representing 27.78% of net assets.
(c) Security fair valued using significant unobservable inputs and classified as a Level 3 security. As of November 30, 2020, the total fair market value of these securities was $15,633,225, representing 14.13% of net assets.
(d) Security exempt from registration under Rule 144A of the Securities Act of 1933. These securities may be resold in transactions exempt from registration, normally to qualified institutional buyers. As of November 30, 2020, these securities had a total value of $5,197,462 or 4.70% of net assets.
See Notes to Financial Statements.
www.arbitragefunds.com | 1-800-295-4485
24
Water Island Event-Driven Fund Portfolio of Investments (continued)
November 30, 2020 (Unaudited)
(e) Represents a holding that is a direct investment into a private company and is not a listed or publicly traded entity.
(f) Rate shown is the 7-day effective yield as of November 30, 2020.
(g) Includes cash held as collateral for short sales.
SCHEDULE OF SECURITIES SOLD SHORT | | Shares | | Value | |
COMMON STOCKS - (15.62%) | |
Auto Manufacturers - (0.82%) | |
Peugeot SA | | | (38,322 | ) | | $ | (903,506 | ) | |
Banks - (1.21%) | |
First Citizens BancShares, Inc., Class A | | | (1,924 | ) | | | (1,017,007 | ) | |
Morgan Stanley | | | (5,180 | ) | | | (320,280 | ) | |
| | | | (1,337,287 | ) | |
Commercial Services - (0.33%) | |
Booz Allen Hamilton Holding Corp., Class A | | | (994 | ) | | | (86,269 | ) | |
S&P Global, Inc. | | | (791 | ) | | | (278,258 | ) | |
| | | | (364,527 | ) | |
Computers & Computer Services - (0.13%) | |
CACI International, Inc., Class A | | | (283 | ) | | | (67,153 | ) | |
Science Applications International Corp. | | | (824 | ) | | | (76,253 | ) | |
| | | | (143,406 | ) | |
Energy - Alternate Sources - (0.23%) | |
Maxeon Solar Technologies Ltd. | | | (10,278 | ) | | | (250,989 | ) | |
Engineering & Construction - (0.42%) | |
Jacobs Engineering Group, Inc. | | | (1,547 | ) | | | (166,829 | ) | |
Stantec, Inc. | | | (4,885 | ) | | | (147,185 | ) | |
WSP Global, Inc. | | | (2,030 | ) | | | (150,761 | ) | |
| | | | (464,775 | ) | |
Environmental Control - (0.18%) | |
Tetra Tech, Inc. | | | (1,638 | ) | | | (195,331 | ) | |
Food - (2.93%) | |
Just Eat Takeaway.com N.V. | | | (30,524 | ) | | | (3,241,997 | ) | |
Leisure Time - (0.07%) | |
Acushnet Holdings Corp. | | | (2,135 | ) | | | (80,489 | ) | |
Media - (0.17%) | |
Nexstar Media Group, Inc., Class A | | | (1,793 | ) | | | (188,713 | ) | |
Oil & Gas - (2.83%) | |
ConocoPhillips | | | (55,835 | ) | | | (2,208,832 | ) | |
Devon Energy Corp. | | | (31,999 | ) | | | (447,666 | ) | |
Pioneer Natural Resources Co. | | | (4,689 | ) | | | (471,620 | ) | |
| | | | (3,128,118 | ) | |
See Notes to Financial Statements.
Semi-Annual Report | November 30, 2020
25
Water Island Event-Driven Fund Portfolio of Investments (continued)
November 30, 2020 (Unaudited)
SCHEDULE OF SECURITIES SOLD SHORT | | Shares | | Value | |
COMMON STOCKS - (15.62%) (Continued) | |
Pharmaceuticals - (0.11%) | |
Viatris, Inc. | | | (7,478 | ) | | $ | (125,780 | ) | |
Semiconductors - (5.64%) | |
Advanced Micro Devices, Inc. | | | (50,487 | ) | | | (4,678,125 | ) | |
Analog Devices, Inc. | | | (11,211 | ) | | | (1,559,226 | ) | |
| | | | (6,237,351 | ) | |
Software - (0.39%) | |
salesforce.com, Inc. | | | (845 | ) | | | (207,701 | ) | |
Take-Two Interactive Software, Inc. | | | (1,266 | ) | | | (228,526 | ) | |
| | | | (436,227 | ) | |
Telecommunications - (0.16%) | |
Cincinnati Bell, Inc. | | | (12,017 | ) | | | (182,779 | ) | |
TOTAL COMMON STOCKS
(Proceeds $15,481,474) | | | (17,281,275 | ) | |
EXCHANGE-TRADED FUNDS - (0.42%) | |
Equity Funds - (0.42%) | |
iShares Russell 2000 Growth ETF | | | (722 | ) | | | (189,590 | ) | |
iShares Russell 2000 Value ETF | | | (454 | ) | | | (55,669 | ) | |
VanEck Vectors Oil Services ETF | | | (1,574 | ) | | | (217,055 | ) | |
| | | | (462,314 | ) | |
TOTAL EXCHANGE-TRADED FUNDS
(Proceeds $412,825) | | | (462,314 | ) | |
TOTAL SECURITIES SOLD SHORT
(Proceeds $15,894,299) | | $ | (17,743,589 | ) | |
See Notes to Financial Statements.
www.arbitragefunds.com | 1-800-295-4485
26
Water Island Event-Driven Fund Portfolio of Investments (continued)
November 30, 2020 (Unaudited)
EQUITY SWAP CONTRACTS
Swap
Counterparty/
Payment
Frequency | | Reference
Obligation | | Rate
Paid/
Received
by the
Fund | | Termination
Date | | Upfront
Payments
Paid | | Upfront
Payments
Received | | Market
Value | | Notional
Amount | | Unrealized
Appreciation | |
Morgan
Stanley &
Co./
Monthly
| | Analog
Devices,
Inc.
| | Received
1 Month-
Federal
Rate
Minus
40 bps
(-0.320%) | |
08/19/2021 | | $ | — | | | $ | — | | | $ | — | | | USD | 691,923 | | | $ | — | | |
Morgan
Stanley &
Co./
Monthly
| | Aon Plc
| | Received
1 Month-
Federal
Rate
Minus
40 bps
(-0.320%) | |
08/19/2021 | | | — | | | | — | | | | — | | | USD | 4,533,191 | | | | — | | |
Goldman
Sachs &
Co./
Monthly
| | William
Hill Plc
| | Paid
1 Month
GBP
LIBOR
Plus
45 bps
(0.440%) | |
10/19/2021 | | | — | | | | — | | | | — | | | GBP | 736,998 | | | | — | | |
Goldman
Sachs &
Co./
Monthly
| | Morgan
Stanley
| | Received
1 Month
LIBOR
Minus
40 bps
(-0.260%) | |
10/28/2021 | | | — | | | | — | | | | — | | | USD | 2,815,800 | | | | — | | |
Goldman
Sachs &
Co./
Monthly
| | Kaz
Minerals
Plc
| | Paid
1 Month
GBP
LIBOR
Plus
45 bps
(0.639%) | |
11/01/2021 | | | — | | | | — | | | | — | | | GBP | 167,197 | | | | — | | |
Goldman
Sachs &
Co./
Monthly
| | Alternative
Credit
Investments
| | Paid
1 Month
GBP
LIBOR
Plus
70 bps
(0.743%) | |
11/05/2021 | | | — | | | | — | | | | — | | | GBP | 147,728 | | | | — | | |
| | | | | | | | | | | | | $ | — | | | | | | | $ | — | | |
See Notes to Financial Statements.
Semi-Annual Report | November 30, 2020
27
Water Island Event-Driven Fund Portfolio of Investments (continued)
November 30, 2020 (Unaudited)
OUTSTANDING FORWARD FOREIGN CURRENCY EXCHANGE CONTRACTS
Currency
Purchased | | Currency Sold | | Counterparty | | Settlement
Date | | Unrealized
Appreciation | |
CAD | 2,703,500 | | | USD | 2,059,457 | | | Morgan Stanley & Co. | | 12/15/2020 | | $ | 22,416 | | |
USD | 56,134 | | | CAD | 72,800 | | | Morgan Stanley & Co. | | 12/15/2020 | | | 73 | | |
CHF | 1,414,300 | | | USD | 1,551,897 | | | Morgan Stanley & Co. | | 12/15/2020 | | | 5,178 | | |
USD | 36,424 | | | CHF | 33,000 | | | Morgan Stanley & Co. | | 12/15/2020 | | | 92 | | |
EUR | 2,155,800 | | | USD | 2,539,626 | | | Morgan Stanley & Co. | | 12/15/2020 | | | 32,916 | | |
USD | 7,290 | | | EUR | 6,100 | | | Morgan Stanley & Co. | | 12/15/2020 | | | 11 | | |
GBP | 190,558 | | | USD | 252,792 | | | Morgan Stanley & Co. | | 12/15/2020 | | | 1,295 | | |
USD | 348,694 | | | NOK | 3,090,700 | | | Morgan Stanley & Co. | | 12/15/2020 | | | 1,242 | | |
NZD | 1,269,100 | | | USD | 846,286 | | | Morgan Stanley & Co. | | 12/15/2020 | | | 43,630 | | |
SEK | 3,210,400 | | | USD | 366,116 | | | Morgan Stanley & Co. | | 12/15/2020 | | | 8,292 | | |
| | | $ | 115,145 | | |
Currency
Purchased | | Currency Sold | | Counterparty | | Settlement
Date | | Unrealized
Depreciation | |
USD | 726,218 | | | AUD | 1,033,600 | | | Morgan Stanley & Co. | | 12/15/2020 | | $ | (32,603 | ) | |
CAD | 55,600 | | | USD | 42,857 | | | Morgan Stanley & Co. | | 12/15/2020 | | | (41 | ) | |
USD | 3,276,084 | | | CAD | 4,295,500 | | | Morgan Stanley & Co. | | 12/15/2020 | | | (31,736 | ) | |
CHF | 16,500 | | | USD | 18,229 | | | Morgan Stanley & Co. | | 12/15/2020 | | | (63 | ) | |
USD | 1,532,772 | | | CHF | 1,397,800 | | | Morgan Stanley & Co. | | 12/15/2020 | | | (6,137 | ) | |
EUR | 13,200 | | | USD | 15,788 | | | Morgan Stanley & Co. | | 12/15/2020 | | | (36 | ) | |
USD | 2,272,800 | | | EUR | 1,923,800 | | | Morgan Stanley & Co. | | 12/15/2020 | | | (22,894 | ) | |
USD | 1,392,285 | | | GBP | 1,068,661 | | | Morgan Stanley & Co. | | 12/15/2020 | | | (32,651 | ) | |
USD | 853,094 | | | NZD | 1,269,100 | | | Morgan Stanley & Co. | | 12/15/2020 | | | (36,823 | ) | |
PLN | 4,070,100 | | | USD | 1,089,338 | | | Morgan Stanley & Co. | | 12/15/2020 | | | (4,852 | ) | |
USD | 1,052,760 | | | PLN | 4,070,100 | | | Morgan Stanley & Co. | | 12/15/2020 | | | (31,725 | ) | |
USD | 367,595 | | | SEK | 3,210,400 | | | Morgan Stanley & Co. | | 12/15/2020 | | | (6,811 | ) | |
| | | $ | (206,372 | ) | |
See Notes to Financial Statements.
www.arbitragefunds.com | 1-800-295-4485
28
Water Island Event-Driven Fund Portfolio of Investments (continued)
November 30, 2020 (Unaudited)
The following is a summary of investments classified by country exposure:
Country | | % of Net Assets(a) | |
United Kingdom | | | 6.67 | % | |
Cayman Islands | | | 5.17 | % | |
Netherlands | | | 1.62 | % | |
United States Virgin Islands | | | 1.32 | % | |
Canada | | | 1.22 | % | |
Bermuda | | | 1.20 | % | |
Australia | | | 0.69 | % | |
Luxembourg | | | 0.35 | % | |
Finland | | | 0.34 | % | |
Israel | | | 0.33 | % | |
Norway | | | 0.32 | % | |
United States | | | 79.89 | % | |
Other Assets in Excess of Liabilities | | | 0.88 | % | |
| | | | 100.00 | % | |
(a) These percentages represent long positions only and are not net of short positions.
Abbreviations:
ASA - Allmennaksjeselskap is the Norwegian term for public limited company.
AUD - Australian dollar
bps - Basis Points. 100 Basis Points is equal to 1 percentage point.
B.V. - Besloten Vennootschap is the Dutch term for private limited liability company.
CAD - Canadian dollar
CHF - Swiss franc
CVR - Contingent Value Rights
ETF - Exchange-Traded Fund
EUR - Euro
GBP - British pound
GBP LIBOR - London Interbank Offered Rate denominated in British Pounds
LIBOR - London Interbank Offered Rate
LLC - Limited Liability Company
Ltd. - Limited
NOK - Norwegian krone
N.V. - Naamloze Vennootschap is the Dutch term for a public limited liability corporation.
NZD - New Zealand dollar
Oyj - Osakeyhtio is the Finnish equivalent of a public limited company.
PIK - Payment-in-kind
Plc - Public Limited Company
PLN - Polish zloty
SA - Generally designates corporations in various countries, mostly those employing civil law. This translates literally in all languages mentioned as anonymous company.
SARL - Société Anonyme à Responsabilité Limitée is the French term for limited liability company.
SEK - Swedish krona
See Notes to Financial Statements.
Semi-Annual Report | November 30, 2020
29
Water Island Event-Driven Fund Portfolio of Investments (continued)
November 30, 2020 (Unaudited)
S&P - Standard & Poor's
USD - United States Dollar
The following table summarizes the Water Island Diversified Event-Driven Fund's investments and derivative financial instruments categorized in the fair value hierarchy as of November 30, 2020:
Investments in Securities at Value* | | Level 1 | | Level 2 | | Level 3 | | Total | |
Assets | |
Common Stocks | |
Auto Manufacturers | | $ | 2,674,318 | | | $ | — | | | $ | — | | | $ | 2,674,318 | | |
Auto Parts & Equipment | | | 690,498 | | | | — | | | | — | | | | 690,498 | | |
Banks | | | 1,039,463 | | | | — | | | | — | | | | 1,039,463 | | |
Beverages | | | 761,755 | | | | — | | | | — | | | | 761,755 | | |
Commercial Services | | | 660,123 | | | | — | | | | — | | | | 660,123 | | |
Computers & Computer Services | | | 1,981,948 | | | | — | | | | 5,448,464 | | | | 7,430,412 | | |
Distribution/Wholesale | | | 3,252,420 | | | | — | | | | — | | | | 3,252,420 | | |
Diversified Financial Services | | | 6,870,807 | | | | — | | | | — | | | | 6,870,807 | | |
Electric | | | 3,979,776 | | | | — | | | | — | | | | 3,979,776 | | |
Energy - Alternate Sources | | | 255,907 | | | | — | | | | — | | | | 255,907 | | |
Engineering & Construction | | | 674,311 | | | | — | | | | — | | | | 674,311 | | |
Entertainment | | | 840,531 | | | | — | | | | — | | | | 840,531 | | |
Food | | | 342,808 | | | | — | | | | — | | | | 342,808 | | |
Forest Products & Paper | | | 377,229 | | | | — | | | | — | | | | 377,229 | | |
Healthcare - Products | | | 410,148 | | | | — | | | | — | | | | 410,148 | | |
Healthcare - Services | | | 510,451 | | | | — | | | | — | | | | 510,451 | | |
Insurance | | | 10,139,326 | | | | — | | | | — | | | | 10,139,326 | | |
Internet | | | 3,862,513 | | | | — | | | | — | | | | 3,862,513 | | |
Leisure Time | | | 185,598 | | | | — | | | | — | | | | 185,598 | | |
Media | | | 348,218 | | | | — | | | | — | | | | 348,218 | | |
Oil & Gas | | | 3,108,667 | | | | — | | | | — | | | | 3,108,667 | | |
Pharmaceuticals | | | 1,032,766 | | | | — | | | | — | | | | 1,032,766 | | |
Real Estate | | | 792,029 | | | | — | | | | — | | | | 792,029 | | |
Real Estate Investment Trusts | | | 3,635,715 | | | | — | | | | — | | | | 3,635,715 | | |
Retail | | | 8,850,535 | | | | — | | | | — | | | | 8,850,535 | | |
Semiconductors | | | 6,396,853 | | | | — | | | | — | | | | 6,396,853 | | |
Software | | | 1,888,924 | | | | — | | | | 1,768,900 | | | | 3,657,824 | | |
Special Purpose Acquisition
Companies | | | 7,904,497 | | | | — | | | | — | | | | 7,904,497 | | |
Telecommunications | | | 7,580,466 | | | | — | | | | 8,294,586 | | | | 15,875,052 | | |
Rights | | | 18,570 | | | | — | | | | 41,875 | | | | 60,445 | | |
Corporate Bonds** | | | — | | | | 5,753,659 | | | | — | | | | 5,753,659 | | |
Convertible Corporate Bonds** | | | — | | | | 1,791,416 | | | | — | | | | 1,791,416 | | |
Warrants | | | 284,994 | | | | 21,776 | | | | — | | | | 306,770 | | |
Preferred Stocks** | | | 87,191 | | | | — | | | | — | | | | 87,191 | | |
See Notes to Financial Statements.
www.arbitragefunds.com | 1-800-295-4485
30
Water Island Event-Driven Fund Portfolio of Investments (continued)
November 30, 2020 (Unaudited)
Investments in Securities at Value* | | Level 1 | | Level 2 | | Level 3 | | Total | |
Private Investments | | $ | — | | | $ | — | | | $ | 79,400 | | | $ | 79,400 | | |
Purchased Options | | | 71,769 | | | | — | | | | — | | | | 71,769 | | |
Short-Term Investments | | | 4,959,890 | | | | — | | | | — | | | | 4,959,890 | | |
TOTAL | | $ | 86,471,014 | | | $ | 7,566,851 | | | $ | 15,633,225 | | | $ | 109,671,090 | | |
Other Financial Instruments*** | |
Assets | |
Forward Foreign Currency
Exchange Contracts | | $ | — | | | $ | 115,145 | | | $ | — | | | $ | 115,145 | | |
Equity Swaps | | | 0 | | | | — | | | | — | | | | 0 | | |
Liabilities | |
Common Stocks** | | | (17,281,275 | ) | | | — | | | | — | | | | (17,281,275 | ) | |
Exchange-Traded Funds | | | (462,314 | ) | | | — | | | | — | | | | (462,314 | ) | |
Forward Foreign Currency
Exchange Contracts | | | — | | | | (206,372 | ) | | | — | | | | (206,372 | ) | |
TOTAL | | $ | (17,743,589 | ) | | $ | (91,227 | ) | | $ | — | | | $ | (17,834,816 | ) | |
* Refer to footnote 2 where leveling hierarchy is defined.
** Refer to Portfolio of Investments for sector information.
*** Other financial instruments are instruments such as securities sold short, equity swaps and forward foreign currency exchange contracts.
The following is a reconciliation of the fair valuations using significant unobservable inputs (Level 3) for the Fund's assets and liabilities during the period ended November 30, 2020:
Investments
in Securities | | Balance as of
May 31, 2020 | | Realized
Gain
(Loss) | | Change in
Unrealized
Appreciation
(Depreciation) | | Purchases | | Sales
Proceeds | | Transfers
into
Level 3 | | Transfers
out of
Level 3 | | Balance as of
November 30,
2020 | | Net change in
Unrealized
Appreciation
(Depreciation)
from
investments
still held
as of
November 30,
2020 | |
Common
Stock | | $ | 2,731,749 | | | $ | 33,758 | | | $ | 430,685 | | | $ | 5,429,345 | | | $ | (1,690,949 | ) | | $ | 8,577,362 | | | $ | — | | | $ | 15,511,950 | | | $ | 448,217 | | |
Private
Investments | | | — | | | | — | | | | (1,328 | ) | | | 80,728 | | | | — | | | | — | | | | — | | | | 79,400 | | | | (1,328 | ) | |
Rights | | | — | | | | — | | | | 1,844 | | | | 40,031 | | | | — | | | | — | | | | — | | | | 41,875 | | | | 1,844 | | |
Total | | $ | 2,731,749 | | | $ | 33,758 | | | $ | 431,201 | | | $ | 5,550,104 | | | $ | (1,690,949 | ) | | $ | 8,577,362 | | | $ | — | | | $ | 15,633,225 | | | $ | 448,733 | | |
See Notes to Financial Statements.
Semi-Annual Report | November 30, 2020
31
Water Island Event-Driven Fund Portfolio of Investments (continued)
November 30, 2020 (Unaudited)
The following table summarizes the quantitative inputs used for investments categorized as Level 3 of the fair value hierarchy as of November 30, 2020:
Investments in
Securities | | Fair Value at
November 30, 2020 | | Valuation
Technique | | Unobservable
Input | | Range of
Values | | Weighted
Average | |
Common Stock
| | $ | 15,511,950
| | | Deal Value
| | Final
Determination
on Dissent | | | $28-$88.66
| | | | $46.08
| | |
Private
Investments | | $ | 79,400 | | | Cost | | Cost | | | $0.91-$1 | | | | $0.97 | | |
Rights
| | $ | 41,875
| | | Discounted,
probability
adjusted value | | Discount Rate,
Probability
| | | 10%, 42.25%
| | | | $0.35
| | |
See Notes to Financial Statements.
www.arbitragefunds.com | 1-800-295-4485
32
Water Island Credit Opportunities Fund Portfolio Information
November 30, 2020 (Unaudited)
Performance (annualized returns as of November 30, 2020)
| | One
Year | | Five
Year | | Ten
Year | | Since
Inception* | |
Water Island Credit Opportunities Fund, Class R | | | 6.43 | % | | | 3.66 | % | | | N/A | | | | 2.90 | % | |
Water Island Credit Opportunities Fund, Class I | | | 6.72 | % | | | 3.90 | % | | | N/A | | | | 3.13 | % | |
Water Island Credit Opportunities Fund, Class C** | | | 5.66 | % | | | 2.87 | % | | | N/A | | | | 2.16 | % | |
Water Island Credit Opportunities Fund, Class A*** | | | 6.57 | % | | | 3.65 | % | | | N/A | | | | 2.83 | % | |
ICE BofA Merrill Lynch U.S. 3-Month Treasury Bill Index | | | 0.80 | % | | | 1.20 | % | | | N/A | | | | 0.76 | % | |
Bloomberg Barclays Capital U.S. Aggregate Bond Index | | | 7.28 | % | | | 4.34 | % | | | N/A | | | | 3.24 | % | |
Current performance may be higher or lower than performance quoted above. Any performance data quoted represents past performance and the investment return and principal value of an investment in the Fund will fluctuate so that an investor's shares, when redeemed, may be worth more or less than their original cost. Past performance is no guarantee of future results. Returns shown above include the reinvestment of all dividends and capital gains. Performance results do not include adjustments made for financial reporting purposes in accordance with U.S. generally accepted accounting principles and may differ from the amount reported in the Financial Highlights. Contractual fee waivers are currently in effect. Without such fee waivers, performance numbers would be reduced. You can obtain performance data current to the most recent month end by calling 1-800-295-4485 or going to www.arbitragefunds.com.
* Class R, Class I and Class C inception: 10/1/12; Class A inception: 6/1/13. The "Since Inception" returns for securities indices are for the inception date of Class R, Class I and Class C shares.
** Class C shares are subject to a 1.00% contingent deferred sales charge on all purchases redeemed in 12 months of purchase.
*** Class A shares are subject to a maximum front-end sales load of 3.25% of the offering price and are also subject to a 1.00% contingent deferred sales load on purchases at or above $250,000 purchased without a front-end sales charge and redeemed within 18 months of purchase.
The Total Annual Fund Operating Expenses for Class R, Class I, Class C and Class A are 1.97%, 1.72%, 2.72% and 1.97%, respectively. The Adviser has agreed to waive fees (not including the effects of interest, dividends on short positions, brokerage commissions, acquired fund fees and expenses, taxes, or other extraordinary expenses) in excess of 1.23%, 0.98%, 1.98% and 1.23% for Class R, Class I, Class C and Class A, respectively, until at least September 30, 2021. These expense ratios are as stated in the current prospectus and may differ from the expense ratios disclosed in the financial highlights in this report.
The ICE Bank of America (BofA) Merrill Lynch U.S. 3-Month Treasury Bill Index tracks the performance of the U.S. dollar denominated U.S. Treasury Bills publicly issued in the U.S. domestic market with a remaining term to final maturity of less than 3 months.
The Bloomberg Barclays Capital U.S. Aggregate Bond Index is a market value-weighted index of investment grade fixed-rated debt issues, including government, corporate, asset-backed and mortgage-backed securities with a maturity of one year or more.
An investor may not invest directly in an index.
Semi-Annual Report | November 30, 2020
33
Water Island Credit Opportunities Fund Portfolio Information (continued)
November 30, 2020 (Unaudited)
Growth of $10,000 Investment
The chart represents historical performance of a hypothetical investment of $10,000 in the Class R shares of the Fund since inception. Past performance does not guarantee future results. This chart does not reflect the deduction of taxes that a shareholder would pay on Fund distributions or the redemption of Fund shares.
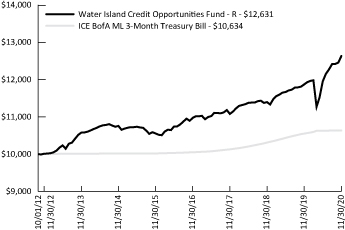
Sector Weighting
The following chart shows the sector weightings of the Water Island Credit Opportunities Fund investments (including short sales and excluding derivatives) as of the report date.
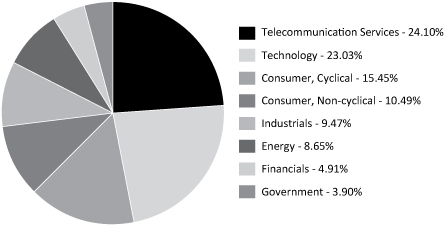
www.arbitragefunds.com | 1-800-295-4485
34
Water Island Credit Opportunities Fund Portfolio of Investments
November 30, 2020 (Unaudited)
| | | Shares | | Value | |
COMMON STOCKS - 0.43% | |
Commercial Services - 0.43% | |
Nielsen Holdings Plc | | | 18,000 | | | $ | 291,060 | | |
TOTAL COMMON STOCKS
(Cost $308,030) | | | 291,060 | | |
| | | Maturity
Date | | Rate | | Principal
Amount | | Value | |
BANK LOAN - 1.45% | |
Commercial Services - 1.45% | |
Refinitiv US Holdings, Inc.,
2018 USD Term Loan B,
Variable Rate, (1 mo. USD
LIBOR plus 3.250%) | | 12/31/2020 | | | 3.396 | % | | $ | 989,924 | | | $ | 984,975 | | |
TOTAL BANK LOANS
(Cost $995,043) | | | 984,975 | | |
CORPORATE BONDS - 67.89% | |
Aerospace & Defense - 4.72% | |
Boeing Co. (The) | | 05/01/2050 | | | 5.805 | % | | | 1,250,000 | | | | 1,651,355 | | |
Triumph Group, Inc. | | 06/01/2022 | | | 5.250 | % | | | 1,687,000 | | | | 1,552,040 | | |
| | | | 3,203,395 | | |
Auto Manufacturers - 4.37% | |
Navistar International Corp.(a)(b) | | 05/01/2025 | | | 9.500 | % | | | 750,000 | | | | 839,063 | | |
Navistar International Corp.(a) | | 11/01/2025 | | | 6.625 | % | | | 2,032,000 | | | | 2,126,894 | | |
| | | | 2,965,957 | | |
Auto Parts & Equipment - 2.73% | |
BorgWarner, Inc.(a) | | 10/01/2025 | | | 5.000 | % | | | 1,581,000 | | | | 1,853,215 | | |
Banks - 1.46% | |
CIT Group, Inc. | | 08/01/2023 | | | 5.000 | % | | | 50,000 | | | | 54,312 | | |
Truist Bank, Variable Rate,
(3 mo. USD LIBOR
plus 0.65%)(b) | | 03/15/2028 | | | 0.900 | % | | | 1,000,000 | | | | 938,440 | | |
| | | | 992,752 | | |
Commercial Services - 5.42% | |
APX Group, Inc. | | 12/01/2022 | | | 7.875 | % | | | 1,030,000 | | | | 1,031,288 | | |
Nielsen Co. Luxembourg
SARL (The)(a) | | 10/01/2021 | | | 5.500 | % | | | 443,000 | | | | 440,785 | | |
Refinitiv US Holdings, Inc.(a) | | 05/15/2026 | | | 6.250 | % | | | 2,069,000 | | | | 2,208,657 | | |
| | | | 3,680,730 | | |
See Notes to Financial Statements.
Semi-Annual Report | November 30, 2020
35
Water Island Credit Opportunities Fund Portfolio of Investments (continued)
November 30, 2020 (Unaudited)
| | | Maturity
Date | | Rate | | Principal
Amount | | Value | |
CORPORATE BONDS - 67.89% (Continued) | |
Computers & Computer Services - 1.72% | |
Dell International LLC /
EMC Corp.(a)(b) | | 10/01/2026 | | | 4.900 | % | | $ | 1,000,000 | | | $ | 1,167,857 | | |
Construction Materials - 3.03% | |
BMC East LLC(a)(b) | | 10/01/2024 | | | 5.500 | % | | | 2,000,000 | | | | 2,058,000 | | |
Distribution/Wholesale - 1.56% | |
HD Supply, Inc.(a) | | 10/15/2026 | | | 5.375 | % | | | 1,000,000 | | | | 1,060,000 | | |
Electrical Components & Equipment - 1.83% | |
WESCO Distribution, Inc. | | 12/15/2021 | | | 5.375 | % | | | 1,238,000 | | | | 1,241,268 | | |
Entertainment - 6.66% | |
Scientific Games
International, Inc.(a) | | 10/15/2025 | | | 5.000 | % | | | 1,500,000 | | | | 1,543,125 | | |
Stars Group Holdings B.V. /
Stars Group US
Co-Borrower LLC(a) | | 07/15/2026 | | | 7.000 | % | | | 2,820,000 | | | | 2,982,150 | | |
| | | | 4,525,275 | | |
Insurance - 1.70% | |
Fidelity & Guaranty
Life Holdings, Inc.(a) | | 05/01/2025 | | | 5.500 | % | | | 1,000,000 | | | | 1,155,860 | | |
Internet - 4.24% | |
EIG Investors Corp. | | 02/01/2024 | | | 10.875 | % | | | 2,770,000 | | | | 2,882,185 | | |
Media - 0.76% | |
Walt Disney Co. (The)(b) | | 09/01/2049 | | | 2.750 | % | | | 500,000 | | | | 515,234 | | |
Office/Business Equip - 0.68% | |
Xerox Corp.(b) | | 05/15/2021 | | | 4.500 | % | | | 457,000 | | | | 462,918 | | |
Oil & Gas - 6.76% | |
Noble Energy, Inc. | | 11/15/2043 | | | 5.250 | % | | | 520,000 | | | | 719,844 | | |
Northern Oil and Gas, Inc.,
(8.50% Cash + 1.00% PIK) | | 05/15/2023 | | | 8.500 | % | | | 1,709,238 | | | | 1,440,033 | | |
Parsley Energy LLC /
Parsley Finance Corp.(a) | | 01/15/2025 | | | 5.375 | % | | | 1,416,000 | | | | 1,458,480 | | |
WPX Energy, Inc. | | 10/15/2027 | | | 5.250 | % | | | 130,000 | | | | 137,150 | | |
WPX Energy, Inc.(b) | | 06/15/2028 | | | 5.875 | % | | | 775,000 | | | | 835,062 | | |
| | | | 4,590,569 | | |
Pipelines - 2.26% | |
Midwest Connector
Capital Co. LLC(a) | | 04/01/2024 | | | 3.900 | % | | | 500,000 | | | | 507,437 | | |
NuStar Logistics LP(b) | | 02/01/2021 | | | 6.750 | % | | | 1,025,000 | | | | 1,026,538 | | |
| | | | 1,533,975 | | |
See Notes to Financial Statements.
www.arbitragefunds.com | 1-800-295-4485
36
Water Island Credit Opportunities Fund Portfolio of Investments (continued)
November 30, 2020 (Unaudited)
| | | Maturity
Date | | Rate | | Principal
Amount | | Value | |
CORPORATE BONDS - 67.89% (Continued) | |
Semiconductors - 0.37% | |
Microchip Technology, Inc.(b) | | 06/01/2021 | | | 3.922 | % | | $ | 250,000 | | | $ | 254,086 | | |
Software - 0.54% | |
Rackspace Technology
Global, Inc.(a) | | 11/15/2024 | | | 8.625 | % | | | 350,000 | | | | 365,330 | | |
Telecommunications - 17.08% | |
Cincinnati Bell, Inc.(a) | | 07/15/2024 | | | 7.000 | % | | | 2,300,000 | | | | 2,377,671 | | |
| | | 10/15/2025 | | | 8.000 | % | | | 2,000,000 | | | | 2,141,400 | | |
Hughes Satellite Systems
Corp.(b) | | 06/15/2021 | | | 7.625 | % | | | 1,000,000 | | | | 1,030,000 | | |
ORBCOMM, Inc.(a) | | 04/01/2024 | | | 8.000 | % | | | 3,000,000 | | | | 3,120,000 | | |
T-Mobile USA, Inc.(b) | | 03/01/2023 | | | 6.000 | % | | | 2,930,000 | | | | 2,935,655 | | |
| | | | 11,604,726 | | |
TOTAL CORPORATE BONDS
(Cost $45,126,974) | | | 46,113,332 | | |
CONVERTIBLE CORPORATE BONDS - 22.27% | |
Computers & Computer Services - 2.23% | |
Pure Storage, Inc. | | 04/15/2023 | | | 0.125 | % | | | 1,500,000 | | | | 1,517,333 | | |
Entertainment - 0.74% | |
Cineplex, Inc.(a) | | 09/30/2025 | | | 5.750 | % | | | 567,000 | | | | 502,079 | | |
Internet - 2.49% | |
Twitter, Inc. | | 06/15/2024 | | | 0.250 | % | | | 1,500,000 | | | | 1,689,788 | | |
Pharmaceuticals - 5.09% | |
Dermira, Inc. | | 05/15/2022 | | | 3.000 | % | | | 1,938,000 | | | | 1,957,380 | | |
Jazz Investments I Ltd. | | 08/15/2021 | | | 1.875 | % | | | 1,500,000 | | | | 1,502,663 | | |
| | | | 3,460,043 | | |
Semiconductors - 2.69% | |
Synaptics, Inc.(b) | | 06/15/2022 | | | 0.500 | % | | | 1,500,000 | | | | 1,830,000 | | |
Software - 9.03% | |
Nuance Communications, Inc.(b) | | 12/15/2035 | | | 1.000 | % | | | 1,000,000 | | | | 1,827,101 | | |
Verint Systems, Inc. | | 06/01/2021 | | | 1.500 | % | | | 2,000,000 | | | | 2,071,344 | | |
Slack Technologies, Inc.(a) | | 04/15/2025 | | | 0.500 | % | | | 1,500,000 | | | | 2,232,004 | | |
| | | | 6,130,449 | | |
TOTAL CONVERTIBLE CORPORATE BONDS
(Cost $13,545,829) | | | 15,129,692 | | |
See Notes to Financial Statements.
Semi-Annual Report | November 30, 2020
37
Water Island Credit Opportunities Fund Portfolio of Investments (continued)
November 30, 2020 (Unaudited)
| | | Shares | | Value | |
WARRANTS - 0.02% | |
Telecommunications - 0.02% | |
Avaya Holdings Corp., Exercise
Price $25.55, Expires 12/15/2022(c) | | | 3,017 | | | $ | 11,842 | | |
TOTAL WARRANTS
(Cost $0) | | | | | 11,842 | | |
PREFERRED STOCKS - 2.30% | |
Insurance - 0.20% | |
National General Holdings Corp., Series B, 7.500%(b) | | | 5,536 | | | | 140,725 | | |
National General Holdings Corp., Series C, 7.500% | | | 10 | | | | 262 | | |
| | | | 140,987 | | |
Real Estate Investment Trusts - 2.10% | |
Taubman Centers, Inc., Series J, 6.500% | | | 56,471 | | | | 1,425,334 | | |
TOTAL PREFERRED STOCKS
(Cost $1,415,612) | | | | | 1,566,321 | | |
| | | Expiration
Date | | Exercise
Price | | Notional
Amount | | Contracts | | Value | |
PURCHASED OPTIONS(c) - 0.48% | |
Call Options Purchased - 0.48% | |
Devon Energy Corp. | | 01/2021 | | $ | 12.74 | | | $ | 760,500 | | | | 500 | | | $ | 94,250 | | |
Scientific Games Corp. | |
| | | 12/2020 | | | 32.00 | | | | 37,280 | | | | 10 | | | | 5,650 | | |
| | | 12/2020 | | | 37.00 | | | | 372,800 | | | | 100 | | | | 24,750 | | |
Triumph Group, Inc. | | 01/2021 | | | 12.50 | | | | 1,317,000 | | | | 1,000 | | | | 202,500 | | |
TOTAL CALL OPTIONS PURCHASED
(Cost $255,628) | | | | 327,150 | |
TOTAL PURCHASED OPTIONS
(Cost $255,628) | | | | 327,150 | |
See Notes to Financial Statements.
www.arbitragefunds.com | 1-800-295-4485
38
Water Island Credit Opportunities Fund Portfolio of Investments (continued)
November 30, 2020 (Unaudited)
| | | Yield | | Shares | | Value | |
SHORT-TERM INVESTMENTS - 2.25% | |
Money Market Funds | |
Morgan Stanley Institutional Liquidity Fund
Government Portfolio, Institutional Class | | | 0.020 | %(d) | | | 763,918 | | | $ | 763,918 | | |
State Street Institutional U.S. Government
Money Market Fund, Premier Class | | | 0.132 | %(d) | | | 763,919 | | | | 763,919 | | |
| | | | 1,527,837 | | |
TOTAL SHORT-TERM INVESTMENTS
(Cost $1,527,837) | | | 1,527,837 | | |
Total Investments - 97.09%
(Cost $63,174,953) | | | 65,952,209 | | |
Other Assets in Excess of Liabilities - 2.91%(e) | | | 1,973,539 | | |
NET ASSETS - 100.00% | | $ | 67,925,748 | | |
Portfolio Footnotes
(a) Security exempt from registration under Rule 144A of the Securities Act of 1933. These securities may be resold in transactions exempt from registration, normally to qualified institutional buyers. As of November 30, 2020, these securities had a total value of $30,140,007 or 44.37% of net assets.
(b) Security, or a portion of security, is being held as collateral for short sales, written option contracts or forward foreign currency exchange contracts. At November 30, 2020, the aggregate fair market value of those securities was $12,249,290, representing 18.03% of net assets.
(c) Non-income-producing security.
(d) Rate shown is the 7-day effective yield as of November 30, 2020.
(e) Includes cash held as collateral for short sales and written option contracts.
See Notes to Financial Statements.
Semi-Annual Report | November 30, 2020
39
Water Island Credit Opportunities Fund Portfolio of Investments (continued)
November 30, 2020 (Unaudited)
SCHEDULE OF SECURITIES SOLD SHORT | | Shares | | Value | |
COMMON STOCKS - (12.65%) | |
Aerospace & Defense - (0.97%) | |
Triumph Group, Inc. | | | (50,100 | ) | | $ | (659,817 | ) | |
Auto Manufacturers - (0.33%) | |
Navistar International Corp. | | | (5,000 | ) | | | (221,300 | ) | |
Commercial Services - (0.43%) | |
Nielsen Holdings Plc | | | (18,000 | ) | | | (291,060 | ) | |
Computers & Computer Services - (0.61%) | |
Pure Storage, Inc., Class A | | | (22,800 | ) | | | (416,556 | ) | |
Entertainment - (0.82%) | |
Cineplex, Inc. | | | (32,500 | ) | | | (260,260 | ) | |
Scientific Games Corp., Class A | | | (7,900 | ) | | | (294,512 | ) | |
| | | | (554,772 | ) | |
Internet - (1.16%) | |
Endurance International Group Holdings, Inc. | | | (7,500 | ) | | | (71,100 | ) | |
Twitter, Inc. | | | (15,400 | ) | | | (716,254 | ) | |
| | | | (787,354 | ) | |
Oil & Gas - (0.62%) | |
Devon Energy Corp. | | | (30,000 | ) | | | (419,700 | ) | |
Pharmaceuticals - (0.31%) | |
Jazz Pharmaceuticals Plc | | | (1,500 | ) | | | (211,065 | ) | |
Semiconductors - (1.29%) | |
Synaptics, Inc. | | | (11,300 | ) | | | (878,801 | ) | |
Software - (5.02%) | |
Nuance Communications, Inc. | | | (37,200 | ) | | | (1,604,436 | ) | |
Slack Technologies, Inc., Class A | | | (33,900 | ) | | | (1,453,632 | ) | |
Verint Systems, Inc. | | | (6,200 | ) | | | (353,152 | ) | |
| | | | (3,411,220 | ) | |
Telecommunications - (1.09%) | |
Cincinnati Bell, Inc. | | | (43,400 | ) | | | (660,114 | ) | |
EchoStar Corp., Class A | | | (3,500 | ) | | | (83,195 | ) | |
| | | | (743,309 | ) | |
TOTAL COMMON STOCKS
(Proceeds $7,174,201) | | | (8,594,954 | ) | |
See Notes to Financial Statements.
www.arbitragefunds.com | 1-800-295-4485
40
Water Island Credit Opportunities Fund Portfolio of Investments (continued)
November 30, 2020 (Unaudited)
| | | Maturity
Date | | Rate | | Principal
Amount | | Value | |
U.S. TREASURY & GOVERNMENT AGENCIES - (4.34%) | |
Sovereign - (4.34%) | |
U.S. Treasury Bond | | 11/15/2049 | | | 2.375 | % | | $ | (268,000 | ) | | $ | (319,203 | ) | |
U.S. Treasury Bond | | 02/15/2050 | | | 2.000 | % | | | (1,240,000 | ) | | | (1,366,373 | ) | |
U.S. Treasury Note | | 02/28/2022 | | | 1.125 | % | | | (140,000 | ) | | | (141,772 | ) | |
U.S. Treasury Note | | 02/28/2025 | | | 1.125 | % | | | (1,080,000 | ) | | | (1,117,547 | ) | |
| | | | (2,944,895 | ) | |
TOTAL U.S. TREASURY & GOVERNMENT AGENCIES
(Proceeds $3,025,856) | | | (2,944,895 | ) | |
TOTAL SECURITIES SOLD SHORT
(Proceeds $10,200,057) | | $ | (11,539,849 | ) | |
WRITTEN OPTIONS | | Expiration
Date | | Exercise
Price | | Notional
Amount | | Contracts | | Value | |
Written Put Options | |
Jazz Pharmaceuticals
Plc | | 12/2020 | | | 140.00 | | | $ | (140,710 | ) | | | (10 | ) | | $ | (5,050 | ) | |
Twitter, Inc. | | 12/2020 | | | 45.00 | | | | (46,510 | ) | | | (10 | ) | | | (1,065 | ) | |
TOTAL WRITTEN PUT OPTIONS
(Premiums received $7,627) | | | (6,115 | ) | |
TOTAL WRITTEN OPTIONS
(Premiums received $7,627) | | $ | (6,115 | ) | |
See Notes to Financial Statements.
Semi-Annual Report | November 30, 2020
41
Water Island Credit Opportunities Fund Portfolio of Investments (continued)
November 30, 2020 (Unaudited)
EQUITY SWAP CONTRACTS
Swap
Counterparty/
Payment
Frequency | | Reference
Obligation | | Rate
Paid/
Received
by the
Fund | | Termination
Date | | Upfront
Payments
Paid | | Upfront
Payments
Received | | Market
Value | | Notional
Amount | | Unrealized
Appreciation | |
Morgan
Stanley &
Co./
Monthly
| | SPDR
Bloomberg
Barclays
High Yield
Bond ETF
| | Received
1 Month-
Federal
Rate
Minus
40 Bps
(-0.320%) | |
08/19/2021 | | $ | — | | | $ | — | | | $ | — | | | USD | 1,494,667 | | | $ | — | | |
Morgan
Stanley &
Co./
Monthly
| | iShares
iBoxx $
Investment
Grade
Corporate
Bond ETF
| | Paid
1 Month-
Federal
Rate
Minus
40 Bps
(-0.320%) | |
08/19/2021 | | | — | | | | — | | | | — | | | USD | 1,190,928 | | | | — | | |
Morgan
Stanley &
Co./
Monthly
| | NuStar
Energy LP
| | Paid
1 Month-
Federal
Rate
Minus
40 Bps
(-0.320%) | |
08/19/2021 | | | — | | | | — | | | | — | | | USD | 93,030 | | | | — | | |
| | | | | | | | | | | | | $ | — | | | | | | | $ | — | | |
OUTSTANDING FORWARD FOREIGN CURRENCY EXCHANGE CONTRACTS
Currency
Purchased | | Currency Sold | | Counterparty | | Settlement
Date | | Unrealized
Appreciation | |
CAD | 562,000 | | | USD | 427,611 | | | Morgan Stanley & Co. | | 12/15/2020 | | $ | 5,166 | | |
USD | 31,834 | | | CAD | 41,300 | | | Morgan Stanley & Co. | | 12/15/2020 | | | 31 | | |
| | | $ | 5,197 | | |
Currency
Purchased | | Currency Sold | | Counterparty | | Settlement
Date | | Unrealized
Depreciation | |
USD | 656,823 | | | CAD | 860,000 | | | Morgan Stanley & Co. | | 12/15/2020 | | $ | (5,435 | ) | |
See Notes to Financial Statements.
www.arbitragefunds.com | 1-800-295-4485
42
Water Island Credit Opportunities Fund Portfolio of Investments (continued)
November 30, 2020 (Unaudited)
The following is a summary of investments classified by country exposure:
Country | | % of Net Assets(a) | |
Netherlands | | | 4.39 | % | |
Ireland | | | 2.21 | % | |
Canada | | | 0.74 | % | |
Luxembourg | | | 0.65 | % | |
United States | | | 89.10 | % | |
Other Assets in Excess of Liabilities | | | 2.91 | % | |
| | | | 100.00 | % | |
(a) These percentages represent long positions only and are not net of short positions.
Abbreviations:
bps - Basis Points. 100 Basis Points is equal to 1 percentage point.
CAD - Canadian dollar
ETF - Exchange-Traded Fund
LIBOR - London Interbank Offered Rate
LLC - Limited Liability Company
LP - Limited Partnership
Ltd. - Limited
PIK - Payment-in-kind
Plc - Public Limited Company
SARL - Société Anonyme à Responsabilité Limitée is the French term for limited liability company.
SPDR - Standard & Poor's Depositary Receipt
USD - United States Dollar
See Notes to Financial Statements.
Semi-Annual Report | November 30, 2020
43
Water Island Credit Opportunities Fund Portfolio of Investments (continued)
November 30, 2020 (Unaudited)
The following table summarizes the Water Island Credit Opportunities Fund's investments and derivative financial instruments categorized in the fair value hierarchy as of November 30, 2020:
Investments in Securities at Value* | | Level 1 | | Level 2 | | Level 3 | | Total | |
Assets | |
Common Stocks** | | $ | 291,060 | | | $ | — | | | $ | — | | | $ | 291,060 | | |
Bank Loans | | | — | | | | 984,975 | | | | — | | | | 984,975 | | |
Corporate Bonds** | | | — | | | | 46,113,332 | | | | — | | | | 46,113,332 | | |
Convertible Corporate Bonds** | | | — | | | | 15,129,692 | | | | — | | | | 15,129,692 | | |
Warrants | | | — | | | | 11,842 | | | | — | | | | 11,842 | | |
Preferred Stocks** | | | 1,566,321 | | | | — | | | | — | | | | 1,566,321 | | |
Purchased Options | | | 327,150 | | | | — | | | | — | | | | 327,150 | | |
Short-Term Investments | | | 1,527,837 | | | | — | | | | — | | | | 1,527,837 | | |
TOTAL | | $ | 3,712,368 | | | $ | 62,239,841 | | | $ | — | | | $ | 65,952,209 | | |
Other Financial Instruments*** | |
Assets | |
Forward Foreign Currency Exchange
Contracts | | $ | — | | | $ | 5,197 | | | $ | — | | | $ | 5,197 | | |
Equity Swaps | | | 0 | | | | — | | | | — | | | | 0 | | |
Liabilities | |
Common Stocks** | | | (8,594,954 | ) | | | — | | | | — | | | | (8,594,954 | ) | |
U.S. Treasury & Government Agencies | | | — | | | | (2,944,895 | ) | | | — | | | | (2,944,895 | ) | |
Written Options | | | (6,115 | ) | | | — | | | | — | | | | (6,115 | ) | |
Forward Foreign Currency Exchange
Contracts | | | — | | | | (5,435 | ) | | | — | | | | (5,435 | ) | |
TOTAL | | $ | (8,601,069 | ) | | $ | (2,945,133 | ) | | $ | — | | | $ | (11,546,202 | ) | |
* Refer to footnote 2 where leveling hierarchy is defined.
** Refer to Portfolio of Investments for sector information.
*** Other financial instruments are instruments such as written options, securities sold short, equity swaps and forward foreign currency exchange contracts.
See Notes to Financial Statements.
www.arbitragefunds.com | 1-800-295-4485
44
Water Island Long/Short Fund Portfolio Information
November 30, 2020 (Unaudited)
Performance (annualized returns as of November 30, 2020)
| | One
Year | | Five
Year | | Ten
Year | | Since
Inception* | |
Water Island Long/Short Fund Class R | | | 23.25 | % | | | 6.62 | % | | | N/A | | | | 4.24 | % | |
Water Island Long/Short Fund Class I | | | 23.55 | % | | | 6.67 | % | | | N/A | | | | 4.28 | % | |
ICE BofA Merrill Lynch U.S. 3-Month
Treasury Bill Index | | | 0.80 | % | | | 1.20 | % | | | N/A | | | | 1.02 | % | |
S&P 500® Index | | | 17.46 | % | | | 13.99 | % | | | N/A | | | | 12.06 | % | |
Current performance may be higher or lower than performance quoted above. Any performance data quoted represents past performance and the investment return and principal value of an investment in the Fund will fluctuate so that an investor's shares, when redeemed, may be worth more or less than their original cost. Past performance is no guarantee of future results. Returns shown above include the reinvestment of all dividends and capital gains. Performance results do not include adjustments made for financial reporting purposes in accordance with U.S. generally accepted accounting principles and may differ from the amount reported in the Financial Highlights. Contractual fee waivers are currently in effect. Without such fee waivers, performance numbers would be reduced. You can obtain performance data current to the most recent month end by calling 1-800-295-4485 or going to www.arbitragefunds.com.
* Class R and Class I inception: 12/31/14. The "Since Inception" returns for securities indices are for the inception date of Class R and Class I shares.
The Total Annual Fund Operating Expenses for Class R and Class I are 12.84% and 12.85%, respectively. The Adviser has agreed to waive fees (not including the effects of interest, dividends on short positions, brokerage commissions, acquired fund fees and expenses, taxes, or other extraordinary expenses) in excess of 1.69% and 1.44% for Class R and Class I, respectively, until at least September 30, 2021. These expense ratios are as stated in the current prospectus and may differ from the expense ratios disclosed in the financial highlights in this report.
The ICE Bank of America (BofA) Merrill Lynch U.S. 3-Month Treasury Bill Index tracks the performance of the U.S. dollar denominated U.S. Treasury Bills publicly issued in the U.S. domestic market with a remaining term to final maturity of less than 3 months.
The S&P 500® Index is an unmanaged index consisting of 500 stocks.
An investor may not invest directly in an index.
Semi-Annual Report | November 30, 2020
45
Water Island Long/Short Fund Portfolio Information (continued)
November 30, 2020 (Unaudited)
Growth of $10,000 Investment
The chart represents historical performance of a hypothetical investment of $10,000 in the Class R shares of the Fund since inception. Past performance does not guarantee future results. This chart does not reflect the deduction of taxes that a shareholder would pay on Fund distributions or the redemption of Fund shares.
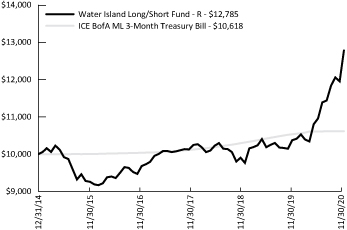
Sector Weighting
The following chart shows the sector weightings of the Water Island Long/Short Fund's investments (including short sales and excluding derivatives) as of the report date.
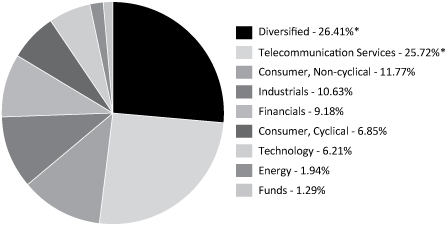
* Concentration Risk: If a large percentage of mergers or event-driven investment opportunities taking place within the U.S. are within one industry over a given period of time, the Fund may invest a large portion of its assets in securities of issuers in a single industry for that period of time. During such a period of concentration, the Fund may be subject to greater volatility with respect to its portfolio securities than a fund that is more broadly diversified.
www.arbitragefunds.com | 1-800-295-4485
46
Water Island Long/Short Fund Portfolio of Investments
November 30, 2020 (unaudited)
| | | Shares | | Value | |
COMMON STOCKS - 83.98% | |
Auto Parts & Equipment - 2.04% | |
Velodyne Lidar, Inc.(a) | | | 3,013 | | | $ | 47,967 | | |
Commercial Services - 1.57% | |
CoreLogic, Inc.(b) | | | 477 | | | | 36,967 | | |
Computers & Computer Services - 2.91% | |
Perspecta, Inc.(b) | | | 3,047 | | | | 68,314 | | |
Diversified Financial Services - 0.73% | |
GCM Grosvenor, Inc., Class A(a) | | | 1,813 | | | | 17,224 | | |
Energy - Alternate Sources - 1.31% | |
Championx Corp.(a)(b) | | | 2,595 | | | | 30,829 | | |
Engineering & Construction - 5.26% | |
AECOM(a)(b) | | | 1,420 | | | | 73,684 | | |
frontdoor, Inc.(a)(b) | | | 1,055 | | | | 49,943 | | |
| | | | 123,627 | | |
Food - 2.71% | |
Whole Earth Brands, Inc.(a) | | | 7,685 | | | | 63,709 | | |
Healthcare - Products - 1.42% | |
Oxford Immunotec Global Plc(a) | | | 2,344 | | | | 33,449 | | |
Insurance - 2.27% | |
Watford Holdings Ltd.(a) | | | 1,536 | | | | 53,330 | | |
Internet - 5.09% | |
Grubhub, Inc.(a)(b) | | | 923 | | | | 64,924 | | |
NortonLifeLock, Inc.(b) | | | 3,000 | | | | 54,690 | | |
| | | | 119,614 | | |
Leisure Time - 0.80% | |
Callaway Golf Co.(b) | | | 889 | | | | 18,891 | | |
Media - 10.60% | |
Kabel Deutschland Holding AG | | | 553 | | | | 71,242 | | |
TEGNA, Inc.(b) | | | 3,258 | | | | 46,948 | | |
Liberty Broadband Corp., Class A(a)(b) | | | 835 | | | | 130,903 | | |
| | | | 249,093 | | |
Miscellaneous Manufacturing - 1.40% | |
Trane Technologies Plc(b) | | | 225 | | | | 32,904 | | |
Pharmaceuticals - 3.17% | |
McKesson Europe AG | | | 2,223 | | | | 68,679 | | |
Paratek Pharmaceuticals, Inc.(a)(b) | | | 933 | | | | 5,775 | | |
| | | | 74,454 | | |
See Notes to Financial Statements.
Semi-Annual Report | November 30, 2020
47
Water Island Long/Short Fund Portfolio of Investments (continued)
November 30, 2020 (unaudited)
| | | Shares | | Value | |
COMMON STOCKS - 83.98% (Continued) | |
Real Estate Investment Trusts - 4.36% | |
Front Yard Residential Corp.(b) | | | 6,285 | | | $ | 102,571 | | |
Retail - 2.89% | |
Dunkin' Brands Group, Inc. | | | 374 | | | | 39,771 | | |
Shift Technologies, Inc.(a) | | | 3,000 | | | | 28,170 | | |
| | | | 67,941 | | |
Software - 2.14% | |
Cloudera, Inc.(a)(b) | | | 2,214 | | | | 25,859 | | |
Slack Technologies, Inc., Class A(a) | | | 568 | | | | 24,356 | | |
| | | | 50,215 | | |
Special Purpose Acquisition Companies - 28.04% | |
Alpha Healthcare Acquisition Corp.(a) | | | 1,349 | | | | 13,449 | | |
Artius Acquisition, Inc., Class A(a) | | | 1,023 | | | | 10,179 | | |
Bull Horn Holdings Corp.(a) | | | 2,645 | | | | 26,450 | | |
CC Neuberger Principal Holdings I, Class A(a) | | | 3,981 | | | | 41,124 | | |
CC Neuberger Principal Holdings II, Class A(a) | | | 1,012 | | | | 10,120 | | |
Churchill Capital Corp. IV, Class A(a) | | | 1,685 | | | | 16,648 | | |
DPCM Capital, Inc.(a) | | | 2,240 | | | | 22,736 | | |
Fast Acquisition Corp.(a) | | | 1,495 | | | | 15,473 | | |
Flying Eagle Acquisition Corp., Class A(a) | | | 2,369 | | | | 36,719 | | |
Foley Trasimene Acquisition Corp., Class A(a) | | | 1,968 | | | | 20,074 | | |
Fusion Acquisition Corp.(a) | | | 2,336 | | | | 24,528 | | |
Hennessy Capital Acquisition Corp. IV, Class A(a) | | | 791 | | | | 10,283 | | |
Hudson Executive Investment Corp., Class A(a) | | | 2,462 | | | | 24,448 | | |
Kingswood Acquisition Corp.(a) | | | 2,245 | | | | 22,652 | | |
Lefteris Acquisition Corp.(a) | | | 1,885 | | | | 18,831 | | |
LF Capital Acquisition Corp., Class A(a) | | | 2,177 | | | | 23,076 | | |
Live Oak Acquisition Corp., Class A(a) | | | 4,067 | | | | 50,837 | | |
Longview Acquisition Corp., Class A(a) | | | 2,839 | | | | 44,714 | | |
Oaktree Acquisition Corp. II(a) | | | 1,779 | | | | 18,128 | | |
Omnichannel Acquisition Corp.(a) | | | 1,812 | | | | 18,211 | | |
Pivotal Investment Corp. II, Class A(a) | | | 796 | | | | 11,176 | | |
Reinvent Technology Partners(a) | | | 1,779 | | | | 20,814 | | |
Roman DBDR Tech Acquisition Corp.(a) | | | 1,792 | | | | 18,368 | | |
Seaport Global Acquisition Corp.(a) | | | 3,015 | | | | 30,150 | | |
Spartacus Acquisition Corp.(a) | | | 1,792 | | | | 18,449 | | |
Sustainable Opportunities Acquisition Corp., Class A(a) | | | 1,281 | | | | 13,348 | | |
Trebia Acquisition Corp., Class A(a) | | | 1,968 | | | | 19,759 | | |
Trine Acquisition Corp., Class A(a) | | | 3,079 | | | | 39,657 | | |
Vy Global Growth(a) | | | 1,792 | | | | 18,673 | | |
| | | | 659,074 | | |
See Notes to Financial Statements.
www.arbitragefunds.com | 1-800-295-4485
48
Water Island Long/Short Fund Portfolio of Investments (continued)
November 30, 2020 (unaudited)
| | | Shares | | Value | |
COMMON STOCKS - 83.98% (Continued) | |
Telecommunications - 5.27% | |
Gilat Satellite Networks Ltd. | | | 4,900 | | | $ | 29,694 | | |
LogMeIn, Inc.(a)(c) | | | 1,063 | | | | 94,246 | | |
| | | | 123,940 | | |
TOTAL COMMON STOCKS
(Cost $1,749,439) | | | 1,974,113 | | |
WARRANTS - 1.36% | |
Special Purpose Acquisition Companies - 1.36% | |
Artius Acquisition, Inc., Class A, Exercise Price $11.50,
Expires 07/13/2026(a) | | | 341 | | | | 484 | | |
CC Neuberger Principal Holdings I, Class A, Exercise Price $11.50,
Expires 12/31/2025(a) | | | 1,327 | | | | 2,190 | | |
CC Neuberger Principal Holdings II, Class A, Exercise Price $11.50,
Expires 07/29/2025(a) | | | 253 | | | | 309 | | |
Churchill Capital Corp. IV, Class A, Exercise Price $11.50,
Expires 09/18/2025(a) | | | 337 | | | | 391 | | |
Foley Trasimene Acquisition Corp., Class A, Exercise Price $11.50,
Expires 07/17/2025(a) | | | 656 | | | | 1,095 | | |
Hudson Executive Investment Corp.,Class A, Exercise Price $11.50,
Expires 06/21/2025(a) | | | 1,231 | | | | 1,256 | | |
Live Oak Acquisition Corp., Class A, Exercise Price $11.50,
Expires 05/08/2027(a) | | | 6,984 | | | | 22,488 | | |
Sustainable Opportunities Acquisition Corp.,Class A,
Exercise Price $11.50, Expires 06/26/2025(a) | | | 1,745 | | | | 2,741 | | |
Trebia Acquisition Corp., Class A, Exercise Price $11.50,
Expires 12/31/2025(a) | | | 656 | | | | 918 | | |
| | | | 31,872 | | |
TOTAL WARRANTS
(Cost $16,320) | | | 31,872 | | |
PREFERRED STOCKS - 2.38% | |
Real Estate Investment Trusts - 2.38% | |
Taubman Centers, Inc., Series J, 6.500% | | | 2,219 | | | | 56,008 | | |
TOTAL PREFERRED STOCKS
(Cost $50,192) | | | 56,008 | | |
See Notes to Financial Statements.
Semi-Annual Report | November 30, 2020
49
Water Island Long/Short Fund Portfolio of Investments (continued)
November 30, 2020 (unaudited)
| | | Shares | | Value | |
PRIVATE INVESTMENTS(c)(d) - 0.06% | |
Fast Capital LLC(a) | | | 400 | | | $ | 400 | | |
Fuse LLC(a) | | | 1,100 | | | | 1,000 | | |
Fuse Sponsor Capital, Z2 Shares(a) | | | 110 | | | | 100 | | |
TOTAL PRIVATE INVESTMENTS
(Cost $1,525) | | | 1,500 | | |
| | | Expiration
Date | | Exercise
Price | | Notional
Amount | | Contracts | | Value | |
PURCHASED OPTIONS(a) - 0.06% | |
Call Option Purchased - 0.02% | |
Maxeon Solar
Technologies Ltd. | | 12/2020 | | $ | 30.00 | | | $ | 19,536 | | | | 8 | | | $ | 560 | | |
TOTAL CALL OPTIONS PURCHASED
(Cost $823) | | | 560 | | |
Put Options Purchased - 0.04% | |
iShares Russell 2000 ETF | | | | | | | | | | | |
| | | 12/2020 | | | 120.00 | | | | 271,530 | | | | 15 | | | | 0 | | |
| | | 12/2020 | | | 135.00 | | | | 271,530 | | | | 15 | | | | 53 | | |
| | | 01/2021 | | | 135.00 | | | | 615,468 | | | | 34 | | | | 935 | | |
TOTAL PUT OPTIONS PURCHASED
(Cost $38,542) | | | 988 | | |
TOTAL PURCHASED OPTIONS
(Cost $39,365) | | | 1,548 | | |
| | | Yield | | Shares | | Value | |
SHORT-TERM INVESTMENTS - 12.83% | |
Money Market Funds | |
Morgan Stanley Institutional Liquidity Fund
Government Portfolio, Institutional Class | | | 0.020 | %(e) | | | 150,778 | | | $ | 150,778 | | |
State Street Institutional U.S. Government Money
Market Fund, Premier Class | | | 0.132 | %(e) | | | 150,778 | | | | 150,778 | | |
| | | | 301,556 | | |
TOTAL SHORT-TERM INVESTMENTS
(Cost $301,556) | | | 301,556 | | |
Total Investments - 100.67%
(Cost $2,158,397) | | | 2,366,597 | | |
Liabilities in Excess of Other Assets - (0.67)%(f) | | | (15,827 | ) | |
NET ASSETS - 100.00% | | $ | 2,350,770 | | |
See Notes to Financial Statements.
www.arbitragefunds.com | 1-800-295-4485
50
Water Island Long/Short Fund Portfolio of Investments (continued)
November 30, 2020 (unaudited)
Portfolio Footnotes
(a) Non-income-producing security.
(b) Security, or a portion of security, is being held as collateral for short sales, written option contracts or forward foreign currency exchange contracts. At November 30, 2020, the aggregate fair market value of those securities was $676,459, representing 28.78% of net assets.
(c) Security fair valued using significant unobservable inputs and classified as a Level 3 security. As of November 30, 2020, the total fair market value of these securities was $95,746, representing 4.07% of net assets.
(d) Represents a holding that is a direct investment into a private company and is not a listed or publicly traded entity.
(e) Rate shown is the 7-day effective yield as of November 30, 2020.
(f) Includes cash held as collateral for short sales and written option contracts.
SCHEDULE OF SECURITIES SOLD SHORT | | Shares | | Value | |
COMMON STOCKS - (18.36%) | |
Commercial Services - (0.59%) | |
Booz Allen Hamilton Holding Corp., Class A | | | (159 | ) | | $ | (13,800 | ) | |
Computers & Computer Services - (0.98%) | |
CACI International, Inc., Class A | | | (46 | ) | | | (10,916 | ) | |
Science Applications International Corp. | | | (132 | ) | | | (12,215 | ) | |
| | | | (23,131 | ) | |
Construction Materials - (1.10%) | |
Johnson Controls International Plc | | | (273 | ) | | | (12,569 | ) | |
Lennox International, Inc. | | | (46 | ) | | | (13,240 | ) | |
| | | | (25,809 | ) | |
Energy - Alternate Sources - (0.75%) | |
Maxeon Solar Technologies Ltd. | | | (725 | ) | | | (17,704 | ) | |
Engineering & Construction - (2.62%) | |
Jacobs Engineering Group, Inc. | | | (169 | ) | | | (18,225 | ) | |
Stantec, Inc. | | | (534 | ) | | | (16,089 | ) | |
WillScot Mobile Mini Holdings Corp. | | | (500 | ) | | | (10,755 | ) | |
WSP Global, Inc. | | | (222 | ) | | | (16,487 | ) | |
| | | | (61,556 | ) | |
Environmental Control - (0.91%) | |
Tetra Tech, Inc. | | | (179 | ) | | | (21,346 | ) | |
Food - (2.79%) | |
Just Eat Takeaway.com N.V. | | | (619 | ) | | | (65,745 | ) | |
Food Service - (1.19%) | |
Aramark | | | (800 | ) | | | (28,000 | ) | |
Leisure Time - (0.35%) | |
Acushnet Holdings Corp. | | | (217 | ) | | | (8,181 | ) | |
See Notes to Financial Statements.
Semi-Annual Report | November 30, 2020
51
Water Island Long/Short Fund Portfolio of Investments (continued)
November 30, 2020 (unaudited)
SCHEDULE OF SECURITIES SOLD SHORT | | Shares | | Value | |
COMMON STOCKS - (18.36%) (Continued) | |
Media - (6.30%) | |
Charter Communications, Inc., Class A | | | (188 | ) | | $ | (122,574 | ) | |
Nexstar Media Group, Inc., Class A | | | (242 | ) | | | (25,471 | ) | |
| | | | (148,045 | ) | |
Pharmaceuticals - (0.22%) | |
Viatris, Inc. | | | (303 | ) | | | (5,096 | ) | |
Software - (0.56%) | |
salesforce.com, Inc. | | | (54 | ) | | | (13,273 | ) | |
TOTAL COMMON STOCKS
(Proceeds $364,342) | | | (431,686 | ) | |
EXCHANGE-TRADED FUNDS - (1.37%) | |
Equity Funds - (1.37%) | |
iShares Russell 2000 Growth ETF | | | (23 | ) | | | (6,040 | ) | |
VanEck Vectors Oil Services ETF | | | (189 | ) | | | (26,063 | ) | |
| | | | (32,103 | ) | |
TOTAL EXCHANGE-TRADED FUNDS
(Proceeds $29,063) | | | (32,103 | ) | |
TOTAL SECURITIES SOLD SHORT
(Proceeds $393,405) | | $ | (463,789 | ) | |
WRITTEN OPTIONS | | Expiration
Date | | Exercise
Price | | Notional
Amount | | Contracts | | Value | |
Written Put Options | |
iShares Russell 2000 ETF | |
| | | 12/2020 | | $ | 110.00 | | | $ | (271,530 | ) | | | (15 | ) | | $ | 0 | | |
| | | 12/2020 | | | 115.00 | | | | (271,530 | ) | | | (15 | ) | | | 0 | | |
| | | 01/2021 | | | 125.00 | | | | (615,468 | ) | | | (34 | ) | | | (493 | ) | |
TOTAL WRITTEN PUT OPTIONS
(Premiums received $26,265) | | | | | (493 | ) | |
TOTAL WRITTEN OPTIONS
(Premiums received $26,265) | | | | $ | (493 | ) | |
See Notes to Financial Statements.
www.arbitragefunds.com | 1-800-295-4485
52
Water Island Long/Short Fund Portfolio of Investments (continued)
November 30, 2020 (unaudited)
OUTSTANDING FORWARD FOREIGN CURRENCY EXCHANGE CONTRACTS
Currency
Purchased | | Currency Sold | | Counterparty | | Settlement
Date | | Unrealized
Appreciation | |
CAD | 35,590 | | | USD | 27,135 | | | Morgan Stanley & Co. | | 12/15/2020 | | $ | 271 | | |
EUR | 1,770 | | | USD | 2,082 | | | Morgan Stanley & Co. | | 12/15/2020 | | | 31 | | |
GBP | 10,000 | | | USD | 13,105 | | | Morgan Stanley & Co. | | 12/15/2020 | | | 226 | | |
| | | $ | 528 | | |
Currency
Purchased | | Currency Sold | | Counterparty | | Settlement
Date | | Unrealized
Depreciation | |
USD | 10,978 | | | CAD | 14,420 | | | Morgan Stanley & Co. | | 12/15/2020 | | $ | (126 | ) | |
USD | 142,418 | | | EUR | 120,180 | | | Morgan Stanley & Co. | | 12/15/2020 | | | (994 | ) | |
USD | 13,068 | | | GBP | 9,900 | | | Morgan Stanley & Co. | | 12/15/2020 | | | (132 | ) | |
| | | $ | (1,252 | ) | |
The following is a summary of investments classified by country exposure:
Country | | % of Net Assets(a) | |
Germany | | | 5.95 | % | |
United States Virgin Islands | | | 4.36 | % | |
Bermuda | | | 2.27 | % | |
United Kingdom | | | 1.42 | % | |
Ireland | | | 1.40 | % | |
Israel | | | 1.26 | % | |
Cayman Islands | | | 0.79 | % | |
United States | | | 83.22 | % | |
Liabilities in Excess of Other Assets | | | (0.67 | )% | |
| | | | 100.00 | % | |
(a) These percentages represent long positions only and are not net of short positions.
Abbreviations:
AG - Aktiengesellschaft is a German term that refers to a corporation that is limited by shares, i.e., owned by shareholders.
CAD - Canadian dollar
ETF - Exchange-Traded Fund
EUR - Euro
GBP - British pound
LLC - Limited Liability Company
Ltd. - Limited
N.V. - Naamloze Vennootschap is the Dutch term for a public limited liability corporation.
Plc - Public Limited Company
USD - United States Dollar
See Notes to Financial Statements.
Semi-Annual Report | November 30, 2020
53
Water Island Long/Short Fund Portfolio of Investments (continued)
November 30, 2020 (unaudited)
The following table summarizes the Water Island Long/Short Fund's investments and derivative financial instruments categorized in the fair value hierarchy as of November 30, 2020:
Investments in Securities at Value* | | Level 1 | | Level 2 | | Level 3 | | Total | |
Assets | |
Common Stocks | |
Auto Parts & Equipment | | $ | 47,967 | | | $ | — | | | $ | — | | | $ | 47,967 | | |
Commercial Services | | | 36,967 | | | | — | | | | — | | | | 36,967 | | |
Computers & Computer Services | | | 68,314 | | | | — | | | | — | | | | 68,314 | | |
Diversified Financial Services | | | 17,224 | | | | — | | | | — | | | | 17,224 | | |
Energy - Alternate Sources | | | 30,829 | | | | — | | | | — | | | | 30,829 | | |
Engineering & Construction | | | 123,627 | | | | — | | | | — | | | | 123,627 | | |
Food | | | 63,709 | | | | — | | | | — | | | | 63,709 | | |
Healthcare - Products | | | 33,449 | | | | — | | | | — | | | | 33,449 | | |
Insurance | | | 53,330 | | | | — | | | | — | | | | 53,330 | | |
Internet | | | 119,614 | | | | — | | | | — | | | | 119,614 | | |
Leisure Time | | | 18,891 | | | | — | | | | — | | | | 18,891 | | |
Media | | | 249,093 | | | | — | | | | — | | | | 249,093 | | |
Miscellaneous Manufacturing | | | 32,904 | | | | — | | | | — | | | | 32,904 | | |
Pharmaceuticals | | | 74,454 | | | | — | | | | — | | | | 74,454 | | |
Real Estate Investment Trusts | | | 102,571 | | | | — | | | | — | | | | 102,571 | | |
Retail | | | 67,941 | | | | — | | | | — | | | | 67,941 | | |
Software | | | 50,215 | | | | — | | | | — | | | | 50,215 | | |
Special Purpose Acquisition
Companies | | | 659,074 | | | | — | | | | — | | | | 659,074 | | |
Telecommunications | | | 29,694 | | | | — | | | | 94,246 | | | | 123,940 | | |
Warrants | | | 31,872 | | | | — | | | | — | | | | 31,872 | | |
Preferred Stocks** | | | 56,008 | | | | — | | | | — | | | | 56,008 | | |
Private Investments | | | — | | | | — | | | | 1,500 | | | | 1,500 | | |
Purchased Options | | | 1,548 | | | | — | | | | — | | | | 1,548 | | |
Short-Term Investments | | | 301,556 | | | | — | | | | — | | | | 301,556 | | |
TOTAL | | $ | 2,270,851 | | | $ | — | | | $ | 95,746 | | | $ | 2,366,597 | | |
Other Financial Instruments*** | |
Assets | |
Forward Foreign Currency
Exchange Contracts | | $ | — | | | $ | 528 | | | $ | — | | | $ | 528 | | |
Liabilities | |
Common Stocks** | | | (431,686 | ) | | | — | | | | — | | | | (431,686 | ) | |
Exchange-Traded Funds | | | (32,103 | ) | | | — | | | | — | | | | (32,103 | ) | |
Written Options | | | (493 | ) | | | — | | | | — | | | | (493 | ) | |
Forward Foreign Currency
Exchange Contracts | | | — | | | | (1,252 | ) | | | — | | | | (1,252 | ) | |
TOTAL | | $ | (464,282 | ) | | $ | (724 | ) | | $ | — | | | $ | (465,006 | ) | |
See Notes to Financial Statements.
www.arbitragefunds.com | 1-800-295-4485
54
Water Island Long/Short Fund Portfolio of Investments (continued)
November 30, 2020 (unaudited)
* Refer to footnote 2 where leveling hierarchy is defined.
** Refer to Portfolio of Investments for sector information.
*** Other financial instruments are instruments such as written options, securities sold short and forward foreign currency exchange contracts.
The following is a reconciliation of the fair valuations using significant unobservable inputs (Level 3) for the Fund's assets and liabilities during the period ended November 30, 2020:
Investments
in Securities | | Balance as of
May 31, 2020 | | Realized
Gain
(Loss) | | Change in
Unrealized
Appreciation
(Depreciation) | | Purchases | | Sales
Proceeds | | Transfers
into
Level 3 | | Transfers
out of
Level 3 | | Balance as of
November 30,
2020 | | Net change in
Unrealized
Appreciation
(Depreciation)
from
investments
still held as of
November 30,
2020 | |
Common
Stock | | $ | 44,492 | | | $ | 2,383 | | | $ | 2,511 | | | $ | — | | | $ | (58,633 | ) | | $ | 103,493 | | | $ | — | | | $ | 94,246 | | | $ | 3,822 | | |
Private
Investments | | | — | | | | — | | | | (25 | ) | | | 1,525 | | | | — | | | | — | | | | — | | | | 1,500 | | | | (25 | ) | |
Total | | $ | 44,492 | | | $ | 2,383 | | | $ | 2,486 | | | $ | 1,525 | | | $ | (58,633 | ) | | $ | 103,493 | | | $ | — | | | $ | 95,746 | | | $ | 3,797 | | |
The following table summarizes the quantitative inputs used for investments categorized as Level 3 of the fair value hierarchy as of November 30, 2020:
Investments in
Securities | | Fair Value at
November 30, 2020 | | Valuation
Technique | | Unobservable
Input | | Range of
Values | | Weighted
Average | |
Common Stock
| | $ | 94,246
| | | Deal Value
| | Final
Determination
on Dissent | | $ | 88.66
| | | $ | 88.66
| | |
| Private Investments | | | 1,500 | | | Cost | | Cost | | $ | .091-$1 | | | $ | 0.93 | | |
See Notes to Financial Statements.
Semi-Annual Report | November 30, 2020
55
| | | Arbitrage
Fund | | Water Island
Event-Driven
Fund | |
ASSETS | |
Investments: | |
At cost of unaffiliated investments | | $ | 1,251,782,630 | | | $ | 104,490,826 | | |
At cost of affiliated investments | | $ | 60,459,409 | | | $ | — | | |
At fair value of unaffiliated investments (Note 2) | | $ | 1,316,576,733 | | | $ | 109,671,090 | | |
At fair value of affiliated investments (Note 2) | | $ | 70,506,411 | | | $ | — | | |
Cash | | | 1,828,015 | | | | 18,237 | | |
Cash denominated in foreign currency (Cost $14,549,778, $1,094,810, $0 and $781) | | | 14,525,560 | | | | 1,092,982 | | |
Deposits with brokers for securities sold short (Note 2) | | | 286,417,665 | | | | 15,564,419 | | |
Segregated cash for collateral (Note 2) | | | 46,164,860 | | | | 3,751,550 | | |
Receivable for investment securities sold | | | 13,709,463 | | | | 3,407,188 | | |
Receivable for capital shares sold | | | 1,644,652 | | | | 50,401 | | |
Unrealized appreciation on forward foreign currency exchange contracts (Note 8) | | | 1,359,096 | | | | 115,145 | | |
Dividends and interest receivable | | | 800,761 | | | | 211,080 | | |
Prepaid expenses | | | 42,845 | | | | 37,235 | | |
Total Assets | | | 1,753,576,061 | | | | 133,919,327 | | |
LIABILITIES | |
Securities sold short, at value (Note 2) (proceeds $256,017,783, $15,894,299, $10,200,057 and
$393,405) | | | 291,361,579 | | | | 17,743,589 | | |
Written options, at value (Note 2) (premiums received $0, $0, $7,627 and $26,265) | | | — | | | | — | | |
Line of credit payable (Note 4) | | | — | | | | 500,000 | | |
Payable for investment securities purchased | | | 32,446,336 | | | | 4,611,734 | | |
Unrealized depreciation on forward foreign currency exchange contracts (Note 8) | | | 2,494,530 | | | | 206,372 | | |
Payable for capital shares redeemed | | | 1,393,182 | | | | 17,989 | | |
Payable to Adviser (Note 5) | | | 1,171,479 | | | | 100,979 | | |
Dividends payable on securities sold short | | | — | | | | 587 | | |
Payable to Distributor (Note 5) | | | 37,466 | | | | 1,908 | | |
Payable to Administrator (Note 5) | | | 60,998 | | | | 10,215 | | |
Payable to Transfer Agent (Note 5) | | | 188,670 | | | | 22,560 | | |
Payable to Custodian | | | 53,592 | | | | 8,087 | | |
Income distribution payable | | | — | | | | — | | |
Interest expense payable | | | 74,698 | | | | 5,956 | | |
Payable for swap reset | | | 30,894 | | | | 2,083 | | |
Audit and legal fees payable | | | 69,099 | | | | 18,215 | | |
Payable to Trustees | | | 46,265 | | | | 4,702 | | |
Chief Compliance Officer Fees payable (Note 5) | | | 62,022 | | | | 4,779 | | |
Chief Financial Officer Fees payable (Note 5) | | | 5,650 | | | | 979 | | |
Other accrued expenses and liabilities | | | 45,497 | | | | 10,417 | | |
Total Liabilities | | | 329,541,957 | | | | 23,271,151 | | |
NET ASSETS | | $ | 1,424,034,104 | | | $ | 110,648,176 | | |
NET ASSETS CONSIST OF: | |
Paid-in capital | | $ | 1,328,759,489 | | | $ | 157,183,947 | | |
Distributable earnings (Accumulated loss) | | | 95,274,615 | | | | (46,535,771 | ) | |
NET ASSETS | | $ | 1,424,034,104 | | | $ | 110,648,176 | | |
See Notes to Financial Statements.
www.arbitragefunds.com | 1-800-295-4485
56
Statement of Assets and Liabilities
November 30, 2020 (Unaudited)
| | | Water
Island Credit
Opportunities Fund | | Water Island
Long/Short
Fund | |
ASSETS | |
Investments: | |
At cost of unaffiliated investments | | $ | 63,174,953 | | | $ | 2,158,397 | | |
At cost of affiliated investments | | $ | — | | | $ | — | | |
At fair value of unaffiliated investments (Note 2) | | $ | 65,952,209 | | | $ | 2,366,597 | | |
At fair value of affiliated investments (Note 2) | | $ | — | | | $ | — | | |
Cash | | | 23,931 | | | | 25,023 | | |
Cash denominated in foreign currency (Cost $14,549,778, $1,094,810, $0 and $781) | | | — | | | | 782 | | |
Deposits with brokers for securities sold short (Note 2) | | | 11,639,438 | | | | 450,952 | | |
Segregated cash for collateral (Note 2) | | | 1,420,283 | | | | 838 | | |
Receivable for investment securities sold | | | — | | | | 56,460 | | |
Receivable for capital shares sold | | | 73,662 | | | | — | | |
Unrealized appreciation on forward foreign currency exchange contracts (Note 8) | | | 5,197 | | | | 528 | | |
Dividends and interest receivable | | | 741,395 | | | | 2,744 | | |
Prepaid expenses | | | 36,670 | | | | 20,454 | | |
Total Assets | | | 79,892,785 | | | | 2,924,378 | | |
LIABILITIES | |
Securities sold short, at value (Note 2) (proceeds $256,017,783, $15,894,299, $10,200,057 and
$393,405) | | | 11,539,849 | | | | 463,789 | | |
Written options, at value (Note 2) (premiums received $0, $0, $7,627 and $26,265) | | | 6,115 | | | | 493 | | |
Line of credit payable (Note 4) | | | — | | | | — | | |
Payable for investment securities purchased | | | 146,812 | | | | 54,430 | | |
Unrealized depreciation on forward foreign currency exchange contracts (Note 8) | | | 5,435 | | | | 1,252 | | |
Payable for capital shares redeemed | | | 140,791 | | | | — | | |
Payable to Adviser (Note 5) | | | 54,816 | | | | 23,326 | | |
Dividends payable on securities sold short | | | 1,230 | | | | 168 | | |
Payable to Distributor (Note 5) | | | 938 | | | | 3 | | |
Payable to Administrator (Note 5) | | | 13,543 | | | | 3,709 | | |
Payable to Transfer Agent (Note 5) | | | 9,835 | | | | 308 | | |
Payable to Custodian | | | 3,888 | | | | 5,748 | | |
Income distribution payable | | | 146 | | | | — | | |
Interest expense payable | | | 14,245 | | | | 167 | | |
Payable for swap reset | | | 718 | | | | — | | |
Audit and legal fees payable | | | 16,094 | | | | 13,799 | | |
Payable to Trustees | | | 3,340 | | | | 1,318 | | |
Chief Compliance Officer Fees payable (Note 5) | | | 3,352 | | | | 98 | | |
Chief Financial Officer Fees payable (Note 5) | | | 736 | | | | 598 | | |
Other accrued expenses and liabilities | | | 5,154 | | | | 4,402 | | |
Total Liabilities | | | 11,967,037 | | | | 573,608 | | |
NET ASSETS | | $ | 67,925,748 | | | $ | 2,350,770 | | |
NET ASSETS CONSIST OF: | |
Paid-in capital | | $ | 68,690,374 | | | $ | 1,954,886 | | |
Distributable earnings (Accumulated loss) | | | (764,626 | ) | | | 395,884 | | |
NET ASSETS | | $ | 67,925,748 | | | $ | 2,350,770 | | |
Semi-Annual Report | November 30, 2020
57
| | | Arbitrage
Fund | | Water Island
Event-Driven
Fund | |
PRICING OF SHARES: | |
CLASS R SHARES: | |
Net assets applicable to Class R shares | | $ | 90,056,018 | | | $ | 7,898,241 | | |
Shares of beneficial interest outstanding (unlimited number of shares authorized, no par value) | | | 6,692,763 | | | | 744,986 | | |
Net asset value and offering price per share | | $ | 13.46 | | | $ | 10.60 | | |
CLASS I SHARES: | |
Net assets applicable to Class I shares | | $ | 1,290,998,239 | | | $ | 102,064,903 | | |
Shares of beneficial interest outstanding (unlimited number of shares authorized, no par value) | | | 92,770,048 | | | | 9,536,556 | | |
Net asset value and offering price per share | | $ | 13.92 | | | $ | 10.70 | | |
CLASS C SHARES: | |
Net assets applicable to Class C shares | | $ | 16,566,096 | | | $ | 360,846 | | |
Shares of beneficial interest outstanding (unlimited number of shares authorized, no par value) | | | 1,305,714 | | | | 35,006 | | |
Net asset value and offering price per share(a) | | $ | 12.69 | | | $ | 10.31 | | |
CLASS A SHARES: | |
Net assets applicable to Class A shares | | $ | 26,413,751 | | | $ | 324,186 | | |
Shares of beneficial interest outstanding (unlimited number of shares authorized, no par value) | | | 1,966,894 | | | | 30,585 | | |
Net asset value and offering price per share(a) | | $ | 13.43 | | | $ | 10.60 | | |
Maximum offering price per share (NAV/(100% — maximum sales charge)) | | $ | 13.81 | | | $ | 10.96 | | |
Maximum sales charge | | | 2.75 | % | | | 3.25 | % | |
(a) Redemption price varies based on length of time held (Note 1).
See Notes to Financial Statements.
www.arbitragefunds.com | 1-800-295-4485
58
Statement of Assets and Liabilities
November 30, 2020 (Unaudited)
| | | Water
Island Credit
Opportunities Fund | | Water Island
Long/Short
Fund | |
PRICING OF SHARES: | |
CLASS R SHARES: | |
Net assets applicable to Class R shares | | $ | 1,784,263 | | | $ | 12,779 | | |
Shares of beneficial interest outstanding (unlimited number of shares authorized, no par value) | | | 177,754 | | | | 1,049 | | |
Net asset value and offering price per share | | $ | 10.04 | | | $ | 12.18 | | |
CLASS I SHARES: | |
Net assets applicable to Class I shares | | $ | 65,368,221 | | | $ | 2,337,991 | | |
Shares of beneficial interest outstanding (unlimited number of shares authorized, no par value) | | | 6,542,902 | | | | 191,884 | | |
Net asset value and offering price per share | | $ | 9.99 | | | $ | 12.18 | | |
CLASS C SHARES: | |
Net assets applicable to Class C shares | | $ | 691,039 | | | $ | — | | |
Shares of beneficial interest outstanding (unlimited number of shares authorized, no par value) | | | 69,099 | | | | — | | |
Net asset value and offering price per share(a) | | $ | 10.00 | | | $ | — | | |
CLASS A SHARES: | |
Net assets applicable to Class A shares | | $ | 82,225 | | | $ | — | | |
Shares of beneficial interest outstanding (unlimited number of shares authorized, no par value) | | | 8,226 | | | | — | | |
Net asset value and offering price per share(a) | | $ | 10.00 | | | $ | — | | |
Maximum offering price per share (NAV/(100% — maximum sales charge)) | | $ | 10.34 | | | $ | — | | |
Maximum sales charge | | | 3.25 | % | | | — | | |
Semi-Annual Report | November 30, 2020
59
| | | Arbitrage
Fund | | Water Island
Event-Driven
Fund | |
INVESTMENT INCOME | |
Dividend income | | $ | 4,945,300 | | | $ | 377,474 | | |
Foreign taxes withheld on dividends | | | (114,480 | ) | | | (10,553 | ) | |
Interest income | | | 117,755 | | | | 168,588 | | |
Total Investment Income | | | 4,948,575 | | | | 535,509 | | |
EXPENSES | |
Investment advisory fees (Note 5) | | | 7,470,045 | | | | 591,572 | | |
Distribution and service fees (Note 5) | |
Class R | | | 113,265 | | | | 9,395 | | |
Class C | | | 88,541 | | | | 1,802 | | |
Class A | | | 28,290 | | | | 435 | | |
Administrative fees (Note 5) | | | 184,109 | | | | 29,381 | | |
Chief Compliance Officer fees (Note 5) | | | 95,064 | | | | 7,271 | | |
Trustees' fees | | | 136,965 | | | | 12,873 | | |
Dividend expense | | | 17,160 | | | | 10,038 | | |
Interest rebate expense | | | 480,409 | | | | 61,906 | | |
Transfer agent fees (Note 5) | | | 618,879 | | | | 82,262 | | |
Custodian and bank service fees | | | 117,230 | | | | 24,922 | | |
Registration and filing fees | | | 40,893 | | | | 31,871 | | |
Printing of shareholder reports | | | 67,588 | | | | 9,248 | | |
Professional fees | | | 106,989 | | | | 31,597 | | |
Line of credit interest expense (Note 4) | | | — | | | | 3,963 | | |
Insurance expense | | | 36,439 | | | | 2,857 | | |
Chief Financial Officer fees (Note 5) | | | 30,806 | | | | 5,604 | | |
Other expenses | | | 44,135 | | | | 10,750 | | |
Total Expenses | | | 9,676,807 | | | | 927,747 | | |
Fees waived and/or reimbursed by the Adviser, Class R (Note 5) | | | (27,465 | ) | | | (4,597 | ) | |
Fees waived and/or reimbursed by the Adviser, Class I (Note 5) | | | (385,800 | ) | | | (60,757 | ) | |
Fees waived and/or reimbursed by the Adviser, Class C (Note 5) | | | (5,364 | ) | | | (220 | ) | |
Fees waived and/or reimbursed by the Adviser, Class A (Note 5) | | | (6,882 | ) | | | (213 | ) | |
Net Expenses | | | 9,251,296 | | | | 861,960 | | |
NET INVESTMENT INCOME (LOSS) | | | (4,302,721 | ) | | | (326,451 | ) | |
See Notes to Financial Statements.
www.arbitragefunds.com | 1-800-295-4485
60
For the Period Ended November 30, 2020 (Unaudited)
| | | Water
Island Credit
Opportunities Fund | | Water Island
Long/Short
Fund | |
INVESTMENT INCOME | |
Dividend income | | $ | 54,120 | | | $ | 10,033 | | |
Foreign taxes withheld on dividends | | | — | | | | (771 | ) | |
Interest income | | | 1,256,341 | | | | — | | |
Total Investment Income | | | 1,310,461 | | | | 9,262 | | |
EXPENSES | |
Investment advisory fees (Note 5) | | | 309,334 | | | | 13,185 | | |
Distribution and service fees (Note 5) | |
Class R | | | 2,403 | | | | 15 | | |
Class C | | | 3,400 | | | | — | | |
Class A | | | 105 | | | | — | | |
Administrative fees (Note 5) | | | 41,281 | | | | 12,032 | | |
Chief Compliance Officer fees (Note 5) | | | 4,072 | | | | 134 | | |
Trustees' fees | | | 8,712 | | | | 2,701 | | |
Dividend expense | | | 3,498 | | | | 1,665 | | |
Interest rebate expense | | | 21,390 | | | | 2,606 | | |
Transfer agent fees (Note 5) | | | 38,079 | | | | 1,440 | | |
Custodian and bank service fees | | | 13,271 | | | | 12,070 | | |
Registration and filing fees | | | 30,347 | | | | 19,783 | | |
Printing of shareholder reports | | | 3,461 | | | | 624 | | |
Professional fees | | | 12,304 | | | | 8,064 | | |
Line of credit interest expense (Note 4) | | | 2,395 | | | | — | | |
Insurance expense | | | 1,252 | | | | 42 | | |
Chief Financial Officer fees (Note 5) | | | 4,673 | | | | 3,547 | | |
Other expenses | | | 9,565 | | | | 6,377 | | |
Total Expenses | | | 509,542 | | | | 84,285 | | |
Fees waived and/or reimbursed by the Adviser, Class R (Note 5) | | | (4,646 | ) | | | (364 | ) | |
Fees waived and/or reimbursed by the Adviser, Class I (Note 5) | | | (150,756 | ) | | | (64,448 | ) | |
Fees waived and/or reimbursed by the Adviser, Class C (Note 5) | | | (1,643 | ) | | | — | | |
Fees waived and/or reimbursed by the Adviser, Class A (Note 5) | | | (202 | ) | | | — | | |
Net Expenses | | | 352,295 | | | | 19,473 | | |
NET INVESTMENT INCOME (LOSS) | | | 958,166 | | | | (10,211 | ) | |
Semi-Annual Report | November 30, 2020
61
| | | Arbitrage
Fund | | Water Island
Event-Driven
Fund | |
REALIZED AND UNREALIZED GAINS (LOSSES) ON INVESTMENTS AND FOREIGN CURRENCIES | |
Net realized gains (losses) from: | |
Unaffiliated investments | | $ | 70,191,781 | | | $ | 8,466,798 | | |
Purchased option contracts | | | 3,310,364 | | | | 249,565 | | |
Swap contracts | | | (16,129,509 | ) | | | (427,043 | ) | |
Securities sold short | | | (54,558,523 | ) | | | (5,331,307 | ) | |
Written option contracts | | | — | | | | — | | |
Forward currency contracts | | | (1,708,660 | ) | | | (84,842 | ) | |
Foreign currency transactions (Note 8) | | | (713,744 | ) | | | 8,306 | | |
Net change in unrealized appreciation (depreciation) on: | |
Unaffiliated investments | | | 77,240,513 | | | | 5,017,608 | | |
Affiliated investments | | | 4,283,100 | | | | — | | |
Securities sold short | | | (27,481,733 | ) | | | (513,014 | ) | |
Foreign currency transactions (Note 8) | | | (21,818 | ) | | | (1,210 | ) | |
Purchased option contracts | | | (349,834 | ) | | | (70,378 | ) | |
Written option contracts | | | — | | | | — | | |
Forward currency contracts | | | (4,021,113 | ) | | | (232,773 | ) | |
NET REALIZED AND UNREALIZED GAINS (LOSSES) ON INVESTMENTS AND
FOREIGN CURRENCIES | | | 50,040,824 | | | | 7,081,710 | | |
NET INCREASE IN NET ASSETS RESULTING FROM OPERATIONS | | $ | 45,738,103 | | | $ | 6,755,259 | | |
See Notes to Financial Statements.
www.arbitragefunds.com | 1-800-295-4485
62
For the Period Ended November 30, 2020 (Unaudited)
| | | Water
Island Credit
Opportunities Fund | | Water Island
Long/Short
Fund | |
REALIZED AND UNREALIZED GAINS (LOSSES) ON INVESTMENTS AND FOREIGN CURRENCIES | |
Net realized gains (losses) from: | |
Unaffiliated investments | | $ | 1,740,849 | | | $ | 312,381 | | |
Purchased option contracts | | | 56,951 | | | | (19,630 | ) | |
Swap contracts | | | (67,522 | ) | | | (1,365 | ) | |
Securities sold short | | | (1,394,131 | ) | | | (61,760 | ) | |
Written option contracts | | | 84,001 | | | | 5,662 | | |
Forward currency contracts | | | (32,685 | ) | | | (6,847 | ) | |
Foreign currency transactions (Note 8) | | | 14,388 | | | | 282 | | |
Net change in unrealized appreciation (depreciation) on: | |
Unaffiliated investments | | | 3,151,973 | | | | 164,527 | | |
Affiliated investments | | | — | | | | — | | |
Securities sold short | | | (709,526 | ) | | | (37,297 | ) | |
Foreign currency transactions (Note 8) | | | 54 | | | | 25 | | |
Purchased option contracts | | | (191,377 | ) | | | (39,040 | ) | |
Written option contracts | | | 9,479 | | | | 19,221 | | |
Forward currency contracts | | | (238 | ) | | | (2,008 | ) | |
NET REALIZED AND UNREALIZED GAINS (LOSSES) ON INVESTMENTS AND
FOREIGN CURRENCIES | | | 2,662,216 | | | | 334,151 | | |
NET INCREASE IN NET ASSETS RESULTING FROM OPERATIONS | | $ | 3,620,382 | | | $ | 323,940 | | |
Semi-Annual Report | November 30, 2020
63
| | | Arbitrage Fund | |
| | | Six Months
Ended
November 30,
2020
(Unaudited) | | Year Ended
May 31, 2020 | |
FROM OPERATIONS | |
Net investment income (loss) | | $ | (4,302,721 | ) | | $ | (2,736,933 | ) | |
Net realized gains (losses) from: | |
Unaffiliated investments | | | 70,191,781 | | | | 93,070,280 | | |
Purchased option contracts | | | 3,310,364 | | | | (5,039,302 | ) | |
Swap contracts | | | (16,129,509 | ) | | | (12,721,184 | ) | |
Securities sold short | | | (54,558,523 | ) | | | (11,978,565 | ) | |
Written option contracts | | | — | | | | 317,902 | | |
Forward currency contracts | | | (1,708,660 | ) | | | 3,988,837 | | |
Foreign currency transactions | | | (713,744 | ) | | | 2,309,502 | | |
Net change in unrealized appreciation (depreciation) on: | |
Unaffiliated investments | | | 77,240,513 | | | | (25,875,315 | ) | |
Affiliated investments | | | 4,283,100 | | | | 5,728,034 | | |
Securities sold short | | | (27,481,733 | ) | | | 929,782 | | |
Foreign currency transactions | | | (21,818 | ) | | | 389 | | |
Purchased option contracts | | | (349,834 | ) | | | 252,665 | | |
Written option contracts | | | — | | | | (25,601 | ) | |
Forward currency contracts | | | (4,021,113 | ) | | | (2,224,904 | ) | |
Net increase in net assets resulting from operations | | | 45,738,103 | | | | 45,995,587 | | |
FROM DIVIDENDS AND DISTRIBUTIONS TO SHAREHOLDERS: | |
Distributions, Class R | | | — | | | | (3,028,417 | ) | |
Distributions, Class I | | | — | | | | (30,760,287 | ) | |
Distributions, Class C | | | — | | | | (441,292 | ) | |
Distributions, Class A | | | — | | | | (377,484 | ) | |
Decrease in net assets from distributions to shareholders | | | — | | | | (34,607,480 | ) | |
FROM CAPITAL SHARE TRANSACTIONS (NOTE 7): | |
Proceeds from shares sold | | | 210,785,984 | | | | 388,612,998 | | |
Shares issued in reinvestment of distributions | | | — | | | | 27,514,664 | | |
Payments for shares redeemed | | | (212,665,681 | ) | | | (794,621,293 | ) | |
Net increase (decrease) in net assets from capital share transactions | | | (1,879,697 | ) | | | (378,493,631 | ) | |
TOTAL INCREASE (DECREASE) IN NET ASSETS | | | 43,858,406 | | | | (367,105,524 | ) | |
NET ASSETS | |
Beginning of period | | | 1,380,175,698 | | | | 1,747,281,222 | | |
End of period | | $ | 1,424,034,104 | | | $ | 1,380,175,698 | | |
See Notes to Financial Statements.
www.arbitragefunds.com | 1-800-295-4485
64
Statement of Changes in Net Assets
| | | Water Island Event-Driven Fund | |
| | | Six Months
Ended
November 30,
2020
(Unaudited) | | Year Ended
May 31, 2020 | |
FROM OPERATIONS | |
Net investment income (loss) | | $ | (326,451 | ) | | $ | 212,973 | | |
Net realized gains (losses) from: | |
Unaffiliated investments | | | 8,466,798 | | | | 8,182,595 | | |
Purchased option contracts | | | 249,565 | | | | (621,405 | ) | |
Swap contracts | | | (427,043 | ) | | | 1,324,551 | | |
Securities sold short | | | (5,331,307 | ) | | | (2,345,694 | ) | |
Written option contracts | | | — | | | | 181,455 | | |
Forward currency contracts | | | (84,842 | ) | | | 86,167 | | |
Foreign currency transactions | | | 8,306 | | | | 19,249 | | |
Net change in unrealized appreciation (depreciation) on: | |
Unaffiliated investments | | | 5,017,608 | | | | 269,869 | | |
Affiliated investments | | | — | | | | — | | |
Securities sold short | | | (513,014 | ) | | | (1,701,864 | ) | |
Foreign currency transactions | | | (1,210 | ) | | | 26 | | |
Purchased option contracts | | | (70,378 | ) | | | 26,088 | | |
Written option contracts | | | — | | | | (4,956 | ) | |
Forward currency contracts | | | (232,773 | ) | | | (29,486 | ) | |
Net increase in net assets resulting from operations | | | 6,755,259 | | | | 5,599,568 | | |
FROM DIVIDENDS AND DISTRIBUTIONS TO SHAREHOLDERS: | |
Distributions, Class R | | | — | | | | (57,935 | ) | |
Distributions, Class I | | | — | | | | (460,278 | ) | |
Distributions, Class C | | | — | | | | — | | |
Distributions, Class A | | | — | | | | (1,743 | ) | |
Decrease in net assets from distributions to shareholders | | | — | | | | (519,956 | ) | |
FROM CAPITAL SHARE TRANSACTIONS (NOTE 7): | |
Proceeds from shares sold | | | 4,523,842 | | | | 58,223,304 | | |
Shares issued in reinvestment of distributions | | | — | | | | 469,438 | | |
Payments for shares redeemed | | | (8,110,334 | ) | | | (81,019,387 | ) | |
Net increase (decrease) in net assets from capital share transactions | | | (3,586,492 | ) | | | (22,326,645 | ) | |
TOTAL INCREASE (DECREASE) IN NET ASSETS | | | 3,168,767 | | | | (17,247,033 | ) | |
NET ASSETS | |
Beginning of period | | | 107,479,409 | | | | 124,726,442 | | |
End of period | | $ | 110,648,176 | | | $ | 107,479,409 | | |
Semi-Annual Report | November 30, 2020
65
| | | Water Island Credit
Opportunities Fund | |
| | | Six Months
Ended
November 30,
2020
(Unaudited) | | Year Ended
May 31, 2020 | |
FROM OPERATIONS | |
Net investment income (loss) | | $ | 958,166 | | | $ | 1,562,938 | | |
Net realized gains (losses) from: | |
Unaffiliated investments | | | 1,740,849 | | | | 175,502 | | |
Purchased option contracts | | | 56,951 | | | | 130,754 | | |
Swap contracts | | | (67,522 | ) | | | (113,022 | ) | |
Securities sold short | | | (1,394,131 | ) | | | 511,864 | | |
Written option contracts | | | 84,001 | | | | 21,926 | | |
Forward currency contracts | | | (32,685 | ) | | | — | | |
Foreign currency transactions | | | 14,388 | | | | (106 | ) | |
Net change in unrealized appreciation (depreciation) on: | |
Unaffiliated investments | | | 3,151,973 | | | | (98,597 | ) | |
Securities sold short | | | (709,526 | ) | | | (873,080 | ) | |
Foreign currency transactions | | | 54 | | | | — | | |
Purchased option contracts | | | (191,377 | ) | | | 243,824 | | |
Written option contracts | | | 9,479 | | | | (9,147 | ) | |
Forward currency contracts | | | (238 | ) | | | — | | |
Net increase in net assets resulting from operations | | | 3,620,382 | | | | 1,552,856 | | |
FROM DIVIDENDS AND DISTRIBUTIONS TO SHAREHOLDERS: | |
Distributions, Class R | | | (28,864 | ) | | | (233,649 | ) | |
Distributions, Class I | | | (989,477 | ) | | | (1,648,549 | ) | |
Distributions, Class C | | | (7,436 | ) | | | (10,320 | ) | |
Distributions, Class A | | | (1,229 | ) | | | (7,297 | ) | |
Decrease in net assets from distributions to shareholders | | | (1,027,006 | ) | | | (1,899,815 | ) | |
FROM CAPITAL SHARE TRANSACTIONS (NOTE 7): | |
Proceeds from shares sold | | | 17,621,344 | | | | 25,851,224 | | |
Shares issued in reinvestment of distributions | | | 1,025,567 | | | | 1,887,360 | | |
Payments for shares redeemed | | | (14,602,815 | ) | | | (24,332,391 | ) | |
Net increase (decrease) in net assets from capital share transactions | | | 4,044,096 | | | | 3,406,193 | | |
TOTAL INCREASE (DECREASE) IN NET ASSETS | | | 6,637,472 | | | | 3,059,234 | | |
NET ASSETS | |
Beginning of period | | | 61,288,276 | | | | 58,229,042 | | |
End of period | | $ | 67,925,748 | | | $ | 61,288,276 | | |
See Notes to Financial Statements.
www.arbitragefunds.com | 1-800-295-4485
66
Statement of Changes in Net Assets
| | | Water Island Long/Short Fund | |
| | | Six Months
Ended
November 30,
2020
(Unaudited) | | Year Ended
May 31, 2020 | |
FROM OPERATIONS | |
Net investment income (loss) | | $ | (10,211 | ) | | $ | 59,555 | | |
Net realized gains (losses) from: | |
Unaffiliated investments | | | 312,381 | | | | 20,869 | | |
Purchased option contracts | | | (19,630 | ) | | | (51,982 | ) | |
Swap contracts | | | (1,365 | ) | | | (5,921 | ) | |
Securities sold short | | | (61,760 | ) | | | 48,669 | | |
Written option contracts | | | 5,662 | | | | 14,261 | | |
Forward currency contracts | | | (6,847 | ) | | | 2,966 | | |
Foreign currency transactions | | | 282 | | | | (331 | ) | |
Net change in unrealized appreciation (depreciation) on: | |
Unaffiliated investments | | | 164,527 | | | | 118,152 | | |
Securities sold short | | | (37,297 | ) | | | (64,266 | ) | |
Foreign currency transactions | | | 25 | | | | 1 | | |
Purchased option contracts | | | (39,040 | ) | | | (8,504 | ) | |
Written option contracts | | | 19,221 | | | | 8,092 | | |
Forward currency contracts | | | (2,008 | ) | | | 184 | | |
Net increase in net assets resulting from operations | | | 323,940 | | | | 141,745 | | |
FROM DIVIDENDS AND DISTRIBUTIONS TO SHAREHOLDERS: | |
Distributions, Class R | | | — | | | | (176 | ) | |
Distributions, Class I | | | — | | | | (36,186 | ) | |
Distributions, Class C | | | — | | | | — | | |
Distributions, Class A | | | — | | | | — | | |
Decrease in net assets from distributions to shareholders | | | — | | | | (36,362 | ) | |
FROM CAPITAL SHARE TRANSACTIONS (NOTE 7): | |
Proceeds from shares sold | | | 106,461 | | | | 70,694 | | |
Shares issued in reinvestment of distributions | | | — | | | | 36,362 | | |
Payments for shares redeemed | | | — | | | | (666,226 | ) | |
Net increase (decrease) in net assets from capital share transactions | | | 106,461 | | | | (559,170 | ) | |
TOTAL INCREASE (DECREASE) IN NET ASSETS | | | 430,401 | | | | (453,787 | ) | |
NET ASSETS | |
Beginning of period | | | 1,920,369 | | | | 2,374,156 | | |
End of period | | $ | 2,350,770 | | | $ | 1,920,369 | | |
Semi-Annual Report | November 30, 2020
67
Selected Per Share Data and Ratios for a Share Outstanding Throughout the Periods Presented:
| | | Six Months
Ended
November 30,
2020 | | Year Ended May 31, | |
| | | (Unaudited) | | 2020 | | 2019 | | 2018 | | 2017 | | 2016 | |
Net asset value,
beginning of period | | $ | 13.04 | | | $ | 12.92 | | | $ | 12.65 | | | $ | 13.06 | | | $ | 12.78 | | | $ | 12.97 | | |
Income (loss) from
investment
operations | |
Net investment
income (loss)(a) | | | (0.05 | ) | | | (0.05 | ) | | | (0.03 | )(c) | | | 0.05 | | | | (0.13 | )(b) | | | (0.06 | ) | |
Net realized and
unrealized gains
(losses) on
investments and
foreign currencies | | | 0.47 | | | | 0.44 | | | | 0.52 | | | | (0.01 | )(c) | | | 0.53 | (d) | | | 0.17 | | |
Total from investment
operations | | | 0.42 | | | | 0.39 | | | | 0.49 | | | | 0.04 | | | | 0.40 | | | | 0.11 | | |
Less distributions | |
From net
investment
income | | | — | | | | — | | | | (0.06 | ) | | | (0.09 | ) | | | — | | | | — | | |
From net
realized gains | | | — | | | | (0.27 | ) | | | (0.16 | ) | | | (0.36 | ) | | | (0.12 | ) | | | (0.30 | ) | |
Total distributions | | | — | | | | (0.27 | ) | | | (0.22 | ) | | | (0.45 | ) | | | (0.12 | ) | | | (0.30 | ) | |
Proceeds from
redemption fees
collected | | | — | | | | — | | | | — | | | | 0.00 | (e) | | | 0.00 | (e) | | | 0.00 | (e) | |
Net asset value,
end of period | | $ | 13.46 | | | $ | 13.04 | | | $ | 12.92 | | | $ | 12.65 | | | $ | 13.06 | | | $ | 12.78 | | |
Total return(f) | | | 3.22 | %(g) | | | 3.07 | % | | | 3.89 | % | | | 0.31 | % | | | 3.17 | % | | | 0.87 | % | |
Net assets, end of
period (in 000s) | | $ | 90,056 | | | $ | 98,715 | | | $ | 163,349 | | | $ | 222,309 | | | $ | 340,353 | | | $ | 433,936 | | |
RATIOS TO AVERAGE
NET ASSETS: | |
Gross expenses(h) | | | 1.60 | %(i) | | | 1.66 | % | | | 1.94 | % | | | 1.91 | % | | | 1.87 | %(b) | | | 1.88 | % | |
Net expenses after
advisory fees
waived and
expenses
reimbursed(h)(j) | | | 1.54 | %(i) | | | 1.63 | % | | | 1.93 | % | | | 1.90 | % | | | 1.87 | %(b) | | | 1.88 | % | |
Net investment
income (loss) | | | (0.82 | %)(i) | | | (0.36 | %) | | | (0.20 | %)(c) | | | 0.41 | % | | | (1.00 | %)(b) | | | (0.51 | %) | |
Portfolio turnover
rate | | | 141 | %(g) | | | 273 | % | | | 419 | % | | | 362 | % | | | 363 | % | | | 321 | % | |
See Notes to Financial Statements.
www.arbitragefunds.com | 1-800-295-4485
68
(a) Per share amounts were calculated using average shares outstanding for the period.
(b) Includes a non-recurring refund by the custodian for overbilling of prior years' out-of-pocket fees. This amounted to less than $0.01 per share and is less than 0.005% of average net assets.
(c) The amount shown for a share outstanding throughout the period may not correlate with the Statement of Operations for the period due to timing of sales and redemptions of Fund shares in relation to income earned and/or fluctuating market value of the investments of the Fund.
(d) Includes estimated proceeds from the Fund's participation in a class action lawsuit. This represents a non-recurring gain in the amount of $0.01 per share.
(e) Amount rounds to less than $0.01 per share.
(f) Total return is a measure of the change in the value of an investment in the Fund over the periods covered, which assumes any dividends or capital gains distributions are reinvested in shares of the Fund. Returns shown do not reflect the deduction of taxes a shareholder would pay on Fund distributions or the redemption of Fund shares.
(g) Not annualized.
(h) Dividend expense totaled 0.00% (annualized), 0.15%, 0.46%, 0.42%, 0.36% and 0.34% of average net assets for the six months ended November 30, 2020, and the years ended May 31, 2020, 2019, 2018, 2017 and 2016, respectively. Interest rebate expense and line of credit interest expense totaled 0.07% (annualized), 0.01%, 0.00%, 0.01%, 0.03% and 0.07% of average net assets for the six months ended November 30, 2020, and the years ended May 31, 2020, 2019, 2018, 2017 and 2016, respectively.
(i) Annualized.
(j) Excluding dividend and interest expenses, the Fund's net expenses after advisory fees waived and expenses reimbursed would have been 1.47% (annualized), 1.47%, 1.47%, 1.47%, 1.48% and 1.47% of average net assets for the the six months ended November 30, 2020 and the years ended May 31, 2020, 2019, 2018, 2017 and 2016, respectively.
See Notes to Financial Statements.
Semi-Annual Report | November 30, 2020
69
Selected Per Share Data and Ratios for a Share Outstanding Throughout the Periods Presented:
| | | Six Months
Ended
November 30,
2020 | | Year Ended May 31, | |
| | | (Unaudited) | | 2020 | | 2019 | | 2018 | | 2017 | | 2016 | |
Net asset value,
beginning of
period | | $ | 13.47 | | | $ | 13.32 | | | $ | 13.03 | | | $ | 13.46 | | | $ | 13.13 | | | $ | 13.28 | | |
Income (loss)
from investment
operations | |
Net investment
income (loss)(a) | | | (0.04 | ) | | | (0.02 | ) | | | 0.01 | | | | 0.05 | | | | (0.10 | )(b) | | | (0.03 | ) | |
Net realized and
unrealized gains
on investments
and foreign
currencies | | | 0.49 | | | | 0.45 | | | | 0.54 | | | | 0.01 | | | | 0.55 | (c) | | | 0.18 | | |
Total from
investment
operations | | | 0.45 | | | | 0.43 | | | | 0.55 | | | | 0.06 | | | | 0.45 | | | | 0.15 | | |
Less distributions | |
From net
investment
income | | | — | | | | (0.01 | ) | | | (0.10 | ) | | | (0.13 | ) | | | — | | | | — | | |
From net
realized gains | | | — | | | | (0.27 | ) | | | (0.16 | ) | | | (0.36 | ) | | | (0.12 | ) | | | (0.30 | ) | |
Total distributions | | | — | | | | (0.28 | ) | | | (0.26 | ) | | | (0.49 | ) | | | (0.12 | ) | | | (0.30 | ) | |
Proceeds from
redemption fees
collected | | | — | | | | — | | | | — | | | | 0.00 | (d) | | | 0.00 | (d) | | | 0.00 | (d) | |
Net asset value,
end of period | | $ | 13.92 | | | $ | 13.47 | | | $ | 13.32 | | | $ | 13.03 | | | $ | 13.46 | | | $ | 13.13 | | |
Total return(e) | | | 3.34 | %(f) | | | 3.27 | % | | | 4.21 | % | | | 0.50 | % | | | 3.47 | % | | | 1.16 | % | |
Net assets, end of
period (in 000s) | | $ | 1,290,998 | | | $ | 1,243,838 | | | $ | 1,546,542 | | | $ | 1,510,598 | | | $ | 1,492,094 | | | $ | 1,395,178 | | |
RATIOS TO AVERAGE
NET ASSETS: | |
Gross expenses(g) | | | 1.35 | %(h) | | | 1.41 | % | | | 1.69 | % | | | 1.66 | % | | | 1.62 | %(b) | | | 1.63 | % | |
Net expenses after
advisory fees
waived and
expenses
reimbursed(g)(i) | | | 1.29 | %(h) | | | 1.38 | % | | | 1.68 | % | | | 1.65 | % | | | 1.62 | %(b) | | | 1.63 | % | |
Net investment
income (loss) | | | (0.58 | %)(h) | | | (0.13 | %) | | | 0.06 | % | | | 0.35 | % | | | (0.76 | %)(b) | | | (0.24 | %) | |
Portfolio turnover
rate | | | 141 | %(f) | | | 273 | % | | | 419 | % | | | 362 | % | | | 363 | % | | | 321 | % | |
See Notes to Financial Statements.
www.arbitragefunds.com | 1-800-295-4485
70
(a) Per share amounts were calculated using average shares outstanding for the period.
(b) Includes a non-recurring refund by the custodian for overbilling of prior years' out-of-pocket fees. This amounted to less than $0.01 per share and is less than 0.005% of average net assets.
(c) Includes estimated proceeds from the Fund's participation in a class action lawsuit. This represents a non-recurring gain in the amount of $0.01 per share.
(d) Amount rounds to less than $0.01 per share.
(e) Total return is a measure of the change in the value of an investment in the Fund over the periods covered, which assumes any dividends or capital gains distributions are reinvested in shares of the Fund. Returns shown do not reflect the deduction of taxes a shareholder would pay on Fund distributions or the redemption of Fund shares.
(f) Not annualized.
(g) Dividend expense totaled 0.00% (annualized), 0.15%, 0.46%, 0.42%, 0.36% and 0.34% of average net assets for the six months ended November 30, 2020, and the years ended May 31, 2020, 2019, 2018, 2017 and 2016, respectively. Interest rebate expense and line of credit interest expense totaled 0.07% (annualized), 0.01%, 0.00%, 0.01%, 0.03% and 0.07% of average net assets for the six months ended November 30, 2020, and the years ended May 31, 2020, 2019, 2018, 2017 and 2016, respectively.
(h) Annualized.
(i) Excluding dividend and interest expenses, the Fund's net expenses after advisory fees waived and expenses reimbursed would have been 1.22% (annualized), 1.22%, 1.22%, 1.22%, 1.23% and 1.22% of average net assets for the six months ended November 30, 2020 and the years ended May 31, 2020, 2019, 2018, 2017 and 2016, respectively.
See Notes to Financial Statements.
Semi-Annual Report | November 30, 2020
71
Selected Per Share Data and Ratios for a Share Outstanding Throughout the Periods Presented:
| | | Six Months
Ended
November 30,
2020 | | Year Ended May 31, | |
| | | (Unaudited) | | 2020 | | 2019 | | 2018 | | 2017 | | 2016 | |
Net asset value,
beginning of period | | $ | 12.34 | | | $ | 12.34 | | | $ | 12.12 | | | $ | 12.54 | | | $ | 12.37 | | | $ | 12.65 | | |
Income (loss) from
investment
operations | |
Net investment
loss(a) | | | (0.10 | ) | | | (0.14 | ) | | | (0.12 | )(b) | | | (0.07 | )(b) | | | (0.22 | )(c) | | | (0.16 | ) | |
Net realized and
unrealized gains
on investments
and foreign
currencies | | | 0.45 | | | | 0.41 | | | | 0.50 | | | | 0.01 | | | | 0.51 | (d) | | | 0.18 | | |
Total from investment
operations | | | 0.35 | | | | 0.27 | | | | 0.38 | | | | (0.06 | ) | | | 0.29 | | | | 0.02 | | |
Less distributions | |
From net
investment
income | | | — | | | | — | | | | — | | | | (0.00 | )(e) | | | — | | | | — | | |
From net
realized gains | | | — | | | | (0.27 | ) | | | (0.16 | ) | | | (0.36 | ) | | | (0.12 | ) | | | (0.30 | ) | |
Total distributions | | | — | | | | (0.27 | ) | | | (0.16 | ) | | | (0.36 | ) | | | (0.12 | ) | | | (0.30 | ) | |
Proceeds from
redemption fees
collected | | | — | | | | — | | | | — | | | | — | | | | — | | | | — | | |
Net asset value,
end of period | | $ | 12.69 | | | $ | 12.34 | | | $ | 12.34 | | | $ | 12.12 | | | $ | 12.54 | | | $ | 12.37 | | |
Total return(f)(g) | | | 2.84 | %(h) | | | 2.24 | % | | | 3.11 | % | | | (0.45 | )% | | | 2.38 | % | | | 0.18 | % | |
Net assets, end of
period (in 000s) | | $ | 16,566 | | | $ | 19,860 | | | $ | 19,050 | | | $ | 22,917 | | | $ | 26,900 | | | $ | 30,814 | | |
RATIOS TO AVERAGE
NET ASSETS: | |
Gross expenses(i) | | | 2.35 | %(j) | | | 2.41 | % | | | 2.69 | % | | | 2.66 | % | | | 2.62 | %(c) | | | 2.63 | % | |
Net expenses after
advisory fees
waived and
expenses
reimbursed(i)(k) | | | 2.29 | %(j) | | | 2.38 | % | | | 2.68 | % | | | 2.65 | % | | | 2.62 | %(c) | | | 2.63 | % | |
Net investment
loss | | | (1.59 | %)(j) | | | (1.16 | %) | | | (0.94 | %)(b) | | | (0.56 | %) | | | (1.76 | %)(c) | | | (1.28 | %) | |
Portfolio turnover
rate | | | 141 | %(h) | | | 273 | % | | | 419 | % | | | 362 | % | | | 363 | % | | | 321 | % | |
See Notes to Financial Statements.
www.arbitragefunds.com | 1-800-295-4485
72
(a) Per share amounts were calculated using average shares outstanding for the period.
(b) The amount shown for a share outstanding throughout the period may not correlate with the Statement of Operations for the period due to timing of sales and redemptions of Fund shares in relation to income earned and/or fluctuating market value of the investments of the Fund.
(c) Includes a non-recurring refund by the custodian for overbilling of prior years' out-of-pocket fees. This amounted to less than $0.01 per share and is less than 0.005% of average net assets.
(d) Includes estimated proceeds from the Fund's participation in a class action lawsuit. This represents a non-recurring gain in the amount of $0.01 per share.
(e) Amount rounds to less than $0.01 per share.
(f) Total return is a measure of the change in the value of an investment in the Fund over the periods covered, which assumes any dividends or capital gains distributions are reinvested in shares of the Fund. Returns shown do not reflect the deduction of taxes a shareholder would pay on Fund distributions or the redemption of Fund shares.
(g) Total return excludes sales charges, if any, and would be lower for the period presented if it reflected these charges.
(h) Not annualized.
(i) Dividend expense totaled 0.00% (annualized), 0.15%, 0.46%, 0.42%, 0.36% and 0.34% of average net assets for the six months ended November 30, 2020, and the years ended May 31, 2020, 2019, 2018, 2017 and 2016, respectively. Interest rebate expense and line of credit interest expense totaled 0.07% (annualized), 0.01%, 0.00%, 0.01%, 0.03% and 0.07% of average net assets for the six months ended November 30, 2020, and the years ended May 31, 2020, 2019, 2018, 2017 and 2016, respectively.
(j) Annualized.
(k) Excluding dividend and interest expenses, the Fund's net expenses after advisory fees waived and expenses reimbursed would have been 2.22% (annualized), 2.22%, 2.22%, 2.22%, 2.23% and 2.22% of average net assets for the six months ended November 30, 2020, and the years ended May 31, 2020, 2019, 2018, 2017 and 2016, respectively.
See Notes to Financial Statements.
Semi-Annual Report | November 30, 2020
73
Selected Per Share Data and Ratios for a Share Outstanding Throughout the Periods Presented:
| | | Six Months
Ended
November 30,
2020 | | Year Ended May 31, | |
| | | (Unaudited) | | 2020 | | 2019 | | 2018 | | 2017 | | 2016 | |
Net asset value,
beginning of period | | $ | 13.01 | | | $ | 12.90 | | | $ | 12.63 | | | $ | 13.07 | | | $ | 12.79 | | | $ | 12.97 | | |
Income (loss) from
investment
operations | |
Net investment
income (loss)(a) | | | (0.05 | ) | | | (0.05 | ) | | | (0.02 | )(d) | | | — | (b) | | | (0.13 | )(c) | | | (0.07 | ) | |
Net realized and
unrealized gains
on investments
and foreign
currencies | | | 0.47 | | | | 0.43 | | | | 0.52 | | | | 0.02 | | | | 0.53 | (e) | | | 0.19 | | |
Total from investment
operations | | | 0.42 | | | | 0.38 | | | | 0.50 | | | | 0.02 | | | | 0.40 | | | | 0.12 | | |
Less distributions | |
From net
investment
income | | | — | | | | — | | | | (0.07 | ) | | | (0.10 | ) | | | — | | | | — | | |
From net
realized gains | | | — | | | | (0.27 | ) | | | (0.16 | ) | | | (0.36 | ) | | | (0.12 | ) | | | (0.30 | ) | |
Total distributions | | | — | | | | (0.27 | ) | | | (0.23 | ) | | | (0.46 | ) | | | (0.12 | ) | | | (0.30 | ) | |
Proceeds from
redemption fees
collected | | | — | | | | — | | | | — | | | | — | | | | — | | | | — | | |
Net asset value,
end of period | | $ | 13.43 | | | $ | 13.01 | | | $ | 12.90 | | | $ | 12.63 | | | $ | 13.07 | | | $ | 12.79 | | |
Total return(f)(g) | | | 3.23 | %(h) | | | 3.00 | % | | | 3.94 | % | | | 0.21 | % | | | 3.17 | % | | | 0.95 | % | |
Net assets, end of
period (in 000s) | | $ | 26,414 | | | $ | 17,762 | | | $ | 18,341 | | | $ | 16,740 | | | $ | 10,012 | | | $ | 8,421 | | |
RATIOS TO AVERAGE
NET ASSETS: | |
Gross expenses(i) | | | 1.60 | %(j) | | | 1.66 | % | | | 1.94 | % | | | 1.91 | % | | | 1.87 | %(c) | | | 1.87 | % | |
Net expenses after
advisory fees
waived and
expenses
reimbursed(i)(k) | | | 1.54 | %(j) | | | 1.63 | % | | | 1.93 | % | | | 1.90 | % | | | 1.87 | %(c) | | | 1.87 | % | |
Net investment
loss | | | (0.82 | %)(j) | | | (0.40 | %) | | | (0.19 | %)(d) | | | (0.01 | %) | | | (1.02 | %)(c) | | | (0.56 | %) | |
Portfolio turnover
rate | | | 141 | %(h) | | | 273 | % | | | 419 | % | | | 362 | % | | | 363 | % | | | 321 | % | |
See Notes to Financial Statements.
www.arbitragefunds.com | 1-800-295-4485
74
(a) Per share amounts were calculated using average shares outstanding for the period.
(b) Amount rounds to less than $0.01 per share.
(c) Includes a non-recurring refund by the custodian for overbilling of prior years' out-of-pocket fees. This amounted to less than $0.01 per share and is less than 0.005% of average net assets.
(d) The amount shown for a share outstanding throughout the period may not correlate with the Statement of Operations for the period due to timing of sales and redemptions of Fund shares in relation to income earned and/or fluctuating market value of the investments of the Fund.
(e) Includes estimated proceeds from the Fund's participation in a class action lawsuit. This represents a non-recurring gain in the amount of $0.01 per share.
(f) Total return is a measure of the change in the value of an investment in the Fund over the periods covered, which assumes any dividends or capital gains distributions are reinvested in shares of the Fund. Returns shown do not reflect the deduction of taxes a shareholder would pay on Fund distributions or the redemption of Fund shares.
(g) Total return excludes sales charges, if any, and would be lower for the period presented if it reflected these charges.
(h) Not annualized.
(i) Dividend expense totaled 0.00% (annualized), 0.15%, 0.46%, 0.42%, 0.36% and 0.33% of average net assets for the six months ended November 30, 2020, and the years ended May 31, 2020, 2019, 2018, 2017 and 2016, respectively. Interest rebate expense and line of credit interest expense totaled 0.07% (annualized), 0.01%, 0.00%, 0.01%, 0.03% and 0.07% of average net assets for the six months ended November 30, 2020 and the years ended May 31, 2020, 2019, 2018, 2017 and 2016, respectively.
(j) Annualized.
(k) Excluding dividend and interest expenses, the Fund's net expenses after advisory fees waived and expenses reimbursed would have been 1.47% (annualized), 1.47%, 1.47%, 1.47%, 1.48% and 1.47% of average net assets for the six months ended November 30, 2020, and the years ended May 31, 2020, 2019, 2018, 2017 and 2016, respectively.
See Notes to Financial Statements.
Semi-Annual Report | November 30, 2020
75
Water Island Event-Driven Fund – Class R
Selected Per Share Data and Ratios for a Share Outstanding Throughout the Periods Presented:
| | | Six Months
Ended
November 30,
2020 | | Year Ended May 31, | |
| | | (Unaudited) | | 2020 | | 2019 | | 2018 | | 2017 | | 2016 | |
Net asset value,
beginning of period | | $ | 9.97 | | | $ | 9.47 | | | $ | 9.46 | | | $ | 9.34 | | | $ | 8.98 | | | $ | 9.73 | | |
Income (loss) from
investment operations | |
Net investment
income (loss)(a) | | | (0.04 | ) | | | 0.01 | | | | 0.07 | | | | 0.06 | | | | (0.04 | )(b) | | | (0.02 | ) | |
Net realized and
unrealized gains
(losses) on
investments and
foreign currencies | | | 0.67 | | | | 0.51 | | | | 0.08 | | | | 0.09 | | | | 0.40 | (c) | | | (0.53 | ) | |
Total from investment
operations | | | 0.63 | | | | 0.52 | | | | 0.15 | | | | 0.15 | | | | 0.36 | | | | (0.55 | ) | |
Less distributions | |
From net
investment
income | | | — | | | | (0.02 | ) | | | (0.14 | ) | | | (0.03 | ) | | | — | | | | (0.20 | ) | |
From net
realized gains | | | — | | | | — | | | | — | | | | — | | | | — | | | | (0.00 | )(d) | |
Total distributions | | | — | | | | (0.02 | ) | | | (0.14 | ) | | | (0.03 | ) | | | — | | | | (0.20 | ) | |
Proceeds from
redemption fees
collected | | | — | | | | — | | | | — | | | | 0.00 | (d) | | | 0.00 | (d) | | | 0.00 | (d) | |
Net asset value,
end of period | | $ | 10.60 | | | $ | 9.97 | | | $ | 9.47 | | | $ | 9.46 | | | $ | 9.34 | | | $ | 8.98 | | |
Total return(e) | | | 6.32 | %(f) | | | 5.49 | % | | | 1.60 | % | | | 1.56 | % | | | 4.01 | % | | | (5.55 | %) | |
Net assets, end of
period (in 000s) | | $ | 7,898 | | | $ | 7,694 | | | $ | 30,423 | | | $ | 45,383 | | | $ | 70,277 | | | $ | 80,114 | | |
RATIOS TO AVERAGE
NET ASSETS: | |
Gross expenses(g) | | | 1.95 | %(h) | | | 2.11 | % | | | 2.58 | % | | | 2.59 | % | | | 2.56 | %(b) | | | 2.62 | % | |
Net expenses after
advisory fees
waived and
expenses reimbursed(g)(i) | | | 1.83 | %(h) | | | 1.83 | % | | | 2.18 | % | | | 2.16 | % | | | 2.26 | % | | | 2.46 | % | |
Net investment
income (loss) | | | (0.84 | %)(h) | | | 0.09 | % | | | 0.70 | % | | | 0.58 | % | | | (0.45 | %)(b) | | | (0.27 | %) | |
Portfolio turnover
rate | | | 154 | %(f) | | | 397 | % | | | 504 | % | | | 421 | % | | | 409 | % | | | 350 | % | |
See Notes to Financial Statements.
www.arbitragefunds.com | 1-800-295-4485
76
(a) Per share amounts were calculated using average shares outstanding for the period.
(b) Includes a non-recurring refund by the custodian for overbilling of prior years' out-of-pocket fees. This amounted to less than $0.01 per share and 0.01% of average net assets.
(c) Includes estimated proceeds from the Fund's participation in a class action lawsuit. This represents a non-recurring gain in the amount of less than $0.005 per share.
(d) Amount rounds to less than $0.01 per share.
(e) Total return is a measure of the change in the value of an investment in the Fund over the periods covered, which assumes any dividends or capital gains distributions are reinvested in shares of the Fund. Returns shown do not reflect the deduction of taxes a shareholder would pay on Fund distributions or the redemption of Fund shares.
(f) Not annualized.
(g) Dividend expense totaled 0.02% (annualized), 0.13%, 0.46%, 0.44%, 0.53% and 0.58% of average net assets for the six months ended November 30, 2020, and the years ended May 31, 2020, 2019, 2018, 2017 and 2016, respectively. Interest rebate expense and line of credit interest expense totaled 0.12% (annualized), 0.01%, 0.03%, 0.03%, 0.04% and 0.19% of average net assets for the six months ended November 30, 2020, and the years ended May 31, 2020, 2019, 2018, 2017 and 2016, respectively.
(h) Annualized.
(i) Excluding dividend and interest expenses, the Fund's net expenses after advisory fees waived and expenses reimbursed would have been 1.69% (annualized), 1.69%, 1.69%, 1.69%, 1.69% and 1.69% of average net assets for the the six months ended November 30, 2020 and the years ended May 31, 2020, 2019, 2018, 2017 and 2016, respectively.
See Notes to Financial Statements.
Semi-Annual Report | November 30, 2020
77
Water Island Event-Driven Fund – Class I
Selected Per Share Data and Ratios for a Share Outstanding Throughout the Periods Presented:
| | | Six Months
Ended
November 30,
2020 | | Year Ended May 31, | |
| | | (Unaudited) | | 2020 | | 2019 | | 2018 | | 2017 | | 2016 | |
Net asset value,
beginning of period | | $ | 10.05 | | | $ | 9.54 | | | $ | 9.53 | | | $ | 9.43 | | | $ | 9.04 | | | $ | 9.81 | | |
Income (loss) from
investment
operations | |
Net investment
income (loss)(a) | | | (0.03 | ) | | | 0.02 | | | | 0.09 | | | | 0.04 | | | | (0.02 | )(b) | | | (0.02 | ) | |
Net realized and
unrealized gains
(losses) on
investments and
foreign currencies | | | 0.68 | | | | 0.53 | | | | 0.09 | | | | 0.12 | | | | 0.41 | (c) | | | (0.51 | ) | |
Total from investment
operations | | | 0.65 | | | | 0.55 | | | | 0.18 | | | | 0.16 | | | | 0.39 | | | | (0.53 | ) | |
Less distributions | |
From net
investment
income | | | — | | | | (0.04 | ) | | | (0.17 | ) | | | (0.06 | ) | | | — | | | | (0.24 | ) | |
From net
realized gains | | | — | | | | — | | | | — | | | | — | | | | — | | | | (0.00 | )(d) | |
Total distributions | | | — | | | | (0.04 | ) | | | (0.17 | ) | | | (0.06 | ) | | | — | | | | (0.24 | ) | |
Proceeds from
redemption fees
collected | | | — | | | | — | | | | — | | | | 0.00 | (d) | | | 0.00 | (d) | | | 0.00 | (d) | |
Net asset value,
end of period | | $ | 10.70 | | | $ | 10.05 | | | $ | 9.54 | | | $ | 9.53 | | | $ | 9.43 | | | $ | 9.04 | | |
Total return(e) | | | 6.47 | %(f) | | | 5.83 | % | | | 1.88 | % | | | 1.69 | % | | | 4.31 | % | | | (5.27 | %) | |
Net assets, end of
period (in 000s) | | $ | 102,065 | | | $ | 99,069 | | | $ | 92,710 | | | $ | 103,001 | | | $ | 68,272 | | | $ | 95,155 | | |
RATIOS TO AVERAGE
NET ASSETS: | |
Gross expenses(g) | | | 1.70 | %(h) | | | 1.86 | % | | | 2.33 | % | | | 2.34 | % | | | 2.31 | %(b) | | | 2.37 | % | |
Net expenses after
advisory fees
waived and
expenses
reimbursed(g)(i) | | | 1.58 | %(h) | | | 1.58 | % | | | 1.93 | % | | | 1.91 | % | | | 2.01 | % | | | 2.21 | % | |
Net investment
income (loss) | | | (0.59 | %)(h) | | | 0.20 | % | | | 0.92 | % | | | 0.46 | % | | | (0.22 | %)(b) | | | (0.26 | %) | |
Portfolio turnover
rate | | | 154 | %(f) | | | 397 | % | | | 504 | % | | | 421 | % | | | 409 | % | | | 350 | % | |
See Notes to Financial Statements.
www.arbitragefunds.com | 1-800-295-4485
78
(a) Per share amounts were calculated using average shares outstanding for the period.
(b) Includes a non-recurring refund by the custodian for overbilling of prior years' out-of-pocket fees. This amounted to less than $0.01 per share and 0.01% of average net assets.
(c) Includes estimated proceeds from the Fund's participation in a class action lawsuit. This represents a non-recurring gain in the amount of less than $0.005 per share.
(d) Amount rounds to less than $0.01 per share.
(e) Total return is a measure of the change in the value of an investment in the Fund over the periods covered, which assumes any dividends or capital gains distributions are reinvested in shares of the Fund. Returns shown do not reflect the deduction of taxes a shareholder would pay on Fund distributions or the redemption of Fund shares.
(f) Not annualized.
(g) Dividend expense totaled 0.02% (annualized), 0.13%, 0.46%, 0.44%, 0.53% and 0.58% of average net assets for the six months ended November 30, 2020, and the years ended May 31, 2020, 2019, 2018, 2017 and 2016, respectively. Interest rebate expense and line of credit interest expense totaled 0.12% (annualized), 0.01%, 0.03%, 0.03%, 0.04% and 0.19% of average net assets for the six months ended November 30, 2020, and the years ended May 31, 2020, 2019, 2018, 2017 and 2016, respectively.
(h) Annualized.
(i) Excluding dividend and interest expenses, the Fund's net expenses after advisory fees waived and expenses reimbursed would have been 1.44% (annualized), 1.44%, 1.44%, 1.44%, 1.44% and 1.44% of average net assets for the six months ended November 30, 2020 and the years ended May 31, 2020, 2019, 2018, 2017 and 2016, respectively.
See Notes to Financial Statements.
Semi-Annual Report | November 30, 2020
79
Water Island Event-Driven Fund – Class C
Selected Per Share Data and Ratios for a Share Outstanding Throughout the Periods Presented:
| | | Six Months
Ended
November 30,
2020 | | Year Ended May 31, | |
| | | (Unaudited) | | 2020 | | 2019 | | 2018 | | 2017 | | 2016 | |
Net asset value,
beginning of period | | $ | 9.73 | | | $ | 9.29 | | | $ | 9.26 | | | $ | 9.19 | | | $ | 8.91 | | | $ | 9.62 | | |
Income (loss) from
investment
operations | |
Net investment
loss(a) | | | (0.08 | ) | | | (0.08 | )(d) | | | (0.01 | ) | | | (0.03 | )(b) | | | (0.11 | )(c) | | | (0.09 | ) | |
Net realized and
unrealized gains
(losses) on
investments and
foreign currencies | | | 0.66 | | | | 0.52 | | | | 0.09 | | | | 0.10 | | | | 0.39 | (e) | | | (0.50 | ) | |
Total from investment
operations | | | 0.58 | | | | 0.44 | | | | 0.08 | | | | 0.07 | | | | 0.28 | | | | (0.59 | ) | |
Less distributions | |
From net
investment
income | | | — | | | | — | | | | (0.05 | ) | | | — | | | | — | | | | (0.12 | ) | |
From net
realized gains | | | — | | | | — | | | | — | | | | — | | | | — | | | | (0.00 | )(f) | |
Total distributions | | | — | | | | — | | | | (0.05 | ) | | | — | | | | — | | | | (0.12 | ) | |
Net asset value,
end of period | | $ | 10.31 | | | $ | 9.73 | | | $ | 9.29 | | | $ | 9.26 | | | $ | 9.19 | | | $ | 8.91 | | |
Total return(g)(h) | | | 5.96 | %(i) | | | 4.74 | % | | | 0.91 | % | | | 0.76 | % | | | 3.14 | % | | | (6.14 | %) | |
Net assets, end of
period (in 000s) | | $ | 361 | | | $ | 369 | | | $ | 794 | | | $ | 1,175 | | | $ | 1,567 | | | $ | 2,538 | | |
RATIOS TO AVERAGE
NET ASSETS: | |
Gross expenses(j) | | | 2.70 | %(k) | | | 2.86 | % | | | 3.33 | % | | | 3.34 | % | | | 3.31 | %(c) | | | 3.37 | % | |
Net expenses after
advisory fees
waived and
expenses
reimbursed(j)(l) | | | 2.58 | %(k) | | | 2.58 | % | | | 2.93 | % | | | 2.91 | % | | | 3.01 | % | | | 3.21 | % | |
Net investment
loss | | | (1.59 | %)(k) | | | (0.89 | )% | | | (0.06 | )% | | | (0.34 | )% | | | (1.26 | %)(c) | | | (0.95 | %) | |
Portfolio turnover
rate | | | 154 | %(i) | | | 397 | % | | | 504 | % | | | 421 | % | | | 409 | % | | | 350 | % | |
See Notes to Financial Statements.
www.arbitragefunds.com | 1-800-295-4485
80
(a) Per share amounts were calculated using average shares outstanding for the period.
(b) The amount shown for a share outstanding throughout the period may not correlate with the Statement of Operations for the period due to timing of sales and redemptions of Fund shares in relation to income earned and/or fluctuating market value of the investments of the Fund.
(c) Includes a non-recurring refund by the custodian for overbilling of prior years' out-of-pocket fees. This amounted to less than $0.01 per share and 0.01% of average net assets.
(d) The amount shown for a share outstanding throughout the period may not correlate with the Statement of Operations for the period due to class specific expenses.
(e) Includes estimated proceeds from the Fund's participation in a class action lawsuit. This represents a non-recurring gain in the amount of less than $0.005 per share.
(f) Amount rounds to less than $0.01 per share.
(g) Total return is a measure of the change in the value of an investment in the Fund over the periods covered, which assumes any dividends or capital gains distributions are reinvested in shares of the Fund. Returns shown do not reflect the deduction of taxes a shareholder would pay on Fund distributions or the redemption of Fund shares.
(h) Total return excludes sales charges, if any, and would be lower for the period presented if it reflected these charges.
(i) Not annualized.
(j) Dividend expense totaled 0.02% (annualized), 0.13%, 0.46%, 0.44%, 0.53% and 0.59% of average net assets for the six months ended November 30, 2020, and the years ended May 31, 2020, 2019, 2018, 2017 and 2016, respectively. Interest rebate expense and line of credit interest expense totaled 0.12% (annualized), 0.01%, 0.03%, 0.03%, 0.04% and 0.18% of average net assets for the six months ended November 30, 2020, and the years ended May 31, 2020, 2019, 2018, 2017 and 2016, respectively.
(k) Annualized.
(l) Excluding dividend and interest expenses, the Fund's net expenses after advisory fees waived and expenses reimbursed would have been 2.44% (annualized), 2.44%, 2.44%, 2.44%, 2.44% and 2.44% of average net assets for the six months ended November 30, 2020, and the years ended May 31, 2020, 2019, 2018, 2017 and 2016, respectively.
See Notes to Financial Statements.
Semi-Annual Report | November 30, 2020
81
Water Island Event-Driven Fund – Class A
Selected Per Share Data and Ratios for a Share Outstanding Throughout the Periods Presented:
| | | Six Months
Ended
November 30,
2020 | | Year Ended May 31, | |
| | | (Unaudited) | | 2020 | | 2019 | | 2018 | | 2017 | | 2016 | |
Net asset value,
beginning of period | | $ | 9.97 | | | $ | 9.46 | | | $ | 9.46 | | | $ | 9.35 | | | $ | 8.98 | | | $ | 9.73 | | |
Income (loss) from
investment
operations | |
Net investment
income (loss)(a) | | | (0.04 | ) | | | (0.00 | )(c) | | | 0.06 | | | | 0.04 | | | | (0.05 | )(b) | | | (0.03 | ) | |
Net realized and
unrealized gains
(losses) on
investments and
foreign currencies | | | 0.67 | | | | 0.53 | | | | 0.08 | | | | 0.10 | | | | 0.42 | (d) | | | (0.52 | ) | |
Total from investment
operations | | | 0.63 | | | | 0.53 | | | | 0.14 | | | | 0.14 | | | | 0.37 | | | | (0.55 | ) | |
Less distributions | |
From net
investment
income | | | — | | | | (0.02 | ) | | | (0.14 | ) | | | (0.03 | ) | | | — | | | | (0.20 | ) | |
From net
realized gains | | | — | | | | — | | | | — | | | | — | | | | — | | | | (0.00 | )(c) | |
Total distributions | | | — | | | | (0.02 | ) | | | (0.14 | ) | | | (0.03 | ) | | | — | | | | (0.20 | ) | |
Proceeds from
redemption fees
collected | | | — | | | | — | | | | — | | | | — | | | | — | | | | — | | |
Net asset value,
end of period | | $ | 10.60 | | | $ | 9.97 | | | $ | 9.46 | | | $ | 9.46 | | | $ | 9.35 | | | $ | 8.98 | | |
Total return(e)(f) | | | 6.32 | %(g) | | | 5.62 | % | | | 1.56 | % | | | 1.49 | % | | | 4.12 | % | | | (5.54 | %) | |
Net assets, end of
period (in 000s) | | $ | 324 | | | $ | 347 | | | $ | 799 | | | $ | 701 | | | $ | 810 | | | $ | 2,062 | | |
RATIOS TO AVERAGE
NET ASSETS: | |
Gross expenses(h) | | | 1.95 | %(i) | | | 2.11 | % | | | 2.58 | % | | | 2.59 | % | | | 2.56 | %(b) | | | 2.63 | % | |
Net expenses after
advisory fees
waived and
expenses
reimbursed(h)(j) | | | 1.83 | %(i) | | | 1.83 | % | | | 2.18 | % | | | 2.16 | % | | | 2.26 | % | | | 2.47 | % | |
Net investment
income (loss) | | | (0.84 | %)(i) | | | 0.02 | % | | | 0.65 | % | | | 0.41 | % | | | (0.53 | %)(b) | | | (0.28 | %) | |
Portfolio turnover
rate | | | 154 | %(g) | | | 397 | % | | | 504 | % | | | 421 | % | | | 409 | % | | | 350 | % | |
See Notes to Financial Statements.
www.arbitragefunds.com | 1-800-295-4485
82
(a) Per share amounts were calculated using average shares outstanding for the period.
(b) Includes a non-recurring refund by the custodian for overbilling of prior years' out-of-pocket fees. This amounted to less than $0.01 per share and 0.01% of average net assets.
(c) Amount rounds to less than $0.01 per share.
(d) Includes estimated proceeds from the Fund's participation in a class action lawsuit. This represents a non-recurring gain in the amount of less than $0.005 per share.
(e) Total return excludes sales charges, if any, and would be lower for the period presented if it reflected these charges.
(f) Total return is a measure of the change in the value of an investment in the Fund over the periods covered, which assumes any dividends or capital gains distributions are reinvested in shares of the Fund. Returns shown do not reflect the deduction of taxes a shareholder would pay on Fund distributions or the redemption of Fund shares or the imposition of any sales load.
(g) Not annualized.
(h) Dividend expense totaled 0.02% (annualized), 0.13%, 0.46%, 0.44%, 0.53% and 0.59% of average net assets for the six months ended November 30, 2020, and the years ended May 31, 2020, 2019, 2018, 2017 and 2016, respectively. Interest rebate expense and line of credit interest expense totaled 0.12% (annualized), 0.01%, 0.03%, 0.03%, 0.04% and 0.19% of average net assets for the six months ended November 30, 2020 and the years ended May 31, 2020, 2019, 2018, 2017 and 2016, respectively.
(i) Annualized.
(j) Excluding dividend and interest expenses, the Fund's net expenses after advisory fees waived and expenses reimbursed would have been 1.69% (annualized), 1.69%, 1.69%, 1.69%, 1.69% and 1.69% of average net assets for the six months ended November 30, 2020, and the years ended May 31, 2020, 2019, 2018, 2017 and 2016, respectively.
See Notes to Financial Statements.
Semi-Annual Report | November 30, 2020
83
Water Island Credit Opportunities Fund – Class R
Selected Per Share Data and Ratios for a Share Outstanding Throughout the Periods Presented:
| | | Six Months
Ended
November 30,
2020 | | Year Ended May 31, | |
| | | (Unaudited) | | 2020 | | 2019 | | 2018 | | 2017 | | 2016 | |
Net asset value,
beginning of period | | $ | 9.64 | | | $ | 9.70 | | | $ | 9.77 | | | $ | 9.67 | | | $ | 9.69 | | | $ | 9.95 | | |
Income (loss) from
investment
operations | |
Net investment
income(a) | | | 0.14 | | | | 0.24 | | | | 0.31 | | | | 0.20 | | | | 0.23 | (b) | | | 0.25 | | |
Net realized and
unrealized gains
(losses) on
investments and
foreign currencies | | | 0.41 | | | | (0.01 | ) | | | (0.07 | ) | | | 0.12 | | | | 0.01 | | | | (0.24 | ) | |
Total from investment
operations | | | 0.55 | | | | 0.23 | | | | 0.24 | | | | 0.32 | | | | 0.24 | | | | 0.01 | | |
Less distributions | |
From net
investment
income | | | (0.15 | ) | | | (0.29 | ) | | | (0.31 | ) | | | (0.22 | ) | | | (0.26 | ) | | | (0.27 | ) | |
Total distributions | | | (0.15 | ) | | | (0.29 | ) | | | (0.31 | ) | | | (0.22 | ) | | | (0.26 | ) | | | (0.27 | ) | |
Proceeds from
redemption
fees collected | | | – | | | | – | | | | – | | | | – | | | | 0.00 | (c) | | | – | | |
Net asset value,
end of period | | $ | 10.04 | | | $ | 9.64 | | | $ | 9.70 | | | $ | 9.77 | | | $ | 9.67 | | | $ | 9.69 | | |
Total return(d) | | | 5.69 | %(e) | | | 2.46 | % | | | 2.55 | % | | | 3.21 | % | | | 2.58 | % | | | 0.10 | % | |
Net assets, end of
period (in 000s) | | $ | 1,784 | | | $ | 3,673 | | | $ | 7,845 | | | $ | 9,533 | | | $ | 11,935 | | | $ | 12,426 | | |
RATIOS TO AVERAGE
NET ASSETS: | |
Gross expenses(f) | | | 1.79 | %(g) | | | 1.96 | % | | | 2.10 | %(h) | | | 2.27 | % | | | 1.96 | %(b) | | | 1.92 | % | |
Net expenses after
advisory fees
waived and
expenses
reimbursed(f)(i) | | | 1.31 | %(g) | | | 1.35 | % | | | 1.59 | %(h) | | | 1.95 | % | | | 1.66 | % | | | 1.67 | % | |
Net investment
income | | | 2.80 | %(g) | | | 2.48 | % | | | 3.18 | %(h) | | | 2.09 | % | | | 2.34 | %(b) | | | 2.62 | % | |
Portfolio turnover
rate | | | 58 | %(e) | | | 175 | % | | | 221 | % | | | 314 | % | | | 211 | % | | | 181 | % | |
See Notes to Financial Statements.
www.arbitragefunds.com | 1-800-295-4485
84
(a) Per share amounts were calculated using average shares outstanding for the period.
(b) Includes a non-recurring refund by the custodian for overbilling of prior years' out-of-pocket fees. This amounted to less than $0.01 per share and is less than 0.005% of average net assets.
(c) Amount rounds to less than $0.01 per share.
(d) Total return is a measure of the change in the value of an investment in the Fund over the periods covered, which assumes any dividends or capital gains distributions are reinvested in shares of the Fund. Returns shown do not reflect the deduction of taxes a shareholder would pay on Fund distributions or the redemption of Fund shares.
(e) Not annualized.
(f) Dividend expense totaled 0.01% (annualized), 0.07%, 0.29%, 0.42%, 0.16% and 0.03% of average net assets for the six months ended November 30, 2020, and the years ended May 31, 2020, 2019, 2018, 2017 and 2016, respectively. Interest rebate expense and line of credit interest expense totaled 0.07% (annualized), 0.05%, 0.01%, 0.03%, 0.00% and 0.14% of average net assets for the six months ended November 30, 2020, and the years ended May 31, 2020, 2019, 2018, 2017 and 2016, respectively.
(g) Annualized.
(h) Effective August 6, 2018, the investment adviser reduced the advisory fee paid by the Fund and agreed to increase the expense reimbursements it provides to the Fund by contractually limiting the Fund's total expenses (other than certain expenses noted in the Notes to Financial Statements) to 1.23% for Class R shares. Prior to August 6, 2018, the expense limitation had been 1.50%
(i) Excluding dividend and interest expenses, the Fund's net expenses after advisory fees waived and expenses reimbursed would have been 1.23% (annualized), 1.23%, 1.29%, 1.50%, 1.50% and 1.50% of average net assets for the six months ended November 30, 2020 and the years ended May 31, 2020, 2019, 2018, 2017 and 2016, respectively.
See Notes to Financial Statements.
Semi-Annual Report | November 30, 2020
85
Water Island Credit Opportunities Fund – Class I
Selected Per Share Data and Ratios for a Share Outstanding Throughout the Periods Presented:
| | | Six Months
Ended
November 30,
2020 | | Year Ended May 31, | |
| | | (Unaudited) | | 2020 | | 2019 | | 2018 | | 2017 | | 2016 | |
Net asset value,
beginning of period | | $ | 9.60 | | | $ | 9.65 | | | $ | 9.73 | | | $ | 9.65 | | | $ | 9.67 | | | $ | 9.93 | | |
Income (loss) from
investment
operations | |
Net investment
income(a) | | | 0.15 | | | | 0.26 | | | | 0.34 | | | | 0.23 | | | | 0.25 | (b) | | | 0.27 | | |
Net realized and
unrealized gains
(losses) on
investments and
foreign currencies | | | 0.40 | | | | 0.01 | (c) | | | (0.08 | ) | | | 0.11 | | | | 0.02 | | | | (0.24 | ) | |
Total from investment
operations | | | 0.55 | | | | 0.27 | | | | 0.26 | | | | 0.34 | | | | 0.27 | | | | 0.03 | | |
Less distributions | |
From net
investment
income | | | (0.16 | ) | | | (0.32 | ) | | | (0.34 | ) | | | (0.26 | ) | | | (0.29 | ) | | | (0.29 | ) | |
Total distributions | | | (0.16 | ) | | | (0.32 | ) | | | (0.34 | ) | | | (0.26 | ) | | | (0.29 | ) | | | (0.29 | ) | |
Proceeds from
redemption
fees collected | | | – | | | | – | | | | – | | | | – | | | | – | | | | – | | |
Net asset value,
end of period | | $ | 9.99 | | | $ | 9.60 | | | $ | 9.65 | | | $ | 9.73 | | | $ | 9.65 | | | $ | 9.67 | | |
Total return(d) | | | 5.73 | %(e) | | | 2.82 | % | | | 2.70 | % | | | 3.61 | % | | | 2.78 | % | | | 0.30 | % | |
Net assets, end of
period (in 000s) | | $ | 65,368 | | | $ | 56,869 | | | $ | 49,795 | | | $ | 36,207 | | | $ | 44,159 | | | $ | 41,992 | | |
RATIOS TO AVERAGE
NET ASSETS: | |
Gross expenses(f) | | | 1.54 | %(g) | | | 1.71 | % | | | 1.85 | %(h) | | | 2.02 | % | | | 1.71 | %(b) | | | 1.68 | % | |
Net expenses after
advisory fees
waived and
expenses
reimbursed(f)(i) | | | 1.06 | %(g) | | | 1.10 | % | | | 1.32 | %(h) | | | 1.70 | % | | | 1.41 | % | | | 1.43 | % | |
Net investment
income | | | 2.96 | %(g) | | | 2.73 | % | | | 3.51 | %(h) | | | 2.34 | % | | | 2.62 | %(b) | | | 2.84 | % | |
Portfolio turnover
rate | | | 58 | %(e) | | | 175 | % | | | 221 | % | | | 314 | % | | | 211 | % | | | 181 | % | |
See Notes to Financial Statements.
www.arbitragefunds.com | 1-800-295-4485
86
(a) Per share amounts were calculated using average shares outstanding for the period.
(b) Includes a non-recurring refund by the custodian for overbilling of prior years' out-of-pocket fees. This amounted to less than $0.01 per share and is less than 0.005% of average net assets.
(c) The amount shown for a share outstanding throughout the period may not correlate with the Statement of Operations for the period due to timing of sales and redemptions of Fund shares in relation to income earned and/or fluctuating market value of the investments of the Fund.
(d) Total return is a measure of the change in the value of an investment in the Fund over the periods covered, which assumes any dividends or capital gains distributions are reinvested in shares of the Fund. Returns shown do not reflect the deduction of taxes a shareholder would pay on Fund distributions or the redemption of Fund shares.
(e) Not annualized.
(f) Dividend expense totaled 0.01% (annualized), 0.07%, 0.29%, 0.42% 0.16% and 0.04% of average net assets for the six months ended November 30, 2020, and the years ended May 31, 2020, 2019, 2018, 2017 and 2016, respectively. Interest rebate expense and line of credit interest expense totaled 0.07% (annualized), 0.05%, 0.01%, 0.03%, 0.00% and 0.14% of average net assets for the six months ended November 30, 2020, and the years ended May 31, 2020, 2019, 2018, 2017 and 2016, respectively.
(g) Annualized.
(h) Effective August 6, 2018, the investment adviser reduced the advisory fee paid by the Fund and agreed to increase the expense reimbursements it provides to the Fund by contractually limiting the Fund's total expenses (other than certain expenses noted in the Notes to Financial Statements) to 0.98% for Class I shares. Prior to August 6, 2018, the expense limitation had been 1.25%
(i) Excluding dividend and interest expenses, the Fund's net expenses after advisory fees waived and expenses reimbursed would have been 0.98% (annualized), 0.98%, 1.02%, 1.25%, 1.25% and 1.25% of average net assets for the six months ended November 30, 2020 and the years ended May 31, 2020, 2019, 2018, 2017 and 2016, respectively.
See Notes to Financial Statements.
Semi-Annual Report | November 30, 2020
87
Water Island Credit Opportunities Fund – Class C
Selected Per Share Data and Ratios for a Share Outstanding Throughout the Periods Presented:
| | | Six Months
Ended
November 30,
2020 | | Year Ended May 31, | |
| | | (Unaudited) | | 2020 | | 2019 | | 2018 | | 2017 | | 2016 | |
Net asset value,
beginning of period | | $ | 9.61 | | | $ | 9.67 | | | $ | 9.74 | | | $ | 9.62 | | | $ | 9.61 | | | $ | 9.89 | | |
Income (loss) from
investment
operations | |
Net investment
income(a) | | | 0.10 | | | | 0.16 | | | | 0.24 | | | | 0.13 | | | | 0.16 | (b) | | | 0.18 | | |
Net realized and
unrealized gains
(losses) on
investments and
foreign currencies | | | 0.40 | | | | 0.00 | (c) | | | (0.07 | ) | | | 0.11 | | | | 0.02 | | | | (0.25 | ) | |
Total from investment
operations | | | 0.50 | | | | 0.16 | | | | 0.17 | | | | 0.24 | | | | 0.18 | | | | (0.07 | ) | |
Less distributions | |
From net
investment
income | | | (0.11 | ) | | | (0.22 | ) | | | (0.24 | ) | | | (0.12 | ) | | | (0.17 | ) | | | (0.21 | ) | |
Total distributions | | | (0.11 | ) | | | (0.22 | ) | | | (0.24 | ) | | | (0.12 | ) | | | (0.17 | ) | | | (0.21 | ) | |
Net asset value,
end of period | | $ | 10.00 | | | $ | 9.61 | | | $ | 9.67 | | | $ | 9.74 | | | $ | 9.62 | | | $ | 9.61 | | |
Total return(d)(e) | | | 5.20 | %(f) | | | 1.70 | % | | | 1.79 | % | | | 2.53 | % | | | 1.83 | % | | | (0.72 | %) | |
Net assets, end of
period (in 000s) | | $ | 691 | | | $ | 659 | | | $ | 468 | | | $ | 640 | | | $ | 1,053 | | | $ | 1,220 | | |
RATIOS TO AVERAGE
NET ASSETS: | |
Gross expenses(g) | | | 2.54 | %(h) | | | 2.71 | % | | | 2.86 | %(i) | | | 3.02 | % | | | 2.71 | %(b) | | | 2.68 | % | |
Net expenses after
advisory fees
waived and
expenses
reimbursed(g)(j) | | | 2.06 | %(h) | | | 2.10 | % | | | 2.34 | %(i) | | | 2.70 | % | | | 2.41 | % | | | 2.43 | % | |
Net investment
income | | | 1.98 | %(h) | | | 1.65 | % | | | 2.46 | %(i) | | | 1.38 | % | | | 1.69 | %(b) | | | 1.92 | % | |
Portfolio turnover
rate | | | 58 | %(f) | | | 175 | % | | | 221 | % | | | 314 | % | | | 211 | % | | | 181 | % | |
See Notes to Financial Statements.
www.arbitragefunds.com | 1-800-295-4485
88
(a) Per share amounts were calculated using average shares outstanding for the period.
(b) Includes a non-recurring refund by the custodian for overbilling of prior years' out-of-pocket fees. This amounted to less than $0.01 per share and is less than 0.005% of average net assets.
(c) Amount rounds to less than $0.01 per share.
(d) Total return is a measure of the change in the value of an investment in the Fund over the periods covered, which assumes any dividends or capital gains distributions are reinvested in shares of the Fund. Returns shown do not reflect the deduction of taxes a shareholder would pay on Fund distributions or the redemption of Fund shares.
(e) Total return excludes sales charges, if any, and would be lower for the period presented if it reflected these charges.
(f) Not annualized.
(g) Dividend expense totaled 0.01% (annualized), 0.07%, 0.29%, 0.42%, 0.16% and 0.04% of average net assets for the six months ended November 30, 2020, and the years ended May 31, 2020, 2019, 2018, 2017 and 2016, respectively. Interest rebate expense and line of credit interest expense totaled 0.07% (annualized), 0.05%, 0.01%, 0.03%, 0.00% and 0.14% of average net assets for the six months ended November 30, 2020, and the years ended May 31, 2020, 2019, 2018, 2017 and 2016, respectively.
(h) Annualized.
(i) Effective August 6, 2018, the investment adviser reduced the advisory fee paid by the Fund and agreed to increase the expense reimbursements it provides to the Fund by contractually limiting the Fund's total expenses (other than certain expenses noted in the Notes to Financial Statements) to 1.98% for Class C shares. Prior to August 6, 2018, the expense limitation had been 2.25%.
(j) Excluding dividend and interest expenses, the Fund's net expenses after advisory fees waived and expenses reimbursed would have been 1.98% (annualized), 1.98%, 2.04%, 2.25%, 2.25% and 2.25% of average net assets for the six months ended November 30, 2020, and years ended May 31, 2020, 2019, 2018, 2017 and 2016, respectively.
See Notes to Financial Statements.
Semi-Annual Report | November 30, 2020
89
Water Island Credit Opportunities Fund – Class A
Selected Per Share Data and Ratios for a Share Outstanding Throughout the Periods Presented:
| | | Six Months
Ended
November 30,
2020 | | Year Ended May 31, | |
| | | (Unaudited) | | 2020 | | 2019 | | 2018 | | 2017 | | 2016 | |
Net asset value,
beginning of period | | $ | 9.60 | | | $ | 9.65 | | | $ | 9.73 | | | $ | 9.66 | | | $ | 9.67 | | | $ | 9.93 | | |
Income (loss) from
investment
operations | |
Net investment
income(a) | | | 0.13 | | | | 0.23 | | | | 0.31 | | | | 0.17 | | | | 0.23 | (b) | | | 0.25 | | |
Net realized and
unrealized gains
(losses) on
investments and
foreign currencies | | | 0.42 | | | | 0.01 | (c) | | | (0.08 | ) | | | 0.14 | | | | 0.02 | | | | (0.25 | ) | |
Total from investment
operations | | | 0.55 | | | | 0.24 | | | | 0.23 | | | | 0.31 | | | | 0.25 | | | | – | | |
Less distributions | |
From net
investment
income | | | (0.15 | ) | | | (0.29 | ) | | | (0.31 | ) | | | (0.24 | ) | | | (0.26 | ) | | | (0.26 | ) | |
Total distributions | | | (0.15 | ) | | | (0.29 | ) | | | (0.31 | ) | | | (0.24 | ) | | | (0.26 | ) | | | (0.26 | ) | |
Net asset value,
end of period | | $ | 10.00 | | | $ | 9.60 | | | $ | 9.65 | | | $ | 9.73 | | | $ | 9.66 | | | $ | 9.67 | | |
Total return(d)(e) | | | 5.71 | %(f) | | | 2.56 | % | | | 2.45 | % | | | 3.10 | % | | | 2.58 | % | | | 0.02 | % | |
Net assets, end of
period (in 000s) | | $ | 82 | | | $ | 88 | | | $ | 121 | | | $ | 153 | | | $ | 107 | | | $ | 104 | | |
RATIOS TO AVERAGE
NET ASSETS: | |
Gross expenses(g) | | | 1.79 | %(h) | | | 1.96 | % | | | 2.10 | %(i) | | | 2.27 | % | | | 1.96 | %(b) | | | 1.91 | % | |
Net expenses after
advisory fees
waived and
expenses
reimbursed(g)(j) | | | 1.31 | %(h) | | | 1.35 | % | | | 1.58 | %(i) | | | 1.95 | % | | | 1.66 | % | | | 1.66 | % | |
Net investment
income | | | 2.73 | %(h) | | | 2.37 | % | | | 3.24 | %(i) | | | 1.81 | % | | | 2.35 | %(b) | | | 2.62 | % | |
Portfolio turnover
rate | | | 58 | %(f) | | | 175 | % | | | 221 | % | | | 314 | % | | | 211 | % | | | 181 | % | |
See Notes to Financial Statements.
www.arbitragefunds.com | 1-800-295-4485
90
(a) Per share amounts were calculated using average shares outstanding for the period.
(b) Includes a non-recurring refund by the custodian for overbilling of prior years' out-of-pocket fees. This amounted to less than $0.01 per share and is less than 0.005% of average net assets.
(c) The amount shown for a share outstanding throughout the period may not correlate with the Statement of Operations for the period due to timing of sales and redemptions of Fund shares in relation to income earned and/or fluctuating market value of the investments of the Fund.
(d) Total return is a measure of the change in the value of an investment in the Fund over the periods covered, which assumes any dividends or capital gains distributions are reinvested in shares of the Fund. Returns shown do not reflect the deduction of taxes a shareholder would pay on Fund distributions or the redemption of Fund shares or the imposition of any sales load.
(e) Total return excludes sales charges, if any, and would be lower for the period presented if it reflected these charges.
(f) Not annualized.
(g) Dividend expense totaled 0.01% (annualized), 0.07%, 0.29%, 0.42%, 0.16% and 0.02% of average net assets for the six months ended November 30, 2020, and the years ended May 31, 2020, 2019, 2018, 2017 and 2016, respectively. Interest rebate expense and line of credit interest expense totaled 0.07% (annualized), 0.05%, 0.01%, 0.03%, 0.00% and 0.14% of average net assets for the six months ended November 30, 2020 and the years ended May 31, 2020, 2019, 2018, 2017 and 2016, respectively.
(h) Annualized.
(i) Effective August 6, 2018, the investment adviser reduced the advisory fee paid by the Fund and agreed to increase the expense reimbursements it provides to the Fund by contractually limiting the Fund's total expenses (other than certain expenses noted in the Notes to Financial Statements) to 1.23% for Class A shares. Prior to August 6, 2018, the expense limitation had been 1.50%
(j) Excluding dividend and interest expenses, the Fund's net expenses after advisory fees waived and expenses reimbursed would have been 1.23% (annualized), 1.23%, 1.28%, 1.50%, 1.50% and 1.50% of average net assets for the six months ended November 30, 2020, and the years ended May 31, 2020, 2019, 2018, 2017 and 2016, respectively.
See Notes to Financial Statements.
Semi-Annual Report | November 30, 2020
91
Water Island Long/Short Fund – Class R
Selected Per Share Data and Ratios for a Share Outstanding Throughout the Periods Presented:
| | | Six Months
Ended
November 30,
2020 | | Year Ended May 31, | |
| | | (Unaudited) | | 2020 | | 2019 | | 2018 | | 2017 | | 2016 | |
Net asset value,
beginning of period | | $ | 10.45 | | | $ | 9.88 | | | $ | 10.12 | | | $ | 9.99 | | | $ | 9.31 | | | $ | 10.12 | | |
Income (loss) from
investment
operations | |
Net investment
income (loss)(a) | | | (0.07 | ) | | | 0.28 | | | | (0.01 | )(c) | | | (0.05 | ) | | | (0.20 | )(b) | | | (0.03 | ) | |
Net realized and
unrealized gains
(losses) on
investments and
foreign currencies | | | 1.80 | | | | 0.46 | | | | (0.03 | ) | | | 0.18 | | | | 0.88 | | | | (0.69 | ) | |
Total from investment
operations | | | 1.73 | | | | 0.74 | | | | (0.04 | ) | | | 0.13 | | | | 0.68 | | | | (0.72 | ) | |
Less distributions | |
From net
investment
income | | | – | | | | (0.03 | ) | | | – | | | | – | | | | – | | | | – | | |
From net realized
gains | | | – | | | | (0.14 | ) | | | (0.20 | ) | | | – | | | | – | | | | (0.09 | ) | |
Total distributions | | | – | | | | (0.17 | ) | | | (0.20 | ) | | | – | | | | – | | | | (0.09 | ) | |
Net asset value,
end of period | | $ | 12.18 | | | $ | 10.45 | | | $ | 9.88 | | | $ | 10.12 | | | $ | 9.99 | | | $ | 9.31 | | |
Total return(d) | | | 16.65 | %(e) | | | 7.58 | % | | | (0.29 | %) | | | 1.30 | % | | | 7.30 | % | | | (7.12 | %) | |
Net assets, end of
period (in 000s) | | $ | 13 | | | $ | 11 | | | $ | 10 | | | $ | 10 | | | $ | 10 | | | $ | 9 | | |
RATIOS TO AVERAGE
NET ASSETS: | |
Gross expenses(f) | | | 8.25 | %(g) | | | 12.79 | % | | | 11.69 | % | | | 12.52 | % | | | 15.85 | %(b) | | | 20.24 | % | |
Net expenses after
advisory fees
waived and
expenses
reimbursed(f)(h) | | | 2.11 | %(g) | | | 1.92 | % | | | 2.43 | % | | | 2.35 | % | | | 2.66 | % | | | 2.62 | % | |
Net investment
income (loss) | | | (1.25 | %)(g) | | | 2.81 | % | | | (0.15 | %) | | | (0.47 | %) | | | (2.14 | %)(b) | | | (0.34 | %) | |
Portfolio turnover
rate | | | 125 | %(e) | | | 577 | % | | | 528 | % | | | 520 | % | | | 449 | % | | | 416 | % | |
See Notes to Financial Statements.
www.arbitragefunds.com | 1-800-295-4485
92
(a) Per share amounts were calculated using average shares outstanding for the period.
(b) Includes a non-recurring refund by the custodian for overbilling of prior years' out-of-pocket fees. This amounted to $0.01 per share and 0.08% of average net assets.
(c) The amount shown for a share outstanding throughout the period may not correlate with the Statement of Operations for the period due to timing of sales and redemptions of Fund shares in relation to income earned and/or fluctuating market value of the investments of the Fund.
(d) Total return is a measure of the change in the value of an investment in the Fund over the periods covered, which assumes any dividends or capital gains distributions are reinvested in shares of the Fund. Returns shown do not reflect the deduction of taxes a shareholder would pay on Fund distributions or the redemption of Fund shares.
(e) Not annualized.
(f) Dividend expense totaled 0.17% (annualized), 0.22%, 0.74%, 0.66%, 0.84% and 0.70% of average net assets for the six months ended November 30, 2020, and the years ended May 31, 2020, 2019, 2018, 2017 and 2016, respectively. Interest rebate expense and line of credit interest expense totaled 0.25% (annualized), 0.01%, 0.00%, 0.00%, 0.13% and 0.23% of average net assets for the six months ended November 30, 2020, and years ended May 31, 2020, 2019, 2018, 2017 and 2016, respectively.
(g) Annualized.
(h) Excluding dividend and interest expenses, the Fund's net expenses after advisory fees waived and expenses reimbursed would have been 1.69% (annualized), 1.69%, 1.69%, 1.69%, 1.69% and 1.69% of average net assets for the six months ended November 30, 2020 and the years ended May 31, 2020, 2019, 2018, 2017 and 2016, respectively.
See Notes to Financial Statements.
Semi-Annual Report | November 30, 2020
93
Water Island Long/Short Fund – Class I
Selected Per Share Data and Ratios for a Share Outstanding Throughout the Periods Presented:
| | | Six Months
Ended
November 30,
2020 | | Year Ended May 31, | |
| | | (Unaudited) | | 2020 | | 2019 | | 2018 | | 2017 | | 2016 | |
Net asset value,
beginning of period | | $ | 10.45 | | | $ | 9.88 | | | $ | 10.12 | | | $ | 9.99 | | | $ | 9.31 | | | $ | 10.12 | | |
Income (loss) from
investment
operations | |
Net investment
income (loss)(a) | | | (0.05 | ) | | | 0.30 | | | | 0.01 | | | | (0.02 | ) | | | (0.18 | )(b) | | | (0.04 | ) | |
Net realized and
unrealized gains
(losses) on
investments and
foreign currencies | | | 1.78 | | | | 0.47 | | | | (0.05 | ) | | | 0.15 | | | | 0.86 | | | | (0.68 | ) | |
Total from investment
operations | | | 1.73 | | | | 0.77 | | | | (0.04 | ) | | | 0.13 | | | | 0.68 | | | | (0.72 | ) | |
Less distributions | |
From net
investment
income | | | – | | | | (0.06 | ) | | | – | | | | – | | | | – | | | | – | | |
From net realized
gains | | | – | | | | (0.14 | ) | | | (0.20 | ) | | | – | | | | – | | | | (0.09 | ) | |
Total distributions | | | – | | | | (0.20 | ) | | | (0.20 | ) | | | – | | | | – | | | | (0.09 | ) | |
Net asset value,
end of period | | $ | 12.18 | | | $ | 10.45 | | | $ | 9.88 | | | $ | 10.12 | | | $ | 9.99 | | | $ | 9.31 | | |
Total return(c) | | | 16.65 | %(d) | | | 7.84 | % | | | (0.29 | %) | | | 1.30 | % | | | 7.30 | % | | | (7.12 | %) | |
Net assets, end of
period (in 000s) | | $ | 2,338 | | | $ | 1,909 | | | $ | 2,344 | | | $ | 2,177 | | | $ | 2,048 | | | $ | 1,302 | | |
RATIOS TO AVERAGE
NET ASSETS: | |
Gross expenses(e) | | | 7.99 | %(f) | | | 12.53 | % | | | 11.44 | % | | | 12.27 | % | | | 15.60 | %(b) | | | 20.02 | % | |
Net expenses after
advisory fees
waived and
expenses
reimbursed(e)(g) | | | 1.85 | %(f) | | | 1.66 | % | | | 2.18 | % | | | 2.10 | % | | | 2.41 | % | | | 2.40 | % | |
Net investment
income (loss) | | | (0.97 | %)(f) | | | 2.97 | % | | | 0.12 | % | | | (0.22 | %) | | | (1.88 | %)(b) | | | (0.47 | %) | |
Portfolio turnover
rate | | | 125 | %(d) | | | 577 | % | | | 528 | % | | | 520 | % | | | 449 | % | | | 416 | % | |
See Notes to Financial Statements.
www.arbitragefunds.com | 1-800-295-4485
94
(a) Per share amounts were calculated using average shares outstanding for the period.
(b) Includes a non-recurring refund by the custodian for overbilling of prior years' out-of-pocket fees. This amounted to $0.01 per share and 0.08% of average net assets.
(c) Total return is a measure of the change in the value of an investment in the Fund over the periods covered, which assumes any dividends or capital gains distributions are reinvested in shares of the Fund. Returns shown do not reflect the deduction of taxes a shareholder would pay on Fund distributions or the redemption of Fund shares.
(d) Not annualized.
(e) Dividend expense totaled 0.16% (annualized), 0.21%, 0.74%, 0.66%, 0.84% and 0.72% of average net assets for the six months ended November 30, 2020, and the years ended May 31, 2020, 2019, 2018, 2017 and 2016, respectively. Interest rebate expense and line of credit interest expense totaled 0.25% (annualized), 0.01%, 0.00%, 0.00%, 0.13% and 0.24% of average net assets for the six months ended November 30, 2020, and the years ended May 31, 2020, 2019, 2018, 2017 and 2016, respectively.
(f) Annualized.
(g) Excluding dividend and interest expenses, the Fund's net expenses after advisory fees waived and expenses reimbursed would have been 1.44% (annualized), 1.44%, 1.44%, 1.44%, 1.44% and 1.44% of average net assets for the six months ended November 30, 2020 and the years ended May 31, 2020, 2019, 2018, 2017 and 2016, respectively.
See Notes to Financial Statements.
Semi-Annual Report | November 30, 2020
95
The Arbitrage Funds Notes to Financial Statements
November 30, 2020 (Unaudited)
1. ORGANIZATION
The Arbitrage Funds (the "Trust") is a Delaware statutory trust, which was organized on December 22, 1999 and is registered under the Investment Company Act of 1940, as amended (the "1940 Act"), as an open-end management investment company issuing its shares in series. Each series represents a distinct portfolio with its own investment objective and policies. The four series presently authorized are the Arbitrage Fund (the "Arbitrage Fund"), the Water Island Event-Driven Fund (the "Event-Driven Fund"), the Water Island Credit Opportunities Fund (the "Credit Opportunities Fund") and the Water Island Long/Short Fund (the "Long/Short Fund"), each a "Fund" and collectively the "Funds". Prior to September 30, 2020, the Event-Driven Fund was named Water Island Diversified Event-Driven Fund. The Event-Driven Fund's portfolio manager, investment objective and investment strategies did not change. The Arbitrage Fund and the Credit Opportunities Fund are each a diversified series of the Trust. The Long/Short Fund and the Event-Driven Fund are each a non-diversified series of the Trust. The Funds' investments are managed by Water Island Capital, LLC (the "Adviser").
| | | Commencement of Operations | |
Fund | | Class R shares | | Class I shares | | Class C shares | | Class A shares | |
Arbitrage Fund | | September 18, 2000 | | October 17, 2003 | | June 1, 2012 | | June 1, 2013 | |
Event-Driven Fund | | October 1, 2010 | | October 1, 2010 | | June 1, 2012 | | June 1, 2013 | |
Credit Opportunities
Fund | | October 1, 2012 | | October 1, 2012 | | October 1, 2012 | | June 1, 2013 | |
Long/Short Fund | | January 2, 2015 | | January 2, 2015 | | N/A | | N/A | |
The investment objective of the Arbitrage Fund is to seek to achieve capital growth by engaging in merger arbitrage. The investment objective of the Event-Driven Fund is to seek to achieve capital growth by investing in companies that are impacted by corporate events such as mergers, acquisitions, asset sales, restructurings, recapitalizations, refinancings, reorganizations and other special situations. The investment objective of the Credit Opportunities Fund is to seek to provide current income and capital growth by investing in debt securities impacted by events such as reorganizations, restructurings, recapitalizations, debt maturities, refinancings, mergers, acquisitions, regulatory changes and other special situations. The investment objective of the Long/Short Fund is to seek to achieve capital appreciation over a full market cycle with lower volatility than the broad equity market.
The Arbitrage Fund, Event-Driven Fund and Credit Opportunities Fund's four classes of shares, Class R, Class I, Class C and Class A, and the Long/Short Fund's two classes of shares, Class R and Class I, represent interests in the same portfolio of investments and have the same rights, but differ primarily in the expenses to which they are subject and the investment eligibility requirements. Class R shares, Class C shares and Class A shares are subject to an annual distribution and servicing fee of up to 0.25%, 1.00% and 0.25%, respectively, of each Fund's average daily net assets attributable to Class R shares, Class C shares and Class A shares, respectively, whereas Class I shares are not subject to any distribution and servicing fees. Class C shares are also subject to a 1.00% contingent deferred sales charge on all purchases redeemed within 12 months of purchase. Class A shares of the Arbitrage Fund are sold subject to a maximum front-end sales load equal to 2.75% of the offering price and are also subject to a 1.00% contingent deferred sales load on purchases at or above $250,000, purchased without a front-end sales charge and redeemed within 18 months of purchase. Class A shares of the Event-Driven Fund and the Credit Opportunities Fund are sold subject to a maximum front-end sales load equal to 3.25% of the offering price and are also subject to a 1.00% contingent deferred sales load on purchases
www.arbitragefunds.com | 1-800-295-4485
96
The Arbitrage Funds Notes to Financial Statements (continued)
November 30, 2020 (Unaudited)
at or above $250,000 purchased without a front-end sales charge and redeemed within 18 months of purchase.
2. SIGNIFICANT ACCOUNTING POLICIES
The following is a summary of significant accounting policies followed by the Funds. These policies are in conformity with U.S. generally accepted accounting principles ("GAAP"). The Funds are considered investment companies for financial reporting purposes under GAAP and Accounting Standards Codification Topic 946 — Financial Services — Investment Companies.
In March 2020, the FASB issued ASU 2020-04, Reference Rate Reform, which provide optional expedients and exceptions for applying GAAP to contracts, hedging relationships, and other transactions which are affected by reference rate reform if certain criteria are met. Such provisions are elective and apply to all entities as of March 12, 2020 through December 31, 2022, subject to meeting certain criteria, that have transactions that reference LIBOR or another reference rate that are discontinued because of reference rate reform. ASU 2020-04 had no impact on the Funds during the current reporting period.
In October 2020, FASB issued Accounting Standards Update No. 2020-08 ("ASU 2020-08"), "Receivables — Nonrefundable Fees and Other Costs (Codification Improvements Subtopic 310-20), Premium Amortization on Purchased Callable Debt Securities". ASU 2020-08 is an update of ASU No. 2017-08, which amends the amortization period of certain purchased callable debt securities held at a premium. ASU 2020-08 updates the amortization period for callable debt securities to be amortized to the next call date. For purposes of this update, the next call date is the first date when a call option at a specified price becomes exercisable. Once that date has passed, the next call date is when the next call option at a specified price becomes exercisable, if applicable. The amendments are effective for fiscal years, and interim periods within those fiscal years, beginning after December 15, 2020. Management is currently evaluating the implication, if any, of the additional disclosure requirements and its impact on the Funds' financial statements.
Use of Estimates — The preparation of financial statements in conformity with GAAP requires management to make estimates and assumptions that affect the reported amounts of assets and liabilities at the date of the financial statements and the reported amounts of increases and decreases in net assets from operations during the reporting period. Actual results could differ from those estimates.
Valuation of Investments — The Funds' portfolio securities are valued as of the close of trading of the New York Stock Exchange ("NYSE") (normally 4:00 p.m., Eastern standard time). Common stocks, mutual funds and other securities, including open short positions that are traded on a securities exchange, are valued at the last quoted sales price at the close of regular trading on the day the valuation is made. Securities which are quoted by NASDAQ are valued at the NASDAQ Official Closing Price. Price information on listed stocks is taken from the exchange where the security is primarily traded. Redeemable securities issued by open-end investment companies are valued at the investment company's respective net asset value, with the exception of exchange-traded open-end investment companies, which are priced as common stocks. Market quotations of foreign securities from the principal markets in which they trade may not be reliable if events or circumstances that may affect the value of portfolio securities occur between the time of the market quotation and the close of trading on the NYSE. If a significant event that affects the valuation of a foreign security occurs between the close of a foreign security's primary exchange and the time the Funds calculate their net asset value ("NAV"), the Funds will fair value
Semi-Annual Report | November 30, 2020
97
The Arbitrage Funds Notes to Financial Statements (continued)
November 30, 2020 (Unaudited)
the foreign security to account for this discrepancy. Securities which are listed on an exchange but which are not traded on the valuation date will be valued at last bid if held long, and last ask if held short. Put and call options and securities traded in the over-the-counter market are valued at the mean of the most recent bid and ask prices. Foreign currency forward contracts are valued at the current day's interpolated foreign exchange rate, as calculated using the current day's spot rate, and the thirty, sixty, ninety and one-hundred eighty day forward rates provided by an independent source.
If available, debt securities are priced based upon an evaluated bid provided by independent, third-party pricing agents. The third-party pricing agents may also value debt securities at an evaluated bid price by employing methodologies that utilize actual market transactions, broker-supplied valuations, or other methodologies designed to identify the market value for such securities. Unlisted securities for which market quotations are readily available are valued at the latest quoted bid price. Single name swap agreements are valued based on the underlying terms of the agreement. Other swap agreements (such as baskets of securities) are valued daily based on the terms of the swap agreement as provided by an independent third party or the counterparty. If a third-party valuation is not available, these other swap agreements are valued based on the valuation provided by the counterparty.
Other assets and securities for which no quotations are readily available are valued at fair value using methods determined in good faith by the Pricing Committee, which is under the supervision of the Board of Trustees of the Trust. Some of the more common reasons that may necessitate that a security be valued at fair value include: the security's trading has been halted or suspended; the security has been delisted from a national exchange; the security's primary trading market is temporarily closed at a time when under normal conditions it would be open; the security has been acquired through completion of a merger/tender or the security's primary pricing source is not able or willing to provide a price. Such methods of fair valuation may include, but are not limited to: multiple of earnings, multiple of book value, discount from market of a similar freely traded security, purchase price of a security, subsequent private transactions in the security or related securities, or a combination of these and other factors. Foreign securities are translated from the local currency into U.S. dollars using currency exchange rates supplied by a quotation service.
Fair Value Measurements — In accordance with the authoritative guidance on fair value measurements under GAAP, the Funds disclose fair value of their investments in a hierarchy that prioritizes the inputs to valuation techniques used to measure the fair value. The objective of a fair value measurement is to determine the price that would be received to sell an asset or paid to transfer a liability in an orderly transaction between market participants at the measurement date (an exit price). Accordingly, the fair value hierarchy gives the highest priority to quoted prices (unadjusted) in active markets for identical assets or liabilities (Level 1) and the lowest priority to unobservable inputs (Level 3). The guidance establishes three levels of the fair value hierarchy as follows:
Level 1 — Unadjusted quoted prices in active markets for identical, unrestricted assets or liabilities that the Funds have the ability to access at the measurement date;
Level 2 — Observable inputs other than quoted prices included in Level 1 that are observable (either directly or indirectly) for substantially the full term of the asset or liability; and
Level 3 — Unobservable inputs for the asset or liability, to the extent relevant observable inputs are not available, representing each Fund's own assumption about the assumptions a market participant would use in valuing the asset or liability, and would be based on the best information available.
www.arbitragefunds.com | 1-800-295-4485
98
The Arbitrage Funds Notes to Financial Statements (continued)
November 30, 2020 (Unaudited)
Investments are classified within the level of the lowest significant input considered in determining fair value. Investments classified within Level 3, whose fair value measurement considers several inputs, may include Level 1 or Level 2 inputs as components of the overall fair value measurement. The inputs or methodology used for valuing securities are not necessarily an indication of the risk associated with investing in those securities.
For the six months ended November 30, 2020, there were no significant changes to the Funds' fair value methodologies. Transfers for Level 3 securities, if any, are shown as part of the leveling table in each Fund's Portfolio of Investments.
Unfunded Commitments — As of November 30, 2020, the Arbitrage Fund, Event-Driven Fund and Long/Short Fund had unfunded commitments of $8,081,100, $1,181,700 and $157,300, respectively, which consist of Private Investment in Public Entity (PIPE) agreements with sponsors of Special Purpose Acquisition Companies. The Funds expect to fulfill these unfunded commitments through the use of liquid investments.
Share Valuation and Redemption Fees — The net asset value per share of each class of shares of the Funds is calculated daily by dividing the total value of a Fund's assets attributable to that class, less liabilities attributable to that class, by the number of shares of that class outstanding. The offering price and redemption price per share of each class of each Fund is equal to the net asset value per share. The Trust does not impose a redemption fee on the sale of a Fund's shares.
Security Transactions — Security transactions are accounted for on trade date. Gains and losses on securities sold are determined on a specific identification basis.
Short Positions — The Funds may sell securities short for economic hedging purposes. Subsequent fluctuations in the market prices of securities sold short may require purchasing the securities at prices which may differ from the market value reflected on the Portfolio of Investments. The Funds are liable for any dividends and interest payable on securities while those securities are in a short position. As collateral for their short positions, the Funds are required under the 1940 Act to maintain assets consisting of cash, cash equivalents or liquid securities. The amount of the collateral is required to be adjusted daily to reflect changes in the value of the securities sold short. The Funds are charged an interest rebate expense by the prime broker on securities sold short. The interest rebate expense is charged for the duration of time that a security is sold short and is shown on the Statements of Operations.
Derivative Instruments and Hedging Activities — The following discloses the Funds' use of derivative instruments and hedging activities.
The Funds' investment objectives not only permit the Funds to purchase investment securities, but they also allow certain Funds to enter into various types of derivative contracts, including, but not limited to, swap contracts, forward foreign currency exchange contracts, and purchased and written option contracts. In doing so, the Funds will employ strategies in differing combinations to permit them to increase, decrease, or change the level or types of exposure to market factors. Central to those strategies are features inherent to derivatives that make them more attractive for this purpose than equity or debt securities: they require little or no initial cash investment; they can focus exposure on only certain selected risk factors; and they may not require the ultimate receipt or delivery of the underlying security (or securities) to satisfy the contract. This may allow the Funds to pursue their objectives more quickly and efficiently than if they were to make direct purchases or sales of securities capable of effecting a similar response to market factors. The Funds may, but are not required to, seek to reduce their currency risk by hedging part or all of their exposure to various foreign currencies.
Semi-Annual Report | November 30, 2020
99
The Arbitrage Funds Notes to Financial Statements (continued)
November 30, 2020 (Unaudited)
Market Risk Factors: In pursuit of their investment objectives, the Funds may seek to use derivatives to increase or decrease their exposure to the following market risk factors:
Equity Risk: Equity risk relates to the change in value of equity securities as they relate to increases or decreases in the general market. Investments in securities issued by small and medium capitalization companies tend to be less liquid and more volatile than stocks of companies with relatively large market capitalizations. To the extent a Fund invests in securities of small and medium capitalization companies, it may be more vulnerable to adverse business events than larger, more established companies.
Interest Rate Risk: Interest rate risk refers to the fluctuations in value of fixed-income securities resulting from the inverse relationship between price and yield. For example, an increase in general interest rates will tend to reduce the market value of fixed income investments, and a decline in general interest rates will tend to increase the value of such investments. In addition, debt securities with longer maturities, which tend to have higher yields, are subject to potentially greater fluctuations in value from changes in interest rates than obligations with shorter maturities.
Foreign Exchange Rate Risk: Foreign exchange rate risk relates to the change in the U.S. dollar value of a security held that is denominated in a foreign currency. The value of a foreign currency denominated security will decrease as the dollar appreciates against the currency, while the value of the foreign currency denominated security will increase as the dollar depreciates against the currency. Adverse changes in exchange rates may erode or reverse any gains produced by foreign currency denominated investments and may widen any losses.
Credit Risk: Credit risk relates to the ability of the issuer to meet interest and principal payments, or both, as they come due. In general, lower-grade, higher-yield bonds are subject to credit risk to a greater extent than lower-yield, higher-quality bonds.
The extent of the impact of the novel coronavirus ("COVID-19") outbreak on the financial performance of the Funds will depend on future developments, including duration and spread of the outbreak, related advisories and restrictions, and the impact of COVID-19 on the financial markets and the overall economy, all of which are highly uncertain and cannot be predicted. Adverse market conditions may be prolonged and may not have the same impact on all types of securities. These disruptions could prevent a Fund from executing advantageous investment decisions in a timely manner and could negatively impact the Fund's ability to achieve its investment objective. If the financial markets and/or the overall economy are impacted for an extended period of time, the Funds' results of operations may be materially adversely affected. During the six months ended November 30, 2020, there was no significant impact to the Funds.
Risk of Investing in Derivatives: The Funds' use of derivatives can result in losses due to unanticipated changes in the market risk factors and the overall market. In instances where the Funds are using derivatives to decrease or hedge exposures to market risk factors for securities held by the Funds, there are also risks that those derivatives may not perform as expected, resulting in losses for the combined or hedged positions.
Derivatives may have little or no initial cash investment relative to their market value exposure and therefore can produce significant gains or losses in excess of their cost. This use of embedded leverage allows the Funds to increase their market value exposure relative to their net assets and can substantially increase the volatility of the Funds' performance.
www.arbitragefunds.com | 1-800-295-4485
100
The Arbitrage Funds Notes to Financial Statements (continued)
November 30, 2020 (Unaudited)
Additional associated risks from investing in derivatives also exist and potentially could have significant effects on the valuation of the derivative instruments and the Funds. Typically, the associated risks are not the risks that the Funds are attempting to increase or decrease exposure to, per their investment objectives, but are the additional risks from investing in derivatives.
Examples of these associated risks are liquidity risk, which is the risk that the Funds will not be able to sell the derivative in the open market in a timely manner, and counterparty credit risk, which is the risk that the counterparty to a transaction will not fulfill its obligation to the Funds. Associated risks can be different for each type of derivative and are discussed by derivative type in the notes that follow.
Option Writing/Purchasing: Certain Funds may write or purchase option contracts to adjust risk and return of their overall investment positions. When a Fund writes or purchases an option, an amount equal to the premium received or paid by the Fund is recorded as a liability or an asset and is subsequently adjusted to the current market value of the option written or purchased. Premiums received or paid from writing or purchasing options that expire unexercised are treated by the Fund on the expiration date as realized gains or losses. The difference between the premium and the amount paid or received on effecting a closing purchase or sale transaction, including brokerage commissions, is also treated as a realized gain or loss. If an option is exercised, the premium paid or received is added to the cost of the purchase or proceeds from the sale in determining whether the Fund has realized a gain or loss on investment transactions. Risks from entering into option transactions arise from the potential inability of counterparties to meet the terms of the contracts, the potential inability to enter into closing transactions because of an illiquid secondary market and from unexpected movements in security values.
Options held by the Funds at November 30, 2020 are disclosed in the Portfolio of Investments.
During the period ended November 30, 2020, the Funds engaged in option writing/purchasing to limit volatility and correlation and to create income and optionality. The maximum potential amount of future payments (undiscounted) that a fund as a writer of put options could be required to make is equal to the notional amount multiplied by the exercise price as shown in the Schedule of Investments.
Foreign Currency Exchange Contracts: The Funds may enter into forward foreign currency exchange contracts as a way of managing foreign exchange rate risk. The Funds may enter into these contracts for the purchase or sale of a specific foreign currency at a fixed price on a future date as a hedge or cross-hedge against either specific transactions or portfolio positions. The objective of the Funds' foreign currency hedging transactions is to reduce risk that the U.S. dollar value of the Funds' securities denominated in foreign currency will decline in value due to changes in foreign currency exchange rates.
Foreign currency exchange contracts held by the Funds at November 30, 2020 are disclosed in the Portfolio of Investments.
During the period ended November 30, 2020, the Funds entered into foreign currency exchange contracts to hedge currency risk.
Warrants/Rights: Each Fund may purchase or otherwise receive warrants or rights. Warrants and rights generally give the holder the right to receive, upon exercise, a security of the issuer at a set price. The Funds typically use warrants and rights in a manner similar to their use of purchased options on securities, as described in the Options Writing/Purchasing section above. Risks associated with the use of warrants and rights are generally similar to risks associated with the
Semi-Annual Report | November 30, 2020
101
The Arbitrage Funds Notes to Financial Statements (continued)
November 30, 2020 (Unaudited)
use of purchased options. However, warrants and rights often do not have standardized terms, and may have longer maturities and may be less liquid than exchange-traded options. In addition, the terms of warrants or rights may limit each Fund's ability to exercise the warrants or rights at such times and in such quantities as each Fund would otherwise wish. Warrants and rights generally pay no dividends and confer no voting or other rights other than to purchase the underlying security.
Warrants/rights held by the Funds at November 30, 2020 are disclosed in the Portfolio of Investments.
During the period ended November 30, 2020, the Funds held warrants/rights as a result of receiving them from completed deals, and to participate in investment opportunities.
Swaps: Certain Funds may enter into interest rate, index, equity, total return and credit default swap agreements, for hedging and non-hedging purposes. These transactions would be entered into in an attempt to obtain a particular return when it is considered desirable to do so, possibly at a lower cost to a Fund than if the Fund had invested directly in the asset that yielded the desired return. Swap agreements may be executed in a multilateral or other trade facility program, such as a registered exchange ("centrally cleared swaps") or may be privately negotiated in the over-the-counter market. The duration of a swap agreement typically ranges from a few weeks to more than one year. In a standard swap transaction, two parties agree to exchange the returns (or differentials in rates of return) earned or realized on particular predetermined investments or instruments, which may be adjusted for an interest factor. The gross returns to be exchanged or "swapped" between the parties are generally calculated with respect to a "notional amount" (i.e., the return on or increase in value of a particular dollar amount invested at a particular interest rate, a particular security, in a particular foreign currency, or in a "basket" of securities representing a particular index). In a centrally cleared swap, immediately following execution of the swap agreement, the swap agreement is novated to a central counterparty (the "CCP") and the Fund's counterparty on the swap agreement becomes the CCP.
Total return swap agreements are contracts in which one party agrees to make periodic payments based on the change in market value of underlying assets, which may include a specified security, basket of securities, defined portfolios of bonds, loans and mortgages, or securities indexes during the specified period in return for periodic payments based on a fixed or variable interest rate or the total return from other underlying assets or indices. Total return swap agreements may be used to obtain exposure to a security or market index without owning or taking physical custody of such security or component securities of a market index. Total return swap agreements may effectively add leverage to a Fund's portfolio because, in addition to its total net assets, the Fund would be subject to investment exposure on the notional amount of the swap. Total return swaps are a mechanism for the user to accept the economic benefits of asset ownership without utilizing the balance sheet. The other leg of the swap, usually the London Interbank Offered Rate (LIBOR) or the Federal Funds Rate, is spread to reflect the non-balance sheet nature of the product. Total return swaps can be designed with any underlying asset agreed upon between two parties. Typically no notional amounts are exchanged with total return swaps. Total return swap agreements entail the risk that a party will default on its payment obligations to a Fund thereunder. Swap agreements also entail the risk that a Fund will not be able to meet its obligation to the counterparty. Generally, a Fund will enter into total return swaps on a net basis (i.e., the two payment streams are netted out with the Fund receiving or paying, as the case may be, only the net amount of the two payments). The Funds will typically enter into agreements based on either long or short exposure to underlying equities. To help mitigate against default risk by the
www.arbitragefunds.com | 1-800-295-4485
102
The Arbitrage Funds Notes to Financial Statements (continued)
November 30, 2020 (Unaudited)
counterparties these agreements are reset monthly, with cashflows exchanged based on the change in the value of the underlying equity from either the opening price or the last reset price, netted against the interest leg of the swap.
Most swap agreements entered into by a Fund calculate the obligations of the parties to the agreement on a "net basis." Consequently, a Fund's current obligations (or rights) under a swap agreement will generally be equal only to the net present value of amounts to be paid or received under the agreement based on the relative values of the positions held by each party to the agreement (the "net amount"). A Fund's current obligations under a swap agreement will be accrued daily (offset against amounts owed to the Fund), and any accrued but unpaid net amounts owed to a swap counterparty will be covered in accordance with applicable regulatory requirements to limit any potential leveraging of a Fund's portfolio. Any net amount accrued but not yet paid to a Fund by the counterparty under a swap agreement (i.e., the Fund's current rights under the swap agreement) is recorded as unrealized appreciation until the amount is paid to the Fund. The Fund's maximum risk of loss from counterparty credit risk is generally limited to the net payment to be received by the Fund and/or the termination value at the end of the contract. Obligations under swap agreements so covered will not be construed to be "senior securities" for purposes of the Funds' investment restriction concerning senior securities.
Whether a Fund's use of swap agreements will be successful in furthering its investment objective will depend on management's ability to correctly predict whether certain types of investments are likely to produce greater returns than other investments. Swap agreements that cannot be terminated or sold within seven days may be considered to be illiquid investments. Moreover, a Fund bears the risk of loss of the amount expected to be received under a swap agreement in the event of the default or bankruptcy of a swap agreement counterparty. Although centrally cleared swaps typically present less counterparty risk than non-centrally cleared swaps, a Fund that has entered into centrally cleared swaps is subject to the risk of the failure of the CCP. A Fund will enter into swap agreements only with counterparties that meet certain standards for creditworthiness (generally, such counterparties would have to be eligible counterparties under the terms of the Fund's repurchase agreement guidelines) or that are centrally cleared. Certain restrictions imposed on the Funds by the Internal Revenue Code of 1986, as amended (the "Code"), may limit a Fund's ability to use swap agreements. It is possible that developments in the swap market, including additional government regulation, could adversely affect a Fund's ability to terminate existing swap agreements or to realize amounts to be received under such agreements.
International Swaps and Derivatives Association, Inc. Master Agreements ("ISDA Master Agreements") govern over-the-counter financial derivative transactions entered into by a Fund and counterparty. The ISDA Master Agreements maintain provisions for general obligations, representations, agreements, collateral and events of default or termination. Events of termination include conditions that may entitle counterparties to elect to terminate early and cause settlement of all outstanding transactions under the applicable ISDA Master Agreement. Any election to terminate early could be material to the financial statements.
Swap agreements held by the Funds at November 30, 2020 are disclosed in the Portfolio of Investments.
During the period ended November 30, 2020, the Arbitrage Fund, Event-Driven Fund, Credit Opportunities Fund and Long/Short Fund entered into swap agreements to gain efficient exposure to underlying equities.
Semi-Annual Report | November 30, 2020
103
The Arbitrage Funds Notes to Financial Statements (continued)
November 30, 2020 (Unaudited)
Fair Value of Derivative Instruments — Fair values of derivatives presented in the financial statements are not netted with the fair value of other derivatives or with any collateral amounts posted by the Funds or any counterparty on the Statement of Assets and Liabilities. The fair value of derivative instruments for the Funds as of the six months ended November 30, 2020, was as follows:
Derivatives Not
Accounted For As
Hedging Instruments | | Asset
Derivatives
Statement of
Assets and
Liabilities
Location | | Fair Value | | Liability
Derivatives
Statement of
Assets and
Liabilities
Location | | Fair Value | |
Arbitrage Fund | |
Forward Foreign
Currency Exchange
Contracts
| | Unrealized
appreciation on
forward foreign
currency
exchange
contracts | | $ | 1,359,096 | | | Unrealized
depreciation on
forward foreign
currency
exchange
contracts | | $ | 2,494,530 | | |
Equity Contracts
(purchased
option contracts)
| | Investments:
at fair value of
unaffiliated
investments | | | 771,152 | | | | | | — | | |
| | | | | $ | 2,130,248 | | | | | $ | 2,494,530 | | |
Derivatives Not
Accounted For As
Hedging Instruments | | Asset
Derivatives
Statement of
Assets and
Liabilities
Location | | Fair Value | | Liability
Derivatives
Statement of
Assets and
Liabilities
Location | | Fair Value | |
Event-Driven Fund | |
Forward Foreign
Currency Exchange
Contracts
| | Unrealized
appreciation on
forward foreign
currency exchange
contracts | | $ | 115,145 | | | Unrealized
depreciation on
forward foreign
currency exchange
contracts | | $ | 206,372 | | |
Equity Contracts
(purchased
option contracts)
| | Investments:
at fair value of
unaffiliated
investments | | | 71,769 | | | | | | — | | |
| | | $ | 186,914 | | | | | $ | 206,372 | | |
www.arbitragefunds.com | 1-800-295-4485
104
The Arbitrage Funds Notes to Financial Statements (continued)
November 30, 2020 (Unaudited)
Derivatives Not
Accounted For As
Hedging Instruments | | Asset
Derivatives
Statement of
Assets and
Liabilities
Location | | Fair Value | | Liability
Derivatives
Statement of
Assets and
Liabilities
Location | | Fair Value | |
Credit Opportunities Fund | |
Forward Foreign
Currency Exchange
Contracts
| | Unrealized
appreciation on
forward foreign
currency exchange
contracts | | $ | 5,197 | | | Unrealized
depreciation on
forward foreign
currency exchange
contracts | | $ | 5,435 | | |
Equity Contracts
(purchased
option contracts)
| | Investments:
at fair value of
unaffiliated
investments | | | 327,150 | | | | | | — | | |
Equity Contracts
(written option
contracts) | | | | | — | | | Written options,
at value | | | 6,115 | | |
| | | $ | 332,347 | | | | | $ | 11,550 | | |
Derivatives Not
Accounted For As
Hedging Instruments | | Asset
Derivatives
Statement of
Assets and
Liabilities
Location | | Fair Value | | Liability
Derivatives
Statement of
Assets and
Liabilities
Location | | Fair Value | |
Long/Short Fund | |
Forward Foreign
Currency Exchange
Contracts
| | Unrealized
appreciation on
forward foreign
currency exchange
contracts | | $ | 528 | | | Unrealized
depreciation on
forward foreign
currency exchange
contracts | | $ | 1,252 | | |
Equity Contracts
(purchased
option contracts)
| | Investments:
at fair value of
unaffiliated
investments | | | 1,548 | | | | | | — | | |
Equity Contracts
(written option
contracts) | | | | | — | | | Written options,
at value | | | 493 | | |
| | | | | $ | 2,076 | | | | | $ | 1,745 | | |
Semi-Annual Report | November 30, 2020
105
The Arbitrage Funds Notes to Financial Statements (continued)
November 30, 2020 (Unaudited)
The effect of derivative instruments on the Funds' Statement of Operations for the six months ended November 30, 2020, was as follows:
Derivatives Not
Accounted For As
Hedging Instruments | | Location Of Gains/(Loss) On
Derivatives Recognized In Income | | Realized
Gain/(Loss)
On Derivatives
Recognized In
Income | | Change in
Unrealized
Gain/(Loss)
On Derivatives
Recognized In
Income | |
Arbitrage Fund | |
Forward Foreign
Currency Exchange
Contracts
| | Net realized gains (losses) from:
Forward currency contracts / Net
change in unrealized appreciation
(depreciation) on: Forward currency
contracts | | $ | (1,708,660 | ) | | $ | (4,021,113 | ) | |
Swap Contracts
| | Net realized gains (losses) from: Swap
contracts / Net change in
unrealized appreciation
(depreciation) on: Swap contracts | | | (16,129,509 | ) | | | — | | |
Equity Contracts
(purchased option
contracts)
| | Net realized gains (losses) from:
Purchased option contracts / Net
change in unrealized appreciation
(depreciation) on: Purchased option
contracts | | | 3,310,364 | | | | (349,834 | ) | |
| | | | | $ | (14,527,805 | ) | | $ | (4,370,947 | ) | |
Derivatives Not
Accounted For As
Hedging Instruments | | Location Of Gains/(Loss) On
Derivatives Recognized In Income | | Realized
Gain/(Loss)
On Derivatives
Recognized In
Income | | Change in
Unrealized
Gain/(Loss)
On Derivatives
Recognized In
Income | |
Event-Driven Fund | |
Forward Foreign
Currency Exchange
Contracts
| | Net realized gains (losses) from:
Forward currency contracts / Net
change in unrealized appreciation
(depreciation) on: Forward currency
contracts | | $ | (84,842 | ) | | $ | (232,773 | ) | |
Swap Contracts
| | Net realized gains (losses) from: Swap
contracts / Net change in
unrealized appreciation
(depreciation) on: Swap contracts | | | (427,043 | ) | | | — | | |
Equity Contracts
(purchased option
contracts)
| | Net realized gains (losses) from:
Purchased option contracts / Net
change in unrealized appreciation
(depreciation) on: Purchased option
contracts | | | 249,565 | | | | (70,378 | ) | |
| | | | | $ | (262,320 | ) | | $ | (303,151 | ) | |
www.arbitragefunds.com | 1-800-295-4485
106
The Arbitrage Funds Notes to Financial Statements (continued)
November 30, 2020 (Unaudited)
Derivatives Not
Accounted For As
Hedging Instruments | | Location Of Gains/(Loss) On
Derivatives Recognized In Income | | Realized
Gain/(Loss)
On Derivatives
Recognized In
Income | | Change in
Unrealized
Gain/(Loss)
On Derivatives
Recognized In
Income | |
Credit Opportunities Fund | |
Forward Foreign
Currency Exchange
Contracts
| | Net realized gains (losses) from:
Forward currency contracts / Net
change in unrealized appreciation
(depreciation) on: Forward currency
contracts | | $ | (32,685 | ) | | $ | (238 | ) | |
Swap Contracts
| | Net realized gains (losses) from: Swap
contracts / Net change in
unrealized appreciation
(depreciation) on: Swap contracts | | | (67,522 | ) | | | — | | |
Equity Contracts
(purchased option
contracts)
| | Net realized gains (losses) from:
Purchased option contracts / Net
change in unrealized appreciation
(depreciation) on: Purchased option
contracts | | | 56,951 | | | | (191,377 | ) | |
Equity Contracts
(written option
contracts)
| | Net realized gains (losses) from:
Written option contracts / Net
change in unrealized appreciation
(depreciation) on: Written option
contracts | | | 84,001 | | | | 9,479 | | |
| | | | | $ | 40,745 | | | $ | (182,136 | ) | |
Semi-Annual Report | November 30, 2020
107
The Arbitrage Funds Notes to Financial Statements (continued)
November 30, 2020 (Unaudited)
Derivatives Not
Accounted For As
Hedging Instruments | | Location Of Gains/(Loss) On
Derivatives Recognized In Income | | Realized
Gain/(Loss)
On Derivatives
Recognized In
Income | | Change in
Unrealized
Gain/(Loss)
On Derivatives
Recognized In
Income | |
Long/Short Fund | |
Forward Foreign
Currency Exchange
Contracts
| | Net realized gains (losses) from:
Forward currency contracts / Net
change in unrealized appreciation
(depreciation) on: Forward currency
contracts | | $ | (6,847 | ) | | $ | (2,008 | ) | |
Swap Contracts
| | Net realized gains (losses) from: Swap
contracts / Net change in
unrealized appreciation
(depreciation) on: Swap contracts | | | (1,365 | ) | | | — | | |
Equity Contracts
(purchased option
contracts)
| | Net realized gains (losses) from:
Purchased option contracts / Net
change in unrealized appreciation
(depreciation) on: Purchased option
contracts | | | (19,630 | ) | | | (39,040 | ) | |
Equity Contracts
(written option
contracts)
| | Net realized gains (losses) from:
Written option contracts / Net
change in unrealized appreciation
(depreciation) on: Written option
contracts | | | 5,662 | | | | 19,221 | | |
| | | | | $ | (22,180 | ) | | $ | (21,827 | ) | |
Volume of derivative instruments held by the Funds during the six months ended November 30, 2020, was as follows:
Derivative Type | | Unit of Measurement | | Monthly Average | |
Arbitrage Fund | |
Swap Contracts | | Notional Quantity | | $ | 369,224,352 | | |
Forward Foreign Currency Exchange
Contracts | | Net Contracts to Deliver/(Receive)
| | | (77,568,273 | ) | |
Purchased Option Contracts | | Contracts | | | 5,239 | | |
Derivative Type | | Unit of Measurement | | Monthly Average | |
Event-Driven Fund | |
Swap Contracts | | Notional Quantity | | $ | 26,266,831 | | |
Forward Foreign Currency Exchange
Contracts | | Net Contracts to Deliver/(Receive)
| | | (4,476,101 | ) | |
Purchased Option Contracts | | Contracts | | | 537 | | |
www.arbitragefunds.com | 1-800-295-4485
108
The Arbitrage Funds Notes to Financial Statements (continued)
November 30, 2020 (Unaudited)
Derivative Type | | Unit of Measurement | | Monthly Average | |
Credit Opportunities Fund | |
Swap Contracts | | Notional Quantity | | $ | 5,535,597 | | |
Forward Foreign Currency Exchange
Contracts | |
Net Contracts to Deliver/(Receive) | | | (326,883 | ) | |
Purchased Option Contracts | | Contracts | | | 2,396 | | |
Written Option Contracts | | Contracts | | | (197 | ) | |
Derivative Type | | Unit of Measurement | | Monthly Average | |
Long/Short Fund | |
Swap Contracts | | Notional Quantity | | $ | 31,009 | | |
Forward Foreign Currency Exchange
Contracts | |
Net Contracts to Deliver/(Receive) | | | (122,857 | ) | |
Purchased Option Contracts | | Contracts | | | 77 | | |
Written Option Contracts | | Contracts | | | (47 | ) | |
Certain derivative contracts are executed under either standardized netting agreements or, for exchange-traded derivatives, the relevant contracts for a particular exchange which contain enforceable netting provisions. A derivative netting arrangement creates an enforceable right of set-off that becomes effective, and affects the realization of settlement on individual assets, liabilities and collateral amounts, only following a specified event of default or early termination. Default events may include the failure to make payments or deliver securities timely, material adverse changes in financial condition or insolvency, the breach of minimum regulatory capital requirements, or loss of license, charter or other legal authorization necessary to perform under the contract.
The Funds held financial instruments such as equity swaps that are subject to enforceable netting arrangements or other similar agreements as of November 30, 2020. At November 30, 2020, there was no unrealized appreciation or depreciation on these instruments held by the Funds. All other derivative contracts held by the Funds were not subject to netting agreements.
Investment Income — Interest income, adjusted for amortization of premium and accretion of discount, is recorded on the accrual basis. Dividend income is recorded on the ex-dividend date, net of any non-reclaimable tax withholdings. Payment-in-kind securities have the option at each interest payment date of making interest payments in cash or additional debt securities. Any interest accrued on payment-in-kind securities is recorded as interest income on an accrual basis. Distributions from REITs may be characterized as ordinary income, net capital gain, or a return of capital to the Funds. The proper characterization of REIT distributions is generally not known until after the end of each calendar year. As such, estimates are used in reporting the character of income and distributions for financial statement purposes when information is not available.
Dividends and Distributions to Shareholders — Dividends arising from net investment income and net capital gain distributions, if any, are declared and paid at least annually to shareholders of the Arbitrage Fund, Event-Driven Fund and Long/Short Fund. Dividends arising from net investment income, if any, are declared daily and paid monthly, and net capital gain distributions, if any, are declared and paid at least annually to shareholders of the Credit Opportunities Fund.
Allocation Between Classes — Investment income earned, realized capital gains and losses, and unrealized appreciation and depreciation are allocated daily to each class of shares based upon the proportionate shares of total net assets of each Fund. Class-specific expenses are charged directly to the class incurring the expense. Common expenses which are not attributable to a
Semi-Annual Report | November 30, 2020
109
The Arbitrage Funds Notes to Financial Statements (continued)
November 30, 2020 (Unaudited)
specific class are allocated daily to each class of shares based upon the proportionate share of total net assets of each Fund.
Federal Income Tax — It is the Funds' policy to continue to comply with the special provisions of Subchapter M of the Code, as amended, applicable to regulated investment companies. As provided therein, in any fiscal year in which a fund so qualifies and distributes at least 90% of its taxable net income, a fund (but not the shareholders) will be relieved of Federal income tax on the income distributed. Accordingly, no provision for income taxes has been made.
As of and during the six months ended November 30, 2020, the Funds did not have a liability for any unrecognized tax benefits. The Funds recognize interest and, if applicable, penalties for any uncertain tax positions. Interest and penalty expense will be recorded as a component of interest or other tax expense. No interest or penalties were recorded during the six months ended November 30, 2020. The Funds file U.S. federal, state, and local tax returns as required. The Funds' tax returns are subject to examination by the relevant tax authorities until expiration of the applicable statute of limitations which is generally three years after the filing of the tax return. Tax returns for open years have incorporated no uncertain tax positions that require a provision for income taxes.
3. INVESTMENT TRANSACTIONS
During the six months ended November 30, 2020, cost of purchases and proceeds from sales and maturities of investment securities, excluding short-term investments, U.S. government securities, equity swap contracts, purchased and written option contracts and securities sold short, were as follows:
| | | Arbitrage Fund | | Event-Driven Fund | | Credit
Opportunities Fund | | Long/Short
Fund | |
Purchases | | $ | 1,649,470,927 | | | $ | 160,335,508 | | | $ | 38,965,739 | | | $ | 2,277,145 | | |
Sales and Maturities | | | 1,470,585,434 | | | | 150,448,627 | | | | 33,083,757 | | | | 2,220,580 | | |
During the six months ended November 30, 2020, cost of purchases and proceeds from sales and maturities of U.S. government securities for the Credit Opportunities Fund were as follows:
| | | Credit Opportunities Fund | |
Purchases | | $ | 1,964,532 | | |
Sales | | | 1,279,430 | | |
4. LINE OF CREDIT
The Trust, on behalf of the Funds, entered into an agreement which enables the Arbitrage Fund, the Event-Driven Fund, the Credit Opportunities Fund and the Long/Short Fund to participate in a $50,000,000 unsecured committed revolving line of credit (the "Committed Line") and a $100,000,000 unsecured uncommitted revolving line of credit (the "Uncommitted Line," together with the Committed Line, the "Credit Agreement") with State Street Bank and Trust Company (the "Custodian"). Borrowings are made solely to temporarily finance the purchase or sale of securities or to finance the redemption of the shares of an investor of the Funds. Interest is charged to the Funds based on their borrowings at a rate per annum of the higher of the LIBOR rate plus 1.25% and the overnight federal funds rate plus 1.25%. The Committed Line has a commitment fee of 0.25% per annum on the unused portion of the Committed Line and is payable quarterly. The Uncommitted Line has an upfront fee of $30,000, is held available on a discretionary demand basis and may be terminated by the Custodian or the Trust at any time for any or no reason. The Trust accrues, on behalf of each of the Funds, the commitment fee on the
www.arbitragefunds.com | 1-800-295-4485
110
The Arbitrage Funds Notes to Financial Statements (continued)
November 30, 2020 (Unaudited)
unused portion of the Committed Line. On December 3, 2020 the Trust terminated the Committed Line and renewed the Uncommitted line. Interest is charged to the Funds based on their borrowing at a rate equal to the higher of (a) the Federal Funds Effective Rate plus 1.25% on such date and (b) the Overnight Bank Funding Rate plus 1.25% on such date, plus in each case 10 basis points. Notwithstanding anything to the contrary, if the Federal Funds Effective Rate or the Overnight Bank Funding Rate shall be less than zero, then the Federal Funds Effective Rate or Overnight Bank Funding Rate, shall be deemed to be zero for the purposes of determining the rate. Such fees are included in the custodian and bank service fees on the Statements of Operations.
In July 2017, the Financial Conduct Authority, the United Kingdom's financial regulatory body, announced that after 2021 it will cease its active encouragement of banks to provide quotations needed to sustain the LIBOR rate, which means that the LIBOR rate may no longer be published after 2021. Although there is still uncertainty regarding a replacement rate, it is anticipated that, beginning in 2020, transactions that currently utilize LIBOR will transition to using the Secured Overnight Financing Rate ("SOFR"), which is a broad measure of the cost of overnight borrowings secured by U.S. Treasury securities. However, various counterparties or other entities may be unwilling or unable to utilize SOFR prior to 2021 or may be unable to modify existing agreements or instruments in a timely manner. The transition from LIBOR to SOFR (or any other replacement rate) may lead to a reduction in the value of some LIBOR-based investments and the effectiveness of new hedges placed against existing LIBOR-based investments, as well as significant market uncertainty, increased volatility, and illiquidity in markets for various instruments, which may result in prolonged adverse market conditions and impact a Fund's performance or NAV.
For the six months ended November 30, 2020, the Event-Driven Fund and the Credit Opportunities Fund had average borrowings of $1,540,909 and $1,773,529, respectively, over a period of 66 days and 34 days, respectively, at a weighted average interest rate of 1.40% and 1.43%, respectively. Interest expense on the line of credit for the Event-Driven Fund and the Credit Opportunities Fund during the six months ended November 30, 2020, is shown as line of credit interest expense on the Statements of Operations. The Arbitrage Fund, the Credit Opportunities Fund and the Long/Short Fund had no outstanding borrowings at November 30, 2020. The Event-Driven Fund had outstanding borrowings of $500,000 at November 30, 2020.
5. ADVISORY FEES, ADMINISTRATION FEES AND OTHER AGREEMENTS
Investment Advisory Agreement
The Funds' investments are managed by the Adviser according to the terms of Investment Advisory Agreements. Under the Investment Advisory Agreement between the Adviser and the Arbitrage Fund, as amended and restated on October 1, 2007, the Arbitrage Fund pays the Adviser an annual fee, which is computed and accrued daily and paid monthly, of 1.25% on the first $250 million, 1.20% on the next $50 million, 1.15% on the next $50 million, 1.10% on the next $75 million, 1.05% on the next $75 million and 1.00% for amounts over $500 million, based on the Arbitrage Fund's average daily net assets. Effective November 1, 2019, the Event-Driven Fund reduced the annual investment advisory fee to 1.10% based on the Event-Driven Fund's average daily net assets. Prior to November 1, 2019, under the Investment Advisory Agreement between the Adviser and the Event-Driven Fund dated September 27, 2010, the Event-Driven Fund paid the Adviser an annual fee, which was computed and accrued daily and paid monthly, of 1.25% based on the Event-Driven Fund's average daily net assets. Effective August 6, 2018, the Credit Opportunities Fund reduced the annual investment advisory fee to 0.95% on the first $250 million of its average daily net assets, 0.90% on the next $500 million of its average daily net assets and 0.85% on its average daily net assets in excess of $750 million. Prior to August 6, 2018, under the
Semi-Annual Report | November 30, 2020
111
The Arbitrage Funds Notes to Financial Statements (continued)
November 30, 2020 (Unaudited)
Investment Advisory Agreement between the Adviser and the Credit Opportunities Fund dated October 1, 2012, the Credit Opportunities Fund paid an average annual fee of 1.00% on the amount of the Credit Opportunities Fund's average daily net assets. Under the Investment Advisory Agreement between the Adviser and the Long/Short Fund dated December 22, 2014, the Long/Short Fund pays the Adviser an annual fee, which is computed and accrued daily and paid monthly, of 1.25% based on the Long/Short Fund's average daily net assets.
The Adviser has contractually agreed, at least until September 30, 2021, to waive its advisory fee and/or reimburse the Funds' other expenses to the extent that total operating expenses (exclusive of taxes, interest, dividends on short positions, brokerage commissions, acquired fund fees and expenses and other costs incurred in connection with the purchase or sale of portfolio securities) exceed the annual rate of the Funds' average daily net assets attributable to each share class as shown in the table below:
| | | Arbitrage Fund | | Event-Driven Fund | | Credit Opportunities Fund | | Long/Short Fund | |
Class R | | | 1.69 | % | | | 1.69 | % | | | 1.23 | % | | | 1.69 | % | |
Class I | | | 1.44 | % | | | 1.44 | % | | | 0.98 | % | | | 1.44 | % | |
Class C | | | 2.44 | % | | | 2.44 | % | | | 1.98 | % | | | N/A | | |
Class A | | | 1.69 | % | | | 1.69 | % | | | 1.23 | % | | | N/A | | |
Effective August 6, 2018, the Adviser has contractually agreed to provide additional expense reimbursements to the Credit Opportunities Fund by lowering the contractual expense limitation, not including taxes, interest, dividends on short positions, brokerage commissions, acquired fund fees and expenses and other costs incurred in connection with the purchase or sale of portfolio securities, to the amounts in the table above. Prior to August 6, 2018, the expense limitation was 1.50% of the Credit Opportunities Fund's average daily net assets allocable to the Class R shares, 1.25% of the Credit Opportunities Fund's average daily net assets allocable to the Class I shares, 2.25% of the Credit Opportunities Fund's average daily net assets allocable to the Class C shares, and 1.50% of the Credit Opportunities Fund's average daily net assets allocable to the Class A shares.
During the six months ended November 30, 2020, the Arbitrage Fund invested in the Event-Driven Fund. The Adviser has agreed to waive $425,511 in advisory fees paid by the Arbitrage Fund on the Arbitrage Fund's assets that are invested in the Event-Driven Fund.
For the six months ended November 30, 2020, the aggregate net fee paid to the Adviser as a percentage of average net assets for the Arbitrage Fund, Event-Driven Fund, Credit Opportunities Fund and Long/Short Fund was 1.00%, 0.98%, 0.47% and 0.00%, respectively.
The Adviser may recapture any waived amount from a Fund pursuant to the agreement, if such recapture does not cause the Fund to exceed existing expense limitations in effect at the time the amounts were waived, the recapture does not cause the Fund to exceed the current expense limitation and the recapture is done within three years after the date on which the expense was waived. The Adviser can recapture, with the exception of the advisory fees waived related to Arbitrage Fund's investment in the Event-Driven Fund, any fees it has waived within three fiscal years of the year in which the fees were waived subject to the applicable annual rate of: 1.69% for Class R shares, 1.44% for Class I shares, 2.44% for Class C shares and 1.69% for Class A shares of the Arbitrage Fund and Event-Driven Fund. The Adviser can recapture any fees it has waived within three fiscal years of the year in which the fees were waived subject to the applicable annual rate of: 1.69% for Class R shares, 1.44% for Class I shares, 2.44% of the Long/Short Fund. The Advisor can recapture any fees it has waived within three years of the date of the expense waiver
www.arbitragefunds.com | 1-800-295-4485
112
The Arbitrage Funds Notes to Financial Statements (continued)
November 30, 2020 (Unaudited)
for the Credit Opportunities Fund subject to the applicable annual rate of 1.23% for Class R shares, 0.98% for Class I shares, 1.98% for Class C shares and 1.23% for Class A shares of the Credit Opportunities Fund for fees waived after August 6, 2018. Prior to August 6, 2018, the Adviser can recapture any fees it has waived within three years after the year in which the expense was waived subject to the applicable annual rate of 1.50% for Class R shares, 1.25% for Class I shares, 2.25% for Class C shares and 1.50% for Class A shares of the Credit Opportunities Fund provided that such recapture would not cause the expense ratio of the Credit Opportunities Fund to exceed the limit in effect at the time such fees were recaptured.
As of November 30, 2020, the balances of future fee and expense recaptures for each Fund were as follows:
| | | Expiring
May 31, 2021 | | Expiring
May 31, 2022 | | Expiring
May 31, 2023 | | Total | |
Event-Driven Fund | |
Class R | | $ | 212,683 | | | $ | 150,425 | | | $ | 72,714 | | | $ | 435,822 | | |
Class I | | | 390,120 | | | | 392,244 | | | | 279,224 | | | | 1,061,588 | | |
Class C | | | 5,981 | | | | 3,752 | | | | 1,804 | | | | 11,537 | | |
Class A | | | 3,178 | | | | 3,225 | | | | 2,112 | | | | 8,515 | | |
Credit Opportunities Fund | |
Class R | | $ | 42,333 | | | $ | 35,953 | | | $ | 46,492 | | | $ | 124,778 | | |
Class I | | | 126,190 | | | | 244,066 | | | | 305,422 | | | | 675,678 | | |
Class C | | | 2,587 | | | | 2,613 | | | | 2,868 | | | | 8,068 | | |
Class A | | | 655 | | | | 740 | | | | 1,504 | | | | 2,899 | | |
Long/Short Fund | |
Class R | | $ | 1,030 | | | $ | 938 | | | $ | 1,126 | | | $ | 3,094 | | |
Class I | | | 215,161 | | | | 201,824 | | | | 216,303 | | | | 633,288 | | |
During the six months ended November 30, 2020, the Adviser did not recapture fees or expenses from the Funds.
Administration Agreement
State Street Bank & Trust Company serves as the Trust's administrator pursuant to an Administration Agreement with the Trust.
Distribution Agreement
ALPS Distributors, Inc. (the "Distributor") serves as the Funds' distributor. The Distributor acts as an agent for the Funds and the distributor of their shares. The Funds have adopted, with respect to their Class R, Class C shares and Class A shares, as applicable, a plan of distribution pursuant to Rule 12b-1 under the 1940 Act which permits each Fund to pay for expenses incurred in the distribution and promotion of the Funds' Class R shares, Class C shares and Class A shares and for services provided to shareholders. The Plan is a "reimbursement" plan. This means that a Fund's Class R shares, Class C shares and Class A shares only pay the 12b-1 fee to the extent that the Adviser, the Distributor or others have incurred expenses in the promotion and distribution of the shares, including but not limited to, the printing of prospectuses and reports used for sales purposes, expenses of preparation of sales literature and related expenses, advertisements, and other distribution-related expenses, as well as any distribution fees paid to securities dealers or others. Under the distribution plan, a Fund may pay compensation to any broker-dealer with whom the Distributor or the Funds has entered into a contract to distribute Class R shares, Class C shares or Class A shares, or to any other qualified financial services firm, for distribution and/or shareholder-related services with respect to shares held or purchased by their respective
Semi-Annual Report | November 30, 2020
113
The Arbitrage Funds Notes to Financial Statements (continued)
November 30, 2020 (Unaudited)
customers or in connection with the purchase of shares attributable to their efforts. The amount of payments under the Plan in any year shall not exceed 0.25% for Class R shares, 0.75% for Class C shares and 0.25% for Class A shares, respectively, of the average daily net assets allocable to a Fund's Class R shares, Class C shares and Class A shares, respectively. In addition, the Plan permits each Fund to make payments at an annual rate of up to 0.25% of the Fund's Class C shares for expenses incurred in connection with the provision of shareholder support or administrative services for the Fund's Class C shares.
During the six months ended November 30, 2020, the Arbitrage Fund's Class R shares incurred $113,265, Class C shares incurred $88,541 and Class A shares incurred $28,290, respectively, in distribution expenses for Class R shares and Class A shares and distribution and shareholder support expenses for Class C shares, all of which was used to compensate broker-dealers. During the six months ended November 30, 2020, the Event-Driven Fund's Class R shares incurred $9,395, Class C shares incurred $1,802 and Class A shares incurred $435, respectively, in distribution expenses for Class R shares and Class A shares and distribution and shareholder support expenses for Class C shares, all of which was used to compensate broker-dealers. During the six months ended November 30, 2020, the Credit Opportunities Fund's Class R shares incurred $2,403, Class C shares incurred $3,400 and Class A shares incurred $105, respectively, in distribution expenses for Class R shares and Class A shares and distribution and shareholder support expenses for Class C shares, all of which was used to compensate broker-dealers. During the six months ended November 30, 2020, the Long/Short Fund's Class R shares incurred $15, Class C shares incurred $0 and Class A shares incurred $0, respectively, in distribution expenses for Class R shares and Class A shares and distribution and shareholder support expenses for Class C shares, all of which was used to compensate broker-dealers. Effective July 31, 2019, Class A and Class C shares of the Long/Short Fund were liquidated.
Chief Compliance Officer
Certain officers of the Trust are also officers of the Adviser. The Chief Compliance Officer ("CCO") of the Trust also serves as the CCO of the Adviser. The Funds currently pay the Adviser 50% of the CCO's salary for the CCO's provision of services to the Funds.
Chief Financial Officer
Foreside Management Services, LLC provides Chief Financial Officer ("CFO") services to the Trust. Foreside Management Services, LLC is compensated by the Trust under a Fund CFO/Treasurer Agreement.
Transfer Agent And Shareholder Services Agreement
DST Systems, Inc. ("DST") is the Funds' transfer agent, and per an agency agreement, maintains the records of each shareholder's account, answers shareholders' inquiries concerning their accounts, processes purchases and redemptions of the Funds shares, acts as dividend and distribution disbursing agent and performs other shareholder service functions.
www.arbitragefunds.com | 1-800-295-4485
114
The Arbitrage Funds Notes to Financial Statements (continued)
November 30, 2020 (Unaudited)
6. AFFILIATED ISSUER TRANSACTIONS
A summary of affiliated transactions for the Arbitrage Fund for the six months ended November 30, 2020 follows:
Affiliated
Issuer | | Beginning
Value
as of
May 31,
2020 | | Purchases
at
Cost | | Proceeds
from
Sales | | Net
Realized
Gain/
(Loss)
on
Sales | | Change
in
Unrealized
Appreciation/
Depreciation | | Ending
Value
as of
November 30,
2020 | | Shares
as of
November 30,
2020 | | Dividend
Income | | Capital
Gain
Distributions | |
Water Island
Event-Driven
Fund | | $ | 66,223,311 | | | $ | — | | | $ | — | | | $ | — | | | $ | 4,283,100 | | | $ | 70,506,411 | | | | 6,589,384 | | | $ | — | | | $ | — | | |
Other: At November 30, 2020, there were affiliated investors owning 63.68% of Event-Driven Fund's shares.
7. CAPITAL SHARE TRANSACTIONS
Proceeds and payments on capital shares as shown in the Statement of Changes in Net Assets are the result of the following capital share transactions for the periods shown:
| | | Six Months Ended
November 30, 2020
(Unaudited) | | Year Ended
May 31, 2020 | |
Arbitrage Fund - Class R | | Shares | | Value | | Shares | | Value | |
Proceeds from shares sold | | | 761,878 | | | $ | 10,041,858 | | | | 1,844,057 | | | $ | 23,874,599 | | |
Shares issued in reinvestment of
distributions | | | — | | | | — | | | | 226,522 | | | | 2,928,930 | | |
Payments for shares redeemed | | | (1,640,208 | ) | | | (21,506,937 | ) | | | (7,139,305 | ) | | | (91,524,308 | ) | |
Net decrease | | | (878,330 | ) | | $ | (11,465,079 | ) | | | (5,068,726 | ) | | $ | (64,720,779 | ) | |
Arbitrage Fund - Class I | |
Proceeds from shares sold | | | 13,903,991 | | | $ | 189,530,811 | | | | 26,307,371 | | | $ | 350,888,952 | | |
Shares issued in reinvestment of
distributions | | | — | | | | — | | | | 1,798,724 | | | | 23,994,981 | | |
Payments for shares redeemed | | | (13,493,449 | ) | | | (184,077,155 | ) | | | (51,892,203 | ) | | | (688,847,296 | ) | |
Net increase/(decrease) | | | 410,542 | | | $ | 5,453,656 | | | | (23,786,108 | ) | | $ | (313,963,363 | ) | |
Arbitrage Fund - Class C | |
Proceeds from shares sold | | | 97,262 | | | $ | 1,208,073 | | | | 362,286 | | | $ | 4,484,833 | | |
Shares issued in reinvestment of
distributions | | | — | | | | — | | | | 26,490 | | | | 325,301 | | |
Payments for shares redeemed | | | (400,903 | ) | | | (4,986,357 | ) | | | (323,299 | ) | | | (3,960,880 | ) | |
Net increase/(decrease) | | | (303,641 | ) | | $ | (3,778,284 | ) | | | 65,477 | | | $ | 849,254 | | |
Arbitrage Fund - Class A | |
Proceeds from shares sold | | | 760,847 | | | $ | 10,005,242 | | | | 721,756 | | | $ | 9,364,614 | | |
Shares issued in reinvestment of
distributions | | | — | | | | — | | | | 20,562 | | | | 265,452 | | |
Payments for shares redeemed | | | (159,030 | ) | | | (2,095,232 | ) | | | (798,929 | ) | | | (10,288,809 | ) | |
Net increase/(decrease) | | | 601,817 | | | $ | 7,910,010 | | | | (56,611 | ) | | $ | (658,743 | ) | |
Semi-Annual Report | November 30, 2020
115
The Arbitrage Funds Notes to Financial Statements (continued)
November 30, 2020 (Unaudited)
| | | Six Months Ended
November 30, 2020
(Unaudited) | | Year Ended
May 31, 2020 | |
Event-Driven Fund - Class R | | Shares | | Value | | Shares | | Value | |
Proceeds from shares sold | | | 69,077 | | | $ | 716,256 | | | | 438,183 | | | $ | 4,185,461 | | |
Shares issued in reinvestment of
distributions | | | — | | | | — | | | | 3,440 | | | | 33,265 | | |
Payments for shares redeemed | | | (95,923 | ) | | | (975,641 | ) | | | (2,883,407 | ) | | | (26,064,348 | ) | |
Net decrease | | | (26,846 | ) | | $ | (259,385 | ) | | | (2,441,784 | ) | | $ | (21,845,622 | ) | |
Event-Driven Fund - Class I | |
Proceeds from shares sold | | | 364,585 | | | $ | 3,769,985 | | | | 5,883,521 | | | $ | 53,863,559 | | |
Shares issued in reinvestment of
distributions | | | — | | | | — | | | | 44,603 | | | | 434,430 | | |
Payments for shares redeemed | | | (684,605 | ) | | | (7,023,849 | ) | | | (5,789,051 | ) | | | (53,843,540 | ) | |
Net increase/(decrease) | | | (320,020 | ) | | $ | (3,253,864 | ) | | | 139,073 | | | $ | 454,449 | | |
Event-Driven Fund - Class C | |
Proceeds from shares sold | | | 1,221 | | | $ | 12,250 | | | | 10,870 | | | $ | 101,200 | | |
Payments for shares redeemed | | | (4,175 | ) | | | (41,446 | ) | | | (58,434 | ) | | | (550,984 | ) | |
Net decrease | | | (2,954 | ) | | $ | (29,196 | ) | | | (47,564 | ) | | $ | (449,784 | ) | |
Event-Driven Fund - Class A | |
Proceeds from shares sold | | | 2,511 | | | $ | 25,351 | | | | 7,600 | | | $ | 73,084 | | |
Shares issued in reinvestment of
distributions | | | — | | | | — | | | | 180 | | | | 1,743 | | |
Payments for shares redeemed | | | (6,754 | ) | | | (69,398 | ) | | | (57,399 | ) | | | (560,515 | ) | |
Net decrease | | | (4,243 | ) | | $ | (44,047 | ) | | | (49,619 | ) | | $ | (485,688 | ) | |
www.arbitragefunds.com | 1-800-295-4485
116
The Arbitrage Funds Notes to Financial Statements (continued)
November 30, 2020 (Unaudited)
| | | Six Months Ended
November 30, 2020
(Unaudited) | | Year Ended
May 31, 2020 | |
Credit Opportunities Fund - Class R | | Shares | | Value | | Shares | | Value | |
Proceeds from shares sold | | | 34,554 | | | $ | 342,489 | | | | 497,173 | | | $ | 4,825,641 | | |
Shares issued in reinvestment of
distributions | | | 2,890 | | | | 28,549 | | | | 24,121 | | | | 233,233 | | |
Payments for shares redeemed | | | (240,514 | ) | | | (2,368,869 | ) | | | (949,307 | ) | | | (8,929,822 | ) | |
Net decrease | | | (203,070 | ) | | $ | (1,997,831 | ) | | | (428,013 | ) | | $ | (3,870,948 | ) | |
Credit Opportunities Fund - Class I | |
Proceeds from shares sold | | | 1,753,678 | | | $ | 17,278,855 | | | | 2,161,328 | | | $ | 20,403,304 | | |
Shares issued in reinvestment of
distributions | | | 100,284 | | | | 988,353 | | | | 170,327 | | | | 1,636,801 | | |
Payments for shares redeemed | | | (1,235,268 | ) | | | (12,221,438 | ) | | | (1,565,768 | ) | | | (14,940,053 | ) | |
Net increase | | | 618,694 | | | $ | 6,045,770 | | | | 765,887 | | | $ | 7,100,052 | | |
Credit Opportunities Fund - Class C | |
Proceeds from shares sold | | | — | | | $ | — | | | | 33,505 | | | $ | 325,001 | | |
Shares issued in reinvestment of
distributions | | | 754 | | | | 7,436 | | | | 1,057 | | | | 10,156 | | |
Payments for shares redeemed | | | (221 | ) | | | (2,182 | ) | | | (14,435 | ) | | | (138,110 | ) | |
Net increase | | | 533 | | | $ | 5,254 | | | | 20,127 | | | $ | 197,047 | | |
Credit Opportunities Fund - Class A | |
Proceeds from shares sold | | | — | | | $ | — | | | | 30,785 | | | $ | 297,278 | | |
Shares issued in reinvestment of
distributions | | | 125 | | | | 1,229 | | | | 748 | | | | 7,170 | | |
Payments for shares redeemed | | | (1,054 | ) | | | (10,326 | ) | | | (34,897 | ) | | | (324,406 | ) | |
Net decrease | | | (929 | ) | | $ | (9,097 | ) | | | (3,364 | ) | | $ | (19,958 | ) | |
Semi-Annual Report | November 30, 2020
117
The Arbitrage Funds Notes to Financial Statements (continued)
November 30, 2020 (Unaudited)
| | | Six Months Ended
November 30, 2020
(Unaudited) | | Year Ended
May 31, 2020 | |
Long/Short Fund - Class R | | Shares | | Value | | Shares | | Value | |
Shares issued in reinvestment of
distributions | | | — | | | $ | — | | | | 18 | | | $ | 176 | | |
Net increase | | | — | | | $ | — | | | | 18 | | | $ | 176 | | |
Long/Short Fund - Class I | |
Proceeds from shares sold | | | 9,130 | | | $ | 106,461 | | | | 7,089 | | | $ | 70,694 | | |
Shares issued in reinvestment of
distributions | | | — | | | | — | | | | 3,640 | | | | 36,186 | | |
Payments for shares redeemed | | | — | | | | — | | | | (65,259 | ) | | | (645,623 | ) | |
Net increase/(decrease) | | | 9,130 | | | $ | 106,461 | | | | (54,530 | ) | | $ | (538,743 | ) | |
Long/Short Fund - Class C(a) | |
Payments for shares redeemed | | | — | | | | — | | | | (1,031 | ) | | | (10,300 | ) | |
Net increase/(decrease) | | | — | | | $ | — | | | | (1,031 | ) | | $ | (10,300 | ) | |
Long/Short Fund - Class A(a) | |
Payments for shares redeemed | | | — | | | | — | | | | (1,031 | ) | | | (10,303 | ) | |
Net increase/(decrease) | | | — | | | $ | — | | | | (1,031 | ) | | $ | (10,303 | ) | |
(a) Effective July 31, 2019, Class A and Class C shares of the Long/Short Fund were liquidated.
8. FOREIGN CURRENCY TRANSLATION
Amounts denominated in or expected to settle in foreign currencies are translated to U.S. dollars based on exchange rates on the basis outlined below:
A. The market values of investment securities and other assets and liabilities are translated at the closing rate of exchange each day.
B. Purchases and sales of investment securities and income and expenses are translated at the rate of exchange prevailing on the respective dates of such transactions.
C. The Funds do not isolate that portion of the results of operations caused by changes in foreign exchange rates on investments from those caused by changes in market prices of securities held. Such fluctuations are included with the net realized and unrealized gains or losses on investments. Reported net realized foreign exchange gains or losses arise from 1) purchases and sales of foreign currencies; 2) currency gains or losses realized between the trade and settlement dates on security transactions; and 3) the difference between the amounts of dividends, interest and foreign withholding taxes recorded on the Funds' books, and the U.S. dollar equivalent of the amounts actually received or paid. Reported net unrealized foreign exchange gains and losses arise from changes in the value of assets and liabilities, other than investment securities, resulting from changes in exchange rates.
9. CONTINGENCIES AND COMMITMENTS
The Funds indemnify the Trust's officers and trustees for certain liabilities that might arise from their performance of their duties to the Funds. Additionally, in the normal course of business, the Funds enter into contracts that contain a variety of representations and warranties and which
www.arbitragefunds.com | 1-800-295-4485
118
The Arbitrage Funds Notes to Financial Statements (continued)
November 30, 2020 (Unaudited)
provide general indemnifications. The Funds' maximum exposure under these arrangements is unknown, as this would involve future claims that may be made against the Funds that have not yet occurred. However, based on experience, the Funds expect the risk of loss to be remote.
10. SECURITIES LENDING
To generate additional income, the Funds may, from time to time, lend portfolio securities to broker-dealers, banks or institutional borrowers of securities. At the time of the loan, the Funds must receive from the borrower 102% collateral in the form of cash or U.S. government securities. This collateral must be valued daily and, should the market value of the loaned securities increase, the borrower must furnish additional collateral to the Funds. During the time portfolio securities are on loan, the borrower pays the Funds any dividends or interest paid on such securities.
Loans are subject to termination by the Funds or the borrower at any time. While the Funds do not have the right to vote securities on loan, they have the right to terminate the loan and regain the right to vote if that is considered important with respect to the investment. In the event the borrower defaults in its obligation to the Fund, the Funds bear the risk of delay in the recovery of portfolio securities and the risk of loss of rights in the collateral.
The Funds may participate in a securities lending program under which the Funds' custodian, State Street Bank and Trust Company (the "Custodian") acting as securities lending agent, is authorized to lend Fund portfolio securities to qualified brokers/dealers and financial institutions that post appropriate collateral. The value of securities loaned will not exceed one-third of the value of the total assets of the Fund making the loan. The Custodian has agreed to indemnify the Fund in case of default of any security borrower.
Securities on loan are fully collateralized and the collateral was equal to or exceeded the securities on loan. Cash collateral is invested in the State Street Institutional U.S. Government Money Market Fund, Premier Class. The Custodian receives a portion of the interest earned on any reinvested collateral. Income received by the Funds in securities lending transactions during the six months ended November 30, 2020, if any, is reflected as securities lending income in the Statement of Operations. The Funds did not participate in securities lending during the six months ended November 30, 2020.
11. FEDERAL TAX INFORMATION
In order to avoid imposition of the excise tax applicable to regulated investment companies, it is each Fund's intention to declare as dividends in each calendar year at least 98.0% of its net investment income (earned during the calendar year) and 98.2% of its net realized capital gains (earned during the twelve months ended October 31) plus undistributed amounts from prior years.
The amount of distributions from net investment income and net realized gains, if any, are determined in accordance with Federal income tax regulations which may differ from accounting principles generally accepted in the United States of America. These "book/tax" differences are either temporary or permanent in nature and permanent differences are charged or credited to undistributed net investment income (loss), accumulated net realized gain (loss) or paid-in capital as appropriate in the period that the differences arise.
Permanent differences between the Funds' financial statement and income tax reporting requirements are primarily attributable to gains and losses on certain foreign currency related transactions, short sale related dividend expense, investments in passive foreign investment companies, investments in swaps, ordinary loss netting to reduce short-term capital gains,
Semi-Annual Report | November 30, 2020
119
The Arbitrage Funds Notes to Financial Statements (continued)
November 30, 2020 (Unaudited)
convertible bonds, corporate actions, non-deductible excise tax activity and partnership basis adjustments. These have no effect on the Funds' net assets or net asset value per share.
Fund | | Distributable
Earnings
(Accumulated Loss) | | Paid-in Capital | |
Arbitrage Fund | | $ | 12,792 | | | $ | (12,792 | ) | |
Event-Driven Fund | | | 466,034 | | | | (466,034 | ) | |
Credit Opportunities Fund | | | 919 | | | | (919 | ) | |
Long/Short Fund | | | — | | | | — | | |
The tax character of dividends and distributions declared and paid during the years ended May 31, 2020 and May 31, 2019 was as follows:
Fund | | Year
Ended | | Ordinary
Income | | Long-Term
Capital Gains* | | Total
Distributions | |
Arbitrage Fund | | 5/31/2020 | | $ | 21,844,119 | | | $ | 12,763,361 | | | $ | 34,607,480 | | |
| | | 5/31/2019 | | | 29,608,804 | | | | 2,793,274 | | | | 32,402,078 | | |
Event-Driven Fund | | 5/31/2020 | | $ | 519,956 | | | $ | — | | | $ | 519,956 | | |
| | | 5/31/2019 | | | 2,299,685 | | | | — | | | | 2,299,685 | | |
Credit Opportunities Fund | | 5/31/2020 | | $ | 1,899,815 | | | $ | — | | | $ | 1,899,815 | | |
| | | 5/31/2019 | | | 1,863,801 | | | | — | | | | 1,863,801 | | |
Long/Short Fund | | 5/31/2020 | | $ | 14,062 | | | $ | 22,300 | | | $ | 36,362 | | |
| | | 5/31/2019 | | | 39,986 | | | | 4,350 | | | | 44,336 | | |
* The Funds designate these distributions as long-term capital gains dividends per IRC code section 852(b)(3)(C).
As of May 31, 2020, the components of distributable earnings on a tax basis were as follows:
| | | Arbitrage
Fund | | Event-Driven Fund | | Credit
Opportunities
Fund | | Long/Short
Fund | |
Undistributed ordinary
income | | $ | 85,958,483 | | | $ | — | | | $ | — | | | $ | 73,560 | | |
Accumulated capital
gains/losses | | | — | | | | — | | | | — | | | | — | | |
Unrealized appreciation/
(depreciation) | | | (36,421,971 | ) | | | (1,715,937 | ) | | | (1,392,015 | ) | | | 508 | | |
Capital loss carryover and
late year ordinary
loss deferrals | | | — | | | | (51,575,093 | ) | | | (1,965,987 | ) | | | (2,124 | ) | |
Total distributable
earnings
(accumulated loss) | | $ | 49,536,512 | | | $ | (53,291,030 | ) | | $ | (3,358,002 | ) | | $ | 71,944 | | |
www.arbitragefunds.com | 1-800-295-4485
120
The Arbitrage Funds Notes to Financial Statements (continued)
November 30, 2020 (Unaudited)
The following information is computed on a tax basis for each item as of November 30, 2020:
Fund | | Gross
Appreciation
(excess of value
over tax cost) | | Gross
Depreciation
(excess of tax
cost over value) | | Net Unrealized
Appreciation | | Aggregate Cost
of Investments
for Income Tax
Purposes | |
Arbitrage Fund | | $ | 79,416,370 | | | $ | (41,080,462 | ) | | $ | 38,335,908 | | | $ | 1,056,224,256 | | |
Event-Driven Fund | | | 5,792,892 | | | | (2,555,149 | ) | | | 3,237,743 | | | | 88,596,527 | | |
Credit Opportunities Fund | | | 3,246,975 | | | | (1,808,239 | ) | | | 1,438,736 | | | | 52,967,269 | | |
Long/Short Fund | | | 110,522 | | | | (110,843 | ) | | | (321 | ) | | | 710,814 | | |
The differences between book-basis and tax-basis net unrealized appreciation/(depreciation) for the Funds are attributable to constructive sales, dividends related to short securities, swap mark to market, wash sales, convertible bonds, straddle loss deferrals, partnership basis adjustments, forward contracts mark to market and unsettled short sales.
Capital Losses
As of May 31, 2020, the Event-Driven Fund had $42,803,914 of short term and $8,771,179 of long term capital loss carryforwards, the Credit Opportunities Fund had $422,403 of short term and $1,183,171 of long term capital loss carryforwards and Long/Short Fund had $2,124 of long term capital loss carryforwards which may reduce the Funds' taxable income arising from future net realized gains on investments, if any, to the extent permitted by the Code and thus may reduce the amount of the distributions to shareholders which would otherwise be necessary to relieve the Funds of any liability for federal tax.
The Event-Driven Fund utilized $6,475,244 of capital loss carryforwards, and the Credit Opportunities Fund utilized $1,310,691 of capital loss carryforwards during the year ended May 31, 2020.
Late Year Losses
The Credit Opportunities Fund elected to defer to the period ending May 31, 2021 losses in the amount of $360,413.
12. SUBSEQUENT EVENTS
Management has evaluated subsequent events for the Funds through the date the financial statements were issued, and has concluded that there are no recognized or non-recognized subsequent events relevant for financial statement disclosure.
Semi-Annual Report | November 30, 2020
121
The Arbitrage Funds Disclosure of Fund Expenses
November 30, 2020 (Unaudited)
All mutual funds have operating expenses. As a shareholder of a mutual fund, your investment is affected by these ongoing costs, which include (among others) costs for portfolio management, administrative services, distribution (12b-1) expenses, redemption fees and shareholder reports like this one. It is important for you to understand the impact of these costs on your investment returns.
Operating expenses such as these are deducted from a mutual fund's gross income and directly reduce its final investment return. These expenses are expressed as a percentage of a mutual fund's average net assets; this percentage is known as a mutual fund's expense ratio.
The following examples use the expense ratio and are intended to help you understand the ongoing costs (in dollars) of investing in your Fund and to compare these costs with those of other mutual funds. The examples are based on an investment of $1,000 made at the beginning of the period shown and held for the entire period.
The table on the following page illustrates your Fund's cost in two ways:
Actual Fund Return. The section helps you to estimate the actual expenses after fee waivers that your Fund incurred over the period. The "Expenses Paid During Period" column shows the actual dollar expense cost incurred by a $1,000 investment in the Fund, and the "Ending Account Value" number is derived from deducting that expense cost from the Fund's gross investment return.
You can use this information, together with the actual amount you invested in the Fund, to estimate the expenses you paid over that period. Simply divide your actual account value by $1,000 to arrive at a ratio (for example, an $8,600 account value divided by $1,000 = 8.6), then multiply that ratio by the number shown for your Fund under "Expenses Paid During Period."
Hypothetical 5% Return. This section helps you compare your Fund's costs with those of other mutual funds. It assumes that the Fund had an annual 5% return before expenses during the period, but that expense ratio (Column 3) for the period is unchanged. This example is useful in making comparisons because the Securities and Exchange Commission requires all mutual funds to make this 5% calculation. You can assess your Fund's comparative cost by comparing the hypothetical result for your Fund in the "Expenses Paid During Period" column with those that appear in the same charts in the shareholder reports for other mutual funds.
Note: Because the return is set at 5% for comparison purposes – NOT your Fund's actual return – the account values shown may not apply to your specific investment.
www.arbitragefunds.com | 1-800-295-4485
122
The Arbitrage Funds Disclosure of Fund Expenses (continued)
November 30, 2020 (Unaudited)
| | | Beginning
Account Value
06/01/2020 | | Ending
Account Value
11/30/2020 | | Expense
Ratio(a) | | Expenses
Paid During
Period(b) | |
Arbitrage Fund | |
Class R | |
Actual | | $ | 1,000.00 | | | $ | 1,032.20 | | | | 1.54 | % | | $ | 7.85 | | |
Hypothetical (5% return before
expenses) | | $ | 1,000.00 | | | $ | 1,017.35 | | | | 1.54 | % | | $ | 7.79 | | |
Class I | |
Actual | | $ | 1,000.00 | | | $ | 1,033.40 | | | | 1.29 | % | | $ | 6.58 | | |
Hypothetical (5% return before
expenses) | | $ | 1,000.00 | | | $ | 1,018.60 | | | | 1.29 | % | | $ | 6.53 | | |
Class C | |
Actual | | $ | 1,000.00 | | | $ | 1,028.40 | | | | 2.29 | % | | $ | 11.64 | | |
Hypothetical (5% return before
expenses) | | $ | 1,000.00 | | | $ | 1,013.59 | | | | 2.29 | % | | $ | 11.56 | | |
Class A | |
Actual | | $ | 1,000.00 | | | $ | 1,032.30 | | | | 1.54 | % | | $ | 7.85 | | |
Hypothetical (5% return before
expenses) | | $ | 1,000.00 | | | $ | 1,017.35 | | | | 1.54 | % | | $ | 7.79 | | |
(a) Annualized, based on the Fund's most recent fiscal half-year expenses.
(b) Expenses, are equal to the Fund's annualized ratio multiplied by the average account value over the period, multiplied by the number of days in the most recent fiscal half year (183), divided by 365.
| | | Beginning
Account Value
06/01/2020 | | Ending
Account Value
11/30/2020 | | Expense
Ratio(a) | | Expenses
Paid During
Period(b) | |
Water Island Event-Driven Fund | |
Class R | |
Actual | | $ | 1,000.00 | | | $ | 1,063.20 | | | | 1.83 | % | | $ | 9.47 | | |
Hypothetical (5% return before
expenses) | | $ | 1,000.00 | | | $ | 1,015.89 | | | | 1.83 | % | | $ | 9.25 | | |
Class I | |
Actual | | $ | 1,000.00 | | | $ | 1,064.70 | | | | 1.58 | % | | $ | 8.18 | | |
Hypothetical (5% return before
expenses) | | $ | 1,000.00 | | | $ | 1,017.15 | | | | 1.58 | % | | $ | 7.99 | | |
Class C | |
Actual | | $ | 1,000.00 | | | $ | 1,059.60 | | | | 2.58 | % | | $ | 13.32 | | |
Hypothetical (5% return before
expenses) | | $ | 1,000.00 | | | $ | 1,012.13 | | | | 2.58 | % | | $ | 13.01 | | |
Class A | |
Actual | | $ | 1,000.00 | | | $ | 1,063.20 | | | | 1.83 | % | | $ | 9.47 | | |
Hypothetical (5% return before
expenses) | | $ | 1,000.00 | | | $ | 1,015.89 | | | | 1.83 | % | | $ | 9.25 | | |
(a) Annualized, based on the Fund's most recent fiscal half-year expenses.
(b) Expenses, are equal to the Fund's annualized ratio multiplied by the average account value over the period, multiplied by the number of days in the most recent fiscal half year (183), divided by 365.
Semi-Annual Report | November 30, 2020
123
The Arbitrage Funds Disclosure of Fund Expenses (continued)
November 30, 2020 (Unaudited)
| | | Beginning
Account Value
06/01/2020 | | Ending
Account Value
11/30/2020 | | Expense
Ratio(a) | | Expenses
Paid During
Period(b) | |
Water Island Credit Opportunities Fund | |
Class R | |
Actual | | $ | 1,000.00 | | | $ | 1,056.90 | | | | 1.31 | % | | $ | 6.75 | | |
Hypothetical (5% return before
expenses) | | $ | 1,000.00 | | | $ | 1,018.50 | | | | 1.31 | % | | $ | 6.63 | | |
Class I | |
Actual | | $ | 1,000.00 | | | $ | 1,057.30 | | | | 1.06 | % | | $ | 5.47 | | |
Hypothetical (5% return before
expenses) | | $ | 1,000.00 | | | $ | 1,019.75 | | | | 1.06 | % | | $ | 5.37 | | |
Class C | |
Actual | | $ | 1,000.00 | | | $ | 1,052.00 | | | | 2.06 | % | | $ | 10.60 | | |
Hypothetical (5% return before
expenses) | | $ | 1,000.00 | | | $ | 1,014.74 | | | | 2.06 | % | | $ | 10.40 | | |
Class A | |
Actual | | $ | 1,000.00 | | | $ | 1,057.10 | | | | 1.31 | % | | $ | 6.76 | | |
Hypothetical (5% return before
expenses) | | $ | 1,000.00 | | | $ | 1,018.50 | | | | 1.31 | % | | $ | 6.63 | | |
(a) Annualized, based on the Fund's most recent fiscal half-year expenses.
(b) Expenses, are equal to the Fund's annualized ratio multiplied by the average account value over the period, multiplied by the number of days in the most recent fiscal half year (183), divided by 365.
| | | Beginning
Account Value
06/1/2020 | | Ending
Account Value
11/30/2020 | | Expense
Ratio(a) | | Expenses
Paid During
Period(b) | |
Water Island Long/Short Fund | |
Class R | |
Actual | | $ | 1,000.00 | | | $ | 1,166.50 | | | | 2.11 | % | | $ | 11.46 | | |
Hypothetical (5% return before
expenses) | | $ | 1,000.00 | | | $ | 1,014.49 | | | | 2.11 | % | | $ | 10.66 | | |
Class I | |
Actual | | $ | 1,000.00 | | | $ | 1,166.50 | | | | 1.84 | % | | $ | 9.99 | | |
Hypothetical (5% return before
expenses) | | $ | 1,000.00 | | | $ | 1,015.84 | | | | 1.84 | % | | $ | 9.30 | | |
(a) Annualized, based on the Fund's most recent fiscal half-year expenses.
(b) Expenses, are equal to the Fund's annualized ratio multiplied by the average account value over the period, multiplied by the number of days in the most recent fiscal half year (183), divided by 365.
www.arbitragefunds.com | 1-800-295-4485
124
The Arbitrage Funds Additional Information
November 30, 2020 (Unaudited)
1. PROXY VOTING POLICIES AND VOTING RECORD
A description of the policies and procedures that the Funds use to vote proxies relating to portfolio securities during the most recent 12-month period ended June 30 is available without charge upon request by calling toll-free 1-800-295-4485, or on the Securities and Exchange Commission's ("SEC") website at http://www.sec.gov. Information regarding how the Funds voted proxies will be available without charge upon request by calling toll-free 1-800-295-4485, or on the SEC's website at http://www.sec.gov.
2. QUARTERLY PORTFOLIO HOLDINGS
The Funds file a complete listing of their portfolio holdings with the SEC as of the first and third quarters of each fiscal year on Form N-PORT. The filings are available upon request by calling 1-800-295-4485. Furthermore, you may obtain a copy of the filing on the SEC's website at http://www.sec.gov.
Semi-Annual Report | November 30, 2020
125

Arbitrage Fund
Water Island Event-Driven Fund
Water Island Credit Opportunities Fund
Water Island Long/Short Fund
800-295-4485
www.arbitragefunds.com
Adviser
Water Island Capital, LLC
41 Madison Avenue, 42nd Floor
New York, NY 10010
Distributor
ALPS Distributors, Inc.
1290 Broadway, Suite 1100
Denver, CO 80203
Transfer Agent
DST Systems, Inc.
P.O. Box 219842
Kansas City, MO 64121-9842
Custodian
State Street Bank & Trust
225 Liberty Street
New York, NY 10281
This material must be preceded or accompanied by a prospectus. Please read it carefully before investing.
Item 2. Code of Ethics.
Not applicable to semi-annual report.
Item 3. Audit Committee Financial Expert.
Not applicable to semi-annual report.
Item 4. Principal Accountant Fees and Services.
Not applicable to semi-annual report.
Item 5. Audit Committee of Listed Registrants.
Not applicable.
Item 6. Schedule of Investments.
The Schedule of Investments is included as part of the Report to Stockholders filed under Item 1 of this form.
Item 7. Disclosure of Proxy Voting Policies and Procedures for Closed-End Management Investment Companies.
Not applicable.
Item 8. Portfolio Managers of Closed-End Management Investment Companies.
Not applicable.
Item 9. Purchases of Equity Securities by Closed-End Management Investment Company and Affiliated Purchasers.
Not applicable.
Item 10. Submission of Matters to Vote of Security Holders.
There have been no material changes to the procedures by which shareholders may recommend nominees to the registrant’s Board of Trustees.
Item 11. Controls and Procedures.
| (a) | The registrant’s principal executive officer and principal financial officer have evaluated the registrant’s disclosure controls and procedures (as defined in Rule 30a-3(c) under the Investment Company Act of 1940, as amended) within the most recent fiscal half-year of the filing date and have concluded that the registrant’s disclosure controls and procedures were effective, as of that date. |
| (b) | There was no change in the registrant’s internal control over financial reporting (as defined in Rule 30a-3(d) under the Investment Company Act of 1940, as amended) during the period covered by this report that has materially affected, or is reasonably likely to materially affect, the registrant’s internal control over financial reporting. |
Item 12. Disclosure of Securities Lending Activities for Closed-End Management Investment Companies
Not applicable.
Item 13. Exhibits.
| (a)(1) | Not applicable to semi-annual report. |
SIGNATURES
Pursuant to the requirements of the Securities Exchange Act of 1934 and the Investment Company Act of 1940, the registrant has duly caused this report to be signed on its behalf by the undersigned, thereunto duly authorized.
THE ARBITRAGE FUNDS
| By: | /s/ John S. Orrico | |
| | John S. Orrico | |
| | President (Principal Executive Officer) | |
| | |
| Date: | February 5, 2021 | |
Pursuant to the requirements of the Securities Exchange Act of 1934 and the Investment Company Act of 1940, this report has been signed below by the following persons on behalf of the registrant and in the capacities and on the dates indicated.
| By: | /s/ John S. Orrico | |
| | John S. Orrico | |
| | President (Principal Executive Officer) | |
| | |
| Date: | February 5, 2021 | |
| By: | /s/ Monique Labbe | |
| | Monique Labbe | |
| | Chief Financial Officer (Principal Financial Officer) | |
| | |
| Date: | February 5, 2021 | |