Table of Contents
UNITED STATES
SECURITIES AND EXCHANGE COMMISSION
Washington, D.C. 20549
FORM N-CSRS
CERTIFIED SHAREHOLDER REPORT OF REGISTERED
MANAGEMENT INVESTMENT COMPANIES
Investment Company Act file number: 811-09815
THE ARBITRAGE FUNDS
(exact name of registrant as specified in charter)
41 Madison Avenue, 42nd Floor, New York, NY 10010
(Address of principal executive offices) (Zip code)
John S. Orrico
Water Island Capital, LLC
41 Madison Avenue
42nd Floor
New York, NY 10010
(Name and address of agent for service)
Registrant’s telephone number, including area code: 212-259-2655
Date of fiscal year end: May 31
Date of reporting period: June 1, 2013 – November 30, 2013
Table of Contents
| Item 1. | Reports to Stockholders. |
Table of Contents
Table of Contents
|

| 1 | ||
| 3 | ||
| 17 | ||
| 19 | ||
| 40 | ||
| 42 | ||
| 51 | ||
| 53 | ||
| 55 | ||
| 57 | ||
| 58 | ||
| 59 | ||
| 60 | ||
| 62 | ||
| 64 | ||
| 66 | ||
| 68 | ||
| 70 | ||
| 72 | ||
| 74 | ||
| 76 | ||
| 78 | ||
| 80 | ||
| 82 | ||
| 84 | ||
| 86 | ||
| 88 | ||
| 89 | ||
| 114 | ||
| 117 | ||
Table of Contents
| Portfolio Information | ||
| November 30, 2013 (Unaudited) |
Performance (annualized returns as of November 30, 2013)
One Year | Five Year | Ten Year | Since Inception* | |||||||||||||||||
Arbitrage Fund, Class R | 1.14% | 3.10% | 3.33% | 4.78% | ||||||||||||||||
Arbitrage Fund, Class I | 1.38% | 3.31% | N/A | 3.38% | ||||||||||||||||
Arbitrage Fund, Class C** | -0.68% | N/A | N/A | 0.10% | ||||||||||||||||
Arbitrage Fund, Class A*** | N/A | N/A | N/A | -1.79% | ||||||||||||||||
HFRI Event Driven: Merger Arbitrage Index | 4.48% | 4.38% | 5.06% | 4.79% | ||||||||||||||||
S&P 500® Index | 19.34% | 10.02% | 7.57% | 3.15% | ||||||||||||||||
Barclays Capital U.S. Aggregate Bond Index | -1.68% | 5.41% | 4.59% | 5.62% | ||||||||||||||||
Current performance may be higher or lower than performance quoted above. Any performance data quoted represents past performance and the investment return and principal value of an investment in the Fund will fluctuate so that an investor’s shares, when redeemed, may be worth more or less than their original cost. Past performance is no guarantee of future results. Returns do not reflect a 2% redemption fee for shares that are redeemed from the fund within 30 days of purchase, which, if reflected, would reduce the performance quoted. Returns shown above include the reinvestment of all dividends and capital gains. Contractual fee waivers are currently in effect. Without such fee waivers, performance numbers would be reduced. You can obtain performance data current to the most recent month end by calling 1-800-295-4485 or going to www.arbitragefunds.com.
* Class R inception: 9/17/00; Class I inception: 10/17/03; Class C inception: 6/1/12; Class A inception: 6/1/13.
** Class C shares are subject to a 1.00% contingent deferred sales charge on all purchases redeemed in 12 months of purchase.
*** Class A shares are subject to a maximum front-end sales load of 2.50% on purchases. The shares are also subject to a deferred sales charge of up to .50% on purchases of $250,000 or more purchased without a front-end sales load and redeemed within 12 months of purchase.
The Total Annual Fund Operating Expenses for Class R, Class I, Class C and Class A are 1.99%, 1.74%, 2.74% and 1.99%, respectively.
The HFRI Event Driven: Merger Arbitrage Index is an index consisting of merger arbitrage strategies which employ an investment process primarily focused on opportunities in equity and equity related instruments of companies which are currently engaged in a corporate transaction. Merger Arbitrage involves primarily announced transactions, typically with limited or no exposure to situations which pre-, post-date or situations in which no formal announcement is expected to occur. Opportunities are frequently presented in cross border, collared and international transactions which incorporate multiple geographic regulatory institutions, with typically involve minimal exposure to corporate credits.
The S&P 500® Index is an unmanaged index consisting of 500 stocks.
The Barclays Capital U.S. Aggregate Bond Index is a market value-weighted index of investment grade fixed-rated debt issues, including government, corporate, asset-backed and mortgage-backed securities with a maturity of one year or more.
An investor may not invest directly in an index.
Semi-Annual Report | November 30, 2013 | 1 |
Table of Contents
The Arbitrage Fund | Portfolio Information (continued) | |
| November 30, 2013 (Unaudited) |
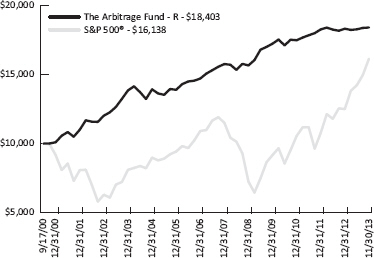
Growth of $10,000 Investment
| The chart represents historical performance of a hypothetical investment of $10,000 in the Class R shares of the Fund since inception. Past performance does not guarantee future results. This chart does not reflect the deduction of taxes that a shareholder would pay on Fund distributions or the redemption of Fund shares. |
|
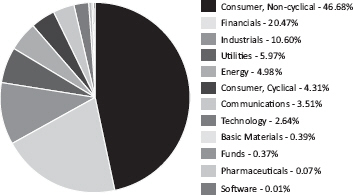
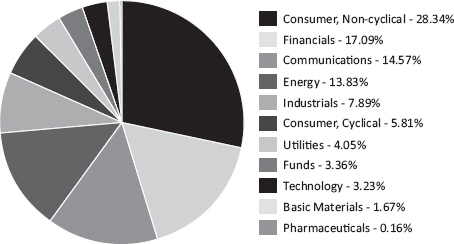
Sector Weighting
The following chart shows the sector weightings of the Arbitrage Fund’s investments in common stock and exchange-traded funds as of the report date.
2 | www.arbitragefunds.com | 1-800-295-4485 |
Table of Contents
The Arbitrage Fund | Portfolio of Investments | |
| November 30, 2013 (Unaudited) |
| Shares | Value | |||||||
COMMON STOCKS - 76.42% | ||||||||
Aerospace & Defense - 0.07% | ||||||||
Allied Defense Group, Inc.(a)(b)(c) | 398,319 | $ | 1,959,371 | |||||
|
| |||||||
Auto Parts & Equipment - 0.09% | ||||||||
Cooper Tire & Rubber Co.(d) | 102,168 | 2,513,333 | ||||||
|
| |||||||
Banks - 5.40% | ||||||||
Bank of Ayudhya Pcl | 4,756,461 | 5,740,045 | ||||||
CapitalSource, Inc.(e) | 6,500,218 | 91,393,065 | ||||||
Sterling Financial Corp.(e) | 1,680,775 | 54,877,304 | ||||||
Taylor Capital Group, Inc.(a) | 32,855 | 818,418 | ||||||
|
| |||||||
| 152,828,832 | ||||||||
|
| |||||||
Coal - 0.04% | ||||||||
Whitehaven Coal Ltd.(a) | 744,767 | 1,098,236 | ||||||
|
| |||||||
Commercial Services - 7.80% | ||||||||
Consolidated Graphics, Inc.(a) | 135,778 | 8,745,461 | ||||||
Lender Processing Services, Inc.(e) | 3,648,513 | 128,099,291 | ||||||
Mac-Gray Corp. | 330,616 | 7,042,121 | ||||||
Stewart Enterprises, Inc., Class A(e) | 5,799,297 | 76,840,685 | ||||||
|
| |||||||
| 220,727,558 | ||||||||
|
| |||||||
Cosmetics & Personal Care - 0.90% | ||||||||
Magic Holdings International Ltd. | 32,115,965 | 25,394,337 | ||||||
|
| |||||||
Diversified Financial Services - 0.39% | ||||||||
IntercontinentalExchange Group, Inc. | 51,506 | 10,985,715 | ||||||
|
| |||||||
Electric - 6.12% | ||||||||
NV Energy, Inc.(e) | 7,325,969 | 173,259,167 | ||||||
|
| |||||||
Electrical Components & Equipment - 4.67% | ||||||||
Molex, Inc.(e) | 3,416,885 | 132,028,436 | ||||||
|
| |||||||
Engineering & Construction - 1.05% | ||||||||
Gemina SpA(a) | 12,056,558 | 29,767,054 | ||||||
|
| |||||||
Food - 3.95% | ||||||||
Harris Teeter Supermarkets, Inc.(e) | 2,265,558 | 111,873,254 | ||||||
|
| |||||||
Healthcare - Products - 7.68% | ||||||||
Hitachi Medical Corp. | 291,971 | 5,124,348 | ||||||
Life Technologies Corp.(a)(e) | 2,090,468 | 158,248,427 | ||||||
See Notes to Financial Statements. | ||
Semi-Annual Report | November 30, 2013 | 3 |
Table of Contents
The Arbitrage Fund | Portfolio of Investments (continued) | |
| November 30, 2013 (Unaudited) |
| Shares | Value | |||||||
COMMON STOCKS - 76.42% (Continued) | ||||||||
Healthcare - Products - 7.68% (Continued) | ||||||||
MAKO Surgical Corp.(a)(d)(e) | 1,796,160 | $ | 53,812,954 | |||||
|
| |||||||
| 217,185,729 | ||||||||
|
| |||||||
Healthcare - Services - 0.26% | ||||||||
Health Management Associates, Inc., Class A(a) | 555,478 | 7,271,207 | ||||||
|
| |||||||
Holding Companies - Diversified - 0.09% | ||||||||
KHD Humboldt Wedag International AG | 287,397 | 2,499,699 | ||||||
|
| |||||||
Iron & Steel - 0.02% | ||||||||
Sundance Resources Ltd.(a) | 5,956,482 | 623,517 | ||||||
|
| |||||||
Media - 1.80% | ||||||||
Belo Corp., Class A(e) | 3,701,380 | 50,819,947 | ||||||
|
| |||||||
Mining - 0.38% | ||||||||
Flinders Mines Ltd.(a) | 46,410,055 | 1,478,566 | ||||||
Yancoal Australia Ltd.(a) | 25,962 | 16,542 | ||||||
Yancoal Australia Ltd., CVR(a) | 3,469,281 | 9,284,258 | ||||||
|
| |||||||
| 10,779,366 | ||||||||
|
| |||||||
Miscellaneous Manufacturing - 3.94% | ||||||||
Invensys Plc | 13,622,407 | 111,564,065 | ||||||
|
| |||||||
Oil & Gas - 2.00% | ||||||||
Coastal Energy Co.(a) | 2,978,811 | 52,789,056 | ||||||
Gulf Coast Ultra Deep Royalty Trust(a) | 1,684,941 | 3,757,418 | ||||||
|
| |||||||
| 56,546,474 | ||||||||
|
| |||||||
Pharmaceuticals - 16.49% | ||||||||
Acino Holding AG(a) | 83,167 | 10,570,210 | ||||||
Celesio AG | 91,691 | 2,940,332 | ||||||
Elan Corp. Plc, Sponsored ADR(a)(e) | 11,568,448 | 209,157,540 | ||||||
Hi-Tech Pharmacal Co., Inc. | 249,855 | 10,851,203 | ||||||
Paladin Labs, Inc.(a) | 946,165 | 103,294,094 | ||||||
Santarus, Inc.(a)(d) | 1,679,964 | 54,061,241 | ||||||
ViroPharma, Inc.(a)(d) | 1,524,264 | 75,466,311 | ||||||
|
| |||||||
| 466,340,931 | ||||||||
|
| |||||||
Real Estate Investment Trusts - 1.73% | ||||||||
Cole Real Estate Investment, Inc. | 767,504 | 10,982,982 | ||||||
See Notes to Financial Statements. | ||
4 | www.arbitragefunds.com | 1-800-295-4485 |
Table of Contents
The Arbitrage Fund | Portfolio of Investments (continued) | |
| November 30, 2013 (Unaudited) |
| Shares | Value | |||||||
COMMON STOCKS - 76.42% (Continued) | ||||||||
Real Estate Investment Trusts - 1.73% (Continued) | ||||||||
Commonwealth Property Office Fund | 32,833,170 | $ | 37,955,695 | |||||
|
| |||||||
| 48,938,677 | ||||||||
|
| |||||||
Retail - 4.34% | ||||||||
Office Depot, Inc.(a)(d) | 1,040,738 | 5,661,615 | ||||||
Shoppers Drug Mart Corp.(e) | 2,131,073 | 117,007,951 | ||||||
|
| |||||||
| 122,669,566 | ||||||||
|
| |||||||
Savings & Loans - 3.27% | ||||||||
Hudson City Bancorp, Inc.(e) | 9,914,128 | 92,597,956 | ||||||
|
| |||||||
Semiconductors - 0.90% | ||||||||
Applied Materials, Inc.(d) | 70,300 | 1,216,190 | ||||||
Mindspeed Technologies, Inc.(a) | 419,911 | 2,112,152 | ||||||
Tokyo Electron Ltd. | 406,408 | 22,017,321 | ||||||
|
| |||||||
| 25,345,663 | ||||||||
|
| |||||||
Software - 1.23% | ||||||||
Unit4 N.V.(a) | 669,880 | 34,725,551 | ||||||
|
| |||||||
Telecommunications - 1.81% | ||||||||
Anaren, Inc.(a) | 699,263 | 19,502,445 | ||||||
Leap Wireless International, Inc.(a)(e) | 1,521,134 | 25,266,036 | ||||||
Tellabs, Inc. | 2,614,155 | 6,404,680 | ||||||
|
| |||||||
| 51,173,161 | ||||||||
|
| |||||||
TOTAL COMMON STOCKS (Cost $2,088,191,183) | 2,161,516,802 | |||||||
|
| |||||||
LIMITED PARTNERSHIPS - 1.54% | ||||||||
Oil & Gas - 1.54% | ||||||||
Pioneer Southwest Energy Partners LP | 1,057,252 | 43,558,782 | ||||||
|
| |||||||
TOTAL LIMITED PARTNERSHIPS (Cost $43,967,035) | 43,558,782 | |||||||
|
| |||||||
RIGHTS - 0.15% | ||||||||
BMC Software, Inc., CVR(a)(b)(c) | 4,637,757 | 385,861 | ||||||
Cubist Pharmaceuticals, Inc., CPR(a)(b)(c) | 119,343 | 42,033 | ||||||
Cubist Pharmaceuticals, Inc., CVR(a) | 2,240,192 | 3,696,317 | ||||||
See Notes to Financial Statements. | ||
Semi-Annual Report | November 30, 2013 | 5 |
Table of Contents
The Arbitrage Fund | Portfolio of Investments (continued) | |
| November 30, 2013 (Unaudited) |
| Shares | Value | |||||||||||||||
RIGHTS - 0.15% (Continued) | ||||||||||||||||
Trius Therapeutics, CVR(a)(b)(c) | 1,034,403 | $ | 152,367 | |||||||||||||
|
| |||||||||||||||
TOTAL RIGHTS (Cost $4,978,827) | 4,276,578 | |||||||||||||||
|
| |||||||||||||||
Expiration Date | Exercise Price | Contracts | Value | |||||||||||||
PURCHASED OPTIONS (a)- 0.01% | ||||||||||||||||
Put Options Purchased - 0.01% | ||||||||||||||||
Applied Materials, Inc. | 01/2014 | $ | 16.00 | 385 | $ | 6,930 | ||||||||||
Cooper Tire & Rubber Co. | 01/2014 | 24.00 | 1,371 | 219,360 | ||||||||||||
Endo Health Solutions, Inc. | 12/2013 | 50.00 | 1,634 | 8,170 | ||||||||||||
MAKO Surgical Corp.: | ||||||||||||||||
| 01/2014 | 17.50 | 116 | 290 | |||||||||||||
| 01/2014 | 20.00 | 4,368 | 10,920 | |||||||||||||
Office Depot, Inc.: | ||||||||||||||||
| 01/2014 | 5.00 | 2,456 | 42,980 | |||||||||||||
| 01/2014 | 11.00 | 1,856 | 13,920 | |||||||||||||
| 01/2014 | 12.00 | 1,546 | 27,055 | |||||||||||||
ViroPharma, Inc. | 01/2014 | 40.00 | 2,146 | 26,825 | ||||||||||||
|
| |||||||||||||||
TOTAL PUT OPTIONS PURCHASED (Cost $849,000) | 356,450 | |||||||||||||||
|
| |||||||||||||||
TOTAL PURCHASED OPTIONS (Cost $849,000) | 356,450 | |||||||||||||||
|
| |||||||||||||||
| Yield | Shares | Value | ||||||||||||||
SHORT-TERM INVESTMENTS - 22.82% | ||||||||||||||||
Money Market Fund | ||||||||||||||||
State Street Institutional Liquid Reserves Fund(f) | 0.071% | 643,523,379 | 643,523,379 | |||||||||||||
|
| |||||||||||||||
Time Deposits | ||||||||||||||||
Euro Time Deposit | 0.010% | 1,998,275 | 1,998,275 | |||||||||||||
|
| |||||||||||||||
TOTAL SHORT-TERM INVESTMENTS (Cost $645,521,654) | 645,521,654 | |||||||||||||||
|
| |||||||||||||||
See Notes to Financial Statements. | ||
6 | www.arbitragefunds.com | 1-800-295-4485 |
Table of Contents
The Arbitrage Fund | Portfolio of Investments (continued) | |
| November 30, 2013 (Unaudited) |
Total Investments - 100.94% (Cost $2,783,507,699) | $ 2,855,230,266 | |||
Liabilities in Excess of Other Assets - (0.94%) | $(26,606,439) | |||
|
| |||
NET ASSETS - 100.00% | $ 2,828,623,827 | |||
|
| |||
(a) | Non-income-producing security. |
(b) | Security considered illiquid. On November 30, 2013, the total market value of these securities was $2,539,632, representing 0.09% of net assets. |
(c) | Security fair valued using methods determined in good faith by the Pricing Committee. As of November 30, 2013, the total market value of these securities was $2,539,632 representing 0.09% of net assets. |
(d) | Underlying security for a written/purchased call/put option. |
(e) | Security, or a portion of security, is being held as collateral for short sales, or written option contracts. At period end, the aggregate market value of those securities was $508,718,686, representing 17.98% of net assets. |
(f) | Rate shown is the 7-day effective yield as of November 30, 2013. |
Securities determined to be illiquid under the procedures approved by the Funds’ Board of Trustees. Information related to the illiquid securities is as follows:
Date(s) of Purchase | Security | Cost | Market Value | % of Net Assets | ||||||||
05/20/2010-12/28/2010 | Allied Defense Group, Inc. | $ | 1,553,995 | $ | 1,959,371 | 0.07% | ||||||
09/10/2013 | BMC Software, Inc., CVR | 0 | 385,861 | 0.01 | ||||||||
12/12/2011 | Cubist Pharmaceuticals, Inc. | 0 | 42,033 | 0.00 | ||||||||
09/12/2013 | Truis Therapeutics, CVR | 0 | 152,367 | 0.01 | ||||||||
|
| |||||||||||
| $ | 2,539,632 | 0.09% | ||||||||||
|
| |||||||||||
See Notes to Financial Statements. | ||
Semi-Annual Report | November 30, 2013 | 7 |
Table of Contents
The Arbitrage Fund | Portfolio of Investments (continued) | |
| November 30, 2013 (Unaudited) |
SCHEDULE OF SECURITIES SOLD SHORT | Shares | Value | ||||||
COMMON STOCKS - (25.16%) | ||||||||
Banks - (7.93%) | ||||||||
M&T Bank Corp. | (833,018 | ) | $ | (96,096,957 | ) | |||
MB Financial, Inc. | (21,362 | ) | (696,615 | ) | ||||
PacWest Bancorp | (1,844,652 | ) | (75,888,983 | ) | ||||
Umpqua Holdings Corp. | (2,807,542 | ) | (51,686,848 | ) | ||||
|
| |||||||
| (224,369,403 | ) | |||||||
|
| |||||||
Commercial Services - (1.20%) | ||||||||
Atlantia SpA | (1,339,487 | ) | (29,904,301 | ) | ||||
RR Donnelley & Sons Co. | (223,830 | ) | (4,140,855 | ) | ||||
|
| |||||||
| (34,045,156 | ) | |||||||
|
| |||||||
Diversified Financial Services - (0.39%) | ||||||||
IntercontinentalExchange Group, Inc. | (51,751 | ) | (11,037,971 | ) | ||||
|
| |||||||
Electrical Components & Equipment - (1.06%) | ||||||||
Schneider Electric SA | (353,817 | ) | (29,956,705 | ) | ||||
|
| |||||||
Food - (1.82%) | ||||||||
Loblaw Cos. Ltd. | (1,269,764 | ) | (51,541,030 | ) | ||||
|
| |||||||
Healthcare - Services - (0.06%) | ||||||||
Community Health Systems, Inc. | (38,564 | ) | (1,590,765 | ) | ||||
|
| |||||||
Insurance - (1.84%) | ||||||||
Fidelity National Financial, Inc., Class A | (1,787,488 | ) | (51,962,276 | ) | ||||
|
| |||||||
Oil & Gas - (1.54%) | ||||||||
Pioneer Natural Resources Co. | (244,366 | ) | (43,436,056 | ) | ||||
|
| |||||||
Pharmaceuticals - (7.82%) | ||||||||
Endo Health Solutions, Inc. | (1,214,309 | ) | (81,589,422 | ) | ||||
Knight Therapeutics | (945,434 | ) | (2,046,490 | ) | ||||
Perrigo Co. | (882,920 | ) | (137,638,399 | ) | ||||
|
| |||||||
| (221,274,311 | ) | |||||||
|
| |||||||
Real Estate Investment Trusts - (0.83%) | ||||||||
American Realty Capital Properties, Inc. | (838,804 | ) | (10,996,720 | ) | ||||
Dexus Property Group | (3,486,439 | ) | (3,316,338 | ) | ||||
GPT Group | (2,817,560 | ) | (9,181,563 | ) | ||||
|
| |||||||
| (23,494,621 | ) | |||||||
|
| |||||||
See Notes to Financial Statements. | ||
8 | www.arbitragefunds.com | 1-800-295-4485 |
Table of Contents
The Arbitrage Fund | Portfolio of Investments (continued) | |
| November 30, 2013 (Unaudited) |
SCHEDULE OF SECURITIES SOLD SHORT | Shares | Value | ||||||
| ||||||||
COMMON STOCKS (Continued)(25.16%) | ||||||||
Semiconductors - (0.67%) | ||||||||
Applied Materials, Inc. | (1,090,395) | $ | (18,863,833) | |||||
|
| |||||||
TOTAL COMMON STOCKS (Proceeds $659,991,398) | (711,572,127) | |||||||
|
| |||||||
EXCHANGE-TRADED FUNDS - (0.38%) | ||||||||
Equity Fund - (0.38%) | ||||||||
SPDR® S&P 500® ETF Trust | (59,541) | (10,776,921) | ||||||
|
| |||||||
TOTAL EXCHANGE-TRADED FUNDS (Proceeds $9,502,177) | (10,776,921) | |||||||
|
| |||||||
TOTAL SECURITIES SOLD SHORT (Proceeds $669,493,575) | (722,349,048) | |||||||
|
| |||||||
SCHEDULE OF WRITTEN OPTIONS | Expiration Date | Exercise Price | Contracts | Value | ||||||||||
| ||||||||||||||
Written Call Options | ||||||||||||||
Applied Materials, Inc.: | ||||||||||||||
| 12/2013 | $ | 17.00 | (2,631) | $ | (143,390) | |||||||||
| 12/2013 | 18.00 | (228) | (2,850) | |||||||||||
| 12/2013 | 19.00 | (162) | (243) | |||||||||||
Endo Health Solutions, Inc.: | ||||||||||||||
| 12/2013 | 55.00 | (3,458) | (4,132,310) | |||||||||||
| 12/2013 | 60.00 | (1,652) | (1,230,740) | |||||||||||
| 12/2013 | 65.00 | (322) | (106,260) | |||||||||||
Fidelity National Financial, Inc., Class A | 12/2013 | 28.00 | (420) | (50,400) | ||||||||||
MAKO Surgical Corp.: | ||||||||||||||
| 12/2013 | 30. 00 | (5) | (25) | |||||||||||
| 01/2014 | 30. 00 | (678) | (1,695) | |||||||||||
| 02/2014 | 30. 00 | (1,212) | (3,030) | |||||||||||
ViroPharma, Inc. | 12/2013 | 50. 00 | (53) | (132) | ||||||||||
|
| |||||||||||||
TOTAL WRITTEN CALL OPTIONS (Premiums received $1,657,179) | (5,671,075) | |||||||||||||
|
| |||||||||||||
Written Put Options | ||||||||||||||
Applied Materials, Inc.: | ||||||||||||||
| 12/2013 | 16. 00 | (152) | (760) | |||||||||||
| 12/2013 | 17. 00 | (2,632) | (63,168) | |||||||||||
See Notes to Financial Statements. | ||
Semi-Annual Report | November 30, 2013 | 9 |
Table of Contents
The Arbitrage Fund | Portfolio of Investments (continued) | |
| November 30, 2013 (Unaudited) |
SCHEDULE OF WRITTEN OPTIONS | Expiration Date | Exercise Price | Contracts | Value | ||||||||||
| ||||||||||||||
Written Put Options (Continued) | ||||||||||||||
Office Depot, Inc.: | ||||||||||||||
| 12/2013 | $ | 13.00 | (135) | $ | (1,350) | |||||||||
| 01/2014 | 11. 00 | (183) | (1,372) | |||||||||||
| 01/2014 | 12. 00 | (55) | (963) | |||||||||||
Santarus, Inc. | 12/2013 | 30. 00 | (193) | (965) | ||||||||||
|
| |||||||||||||
TOTAL WRITTEN PUT OPTIONS (Premiums received $125,198) | (68,578) | |||||||||||||
|
| |||||||||||||
TOTAL WRITTEN OPTIONS (Premiums received $1,782,377) | $ | (5,739,653) | ||||||||||||
|
| |||||||||||||
See Notes to Financial Statements. | ||
10 | www.arbitragefunds.com | 1-800-295-4485 |
Table of Contents
The Arbitrage Fund | Portfolio of Investments (continued) | |
| November 30, 2013 (Unaudited) |
EQUITY SWAP CONTRACTS
Swap Counterparty | Reference Obligation | Rate Paid/Received by the Fund | Termination Dates | Notional Amount | Unrealized Appreciation | |||||||||
| ||||||||||||||
Goldman, Sachs & Co. | Delcam Plc | LIBOR-BBA plus 0.85 bps | 11/27/2014 | $ | 424,368 | $ | 7 | |||||||
Goldman, Sachs & Co. | Life Technologies | 1 Month-LIBOR-BBA plus 0.50 bps | 06/25/2014 | 27,525,314 | 59,766 | |||||||||
Goldman, Sachs & Co. | Yancoal Australia | 1 Month-BBSW- REUTERS plus 0.50 bps | 05/07/2014 - 06/17/2014 | 11,453,046 | 361,675 | |||||||||
UBS | Life Technologies | 1 Month-LIBOR-BBA plus 1.10 bps | Monthly Reset | 3,306,034 | 17,121 | |||||||||
UBS | Yancoal Australia | 1 Month-BBSW- REUTERS plus 0.55 bps | Monthly Reset | 16,637,556 | 525,397 | |||||||||
|
| |||||||||||||
| $ | 59,346,318 | $ | 963,966 | |||||||||||
|
| |||||||||||||
Swap Counterparty | Reference Obligation | Rate Paid/Received by the Fund | Termination Dates | Notional Amount | Unrealized Depreciation | |||||||||
| ||||||||||||||
Goldman, Sachs & Co. | NV Energy, Inc. | 1 Month-LIBOR-BBA plus 0.50 bps | 12/03/2014 | $ | 4,035,562 | $ | (15,062) | |||||||
Goldman, Sachs & Co. | Yancoal Australia Ltd. | 1 Month-BBSW- REUTERS plus 0.50 bps | 06/11/2014 - 06/20/2014 | 774,977 | (31,848) | |||||||||
Goldman, Sachs & Co. | Yanzhou Coal | 1 Month-HIBOR- REUTERS minus 2.5 bps - 2.75 bps | 05/30/2014 - 06/13/2014 | (1,775,812) | (70,160) | |||||||||
UBS | Flinders Mines | 1 Month-BBSW- REUTERS plus 0.55 bps | Monthly Reset | 376,405 | (47,051) | |||||||||
UBS | Yancoal Australia | 1 Month-BBSW- REUTERS plus 0.55 bps | Monthly Reset | 3,322,755 | (136,552) | |||||||||
|
| |||||||||||||
| $ | 6,733,887 | $ | (300,673) | |||||||||||
|
| |||||||||||||
See Notes to Financial Statements. | ||
Semi-Annual Report | November 30, 2013 | 11 |
Table of Contents
The Arbitrage Fund | Portfolio of Investments (continued) | |
| November 30, 2013 (Unaudited) |
OUTSTANDING FORWARD FOREIGN CURRENCY EXCHANGE CONTRACTS
Contract Description | Contracts to Deliver/Receive | Purchase/ Sale Contract | Expiration Date | Current Value | Unrealized Appreciation | |||||||||||
AUD | 118,147,613 | Sale | 12/16/13 | 107,423,002 | $ | 1,928,486 | ||||||||||
CAD | 207,958,316 | Sale | 12/16/13 | 195,630,712 | 4,339,461 | |||||||||||
EUR | 8,590,000 | Sale | 12/16/13 | 11,672,057 | 135,356 | |||||||||||
EUR | 254,150,000 | Purchase | 12/16/13 | 345,337,994 | 1,459,482 | |||||||||||
HKD | 6,980,000 | Sale | 12/16/13 | 900,383 | 84 | |||||||||||
HKD | 99,800,000 | Purchase | 12/16/13 | 12,873,673 | 1,491 | |||||||||||
JPY | 534,036,000 | Sale | 12/16/13 | 5,213,793 | 121,566 | |||||||||||
NOK | 155,451,000 | Sale | 12/16/13 | 25,355,488 | 861,810 | |||||||||||
SEK | 23,024,000 | Sale | 12/16/13 | 3,508,764 | 12,910 | |||||||||||
CHF | 7,190,000 | Sale | 12/16/13 | 7,933,869 | 57,611 | |||||||||||
THB | 1,428,000,000 | Purchase | 12/16/13 | 44,436,446 | 47,264 | |||||||||||
THB | 295,250,000 | Sale | 12/16/13 | 9,187,578 | 128,192 | |||||||||||
|
| |||||||||||||||
| $ | 9,093,713 | |||||||||||||||
|
| |||||||||||||||
Contract Description | Contracts to Deliver/Receive | Purchase/ Sale Contract | Expiration Date | Current Value | Unrealized Depreciation | |||||||||||
AUD | 78,409,000 | Purchase | 12/16/13 | 71,291,581 | $ | (1,338,180) | ||||||||||
AUD | 1,400,000 | Sale | 12/16/13 | 1,272,918 | (4,314) | |||||||||||
GBP | 50,671,000 | Sale | 12/16/13 | 82,902,857 | (2,208,662) | |||||||||||
CAD | 84,320,000 | Purchase | 12/16/13 | 79,321,577 | (2,367,019) | |||||||||||
EUR | 274,361,197 | Sale | 12/16/13 | 372,800,886 | (6,629,544) | |||||||||||
EUR | 210,000 | Purchase | 12/16/13 | 285,347 | (3,958) | |||||||||||
HKD | 290,330,000 | Sale | 12/16/13 | 37,451,037 | (3,985) | |||||||||||
JPY | 9,636,000 | Purchase | 12/16/13 | 94,076 | (3,170) | |||||||||||
NOK | 155,451,000 | Purchase | 12/16/13 | 25,355,488 | (691,443) | |||||||||||
SEK | 23,024,000 | Purchase | 12/16/13 | 3,508,764 | (12,394) | |||||||||||
CHF | 2,370,000 | Sale | 12/16/13 | 2,615,197 | (10,343) | |||||||||||
THB | 1,787,424,000 | Sale | 12/16/13 | 55,620,987 | (214,168) | |||||||||||
THB | 470,300,000 | Purchase | 12/16/13 | 14,634,776 | (34,594) | |||||||||||
|
| |||||||||||||||
| $ | (13,521,774) | |||||||||||||||
|
| |||||||||||||||
See Notes to Financial Statements. | ||
12 | www.arbitragefunds.com | 1-800-295-4485 |
Table of Contents
The Arbitrage Fund | Portfolio of Investments (continued) | |
| November 30, 2013 (Unaudited) |
Country | % of Net Assets | |||
| ||||
Canada | 7.79% | |||
Great Britain | 3.95% | |||
Cayman Islands | 2.77% | |||
Australia | 1.78% | |||
Netherlands | 1.23% | |||
Italy | 1.05% | |||
Japan | 0.96% | |||
Switzerland | 0.37% | |||
Thailand | 0.20% | |||
Germany | 0.19% | |||
United States | 80.65% | |||
Liabilities in Excess of Other Assets | (0.94)% | |||
|
| |||
| 100.00% | ||||
|
| |||
Abbreviations:
AG - Aktiengesellschaft is a German term that refers to a corporation that is limited by shares, i.e., owned by shareholders
ADR - American Depositary Receipt
AUD - Australian Dollar
BBA - British Bankers Association
BBSW - Australian Bank Bill Swap Reference Rate
bps - Basis Points
CAD - Canadian Dollar
CHF - Swiss Franc
CPR - Conditional Prepayment Rate
CVR - Contingent Value Rights
ETF - Exchange-Traded Fund
EUR - Euro
GBP - British Pound
HIBOR - Hong Kong Interbank Offer Rate
HKD - Hong Kong Dollar
JPY - Japanese Yen
LIBOR - London Interbank Offered Rate
LP - Limited Partnership
Ltd. - Limited
NOK - Norwegian Krone
N.V. - Naamloze Vennootschap is the Dutch term for a public limited liability corporation
Pcl - Public Company Limited
Plc - Public Limited Liability
SA - Generally designates corporations in various countries, mostly those employing civil law. This translates literally in all languages mentioned as anonymous company
SEK - Swedish Krona
S&P - Standard & Poor’s
SpA - Societa per Azione
SPDR - Standard & Poor’s Depositary Receipt
THB - Thai Bhat
See Notes to Financial Statements. | ||
Semi-Annual Report | November 30, 2013 | 13 |
Table of Contents
The Arbitrage Fund | ||
| November 30, 2013 (Unaudited) |
The following is a summary of the inputs used as of November 30, 2013, in valuing the Arbitrage Fund’s investments carried at value:
Investments in Securities at Value
| Level 1 | Level 2 | Level 3 | Total | |||||||||||||
Assets | ||||||||||||||||
Common Stocks | ||||||||||||||||
Aerospace & Defense | $ | – | $ | – | $ | 1,959,371 | $ | 1,959,371 | ||||||||
Auto Parts & Equipment | 2,513,333 | – | – | 2,513,333 | ||||||||||||
Banks | 152,828,832 | – | – | 152,828,832 | ||||||||||||
Coal | 1,098,236 | – | – | 1,098,236 | ||||||||||||
Commercial Services | 220,727,558 | – | – | 220,727,558 | ||||||||||||
Cosmetics & Personal Care | 25,394,337 | – | – | 25,394,337 | ||||||||||||
Diversified Financial Services | 10,985,715 | – | – | 10,985,715 | ||||||||||||
Electric | 173,259,167 | – | – | 173,259,167 | ||||||||||||
Electrical Components & Equipment | 132,028,436 | – | – | 132,028,436 | ||||||||||||
Engineering & Construction | 29,767,054 | – | – | 29,767,054 | ||||||||||||
Food | 111,873,254 | – | – | 111,873,254 | ||||||||||||
Healthcare - Products | 217,185,729 | – | – | 217,185,729 | ||||||||||||
Healthcare - Services | 7,271,207 | – | – | 7,271,207 | ||||||||||||
Holding Companies - Diversified | 2,499,699 | – | – | 2,499,699 | ||||||||||||
Iron & Steel | 623,517 | – | – | 623,517 | ||||||||||||
Media | 50,819,947 | – | – | 50,819,947 | ||||||||||||
Mining | 10,779,366 | – | – | 10,779,366 | ||||||||||||
Miscellaneous Manufacturing | 111,564,065 | – | – | 111,564,065 | ||||||||||||
Oil & Gas | 56,546,474 | – | – | 56,546,474 | ||||||||||||
Pharmaceuticals | 466,340,931 | – | – | 466,340,931 | ||||||||||||
Real Estate Investment Trusts | 48,938,677 | – | – | 48,938,677 | ||||||||||||
Retail | 122,669,566 | – | – | 122,669,566 | ||||||||||||
Savings & Loans | 92,597,956 | – | – | 92,597,956 | ||||||||||||
Semiconductors | 25,345,663 | – | – | 25,345,663 | ||||||||||||
Software | 34,725,551 | – | – | 34,725,551 | ||||||||||||
Telecommunications | 51,173,161 | – | – | 51,173,161 | ||||||||||||
Limited Partnerships | 43,558,782 | – | – | 43,558,782 | ||||||||||||
Rights | 3,696,317 | – | 580,261 | 4,276,578 | ||||||||||||
Purchased Options | 356,450 | – | – | 356,450 | ||||||||||||
Short-Term Investments | 645,521,654 | – | – | 645,521,654 | ||||||||||||
| ||||||||||||||||
TOTAL | $ | 2,852,690,634 | $ | – | $ | 2,539,632 | $ | 2,855,230,266 | ||||||||
| ||||||||||||||||
See Notes to Financial Statements. | ||
14 | www.arbitragefunds.com | 1-800-295-4485 |
Table of Contents
The Arbitrage Fund | ||
| November 30, 2013 (Unaudited) |
Investments in Securities at Value (Continued)
| Level 1 | Level 2 | Level 3 | Total | |||||||||||||
Other Financial Instruments* | ||||||||||||||||
Assets | ||||||||||||||||
Forward Foreign Currency Exchange Contracts | $ | – | $ | 9,093,713 | $ | – | $ | 9,093,713 | ||||||||
Equity Swaps | 963,966 | – | – | 963,966 | ||||||||||||
Liabilities | ||||||||||||||||
Common Stocks** | (709,525,637 | ) | – | (2,046,490 | ) | (711,572,127 | ) | |||||||||
Exchange-Traded Funds | (10,776,921 | ) | – | – | (10,776,921 | ) | ||||||||||
Written Options | (5,739,653 | ) | – | – | (5,739,653 | ) | ||||||||||
Forward Foreign Currency Exchange Contracts | – | (13,521,774 | ) | – | (13,521,774 | ) | ||||||||||
Equity Swaps | (300,673 | ) | – | – | (300,673 | ) | ||||||||||
| ||||||||||||||||
TOTAL | $ | (725,378,918 | ) | $ | (4,428,061 | ) | $ | (2,046,490 | ) | $ | (731,853,469 | ) | ||||
| ||||||||||||||||
* | Other financial instruments are instruments such as written options, securities sold short, equity swaps and forward foreign currency exchange contracts. |
** | Refer to Portfolio of Investments for sector information. |
See Notes to Financial Statements. | ||
Semi-Annual Report | November 30, 2013 | 15 |
Table of Contents
The Arbitrage Fund | ||
| November 30, 2013 (Unaudited) |
The following is a reconciliation of the fair valuations using significant unobservable inputs (Level 3) for the Fund’s assets and liabilities during the six months ended November 30, 2013:
Investments in Securities | Balance as of May 31, 2013 | Realized Gain | Change in Unrealized Appreciation | Purchases | Sales Proceeds | Transfer into Level 3 | Transfer out of Level 3 | Balance as of November 30, 2013 | Net change in unrealized appreciation included in the Statements of Operations attributable to Level 3 investments held at November 30, 2013 | |||||||||||||||||||||||||||
Common Stocks | $ | 796,638 | $ | – | $ | 1,162,733 | $ | – | $ | – | $ | – | $ | – | $ | 1,959,371 | $ | 1,162,733 | ||||||||||||||||||
Rights | 0 | – | 580,261 | 0 | – | – | – | 580,261 | 580,261 | |||||||||||||||||||||||||||
| ||||||||||||||||||||||||||||||||||||
Total | $ | 796,638 | $ | – | $ | 1,742,994 | $ | – | $ | – | $ | – | $ | – | $ | 2,539,632 | $ | 1,742,994 | ||||||||||||||||||
| ||||||||||||||||||||||||||||||||||||
Other Financial Instruments | Balance as of May 31, 2013 | Realized Gain | Change in Unrealized Appreciation | Purchases | Sales Proceeds | Transfer into Level 3 | Transfer out of Level 3 | Balance as of 2013 | Net change in unrealized appreciation included in the Statements of Operations attributable to Level 3 investments held at November 30, 2013 | |||||||||||||||||||||||||||
Common Stocks | $ | – | $ | – | $ | (79,755) | $ | (1,966,735) | $ | – | $ | – | $ | – | $ | (2,046,490) $ | (79,755) | |||||||||||||||||||
| ||||||||||||||||||||||||||||||||||||
Total | $ | – | $ | – | $ | (79,755) | $ | (1,966,735) | $ | – | $ | – | $ | – | $ | (2,046,490) $ | (79,755) | |||||||||||||||||||
| ||||||||||||||||||||||||||||||||||||
See Notes to Financial Statements. | ||
16 | www.arbitragefunds.com | 1-800-295-4485 |
Table of Contents
| Portfolio Information | ||
| November 30, 2013 (Unaudited) |
Performance (annualized returns as of November 30, 2013)
| One Year | Since Inception* | |||
Arbitrage Event-Driven Fund, Class R | 7.15% | 3.71% | ||
Arbitrage Event-Driven Fund, Class I | 7.34% | 3.95% | ||
Arbitrage Event-Driven Fund, Class C** | 5.33% | 3.75% | ||
Arbitrage Event-Driven Fund, Class A*** | N/A | 0.30% | ||
HFRI Event Driven Index | 13.20% | 6.63% | ||
Barclays Capital US Aggregate Bond Index | -1.61% | 2.85% |
Current performance may be higher or lower than performance quoted above. Any performance data quoted represents past performance, and the investment return and principal value of an investment in the Fund will fluctuate so that an investor’s shares, when redeemed, may be worth more or less than their original cost. Past performance is no guarantee of future results. Returns do not reflect a 2% redemption fee for shares that are redeemed from the fund within 30 days of purchase, which, if reflected, would reduce the performance quoted. Returns shown above include the reinvestment of all dividends and capital gains. Contractual fee waivers are currently in effect. Without such fee waivers, performance numbers would be reduced. You can obtain performance data current to the most recent month end by calling 1-800-295-4485 or going to www.arbitragefunds.com.
* Class R and Class I inception: 10/1/10; Class C inception: 6/1/12; Class A inception: 6/1/13.
** Class C shares are subject to a 1.00% contingent deferred sales charge on all purchases redeemed in 12 months of purchase.
*** Class A shares are subject to a maximum front-end sales load of 3.25% on purchases. The shares are also subject to a deferred sales charge of up to 1.00% on purchases of $500,000 or more purchased without a front-end sales load and redeemed within 18 months of purchase.
The Total Annual Fund Operating Expenses for Class R, Class I, Class C and Class A are 2.55%, 2.30%, 3.30% and 2.55%, respectively. The Advisor has agreed to waive fees in excess of 1.69%, 1.44%, 2.44% and 1.69% for Class R, Class I, Class C and Class A, respectively, until at least August 31, 2015.
The HFRI Event Driven Index is an index of companies currently or prospectively involved in corporate transactions of a wide variety including but not limited to mergers, restructurings, financial distress, tender offers, shareholder buybacks, debt exchanges, security issuance or other capital structure adjustments. Security types can range from most senior in the capital structure to most junior or subordinated and frequently involve additional derivative securities. Event-Driven exposure includes a combination of sensitivities to equity markets, credit markets and idiosyncratic, company-specific developments.
The Barclays Capital U.S. Aggregate Bond Index is a market value-weighted index of investment-grade fixed-rated debt issues, including government, corporate, asset-backed and mortgage-backed securities with a maturity of one year or more.
An investor may not invest directly in an index.
Semi-Annual Report | November 30, 2013 | 17 |
Table of Contents
The Arbitrage Event-Driven Fund | Portfolio Information (continued) | |
| November 30, 2013 (Unaudited) |
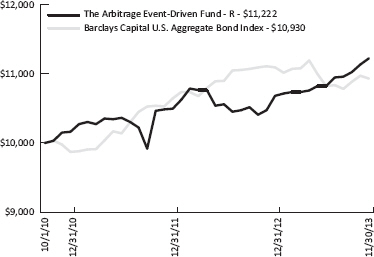
Growth of $10,000 Investment
| The chart represents historical performance of a hypothetical investment of $10,000 in the Class R shares of the Fund since inception. Past performance does not guarantee future results. This chart does not reflect the deduction of taxes that a shareholder would pay on Fund distributions or the redemption of Fund shares. |
Sector Weighting
The following chart shows the sector weightings of the Arbitrage Event-Driven Fund’s investments in common stock, corporate bonds, convertible corporate bonds and exchange-traded funds as of the report date.
18 | www.arbitragefunds.com | 1-800-295-4485 |
Table of Contents
The Arbitrage Event-Driven Fund | Portfolio of Investments | |
| November 30, 2013 (Unaudited) |
| Shares | Value | |||||||
COMMON STOCKS - 54.16% | ||||||||
Aerospace & Defense - 0.02% | ||||||||
Allied Defense Group, Inc.(a)(b)(c) | 5,000 | $ | 24,595 | |||||
|
| |||||||
Apparel - 0.27% | ||||||||
Jones Group, Inc. | 23,357 | 327,932 | ||||||
|
| |||||||
Auto Parts & Equipment - 0.06% | ||||||||
Cooper Tire & Rubber Co.(d) | 2,711 | 66,691 | ||||||
|
| |||||||
Banks - 2.82% | ||||||||
Bank of Ayudhya Pcl | 163,436 | 197,233 | ||||||
CapitalSource, Inc.(e) | 172,943 | 2,431,578 | ||||||
Sterling Financial Corp. | 23,895 | 780,172 | ||||||
|
| |||||||
| 3,408,983 | ||||||||
|
| |||||||
Coal - 0.81% | ||||||||
CONSOL Energy, Inc.(d) | 12,911 | 459,373 | ||||||
Peabody Energy Corp. | 12,052 | 219,347 | ||||||
Walter Energy, Inc. | 18,078 | 257,250 | ||||||
Whitehaven Coal Ltd.(a) | 25,954 | 38,272 | ||||||
|
| |||||||
| 974,242 | ||||||||
|
| |||||||
Commercial Services - 3.00% | ||||||||
Lender Processing Services, Inc. | 70,719 | 2,482,944 | ||||||
Mac-Gray Corp. | 53,764 | 1,145,173 | ||||||
|
| |||||||
| 3,628,117 | ||||||||
|
| |||||||
Diversified Financial Services - 1.35% | ||||||||
IntercontinentalExchange Group, Inc. | 1,147 | 244,644 | ||||||
Outerwall, Inc.(a)(d) | 20,338 | 1,391,119 | ||||||
|
| |||||||
| 1,635,763 | ||||||||
|
| |||||||
Electric - 3.53% | ||||||||
NRG Energy, Inc.(d) | 35,192 | 931,180 | ||||||
NV Energy, Inc.(e) | 141,130 | 3,337,725 | ||||||
|
| |||||||
| 4,268,905 | ||||||||
|
| |||||||
Electrical Components & Equipment - 2.42% | ||||||||
Molex, Inc., Class A | 75,537 | 2,917,239 | ||||||
|
| |||||||
Food - 1.41% | ||||||||
Harris Teeter Supermarkets, Inc.(e) | 34,594 | 1,708,252 | ||||||
|
| |||||||
See Notes to Financial Statements. | ||
Semi-Annual Report | November 30, 2013 | 19 |
Table of Contents
The Arbitrage Event-Driven Fund | Portfolio of Investments (continued) | |
| November 30, 2013 (Unaudited) |
| Shares | Value | |||||||
COMMON STOCKS - 54.16% (Continued) | ||||||||
Gas - 0.17% | ||||||||
Envestra Ltd. | 210,488 | $ | 202,134 | |||||
|
| |||||||
Healthcare - Products - 3.89% | ||||||||
Life Technologies Corp.(a)(e) | 45,122 | 3,415,735 | ||||||
MAKO Surgical Corp.(a)(d) | 42,934 | 1,286,303 | ||||||
|
| |||||||
| 4,702,038 | ||||||||
|
| |||||||
Household Products & Wares - 0.35% | ||||||||
Costa, Inc.(a) | 19,029 | 416,735 | ||||||
|
| |||||||
Insurance - 1.57% | ||||||||
Assured Guaranty Ltd.(d) | 30,958 | 726,894 | ||||||
Genworth Financial, Inc., Class A(a)(d) | 77,300 | 1,168,003 | ||||||
|
| |||||||
| 1,894,897 | ||||||||
|
| |||||||
Machinery - Diversified - 0.74% | ||||||||
MAN SE | 1,064 | 129,353 | ||||||
Manitowoc Co., Inc.(d) | 37,024 | 762,324 | ||||||
|
| |||||||
| 891,677 | ||||||||
|
| |||||||
Media - 2.27% | ||||||||
Belo Corp., Class A(e) | 132,330 | 1,816,891 | ||||||
Charter Communications, Inc., Class A(a) | 1,126 | 152,123 | ||||||
Time Warner Cable, Inc. | 5,614 | 775,967 | ||||||
|
| |||||||
| 2,744,981 | ||||||||
|
| |||||||
Mining - 0.48% | ||||||||
Nevada Copper Corp.(a) | 6,725 | 9,177 | ||||||
Stillwater Mining Co.(a) | 42,774 | 480,352 | ||||||
Yancoal Australia Ltd., CVR(a) | 31,533 | 84,387 | ||||||
|
| |||||||
| 573,916 | ||||||||
|
| |||||||
Miscellaneous Manufacturing - 1.72% | ||||||||
Ingersoll-Rand Plc | 11,640 | 831,329 | ||||||
Invensys Plc | 152,686 | 1,250,459 | ||||||
|
| |||||||
| 2,081,788 | ||||||||
|
| |||||||
Oil & Gas - 3.64% | ||||||||
Berry Petroleum Co., Class A | 3,082 | 155,086 | ||||||
Coastal Energy Co.(a) | 126,353 | 2,239,167 | ||||||
Gulf Coast Ultra Deep Royalty Trust(a) | 21,724 | 48,445 | ||||||
Ithaca Energy, Inc.(a) | 82,151 | 197,926 | ||||||
Noble Corp. Plc | 17,782 | 677,850 | ||||||
See Notes to Financial Statements. | ||
20 | www.arbitragefunds.com | 1-800-295-4485 |
Table of Contents
The Arbitrage Event-Driven Fund | Portfolio of Investments (continued) | |
| November 30, 2013 (Unaudited) |
| Shares | Value | |||||||
COMMON STOCKS - 54.16% (Continued) | ||||||||
Oil & Gas - 3.64% (Continued) | ||||||||
Talisman Energy, Inc.(d) | 71,647 | $ | 838,146 | |||||
TORC Oil & Gas Ltd. | 24,082 | 233,669 | ||||||
|
| |||||||
| 4,390,289 | ||||||||
|
| |||||||
Oil & Gas Services - 0.61% | ||||||||
Oil States International, Inc.(a) | 7,151 | 731,905 | ||||||
|
| |||||||
Pharmaceuticals - 11.02% | ||||||||
Acino Holding AG(a) | 3,520 | 447,379 | ||||||
Actavis Plc(a)(d) | 5,179 | 844,539 | ||||||
Algeta ASA | 2,097 | 120,819 | ||||||
Atrium Innovations, Inc.(a) | 5,155 | 117,650 | ||||||
Celesio AG | 8,952 | 287,071 | ||||||
Elan Corp. Plc, Sponsored ADR(a)(e) | 156,945 | 2,837,566 | ||||||
McKesson Corp. | 1,007 | 167,051 | ||||||
Paladin Labs, Inc.(a) | 37,687 | 4,114,340 | ||||||
Santarus, Inc.(a)(d) | 63,897 | 2,056,205 | ||||||
ViroPharma, Inc.(a)(d) | 46,860 | 2,320,039 | ||||||
|
| |||||||
| 13,312,659 | ||||||||
|
| |||||||
Real Estate Investment Trusts - 0.80% | ||||||||
Cole Real Estate Investment, Inc. | 29,968 | 428,842 | ||||||
Commonwealth Property Office Fund | 469,421 | 542,659 | ||||||
|
| |||||||
| 971,501 | ||||||||
|
| |||||||
Retail - 3.50% | ||||||||
Aeropostale, Inc.(a) | 1,855 | 19,143 | ||||||
Office Depot, Inc.(a)(d) | 70,865 | 385,506 | ||||||
Shoppers Drug Mart Corp. | 69,646 | 3,823,959 | ||||||
|
| |||||||
| 4,228,608 | ||||||||
|
| |||||||
Savings & Loans - 1.93% | ||||||||
Hudson City Bancorp, Inc.(e) | 249,897 | 2,334,038 | ||||||
|
| |||||||
Semiconductors - 0.90% | ||||||||
Applied Materials, Inc.(d) | 2,220 | 38,406 | ||||||
Mindspeed Technologies, Inc.(a) | 77,405 | 389,347 | ||||||
Tokyo Electron Ltd. | 12,117 | 656,444 | ||||||
|
| |||||||
| 1,084,197 | ||||||||
|
| |||||||
Software - 0.23% | ||||||||
Activision Blizzard, Inc.(d) | 16,427 | 282,709 | ||||||
|
| |||||||
See Notes to Financial Statements. | ||
Semi-Annual Report | November 30, 2013 | 21 |
Table of Contents
The Arbitrage Event-Driven Fund | Portfolio of Investments (continued) | |
| November 30, 2013 (Unaudited) |
| Shares | Value | |||||||
COMMON STOCKS - 54.16% (Continued) | ||||||||
Telecommunications - 4.23% | ||||||||
Anaren, Inc.(a) | 50,986 | $ | 1,421,999 | |||||
Corning, Inc. | 43,432 | 741,819 | ||||||
Globalstar, Inc.(a) | 179,547 | 319,594 | ||||||
Leap Wireless International, Inc.(a) | 35,127 | 583,459 | ||||||
Verizon Communications, Inc.(e) | 41,031 | 2,035,958 | ||||||
|
| |||||||
| 5,102,829 | ||||||||
|
| |||||||
Transportation - 0.42% | ||||||||
Fred Olsen Production ASA | 336,219 | 504,862 | ||||||
|
| |||||||
TOTAL COMMON STOCKS (Cost $62,827,653) | 65,412,482 | |||||||
|
| |||||||
LIMITED PARTNERSHIPS - 0.20% | ||||||||
Oil & Gas - 0.20% | ||||||||
Pioneer Southwest Energy Partners LP | 5,900 | 243,080 | ||||||
|
| |||||||
TOTAL LIMITED PARTNERSHIPS (Cost $258,021) | 243,080 | |||||||
|
| |||||||
PREFERRED STOCKS - 0.49% | ||||||||
Banks - 0.27% | ||||||||
GMAC Capital Trust I, 8.125%(f) | 12,067 | 323,878 | ||||||
|
| |||||||
Financial Services - 0.22% | ||||||||
Citigroup Capital IX, 6.000% | 10,617 | 265,107 | ||||||
|
| |||||||
TOTAL PREFERRED STOCKS (Cost $549,005) | 588,985 | |||||||
|
| |||||||
RIGHTS - 0.22% | ||||||||
BMC Software, Inc., CVR(a)(b)(c) | 49,764 | 4,140 | ||||||
Cubist Pharmaceuticals, Inc., CPR(a)(b)(c) | 34,500 | 12,151 | ||||||
Cubist Pharmaceuticals, Inc., CVR(a) | 121,577 | 200,602 | ||||||
Sanofi, CVR(a) | 52,998 | 31,799 | ||||||
Trius Therapeutics, CVR(a)(b)(c) | 103,378 | 15,228 | ||||||
|
| |||||||
TOTAL RIGHTS (Cost $303,585) | 263,920 | |||||||
|
| |||||||
See Notes to Financial Statements. | ||
22 | www.arbitragefunds.com | 1-800-295-4485 |
Table of Contents
The Arbitrage Event-Driven Fund | Portfolio of Investments (continued) | |
| November 30, 2013 (Unaudited) |
| Maturity Date | Rate | Principal Amount | Value | |||||||||||||
BANK LOANS - 6.77% | ||||||||||||||||
Chesapeake Energy Co.(f) | 12/02/2017 | 2.250% | $ | 2,700,000 | $ | 2,760,601 | ||||||||||
FairPoint Communications, Inc.(f) | 02/13/2013 | 7.500% | 2,700,000 | 2,773,913 | ||||||||||||
Zayo Bandwidth LLC(a) | 06/16/2012 | 4.500% | 2,640,000 | 2,644,646 | ||||||||||||
TOTAL BANK LOANS (Cost $8,188,128) | 8,179,160 | |||||||||||||||
|
| |||||||||||||||
CORPORATE BONDS - 24.13% | ||||||||||||||||
Banks - 1.99% | ||||||||||||||||
Fifth Third Capital Trust IV(f) | 04/15/2037 | 6.500% | 2,405,000 | 2,401,994 | ||||||||||||
|
| |||||||||||||||
Chemicals - 0.35% | ||||||||||||||||
NOVA Chemicals Corp. | 11/01/2019 | 8.625% | 385,000 | 424,463 | ||||||||||||
|
| |||||||||||||||
Commercial Services - 0.38% | ||||||||||||||||
United Rentals North America, Inc. | 09/15/2020 | 8.375% | 407,000 | 453,805 | ||||||||||||
|
| |||||||||||||||
Diversified Financial Services - 0.99% | ||||||||||||||||
Icahn Enterprises LP / Icahn Enterprises Finance Corp. | 01/15/2016 | 7.750% | 1,162,000 | 1,191,050 | ||||||||||||
|
| |||||||||||||||
Electric - 0.08% | ||||||||||||||||
NRG Energy, Inc.(d) | 06/15/2019 | 8.500% | 95,000 | 103,312 | ||||||||||||
|
| |||||||||||||||
Electrical Components & Equipment - 0.41% | ||||||||||||||||
Coleman Cable, Inc. | 02/15/2018 | 9.000% | 466,000 | 491,630 | ||||||||||||
|
| |||||||||||||||
Energy - Alternate Sources - 1.07% | ||||||||||||||||
First Wind Capital LLC(g) | 06/01/2018 | 10.250% | 1,181,000 | 1,293,195 | ||||||||||||
|
| |||||||||||||||
Financial Services - 0.22% | ||||||||||||||||
Marina District Finance Co., Inc. | 08/15/2018 | 9.875% | 245,000 | 267,050 | ||||||||||||
|
| |||||||||||||||
Healthcare - Products - 0.48% | ||||||||||||||||
Alere, Inc. | 10/01/2018 | 8.625% | 537,000 | 582,645 | ||||||||||||
|
| |||||||||||||||
See Notes to Financial Statements. | ||
Semi-Annual Report | November 30, 2013 | 23 |
Table of Contents
The Arbitrage Event-Driven Fund | Portfolio of Investments (continued) | |
| November 30, 2013 (Unaudited) |
| Maturity Date | Rate | Principal Amount | Value | |||||||||||||
CORPORATE BONDS - 24.13% (Continued) | ||||||||||||||||
Healthcare - Services - 0.63% | ||||||||||||||||
Health Management Associates, Inc.(e) | 04/15/2016 | 6.125% | $ | 689,000 | $ | 763,067 | ||||||||||
|
| |||||||||||||||
Household Products & Wares - 1.01% | ||||||||||||||||
American Achievement Corp.(g) | 04/15/2016 | 10.875% | 1,147,000 | 1,217,254 | ||||||||||||
|
| |||||||||||||||
Lodging - 1.06% | ||||||||||||||||
Marina District Finance Co., Inc. | 10/15/2015 | 9.500% | 1,222,000 | 1,283,100 | ||||||||||||
|
| |||||||||||||||
Media - 4.42% | ||||||||||||||||
Allbritton Communications Co.(e) | 05/15/2018 | 8.000% | 1,269,000 | 1,354,657 | ||||||||||||
Entercom Radio LLC | 12/01/2019 | 10.500% | 411,000 | 467,513 | ||||||||||||
Local TV Finance LLC(g) | 06/15/2015 | 9.250% | 797,000 | 804,970 | ||||||||||||
Media General, Inc.(e) | 02/15/2017 | 11.750% | 1,042,000 | 1,127,965 | ||||||||||||
Reader’s Digest Association, Inc.(c)(f)(h) | 02/15/2017 | 9.500% | 274,000 | 106,860 | ||||||||||||
Univision Communications, Inc.(g) | 05/15/2021 | 8.500% | 208,000 | 230,360 | ||||||||||||
YPG Financing, Inc.(g) | 11/30/2018 | 9.250% | 1,275,285 | 1,242,219 | ||||||||||||
|
| |||||||||||||||
| 5,334,544 | ||||||||||||||||
|
| |||||||||||||||
Mining - 0.43% | ||||||||||||||||
Midwest Vanadium Pty Ltd.(g) | 02/15/2018 | 11.500% | 630,000 | 522,900 | ||||||||||||
|
| |||||||||||||||
Oil & Gas - 4.25% | ||||||||||||||||
Chaparral Energy, Inc. | 09/01/2021 | 8.250% | 621,000 | 681,548 | ||||||||||||
Endeavour International Corp: | ||||||||||||||||
| 03/01/2018 | 12.000% | 598,000 | 621,920 | |||||||||||||
| 06/01/2018 | 12.000% | 730,000 | 700,800 | |||||||||||||
Forest Oil Corp. | 06/15/2019 | 7.250% | 838,000 | 831,715 | ||||||||||||
Newfield Exploration Co. | 05/15/2018 | 7.125% | 1,332,000 | 1,386,945 | ||||||||||||
Offshore Group Investment Ltd. | 11/01/2019 | 7.500% | 261,000 | 283,185 | ||||||||||||
Southern Pacific Resource Corp.(g) | 01/25/2018 | 8.750% | 774,000 | 622,813 | ||||||||||||
|
| |||||||||||||||
| 5,128,926 | ||||||||||||||||
|
| |||||||||||||||
See Notes to Financial Statements. | ||
24 | www.arbitragefunds.com | 1-800-295-4485 |
Table of Contents
The Arbitrage Event-Driven Fund | Portfolio of Investments (continued) | |
| November 30, 2013 (Unaudited) |
| Maturity Date | Rate | Principal Amount | Value | |||||||||||||
CORPORATE BONDS - 24.13% (Continued) | ||||||||||||||||
Oil & Gas Services - 0.74% | ||||||||||||||||
Oil States International, Inc.: | ||||||||||||||||
| 06/01/2019 | 6.500% | $ | 359,000 | $ | 381,886 | |||||||||||
| 01/15/2023 | 5.125% | 458,000 | 514,105 | |||||||||||||
|
| |||||||||||||||
| 895,991 | ||||||||||||||||
|
| |||||||||||||||
Packaging & Containers - 0.64% | ||||||||||||||||
ARD Finance SA, PIK(g) | 06/01/2018 | 11.125% | 288,185 | 308,358 | ||||||||||||
Packaging Dynamics Corp.(g) | 02/01/2016 | 8.750% | 457,000 | 470,710 | ||||||||||||
|
| |||||||||||||||
| 779,068 | ||||||||||||||||
|
| |||||||||||||||
Pipelines - 0.51% | ||||||||||||||||
Copano Energy LLC / Copano Energy Finance Corp. | 04/01/2021 | 7.125% | 536,000 | 615,829 | ||||||||||||
|
| |||||||||||||||
Retail - 0.22% | ||||||||||||||||
Brown Shoe Co., Inc. | 05/15/2019 | 7.125% | 252,000 | 267,120 | ||||||||||||
|
| |||||||||||||||
Semiconductors - 1.49% | ||||||||||||||||
SunEdison, Inc.(e) | 04/01/2019 | 7.750% | 1,721,000 | 1,798,445 | ||||||||||||
|
| |||||||||||||||
Telecommunications - 1.70% | ||||||||||||||||
Cincinnati Bell, Inc. | 03/15/2018 | 8.750% | 539,000 | 569,319 | ||||||||||||
Clearwire Communications LLC / Clearwire Finance, Inc.(e)(g) | 12/01/2015 | 12.000% | 841,000 | 866,230 | ||||||||||||
Nortel Networks Ltd.(h) | 07/15/2016 | 10.750% | 301,000 | 345,397 | ||||||||||||
Sprint Communications, Inc. | 04/15/2022 | 9.250% | 226,000 | 268,375 | ||||||||||||
|
| |||||||||||||||
| 2,049,321 | ||||||||||||||||
|
| |||||||||||||||
Trucking & Leasing - 1.06% | ||||||||||||||||
Maxim Crane Works LP / Maxim Finance Corp.(g) | 04/15/2015 | 12.250% | 1,234,000 | 1,281,817 | ||||||||||||
|
| |||||||||||||||
TOTAL CORPORATE BONDS (Cost $29,306,743) | 29,146,526 | |||||||||||||||
|
| |||||||||||||||
See Notes to Financial Statements. | ||
Semi-Annual Report | November 30, 2013 | 25 |
Table of Contents
The Arbitrage Event-Driven Fund | Portfolio of Investments (continued) | |
| November 30, 2013 (Unaudited) |
| Maturity Date | Rate | Principal Amount | Value | |||||||||||||
CONVERTIBLE CORPORATE BONDS - 3.96% | ||||||||||||||||
Commercial Services - 0.73% | ||||||||||||||||
Stewart Enterprises, Inc. | 07/15/2016 | 3.375% | $ | 675,000 | $ | 880,453 | ||||||||||
|
| |||||||||||||||
Iron & Steel - 0.38% | ||||||||||||||||
United States Steel Corp. | 05/15/2014 | 4.000% | 440,000 | 460,075 | ||||||||||||
|
| |||||||||||||||
Lodging - 0.71% | ||||||||||||||||
Morgans Hotel Group Co. | 10/15/2014 | 2.375% | 892,000 | 860,780 | ||||||||||||
|
| |||||||||||||||
Media - 0.02% | ||||||||||||||||
YPG Financing, Inc., PIK | 11/30/2022 | 8.000% | 17,710 | 17,084 | ||||||||||||
|
| |||||||||||||||
Oil & Gas - 1.07% | ||||||||||||||||
Petrominerales Ltd. | 06/12/2017 | 3.250% | 1,300,000 | 1,289,210 | ||||||||||||
|
| |||||||||||||||
Semiconductors - 0.27% | ||||||||||||||||
Rambus, Inc. | 06/15/2014 | 5.000% | 320,000 | 325,200 | ||||||||||||
|
| |||||||||||||||
Telecommunications - 0.78% | ||||||||||||||||
Globalstar, Inc., PIK | 04/01/2028 | 8.000% | 263,820 | 635,312 | ||||||||||||
Nortel Networks Corp.(h) | 04/15/2014 | 2.125% | 316,000 | 311,260 | ||||||||||||
|
| |||||||||||||||
| 946,572 | ||||||||||||||||
|
| |||||||||||||||
TOTAL CONVERTIBLE CORPORATE BONDS (Cost $4,178,746) | 4,779,374 | |||||||||||||||
|
| |||||||||||||||
Expiration Date | Exercise Price | Contracts | Value | |||||||||||||
PURCHASED OPTIONS (a)- 0.05% | ||||||||||||||||
Put Options Purchased - 0.05% | ||||||||||||||||
Actavis Plc | 01/2014 | $145.00 | 43 | $ | 3,010 | |||||||||||
Activision Blizzard, Inc. | 01/2014 | 15.00 | 164 | 1,640 | ||||||||||||
Applied Materials, Inc. | 01/2014 | 16.00 | 13 | 234 | ||||||||||||
BlackBerry Ltd.: | ||||||||||||||||
| 01/2014 | 5.00 | 161 | 1,932 | |||||||||||||
| 01/2014 | 6.00 | 217 | 7,487 | |||||||||||||
| 01/2014 | 7.00 | 177 | 16,992 | |||||||||||||
Cooper Tire & Rubber Co. | 01/2014 | 24.00 | 35 | 5,600 | ||||||||||||
Endo Health Solutions, Inc. | 12/2013 | 50.00 | 59 | 295 | ||||||||||||
Genworth Financial, Inc., Class A: | ||||||||||||||||
| 12/2013 | 12.00 | 92 | 92 | |||||||||||||
| 12/2013 | 13.00 | 92 | 322 | |||||||||||||
See Notes to Financial Statements. | ||
26 | www.arbitragefunds.com | 1-800-295-4485 |
Table of Contents
The Arbitrage Event-Driven Fund | Portfolio of Investments (continued) | |
| November 30, 2013 (Unaudited) |
| Expiration Date | Exercise Price | Contracts | Value | |||||||||||||
PURCHASED OPTIONS (a)- 0.05% (Continued) | ||||||||||||||||
Put Options Purchased (Continued) | ||||||||||||||||
MAKO Surgical Corp. | 01/2014 | $20.00 | 350 | $ | 875 | |||||||||||
Office Depot, Inc.: | ||||||||||||||||
| 01/2014 | 11.00 | 140 | 1,050 | |||||||||||||
| 01/2014 | 12.00 | 85 | 1,487 | |||||||||||||
Outerwall, Inc. | 01/2014 | 60.00 | 207 | 23,288 | ||||||||||||
ViroPharma, Inc. | 01/2014 | 40.00 | 76 | 950 | ||||||||||||
|
| |||||||||||||||
TOTAL PUT OPTIONS PURCHASED (Cost $105,524) | 65,254 | |||||||||||||||
|
| |||||||||||||||
TOTAL PURCHASED OPTIONS (Cost $105,524) | 65,254 | |||||||||||||||
|
| |||||||||||||||
| Yield | Shares | Value | ||||||||||||||
SHORT-TERM INVESTMENTS - 13.62% | ||||||||||||||||
Time Deposits | ||||||||||||||||
Euro Time Deposit | 0.010% | 16,443,216 | 16,443,216 | |||||||||||||
|
| |||||||||||||||
TOTAL SHORT-TERM INVESTMENTS (Cost $16,443,216) | 16,443,216 | |||||||||||||||
|
| |||||||||||||||
Total Investments - 103.60% (Cost $122,160,621) | $ | 125,121,997 | ||||||||||||||
Liabilities in Excess of Other Assets - (3.60%) | (4,343,261) | |||||||||||||||
|
| |||||||||||||||
NET ASSETS - 100.00% | $ | 120,778,736 | ||||||||||||||
|
| |||||||||||||||
(a) | Non-income-producing security. |
(b) | Security considered illiquid. On November 30, 2013, the total market value of these securities was $56,114, representing 0.04% of net assets. |
(c) | Security fair valued using methods determined in good faith by the Pricing Committee. As of November 30, 2013, the total market value of these securities was $162,974 representing 0.13% of net assets. |
(d) | Underlying security for a written/purchased call/put option. |
(e) | Security, or a portion of security, is being held as collateral for short sales, or written option contracts. At period end, the aggregate market value of those securities was $19,398,337, representing 16.06% of net assets. |
(f) | Interest rate will change at a future date. Interest rate shown reflects the rate in effect at November 30, 2013. |
See Notes to Financial Statements. | ||
Semi-Annual Report | November 30, 2013 | 27 |
Table of Contents
The Arbitrage Event-Driven Fund | Portfolio of Investments (continued) | |
| November 30, 2013 (Unaudited) |
(g) | Security exempt from registration under Rule 144A of the Securities Act of 1933. These may be resold in transactions exempt from registration, normally to qualified institutional buyers. As of November 30, 2013, these securities had a total value of $8,860,826 or 7.34% of net assets. |
(h) | Security in default on interest payments. |
Securities determined to be illiquid under the procedures approved by the Funds’ Board of Trustees. Information related to the illiquid securities is as follows:
Date(s) of Purchase | Security | Cost | Market Value | % of Net Assets | |||||||||||||
12/31/2010-01/05/2011 | Allied Defense Group, Inc. | $ | 16,534 | $ | 24,595 | 0.02% | |||||||||||
09/10/2013 | BMC Software, Inc., CVR | 0 | 4,140 | 0.00 | |||||||||||||
12/12/2011 | Cubist Pharmaceuticals, Inc. | 0 | 12,151 | 0.01 | |||||||||||||
09/12/2013 | Truis Therapeutics, CVR | 0 | 15,228 | 0.01 | |||||||||||||
|
| ||||||||||||||||
| $ | 56,114 | 0.04% | |||||||||||||||
|
| ||||||||||||||||
See Notes to Financial Statements. | ||
28 | www.arbitragefunds.com | 1-800-295-4485 |
Table of Contents
The Arbitrage Event-Driven Fund | Portfolio of Investments (continued) | |
| November 30, 2013 (Unaudited) |
SCHEDULE OF SECURITIES SOLD SHORT | Shares | Value | ||||||
COMMON STOCKS - (16.34%) | ||||||||
Aerospace & Defense - (0.12%) | ||||||||
United Technologies Corp. | (1,314 | ) | $ | (145,670 | ) | |||
|
| |||||||
Banks - (4.28%) | ||||||||
M&T Bank Corp. | (20,999 | ) | (2,422,445 | ) | ||||
PacWest Bancorp | (49,065 | ) | (2,018,534 | ) | ||||
Umpqua Holdings Corp. | (39,903 | ) | (734,614 | ) | ||||
|
| |||||||
| (5,175,593 | ) | |||||||
|
| |||||||
Building Materials - (0.14%) | ||||||||
Lennox International, Inc. | (2,091 | ) | (172,298 | ) | ||||
|
| |||||||
Coal - (0.21%) | ||||||||
Alpha Natural Resources, Inc. | (37,211 | ) | (248,570 | ) | ||||
|
| |||||||
Commercial Services - (0.51%) | ||||||||
Stewart Enterprises, Inc., Class A | (46,788 | ) | (619,941 | ) | ||||
|
| |||||||
Distributors & Wholesalers - (0.14%) | ||||||||
Watsco, Inc. | (1,744 | ) | (167,354 | ) | ||||
|
| |||||||
Diversified Financial Services - (0.20%) | ||||||||
IntercontinentalExchange Group, Inc. | (1,148 | ) | (244,857 | ) | ||||
|
| |||||||
Electric - (0.36%) | ||||||||
AES Corp. | (7,546 | ) | (109,945 | ) | ||||
Calpine Corp. | (5,774 | ) | (109,186 | ) | ||||
Edison International | (2,395 | ) | (110,673 | ) | ||||
PPL Corp. | (3,587 | ) | (110,157 | ) | ||||
|
| |||||||
| (439,961 | ) | |||||||
|
| |||||||
Electrical Components & Equipment - (0.28%) | ||||||||
Schneider Electric SA | (3,963 | ) | (335,536 | ) | ||||
|
| |||||||
Electronics - (0.07%) | ||||||||
Allegion Plc | (1,940 | ) | (83,886 | ) | ||||
|
| |||||||
Food - (1.40%) | ||||||||
Loblaw Cos. Ltd. | (41,547 | ) | (1,686,436 | ) | ||||
|
| |||||||
See Notes to Financial Statements. | ||
Semi-Annual Report | November 30, 2013 | 29 |
Table of Contents
The Arbitrage Event-Driven Fund | Portfolio of Investments (continued) | |
| November 30, 2013 (Unaudited) |
SCHEDULE OF SECURITIES SOLD SHORT | Shares | Value | ||||||
| ||||||||
COMMON STOCKS (Continued)(16.34%) | ||||||||
Hand & Machine Tools - (0.03%) | ||||||||
Stanley Black & Decker, Inc. | (452) | $ | (36,788) | |||||
|
| |||||||
Insurance - (0.91%) | ||||||||
Fidelity National Financial, Inc., Class A | (34,661) | (1,007,595) | ||||||
Genworth Financial, Inc., Class A | (5,900) | (89,149) | ||||||
|
| |||||||
| (1,096,744) | ||||||||
|
| |||||||
Iron & Steel - (0.09%) | ||||||||
United States Steel Corp. | (3,859) | (103,460) | ||||||
|
| |||||||
Metal Fabrication & Hardware - (0.03%) | ||||||||
Assa Abloy AB, Unsponsored ADR | (1,501) | (37,975) | ||||||
|
| |||||||
Mining - (0.01%) | ||||||||
Nevada Copper Corp. | (6,725) | (9,177) | ||||||
|
| |||||||
Oil & Gas - (0.73%) | ||||||||
Atwood Oceanics, Inc. | (1,844) | (96,921) | ||||||
Diamond Offshore Drilling, Inc. | (1,614) | (96,921) | ||||||
Ensco Plc, Class A | (1,863) | (110,066) | ||||||
Hercules Offshore, Inc. | (22,608) | (144,465) | ||||||
Pioneer Natural Resources Co. | (1,350) | (239,962) | ||||||
Rowan Companies Plc, Class A | (2,740) | (94,859) | ||||||
Seadrill, Ltd. | (2,194) | (93,706) | ||||||
|
| |||||||
| (876,900) | ||||||||
|
| |||||||
Pharmaceuticals - (4.44%) | ||||||||
AmerisourceBergen Corp. | (1,326) | (93,523) | ||||||
Endo Health Solutions, Inc. | (49,333) | (3,314,684) | ||||||
Knight Therapeutics | (37,687) | (81,577) | ||||||
Perrigo Co. | (11,985) | (1,868,342) | ||||||
|
| |||||||
| (5,358,126) | ||||||||
|
| |||||||
Pipelines - (0.11%) | ||||||||
APA Group | (22,902) | (127,581) | ||||||
|
| |||||||
Real Estate Investment Trusts - (0.53%) | ||||||||
American Realty Capital Properties, Inc. | (32,751) | (429,365) | ||||||
GPT Group | (66,325) | (216,133) | ||||||
|
| |||||||
| (645,498) | ||||||||
|
| |||||||
See Notes to Financial Statements. | ||
30 | www.arbitragefunds.com | 1-800-295-4485 |
Table of Contents
The Arbitrage Event-Driven Fund | Portfolio of Investments (continued) | |
| November 30, 2013 (Unaudited) |
SCHEDULE OF SECURITIES SOLD SHORT | Shares | Value | ||||||||||||||
| ||||||||||||||||
COMMON STOCKS (Continued)(16.34%) | ||||||||||||||||
Semiconductors - (0.48%) | ||||||||||||||||
Applied Materials, Inc. | (33,700) | $ | (583,010) | |||||||||||||
|
| |||||||||||||||
Telecommunications - (1.27%) | ||||||||||||||||
AT&T, Inc. | (43,655) | (1,537,093) | ||||||||||||||
|
| |||||||||||||||
TOTAL COMMON STOCKS (Proceeds $18,586,337) | (19,732,454) | |||||||||||||||
|
| |||||||||||||||
EXCHANGE-TRADED FUNDS - (3.45%) | ||||||||||||||||
Equity Fund - (3.45%) | ||||||||||||||||
Health Care Select Sector SPDR® Fund | (8,293) | (458,271) | ||||||||||||||
Industrial Select Sector SPDR® Fund | (3,181) | (160,322) | ||||||||||||||
iShares® S&P®/TSX Capped Energy Index Fund | (1,972) | (31,402) | ||||||||||||||
Market Vectors Coal ETF | (12,051) | (239,936) | ||||||||||||||
Market Vectors Oil Service ETF | (12,943) | (626,312) | ||||||||||||||
SPDR® Barclays High Yield Bond ETF Trust | (38,240) | (1,558,280) | ||||||||||||||
SPDR® S&P 500® ETF Trust | (2,453) | (443,993) | ||||||||||||||
SPDR® S&P 500® Insurance ETF Trust | (6,993) | (436,084) | ||||||||||||||
SPDR® S&P® Oil & Gas Exploration & Production ETF | (3,081) | (208,830) | ||||||||||||||
|
| |||||||||||||||
| (4,163,430) | ||||||||||||||||
|
| |||||||||||||||
TOTAL EXCHANGE-TRADED FUNDS (Proceeds $4,035,113) | (4,163,430) | |||||||||||||||
|
| |||||||||||||||
| Maturity Date | Rate | Principal Amount | Value | |||||||||||||
| ||||||||||||||||
CORPORATE BONDS - (0.54%) | ||||||||||||||||
Pipelines - (0.27%) | ||||||||||||||||
Kinder Morgan Energy Partners LP | 09/01/2022 | 3.950 | % | $ | (330,000) | $ | (325,750) | |||||||||
|
| |||||||||||||||
Telecommunications - (0.27%) | ||||||||||||||||
SoftBank Corp. | 04/15/2020 | 4.500 | % | (331,000) | (328,931) | |||||||||||
|
| |||||||||||||||
TOTAL CORPORATE BONDS (Proceeds $673,823) | (654,681) | |||||||||||||||
|
| |||||||||||||||
TOTAL SECURITIES SOLD SHORT (Proceeds $23,295,273) | $ | (24,550,565) | ||||||||||||||
|
| |||||||||||||||
See Notes to Financial Statements. | ||
Semi-Annual Report | November 30, 2013 | 31 |
Table of Contents
The Arbitrage Event-Driven Fund | Portfolio of Investments (continued) | |
| November 30, 2013 (Unaudited) |
SCHEDULE OF WRITTEN OPTIONS | Expiration Date | Exercise Price | Contracts | Value | ||||||||||
| ||||||||||||||
Written Call Options | ||||||||||||||
Applied Materials, Inc.: | ||||||||||||||
| 12/2013 | $ | 17.00 | (73) | $ | (3,979) | |||||||||
| 12/2013 | 18.00 | (2) | (25) | |||||||||||
Assured Guaranty Ltd. | 12/2013 | 24.00 | (51) | (1,862) | ||||||||||
CONSOL Energy, Inc.: | ||||||||||||||
| 12/2013 | 36.00 | (9) | (733) | |||||||||||
| 12/2013 | 37.00 | (11) | (511) | |||||||||||
| 12/2013 | 38.00 | (11) | (281) | |||||||||||
| 12/2013 | 39.00 | (11) | (165) | |||||||||||
Endo Health Solutions, Inc.: | ||||||||||||||
| 12/2013 | 55.00 | (123) | (146,985) | |||||||||||
| 12/2013 | 60.00 | (59) | (43,955) | |||||||||||
Fidelity National Financial, Inc., Class A | 12/2013 | 28.00 | (8) | (960) | ||||||||||
Genworth Financial, Inc., Class A | 12/2013 | 14.00 | (30) | (3,660) | ||||||||||
MAKO Surgical Corp.: | ||||||||||||||
| 01/2014 | 30.00 | (54) | (135) | |||||||||||
| 02/2014 | 30.00 | (97) | (243) | |||||||||||
Manitowoc Co., Inc: | ||||||||||||||
| 12/2013 | 19.00 | (22) | (3,795) | |||||||||||
| 12/2013 | 20.00 | (63) | (5,985) | |||||||||||
NRG Energy, Inc.: | ||||||||||||||
| 12/2013 | 27.00 | (122) | (6,100) | |||||||||||
| 12/2013 | 28.00 | (97) | (2,182) | |||||||||||
| 12/2013 | 29.00 | (23) | (288) | |||||||||||
Talisman Energy, Inc. | 12/2013 | 12.00 | (135) | (2,700) | ||||||||||
ViroPharma, Inc. | 12/2013 | 50.00 | (1) | (2) | ||||||||||
|
| |||||||||||||
TOTAL WRITTEN CALL OPTIONS (Premiums received $89,317) | (224,546) | |||||||||||||
|
| |||||||||||||
Written Put Options | ||||||||||||||
Alpha Natural Resources, Inc.: | ||||||||||||||
| 12/2013 | 6.00 | (33) | (413) | |||||||||||
| 12/2013 | 7.00 | (62) | (3,441) | |||||||||||
| 12/2013 | 8.00 | (36) | (5,040) | |||||||||||
Applied Materials, Inc. | 12/2013 | 17.00 | (73) | (1,752) | ||||||||||
Genworth Financial, Inc., Class A | 12/2013 | 14.00 | (30) | (300) | ||||||||||
Office Depot, Inc.: | ||||||||||||||
| 01/2014 | 11.00 | (21) | (157) | |||||||||||
| 01/2014 | 12.00 | (6) | (105) | |||||||||||
See Notes to Financial Statements. | ||
32 | www.arbitragefunds.com | 1-800-295-4485 |
Table of Contents
The Arbitrage Event-Driven Fund | Portfolio of Investments (continued) | |
| November 30, 2013 (Unaudited) |
SCHEDULE OF WRITTEN OPTIONS | Expiration Date | Exercise Price | Contracts | Value | ||||||||||
| ||||||||||||||
Written Put Options (Continued) | ||||||||||||||
Santarus, Inc. | 12/2013 | $ | 30.00 | (8) | $ | (40) | ||||||||
|
| |||||||||||||
TOTAL WRITTEN PUT OPTIONS (Premiums received $11,910) | (11,248) | |||||||||||||
|
| |||||||||||||
TOTAL WRITTEN OPTIONS (Premiums received $101,227) | $ | (235,794) | ||||||||||||
|
| |||||||||||||
See Notes to Financial Statements. | ||
Semi-Annual Report | November 30, 2013 | 33 |
Table of Contents
The Arbitrage Event-Driven Fund | Portfolio of Investments (continued) | |
| November 30, 2013 (Unaudited) |
EQUITY SWAP CONTRACTS
Swap Counterparty | Reference Obligation | Rate Paid/Received by the Fund | Termination Dates | Notional Amount | Unrealized Appreciation | |||||||||
| ||||||||||||||
Goldman, Sachs & Co. | Yancoal Australia | 1 Month-BBSW- REUTERS plus 0.50 bps | 05/07/2014- 06/17/2014 | $ | 133,073 | $ | 4,202 | |||||||
UBS | Commonwealth Properties | 1 Month-BBSW- REUTERS plus 0.55 bps | Monthly Reset | 219,725 | 13,790 | |||||||||
UBS | Dexus Property | 1 Month-BBSW- REUTERS plus 0.55 bps | Monthly Reset | (43,641) | 1,608 | |||||||||
UBS | Yancoal Australia | 1 Month-BBSW- REUTERS plus 0.55 bps | Monthly Reset | 143,984 | 4,547 | |||||||||
|
| |||||||||||||
| $ | 453,141 | $ | 24,147 | |||||||||||
|
| |||||||||||||
Swap Counterparty | Reference Obligation | Rate Paid/Received by the Fund | Termination Dates | Notional Amount | Unrealized Depreciation | |||||||||
| ||||||||||||||
Goldman, Sachs & Co. | Delcam Plc | LIBOR-BBA plus 0.85 bps | 11/12/2014 | $ | 187,192 | $ | (878) | |||||||
Goldman, Sachs & Co. | Yancoal Australia | 1 Month-BBSW- REUTERS plus 0.50 bps | 09/15/2014 | 17,467 | (718) | |||||||||
Goldman, Sachs & Co. | Yanzhou Coal | 1 Month-HIBOR- REUTERS minus 2.5 bps - 2.75 bps | 05/30/2014- 06/13/2014 | (19,420) | (747) | |||||||||
UBS | Flinders Mines | 1 Month-BBSW- REUTERS plus 0.55 bps | Monthly Reset | 10,307 | (1,288) | |||||||||
UBS | Yancoal Australia | 1 Month-BBSW- REUTERS plus 0.55 bps | Monthly Reset | 30,837 | (1,267) | |||||||||
|
| |||||||||||||
| $ | 226,383 | $ | (4,898) | |||||||||||
|
| |||||||||||||
See Notes to Financial Statements. | ||
34 | www.arbitragefunds.com | 1-800-295-4485 |
Table of Contents
The Arbitrage Event-Driven Fund | Portfolio of Investments (continued) | |
| November 30, 2013 (Unaudited) |
OUTSTANDING FORWARD FOREIGN CURRENCY EXCHANGE CONTRACTS
Contract Description | Contracts to Deliver/Receive | Purchase/ Sale Contract | Expiration Date | Current Value | Unrealized Appreciation | |||||||||||
AUD | 2,115,900 | Sale | 12/16/13 | 1,923,833 | $ | 36,532 | ||||||||||
CAD | 10,940,500 | Sale | 12/16/13 | 10,291,956 | 227,115 | |||||||||||
EUR | 3,969,000 | Purchase | 12/16/13 | 5,393,061 | 22,765 | |||||||||||
EUR | 208,000 | Sale | 12/16/13 | 282,629 | 4,178 | |||||||||||
NOK | 120,000 | Purchase | 12/16/13 | 19,573 | 158 | |||||||||||
NOK | 7,846,000 | Sale | 12/16/13 | 1,279,755 | 36,891 | |||||||||||
CHF | 404,000 | Sale | 12/16/13 | 445,797 | 3,372 | |||||||||||
THB | 49,540,000 | Purchase | 12/16/13 | 1,541,584 | 1,640 | |||||||||||
THB | 28,260,000 | Sale | 12/16/13 | 879,394 | 5,296 | |||||||||||
|
| |||||||||||||||
| $ | 337,947 | |||||||||||||||
|
| |||||||||||||||
Contract Description | Contracts to Deliver/Receive | Purchase/ Sale Contract | Expiration Date | Current Value | Unrealized Appreciation | |||||||||||
AUD | 1,561,000 | Purchase | 12/16/13 | 1,419,303 | $ | (26,221) | ||||||||||
AUD | 7,000 | Sale | 12/16/13 | 6,365 | (22) | |||||||||||
GBP | 573,000 | Sale | 12/16/13 | 937,486 | (16,782) | |||||||||||
CAD | 3,038,000 | Purchase | 12/16/13 | 2,857,910 | (81,509) | |||||||||||
EUR | 140,000 | Purchase | 12/16/13 | 190,231 | (1,294) | |||||||||||
EUR | 4,207,000 | Sale | 12/16/13 | 5,716,455 | (114,964) | |||||||||||
NOK | 4,115,000 | Purchase | 12/16/13 | 671,194 | (21,338) | |||||||||||
NOK | 220,000 | Sale | 12/16/13 | 35,884 | (200) | |||||||||||
THB | 16,100,000 | Purchase | 12/16/13 | 500,999 | (1,184) | |||||||||||
THB | 43,769,000 | Sale | 12/16/13 | 1,362,002 | (5,244) | |||||||||||
|
| |||||||||||||||
| $ | (268,758) | |||||||||||||||
|
| |||||||||||||||
See Notes to Financial Statements. | ||
Semi-Annual Report | November 30, 2013 | 35 |
Table of Contents
The Arbitrage Event-Driven Fund | Portfolio of Investments (continued) | |
| November 30, 2013 (Unaudited) |
Country | % of Net Assets | |||
| ||||
Canada | 11.25% | |||
Cayman Islands | 2.09% | |||
Australia | 1.15% | |||
Great Britain | 1.04% | |||
Bermuda | 0.60% | |||
Japan | 0.54% | |||
Norway | 0.52% | |||
Switzerland | 0.37% | |||
Germany | 0.34% | |||
Ireland | 0.26% | |||
Thailand | 0.16% | |||
France | 0.03% | |||
United States | 85.25% | |||
Liabilities in Excess of Other Assets | (3.60)% | |||
|
| |||
| 100.00% | ||||
|
| |||
Abbreviations:
AB - Arktiebolag is the Swedish term for a limited company
ADR - American Depositary Receipt
AG - Aktiengesellschaft is a German term that refers to a corporation that is limited by shares, i.e., owned by shareholders
ASA - Allmennaksjeselskap is the Norwegian term for a public limited company
AUD - Australian Dollar
BBA - British Bankers Association
BBSW - Australian Bank Bill Swap Reference Rate
bps - Basis Points
CAD - Canadian Dollar
CHF - Swiss Franc
CPR - Conditional Prepayment Rate
CVR - Contingent Value Rights
ETF - Exchange-Traded Fund
EUR - Euro
GBP - British Pound
HIBOR - Hong Kong Interbank Offered Rate
LIBOR - London Interbank Offered Rate
LLC - Limited Liability Company
LP - Limited Partnership
Ltd. - Limited
NOK - Norwegian Krone
Pcl - Public Company Limited
PIK - Payment-in-kind
Plc - Public Limited Liability
SA - Generally designates corporations in various countries, mostly those employing civil law. This translates literally in all languages mentioned as anonymous company
SE - SE Regulation. A European Company which can operate on a Europe-wide basis and be governed by Community law directly applicable in all Member States
S&P - Standard & Poor’s
SPDR - Standard & Poor’s Depositary Receipt
THB - Thai Baht
See Notes to Financial Statements. | ||
36 | www.arbitragefunds.com | 1-800-295-4485 |
Table of Contents
The Arbitrage Event-Driven Fund | ||
| November 30, 2013 (Unaudited) |
The following is a summary of the inputs used as of November 30, 2013, in valuing the Arbitrage Event-Driven Fund’s investments carried at value:
Investments in Securities at Value
| Level 1 | Level 2 | Level 3 | Total | |||||||||||||
| ||||||||||||||||
Assets | ||||||||||||||||
Common Stocks | ||||||||||||||||
Aerospace & Defense | $ | – | $ | – | $ | 24,595 | $ | 24,595 | ||||||||
Apparel | 327,932 | – | – | 327,932 | ||||||||||||
Auto Parts & Equipment | 66,691 | – | – | 66,691 | ||||||||||||
Banks | 3,408,983 | – | – | 3,408,983 | ||||||||||||
Coal | 974,242 | – | – | 974,242 | ||||||||||||
Commercial Services | 3,628,117 | – | – | 3,628,117 | ||||||||||||
Diversified Financial Services | 1,635,763 | – | – | 1,635,763 | ||||||||||||
Electric | 4,268,905 | – | – | 4,268,905 | ||||||||||||
Electrical Components & Equipment | 2,917,239 | – | – | 2,917,239 | ||||||||||||
Food | 1,708,252 | – | – | 1,708,252 | ||||||||||||
Gas | 202,134 | – | – | 202,134 | ||||||||||||
Healthcare - Products | 4,702,038 | – | – | 4,702,038 | ||||||||||||
Household Products & Wares | 416,735 | – | – | 416,735 | ||||||||||||
Insurance | 1,894,897 | – | – | 1,894,897 | ||||||||||||
Machinery - Diversified | 891,677 | – | – | 891,677 | ||||||||||||
Media | 2,744,981 | – | – | 2,744,981 | ||||||||||||
Mining | 573,916 | – | – | 573,916 | ||||||||||||
Miscellaneous Manufacturing | 2,081,788 | – | – | 2,081,788 | ||||||||||||
Oil & Gas | 4,390,289 | – | – | 4,390,289 | ||||||||||||
Oil & Gas Services | 731,905 | – | – | 731,905 | ||||||||||||
Pharmaceuticals | 13,312,659 | – | – | 13,312,659 | ||||||||||||
Real Estate Investment Trusts | 971,501 | – | – | 971,501 | ||||||||||||
Retail | 4,228,608 | – | – | 4,228,608 | ||||||||||||
Savings & Loans | 2,334,038 | – | – | 2,334,038 | ||||||||||||
Semiconductors | 1,084,197 | – | – | 1,084,197 | ||||||||||||
Software | 282,709 | – | – | 282,709 | ||||||||||||
Telecommunications | 5,102,829 | – | – | 5,102,829 | ||||||||||||
Transportation | 504,862 | – | – | 504,862 | ||||||||||||
Limited Partnerships | 243,080 | – | – | 243,080 | ||||||||||||
Preferred Stocks | 588,985 | – | – | 588,985 | ||||||||||||
Rights | 232,401 | – | 31,519 | 263,920 | ||||||||||||
Bank Loan | – | 8,179,160 | – | 8,179,160 | ||||||||||||
Corporate Bonds | – | 29,039,666 | 106,860 | 29,146,526 | ||||||||||||
Convertible Corporate Bonds | – | 4,779,374 | – | 4,779,374 | ||||||||||||
Purchased Options | 65,254 | – | – | 65,254 | ||||||||||||
Short-Term Investments | 16,443,216 | – | – | 16,443,216 | ||||||||||||
| ||||||||||||||||
TOTAL | $ | 82,960,823 | $ | 41,998,200 | $ | 162,974 | $ | 125,121,997 | ||||||||
| ||||||||||||||||
See Notes to Financial Statements. | ||
Semi-Annual Report | November 30, 2013 | 37 |
Table of Contents
The Arbitrage Event-Driven Fund | ||
| November 30, 2013 (Unaudited) |
Investments in Securities at Value (Continued)
| Level 1 | Level 2 | Level 3 | Total | |||||||||||||
| ||||||||||||||||
Other Financial Instruments* | ||||||||||||||||
| ||||||||||||||||
Assets | ||||||||||||||||
Forward Foreign Currency Exchange | $ | – | $ | 337,947 | $ | – | $ | 337,947 | ||||||||
Equity Swaps | 24,147 | – | – | 24,147 | ||||||||||||
Liabilities | ||||||||||||||||
Common Stocks** | (19,650,877) | – | (81,577) | (19,732,454) | ||||||||||||
Exchange-Traded Funds | (4,163,430) | – | – | (4,163,430) | ||||||||||||
Corporate Bonds | – | (654,681) | – | (654,681) | ||||||||||||
Written Options | (235,794) | – | – | (235,794) | ||||||||||||
Forward Foreign Currency Exchange | – | (268,758) | – | (268,758) | ||||||||||||
Equity Swaps | (4,898) | – | – | (4,898) | ||||||||||||
| ||||||||||||||||
TOTAL | $ | (24,030,852) | $ | (585,492) | $ | (81,577) | $ | (24,697,921) | ||||||||
| ||||||||||||||||
* | Other financial instruments are instruments such as written options, securities sold short, equity swaps and forward foreign currency exchange contracts. |
** | Refer to Portfolio of Investments for sector information. |
The following is a reconciliation of the fair valuations using significant unobservable inputs (Level 3) for the Fund’s assets and liabilities during the six months ended November 30, 2013:
Investments in | Balance as of | Realized Gain | Change in Unrealized Appreciation | Purchases | Sales Proceeds | Transfer into Level 3 | Transfer out of Level 3 | Balance as of November 30, 2013 | Net change in unrealized appreciation/ (depreciation) included in the Statements of Operations attributable to Level 3 investments held at November 30, 2013 | |||||||||||||||||||||||||||
| ||||||||||||||||||||||||||||||||||||
Common Stocks | $ | 10,000 | $ | – | $ | 14,595 | $ | – | $ | – | $ | – | $ | – | $ | 24,595 | $ | 14,596 | ||||||||||||||||||
Rights | – | – | 31,519 | 0 | – | – | – | 31,519 | 31,519 | |||||||||||||||||||||||||||
Corporate Bonds | – | – | (9,590) | – | – | 116,450 | – | 106,860 | (142,781) | |||||||||||||||||||||||||||
| ||||||||||||||||||||||||||||||||||||
Total | $ | 10,000 | $ | – | $ | 36,524 | $ | – | $ | – | $ | 116,450 | $ | – | $ | 162,974 | $ | (96,666) | ||||||||||||||||||
| ||||||||||||||||||||||||||||||||||||
See Notes to Financial Statements. | ||
38 | www.arbitragefunds.com | 1-800-295-4485 |
Table of Contents
The Arbitrage Event-Driven Fund | ||
| November 30, 2013 (Unaudited) |
Other Financial Instruments | Balance as of | Realized Gain | Change in Unrealized Appreciation | Purchases | Sale Proceeds | Transfer into Level 3 | Transfer out of Level 3 | Balance as of November 30, 2013 | Net change in unrealized appreciation included in the Statements of Operations attributable to Level 3 investments held at November 30, 2013 | |||||||||||||||||||||||||||
| ||||||||||||||||||||||||||||||||||||
Common Stocks | $ | – | $ | – | $ | (2,186) | $ | (79,392) | $ | – | $ | – | $ | – | $ | (81,577) | $ | (2,186) | ||||||||||||||||||
| ||||||||||||||||||||||||||||||||||||
Total | $ | – | $ | – | $ | (2,186) | $ | (79,392) | $ | – | $ | – | $ | – | $ | (81,577) | $ | (2,186) | ||||||||||||||||||
| ||||||||||||||||||||||||||||||||||||
See Notes to Financial Statements. | ||
Semi-Annual Report | November 30, 2013 | 39 |
Table of Contents
| Portfolio Information | ||
| November 30, 2013 (Unaudited) |
Performance (annualized returns as of November 30, 2013)
| One Year | Since Inception* | ||||||||||||||||
Arbitrage Credit Opportunities Fund, Class R | 5.65% | 4.93% | |||||||||||||||
Arbitrage Credit Opportunities Fund, Class I | 5.81% | 5.06% | |||||||||||||||
Arbitrage Credit Opportunities Fund, Class C** | 3.89% | 4.27% | |||||||||||||||
Arbitrage Credit Opportunities Fund, Class A*** | N/A | -0.04% | |||||||||||||||
Barclays Capital U.S. Aggregate Bond Index | -1.61% | -1.14% | |||||||||||||||
Current performance may be higher or lower than performance quoted above. Any performance data quoted represents past performance and the investment return and principal value of an investment in the Fund will fluctuate so that an investor’s shares, when redeemed, may be worth more or less than their original cost. Past performance is no guarantee of future results. Returns do not reflect a 2% redemption fee for shares that are redeemed from the fund within 60 days of purchase, which, if reflected, would reduce the performance quoted. Returns shown above include the reinvestment of all dividends and capital gains. Contractual fee waivers are currently in effect. Without such fee waivers, performance numbers would be reduced. You can obtain performance data current to the most recent month end by calling 1-800-295-4485 or going to www.arbitragefunds.com.
* Class R, Class I and Class C inception: 10/1/12; Class A inception: 6/1/13.
** Class C shares are subject to a 1.00% contingent deferred sales charge on all purchases redeemed in 12 months of purchase.
*** Class A shares are subject to a maximum front-end sales load of 3.25% on purchases. The shares are also subject to a deferred sales charge of up to 1.00% on purchases of $500,000 or more purchased without a front-end sales load and redeemed within 18 months of purchase.
The Total Annual Fund Operating Expenses for Class R, Class I, Class C and Class A are 3.86%, 3.61%, 4.61% and 3.86%, respectively. The Advisor has agreed to waive fees in excess of 1.50%, 1.25%, 2.25% and 1.50% for Class R, Class I, Class C and Class A, respectively, until at least August 31, 2015.
The Barclays Capital U.S. Aggregate Bond Index is a market value-weighted index of investment grade fixed-rated debt issues, including government, corporate, asset-backed and mortgage-backed securities with a maturity of one year or more.
An investor may not invest directly in an index.
40 | www.arbitragefunds.com | 1-800-295-4485 |
Table of Contents
The Arbitrage Credit Opportunities Fund | Portfolio Information (continued) | |
| November 30, 2013 (Unaudited) |
Growth of $10,000 Investment
| The chart represents historical performance of a hypothetical investment of $10,000 in the Class R shares of the Fund since inception. Past performance does not guarantee future results. This chart does not reflect the deduction of taxes that a shareholder would pay on Fund distributions or the redemption of Fund shares. |
|
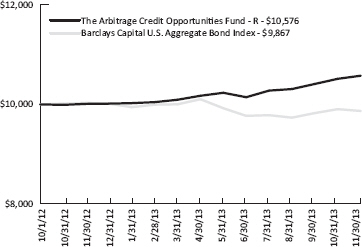
Sector Weighting
The following chart shows the sector weightings of the Arbitrage Credit Opportunities Fund’s investments in common stock, corporate bonds, convertible corporate bonds and exchange-traded funds as of the report date.
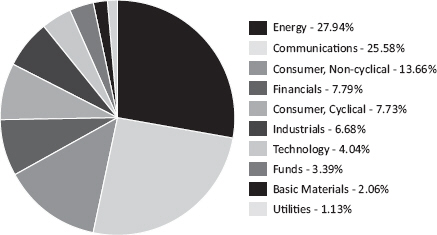
Semi-Annual Report | November 30, 2013 | 41 |
Table of Contents
The Arbitrage Credit Opportunities Fund | Portfolio of Investments | |
| November 30, 2013 (Unaudited) |
| Shares | Value | |||||||||||||||
COMMON STOCKS - 0.35% | ||||||||||||||||
Telecommunications - 0.35% | ||||||||||||||||
Globalstar, Inc.(a) | 25,294 | $ | 45,023 | |||||||||||||
|
| |||||||||||||||
TOTAL COMMON STOCKS (Cost $8,094) | 45,023 | |||||||||||||||
|
| |||||||||||||||
PREFERRED STOCKS - 0.31% | ||||||||||||||||
Banks - 0.31% | ||||||||||||||||
GMAC Capital Trust I, 8.125%(b)(c) | 1,500 | 40,260 | ||||||||||||||
|
| |||||||||||||||
TOTAL PREFERRED STOCKS (Cost $37,840) | 40,260 | |||||||||||||||
|
| |||||||||||||||
| Maturity Date | Rate | Principal Amount | Value | |||||||||||||
BANK LOANS - 7.54% | ||||||||||||||||
Chesapeake Energy Co.(c) | 12/02/2017 | 2.250% | $ | 300,000 | $ | 306,733 | ||||||||||
FairPoint Communications, Inc.(c) | 02/13/2013 | 7.500% | 300,000 | 308,213 | ||||||||||||
Zayo Bandwidth LLC | 06/16/2012 | 4.500% | 360,000 | 360,634 | ||||||||||||
TOTAL BANK LOANS (Cost $976,709) | 975,580 | |||||||||||||||
|
| |||||||||||||||
CORPORATE BONDS - 53.33% | ||||||||||||||||
Banks - 1.71% | ||||||||||||||||
Fifth Third Capital Trust IV(c) | 04/15/2037 | 6.500% | 222,000 | 221,722 | ||||||||||||
|
| |||||||||||||||
Chemicals - 0.47% | ||||||||||||||||
NOVA Chemicals Corp. | 11/01/2019 | 8.625% | 55,000 | 60,638 | ||||||||||||
|
| |||||||||||||||
Commercial Services - 0.78% | ||||||||||||||||
United Rentals North America, Inc. | 09/15/2020 | 8.375% | 90,000 | 100,350 | ||||||||||||
|
| |||||||||||||||
Computers - 1.24% | ||||||||||||||||
SunGard Data Systems, Inc.(b) | 11/15/2020 | 7.625% | 147,000 | 159,863 | ||||||||||||
|
| |||||||||||||||
Diversified Financial Services - 1.55% | ||||||||||||||||
Icahn Enterprises LP / Icahn Enterprises Finance Corp. | 01/15/2016 | 7.750% | 196,000 | 200,900 | ||||||||||||
|
| |||||||||||||||
See Notes to Financial Statements. | ||
42 | www.arbitragefunds.com | 1-800-295-4485 |
Table of Contents
The Arbitrage Credit Opportunities Fund | Portfolio of Investments (continued) | |
| November 30, 2013 (Unaudited) |
| Maturity Date | Rate | Principal Amount | Value | |||||||||||||
CORPORATE BONDS - 53.33% (Continued) | ||||||||||||||||
Electric - 0.76% | ||||||||||||||||
NRG Energy, Inc. | 06/15/2019 | 8.500% | $ | 90,000 | $ | 97,875 | ||||||||||
|
| |||||||||||||||
Electrical Components & Equipment - 1.06% | ||||||||||||||||
Coleman Cable, Inc. | 02/15/2018 | 9.000% | 130,000 | 137,150 | ||||||||||||
|
| |||||||||||||||
Energy - Alternate Sources - 1.86% | ||||||||||||||||
First Wind Capital LLC(d) | 06/01/2018 | 10.250% | 220,000 | 240,900 | ||||||||||||
|
| |||||||||||||||
Food - 0.81% | ||||||||||||||||
ARAMARK Corp.(d) | 03/15/2020 | 5.750% | 100,000 | 104,250 | ||||||||||||
|
| |||||||||||||||
Healthcare - Products - 1.03% | ||||||||||||||||
Alere, Inc. | 10/01/2018 | 8.625% | 123,000 | 133,455 | ||||||||||||
|
| |||||||||||||||
Healthcare - Services - 1.96% | ||||||||||||||||
Health Management Associates, Inc. | 04/15/2016 | 6.125% | 229,000 | 253,617 | ||||||||||||
|
| |||||||||||||||
Household Products & Wares - 0.85% | ||||||||||||||||
American Achievement Corp.(d) | 04/15/2016 | 10.875% | 104,000 | 110,370 | ||||||||||||
|
| |||||||||||||||
Lodging - 2.59% | ||||||||||||||||
Felcor Lodging LP | 10/01/2014 | 10.000% | 81,000 | 86,265 | ||||||||||||
Marina District Finance Co., Inc. | 10/15/2015 | 9.500% | 237,000 | 248,850 | ||||||||||||
|
| |||||||||||||||
| 335,115 | ||||||||||||||||
|
| |||||||||||||||
Media - 11.48% | ||||||||||||||||
Allbritton Communications Co. | 05/15/2018 | 8.000% | 295,000 | 314,912 | ||||||||||||
Entercom Radio LLC(b) | 12/01/2019 | 10.500% | 135,000 | 153,563 | ||||||||||||
Local TV Finance LLC(d) | 06/15/2015 | 9.250% | 280,000 | 282,800 | ||||||||||||
Media General, Inc. | 02/15/2017 | 11.750% | 154,000 | 166,705 | ||||||||||||
Univision Communications, Inc.(d) | 05/15/2021 | 8.500% | 100,000 | 110,750 | ||||||||||||
Videotron Ltd. | 04/15/2018 | 9.125% | 208,000 | 219,180 | ||||||||||||
YPG Financing, Inc.(d) | 11/30/2018 | 9.250% | 242,597 | 236,307 | ||||||||||||
|
| |||||||||||||||
| 1,484,217 | ||||||||||||||||
|
| |||||||||||||||
Mining - 0.39% | ||||||||||||||||
Midwest Vanadium Pty Ltd.(d) | 02/15/2018 | 11.500% | 61,000 | 50,630 | ||||||||||||
|
| |||||||||||||||
See Notes to Financial Statements. | ||
Semi-Annual Report | November 30, 2013 | 43 |
Table of Contents
The Arbitrage Credit Opportunities Fund | Portfolio of Investments (continued) | |
| November 30, 2013 (Unaudited) |
| Maturity Date | Rate | Principal Amount | Value | |||||||||||||
CORPORATE BONDS - 53.33% (Continued) | ||||||||||||||||
Oil & Gas - 8.45% | ||||||||||||||||
Chaparral Energy, Inc. | 09/01/2021 | 8.250% | $ | 107,000 | $ | 117,432 | ||||||||||
Denbury Resources, Inc. | 02/15/2020 | 8.250% | 125,000 | 137,969 | ||||||||||||
Endeavour International Corp.(b) | ||||||||||||||||
| 03/01/2018 | 12.000% | 80,000 | 83,200 | |||||||||||||
| 06/01/2018 | 12.000% | 74,000 | 71,040 | |||||||||||||
Forest Oil Corp. | 06/15/2019 | 7.250% | 92,000 | 91,310 | ||||||||||||
Gastar Exploration USA, Inc.(d) | 05/15/2018 | 8.625% | 100,000 | 98,000 | ||||||||||||
Midstates Petroleum Co. Inc. / Midstates Petroleum Co LLC | 06/01/2021 | 9.250% | 100,000 | 104,375 | ||||||||||||
Newfield Exploration Co. | 05/15/2018 | 7.125% | 255,000 | 265,519 | ||||||||||||
Offshore Group Investment Ltd. | 11/01/2019 | 7.500% | 50,000 | 54,250 | ||||||||||||
Southern Pacific Resource Corp.(d) | 01/25/2018 | 8.750% | 87,000 | 70,006 | ||||||||||||
|
| |||||||||||||||
| 1,093,101 | ||||||||||||||||
|
| |||||||||||||||
Oil & Gas Services - 2.64% | ||||||||||||||||
Oil States International, Inc. | ||||||||||||||||
| 06/01/2019 | 6.500% | 125,000 | 132,969 | |||||||||||||
| 01/15/2023 | 5.125% | 186,000 | 208,785 | |||||||||||||
|
| |||||||||||||||
| 341,754 | ||||||||||||||||
|
| |||||||||||||||
Packaging & Containers - 1.66% | ||||||||||||||||
ARD Finance SA, PIK(d) | 06/01/2018 | 11.125% | 44,336 | 47,440 | ||||||||||||
Packaging Dynamics Corp.(d) | 02/01/2016 | 8.750% | 162,000 | 166,860 | ||||||||||||
|
| |||||||||||||||
| 214,300 | ||||||||||||||||
|
| |||||||||||||||
Pipelines - 3.07% | ||||||||||||||||
Copano Energy LLC / Copano Energy Finance Corp. | 04/01/2021 | 7.125% | 68,000 | 78,128 | ||||||||||||
ONEOK, Inc. | 06/15/2015 | 5.200% | 300,000 | 318,273 | ||||||||||||
|
| |||||||||||||||
| 396,401 | ||||||||||||||||
|
| |||||||||||||||
Real Estate Investment Trusts - 0.85% | ||||||||||||||||
Realogy Group LLC(d) | 02/15/2019 | 7.875% | 100,000 | 109,250 | ||||||||||||
|
| |||||||||||||||
Retail - 0.86% | ||||||||||||||||
Brown Shoe Co., Inc. | 05/15/2019 | 7.125% | 105,000 | 111,300 | ||||||||||||
|
| |||||||||||||||
Semiconductors - 1.46% | ||||||||||||||||
SunEdison, Inc. | 04/01/2019 | 7.750% | 181,000 | 189,145 | ||||||||||||
|
| |||||||||||||||
See Notes to Financial Statements. | ||
44 | www.arbitragefunds.com | 1-800-295-4485 |
Table of Contents
The Arbitrage Credit Opportunities Fund | Portfolio of Investments (continued) | |
| November 30, 2013 (Unaudited) |
| Maturity Date | Rate | Principal Amount | Value | |||||||||||||
CORPORATE BONDS - 53.33% (Continued) | ||||||||||||||||
Telecommunications - 4.05% | ||||||||||||||||
Cincinnati Bell, Inc. | 03/15/2018 | 8.750% | $ | 111,000 | $ | 117,244 | ||||||||||
Clearwire Communications LLC / Clearwire Finance, Inc.(d) | 12/01/2015 | 12.000% | 77,000 | 79,310 | ||||||||||||
Cricket Communications, Inc.(b) | 10/15/2020 | 7.750% | 218,000 | 249,882 | ||||||||||||
Nortel Networks Ltd.(e) | 07/15/2016 | 10.750% | 38,000 | 43,605 | ||||||||||||
Sprint Communications, Inc. | 04/15/2022 | 9.250% | 28,000 | 33,250 | ||||||||||||
|
| |||||||||||||||
| 523,291 | ||||||||||||||||
|
| |||||||||||||||
Trucking & Leasing - 1.75% | ||||||||||||||||
Maxim Crane Works LP / Maxim Finance Corp.(d) | 04/15/2015 | 12.250% | 218,000 | 226,447 | ||||||||||||
|
| |||||||||||||||
TOTAL CORPORATE BONDS (Cost $6,881,609) | 6,896,041 | |||||||||||||||
|
| |||||||||||||||
CONVERTIBLE CORPORATE BONDS - 8.48% | ||||||||||||||||
Commercial Services - 0.85% | ||||||||||||||||
Stewart Enterprises, Inc. | 07/15/2016 | 3.375% | 84,000 | 109,568 | ||||||||||||
|
| |||||||||||||||
Iron & Steel - 0.42% | ||||||||||||||||
United States Steel Corp. | 05/15/2014 | 4.000% | 52,000 | 54,373 | ||||||||||||
|
| |||||||||||||||
Lodging - 1.72% | ||||||||||||||||
Morgans Hotel Group Co. | 10/15/2014 | 2.375% | 230,000 | 221,950 | ||||||||||||
|
| |||||||||||||||
Oil & Gas - 1.53% | ||||||||||||||||
Petrominerales Ltd. | 06/12/2017 | 3.250% | 200,000 | 198,340 | ||||||||||||
|
| |||||||||||||||
Pharmaceuticals - 2.26% | ||||||||||||||||
Omnicare, Inc. | 12/15/2035 | 3.250% | 125,000 | 133,125 | ||||||||||||
ViroPharma, Inc. | 03/15/2017 | 2.000% | 60,000 | 159,337 | ||||||||||||
|
| |||||||||||||||
| 292,462 | ||||||||||||||||
|
| |||||||||||||||
Real Estate Investment Trusts - 0.78% | ||||||||||||||||
Annaly Capital Management, Inc. | 05/15/2015 | 5.000% | 100,000 | 101,312 | ||||||||||||
|
| |||||||||||||||
See Notes to Financial Statements. | ||
Semi-Annual Report | November 30, 2013 | 45 |
Table of Contents
The Arbitrage Credit Opportunities Fund | Portfolio of Investments (continued) | |
| November 30, 2013 (Unaudited) |
| Maturity Date | Rate | Principal Amount | Value | |||||||||||||
CONVERTIBLE CORPORATE BONDS - 8.48% (Continued) | ||||||||||||||||
Telecommunications - 0.92% | ||||||||||||||||
Globalstar, Inc., PIK | 04/01/2028 | 8.000% | $ | 31,589 | $ | 76,070 | ||||||||||
Nortel Networks Corp.(e) | 04/15/2014 | 2.125% | 43,000 | 42,355 | ||||||||||||
|
| |||||||||||||||
| 118,425 | ||||||||||||||||
|
| |||||||||||||||
TOTAL CONVERTIBLE CORPORATE BONDS | ||||||||||||||||
(Cost $1,021,644) | 1,096,430 | |||||||||||||||
|
| |||||||||||||||
| Yield | Shares | Value | ||||||||||||||
SHORT-TERM INVESTMENTS - 36.56% | ||||||||||||||||
Time Deposits | ||||||||||||||||
Euro Time Deposit | 0.010% | 4,727,591 | 4,727,591 | |||||||||||||
|
| |||||||||||||||
TOTAL SHORT-TERM INVESTMENTS | ||||||||||||||||
(Cost $4,727,591) | 4,727,591 | |||||||||||||||
|
| |||||||||||||||
Total Investments - 106.57% | ||||||||||||||||
(Cost $13,653,487) | $ | 13,780,925 | ||||||||||||||
Liabilities in Excess of Other Assets - (6.57%) |
| (849,838) | ||||||||||||||
|
| |||||||||||||||
NET ASSETS - 100.00% | $ | 12,931,087 | ||||||||||||||
|
| |||||||||||||||
(a) | Non-income-producing security. |
(b) | Security, or a portion of security, is being held as collateral for short sales, or written option contracts. At period end, the aggregate market value of those securities was $437,136, representing 3.38% of net assets. |
(c) | Interest rate will change at a future date. Interest rate shown reflects the rate in effect at November 30, 2013. |
(d) | Security exempt from registration under Rule 144A of the Securities Act of 1933. These may be resold in transactions exempt from registration, normally to qualified institutional buyers. As of November 30, 2013, these securities had a total value of $1,933,320 or 14.95% of net assets. |
(e) | Security in default on interest payments. |
See Notes to Financial Statements. | ||
46 | www.arbitragefunds.com | 1-800-295-4485 |
Table of Contents
The Arbitrage Credit Opportunities Fund | Portfolio of Investments (continued) | |
| November 30, 2013 (Unaudited) |
SCHEDULE OF SECURITIES SOLD SHORT | Shares | Value | ||||||||||||||
COMMON STOCKS - (0.69%) | ||||||||||||||||
Commercial Services - (0.60%) | ||||||||||||||||
Stewart Enterprises, Inc., Class A |
| (5,815) | $ | (77,049) | ||||||||||||
|
| |||||||||||||||
Iron & Steel - (0.09%) | ||||||||||||||||
United States Steel Corp. | (455) | (12,198) | ||||||||||||||
|
| |||||||||||||||
TOTAL COMMON STOCKS | ||||||||||||||||
(Proceeds $87,698) | (89,247) | |||||||||||||||
|
| |||||||||||||||
EXCHANGE-TRADED FUNDS - (2.27%) | ||||||||||||||||
Equity Fund - (2.27%) | ||||||||||||||||
SPDR® Barclays High Yield Bond ETF Trust |
| (7,200) | (293,400) | |||||||||||||
|
| |||||||||||||||
TOTAL EXCHANGE-TRADED FUNDS | ||||||||||||||||
(Proceeds $282,679) | (293,400) | |||||||||||||||
|
| |||||||||||||||
| Maturity Date | Rate | Principal Amount | Value | |||||||||||||
CORPORATE BONDS - (1.43%) | ||||||||||||||||
Oil & Gas - (0.80%) | ||||||||||||||||
Chesapeake Energy Corp. | 06/15/2021 | 5.375% | $ | (100,000) | $ | (103,250) | ||||||||||
|
| |||||||||||||||
Pipelines - (0.32%) | ||||||||||||||||
Kinder Morgan Energy Partners LP | 09/01/2022 | 3.950% | (42,000) | (41,459) | ||||||||||||
|
| |||||||||||||||
Telecommunications - (0.31%) | ||||||||||||||||
SoftBank Corp. | 04/15/2020 | 4.500% | (41,000) | (40,744) | ||||||||||||
|
| |||||||||||||||
TOTAL CORPORATE BONDS | ||||||||||||||||
(Proceeds $183,843) | (185,453) | |||||||||||||||
|
| |||||||||||||||
TOTAL SECURITIES SOLD SHORT | ||||||||||||||||
(Proceeds $554,220) | $ | (568,100) | ||||||||||||||
|
| |||||||||||||||
See Notes to Financial Statements. | ||
Semi-Annual Report | November 30, 2013 | 47 |
Table of Contents
The Arbitrage Credit Opportunities Fund | Portfolio of Investments (continued) | |
| November 30, 2013 (Unaudited) |
OUTSTANDING FORWARD FOREIGN CURRENCY EXCHANGE CONTRACTS
Contract Description | Contracts to Deliver/Receive | Purchase/ Sale Contract | Expiration Date | Current Value | Unrealized Appreciation | |||||||
CAD | 331,000 | Sale | 12/16/2013 | 311,379 | $ | 7,273 | ||||||
|
| |||||||||||
| $ | 7,273 | |||||||||||
|
| |||||||||||
Contract Description | Contracts to Deliver/Receive | Purchase/ Sale Contract | Expiration Date | Current Value | Unrealized Depreciation | |||||||
CAD | 4,000 | Purchase | 12/16/2013 | 3,763 | $ | (58) | ||||||
|
| |||||||||||
| $ | (58) | |||||||||||
|
| |||||||||||
See Notes to Financial Statements. | ||
48 | www.arbitragefunds.com | 1-800-295-4485 |
Table of Contents
The Arbitrage Credit Opportunities Fund | Portfolio of Investments (continued) | |
| November 30, 2013 (Unaudited) |
Country | % of Net Assets | |||
Canada | 6.73% | |||
Cayman Islands | 0.42% | |||
Australia | 0.39% | |||
Ireland | 0.37% | |||
United States | 98.66% | |||
Liabilities in Excess of Other Assets | (6.57)% | |||
|
| |||
| 100.00% | ||||
|
| |||
Abbreviations:
CAD - Canadian Dollar
LLC - Limited Liability Company
LP - Limited Partnership
Ltd. - Limited
PIK - Payment - in - kind
SA - Generally designates corporations in various countries, mostly those employing civil law. This translates literally in all languages
mentioned as anonymous company
See Notes to Financial Statements. | ||
Semi-Annual Report | November 30, 2013 | 49 |
Table of Contents
The Arbitrage Credit Opportunities Fund | ||
| November 30, 2013 (Unaudited) |
The following is a summary of the inputs used as of November 30, 2013, in valuing the Arbitrage Credit Opportunities Fund’s investments carried at value:
Investments in Securities at Value | ||||||||||||||||
| Level 1 | Level 2 | Level 3 | Total | |||||||||||||
Assets | ||||||||||||||||
Common Stocks | ||||||||||||||||
Telecommunications | $ | 45,023 | $ | – | $ | – | $ | 45,023 | ||||||||
Preferred Stocks | 40,260 | – | – | 40,260 | ||||||||||||
Bank Loan | – | 975,580 | – | 975,580 | ||||||||||||
Corporate Bonds | – | 6,896,041 | – | 6,896,041 | ||||||||||||
Convertible Corporate Bonds | – | 1,096,430 | – | 1,096,430 | ||||||||||||
Short - Term Investments | 4,727,591 | – | – | 4,727,591 | ||||||||||||
TOTAL | $ | 4,812,874 | $ | 8,968,051 | $ | – | | $ | 13,780,925 | |||||||
| ||||||||||||||||
Other Financial Instruments* | ||||||||||||||||
Assets | ||||||||||||||||
Forward Foreign Currency Exchange Contracts | $ | – | $ | 7,273 | $ | – | $ | 7,273 | ||||||||
Liabilities | ||||||||||||||||
Common Stocks** | (89,247) | – | – | (89,247) | ||||||||||||
Exchange-Traded Funds | (293,400) | – | – | (293,400) | ||||||||||||
Corporate Bonds | – | (185,453) | – | (185,453) | ||||||||||||
Forward Foreign Currency Exchange Contracts | – | (58) | – | (58) | ||||||||||||
TOTAL | $ | (382,647) | $ | (178,238) | $ | – | $ | (560,885) | ||||||||
| ||||||||||||||||
* | Other financial instruments are instruments such as written options, securities sold short, equity swaps and forward foreign currency exchange contracts. |
** | Refer to Portfolio of Investments for sector information. |
See Notes to Financial Statements. | ||
50 | www.arbitragefunds.com | 1-800-295-4485 |
Table of Contents
| Statement of Assets and Liabilities | ||
| November 30, 2013 (Unaudited) |
ASSETS | ||||
Investments: | ||||
At cost | $ | 2,783,507,699 | ||
|
| |||
At value (Note 2) | $ | 2,855,230,266 | ||
Cash | 63,069,965 | |||
Cash denominated in foreign currency (Cost $211,095) | 215,301 | |||
Deposits with brokers for securities sold short (Note 2) | 626,169,072 | |||
Deposits with brokers for swaps (Note 2) | 46,072,409 | |||
Receivable for investment securities sold | 39,224,679 | |||
Receivable for capital shares sold | 7,006,948 | |||
Unrealized appreciation on forward foreign currency exchange contracts (Note 7) | 9,093,713 | |||
Unrealized appreciation on equity swap contracts | 963,966 | |||
Dividends and interest receivable | 1,769,779 | |||
Prepaid expenses and other assets | 190,179 | |||
|
| |||
Total Assets | 3,649,006,277 | |||
|
| |||
LIABILITIES | ||||
Securities sold short, at value (Note 2) (proceeds $669,493,575) | 722,349,048 | |||
Written options, at value (Note 2) (premiums received $1,782,377) | 5,739,653 | |||
Payable to custodian | 76,231 | |||
Payable for investment securities purchased | 71,239,324 | |||
Payable for swap contract payments | 108,226 | |||
Unrealized depreciation on forward foreign currency exchange contracts (Note 7) | 13,521,774 | |||
Unrealized depreciation on equity swap contracts | 300,673 | |||
Payable for capital shares redeemed | 2,936,351 | |||
Payable to Advisor (Note 5) | 2,404,799 | |||
Dividends payable on securities sold short (Note 2) | 349,021 | |||
Payable to Distributor (Note 5) | 213,601 | |||
Payable to Administrator (Note 5) | 522,430 | |||
Interest expense payable | 300,841 | |||
Payable to Trustees | 54,768 | |||
Payable to Chief Compliance Officer (Note 5) | 56,330 | |||
Other accrued expenses and liabilities | 209,380 | |||
|
| |||
Total Liabilities | 820,382,450 | |||
|
| |||
NET ASSETS | $ | 2,828,623,827 | ||
|
| |||
NET ASSETS CONSIST OF: | ||||
Paid-in capital | $ | 2,860,204,473 | ||
Accumulated net investment loss | (7,344,554) | |||
Accumulated net realized loss on investments, equity swap contracts, securities sold short, written option contracts and foreign currencies | (35,379,817) | |||
Net unrealized appreciation on investments, equity swap contracts, securities sold short, written option contracts and translation of assets and liabilities denominated in foreign currencies | 11,143,725 | |||
|
| |||
NET ASSETS | $ | 2,828,623,827 | ||
|
|
See Notes to Financial Statements. | ||
Semi-Annual Report | November 30, 2013 | 51 |
Table of Contents
The Arbitrage Fund | Statement of Assets and Liabilities | |
| November 30, 2013 (Unaudited) |
PRICING OF SHARES: | ||||
CLASS R SHARES: | ||||
Net assets applicable to Class R shares | $ | 914,906,341 | ||
Shares of beneficial interest outstanding (unlimited number of shares authorized, no par value) | 72,527,095 | |||
Net asset value and offering price per share(a) | $ | 12.61 | ||
CLASS I SHARES: | ||||
Net assets applicable to Class I shares | $ | 1,879,786,844 | ||
Shares of beneficial interest outstanding (unlimited number of shares authorized, no par value) | 146,028,105 | |||
Net asset value and offering price per share(a) | $ | 12.87 | ||
CLASS C SHARES: | ||||
Net assets applicable to Class C shares | $ | 31,546,448 | ||
Shares of beneficial interest outstanding (unlimited number of shares authorized, no par value) | 2,534,184 | |||
Net asset value and offering price per share(a) | $ | 12.45 | ||
CLASS A SHARES: | ||||
Net assets applicable to Class A shares | $ | 2,384,194 | ||
Shares of beneficial interest outstanding (unlimited number of shares authorized, no par value) | 188,865 | |||
Net asset value and offering price per share(a) | $ | 12.62 |
(a) | Redemption price varies based on length of time held (Note 1). |
See Notes to Financial Statements. | ||
52 | www.arbitragefunds.com | 1-800-295-4485 |
Table of Contents
| Statement of Assets and Liabilities | ||
| November 30, 2013 (Unaudited) |
ASSETS | ||||
Investments: | ||||
At cost | $ | 122,160,621 | ||
|
| |||
At value (Note 2) | $ | 125,121,997 | ||
Cash | 2,052 | |||
Cash denominated in foreign currency (Cost $78,235) | 78,118 | |||
Deposits with brokers for securities sold short (Note 2) | 24,186,538 | |||
Deposits with brokers for swaps (Note 2) | 373,403 | |||
Receivable for investment securities sold | 1,502,397 | |||
Receivable for capital shares sold | 1,525,116 | |||
Unrealized appreciation on forward foreign currency exchange contracts (Note 7) | 337,947 | |||
Unrealized appreciation on equity swap contracts | 24,147 | |||
Dividends and interest receivable | 694,247 | |||
Prepaid expenses and other assets | 38,717 | |||
|
| |||
Total Assets | 153,884,679 | |||
|
| |||
LIABILITIES | ||||
Securities sold short, at value (Note 2) (proceeds $23,295,273) | 24,550,565 | |||
Written options, at value (Note 2) (premiums received $101,227) | 235,794 | |||
Payable to custodian | 12,411 | |||
Payable for investment securities purchased | 7,821,509 | |||
Payable for swap contract payments | 625 | |||
Unrealized depreciation on forward foreign currency exchange contracts (Note 7) | 268,758 | |||
Unrealized depreciation on equity swap contracts | 4,898 | |||
Payable for capital shares redeemed | 73,253 | |||
Payable to Advisor (Note 5) | 92,535 | |||
Dividends payable on securities sold short (Note 2) | 3,183 | |||
Payable to Distributor (Note 5) | 5,957 | |||
Payable to Administrator (Note 5) | 11,559 | |||
Interest expense payable | 8,865 | |||
Payable to Trustees | 494 | |||
Payable to Chief Compliance Officer (Note 5) | 370 | |||
Other accrued expenses and liabilities | 15,167 | |||
|
| |||
Total Liabilities | 33,105,943 | |||
|
| |||
NET ASSETS | $ | 120,778,736 | ||
|
| |||
NET ASSETS CONSIST OF: | ||||
Paid-in capital | $ | 118,296,395 | ||
Accumulated net investment income | 653,060 | |||
Accumulated net realized gain on investments, equity swap contracts, securities sold short, written option contracts and foreign currencies | 170,304 | |||
Net unrealized appreciation on investments, equity swap contracts, securities sold short, written option contracts and translation of assets and liabilities denominated in foreign currencies | 1,658,977 | |||
|
| |||
NET ASSETS | $ | 120,778,736 | ||
|
|
See Notes to Financial Statements. | ||
Semi-Annual Report | November 30, 2013 | 53 |
Table of Contents
The Arbitrage Event-Driven Fund | Statement of Assets and Liabilities | |
| November 30, 2013 (Unaudited) |
PRICING OF SHARES: | ||||
CLASS R SHARES: | ||||
Net assets applicable to Class R shares | $ | 27,694,591 | ||
Shares of beneficial interest outstanding (unlimited number of shares authorized, no par value) | 2,726,652 | |||
Net asset value and offering price per share(a) | $ | 10.16 | ||
CLASS I SHARES: | ||||
Net assets applicable to Class I shares | $ | 90,923,666 | ||
Shares of beneficial interest outstanding (unlimited number of shares authorized, no par value) | 8,884,791 | |||
Net asset value and offering price per share(a) | $ | 10.23 | ||
CLASS C SHARES: | ||||
Net assets applicable to Class C shares | $ | 1,131,430 | ||
Shares of beneficial interest outstanding (unlimited number of shares authorized, no par value) | 111,975 | |||
Net asset value and offering price per share(a) | $ | 10.10 | ||
CLASS A SHARES: | ||||
Net assets applicable to Class A shares | $ | 1,029,049 | ||
Shares of beneficial interest outstanding (unlimited number of shares authorized, no par value) | 101,253 | |||
Net asset value and offering price per share(a) | $ | 10.16 |
(a) | Redemption price varies based on length of time held (Note 1). |
See Notes to Financial Statements. | ||
54 | www.arbitragefunds.com | 1-800-295-4485 |
Table of Contents
| Statement of Assets and Liabilities | ||
| November 30, 2013 (Unaudited) |
ASSETS | ||||
Investments: | ||||
At cost | $ | 13,653,487 | ||
|
| |||
At value (Note 2) | $ | 13,780,925 | ||
Deposits with brokers for securities sold short (Note 2) | 544,170 | |||
Receivable for capital shares sold | 106,490 | |||
Unrealized appreciation on forward foreign currency exchange contracts (Note 7) | 7,273 | |||
Dividends and interest receivable | 146,594 | |||
Receivable due from Advisor | 18,188 | |||
Prepaid expenses and other assets | 33,530 | |||
|
| |||
Total Assets | 14,637,170 | |||
|
| |||
LIABILITIES | ||||
Securities sold short, at value (Note 2) (proceeds $554,220) | 568,100 | |||
Payable to custodian | 849 | |||
Payable for investment securities purchased | 1,040,478 | |||
Unrealized depreciation on forward foreign currency exchange contracts (Note 7) | 58 | |||
Payable for capital shares redeemed | 74,873 | |||
Dividends payable on securities sold short (Note 2) | 23 | |||
Payable to Distributor (Note 5) | 671 | |||
Payable to Administrator (Note 5) | 6,544 | |||
Interest expense payable | 221 | |||
Audit and legal fees payable | 13,005 | |||
Payable to Trustees | 69 | |||
Payable to Chief Compliance Officer (Note 5) | 57 | |||
Other accrued expenses and liabilities | 1,135 | |||
|
| |||
Total Liabilities | 1,706,083 | |||
|
| |||
NET ASSETS | $ | 12,931,087 | ||
|
| |||
NET ASSETS CONSIST OF: | ||||
Paid-in capital | $ | 12,716,190 | ||
Accumulated net investment income | 73,847 | |||
Accumulated net realized gain on investments and foreign currencies | 20,445 | |||
Net unrealized appreciation on investments, securities sold short and translation of assets and liabilities denominated in foreign currencies | 120,605 | |||
|
| |||
NET ASSETS | $ | 12,931,087 | ||
|
|
See Notes to Financial Statements. | ||
Semi-Annual Report | November 30, 2013 | 55 |
Table of Contents
The Arbitrage Credit Opportunities Fund | Statement of Assets and Liabilities | |
| November 30, 2013 (Unaudited) |
PRICING OF SHARES: | ||||
CLASS R SHARES: | ||||
Net assets applicable to Class R shares | $ | 3,150,291 | ||
Shares of beneficial interest outstanding (unlimited number of shares authorized, no par value) | 307,441 | |||
Net asset value and offering price per share(a) | $ | 10.25 | ||
CLASS I SHARES: | ||||
Net assets applicable to Class I shares | $ | 9,663,817 | ||
Shares of beneficial interest outstanding (unlimited number of shares authorized, no par value) | 945,187 | |||
Net asset value and offering price per share(a) | $ | 10.22 | ||
CLASS C SHARES: | ||||
Net assets applicable to Class C shares | $ | 91,435 | ||
Shares of beneficial interest outstanding (unlimited number of shares authorized, no par value) | 8,960 | |||
Net asset value and offering price per share(a) | $ | 10.20 | ||
CLASS A SHARES: | ||||
Net assets applicable to Class A shares | $ | 25,544 | ||
Shares of beneficial interest outstanding (unlimited number of shares authorized, no par value) | 2,497 | |||
Net asset value and offering price per share(a) | $ | 10.23 |
(a) | Redemption price varies based on length of time held (Note 1). |
See Notes to Financial Statements. | ||
56 | www.arbitragefunds.com | 1-800-295-4485 |
Table of Contents
| Statement of Operations | ||
| For the Six Months Ended November 30, 2013 (Unaudited) |
INVESTMENT INCOME | ||||
Dividends | $ | 25,872,580 | ||
Foreign taxes withheld | (232,900) | |||
Interest income | 4,212 | |||
|
| |||
Total Income | 25,643,892 | |||
|
| |||
EXPENSES | ||||
Investment advisory fees (Note 5) | 14,824,279 | |||
Distribution and service fees (Note 5) | ||||
Class R | 1,145,322 | |||
Class C | 127,387 | |||
Class A | 1,192 | |||
Administrative fees (Note 5) | 279,581 | |||
Chief Compliance Officer fees (Note 5) | 185,931 | |||
Trustees’ fees | 123,662 | |||
Dividend expense | 4,622,847 | |||
Interest rebate expense | 1,270,155 | |||
Transfer agent fees (Note 5) | 1,329,376 | |||
Custodian and bank service fees | 108,614 | |||
Registration and filing fees | 55,848 | |||
Printing of shareholder reports | 138,550 | |||
Professional fees | 62,085 | |||
Line of credit interest expense (Note 4) | 159,491 | |||
Insurance expense | 63,486 | |||
Principal Financial Officer fees (Note 5) | 4,908 | |||
Other expenses | 17,594 | |||
|
| |||
Total Expenses | 24,520,308 | |||
Fees waived by the Advisor, Class A (Note 5) | (175) | |||
|
| |||
Net Expenses | 24,520,133 | |||
|
| |||
NET INVESTMENT INCOME | 1,123,759 | |||
|
| |||
REALIZED AND UNREALIZED GAINS (LOSSES) ON INVESTMENTS AND | ||||
Net realized gains (losses) from: | ||||
Investments | 68,959,675 | |||
Equity swap contracts | 2,684,033 | |||
Securities sold short | (85,380,630) | |||
Written option contracts | 3,535,965 | |||
Foreign currency transactions (Note 7) | (6,101,814) | |||
Net change in unrealized appreciation (depreciation) on: | ||||
Investments | 60,080,873 | |||
Equity swap contracts | (426,977) | |||
Securities sold short | (4,762,710) | |||
Written option contracts | (344,171) | |||
Foreign currency transactions (Note 7) | (11,211,869) | |||
|
| |||
NET REALIZED AND UNREALIZED GAINS ON INVESTMENTS AND FOREIGN CURRENCIES | ||||
| 27,032,375 | ||||
|
| |||
NET INCREASE IN NET ASSETS RESULTING FROM OPERATIONS | $ | 28,156,134 | ||
|
|
See Notes to Financial Statements. | ||
Semi-Annual Report | November 30, 2013 | 57 |
Table of Contents
| Statement of Operations | ||
| For the Six Months Ended November 30, 2013 (Unaudited) |
INVESTMENT INCOME | ||||
Dividends | $ | 456,608 | ||
Foreign taxes withheld | (4,156) | |||
Interest income | 1,079,649 | |||
|
| |||
Total Income | 1,532,101 | |||
|
| |||
EXPENSES | ||||
Investment advisory fees (Note 5) | 496,578 | |||
Distribution and service fees (Note 5) | ||||
Class R | 18,107 | |||
Class C | 2,582 | |||
Class A | 761 | |||
Administrative fees (Note 5) | 12,648 | |||
Chief Compliance Officer fees (Note 5) | 3,788 | |||
Trustees’ fees | 2,501 | |||
Dividend expense | 124,602 | |||
Interest rebate expense | 34,019 | |||
Transfer agent fees (Note 5) | 49,214 | |||
Custodian and bank service fees | 11,294 | |||
Registration and filing fees | 33,965 | |||
Printing of shareholder reports | 3,019 | |||
Professional fees | 14,455 | |||
Line of credit interest expense (Note 4) | 322 | |||
Insurance expense | 877 | |||
Principal Financial Officer fees (Note 5) | 96 | |||
Other expenses | 4,692 | |||
|
| |||
Total Expenses | 813,520 | |||
Fees waived by the Advisor, Class R (Note 5) | (12,010) | |||
Fees waived by the Advisor, Class I (Note 5) | (48,150) | |||
Fees waived by the Advisor, Class C (Note 5) | (455) | |||
Fees waived by the Advisor, Class A (Note 5) | (455) | |||
|
| |||
Net Expenses | 752,450 | |||
|
| |||
NET INVESTMENT INCOME | 779,651 | |||
|
| |||
REALIZED AND UNREALIZED GAINS (LOSSES) ON INVESTMENTS AND FOREIGN CURRENCIES | ||||
Net realized gains (losses) from: | ||||
Investments | 1,716,640 | |||
Equity swap contracts | 28,385 | |||
Securities sold short | (1,176,804) | |||
Written option contracts | 82,124 | |||
Foreign currency transactions (Note 7) | (84,926) | |||
Net change in unrealized appreciation (depreciation) on: | ||||
Investments | 2,588,543 | |||
Equity swap contracts | 1,018 | |||
Securities sold short | (750,267) | |||
Written option contracts | (93,527) | |||
Foreign currency transactions (Note 7) | (50,041) | |||
|
| |||
NET REALIZED AND UNREALIZED GAINS ON INVESTMENTS AND FOREIGN CURRENCIES | ||||
| 2,261,145 | ||||
|
| |||
NET INCREASE IN NET ASSETS RESULTING FROM OPERATIONS | $ | 3,040,796 | ||
|
|
See Notes to Financial Statements. | ||
58 | www.arbitragefunds.com | 1-800-295-4485 |
Table of Contents
| Statement of Operations | ||
| For the Six Months Ended November 30, 2013 (Unaudited) |
INVESTMENT INCOME | ||||
Dividends | $ | 6,358 | ||
Interest income | 217,471 | |||
|
| |||
Total Income | 223,829 | |||
|
| |||
EXPENSES | ||||
Investment advisory fees (Note 5) | 36,916 | |||
Distribution and service fees (Note 5) | ||||
Class R | 2,799 | |||
Class C | 151 | |||
Class A | 16 | |||
Administrative fees (Note 5) | 3,623 | |||
Chief Compliance Officer fees (Note 5) | 371 | |||
Trustees’ fees | 251 | |||
Dividend expense | 6,096 | |||
Interest rebate expense | 968 | |||
Transfer agent fees (Note 5) | 22,488 | |||
Custodian and bank service fees | 1,440 | |||
Registration and filing fees | 22,130 | |||
Printing of shareholder reports | 307 | |||
Professional fees | 13,551 | |||
Insurance expense | 31 | |||
Offering cost | 9,778 | |||
Principal Financial Officer fees (Note 5) | 10 | |||
Other expenses | 2,527 | |||
|
| |||
Total Expenses | 123,453 | |||
Fees waived by the Advisor, Class R (Note 5) | (19,195 | ) | ||
Fees waived by the Advisor, Class I (Note 5) | (47,615 | ) | ||
Fees waived by the Advisor, Class C (Note 5) | (345 | ) | ||
Fees waived by the Advisor, Class A (Note 5) | (123 | ) | ||
|
| |||
Net Expenses | 56,175 | |||
|
| |||
NET INVESTMENT INCOME | 167,654 | |||
|
| |||
REALIZED AND UNREALIZED GAINS (LOSSES) ON INVESTMENTS AND FOREIGN CURRENCIES | ||||
Net realized gains from: | ||||
Investments | 29,640 | |||
Foreign currency transactions (Note 7) | 1,854 | |||
Net change in unrealized appreciation/(depreciation) on: | ||||
Investments | 85,051 | |||
Securities sold short | (15,264 | ) | ||
Foreign currency transactions (Note 7) | 4,173 | |||
|
| |||
NET REALIZED AND UNREALIZED GAINS ON INVESTMENTS AND FOREIGN CURRENCIES | ||||
| 105,454 | ||||
|
| |||
NET INCREASE IN NET ASSETS RESULTING FROM OPERATIONS | $ | 273,108 | ||
|
|
See Notes to Financial Statements. | ||
Semi-Annual Report | November 30, 2013 | 59 |
Table of Contents
| Statements of Changes in Net Assets | ||
| Six Months Ended November 30, 2013 (Unaudited) | Year Ended May 31, 2013 | |||||||
| ||||||||
FROM OPERATIONS: | ||||||||
Net investment income (loss) | $ | 1,123,759 | $ | (18,376,785) | ||||
Net realized gains (losses) from: | ||||||||
Investments and equity swap contracts | 71,643,708 | 150,085,954 | ||||||
Securities sold short | (85,380,630) | (129,289,719) | ||||||
Written option contracts | 3,535,965 | 19,279,647 | ||||||
Foreign currency transactions | (6,101,814) | (1,755,446) | ||||||
Net change in unrealized appreciation (depreciation) on: | ||||||||
Investments and equity swap contracts | 59,653,896 | 76,337,378 | ||||||
Securities sold short | (4,762,710) | (58,720,755) | ||||||
Written option contracts | (344,171) | (5,734,824) | ||||||
Foreign currency transactions | (11,211,869) | (16,844,153) | ||||||
|
| |||||||
Net increase in net assets resulting from operations | 28,156,134 | 14,981,297 | ||||||
|
| |||||||
FROM DIVIDENDS AND DISTRIBUTIONS TO SHAREHOLDERS: | ||||||||
NET INVESTMENT INCOME | ||||||||
Distributions from net investment income, Class R | – | (7,357,507) | ||||||
Distributions from net investment income, Class I | – | (19,481,923) | ||||||
Distributions from net investment income, Class C | – | – | ||||||
Distributions from net investment income, Class A | – | (53,643) | ||||||
NET REALIZED GAINS | ||||||||
Distributions from net realized gains, Class R | – | (20,078,884) | ||||||
Distributions from net realized gains, Class I | – | (39,477,805) | ||||||
Distributions from net realized gains, Class C | – | – | ||||||
Distributions from net realized gains, Class A | – | (108,702) | ||||||
|
| |||||||
Decrease in net assets from distributions to shareholders | – | (86,558,464) | ||||||
|
| |||||||
See Notes to Financial Statements. | ||
60 | www.arbitragefunds.com | 1-800-295-4485 |
Table of Contents
The Arbitrage Fund | Statements of Changes in Net Assets | |
| Six Months Ended November 30, 2013 (Unaudited) | Year Ended May 31, 2013 | |||||||
| ||||||||
FROM CAPITAL SHARE TRANSACTIONS (NOTE 6): | ||||||||
CLASS R | ||||||||
Proceeds from shares sold | 196,243,547 | 402,159,958 | ||||||
Shares issued in reinvestment of distributions | – | 27,131,307 | ||||||
Proceeds from redemption fees collected (Note 2) | 28,915 | 38,339 | ||||||
Payments for shares redeemed | (206,300,890) | (492,205,896) | ||||||
|
| |||||||
Net decrease in net assets from Class R share transactions | (10,028,428) | (62,876,292) | ||||||
|
| |||||||
CLASS I | ||||||||
Proceeds from shares sold | 344,085,060 | 946,778,145 | ||||||
Shares issued in reinvestment of distributions | – | 33,907,193 | ||||||
Proceeds from redemption fees collected (Note 2) | 17,501 | 28,661 | ||||||
Payments for shares redeemed | (421,612,800) | (1,080,428,416) | ||||||
|
| |||||||
Net decrease in net assets from Class I share transactions | (77,510,239) | (99,714,417) | ||||||
|
| |||||||
CLASS C | ||||||||
Proceeds from shares sold | 14,787,011 | 19,595,035 | ||||||
Shares issued in reinvestment of distributions | – | 161,720 | ||||||
Proceeds from redemption fees collected (Note 2) | 3,683 | 231 | ||||||
Payments for shares redeemed | (2,095,829) | (833,208) | ||||||
|
| |||||||
Net increase in net assets from Class C share transactions | 12,694,865 | 18,923,778 | ||||||
|
| |||||||
CLASS A | ||||||||
Proceeds from shares sold | 2,522,883 | – | ||||||
Payments for shares redeemed | (143,483) | – | ||||||
|
| |||||||
Net increase in net assets from Class A share transactions | 2,379,400 | – | ||||||
|
| |||||||
TOTAL DECREASE IN NET ASSETS | (44,308,268) | (215,244,098) | ||||||
|
| |||||||
NET ASSETS: | ||||||||
Beginning of period | 2,872,932,095 | 3,088,176,193 | ||||||
|
| |||||||
End of period * | $ | 2,828,623,827 | $ | 2,872,932,095 | ||||
|
| |||||||
|
| |||||||
*Including accumulated net investment (loss) of: | $ | (7,344,554) | $ | (8,468,313) | ||||
See Notes to Financial Statements. | ||
Semi-Annual Report | November 30, 2013 | 61 |
Table of Contents
| Statements of Changes in Net Assets | ||
| Six Months Ended November 30, 2013 (Unaudited) | Year Ended May 31, 2013 | |||||||
| ||||||||
FROM OPERATIONS: | ||||||||
Net investment income | $ | 779,651 | $ | 696,474 | ||||
Net realized gains (losses) from: | ||||||||
Investments and equity swap contracts | 1,745,025 | 843,286 | ||||||
Securities sold short | (1,176,804) | (1,531,907) | ||||||
Written option contracts | 82,124 | 535,188 | ||||||
Foreign currency transactions | (84,926) | (41,552) | ||||||
Net change in unrealized appreciation (depreciation) on: | ||||||||
Investments and equity swap contracts | 2,589,561 | 1,718,772 | ||||||
Securities sold short | (750,267) | (721,995) | ||||||
Written option contracts | (93,527) | (79,784) | ||||||
Foreign currency transactions | (50,041) | (98,534) | ||||||
|
| |||||||
Net increase in net assets resulting from operations | 3,040,796 | 1,319,948 | ||||||
|
| |||||||
FROM DIVIDENDS AND DISTRIBUTIONS TO SHAREHOLDERS: | ||||||||
NET INVESTMENT INCOME | ||||||||
Distributions from net investment income, Class R | – | (69,098) | ||||||
Distributions from net investment income, Class I | – | (353,713) | ||||||
Distributions from net investment income, Class C | – | (1,031) | ||||||
Distributions from net investment income, Class A | – | – | ||||||
NET REALIZED GAINS | ||||||||
Distributions from net realized gains, Class R | – | (107,560) | ||||||
Distributions from net realized gains, Class I | – | (540,904) | ||||||
Distributions from net realized gains, Class C | – | (1,943) | ||||||
Distributions from net realized gains, Class A | – | – | ||||||
|
| |||||||
Decrease in net assets from distributions to shareholders | – | (1,074,249) | ||||||
|
| |||||||
See Notes to Financial Statements. | ||
62 | www.arbitragefunds.com | 1-800-295-4485 |
Table of Contents
The Arbitrage Event-Driven Fund | Statements of Changes in Net Assets | |
| Six Months Ended November 30, 2013 (Unaudited) | Year Ended May 31, 2013 | |||||||
| ||||||||
FROM CAPITAL SHARE TRANSACTIONS (NOTE 6): | ||||||||
CLASS R | ||||||||
Proceeds from shares sold | 19,838,571 | 6,778,284 | ||||||
Shares issued in reinvestment of distributions | – | 163,355 | ||||||
Proceeds from redemption fees collected (Note 2) | 455 | 1,136 | ||||||
Payments for shares redeemed | (2,759,718) | (5,848,204) | ||||||
|
| |||||||
Net increase in net assets from Class R share transactions | 17,079,308 | 1,094,571 | ||||||
|
| |||||||
CLASS I | ||||||||
Proceeds from shares sold | 60,230,026 | 38,368,173 | ||||||
Shares issued in reinvestment of distributions | – | 628,267 | ||||||
Proceeds from redemption fees collected (Note 2) | 9,352 | 15,946 | ||||||
Payments for shares redeemed | (13,275,432) | (19,143,328) | ||||||
|
| |||||||
Net increase in net assets from Class I share transactions | 46,963,946 | 19,869,058 | ||||||
|
| |||||||
CLASS C | ||||||||
Proceeds from shares sold | 772,291 | 347,531 | ||||||
Shares issued in reinvestment of distributions | – | 2,973 | ||||||
Payments for shares redeemed | – | (10,000) | ||||||
|
| |||||||
Net increase in net assets from Class C share transactions | 772,291 | 340,504 | ||||||
|
| |||||||
CLASS A | ||||||||
Proceeds from shares sold | 1,007,605 | – | ||||||
|
| |||||||
Net increase in net assets from Class A share transactions | 1,007,605 | – | ||||||
|
| |||||||
TOTAL INCREASE IN NET ASSETS | 68,863,946 | 21,549,832 | ||||||
|
| |||||||
NET ASSETS: | ||||||||
Beginning of period | 51,914,790 | 30,364,958 | ||||||
|
| |||||||
End of period * | $ | 120,778,736 | $ | 51,914,790 | ||||
|
| |||||||
|
| |||||||
*Including accumulated net investment income (loss) of: | $ | 653,060 | $ | (126,591) | ||||
See Notes to Financial Statements. | ||
Semi-Annual Report | November 30, 2013 | 63 |
Table of Contents
Statements of Changes in Net Assets |
Period Ended November 30, 2013 | Period Ended May 31, 2013(a) | |||||||
| ||||||||
FROM OPERATIONS: | ||||||||
Net investment income | $ | 167,654 | $ | 82,256 | ||||
Net realized gains (losses) from: | ||||||||
Investments | 29,640 | (1,047) | ||||||
Securities sold short | – | (10,086) | ||||||
Written option contracts | – | 91 | ||||||
Foreign currency transactions | 1,854 | 1,414 | ||||||
Net change in unrealized appreciation on: | ||||||||
Investments | 85,051 | 42,388 | ||||||
Securities sold short | (15,264) | 1,384 | ||||||
Foreign currency transactions | 4,173 | 2,873 | ||||||
|
| |||||||
Net increase in net assets resulting from operations | 273,108 | 119,273 | ||||||
|
| |||||||
FROM DIVIDENDS AND DISTRIBUTIONS TO SHAREHOLDERS: | ||||||||
NET INVESTMENT INCOME | ||||||||
Distributions from net investment income, Class R | (51,576) | (7,862) | ||||||
Distributions from net investment income, Class I | (111,575) | (28,735) | ||||||
Distributions from net investment income, Class C | (635) | (77) | ||||||
Distributions from net investment income, Class A | (278) | – | ||||||
|
| |||||||
Decrease in net assets from distributions to shareholders | (164,064) | (36,674) | ||||||
|
| |||||||
See Notes to Financial Statements. | ||
64 | www.arbitragefunds.com | 1-800-295-4485 |
Table of Contents
The Arbitrage Credit Opportunities Fund | ||
Statements of Changes in Net Assets |
Period Ended November 30, 2013 | Period Ended May 31, 2013(a) | |||||||
| ||||||||
FROM CAPITAL SHARE TRANSACTIONS (NOTE 6): | ||||||||
CLASS R | ||||||||
Proceeds from shares sold | 1,535,456 | 1,704,124 | ||||||
Shares issued in reinvestment of distributions | 51,575 | 7,862 | ||||||
Proceeds from redemption fees collected (Note 2) | 711 | 20 | ||||||
Payments for shares redeemed | (138,386) | (70,525) | ||||||
|
| |||||||
Net increase in net assets from Class R share transactions | 1,449,356 | 1,641,481 | ||||||
|
| |||||||
CLASS I | ||||||||
Proceeds from shares sold | 6,410,350 | 3,391,866 | ||||||
Shares issued in reinvestment of distributions | 111,573 | 16,969 | ||||||
Proceeds from redemption fees collected (Note 2) | 301 | – | ||||||
Payments for shares redeemed | (398,691) | – | ||||||
|
| |||||||
Net increase in net assets from Class I share transactions | 6,123,533 | 3,408,835 | ||||||
|
| |||||||
CLASS C | ||||||||
Proceeds from shares sold | 65,001 | 25,145 | ||||||
Shares issued in reinvestment of distributions | 633 | 77 | ||||||
|
| |||||||
Net increase in net assets from Class C share transactions | 65,634 | 25,222 | ||||||
|
| |||||||
CLASS A | ||||||||
Proceeds from shares sold | 25,106 | – | ||||||
Shares issued in reinvestment of distributions | 277 | – | ||||||
|
| |||||||
Net increase in net assets from Class A share transactions | 25,383 | – | ||||||
|
| |||||||
TOTAL INCREASE IN NET ASSETS | 7,772,950 | 5,158,137 | ||||||
|
| |||||||
NET ASSETS: | ||||||||
Beginning of period | 5,158,137 | – | ||||||
|
| |||||||
End of period * | $ | 12,931,087 | $ | 5,158,137 | ||||
|
| |||||||
|
| |||||||
*Including accumulated net investment income of : | $ | 73,847 | $ | 70,257 | ||||
(a) Commenced operations on October 1, 2012.
See Notes to Financial Statements. | ||
Semi-Annual Report | November 30, 2013 | 65 |
Table of Contents
Selected Per Share Data and Ratios for a Share Outstanding Throughout the Periods Presented:
Net asset value, beginning of period |
Income (loss) from investment operations |
Net investment loss(a) |
Net realized and unrealized gains on investments and foreign currencies |
Total from investment operations |
Less distributions |
From net investment income |
From net realized gains |
Total distributions |
Proceeds from redemption fees collected |
Net asset value, end of period |
Total return(c) |
Net assets, end of period (in 000s) |
RATIOS TO AVERAGE NET ASSETS: |
Expenses including interest and dividend expense |
Expenses excluding interest and dividend expense(f)(g) |
Expenses after advisory fees waived and expenses reimbursed excluding interest and dividend expense(f)(g) |
Net investment loss |
Portfolio turnover rate |
(a) | Per share amounts were calculated using average shares for the period. |
(b) | Amount rounds to less than $0.01 per share. |
(c) | Total return is a measure of the change in the value of an investment in the Fund over the years covered, which assumes any dividends or capital gains distributions are reinvested in shares of the Fund. Returns shown do not reflect the deduction of taxes a shareholder would pay on Fund distributions or the redemption of Fund shares. |
(d) | Not Annualized. |
(e) | Annualized. |
(f) | Dividend expense totaled 0.32% (annualized), 0.42%, 0.58%, 0.51%, 0.88% and 0.74%, respectively, of average net assets for the six months ended November 30, 2013 and the years ended May 31, 2013, 2012, 2011, 2010 and 2009 respectively. |
(g) | Interest rebate expense and line of credit interest expense totaled 0.10% (annualized), 0.10%, 0.20%, 0.13%, 0.29% and 0.58%, respectively, of average net assets for the six months ended November 30, 2013 and the years ended May 31, 2013, 2012, 2011, 2010, and 2009, respectively. |
See Notes to Financial Statements. | ||
66 | www.arbitragefunds.com | 1-800-295-4485 |
Table of Contents
| Financial Highlights | ||
Six Months Ended November 30, 2013 (Unaudited) | Year Ended May 31, 2013 | Year Ended May 31, 2012 | Year Ended May 31, 2011 | Year Ended May 31, 2010 | Year Ended May 31, 2009 | |||||
| $12.50 | $12.80 | $12.77 | $12.50 | $12.43 | $12.79 | |||||
| (0.01) | (0.10) | (0.11) | (0.12) | (0.14) | (0.16) | |||||
| 0.12 | 0.15 | 0.44 | 0.66 | 0.52 | 0.30 | |||||
| 0.11 | 0.05 | 0.33 | 0.54 | 0.38 | 0.14 | |||||
| ||||||||||
| – | (0.09) | – | – | (0.05) | – | |||||
| – | (0.26) | (0.30) | (0.27) | (0.26) | (0.52) | |||||
| – | (0.35) | (0.30) | (0.27) | (0.31) | (0.52) | |||||
| 0.00(b) | 0.00(b) | 0.00(b) | 0.00(b) | 0.00(b) | 0.02 | |||||
| $12.61 | $12.50 | $12.80 | $12.77 | $12.50 | $12.43 | |||||
| 0.88%(d) | 0.42% | 2.54% | 4.37% | 3.08% | 1.64% | |||||
| $914,906 | $916,677 | $1,003,646 | $866,885 | $759,235 | $219,338 | |||||
| 1.87%(e) | 1.97% | 2.23% | 2.16% | 2.80% | 3.28% | |||||
| 1.46%(e) | 1.45% | 1.45% | 1.52% | 1.63% | 1.95% | |||||
| 1.46%(e) | 1.45% | 1.44% | 1.52% | 1.63% | 1.95% | |||||
| (0.09)%(e) | (0.78)% | (0.83)% | (0.93)% | (1.12)% | (1.34)% | |||||
| 202%(d) | 459% | 563% | 389% | 371% | 709% | |||||
Semi-Annual Report | November 30, 2013 | 67 |
Table of Contents
Selected Per Share Data and Ratios for a Share Outstanding Throughout the Periods Presented:
Net asset value, beginning of period |
Income (loss) from investment operations |
Net investment income (loss)(a) |
Net realized and unrealized gains on investments and foreign currencies |
Total from investment operations |
Less distributions |
From net investment income |
From net realized gains |
Total distributions |
Proceeds from redemption fees collected |
Net asset value, end of period |
Total return(c) |
Net assets, end of period : (in 000s) |
RATIOS TO AVERAGE NET ASSETS |
Expenses including interest and dividend expense |
Expenses excluding interest and dividend expense(f)(g) |
Expenses after advisory fees waived and expenses reimbursed excluding interest and dividend expense(f)(g) |
Net investment income (loss) |
Portfolio turnover rate |
(a) | Per share amounts were calculated using average shares for the period. |
(b) | Amount rounds to less than $0.01 per share. |
(c) | Total return is a measure of the change in the value of an investment in the Fund over the years covered, which assumes any dividends or capital gains distributions are reinvested in shares of the Fund. Returns shown do not reflect the deduction of taxes a shareholder would pay on Fund distributions or the redemption of Fund shares. |
(d) | Not Annualized. |
(e) | Annualized. |
(f) | Dividend expense totaled 0.32% (annualized), 0.42%, 0.58%, 0.51%, 0.88% and 0.74%, respectively, of average net assets for the six months ended November 30, 2013 and the years ended May 31, 2013, 2012, 2011, 2010 and 2009 respectively. |
(g) | Interest rebate expense and line of credit interest expense totaled 0.10% (annualized), 0.10%, 0.20%, 0.13%, 0.29% and 0.58%, respectively, of average net assets for the six months ended November 30, 2013 and the years ended May 31, 2013, 2012, 2011, 2010, and 2009, respectively. |
See Notes to Financial Statements. | ||
68 | www.arbitragefunds.com | 1-800-295-4485 |
Table of Contents
| Financial Highlights | ||
Six Months Ended November 30, 2013 (Unaudited) | Year Ended May 31, 2013 | Year Ended May 31, 2012 | Year Ended May 31, 2011 | Year Ended May 31, 2010 | Year Ended May 31, 2009 | |||||
| $12.74 | $13.04 | $12.98 | $12.68 | $12.60 | $12.95 | |||||
| 0.01 | (0.07) | (0.07) | (0.08) | (0.11) | (0.11) | |||||
| 0.12 | 0.16 | 0.43 | 0.67 | 0.52 | 0.28 | |||||
| 0.13 | 0.09 | 0.36 | 0.59 | 0.41 | 0.17 | |||||
| ||||||||||
| – | (0.13) | – | (0.02) | (0.07) | – | |||||
| – | (0.26) | (0.30) | (0.27) | (0.26) | (0.52) | |||||
| – | (0.39) | (0.30) | (0.29) | (0.33) | (0.52) | |||||
| 0.00(b) | 0.00(b) | 0.00(b) | 0.00(b) | 0.00(b) | 0.00(b) | |||||
| $12.87 | $12.74 | $13.04 | $12.98 | $12.68 | $12.60 | |||||
| 1.02%(d) | 0.67% | 2.74% | 4.74% | 3.28% | 1.69% | |||||
| $1,879,787 | $1,937,514 | $2,084,530 | $1,346,801 | $582,460 | $108,780 | |||||
| 1.62%(e) | 1.72% | 1.98% | 1.91% | 2.55% | 3.03% | |||||
| 1.21%(e) | 1.20% | 1.20% | 1.27% | 1.38% | 1.70% | |||||
| 1.21%(e) | 1.20% | 1.20% | 1.27% | 1.38% | 1.70% | |||||
| 0.17%(e) | (0.51)% | (0.56)% | (0.62)% | (0.85)% | (0.87)% | |||||
| 202%(d) | 459% | 563% | 389% | 371% | 709% | |||||
Semi-Annual Report | November 30, 2013 | 69 |
Table of Contents
| �� | ||
Selected Per Share Data and Ratios for a Share Outstanding Throughout the Periods Presented:
Net asset value, beginning of period |
Income (loss) from investment operations |
Net investment loss(b) |
Net realized and unrealized gains on investments and foreign currencies |
Total from investment operations |
Less distributions |
From net investment income |
From net realized gains |
Total distributions |
Proceeds from redemption fees collected |
Net asset value, end of period |
Total return(d) |
Net assets, end of period (in 000s) |
RATIOS TO AVERAGE NET ASSETS |
Expenses including interest and dividend expense |
Expenses excluding interest and dividend expense(g)(h) |
Expenses after advisory fees waived and expenses reimbursed excluding interest and dividend expense(g)(h) |
Net investment loss |
Portfolio turnover rate |
(a) | Commenced operations on June 1, 2012. |
(b) | Per share amounts were calculated using average shares for the period. |
(c) | Amount rounds to less than $0.01 per share. |
(d) | Total return is a measure of the change in the value of an investment in the Fund over the years covered, which assumes any dividends or capital gains distributions are reinvested in shares of the Fund. Returns shown do not reflect the deduction of taxes a shareholder would pay on Fund distributions or the redemption of Fund shares. |
(e) | Not Annualized. |
(f) | Annualized. |
(g) | Dividend expense totaled 0.32% (annualized) and 0.42% of average net assets for the six months ended November 30, 2013 the year ended May 31, 2013. |
(h) | Interest rebate expense and line of credit interest expense totaled 0.10% (annualized) and 0.11% of average net assets for the six months ended November 30, 2013 and the year ended May 31, 2013. |
See Notes to Financial Statements. | ||
70 | www.arbitragefunds.com | 1-800-295-4485 |
Table of Contents
| Financial Highlights | ||
Six Months November 30, | Year Ended May 31, 2013 (a) | |
| $12.38 | $12.80 | |
| (0.05) | (0.23) | |
| 0.12 | 0.20 | |
| ||
| 0.07 | (0.03) | |
| ||
| – | (0.13) | |
| – | (0.26) | |
| ||
| – | (0.39) | |
| ||
| 0.00(c) | 0.00(c) | |
| ||
| $12.45 | $12.38 | |
| ||
| 0.57%(e) | (0.27%) | |
| $31,546 | $18,741 | |
| 2.62%(f) | 2.75% | |
| 2.21%(f) | 2.20% | |
| 2.21%(f) | 2.20% | |
| (0.87)%(f) | (1.84)% | |
| 202%(e) | 459% | |
| ||
Semi-Annual Report | November 30, 2013 | 71 |
Table of Contents
| Financial Highlights | ||
Selected Per Share Data and Ratios for a Share Outstanding Throughout the Period Presented:
| Six Months Ended November 30, 2013 (Unaudited) (a) | ||
Net asset value, beginning of period | $12.50 | |
Income (loss) from investment operations | ||
Net investment loss(b) | (0.01) | |
Net realized and unrealized gains on investments and foreign currencies | 0.13 | |
| ||
Total from investment operations | 0.12 | |
| ||
Less distributions | ||
From net realized gains | ||
| ||
Total distributions | – | |
| ||
Net asset value, end of period | $12.62 | |
| ||
Total return(c) | 0.96%(d) | |
Net assets, end of period (in 000s) | $2,384 | |
RATIOS TO AVERAGE NET ASSETS: | ||
Expenses including interest and dividend expense | 1.89%(e) | |
Expenses excluding interest and dividend expense(f)(g) | 1.48%(e) | |
Expenses after advisory fees waived and expenses reimbursed excluding interest and dividend expense(f)(g) | 1.44%(e) | |
Net investment loss | (0.12)%(e) | |
Portfolio turnover rate | 202%(d) | |
(a) | Commenced Operations on June 1, 2013. |
(b) | Per share amounts were calculated using average shares for the period. |
(c) | Total return is a measure of the change in the value of an investment in the Fund over the years covered, which assumes any dividends or capital gains distributions are reinvested in shares of the Fund. Returns shown do not reflect the deduction of taxes a shareholder would pay on Fund distributions or the redemption of Fund shares. |
(d) | Not Annualized. |
(e) | Annualized. |
(f) | Dividend expense totaled 0.32% (annualized) of average net assets for the six months ended November 30, 2013. |
(g) | Interest rebate expense and line of credit interest expense totaled 0.10% (annualized) of average net assets for the six months ended November 30, 2013. |
See Notes to Financial Statements. | ||
72 | www.arbitragefunds.com | 1-800-295-4485 |
Table of Contents
Page Intentionally Left Blank
Table of Contents
Selected Per Share Data and Ratios for a Share Outstanding Throughout the Periods Presented:
Net asset value, beginning of period |
Income (loss) from investment operations |
Net investment income (loss)(b) |
Net realized and unrealized gains on investments and foreign currencies |
Total from investment operations |
Less distributions |
From net investment income |
From net realized gains |
Total distributions |
Proceeds from redemption fees collected |
Net asset value, end of period |
Total return(d) |
Net assets, end of period (in 000s) |
RATIOS TO AVERAGE NET ASSETS: |
Expenses including interest and dividend expense |
Expenses excluding interest and dividend expense(g)(h) |
Expenses after advisory fees waived and expenses reimbursed excluding interest and dividend expense(g)(h) |
Net investment income (loss) |
Portfolio turnover rate |
(a) | Commenced operations on October 1, 2010. |
(b) | Per share amounts were calculated using average shares for the period. |
(c) | Amount rounds to less than $0.01 per share. |
(d) | Total return is a measure of the change in the value of an investment in the Fund over the years covered, which assumes any dividends or capital gains distributions are reinvested in shares of the Fund. Returns shown do not reflect the deduction of taxes a shareholder would pay on Fund distributions or the redemption of Fund shares. |
(e) | Not Annualized. |
(f) | Annualized. |
(g) | Dividend expense totaled 0.31% (annualized), 0.36%, 0.27% and 0.28% (annualized), respectively, of average net assets for the six months ended November 30, 2013 and the years ended May 31, 2013, 2012 and the period ended May 31, 2011, respectively. |
(h) | Interest rebate expense and line of credit interest expense totaled 0.09% (annualized), 0.13%, 0.21% and 0.21% (annualized) of average net assets for the six months ended November 30, 2013 and the years ended May 31, 2013, 2012 and the period ended May 31, 2011, respectively. |
See Notes to Financial Statements. | ||
74 | www.arbitragefunds.com | 1-800-295-4485 |
Table of Contents
| Financial Highlights | ||
Six Months November 30, 2013 | Year Ended May 31, 2013 | Year Ended May 31, 2012 | Period Ended May 31, 2011(a) | |||
| $9.80 | $9.79 | $10.23 | $10.00 | |||
| 0.09 | 0.15 | 0.10 | (0.02) | |||
| 0.27 | 0.11 | 0.09 | 0.36 | |||
| 0.36 | 0.26 | 0.19 | 0.34 | |||
| ||||||
| – | (0.10) | (0.15) | (0.01) | |||
| – | (0.15) | (0.48) | (0.10) | |||
| – | (0.25) | (0.63) | (0.11) | |||
| 0.00(c) | 0.00(c) | 0.00(c) | 0.00(c) | |||
| $10.16 | $9.80 | $9.79 | $10.23 | |||
| 3.67%(e) | 2.72% | 1.88% | 3.43%(e) | |||
| $27,695 | $10,080 | $8,976 | $4,867 | |||
| 2.26%(f) | 2.55% | 2.67% | 4.33%(f) | |||
| 1.86%(f) | 2.06% | 2.19% | 3.84%(f) | |||
| 1.69%(f) | 1.69% | 1.69% | 1.69%(f) | |||
| 1.84%(f) | 1.58% | 1.02% | (0.26)%(f) | |||
| 172%(e) | 336% | 490% | 298%(e) | |||
Semi-Annual Report | November 30, 2013 | 75 |
Table of Contents
Selected Per Share Data and Ratios for a Share Outstanding Throughout the Periods Presented:
Net asset value, beginning of period |
Income (loss) from investment operations |
Net investment income(b) |
Net realized and unrealized gains on investments and foreign currencies |
Total from investment operations |
Less distributions |
From net investment income |
From net realized gains |
Total distributions |
Proceeds from redemption fees collected |
Net asset value, end of period |
Total return(d) |
Net assets, end of period (in 000s) |
RATIOS TO AVERAGE NET ASSETS: |
Expenses including interest and dividend expense |
Expenses excluding interest and dividend expense(g)(h) |
Expenses after advisory fees waived and expenses reimbursed excluding interest and dividend expense(g)(h) |
Net investment income |
Portfolio turnover rate |
(a) | Commenced operations on October 1, 2010. |
(b) | Per share amounts were calculated using average shares for the period. |
(c) | Amount rounds to less than $0.01 per share. |
(d) | Total return is a measure of the change in the value of an investment in the Fund over the years covered, which assumes any dividends or capital gains distributions are reinvested in shares of the Fund. Returns shown do not reflect the deduction of taxes a shareholder would pay on Fund distributions or the redemption of Fund shares. |
(e) | Not Annualized. |
(f) | Annualized. |
(g) | Dividend expense totaled 0.31% (annualized), 0.36%, 0.27% and 0.28% (annualized), respectively, of average net assets for the six months ended November 30, 2013 and the years ended May 31, 2013, 2012 and the period ended May 31, 2011, respectively. |
(h) | Interest rebate expense and line of credit interest expense totaled 0.09% (annualized), 0.13%, 0.21% and 0.21% (annualized) of average net assets for the six months ended November 30, 2013 and the years ended May 31, 2013, 2012 and the period ended May 31, 2011, respectively. |
See Notes to Financial Statements. | ||
76 | www.arbitragefunds.com | 1-800-295-4485 |
Table of Contents
| Financial Highlights | ||
Six Months November 30, | Year Ended May 31, 2013 | Year Ended May 31, 2012 | Period Ended May 31, 2011(a) | |||
| $9.86 | $9.82 | $10.24 | $10.00 | |||
| 0.10 | 0.16 | 0.12 | 0.01 | |||
| 0.27 | 0.13 | 0.09 | 0.35 | |||
| 0.37 | 0.29 | 0.21 | 0.36 | |||
| – | (0.10) | (0.15) | (0.02) | |||
| – | (0.15) | (0.48) | (0.10) | |||
| – | (0.25) | (0.63) | (0.12) | |||
| 0.00(c) | 0.00(c) | 0.00(c) | 0.00(c) | |||
| $10.23 | $9.86 | $9.82 | $10.24 | |||
| 3.75%(e) | 3.04% | 2.09% | 3.57%(e) | |||
| $90,924 | $41,493 | $21,389 | $11,701 | |||
| 1.99%(f) | 2.31% | 2.42% | 4.73%(f) | |||
| 1.59%(f) | 1.82% | 1.94% | 4.24%(f) | |||
| 1.44%(f) | 1.44% | 1.44% | 1.44%(f) | |||
| 2.00%(f) | 1.68% | 1.25% | 0.12%(f) | |||
| 172%(e) | 336% | 490% | 298%(e) | |||
Semi-Annual Report | November 30, 2013 | 77 |
Table of Contents
Selected Per Share Data and Ratios for a Share Outstanding Throughout the Periods Presented:
Net asset value, beginning of period |
Income (loss) from investment operations |
Net investment income(b) |
Net realized and unrealized gains on investments and foreign currencies |
Total from investment operations |
Less distributions |
From net investment income |
From net realized gains |
Total distributions |
Proceeds from redemption fees collected |
Net asset value, end of period |
Total return(c) |
Net assets, end of period (in 000s) |
RATIOS TO AVERAGE NET ASSETS: |
Expenses including interest and dividend expense |
Expenses excluding interest and dividend expense(f)(g) |
Expenses after advisory fees waived and expenses reimbursed excluding interest and dividend expense(f)(g) |
Net investment income |
Portfolio turnover rate |
(a) | Commenced operations on June 1, 2012. |
(b) | Per share amounts were calculated using average shares for the period. |
(c) | Total return is a measure of the change in the value of an investment in the Fund over the years covered, which assumes any dividends or capital gains distributions are reinvested in shares of the Fund. Returns shown do not reflect the deduction of taxes a shareholder would pay on Fund distributions or the redemption of Fund shares. |
(d) | Not Annualized. |
(e) | Annualized. |
(f) | Dividend expense totaled 0.31% (annualized) and 0.36% of average net assets for the six months ended November 30, 2013 and the year ended May 31, 2013. |
(g) | Interest rebate expense and line of credit interest expense totaled 0.09% (annualized) and 0.13% of average net assets for the six months ended November 30, 2013 and the year ended May 31, 2013. |
See Notes to Financial Statements. | ||
78 | www.arbitragefunds.com | 1-800-295-4485 |
Table of Contents
| Financial Highlights | ||
Six Months Ended November 30, 2013 (Unaudited) | Year Ended May 31, 2013 (a) | |
| $9.78 | $9.79 | |
| 0.06 | 0.09 | |
| 0.26 | 0.13 | |
| 0.32 | 0.22 | |
| ||
| – | (0.08) | |
| – | (0.15) | |
| – | (0.23) | |
| – | – | |
| $10.10 | $9.78 | |
| 3.27%(d) | 2.33% | |
| $1,131 | $342 | |
| 3.02%(e) | 3.31% | |
| 2.62%(e) | 2.82% | |
| 2.44%(e) | 2.44% | |
| 1.13%(e) | 0.95% | |
| 172%(d) | 336% | |
Semi-Annual Report | November 30, 2013 | 79 |
Table of Contents
| Financial Highlights | ||
Selected Per Share Data and Ratios for a Share Outstanding Throughout the Period Presented:
Six Months Ended November 30, 2013 (Unaudited) (a) | ||
Net asset value, beginning of period | $9.80 | |
Income (loss) from investment operations | ||
Net investment income(b) | 0.07 | |
Net realized and unrealized gains on investments and foreign currencies | 0.29 | |
| ||
Total from investment operations | 0.36 | |
| ||
Less distributions | ||
From net realized gains | ||
| ||
Total distributions | – | |
| ||
Net asset value, end of period | $10.16 | |
| ||
Total return(c) | 3.67%(d) | |
Net assets, end of period (in 000s) | $1,029 | |
RATIOS TO AVERAGE NET ASSETS: | ||
Expenses including interest and dividend expense | 2.24%(e) | |
Expenses excluding interest and dividend expense(f)(g) | 1.84%(e) | |
Expenses after advisory fees waived and expenses reimbursed excluding interest and dividend expense(f)(g) | 1.69%(e) | |
Net investment income | 1.41%(e) | |
Portfolio turnover rate | 172%(d) | |
(a) | Commenced Operations on June 1, 2013. |
(b) | Per share amounts were calculated using average shares for the period. |
(c) | Total return is a measure of the change in the value of an investment in the Fund over the years covered, which assumes any dividends or capital gains distributions are reinvested in shares of the Fund. Returns shown do not reflect the deduction of taxes a shareholder would pay on Fund distributions or the redemption of Fund shares. |
(d) | Not Annualized. |
(e) | Annualized. |
(f) | Dividend expense totaled 0.31% (annualized) of average net assets for the six months ended November 30, 2013. |
(g) | Interest rebate expense and line of credit interest expense totaled 0.09% (annualized) of average net assets for the six months ended November 30, 2013. |
See Notes to Financial Statements. | ||
80 | www.arbitragefunds.com | 1-800-295-4485 |
Table of Contents
Page Intentionally Left Blank
Table of Contents
Selected Per Share Data and Ratios for a Share Outstanding Throughout the Periods Presented:
Net asset value, beginning of period |
Income (loss) from investment operations |
Net investment income(b) |
Net realized and unrealized gains on investments and foreign currencies |
Total from investment operations |
Less distributions |
From net investment income |
Total distributions |
Proceeds from redemption fees collected |
Net asset value, end of period |
Total return (d) |
Net assets, end of period (in 000s) |
RATIOS TO AVERAGE NET ASSETS: |
Expenses including interest and dividend expense |
Expenses excluding interest and dividend expense(g)(h) |
Expenses after advisory fees waived and expenses reimbursed excluding interest and dividend expense(g)(h) |
Net investment income |
Portfolio turnover rate |
(a) | Commenced Operations on October 1, 2012. |
(b) | Per share amounts were calculated using average shares for the period. |
(c) | Amount rounds to less than $0.01 per share. |
(d) | Total return is a measure of the change in the value of an investment in the Fund over the years covered, which assumes any dividends or capital gains distributions are reinvested in shares of the Fund. Returns shown do not reflect the deduction of taxes a shareholder would pay on Fund distributions or the redemption of Fund shares. |
(e) | Not Annualized. |
(f) | Annualized. |
(g) | Dividend expense totaled 0.17% (annualized) and 0.03% (annualized) of average net assets for the six months ended November 30, 2013 and the period ended May 31, 2013. |
(h) | Interest rebate expense totaled 0.03% (annualized) and 0.02% (annualized) of average net assets for the six months ended November 30, 2013 and the period ended May 31, 2013. |
See Notes to Financial Statements. | ||
82 | www.arbitragefunds.com | 1-800-295-4485 |
Table of Contents
| Financial Highlights | ||
Six Months Ended November 30, | Period Ended May 31, 2013(a) | |
| $10.18 | $10.00 | |
| 0.22 | 0.17 | |
| 0.11 | 0.06 | |
| 0.33 | 0.23 | |
| ||
| (0.26) | (0.05) | |
| (0.26) | (0.05) | |
| 0.00(c) | 0.00(c) | |
| $10.25 | $10.18 | |
| 3.35%(e) | 2.33%(e) | |
| $3,150 | $1,671 | |
| 3.41%(f) | 3.79%(f) | |
| 3.21%(f) | 3.74%(f) | |
| 1.50%(f) | 1.50%(f) | |
| 4.37%(f) | 2.49%(f) | |
| 77%(e) | 92%(e) | |
Semi-Annual Report | November 30, 2013 | 83 |
Table of Contents
Selected Per Share Data and Ratios for a Share Outstanding Throughout the Periods Presented:
Net asset value, beginning of period |
Income (loss) from investment operations |
Net investment income(b) |
Net realized and unrealized gains on investments and foreign currencies |
Total from investment operations |
Less distributions |
From net investment income |
Total distributions |
Proceeds from redemption fees collected |
Net asset value, end of period |
Total return(d) |
Net assets, end of period (in 000s) |
RATIOS TO AVERAGE NET ASSETS: |
Expenses including interest and dividend expense |
Expenses excluding interest and dividend expense(g)(h) |
Expenses after advisory fees waived and expenses reimbursed excluding interest and dividend expense(g)(h) |
Net investment income |
Portfolio turnover rate |
(a) | Commenced Operations on October 1, 2012. |
(b) | Per share amounts were calculated using average shares for the period. |
(c) | Amount rounds to less than $0.01 per share. |
(d) | Total return is a measure of the change in the value of an investment in the Fund over the years covered, which assumes any dividends or capital gains distributions are reinvested in shares of the Fund. Returns shown do not reflect the deduction of taxes a shareholder would pay on Fund distributions or the redemption of Fund shares. |
(e) | Not Annualized. |
(f) | Annualized. |
(g) | Dividend expense totaled 0.17% (annualized) and 0.03% (annualized) of average net assets for the six months ended November 30, 2013 and the period ended May 31, 2013. |
(h) | Interest rebate expense totaled 0.03% (annualized) and 0.01% (annualized) of average net assets for the six months ended November 30, 2013 and the period ended May 31, 2013. |
See Notes to Financial Statements. | ||
84 | www.arbitragefunds.com | 1-800-295-4485 |
Table of Contents
| Financial Highlights | ||
| Six Months Ended November 30, 2013 (Unaudited) | Period Ended May 31, 2013(a) | |
| $10.16 | $10.00 | |
| 0.23 | 0.17 | |
| 0.10 | 0.08 | |
| 0.33 | 0.25 | |
| ||
| (0.27) | (0.09) | |
| (0.27) | (0.09) | |
| 0.00(c) | – | |
| $10.22 | $10.16 | |
| 3.34%(e) | 2.49%(e) | |
| $9,664 | $3,462 | |
| 3.31%(f) | 3.64%(f) | |
| 3.12%(f) | 3.60%(f) | |
| 1.25%(f) | 1.25%(f) | |
| 4.62%(f) | 2.62%(f) | |
| 77%(e) | 92%(e) | |
Semi-Annual Report | November 30, 2013 | 85 |
Table of Contents
Selected Per Share Data and Ratios for a Share Outstanding Throughout the Periods Presented:
Net asset value, beginning of period |
Income (loss) from investment operations |
Net investment income(b) |
Net realized and unrealized gains on investments and foreign currencies |
Total from investment operations |
Less distributions |
From net investment income |
Total distributions |
Proceeds from redemption fees collected |
Net asset value, end of period |
Total return(c) |
Net assets, end of period (in 000s) |
RATIOS TO AVERAGE NET ASSETS: |
Expenses including interest and dividend expense |
Expenses excluding interest and dividend expense(f)(g) |
Expenses after advisory fees waived and expenses reimbursed excluding interest and dividend expense(f)(g) |
Net investment income |
Portfolio turnover rate |
(a) | Commenced Operations on October 1, 2012. |
(b) | Per share amounts were calculated using average shares for the period. |
(c) | Total return is a measure of the change in the value of an investment in the Fund over the years covered, which assumes any dividends or capital gains distributions are reinvested in shares of the Fund. Returns shown do not reflect the deduction of taxes a shareholder would pay on Fund distributions or the redemption of Fund shares. |
(d) | Not Annualized. |
(e) | Annualized. |
(f) | Dividend expense totaled 0.17% (annualized) and 0.03% (annualized) of average net assets for the six months ended November 30, 2013 and the period ended May 31, 2013. |
(g) | Interest rebate expense totaled 0.03% (annualized) and 0.02% (annualized) of average net assets for the six months ended November 30, 2013 and the period ended May 31, 2013. |
See Notes to Financial Statements. | ||
86 | www.arbitragefunds.com | 1-800-295-4485 |
Table of Contents
| Financial Highlights | ||
| Six Months Ended November 30, 2013 (Unaudited) | Period Ended May 31, 2013(a) | |
| $10.17 | $10.00 | |
| 0.19 | 0.11 | |
| 0.09 | 0.09 | |
| 0.28 | 0.20 | |
| ||
| (0.25) | (0.03) | |
| (0.25) | (0.03) | |
| – | – | |
| $10.20 | $10.17 | |
| 2.82%(d) | 2.01%(d) | |
| $91 | $26 | |
| 4.73%(e) | 4.69%(e) | |
| 4.54%(e) | 4.64%(e) | |
| 2.25%(e) | 2.25%(e) | |
| 3.67%(e) | 1.58%(e) | |
| 77%(d) | 92%(d) | |
Semi-Annual Report | November 30, 2013 | 87 |
Table of Contents
| Financial Highlights | ||
Selected Per Share Data and Ratios for a Share Outstanding Throughout the Period Presented:
| Period Ended November 30, 2013 (Unaudited) (a) | ||
Net asset value, beginning of period | $10.18 | |
Income (loss) from investment operations | ||
Net investment income(b) | 0.23 | |
Net realized and unrealized gains on investments and foreign currencies | 0.10 | |
| ||
Total from investment operations | 0.33 | |
| ||
Less distributions | ||
From net investment income | (0.28) | |
| ||
Total distributions | (0.28) | |
| ||
Net asset value, end of period | $10.23 | |
| ||
Total return(c) | 3.30%(d) | |
Net assets, end of period (in 000s) | $26 | |
RATIOS TO AVERAGE NET ASSETS: | ||
Expenses including interest and dividend expense | 3.57%(e) | |
Expenses excluding interest and dividend expense(f)(g) | 3.38%(e) | |
Expenses after advisory fees waived and expenses reimbursed excluding interest and dividend expense(f)(g) | 1.50%(e) | |
Net investment income | 4.53%(e) | |
Portfolio turnover rate | 77%(d) | |
(a) | Commenced Operations on June 1, 2013. |
(b) | Per share amounts were calculated using average shares for the period. |
(c) | Total return is a measure of the change in the value of an investment in the Fund over the years covered, which assumes any dividends or capital gains distributions are reinvested in shares of the Fund. Returns shown do not reflect the deduction of taxes a shareholder would pay on Fund distributions or the redemption of Fund shares. |
(d) | Not Annualized. |
(e) | Annualized. |
(f) | Dividend expense totaled 0.17% (annualized) of average net assets for the six months ended November 30, 2013. |
(g) | Interest rebate expense totaled 0.03% (annualized) of average net assets for the six months ended November 30, 2013. |
See Notes to Financial Statements. | ||
88 | www.arbitragefunds.com | 1-800-295-4485 |
Table of Contents
The Arbitrage Funds | Notes to Financial Statements | |
| November 30, 2013 (Unaudited) |
1. ORGANIZATION
The Arbitrage Funds (the “Trust”) was organized as a Delaware business trust on December 22, 1999, and is registered under the Investment Company Act of 1940, as amended (the “1940 Act”), as an open-end management investment company issuing its shares in series, each series representing a distinct portfolio with its own investment objective and policies. The three series presently authorized are The Arbitrage Fund (the “Arbitrage Fund”), The Arbitrage Event-Driven Fund (the “Event-Driven Fund”) and The Arbitrage Credit Opportunities Fund (“Credit Opportunities Fund”), each a “Fund” and collectively the “Funds”, each a diversified series, which offer four classes of shares. Class R shares, Class I shares, Class C shares and Class A shares of the Arbitrage Fund commenced operations on September 18, 2000, October 17, 2003, June 1, 2012 and June 1, 2013, respectively. Class R shares, Class I shares, Class C shares, and Class A shares of the Event-Driven Fund commenced operations on October 1, 2010, October 1, 2010, June 1, 2012 and June 1, 2013, respectively. Class R shares, Class I and Class C shares of the Credit Opportunities Fund commenced operations on October 1, 2012 and Class A shares commenced operations on June 1, 2013.
The investment objective of the Arbitrage Fund is to achieve capital growth by engaging in merger arbitrage. The investment objective of the Event-Driven Fund is to achieve capital growth by investing in companies that are impacted by corporate events such as mergers, acquisitions, restructurings, recapitalizations, refinancings, reorganizations and other special situations. The investment objective of the Credit Opportunities Fund is to provide current income and capital growth by investing in debt securities impacted by events such as reorganizations, restructurings, recapitalizations, debt maturities, refinancings, mergers, acquisitions, regulatory changes and other special situations.
The Funds’ four classes of shares, Class R, Class I, Class C and Class A represent interests in the same portfolio of investments and have the same rights, but differ primarily in the expenses to which they are subject and the investment eligibility requirements. Class R shares, Class C shares and Class A shares are subject to an annual distribution fee of up to 0.25%, 1.00% and 0.25% respectively, of each Fund’s average daily net assets attributable to Class R shares, Class C shares and Class A shares, respectively, whereas Class I shares are not subject to any distribution fees. Class C shares are also subject to a 1.00% contingent deferred sales charge on all purchases redeemed in 12 months of purchase. Class A shares of the Arbitrage Fund are sold subject to a maximum front-end sales load equal to 2.50% of the offering price and are also subject to a 0.50% contingent deferred sales load on purchases at or above $250,000, purchased without a front-end sales charge and redeemed within 12 months of purchase. Class A shares of the Event-Driven Fund and the Credit Opportunities Fund are sold subject to a maximum front-end sales load equal to 3.25% of the offering price and are also subject to a 1.00% contingent deferred sales load on purchases at or above $500,000, purchased without a front-end sales charge and redeemed within 18 months of purchase.
2. SIGNIFICANT ACCOUNTING POLICIES
The following is a summary of significant accounting policies followed by the Funds. These policies are in conformity with U.S. generally accepted accounting principles (“GAAP”).
Use of estimates — The preparation of financial statements in conformity with U.S. generally accepted accounting principles (“GAAP”) requires management to make estimates and
Semi-Annual Report | November 30, 2013 | 89 |
Table of Contents
The Arbitrage Funds | Notes to Financial Statements (continued) | |
| November 30, 2013 (Unaudited) |
assumptions that affect the reported amounts of assets and liabilities at the date of the financial statements and the reported amounts of increases and decreases in net assets from operations during the reporting period. Actual results could differ from those estimates.
Valuation of investments — The Funds’ portfolio securities are valued as of the close of trading of the New York Stock Exchange (“NYSE”) (normally 4:00 p.m., Eastern time). Common stocks and other securities, including open short positions that are traded on a securities exchange, are valued at the last quoted sales price at the close of regular trading on the day the valuation is made. Securities which are quoted by NASDAQ are valued at the NASDAQ Official Closing Price. Price information on listed stocks is taken from the exchange where the security is primarily traded. Securities which are listed on an exchange but which are not traded on the valuation date are valued at the mean of the most recent bid and asked prices. Put and call options and securities traded in the over-the-counter market are valued at the mean of the most recent bid and asked prices. When there is no bid price available, put and call options will be valued using the average of the last ask price and zero. If available, debt securities are priced based upon an evaluated bid provided by independent, third-party pricing agents. The third-party pricing agents may also value debt securities at an evaluated bid price by employing methodologies that utilize actual market transactions, broker-supplied valuations, or other methodologies designed to identify the market value for such securities. Unlisted securities for which market quotations are readily available are valued at the latest quoted bid price. Swap contracts that are listed or traded on a national securities exchange, commodities exchange, contract market or comparable over-the-counter market, and that are freely transferable, are valued at their closing settlement price on the exchange on which they are primarily traded or based upon the current settlement price for a like instrument acquired on the day on which the instrument is being valued. Over-the-counter swap contracts for which market quotations are readily available are valued based on quotes received from independent pricing services or one or more dealers that make markets in such securities. Other assets and securities for which no quotations are readily available are valued at fair value as determined in good faith under the supervision of the Board of Trustees of the Trust. Some of the more common reasons that may necessitate that a security be valued at fair value include: the security’s trading has been halted or suspended; the security has been delisted from a national exchange; the security’s primary trading market is temporarily closed at a time when under normal conditions it would be open; or the security’s primary pricing source is not able or willing to provide a price. Such methods of fair valuation may include, but are not limited to: multiple of earnings, multiple of book value, discount from market of a similar freely traded security, purchase price of a security, subsequent private transactions in the security or related securities, or a combination of these and other factors. Foreign securities are translated from the local currency into U.S. dollars using currency exchange rates supplied by a quotation service (see Note 7).
Fair value measurements — In accordance with the authoritative guidance on fair value measurements under GAAP, the Funds disclose fair value of their investments in a hierarchy that prioritizes the inputs to valuation techniques used to measure the fair value. The objective of a fair value measurement is to determine the price that would be received to sell an asset or paid to transfer a liability in an orderly transaction between market participants at the measurement date (an exit price). Accordingly, the fair value hierarchy gives the highest priority to quoted prices (unadjusted) in active markets for identical assets or liabilities (Level 1) and the lowest priority to unobservable inputs (Level 3). The guidance establishes three levels of the fair value hierarchy as follows:
90 | www.arbitragefunds.com | 1-800-295-4485 |
Table of Contents
The Arbitrage Funds | Notes to Financial Statements (continued) | |
| November 30, 2013 (Unaudited) |
Level 1 — | Unadjusted quoted prices in active markets for identical, unrestricted assets or liabilities that the Funds have the ability to access at the measurement date; | |
Level 2 — | Observable inputs other than quoted prices included in Level 1 that are observable (either directly or indirectly) for substantially the full term of the asset or liability; and | |
Level 3 — | Unobservable inputs for the asset or liability, to the extent relevant observable inputs are not available, representing each Fund’s own assumption about the assumptions a market participant would use in valuing the asset or liability, and would be based on the best information available. | |
Investments are classified within the level of the lowest significant input considered in determining fair value. Investments classified within Level 3, whose fair value measurement considers several inputs, may include Level 1 or Level 2 inputs as components of the overall fair value measurement. The inputs or methodology used for valuing securities are not necessarily an indication of the risk associated with investing in those securities. The Funds recognize transfers between levels as of the beginning of the annual period in which the transfer occurred.
For the period ended November 30, 2013, there have been no significant changes to the Funds’ fair value methodologies. Additionally, during the period ended November 30, 2013, there were no transfers between level 1 and 2 securities. Transfers for level 3 securities, if any, are shown as part of the leveling table in the Portfolio of Investments.
Share valuation and redemption fees — The net asset value per share of each class of shares of the Funds is calculated daily by dividing the total value of a Fund’s assets attributable to that class, less liabilities attributable to that class, by the number of shares of that class outstanding. The offering price and redemption price per share of each class of each Fund is equal to the net asset value per share, except that, shares of Class R, Class I and Class A are subject to a redemption fee of 2% if redeemed within 30 days for the Arbitrage Fund and Event-Driven Fund and 60 days for the Credit Opportunities Fund from the date of purchase. The Class A redemption fee does not apply for purchases over $250,000 in the Arbitrage Fund and purchases over $500,000 in the Event-Driven Fund and Credit Opportunities Fund, as these purchases are subject to a contingent deferred sales charge. For the six months ended November 30, 2013, proceeds from redemption fees in the Arbitrage Fund were $28,915 in Class R, $17,501 in Class I, $3,683 in Class C and $0 in Class A. For the six months ended November 30, 2013, proceeds from redemption fees in the Event-Driven Fund were $455 in Class R, $9,352 in Class I, $0 in Class C and $0 in Class A. For the six months ended November 30, 2013, proceeds from redemption fees in the Credit Opportunities Fund were $711 in Class R, $301 in Class I, $0 in Class C and $0 in Class A. The redemption fee is paid directly to each Fund rather than the Adviser and is allocated pro-rata to the shareholders based on net assets.
Security Transactions — Security transactions are accounted for on trade date. Gains and losses on securities sold are determined on a specific identification basis.
Short Positions — The Funds may sell securities short for economic hedging purposes. Subsequent fluctuations in the market prices of securities sold, but not yet purchased, may require purchasing the securities at prices which may differ from the market value reflected on the Portfolio of Investments. The Funds are liable for any dividends payable on securities while those securities are in a short position. As collateral for their short positions, the Funds are required
Semi-Annual Report | November 30, 2013 | 91 |
Table of Contents
The Arbitrage Funds | Notes to Financial Statements (continued) | |
| November 30, 2013 (Unaudited) |
under the 1940 Act to maintain assets consisting of cash, cash equivalents or liquid securities. The amount of the collateral is required to be adjusted daily to reflect changes in the value of the securities sold short. The Funds are charged an interest rebate expense by the prime broker on securities sold short. The interest rebate expense is charged for the duration of time that a security is sold short and is shown on the Statements of Operations.
Derivative Instruments and Hedging Activities — The following discloses the Funds’ use of derivative instruments and hedging activities.
The Funds’ investment objectives not only permit the Funds to purchase investment securities, they also allow certain Funds to enter into various types of derivative contracts, including, but not limited to swap contracts, forward foreign currency exchange contracts, and purchased and written options. In doing so, the Funds will employ strategies in differing combinations to permit them to increase, decrease, or change the level or types of exposure to market factors. Central to those strategies are features inherent to derivatives that make them more attractive for this purpose than equity or debt securities; they require little or no initial cash investment, they can focus exposure on only certain selected risk factors, and they may not require the ultimate receipt or delivery of the underlying security (or securities) to the contract. This may allow the Funds to pursue their objectives more quickly and efficiently than if they were to make direct purchases or sales of securities capable of effecting a similar response to market factors.
Market Risk Factors: In pursuit of their investment objectives, the Funds may seek to use derivatives to increase or decrease their exposure to the following market risk factors:
Equity Risk: Equity risk relates to the change in value of equity securities as they relate to increases or decreases in the general market.
Interest Rate Risk: Interest rate risk refers to the fluctuations in value of fixed-income securities resulting from the inverse relationship between price and yield. For example, an increase in general interest rates will tend to reduce the market value of fixed income investments, and a decline in general interest rates will tend to increase the value of such investments. In addition, debt securities with longer maturities, which tend to have higher yields, are subject to potentially greater fluctuations in value from changes in interest rates than obligations with shorter maturities.
Foreign Exchange Rate Risk: Foreign exchange rate risk relates to the change in the U.S. dollar value of a security held that is denominated in a foreign currency. The value of a foreign currency denominated security will decrease as the dollar appreciates against the currency, while the value of the foreign currency denominated security will increase as the dollar depreciates against the currency.
Risk of Investing in Derivatives: The Funds’ use of derivatives can result in losses due to unanticipated changes in the market risk factors and the overall market. In instances where the Funds are using derivatives to decrease or hedge exposures to market risk factors for securities held by the Funds, there are also risks that those derivatives may not perform as expected, resulting in losses for the combined or hedged positions.
92 | www.arbitragefunds.com | 1-800-295-4485 |
Table of Contents
The Arbitrage Funds | Notes to Financial Statements (continued) | |
| November 30, 2013 (Unaudited) |
Derivatives may have little or no initial cash investment relative to their market value exposure and therefore can produce significant gains or losses in excess of their cost. This use of embedded leverage allows the Funds to increase their market value exposure relative to their net assets and can substantially increase the volatility of the Funds’ performance.
Additional associated risks from investing in derivatives also exist and potentially could have significant effects on the valuation of the derivative and the Funds. Typically, the associated risks are not the risks that the Funds are attempting to increase or decrease exposure to, per their investment objectives, but are the additional risks from investing in derivatives.
Examples of these associated risks are liquidity risk, which is the risk that the Funds will not be able to sell the derivative in the open market in a timely manner, and counterparty credit risk, which is the risk that the counterparty will not fulfill its obligation to the Funds. Associated risks can be different for each type of derivative and are discussed by each derivative type in the notes that follow.
Option Writing/Purchasing: Certain Funds may write or purchase option contracts to adjust risk and return of their overall investment positions. When a Fund writes or purchases an option, an amount equal to the premium received or paid by the Fund is recorded as a liability or an asset and is subsequently adjusted to the current market value of the option written or purchased. Premiums received or paid from writing or purchasing options that expire unexercised are treated by the Fund on the expiration date as realized gains or losses. The difference between the premium and the amount paid or received on effecting a closing purchase or sale transaction, including brokerage commissions, is also treated as a realized gain or loss. If an option is exercised, the premium paid or received is added to the cost of the purchase or proceeds from the sale in determining whether the Fund has realized a gain or loss on investment transactions. Risks from entering into option transactions arise from the potential inability of counterparties to meet the terms of the contracts, the potential inability to enter into closing transactions because of an illiquid secondary market and from unexpected movements in security values.
A summary of put and call option contracts written in the Arbitrage Fund during the six months ended November 30, 2013, is as follows:
| Put Contracts | Put Premiums | Call Contracts | Call Premiums | |||||||||||||
|
| |||||||||||||||
Options outstanding at beginning of period | 2,493 | $ | 140,837 | 94,373 | $ | 2,466,604 | ||||||||||
Options written | 93,964 | 2,993,434 | 115,449 | 6,658,047 | ||||||||||||
Options closed | (16,604) | (779,029) | (17,231) | (1,032,363) | ||||||||||||
Options exercised | (35,037) | (1,293,170) | (81,000) | (4,068,080) | ||||||||||||
Options expired | (41,466) | (936,874) | (100,770) | (2,367,029) | ||||||||||||
|
| |||||||||||||||
Options outstanding at end of period | 3,350 | $ | 125,198 | 10,821 | $ | 1,657,179 | ||||||||||
|
| |||||||||||||||
Semi-Annual Report | November 30, 2013 | 93 |
Table of Contents
The Arbitrage Funds | Notes to Financial Statements (continued) | |
| November 30, 2013 (Unaudited) |
A summary of put and call option contracts written in the Event-Driven Fund during the six months ended November 30, 2013, is as follows:
| Put Contracts | Put Premiums | Call Contracts | Call Premiums | |||||||||||||
|
| |||||||||||||||
Options outstanding at beginning of period | 291 | $ | 25,068 | 1,304 | $ | 46,909 | ||||||||||
Options written | 4,344 | 161,985 | 8,197 | 406,525 | ||||||||||||
Options closed | (1,174 | ) | (65,410 | ) | (2,788 | ) | (111,363 | ) | ||||||||
Options exercised | (1,196 | ) | (59,591 | ) | (3,373 | ) | (159,984 | ) | ||||||||
Options expired | (1,996 | ) | (50,142 | ) | (2,338 | ) | (92,770 | ) | ||||||||
|
| |||||||||||||||
Options outstanding at end of period | 269 | $ | 11,910 | 1,002 | $ | 89,317 | ||||||||||
|
| |||||||||||||||
A summary of put and call option contracts written in the Credit Opportunities Fund during the six months ended November 30, 2013, is as follows:
| Put Contracts | Put Premiums | Call Contracts | Call Premiums | |||||||||||||
|
| |||||||||||||||
Options outstanding at beginning of period | – | $ | – | – | $ | – | ||||||||||
Options written | 1 | 84 | 1 | 91 | ||||||||||||
Options closed | (1 | ) | (84 | ) | – | – | ||||||||||
Options exercised | – | – | – | – | ||||||||||||
Options expired | – | – | (1 | ) | (91 | ) | ||||||||||
|
| |||||||||||||||
Options outstanding at end of period | – | $ | – | – | $ | – | ||||||||||
|
| |||||||||||||||
Foreign currency exchange contracts: The Funds may enter into forward foreign currency exchange contracts as a way of managing foreign exchange rate risk. The Funds may enter into these contracts for the purchase or sale of a specific foreign currency at a fixed price on a future date as a hedge or cross-hedge against either specific transactions or portfolio positions. The objective of the Funds’ foreign currency hedging transactions is to reduce risk that the U.S. dollar value of the Funds’ securities denominated in foreign currency will decline in value due to changes in foreign currency exchange rates.
Warrants and Rights: The Funds may invest in warrants. A Fund may purchase warrants issued by domestic and foreign companies to purchase newly created equity securities consisting of common and preferred stock. Warrants are securities that give the holder the right, but not the obligation to purchase equity issues of the company issuing the warrants, or a related company, at a fixed price either on a date certain or during a set period. The equity security underlying a warrant is authorized at the time the warrant is issued or is issued together with the warrant.
Investing in warrants can provide a greater potential for profit or loss than an equivalent investment in the underlying security, and, thus, can be a speculative investment. At the time of issue, the cost of a warrant is substantially less than the cost of the underlying security itself, and price movements in the underlying security are generally magnified in the price movements of the warrant. This leveraging effect enables the investor to gain exposure to the underlying security with a relatively low capital investment. This leveraging increases an investor’s risk, however, in the event of a decline in the value of the underlying security, a complete loss of the amount
94 | www.arbitragefunds.com | 1-800-295-4485 |
Table of Contents
The Arbitrage Funds | Notes to Financial Statements (continued) | |
| November 30, 2013 (Unaudited) |
invested in the warrant may result. In addition, the price of a warrant tends to be more volatile than, and may not correlate exactly to, the price of the underlying security. If the market price of the underlying security is below the exercise price of the warrant on its expiration date, the warrant will generally expire without value. The value of a warrant may decline because of a decline in the value of the underlying security, the passage of time, changes in interest rates or in the dividend or other policies of the company whose equity underlies the warrant or a change in the perception as to the future price of the underlying security, or any combination thereof. Warrants generally pay no dividends and confer no voting or other rights other than to purchase the underlying security.
Equity swap contracts: The Funds may invest in swaps for the purpose of managing exposure to interest rate, credit or market risk. Additionally, the Funds enter into equity swap agreements for the purpose of attempting to obtain a desired return on, or exposure to, certain equity securities or equity indices in an expedited manner or at a lower cost to the Funds than if the Funds had invested directly in such securities. An equity swap contract entitles the Funds to receive from the counterparty any appreciation and dividends paid on an individual security, while obligating the Funds to pay the counterparty any depreciation on the security. Fluctuations in the value of an open contract are recorded daily as a net unrealized gain or loss. The Funds will realize a gain or loss upon termination or reset of the contract. Either party, under certain conditions, may terminate the contract prior to the contract’s expiration date. Collateral, in the form of cash or securities, may be required to be held in segregated accounts with the Funds’ custodian and/or counterparty’s broker. Risks may exceed amounts recognized on the Statements of Assets and Liabilities. These risks include changes in the returns of the underlying instruments, failure of the counterparties to perform under the contracts’ terms and the possible lack of liquidity with respect to the swap agreements.
Whether a Fund’s use of swap agreements will be successful in furthering its investment objective will depend on Management’s ability to correctly predict whether certain types of investments are likely to produce greater returns than other investments. Because they are two-party contracts and because they may have terms of greater than seven days, swap agreements may be considered to be illiquid investments. Moreover, a Fund bears the risk of loss of the amount expected to be received under a swap agreement in the event of the default or bankruptcy of a swap agreement counterparty.
International Swaps and Derivatives Association, Inc. Master Agreements (“ISDA Master Agreements”) govern OTC financial derivative transactions entered into by a Fund and those counterparties. The ISDA Master Agreements maintain provisions for general obligations, representations, agreements, collateral and events of default or termination. Events of termination include conditions that may entitle counterparties to elect to terminate early and cause settlement of all outstanding transactions under the applicable ISDA Master Agreement. Pursuant to the Funds’ derivative ISDA Master Agreements, the Funds are required to maintain sufficient collateral or maintain a predetermined level of net assets. Any election to terminate early could be material to the financial statements. The values of all derivative instruments with credit-risk-related contingent features that are in a net liability position at November 30, 2013, in the tables below exclude the effects of cash collateral received or posted pursuant to these derivative contracts and, therefore, are not representative of the Funds’ net exposure.
Semi-Annual Report | November 30, 2013 | 95 |
Table of Contents
The Arbitrage Funds | Notes to Financial Statements (continued) | |
| November 30, 2013 (Unaudited) |
Fair Value of Derivative Instruments — Fair values of derivatives presented in the financial statements are not netted with the fair value of other derivatives or with any collateral amounts posted by the Funds or any counterparty. The fair value of derivative instruments for the Funds as of November 30, 2013, was as follows:
Derivatives Not Accounted For As Hedging Instruments | Asset Derivatives Statement of Assets and Liabilities Location | Fair Value | Liability Derivatives Statement of Assets and Liabilities Location | Fair Value | ||||||||
Arbitrage Fund | ||||||||||||
Foreign Currency Contracts | Unrealized appreciation on | $ | 9,093,713 | Unrealized depreciation on | $ | 13,521,774 | ||||||
Equity Contracts | Unrealized appreciation on | 963,966 | Unrealized depreciation on | 300,673 | ||||||||
Equity Contracts | Investments: at value | 4,276,578 | ||||||||||
Equity Contracts | Investments: at value | $ | 356,450 | |||||||||
Equity Contracts | Written options, at value | $ | 5,739,653 | |||||||||
|
|
|
| |||||||||
| $ | 14,690,707 | $ | 19,562,100 | |||||||||
|
|
|
| |||||||||
96 | www.arbitragefunds.com | 1-800-295-4485 |
Table of Contents
The Arbitrage Funds | Notes to Financial Statements (continued) | |
| November 30, 2013 (Unaudited) |
Derivatives Not Accounted For As Hedging Instruments | Asset Derivatives Statement of Assets and Liabilities Location | Fair Value | Liability Derivatives Statement of Assets and Liabilities Location | Fair Value | ||||||||
Event-Driven Fund | ||||||||||||
Foreign currency contracts | Unrealized appreciation | $ | 337,947 | Unrealized depreciation | $ | 268,758 | ||||||
Equity Contracts | Unrealized appreciation | 24,147 | Unrealized depreciation | 4,898 | ||||||||
Equity Contracts | Investments: at value | 263,920 | ||||||||||
Equity Contracts | Investments: at value | 65,254 | ||||||||||
Equity Contracts | Written options, at value | 235,794 | ||||||||||
|
|
|
| |||||||||
| $ | 691,268 | $ | 509,450 | |||||||||
|
|
|
| |||||||||
Derivatives Not Accounted For As Hedging Instruments | Asset Derivatives Statement of Assets and Liabilities Location | Fair Value | Liability Derivatives Statement of Assets and Liabilities Location | Fair Value | ||||||||
Credit Opportunities Fund | ||||||||||||
Foreign currency contracts | Unrealized appreciation on | $ | 7,273 | Unrealized depreciation on | $ | 58 | ||||||
|
|
|
| |||||||||
| $ | 7,273 | $ | 58 | |||||||||
|
|
|
| |||||||||
Semi-Annual Report | November 30, 2013 | 97 |
Table of Contents
The Arbitrage Funds | Notes to Financial Statements (continued) | |
| November 30, 2013 (Unaudited) |
The effect of derivative instruments on the Funds’ Statement of Operations for the six months ended November 30, 2013, was as follows:
Derivatives Not Accounted For As Hedging Instruments | Location Of Gains/(Loss) On Derivatives Recognized In Income | Realized Gain/(Loss) On Derivatives Recognized In Income | Changed In Unrealized Gain/(Loss) On Derivatives Recognized In Income | |||||||
| ||||||||||
Arbitrage Fund | ||||||||||
Foreign Currency Contracts | Net realized gains (losses) from: Foreign currency transactions /Net change in unrealized appreciation (depreciation) on: Foreign currency transactions | $ | 1,201,894 | $ | (11,168,610) | |||||
Equity Contracts (swap contracts) | Net realized gains (losses) from: Equity swap contracts /Net change in unrealized appreciation (depreciation) on: Equity swap contracts | 2,684,033 | (426,977) | |||||||
Equity Contracts Long (rights) | Net realized gains (losses) from: Investments /Net change in unrealized appreciation (depreciation) on: Investments | (356,563) | (528,936) | |||||||
Equity Contracts Short (rights) | Net realized gains (losses) from: Investments /Net change in unrealized appreciation (depreciation) on: Securities sold short | 131,945 | – | |||||||
Equity Contracts (purchased option contracts) | Net realized gains (losses) from: Investments /Net change in unrealized appreciation (depreciation) on: Investments | $ | 1,192,789 | $ | 2,246,178 | |||||
Equity Contracts (written option contracts) | Net realized gains (losses) from: Written option contracts /Net change in unrealized appreciation (depreciation) on: Written option contracts | 3,535,965 | (344,171) | |||||||
|
| |||||||||
| $ | 8,390,063 | $ | (10,22,516) | |||||||
|
| |||||||||
98 | www.arbitragefunds.com | 1-800-295-4485 |
Table of Contents
The Arbitrage Funds | Notes to Financial Statements (continued) | |
| November 30, 2013 (Unaudited) |
Derivatives Not Accounted For As Hedging Instruments | Location Of Gains/(Loss) On Derivatives Recognized In Income | Realized Gain/(Loss) On Derivatives Recognized In Income | Changed In Unrealized Gain/(Loss) On Derivatives Recognized In Income | |||||||
Event-Driven Fund | ||||||||||
Foreign Currency Contracts | Net realized gains (losses) from: Foreign currency transactions /Net change in unrealized appreciation (depreciation) on: Foreign currency transactions | $ | 49,017 | $ | (50,499 | ) | ||||
Equity Contracts (swap contracts) | Net realized gains (losses) from: Equity swap contracts /Net change in unrealized appreciation (depreciation) on: Equity swap contracts | 28,385 | 1,018 | |||||||
Equity Contracts Long (rights) | Net realized gains (losses) from: Investments /Net change in unrealized appreciation (depreciation) on: Investments | 4,349 | (39,503 | ) | ||||||
Equity Contracts Short (rights) | Net realized gains (losses) from: Investments /Net change in unrealized appreciation (depreciation) on: Securities sold short | – | – | |||||||
Equity Contracts (purchased option contracts) | Net realized gains (losses) from: Investments /Net change in unrealized appreciation (depreciation) on: Investments | (123,614 | ) | (491 | ) | |||||
Equity Contracts (written option contracts) | Net realized gains (losses) from: Written option contracts /Net change in unrealized appreciation (depreciation) on: Written option contracts | $ | 82,124 | $ | (93,527 | ) | ||||
|
| |||||||||
| $ | 40,261 | $ | (183,002 | ) | ||||||
|
| |||||||||
Semi-Annual Report | November 30, 2013 | 99 |
Table of Contents
The Arbitrage Funds | Notes to Financial Statements (continued) | |
| November 30, 2013 (Unaudited) |
Derivatives Not Accounted For As Hedging Instruments | Location Of Gains/(Loss) On Derivatives Recognized In Income | Realized Gain/(Loss) On Derivatives Recognized In Income | Changed In Unrealized Gain/(Loss) On Derivatives Recognized In Income | |||||||
Credit Opportunities Fund | ||||||||||
Foreign currency | Net realized gains (losses) from: contracts Foreign currency transactions / Net change in unrealized appreciation (depreciation) on: Foreign currency transactions | $ | 2,102 | $ | 4,342 | |||||
|
| |||||||||
| $ | 2,102 | $ | 4,342 | |||||||
|
| |||||||||
Volume of Derivative Instruments for the Funds during the period ended November 30, 2013 was as follows:
Derivative Type | Unit of Measurement | Monthly Average | ||||
Arbitrage Fund | ||||||
Equity Swap Contracts | Notional Quantity | 51,624,670 | ||||
Forward Foreign Currency | Net Contracts to | (1,639,286,793 | ) | |||
Purchased Option Contracts | Contracts | 23,862 | ||||
Rights | Shares | 1,897,723 | ||||
Written Option Contracts | Contracts | (54,472 | ) | |||
Derivative Type | Unit of Measurement | Monthly Average | ||||
Event-Driven Fund | ||||||
Equity Swap Contracts | Notional Quantity | 972,670 | ||||
Forward Foreign Currency | Net Contracts to | (44,823,733 | ) | |||
Purchased Option Contracts | Contracts | 1,560 | ||||
Rights | Shares | 135,421 | ||||
Written Option Contracts | Contracts | (2,130 | ) | |||
Derivative Type | Unit of Measurement | Monthly Average | ||||
Credit Opportunities Fund | ||||||
Forward Foreign Currency | Net Contracts to | (193,667 | ) | |||
100 | www.arbitragefunds.com | 1-800-295-4485 |
Table of Contents
The Arbitrage Funds | Notes to Financial Statements (continued) | |
| November 30, 2013 (Unaudited) |
Certain derivative contracts are executed under either standardized netting agreements or, for exchange-traded derivatives, the relevant contracts for a particular exchange which contain enforceable netting provisions. A derivative netting arrangement creates an enforceable right of set-off that becomes effective, and affects the realization of settlement on individual assets, liabilities and collateral amounts, only following a specified event of default or early termination. Default events may include the failure to make payments or deliver securities timely, material adverse changes in financial condition or insolvency, the breach of minimum regulatory capital requirements, or loss of license, charter or other legal authorization necessary to perform under the contract.
The following table presents financial instruments that are subject to enforceable netting arrangements or other similar agreements as of November 30, 2013:
Offsetting of Financial Assets and Derivative Assets:
Arbitrage Fund | ||||||||||||||||||||||||
Gross Amounts Not Offset in the Statement of Assets and Liabilities | ||||||||||||||||||||||||
|
| |||||||||||||||||||||||
Description | Gross Amounts of | Gross Amounts of Assets and Liabilities | Net Amounts the Statement of | Financial Instruments (a) | Cash Collateral Received(a) | Net Amount | ||||||||||||||||||
Equity Swap Contracts | $ | 963,966 | $ | – | $ | 963,966 | $ | – | $ | – | $ | 963,966 | ||||||||||||
Total | $ | 963,966 | $ | – | $ | 963,966 | $ | – | $ | – | $ | 963,966 | ||||||||||||
Semi-Annual Report | November 30, 2013 | 101 |
Table of Contents
The Arbitrage Funds | Notes to Financial Statements (continued) | |
| November 30, 2013 (Unaudited) |
Event-Driven Fund | ||||||||||||||||||||||||
| Gross Amounts Not Offset in the Statement of Assets and Liabilities | ||||||||||||||||||||||||
Description | Gross Amounts of | Gross Amounts of Assets and Liabilities | Net Amounts the Statement of | Financial Instruments (a) | Cash Collateral Received(a) | Net Amount | ||||||||||||||||||
Equity Swap Contracts | $ | 24,147 | $ | – | $ | 24,147 | $ | – | $ | – | $ | 24,147 | ||||||||||||
Total | $ | 24,147 | $ | – | $ | 24,147 | $ | – | $ | – | $ | 24,147 | ||||||||||||
Offsetting of Financial Liabilities and Derivative Liabilities:
Arbitrage Fund | ||||||||||||||||||||||||
| Gross Amounts Not Offset in the Statement of Assets and Liabilities | ||||||||||||||||||||||||
Description | Gross Amounts of | Gross Amounts of Assets and Liabilities | Net Amounts the Statement of | Financial Instruments (a) | Cash Collateral Pledged(a) | Net Amount | ||||||||||||||||||
Equity Swap Contracts | $ | 300,673 | $ | – | $ | 300,673 | $ | – | $ | (300,673 | ) | $ | – | |||||||||||
Total | $ | 300,673 | $ | – | $ | 300,673 | $ | – | $ | (300,673 | ) | $ | – | |||||||||||
102 | www.arbitragefunds.com | 1-800-295-4485 |
Table of Contents
The Arbitrage Funds | Notes to Financial Statements (continued) | |
| November 30, 2013 (Unaudited) |
Event-Driven Fund | ||||||||||||||||||||||||
| Gross Amounts Not Offset in the Statement of Assets and Liabilities | ||||||||||||||||||||||||
Description | Gross Amounts of | Gross Amounts Offset in the of Assets and Liabilities | Net Amounts the Statement of | Financial Instruments (a) | Cash Collateral Pledged(a) | Net Amount | ||||||||||||||||||
Equity Swap Contracts | $ | 4,898 | $ | – | $ | 4,898 | $ | – | $ | (4,898) | $ | – | ||||||||||||
Total | $ | 4,898 | $ | – | $ | 4,898 | $ | – | $ | (4,898) | $ | – | ||||||||||||
(a) | These amounts are limited to the derivative asset/liability balance and, accordingly, do not include excess collateral received/pledged. |
Investment income — Interest income and interest rebate expense is accrued as earned. Dividend income and expense are recorded on the ex-dividend date, net of any non-reclaimable tax withholdings.
Dividends and distributions to shareholders — Dividends arising from net investment income and net capital gain distributions, if any, are declared and paid at least annually to shareholders of the Arbitrage Fund and Event-Driven Fund. Dividends arising from net investment income, if any, are declared and paid quarterly, and net capital gain distributions, if any, are declared and paid at least annually to shareholders of the Credit Opportunities Fund.
Allocation between classes — Investment income earned, realized capital gains and losses, and unrealized appreciation and depreciation are allocated daily to each class of shares based upon the proportionate shares of total net assets of each Fund. Class specific expenses are charged directly to the class incurring the expense. Common expenses which are not attributable to a specific class are allocated daily to each class of shares based upon the proportionate share of total net assets of each Fund.
Offering costs — Offering costs, including costs of printing initial prospectuses, legal and registration fees, have been amortized over twelve months from the inception date of the Credit Opportunities Fund. As of November 30, 2013, the offering costs have been fully amortized.
Federal income tax — It is the Funds’ policy to continue to comply with the special provisions of Subchapter M of the Internal Revenue Code of 1986, as amended, applicable to regulated investment companies. As provided therein, in any fiscal year in which a fund so qualifies and distributes at least 90% of its taxable net income, a fund (but not the shareholders) will be relieved
Semi-Annual Report | November 30, 2013 | 103 |
Table of Contents
The Arbitrage Funds | Notes to Financial Statements (continued) | |
| November 30, 2013 (Unaudited) |
of Federal income tax on the income distributed. Accordingly, no provision for income taxes has been made.
As of and during the period ended November 30, 2013, the Funds did not have a liability for any unrecognized tax benefits. The Funds file U.S. federal, state, and local tax returns as required. The Funds’ tax returns are subject to examination by the relevant tax authorities until expiration of the applicable statute of limitations which is generally three years after the filing of the tax return. Tax returns for open years have incorporated no uncertain tax positions that require a provision for income taxes.
3. INVESTMENT TRANSACTIONS
During the six months ended November 30, 2013 for the Arbitrage Fund, the Event-Driven Fund, and the Credit Opportunities Fund, cost of purchases and proceeds from sales and maturities of investment securities, other than short-term investments, U.S. government securities, equity swap contracts, purchased and written option contracts and securities sold short, were as follows:
| Arbitrage Fund | Event-Driven Fund | Credit Opportunities Fund | ||||||||||
Purchases | $ | 5,027,210,058 | $ | 180,712,878 | $ | 9,059,679 | ||||||
Sales and Maturities | 5,724,884,899 | 126,272,530 | 4,795,138 | |||||||||
4. LINE OF CREDIT
The Trust, on behalf of the Funds, entered into an agreement which enables the Funds to participate in a $300,000,000 unsecured committed revolving line of credit with State Street Bank and Trust Company (the “Custodian”). Borrowings will be made solely to temporarily finance the purchase or sale of securities or to finance the redemption of the shares of an investor of the Funds. Interest is charged to the Funds based on their borrowings at a rate per annum of the higher of the LIBOR rate plus 1.25% and the overnight federal funds rate plus 1.25%. In addition, a commitment fee of 0.10% per annum is payable at the end of each calendar quarter. The Trust accrues, on behalf of each of the Funds, the commitment fee on the unused portion of the line of credit. Such fees are included in custodian and bank service fees on the Statements of Operations.
The Arbitrage Fund did not have outstanding borrowings at November 30, 2013. For the six months ended November 30, 2013, the Arbitrage Fund had average borrowings of $65,244,444 over a period of 9 days at a weighted average interest rate of 1.364%. Interest expense on the line of credit for the Arbitrage Fund during the six months ended November 30, 2013 is shown as line of credit interest expense on the Arbitrage Fund’s Statement of Operations.
The Event-Driven Fund did not have outstanding borrowings at November 30, 2013. For the six months ended November 30, 2013, the Event-Driven Fund had average borrowings of $1,200,000 over a period of 7 days at a weighted average interest rate of 1.380%. Interest expense on the line of credit for the Event-Driven Fund during the six months ended November 30, 2013 is shown as line of credit interest expense on the Event-Driven Fund’s Statement of Operations.
For the six months ended November 30, 2013, the Credit Opportunities Fund had no borrowings.
104 | www.arbitragefunds.com | 1-800-295-4485 |
Table of Contents
The Arbitrage Funds | Notes to Financial Statements (continued) | |
| November 30, 2013 (Unaudited) |
5. LOAN PARTICIPATIONS AND ASSIGNMENTS
The Funds may invest in direct debt instruments which are interests in amounts owed to lenders or lending syndicates by corporate, governmental, or other borrowers. The Funds’ investments in loans may be in the form of participations in loans or assignments of all or a portion of loans from third parties. A loan is often administered by a bank or other financial institution (the “lender”) that acts as agent for all holders. The agent administers the terms of the loan, as specified in the loan agreement. The Funds may invest in multiple series or tranches of a loan, which may have varying terms and carry different associated risks. The Funds generally have no right to enforce compliance with the terms of the loan agreement with the borrower. As a result, the Funds may be subject to the credit risk of both the borrower and the lender that is selling the loan agreement. When the Funds purchase assignments from lenders they acquire direct rights against the borrower of the loan. The Funds may enter into unfunded loan commitments, which are contractual obligations for future funding. Unfunded loan commitments represent a future obligation in full, even though a percentage of the notional loan amounts may not be utilized by the borrower. When investing in a loan participation, the Funds have the right to receive payments of principal, interest and any fees to which it is entitled only from the lender selling the loan agreement and only upon receipt of payments by the lender from the borrower. The Funds may receive a commitment fee based on the undrawn portion of the underlying line of credit portion of a floating rate loan. In certain circumstances, the Funds may receive a penalty fee upon the prepayment of a floating rate loan by a borrower. Fees earned or paid are recorded as a component of interest income or interest expense, respectively, on the Statement of Operations. At November 30, 2013, the Arbitrage Fund, Event-Driven Fund and Credit Opportunities Fund all had $0, $8,179,160 and $975,580, respectively, in outstanding loan commitments.
6. ADVISORY FEES, ADMINISTRATION FEES AND OTHER AGREEMENTS
Investment Advisory Agreement
The Funds’ investments are managed by Water Island Capital, LLC (the “Adviser”) under the terms of Investment Advisory Agreements. Under the Investment Advisory Agreement between the Adviser and the Arbitrage Fund, as amended and restated on October 1, 2007, the Arbitrage Fund pays the Adviser an annual fee, which is computed and accrued daily and paid monthly, of 1.25% on the first $250 million, 1.20% on the next $50 million, 1.15% on the next $50 million, 1.10% on the next $75 million, 1.05% on the next $75 million and 1.00% for amounts over $500 million, based on the Arbitrage Fund’s average daily net assets. Under the Investment Advisory Agreement between the Adviser and the Event-Driven Fund dated September 27, 2010, the Event-Driven Fund pays the Adviser an annual fee, which is computed and accrued daily and paid monthly, of 1.25% based on the Event-Driven Fund’s average daily net assets. Under the Investment Advisory Agreement between the Adviser and the Credit Opportunities Fund dated October 1, 2012, the Credit Opportunities Fund pays the Adviser an annual fee, which is computed and accrued daily and paid monthly, of 1.00% based on the Credit Opportunities Fund’s average daily net assets.
The Adviser has contractually agreed, at least until August 31, 2015, to waive its advisory fee and/or reimburse the Funds’ other expenses to the extent that total operating expenses (exclusive of interest, taxes, dividends on short positions, brokerage commissions, acquired fund fees and expenses and other costs incurred in connection with the purchase or sale of portfolio securities) exceed the annual rate of the Funds’ average daily net assets attributable to each share class as shown in the table below:
Semi-Annual Report | November 30, 2013 | 105 |
Table of Contents
The Arbitrage Funds | Notes to Financial Statements (continued) | |
| November 30, 2013 (Unaudited) |
| Arbitrage Fund | Event-Driven Fund | Credit Opportunities Fund | ||||
Class R | 1.69% | 1.69% | 1.50% | |||
Class I | 1.44% | 1.44% | 1.25% | |||
Class C | 2.44% | 2.44% | 2.25% | |||
Class A | 1.69% | 1.69% | 1.50% |
For the six months ended November 30, 2013, the aggregate net fee paid to the Adviser as a percentage of average net assets for the Arbitrage Fund, Event-Driven Fund and Credit Opportunities Fund was 1.03%, 1.10% and 0.00%, respectively.
The Adviser is permitted to recapture fees waived and expenses reimbursed to the extent actual fees and expenses for a period are less than the expense limitation of each class, provided, however, that the Adviser shall only be entitled to recapture such amounts for a period of three years from the end of the fiscal year during which such amount was waived or reimbursed. The Adviser can recapture any fees it has waived within the three-year period subject to the applicable annual rate of: 1.69% for Class R shares, 1.44% for Class I shares, 2.44% for Class C shares and 1.69% for Class A shares for Event-Driven Fund and 1.50% for Class R shares, 1.25% for Class I shares, 2.25% for Class C shares and 1.50% for Class A shares for Credit Opportunities Fund, respectively.
As of November 30, 2013, the balances of future recapture for each Fund were as follows:
| Expiring May 31, 2015 | Expiring May 31, 2016 | Total | ||||||||||
Event-Driven Fund | ||||||||||||
Class R | $ | 37,027 | $ | 30,441 | $ | 67,468 | ||||||
Class I | $ | 78,860 | $ | 127,460 | $ | 206,320 | ||||||
Class C | $ | N/A | $ | 620 | $ | 620 | ||||||
Credit Opportunities Fund | ||||||||||||
Class R | N/A | $ | 22,353 | $ | 22,353 | |||||||
Class I | N/A | $ | 51,089 | $ | 51,089 | |||||||
Class C | N/A | $ | 399 | $ | 399 | |||||||
There were no amounts recaptured during the period ended November, 2013 for the Funds.
Certain officers of the Trust are also officers of the Adviser. The Chief Compliance Officer (“CCO”) of the Trust also serves as the CCO of the Adviser. The Funds pay the Adviser 60% of the CCO’s salary for providing CCO services.
Administration Agreement
ALPS Fund Services, Inc. (“ALPS” and the “Administrator”) serves as the Trust’s administrator pursuant to an Administration, Bookkeeping a9.nd Pricing Services Agreement (“Administration Agreement”) with the Trust. As compensation for its services to the Trust, ALPS receives an annual administration fee based on the annual minimum fee of $370,000. The Administrator is also reimbursed by the Trust for certain out-of-pocket expenses. Certain officers of the Trust are also officers of the Administrator.
106 | �� | www.arbitragefunds.com | 1-800-295-4485 |
Table of Contents
The Arbitrage Funds | Notes to Financial Statements (continued) | |
| November 30, 2013 (Unaudited) |
Distribution Agreement
ALPS Distributors, Inc. (the “Distributor”) serves as the Funds’ distributors. The Distributor acts as an agent for the Funds and the distributor of their shares.
The Funds have adopted, with respect to its Class R, Class C shares and Class A shares, a plan of distribution pursuant to Rule 12b 1 under the 1940 Act which permits each Fund to pay for expenses incurred in the distribution and promotion of the Funds’ Class R shares, Class C shares and Class A shares and for services provided to shareholders. The Plan is a “reimbursement” plan. This means that a Fund’s Class R shares, Class C shares and Class A shares only pay a particular 12b 1 fee to the extent that the Adviser, the Distributor or others have incurred expenses in the promotion and distribution of the shares, including but not limited to, the printing of prospectuses and reports used for sales purposes, expenses of preparation of sales literature and related expenses, advertisements, and other distribution related expenses, as well as any distribution fees paid to securities dealers or others. Under the distribution plan, a Fund may pay compensation to any broker dealer with whom the Distributor or the Funds has entered into a contract to distribute Class R shares, Class C shares or Class A shares, or to any other qualified financial services firm, for distribution and/or shareholder related services with respect to shares held or purchased by their respective customers or in connection with the purchase of shares attributable to their efforts. The amount of payments under the Plan in any year shall not exceed 0.25% for Class R shares, 0.75% for Class C shares and 0.25% for Class A shares, respectively, annually of the average daily net assets allocable to a Fund’s Class R shares, Class C shares and Class A shares, respectively. In addition, the Plan permits each Fund to make payments at an annual rate of up to 0.25% of the Fund’s Class C shares for expenses incurred in connection with the provision of shareholder support or administrative services for the Fund’s Class C shares. During the six months ended November 30, 2013, The Arbitrage Fund’s Class R shares incurred $1,145,322, Class C shares incurred $127,387 and Class A shares incurred $1,192, respectively, in distribution expenses for Class R shares and Class A shares and distribution and shareholder support expenses for Class C shares, all of which was used to compensate broker dealers. With respect to the Event Driven Fund, during the six months ended November 30, 2013, the Event Driven Fund’s Class R shares incurred $2,582, Class C shares incurred $761 and Class A shares incurred $18,107, respectively, in distribution expenses for Class R shares and Class A shares and distribution and shareholder support expenses for Class C shares, all of which was used to compensate broker dealers. With respect to the Credit Opportunities Fund, during the six months ended November 30, 2013, the Credit Opportunities Fund’s Class R shares incurred $2,799, Class C shares incurred $151 and Class A shares incurred $16, respectively, in distribution expenses for Class R shares and Class A shares and distribution and shareholder support expenses for Class C shares, all of which was used to compensate broker dealers.
Principal Financial Officer
ALPS receives an annual fee of $10,000 for providing Principal Financial Officer (“PFO”) services to the Trust. ALPS is compensated by the trust under the PFO Services Agreement.
Transfer Agent And Shareholder Services Agreement
DST Systems, Inc. (“DST”) maintains the records of each shareholder’s account, answers shareholders’ inquiries concerning their accounts, processes purchases and redemptions of the Funds shares, acts as dividend and distribution disbursing agent and performs other shareholder service functions.
Under the terms of the amended Transfer Agent and Shareholder Services Agreement between the Trust and DST, DST receives from the Funds a monthly complex minimum fee, including four
Semi-Annual Report | November 30, 2013 | 107 |
Table of Contents
The Arbitrage Funds | Notes to Financial Statements (continued) | |
| November 30, 2013 (Unaudited) |
cusips (i.e., an individual share class), at an annual rate of $67,795 per year. For each cusip thereafter, an additional fee is applied at a minimum fee of $10,430 per cusip per year. There were eight additional cusips for the six months ended November 30, 2013. In addition, the Funds pay out-of-pocket expenses, including but not limited to, postage, envelopes, checks, drafts, forms, reports, telephone services, record storage and communication lines. These out-of-pocket expenses are included in transfer agent fees on the Funds Statement of Operations.
7. CAPITAL SHARE TRANSACTIONS
Proceeds and payments on capital shares as shown in the Statements of Changes in Net Assets are the result of the following capital share transactions for the periods shown:
| Six Months Ended November 30, 2013 (Unaudited) | Year Ended May 31, 2013 | |||||||
Arbitrage Fund - Class R | ||||||||
Shares sold | 15,618,056 | 31,786,403 | ||||||
Shares issued in reinvestment of dividends | – | 2,177,472 | ||||||
Shares redeemed | (16,420,562) | (39,071,802) | ||||||
|
| |||||||
Net decrease in shares outstanding | (802,506) | (5,107,927) | ||||||
|
| |||||||
Shares outstanding at beginning of period | 73,329,601 | 78,437,528 | ||||||
|
| |||||||
Shares outstanding at end of period | 72,527,095 | 73,329,601 | ||||||
|
| |||||||
Arbitrage Fund - Class I | ||||||||
Shares sold | 26,834,200 | 73,503,353 | ||||||
Shares issued in reinvestment of dividends | – | 2,674,069 | ||||||
Shares redeemed | (32,877,413) | (84,020,838) | ||||||
|
| |||||||
Net decrease in shares outstanding | (6,043,213) | (7,843,416) | ||||||
|
| |||||||
Shares outstanding at beginning of period | 152,071,318 | 159,914,734 | ||||||
|
| |||||||
Shares outstanding at end of period | 146,028,105 | 152,071,318 | ||||||
|
| |||||||
| Six Months Ended November 30, 2013 (Unaudited) | Year Ended May 31, 2013 | |||||||
Arbitrage Fund - Class C(a) | ||||||||
Shares sold | 1,188,979 | 1,567,850 | ||||||
Shares issued in reinvestment of dividends | – | 13,063 | ||||||
Shares redeemed | (168,532) | (67,176) | ||||||
|
| |||||||
Net increase in shares outstanding | 1,020,447 | 1,513,736 | ||||||
|
| |||||||
Shares outstanding at beginning of period | – | – | ||||||
|
| |||||||
Shares outstanding at end of period | 2,534,184 | 1,513,737 | ||||||
|
| |||||||
Arbitrage Fund - Class A(b) | ||||||||
Shares sold | 200,244 | – | ||||||
Shares redeemed | (11,379) | – | ||||||
|
| |||||||
Net increase in shares outstanding | 188,865 | – | ||||||
|
| |||||||
Shares outstanding at beginning of period | – | – | ||||||
|
| |||||||
Shares outstanding at end of period | 188,865 | – | ||||||
|
| |||||||
108 | www.arbitragefunds.com | 1-800-295-4485 |
Table of Contents
The Arbitrage Funds | Notes to Financial Statements (continued) | |
| November 30, 2013 (Unaudited) |
| Six Months Ended November 30, 2013 (Unaudited) | Year Ended | |||||||
Event-Driven Fund - Class R | ||||||||
Shares sold | 1,974,739 | 696,518 | ||||||
Shares issued in reinvestment of dividends | – | 17,016 | ||||||
Shares redeemed | (276,848) | (602,065) | ||||||
|
| |||||||
Net increase in shares outstanding | 1,697,891 | 111,469 | ||||||
|
| |||||||
Shares outstanding at beginning of period | 1,028,761 | 917,292 | ||||||
|
| |||||||
Shares outstanding at end of period | 2,726,652 | 1,028,761 | ||||||
|
| |||||||
Event-Driven Fund - Class I | ||||||||
Shares sold | 6,008,055 | 3,921,901 | ||||||
Shares issued in reinvestment of dividends | – | 65,105 | ||||||
Shares redeemed | (1,332,128) | (1,956,757) | ||||||
|
| |||||||
Net increase in shares outstanding | 4,675,927 | 2,030,250 | ||||||
|
| |||||||
Shares outstanding at beginning of period | 4,208,864 | 2,178,615 | ||||||
|
| |||||||
Shares outstanding at end of period | 8,884,791 | 4,208,864 | ||||||
|
| |||||||
Event-Driven Fund - Class C(a) | ||||||||
Shares sold | 77,036 | 35,656 | ||||||
Shares issued in reinvestment of dividends | – | 309 | ||||||
Shares redeemed | – | (1,026) | ||||||
|
| |||||||
Net increase in shares outstanding | 77,036 | 34,939 | ||||||
|
| |||||||
Shares outstanding at beginning of period | – | – | ||||||
|
| |||||||
Shares outstanding at end of period | 111,975 | 34,939 | ||||||
|
| |||||||
Event-Driven Fund - Class A(b) | ||||||||
Shares sold | 101,253 | – | ||||||
Net increase in shares outstanding | 101,253 | – | ||||||
|
| |||||||
Shares outstanding at beginning of period | – | |||||||
|
| |||||||
Shares outstanding at end of period | 101,253 | – | ||||||
|
| |||||||
Semi-Annual Report | November 30, 2013 | 109 |
Table of Contents
The Arbitrage Funds | Notes to Financial Statements (continued) | |
| November 30, 2013 (Unaudited) |
| Six Months Ended November 30, 2013 (Unaudited) | Period Ended May 31, 2013(c) | |||||||
Credit Opportunities Fund - Class R | ||||||||
Shares sold | 151,774 | 170,405 | ||||||
Shares issued in reinvestment of dividends | 5,139 | 786 | ||||||
Shares redeemed | (13,637) | (7,026) | ||||||
|
| |||||||
Net increase in shares outstanding | 143,276 | 164,165 | ||||||
|
| |||||||
Shares outstanding at beginning of period | – | – | ||||||
|
| |||||||
Shares outstanding at end of period | 307,441 | 164,165 | ||||||
|
| |||||||
Credit Opportunities Fund - Class I | ||||||||
Shares sold | 632,290 | 339,129 | ||||||
Shares issued in reinvestment of dividends | 11,143 | 1,700 | ||||||
Shares redeemed | (39,075) | – | ||||||
|
| |||||||
Net increase in shares outstanding | 604,358 | 340,829 | ||||||
|
| |||||||
Shares outstanding at beginning of period | – | – | ||||||
|
| |||||||
Shares outstanding at end of period | 945,187 | 340,829 | ||||||
|
| |||||||
Credit Opportunities Fund - Class C | ||||||||
Shares sold | 6,379 | 2,510 | ||||||
Shares issued in reinvestment of dividends | 63 | 8 | ||||||
Net increase in shares outstanding | 6,442 | 2,518 | ||||||
|
| |||||||
Shares outstanding at beginning of period | – | – | ||||||
|
| |||||||
Shares outstanding at end of period | 8,960 | 2,518 | ||||||
|
| |||||||
Credit Opportunities Fund - Class A(b) | ||||||||
Shares sold | 2,469 | – | ||||||
Shares issued in reinvestment of dividends | 28 | – | ||||||
Net increase in shares outstanding | 2,497 | – | ||||||
|
| |||||||
Shares outstanding at beginning of period | – | – | ||||||
|
| |||||||
Shares outstanding at end of period | 2,497 | – | ||||||
|
| |||||||
(a) | Commenced operations on June 1, 2012. |
(b) | Commenced operations on June 1, 2013. |
(c) | Commenced operations on October 1, 2012. |
8. FOREIGN CURRENCY TRANSLATION
Amounts denominated in or expected to settle in foreign currencies are translated to U.S. dollars based on exchange rates on the following basis:
A. The market values of investment securities and other assets and liabilities are translated at the closing rate of exchange each day.
B. Purchases and sales of investment securities and income and expenses are translated at the rate of exchange prevailing on the respective dates of such transactions.
C. The Funds do not isolate that portion of the results of operations caused by changes in foreign exchange rates on investments from those caused by changes in market prices of securities held. Such fluctuations are included with the net realized and unrealized gains or losses on investments.
110 | www.arbitragefunds.com | 1-800-295-4485 |
Table of Contents
The Arbitrage Funds | Notes to Financial Statements (continued) | |
| November 30, 2013 (Unaudited) |
Reported net realized foreign exchange gains or losses arise from 1) purchases and sales of foreign currencies; 2) currency gains or losses realized between the trade and settlement dates on securities transactions; and 3) the difference between the amounts of dividends, interest and foreign withholding taxes recorded on the Funds’ books, and the U.S. dollar equivalent of the amounts actually received or paid. Reported net unrealized foreign exchange gains and losses arise from changes in the value of assets and liabilities, other than investment securities, resulting from changes in exchange rates.
9. CONTINGENCIES AND COMMITMENTS
The Funds indemnify the Trust’s officers and trustees for certain liabilities that might arise from their performance of their duties to the Funds. Additionally, in the normal course of business the Funds enter into contracts that contain a variety of representations and warranties and which provide general indemnifications. The Funds’ maximum exposure under these arrangements is unknown, as this would involve future claims that may be made against the Funds that have not yet occurred. However, based on experience, the Funds expect the risk of loss to be remote.
10. SECURITIES LENDING
In order to generate additional income, the Funds may, from time to time, lend portfolio securities to broker-dealers, banks or institutional borrowers of securities. The Funds must receive 100% collateral in the form of cash or U.S. government securities. This collateral must be valued daily and, should the market value of the loaned securities increase, the borrower must furnish additional collateral to the Funds. During the time portfolio securities are on loan, the borrower pays the Funds any dividends or interest paid on such securities.
Loans are subject to termination by the Funds or the borrower at any time. While the Funds do not have the right to vote securities on loan, they have the right to terminate the loan and regain the right to vote if that is considered important with respect to the investment. In the event the borrower defaults in its obligation to the Funds, the Funds bear the risk of delay in the recovery of portfolio securities and the risk of loss of rights in the collateral. There were no securities on loan in the Funds during the six months ended November 30, 2013.
11. FEDERAL TAX INFORMATION
In order to avoid imposition of the excise tax applicable to regulated investment companies, it is also the Funds’ intention to declare as dividends in each calendar year at least 98% of its net investment income (earned during the calendar year) and 98.2% of its net realized capital gains (earned during the twelve months ended October 31) plus undistributed amounts from prior years.
The amount of distributions from net investment income and net realized gains, if any, are determined in accordance with Federal income tax regulations which may differ from accounting principles generally accepted in the United States of America. These “book/tax” differences are either temporary or permanent in nature and permanent differences are charged or credited to undistributed net investment income (loss), accumulated net realized gain (loss) or paid—in capital as appropriate in the period that the differences arise.
Permanent differences between the Funds’ financial statement and income tax reporting requirements are primarily attributable to gains and losses on certain foreign currency related transactions, short sale related dividend expense, investments in passive foreign investment
Semi-Annual Report | November 30, 2013 | 111 |
Table of Contents
The Arbitrage Funds | Notes to Financial Statements (continued) | |
| November 30, 2013 (Unaudited) |
companies, and investments in swaps. These have no effect on the Funds’ net assets or net asset value per share.
The tax character of dividends and distributions declared during the year ended May 31, 2013 for the Arbitrage Fund was as follows:
Year Ended | Ordinary Income | Long-Term Capital Gains* | Total Distributions | |||||||||
5/31/13 | $ | 86,556,164 | $ | 2,300 | $ | 86,558,464 | ||||||
The tax character of dividends and distributions declared during the year ended May 31, 2013 for the Event-Driven Fund was as follows:
Year Ended | Ordinary Income | Long-Term Capital Gains* | Total Distributions | |||||||||
5/31/13 | $ | 1,074,249 | $ | – | $ | 1,074,249 | ||||||
The tax character of dividends and distributions declared during the period ended May 31, 2013 for the Credit Opportunities Fund was as follows:
Period Ended | Ordinary Income | Long-Term Capital Gains* | Total Distributions | |||||||||
5/31/13 | $ | 36,674 | $ | – | $ | 36,674 | ||||||
* | The Funds designate these distributions as long-term capital gain dividends per IRC code section 852(b)(3)(C). |
The following information is computed on a tax basis for each item as of November 30, 2013:
Fund | Cost of Investments | Gross Unrealized Appreciation | Gross Unrealized (Depreciation) | Net Unrealized Appreciation/ (Depreciation) | ||||||||||||
Arbitrage Fund | $ | 2,803,117,571 | $ | 75,000,863 | $ | (22,888,167) | $ | 52,112,696 | ||||||||
Event-Driven Fund | $ | 122,499,668 | $ | 3,631,226 | $ | (1,008,897) | $ | 2,622,329 | ||||||||
Credit Opportunities Fund | $ | 13,653,708 | $ | 174,254 | $ | (47,037) | $ | 127,217 | ||||||||
The differences between book–basis and tax–basis net unrealized appreciation/(depreciation) for the Arbitrage Fund, the Event-Driven Fund and the Credit Opportunities Fund are attributable to constructive sales, dividends related to short securities, investments in passive foreign investment companies, and wash sales.
Post-Enactment Capital Losses:
Under the recently enacted Regulated Investment Company Modernization Act of 2010, Funds are permitted to carry forward capital losses incurred in taxable years beginning after December 22, 2010, for an unlimited period. Post-enactment capital losses that are carried forward will retain their character as either short-term or long-term capital.
The Arbitrage Credit Fund has elected to defer Short Term capital losses in the amount of $10,925 to the next tax year.
112 | www.arbitragefunds.com | 1-800-295-4485 |
Table of Contents
The Arbitrage Funds | Notes to Financial Statements (continued) | |
| November 30, 2013 (Unaudited) |
12. RECENT ACCOUNTING PRONOUNCEMENT
In June 2013, the Financial Accounting Standards Board (FASB) issued Accounting Standards Update (ASU) No. 2013-08, Financial Services-Investment Companies (Topic 946): Amendments to the Scope, Measurement, and Disclosure Requirements. The FASB standard identifies characteristics a company must assess to determine whether it is considered an investment company for financial reporting purposes. This ASU is effective for fiscal years beginning after December 15, 2013. The Funds believe the adoption of this ASU will not have a material impact on the financial statements.
13. SUBSEQUENT EVENTS
The Funds have evaluated the need for disclosures and/or adjustments resulting from subsequent events through the date the financial statements were available to be issued. Based on this evaluation, no adjustments were required to the financial statements.
Semi-Annual Report | November 30, 2013 | 113 |
Table of Contents
The Arbitrage Funds | Disclosure of Fund Expenses | |
| November 30, 2013 (Unaudited) |
All mutual funds have operating expenses. As a shareholder of a mutual fund, your investment is affected by these ongoing costs, which include (among others) costs for portfolio management, administrative services, distribution (12b-1) expenses, redemption fees and shareholder reports like this one. It is important for you to understand the impact of these costs on your investment returns.
Operating expenses such as these are deducted from a mutual fund’s gross income and directly reduce its final investment return. These expenses are expressed as a percentage of a mutual fund’s average net assets; this percentage is known as a mutual fund’s expense ratio.
The following examples use the expense ratio and are intended to help you understand the ongoing costs (in dollars) of investing in your Fund and to compare these costs with those of other mutual funds. The examples are based on an investment of $1,000 made at the beginning of the period shown and held for the entire period.
The table on the following page illustrates your Fund’s costs in two ways.
Actual Fund Return. This section helps you to estimate the actual expenses after fee waivers that your Fund incurred over the period. The “Expenses Paid During Period” column shows the actual dollar expense cost incurred by a $1,000 investment in the Fund, and the “Ending Account Value” number is derived from deducting that expense cost from the Fund’s gross investment return.
You can use this information, together with the actual amount you invested in the Fund, to estimate the expenses you paid over that period. Simply divide your actual account value by $1,000 to arrive at a ratio (for example, an $8,600 account value divided by $1,000 = 8.6), then multiply that ratio by the number shown for your Fund under “Expenses Paid During Period.”
Hypothetical 5% Return. This section helps you compare your Fund’s costs with those of other mutual funds. It assumes that the Fund had an annual 5% return before expenses during the period, but that the expense ratio (Column 3) for the period is unchanged. This example is useful in making comparisons because the Securities and Exchange Commission requires all mutual funds to make this 5% calculation. You can assess your Fund’s comparative cost by comparing the hypothetical result for your Fund in the “Expenses Paid During Period” column with those that appear in the same charts in the shareholder reports for other mutual funds.
Note: Because the return is set at 5% for comparison purposes — NOT your Fund’s actual return —the account values shown may not apply to your specific investment.
114 | www.arbitragefunds.com | 1-800-295-4485 |
Table of Contents
The Arbitrage Funds | Disclosure of Fund Expenses (continued) | |
| November 30, 2013 (Unaudited) |
Beginning Account Value 06/01/2013 | Ending Account Value 11/30/2013 | Expense Ratio(a) | Expenses Paid During Period(b) | |||||||||||||||||
The Arbitrage Fund | ||||||||||||||||||||
Class R | ||||||||||||||||||||
Actual | $1,000.00 | $1,008.80 | 1.87 | % | $9.42 | |||||||||||||||
Hypothetical (5% return before expenses) | $1,000.00 | $1,015.69 | 1.87 | % | $9.45 | |||||||||||||||
Class I | ||||||||||||||||||||
Actual | $1,000.00 | $1,010.20 | 1.62 | % | $8.16 | |||||||||||||||
Hypothetical (5% return before expenses) | $1,000.00 | $1,016.95 | 1.62 | % | $8.19 | |||||||||||||||
Class C | ||||||||||||||||||||
Actual | $1,000.00 | $1,005.70 | 2.62 | % | $13.17 | |||||||||||||||
Hypothetical (5% return before expenses) | $1,000.00 | $1,011.93 | 2.62 | % | $13.21 | |||||||||||||||
Class A | ||||||||||||||||||||
Actual | $1,000.00 | $1,009.60 | 1.85 | % | $9.32 | |||||||||||||||
Hypothetical (5% return before expenses) | $1,000.00 | $1,015.79 | 1.85 | % | $9.35 | |||||||||||||||
The Arbitrage Event-Driven Fund | ||||||||||||||||||||
Class R | ||||||||||||||||||||
Actual | $1,000.00 | $1,036.70 | 2.09 | % | $10.67 | |||||||||||||||
Hypothetical (5% return before expenses) | $1,000.00 | $1,014.59 | 2.09 | % | $10.56 | |||||||||||||||
Class I | ||||||||||||||||||||
Actual | $1,000.00 | $1,037.50 | 1.84 | % | $9.40 | |||||||||||||||
Hypothetical (5% return before expenses) | $1,000.00 | $1,015.84 | 1.84 | % | $9.30 | |||||||||||||||
Class C | ||||||||||||||||||||
Actual | $1,000.00 | $1,032.70 | 2.84 | % | $14.47 | |||||||||||||||
Hypothetical (5% return before expenses) | $1,000.00 | $1,010.83 | 2.84 | % | $14.32 | |||||||||||||||
Class A | ||||||||||||||||||||
Actual | $1,000.00 | $1,036.70 | 2.09 | % | $10.67 | |||||||||||||||
Hypothetical (5% return before expenses) | $1,000.00 | $1,014.59 | 2.09 | % | $10.56 | |||||||||||||||
The Arbitrage Credit Opportunities Fund | ||||||||||||||||||||
Class R | ||||||||||||||||||||
Actual | $1,000.00 | $1,033.50 | 1.69 | % | $8.62 | |||||||||||||||
Hypothetical (5% return before expenses) | $1,000.00 | $1,016.60 | 1.69 | % | $8.54 | |||||||||||||||
Class I | ||||||||||||||||||||
Actual | $1,000.00 | $1,033.40 | 1.44 | % | $7.34 | |||||||||||||||
Hypothetical (5% return before expenses) | $1,000.00 | $1,017.85 | 1.44 | % | $7.28 | |||||||||||||||
Semi-Annual Report | November 30, 2013 | 115 |
Table of Contents
The Arbitrage Funds | Disclosure of Fund Expenses (continued) | |
| November 30, 2013 (Unaudited) |
Beginning Account Value 06/01/2013 | Ending Account Value 11/30/2013 | Expense Ratio(a) | Expenses Paid During Period(b) | |||||||||||||||||
Class C | ||||||||||||||||||||
Actual | $1,000.00 | $1,028.20 | 2.44 | % | $12.41 | |||||||||||||||
Hypothetical (5% return before expenses) | $1,000.00 | $1,012.84 | 2.44 | % | $12.31 | |||||||||||||||
Class A | ||||||||||||||||||||
Actual | $1,000.00 | $1,033.00 | 1.69 | % | $8.61 | |||||||||||||||
Hypothetical (5% return before expenses) | $1,000.00 | $1,016.60 | 1.69 | % | $8.54 | |||||||||||||||
(a) | Annualized, based on the Fund’s most recent fiscal half-year expenses. |
(b) | Expenses are equal to the Fund’s annualized ratio multiplied by the average account value over the period, multiplied by the number of days in the most recent fiscal half year (183), divided by 365. |
116 | www.arbitragefunds.com | 1-800-295-4485 |
Table of Contents
The Arbitrage Funds | Additional Information | |
| November 30, 2013 (Unaudited) |
1. PROXY VOTING POLICIES AND VOTING RECORD
A description of the policies and procedures that the Funds use to vote proxies relating to portfolio securities is available without charge upon request by calling toll-free 1-800-295-4485, or on the Securities and Exchange Commission’s (“SEC”) website at http://www.sec.gov. Information regarding how the Funds voted proxies relating to portfolio securities during the most recent fiscal year ending June 30, 2012 will be available without charge upon request by calling toll-free 1-800-295-4485, or on the SEC’s website at http://www.sec.gov.
2. QUARTERLY PORTFOLIO HOLDINGS
The Funds file a complete listing of their portfolio holdings with the SEC as of the first and third quarters of each fiscal year on Form N-Q. The filings are available upon request by calling 1-800-295-4485. Furthermore, you may obtain a copy of the filing on the SEC’s website at http://www.sec.gov. The Funds’ Forms N-Q may also be reviewed and copied at the SEC’s Public Reference Room in Washington, D.C., and information on the operation of the Public Reference Room may be obtained by calling 1-800-SEC-0330.
Semi-Annual Report | November 30, 2013 | 117 |
Table of Contents
Table of Contents
| Item 2. | Code of Ethics. | |
| Not applicable to semi-annual report. | ||
| Item 3. | Audit Committee Financial Expert. | |
| Not applicable to semi-annual report. | ||
| Item 4. | Principal Accountant Fees and Services. | |
| Not applicable to semi-annual report. | ||
| Item 5. | Audit Committee of Listed Registrants. | |
| Not applicable. | ||
| Item 6. | Schedule of Investments. | |
| Not applicable. | ||
| Item 7. | Disclosure of Proxy Voting Policies and Procedures for Closed-End Management Investment Companies. | |
| Not applicable | ||
| Item 8. | Portfolio Managers of Closed-End Management Investment Companies. | |
| Not applicable. | ||
| Item 9. | Purchases of Equity Securities by Closed-End Management Investment Company and Affiliated Purchasers. | |
| Not applicable. | ||
| Item 10. | Submission of Matters to Vote of Security Holders. | |
| None. | ||
Table of Contents
Item 11. Controls and Procedures. | ||||
| (a) | The registrant’s principal executive officer and principal financial officer have evaluated the registrant’s disclosure controls and procedures (as defined in Rule 30a-3(c) under the Investment Company Act of 1940, as amended) within 90 days of this filing and have concluded that the registrant’s disclosure controls and procedures were effective, as of that date. | |||
| (b) | There was no change in the registrant’s internal control over financial reporting (as defined in Rule 30a-3(d) under the Investment Company Act of 1940, as amended) during the second fiscal quarter of the period covered by this report that has materially affected, or is reasonably likely to materially affect, the registrant’s internal control over financial reporting. | |||
Item 12. Exhibits. | ||||
(a)(1) | Not applicable to semi-annual report. | |||
(a)(2) | A separate certification for the principal executive officer and the principal financial officer of the registrant as required by Rule 30a-2(a) under the Investment Company Act of 1940, as amended (17 CFR 270.30a-2(a)), are filed herewith. | |||
(a)(3) | Not applicable. | |||
(b) | The certifications by the registrant’s Principal Executive Officer and Principal Financial Officer, as required by Rule 30a-2(b) of the Investment Company Act of 1940, as amended, and Section 906 of the Sarbanes-Oxley Act of 2002 are attached hereto as Ex99.906Cert. | |||
Table of Contents
SIGNATURES
Pursuant to the requirements of the Securities Exchange Act of 1934 and the Investment Company Act of 1940, the registrant has duly caused this report to be signed on its behalf by the undersigned, thereunto duly authorized.
THE ARBITRAGE FUNDS
By: | /s/ John S. Orrico | |
John S. Orrico | ||
President | ||
Date: | February 7, 2014 | |
Pursuant to the requirements of the Securities Exchange Act of 1934 and the Investment Company Act of 1940, this report has been signed below by the following persons on behalf of the registrant and in the capacities and on the dates indicated.
By: | /s/ John S. Orrico | |
John S. Orrico | ||
President | ||
Date: | February 7, 2014 | |
By: | /s/ Kim Storms | |
Kim Storms | ||
Chief Financial Officer | ||
Date: | February 7, 2014 | |