UNITED STATES
SECURITIES AND EXCHANGE COMMISSION
Washington, D.C. 20549
FORM N-CSRS
CERTIFIED SHAREHOLDER REPORT OF REGISTERED
MANAGEMENT INVESTMENT COMPANIES
Investment Company Act file number | 811-09815 | ||||||||
| |||||||||
THE ARBITRAGE FUNDS | |||||||||
(Exact name of registrant as specified in charter) | |||||||||
| |||||||||
41 Madison Avenue, 42nd Floor, New York, NY |
| 10010 | |||||||
(Address of principal executive offices) |
| (Zip code) | |||||||
| |||||||||
John S. Orrico Water Island Capital, LLC 41 Madison Avenue 42nd Floor New York, NY 10010 | |||||||||
(Name and address of agent for service) | |||||||||
| |||||||||
Registrant’s telephone number, including area code: | 800-295-4485 |
| |||||||
| |||||||||
Date of fiscal year end: | May 31 |
| |||||||
| |||||||||
Date of reporting period: | June 1, 2016 – November 30, 2016 |
| |||||||
Item 1. Reports to Stockholders.

Semi-Annual Report
November 30, 2016
The Arbitrage Fund
The Arbitrage Event-Driven Fund
The Arbitrage Credit Opportunities Fund
The Arbitrage Tactical Equity Fund

TABLE OF CONTENTS
The Arbitrage Fund | |||||||
Portfolio Information | 1 | ||||||
Portfolio of Investments | 3 | ||||||
The Arbitrage Event-Driven Fund | |||||||
Portfolio Information | 15 | ||||||
Portfolio of Investments | 17 | ||||||
The Arbitrage Credit Opportunities Fund | |||||||
Portfolio Information | 33 | ||||||
Portfolio of Investments | 35 | ||||||
The Arbitrage Tactical Equity Fund | |||||||
Portfolio Information | 42 | ||||||
Portfolio of Investments | 44 | ||||||
Statements of Assets and Liabilities | 54 | ||||||
Statements of Operations | 58 | ||||||
Statements of Changes in Net Assets | 62 | ||||||
Financial Highlights | |||||||
The Arbitrage Fund - Class R | 66 | ||||||
The Arbitrage Fund - Class I | 68 | ||||||
The Arbitrage Fund - Class C | 70 | ||||||
The Arbitrage Fund - Class A | 72 | ||||||
The Arbitrage Event-Driven Fund - Class R | 74 | �� | |||||
The Arbitrage Event-Driven Fund - Class I | 76 | ||||||
The Arbitrage Event-Driven Fund - Class C | 78 | ||||||
The Arbitrage Event-Driven Fund - Class A | 80 | ||||||
The Arbitrage Credit Opportunities Fund - Class R | 82 | ||||||
The Arbitrage Credit Opportunities Fund - Class I | 84 | ||||||
The Arbitrage Credit Opportunities Fund - Class C | 86 | ||||||
The Arbitrage Credit Opportunities Fund - Class A | 88 | ||||||
The Arbitrage Tactical Equity Fund - Class R | 90 | ||||||
The Arbitrage Tactical Equity Fund - Class I | 92 | ||||||
The Arbitrage Tactical Equity Fund - Class C | 94 | ||||||
The Arbitrage Tactical Equity Fund - Class A | 96 | ||||||
Notes to Financial Statements | 98 | ||||||
Disclosure of Fund Expenses | 125 | ||||||
Additional Information | 128 | ||||||
The Arbitrage Fund Portfolio Information
November 30, 2016 (Unaudited)
Performance (annualized returns as of November 30, 2016)
| One Year | Five Year | Ten Year | Since Inception* | ||||||||||||||||
Arbitrage Fund, Class R | 3.34 | % | 1.21 | % | 2.86 | % | 4.17 | % | |||||||||||
Arbitrage Fund, Class I | 3.64 | % | 1.47 | % | 3.09 | % | 3.03 | % | |||||||||||
Arbitrage Fund, Class C** | 2.61 | % | N/A | N/A | 0.71 | % | |||||||||||||
Arbitrage Fund, Class A*** | 3.33 | % | N/A | N/A | 1.74 | % | |||||||||||||
S&P 500® Index | 8.06 | % | 14.45 | % | 6.89 | % | 4.57 | % | |||||||||||
| BofA Merrill Lynch U.S. 3-Month Treasury Bill Index | 0.32 | % | 0.11 | % | 0.84 | % | 1.62 | % | |||||||||||
Current performance may be higher or lower than performance quoted above. Any performance data quoted represents past performance and the investment return and principal value of an investment in the Fund will fluctuate so that an investor's shares, when redeemed, may be worth more or less than their original cost. Past performance is no guarantee of future results. Returns do not reflect a 2% redemption fee for shares that are redeemed from the fund within 30 days of purchase, which, if reflected, would reduce the performance quoted. Returns shown above include the reinvestment of all dividends and capital gains. You can obtain performance data current to the most recent month end by calling 1-800-295-4485 or going to www.arbitragefunds.com.
* Class R inception: 9/18/00; Class I inception: 10/17/03; Class C inception: 6/1/12; Class A inception: 6/1/13.
** Class C shares are subject to a 1.00% contingent deferred sales charge on all purchases redeemed in 12 months of purchase.
*** Class A shares are subject to a maximum front-end sales load of 2.50% on purchases up to $250,000. The shares are also subject to a deferred sales charge of up to 0.50% on purchases of $250,000 or more purchased without a front-end sales load and redeemed within 12 months of purchase.
The Total Annual Fund Operating Expenses for Class R, Class I, Class C and Class A are 1.91%, 1.66%, 2.66% and 1.91%, respectively. These expense ratios are as stated in the current prospectus and may differ from the expense ratios disclosed in the financial highlights in this report.
The S&P 500® Index is an unmanaged index consisting of 500 stocks.
The Bank of America (BofA) Merrill Lynch U.S. 3-Month Treasury Bill Index tracks the performance of the U.S. dollar denominated U.S. Treasury Bills publicly issued in the U.S. domestic market with a remaining term to final maturity of less than 3 months.
An investor may not invest directly in an index.
Semi-Annual Report | November 30, 2016
1
The Arbitrage Fund Portfolio Information (continued)
November 30, 2016 (Unaudited)
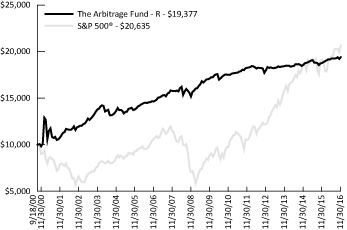
Growth of $10,000 Investment
The chart represents historical performance of a hypothetical investment of $10,000 in the Class R shares of the Fund since inception. Past performance does not guarantee future results. This chart does not reflect the deduction of taxes that a shareholder would pay on Fund distributions or the redemption of Fund shares.
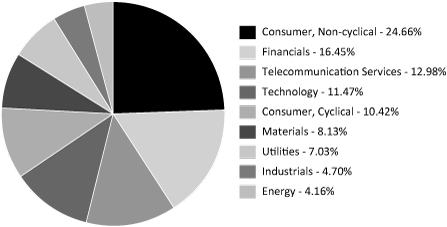
Sector Weighting
The following chart shows the sector weightings of The Arbitrage Fund's investments in common stock as of the report date.
www.arbitragefunds.com | 1-800-295-4485
2
The Arbitrage Fund Portfolio of Investments
November 30, 2016 (Unaudited)
Shares | Value | ||||||||||
COMMON STOCKS - 70.32% | |||||||||||
Aerospace & Defense - 0.49% | |||||||||||
B/E Aerospace, Inc. | 143,696 | $ | 8,627,508 | ||||||||
Banks - 4.42% | |||||||||||
Cascade Bancorp(a) | 624,643 | 4,547,401 | |||||||||
PrivateBancorp, Inc.(b) | 890,654 | 41,664,794 | |||||||||
| SVG Capital Plc(a) | 3,567,293 | 31,511,573 | |||||||||
77,723,768 | |||||||||||
Chemicals - 6.63% | |||||||||||
Chemtura Corp.(a)(b) | 1,050,279 | 34,606,693 | |||||||||
Syngenta AG, ADR | 353,652 | 27,026,086 | |||||||||
Valspar Corp.(b)(c) | 539,250 | 55,052,032 | |||||||||
116,684,811 | |||||||||||
Commercial Services - 5.25% | |||||||||||
DirectCash Payments, Inc. | 615,000 | 8,703,305 | |||||||||
ExamWorks Group, Inc.(a)(d)(e) | 983,873 | 34,484,749 | |||||||||
LifeLock, Inc.(a)(c) | 386,874 | 9,211,470 | |||||||||
Monster Worldwide, Inc.(a)(d)(e) | 1,002,500 | 3,408,500 | |||||||||
Team Health Holdings, Inc.(a) | 858,668 | 36,536,323 | |||||||||
92,344,347 | |||||||||||
Computers & Computer Services - 1.41% | |||||||||||
Brocade Communications Systems, Inc. | 945,530 | 11,667,840 | |||||||||
Datalink Corp.(a) | 380,591 | 4,262,619 | |||||||||
Mentor Graphics Corp.(c) | 241,196 | 8,815,714 | |||||||||
24,746,173 | |||||||||||
Construction Materials - 0.72% | |||||||||||
Headwaters, Inc.(a) | 534,949 | 12,678,291 | |||||||||
Electric - 5.19% | |||||||||||
Empire District Electric Co. | 412,300 | 14,030,569 | |||||||||
Talen Energy Corp.(a) | 2,180,092 | 30,434,085 | |||||||||
Westar Energy, Inc.(b)(c) | 822,520 | 46,850,739 | |||||||||
91,315,393 | |||||||||||
Food - 2.29% | |||||||||||
WhiteWave Foods Co.(a)(b) | 732,635 | 40,360,862 | |||||||||
Gas - 0.25% | |||||||||||
Gas Natural, Inc. | 350,762 | 4,384,525 | |||||||||
See Notes to Financial Statements.
Semi-Annual Report | November 30, 2016
3
The Arbitrage Fund Portfolio of Investments (continued)
November 30, 2016 (Unaudited)
Shares | Value | ||||||||||
COMMON STOCKS - 70.32% (Continued) | |||||||||||
Healthcare - Products - 6.60% | |||||||||||
St Jude Medical, Inc.(b)(c) | 1,466,421 | $ | 116,140,543 | ||||||||
Healthcare - Services - 1.74% | |||||||||||
Envision Healthcare Holdings, Inc.(a) | 1,144,451 | 26,001,927 | |||||||||
Universal American Corp.(a) | 457,188 | 4,590,167 | |||||||||
30,592,094 | |||||||||||
Home Builders - 0.33% | |||||||||||
WCI Communities, Inc.(a) | 250,020 | 5,812,965 | |||||||||
Home Furnishings - 2.38% | |||||||||||
DTS, Inc. | 105,800 | 4,492,268 | |||||||||
Harman International Industries, Inc.(c) | 341,754 | 37,377,635 | |||||||||
41,869,903 | |||||||||||
Insurance - 2.64% | |||||||||||
Endurance Specialty Holdings Ltd. | 503,987 | 46,467,601 | |||||||||
Internet - 5.97% | |||||||||||
Blue Nile, Inc. | 400 | 16,128 | |||||||||
LinkedIn Corp., Class A(a)(b) | 538,094 | 105,057,473 | |||||||||
105,073,601 | |||||||||||
Machinery - Construction & Mining - 1.80% | |||||||||||
Bradken Ltd.(a) | 575,000 | 1,354,502 | |||||||||
Joy Global, Inc.(b) | 1,080,167 | 30,277,081 | |||||||||
31,631,583 | |||||||||||
Media - 3.75% | |||||||||||
Media General, Inc.(a) | 1,199,521 | 22,035,201 | |||||||||
SAI Global Ltd. | 1,098,586 | 3,837,216 | |||||||||
Starz, Class A(a) | 521,436 | 17,655,823 | |||||||||
Time Warner, Inc.(c) | 245,465 | 22,538,596 | |||||||||
66,066,836 | |||||||||||
Oil & Gas - 1.03% | |||||||||||
InterOil Corp.(a) | 373,212 | 18,138,103 | |||||||||
Packaging & Containers - 0.39% | |||||||||||
AEP Industries, Inc. | 58,077 | 6,844,374 | |||||||||
See Notes to Financial Statements.
www.arbitragefunds.com | 1-800-295-4485
4
The Arbitrage Fund Portfolio of Investments (continued)
November 30, 2016 (Unaudited)
Shares | Value | ||||||||||
COMMON STOCKS - 70.32% (Continued) | |||||||||||
Pipelines - 1.56% | |||||||||||
Columbia Pipeline Partners LP | 1,059,388 | $ | 18,168,504 | ||||||||
Spectra Energy Corp. | 228,700 | 9,365,265 | |||||||||
27,533,769 | |||||||||||
Real Estate Investment Trusts - 0.91% | |||||||||||
Post Properties, Inc. | 245,018 | 15,931,070 | |||||||||
Retail - 5.27% | |||||||||||
Cabela's, Inc.(a)(c) | 514,074 | 31,995,966 | |||||||||
CST Brands, Inc.(b) | 1,210,073 | 58,119,806 | |||||||||
Moleskine SpA | 1,026,599 | 2,611,298 | |||||||||
92,727,070 | |||||||||||
Savings & Loans - 2.00% | |||||||||||
Astoria Financial Corp. | 991,207 | 16,206,235 | |||||||||
EverBank Financial Corp.(b) | 980,000 | 18,914,000 | |||||||||
35,120,235 | |||||||||||
Semiconductors - 4.48% | |||||||||||
Applied Micro Circuits Corp.(a) | 538,367 | 4,710,712 | |||||||||
Intersil Corp., Class A | 245,800 | 5,444,470 | |||||||||
Linear Technology Corp. | 623,740 | 39,002,462 | |||||||||
NXP Semiconductors N.V.(a)(c) | 298,814 | 29,627,408 | |||||||||
78,785,052 | |||||||||||
Software - 2.72% | |||||||||||
Interactive Intelligence Group, Inc.(a) | 384,545 | 23,245,745 | |||||||||
TubeMogul, Inc.(a) | 1,760,421 | 24,645,894 | |||||||||
47,891,639 | |||||||||||
Telecommunications - 0.10% | |||||||||||
Inteliquent, Inc. | 76,998 | 1,743,235 | |||||||||
| TOTAL COMMON STOCKS (Cost $1,224,645,390) | 1,237,235,351 | ||||||||||
RIGHTS - 0.46% | |||||||||||
Casa Ley CVR, Expires 01/30/2018(a)(d)(e) | 6,223,326 | 2,596,372 | |||||||||
Chelsea Therapeutics CVR, Expires 03/31/2018(a)(d)(e) | 2,389,273 | — | |||||||||
Cubist Pharmaceuticals, Inc. CPR, Expires 07/01/2019(a)(d)(e) | 119,343 | — | |||||||||
Leap Wireless International CVR, Expires 03/13/2017(a)(d)(e) | 1,783,190 | 5,527,889 | |||||||||
PDC CVR, Expires 12/31/2016(a)(d)(e) | 6,223,326 | — | |||||||||
See Notes to Financial Statements.
Semi-Annual Report | November 30, 2016
5
The Arbitrage Fund Portfolio of Investments (continued)
November 30, 2016 (Unaudited)
Shares | Value | ||||||||||
RIGHTS - 0.46% (Continued) | |||||||||||
Trius Therapeutics CVR, Expires 02/15/2017(a)(d)(e) | 1,034,403 | $ | — | ||||||||
| TOTAL RIGHTS (Cost $11,220,382) | 8,124,261 | ||||||||||
| Expiration Date | Exercise Price | Contracts | Value | ||||||||||||||||
PURCHASED OPTIONS(a) - 0.02% | |||||||||||||||||||
Call Options Purchased - 0.01% | |||||||||||||||||||
Great Plains Energy, Inc. | 12/2016 | $ | 30.00 | 666 | $ | 3,330 | |||||||||||||
Rockwell Collins, Inc. | 04/2017 | 100.00 | 447 | 140,805 | |||||||||||||||
| TOTAL CALL OPTIONS PURCHASED (Cost $226,931) | 144,135 | ||||||||||||||||||
Put Options Purchased - 0.01% | |||||||||||||||||||
CBOE Holdings, Inc. | 01/2017 | 65.00 | 1,000 | 60,000 | |||||||||||||||
Cvent, Inc. | 12/2016 | 35.00 | 346 | 0 | |||||||||||||||
Mentor Graphics Corp. | 04/2017 | 35.00 | 9 | 360 | |||||||||||||||
St Jude Medical, Inc. | 12/2016 | 65.00 | 1,009 | 7,567 | |||||||||||||||
Westar Energy, Inc. | 12/2016 | 50.00 | 1,180 | 14,750 | |||||||||||||||
| TOTAL PUT OPTIONS PURCHASED (Cost $431,221) | 82,677 | ||||||||||||||||||
| TOTAL PURCHASED OPTIONS (Cost $658,152) | 226,812 | ||||||||||||||||||
Yield | Shares | Value | |||||||||||||
SHORT-TERM INVESTMENTS - 34.77% | |||||||||||||||
Money Market Fund | |||||||||||||||
| Morgan Stanley Institutional Liquidity Fund - Government Portfolio | 0.295 | %(f) | 551,227,769 | $ | 551,227,769 | ||||||||||
Time Deposit | |||||||||||||||
State Street Bank Time Deposit | 60,510,066 | 60,510,066 | |||||||||||||
| TOTAL SHORT-TERM INVESTMENTS (Cost $611,737,835) | 611,737,835 | ||||||||||||||
| Total Investments - 105.57% (Cost $1,848,261,759) | 1,857,324,259 | ||||||||||||||
Liabilities in Excess of Other Assets - (5.57)%(g) | (97,913,092 | ) | |||||||||||||
NET ASSETS - 100.00% | $ | 1,759,411,167 | |||||||||||||
See Notes to Financial Statements.
www.arbitragefunds.com | 1-800-295-4485
6
The Arbitrage Fund Portfolio of Investments (continued)
November 30, 2016 (Unaudited)
Portfolio Footnotes
(a) Non-income-producing security.
(b) Security, or a portion of security, is being held as collateral for short sales, written option contracts or forward foreign currency exchange contracts. At November 30, 2016, the aggregate market value of those securities was $278,586,100, representing 15.83% of net assets.
(c) Underlying security for a written/purchased call/put option.
(d) Security considered illiquid. On November 30, 2016, the total market value of these securities was $46,017,510, representing 2.61% of net assets.
(e) Security fair valued using methods determined in good faith by the Pricing Committee. As of November 30, 2016, the total market value of these securities was $46,017,510, representing 2.61% of net assets.
(f) Rate shown is the 7-day effective yield as of November 30, 2016.
(g) Includes cash which is being held as collateral for short sales and written option contracts.
Securities are determined to be illiquid under the procedures approved by the Funds' Board of Trustees. Information related to the Fund's illiquid securities as of November 30, 2016 is as follows:
| Date of Purchase | Security | Cost | Value | % of Net Assets | |||||||||||||||
01/30/2015 | Casa Ley CVR | $ | 6,316,054 | $ | 2,596,372 | 0.15 | % | ||||||||||||
06/24/2014 | Chelsea Therapeutics CVR | — | — | 0.00 | |||||||||||||||
12/12/2011 | Cubist Pharmaceuticals, Inc. CPR | — | — | 0.00 | |||||||||||||||
05/20/2016 | ExamWorks Group, Inc. | 34,249,279 | 34,484,749 | 1.96 | |||||||||||||||
03/14/2014 | Leap Wireless International CVR | 4,600,630 | 5,527,889 | 0.31 | |||||||||||||||
08/09/2016 | Monster Worldwide, Inc. | 3,385,921 | 3,408,500 | 0.19 | |||||||||||||||
01/30/2015 | PDC CVR | 303,698 | — | 0.00 | |||||||||||||||
09/12/2013 | Trius Therapeutics CVR | — | — | 0.00 | |||||||||||||||
$ | 46,017,510 | 2.61 | % | ||||||||||||||||
See Notes to Financial Statements.
Semi-Annual Report | November 30, 2016
7
The Arbitrage Fund Portfolio of Investments (continued)
November 30, 2016 (Unaudited)
SCHEDULE OF SECURITIES SOLD SHORT | Shares | Value | |||||||||
COMMON STOCKS - (11.26%) | |||||||||||
Aerospace & Defense - (0.23%) | |||||||||||
Rockwell Collins, Inc. | (44,542 | ) | $ | (4,129,934 | ) | ||||||
Airlines - (0.27%) | |||||||||||
Virgin America, Inc. | (85,000 | ) | (4,802,500 | ) | |||||||
Banks - (1.66%) | |||||||||||
Canadian Imperial Bank of Commerce | (325,730 | ) | (25,625,179 | ) | |||||||
First Interstate BancSystem, Inc., Class A | (92,925 | ) | (3,507,919 | ) | |||||||
(29,133,098 | ) | ||||||||||
Distribution/Wholesale - (0.25%) | |||||||||||
Ingram Micro, Inc., Class A | (115,644 | ) | (4,329,711 | ) | |||||||
Electric - (0.29%) | |||||||||||
Great Plains Energy, Inc. | (194,198 | ) | (5,124,885 | ) | |||||||
Healthcare - Products - (2.75%) | |||||||||||
Abbott Laboratories | (1,270,941 | ) | (48,384,724 | ) | |||||||
Healthcare - Services - (1.48%) | |||||||||||
Amsurg Corp. | (382,253 | ) | (26,039,074 | ) | |||||||
Media - (0.76%) | |||||||||||
Nexstar Broadcasting Group, Inc., Class A | (150,032 | ) | (8,949,409 | ) | |||||||
Time Warner, Inc. | (48,000 | ) | (4,407,360 | ) | |||||||
(13,356,769 | ) | ||||||||||
Oil & Gas - (0.26%) | |||||||||||
Exxon Mobil Corp. | (52,880 | ) | (4,616,424 | ) | |||||||
Packaging & Containers - (0.21%) | |||||||||||
Berry Plastics Group, Inc. | (72,582 | ) | (3,612,406 | ) | |||||||
Pipelines - (0.54%) | |||||||||||
Enbridge, Inc. | (225,511 | ) | (9,480,482 | ) | |||||||
Real Estate Investment Trusts - (0.91%) | |||||||||||
Mid-America Apartment Communities, Inc. | (173,998 | ) | (15,943,437 | ) | |||||||
Savings & Loans - (0.90%) | |||||||||||
New York Community Bancorp, Inc. | (991,064 | ) | (15,837,203 | ) | |||||||
Semiconductors - (0.75%) | |||||||||||
Analog Devices, Inc. | (144,770 | ) | (10,747,725 | ) | |||||||
See Notes to Financial Statements.
www.arbitragefunds.com | 1-800-295-4485
8
The Arbitrage Fund Portfolio of Investments (continued)
November 30, 2016 (Unaudited)
SCHEDULE OF SECURITIES SOLD SHORT | Shares | Value | |||||||||
COMMON STOCKS - (11.26%) (Continued) | |||||||||||
Semiconductors - (0.75%) (Continued) | |||||||||||
MACOM Technology Solutions Holdings, Inc. | (49,963 | ) | $ | (2,489,165 | ) | ||||||
(13,236,890 | ) | ||||||||||
| TOTAL COMMON STOCKS (Proceeds $196,074,223) | (198,027,537 | ) | |||||||||
RIGHTS - 0.00%(a) | |||||||||||
Chelsea Therapeutics CVR, Expires 03/31/2018 | (1,100 | ) | — | ||||||||
| TOTAL RIGHTS (Proceeds $0) | — | ||||||||||
| TOTAL SECURITIES SOLD SHORT (Proceeds $196,074,223) | $ | (198,027,537 | ) | ||||||||
(a) Less than 0.005% of net assets.
WRITTEN OPTIONS | Expiration Date | Exercise Price | Contracts | Value | |||||||||||||||
Written Call Options | |||||||||||||||||||
Cabela's, Inc. | 12/2016 | $ | 60.00 | (493 | ) | $ | (118,320 | ) | |||||||||||
| Harman International Industries, Inc.: | |||||||||||||||||||
12/2016 | 110.00 | (793 | ) | (11,895 | ) | ||||||||||||||
01/2017 | 110.00 | (911 | ) | (36,440 | ) | ||||||||||||||
LifeLock, Inc. | 01/2017 | 24.00 | (1,062 | ) | (5,310 | ) | |||||||||||||
| MACOM Technology Solutions Holdings, Inc. | 12/2016 | 40.00 | (80 | ) | (76,000 | ) | |||||||||||||
NXP Semiconductors N.V.: | |||||||||||||||||||
12/2016 | 97.50 | (534 | ) | (97,455 | ) | ||||||||||||||
12/2016 | 98.00 | (192 | ) | (42,720 | ) | ||||||||||||||
12/2016 | 98.50 | (124 | ) | (11,470 | ) | ||||||||||||||
12/2016 | 99.00 | (185 | ) | (14,337 | ) | ||||||||||||||
12/2016 | 99.50 | (272 | ) | (10,880 | ) | ||||||||||||||
12/2016 | 100.00 | (158 | ) | (4,740 | ) | ||||||||||||||
01/2017 | 97.50 | (936 | ) | (255,060 | ) | ||||||||||||||
01/2017 | 100.00 | (663 | ) | (87,848 | ) | ||||||||||||||
Time Warner, Inc.: | |||||||||||||||||||
12/2016 | 87.50 | (42 | ) | (19,110 | ) | ||||||||||||||
12/2016 | 90.00 | (515 | ) | (124,888 | ) | ||||||||||||||
12/2016 | 90.50 | (29 | ) | (6,380 | ) | ||||||||||||||
12/2016 | 91.00 | (149 | ) | (27,639 | ) | ||||||||||||||
12/2016 | 91.50 | (216 | ) | (32,724 | ) | ||||||||||||||
See Notes to Financial Statements.
Semi-Annual Report | November 30, 2016
9
The Arbitrage Fund Portfolio of Investments (continued)
November 30, 2016 (Unaudited)
WRITTEN OPTIONS | Expiration Date | Exercise Price | Contracts | Value | |||||||||||||||
Written Call Options (Continued) | |||||||||||||||||||
12/2016 | $ | 92.00 | (293 | ) | $ | (37,358 | ) | ||||||||||||
12/2016 | 92.50 | (316 | ) | (32,232 | ) | ||||||||||||||
12/2016 | 93.00 | (311 | ) | (26,590 | ) | ||||||||||||||
| TOTAL WRITTEN CALL OPTIONS (Premiums received $1,108,655) | (1,079,396 | ) | |||||||||||||||||
Written Put Options | |||||||||||||||||||
CBOE Holdings, Inc. | 01/2017 | 60.00 | (1,000 | ) | (27,500 | ) | |||||||||||||
NXP Semiconductors N.V.: | |||||||||||||||||||
12/2016 | 97.50 | (37 | ) | (925 | ) | ||||||||||||||
12/2016 | 100.00 | (332 | ) | (41,500 | ) | ||||||||||||||
Time Warner, Inc.: | |||||||||||||||||||
12/2016 | 85.00 | (90 | ) | (180 | ) | ||||||||||||||
12/2016 | 87.50 | (71 | ) | (923 | ) | ||||||||||||||
12/2016 | 89.00 | (35 | ) | (875 | ) | ||||||||||||||
12/2016 | 90.00 | (51 | ) | (2,295 | ) | ||||||||||||||
Valspar Corp. | 01/2017 | 105.00 | (71 | ) | (24,140 | ) | |||||||||||||
| TOTAL WRITTEN PUT OPTIONS (Premiums received $144,676) | (98,338 | ) | |||||||||||||||||
| TOTAL WRITTEN OPTIONS (Premiums received $1,253,331) | $ | (1,177,734 | ) | ||||||||||||||||
OUTSTANDING FORWARD FOREIGN CURRENCY EXCHANGE CONTRACTS
| Contract Description | Counterparty | Contracts to Deliver/Receive | Purchase/Sale Contract | Expiration Date | Current Value | Unrealized Appreciation | |||||||||||||||||||||
AUD | Goldman Sachs | 7,171,900 | Sale | 12/15/2016 | $ | 5,294,185 | $ | 180,171 | |||||||||||||||||||
CAD | Goldman Sachs | 14,745,500 | Sale | 12/15/2016 | 10,978,470 | 221,051 | |||||||||||||||||||||
CHF | Goldman Sachs | 5,022,200 | Sale | 12/15/2016 | 4,943,865 | 238,704 | |||||||||||||||||||||
EUR | Goldman Sachs | 27,968,898 | Sale | 12/15/2016 | 29,661,006 | 1,812,075 | |||||||||||||||||||||
GBP | Goldman Sachs | 47,980,500 | Purchase | 12/15/2016 | 60,052,843 | 1,122,804 | |||||||||||||||||||||
GBP | Goldman Sachs | 54,956,000 | Sale | 12/15/2016 | 68,783,444 | 4,432,304 | |||||||||||||||||||||
SEK | Goldman Sachs | 135,062,100 | Purchase | 12/15/2016 | 14,655,074 | 42,118 | |||||||||||||||||||||
SEK | Goldman Sachs | 135,062,100 | Sale | 12/15/2016 | 14,655,075 | 771,524 | |||||||||||||||||||||
$ | 8,820,751 | ||||||||||||||||||||||||||
See Notes to Financial Statements.
www.arbitragefunds.com | 1-800-295-4485
10
The Arbitrage Fund Portfolio of Investments (continued)
November 30, 2016 (Unaudited)
| Contract Description | Counterparty | Contracts to Deliver/Receive | Purchase/Sale Contract | Expiration Date | Current Value | Unrealized Depreciation | |||||||||||||||||||||
AUD | Goldman Sachs | 130,400 | Purchase | 12/15/2016 | $ | 96,260 | $ | (3,647 | ) | ||||||||||||||||||
CAD | Goldman Sachs | 3,054,400 | Purchase | 12/15/2016 | 2,274,093 | (53,326 | ) | ||||||||||||||||||||
CHF | Goldman Sachs | 4,721,600 | Purchase | 12/15/2016 | 4,647,954 | (48,479 | ) | ||||||||||||||||||||
EUR | Goldman Sachs | 25,505,100 | Purchase | 12/15/2016 | 27,048,149 | (1,481,599 | ) | ||||||||||||||||||||
GBP | Goldman Sachs | 6,218,300 | Purchase | 12/15/2016 | 7,782,883 | (253,956 | ) | ||||||||||||||||||||
GBP | Goldman Sachs | 24,748,900 | Sale | 12/15/2016 | 30,975,954 | (528,448 | ) | ||||||||||||||||||||
$ | (2,369,455 | ) | |||||||||||||||||||||||||
The following is a summary of investments classified by country exposure:
Country | % of Net Assets(a) | ||||||
Bermuda | 2.64 | % | |||||
United Kingdom | 1.79 | % | |||||
Netherlands | 1.68 | % | |||||
Switzerland | 1.53 | % | |||||
Singapore | 1.03 | % | |||||
Canada | 0.50 | % | |||||
Australia | 0.30 | % | |||||
Italy | 0.15 | % | |||||
United States | 95.95 | % | |||||
Liabilities in Excess of Other Assets | (5.57 | )% | |||||
100.00 | % | ||||||
(a) These percentages represent long positions only and are not net of short positions.
Abbreviations:
ADR - American Depositary Receipt
AG - Aktiengesellschaft is a German term that refers to a corporation that is limited by shares, i.e., owned by shareholders.
AUD - Australian dollar
CAD - Canadian dollar
CHF - Swiss franc
CPR - Conditional Prepayment Rate
CVR - Contingent Value Rights
EUR - Euro
GBP - British pound
LP - Limited Partnership
Ltd. - Limited
N.V. - Naamloze Vennootschap is the Dutch term for a public limited liability corporation.
Plc - Public Limited Company
SEK - Swedish krona
SpA - Societa per Azione
See Notes to Financial Statements.
Semi-Annual Report | November 30, 2016
11
The Arbitrage Fund Portfolio of Investments (continued)
November 30, 2016 (Unaudited)
The following table summarizes The Arbitrage Fund's investments and derivative financial instruments categorized in the disclosure hierarchy as of November 30, 2016:
Investments in Securities at Value* | Level 1 | Level 2 | Level 3 | Total | |||||||||||||||
Assets | |||||||||||||||||||
Common Stocks | |||||||||||||||||||
Aerospace & Defense | $ | 8,627,508 | $ | — | $ | — | $ | 8,627,508 | |||||||||||
Banks | 77,723,768 | — | — | 77,723,768 | |||||||||||||||
Chemicals | 116,684,811 | — | — | 116,684,811 | |||||||||||||||
Commercial Services | 54,451,098 | 37,893,249 | — | 92,344,347 | |||||||||||||||
| Computers & Computer Services | 24,746,173 | — | — | 24,746,173 | |||||||||||||||
Construction Materials | 12,678,291 | — | — | 12,678,291 | |||||||||||||||
Electric | 91,315,393 | — | — | 91,315,393 | |||||||||||||||
Food | 40,360,862 | — | — | 40,360,862 | |||||||||||||||
Gas | 4,384,525 | — | — | 4,384,525 | |||||||||||||||
Healthcare - Products | 116,140,543 | — | — | 116,140,543 | |||||||||||||||
Healthcare - Services | 30,592,094 | — | — | 30,592,094 | |||||||||||||||
Home Builders | 5,812,965 | — | — | 5,812,965 | |||||||||||||||
Home Furnishings | 41,869,903 | — | — | 41,869,903 | |||||||||||||||
Insurance | 46,467,601 | — | — | 46,467,601 | |||||||||||||||
Internet | 105,073,601 | — | — | 105,073,601 | |||||||||||||||
| Machinery - Construction & Mining | 31,631,583 | — | — | 31,631,583 | |||||||||||||||
Media | 66,066,836 | — | — | 66,066,836 | |||||||||||||||
Oil & Gas | 18,138,103 | — | — | 18,138,103 | |||||||||||||||
Packaging & Containers | 6,844,374 | — | — | 6,844,374 | |||||||||||||||
Pipelines | 27,533,769 | — | — | 27,533,769 | |||||||||||||||
Real Estate Investment Trusts | 15,931,070 | — | — | 15,931,070 | |||||||||||||||
Retail | 92,727,070 | — | — | 92,727,070 | |||||||||||||||
Savings & Loans | 35,120,235 | — | — | 35,120,235 | |||||||||||||||
Semiconductors | 78,785,052 | — | — | 78,785,052 | |||||||||||||||
Software | 47,891,639 | — | — | 47,891,639 | |||||||||||||||
Telecommunications | 1,743,235 | — | — | 1,743,235 | |||||||||||||||
Rights | — | 5,527,889 | 2,596,372 | 8,124,261 | |||||||||||||||
Purchased Options | 226,812 | — | — | 226,812 | |||||||||||||||
Short-Term Investments | 611,737,835 | — | — | 611,737,835 | |||||||||||||||
TOTAL | $ | 1,811,306,749 | $ | 43,421,138 | $ | 2,596,372 | $ | 1,857,324,259 | |||||||||||
* Refer to footnote 2 where leveling hierarchy is defined.
See Notes to Financial Statements.
www.arbitragefunds.com | 1-800-295-4485
12
The Arbitrage Fund Portfolio of Investments (continued)
November 30, 2016 (Unaudited)
Other Financial Instruments*** | Level 1 | Level 2 | Level 3 | Total | |||||||||||||||
Assets | |||||||||||||||||||
| Forward Foreign Currency Exchange Contracts | $ | — | $ | 8,820,751 | $ | — | $ | 8,820,751 | |||||||||||
Liabilities | |||||||||||||||||||
Common Stocks** | (198,027,537 | ) | — | — | (198,027,537 | ) | |||||||||||||
Written Options | (1,177,734 | ) | — | — | (1,177,734 | ) | |||||||||||||
| Forward Foreign Currency Exchange Contracts | — | (2,369,455 | ) | — | (2,369,455 | ) | |||||||||||||
TOTAL | $ | (199,205,271 | ) | $ | 6,451,296 | $ | 0 | $ | (192,753,975 | ) | |||||||||
** Refer to Portfolio of Investments for sector information.
*** Other financial instruments are instruments such as written options, securities sold short and forward foreign currency exchange contracts.
The Fund recognizes transfers between levels as of the beginning of the annual period in which the transfer occurred.
Transfers from Level 1 to Level 2 at November 30, 2016 in the amount of $12,882,488 were due to the application of fair value pricing pursuant to Fair Valuation procedures approved by the Board of Trustees. A market price for identical securities was not available.
The following is a reconciliation of the fair valuations using significant unobservable inputs (Level 3) for the Fund's assets and liabilities during the period ended November 30, 2016:
| Investments in Securities | Balance as of May 31, 2016 | Realized Gain/(Loss) | Change in Unrealized Appreciation/ (Depreciation) | Purchases | Sales Proceeds | Transfers into Level 3 | Transfers out of Level 3 | Balance as of November 30, 2016 | Net change in Unrealized Appreciation/ (Depreciation) included in the Statement of Operations attributable to Level 3 investments held at November 30, 2016 | ||||||||||||||||||||||||||||||
Rights | $ | 2,853,976 | $ | — | $ | (257,604 | ) | $ | — | $ | — | $ | — | $ | — | $ | 2,596,372 | $ | (257,604 | ) | |||||||||||||||||||
Total | $ | 2,853,976 | $ | — | $ | (257,604 | ) | $ | — | $ | — | $ | — | $ | — | $ | 2,596,372 | $ | (257,604 | ) | |||||||||||||||||||
See Notes to Financial Statements.
Semi-Annual Report | November 30, 2016
13
The Arbitrage Fund Portfolio of Investments (continued)
November 30, 2016 (Unaudited)
| Other Financial Instruments | Balance as of May 31, 2016 | Realized Gain/(Loss) | Change in Unrealized Appreciation/ (Depreciation) | Purchases | Sales Proceeds | Transfers into Level 3 | Transfers out of Level 3 | Balance as of November 30, 2016 | Net change in Unrealized Appreciation/ (Depreciation) included in the Statement of Operations attributable to Level 3 investments held at November 30, 2016 | ||||||||||||||||||||||||||||||
Rights | $ | (65 | ) | $ | — | $ | 65 | $ | — | $ | — | $ | — | $ | — | $ | — | $ | 65 | ||||||||||||||||||||
Total | $ | (65 | ) | $ | — | $ | 65 | $ | — | $ | — | $ | — | $ | — | $ | — | $ | 65 | ||||||||||||||||||||
See Notes to Financial Statements.
www.arbitragefunds.com | 1-800-295-4485
14
The Arbitrage Event-Driven Fund Portfolio Information
November 30, 2016 (Unaudited)
Performance (annualized returns as of November 30, 2016)
| One Year | Five Year | Since Inception* | |||||||||||||
Arbitrage Event-Driven Fund, Class R | 4.41 | % | 0.22 | % | 0.95 | % | |||||||||
Arbitrage Event-Driven Fund, Class I | 4.63 | % | 0.47 | % | 1.19 | % | |||||||||
Arbitrage Event-Driven Fund, Class C** | 3.65 | % | N/A | -0.52 | % | ||||||||||
Arbitrage Event-Driven Fund, Class A*** | 4.42 | % | N/A | -0.59 | % | ||||||||||
Bloomberg Barclays U.S. Aggregate Bond Index | 2.17 | % | 2.43 | % | 2.82 | % | |||||||||
BofA Merrill Lynch U.S. 3-Month Treasury Bill Index | 0.32 | % | 0.11 | % | 0.11 | % | |||||||||
Current performance may be higher or lower than performance quoted above. Any performance data quoted represents past performance, and the investment return and principal value of an investment in the Fund will fluctuate so that an investor's shares, when redeemed, may be worth more or less than their original cost. Past performance is no guarantee of future results. Returns do not reflect a 2% redemption fee for shares that are redeemed from the fund within 30 days of purchase, which, if reflected, would reduce the performance quoted. Returns shown above include the reinvestment of all dividends and capital gains. Contractual fee waivers are currently in effect. Without such fee waivers, performance numbers would be reduced. You can obtain performance data current to the most recent month end by calling 1-800-295-4485 or going to www.arbitragefunds.com.
* Class R and Class I inception: 10/1/10; Class C inception: 6/1/12; Class A inception: 6/1/13.
** Class C shares are subject to a 1.00% contingent deferred sales charge on all purchases redeemed in 12 months of purchase.
*** Class A shares are subject to a maximum front-end sales load of 3.25% on purchases up to $500,000. The shares are also subject to a deferred sales charge of up to 1.00% on purchases of $500,000 or more purchased without a front-end sales load and redeemed within 18 months of purchase.
The Total Annual Fund Operating Expenses for Class R, Class I, Class C and Class A are 2.64%, 2.39%, 3.39% and 2.64%, respectively. The Advisor has agreed to waive fees (not including the effects of interest, dividends on short positions, brokerage commissions, acquired fund fees and expenses, taxes, or other extraordinary expenses) in excess of 1.69%, 1.44%, 2.44% and 1.69% for Class R, Class I, Class C and Class A, respectively, until at least September 30, 2017. These expense ratios are as stated in the current prospectus and may differ from the expense ratios disclosed in the financial highlights in this report.
The Bloomberg Barclays U.S. Aggregate Bond Index is a market value-weighted index of investment-grade fixed-rated debt issues, including government, corporate, asset-backed and mortgage-backed securities with a maturity of one year or more.
The Bank of America (BofA) Merrill Lynch U.S. 3-Month Treasury Bill Index tracks the performance of the U.S. dollar denominated U.S. Treasury Bills publicly issued in the U.S. domestic market with a remaining term to final maturity of less than 3 months.
An investor may not invest directly in an index.
Semi-Annual Report | November 30, 2016
15
The Arbitrage Event-Driven Fund Portfolio Information (continued)
November 30, 2016 (Unaudited)
Growth of $10,000 Investment
The chart represents historical performance of a hypothetical investment of $10,000 in the Class R shares of the Fund since inception. Past performance does not guarantee future results. This chart does not reflect the deduction of taxes that a shareholder would pay on Fund distributions or the redemption of Fund shares.

Sector Weighting
The following chart shows the sector weightings of The Arbitrage Event-Driven Fund's investments in common stock, preferred stock, exchange-traded funds and corporate bonds as of the report date.

www.arbitragefunds.com | 1-800-295-4485
16
The Arbitrage Event-Driven Fund Portfolio of Investments
November 30, 2016 (Unaudited)
Shares | Value | ||||||||||
COMMON STOCKS - 66.56% | |||||||||||
Aerospace & Defense - 0.50% | |||||||||||
B/E Aerospace, Inc. | 12,703 | $ | 762,688 | ||||||||
Agriculture - 1.38% | |||||||||||
Altria Group, Inc. | 4,557 | 291,329 | |||||||||
British American Tobacco Plc, Sponsored ADR | 1,673 | 182,424 | |||||||||
Reynolds American, Inc. | 30,457 | 1,647,724 | |||||||||
2,121,477 | |||||||||||
Auto Parts & Equipment - 0.98% | |||||||||||
Adient Plc(a) | 27,944 | 1,496,681 | |||||||||
Chemicals - 8.79% | |||||||||||
Air Products & Chemicals, Inc. | 10,640 | 1,537,055 | |||||||||
Chemtura Corp.(a) | 92,020 | 3,032,059 | |||||||||
Linde AG, ADR | 2,389 | 40,039 | |||||||||
Linde AG | 10,020 | 1,669,416 | |||||||||
Syngenta AG, ADR(b) | 31,022 | 2,370,701 | |||||||||
Valspar Corp.(b)(c) | 47,185 | 4,817,117 | |||||||||
13,466,387 | |||||||||||
Commercial Services - 2.90% | |||||||||||
ExamWorks Group, Inc.(a)(d)(e) | 4,084 | 143,144 | |||||||||
LifeLock, Inc.(a)(c) | 33,761 | 803,850 | |||||||||
LSC Communications, Inc. | 15,653 | 323,078 | |||||||||
Team Health Holdings, Inc.(a) | 74,531 | 3,171,294 | |||||||||
4,441,366 | |||||||||||
Computers & Computer Services - 2.58% | |||||||||||
Accenture Plc, Class A | 879 | 104,979 | |||||||||
Brocade Communications Systems, Inc. | 82,483 | 1,017,840 | |||||||||
CGI Group, Inc., Class A(a) | 2,159 | 102,272 | |||||||||
EPAM Systems, Inc.(a) | 661 | 43,560 | |||||||||
Hewlett Packard Enterprise Co.(b) | 74,183 | 1,765,555 | |||||||||
International Business Machines Corp. | 939 | 152,325 | |||||||||
Mentor Graphics Corp. | 21,102 | 771,278 | |||||||||
3,957,809 | |||||||||||
Diversified Financial Services - 0.54% | |||||||||||
CBOE Holdings, Inc.(b) | 11,947 | 823,148 | |||||||||
See Notes to Financial Statements.
Semi-Annual Report | November 30, 2016
17
The Arbitrage Event-Driven Fund Portfolio of Investments (continued)
November 30, 2016 (Unaudited)
Shares | Value | ||||||||||
| COMMON STOCKS - 66.56% (Continued) | |||||||||||
Electric - 5.20% | |||||||||||
Empire District Electric Co. | 35,967 | $ | 1,223,957 | ||||||||
Talen Energy Corp.(a) | 190,246 | 2,655,834 | |||||||||
Westar Energy, Inc.(b)(c) | 71,752 | 4,086,994 | |||||||||
7,966,785 | |||||||||||
Food - 3.34% | |||||||||||
Nomad Foods Ltd.(a) | 99,807 | 939,184 | |||||||||
SUPERVALU, Inc.(a) | 123,649 | 573,731 | |||||||||
WhiteWave Foods Co.(a) | 65,494 | 3,608,065 | |||||||||
5,120,980 | |||||||||||
Healthcare - Products - 7.29% | |||||||||||
St Jude Medical, Inc.(b)(c) | 140,965 | 11,164,428 | |||||||||
Home Furnishings - 2.13% | |||||||||||
Harman International Industries, Inc.(c) | 29,813 | 3,260,648 | |||||||||
Household Products - 0.62% | |||||||||||
Colgate-Palmolive Co. | 3,964 | 258,571 | |||||||||
Coty, Inc., Class A(a) | 36,880 | 690,025 | |||||||||
948,596 | |||||||||||
Household Products/Wares - 0.52% | |||||||||||
Church & Dwight Co., Inc. | 6,047 | 264,798 | |||||||||
Clorox Co. | 2,325 | 268,677 | |||||||||
Kimberly-Clark Corp. | 2,315 | 267,637 | |||||||||
801,112 | |||||||||||
Insurance - 2.67% | |||||||||||
Endurance Specialty Holdings Ltd. | 44,324 | 4,086,673 | |||||||||
Internet - 9.19% | |||||||||||
Alibaba Group Holding Ltd., Sponsored ADR(a)(c) | 3,500 | 329,070 | |||||||||
LinkedIn Corp., Class A(a)(b) | 51,635 | 10,081,217 | |||||||||
Pandora Media, Inc.(a) | 30,301 | 352,098 | |||||||||
Twitter, Inc.(a) | 3,800 | 70,262 | |||||||||
Yahoo!, Inc.(a)(b) | 79,172 | 3,247,635 | |||||||||
14,080,282 | |||||||||||
Machinery - Construction & Mining - 1.73% | |||||||||||
Joy Global, Inc. | 94,296 | 2,643,117 | |||||||||
See Notes to Financial Statements.
www.arbitragefunds.com | 1-800-295-4485
18
The Arbitrage Event-Driven Fund Portfolio of Investments (continued)
November 30, 2016 (Unaudited)
Shares | Value | ||||||||||
| COMMON STOCKS - 66.56% (Continued) | |||||||||||
Media - 4.03% | |||||||||||
CBS Corp., Class B, NVDR | 17,143 | $ | 1,040,923 | ||||||||
Comcast Corp., Class A | 15,732 | 1,093,531 | |||||||||
Starz, Class A(a) | 45,487 | 1,540,190 | |||||||||
Time Warner, Inc.(c) | 21,126 | 1,939,789 | |||||||||
Viacom, Inc., Class B | 14,951 | 560,364 | |||||||||
6,174,797 | |||||||||||
Office/Business Equip - 0.66% | |||||||||||
Xerox Corp. | 108,422 | 1,013,746 | |||||||||
Oil & Gas - 1.03% | |||||||||||
InterOil Corp.(a) | 32,557 | 1,582,270 | |||||||||
Pharmaceuticals - 0.43% | |||||||||||
Actelion Ltd.(a) | 1,434 | 276,447 | |||||||||
Depomed, Inc.(a) | 20,180 | 385,438 | |||||||||
661,885 | |||||||||||
Real Estate Investment Trusts - 0.91% | |||||||||||
Post Properties, Inc. | 21,374 | 1,389,737 | |||||||||
Retail - 4.68% | |||||||||||
Cabela's, Inc.(a)(c) | 44,861 | 2,792,149 | |||||||||
CST Brands, Inc.(b) | 80,496 | 3,866,223 | |||||||||
Dunkin' Brands Group, Inc. | 2,395 | 130,025 | |||||||||
McDonald's Corp. | 1,004 | 119,747 | |||||||||
Popeyes Louisiana Kitchen, Inc.(a) | 2,155 | 129,041 | |||||||||
Restaurant Brands International, Inc. | 2,438 | 115,878 | |||||||||
Wendy's Co. | 1,158 | 14,556 | |||||||||
7,167,619 | |||||||||||
Savings & Loans - 0.21% | |||||||||||
Astoria Financial Corp. | 19,571 | 319,986 | |||||||||
Semiconductors - 2.80% | |||||||||||
Cabot Microelectronics Corp.(b) | 11,923 | 710,372 | |||||||||
Intel Corp. | 4,464 | 154,901 | |||||||||
NXP Semiconductors N.V.(a)(c) | 26,067 | 2,584,543 | |||||||||
QUALCOMM, Inc.(c) | 12,287 | 837,113 | |||||||||
4,286,929 | |||||||||||
See Notes to Financial Statements.
Semi-Annual Report | November 30, 2016
19
The Arbitrage Event-Driven Fund Portfolio of Investments (continued)
November 30, 2016 (Unaudited)
Shares | Value | ||||||||||
| COMMON STOCKS - 66.56% (Continued) | |||||||||||
Software - 1.35% | |||||||||||
CA, Inc. | 4,335 | $ | 138,547 | ||||||||
Citrix Systems, Inc.(a) | 10,767 | 933,822 | |||||||||
Cornerstone OnDemand, Inc.(a) | 23,772 | 853,652 | |||||||||
Oracle Corp. | 3,690 | 148,301 | |||||||||
2,074,322 | |||||||||||
Telecommunications - 0.10% | |||||||||||
Inteliquent, Inc. | 6,897 | 156,148 | |||||||||
| TOTAL COMMON STOCKS (Cost $101,230,450) | 101,969,616 | �� | |||||||||
EXCHANGE-TRADED FUNDS - 1.28% | |||||||||||
Equity Funds - 1.28% | |||||||||||
Consumer Staples Select Sector SPDR® Fund | 8,342 | 421,938 | |||||||||
iShares® Russell 2000 Growth ETF | 2,460 | 374,683 | |||||||||
SPDR® S&P® Homebuilders ETF | 23,354 | 790,533 | |||||||||
Technology Select Sector SPDR® Fund | 7,739 | 367,602 | |||||||||
1,954,756 | |||||||||||
| TOTAL EXCHANGE-TRADED FUNDS (Cost $1,915,288) | 1,954,756 | ||||||||||
RIGHTS - 0.37% | |||||||||||
Casa Ley CVR, Expires 01/30/2018(a)(d)(e) | 891,084 | 371,761 | |||||||||
Chelsea Therapeutics CVR, Expires 03/31/2018(a)(d)(e) | 434,520 | — | |||||||||
Cubist Pharmaceuticals, Inc. CPR, Expires 07/01/2019(a)(d)(e) | 34,500 | — | |||||||||
Leap Wireless International CVR, Expires 03/13/2017(a)(d)(e) | 64,802 | 200,886 | |||||||||
PDC CVR, Expires 12/31/2016(a)(d)(e) | 891,084 | — | |||||||||
Trius Therapeutics CVR, Expires 02/15/2017(a)(d)(e) | 103,378 | — | |||||||||
| TOTAL RIGHTS (Cost $1,115,035) | 572,647 | ||||||||||
| Maturity Date | Rate | Principal Amount | Value | ||||||||||||||||
CORPORATE BONDS - 11.60% | |||||||||||||||||||
Food - 0.09% | |||||||||||||||||||
WhiteWave Foods Co. | 10/01/2022 | 5.375 | % | $ | 127,000 | $ | 140,018 | ||||||||||||
Insurance - 2.19% | |||||||||||||||||||
Ambac Assurance Corp.(f) | 06/07/2020 | 5.100 | % | 2,839,421 | 3,357,615 | ||||||||||||||
See Notes to Financial Statements.
www.arbitragefunds.com | 1-800-295-4485
20
The Arbitrage Event-Driven Fund Portfolio of Investments (continued)
November 30, 2016 (Unaudited)
| Maturity Date | Rate | Principal Amount | Value | ||||||||||||||||
| CORPORATE BONDS - 11.60% (Continued) | |||||||||||||||||||
Media - 4.08% | |||||||||||||||||||
LIN Television Corp.(b) | 01/15/2021 | 6.375 | % | 1,926,000 | $ | 1,993,410 | |||||||||||||
| RCN Telecom Services LLC / RCN Capital Corp.(f) | 08/15/2020 | 8.500 | % | 4,016,000 | 4,256,960 | ||||||||||||||
6,250,370 | |||||||||||||||||||
Miscellaneous Manufacturing - 1.02% | |||||||||||||||||||
Bombardier, Inc.(f) | 03/15/2018 | 7.500 | % | 1,232,000 | 1,318,240 | ||||||||||||||
LSB Industries, Inc.(g) | 08/01/2019 | 8.500 | % | 257,000 | 237,725 | ||||||||||||||
1,555,965 | |||||||||||||||||||
Software - 1.23% | |||||||||||||||||||
Rackspace Hosting, Inc.(f) | 01/15/2024 | 6.500 | % | 1,644,000 | 1,878,270 | ||||||||||||||
Telecommunications - 2.99% | |||||||||||||||||||
Avaya, Inc.(f) | 04/01/2019 | 7.000 | % | 2,211,000 | 1,923,570 | ||||||||||||||
Frontier Communications Corp. | 09/15/2020 | 8.875 | % | 815,000 | 850,656 | ||||||||||||||
Sprint Communications, Inc. | 12/01/2016 | 6.000 | % | 1,814,000 | 1,814,000 | ||||||||||||||
4,588,226 | |||||||||||||||||||
| TOTAL CORPORATE BONDS & NOTES (Cost $17,368,653) | 17,770,464 | ||||||||||||||||||
| Expiration Date | Exercise Price | Contracts | Value | ||||||||||||||||
PURCHASED OPTIONS(a) - 0.04% | |||||||||||||||||||
Call Options Purchased - 0.03% | |||||||||||||||||||
| Alibaba Group Holding Ltd., Sponsored ADR | 12/2016 | $ | 105.00 | 62 | $ | 465 | |||||||||||||
Ambac Financial Group, Inc. | 02/2017 | 25.00 | 147 | 23,153 | |||||||||||||||
| Charter Communications, Inc., Class A | 12/2016 | 300.00 | 40 | 2,300 | |||||||||||||||
Great Plains Energy, Inc. | 12/2016 | 30.00 | 63 | 315 | |||||||||||||||
New York Community Bancorp, Inc. | 01/2017 | 16.00 | 155 | 6,975 | |||||||||||||||
Rockwell Collins, Inc. | 04/2017 | 100.00 | 39 | 12,285 | |||||||||||||||
| TOTAL CALL OPTIONS PURCHASED (Cost $58,246) | 45,493 | ||||||||||||||||||
See Notes to Financial Statements.
Semi-Annual Report | November 30, 2016
21
The Arbitrage Event-Driven Fund Portfolio of Investments (continued)
November 30, 2016 (Unaudited)
| Expiration Date | Exercise Price | Contracts | Value | ||||||||||||||||
PURCHASED OPTIONS(a) - 0.04% (Continued) | |||||||||||||||||||
Put Options Purchased - 0.01% | |||||||||||||||||||
| Alibaba Group Holding Ltd., Sponsored ADR | 01/2017 | $ | 95.00 | 35 | $ | 14,787 | |||||||||||||
Cvent, Inc. | 12/2016 | 35.00 | 31 | 0 | |||||||||||||||
St Jude Medical, Inc. | 12/2016 | 65.00 | 95 | 713 | |||||||||||||||
Westar Energy, Inc. | 12/2016 | 50.00 | 116 | 1,450 | |||||||||||||||
| TOTAL PUT OPTIONS PURCHASED (Cost $32,570) | 16,950 | ||||||||||||||||||
| TOTAL PURCHASED OPTIONS (Cost $90,816) | 62,443 | ||||||||||||||||||
Yield | Shares | Value | |||||||||||||
SHORT-TERM INVESTMENTS - 26.58% | |||||||||||||||
Money Market Fund | |||||||||||||||
| Morgan Stanley Institutional Liquidity Fund - Government Portfolio | 0.295 | %(h) | 35,575,372 | $ | 35,575,372 | ||||||||||
Time Deposit | |||||||||||||||
State Street Bank Time Deposit | 5,138,784 | 5,138,784 | |||||||||||||
| TOTAL SHORT-TERM INVESTMENTS (Cost $40,714,156) | 40,714,156 | ||||||||||||||
| Total Investments - 106.43% (Cost $162,434,398) | 163,044,082 | ||||||||||||||
Liabilities in Excess of Other Assets - (6.43)%(i) | (9,850,407 | ) | |||||||||||||
NET ASSETS — 100.00% | $ | 153,193,675 | |||||||||||||
Portfolio Footnotes
(a) Non-income-producing security.
(b) Security, or a portion of security, is being held as collateral for short sales, written option contracts or forward foreign currency exchange contracts. At November 30, 2016, the aggregate market value of those securities was $27,271,063, representing 17.80% of net assets.
(c) Underlying security for a written/purchased call/put option.
(d) Security fair valued using methods determined in good faith by the Pricing Committee. As of November 30, 2016, the total market value of these securities was $715,791, representing 0.47% of net assets.
(e) Security considered illiquid. On November 30, 2016, the total market value of these securities was $715,791, representing 0.47% of net assets.
See Notes to Financial Statements.
www.arbitragefunds.com | 1-800-295-4485
22
The Arbitrage Event-Driven Fund Portfolio of Investments (continued)
November 30, 2016 (Unaudited)
(f) Security exempt from registration under Rule 144A of the Securities Act of 1933. These securities may be resold in transactions exempt from registration, normally to qualified institutional buyers. As of November 30, 2016, these securities had a total value of $12,734,655 or 8.31% of net assets.
(g) Interest rate will change at a future date. Interest rate shown reflects the rate in effect at November 30, 2016.
(h) Rate shown is the 7-day effective yield as of November 30, 2016.
(i) Includes cash which is being held as collateral for short sales and written option contracts.
Securities are determined to be illiquid under the procedures approved by the Funds' Board of Trustees. Information related to the Fund's illiquid securities as of November 30, 2016 is as follows:
| Date of Purchase | Security | Cost | Value | % of Net Assets | |||||||||||||||
01/30/2015 | Casa Ley CVR | $ | 904,361 | $ | 371,761 | 0.24 | % | ||||||||||||
06/24/2014 | Chelsea Therapeutics CVR | — | — | 0.00 | |||||||||||||||
12/12/2011 | Cubist Pharmaceuticals, Inc. CPR | — | — | 0.00 | |||||||||||||||
05/23/2016 | ExamWorks Group, Inc. | 141,850 | 143,144 | 0.09 | |||||||||||||||
03/17/2014 | Leap Wireless International CVR | 167,189 | 200,886 | 0.13 | |||||||||||||||
01/30/2015 | PDC CVR | 43,485 | — | 0.00 | |||||||||||||||
09/12/2013 | Trius Therapeutics CVR | — | — | 0.00 | |||||||||||||||
$ | 715,791 | 0.46 | % | ||||||||||||||||
SCHEDULE OF SECURITIES SOLD SHORT | Shares | Value | |||||||||
COMMON STOCKS - (20.82%) | |||||||||||
Aerospace & Defense - (0.24%) | |||||||||||
Rockwell Collins, Inc. | (3,938 | ) | $ | (365,131 | ) | ||||||
Agriculture - (0.40%) | |||||||||||
British American Tobacco Plc, Sponsored ADR | (5,586 | ) | (609,097 | ) | |||||||
Auto Parts & Equipment - (0.80%) | |||||||||||
BorgWarner, Inc. | (8,634 | ) | (307,370 | ) | |||||||
Lear Corp. | (2,435 | ) | (315,357 | ) | |||||||
Magna International, Inc. | (7,124 | ) | (288,166 | ) | |||||||
Tenneco, Inc. | (5,336 | ) | (314,557 | ) | |||||||
(1,225,450 | ) | ||||||||||
Chemicals - (1.18%) | |||||||||||
Praxair, Inc. | (14,977 | ) | (1,801,733 | ) | |||||||
Commercial Services - (0.06%) | |||||||||||
Quad/Graphics, Inc. | (3,451 | ) | (97,077 | ) | |||||||
See Notes to Financial Statements.
Semi-Annual Report | November 30, 2016
23
The Arbitrage Event-Driven Fund Portfolio of Investments (continued)
November 30, 2016 (Unaudited)
SCHEDULE OF SECURITIES SOLD SHORT | Shares | Value | |||||||||
| COMMON STOCKS - (20.82%) (Continued) | |||||||||||
Computers & Computer Services - (1.26%) | |||||||||||
CGI Group, Inc., Class A | (3,578 | ) | $ | (169,490 | ) | ||||||
Computer Sciences Corp. | (14,694 | ) | (890,897 | ) | |||||||
Genpact Ltd. | (5,638 | ) | (134,917 | ) | |||||||
HP, Inc. | (23,853 | ) | (367,336 | ) | |||||||
International Business Machines Corp. | (2,244 | ) | (364,022 | ) | |||||||
(1,926,662 | ) | ||||||||||
Construction Materials - (0.55%) | |||||||||||
Armstrong World Industries, Inc. | (20,190 | ) | (841,923 | ) | |||||||
Distribution/Wholesale - (0.25%) | |||||||||||
Ingram Micro, Inc., Class A | (10,088 | ) | (377,695 | ) | |||||||
Diversified Financial Services - (0.55%) | |||||||||||
CME Group, Inc. | (3,826 | ) | (431,994 | ) | |||||||
Intercontinental Exchange, Inc. | (7,380 | ) | (408,852 | ) | |||||||
(840,846 | ) | ||||||||||
Electric - (0.29%) | |||||||||||
Great Plains Energy, Inc. | (16,940 | ) | (447,047 | ) | |||||||
Food - (0.86%) | |||||||||||
Conagra Brands, Inc. | (20,307 | ) | (745,064 | ) | |||||||
Kroger Co. | (2,596 | ) | (83,851 | ) | |||||||
SpartanNash Co. | (6,405 | ) | (231,925 | ) | |||||||
Sprouts Farmers Market, Inc. | (3,710 | ) | (74,237 | ) | |||||||
United Natural Foods, Inc. | (4,031 | ) | (189,255 | ) | |||||||
(1,324,332 | ) | ||||||||||
Healthcare - Products - (3.04%) | |||||||||||
Abbott Laboratories | (122,219 | ) | (4,652,877 | ) | |||||||
Healthcare - Services - (0.71%) | |||||||||||
Aetna, Inc. | (8,364 | ) | (1,094,346 | ) | |||||||
Household Products - (1.08%) | |||||||||||
Procter & Gamble Co. | (20,128 | ) | (1,659,755 | ) | |||||||
Insurance - (0.24%) | |||||||||||
Ambac Financial Group, Inc. | (14,740 | ) | (361,130 | ) | |||||||
See Notes to Financial Statements.
www.arbitragefunds.com | 1-800-295-4485
24
The Arbitrage Event-Driven Fund Portfolio of Investments (continued)
November 30, 2016 (Unaudited)
SCHEDULE OF SECURITIES SOLD SHORT | Shares | Value | |||||||||
| COMMON STOCKS - (20.82%) (Continued) | |||||||||||
Internet - (2.19%) | |||||||||||
Alibaba Group Holding Ltd., Sponsored ADR | (24,372 | ) | $ | (2,291,455 | ) | ||||||
F5 Networks, Inc. | (1,322 | ) | (186,071 | ) | |||||||
Symantec Corp. | (33,063 | ) | (806,407 | ) | |||||||
Twitter, Inc. | (3,800 | ) | (70,262 | ) | |||||||
(3,354,195 | ) | ||||||||||
Media - (2.21%) | |||||||||||
Cable One, Inc. | (510 | ) | (301,441 | ) | |||||||
Charter Communications, Inc., Class A | (3,926 | ) | (1,080,867 | ) | |||||||
Time Warner, Inc. | (3,900 | ) | (358,098 | ) | |||||||
Twenty-First Century Fox, Inc., Class A | (15,434 | ) | (433,850 | ) | |||||||
Walt Disney Co. | (12,162 | ) | (1,205,497 | ) | |||||||
(3,379,753 | ) | ||||||||||
Office/Business Equip - (0.34%) | |||||||||||
Canon, Inc., Sponsored ADR | (18,215 | ) | (526,596 | ) | |||||||
Oil & Gas - (0.26%) | |||||||||||
Exxon Mobil Corp. | (4,625 | ) | (403,762 | ) | |||||||
Pharmaceuticals - (0.05%) | |||||||||||
Actelion Ltd., Sponsored ADR | (1,500 | ) | (73,224 | ) | |||||||
Real Estate Investment Trusts - (0.91%) | |||||||||||
Mid-America Apartment Communities, Inc. | (15,179 | ) | (1,390,852 | ) | |||||||
Retail - (0.53%) | |||||||||||
Yum! Brands, Inc. | (12,869 | ) | (815,766 | ) | |||||||
Savings & Loans - (0.20%) | |||||||||||
New York Community Bancorp, Inc. | (19,571 | ) | (312,745 | ) | |||||||
Semiconductors - (0.98%) | |||||||||||
Entegris, Inc. | (32,411 | ) | (581,777 | ) | |||||||
Intel Corp. | (13,835 | ) | (480,075 | ) | |||||||
Microchip Technology, Inc. | (2,427 | ) | (160,619 | ) | |||||||
Qorvo, Inc. | (2,523 | ) | (134,753 | ) | |||||||
Texas Instruments, Inc. | (2,057 | ) | (152,074 | ) | |||||||
(1,509,298 | ) | ||||||||||
See Notes to Financial Statements.
Semi-Annual Report | November 30, 2016
25
The Arbitrage Event-Driven Fund Portfolio of Investments (continued)
November 30, 2016 (Unaudited)
SCHEDULE OF SECURITIES SOLD SHORT | Shares | Value | |||||||||
| COMMON STOCKS - (20.82%) (Continued) | |||||||||||
Telecommunications - (1.64%) | |||||||||||
Cisco Systems, Inc. | (9,223 | ) | $ | (275,030 | ) | ||||||
LogMeIn, Inc. | (17,503 | ) | (1,765,178 | ) | |||||||
T-Mobile US, Inc. | (8,654 | ) | (469,133 | ) | |||||||
(2,509,341 | ) | ||||||||||
| TOTAL COMMON STOCKS (Proceeds $31,388,344) | (31,900,633 | ) | |||||||||
EXCHANGE-TRADED FUNDS - (2.31%) | |||||||||||
Equity Funds - (2.31%) | |||||||||||
Consumer Staples Select Sector SPDR® Fund | (19,834 | ) | (1,003,204 | ) | |||||||
iShares® Nasdaq Biotechnology ETF | (1,067 | ) | (292,433 | ) | |||||||
iShares® Russell 2000 ETF | (1,403 | ) | (184,649 | ) | |||||||
Materials Select Sector SPDR® Fund | (29,880 | ) | (1,492,207 | ) | |||||||
Technology Select Sector SPDR® Fund | (11,896 | ) | (565,060 | ) | |||||||
(3,537,553 | ) | ||||||||||
| TOTAL EXCHANGE-TRADED FUNDS (Proceeds $3,516,952) | (3,537,553 | ) | |||||||||
RIGHTS - 0.00%(a) | |||||||||||
Chelsea Therapeutics CVR, Expires 03/31/2018 | (200 | ) | — | ||||||||
| TOTAL RIGHTS (Proceeds $0) | — | ||||||||||
(a) Less than 0.005% of net assets.
| Maturity Date | Rate | Principal Amount | Value | ||||||||||||||||
CORPORATE BONDS - (0.19%) | |||||||||||||||||||
Computers & Computer Services - (0.19%) | |||||||||||||||||||
| Diamond 1 Finance Corp. / Diamond 2 Finance Corp. | 06/15/2023 | 5.450 | % | $ | (282,000 | ) | $ | (293,855 | ) | ||||||||||
| TOTAL CORPORATE BONDS (Proceeds $283,347) | (293,855 | ) | |||||||||||||||||
| TOTAL SECURITIES SOLD SHORT (Proceeds $35,188,643) | $ | (35,732,041 | ) | ||||||||||||||||
See Notes to Financial Statements.
www.arbitragefunds.com | 1-800-295-4485
26
The Arbitrage Event-Driven Fund Portfolio of Investments (continued)
November 30, 2016 (Unaudited)
WRITTEN OPTIONS | Expiration Date | Exercise Price | Contracts | Value | |||||||||||||||
Written Call Options | |||||||||||||||||||
| Alibaba Group Holding Ltd., Sponsored ADR | 12/2016 | $ | 110.00 | (62 | ) | $ | (93 | ) | |||||||||||
Cabela's, Inc. | 12/2016 | 60.00 | (44 | ) | (10,560 | ) | |||||||||||||
| Harman International Industries, Inc.: | |||||||||||||||||||
12/2016 | 110.00 | (69 | ) | (1,035 | ) | ||||||||||||||
01/2017 | 110.00 | (78 | ) | (3,120 | ) | ||||||||||||||
LifeLock, Inc. | 01/2017 | 24.00 | (93 | ) | (465 | ) | |||||||||||||
NXP Semiconductors N.V.: | |||||||||||||||||||
12/2016 | 97.50 | (45 | ) | (8,213 | ) | ||||||||||||||
12/2016 | 98.00 | (17 | ) | (3,783 | ) | ||||||||||||||
12/2016 | 98.50 | (11 | ) | (1,017 | ) | ||||||||||||||
12/2016 | 99.00 | (16 | ) | (1,240 | ) | ||||||||||||||
12/2016 | 99.50 | (23 | ) | (920 | ) | ||||||||||||||
12/2016 | 100.00 | (9 | ) | (270 | ) | ||||||||||||||
01/2017 | 97.50 | (84 | ) | (22,890 | ) | ||||||||||||||
01/2017 | 100.00 | (58 | ) | (7,685 | ) | ||||||||||||||
Time Warner, Inc.: | |||||||||||||||||||
12/2016 | 87.50 | (3 | ) | (1,365 | ) | ||||||||||||||
12/2016 | 90.00 | (44 | ) | (10,670 | ) | ||||||||||||||
12/2016 | 90.50 | (3 | ) | (660 | ) | ||||||||||||||
12/2016 | 91.00 | (13 | ) | (2,411 | ) | ||||||||||||||
12/2016 | 91.50 | (17 | ) | (2,576 | ) | ||||||||||||||
12/2016 | 92.00 | (24 | ) | (3,060 | ) | ||||||||||||||
12/2016 | 92.50 | (26 | ) | (2,652 | ) | ||||||||||||||
12/2016 | 93.00 | (25 | ) | (2,137 | ) | ||||||||||||||
| TOTAL WRITTEN CALL OPTIONS (Premiums received $95,131) | (86,822 | ) | |||||||||||||||||
See Notes to Financial Statements.
Semi-Annual Report | November 30, 2016
27
The Arbitrage Event-Driven Fund Portfolio of Investments (continued)
November 30, 2016 (Unaudited)
WRITTEN OPTIONS | Expiration Date | Exercise Price | Contracts | Value | |||||||||||||||
Written Put Options | |||||||||||||||||||
NXP Semiconductors N.V.: | |||||||||||||||||||
12/2016 | $ | 97.50 | (3 | ) | $ | (75 | ) | ||||||||||||
12/2016 | 100.00 | (14 | ) | (1,750 | ) | ||||||||||||||
QUALCOMM, Inc. | 12/2016 | 65.00 | (18 | ) | (639 | ) | |||||||||||||
Time Warner, Inc.: | |||||||||||||||||||
12/2016 | 85.00 | (7 | ) | (14 | ) | ||||||||||||||
12/2016 | 87.50 | (6 | ) | (78 | ) | ||||||||||||||
12/2016 | 89.00 | (4 | ) | (100 | ) | ||||||||||||||
12/2016 | 90.00 | (5 | ) | (225 | ) | ||||||||||||||
Valspar Corp. | 01/2017 | 105.00 | (7 | ) | (2,380 | ) | |||||||||||||
| TOTAL WRITTEN PUT OPTIONS (Premiums received $5,638) | (5,261 | ) | |||||||||||||||||
| TOTAL WRITTEN OPTIONS (Premiums received $100,769) | $ | (92,083 | ) | ||||||||||||||||
EQUITY SWAP CONTRACTS
| Swap Counterparty | Reference Obligation | Rate Paid/Received by the Fund | Termination Date | Notional Amount | Unrealized Appreciation | ||||||||||||||||||
| Goldman Sachs & Co. | Micro Focus International Plc | Received 1 Month- LIBOR minus 45 bps | 11/30/2017 | $ | 100,610 | $ | 0 | ||||||||||||||||
OUTSTANDING FORWARD FOREIGN CURRENCY EXCHANGE CONTRACTS
| Contract Description | Counterparty | Contracts to Deliver/Receive | Purchase/Sale Contract | Expiration Date | Current Value | Unrealized Appreciation | |||||||||||||||||||||
CHF | Goldman Sachs | 28,000 | Purchase | 12/15/2016 | $ | 27,563 | $ | 40 | |||||||||||||||||||
CHF | Goldman Sachs | 127,300 | Sale | 12/15/2016 | 125,313 | 1,444 | |||||||||||||||||||||
GBP | Goldman Sachs | 4,207,700 | Purchase | 12/15/2016 | 5,266,397 | 104,919 | |||||||||||||||||||||
GBP | Goldman Sachs | 5,077,300 | Sale | 12/15/2016 | 6,354,796 | 412,743 | |||||||||||||||||||||
SEK | Goldman Sachs | 12,096,300 | Purchase | 12/15/2016 | 1,312,523 | 3,772 | |||||||||||||||||||||
SEK | Goldman Sachs | 12,096,300 | Sale | 12/15/2016 | 1,312,525 | 69,947 | |||||||||||||||||||||
$ | 592,865 | ||||||||||||||||||||||||||
| Contract Description | Counterparty | Contracts to Deliver/Receive | Purchase/Sale Contract | Expiration Date | Current Value | Unrealized Depreciation | |||||||||||||||||||||
CHF | Goldman Sachs | 72,900 | Purchase | 12/15/2016 | $ | 71,763 | $ | (339 | ) | ||||||||||||||||||
GBP | Goldman Sachs | 869,600 | Purchase | 12/15/2016 | 1,088,400 | (38,718 | ) | ||||||||||||||||||||
$ | (39,057 | ) | |||||||||||||||||||||||||
See Notes to Financial Statements.
www.arbitragefunds.com | 1-800-295-4485
28
The Arbitrage Event-Driven Fund Portfolio of Investments (continued)
November 30, 2016 (Unaudited)
The following is a summary of investments classified by country exposure:
Country | % of Net Assets(a) | ||||||
Bermuda | 2.67 | % | |||||
Switzerland | 1.73 | % | |||||
Netherlands | 1.69 | % | |||||
Germany | 1.12 | % | |||||
Ireland | 1.05 | % | |||||
Singapore | 1.03 | % | |||||
Canada | 1.01 | % | |||||
United Kingdom | 0.73 | % | |||||
China | 0.21 | % | |||||
United States | 95.19 | % | |||||
Liabilities in Excess of Other Assets | (6.43 | )% | |||||
100.00 | % | ||||||
(a) These percentages represent long positions only and are not net of short positions.
Abbreviations:
ADR - American Depositary Receipt
AG - Aktiengesellschaft is a German term that refers to a corporation that is limited by shares, i.e., owned by shareholders.
bps - Basis Points
CHF - Swiss franc
CPR - Conditional Prepayment Rate
CVR - Contingent Value Rights
ETF - Exchange-Traded Fund
GBP - British pound
LIBOR - London Interbank Offered Rate
LLC - Limited Liability Company
Ltd. - Limited
N.V. - Naamloze Vennootschap is the Dutch term for a public limited liability corporation.
NVDR - Non-Voting Depository Receipt
Plc - Public Limited Company
SEK - Swedish krona
SPDR - Standard & Poor's Depositary Receipt
See Notes to Financial Statements.
Semi-Annual Report | November 30, 2016
29
The Arbitrage Event-Driven Fund Portfolio of Investments (continued)
November 30, 2016 (Unaudited)
The following table summarizes The Arbitrage Event-Driven Fund's investments and derivative financial instruments categorized in the disclosure hierarchy as of November 30, 2016:
Investments in Securities at Value* | Level 1 | Level 2 | Level 3 | Total | |||||||||||||||
Assets | |||||||||||||||||||
Common Stocks | |||||||||||||||||||
Aerospace & Defense | $ | 762,688 | $ | — | $ | — | $ | 762,688 | |||||||||||
Agriculture | 2,121,477 | — | — | 2,121,477 | |||||||||||||||
Auto Parts & Equipment | 1,496,681 | — | — | 1,496,681 | |||||||||||||||
Chemicals | 13,466,387 | — | — | 13,466,387 | |||||||||||||||
Commercial Services | 4,298,222 | 143,144 | — | 4,441,366 | |||||||||||||||
| Computers & Computer Services | 3,957,809 | — | — | 3,957,809 | |||||||||||||||
| Diversified Financial Services | 823,148 | — | — | 823,148 | |||||||||||||||
Electric | 7,966,785 | — | — | 7,966,785 | |||||||||||||||
Food | 5,120,980 | — | — | 5,120,980 | |||||||||||||||
Healthcare - Products | 11,164,428 | — | — | 11,164,428 | |||||||||||||||
Home Furnishings | 3,260,648 | — | — | 3,260,648 | |||||||||||||||
Household Products | 948,596 | — | — | 948,596 | |||||||||||||||
Household Products/Wares | 801,112 | — | — | 801,112 | |||||||||||||||
Insurance | 4,086,673 | — | — | 4,086,673 | |||||||||||||||
Internet | 14,080,282 | — | — | 14,080,282 | |||||||||||||||
| Machinery - Construction & Mining | 2,643,117 | — | — | 2,643,117 | |||||||||||||||
Media | 6,174,797 | — | — | 6,174,797 | |||||||||||||||
Office/Business Equip | 1,013,746 | — | — | 1,013,746 | |||||||||||||||
Oil & Gas | 1,582,270 | — | — | 1,582,270 | |||||||||||||||
Pharmaceuticals | 661,885 | — | — | 661,885 | |||||||||||||||
Real Estate Investment Trusts | 1,389,737 | — | — | 1,389,737 | |||||||||||||||
Retail | 7,167,619 | — | — | 7,167,619 | |||||||||||||||
Savings & Loans | 319,986 | — | — | 319,986 | |||||||||||||||
Semiconductors | 4,286,929 | — | — | 4,286,929 | |||||||||||||||
Software | 2,074,322 | — | — | 2,074,322 | |||||||||||||||
Telecommunications | 156,148 | — | — | 156,148 | |||||||||||||||
Exchange-Traded Funds | 1,954,756 | — | — | 1,954,756 | |||||||||||||||
Rights | — | 200,886 | 371,761 | 572,647 | |||||||||||||||
Corporate Bonds** | — | 17,770,464 | — | 17,770,464 | |||||||||||||||
Purchased Options | 62,443 | — | — | 62,443 | |||||||||||||||
Short-Term Investments | 40,714,156 | — | — | 40,714,156 | |||||||||||||||
TOTAL | $ | 144,557,827 | $ | 18,114,494 | $ | 371,761 | $ | 163,044,082 | |||||||||||
* Refer to footnote 2 where leveling hierarchy is defined.
** Refer to Portfolio of Investments for sector information.
See Notes to Financial Statements.
www.arbitragefunds.com | 1-800-295-4485
30
The Arbitrage Event-Driven Fund Portfolio of Investments (continued)
November 30, 2016 (Unaudited)
Other Financial Instruments*** | Level 1 | Level 2 | Level 3 | Total | |||||||||||||||
Assets | |||||||||||||||||||
| Forward Foreign Currency Exchange Contracts | $ | — | $ | 592,865 | $ | — | $ | 592,865 | |||||||||||
Liabilities | |||||||||||||||||||
Common Stocks** | (31,900,633 | ) | — | — | (31,900,633 | ) | |||||||||||||
Exchange-Traded Funds | (3,537,553 | ) | — | — | (3,537,553 | ) | |||||||||||||
Corporate Bonds** | — | (293,855 | ) | — | (293,855 | ) | |||||||||||||
Written Options | (92,083 | ) | — | — | (92,083 | ) | |||||||||||||
| Forward Foreign Currency Exchange Contracts | — | (39,057 | ) | — | (39,057 | ) | |||||||||||||
TOTAL | $ | (35,530,269 | ) | $ | 259,953 | $ | 0 | $ | (35,270,316 | ) | |||||||||
** Refer to Portfolio of Investments for sector information.
*** Other financial instruments are instruments such as written options, securities sold short, equity swaps and forward foreign currency exchange contracts.
The Fund recognizes transfers between levels as of the beginning of the annual period in which the transfer occurred.
Transfers from Level 1 to Level 2 at November 30, 2016 in the amount of $1,246,217 were due to the application of fair value pricing pursuant to Fair Valuation procedures approved by the Board of Trustees. A market price for identical securities was not available.
The following is a reconciliation of the fair valuations using significant unobservable inputs (Level 3) for the Fund's assets and liabilities during the period ended November 30, 2016:
| Investments in Securities | Balance as of May 31, 2016 | Change in Unrealized Depreciation | Purchases | Sales Proceeds | Transfers into Level 3 | Transfers out of Level 3 | Balance as of November 30, 2016 | Net change in Unrealized Depreciation included in the Statement of Operations attributable to Level 3 investments held at November 30, 2016 | |||||||||||||||||||||||||||
Rights | $ | 409,795 | $ | (38,034 | ) | $ | — | $ | — | $ | — | $ | — | $ | 371,761 | $ | (38,034 | ) | |||||||||||||||||
Total | $ | 409,795 | $ | (38,034 | ) | $ | — | $ | — | $ | — | $ | — | $ | 371,761 | $ | (38,034 | ) | |||||||||||||||||
See Notes to Financial Statements.
Semi-Annual Report | November 30, 2016
31
The Arbitrage Event-Driven Fund Portfolio of Investments (continued)
November 30, 2016 (Unaudited)
| Other Financial Instruments | Balance as of May 31, 2016 | Change in Unrealized Appreciation | Purchases | Sales Proceeds | Transfers into Level 3 | Transfers out of Level 3 | Balance as of November 30, 2016 | Net change in Unrealized Appreciation included in the Statement of Operations attributable to Level 3 investments held at November 30, 2016 | |||||||||||||||||||||||||||
Rights | $ | (12 | ) | $ | 12 | $ | — | $ | — | $ | — | $ | — | $ | — | $ | 12 | ||||||||||||||||||
Total | $ | (12 | ) | $ | 12 | $ | — | $ | — | $ | — | $ | — | $ | — | $ | 12 | ||||||||||||||||||
See Notes to Financial Statements.
www.arbitragefunds.com | 1-800-295-4485
32
The Arbitrage Credit Opportunities Fund Portfolio Information
November 30, 2016 (Unaudited)
Performance (annualized returns as of November 30, 2016)
| One Year | Since Inception* | ||||||||||
Arbitrage Credit Opportunities Fund, Class R | 3.96 | % | 2.25 | % | |||||||
Arbitrage Credit Opportunities Fund, Class I | 4.12 | % | 2.46 | % | |||||||
Arbitrage Credit Opportunities Fund, Class C** | 3.11 | % | 1.53 | % | |||||||
Arbitrage Credit Opportunities Fund, Class A*** | 3.90 | % | 1.98 | % | |||||||
Bloomberg Barclays U.S. Aggregate Bond Index | 2.17 | % | 1.69 | % | |||||||
BofA Merrill Lynch U.S. 3-Month Treasury Bill Index | 0.32 | % | 0.12 | % | |||||||
Current performance may be higher or lower than performance quoted above. Any performance data quoted represents past performance and the investment return and principal value of an investment in the Fund will fluctuate so that an investor's shares, when redeemed, may be worth more or less than their original cost. Past performance is no guarantee of future results. Returns do not reflect a 2% redemption fee for shares that are redeemed from the fund within 60 days of purchase, which, if reflected, would reduce the performance quoted. Returns shown above include the reinvestment of all dividends and capital gains. Contractual fee waivers are currently in effect. Without such fee waivers, performance numbers would be reduced. You can obtain performance data current to the most recent month end by calling 1-800-295-4485 or going to www.arbitragefunds.com.
* Class R, Class I and Class C inception: 10/1/12; Class A inception: 6/1/13.
** Class C shares are subject to a 1.00% contingent deferred sales charge on all purchases redeemed in 12 months of purchase.
*** Class A shares are subject to a maximum front-end sales load of 3.25% on purchases up to $500,000. The shares are also subject to a deferred sales charge of up to 1.00% on purchases of $500,000 or more purchased without a front-end sales load and redeemed within 18 months of purchase.
The Total Annual Fund Operating Expenses for Class R, Class I, Class C and Class A are 1.95%, 1.70%, 2.70% and 1.95%, respectively. The Advisor has agreed to waive fees (not including the effects of interest, dividends on short positions, brokerage commissions, acquired fund fees and expenses, taxes, or other extraordinary expenses) in excess of 1.50%, 1.25%, 2.25% and 1.50% for Class R, Class I, Class C and Class A, respectively, until at least September 30, 2017. These expense ratios are as stated in the current prospectus and may differ from the expense ratios disclosed in the financial highlights in this report.
The Bloomberg Barclays U.S. Aggregate Bond Index is a market value-weighted index of investment grade fixed-rated debt issues, including government, corporate, asset-backed and mortgage-backed securities with a maturity of one year or more.
The Bank of America (BofA) Merrill Lynch U.S. 3-Month Treasury Bill Index tracks the performance of the U.S. dollar denominated U.S. Treasury Bills publicly issued in the U.S. domestic market with a remaining term to final maturity of less than 3 months.
An investor may not invest directly in an index.
Semi-Annual Report | November 30, 2016
33
The Arbitrage Credit Opportunities Fund Portfolio Information (continued)
November 30, 2016 (Unaudited)
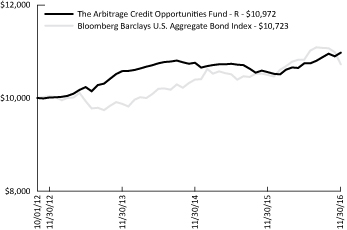
Growth of $10,000 Investment
The chart represents historical performance of a hypothetical investment of $10,000 in the Class R shares of the Fund since inception. Past performance does not guarantee future results. This chart does not reflect the deduction of taxes that a shareholder would pay on Fund distributions or the redemption of Fund shares.
Sector Weighting
The following chart shows the sector weightings of The Arbitrage Credit Opportunities Fund's investments in corporate bonds and convertible corporate bonds as of the report date.

www.arbitragefunds.com | 1-800-295-4485
34
The Arbitrage Credit Opportunities Fund Portfolio of Investments
November 30, 2016 (Unaudited)
| Maturity Date | Rate | Principal Amount | Value | ||||||||||||||||
CORPORATE BONDS - 56.76% | |||||||||||||||||||
Chemicals - 1.04% | |||||||||||||||||||
Ashland LLC | 04/15/2018 | 3.875 | % | $ | 562,000 | $ | 573,240 | ||||||||||||
Coal - 1.18% | |||||||||||||||||||
Peabody Energy Corp.(a)(b) | 03/15/2022 | 10.000 | % | 750,000 | 646,875 | ||||||||||||||
Computers & Computer Services - 1.99% | |||||||||||||||||||
| Diamond 1 Finance Corp. / Diamond 2 Finance Corp.(a)(c) | 06/15/2021 | 5.875 | % | 1,039,000 | 1,094,966 | ||||||||||||||
Electric - 1.84% | |||||||||||||||||||
GenOn Energy, Inc.(c) | 06/15/2017 | 7.875 | % | 1,401,000 | 1,008,720 | ||||||||||||||
Entertainment - 2.79% | |||||||||||||||||||
Scientific Games Corp. | 09/15/2018 | 8.125 | % | 828,000 | 833,175 | ||||||||||||||
| Scientific Games International, Inc. | |||||||||||||||||||
05/15/2021 | 6.625 | % | 381,000 | 306,705 | |||||||||||||||
12/01/2022 | 10.000 | % | 416,000 | 390,000 | |||||||||||||||
1,529,880 | |||||||||||||||||||
Food - 8.50% | |||||||||||||||||||
| Bumble Bee Holdco., SCA, PIK (10.38% PIK)(a)(d) | 03/15/2018 | 9.625 | % | 250,000 | 245,000 | ||||||||||||||
Bumble Bee Holdings, Inc.(a)(c) | 12/15/2017 | 9.000 | % | 1,807,000 | 1,784,412 | ||||||||||||||
Simmons Foods, Inc.(a) | 10/01/2021 | 7.875 | % | 873,000 | 883,913 | ||||||||||||||
WhiteWave Foods Co. | 10/01/2022 | 5.375 | % | 1,589,000 | 1,751,872 | ||||||||||||||
4,665,197 | |||||||||||||||||||
Home Builders - 1.77% | |||||||||||||||||||
WCI Communities, Inc. | 08/15/2021 | 6.875 | % | 925,000 | 971,250 | ||||||||||||||
Insurance - 4.53% | |||||||||||||||||||
Ambac Assurance Corp.(a) | 06/07/2020 | 5.100 | % | 2,101,283 | 2,484,767 | ||||||||||||||
Machinery - Construction & Mining - 1.00% | |||||||||||||||||||
Terex Corp. | 05/15/2021 | 6.000 | % | 540,000 | 546,750 | ||||||||||||||
Media - 6.02% | |||||||||||||||||||
LIN Television Corp. | 01/15/2021 | 6.375 | % | 753,000 | 779,355 | ||||||||||||||
| RCN Telecom Services LLC / RCN Capital Corp.(a) | 08/15/2020 | 8.500 | % | 2,381,000 | 2,523,860 | ||||||||||||||
3,303,215 | |||||||||||||||||||
See Notes to Financial Statements.
Semi-Annual Report | November 30, 2016
35
The Arbitrage Credit Opportunities Fund Portfolio of Investments (continued)
November 30, 2016 (Unaudited)
| Maturity Date | Rate | Principal Amount | Value | ||||||||||||||||
CORPORATE BONDS - 56.76% (Continued) | |||||||||||||||||||
Miscellaneous Manufacturing - 5.46% | |||||||||||||||||||
Bombardier, Inc.(a) | |||||||||||||||||||
03/15/2018 | 7.500 | % | $ | 1,744,000 | $ | 1,866,080 | |||||||||||||
12/01/2021 | 8.750 | % | 1,000,000 | 992,500 | |||||||||||||||
LSB Industries, Inc. | 08/01/2019 | 8.500 | % | 151,000 | 139,675 | ||||||||||||||
2,998,255 | |||||||||||||||||||
Pharmaceuticals - 1.30% | |||||||||||||||||||
| Valeant Pharmaceuticals International, Inc.(a) | 08/15/2018 | 6.750 | % | 750,000 | 711,094 | ||||||||||||||
Retail - 8.79% | |||||||||||||||||||
CST Brands, Inc. | 05/01/2023 | 5.000 | % | 1,463,000 | 1,514,205 | ||||||||||||||
| Neiman Marcus Group Ltd. LLC(a) | 10/15/2021 | 8.000 | % | 836,000 | 660,440 | ||||||||||||||
Rite Aid Corp.(c) | 03/15/2020 | 9.250 | % | 1,000,000 | 1,046,250 | ||||||||||||||
Rite Aid Corp.(a)(c) | 04/01/2023 | 6.125 | % | 1,500,000 | 1,603,350 | ||||||||||||||
4,824,245 | |||||||||||||||||||
Software - 3.75% | |||||||||||||||||||
Rackspace Hosting, Inc.(a) | 01/15/2024 | 6.500 | % | 1,800,000 | 2,056,500 | ||||||||||||||
Telecommunications - 6.80% | |||||||||||||||||||
Avaya, Inc.(a) | 04/01/2019 | 7.000 | % | 1,657,000 | 1,441,590 | ||||||||||||||
| FairPoint Communications, Inc.(a)(c) | 08/15/2019 | 8.750 | % | 818,000 | 842,540 | ||||||||||||||
Frontier Communications Corp. | 09/15/2020 | 8.875 | % | 515,000 | 537,531 | ||||||||||||||
Sprint Communications, Inc.(c) | 12/01/2016 | 6.000 | % | 910,000 | 910,000 | ||||||||||||||
3,731,661 | |||||||||||||||||||
| TOTAL CORPORATE BONDS & NOTES (Cost $30,914,097) | 31,146,615 | ||||||||||||||||||
CONVERTIBLE CORPORATE BONDS - 23.04% | |||||||||||||||||||
Commercial Services - 3.68% | |||||||||||||||||||
Monster Worldwide, Inc. | 10/15/2019 | 3.500 | % | 1,990,000 | 2,021,094 | ||||||||||||||
Internet - 14.57% | |||||||||||||||||||
FireEye, Inc., Series B | 06/01/2035 | 1.625 | % | 1,314,000 | 1,181,779 | ||||||||||||||
LinkedIn Corp.(c) | 11/01/2019 | 0.500 | % | 3,000,000 | 2,990,625 | ||||||||||||||
Shutterfly, Inc.(c) | 05/15/2018 | 0.250 | % | 1,500,000 | 1,508,438 | ||||||||||||||
Twitter, Inc.(c) | 09/15/2021 | 1.000 | % | 2,500,000 | 2,314,062 | ||||||||||||||
7,994,904 | |||||||||||||||||||
See Notes to Financial Statements.
www.arbitragefunds.com | 1-800-295-4485
36
The Arbitrage Credit Opportunities Fund Portfolio of Investments (continued)
November 30, 2016 (Unaudited)
| Maturity Date | Rate | Principal Amount | Value | ||||||||||||||||
CONVERTIBLE CORPORATE BONDS - 23.04% (Continued) | |||||||||||||||||||
Pharmaceuticals - 2.94% | |||||||||||||||||||
Depomed, Inc. | 09/01/2021 | 2.500 | % | $ | 1,357,000 | $ | 1,616,526 | ||||||||||||
Software - 1.85% | |||||||||||||||||||
Cornerstone OnDemand, Inc. | 07/01/2018 | 1.500 | % | 1,000,000 | 1,013,750 | ||||||||||||||
| TOTAL CONVERTIBLE CORPORATE BONDS (Cost $12,493,150) | 12,646,274 | ||||||||||||||||||
| Expiration Date | Exercise Price | Contracts | Value | ||||||||||||||||
PURCHASED OPTIONS(e) - 0.24% | |||||||||||||||||||
Call Option Purchased - 0.03% | |||||||||||||||||||
Ambac Financial Group, Inc. | 02/2017 | $ | 25.00 | 109 | $ | 17,167 | |||||||||||||
Put Options Purchased - 0.21% | |||||||||||||||||||
| Depomed, Inc.12/201616.00188 | 5,170 | ||||||||||||||||||
| SPDR S&P500 ETF Trust01/2017210.00750 | 109,125 | ||||||||||||||||||
| TOTAL PUT OPTIONS PURCHASED (Cost $201,564) | 114,295 | ||||||||||||||||||
| TOTAL PURCHASED OPTIONS (Cost $210,408) | $ | 131,462 | |||||||||||||||||
Yield | Shares | Value | |||||||||||||
SHORT-TERM INVESTMENTS - 19.07% | |||||||||||||||
Money Market Fund | |||||||||||||||
| Morgan Stanley Institutional Liquidity Fund - Government Portfolio | 0.295 | %(f) | 10,463,273 | $ | 10,463,273 | ||||||||||
| TOTAL SHORT-TERM INVESTMENTS (Cost $10,463,273) | 10,463,273 | ||||||||||||||
| Total Investments - 99.11% (Cost $54,080,928) | 54,387,624 | ||||||||||||||
Other Assets in Excess of Liabilities - 0.89%(g) | 488,502 | ||||||||||||||
NET ASSETS - 100.00% | $ | 54,876,126 | |||||||||||||
See Notes to Financial Statements.
Semi-Annual Report | November 30, 2016
37
The Arbitrage Credit Opportunities Fund Portfolio of Investments (continued)
November 30, 2016 (Unaudited)
Portfolio Footnotes
(a) Security exempt from registration under Rule 144A of the Securities Act of 1933. These securities may be resold in transactions exempt from registration, normally to qualified institutional buyers. As of November 30, 2016, these securities had a total value of $19,837,887 or 36.15% of net assets.
(b) Security in default on interest payments.
(c) Security, or a portion of security, is being held as collateral for short sales. At November 30, 2016, the aggregate market value of those securities was $10,950,765, representing 19.96% of net assets.
(d) Security considered illiquid. On November 30, 2016, the total market value of these securities was $245,000, representing 0.45% of net assets.
(e) Non-income-producing security.
(f) Rate shown is the 7-day effective yield as of November 30, 2016.
(g) Includes cash which is being held as collateral for short sales and written option contracts.
Securities are determined to be illiquid under the procedures approved by the Funds' Board of Trustees. Information related to the Fund's illiquid securities as of November 30, 2016 is as follows:
| Date of Purchase | Security | Cost | Value | % of Net Assets | |||||||||||||||
06/02/2015 | Bumble Bee Holdco., SCA | $ | 254,586 | $ | 245,000 | 0.45 | % | ||||||||||||
See Notes to Financial Statements.
www.arbitragefunds.com | 1-800-295-4485
38
The Arbitrage Credit Opportunities Fund Portfolio of Investments (continued)
November 30, 2016 (Unaudited)
SCHEDULE OF SECURITIES SOLD SHORT | Shares | Value | |||||||||
COMMON STOCKS - (2.63%) | |||||||||||
Insurance - (0.49%) | |||||||||||
Ambac Financial Group, Inc. | (10,908 | ) | $ | (267,246 | ) | ||||||
Internet - (0.91%) | |||||||||||
Shutterfly, Inc. | (7,000 | ) | (354,690 | ) | |||||||
Twitter, Inc. | (8,000 | ) | (147,920 | ) | |||||||
(502,610 | ) | ||||||||||
Pharmaceuticals - (1.23%) | |||||||||||
Depomed, Inc. | (35,243 | ) | (673,141 | ) | |||||||
| TOTAL COMMON STOCKS (Proceeds $1,475,788) | (1,442,997 | ) | |||||||||
| Maturity Date | Rate | Principal Amount | Value | ||||||||||||||||
CORPORATE BONDS - (11.83%) | |||||||||||||||||||
Chemicals - (2.48%) | |||||||||||||||||||
Ashland LLC | 08/15/2022 | 4.750 | % | $ | (1,325,000 | ) | $ | (1,363,094 | ) | ||||||||||
Commercial Services - (0.74%) | |||||||||||||||||||
Team Health, Inc. | 12/15/2023 | 7.250 | % | (360,000 | ) | (405,454 | ) | ||||||||||||
Computers & Computer Services - (2.17%) | |||||||||||||||||||
| Diamond 1 Finance Corp. / Diamond 2 Finance Corp. | 06/15/2023 | 5.450 | % | (259,000 | ) | (269,888 | ) | ||||||||||||
EMC Corp. | 06/01/2020 | 2.650 | % | (958,000 | ) | (917,811 | ) | ||||||||||||
(1,187,699 | ) | ||||||||||||||||||
Entertainment - (1.16%) | |||||||||||||||||||
| International Game Technology Plc | 02/15/2022 | 6.250 | % | (600,000 | ) | (637,500 | ) | ||||||||||||
Internet - (1.57%) | |||||||||||||||||||
Symantec Corp. | 09/15/2020 | 4.200 | % | (842,000 | ) | (860,150 | ) | ||||||||||||
Retail - (3.71%) | |||||||||||||||||||
Nordstrom, Inc. | 10/15/2021 | 4.000 | % | (1,194,000 | ) | (1,254,150 | ) | ||||||||||||
Walgreens Boots Alliance, Inc. | 11/18/2024 | 3.800 | % | (770,000 | ) | (781,983 | ) | ||||||||||||
(2,036,133 | ) | ||||||||||||||||||
| TOTAL CORPORATE BONDS (Proceeds $6,418,647) | (6,490,030 | ) | |||||||||||||||||
| TOTAL SECURITIES SOLD SHORT (Proceeds $7,894,435) | $ | (7,933,027 | ) | ||||||||||||||||
See Notes to Financial Statements.
Semi-Annual Report | November 30, 2016
39
The Arbitrage Credit Opportunities Fund Portfolio of Investments (continued)
November 30, 2016 (Unaudited)
WRITTEN OPTIONS | Expiration Date | Exercise Price | Contracts | Value | |||||||||||||||
Written Put Options | |||||||||||||||||||
SPDR S&P500 ETF Trust | 01/2017 | $ | 205.00 | (750 | ) | $ | (69,000 | ) | |||||||||||
| TOTAL WRITTEN PUT OPTIONS (Premiums received $122,388) | (69,000 | ) | |||||||||||||||||
| TOTAL WRITTEN OPTIONS (Premiums received $122,388) | $ | (69,000 | ) | ||||||||||||||||
The following is a summary of investments classified by country exposure:
Country | % of Net Assets(a) | ||||||
Canada | 5.21 | % | |||||
Luxembourg | 0.45 | % | |||||
United States | 93.45 | % | |||||
Other Assets in Excess of Liabilities | 0.89 | % | |||||
100.00 | % | ||||||
(a) These percentages represent long positions only and are not net of short positions.
Abbreviations:
ETF - Exchange-Traded Fund
LLC - Limited Liability Company
Ltd. - Limited
PIK - Payment-in-kind
Plc - Public Limited Company
SCA - Societe en commandite par actions is the French term for limited liability partnership.
SPDR - Standard & Poor's Depositary Receipt
See Notes to Financial Statements.
www.arbitragefunds.com | 1-800-295-4485
40
The Arbitrage Credit Opportunities Fund Portfolio of Investments (continued)
November 30, 2016 (Unaudited)
The following table summarizes The Arbitrage Credit Opportunities Fund's investments and derivative financial instruments categorized in the disclosure hierarchy as of November 30, 2016:
Investments in Securities at Value* | Level 1 | Level 2 | Level 3 | Total | |||||||||||||||
Assets | |||||||||||||||||||
Corporate Bonds** | $ | — | $ | 31,146,615 | $ | — | $ | 31,146,615 | |||||||||||
Convertible Corporate Bonds** | — | 12,646,274 | — | 12,646,274 | |||||||||||||||
Purchased Options | 131,462 | — | — | 131,462 | |||||||||||||||
Short-Term Investments | 10,463,273 | — | — | 10,463,273 | |||||||||||||||
TOTAL | $ | 10,594,735 | $ | 43,792,889 | $ | — | $ | 54,387,624 | |||||||||||
Other Financial Instruments*** | |||||||||||||||||||
Liabilities | |||||||||||||||||||
Common Stocks** | (1,442,997 | ) | — | — | (1,442,997 | ) | |||||||||||||
Corporate Bonds** | — | (6,490,030 | ) | — | (6,490,030 | ) | |||||||||||||
Written Options | (69,000 | ) | — | — | (69,000 | ) | |||||||||||||
TOTAL | $ | (1,511,997 | ) | $ | (6,490,030 | ) | $ | — | $ | (8,002,027 | ) | ||||||||
* Refer to footnote 2 where leveling hierarchy is defined.
** Refer to Portfolio of Investments for sector information.
*** Other financial instruments are instruments such as written options, securities sold short, equity swaps and forward foreign currency exchange contracts.
The Fund recognizes transfers between levels as of the beginning of the annual period in which the transfer occurred.
During the six months ended November 30, 2016, there were no transfers between Level 1, Level 2 or Level 3 security classifications.
See Notes to Financial Statements.
Semi-Annual Report | November 30, 2016
41
The Arbitrage Tactical Equity Fund Portfolio Information
November 30, 2016 (Unaudited)
Performance (annualized returns as of November 30, 2016)
| One Year | Since Inception* | ||||||||||
Arbitrage Tactical Equity Fund, Class R | 2.05 | % | -2.80 | % | |||||||
Arbitrage Tactical Equity Fund, Class I | 2.05 | % | -2.80 | % | |||||||
Arbitrage Tactical Equity Fund, Class C** | 2.05 | % | -2.80 | % | |||||||
Arbitrage Tactical Equity Fund, Class A*** | 2.05 | % | -2.80 | % | |||||||
S&P 500® Index | 8.06 | % | 5.18 | % | |||||||
BofA Merrill Lynch U.S. 3-Month Treasury Bill Index | 0.32 | % | 0.17 | % | |||||||
Current performance may be higher or lower than performance quoted above. Any performance data quoted represents past performance and the investment return and principal value of an investment in the Fund will fluctuate so that an investor's shares, when redeemed, may be worth more or less than their original cost. Past performance is no guarantee of future results. Returns do not reflect a 2% redemption fee for shares that are redeemed from the fund within 60 days of purchase, which, if reflected, would reduce the performance quoted. Returns shown above include the reinvestment of all dividends and capital gains. Contractual fee waivers are currently in effect. Without such fee waivers, performance numbers would be reduced. You can obtain performance data current to the most recent month end by calling 1-800-295-4485 or going to mnv.arbitragefunds.com.
* Class R, Class I, Class C and Class A inception: 12/31/14.
** Class C shares are subject to a 1.00% contingent deferred sales charge on all purchases redeemed in 12 months of purchase.
*** Class A shares are subject to a maximum front-end sales load of 3.25% on purchases up to $500,000. The shares are also subject to a deferred sales charge of up to 1.00% on purchases of $500,000 or more purchased without a front-end sales load and redeemed within 18 months of purchase.
The Total Annual Fund Operating Expenses for Class R, Class I, Class C and Class A are 20.33%, 20.08%, 21.08% and 20.33%, respectively. The Advisor has agreed to waive fees (not including the effects of interest, dividends on short positions, brokerage commissions, acquired fund fees and expenses, taxes, or other extraordinary expenses) in excess of 1.69%, 1.44%, 2.44% and 1.69%, for Class R, Class I, Class C and Class A, respectively, until at least December 31, 2017. These expense ratios are as stated in the current prospectus and may differ from the expense ratios disclosed in the financial highlights in this report.
The S&P 500® Index is an unmanaged index consisting of 500 stocks.
The Bank of America (BofA) Merrill Lynch U.S. 3-Month Treasury Bill Index tracks the performance of the U.S. dollar denominated U.S. Treasury Bills publicly issued in the U.S. domestic market with a remaining term to final maturity of less than 3 months.
An investor may not invest directly in an index.
www.arbitragefunds.com | 1-800-295-4485
42
The Arbitrage Tactical Equity Fund Portfolio Information (continued)
November 30, 2016 (Unaudited)
Growth of $10,000 Investment
The chart represents historical performance of a hypothetical investment of $10,000 in the Class R shares of the Fund since inception. Past performance does not guarantee future results. This chart does not reflect the deduction of taxes that a shareholder would pay on Fund distributions or the redemption of Fund shares.
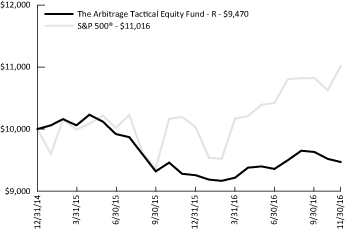
Sector Weighting
The following chart shows the sector weightings of The Arbitrage Tactical Equity Fund's investments in common stock and exchange-traded funds as of the report date.
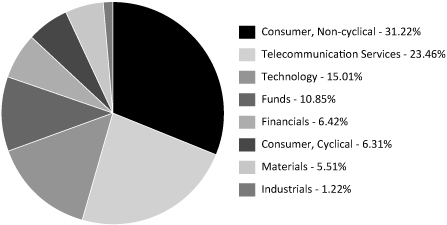
Semi-Annual Report | November 30, 2016
43
The Arbitrage Tactical Equity Fund Portfolio of Investments
November 30, 2016 (Unaudited)
Shares | Value | ||||||||||
COMMON STOCKS - 73.11% | |||||||||||
Agriculture - 3.24% | |||||||||||
Altria Group, Inc. | 88 | $ | 5,626 | ||||||||
British American Tobacco Plc, Sponsored ADR | 31 | 3,380 | |||||||||
Reynolds American, Inc.(a) | 790 | 42,739 | |||||||||
51,745 | |||||||||||
Auto Parts & Equipment - 2.55% | |||||||||||
Adient Plc(b) | 647 | 34,653 | |||||||||
Federal-Mogul Holdings Corp.(b) | 638 | 6,106 | |||||||||
40,759 | |||||||||||
Chemicals - 4.72% | |||||||||||
Air Products & Chemicals, Inc.(a) | 276 | 39,871 | |||||||||
Linde AG | 209 | 34,821 | |||||||||
Linde AG, ADR | 50 | 838 | |||||||||
75,530 | |||||||||||
Commercial Services - 4.47% | |||||||||||
Herc Holdings, Inc.(b)(c) | 355 | 14,108 | |||||||||
LSC Communications, Inc. | 1,165 | 24,046 | |||||||||
Team Health Holdings, Inc.(b) | 781 | 33,231 | |||||||||
71,385 | |||||||||||
Computers & Computer Services - 4.35% | |||||||||||
Accenture Plc, Class A | 18 | 2,150 | |||||||||
Brocade Communications Systems, Inc. | 860 | 10,612 | |||||||||
CGI Group, Inc., Class A(b) | 43 | 2,037 | |||||||||
EPAM Systems, Inc.(b) | 14 | 923 | |||||||||
Hewlett Packard Enterprise Co.(a) | 1,708 | 40,650 | |||||||||
International Business Machines Corp. | 20 | 3,244 | |||||||||
VeriFone Systems, Inc.(a)(b) | 587 | 9,915 | |||||||||
69,531 | |||||||||||
Diversified Financial Services - 1.02% | |||||||||||
CBOE Holdings, Inc.(a) | 236 | 16,260 | |||||||||
Food - 4.40% | |||||||||||
Hain Celestial Group, Inc.(b) | 423 | 16,577 | |||||||||
Nomad Foods Ltd.(a)(b) | 3,335 | 31,382 | |||||||||
SUPERVALU, Inc.(b) | 4,810 | 22,319 | |||||||||
70,278 | |||||||||||
Healthcare - Products - 3.31% | |||||||||||
St Jude Medical, Inc.(a) | 668 | 52,906 | |||||||||
See Notes to Financial Statements.
www.arbitragefunds.com | 1-800-295-4485
44
The Arbitrage Tactical Equity Fund Portfolio of Investments (continued)
November 30, 2016 (Unaudited)
Shares | Value | ||||||||||
| COMMON STOCKS - 73.11% (Continued) | |||||||||||
Household Products - 1.43% | |||||||||||
Colgate-Palmolive Co. | 76 | $ | 4,957 | ||||||||
Coty, Inc., Class A | 956 | 17,887 | |||||||||
22,844 | |||||||||||
Household Products/Wares - 0.97% | |||||||||||
Church & Dwight Co., Inc. | 116 | 5,080 | |||||||||
Clorox Co. | 45 | 5,200 | |||||||||
Kimberly-Clark Corp. | 45 | 5,202 | |||||||||
15,482 | |||||||||||
Internet - 9.17% | |||||||||||
Alibaba Group Holding Ltd., Sponsored ADR(b)(c) | 100 | 9,402 | |||||||||
FireEye, Inc.(b) | 100 | 1,284 | |||||||||
LinkedIn Corp., Class A(a)(b) | 245 | 47,834 | |||||||||
Pandora Media, Inc.(b) | 636 | 7,390 | |||||||||
Twitter, Inc.(b) | 100 | 1,849 | |||||||||
Yahoo!, Inc.(a)(b) | 1,922 | 78,841 | |||||||||
146,600 | |||||||||||
Media - 7.61% | |||||||||||
CBS Corp., Class B, NVDR(a) | 422 | 25,624 | |||||||||
Comcast Corp., Class A | 326 | 22,660 | |||||||||
Kabel Deutschland Holding AG | 155 | 17,931 | |||||||||
Starz, Class A(b) | 474 | 16,050 | |||||||||
Time Warner, Inc.(c) | 269 | 24,699 | |||||||||
Viacom, Inc., Class B(a) | 390 | 14,617 | |||||||||
121,581 | |||||||||||
Office/Business Equip - 1.32% | |||||||||||
Xerox Corp. | 2,259 | 21,122 | |||||||||
Pharmaceuticals - 9.25% | |||||||||||
Actelion Ltd. | 59 | 11,374 | |||||||||
Allergan Plc(b) | 115 | 22,344 | |||||||||
Bayer AG(a) | 716 | 67,227 | |||||||||
Celesio AG | 1,371 | 36,835 | |||||||||
Depomed, Inc.(b) | 526 | 10,047 | |||||||||
147,827 | |||||||||||
Real Estate Investment Trusts - 3.45% | |||||||||||
Forest City Realty Trust, Inc., Class A(a) | 1,033 | 19,100 | |||||||||
Forest City Realty Trust, Inc., Class B(a) | 1,916 | 36,040 | |||||||||
55,140 | |||||||||||
See Notes to Financial Statements.
Semi-Annual Report | November 30, 2016
45
The Arbitrage Tactical Equity Fund Portfolio of Investments (continued)
November 30, 2016 (Unaudited)
Shares | Value | ||||||||||
COMMON STOCKS - 73.11% (Continued) | |||||||||||
Retail - 2.50% | |||||||||||
Cabela's, Inc.(b) | 467 | $ | 29,066 | ||||||||
Dunkin' Brands Group, Inc. | 49 | 2,660 | |||||||||
McDonald's Corp. | 21 | 2,505 | |||||||||
Popeyes Louisiana Kitchen, Inc.(b) | 44 | 2,635 | |||||||||
Restaurant Brands International, Inc. | 50 | 2,376 | |||||||||
Wendy's Co. | 24 | 302 | |||||||||
Yum China Holdings, Inc.(b) | 16 | 450 | |||||||||
39,994 | |||||||||||
Semiconductors - 4.20% | |||||||||||
Broadcom Ltd. | 215 | 36,655 | |||||||||
Cabot Microelectronics Corp.(a) | 239 | 14,240 | |||||||||
Intel Corp. | 93 | 3,227 | |||||||||
QUALCOMM, Inc.(a)(c) | 190 | 12,945 | |||||||||
67,067 | |||||||||||
Software - 4.15% | |||||||||||
CA, Inc. | 90 | 2,876 | |||||||||
Citrix Systems, Inc.(a)(b) | 281 | 24,371 | |||||||||
Cornerstone OnDemand, Inc.(b) | 607 | 21,797 | |||||||||
Oracle Corp. | 77 | 3,095 | |||||||||
VMware, Inc., Class A(a)(b) | 175 | 14,200 | |||||||||
66,339 | |||||||||||
Telecommunications - 0.51% | |||||||||||
TDC A/S(b) | 1,594 | 8,110 | |||||||||
Transportation - 0.49% | |||||||||||
Ansaldo STS SpA | 701 | 7,831 | |||||||||
| TOTAL COMMON STOCKS (Cost $1,147,133) | 1,168,331 | ||||||||||
EXCHANGE-TRADED FUNDS - 2.53% | |||||||||||
Equity Funds - 2.53% | |||||||||||
Consumer Staples Select Sector SPDR® Fund | 173 | 8,750 | |||||||||
iShares® Russell 2000 Growth ETF | 51 | 7,768 | |||||||||
SPDR® S&P® Homebuilders ETF | 481 | 16,282 | |||||||||
Technology Select Sector SPDR® Fund | 160 | 7,600 | |||||||||
40,400 | |||||||||||
| TOTAL EXCHANGE-TRADED FUNDS (Cost $39,673) | 40,400 | ||||||||||
See Notes to Financial Statements.
www.arbitragefunds.com | 1-800-295-4485
46
The Arbitrage Tactical Equity Fund Portfolio of Investments (continued)
November 30, 2016 (Unaudited)
| Expiration Date | Exercise Price | Contracts | Value | ||||||||||||||||
PURCHASED OPTIONS(b) - 0.03% | |||||||||||||||||||
Call Options Purchased - 0.00%(d) | |||||||||||||||||||
| Alibaba Group Holding Ltd., Sponsored ADR | 12/2016 | $ | 105.00 | 1 | $ | 8 | |||||||||||||
| Charter Communications, Inc., Class A | 12/2016 | 300.00 | 1 | 57 | |||||||||||||||
| TOTAL CALL OPTIONS PURCHASED (Cost $505) | 65 | ||||||||||||||||||
Put Options Purchased - 0.03% | |||||||||||||||||||
| Alibaba Group Holding Ltd., Sponsored ADR | 01/2017 | 95.00 | 1 | 422 | |||||||||||||||
| TOTAL PURCHASED OPTIONS (Cost $896) | 487 | ||||||||||||||||||
Yield | Shares | Value | |||||||||||||
SHORT-TERM INVESTMENTS - 9.14% | |||||||||||||||
Money Market Fund | |||||||||||||||
| Morgan Stanley Institutional Liquidity Fund - Government Portfolio | 0.295 | %(e) | 146,091 | $ | 146,091 | ||||||||||
| TOTAL SHORT-TERM INVESTMENTS (Cost $146,091) | 146,091 | ||||||||||||||
| Total Investments - 84.81% (Cost $1,333,793) | 1,355,309 | ||||||||||||||
Other Assets in Excess of Liabilities - 15.19%(f) | 242,797 | ||||||||||||||
NET ASSETS - 100.00% | $ | 1,598,106 | |||||||||||||
Portfolio Footnotes
(a) Security, or a portion of security, is being held as collateral for short sales, written option contracts or forward foreign currency exchange contracts. At November 30, 2016, the aggregate market value of those securities was $405,662, representing 25.38% of net assets.
(b) Non-income-producing security.
(c) Underlying security for a written/purchased call/put option.
(d) Less than 0.005% of net assets.
(e) Rate shown is the 7-day effective yield as of November 30, 2016.
(f) Includes cash which is being held as collateral for short sales and written option contracts.
See Notes to Financial Statements.
Semi-Annual Report | November 30, 2016
47
The Arbitrage Tactical Equity Fund Portfolio of Investments (continued)
November 30, 2016 (Unaudited)
SCHEDULE OF SECURITIES SOLD SHORT | Shares | Value | |||||||||
COMMON STOCKS - (41.55%) | |||||||||||
Agriculture - (0.99%) | |||||||||||
British American Tobacco Plc, Sponsored ADR | (145 | ) | $ | (15,811 | ) | ||||||
Auto Parts & Equipment - (1.77%) | |||||||||||
BorgWarner, Inc. | (200 | ) | (7,120 | ) | |||||||
Lear Corp. | (56 | ) | (7,253 | ) | |||||||
Magna International, Inc. | (165 | ) | (6,674 | ) | |||||||
Tenneco, Inc. | (124 | ) | (7,310 | ) | |||||||
(28,357 | ) | ||||||||||
Chemicals - (2.36%) | |||||||||||
Praxair, Inc. | (313 | ) | (37,654 | ) | |||||||
Commercial Services - (0.93%) | |||||||||||
Quad/Graphics, Inc. | (257 | ) | (7,230 | ) | |||||||
United Rentals, Inc. | (76 | ) | (7,684 | ) | |||||||
(14,914 | ) | ||||||||||
Computers & Computer Services - (2.61%) | |||||||||||
CGI Group, Inc., Class A | (75 | ) | (3,553 | ) | |||||||
Computer Sciences Corp. | (318 | ) | (19,280 | ) | |||||||
Genpact Ltd. | (117 | ) | (2,800 | ) | |||||||
HP, Inc. | (497 | ) | (7,654 | ) | |||||||
International Business Machines Corp. | (52 | ) | (8,435 | ) | |||||||
(41,722 | ) | ||||||||||
Construction Materials - (1.09%) | |||||||||||
Armstrong World Industries, Inc. | (416 | ) | (17,347 | ) | |||||||
Distribution/Wholesale - (0.25%) | |||||||||||
Ingram Micro, Inc., Class A | (105 | ) | (3,931 | ) | |||||||
Diversified Financial Services - (1.04%) | |||||||||||
CME Group, Inc. | (76 | ) | (8,581 | ) | |||||||
Intercontinental Exchange, Inc. | (145 | ) | (8,033 | ) | |||||||
(16,614 | ) | ||||||||||
Food - (2.38%) | |||||||||||
Conagra Brands, Inc. | (421 | ) | (15,447 | ) | |||||||
Kroger Co. | (101 | ) | (3,262 | ) | |||||||
SpartanNash Co. | (249 | ) | (9,016 | ) | |||||||
Sprouts Farmers Market, Inc. | (144 | ) | (2,882 | ) | |||||||
United Natural Foods, Inc. | (157 | ) | (7,371 | ) | |||||||
(37,978 | ) | ||||||||||
See Notes to Financial Statements.
www.arbitragefunds.com | 1-800-295-4485
48
The Arbitrage Tactical Equity Fund Portfolio of Investments (continued)
November 30, 2016 (Unaudited)
SCHEDULE OF SECURITIES SOLD SHORT | Shares | Value | |||||||||
COMMON STOCKS - (41.55%) (Continued) | |||||||||||
Healthcare - Products - (1.39%) | |||||||||||
Abbott Laboratories | (583 | ) | $ | (22,195 | ) | ||||||
Healthcare - Services - (1.42%) | |||||||||||
Aetna, Inc. | (173 | ) | (22,635 | ) | |||||||
Household Products - (1.94%) | |||||||||||
Procter & Gamble Co. | (377 | ) | (31,087 | ) | |||||||
Internet - (5.05%) | |||||||||||
Alibaba Group Holding Ltd., Sponsored ADR | (610 | ) | (57,352 | ) | |||||||
F5 Networks, Inc. | (34 | ) | (4,786 | ) | |||||||
Symantec Corp. | (688 | ) | (16,780 | ) | |||||||
Twitter, Inc. | (100 | ) | (1,849 | ) | |||||||
(80,767 | ) | ||||||||||
Media - (4.39%) | |||||||||||
Cable One, Inc. | (11 | ) | (6,501 | ) | |||||||
Charter Communications, Inc., Class A | (81 | ) | (22,300 | ) | |||||||
Twenty-First Century Fox, Inc., Class A | (389 | ) | (10,935 | ) | |||||||
Walt Disney Co. | (307 | ) | (30,430 | ) | |||||||
(70,166 | ) | ||||||||||
Office/Business Equip - (0.69%) | |||||||||||
Canon, Inc., Sponsored ADR | (380 | ) | (10,986 | ) | |||||||
Pharmaceuticals - (4.04%) | |||||||||||
Actelion Ltd., Sponsored ADR | (124 | ) | (6,053 | ) | |||||||
Merck KGaA | (584 | ) | (58,516 | ) | |||||||
(64,569 | ) | ||||||||||
Real Estate Investment Trusts - (2.75%) | |||||||||||
Forest City Realty Trust, Inc., Class A | (1,916 | ) | (35,427 | ) | |||||||
Seritage Growth Properties, Class A | (180 | ) | (8,575 | ) | |||||||
(44,002 | ) | ||||||||||
Retail - (1.04%) | |||||||||||
Yum! Brands, Inc. | (263 | ) | (16,672 | ) | |||||||
See Notes to Financial Statements.
Semi-Annual Report | November 30, 2016
49
The Arbitrage Tactical Equity Fund Portfolio of Investments (continued)
November 30, 2016 (Unaudited)
SCHEDULE OF SECURITIES SOLD SHORT | Shares | Value | |||||||||
COMMON STOCKS - (41.55%) (Continued) | |||||||||||
Semiconductors - (1.98%) | |||||||||||
Entegris, Inc. | (649 | ) | $ | (11,650 | ) | ||||||
Intel Corp. | (310 | ) | (10,757 | ) | |||||||
Microchip Technology, Inc. | (50 | ) | (3,309 | ) | |||||||
Qorvo, Inc. | (52 | ) | (2,777 | ) | |||||||
Texas Instruments, Inc. | (43 | ) | (3,179 | ) | |||||||
(31,672 | ) | ||||||||||
Telecommunications - (3.44%) | |||||||||||
Cisco Systems, Inc. | (212 | ) | (6,322 | ) | |||||||
LogMeIn, Inc. | (386 | ) | (38,928 | ) | |||||||
T-Mobile US, Inc. | (178 | ) | (9,649 | ) | |||||||
(54,899 | ) | ||||||||||
| TOTAL COMMON STOCKS (Proceeds $654,719) | (663,978 | ) | |||||||||
EXCHANGE-TRADED FUNDS - (11.42%) | |||||||||||
Equity Funds - (11.42%) | |||||||||||
Consumer Staples Select Sector SPDR® Fund | (909 | ) | (45,977 | ) | |||||||
iShares® Nasdaq Biotechnology ETF | (48 | ) | (13,155 | ) | |||||||
iShares® Russell 2000 ETF | (104 | ) | (13,687 | ) | |||||||
iShares® Russell 2000 Growth ETF | (50 | ) | (7,616 | ) | |||||||
Materials Select Sector SPDR® Fund | (583 | ) | (29,115 | ) | |||||||
Technology Select Sector SPDR® Fund | (573 | ) | (27,218 | ) | |||||||
VanEck Vectors Semiconductor ETF | (386 | ) | (27,429 | ) | |||||||
Vanguard REIT ETF | (229 | ) | (18,409 | ) | |||||||
(182,606 | ) | ||||||||||
| TOTAL EXCHANGE-TRADED FUNDS (Proceeds $180,636) | (182,606 | ) | |||||||||
| TOTAL SECURITIES SOLD SHORT (Proceeds $835,355) | $ | (846,584 | ) | ||||||||
See Notes to Financial Statements.
www.arbitragefunds.com | 1-800-295-4485
50
The Arbitrage Tactical Equity Fund Portfolio of Investments (continued)
November 30, 2016 (Unaudited)
WRITTEN OPTIONS | Expiration Date | Exercise Price | Contracts | Value | |||||||||||||||
Written Call Options | |||||||||||||||||||
| Alibaba Group Holding Ltd., Sponsored ADR | 12/2016 | $ | 110.00 | (1 | ) | $ | (1 | ) | |||||||||||
Herc Holdings, Inc. | 12/2016 | 35.00 | (3 | ) | (1,530 | ) | |||||||||||||
Time Warner, Inc. | 12/2016 | 90.00 | (1 | ) | (243 | ) | |||||||||||||
| TOTAL WRITTEN CALL OPTIONS (Premiums received $823) | (1,774 | ) | |||||||||||||||||
Written Put Options | |||||||||||||||||||
Herc Holdings, Inc. | 12/2016 | 30.00 | (1 | ) | (12 | ) | |||||||||||||
QUALCOMM, Inc. | 12/2016 | 65.00 | (1 | ) | (36 | ) | |||||||||||||
| TOTAL WRITTEN PUT OPTIONS (Premiums received $325) | (48 | ) | |||||||||||||||||
| TOTAL WRITTEN OPTIONS (Premiums received $1,148) | $ | (1,822 | ) | ||||||||||||||||
EQUITY SWAP CONTRACTS
| Swap Counterparty | Reference Obligation | Rate Paid/Received by the Fund | Termination Date | Notional Amount | Unrealized Appreciation | ||||||||||||||||||
| Morgan Stanley | STOXX Europe 600 Telecommunications | Received 1 Month-EONIA plus 45 bps | 08/25/2017 | $ | 4,942 | $ | 0 | ||||||||||||||||
| Morgan Stanley | Micro Focus International Plc | Received 1 Month-LIBOR minus 50 bps | 09/08/2017 | 2,048 | 0 | ||||||||||||||||||
$ | 6,990 | $ | — | ||||||||||||||||||||
OUTSTANDING FORWARD FOREIGN CURRENCY EXCHANGE CONTRACTS
| Contract Description | Counterparty | Contracts to Deliver/Receive | Purchase/Sale Contract | Expiration Date | Current Value | Unrealized Appreciation | |||||||||||||||||||||
CHF | Goldman Sachs | 2,300 | Purchase | 12/15/2016 | $ | 2,264 | $ | 3 | |||||||||||||||||||
CHF | Goldman Sachs | 8,400 | Sale | 12/15/2016 | 8,269 | 24 | |||||||||||||||||||||
DKK | Goldman Sachs | 133,700 | Sale | 12/15/2016 | 19,057 | 985 | |||||||||||||||||||||
EUR | Goldman Sachs | 900 | Purchase | 12/15/2016 | 954 | 4 | |||||||||||||||||||||
EUR | Goldman Sachs | 112,250 | Sale | 12/15/2016 | 119,041 | 7,003 | |||||||||||||||||||||
GBP | Goldman Sachs | 11,700 | Purchase | 12/15/2016 | 14,644 | 289 | |||||||||||||||||||||
GBP | Goldman Sachs | 11,700 | Sale | 12/15/2016 | 14,644 | 951 | |||||||||||||||||||||
$ | 9,259 | ||||||||||||||||||||||||||
See Notes to Financial Statements.
Semi-Annual Report | November 30, 2016
51
The Arbitrage Tactical Equity Fund Portfolio of Investments (continued)
November 30, 2016 (Unaudited)
| Contract Description | Counterparty | Contracts to Deliver/Receive | Purchase/Sale Contract | Expiration Date | Current Value | Unrealized Depreciation | |||||||||||||||||||||
CHF | Goldman Sachs | 6,100 | Purchase | 12/15/2016 | $ | 6,005 | $ | (28 | ) | ||||||||||||||||||
DKK | Goldman Sachs | 74,300 | Purchase | 12/15/2016 | 10,590 | (666 | ) | ||||||||||||||||||||
EUR | Goldman Sachs | 44,410 | Purchase | 12/15/2016 | 47,097 | (2,208 | ) | ||||||||||||||||||||
$ | (2,902 | ) | |||||||||||||||||||||||||
The following is a summary of investments classified by country exposure:
Country | % of Net Assets(a) | ||||||
Germany | 9.86 | % | |||||
Ireland | 2.31 | % | |||||
Singapore | 2.30 | % | |||||
United Kingdom | 2.17 | % | |||||
Switzerland | 0.71 | % | |||||
China | 0.59 | % | |||||
Denmark | 0.51 | % | |||||
Italy | 0.49 | % | |||||
Canada | 0.28 | % | |||||
United States | 65.59 | % | |||||
Other Assets in Excess of Liabilities | 15.19 | % | |||||
100.00 | % | ||||||
(a) These percentages represent long positions only and are not net of short positions.
Abbreviations:
ADR - American Depositary Receipt
AG - Aktiengesellschaft is a German term that refers to a corporation that is limited by shares, i.e., owned by shareholders.
bps - Basis Points
CHF - Swiss franc
DKK - Danish krone
EONIA - Euro OverNight Index Average
ETF - Exchange-Traded Fund
EUR - Euro
GBP - British pound
KGaA - Kommanditgesellschaft Auf Aktien is a German corporate designation that refers to a limited partnership.
LIBOR - London Interbank Offered Rate
Ltd. - Limited
NVDR - Non-Voting Depository Receipt
Plc - Public Limited Company
REIT - Real Estate Investment Trust
S&P - Standard & Poor's
SpA - Societa per Azione
SPDR - Standard & Poor's Depositary Receipt
See Notes to Financial Statements.
www.arbitragefunds.com | 1-800-295-4485
52
The Arbitrage Tactical Equity Fund Portfolio of Investments (continued)
November 30, 2016 (Unaudited)
The following table summarizes The Arbitrage Tactical Equity Fund's investments and derivative financial instruments categorized in the disclosure hierarchy as of November 30, 2016:
Investments in Securities at Value* | Level 1 | Level 2 | Level 3 | Total | |||||||||||||||
Assets | |||||||||||||||||||
Common Stocks** | $ | 1,168,331 | $ | — | $ | — | $ | 1,168,331 | |||||||||||
Exchange-Traded Funds | 40,400 | — | — | 40,400 | |||||||||||||||
Purchased Options | 487 | — | — | 487 | |||||||||||||||
Short-Term Investments | 146,091 | — | — | 146,091 | |||||||||||||||
TOTAL | $ | 1,355,309 | $ | — | $ | — | $ | 1,355,309 | |||||||||||
Other Financial Instruments*** | |||||||||||||||||||
Assets | |||||||||||||||||||
Forward Foreign Currency Exchange Contracts | $ | — | $ | 9,259 | $ | — | $ | 9,259 | |||||||||||
Liabilities | |||||||||||||||||||
Common Stocks** | (663,978 | ) | — | — | (663,978 | ) | |||||||||||||
Exchange-Traded Funds | (182,606 | ) | — | — | (182,606 | ) | |||||||||||||
Written Options | (1,822 | ) | — | — | (1,822 | ) | |||||||||||||
Forward Foreign Currency Exchange Contracts | — | (2,902 | ) | — | (2,902 | ) | |||||||||||||
TOTAL | $ | (848,406 | ) | $ | 6,357 | $ | — | $ | (842,049 | ) | |||||||||
* Refer to footnote 2 where leveling hierarchy is defined.
** Refer to Portfolio of Investments for sector information.
*** Other financial instruments are instruments such as written options, securities sold short, equity swaps and forward foreign currency exchange contracts.
The Fund recognizes transfers between levels as of the beginning of the annual period in which the transfer occurred.
During the six months ended November 30, 2016, there were no transfers between Level 1, Level 2 or Level 3 security classifications.
See Notes to Financial Statements.
Semi-Annual Report | November 30, 2016
53
The Arbitrage Funds
| The Arbitrage Fund | The Arbitrage Event-Driven Fund | ||||||||||
ASSETS | |||||||||||
Investments: | |||||||||||
At cost | $ | 1,848,261,759 | $ | 162,434,398 | |||||||
At value (Note 2) | $ | 1,857,324,259 | $ | 163,044,082 | |||||||
Cash denominated in foreign currency (Cost $51,586, $132, $0 and $0) | 51,662 | 133 | |||||||||
Deposits with brokers for securities sold short (Note 2) | 171,796,596 | 30,896,225 | |||||||||
Segregated cash for swaps (Note 2) | — | 230,000 | |||||||||
Receivable for investment securities sold | 27,400,570 | 5,389,204 | |||||||||
Receivable for capital shares sold | 3,948,123 | 126,090 | |||||||||
Unrealized appreciation on forward foreign currency exchange contracts (Note 8) | 8,820,751 | 592,865 | |||||||||
Dividends and interest receivable | 663,489 | 386,164 | |||||||||
Receivable due from Adviser | — | — | |||||||||
Prepaid expenses and other assets | 134,662 | 41,873 | |||||||||
Total Assets | 2,070,140,112 | 200,706,636 | |||||||||
LIABILITIES | |||||||||||
| Securities sold short, at value (Note 2) (proceeds $196,074,223, $35,188,643, $7,894,435 and $835,355) | 198,027,537 | 35,732,041 | |||||||||
Due to bank | — | — | |||||||||
Written options, at value (Note 2) (premiums received $1,253,331, $100,769, $122,388 and $1,148) | 1,177,734 | 92,083 | |||||||||
Payable for investment securities purchased | 103,466,570 | 10,958,033 | |||||||||
Unrealized depreciation on forward foreign currency exchange contracts (Note 8) | 2,369,455 | 39,057 | |||||||||
Payable for capital shares redeemed | 3,063,028 | 293,084 | |||||||||
Payable to Adviser (Note 6) | 1,509,475 | 123,121 | |||||||||
Dividends payable on securities sold short (Note 2) | 215,465 | 32,309 | |||||||||
Payable to Distributor (Note 6) | 97,396 | 17,031 | |||||||||
Payable to Administrator (Note 6) | 125,596 | 17,768 | |||||||||
Payable to Transfer Agent (Note 6) | 279,929 | 60,021 | |||||||||
Payable to Custodian | 95,906 | 35,249 | |||||||||
Interest expense payable | 52,004 | 9,629 | |||||||||
Audit and legal fees payable | 103,960 | 35,953 | |||||||||
Payable to Trustees | 30,115 | 25,967 | |||||||||
Chief Financial Officer fees payable (Note 6) | 9,798 | 2,683 | |||||||||
Other accrued expenses and liabilities | 104,977 | 38,932 | |||||||||
Total Liabilities | 310,728,945 | 47,512,961 | |||||||||
NET ASSETS | $ | 1,759,411,167 | $ | 153,193,675 | |||||||
NET ASSETS CONSIST OF: | |||||||||||
Paid-in capital | $ | 1,727,479,111 | $ | 216,807,600 | |||||||
Accumulated net investment income (loss) | (7,097,607 | ) | (1,619,054 | ) | |||||||
| Accumulated net realized gain (loss) on investments, swap contracts, securities sold short, written option contracts and foreign currencies | 25,395,626 | (62,621,706 | ) | ||||||||
| Net unrealized appreciation on investments, swap contracts, securities sold short, written option contracts and translation of assets and liabilities denominated in foreign currencies | 13,634,037 | 626,835 | |||||||||
NET ASSETS | $ | 1,759,411,167 | $ | 153,193,675 | |||||||
See Notes to Financial Statements.
www.arbitragefunds.com | 1-800-295-4485
54
Statements of Assets and Liabilities
November 30, 2016 (Unaudited)
| The Arbitrage Credit Opportunities Fund | The Arbitrage Tactical Equity Fund | ||||||||||
ASSETS | |||||||||||
Investments: | |||||||||||
At cost | $ | 54,080,928 | $ | 1,333,793 | |||||||
At value (Note 2) | $ | 54,387,624 | $ | 1,355,309 | |||||||
Cash denominated in foreign currency (Cost $51,586, $132, $0 and $0) | — | — | |||||||||
Deposits with brokers for securities sold short (Note 2) | 8,357,969 | 882,115 | |||||||||
Segregated cash for swaps (Note 2) | — | 255,000 | |||||||||
Receivable for investment securities sold | 394,448 | 90,670 | |||||||||
Receivable for capital shares sold | 31,210 | — | |||||||||
Unrealized appreciation on forward foreign currency exchange contracts (Note 8) | — | 9,259 | |||||||||
Dividends and interest receivable | 599,660 | 557 | |||||||||
Receivable due from Adviser | — | 20,362 | |||||||||
Prepaid expenses and other assets | 37,413 | 8,821 | |||||||||
Total Assets | 63,808,324 | 2,622,093 | |||||||||
LIABILITIES | |||||||||||
| Securities sold short, at value (Note 2) (proceeds $196,074,223, $35,188,643, $7,894,435 and $835,355) | 7,933,027 | 846,584 | |||||||||
Due to bank | 8,776 | 3,434 | |||||||||
Written options, at value (Note 2) (premiums received $1,253,331, $100,769, $122,388 and $1,148) | 69,000 | 1,822 | |||||||||
Payable for investment securities purchased | 733,045 | 117,510 | |||||||||
Unrealized depreciation on forward foreign currency exchange contracts (Note 8) | — | 2,902 | |||||||||
Payable for capital shares redeemed | 2,710 | — | |||||||||
Payable to Adviser (Note 6) | 29,946 | — | |||||||||
Dividends payable on securities sold short (Note 2) | — | 461 | |||||||||
Payable to Distributor (Note 6) | 3,181 | 12 | |||||||||
Payable to Administrator (Note 6) | 9,040 | 2,595 | |||||||||
Payable to Transfer Agent (Note 6) | 5,810 | 212 | |||||||||
Payable to Custodian | 5,345 | 6,905 | |||||||||
Interest expense payable | 81,625 | — | |||||||||
Audit and legal fees payable | 14,556 | 11,356 | |||||||||
Payable to Trustees | 25,444 | 25,291 | |||||||||
Chief Financial Officer fees payable (Note 6) | 1,416 | 1,144 | |||||||||
Other accrued expenses and liabilities | 9,277 | 3,759 | |||||||||
Total Liabilities | 8,932,198 | 1,023,987 | |||||||||
NET ASSETS | $ | 54,876,126 | $ | 1,598,106 | |||||||
NET ASSETS CONSIST OF: | |||||||||||
Paid-in capital | $ | 57,020,565 | $ | 1,715,386 | |||||||
Accumulated net investment income (loss) | 318,709 | (13,274 | ) | ||||||||
| Accumulated net realized gain (loss) on investments, swap contracts, securities sold short, written option contracts and foreign currencies | (2,784,737 | ) | (119,957 | ) | |||||||
| Net unrealized appreciation on investments, swap contracts, securities sold short, written option contracts and translation of assets and liabilities denominated in foreign currencies | 321,589 | 15,951 | |||||||||
NET ASSETS | $ | 54,876,126 | $ | 1,598,106 | |||||||
Semi-Annual Report | November 30, 2016
55
The Arbitrage Funds
| The Arbitrage Fund | The Arbitrage Event-Driven Fund | ||||||||||
PRICING OF SHARES: | |||||||||||
CLASS R SHARES: | |||||||||||
Net assets applicable to Class R shares | $ | 353,347,333 | $ | 73,634,523 | |||||||
Shares of beneficial interest outstanding (unlimited number of shares authorized, no par value) | 27,436,110 | 8,104,130 | |||||||||
Net asset value and offering price per share(a) | $ | 12.88 | $ | 9.09 | |||||||
CLASS I SHARES: | |||||||||||
Net assets applicable to Class I shares | $ | 1,368,844,328 | $ | 76,854,364 | |||||||
Shares of beneficial interest outstanding (unlimited number of shares authorized, no par value) | 103,310,542 | 8,392,455 | |||||||||
Net asset value and offering price per share(a) | $ | 13.25 | $ | 9.16 | |||||||
CLASS C SHARES: | |||||||||||
Net assets applicable to Class C shares | $ | 28,028,931 | $ | 1,835,831 | |||||||
Shares of beneficial interest outstanding (unlimited number of shares authorized, no par value) | 2,257,572 | 204,545 | |||||||||
Net asset value and offering price per share(a) | $ | 12.42 | $ | 8.98 | |||||||
CLASS A SHARES: | |||||||||||
Net assets applicable to Class A shares | $ | 9,190,575 | $ | 868,957 | |||||||
Shares of beneficial interest outstanding (unlimited number of shares authorized, no par value) | 713,286 | 95,589 | |||||||||
Net asset value and offering price per share(a) | $ | 12.88 | $ | 9.09 | |||||||
Maximum offering price per share (NAV/(100% — maximum sales charge)) | $ | 13.21 | $ | 9.40 | |||||||
Maximum sales charge | 2.50 | % | 3.25 | % | |||||||
(a) Redemption price varies based on length of time held (Note 1).
See Notes to Financial Statements.
www.arbitragefunds.com | 1-800-295-4485
56
Statements of Assets and Liabilities
November 30, 2016 (Unaudited)
| The Arbitrage Credit Opportunities Fund | The Arbitrage Tactical Equity Fund | ||||||||||
PRICING OF SHARES: | |||||||||||
CLASS R SHARES: | |||||||||||
Net assets applicable to Class R shares | $ | 12,319,773 | $ | 9,463 | |||||||
Shares of beneficial interest outstanding (unlimited number of shares authorized, no par value) | 1,254,448 | 1,010 | |||||||||
Net asset value and offering price per share(a) | $ | 9.82 | $ | 9.37 | |||||||
CLASS I SHARES: | |||||||||||
Net assets applicable to Class I shares | $ | 41,666,529 | $ | 1,569,717 | |||||||
Shares of beneficial interest outstanding (unlimited number of shares authorized, no par value) | 4,249,673 | 167,435 | |||||||||
Net asset value and offering price per share(a) | $ | 9.80 | $ | 9.38 | |||||||
CLASS C SHARES: | |||||||||||
Net assets applicable to Class C shares | $ | 778,258 | $ | 9,462 | |||||||
Shares of beneficial interest outstanding (unlimited number of shares authorized, no par value) | 79,816 | 1,010 | |||||||||
Net asset value and offering price per share(a) | $ | 9.75 | $ | 9.37 | |||||||
CLASS A SHARES: | |||||||||||
Net assets applicable to Class A shares | $ | 111,566 | $ | 9,464 | |||||||
Shares of beneficial interest outstanding (unlimited number of shares authorized, no par value) | 11,381 | 1,009 | |||||||||
Net asset value and offering price per share(a) | $ | 9.80 | $ | 9.37 | |||||||
Maximum offering price per share (NAV/(100% — maximum sales charge)) | $ | 10.13 | $ | 9.68 | |||||||
Maximum sales charge | 3.25 | % | 3.25 | % | |||||||
Semi-Annual Report | November 30, 2016
57
The Arbitrage Funds
| The Arbitrage Fund | The Arbitrage Event-Driven Fund | ||||||||||
INVESTMENT INCOME | |||||||||||
Dividend income | $ | 8,636,878 | $ | 635,430 | |||||||
Foreign taxes withheld on dividends | (9,682 | ) | (3,386 | ) | |||||||
Interest income | 652,574 | 633,858 | |||||||||
Securities lending income | 35,601 | 657 | |||||||||
Total Investment Income | 9,315,371 | 1,266,559 | |||||||||
EXPENSES | |||||||||||
Investment advisory fees (Note 6) | 9,396,370 | 1,042,336 | |||||||||
Distribution and service fees (Note 6) | |||||||||||
Class R | 485,560 | 96,501 | |||||||||
Class C | 148,135 | 11,733 | |||||||||
Class A | 10,820 | 2,056 | |||||||||
Administrative fees (Note 6) | 177,851 | 27,794 | |||||||||
Chief Compliance Officer fees (Note 6) | 84,922 | 8,064 | |||||||||
Trustees' fees | 58,988 | 49,212 | |||||||||
Dividend expense | 3,661,653 | 482,661 | |||||||||
Interest rebate expense | 676,497 | 58,122 | |||||||||
Transfer agent fees (Note 6) | 704,271 | 157,737 | |||||||||
Custodian and bank service fees | 185,411 | 56,842 | |||||||||
Registration and filing fees | 42,553 | 33,090 | |||||||||
Printing of shareholder reports | 92,846 | 33,031 | |||||||||
Professional fees | 194,878 | 35,887 | |||||||||
Line of credit interest expense (Note 4) | — | 333 | |||||||||
Insurance expense | 47,845 | 7,477 | |||||||||
Chief Financial Officer fees (Note 6) | 30,566 | 6,677 | |||||||||
Other expenses | 61,014 | 6,589 | |||||||||
Total Expenses | 16,060,180 | 2,116,142 | |||||||||
Fees waived by the Adviser, Class R (Note 6) | — | (114,966 | ) | ||||||||
Expense reductions, Class R(a) | (13,112 | ) | (7,144 | ) | |||||||
Fees waived by the Adviser, Class I (Note 6) | — | (127,624 | ) | ||||||||
Expense reductions, Class I(a) | (45,944 | ) | (7,887 | ) | |||||||
Fees waived by the Adviser, Class C (Note 6) | — | (3,493 | ) | ||||||||
Expense reductions, Class C(a) | (1,005 | ) | (224 | ) | |||||||
Fees waived by the Adviser, Class A (Note 6) | — | (2,453 | ) | ||||||||
Expense reductions, Class A(a) | (293 | ) | (174 | ) | |||||||
Net Expenses | 15,999,826 | 1,852,177 | |||||||||
NET INVESTMENT INCOME (LOSS) | (6,684,455 | ) | (585,618 | ) | |||||||
(a) Represents a non-recurring refund for overbilling of prior years' out-of-pocket fees.
See Notes to Financial Statements.
www.arbitragefunds.com | 1-800-295-4485
58
Statements of Operations
For the Six Months Ended November 30, 2016 (Unaudited)
| The Arbitrage Credit Opportunities Fund | The Arbitrage Tactical Equity Fund | ||||||||||
INVESTMENT INCOME | |||||||||||
Dividend income | $ | — | $ | 6,616 | |||||||
Foreign taxes withheld on dividends | — | (246 | ) | ||||||||
Interest income | 1,003,426 | 629 | |||||||||
Securities lending income | — | — | |||||||||
Total Investment Income | 1,003,426 | 6,999 | |||||||||
EXPENSES | |||||||||||
Investment advisory fees (Note 6) | 276,805 | 9,600 | |||||||||
Distribution and service fees (Note 6) | |||||||||||
Class R | 15,684 | 12 | |||||||||
Class C | 4,510 | 48 | |||||||||
Class A | 135 | 12 | |||||||||
Administrative fees (Note 6) | 17,095 | 6,247 | |||||||||
Chief Compliance Officer fees (Note 6) | 2,592 | 69 | |||||||||
Trustees' fees | 48,288 | 47,952 | |||||||||
Dividend expense | 20,426 | 5,672 | |||||||||
Interest rebate expense | 14,543 | 1,012 | |||||||||
Transfer agent fees (Note 6) | 18,610 | 639 | |||||||||
Custodian and bank service fees | 9,582 | 15,040 | |||||||||
Registration and filing fees | 28,557 | 11,529 | |||||||||
Printing of shareholder reports | 6,696 | 2,435 | |||||||||
Professional fees | 13,035 | 13,144 | |||||||||
Line of credit interest expense (Note 4) | — | — | |||||||||
Insurance expense | 1,567 | 39 | |||||||||
Chief Financial Officer fees (Note 6) | 4,309 | 3,493 | |||||||||
Other expenses | 5,978 | 3,732 | |||||||||
Total Expenses | 488,412 | 120,675 | |||||||||
Fees waived by the Adviser, Class R (Note 6) | (19,249 | ) | (631 | ) | |||||||
Expense reductions, Class R(a) | (472 | ) | (8 | ) | |||||||
Fees waived by the Adviser, Class I (Note 6) | (64,269 | ) | (99,668 | ) | |||||||
Expense reductions, Class I(a) | (1,534 | ) | (1,274 | ) | |||||||
Fees waived by the Adviser, Class C (Note 6) | (1,382 | ) | (631 | ) | |||||||
Expense reductions, Class C(a) | (31 | ) | (8 | ) | |||||||
Fees waived by the Adviser, Class A (Note 6) | (166 | ) | (631 | ) | |||||||
Expense reductions, Class A(a) | (4 | ) | (8 | ) | |||||||
Net Expenses | 401,305 | 17,816 | |||||||||
NET INVESTMENT INCOME (LOSS) | 602,121 | (10,817 | ) | ||||||||
Semi-Annual Report | November 30, 2016
59
The Arbitrage Funds
| The Arbitrage Fund | The Arbitrage Event-Driven Fund | ||||||||||
REALIZED AND UNREALIZED GAINS (LOSSES) ON INVESTMENTS AND FOREIGN CURRENCIES | |||||||||||
Net realized gains (losses) from: | |||||||||||
Investments | $ | 67,759,999 | $ | 7,949,276 | |||||||
Swap contracts | 1,871,425 | 207,225 | |||||||||
Securities sold short | (36,447,005 | ) | (3,771,509 | ) | |||||||
Written option contracts | 719,206 | 486,489 | |||||||||
Foreign currency transactions (Note 8) | 4,430,801 | 229,496 | |||||||||
Net change in unrealized appreciation (depreciation) on: | |||||||||||
Investments | (35,821,862 | ) | (3,889,799 | ) | |||||||
Swap contracts | — | 383 | |||||||||
Securities sold short | 13,321,802 | 667,027 | |||||||||
Written option contracts | 69,177 | 10,492 | |||||||||
Foreign currency transactions (Note 8) | 5,970,658 | 737,233 | |||||||||
NET REALIZED AND UNREALIZED GAINS ON INVESTMENTS AND FOREIGN CURRENCIES | 21,874,201 | 2,626,313 | |||||||||
NET INCREASE IN NET ASSETS RESULTING FROM OPERATIONS | $ | 15,189,746 | $ | 2,040,695 | |||||||
See Notes to Financial Statements.
www.arbitragefunds.com | 1-800-295-4485
60
Statements of Operations
For the Six Months Ended November 30, 2016 (Unaudited)
| The Arbitrage Credit Opportunities Fund | The Arbitrage Tactical Equity Fund | ||||||||||
REALIZED AND UNREALIZED GAINS (LOSSES) ON INVESTMENTS AND FOREIGN CURRENCIES | |||||||||||
Net realized gains (losses) from: | |||||||||||
Investments | $ | 1,167,939 | $ | 50,568 | |||||||
Swap contracts | — | 1,662 | |||||||||
Securities sold short | (1,011,059 | ) | (46,667 | ) | |||||||
Written option contracts | 58,741 | 8,670 | |||||||||
Foreign currency transactions (Note 8) | (543 | ) | 1,620 | ||||||||
Net change in unrealized appreciation (depreciation) on: | |||||||||||
Investments | (421,811 | ) | 5,996 | ||||||||
Swap contracts | — | — | |||||||||
Securities sold short | 769,404 | (5,195 | ) | ||||||||
Written option contracts | 22,586 | (1,501 | ) | ||||||||
Foreign currency transactions (Note 8) | 25,645 | 4,176 | |||||||||
NET REALIZED AND UNREALIZED GAINS ON INVESTMENTS AND FOREIGN CURRENCIES | 610,902 | 19,329 | |||||||||
NET INCREASE IN NET ASSETS RESULTING FROM OPERATIONS | $ | 1,213,023 | $ | 8,512 | |||||||
Semi-Annual Report | November 30, 2016
61
The Arbitrage Funds
The Arbitrage Fund | |||||||||||
| Six Months Ended November 30, 2016 (Unaudited) | Year Ended May 31, 2016 | ||||||||||
FROM OPERATIONS: | |||||||||||
Net investment income (loss) | $ | (6,684,455 | ) | $ | (6,350,178 | ) | |||||
Net realized gains (losses) from: | |||||||||||
Investments | 67,759,999 | (42,523,714 | ) | ||||||||
Swap contracts | 1,871,425 | 5,879,985 | |||||||||
Securities sold short | (36,447,005 | ) | 28,409,348 | ||||||||
Written option contracts | 719,206 | 9,412,568 | |||||||||
Foreign currency transactions | 4,430,801 | (6,415,772 | ) | ||||||||
Net change in unrealized appreciation (depreciation) on: | |||||||||||
Investments | (35,821,862 | ) | 47,088,404 | ||||||||
Swap contracts | — | (112,866 | ) | ||||||||
Securities sold short | 13,321,802 | (21,190,678 | ) | ||||||||
Written option contracts | 69,177 | (383,049 | ) | ||||||||
Foreign currency transactions | 5,970,658 | 5,431,159 | |||||||||
Net increase (decrease) in net assets resulting from operations | 15,189,746 | 19,245,207 | |||||||||
FROM DIVIDENDS AND DISTRIBUTIONS TO SHAREHOLDERS: | |||||||||||
NET INVESTMENT INCOME | |||||||||||
Distributions from net investment income, Class R | — | — | |||||||||
Distributions from net investment income, Class I | — | — | |||||||||
Distributions from net investment income, Class C | — | — | |||||||||
Distributions from net investment income, Class A | — | — | |||||||||
NET REALIZED GAINS | |||||||||||
Distributions from net realized gains, Class R | — | (10,362,441 | ) | ||||||||
Distributions from net realized gains, Class I | — | (33,308,237 | ) | ||||||||
Distributions from net realized gains, Class C | — | (785,094 | ) | ||||||||
Distributions from net realized gains, Class A | — | (410,119 | ) | ||||||||
Decrease in net assets from distributions to shareholders | — | (44,865,891 | ) | ||||||||
FROM CAPITAL SHARE TRANSACTIONS (NOTE 7): | |||||||||||
Proceeds from shares sold | 269,794,421 | 750,332,263 | |||||||||
Shares issued in reinvestment of distributions | — | 35,336,364 | |||||||||
Proceeds from redemption fees collected (Note 2) | 1,506 | 15,245 | |||||||||
Payments for shares redeemed | (393,923,517 | ) | (957,255,726 | ) | |||||||
Net increase (decrease) in net assets from capital share transactions | (124,127,590 | ) | (171,571,854 | ) | |||||||
TOTAL INCREASE (DECREASE) IN NET ASSETS | (108,937,844 | ) | (197,192,538 | ) | |||||||
NET ASSETS: | |||||||||||
Beginning of period | 1,868,349,011 | 2,065,541,549 | |||||||||
End of period* | $ | 1,759,411,167 | $ | 1,868,349,011 | |||||||
* Including accumulated net investment income (loss) of: | $ | (7,097,607 | ) | $ | (413,152 | ) | |||||
See Notes to Financial Statements.
www.arbitragefunds.com | 1-800-295-4485
62
Statements of Changes in Net Assets
The Arbitrage Event-Driven Fund | |||||||||||
| Six Months Ended November 30, 2016 (Unaudited) | Year Ended May 31, 2016 | ||||||||||
FROM OPERATIONS: | |||||||||||
Net investment income (loss) | $ | (585,618 | ) | $ | (884,529 | ) | |||||
Net realized gains (losses) from: | |||||||||||
Investments | 7,949,276 | (58,328,289 | ) | ||||||||
Swap contracts | 207,225 | 1,095,052 | |||||||||
Securities sold short | (3,771,509 | ) | 9,538,416 | ||||||||
Written option contracts | 486,489 | 4,570,661 | |||||||||
Foreign currency transactions | 229,496 | (669,306 | ) | ||||||||
Net change in unrealized appreciation (depreciation) on: | |||||||||||
Investments | (3,889,799 | ) | 10,536,616 | ||||||||
Swap contracts | 383 | 14,649 | |||||||||
Securities sold short | 667,027 | (1,297,974 | ) | ||||||||
Written option contracts | 10,492 | 36,407 | |||||||||
Foreign currency transactions | 737,233 | 363,689 | |||||||||
Net increase (decrease) in net assets resulting from operations | 2,040,695 | (35,024,608 | ) | ||||||||
FROM DIVIDENDS AND DISTRIBUTIONS TO SHAREHOLDERS: | |||||||||||
NET INVESTMENT INCOME | |||||||||||
Distributions from net investment income, Class R | — | (2,171,603 | ) | ||||||||
Distributions from net investment income, Class I | — | (4,633,283 | ) | ||||||||
Distributions from net investment income, Class C | — | (43,575 | ) | ||||||||
Distributions from net investment income, Class A | — | (63,342 | ) | ||||||||
NET REALIZED GAINS | |||||||||||
Distributions from net realized gains, Class R | — | (3,541 | ) | ||||||||
Distributions from net realized gains, Class I | — | (6,279 | ) | ||||||||
Distributions from net realized gains, Class C | — | (124 | ) | ||||||||
Distributions from net realized gains, Class A | — | (103 | ) | ||||||||
Decrease in net assets from distributions to shareholders | — | (6,921,850 | ) | ||||||||
FROM CAPITAL SHARE TRANSACTIONS (NOTE 7): | |||||||||||
Proceeds from shares sold | 10,638,625 | 58,275,506 | |||||||||
Shares issued in reinvestment of distributions | — | 4,703,095 | |||||||||
Proceeds from redemption fees collected (Note 2) | 35 | 9,361 | |||||||||
Payments for shares redeemed | (39,354,294 | ) | (436,649,628 | ) | |||||||
Net increase (decrease) in net assets from capital share transactions | (28,715,634 | ) | (373,661,666 | ) | |||||||
TOTAL INCREASE (DECREASE) IN NET ASSETS | (26,674,939 | ) | (415,608,124 | ) | |||||||
NET ASSETS: | |||||||||||
Beginning of period | 179,868,614 | 595,476,738 | |||||||||
End of period* | $ | 153,193,675 | $ | 179,868,614 | |||||||
* Including accumulated net investment income (loss) of: | $ | (1,619,054 | ) | $ | (1,033,436 | ) | |||||
Semi-Annual Report | November 30, 2016
63
The Arbitrage Funds
The Arbitrage Credit Opportunities Fund | |||||||||||
| Six Months Ended November 30, 2016 (Unaudited) | Year Ended May 31, 2016 | ||||||||||
FROM OPERATIONS: | |||||||||||
Net investment income (loss) | $ | 602,121 | $ | 1,765,214 | |||||||
Net realized gains (losses) from: | |||||||||||
Investments | 1,167,939 | (2,722,508 | ) | ||||||||
Swap contracts | — | 4,760 | |||||||||
Securities sold short | (1,011,059 | ) | 71,167 | ||||||||
Written option contracts | 58,741 | 67,997 | |||||||||
Foreign currency transactions | (543 | ) | 11,236 | ||||||||
Net change in unrealized appreciation (depreciation) on: | |||||||||||
Investments | (421,811 | ) | 1,195,263 | ||||||||
Swap contracts | — | 1,801 | |||||||||
Securities sold short | 769,404 | (569,877 | ) | ||||||||
Written option contracts | 22,586 | 29,362 | |||||||||
Foreign currency transactions | 25,645 | (20,452 | ) | ||||||||
Net increase (decrease) in net assets resulting from operations | 1,213,023 | (166,037 | ) | ||||||||
FROM DIVIDENDS AND DISTRIBUTIONS TO SHAREHOLDERS: | |||||||||||
NET INVESTMENT INCOME | |||||||||||
Distributions from net investment income, Class R | (97,049 | ) | (535,626 | ) | |||||||
Distributions from net investment income, Class I | (375,459 | ) | (1,312,370 | ) | |||||||
Distributions from net investment income, Class C | (2,738 | ) | (37,922 | ) | |||||||
Distributions from net investment income, Class A | (833 | ) | (14,790 | ) | |||||||
NET REALIZED GAINS | |||||||||||
Distributions from net realized gains, Class R | — | — | |||||||||
Distributions from net realized gains, Class I | — | — | |||||||||
Distributions from net realized gains, Class C | — | — | |||||||||
Distributions from net realized gains, Class A | — | — | |||||||||
Decrease in net assets from distributions to shareholders | (476,079 | ) | (1,900,708 | ) | |||||||
FROM CAPITAL SHARE TRANSACTIONS (NOTE 7): | |||||||||||
Proceeds from shares sold | 4,778,531 | 19,206,229 | |||||||||
Shares issued in reinvestment of distributions | 416,094 | 1,863,018 | |||||||||
Proceeds from redemption fees collected (Note 2) | 80 | — | |||||||||
Payments for shares redeemed | (6,798,322 | ) | (34,755,910 | ) | |||||||
Net increase (decrease) in net assets from capital share transactions | (1,603,617 | ) | (13,686,663 | ) | |||||||
TOTAL INCREASE (DECREASE) IN NET ASSETS | (866,673 | ) | (15,753,408 | ) | |||||||
NET ASSETS: | |||||||||||
Beginning of period | 55,742,799 | 71,496,207 | |||||||||
End of period* | $ | 54,876,126 | $ | 55,742,799 | |||||||
* Including accumulated net investment income (loss) of: | $ | 318,709 | $ | 192,667 | |||||||
See Notes to Financial Statements.
www.arbitragefunds.com | 1-800-295-4485
64
Statements of Changes in Net Assets
The Arbitrage Tactical Equity Fund | |||||||||||
| Six Months Ended November 30, 2016 (Unaudited) | Year Ended May 31, 2016 | ||||||||||
FROM OPERATIONS: | |||||||||||
Net investment income (loss) | $ | (10,817 | ) | $ | (6,976 | ) | |||||
Net realized gains (losses) from: | |||||||||||
Investments | 50,568 | (155,345 | ) | ||||||||
Swap contracts | 1,662 | 1,864 | |||||||||
Securities sold short | (46,667 | ) | 18,523 | ||||||||
Written option contracts | 8,670 | 17,026 | |||||||||
Foreign currency transactions | 1,620 | (709 | ) | ||||||||
Net change in unrealized appreciation (depreciation) on: | |||||||||||
Investments | 5,996 | 8,652 | |||||||||
Swap contracts | — | — | |||||||||
Securities sold short | (5,195 | ) | (2,581 | ) | |||||||
Written option contracts | (1,501 | ) | 1,232 | ||||||||
Foreign currency transactions | 4,176 | 2,180 | |||||||||
Net increase (decrease) in net assets resulting from operations | 8,512 | (116,134 | ) | ||||||||
FROM DIVIDENDS AND DISTRIBUTIONS TO SHAREHOLDERS: | |||||||||||
NET INVESTMENT INCOME | |||||||||||
Distributions from net investment income, Class R | — | — | |||||||||
Distributions from net investment income, Class I | — | — | |||||||||
Distributions from net investment income, Class C | — | — | |||||||||
Distributions from net investment income, Class A | — | — | |||||||||
NET REALIZED GAINS | |||||||||||
Distributions from net realized gains, Class R | — | (88 | ) | ||||||||
Distributions from net realized gains, Class I | — | (14,509 | ) | ||||||||
Distributions from net realized gains, Class C | — | (88 | ) | ||||||||
Distributions from net realized gains, Class A | — | (88 | ) | ||||||||
Decrease in net assets from distributions to shareholders | — | (14,773 | ) | ||||||||
FROM CAPITAL SHARE TRANSACTIONS (NOTE 7): | |||||||||||
Proceeds from shares sold | 259,772 | 404,121 | |||||||||
Shares issued in reinvestment of distributions | — | 14,773 | |||||||||
Proceeds from redemption fees collected (Note 2) | — | — | |||||||||
Payments for shares redeemed | — | (374,608 | ) | ||||||||
Net increase (decrease) in net assets from capital share transactions | 259,772 | 44,286 | |||||||||
TOTAL INCREASE (DECREASE) IN NET ASSETS | 268,284 | (86,621 | ) | ||||||||
NET ASSETS: | |||||||||||
Beginning of period | 1,329,822 | 1,416,443 | |||||||||
End of period* | $ | 1,598,106 | $ | 1,329,822 | |||||||
* Including accumulated net investment income (loss) of: | $ | (13,274 | ) | $ | (2,457 | ) | |||||
Semi-Annual Report | November 30, 2016
65
The Arbitrage Fund – Class R
Selected Per Share Data and Ratios for a Share Outstanding Throughout the Periods Presented:
| Six Months Ended November 30, 2016 (Unaudited) | Year Ended May 31, 2016 | Year Ended May 31, 2015 | |||||||||||||
Net asset value, beginning of period | $ | 12.78 | $ | 12.97 | $ | 12.58 | |||||||||
Income (loss) from investment operations | |||||||||||||||
Net investment loss(a) | (0.06 | )(b) | (0.06 | ) | (0.11 | ) | |||||||||
Net realized and unrealized gains on investments and foreign currencies | 0.16 | 0.17 | 0.53 | ||||||||||||
Total from investment operations | 0.10 | 0.11 | 0.42 | ||||||||||||
Less distributions | |||||||||||||||
From net investment income | — | — | — | ||||||||||||
From net realized gains | — | (0.30 | ) | (0.03 | ) | ||||||||||
Total distributions | — | (0.30 | ) | (0.03 | ) | ||||||||||
Proceeds from redemption fees collected(c) | 0.00 | 0.00 | 0.00 | ||||||||||||
Net asset value, end of period | $ | 12.88 | $ | 12.78 | $ | 12.97 | |||||||||
Total return(d) | 0.78 | %(e) | 0.87 | % | 3.35 | % | |||||||||
Net assets, end of period (in 000s) | $ | 353,347 | $ | 433,936 | $ | 500,440 | |||||||||
RATIOS TO AVERAGE NET ASSETS: | |||||||||||||||
Gross expenses(g) | 1.97 | %(f) | 1.88 | % | 2.31 | % | |||||||||
Net expenses after advisory fees waived and expenses reimbursed(g)(h) | 1.97 | %(f) | 1.88 | % | 2.31 | % | |||||||||
Net investment loss | (0.92 | %)(b)(f) | (0.51 | %) | (0.87 | %) | |||||||||
Portfolio turnover rate | 196 | %(e) | 321 | % | 514 | % | |||||||||
(a) Per share amounts were calculated using average shares outstanding for the period.
(b) Includes a non-recurring refund for overbilling of prior years' out-of-pocket fees.
(c) Amount rounds to less than $0.01 per share.
(d) Total return is a measure of the change in the value of an investment in the Fund over the years covered, which assumes any dividends or capital gains distributions are reinvested in shares of the Fund. Returns shown do not reflect the deduction of taxes a shareholder would pay on Fund distributions or the redemption of Fund shares.
(e) Not annualized.
(f) Annualized.
(g) Dividend expense totaled 0.41% (annualized), 0.34%, 0.68%, 0.60%, 0.42% and 0.58% of average net assets for the six months ended November 30, 2016 and the years ended May 31, 2016, 2015, 2014, 2013 and 2012, respectively. Interest rebate expense and line of credit interest expense totaled 0.08% (annualized), 0.07%, 0.18%, 0.12%, 0.10% and 0.20% of average net assets for the six months ended November 30, 2016 and the years ended May 31, 2016, 2015, 2014, 2013 and 2012, respectively.
(h) Excluding dividend and interest expenses, the Fund's net expenses after advisory fees waived and expenses reimbursed would have been 1.48% (annualized), 1.47%, 1.45%, 1.45%, 1.45% and 1.45% of average net assets for the six months ended November 30, 2016 and the years ended May 31, 2016, 2015, 2014, 2013 and 2012, respectively.
See Notes to Financial Statements.
www.arbitragefunds.com | 1-800-295-4485
66
Financial Highlights
| Year Ended May 31, 2014 | Year Ended May 31, 2013 | Year Ended May 31, 2012 | |||||||||||||
Net asset value, beginning of period | $ | 12.50 | $ | 12.80 | $ | 12.77 | |||||||||
Income (loss) from investment operations | |||||||||||||||
Net investment loss(a) | (0.09 | ) | (0.10 | ) | (0.11 | ) | |||||||||
Net realized and unrealized gains on investments and foreign currencies | 0.23 | 0.15 | 0.44 | ||||||||||||
Total from investment operations | 0.14 | 0.05 | 0.33 | ||||||||||||
Less distributions | |||||||||||||||
From net investment income | — | (0.09 | ) | — | |||||||||||
From net realized gains | (0.06 | ) | (0.26 | ) | (0.30 | ) | |||||||||
Total distributions | (0.06 | ) | (0.35 | ) | (0.30 | ) | |||||||||
Proceeds from redemption fees collected(c) | 0.00 | 0.00 | 0.00 | ||||||||||||
Net asset value, end of period | $ | 12.58 | $ | 12.50 | $ | 12.80 | |||||||||
Total return(d) | 1.10 | % | 0.42 | % | 2.54 | % | |||||||||
Net assets, end of period (in 000s) | $ | 760,750 | $ | 916,677 | $ | 1,003,646 | |||||||||
RATIOS TO AVERAGE NET ASSETS: | |||||||||||||||
Gross expenses(g) | 2.17 | % | 1.97 | % | 2.23 | % | |||||||||
Net expenses after advisory fees waived and expenses reimbursed(g)(h) | 2.17 | % | 1.97 | % | 2.23 | % | |||||||||
Net investment loss | (0.70 | %) | (0.78 | %) | (0.83 | %) | |||||||||
Portfolio turnover rate | 462 | % | 459 | % | 563 | % | |||||||||
Semi-Annual Report | November 30, 2016
67
The Arbitrage Fund – Class I
Selected Per Share Data and Ratios for a Share Outstanding Throughout the Periods Presented:
| Six Months Ended November 30, 2016 (Unaudited) | Year Ended May 31, 2016 | Year Ended May 31, 2015 | |||||||||||||
Net asset value, beginning of period | $ | 13.13 | $ | 13.28 | $ | 12.86 | |||||||||
Income (loss) from investment operations | |||||||||||||||
Net investment loss(a) | (0.04 | )(b) | (0.03 | ) | (0.09 | ) | |||||||||
Net realized and unrealized gains on investments and foreign currencies | 0.16 | 0.18 | 0.54 | ||||||||||||
Total from investment operations | 0.12 | 0.15 | 0.45 | ||||||||||||
Less distributions | |||||||||||||||
From net investment income | — | — | — | ||||||||||||
From net realized gains | — | (0.30 | ) | (0.03 | ) | ||||||||||
Total distributions | — | (0.30 | ) | (0.03 | ) | ||||||||||
Proceeds from redemption fees collected(c) | 0.00 | 0.00 | 0.00 | ||||||||||||
Net asset value, end of period | $ | 13.25 | $ | 13.13 | $ | 13.28 | |||||||||
Total return(d) | 0.91 | %(e) | 1.16 | % | 3.51 | % | |||||||||
Net assets, end of period (in 000s) | $ | 1,368,844 | $ | 1,395,178 | $ | 1,514,685 | |||||||||
RATIOS TO AVERAGE NET ASSETS: | |||||||||||||||
Gross expenses(g) | 1.72 | %(f) | 1.63 | % | 2.06 | % | |||||||||
Net expenses after advisory fees waived and expenses reimbursed(g)(h) | 1.72 | %(f) | 1.63 | % | 2.06 | % | |||||||||
Net investment loss | (0.68 | %)(b)(f) | (0.24 | %) | (0.65 | %) | |||||||||
Portfolio turnover rate | 196 | %(e) | 321 | % | 514 | % | |||||||||
(a) Per share amounts were calculated using average shares outstanding for the period.
(b) Includes a non-recurring refund for overbilling of prior years' out-of-pocket fees.
(c) Amount rounds to less than $0.01 per share.
(d) Total return is a measure of the change in the value of an investment in the Fund over the years covered, which assumes any dividends or capital gains distributions are reinvested in shares of the Fund. Returns shown do not reflect the deduction of taxes a shareholder would pay on Fund distributions or the redemption of Fund shares.
(e) Not annualized.
(f) Annualized.
(g) Dividend expense totaled 0.41% (annualized), 0.34%, 0.68%, 0.60%, 0.42% and 0.58% of average net assets for the six months ended November 30, 2016 and the years ended May 31, 2016, 2015, 2014, 2013 and 2012, respectively. Interest rebate expense and line of credit interest expense totaled 0.08% (annualized), 0.07%, 0.18%, 0.12%, 0.10% and 0.20% of average net assets for the six months ended November 30, 2016 and the years ended May 31, 2016, 2015, 2014, 2013 and 2012, respectively.
(h) Excluding dividend and interest expenses, the Fund's net expenses after advisory fees waived and expenses reimbursed would have been 1.23% (annualized), 1.22%, 1.20%, 1.20%, 1.20% and 1.20% of average net assets for the six months ended November 30, 2016 and the years ended May 31, 2016, 2015, 2014, 2013 and 2012, respectively.
See Notes to Financial Statements.
www.arbitragefunds.com | 1-800-295-4485
68
Financial Highlights
| Year Ended May 31, 2014 | Year Ended May 31, 2013 | Year Ended May 31, 2012 | |||||||||||||
Net asset value, beginning of period | $ | 12.74 | $ | 13.04 | $ | 12.98 | |||||||||
Income (loss) from investment operations | |||||||||||||||
Net investment loss(a) | (0.05 | ) | (0.07 | ) | (0.07 | ) | |||||||||
Net realized and unrealized gains on investments and foreign currencies | 0.23 | 0.16 | 0.43 | ||||||||||||
Total from investment operations | 0.18 | 0.09 | 0.36 | ||||||||||||
Less distributions | |||||||||||||||
From net investment income | — | (0.13 | ) | — | |||||||||||
From net realized gains | (0.06 | ) | (0.26 | ) | (0.30 | ) | |||||||||
Total distributions | (0.06 | ) | (0.39 | ) | (0.30 | ) | |||||||||
Proceeds from redemption fees collected(c) | 0.00 | 0.00 | 0.00 | ||||||||||||
Net asset value, end of period | $ | 12.86 | $ | 12.74 | $ | 13.04 | |||||||||
Total return(d) | 1.39 | % | 0.67 | % | 2.74 | % | |||||||||
Net assets, end of period (in 000s) | $ | 1,712,120 | $ | 1,937,514 | $ | 2,084,530 | |||||||||
RATIOS TO AVERAGE NET ASSETS: | |||||||||||||||
Gross expenses(g) | 1.92 | % | 1.72 | % | 1.98 | % | |||||||||
Net expenses after advisory fees waived and expenses reimbursed(g)(h) | 1.92 | % | 1.72 | % | 1.98 | % | |||||||||
Net investment loss | (0.42 | %) | (0.51 | %) | (0.56 | %) | |||||||||
Portfolio turnover rate | 462 | % | 459 | % | 563 | % | |||||||||
Semi-Annual Report | November 30, 2016
69
The Arbitrage Fund – Class C
Selected Per Share Data and Ratios for a Share Outstanding Throughout the Periods Presented:
| Six Months Ended November 30, 2016 (Unaudited) | Year Ended May 31, 2016 | Year Ended May 31, 2015 | |||||||||||||
Net asset value, beginning of period | $ | 12.37 | $ | 12.65 | $ | 12.37 | |||||||||
Income (loss) from investment operations | |||||||||||||||
Net investment loss(b) | (0.10 | )(c) | (0.16 | ) | (0.20 | ) | |||||||||
Net realized and unrealized gains on investments and foreign currencies | 0.15 | 0.18 | 0.51 | ||||||||||||
Total from investment operations | 0.05 | 0.02 | 0.31 | ||||||||||||
Less distributions | |||||||||||||||
From net investment income | — | — | — | ||||||||||||
From net realized gains | — | (0.30 | ) | (0.03 | ) | ||||||||||
Total distributions | — | (0.30 | ) | (0.03 | ) | ||||||||||
Proceeds from redemption fees collected | — | — | — | ||||||||||||
Net asset value, end of period | $ | 12.42 | $ | 12.37 | $ | 12.65 | |||||||||
Total return(e) | 0.40 | %(f) | 0.18 | % | 2.52 | % | |||||||||
Net assets, end of period (in 000s) | $ | 28,029 | $ | 30,814 | $ | 32,958 | |||||||||
RATIOS TO AVERAGE NET ASSETS: | |||||||||||||||
Gross expenses(h) | 2.72 | %(g) | 2.63 | % | 3.06 | % | |||||||||
Net expenses after advisory fees waived and expenses reimbursed(h)(i) | 2.72 | %(g) | 2.63 | % | 3.06 | % | |||||||||
Net investment loss | (1.67 | %)(c)(g) | (1.28 | %) | (1.60 | %) | |||||||||
Portfolio turnover rate | 196 | %(f) | 321 | % | 514 | % | |||||||||
(a) Commenced operations on June 1, 2012.
(b) Per share amounts were calculated using average shares outstanding for the period.
(c) Includes a non-recurring refund for overbilling of prior years' out-of-pocket fees.
(d) Amount rounds to less than $0.01 per share.
(e) Total return is a measure of the change in the value of an investment in the Fund over the years covered, which assumes any dividends or capital gains distributions are reinvested in shares of the Fund. Returns shown do not reflect the deduction of taxes a shareholder would pay on Fund distributions or the redemption of Fund shares.
(f) Not annualized.
(g) Annualized.
(h) Dividend expense totaled 0.41% (annualized), 0.34%, 0.68%, 0.60% and 0.42% of average net assets for the six months ended November 30, 2016 and the years ended May 31, 2016, 2015, 2014 and 2013, respectively. Interest rebate expense and line of credit interest expense totaled 0.08% (annualized), 0.07%, 0.18%, 0.12% and 0.11% of average net assets for the six months ended November 30, 2016 and the years ended May 31, 2016, 2015, 2014 and 2013, respectively.
(i) Excluding dividend and interest expenses, the Fund's net expenses after advisory fees waived and expenses reimbursed would have been 2.23% (annualized), 2.22%, 2.20%, 2.20% and 2.20% of average net assets for the six months ended November 30, 2016 and the years ended May 31, 2016, 2015, 2014, and 2013, respectively.
See Notes to Financial Statements.
www.arbitragefunds.com | 1-800-295-4485
70
Financial Highlights
| Year Ended May 31, 2014 | Year Ended May 31, 2013(a) | ||||||||||
Net asset value, beginning of period | $ | 12.38 | $ | 12.80 | |||||||
Income (loss) from investment operations | |||||||||||
Net investment loss(b) | (0.18 | ) | (0.23 | ) | |||||||
Net realized and unrealized gains on investments and foreign currencies | 0.23 | 0.20 | |||||||||
Total from investment operations | 0.05 | (0.03 | ) | ||||||||
Less distributions | |||||||||||
From net investment income | — | (0.13 | ) | ||||||||
From net realized gains | (0.06 | ) | (0.26 | ) | |||||||
Total distributions | (0.06 | ) | (0.39 | ) | |||||||
Proceeds from redemption fees collected | — | 0.00 | (d) | ||||||||
Net asset value, end of period | $ | 12.37 | $ | 12.38 | |||||||
Total return(e) | 0.38 | % | (0.27 | %) | |||||||
Net assets, end of period (in 000s) | $ | 33,589 | $ | 18,741 | |||||||
RATIOS TO AVERAGE NET ASSETS: | |||||||||||
Gross expenses(h) | 2.92 | % | 2.75 | % | |||||||
Net expenses after advisory fees waived and expenses reimbursed(h)(i) | 2.92 | % | 2.75 | % | |||||||
Net investment loss | (1.45 | %) | (1.84 | %) | |||||||
Portfolio turnover rate | 462 | % | 459 | % | |||||||
Semi-Annual Report | November 30, 2016
71
The Arbitrage Fund – Class A
Selected Per Share Data and Ratios for a Share Outstanding Throughout the Periods Presented:
| Six Months Ended November 30, 2016 (Unaudited) | Year Ended May 31, 2016 | ||||||||||
Net asset value, beginning of period | $ | 12.79 | $ | 12.97 | |||||||
Income (loss) from investment operations | |||||||||||
Net investment loss(b) | (0.06 | )(c) | (0.07 | ) | |||||||
Net realized and unrealized gains on investments and foreign currencies | 0.15 | 0.19 | |||||||||
Total from investment operations | 0.09 | 0.12 | |||||||||
Less distributions | |||||||||||
From net realized gains | — | (0.30 | ) | ||||||||
Total distributions | — | (0.30 | ) | ||||||||
Proceeds from redemption fees collected | — | — | |||||||||
Net asset value, end of period | $ | 12.88 | $ | 12.79 | |||||||
Total return(e) | 0.70 | %(f) | 0.95 | % | |||||||
Net assets, end of period (in 000s) | $ | 9,191 | $ | 8,421 | |||||||
RATIOS TO AVERAGE NET ASSETS: | |||||||||||
Gross expenses(h) | 1.97 | %(g) | 1.87 | % | |||||||
Net expenses after advisory fees waived and expenses reimbursed(h)(i) | 1.97 | %(g) | 1.87 | % | |||||||
Net investment loss | (0.93 | %)(c)(g) | (0.56 | %) | |||||||
Portfolio turnover rate | 196 | %(f) | 321 | % | |||||||
(a) Commenced operations on June 1, 2013.
(b) Per share amounts were calculated using average shares outstanding for the period.
(c) Includes a non-recurring refund for overbilling of prior years' out-of-pocket fees.
(d) Amount rounds to less than $0.01 per share.
(e) Total return is a measure of the change in the value of an investment in the Fund over the years covered, which assumes any dividends or capital gains distributions are reinvested in shares of the Fund. Returns shown do not reflect the deduction of taxes a shareholder would pay on Fund distributions or the redemption of Fund shares.
(f) Not annualized.
(g) Annualized.
(h) Dividend expense totaled 0.41% (annualized), 0.33%, 0.68% and 0.60% of average net assets for the six months ended November 30, 2016 and the years ended May 31, 2016, 2015 and 2014, respectively. Interest rebate expense and line of credit interest expense totaled 0.08% (annualized), 0.07%, 0.18% and 0.12% of average net assets for the six months ended November 30, 2016 and the years ended May 31, 2016, 2015 and 2014, respectively.
(i) Excluding dividend and interest expenses, the Fund's net expenses after advisory fees waived and expenses reimbursed would have been 1.48% (annualized), 1.47%, 1.45% and 1.46% of average net assets for the six months ended November 30, 2016 and the years ended May 31, 2016, 2015 and 2014, respectively.
See Notes to Financial Statements.
www.arbitragefunds.com | 1-800-295-4485
72
Financial Highlights
| Year Ended May 31, 2015 | Year Ended May 31, 2014(a) | ||||||||||
Net asset value, beginning of period | $ | 12.59 | $ | 12.50 | |||||||
Income (loss) from investment operations | |||||||||||
Net investment loss(b) | (0.09 | ) | (0.09 | ) | |||||||
Net realized and unrealized gains on investments and foreign currencies | 0.50 | 0.24 | |||||||||
Total from investment operations | 0.41 | 0.15 | |||||||||
Less distributions | |||||||||||
From net realized gains | (0.03 | ) | (0.06 | ) | |||||||
Total distributions | (0.03 | ) | (0.06 | ) | |||||||
Proceeds from redemption fees collected | — | 0.00 | (d) | ||||||||
Net asset value, end of period | $ | 12.97 | $ | 12.59 | |||||||
Total return(e) | 3.27 | % | 1.18 | % | |||||||
Net assets, end of period (in 000s) | $ | 17,458 | $ | 6,655 | |||||||
RATIOS TO AVERAGE NET ASSETS: | |||||||||||
Gross expenses(h) | 2.31 | % | 2.18 | % | |||||||
Net expenses after advisory fees waived and expenses reimbursed(h)(i) | 2.31 | % | 2.18 | % | |||||||
Net investment loss | (0.70 | %) | (0.69 | %) | |||||||
Portfolio turnover rate | 514 | % | 462 | % | |||||||
Semi-Annual Report | November 30, 2016
73
The Arbitrage Event-Driven Fund – Class R
Selected Per Share Data and Ratios for a Share Outstanding Throughout the Periods Presented:
| Six Months Ended November 30, 2016 (Unaudited) | Year Ended May 31, 2016 | Year Ended May 31, 2015 | |||||||||||||
Net asset value, beginning of period | $ | 8.98 | $ | 9.73 | $ | 10.29 | |||||||||
Income (loss) from investment operations | |||||||||||||||
Net investment income (loss)(a) | (0.04 | )(b) | (0.02 | ) | 0.04 | ||||||||||
Net realized and unrealized gains (losses) on investments and foreign currencies | 0.15 | (0.53 | ) | (0.36 | ) | ||||||||||
Total from investment operations | 0.11 | (0.55 | ) | (0.32 | ) | ||||||||||
Less distributions | |||||||||||||||
From net investment income | — | (0.20 | ) | (0.08 | ) | ||||||||||
From net realized gains | — | (0.00 | )(c) | (0.16 | ) | ||||||||||
Total distributions | — | (0.20 | ) | (0.24 | ) | ||||||||||
Proceeds from redemption fees collected(c) | 0.00 | 0.00 | 0.00 | ||||||||||||
Net asset value, end of period | $ | 9.09 | $ | 8.98 | $ | 9.73 | |||||||||
Total return(d) | 1.22 | %(e) | (5.55 | %) | (3.12 | %) | |||||||||
Net assets, end of period (in 000s) | $ | 73,635 | $ | 80,114 | $ | 195,014 | |||||||||
RATIOS TO AVERAGE NET ASSETS: | |||||||||||||||
Gross expenses(g) | 2.64 | %(f) | 2.62 | % | 2.52 | % | |||||||||
Net expenses after advisory fees waived and expenses reimbursed(g)(h) | 2.34 | %(f) | 2.46 | % | 2.50 | % | |||||||||
Net investment income (loss) | (0.82 | %)(b)(f) | (0.27 | %) | 0.37 | % | |||||||||
Portfolio turnover rate | 199 | %(e) | 350 | % | 451 | % | |||||||||
(a) Per share amounts were calculated using average shares outstanding for the period.
(b) Includes a non-recurring refund for overbilling of prior years' out-of-pocket fees.
(c) Amount rounds to less than $0.01 per share.
(d) Total return is a measure of the change in the value of an investment in the Fund over the years covered, which assumes any dividends or capital gains distributions are reinvested in shares of the Fund. Returns shown do not reflect the deduction of taxes a shareholder would pay on Fund distributions or the redemption of Fund shares.
(e) Not annualized.
(f) Annualized.
(g) Dividend expense totaled 0.58% (annualized), 0.58%, 0.55%, 0.49%, 0.36% and 0.27% of average net assets for the six months ended November 30, 2016 and the years ended May 31, 2016, 2015, 2014, 2013 and 2012, respectively. Interest rebate expense and line of credit interest expense totaled 0.07% (annualized), 0.19%, 0.26%, 0.13%, 0.13% and 0.21% of average net assets for the six months ended November 30, 2016 and the years ended May 31, 2016, 2015, 2014, 2013 and 2012, respectively.
(h) Excluding dividend and interest expenses, the Fund's net expenses after advisory fees waived and expenses reimbursed would have been 1.69% (annualized), 1.69%, 1.69%, 1.69%, 1.69% and 1.69% of average net assets for the six months ended November 30, 2016 and the years ended May 31, 2016, 2015, 2014, 2013 and 2012, respectively.
See Notes to Financial Statements.
www.arbitragefunds.com | 1-800-295-4485
74
Financial Highlights
| Year Ended May 31, 2014 | Year Ended May 31, 2013 | Year Ended May 31, 2012 | |||||||||||||
Net asset value, beginning of period | $ | 9.80 | $ | 9.79 | $ | 10.23 | |||||||||
Income (loss) from investment operations | |||||||||||||||
Net investment income (loss)(a) | 0.10 | 0.15 | 0.10 | ||||||||||||
Net realized and unrealized gains (losses) on investments and foreign currencies | 0.46 | 0.11 | 0.09 | ||||||||||||
Total from investment operations | 0.56 | 0.26 | 0.19 | ||||||||||||
Less distributions | |||||||||||||||
From net investment income | (0.06 | ) | (0.10 | ) | (0.15 | ) | |||||||||
From net realized gains | (0.01 | ) | (0.15 | ) | (0.48 | ) | |||||||||
Total distributions | (0.07 | ) | (0.25 | ) | (0.63 | ) | |||||||||
Proceeds from redemption fees collected(c) | 0.00 | 0.00 | 0.00 | ||||||||||||
Net asset value, end of period | $ | 10.29 | $ | 9.80 | $ | 9.79 | |||||||||
Total return(d) | 5.75 | % | 2.72 | % | 1.88 | % | |||||||||
Net assets, end of period (in 000s) | $ | 204,055 | $ | 10,080 | $ | 8,976 | |||||||||
RATIOS TO AVERAGE NET ASSETS: | |||||||||||||||
Gross expenses(g) | 2.33 | % | 2.55 | % | 2.67 | % | |||||||||
Net expenses after advisory fees waived and expenses reimbursed(g)(h) | 2.31 | % | 2.18 | % | 2.17 | % | |||||||||
Net investment income (loss) | 1.04 | % | 1.58 | % | 1.02 | % | |||||||||
Portfolio turnover rate | 340 | % | 336 | % | 490 | % | |||||||||
Semi-Annual Report | November 30, 2016
75
The Arbitrage Event-Driven Fund – Class I
Selected Per Share Data and Ratios for a Share Outstanding Throughout the Periods Presented:
| Six Months Ended November 30, 2016 (Unaudited) | Year Ended May 31, 2016 | Year Ended May 31, 2015 | |||||||||||||
Net asset value, beginning of period | $ | 9.04 | $ | 9.81 | $ | 10.37 | |||||||||
Income (loss) from investment operations | |||||||||||||||
Net investment income (loss)(a) | (0.03 | )(b) | (0.02 | ) | 0.06 | ||||||||||
Net realized and unrealized gains (losses) on investments and foreign currencies | 0.15 | (0.51 | ) | (0.37 | ) | ||||||||||
Total from investment operations | 0.12 | (0.53 | ) | (0.31 | ) | ||||||||||
Less distributions | |||||||||||||||
From net investment income | — | (0.24 | ) | (0.09 | ) | ||||||||||
From net realized gains | — | (0.00 | )(c) | (0.16 | ) | ||||||||||
Total distributions | — | (0.24 | ) | (0.25 | ) | ||||||||||
Proceeds from redemption fees collected(c) | 0.00 | 0.00 | 0.00 | ||||||||||||
Net asset value, end of period | $ | 9.16 | $ | 9.04 | $ | 9.81 | |||||||||
Total return(d) | 1.33 | %(e) | (5.27 | %) | (2.96 | %) | |||||||||
Net assets, end of period (in 000s) | $ | 76,854 | $ | 95,155 | $ | 390,102 | |||||||||
RATIOS TO AVERAGE NET ASSETS: | |||||||||||||||
Gross expenses(g) | 2.39 | %(f) | 2.37 | % | 2.27 | % | |||||||||
Net expenses after advisory fees waived and expenses reimbursed(g)(h) | 2.09 | %(f) | 2.21 | % | 2.25 | % | |||||||||
Net investment income (loss) | (0.57 | %)(b)(f) | (0.26 | %) | 0.62 | % | |||||||||
Portfolio turnover rate | 199 | %(e) | 350 | % | 451 | % | |||||||||
(a) Per share amounts were calculated using average shares outstanding for the period.
(b) Includes a non-recurring refund for overbilling of prior years' out-of-pocket fees.
(c) Amount rounds to less than $0.01 per share.
(d) Total return is a measure of the change in the value of an investment in the Fund over the years covered, which assumes any dividends or capital gains distributions are reinvested in shares of the Fund. Returns shown do not reflect the deduction of taxes a shareholder would pay on Fund distributions or the redemption of Fund shares.
(e) Not annualized.
(f) Annualized.
(g) Dividend expense totaled 0.58% (annualized), 0.58%, 0.55%, 0.49%, 0.36% and 0.27% of average net assets for the six months ended November 30, 2016 and the years ended May 31, 2016, 2015, 2014, 2013 and 2012, respectively. Interest rebate expense and line of credit interest expense totaled 0.07% (annualized), 0.19%, 0.26%, 0.13%, 0.13% and 0.21% of average net assets for the six months ended November 30, 2016 and the years ended May 31, 2016, 2015, 2014, 2013 and 2012, respectively.
(h) Excluding dividend and interest expenses, the Fund's net expenses after advisory fees waived and expenses reimbursed would have been 1.44% (annualized), 1.44%, 1.44%, 1.44%, 1.44% and 1.44% of average net assets for the six months ended November 30, 2016 and the years ended May 31, 2016, 2015, 2014, 2013 and 2012, respectively.
See Notes to Financial Statements.
www.arbitragefunds.com | 1-800-295-4485
76
Financial Highlights
| Year Ended May 31, 2014 | Year Ended May 31, 2013 | Year Ended May 31, 2012 | |||||||||||||
Net asset value, beginning of period | $ | 9.86 | $ | 9.82 | $ | 10.24 | |||||||||
Income (loss) from investment operations | |||||||||||||||
Net investment income (loss)(a) | 0.13 | 0.16 | 0.12 | ||||||||||||
Net realized and unrealized gains (losses) on investments and foreign currencies | 0.46 | 0.13 | 0.09 | ||||||||||||
Total from investment operations | 0.59 | 0.29 | 0.21 | ||||||||||||
Less distributions | |||||||||||||||
From net investment income | (0.07 | ) | (0.10 | ) | (0.15 | ) | |||||||||
From net realized gains | (0.01 | ) | (0.15 | ) | (0.48 | ) | |||||||||
Total distributions | (0.08 | ) | (0.25 | ) | (0.63 | ) | |||||||||
Proceeds from redemption fees collected(c) | 0.00 | 0.00 | 0.00 | ||||||||||||
Net asset value, end of period | $ | 10.37 | $ | 9.86 | $ | 9.82 | |||||||||
Total return(d) | 6.02 | % | 3.04 | % | 2.09 | % | |||||||||
Net assets, end of period (in 000s) | $ | 290,999 | $ | 41,493 | $ | 21,389 | |||||||||
RATIOS TO AVERAGE NET ASSETS: | |||||||||||||||
Gross expenses(g) | 2.11 | % | 2.31 | % | 2.42 | % | |||||||||
Net expenses after advisory fees waived and expenses reimbursed(g)(h) | 2.06 | % | 1.93 | % | 1.92 | % | |||||||||
Net investment income (loss) | 1.31 | % | 1.68 | % | 1.25 | % | |||||||||
Portfolio turnover rate | 340 | % | 336 | % | 490 | % | |||||||||
Semi-Annual Report | November 30, 2016
77
The Arbitrage Event-Driven Fund – Class C
Selected Per Share Data and Ratios for a Share Outstanding Throughout the Periods Presented:
| Six Months Ended November 30, 2016 (Unaudited) | Year Ended May 31, 2016 | Year Ended May 31, 2015 | |||||||||||||
Net asset value, beginning of period | $ | 8.91 | $ | 9.62 | $ | 10.22 | |||||||||
Income (loss) from investment operations | |||||||||||||||
Net investment income (loss)(b) | (0.07 | )(c) | (0.09 | ) | (0.04 | ) | |||||||||
Net realized and unrealized gains (losses) on investments and foreign currencies | 0.14 | (0.50 | ) | (0.36 | ) | ||||||||||
Total from investment operations | 0.07 | (0.59 | ) | (0.40 | ) | ||||||||||
Less distributions | |||||||||||||||
From net investment income | — | (0.12 | ) | (0.04 | ) | ||||||||||
From net realized gains | — | (0.00 | )(d) | (0.16 | ) | ||||||||||
Total distributions | — | (0.12 | ) | (0.20 | ) | ||||||||||
Net asset value, end of period | $ | 8.98 | $ | 8.91 | $ | 9.62 | |||||||||
Total return(e) | 0.79 | %(f) | (6.14 | %) | (3.95 | %) | |||||||||
Net assets, end of period (in 000s) | $ | 1,836 | $ | 2,538 | $ | 5,020 | |||||||||
RATIOS TO AVERAGE NET ASSETS: | |||||||||||||||
Gross expenses(h) | 3.39 | %(g) | 3.37 | % | 3.27 | % | |||||||||
Net expenses after advisory fees waived and expenses reimbursed(h)(i) | 3.09 | %(g) | 3.21 | % | 3.25 | % | |||||||||
Net investment income (loss) | (1.57 | %)(c)(g) | (0.95 | %) | (0.37 | %) | |||||||||
Portfolio turnover rate | 199 | %(f) | 350 | % | 451 | % | |||||||||
(a) Commenced operations on June 1, 2012.
(b) Per share amounts were calculated using average shares outstanding for the period.
(c) Includes a non-recurring refund for overbilling of prior years' out-of-pocket fees.
(d) Amount rounds to less than $0.01 per share.
(e) Total return is a measure of the change in the value of an investment in the Fund over the years covered, which assumes any dividends or capital gains distributions are reinvested in shares of the Fund. Returns shown do not reflect the deduction of taxes a shareholder would pay on Fund distributions or the redemption of Fund shares.
(f) Not annualized.
(g) Annualized.
(h) Dividend expense totaled 0.58% (annualized), 0.59%, 0.55%, 0.49% and 0.36% of average net assets for the six months ended November 30, 2016 and the years ended May 31, 2016, 2015, 2014 and 2013, respectively. Interest rebate expense and line of credit interest expense totaled 0.07% (annualized), 0.18%, 0.26%, 0.13% and 0.13% of average net assets for the six months ended November 30, 2016 and the years ended May 31, 2016, 2015, 2014 and 2013, respectively.
(i) Excluding dividend and interest expenses, the Fund's net expenses after advisory fees waived and expenses reimbursed would have been 2.44% (annualized), 2.44%, 2.44%, 2.44% and 2.44% of average net assets for the six months ended November 30, 2016 and the years ended May 31, 2016, 2015, 2014, and 2013, respectively.
See Notes to Financial Statements.
www.arbitragefunds.com | 1-800-295-4485
78
Financial Highlights
| Year Ended May 31, 2014 | Year Ended May 31, 2013(a) | ||||||||||
Net asset value, beginning of period | $ | 9.78 | $ | 9.79 | |||||||
Income (loss) from investment operations | |||||||||||
Net investment income (loss)(b) | 0.03 | 0.09 | |||||||||
Net realized and unrealized gains (losses) on investments and foreign currencies | 0.46 | 0.13 | |||||||||
Total from investment operations | 0.49 | 0.22 | |||||||||
Less distributions | |||||||||||
From net investment income | (0.04 | ) | (0.08 | ) | |||||||
From net realized gains | (0.01 | ) | (0.15 | ) | |||||||
Total distributions | (0.05 | ) | (0.23 | ) | |||||||
Net asset value, end of period | $ | 10.22 | $ | 9.78 | |||||||
Total return(e) | 5.05 | % | 2.33 | % | |||||||
Net assets, end of period (in 000s) | $ | 4,232 | $ | 342 | |||||||
RATIOS TO AVERAGE NET ASSETS: | |||||||||||
Gross expenses(h) | 3.12 | % | 3.31 | % | |||||||
Net expenses after advisory fees waived and expenses reimbursed(h)(i) | 3.06 | % | 2.93 | % | |||||||
Net investment income (loss) | 0.32 | % | 0.95 | % | |||||||
Portfolio turnover rate | 340 | % | 336 | % | |||||||
Semi-Annual Report | November 30, 2016
79
The Arbitrage Event-Driven Fund – Class A
Selected Per Share Data and Ratios for a Share Outstanding Throughout the Periods Presented:
| Six Months Ended November 30, 2016 (Unaudited) | Year Ended May 31, 2016 | ||||||||||
Net asset value, beginning of period | $ | 8.98 | $ | 9.73 | |||||||
Income (loss) from investment operations | |||||||||||
Net investment income (loss)(b) | (0.04 | )(c) | (0.03 | ) | |||||||
Net realized and unrealized gains (losses) on investments and foreign currencies | 0.15 | (0.52 | ) | ||||||||
Total from investment operations | 0.11 | (0.55 | ) | ||||||||
Less distributions | |||||||||||
From net investment income | — | (0.20 | ) | ||||||||
From net realized gains | — | (0.00 | )(d) | ||||||||
Total distributions | — | (0.20 | ) | ||||||||
Proceeds from redemption fees collected | — | — | |||||||||
Net asset value, end of period | $ | 9.09 | $ | 8.98 | |||||||
Total return(e) | 1.22 | %(f) | (5.54 | %) | |||||||
Net assets, end of period (in 000s) | $ | 869 | $ | 2,062 | |||||||
RATIOS TO AVERAGE NET ASSETS: | |||||||||||
Gross expenses(h) | 2.64 | %(g) | 2.63 | % | |||||||
Net expenses after advisory fees waived and expenses reimbursed(h)(i) | 2.34 | %(g) | 2.47 | % | |||||||
Net investment income (loss) | (0.77 | %)(c)(g) | (0.28 | %) | |||||||
Portfolio turnover rate | 199 | %(f) | 350 | % | |||||||
(a) Commenced operations on June 1, 2013.
(b) Per share amounts were calculated using average shares outstanding for the period.
(c) Includes a non-recurring refund for overbilling of prior years' out-of-pocket fees.
(d) Amount rounds to less than $0.01 per share.
(e) Total return is a measure of the change in the value of an investment in the Fund over the years covered, which assumes any dividends or capital gains distributions are reinvested in shares of the Fund. Returns shown do not reflect the deduction of taxes a shareholder would pay on Fund distributions or the redemption of Fund shares.
(f) Not annualized.
(g) Annualized.
(h) Dividend expense totaled 0.58% (annualized), 0.59%, 0.55% and 0.49% of average net assets for the six months ended November 30, 2016 and the years ended May 31, 2016, 2015 and 2014, respectively. Interest rebate expense and line of credit interest expense totaled 0.07% (annualized), 0.19%, 0.26% and 0.13% of average net assets for the six months ended November 30, 2016 and the years ended May 31, 2016, 2015 and 2014, respectively.
(i) Excluding dividend and interest expenses, the Fund's net expenses after advisory fees waived and expenses reimbursed would have been 1.69% (annualized), 1.69%, 1.69% and 1.69% of average net assets for the six months ended November 30, 2016 and the years ended May 31, 2016, 2015 and 2014, respectively.
See Notes to Financial Statements.
www.arbitragefunds.com | 1-800-295-4485
80
Financial Highlights
| Year Ended May 31, 2015 | Year Ended May 31, 2014(a) | ||||||||||
Net asset value, beginning of period | $ | 10.30 | $ | 9.80 | |||||||
Income (loss) from investment operations | |||||||||||
Net investment income (loss)(b) | 0.03 | 0.10 | |||||||||
Net realized and unrealized gains (losses) on investments and foreign currencies | (0.36 | ) | 0.47 | ||||||||
Total from investment operations | (0.33 | ) | 0.57 | ||||||||
Less distributions | |||||||||||
From net investment income | (0.08 | ) | (0.06 | ) | |||||||
From net realized gains | (0.16 | ) | (0.01 | ) | |||||||
Total distributions | (0.24 | ) | (0.07 | ) | |||||||
Proceeds from redemption fees collected | — | 0.00 | (d) | ||||||||
Net asset value, end of period | $ | 9.73 | $ | 10.30 | |||||||
Total return(e) | (3.22 | %) | 5.85 | % | |||||||
Net assets, end of period (in 000s) | $ | 5,341 | $ | 3,830 | |||||||
RATIOS TO AVERAGE NET ASSETS: | |||||||||||
Gross expenses(h) | 2.52 | % | 2.36 | % | |||||||
Net expenses after advisory fees waived and expenses reimbursed(h)(i) | 2.50 | % | 2.31 | % | |||||||
Net investment income (loss) | 0.35 | % | 0.98 | % | |||||||
Portfolio turnover rate | 451 | % | 340 | % | |||||||
Semi-Annual Report | November 30, 2016
81
The Arbitrage Credit Opportunities Fund – Class R
Selected Per Share Data and Ratios for a Share Outstanding Throughout the Periods Presented:
| Six Months Ended November 30, 2016 (Unaudited) | Year Ended May 31, 2016 | Year Ended May 31, 2015 | |||||||||||||
Net asset value, beginning of period | $ | 9.69 | $ | 9.95 | $ | 10.28 | |||||||||
Income (loss) from investment operations | |||||||||||||||
Net investment income(b) | 0.10 | (c) | 0.25 | 0.28 | |||||||||||
Net realized and unrealized gains (losses) on investments and foreign currencies | 0.11 | (0.24 | ) | (0.29 | ) | ||||||||||
Total from investment operations | 0.21 | 0.01 | (0.01 | ) | |||||||||||
Less distributions | |||||||||||||||
From net investment income | (0.08 | ) | (0.27 | ) | (0.32 | ) | |||||||||
Total distributions | (0.08 | ) | (0.27 | ) | (0.32 | ) | |||||||||
Proceeds from redemption fees collected | — | — | 0.00 | (d) | |||||||||||
Net asset value, end of period | $ | 9.82 | $ | 9.69 | $ | 9.95 | |||||||||
Total return(e) | 2.13 | %(f) | 0.10 | % | (0.10 | %) | |||||||||
Net assets, end of period (in 000s) | $ | 12,320 | $ | 12,426 | $ | 22,728 | |||||||||
RATIOS TO AVERAGE NET ASSETS: | |||||||||||||||
Gross expenses(h) | 1.93 | %(g) | 1.92 | % | 2.27 | % | |||||||||
Net expenses after advisory fees waived and expenses reimbursed(h)(i) | 1.62 | %(g) | 1.67 | % | 2.03 | % | |||||||||
Net investment income | 2.00 | %(c)(g) | 2.62 | % | 2.84 | % | |||||||||
Portfolio turnover rate | 124 | %(f) | 181 | % | 191 | % | |||||||||
(a) Commenced operations on October 1, 2012.
(b) Per share amounts were calculated using average shares outstanding for the period.
(c) Includes a non-recurring refund for overbilling of prior years' out-of-pocket fees.
(d) Amount rounds to less than $0.01 per share.
(e) Total return is a measure of the change in the value of an investment in the Fund over the years covered, which assumes any dividends or capital gains distributions are reinvested in shares of the Fund. Returns shown do not reflect the deduction of taxes a shareholder would pay on Fund distributions or the redemption of Fund shares.
(f) Not annualized.
(g) Annualized.
(h) Dividend expense totaled 0.07% (annualized), 0.03%, 0.06%, 0.10% and 0.03% (annualized) of average net assets for the six months ended November 30, 2016 and the years ended May 31, 2016, 2015, 2014 and the period ended May 31, 2013, respectively. Interest rebate expense and line of credit interest expense totaled 0.05% (annualized), 0.14%, 0.47%, 0.07% and 0.02% (annualized) of average net assets for the six months ended November 30, 2016 and the years ended May 31, 2016, 2015, 2014 and the period ended May 31, 2013, respectively.
(i) Excluding dividend and interest expenses, the Fund's net expenses after advisory fees waived and expenses reimbursed would have been 1.50% (annualized), 1.50%, 1.50%, 1.50% and 1.50% (annualized) of average net assets for the six months ended November 30, 2016 and the years ended May 31, 2016, 2015, 2014 and the period ended May 31, 2013, respectively.
See Notes to Financial Statements.
www.arbitragefunds.com | 1-800-295-4485
82
Financial Highlights
| Year Ended May 31, 2014 | Year Ended May 31, 2013(a) | ||||||||||
Net asset value, beginning of period | $ | 10.18 | $ | 10.00 | |||||||
Income (loss) from investment operations | |||||||||||
Net investment income(b) | 0.40 | 0.17 | |||||||||
Net realized and unrealized gains (losses) on investments and foreign currencies | 0.08 | 0.06 | |||||||||
Total from investment operations | 0.48 | 0.23 | |||||||||
Less distributions | |||||||||||
From net investment income | (0.39 | ) | (0.05 | ) | |||||||
Total distributions | (0.39 | ) | (0.05 | ) | |||||||
Proceeds from redemption fees collected | 0.01 | 0.00 | (d) | ||||||||
Net asset value, end of period | $ | 10.28 | $ | 10.18 | |||||||
Total return(e) | 4.99 | % | 2.33 | %(f) | |||||||
Net assets, end of period (in 000s) | $ | 6,393 | $ | 1,671 | |||||||
RATIOS TO AVERAGE NET ASSETS: | |||||||||||
Gross expenses(h) | 2.71 | % | 3.79 | %(g) | |||||||
Net expenses after advisory fees waived and expenses reimbursed(h)(i) | 1.67 | % | 1.55 | %(g) | |||||||
Net investment income | 3.97 | % | 2.49 | %(g) | |||||||
Portfolio turnover rate | 181 | % | 92 | %(f) | |||||||
Semi-Annual Report | November 30, 2016
83
The Arbitrage Credit Opportunities Fund – Class I
Selected Per Share Data and Ratios for a Share Outstanding Throughout the Periods Presented:
| Six Months Ended November 30, 2016 (Unaudited) | Year Ended May 31, 2016 | Year Ended May 31, 2015 | |||||||||||||
Net asset value, beginning of period | $ | 9.67 | $ | 9.93 | $ | 10.25 | |||||||||
Income (loss) from investment operations | |||||||||||||||
Net investment income(b) | 0.11 | (c) | 0.27 | 0.33 | |||||||||||
Net realized and unrealized gains (losses) on investments and foreign currencies | 0.11 | (0.24 | ) | (0.31 | ) | ||||||||||
Total from investment operations | 0.22 | 0.03 | 0.02 | ||||||||||||
Less distributions | |||||||||||||||
From net investment income | (0.09 | ) | (0.29 | ) | (0.34 | ) | |||||||||
Total distributions | (0.09 | ) | (0.29 | ) | (0.34 | ) | |||||||||
Proceeds from redemption fees collected | — | — | 0.00 | (d) | |||||||||||
Net asset value, end of period | $ | 9.80 | $ | 9.67 | $ | 9.93 | |||||||||
Total return(e) | 2.26 | %(f) | 0.30 | % | 0.16 | % | |||||||||
Net assets, end of period (in 000s) | $ | 41,667 | $ | 41,992 | $ | 46,118 | |||||||||
RATIOS TO AVERAGE NET ASSETS: | |||||||||||||||
Gross expenses(h) | 1.68 | %(g) | 1.68 | % | 2.04 | % | |||||||||
Net expenses after advisory fees waived and expenses reimbursed(h)(i) | 1.37 | %(g) | 1.43 | % | 1.78 | % | |||||||||
Net investment income | 2.25 | %(c)(g) | 2.84 | % | 3.28 | % | |||||||||
Portfolio turnover rate | 124 | %(f) | 181 | % | 191 | % | |||||||||
(a) Commenced operations on October 1, 2012.
(b) Per share amounts were calculated using average shares outstanding for the period.
(c) Includes a non-recurring refund for overbilling of prior years' out-of-pocket fees.
(d) Amount rounds to less than $0.01 per share.
(e) Total return is a measure of the change in the value of an investment in the Fund over the years covered, which assumes any dividends or capital gains distributions are reinvested in shares of the Fund. Returns shown do not reflect the deduction of taxes a shareholder would pay on Fund distributions or the redemption of Fund shares.
(f) Not annualized.
(g) Annualized.
(h) Dividend expense totaled 0.07% (annualized), 0.04%, 0.06% and 0.10%, 0.03% (annualized) of average net assets for the six months ended November 30, 2016 and the years ended May 31, 2016, 2015 and 2014 and the period ended May 31, 2013, respectively. Interest rebate expense and line of credit interest expense totaled 0.05% (annualized), 0.14%, 0.47%, 0.07% and 0.01% (annualized) of average net assets for the six months ended November 30, 2016 and the years ended May 31, 2016, 2015 and 2014 and the period ended May 31, 2013, respectively.
(i) Excluding dividend and interest expenses, the Fund's net expenses after advisory fees waived and expenses reimbursed would have been 1.25% (annualized), 1.25%, 1.25%, 1.25% and 1.25% (annualized) of average net assets for the six months ended November 30, 2016 and the years ended May 31, 2016, 2015, 2014 and the period ended May 31, 2013, respectively.
See Notes to Financial Statements.
www.arbitragefunds.com | 1-800-295-4485
84
Financial Highlights
| Year Ended May 31, 2014 | Year Ended May 31, 2013(a) | ||||||||||
Net asset value, beginning of period | $ | 10.16 | $ | 10.00 | |||||||
Income (loss) from investment operations | |||||||||||
Net investment income(b) | 0.42 | 0.17 | |||||||||
Net realized and unrealized gains (losses) on investments and foreign currencies | 0.08 | 0.08 | |||||||||
Total from investment operations | 0.50 | 0.25 | |||||||||
Less distributions | |||||||||||
From net investment income | (0.41 | ) | (0.09 | ) | |||||||
Total distributions | (0.41 | ) | (0.09 | ) | |||||||
Proceeds from redemption fees collected | 0.00 | (d) | — | ||||||||
Net asset value, end of period | $ | 10.25 | $ | 10.16 | |||||||
Total return(e) | 5.08 | % | 2.49 | %(f) | |||||||
Net assets, end of period (in 000s) | $ | 23,039 | $ | 3,462 | |||||||
RATIOS TO AVERAGE NET ASSETS: | |||||||||||
Gross expenses(h) | 2.37 | % | 3.64 | %(g) | |||||||
Net expenses after advisory fees waived and expenses reimbursed(h)(i) | 1.42 | % | 1.29 | %(g) | |||||||
Net investment income | 4.16 | % | 2.62 | %(g) | |||||||
Portfolio turnover rate | 181 | % | 92 | %(f) | |||||||
Semi-Annual Report | November 30, 2016
85
The Arbitrage Credit Opportunities Fund – Class C
Selected Per Share Data and Ratios for a Share Outstanding Throughout the Periods Presented:
| Six Months Ended November 30, 2016 (Unaudited) | Year Ended May 31, 2016 | Year Ended May 31, 2015 | |||||||||||||
Net asset value, beginning of period | $ | 9.61 | $ | 9.89 | $ | 10.23 | |||||||||
Income (loss) from investment operations | |||||||||||||||
Net investment income(b) | 0.49 | (c) | 0.18 | 0.22 | |||||||||||
Net realized and unrealized gains (losses) on investments and foreign currencies | (0.32 | )(d) | (0.25 | ) | (0.30 | ) | |||||||||
Total from investment operations | 0.17 | (0.07 | ) | (0.08 | ) | ||||||||||
Less distributions | |||||||||||||||
From net investment income | (0.03 | ) | (0.21 | ) | (0.26 | ) | |||||||||
Total distributions | (0.03 | ) | (0.21 | ) | (0.26 | ) | |||||||||
Net asset value, end of period | $ | 9.75 | $ | 9.61 | $ | 9.89 | |||||||||
Total return(e) | 1.76 | %(f) | (0.72 | %) | (0.76 | %) | |||||||||
Net assets, end of period (in 000s) | $ | 778 | $ | 1,220 | $ | 2,020 | |||||||||
RATIOS TO AVERAGE NET ASSETS: | |||||||||||||||
Gross expenses(h) | 2.68 | %(g) | 2.68 | % | 3.05 | % | |||||||||
Net expenses after advisory fees waived and expenses reimbursed(h)(i) | 2.37 | %(g) | 2.43 | % | 2.78 | % | |||||||||
Net investment income | 1.21 | %(c)(g) | 1.92 | % | 2.24 | % | |||||||||
Portfolio turnover rate | 124 | %(f) | 181 | % | 191 | % | |||||||||
(a) Commenced operations on October 1, 2012.
(b) Per share amounts were calculated using average shares outstanding for the period.
(c) Includes a non-recurring refund for overbilling of prior years' out-of-pocket fees.
(d) The amount shown for a share outstanding throughout the period may not correlate with the Statement of Operations for the period due to timing of sales and redemptions of Fund shares in relation to income earned and/or fluctuating market value of the investments of the Fund.
(e) Total return is a measure of the change in the value of an investment in the Fund over the years covered, which assumes any dividends or capital gains distributions are reinvested in shares of the Fund. Returns shown do not reflect the deduction of taxes a shareholder would pay on Fund distributions or the redemption of Fund shares.
(f) Not annualized.
(g) Annualized.
(h) Dividend expense totaled 0.07% (annualized), 0.04%, 0.06%, 0.10% and 0.03% (annualized) of average net assets for the six months ended November 30, 2016 and the years ended May 31, 2016, 2015, 2014 and the period ended May 31, 2013, respectively. Interest rebate expense and line of credit interest expense totaled 0.05% (annualized), 0.14%, 0.47%, 0.07% and 0.01% (annualized) of average net assets for the six months ended November 30, 2016 and the years ended May 31, 2016, 2015, 2014 and the period ended May 31, 2013, respectively.
(i) Excluding dividend and interest expenses, the Fund's net expenses after advisory fees waived and expenses reimbursed would have been 2.25% (annualized), 2.25%, 2.25%, 2.25% and 2.25% (annualized) of average net assets for the six months ended November 30, 2016 and the years ended May 31, 2016, 2015, 2014 and the period ended May 31, 2013, respectively.
See Notes to Financial Statements.
www.arbitragefunds.com | 1-800-295-4485
86
Financial Highlights
| Year Ended May 31, 2014 | Year Ended May 31, 2013(a) | ||||||||||
Net asset value, beginning of period | $ | 10.17 | $ | 10.00 | |||||||
Income (loss) from investment operations | |||||||||||
Net investment income(b) | 0.34 | 0.11 | |||||||||
Net realized and unrealized gains (losses) on investments and foreign currencies | 0.07 | 0.09 | |||||||||
Total from investment operations | 0.41 | 0.20 | |||||||||
Less distributions | |||||||||||
From net investment income | (0.35 | ) | (0.03 | ) | |||||||
Total distributions | (0.35 | ) | (0.03 | ) | |||||||
Net asset value, end of period | $ | 10.23 | $ | 10.17 | |||||||
Total return(e) | 4.17 | % | 2.01 | %(f) | |||||||
Net assets, end of period (in 000s) | $ | 716 | $ | 26 | |||||||
RATIOS TO AVERAGE NET ASSETS: | |||||||||||
Gross expenses(h) | 3.37 | % | 4.69 | %(g) | |||||||
Net expenses after advisory fees waived and expenses reimbursed(h)(i) | 2.42 | % | 2.30 | %(g) | |||||||
Net investment income | 3.37 | % | 1.58 | %(g) | |||||||
Portfolio turnover rate | 181 | % | 92 | %(f) | |||||||
Semi-Annual Report | November 30, 2016
87
The Arbitrage Credit Opportunities Fund – Class A
Selected Per Share Data and Ratios for a Share Outstanding Throughout the Periods Presented:
| Six Months Ended November 30, 2016 (Unaudited) | Year Ended May 31, 2016 | ||||||||||
Net asset value, beginning of period | $ | 9.67 | $ | 9.93 | |||||||
Income (loss) from investment operations | |||||||||||
Net investment income(b) | 0.01 | (c) | 0.25 | ||||||||
Net realized and unrealized gains (losses) on investments and foreign currencies | 0.20 | (0.25 | ) | ||||||||
Total from investment operations | 0.21 | — | |||||||||
Less distributions | |||||||||||
From net investment income | (0.08 | ) | (0.26 | ) | |||||||
Total distributions | (0.08 | ) | (0.26 | ) | |||||||
Net asset value, end of period | $ | 9.80 | $ | 9.67 | |||||||
Total return(d) | 2.14 | %(e) | 0.02 | % | |||||||
Net assets, end of period (in 000s) | $ | 112 | $ | 104 | |||||||
RATIOS TO AVERAGE NET ASSETS: | |||||||||||
Gross expenses(g) | 1.93 | %(f) | 1.91 | % | |||||||
Net expenses after advisory fees waived and expenses reimbursed(g)(h) | 1.62 | %(f) | 1.66 | % | |||||||
Net investment income | 2.02 | %(c)(f) | 2.62 | % | |||||||
Portfolio turnover rate | 124 | %(e) | 181 | % | |||||||
(a) Commenced operations on June 1, 2013.
(b) Per share amounts were calculated using average shares outstanding for the period.
(c) Includes a non-recurring refund for overbilling of prior years' out-of-pocket fees.
(d) Total return is a measure of the change in the value of an investment in the Fund over the years covered, which assumes any dividends or capital gains distributions are reinvested in shares of the Fund. Returns shown do not reflect the deduction of taxes a shareholder would pay on Fund distributions or the redemption of Fund shares.
(e) Not annualized.
(f) Annualized.
(g) Dividend expense totaled 0.07% (annualized), 0.02%, 0.06% and 0.10% of average net assets for the six months ended November 30, 2016 and the years ended May 31, 2016, 2015 and 2014, respectively. Interest rebate expense and line of credit interest expense totaled 0.05% (annualized), 0.14%, 0.47% and 0.07% of average net assets for the six months ended November 30, 2016 and the years ended May 31, 2016, 2015 and 2014, respectively.
(h) Excluding dividend and interest expenses, the Fund's net expenses after advisory fees waived and expenses reimbursed would have been 1.50% (annualized), 1.50%, 1.50% and 1.50% of average net assets for the six months ended November 30, 2016 and the years ended May 31, 2016, 2015 and 2014, respectively.
See Notes to Financial Statements.
www.arbitragefunds.com | 1-800-295-4485
88
Financial Highlights
| Year Ended May 31, 2015 | Year Ended May 31, 2014(a) | ||||||||||
Net asset value, beginning of period | $ | 10.25 | $ | 10.18 | |||||||
Income (loss) from investment operations | |||||||||||
Net investment income(b) | 0.29 | 0.39 | |||||||||
Net realized and unrealized gains (losses) on investments and foreign currencies | (0.29 | ) | 0.09 | ||||||||
Total from investment operations | — | 0.48 | |||||||||
Less distributions | |||||||||||
From net investment income | (0.32 | ) | (0.41 | ) | |||||||
Total distributions | (0.32 | ) | (0.41 | ) | |||||||
Net asset value, end of period | $ | 9.93 | $ | 10.25 | |||||||
Total return(d) | (0.01 | %) | 4.86 | % | |||||||
Net assets, end of period (in 000s) | $ | 630 | $ | 28 | |||||||
RATIOS TO AVERAGE NET ASSETS: | |||||||||||
Gross expenses(g) | 2.29 | % | 2.77 | % | |||||||
Net expenses after advisory fees waived and expenses reimbursed(g)(h) | 2.03 | % | 1.67 | % | |||||||
Net investment income | 2.95 | % | 3.89 | % | |||||||
Portfolio turnover rate | 191 | % | 181 | % | |||||||
Semi-Annual Report | November 30, 2016
89
The Arbitrage Tactical Equity Fund – Class R
Selected Per Share Data and Ratios for a Share Outstanding Throughout the Periods Presented:
| Six Months Ended November 30, 2016 (Unaudited) | Year Ended May 31, 2016 | ||||||||||
Net asset value, beginning of period | $ | 9.31 | $ | 10.12 | |||||||
Income (loss) from investment operations | |||||||||||
Net investment loss(b) | (0.08 | )(c) | (0.03 | ) | |||||||
Net realized and unrealized gains (losses) on investments and foreign currencies | 0.14 | (0.69 | ) | ||||||||
Total from investment operations | 0.06 | (0.72 | ) | ||||||||
Less distributions | |||||||||||
From net realized gains | — | (0.09 | ) | ||||||||
Total distributions | — | (0.09 | ) | ||||||||
Net asset value, end of period | $ | 9.37 | $ | 9.31 | |||||||
Total return(d) | 0.75 | %(e) | (7.12 | )% | |||||||
Net assets, end of period (in 000s) | $ | 9 | $ | 9 | |||||||
RATIOS TO AVERAGE NET ASSETS: | |||||||||||
Gross expenses(g) | 15.79 | %(f) | 20.24 | % | |||||||
Net expenses after advisory fees waived and expenses reimbursed(g)(h) | 2.57 | %(f) | 2.62 | % | |||||||
Net investment loss | (1.65 | %)(c)(f) | (0.34 | %) | |||||||
Portfolio turnover rate | 178 | %(e) | 416 | % | |||||||
(a) Commenced operations on January 2, 2015.
(b) Per share amounts were calculated using average shares outstanding for the period.
(c) Includes a non-recurring refund for overbilling of prior years' out-of-pocket fees.
(d) Total return is a measure of the change in the value of an investment in the Fund over the years covered, which assumes any dividends or capital gains distributions are reinvested in shares of the Fund. Returns shown do not reflect the deduction of taxes a shareholder would pay on Fund distributions or the redemption of Fund shares.
(e) Not annualized.
(f) Annualized.
(g) Dividend expense totaled 0.73% (annualized), 0.70% and 1.01% (annualized) of average net assets for six months ended November 30, 2016 and the year ended May 31, 2016 and the period ended May 31, 2015, respectively. Interest rebate expense and line of credit interest expense totaled 0.15% (annualized), 0.23% and 0.15% (annualized) of average net assets for the six months ended November 30, 2016 and the year ended May 31, 2016 and the period ended May 31, 2015, respectively.
(h) Excluding dividend and interest expenses, the Fund's net expenses after advisory fees waived and expenses reimbursed would have been 1.69% (annualized), 1.69% and 1.69% (annualized) of average net assets for the six months ended November 30, 2016 and the year ended May 31, 2016 and the period ended May 31, 2015, respectively.
See Notes to Financial Statements.
www.arbitragefunds.com | 1-800-295-4485
90
Financial Highlights
| Period Ended May 31, 2015(a) | |||||||
Net asset value, beginning of period | $ | 10.00 | |||||
Income (loss) from investment operations | |||||||
Net investment loss(b) | (0.10 | ) | |||||
Net realized and unrealized gains (losses) on investments and foreign currencies | 0.22 | ||||||
Total from investment operations | 0.12 | ||||||
Less distributions | |||||||
From net realized gains | — | ||||||
Total distributions | — | ||||||
Net asset value, end of period | $ | 10.12 | |||||
Total return(d) | 1.20 | %(e) | |||||
Net assets, end of period (in 000s) | $ | 10 | |||||
RATIOS TO AVERAGE NET ASSETS: | |||||||
Gross expenses(g) | 44.48 | %(f) | |||||
Net expenses after advisory fees waived and expenses reimbursed(g)(h) | 2.85 | %(f) | |||||
Net investment loss | (2.35 | %)(f) | |||||
Portfolio turnover rate | 235 | %(e) | |||||
Semi-Annual Report | November 30, 2016
91
The Arbitrage Tactical Equity Fund – Class I
Selected Per Share Data and Ratios for a Share Outstanding Throughout the Periods Presented:
| Six Months Ended November 30, 2016 (Unaudited) | Year Ended May 31, 2016 | ||||||||||
Net asset value, beginning of period | $ | 9.31 | $ | 10.12 | |||||||
Income (loss) from investment operations | |||||||||||
Net investment loss(b) | (0.07 | )(c) | �� | (0.04 | ) | ||||||
Net realized and unrealized gains (losses) on investments and foreign currencies | 0.14 | (0.68 | ) | ||||||||
Total from investment operations | 0.07 | (0.72 | ) | ||||||||
Less distributions | |||||||||||
From net realized gains | — | (0.09 | ) | ||||||||
Total distributions | — | (0.09 | ) | ||||||||
Net asset value, end of period | $ | 9.38 | $ | 9.31 | |||||||
Total return(d) | 0.75 | %(e) | (7.12 | )% | |||||||
Net assets, end of period (in 000s) | $ | 1,570 | $ | 1,302 | |||||||
RATIOS TO AVERAGE NET ASSETS: | |||||||||||
Gross expenses(g) | 15.53 | %(f) | 20.02 | % | |||||||
Net expenses after advisory fees waived and expenses reimbursed(g)(h) | 2.31 | %(f) | 2.40 | % | |||||||
Net investment loss | (1.40 | %)(c)(f) | (0.47 | %) | |||||||
Portfolio turnover rate | 178 | %(e) | 416 | % | |||||||
(a) Commenced operations on January 2, 2015.
(b) Per share amounts were calculated using average shares outstanding for the period.
(c) Includes a non-recurring refund for overbilling of prior years' out-of-pocket fees.
(d) Total return is a measure of the change in the value of an investment in the Fund over the years covered, which assumes any dividends or capital gains distributions are reinvested in shares of the Fund. Returns shown do not reflect the deduction of taxes a shareholder would pay on Fund distributions or the redemption of Fund shares.
(e) Not annualized.
(f) Annualized.
(g) Dividend expense totaled 0.74% (annualized), 0.72% and 1.01% (annualized) of average net assets for the six months ended November 30, 2016 and the year ended May 31, 2016 and the period ended May 31, 2015, respectively. Interest rebate expense and line of credit interest expense totaled 0.13% (annualized), 0.24% and 0.15% (annualized) of average net assets for the six months ended November 30, 2016 and the year ended May 31, 2016 and the period ended May 31, 2015, respectively.
(h) Excluding dividend and interest expenses, the Fund's net expenses after advisory fees waived and expenses reimbursed would have been 1.44% (annualized), 1.44% and 1.44% (annualized) of average net assets for the six months ended November 30, 2016 and the year ended May 31, 2016 and the period ended May 31, 2015, respectively.
See Notes to Financial Statements.
www.arbitragefunds.com | 1-800-295-4485
92
Financial Highlights
| Period Ended May 31, 2015(a) | |||||||
Net asset value, beginning of period | $ | 10.00 | |||||
Income (loss) from investment operations | |||||||
Net investment loss(b) | (0.09 | ) | |||||
Net realized and unrealized gains (losses) on investments and foreign currencies | 0.21 | ||||||
Total from investment operations | 0.12 | ||||||
Less distributions | |||||||
From net realized gains | — | ||||||
Total distributions | — | ||||||
Net asset value, end of period | $ | 10.12 | |||||
Total return(d) | 1.20 | %(e) | |||||
Net assets, end of period (in 000s) | $ | 1,386 | |||||
RATIOS TO AVERAGE NET ASSETS: | |||||||
Gross expenses(g) | 28.08 | %(f) | |||||
Net expenses after advisory fees waived and expenses reimbursed(g)(h) | 2.60 | %(f) | |||||
Net investment loss | (2.15 | %)(f) | |||||
Portfolio turnover rate | 235 | %(e) | |||||
Semi-Annual Report | November 30, 2016
93
The Arbitrage Tactical Equity Fund – Class C
Selected Per Share Data and Ratios for a Share Outstanding Throughout the Periods Presented:
| Six Months Ended November 30, 2016 (Unaudited) | Year Ended May 31, 2016 | ||||||||||
Net asset value, beginning of period | $ | 9.31 | $ | 10.12 | |||||||
Income (loss) from investment operations | |||||||||||
Net investment loss(b) | (0.11 | )(c) | (0.10 | ) | |||||||
Net realized and unrealized gains (losses) on investments and foreign currencies | 0.17 | (0.62 | ) | ||||||||
Total from investment operations | 0.06 | (0.72 | ) | ||||||||
Less distributions | |||||||||||
From net realized gains | — | (0.09 | ) | ||||||||
Total distributions | — | (0.09 | ) | ||||||||
Net asset value, end of period | $ | 9.37 | $ | 9.31 | |||||||
Total return(d) | 0.75 | %(e) | (7.12 | )% | |||||||
Net assets, end of period (in 000s) | $ | 9 | $ | 9 | |||||||
RATIOS TO AVERAGE NET ASSETS: | |||||||||||
Gross expenses(g) | 16.54 | %(f) | 20.99 | % | |||||||
Net expenses after advisory fees waived and expenses reimbursed(g)(h) | 3.32 | %(f) | 3.37 | % | |||||||
Net investment loss | (2.41 | %)(c)(f) | (1.09 | %) | |||||||
Portfolio turnover rate | 178 | %(e) | 416 | % | |||||||
(a) Commenced operations on January 2, 2015.
(b) Per share amounts were calculated using average shares outstanding for the period.
(c) Includes a non-recurring refund for overbilling of prior years' out-of-pocket fees.
(d) Total return is a measure of the change in the value of an investment in the Fund over the years covered, which assumes any dividends or capital gains distributions are reinvested in shares of the Fund. Returns shown do not reflect the deduction of taxes a shareholder would pay on Fund distributions or the redemption of Fund shares.
(e) Not annualized.
(f) Annualized.
(g) Dividend expense totaled 0.73% (annualized), 0.70% and 1.01% (annualized) of average net assets for the six months ended November 30, 2016 and the year ended May 31, 2016 and the period ended May 31, 2015, respectively. Interest rebate expense and line of credit interest expense totaled 0.15% (annualized), 0.23% and 0.15% (annualized) of average net assets for the six months ended November 30, 2016 and the year ended May 31, 2016 and the period ended May 31, 2015, respectively.
(h) Excluding dividend and interest expenses, the Fund's net expenses after advisory fees waived and expenses reimbursed would have been 2.44% (annualized), 2.44% and 2.44% (annualized) of average net assets for the six months ended November 30, 2016 and the year ended May 31, 2016 and the period ended May 31, 2015, respectively.
See Notes to Financial Statements.
www.arbitragefunds.com | 1-800-295-4485
94
Financial Highlights
| Period Ended May 31, 2015(a) | |||||||
Net asset value, beginning of period | $ | 10.00 | |||||
Income (loss) from investment operations | |||||||
Net investment loss(b) | (0.13 | ) | |||||
Net realized and unrealized gains (losses) on investments and foreign currencies | 0.25 | ||||||
Total from investment operations | 0.12 | ||||||
Less distributions | |||||||
From net realized gains | — | ||||||
Total distributions | — | ||||||
Net asset value, end of period | $ | 10.12 | |||||
Total return(d) | 1.20 | %(e) | |||||
Net assets, end of period (in 000s) | $ | 10 | |||||
RATIOS TO AVERAGE NET ASSETS: | |||||||
Gross expenses(g) | 45.25 | %(f) | |||||
Net expenses after advisory fees waived and expenses reimbursed(g)(h) | 3.60 | %(f) | |||||
Net investment loss | (3.10 | %)(f) | |||||
Portfolio turnover rate | 235 | %(e) | |||||
Semi-Annual Report | November 30, 2016
95
The Arbitrage Tactical Equity Fund – Class A
Selected Per Share Data and Ratios for a Share Outstanding Throughout the Periods Presented:
| Six Months Ended November 30, 2016 (Unaudited) | Year Ended May 31, 2016 | ||||||||||
Net asset value, beginning of period | $ | 9.31 | $ | 10.12 | |||||||
Income (loss) from investment operations | |||||||||||
Net investment loss(b) | (0.08 | )(c) | (0.03 | ) | |||||||
Net realized and unrealized gains (losses) on investments and foreign currencies | 0.14 | (0.69 | ) | ||||||||
Total from investment operations | 0.06 | (0.72 | ) | ||||||||
Less distributions | |||||||||||
From net realized gains | — | (0.09 | ) | ||||||||
Total distributions | — | (0.09 | ) | ||||||||
Net asset value, end of period | $ | 9.37 | $ | 9.31 | |||||||
Total return(d) | 0.75 | %(e) | (7.12 | )% | |||||||
Net assets, end of period (in 000s) | $ | 9 | $ | 9 | |||||||
RATIOS TO AVERAGE NET ASSETS: | |||||||||||
Gross expenses(g) | 15.79 | %(f) | 20.24 | % | |||||||
Net expenses after advisory fees waived and expenses reimbursed(g)(h) | 2.57 | %(f) | 2.62 | % | |||||||
Net investment loss | (1.68 | %)(c)(f) | (0.34 | %) | |||||||
Portfolio turnover rate | 178 | %(e) | 416 | % | |||||||
(a) Commenced operations on January 2, 2015.
(b) Per share amounts were calculated using average shares outstanding for the period.
(c) Includes a non-recurring refund for overbilling of prior years' out-of-pocket fees.
(d) Total return is a measure of the change in the value of an investment in the Fund over the years covered, which assumes any dividends or capital gains distributions are reinvested in shares of the Fund. Returns shown do not reflect the deduction of taxes a shareholder would pay on Fund distributions or the redemption of Fund shares.
(e) Not annualized.
(f) Annualized.
(g) Dividend expense totaled 0.73% (annualized), 0.70% and 1.01% (annualized) of average net assets for the six months ended November 30, 2016 and the year ended ended May 31, 2016 and the period ended May 31, 2015, respectively. Interest rebate expense and line of credit interest expense totaled 0.15% (annualized), 0.23% and 0.15% (annualized) of average net assets for the six months ended November 30, 2016 and the year ended May 31, 2016 and the period ended May 31, 2015, respectively.
(h) Excluding dividend and interest expenses, the Fund's net expenses after advisory fees waived and expenses reimbursed would have been 1.69% (annualized), 1.69% and 1.69% (annualized) of average net assets for the six months ended November 30, 2016 and the year ended May 31, 2016 and the period ended May 31, 2015, respectively.
See Notes to Financial Statements.
www.arbitragefunds.com | 1-800-295-4485
96
Financial Highlights
| Period Ended May 31, 2015(a) | |||||||
Net asset value, beginning of period | $ | 10.00 | |||||
Income (loss) from investment operations | |||||||
Net investment loss(b) | (0.10 | ) | |||||
Net realized and unrealized gains (losses) on investments and foreign currencies | 0.22 | ||||||
Total from investment operations | 0.12 | ||||||
Less distributions | |||||||
From net realized gains | — | ||||||
Total distributions | — | ||||||
Net asset value, end of period | $ | 10.12 | |||||
Total return(d) | 1.20 | %(e) | |||||
Net assets, end of period (in 000s) | $ | 10 | |||||
RATIOS TO AVERAGE NET ASSETS: | |||||||
Gross expenses(g) | 44.49 | %(f) | |||||
Net expenses after advisory fees waived and expenses reimbursed(g)(h) | 2.85 | %(f) | |||||
Net investment loss | (2.35 | %)(f) | |||||
Portfolio turnover rate | 235 | %(e) | |||||
Semi-Annual Report | November 30, 2016
97
The Arbitrage Funds Notes to Financial Statements
November 30, 2016 (Unaudited)
1. ORGANIZATION
The Arbitrage Funds (the "Trust") is a Delaware statutory trust, which was organized on December 22, 1999 and is registered under the Investment Company Act of 1940, as amended (the "1940 Act"), as an open-end management investment company issuing its shares in series, each series representing a distinct portfolio with its own investment objective and policies. The four series presently authorized are The Arbitrage Fund (the "Arbitrage Fund"), The Arbitrage Event-Driven Fund (the "Event-Driven Fund"), The Arbitrage Credit Opportunities Fund (the "Credit Opportunities Fund") and The Arbitrage Tactical Equity Fund (the "Tactical Equity Fund"), each a "Fund" and collectively the "Funds", which offer four classes of shares. The Arbitrage Fund, the Event-Driven Fund and the Credit Opportunities Fund are each a diversified series of the Trust. The Tactical Equity Fund is a non-diversified series of the trust. The Funds' investments are managed by Water Island Capital, LLC (the "Adviser").
Fund | Commencement of Operations | ||||||
Arbitrage Fund | |||||||
Class R shares | September 18, 2000 | ||||||
Class I shares | October 17, 2003 | ||||||
Class C shares | June 1, 2012 | ||||||
Class A shares | June 1, 2013 | ||||||
Event-Driven Fund | |||||||
Class R shares | October 1, 2010 | ||||||
Class I shares | October 1, 2010 | ||||||
Class C shares | June 1, 2012 | ||||||
Class A shares | June 1, 2013 | ||||||
Credit Opportunities Fund | |||||||
Class R shares | October 1, 2012 | ||||||
Class I shares | October 1, 2012 | ||||||
Class C shares | October 1, 2012 | ||||||
Class A shares | June 1, 2013 | ||||||
Tactical Equity Fund | |||||||
Class R shares | January 2, 2015 | ||||||
Class I shares | January 2, 2015 | ||||||
Class C shares | January 2, 2015 | ||||||
Class A shares | January 2, 2015 | ||||||
The investment objective of the Arbitrage Fund seeks to achieve capital growth by engaging in merger arbitrage. The investment objective of the Event-Driven Fund seeks to achieve capital growth by investing in companies that are impacted by corporate events such as mergers, acquisitions, restructurings, recapitalizations, refinancings, reorganizations and other special situations. The investment objective of the Credit Opportunities Fund seeks to provide current income and capital growth by investing in debt securities impacted by events such as reorganizations, restructurings, recapitalizations, debt maturities, refinancings, mergers, acquisitions, regulatory changes and other special situations. The investment objective of the Tactical Equity Fund seeks to achieve capital appreciation by investing in securities of companies where the market may not fully appreciate the impact of fundamental changes to the business, industry or regulatory environment.
www.arbitragefunds.com | 1-800-295-4485
98
The Arbitrage Funds Notes to Financial Statements (continued)
November 30, 2016 (Unaudited)
The Funds' four classes of shares, Class R, Class I, Class C and Class A, represent interests in the same portfolio of investments and have the same rights, but differ primarily in the expenses to which they are subject and the investment eligibility requirements. Class R shares, Class C shares and Class A shares are subject to an annual distribution and servicing fee of up to 0.25%, 1.00% and 0.25%, respectively, of each Fund's average daily net assets attributable to Class R shares, Class C shares and Class A shares, respectively, whereas Class I shares are not subject to any distribution and servicing fees. Class C shares are also subject to a 1.00% contingent deferred sales charge on all purchases redeemed within 12 months of purchase. Class A shares of the Arbitrage Fund are sold subject to a maximum front-end sales load equal to 2.50% of the offering price and are also subject to a 0.50% contingent deferred sales load on purchases at or above $250,000, purchased without a front-end sales charge and redeemed within 12 months of purchase. Class A shares of the Event-Driven Fund, the Credit Opportunities Fund and the Tactical Equity Fund are sold subject to a maximum front-end sales load equal to 3.25% of the offering price and are also subject to a 1.00% contingent deferred sales load on purchases at or above $500,000, purchased without a front-end sales charge and redeemed within 18 months of purchase.
2. SIGNIFICANT ACCOUNTING POLICIES
The following is a summary of significant accounting policies followed by the Funds. These policies are in conformity with U.S. generally accepted accounting principles ("GAAP"). The Funds are considered investment companies for financial reporting purposes under GAAP and Accounting Standards Codification Topic 946 — Investment Companies.
Use of Estimates — The preparation of financial statements in conformity with GAAP requires management to make estimates and assumptions that affect the reported amounts of assets and liabilities at the date of the financial statements and the reported amounts of increases and decreases in net assets from operations during the reporting period. Actual results could differ from those estimates.
Valuation of Investments — The Funds' portfolio securities are valued as of the close of trading of the New York Stock Exchange ("NYSE") (normally 4:00 p.m., Eastern time). Common stocks and other securities, including open short positions that are traded on a securities exchange, are valued at the last quoted sales price at the close of regular trading on the day the valuation is made. Securities which are quoted by NASDAQ are valued at the NASDAQ Official Closing Price. Price information on listed stocks is taken from the exchange where the security is primarily traded. Market quotations of foreign securities from the principal markets in which they trade may not be reliable if events or circumstances that may affect the value of portfolio securities occur between the time of the market quotation and the close of trading on the NYSE. If a significant event that affects the valuation of a foreign security occurs between the close of a foreign security's primary exchange and the time the Funds calculate their net asset value ("NAV"), the Funds will fair value the foreign security to account for this discrepancy. Securities which are listed on an exchange but which are not traded on the valuation date are valued at the mean of the most recent bid and ask prices. Put and call options and securities traded in the over-the-counter market are valued at the mean of the most recent bid and ask prices. When there is no bid price available, put and call options will be valued using the average of the last ask price and zero. Foreign currency forward contracts are valued at the current day's interpolated foreign exchange rate, as calculated using the current day's spot rate, and the thirty, sixty, ninety and one-hundred eighty day forward rates provided by an independent source.
Semi-Annual Report | November 30, 2016
99
The Arbitrage Funds Notes to Financial Statements (continued)
November 30, 2016 (Unaudited)
Bank loans are valued at the composite mid-price which is calculated using the simple average of the dealer marks. If available, debt securities are priced based upon an evaluated bid provided by independent, third-party pricing agents. The third-party pricing agents may also value debt securities at an evaluated bid price by employing methodologies that utilize actual market transactions, broker-supplied valuations, or other methodologies designed to identify the market value for such securities. Unlisted securities for which market quotations are readily available are valued at the latest quoted bid price. Swap contracts that are listed or traded on a national securities exchange, commodities exchange, contract market or comparable over-the-counter market, and that are freely transferable, are valued at their closing settlement price on the exchange on which they are primarily traded or based upon the current settlement price for a like instrument acquired on the day on which the instrument is being valued. Over-the-counter swap contracts for which market quotations are readily available are valued based on quotes received from independent pricing services or one or more dealers that make markets in such securities.
Other assets and securities for which no quotations are readily available are valued at fair value as determined in good faith under the supervision of the Board of Trustees of the Trust. Some of the more common reasons that may necessitate that a security be valued at fair value include: the security's trading has been halted or suspended; the security has been delisted from a national exchange; the security's primary trading market is temporarily closed at a time when under normal conditions it would be open; the security has been acquired through completion of a merger/tender or the security's primary pricing source is not able or willing to provide a price. Such methods of fair valuation may include, but are not limited to: multiple of earnings, multiple of book value, discount from market of a similar freely traded security, purchase price of a security, subsequent private transactions in the security or related securities, or a combination of these and other factors. Foreign securities are translated from the local currency into U.S. dollars using currency exchange rates supplied by a quotation service.
Fair Value Measurements — In accordance with the authoritative guidance on fair value measurements under GAAP, the Funds disclose fair value of their investments in a hierarchy that prioritizes the inputs to valuation techniques used to measure the fair value. The objective of a fair value measurement is to determine the price that would be received to sell an asset or paid to transfer a liability in an orderly transaction between market participants at the measurement date (an exit price). Accordingly, the fair value hierarchy gives the highest priority to quoted prices (unadjusted) in active markets for identical assets or liabilities (Level 1) and the lowest priority to unobservable inputs (Level 3). The guidance establishes three levels of the fair value hierarchy as follows:
Level 1 — Unadjusted quoted prices in active markets for identical, unrestricted assets or liabilities that the Funds have the ability to access at the measurement date;
Level 2 — Observable inputs other than quoted prices included in Level 1 that are observable (either directly or indirectly) for substantially the full term of the asset or liability; and
Level 3 — Unobservable inputs for the asset or liability, to the extent relevant observable inputs are not available, representing each Fund's own assumption about the assumptions a market participant would use in valuing the asset or liability, and would be based on the best information available.
www.arbitragefunds.com | 1-800-295-4485
100
The Arbitrage Funds Notes to Financial Statements (continued)
November 30, 2016 (Unaudited)
Investments are classified within the level of the lowest significant input considered in determining fair value. Investments classified within Level 3, whose fair value measurement considers several inputs, may include Level 1 or Level 2 inputs as components of the overall fair value measurement. The inputs or methodology used for valuing securities are not necessarily an indication of the risk associated with investing in those securities. The Funds recognize transfers between levels as of the beginning of the annual period in which the transfer occurred.
For the six months ended November 30, 2016, there were no significant changes to the Funds' fair value methodologies. Information on transfers between Level 1 and Level 2, if any, and transfers for Level 3 securities, if any, are disclosed following the leveling table in each Fund's Portfolio of Investments.
Share Valuation and Redemption Fees — The net asset value per share of each class of shares of the Funds is calculated daily by dividing the total value of a Fund's assets attributable to that class, less liabilities attributable to that class, by the number of shares of that class outstanding. The offering price and redemption price per share of each class of each Fund is equal to the net asset value per share, except that, shares of Class R, Class I and Class A are subject to a redemption fee of 2% if redeemed within 30 days for the Arbitrage Fund, Event-Driven Fund and Tactical Equity Fund and 60 days for the Credit Opportunities Fund from the date of purchase. The Class A redemption fee does not apply for purchases over $250,000 in the Arbitrage Fund and purchases over $500,000 in the Event-Driven Fund, Credit Opportunities Fund and Tactical Equity Fund, as these purchases are subject to a contingent deferred sales charge. Class C shares are not subject to a redemption fee. Proceeds from redemption fees for the six months ended November 30, 2016 are disclosed in Note 7. The redemption fee is paid directly to each Fund rather than the Adviser and is allocated pro-rata to the shareholders based on net assets attributed to each class.
Security Transactions — Security transactions are accounted for on trade date. Gains and losses on securities sold are determined on a specific identification basis.
Short Positions — The Funds may sell securities short for economic hedging purposes. Subsequent fluctuations in the market prices of securities sold short may require purchasing the securities at prices which may differ from the market value reflected on the Portfolio of Investments. The Funds are liable for any dividends and interest payable on securities while those securities are in a short position. As collateral for their short positions, the Funds are required under the 1940 Act to maintain assets consisting of cash, cash equivalents or liquid securities. The amount of the collateral is required to be adjusted daily to reflect changes in the value of the securities sold short. The Funds are charged an interest rebate expense by the prime broker on securities sold short. The interest rebate expense is charged for the duration of time that a security is sold short and is shown on the Statements of Operations.
Derivative Instruments and Hedging Activities — The following discloses the Funds' use of derivative instruments and hedging activities.
The Funds' investment objectives not only permit the Funds to purchase investment securities, but they also allow certain Funds to enter into various types of derivative contracts, including, but not limited to, swap contracts, forward foreign currency exchange contracts, and purchased and written option contracts. In doing so, the Funds will employ strategies in differing combinations to permit them to increase, decrease, or change the level or types of exposure to market factors. Central to those strategies are features inherent to derivatives that make them more attractive for this purpose than equity or debt securities: they require little or no initial
Semi-Annual Report | November 30, 2016
101
The Arbitrage Funds Notes to Financial Statements (continued)
November 30, 2016 (Unaudited)
cash investment; they can focus exposure on only certain selected risk factors; and they may not require the ultimate receipt or delivery of the underlying security (or securities) to satisfy the contract. This may allow the Funds to pursue their objectives more quickly and efficiently than if they were to make direct purchases or sales of securities capable of effecting a similar response to market factors.
Market Risk Factors: In pursuit of their investment objectives, the Funds may seek to use derivatives to increase or decrease their exposure to the following market risk factors:
Equity Risk: Equity risk relates to the change in value of equity securities as they relate to increases or decreases in the general market.
Interest Rate Risk: Interest rate risk refers to the fluctuations in value of fixed-income securities resulting from the inverse relationship between price and yield. For example, an increase in general interest rates will tend to reduce the market value of fixed income investments, and a decline in general interest rates will tend to increase the value of such investments. In addition, debt securities with longer maturities, which tend to have higher yields, are subject to potentially greater fluctuations in value from changes in interest rates than obligations with shorter maturities.
Foreign Exchange Rate Risk: Foreign exchange rate risk relates to the change in the U.S. dollar value of a security held that is denominated in a foreign currency. The value of a foreign currency denominated security will decrease as the dollar appreciates against the currency, while the value of the foreign currency denominated security will increase as the dollar depreciates against the currency. Adverse changes in exchange rates may erode or reverse any gains produced by foreign currency denominated investments and may widen any losses.
Credit Risk: Credit risk relates to the ability of the issuer to meet interest and principal payments, or both, as they come due. In general, lower-grade, higher-yield bonds are subject to credit risk to a greater extent than lower-yield, higher-quality bonds.
Risk of Investing in Derivatives: The Funds' use of derivatives can result in losses due to unanticipated changes in the market risk factors and the overall market. In instances where the Funds are using derivatives to decrease or hedge exposures to market risk factors for securities held by the Funds, there are also risks that those derivatives may not perform as expected, resulting in losses for the combined or hedged positions.
Derivatives may have little or no initial cash investment relative to their market value exposure and therefore can produce significant gains or losses in excess of their cost. This use of embedded leverage allows the Funds to increase their market value exposure relative to their net assets and can substantially increase the volatility of the Funds' performance.
Additional associated risks from investing in derivatives also exist and potentially could have significant effects on the valuation of the derivative instruments and the Funds. Typically, the associated risks are not the risks that the Funds are attempting to increase or decrease exposure to, per their investment objectives, but are the additional risks from investing in derivatives.
Examples of these associated risks are liquidity risk, which is the risk that the Funds will not be able to sell the derivative in the open market in a timely manner, and counterparty credit risk, which is the risk that the counterparty to a transaction will not fulfill its obligation to the Funds.
www.arbitragefunds.com | 1-800-295-4485
102
The Arbitrage Funds Notes to Financial Statements (continued)
November 30, 2016 (Unaudited)
Associated risks can be different for each type of derivative and are discussed by derivative type in the notes that follow.
Option Writing/Purchasing: Certain Funds may write or purchase option contracts to adjust risk and return of their overall investment positions. When a Fund writes or purchases an option, an amount equal to the premium received or paid by the Fund is recorded as a liability or an asset and is subsequently adjusted to the current market value of the option written or purchased. Premiums received or paid from writing or purchasing options that expire unexercised are treated by the Fund on the expiration date as realized gains or losses. The difference between the premium and the amount paid or received on effecting a closing purchase or sale transaction, including brokerage commissions, is also treated as a realized gain or loss. If an option is exercised, the premium paid or received is added to the cost of the purchase or proceeds from the sale in determining whether the Fund has realized a gain or loss on investment transactions. Risks from entering into option transactions arise from the potential inability of counterparties to meet the terms of the contracts, the potential inability to enter into closing transactions because of an illiquid secondary market and from unexpected movements in security values.
A summary of put and call option contracts written during the six months ended November 30, 2016, is as follows:
Arbitrage Fund | Put Contracts | Put Premiums | Call Contracts | Call Premiums | |||||||||||||||
Options outstanding at beginning of period | 1,544 | $ | 82,843 | 1,286 | $ | 171,350 | |||||||||||||
Options written | 7,155 | 396,920 | 27,157 | 2,279,953 | |||||||||||||||
Options closed | (1,475 | ) | (26,874 | ) | (4,379 | ) | (349,184 | ) | |||||||||||
Options exercised | (862 | ) | (43,650 | ) | (3,176 | ) | (509,786 | ) | |||||||||||
Options expired | (4,675 | ) | (264,563 | ) | (12,614 | ) | (483,678 | ) | |||||||||||
Options outstanding at end of period | 1,687 | $ | 144,676 | 8,274 | $ | 1,108,655 | |||||||||||||
Event-Driven Fund | Put Contracts | Put Premiums | Call Contracts | Call Premiums | |||||||||||||||
Options outstanding at beginning of period | 186 | $ | 12,311 | 227 | $ | 30,514 | |||||||||||||
Options written | 2,713 | 220,544 | 7,302 | 575,208 | |||||||||||||||
Options closed | (462 | ) | (52,061 | ) | (1,293 | ) | (148,904 | ) | |||||||||||
Options exercised | (437 | ) | (41,774 | ) | (751 | ) | (90,382 | ) | |||||||||||
Options expired | (1,936 | ) | (133,382 | ) | (4,721 | ) | (271,305 | ) | |||||||||||
Options outstanding at end of period | 64 | $ | 5,638 | 764 | $ | 95,131 | |||||||||||||
Credit Opportunities Fund | Put Contracts | Put Premiums | Call Contracts | Call Premiums | |||||||||||||||
Options outstanding at beginning of period | 376 | $ | 34,737 | — | $ | — | |||||||||||||
Options written | 2,533 | 177,963 | 83 | (4,008 | ) | ||||||||||||||
Options closed | (726 | ) | (40,923 | ) | — | — | |||||||||||||
Options exercised | — | — | (83 | ) | 4,008 | ||||||||||||||
Options expired | (1,433 | ) | (49,389 | ) | — | — | |||||||||||||
Options outstanding at end of period | 750 | $ | 122,388 | — | $ | — | |||||||||||||
Semi-Annual Report | November 30, 2016
103
The Arbitrage Funds Notes to Financial Statements (continued)
November 30, 2016 (Unaudited)
Tactical Equity Fund | Put Contracts | Put Premiums | Call Contracts | Call Premiums | |||||||||||||||
Options outstanding at beginning of period | 8 | $ | 1,193 | 5 | $ | 1,298 | |||||||||||||
Options written | 37 | 3,856 | 95 | 8,056 | |||||||||||||||
Options closed | (10 | ) | (1,738 | ) | (17 | ) | (2,280 | ) | |||||||||||
Options exercised | (4 | ) | (326 | ) | (17 | ) | (2,273 | ) | |||||||||||
Options expired | (29 | ) | (2,660 | ) | (61 | ) | (3,978 | ) | |||||||||||
Options outstanding at end of period | 2 | $ | 325 | 5 | $ | 823 | |||||||||||||
Foreign Currency Exchange Contracts: The Funds may enter into forward foreign currency exchange contracts as a way of managing foreign exchange rate risk. The Funds may enter into these contracts for the purchase or sale of a specific foreign currency at a fixed price on a future date as a hedge or cross-hedge against either specific transactions or portfolio positions. The objective of the Funds' foreign currency hedging transactions is to reduce risk that the U.S. dollar value of the Funds' securities denominated in foreign currency will decline in value due to changes in foreign currency exchange rates.
Swaps: Certain Funds may enter into interest rate, index, equity, total return and credit default swap agreements, for hedging and non-hedging purposes. These transactions would be entered into in an attempt to obtain a particular return when it is considered desirable to do so, possibly at a lower cost to a Fund than if the Fund had invested directly in the asset that yielded the desired return. Swap agreements may be executed in a multilateral or other trade facility program, such as a registered exchange ("centrally cleared swaps") or may be privately negotiated in the over-the-counter market. The duration of a swap agreement typically ranges from a few weeks to more than one year. In a standard swap transaction, two parties agree to exchange the returns (or differentials in rates of return) earned or realized on particular predetermined investments or instruments, which may be adjusted for an interest factor. The gross returns to be exchanged or "swapped" between the parties are generally calculated with respect to a "notional amount" (i.e., the return on or increase in value of a particular dollar amount invested at a particular interest rate, in a particular foreign currency, or in a "basket" of securities representing a particular index). In a centrally cleared swap, immediately following execution of the swap agreement, the swap agreement is novated to a central counterparty (the "CCP") and the Fund's counterparty on the swap agreement becomes the CCP.
Forms of swap agreements include interest rate caps, under which, in return for a premium, one party agrees to make payments to the other to the extent that interest rates exceed a specified rate, or "cap"; interest rate floors, under which, in return for a premium, one party agrees to make payments to the other to the extent that interest rates fall below a specified level, or "floor"; and interest rate collars, under which a party sells a cap and purchases a floor, or vice versa, in an attempt to protect itself against interest rate movements exceeding given minimum or maximum levels.
Credit default swaps are a type of swap agreement in which the protection "buyer" is generally obligated to pay the protection "seller" an upfront and/or a periodic stream of payments over the term of the contract provided that no credit event, such as a default, on a reference obligation has occurred. The credit default swap agreement may have as reference obligations one or more securities that are not currently held by a Fund. If a credit event occurs, the seller generally must pay the buyer the "par value" (full notional value) of the swap in exchange for an equal face
www.arbitragefunds.com | 1-800-295-4485
104
The Arbitrage Funds Notes to Financial Statements (continued)
November 30, 2016 (Unaudited)
amount of deliverable obligations of the reference entity described in the swap, or the seller may be required to deliver the related net cash amount if the swap is cash settled. A Fund may be either the buyer or seller in the transaction. If a Fund is a buyer and no credit event occurs, the Fund may recover nothing if the swap is held through its termination date. However, if a credit event occurs, the buyer generally may elect to receive the full notional value of the swap in exchange for an equal face amount of deliverable obligations of the reference entity whose value may have significantly decreased. As a seller, a Fund generally receives an upfront payment and/or a fixed rate of income throughout the term of the swap provided that there is no credit event. As the seller, a Fund would effectively add leverage to its portfolio because, in addition to its total net assets, the Fund would be subject to investment exposure on the notional amount of the swap. Credit default swap agreements involve greater risks than if a Fund had invested in the reference obligation directly since, in addition to general market risks, credit default swaps are subject to illiquidity risk, counterparty risk and credit risk. A Fund will enter into credit default swap agreements only with counterparties that meet certain standards of creditworthiness or that are centrally cleared.
Total return swap agreements are contracts in which one party agrees to make periodic payments based on the change in market value of underlying assets, which may include a specified security, basket of securities, defined portfolios of bonds, loans and mortgages, or securities indexes during the specified period in return for periodic payments based on a fixed or variable interest rate or the total return from other underlying assets or indices. Total return swap agreements may be used to obtain exposure to a security or market index without owning or taking physical custody of such security or component securities of a market index. Total return swap agreements may effectively add leverage to a Fund's portfolio because, in addition to its total net assets, the Fund would be subject to investment exposure on the notional amount of the swap. Total return swaps are a mechanism for the user to accept the economic benefits of asset ownership without utilizing the balance sheet. The other leg of the swap, usually the London Interbank Offered Rate (LIBOR), is spread to reflect the non-balance sheet nature of the product. Total return swaps can be designed with any underlying asset agreed upon between two parties. Typically no notional amounts are exchanged with total return swaps. Total return swap agreements entail the risk that a party will default on its payment obligations to a Fund thereunder. Swap agreements also entail the risk that a Fund will not be able to meet its obligation to the counterparty. Generally, a Fund will enter into total return swaps on a net basis (i.e., the two payment streams are netted out with the Fund receiving or paying, as the case may be, only the net amount of the two payments).
Most swap agreements entered into by a Fund calculate the obligations of the parties to the agreement on a "net basis." Consequently, a Fund's current obligations (or rights) under a swap agreement will generally be equal only to the net present value of amounts to be paid or received under the agreement based on the relative values of the positions held by each party to the agreement (the "net amount"). A Fund's current obligations under a swap agreement will be accrued daily (offset against amounts owed to the Fund), and any accrued but unpaid net amounts owed to a swap counterparty will be covered in accordance with applicable regulatory requirements to limit any potential leveraging of a Fund's portfolio. Any net amount accrued but not yet paid to a Fund by the counterparty under a swap agreement (i.e., the Fund's current rights under the swap agreement) is recorded as unrealized appreciation until the amount is paid to the Fund. The Fund's maximum risk of loss from counterparty credit risk is generally limited to the net payment to be received by the Fund and/or the termination value at the end of the
Semi-Annual Report | November 30, 2016
105
The Arbitrage Funds Notes to Financial Statements (continued)
November 30, 2016 (Unaudited)
contract. Obligations under swap agreements so covered will not be construed to be "senior securities" for purposes of the Funds' investment restriction concerning senior securities.
Whether a Fund's use of swap agreements will be successful in furthering its investment objective will depend on Management's ability to correctly predict whether certain types of investments are likely to produce greater returns than other investments. Swap agreements that cannot be terminated or sold within seven days may be considered to be illiquid investments. Moreover, a Fund bears the risk of loss of the amount expected to be received under a swap agreement in the event of the default or bankruptcy of a swap agreement counterparty. Although centrally cleared swaps typically present less counterparty risk than non-centrally cleared swaps, a Fund that has entered into centrally cleared swaps is subject to the risk of the failure of the CCP. A Fund will enter into swap agreements only with counterparties that meet certain standards for creditworthiness (generally, such counterparties would have to be eligible counterparties under the terms of the Fund's repurchase agreement guidelines) or that are centrally cleared. Certain restrictions imposed on the Funds by the Internal Revenue Code of 1986 as amended (the "Code") may limit a Fund's ability to use swap agreements. It is possible that developments in the swap market, including additional government regulation, could adversely affect a Fund's ability to terminate existing swap agreements or to realize amounts to be received under such agreements.
International Swaps and Derivatives Association, Inc. Master Agreements ("ISDA Master Agreements") govern over-the-counter financial derivative transactions entered into by a Fund and counterparty. The ISDA Master Agreements maintain provisions for general obligations, representations, agreements, collateral and events of default or termination. Events of termination include conditions that may entitle counterparties to elect to terminate early and cause settlement of all outstanding transactions under the applicable ISDA Master Agreement. Any election to terminate early could be material to the financial statements.
Swap agreements held by the Funds at November 30, 2016 are disclosed in the Portfolio of Investments.
www.arbitragefunds.com | 1-800-295-4485
106
The Arbitrage Funds Notes to Financial Statements (continued)
November 30, 2016 (Unaudited)
Fair Value of Derivative Instruments — Fair values of derivatives presented in the financial statements are not netted with the fair value of other derivatives or with any collateral amounts posted by the Funds or any counterparty. The fair value of derivative instruments for the Funds as of the six months ended November 30, 2016, was as follows:
| Derivatives Not Accounted For As Hedging Instruments | Asset Derivatives Statement of Assets and Liabilities Location | Fair Value | Liability Derivatives Statement of Assets and Liabilities Location | Fair Value | |||||||||||||||
Arbitrage Fund | |||||||||||||||||||
| Foreign Currency Contracts | Unrealized appreciation on forward foreign currency exchange contracts | $ | 8,820,751 | Unrealized depreciation on forward foreign currency exchange contracts | $ | 2,369,455 | |||||||||||||
| Equity Contracts (rights) | Investments: at value | 8,124,261 | Securities sold short, at value | — | |||||||||||||||
| Equity Contracts (purchased option contracts) | Investments: at value | 226,812 | |||||||||||||||||
| Equity Contracts (written option contracts) | Written options, at value | 1,177,734 | |||||||||||||||||
$ | 17,171,824 | $ | 3,547,189 | ||||||||||||||||
| Derivatives Not Accounted For As Hedging Instruments | Asset Derivatives Statement of Assets and Liabilities Location | Fair Value | Liability Derivatives Statement of Assets and Liabilities Location | Fair Value | |||||||||||||||
Event-Driven Fund | |||||||||||||||||||
| Foreign Currency Contracts | Unrealized appreciation on forward foreign currency exchange contracts | $ | 592,865 | Unrealized depreciation on forward foreign currency exchange contracts | $ | 39,057 | |||||||||||||
| Equity Contracts (rights) | Investments: at value | 572,647 | Securities sold short, at value | — | |||||||||||||||
| Equity Contracts (purchased option contracts) | Investments: at value | 62,443 | |||||||||||||||||
| Equity Contracts (written option contracts) | Written options, at value | 92,083 | |||||||||||||||||
$ | 1,227,955 | $ | 131,140 | ||||||||||||||||
Semi-Annual Report | November 30, 2016
107
The Arbitrage Funds Notes to Financial Statements (continued)
November 30, 2016 (Unaudited)
| Derivatives Not Accounted For As Hedging Instruments | Asset Derivatives Statement of Assets and Liabilities Location | Fair Value | Liability Derivatives Statement of Assets and Liabilities Location | Fair Value | |||||||||||||||
Credit Opportunities Fund | |||||||||||||||||||
| Foreign Currency Contracts | Unrealized appreciation on forward foreign currency exchange contracts | $ | — | Unrealized depreciation on forward foreign currency exchange contracts | $ | — | |||||||||||||
| Equity Contracts (purchased option contracts) | Investments: at value | 131,462 | |||||||||||||||||
| Equity Contracts (written option contracts) | Written options, at value | 69,000 | |||||||||||||||||
$ | 131,462 | $ | 69,000 | ||||||||||||||||
| Derivatives Not Accounted For As Hedging Instruments | Asset Derivatives Statement of Assets and Liabilities Location | Fair Value | Liability Derivatives Statement of Assets and Liabilities Location | Fair Value | |||||||||||||||
Tactical Equity Fund | |||||||||||||||||||
| Foreign Currency Contracts | Unrealized appreciation on forward foreign currency exchange contracts | $ | 9,259 | Unrealized depreciation on forward foreign currency exchange contracts | $ | 2,902 | |||||||||||||
| Equity Contracts (purchased option contracts) | Investments: at value | 487 | |||||||||||||||||
| Equity Contracts (written option contracts) | Written options, at value | 1,822 | |||||||||||||||||
$ | 9,746 | $ | 4,724 | ||||||||||||||||
www.arbitragefunds.com | 1-800-295-4485
108
The Arbitrage Funds Notes to Financial Statements (continued)
November 30, 2016 (Unaudited)
The effect of derivative instruments on the Funds' Statement of Operations for the six months ended November 30, 2016, was as follows:
| Derivatives Not Accounted For As Hedging Instruments | Location Of Gains/(Loss) On Derivatives Recognized In Income | Realized Gain/(Loss) On Derivatives Recognized In Income | Change in Unrealized Gain/(Loss) On Derivatives Recognized In Income | ||||||||||||
Arbitrage Fund | |||||||||||||||
| Foreign Currency Contracts | Net realized gains (losses) from: Foreign currency transactions / Net change in unrealized appreciation (depreciation) on: Foreign currency transactions | $ | 6,265,335 | $ | 6,038,144 | ||||||||||
| Equity Contracts (swap contracts) | Net realized gains (losses) from: Swap contracts / Net change in unrealized appreciation (depreciation) on: Swap contracts | 1,871,425 | — | ||||||||||||
| Equity Contracts Long (rights) | Net realized gains (losses) from: Investments / Net change in unrealized appreciation (depreciation) on: Investments | 190,305 | (537,181 | ) | |||||||||||
| Equity Contracts Short (rights) | Net realized gains (losses) from: Investments / Net change in unrealized appreciation (depreciation) on: Securities sold short | — | 65 | ||||||||||||
| Equity Contracts (purchased option contracts) | Net realized gains (losses) from: Investments / Net change in unrealized appreciation (depreciation) on: Investments | (1,667,646 | ) | (160,808 | ) | ||||||||||
| Equity Contracts (written option contracts) | Net realized gains (losses) from: Written option contracts / Net change in unrealized appreciation (depreciation) on: Written option contracts | 719,206 | 69,177 | ||||||||||||
$ | 7,378,625 | $ | 5,409,397 | ||||||||||||
Semi-Annual Report | November 30, 2016
109
The Arbitrage Funds Notes to Financial Statements (continued)
November 30, 2016 (Unaudited)
| Derivatives Not Accounted For As Hedging Instruments | Location Of Gains/(Loss) On Derivatives Recognized In Income | Realized Gain/(Loss) On Derivatives Recognized In Income | Change in Unrealized Gain/(Loss) On Derivatives Recognized In Income | ||||||||||||
Event-Driven Fund | |||||||||||||||
| Foreign Currency Contracts | Net realized gains (losses) from: Foreign currency transactions / Net change in unrealized appreciation (depreciation) on: Foreign currency transactions | $ | 381,904 | $ | 737,967 | ||||||||||
| Equity Contracts (swap contracts) | Net realized gains (losses) from: Swap contracts / Net change in unrealized appreciation (depreciation) on: Swap contracts | 207,225 | 383 | ||||||||||||
| Equity Contracts Long (rights) | Net realized gains (losses) from: Investments / Net change in unrealized appreciation (depreciation) on: Investments | 11,181 | (52,461 | ) | |||||||||||
| Equity Contracts Short (rights) | Net realized gains (losses) from: Investments / Net change in unrealized appreciation (depreciation) on: Securities sold short | — | 12 | ||||||||||||
| Equity Contracts (purchased option contracts) | Net realized gains (losses) from: Investments / Net change in unrealized appreciation (depreciation) on: Investments | (407,972 | ) | 2,217 | |||||||||||
| Equity Contracts (written option contracts) | Net realized gains (losses) from: Written option contracts / Net change in unrealized appreciation (depreciation) on: Written option contracts | 486,489 | 10,492 | ||||||||||||
$ | 678,827 | $ | 698,610 | ||||||||||||
www.arbitragefunds.com | 1-800-295-4485
110
The Arbitrage Funds Notes to Financial Statements (continued)
November 30, 2016 (Unaudited)
| Derivatives Not Accounted For As Hedging Instruments | Location Of Gains/(Loss) On Derivatives Recognized In Income | Realized Gain/(Loss) On Derivatives Recognized In Income | Change in Unrealized Gain/(Loss) On Derivatives Recognized In Income | ||||||||||||
Credit Opportunities Fund | |||||||||||||||
| Foreign Currency Contracts | Net realized gains (losses) from: Foreign currency transactions / Net change in unrealized appreciation (depreciation) on: Foreign currency transactions | $ | (24,467 | ) | $ | 25,632 | |||||||||
| Equity Contracts (purchased option contracts) | Net realized gains (losses) from: Investments / Net change in unrealized appreciation (depreciation) on: Investments | (78,417 | ) | (36,975 | ) | ||||||||||
| Equity Contracts (written option contracts) | Net realized gains (losses) from: Written option contracts / Net change in unrealized appreciation (depreciation) on: Written option contracts | 58,741 | 22,586 | ||||||||||||
$ | (44,143 | ) | $ | 11,243 | |||||||||||
| Derivatives Not Accounted For As Hedging Instruments | Location Of Gains/(Loss) On Derivatives Recognized In Income | Realized Gain/(Loss) On Derivatives Recognized In Income | Change in Unrealized Gain/(Loss) On Derivatives Recognized In Income | ||||||||||||
Tactical Equity Fund | |||||||||||||||
| Foreign Currency Contracts | Net realized gains (losses) from: Foreign currency transactions / Net change in unrealized appreciation (depreciation) on: Foreign currency transactions | $ | 1,702 | $ | 4,197 | ||||||||||
| Equity Contracts (swap contracts) | Net realized gains (losses) from: Swap contracts / Net change in unrealized appreciation (depreciation) on: Swap contracts | 1,662 | — | ||||||||||||
| Equity Contracts (purchased option contracts) | Net realized gains (losses) from: Investments / Net change in unrealized appreciation (depreciation) on: Investments | (8,175 | ) | (690 | ) | ||||||||||
| Equity Contracts (written option contracts) | Net realized gains (losses) from: Written option contracts / Net change in unrealized appreciation (depreciation) on: Written option contracts | 8,670 | (1,501 | ) | |||||||||||
$ | 3,859 | $ | 2,006 | ||||||||||||
Semi-Annual Report | November 30, 2016
111
The Arbitrage Funds Notes to Financial Statements (continued)
November 30, 2016 (Unaudited)
Volume of derivative instruments held by the Funds during the six months ended November 30, 2016, was as follows:
Derivative Type | Unit of Measurement | Monthly Average | |||||||||
Arbitrage Fund | |||||||||||
Swap Contracts | Notional Quantity | 13,291,525 | |||||||||
| Forward Foreign Currency Exchange Contracts | Net Contracts to Deliver/(Receive) | (101,266,642 | ) | ||||||||
Purchased Option Contracts | Contracts | 13,642 | |||||||||
Rights | Shares | 17,772,861 | |||||||||
Rights — Short | Shares | (1,100 | ) | ||||||||
Written Option Contracts | Contracts | (7,330 | ) | ||||||||
Derivative Type | Unit of Measurement | Monthly Average | |||||||||
Event-Driven Fund | |||||||||||
Swap Contracts | Notional Quantity | 318,643 | |||||||||
| Forward Foreign Currency Exchange Contracts | Net Contracts to Deliver/(Receive) | (5,562,317 | ) | ||||||||
Purchased Option Contracts | Contracts | 2,298 | |||||||||
Rights | Shares | 2,419,368 | |||||||||
Rights — Short | Shares | (200 | ) | ||||||||
Written Option Contracts | Contracts | (1,286 | ) | ||||||||
Derivative Type | Unit of Measurement | Monthly Average | |||||||||
Credit Opportunities Fund | |||||||||||
| Forward Foreign Currency Exchange Contracts | Net Contracts to Deliver/(Receive) | 273,334 | |||||||||
Purchased Option Contracts | Contracts | 427 | |||||||||
Written Option Contracts | Contracts | (269 | ) | ||||||||
Derivative Type | Unit of Measurement | Monthly Average | |||||||||
Tactical Equity Fund | |||||||||||
Swap Contracts | Notional Quantity | 4,793 | |||||||||
| Forward Foreign Currency Exchange Contracts | Net Contracts to Deliver/(Receive) | (106,945 | ) | ||||||||
Purchased Option Contracts | Contracts | 20 | |||||||||
Written Option Contracts | Contracts | (15 | ) | ||||||||
Certain derivative contracts are executed under either standardized netting agreements or, for exchange-traded derivatives, the relevant contracts for a particular exchange which contain enforceable netting provisions. A derivative netting arrangement creates an enforceable right of set-off that becomes effective, and affects the realization of settlement on individual assets, liabilities and collateral amounts, only following a specified event of default or early termination. Default events may include the failure to make payments or deliver securities timely, material adverse changes in financial condition or insolvency, the breach of minimum regulatory capital requirements, or loss of license, charter or other legal authorization necessary to perform under the contract.
www.arbitragefunds.com | 1-800-295-4485
112
The Arbitrage Funds Notes to Financial Statements (continued)
November 30, 2016 (Unaudited)
The Event-Driven Fund and Tactical Equity Fund held financial instruments that are subject to enforceable netting arrangements or other similar agreements as of November 30, 2016. At November 30, 2016, there was no unrealized appreciation or depreciation on these instruments.
Security Transactions and Investment Income — Security transactions are accounted for on a trade date basis. Interest income, adjusted for amortization of premium and accretion of discount, is recorded on the accrual basis. Dividend income is recorded on the ex-dividend date, net of any non-reclaimable tax withholdings.
Dividends and Distributions to Shareholders — Dividends arising from net investment income and net capital gain distributions, if any, are declared and paid at least annually to shareholders of the Arbitrage Fund, Event-Driven Fund and Tactical Equity Fund. Dividends arising from net investment income, if any, are declared and paid quarterly, and net capital gain distributions, if any, are declared and paid at least annually to shareholders of the Credit Opportunities Fund.
Allocation Between Classes — Investment income earned, realized capital gains and losses, and unrealized appreciation and depreciation are allocated daily to each class of shares based upon the proportionate shares of total net assets of each Fund. Class-specific expenses are charged directly to the class incurring the expense. Common expenses which are not attributable to a specific class are allocated daily to each class of shares based upon the proportionate share of total net assets of each Fund.
Federal Income Tax — It is the Funds' policy to continue to comply with the special provisions of Subchapter M of the Internal Revenue Code of 1986, as amended, applicable to regulated investment companies. As provided therein, in any fiscal year in which a fund so qualifies and distributes at least 90% of its taxable net income, a fund (but not the shareholders) will be relieved of Federal income tax on the income distributed. Accordingly, no provision for income taxes has been made.
As of and during the six months ended November 30, 2016, the Funds did not have a liability for any unrecognized tax benefits. The Funds file U.S. federal, state, and local tax returns as required. The Funds' tax returns are subject to examination by the relevant tax authorities until expiration of the applicable statute of limitations which is generally three years after the filing of the tax return. Tax returns for open years have incorporated no uncertain tax positions that require a provision for income taxes.
3. INVESTMENT TRANSACTIONS
During the six months ended November 30, 2016, cost of purchases and proceeds from sales and maturities of investment securities, excluding short-term investments, U.S. government securities, equity swap contracts, purchased and written option contracts and securities sold short, were as follows:
Arbitrage Fund | Event-Driven Fund | Credit Opportunities Fund | Tactical Equity Fund | ||||||||||||||||
Purchases | $ | 3,055,021,485 | $ | 299,525,856 | $ | 58,387,129 | $ | 2,245,524 | |||||||||||
Sales and Maturities | 2,772,174,752 | 280,499,142 | 60,134,972 | 1,602,524 | |||||||||||||||
Semi-Annual Report | November 30, 2016
113
The Arbitrage Funds Notes to Financial Statements (continued)
November 30, 2016 (Unaudited)
4. LINE OF CREDIT
The Trust, on behalf of the Funds, entered into an agreement which enables the Arbitrage Fund, the Event-Driven Fund, the Credit Opportunities Fund and the Tactical Equity Fund to participate in a $100,000,000 unsecured committed revolving line of credit (the "Committed Line") and a $100,000,000 unsecured uncommitted revolving line of credit (the "Uncommitted Line," together with the Committed Line, the "Credit Agreement") with State Street Bank and Trust Company (the "Custodian"). Borrowings are made solely to temporarily finance the purchase or sale of securities or to finance the redemption of the shares of an investor of the Funds. Interest is charged to the Funds based on their borrowings at a rate per annum of the higher of the LIBOR rate plus 1.25% and the overnight federal funds rate plus 1.25%. The Committed Line has a commitment fee of 0.20% per annum on the unused portion of the Committed Line and is payable quarterly. The Uncommitted Line has an upfront fee of $50,000 and is held available on a discretionary demand basis and may be terminated by the Custodian or the Trust at any time for any or no reason. The Trust accrues, on behalf of each of the Funds, the commitment fee on the unused portion of the Committed Line. Such fees are included in the custodian and bank service fees on the Statement of Operations.
Effective December 6, 2016, the Credit Agreement was amended and restated. The Committed Line has a commitment fee of 0.25% per annum on the unused portion of the Committed Line and is payable quarterly. The Uncommitted Line has an upfront fee of $25,000, is held available on a discretionary demand basis and may be terminated by the Custodian or the Trust at any time for any or no reason. The Trust accrues, on behalf of each of the Funds, the commitment fee on the unused portion of the Committed Line. Such fees are included in the custodian and bank service fees on the Statement of Operations.
The Arbitrage Fund, the Credit Opportunities Fund and the Tactical Equity Fund had no borrowings during the six months ended November 30, 2016.
For the six months ended November 30, 2016, the Event-Driven Fund had average borrowings of $1,750,000 over a period of 4 days at a weighted average interest rate of 1.71%. Interest expense on the line of credit for the Event-Driven Fund during the six months ended November 30, 2016, is shown as line of credit interest expense on the Statement of Operations. The Event-Driven Fund had no outstanding borrowings at November 30, 2016.
5. LOAN PARTICIPATIONS AND ASSIGNMENTS
The Funds may invest in direct debt instruments which are interests in amounts owed to lenders or lending syndicates by corporate, governmental, or other borrowers. The Funds' investments in loans may be in the form of participations in loans or assignments of all or a portion of the loans from third parties. A loan is often administered by a bank or other financial institution (the "lender") that acts as agent for all holders. The agent administers the terms of the loan, as specified in the loan agreement. The Funds may invest in multiple series or tranches of a loan, which may have varying terms and carry different associated risks. The Funds generally have no right to enforce compliance with the terms of the loan agreement with the borrower. As a result, the Funds may be subject to the credit risk of both the borrower and the lender that is selling the loan agreement. When the Funds purchase assignments from lenders they acquire direct rights against the borrower of the loan. The Funds may enter into unfunded loan commitments, which are contractual obligations for future funding. Unfunded loan commitments represent a future obligation in full, even though a percentage of the notional loan amounts may not be
www.arbitragefunds.com | 1-800-295-4485
114
The Arbitrage Funds Notes to Financial Statements (continued)
November 30, 2016 (Unaudited)
utilized by the borrower. When investing in a loan participation, the Funds have the right to receive payments of principal, interest and any fees to which it is entitled only from the lender selling the loan agreement and only upon receipt of payments by the lender from the borrower. The Funds may receive a commitment fee based on the undrawn portion of the underlying line of credit portion of a floating rate loan. In certain circumstances, the Funds may receive a penalty fee upon the prepayment of a floating rate loan by a borrower. For the period ended November 30, 2016, no penalty fees were received by the Funds. Fees earned or paid are recorded as a component of interest income or interest expense, respectively, on the Statement of Operations, if applicable.
At November 30, 2016, the Arbitrage Fund, Event-Driven Fund, Credit Opportunities Fund and Tactical Equity Fund each had no outstanding loan commitments.
6. ADVISORY FEES, ADMINISTRATION FEES AND OTHER AGREEMENTS
Investment Advisory Agreement
The Funds' investments are managed by the Adviser according to the terms of Investment Advisory Agreements. Under the Investment Advisory Agreement between the Adviser and the Arbitrage Fund, as amended and restated on October 1, 2007, the Arbitrage Fund pays the Adviser an annual fee, which is computed and accrued daily and paid monthly, of 1.25% on the first $250 million, 1.20% on the next $50 million, 1.15% on the next $50 million, 1.10% on the next $75 million, 1.05% on the next $75 million and 1.00% for amounts over $500 million, based on the Arbitrage Fund's average daily net assets. Under the Investment Advisory Agreement between the Adviser and the Event-Driven Fund dated September 27, 2010, the Event-Driven Fund pays the Adviser an annual fee, which is computed and accrued daily and paid monthly, of 1.25% based on the Event-Driven Fund's average daily net assets. Under the Investment Advisory Agreement between the Adviser and the Credit Opportunities Fund dated October 1, 2012, the Credit Opportunities Fund pays the Adviser an annual fee, which is computed and accrued daily and paid monthly, of 1.00% based on the Credit Opportunities Fund's average daily net assets. Under the Investment Advisory Agreement between the Adviser and the Tactical Equity Fund dated December 22, 2014, the Tactical Equity Fund pays the Adviser an annual fee, which is computed and accrued daily and paid monthly, of 1.25% based on the Tactical Equity Fund's average daily net assets.
The Adviser has contractually agreed, at least until September 30, 2017 for the Arbitrage Fund, the Event-Driven Fund, the Credit Opportunities Fund, and December 31, 2017 for the Tactical Equity Fund, to waive its advisory fee and/or reimburse the Funds' other expenses to the extent that total operating expenses (exclusive of taxes, interest, dividends on short positions, brokerage commissions, acquired fund fees and expenses and other costs incurred in connection with the purchase or sale of portfolio securities) exceed the annual rate of the Funds' average daily net assets attributable to each share class as shown in the table below:
Arbitrage Fund | Event-Driven Fund | Credit Opportunities Fund | Tactical Equity Fund | ||||||||||||||||
Class R | 1.69 | % | 1.69 | % | 1.50 | % | 1.69 | % | |||||||||||
Class I | 1.44 | % | 1.44 | % | 1.25 | % | 1.44 | % | |||||||||||
Class C | 2.44 | % | 2.44 | % | 2.25 | % | 2.44 | % | |||||||||||
Class A | 1.69 | % | 1.69 | % | 1.50 | % | 1.69 | % | |||||||||||
Semi-Annual Report | November 30, 2016
115
The Arbitrage Funds Notes to Financial Statements (continued)
November 30, 2016 (Unaudited)
For the six months ended November 30, 2016, the aggregate net fee paid to the Adviser as a percentage of average net assets for the Arbitrage Fund, Event-Driven Fund, Credit Opportunities Fund and Tactical Equity Fund was 1.05%, 1.25%, 1.00% and 1.25%, respectively.
The Adviser is permitted to recapture fees waived and expenses reimbursed to the extent actual fees and expenses for a period are less than the expense limitation of each class, provided, however, that the Adviser shall only be entitled to recapture such amounts for a period of three years from the end of the fiscal year during which such amount was waived or reimbursed. The Adviser can recapture any fees it has waived within three fiscal years of the year in which fees were waived subject to the applicable annual rate of: 1.69% for Class R shares, 1.44% for Class I shares, 2.44% for Class C shares and 1.69% for Class A shares of the Arbitrage Fund, Event-Driven Fund and Tactical Equity Fund, 1.50% for Class R shares, 1.25% for Class I shares, 2.25% for Class C shares and 1.50% for Class A shares of the Credit Opportunities Fund.
As of the six months ended November 30, 2016, the balances of future fee and expense recaptures for each Fund were as follows:
| Expiring May 31, 2017 | Expiring May 31, 2018 | Expiring May 31, 2019 | Total | ||||||||||||||||
Event-Driven Fund | |||||||||||||||||||
Class R | $ | 16,826 | $ | 42,377 | $ | 193,596 | $ | 252,799 | |||||||||||
Class I | $ | 67,294 | $ | 96,022 | $ | 332,746 | $ | 496,062 | |||||||||||
Class C | $ | 854 | $ | 1,230 | $ | 5,871 | $ | 7,955 | |||||||||||
Class A | $ | 756 | $ | 1,377 | $ | 5,132 | $ | 7,265 | |||||||||||
Credit Opportunities Fund | |||||||||||||||||||
Class R | $ | 36,515 | $ | 25,136 | $ | 44,465 | $ | 106,116 | |||||||||||
Class I | $ | 113,965 | $ | 92,962 | $ | 107,990 | $ | 314,917 | |||||||||||
Class C | $ | 1,393 | $ | 4,587 | $ | 4,018 | $ | 9,998 | |||||||||||
Class A | $ | 214 | $ | 1,194 | $ | 1,093 | $ | 2,501 | |||||||||||
Tactical Equity Fund | |||||||||||||||||||
Class R | N/A | $ | 1,733 | $ | 1,665 | $ | 3,398 | ||||||||||||
Class I | N/A | $ | 97,858 | $ | 256,320 | $ | 354,178 | ||||||||||||
Class C | N/A | $ | 1,733 | $ | 1,665 | $ | 3,398 | ||||||||||||
Class A | N/A | $ | 1,733 | $ | 1,665 | $ | 3,398 | ||||||||||||
There were no amounts recaptured during the six months ended November 30, 2016, for the Funds.
Certain officers of the Trust are also officers of the Adviser. The Chief Compliance Officer ("CCO") of the Trust also serves as the CCO of the Adviser. The Funds currently pay the Adviser 50% of the CCO's salary for the CCO's provision of services to the Funds. Prior to November 17, 2016, Ascendant Compliance Management, Inc. provided CCO services to the Trust. Ascendant Compliance Management, Inc. was compensated by the Trust under a Consulting Services Agreement.
Administration Agreement
State Street Bank & Trust Company serves as the Trust's administrator pursuant to an Administration Agreement with the Trust.
www.arbitragefunds.com | 1-800-295-4485
116
The Arbitrage Funds Notes to Financial Statements (continued)
November 30, 2016 (Unaudited)
Distribution Agreement
ALPS Distributors, Inc. (the "Distributor") serves as the Funds' distributor. The Distributor acts as an agent for the Funds and the distributor of their shares. The Funds have adopted, with respect to their Class R, Class C shares and Class A shares, a plan of distribution pursuant to Rule 12b-1 under the 1940 Act which permits each Fund to pay for expenses incurred in the distribution and promotion of the Funds' Class R shares, Class C shares and Class A shares and for services provided to shareholders. The Plan is a "reimbursement" plan. This means that a Fund's Class R shares, Class C shares and Class A shares only pay a particular 12b-1 fee to the extent that the Adviser, the Distributor or others have incurred expenses in the promotion and distribution of the shares, including but not limited to, the printing of prospectuses and reports used for sales purposes, expenses of preparation of sales literature and related expenses, advertisements, and other distribution-related expenses, as well as any distribution fees paid to securities dealers or others. Under the distribution plan, a Fund may pay compensation to any broker-dealer with whom the Distributor or the Funds has entered into a contract to distribute Class R shares, Class C shares or Class A shares, or to any other qualified financial services firm, for distribution and/or shareholder-related services with respect to shares held or purchased by their respective customers or in connection with the purchase of shares attributable to their efforts. The amount of payments under the Plan in any year shall not exceed 0.25% for Class R shares, 0.75% for Class C shares and 0.25% for Class A shares, respectively, of the average daily net assets allocable to a Fund's Class R shares, Class C shares and Class A shares, respectively. In addition, the Plan permits each Fund to make payments at an annual rate of up to 0.25% of the Fund's Class C shares for expenses incurred in connection with the provision of shareholder support or administrative services for the Fund's Class C shares.
During the six months ended November 30, 2016, The Arbitrage Fund's Class R shares incurred $485,560, Class C shares incurred $148,135 and Class A shares incurred $10,820, respectively, in distribution expenses for Class R shares and Class A shares and distribution and shareholder support expenses for Class C shares, all of which was used to compensate broker-dealers. With respect to the Event-Driven Fund, during the six months ended November 30, 2016, the Event-Driven Fund's Class R shares incurred $96,501, Class C shares incurred $11,733 and Class A shares incurred $2,056, respectively, in distribution expenses for Class R shares and Class A shares and distribution and shareholder support expenses for Class C shares, all of which was used to compensate broker-dealers. With respect to the Credit Opportunities Fund, during the six months ended November 30, 2016, the Credit Opportunities Fund's Class R shares incurred $15,684, Class C shares incurred $4,510 and Class A shares incurred $135, respectively, in distribution expenses for Class R shares and Class A shares and distribution and shareholder support expenses for Class C shares, all of which was used to compensate broker-dealers. With respect to the Tactical Equity Fund, during the six months ended November 30, 2016, the Tactical Equity Fund's Class R shares incurred $12, Class C shares incurred $48 and Class A shares incurred $12, respectively, in distribution expenses for Class R shares and Class A shares and distribution and shareholder support expenses for Class C shares, all of which was used to compensate broker-dealers.
Chief Financial Officer
Foreside Management Services, LLC provides Chief Financial Officer ("CFO") services to the Trust. Foreside Management Services, LLC is compensated by the Trust under a Fund CFO/Treasurer Agreement.
Semi-Annual Report | November 30, 2016
117
The Arbitrage Funds Notes to Financial Statements (continued)
November 30, 2016 (Unaudited)
Transfer Agent And Shareholder Services Agreement
DST Systems, Inc. ("DST") is the Funds' transfer agent, and per an agency agreement, maintains the records of each shareholder's account, answers shareholders' inquiries concerning their accounts, processes purchases and redemptions of the Funds shares, acts as dividend and distribution disbursing agent and performs other shareholder service functions.
7. CAPITAL SHARE TRANSACTIONS
Proceeds and payments on capital shares as shown in the Statement of Changes in Net Assets are the result of the following capital share transactions for the periods shown:
| Six Months Ended November 30, 2016 (Unaudited) | Year Ended May 31, 2016 | ||||||||||||||||||
Arbitrage Fund - Class R | Shares | Value | Shares | Value | |||||||||||||||
Proceeds from shares sold | 2,920,023 | $ | 37,380,798 | 10,329,274 | $ | 130,810,689 | |||||||||||||
| Shares issued in reinvestment of distributions | — | — | 822,474 | 10,264,483 | |||||||||||||||
| Proceeds from redemption fees collected | — | 744 | — | 5,031 | |||||||||||||||
Payments for shares redeemed | (9,441,027 | ) | (120,809,206 | ) | (15,786,500 | ) | (200,571,773 | ) | |||||||||||
Net decrease | (6,521,004 | ) | $ | (83,427,664 | ) | (4,634,752 | ) | $ | (59,491,570 | ) | |||||||||
Arbitrage Fund - Class I | |||||||||||||||||||
Proceeds from shares sold | 17,431,988 | $ | 229,549,334 | 46,706,866 | $ | 608,970,058 | |||||||||||||
| Shares issued in reinvestment of distributions | — | — | 1,892,721 | 24,245,751 | |||||||||||||||
| Proceeds from redemption fees collected | — | 762 | — | 10,214 | |||||||||||||||
Payments for shares redeemed | (20,371,701 | ) | (268,056,610 | ) | (56,370,693 | ) | (735,261,059 | ) | |||||||||||
Net decrease | (2,939,713 | ) | $ | (38,506,514 | ) | (7,771,106 | ) | $ | (102,035,036 | ) | |||||||||
Arbitrage Fund - Class C | |||||||||||||||||||
Proceeds from shares sold | 135,188 | $ | 1,671,913 | 500,812 | $ | 6,204,471 | |||||||||||||
| Shares issued in reinvestment of distributions | — | — | 38,603 | 467,867 | |||||||||||||||
Payments for shares redeemed | (369,441 | ) | (4,567,127 | ) | (652,449 | ) | (8,039,350 | ) | |||||||||||
Net decrease | (234,253 | ) | $ | (2,895,214 | ) | (113,034 | ) | $ | (1,367,012 | ) | |||||||||
Arbitrage Fund - Class A | |||||||||||||||||||
Proceeds from shares sold | 92,964 | $ | 1,192,376 | 340,518 | $ | 4,347,045 | |||||||||||||
| Shares issued in reinvestment of distributions | — | — | 28,684 | 358,263 | |||||||||||||||
Payments for shares redeemed | (38,321 | ) | (490,574 | ) | (1,056,094 | ) | (13,383,544 | ) | |||||||||||
Net increase/(decrease) | 54,643 | $ | 701,802 | (686,892 | ) | $ | (8,678,236 | ) | |||||||||||
www.arbitragefunds.com | 1-800-295-4485
118
The Arbitrage Funds Notes to Financial Statements (continued)
November 30, 2016 (Unaudited)
| Six Months Ended November 30, 2016 (Unaudited) | Year Ended May 31, 2016 | ||||||||||||||||||
Event-Driven Fund - Class R | Shares | Value | Shares | Value | |||||||||||||||
Proceeds from shares sold | 565,811 | $ | 5,110,674 | 2,496,545 | $ | 22,578,349 | |||||||||||||
| Shares issued in reinvestment of distributions | — | — | 181,920 | 1,577,249 | |||||||||||||||
| Proceeds from redemption fees collected | — | 29 | — | 1,449 | |||||||||||||||
Payments for shares redeemed | (1,381,527 | ) | (12,476,023 | ) | (13,805,457 | ) | (125,836,833 | ) | |||||||||||
Net decrease | (815,716 | ) | $ | (7,365,320 | ) | (11,126,992 | ) | $ | (101,679,786 | ) | |||||||||
Event-Driven Fund - Class I | |||||||||||||||||||
Proceeds from shares sold | 588,522 | $ | 5,351,125 | 3,768,748 | $ | 34,981,398 | |||||||||||||
| Shares issued in reinvestment of distributions | — | — | 346,601 | 3,018,893 | |||||||||||||||
| Proceeds from redemption fees collected | — | 6 | — | 7,912 | |||||||||||||||
Payments for shares redeemed | (2,721,262 | ) | (24,762,516 | ) | (33,339,072 | ) | (304,977,002 | ) | |||||||||||
Net decrease | (2,132,740 | ) | $ | (19,411,385 | ) | (29,223,723 | ) | $ | (266,968,799 | ) | |||||||||
Event-Driven Fund - Class C | |||||||||||||||||||
Proceeds from shares sold | 5,211 | $ | 46,548 | 60,431 | $ | 543,460 | |||||||||||||
| Shares issued in reinvestment of distributions | — | — | 5,047 | 43,509 | |||||||||||||||
Payments for shares redeemed | (85,634 | ) | (765,913 | ) | (302,131 | ) | (2,696,528 | ) | |||||||||||
Net decrease | (80,423 | ) | $ | (719,365 | ) | (236,653 | ) | $ | (2,109,559 | ) | |||||||||
Event-Driven Fund - Class A | |||||||||||||||||||
Proceeds from shares sold | 14,435 | $ | 130,278 | 18,634 | $ | 172,299 | |||||||||||||
| Shares issued in reinvestment of distributions | — | — | 7,318 | 63,444 | |||||||||||||||
Payments for shares redeemed | (148,386 | ) | (1,349,842 | ) | (345,160 | ) | (3,139,265 | ) | |||||||||||
Net decrease | (133,951 | ) | $ | (1,219,564 | ) | (319,208 | ) | $ | (2,903,522 | ) | |||||||||
Semi-Annual Report | November 30, 2016
119
The Arbitrage Funds Notes to Financial Statements (continued)
November 30, 2016 (Unaudited)
| Six Months Ended November 30, 2016 (Unaudited) | Year Ended May 31, 2016 | ||||||||||||||||||
Credit Opportunities Fund - Class R | Shares | Value | Shares | Value | |||||||||||||||
Proceeds from shares sold | 165,926 | $ | 1,615,481 | 329,444 | $ | 3,203,618 | |||||||||||||
| Shares issued in reinvestment of distributions | 9,989 | 97,021 | 53,795 | 521,680 | |||||||||||||||
| Proceeds from redemption fees collected | — | 80 | — | — | |||||||||||||||
Payments for shares redeemed | (203,900 | ) | (1,984,749 | ) | (1,384,361 | ) | (13,365,525 | ) | |||||||||||
Net decrease | (27,985 | ) | $ | (272,167 | ) | (1,001,122 | ) | $ | (9,640,227 | ) | |||||||||
Credit Opportunities Fund - Class I | |||||||||||||||||||
Proceeds from shares sold | 319,173 | $ | 3,101,525 | 1,623,325 | $ | 15,744,142 | |||||||||||||
| Shares issued in reinvestment of distributions | 32,565 | 315,615 | 133,365 | 1,289,012 | |||||||||||||||
Payments for shares redeemed | (442,891 | ) | (4,300,237 | ) | (2,058,317 | ) | (19,839,217 | ) | |||||||||||
Net decrease | (91,153 | ) | $ | (883,097 | ) | (301,627 | ) | $ | (2,806,063 | ) | |||||||||
Credit Opportunities Fund - Class C | |||||||||||||||||||
Proceeds from shares sold | 2,235 | $ | 21,595 | 11,795 | $ | 113,168 | |||||||||||||
| Shares issued in reinvestment of distributions | 284 | 2,737 | 3,931 | 37,920 | |||||||||||||||
Payments for shares redeemed | (49,605 | ) | (478,715 | ) | (93,070 | ) | (893,117 | ) | |||||||||||
Net decrease | (47,086 | ) | $ | (454,383 | ) | (77,344 | ) | $ | (742,029 | ) | |||||||||
Credit Opportunities Fund - Class A | |||||||||||||||||||
Proceeds from shares sold | 4,087 | $ | 39,930 | 14,931 | $ | 145,301 | |||||||||||||
| Shares issued in reinvestment of distributions | 74 | 721 | 1,489 | 14,406 | |||||||||||||||
Payments for shares redeemed | (3,552 | ) | (34,621 | ) | (69,108 | ) | (658,051 | ) | |||||||||||
Net increase/(decrease) | 609 | $ | 6,030 | (52,688 | ) | $ | (498,344 | ) | |||||||||||
www.arbitragefunds.com | 1-800-295-4485
120
The Arbitrage Funds Notes to Financial Statements (continued)
November 30, 2016 (Unaudited)
| Six Months Ended November 30, 2016 (Unaudited) | Year Ended May 31, 2016 | ||||||||||||||||||
Tactical Equity Fund - Class R | Shares | Value | Shares | Value | |||||||||||||||
| Shares issued in reinvestment of distributions | — | $ | — | 10 | $ | 88 | |||||||||||||
Net increase | — | — | 10 | 88 | |||||||||||||||
Tactical Equity Fund - Class I | |||||||||||||||||||
Proceeds from shares sold | 27,600 | $ | 259,772 | 41,947 | $ | 404,121 | |||||||||||||
| Shares issued in reinvestment of distributions | — | — | 1,588 | 14,509 | |||||||||||||||
Payments for shares redeemed | — | — | (40,610 | ) | (374,608 | ) | |||||||||||||
Net increase | 27,600 | $ | 259,772 | 2,925 | $ | 44,022 | |||||||||||||
Tactical Equity Fund - Class C | |||||||||||||||||||
| Shares issued in reinvestment of distributions | — | $ | — | 10 | $ | 88 | |||||||||||||
Net increase | — | $ | — | 10 | $ | 88 | |||||||||||||
Tactical Equity Fund - Class A | |||||||||||||||||||
| Shares issued in reinvestment of distributions | — | $ | — | 10 | $ | 88 | |||||||||||||
Net increase | — | $ | — | 10 | $ | 88 | |||||||||||||
8. FOREIGN CURRENCY TRANSLATION
Amounts denominated in or expected to settle in foreign currencies are translated to U.S. dollars based on exchange rates on the basis outlined below:
A. The market values of investment securities and other assets and liabilities are translated at the closing rate of exchange each day.
B. Purchases and sales of investment securities and income and expenses are translated at the rate of exchange prevailing on the respective dates of such transactions.
C. The Funds do not isolate that portion of the results of operations caused by changes in foreign exchange rates on investments from those caused by changes in market prices of securities held. Such fluctuations are included with the net realized and unrealized gains or losses on investments. Reported net realized foreign exchange gains or losses arise from 1) purchases and sales of foreign currencies; 2) currency gains or losses realized between the trade and settlement dates on security transactions; and 3) the difference between the amounts of dividends, interest and foreign withholding taxes recorded on the Funds' books, and the U.S. dollar equivalent of the amounts actually received or paid. Reported net unrealized foreign exchange gains and losses arise from changes in the value of assets and liabilities, other than investment securities, resulting from changes in exchange rates.
9. CONTINGENCIES AND COMMITMENTS
The Funds indemnify the Trust's officers and trustees for certain liabilities that might arise from their performance of their duties to the Funds. Additionally, in the normal course of business,
Semi-Annual Report | November 30, 2016
121
The Arbitrage Funds Notes to Financial Statements (continued)
November 30, 2016 (Unaudited)
the Funds enter into contracts that contain a variety of representations and warranties and which provide general indemnifications. The Funds' maximum exposure under these arrangements is unknown, as this would involve future claims that may be made against the Funds that have not yet occurred. However, based on experience, the Funds expect the risk of loss to be remote.
10. SECURITIES LENDING
To generate additional income, the Funds may, from time to time, lend portfolio securities to broker-dealers, banks or institutional borrowers of securities. At the time of the loan, the Funds must receive from the borrower 100% collateral in the form of cash or U.S. government securities. This collateral must be valued daily and, should the market value of the loaned securities increase, the borrower must furnish additional collateral to the Funds. During the time portfolio securities are on loan, the borrower pays the Funds any dividends or interest paid on such securities.
Loans are subject to termination by the Funds or the borrower at any time. While the Funds do not have the right to vote securities on loan they have the right to terminate the loan and regain the right to vote if that is considered important with respect to the investment. In the event the borrower defaults in its obligation to the Fund, the Funds bear the risk of delay in the recovery of portfolio securities and the risk of loss of rights in the collateral.
Certain Funds may participate in a securities lending program under which the Funds' custodian, State Street Bank and Trust Company (the "Custodian") acting as securities lending agent, is authorized to lend Fund portfolio securities to qualified brokers/dealers and financial institutions that post appropriate collateral. The value of securities loaned will not exceed one-third of the value of the total assets of the Fund making the loan. The Custodian has agreed to indemnify the Fund in case of default of any security borrower.
Securities on loan are fully collateralized and the collateral was equal to or exceeded the securities on loan. Cash collateral is invested in the State Street Institutional U.S. Government Money Market Fund, Premier Class. The Custodian receives a portion of the interest earned on any reinvested collateral. Income received by the Funds in securities lending transactions during the six months ended November 30, 2016 is reflected as securities lending income in the Statement of Operations. Arbitrage Fund and Event-Driven Fund did lend out securities during the six months ended November 30, 2016. There were no securities on loan in the Funds on November 30, 2016.
11. FEDERAL TAX INFORMATION
In order to avoid imposition of the excise tax applicable to regulated investment companies, it is also the Funds' intention to declare as dividends in each calendar year at least 98.0% of its net investment income (earned during the calendar year) and 98.2% of its net realized capital gains (earned during the twelve months ended October 31) plus undistributed amounts from prior years.
The amount of distributions from net investment income and net realized gains, if any, are determined in accordance with Federal income tax regulations which may differ from accounting principles generally accepted in the United States of America. These "book/tax" differences are either temporary or permanent in nature and permanent differences are charged or credited to undistributed net investment income (loss), accumulated net realized gain (loss) or paid-in capital as appropriate in the period that the differences arise.
www.arbitragefunds.com | 1-800-295-4485
122
The Arbitrage Funds Notes to Financial Statements (continued)
November 30, 2016 (Unaudited)
Permanent differences between the Funds' financial statement and income tax reporting requirements are primarily attributable to gains and losses on certain foreign currency related transactions, short sale related dividend expense, investments in passive foreign investment companies, investments in swaps, consent fee income, net operating losses and partnership basis adjustments. These have no effect on the Funds' net assets or net asset value per share.
The tax character of dividends and distributions declared and paid during the years ended May 31, 2016 and May 31, 2015 was as follows:
| Fund Year | Ordinary Ended | Long-Term Income | Total Capital Gains* | Distributions | |||||||||||||||
Arbitrage Fund | 5/31/2016 | $ | 36,514,253 | $ | 8,351,638 | $ | 44,865,891 | ||||||||||||
5/31/2015 | — | 5,699,538 | 5,699,538 | ||||||||||||||||
Event-Driven Fund | 5/31/2016 | $ | 6,911,803 | $ | 10,047 | $ | 6,921,850 | ||||||||||||
5/31/2015 | 16,463,793 | — | 16,463,793 | ||||||||||||||||
Credit Opportunities Fund | 5/31/2016 | $ | 1,900,708 | $ | — | $ | 1,900,708 | ||||||||||||
5/31/2015 | 1,328,590 | — | 1,328,590 | ||||||||||||||||
Tactical Equity Fund | 5/31/2016 | $ | 14,738 | $ | 35 | $ | 14,773 | ||||||||||||
5/31/2015 | — | — | — | ||||||||||||||||
* The Funds designate these distributions as long-term capital gains dividends per IRC code section 852(b)(3)(C).
The following information is computed on a tax basis for each item as of November 30, 2016:
Fund | Gross Appreciation (excess of value over tax cost) | Gross Depreciation (excess of tax cost over value) | Net Appreciation/ (Depreciation) of Foreign Currency and Derivatives | Net Unrealized Appreciation (Depreciation) | Cost of Investments for Income Tax Purposes | ||||||||||||||||||
Arbitrage Fund | $ | 2,631,885 | $ | (10,058,750 | ) | $ | 4,571,537 | $ | (2,855,328 | ) | $ | 1,864,751,124 | |||||||||||
Event-Driven Fund | 1,170,548 | (2,286,753 | ) | 17,151 | (1,099,054 | ) | 164,160,287 | ||||||||||||||||
| Credit Opportunities Fund | 801,058 | (515,555 | ) | 14,893 | 300,396 | 54,102,121 | |||||||||||||||||
Tactical Equity Fund | 22,777 | (27,860 | ) | (5,565 | ) | (10,648 | ) | 1,360,392 | |||||||||||||||
The differences between book-basis and tax-basis net unrealized appreciation/(depreciation) for the Funds are attributable to constructive sales, dividends related to short securities, investments in passive foreign investment companies, wash sales, convertible bonds, straddle loss deferrals and unsettled wash sales.
Capital Losses
As of May 31, 2016, the Event-Driven Fund had $36,044,782 of short term and $1,791,994 of long term capital loss carryforwards, the Credit Opportunities Fund had $1,413,105 of short term and $231,444 of long term capital loss carryforwards and the Tactical Equity Fund had $48,263 of short term capital loss carryforwards which may reduce the Funds' taxable income arising from future net realized gains on investments, if any, to the extent permitted by the Code and thus may reduce the amount of the distributions to shareholders which would otherwise be necessary to relieve the Funds of any liability for federal tax.
Semi-Annual Report | November 30, 2016
123
The Arbitrage Funds Notes to Financial Statements (continued)
November 30, 2016 (Unaudited)
Late Year Losses
The Event-Driven Fund, the Credit Opportunities Fund and the Tactical Equity Fund elect to defer to the period ending May 31, 2017, capital losses recognized during the period November 1, 2015 to May 31, 2016 in the amount of $27,112,371, $1,345,615 and $60,948, respectively.
The Event-Driven Fund and Tactical Equity Fund have elected to defer late year ordinary losses of $1,217,978 and $298, respectively, as arising on June 1, 2016.
12. INFORMATION REGARDING LEGAL PROCEEDINGS
The Arbitrage Fund and dozens of other entities and individuals have been named as defendants in an adversary proceeding pending in the United States Bankruptcy Court for the Southern District of New York (Weisfelner, as Trustee of the LB Creditor Trust v. Fund 1, et al., Adv. Pro. No. 10-04609). The complaint alleges that payments made to shareholders of Lyondell Chemical Company ("Lyondell") in connection with the acquisition of Lyondell by Basell AF S.C.A. in a cash-out merger in or around December, 2007 constituted constructive or intentional "fraudulent transfers" under applicable state law and seeks to recover from the former Lyondell shareholders the payments received for the shares.
On January 14, 2014, the Court issued a decision and order on motions to dismiss granting in part, and denying in part, the motions. On April 9, 2014, plaintiff filed a Third Amended Complaint continuing to assert constructive or intentional fraudulent transfer claims under applicable state law. On August 1, 2014, defendants filed a motion to dismiss the Third Amended Complaint, and oral arguments on the motion to dismiss was held on January 14, 2015. On November 18, 2015, the Court issued a decision dismissing the intentional fraudulent transfer claim. The plaintiff appealed the November 18, 2015 decision, which was entered as a Final Judgment. On May 4, 2016, based on the March 29, 2016 decision of the U.S. Court of Appeal for the Second Circuit in In re Tribune Fraudulent Conveyance Litigation, defendants moved to dismiss the remaining constructive fraudulent transfer claims in the Creditor Action, or alternatively, to stay all discovery in that action pending the exhaustion of all appeal periods in the Tribune matter.
On July 20, 2016, the Bankruptcy Court entered an opinion granting the motion to dismiss, based on the Second Circuit's decision in Tribune. The Plaintiff filed an objection which requests that, among other things, the case be stayed and the claims not dismissed pending the Tribune appeal. On July 27, 2016, the District Court issued an opinion reversing the Bankruptcy Court's dismissal of the intentional fraudulent transfer claim. The District Court denied defendants' motion for reconsideration, and the claim has been remanded to the Bankruptcy Court.
Currently, the case is in a holding pattern as the parties are waiting for a decision from the District Court regarding the Bankruptcy Court's recommendation to dismiss the constructive fraudulent transfer claims, based on Tribune. Further, the intentional fraudulent transfer claims are pending further discussion with the Bankruptcy Court regarding how to proceed.
At this stage in the proceedings, it is not possible to assess with any reasonable certainty the probable outcome of the pending litigation. Consequently, at this time, management is unable to estimate the possible loss that may result.
13. SUBSEQUENT EVENTS
The Adviser has evaluated the need for disclosures and/or adjustments resulting from events and transactions subsequent to November 30, 2016, through the date the financial statements were issued. There were no such events or transactions requiring adjustments to or disclosure in the Funds' financial statements.
www.arbitragefunds.com | 1-800-295-4485
124
The Arbitrage Funds Disclosure of Fund Expenses
November 30, 2016 (Unaudited)
All mutual funds have operating expenses. As a shareholder of a mutual fund, your investment is affected by these ongoing costs, which include (among others) costs for portfolio management, administrative services, distribution (12b-1) expenses, redemption fees and shareholder reports like this one. It is important for you to understand the impact of these costs on your investment returns.
Operating expenses such as these are deducted from a mutual fund's gross income and directly reduce its final investment return. These expenses are expressed as a percentage of a mutual fund's average net assets; this percentage is known as a mutual fund's expense ratio.
The following examples use the expense ratio and are intended to help you understand the ongoing costs (in dollars) of investing in your Fund and to compare these costs with those of other mutual funds. The examples are based on an investment of $1,000 made at the beginning of the period shown and held for the entire period.
The table on the following page illustrates your Fund's cost in two ways:
Actual Fund Return. The section helps you to estimate the actual expenses after fee waivers that your Fund incurred over the period. The "Expenses Paid During Period" column shows the actual dollar expense cost incurred by a $1,000 investment in the Fund, and the "Ending Account Value" number is derived from deducting that expense cost from the Fund's gross investment return.
You can use this information, together with the actual amount you invested in the Fund, to estimate the expenses you paid over that period. Simply divide your actual account value by $1,000 to arrive at a ratio (for example, an $8,600 account value divided by $1,000 = 8.6), then multiply that ratio by the number shown for your Fund under "Expenses Paid During Period."
Hypothetical 5% Return. This section helps you compare your Fund's costs with those of other mutual funds. It assumes that the Fund had an annual 5% return before expenses during the period, but that expense ratio (Column 3) for the period is unchanged. This example is useful in making comparisons because the Securities and Exchange Commission requires all mutual funds to make this 5% calculation. You can assess your Fund's comparative cost by comparing the hypothetical result for your Fund in the "Expenses Paid During Period" column with those that appear in the same charts in the shareholder reports for other mutual funds.
Note: Because the return is set at 5% for comparison purposes — NOT your Fund's actual return — the account values shown may not apply to your specific investment.
Semi-Annual Report | November 30, 2016
125
The Arbitrage Funds Disclosure of Fund Expenses (continued)
November 30, 2016 (Unaudited)
| Beginning Account Value 06/01/2016 | Ending Account Value 11/30/2016 | Expense Ratio(a) | Expenses Paid During Period(b) | ||||||||||||||||
The Arbitrage Fund | |||||||||||||||||||
Class R | |||||||||||||||||||
Actual | $ | 1,000.00 | $ | 1,007.80 | 1.97 | % | $ | 9.92 | |||||||||||
| Hypothetical (5% return before expenses) | $ | 1,000.00 | $ | 1,015.19 | 1.97 | % | $ | 9.95 | |||||||||||
Class I | |||||||||||||||||||
Actual | $ | 1,000.00 | $ | 1,009.10 | 1.72 | % | $ | 8.66 | |||||||||||
| Hypothetical (5% return before expenses) | $ | 1,000.00 | $ | 1,016.44 | 1.72 | % | $ | 8.69 | |||||||||||
Class C | |||||||||||||||||||
Actual | $ | 1,000.00 | $ | 1,004.00 | 2.72 | % | $ | 13.66 | |||||||||||
| Hypothetical (5% return before expenses) | $ | 1,000.00 | $ | 1,011.43 | 2.72 | % | $ | 13.72 | |||||||||||
Class A | |||||||||||||||||||
Actual | $ | 1,000.00 | $ | 1,007.00 | 1.97 | % | $ | 9.91 | |||||||||||
| Hypothetical (5% return before expenses) | $ | 1,000.00 | $ | 1,015.19 | 1.97 | % | $ | 9.95 | |||||||||||
(a) Annualized, based on the Fund's most recent fiscal half-year expenses.
(b) Expenses, are equal to the Fund's annualized ratio multiplied by the average account value over the period, multiplied by the number of days in the most recent fiscal half year (183), divided by 365.
| Beginning Account Value 06/01/2016 | Ending Account Value 11/30/2016 | Expense Ratio(a) | Expenses Paid During Period(b) | ||||||||||||||||
The Arbitrage Event-Driven Fund | |||||||||||||||||||
Class R | |||||||||||||||||||
Actual | $ | 1,000.00 | $ | 1,012.20 | 2.34 | % | $ | 11.80 | |||||||||||
| Hypothetical (5% return before expenses) | $ | 1,000.00 | $ | 1,013.34 | 2.34 | % | $ | 11.81 | |||||||||||
Class I | |||||||||||||||||||
Actual | $ | 1,000.00 | $ | 1,013.30 | 2.09 | % | $ | 10.55 | |||||||||||
| Hypothetical (5% return before expenses) | $ | 1,000.00 | $ | 1,014.59 | 2.09 | % | $ | 10.56 | |||||||||||
Class C | |||||||||||||||||||
Actual | $ | 1,000.00 | $ | 1,007.90 | 3.09 | % | $ | 15.55 | |||||||||||
| Hypothetical (5% return before expenses) | $ | 1,000.00 | $ | 1,009.58 | 3.09 | % | $ | 15.57 | |||||||||||
Class A | |||||||||||||||||||
Actual | $ | 1,000.00 | $ | 1,012.20 | 2.34 | % | $ | 11.80 | |||||||||||
| Hypothetical (5% return before expenses) | $ | 1,000.00 | $ | 1,013.34 | 2.34 | % | $ | 11.81 | |||||||||||
(a) Annualized, based on the Fund's most recent fiscal half-year expenses.
(b) Expenses, are equal to the Fund's annualized ratio multiplied by the average account value over the period, multiplied by the number of days in the most recent fiscal half year (183), divided by 365.
www.arbitragefunds.com | 1-800-295-4485
126
The Arbitrage Funds Disclosure of Fund Expenses (continued)
November 30, 2016 (Unaudited)
| Beginning Account Value 06/01/2016 | Ending Account Value 11/30/2016 | Expense Ratio(a) | Expenses Paid During Period(b) | ||||||||||||||||
The Arbitrage Credit Opportunities Fund | |||||||||||||||||||
Class R | |||||||||||||||||||
Actual | $ | 1,000.00 | $ | 1,021.30 | 1.63 | % | $ | 8.26 | |||||||||||
| Hypothetical (5% return before expenses) | $ | 1,000.00 | $ | 1,016.90 | 1.63 | % | $ | 8.24 | |||||||||||
Class I | |||||||||||||||||||
Actual | $ | 1,000.00 | $ | 1,022.60 | 1.38 | % | $ | 7.00 | |||||||||||
| Hypothetical (5% return before expenses) | $ | 1,000.00 | $ | 1,018.15 | 1.38 | % | $ | 6.98 | |||||||||||
Class C | |||||||||||||||||||
Actual | $ | 1,000.00 | $ | 1,017.60 | 2.38 | % | $ | 12.04 | |||||||||||
| Hypothetical (5% return before expenses) | $ | 1,000.00 | $ | 1,013.14 | 2.38 | % | $ | 12.01 | |||||||||||
Class A | |||||||||||||||||||
Actual | $ | 1,000.00 | $ | 1,021.40 | 1.63 | % | $ | 8.26 | |||||||||||
| Hypothetical (5% return before expenses) | $ | 1,000.00 | $ | 1,016.90 | 1.63 | % | $ | 8.24 | |||||||||||
(a) Annualized, based on the Fund's most recent fiscal half-year expenses.
(b) Expenses, are equal to the Fund's annualized ratio multiplied by the average account value over the period, multiplied by the number of days in the most recent fiscal half year (183), divided by 365.
| Beginning Account Value 06/01/2016 | Ending Account Value 11/30/2016 | Expense Ratio(a) | Expenses Paid During Period(b) | ||||||||||||||||
The Arbitrage Tactical Equity Fund | |||||||||||||||||||
Class R | |||||||||||||||||||
Actual | $ | 1,000.00 | $ | 1,007.50 | 2.56 | % | $ | 12.88 | |||||||||||
| Hypothetical (5% return before expenses) | $ | 1,000.00 | $ | 1,012.23 | 2.56 | % | $ | 12.91 | |||||||||||
Class I | |||||||||||||||||||
Actual | $ | 1,000.00 | $ | 1,007.50 | 2.31 | % | $ | 11.63 | |||||||||||
| Hypothetical (5% return before expenses) | $ | 1,000.00 | $ | 1,013.49 | 2.31 | % | $ | 11.66 | |||||||||||
Class C | |||||||||||||||||||
Actual | $ | 1,000.00 | $ | 1,007.50 | 3.31 | % | $ | 16.66 | |||||||||||
| Hypothetical (5% return before expenses) | $ | 1,000.00 | $ | 1,008.47 | 3.31 | % | $ | 16.67 | |||||||||||
Class A | |||||||||||||||||||
Actual | $ | 1,000.00 | $ | 1,007.50 | 2.58 | % | $ | 12.98 | |||||||||||
| Hypothetical (5% return before expenses) | $ | 1,000.00 | $ | 1,012.13 | 2.58 | % | $ | 13.01 | |||||||||||
(a) Annualized, based on the Fund's most recent fiscal half-year expenses.
(b) Expenses, are equal to the Fund's annualized ratio multiplied by the average account value over the period, multiplied by the number of days in the most recent fiscal half year (183), divided by 365.
Semi-Annual Report | November 30, 2016
127
The Arbitrage Funds Additional Information
November 30, 2016 (Unaudited)
1. PROXY VOTING POLICIES AND VOTING RECORD
A description of the policies and procedures that the Funds use to vote proxies relating to portfolio securities is available without charge upon request by calling toll-free 1-800-295-4485, or on the Securities and Exchange Commission's ("SEC") website at http://www.sec.gov. Information regarding how the Funds voted proxies will be available without charge upon request by calling toll-free 1-800-295-4485, or on the SEC's website at http://www.sec.gov.
2. QUARTERLY PORTFOLIO HOLDINGS
The Funds file a complete listing of their portfolio holdings with the SEC as of the first and third quarters of each fiscal year on Form N-Q. The filings are available upon request by calling 1-800-295-4485. Furthermore, you may obtain a copy of the filing on the SEC's website at http://www.sec.gov. The Funds' Forms N-Q may also be reviewed and copied at the SEC's Public Reference Room in Washington, D.C., and information on the operation of the Public Reference Room may be obtained by calling 1-800-SEC-0330.
www.arbitragefunds.com | 1-800-295-4485
128
This Page Intentionally Left Blank

The Arbitrage Fund
The Arbitrage Event-Driven Fund
The Arbitrage Credit Opportunities Fund
The Arbitrage Tactical Equity Fund
800-295-4485
www.arbitragefunds.com
Adviser
Water Island Capital, LLC
41 Madison Avenue, 42nd Floor
New York, NY 10010
Distributor
ALPS Distributors, Inc.
1290 Broadway, Suite 1100
Denver, CO 80203
Transfer Agent
DST Systems, Inc.
P.O. Box 219842
Kansas City, MO 64121-9842
Custodian
State Street Bank & Trust
225 Liberty Street
New York, NY 10281
This material must be preceded or accompanied by a prospectus. Please read it carefully before investing.
Item 2. Code of Ethics.
Not applicable to semi-annual report.
Item 3. Audit Committee Financial Expert.
Not applicable to semi-annual report.
Item 4. Principal Accountant Fees and Services.
Not applicable to semi-annual report.
Item 5. Audit Committee of Listed Registrants.
Not applicable.
Item 6. Schedule of Investments.
The Schedule of Investments is included as part of the Report to Stockholders filed under Item 1 of this form.
Item 7. Disclosure of Proxy Voting Policies and Procedures for Closed-End Management Investment Companies.
Not applicable.
Item 8. Portfolio Managers of Closed-End Management Investment Companies.
Not applicable.
Item 9. Purchases of Equity Securities by Closed-End Management Investment Company and Affiliated Purchasers.
Not applicable.
Item 10. Submission of Matters to Vote of Security Holders.
There have been no material changes to the procedures by which shareholders may recommend nominees to the registrant’s Board of Trustees.
Item 11. Controls and Procedures.
(a) The registrant’s principal executive officer and principal financial officer have evaluated the registrant’s disclosure controls and procedures (as defined in Rule 30a-3(c) under the Investment Company Act of 1940, as amended) within 90 days of this filing and have concluded that the registrant’s disclosure controls and procedures were effective, as of that date.
(b) There was no change in the registrant’s internal control over financial reporting (as defined in Rule 30a-3(d) under the Investment Company Act of 1940, as amended) during the second fiscal quarter of the period covered by this report that has materially affected, or is reasonably likely to materially affect, the registrant’s internal control over financial reporting.
Item 12. Exhibits.
(a)(1) Not applicable to semi-annual report.
(a)(2) A separate certification for the principal executive officer and the principal financial officer of the registrant as required by Rule 30a-2(a) under the Investment Company Act of 1940, as amended (17 CFR 270.30a-2(a)), are attached hereto as exhibit Ex-99.CERT.
(a)(3) Not applicable.
(b) The certifications by the registrant’s principal executive officer and principal financial officer, as required by Rule 30a-2(b) of the Investment Company Act of 1940, as amended, and Section 906 of the Sarbanes-Oxley Act of 2002 are attached hereto as Ex-99.906CERT.
SIGNATURES
Pursuant to the requirements of the Securities Exchange Act of 1934 and the Investment Company Act of 1940, the registrant has duly caused this report to be signed on its behalf by the undersigned, thereunto duly authorized.
THE ARBITRAGE FUNDS
By: | /s/ John S. Orrico |
|
| John S. Orrico |
|
| President (Principal Executive Officer) |
|
|
|
|
Date: | February 3, 2017 |
|
Pursuant to the requirements of the Securities Exchange Act of 1934 and the Investment Company Act of 1940, this report has been signed below by the following persons on behalf of the registrant and in the capacities and on the dates indicated.
By: | /s/ John S. Orrico |
|
| John S. Orrico |
|
| President (Principal Executive Officer) |
|
|
|
|
Date: | February 3, 2017 |
|
|
|
|
|
|
|
By: | /s/ Monique Labbe |
|
| Monique Labbe |
|
| Chief Financial Officer (Principal Financial Officer) |
|
|
|
|
Date: | February 3, 2017 |
|