Table of Contents
UNITED STATES
SECURITIES AND EXCHANGE COMMISSION
Washington, D.C. 20549
FORM N-CSRS
CERTIFIED SHAREHOLDER REPORT OF REGISTERED
MANAGEMENT INVESTMENT COMPANIES
Investment Company Act file number: 811-09815
THE ARBITRAGE FUNDS
(exact name of registrant as specified in charter)
41 Madison Avenue, 42nd Floor, New York, NY 10010
(Address of principal executive offices) (Zip code)
John S. Orrico
Water Island Capital, LLC
41 Madison Avenue
42nd Floor
New York, NY 10010
(Name and address of agent for service)
Registrant’s telephone number, including area code: 212-259-2655
Date of fiscal year end: May 31
Date of reporting period: June 1, 2015 – November 30, 2015
Table of Contents
| Item 1. | Reports to Stockholders. |
Table of Contents

Semi-Annual Report
November 30, 2015
The Arbitrage Fund
The Arbitrage Event-Driven Fund
The Arbitrage Credit Opportunities Fund
The Arbitrage Tactical Equity Fund
Table of Contents
| TABLE OF CONTENTS | |||||
| 1 | ||||||
| 3 | ||||||
| 16 | ||||||
| 18 | ||||||
| 34 | ||||||
| 36 | ||||||
| 45 | ||||||
| 48 | ||||||
| 56 | ||||||
| 60 | ||||||
| 62 | ||||||
| 66 | ||||||
| 68 | ||||||
| 70 | ||||||
| 72 | ||||||
| 74 | ||||||
| 76 | ||||||
| 78 | ||||||
| 80 | ||||||
| 82 | ||||||
| 84 | ||||||
| 86 | ||||||
| 88 | ||||||
| 90 | ||||||
| 92 | ||||||
| 94 | ||||||
| 96 | ||||||
| 98 | ||||||
| 128 | ||||||
| 131 | ||||||

Table of Contents
| The Arbitrage Fund | Portfolio Information | |
| November 30, 2015 (Unaudited) |
Performance (annualized returns as of November 30, 2015)
| One Year | Five Year | Ten Year | Since Inception* | |||||||||||||
Arbitrage Fund, Class R | 1.03% | 1.39% | 3.14% | 4.22% | ||||||||||||
Arbitrage Fund, Class I | 1.16% | 1.62% | 3.36% | 2.98% | ||||||||||||
Arbitrage Fund, Class C** | 0.25% | N/A | N/A | 0.17% | ||||||||||||
Arbitrage Fund, Class A*** | 0.95% | N/A | N/A | 1.11% | ||||||||||||
S&P 500® Index | 2.75% | 14.40% | 7.48% | 4.35% | ||||||||||||
HFRI Event Driven: Merger Arbitrage Index | 2.56% | 2.75% | 4.56% | 4.35% | ||||||||||||
Barclays Capital U.S. Aggregate Bond Index | 0.97% | 3.09% | 4.65% | 5.25% | ||||||||||||
Current performance may be higher or lower than performance quoted above. Any performance data quoted represents past performance and the investment return and principal value of an investment in the Fund will fluctuate so that an investor’s shares, when redeemed, may be worth more or less than their original cost. Past performance is no guarantee of future results. Returns do not reflect a 2% redemption fee for shares that are redeemed from the fund within 30 days of purchase, which, if reflected, would reduce the performance quoted. Returns shown above include the reinvestment of all dividends and capital gains. Contractual fee waivers are currently in effect. Without such fee waivers, performance numbers would be reduced. You can obtain performance data current to the most recent month end by calling 1-800-295-4485 or going to www.arbitragefunds.com.
* Class R inception: 9/17/00; Class I inception: 10/17/03; Class C inception: 6/1/12; Class A inception: 6/1/13.
** Class C shares are subject to a 1.00% contingent deferred sales charge on all purchases redeemed in 12 months of purchase.
*** Class A shares are subject to a maximum front-end sales load of 2.50% on purchases up to $250,000. The shares are also subject to a deferred sales charge of up to 0.50% on purchases of $250,000 or more purchased without a front-end sales load and redeemed within 12 months of purchase.
The Total Annual Fund Operating Expenses for Class R, Class I, Class C and Class A are 2.31%, 2.06%, 3.06% and 2.31%, respectively.
The HFRI Event Driven: Merger Arbitrage Index is an index consisting of merger arbitrage strategies which employ an investment process primarily focused on opportunities in equity and equity related instruments of companies which are currently engaged in a corporate transaction. Merger Arbitrage involves primarily announced transactions, typically with limited or no exposure to situations which pre-, post-date or situations in which no formal announcement is expected to occur. Opportunities are frequently presented in cross border, collared and international transactions which incorporate multiple geographic regulatory institutions, with typically involve minimal exposure to corporate credits.
The S&P 500® Index is an unmanaged index consisting of 500 stocks.
The Barclays Capital U.S. Aggregate Bond Index is a market value-weighted index of investment grade fixed-rated debt issues, including government, corporate, asset-backed and mortgage-backed securities with a maturity of one year or more.
An investor may not invest directly in an index
| Semi-Annual Report | November 30, 2015 | 1 |
Table of Contents
| The Arbitrage Fund | Portfolio Information (continued) | |
| November 30, 2015 (Unaudited) |
Growth of $10,000 Investment
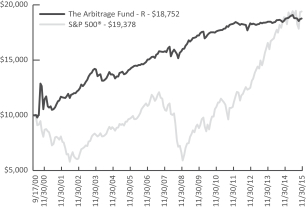 | The chart represents historical performance of a hypothetical investment of $10,000 in the Class R shares of the Fund since inception. Past performance does not guarantee future results. This chart does not reflect the deduction of taxes that a shareholder would pay on Fund distributions or the redemption of Fund shares. |
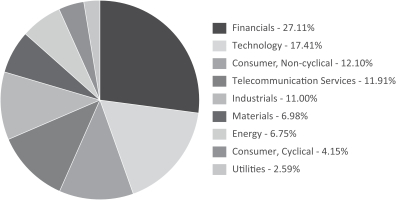
Sector Weighting
The following chart shows the sector weightings of Arbitrage Fund’s investments in common stock and limited partnerships as of the report date.
| 2 | www.arbitragefunds.com | 1-800-295-4485 |
Table of Contents
| The Arbitrage Fund | Portfolio of Investments | |
| November 30, 2015 (Unaudited) |
| Shares | Value | |||||||
| COMMON STOCKS - 88.02% | ||||||||
| Advertising - 0.65% | ||||||||
Journal Media Group, Inc. | 1,079,432 | $ | 13,017,950 | |||||
|
| |||||||
| Auto Parts & Equipment - 0.33% | ||||||||
Montupet | 86,000 | 6,493,090 | ||||||
|
| |||||||
| Banks - 1.24% | ||||||||
National Penn Bancshares, Inc. | 1,977,212 | 24,695,378 | ||||||
|
| |||||||
| Biotechnology - 0.03% | ||||||||
Ocata Therapeutics, Inc.(a) | 66,222 | 568,185 | ||||||
|
| |||||||
| Chemicals - 7.32% | ||||||||
Airgas, Inc.(b) | 71,400 | 9,867,480 | ||||||
Alent Plc | 6,603,414 | 50,025,336 | ||||||
Cytec Industries, Inc. | 1,149,784 | 86,084,328 | ||||||
|
| |||||||
| 145,977,144 | ||||||||
|
| |||||||
| Commercial Services - 0.10% | ||||||||
Veda Group Ltd. | 1,000,000 | 1,996,033 | ||||||
|
| |||||||
| Computers & Computer Services - 0.32% | ||||||||
EMC Corp.(b) | 81,000 | 2,052,540 | ||||||
SanDisk Corp.(b) | 59,800 | 4,417,426 | ||||||
|
| |||||||
| 6,469,966 | ||||||||
|
| |||||||
| Electric - 0.35% | ||||||||
Enel Green Power SpA | 1,861,918 | 3,932,451 | ||||||
NextEra Energy, Inc. | 30,871 | 3,082,778 | ||||||
|
| |||||||
| 7,015,229 | ||||||||
|
| |||||||
| Food - 1.36% | ||||||||
Boulder Brands, Inc.(a) | 683,657 | 7,472,371 | ||||||
Diamond Foods, Inc.(a)(b) | 484,562 | 19,615,070 | ||||||
|
| |||||||
| 27,087,441 | ||||||||
|
| |||||||
| Gas - 1.75% | ||||||||
AGL Resources, Inc. | 398,100 | 24,909,117 | ||||||
Piedmont Natural Gas Co., Inc.(c) | 172,000 | 10,001,800 | ||||||
|
| |||||||
| 34,910,917 | ||||||||
|
| |||||||
| Healthcare - Products - 0.24% | ||||||||
STERIS Plc | 63,400 | 4,842,492 | ||||||
|
| |||||||
See Notes to Financial Statements.
| Semi-Annual Report | November 30, 2015 | 3 |
Table of Contents
| The Arbitrage Fund | Portfolio of Investments (continued) | |
| November 30, 2015 (Unaudited) |
| Shares | Value | |||||||
| COMMON STOCKS - 88.02% (Continued) | ||||||||
| Healthcare - Services - 4.88% | ||||||||
Amica Mature Lifestyles, Inc. | 1,083,700 | $ | 15,012,505 | |||||
Health Net, Inc.(a) | 1,301,847 | 82,354,841 | ||||||
|
| |||||||
| 97,367,346 | ||||||||
|
| |||||||
| Household Products/Wares - 0.37% | ||||||||
Wausau Paper Corp. | 723,163 | 7,405,189 | ||||||
|
| |||||||
| Insurance - 19.11% | ||||||||
ACE Ltd.(b) | 47,703 | 5,478,690 | ||||||
Amlin Plc | 4,075,000 | 40,475,844 | ||||||
Chubb Corp. | 659,212 | 86,046,942 | ||||||
PartnerRe Ltd.(c) | 1,069,262 | 148,766,422 | ||||||
StanCorp Financial Group, Inc. | 343,041 | 38,983,179 | ||||||
Symetra Financial Corp.(c) | 1,952,991 | 61,480,157 | ||||||
|
| |||||||
| 381,231,234 | ||||||||
|
| |||||||
| Internet - 3.17% | ||||||||
HomeAway, Inc.(a) | 1,561,632 | 55,219,308 | ||||||
Youku Tudou, Inc., ADR(a)(b) | 300,000 | 8,061,000 | ||||||
|
| |||||||
| 63,280,308 | ||||||||
|
| |||||||
| Leisure Time - 1.66% | ||||||||
Steiner Leisure Ltd.(a) | 528,348 | 33,222,522 | ||||||
|
| |||||||
| Lodging - 0.51% | ||||||||
Starwood Hotels & Resorts Worldwide, Inc. | 140,400 | 10,086,336 | ||||||
|
| |||||||
| Media - 4.44% | ||||||||
Cablevision Systems Corp., Class A(b) | 765,068 | 23,334,574 | ||||||
Media General, Inc.(a)(b) | 666,904 | 10,357,019 | ||||||
RealD, Inc.(a) | 1,137,067 | 11,939,203 | ||||||
Time Warner Cable, Inc. | 232,652 | 42,987,110 | ||||||
|
| |||||||
| 88,617,906 | ||||||||
|
| |||||||
| Metal Fabricate & Hardware - 6.57% | ||||||||
Precision Castparts Corp.(b)(c) | 566,199 | 131,097,716 | ||||||
|
| |||||||
| Miscellaneous Manufacturing - 0.47% | ||||||||
Koninklijke Ten Cate N.V. | 359,620 | 9,346,928 | ||||||
|
| |||||||
| Oil & Gas - 0.43% | ||||||||
Canadian Oil Sands Ltd. | 1,351,687 | 8,664,076 | ||||||
|
| |||||||
See Notes to Financial Statements.
| 4 | www.arbitragefunds.com | 1-800-295-4485 |
Table of Contents
| The Arbitrage Fund | Portfolio of Investments (continued) | |
| November 30, 2015 (Unaudited) |
| Shares | Value | |||||||
| COMMON STOCKS - 88.02% (Continued) | ||||||||
| Oil & Gas Services - 2.22% | ||||||||
Cameron International Corp.(a) | 648,449 | $ | 44,282,582 | |||||
|
| |||||||
| Pharmaceuticals - 2.49% | ||||||||
Allergan Plc(a) | 11,500 | 3,609,735 | ||||||
Depomed, Inc.(a)(b) | 100,000 | 1,944,000 | ||||||
Dyax Corp.(a) | 348,100 | 11,717,046 | ||||||
ZS Pharma, Inc.(a)(b) | 360,000 | 32,385,600 | ||||||
|
| |||||||
| 49,656,381 | ||||||||
|
| |||||||
| Pipelines - 1.22% | ||||||||
Williams Companies, Inc. | 667,411 | 24,400,546 | ||||||
|
| |||||||
| Real Estate Investment Trusts - 4.79% | ||||||||
BioMed Realty Trust, Inc. | 1,729,992 | 40,602,912 | ||||||
Charter Hall Office REIT(a) | 24,845,404 | 18,327 | ||||||
Strategic Hotels & Resorts, Inc.(a) | 3,876,848 | 54,896,168 | ||||||
|
| |||||||
| 95,517,407 | ||||||||
|
| |||||||
| Retail - 1.34% | ||||||||
Pep Boys-Manny Moe & Jack(a)(b) | 1,338,685 | 20,789,778 | ||||||
Rite Aid Corp.(a)(b) | 500,000 | 3,940,000 | ||||||
Roundy’s, Inc.(a) | 563,678 | 2,017,967 | ||||||
|
| |||||||
| 26,747,745 | ||||||||
|
| |||||||
| Semiconductors - 8.41% | ||||||||
Altera Corp.(b)(c) | 739,494 | 39,045,283 | ||||||
Broadcom Corp., Class A(c) | 902,258 | 49,290,355 | ||||||
Fairchild Semiconductor International, Inc.(a) | 350,600 | 6,850,724 | ||||||
KLA-Tencor Corp.(b) | 313,751 | 20,855,029 | ||||||
NXP Semiconductors N.V.(a) | 72,293 | 6,756,504 | ||||||
PMC-Sierra, Inc.(a)(b) | 3,808,870 | 45,058,932 | ||||||
|
| |||||||
| 167,856,827 | ||||||||
|
| |||||||
| Software - 6.14% | ||||||||
King Digital Entertainment Plc(b) | 1,706,259 | 30,183,722 | ||||||
MedAssets, Inc.(a) | 437,179 | 13,172,203 | ||||||
SolarWinds, Inc.(a)(b)(c) | 443,300 | 25,902,019 | ||||||
Solera Holdings, Inc. | 643,042 | 34,557,077 | ||||||
VMware, Inc., Class A(a)(b) | 304,009 | 18,669,193 | ||||||
|
| |||||||
| 122,484,214 | ||||||||
|
| |||||||
See Notes to Financial Statements.
| Semi-Annual Report | November 30, 2015 | 5 |
Table of Contents
| The Arbitrage Fund | Portfolio of Investments (continued) | |
| November 30, 2015 (Unaudited) |
| Shares | Value | |||||||
| COMMON STOCKS - 88.02% (Continued) | ||||||||
| Telecommunications - 1.62% | ||||||||
EZchip Semiconductor Ltd.(a) | 686,658 | $ | 17,070,318 | |||||
Premiere Global Services, Inc.(a) | 1,096,099 | 15,202,893 | ||||||
|
| |||||||
| 32,273,211 | ||||||||
|
| |||||||
| Transportation - 4.49% | ||||||||
Ansaldo STS SpA | 4,897,484 | 50,580,105 | ||||||
TNT Express N.V. | 4,777,747 | 38,919,519 | ||||||
|
| |||||||
| 89,499,624 | ||||||||
|
| |||||||
| TOTAL COMMON STOCKS (Cost $1,750,023,710) | 1,756,111,923 | |||||||
|
| |||||||
| RIGHTS - 0.53% | ||||||||
ArthroCare Corp., CVR (No expiration)(a)(d)(e) | 3,215,721 | 1,206,539 | ||||||
Casa Ley, CVR, Expires 01/30/2018(a)(d)(e) | 6,223,326 | 2,360,508 | ||||||
Chelsea Therapeutics, CVR, Expires 03/31/2018(a)(d)(e) | 2,389,273 | 131,410 | ||||||
Cubist Pharmaceuticals, Inc., CPR, Expires 07/01/2019(a)(d)(e) | 119,343 | 0 | ||||||
Leap Wireless International, CVR, Expires 03/13/2017(a)(d)(e) | 1,783,190 | 6,686,962 | ||||||
PDC, CVR, Expires 03/31/2016(a)(d)(e) | 6,223,326 | 146,870 | ||||||
Trius Therapeutics, CVR, Expires 02/15/2017(a)(d)(e) | 1,034,403 | 92,165 | ||||||
|
| |||||||
| TOTAL RIGHTS (Cost $12,345,884) | 10,624,454 | |||||||
|
| |||||||
| Expiration Date | Exercise Price | Contracts | Value | |||||||||||||
| PURCHASED OPTIONS(a) - 0.07% | ||||||||||||||||
| Call Options Purchased - 0.01% | ||||||||||||||||
Airgas, Inc. | 12/2015 | $ | 140.00 | 251 | $ | 8,157 | ||||||||||
Cablevision Systems Corp. | 01/2016 | 32.00 | 63 | 3,938 | ||||||||||||
EMC Corp. | 12/2015 | 29.00 | 810 | 2,025 | ||||||||||||
New York Community Bancorp, Inc. | 12/2015 | 18.00 | 200 | 500 | ||||||||||||
PMC-Sierra, Inc. | 12/2015 | 12.00 | 141 | 353 | ||||||||||||
SolarWinds, Inc. | 12/2015 | 60.00 | 997 | 7,477 | ||||||||||||
UTI Worldwide, Inc. | 05/2016 | 7.50 | 828 | 4,140 | ||||||||||||
VMware, Inc., Class A | 04/2016 | 60.00 | 218 | 123,170 | ||||||||||||
|
| |||||||||||||||
| TOTAL CALL OPTIONS PURCHASED (Cost $199,157) | 149,760 | |||||||||||||||
|
| |||||||||||||||
See Notes to Financial Statements.
| 6 | www.arbitragefunds.com | 1-800-295-4485 |
Table of Contents
| The Arbitrage Fund | Portfolio of Investments (continued) | |
| November 30, 2015 (Unaudited) |
| Expiration Date | Exercise Price | Contracts | Value | |||||||||||||
| PURCHASED OPTIONS(a) - 0.07% (Continued) | ||||||||||||||||
| Put Options Purchased - 0.06% | ||||||||||||||||
Altera Corp. | 02/2016 | $ | 45.00 | 1,872 | $ | 74,880 | ||||||||||
AXIS Capital Holdings Ltd. | 12/2015 | 50.00 | 1,254 | 21,945 | ||||||||||||
Charter Communications, Inc. | 03/2016 | 190.00 | 135 | 199,125 | ||||||||||||
Depomed, Inc. | 12/2015 | 20.00 | 1,000 | 145,000 | ||||||||||||
Expedia, Inc. | 12/2015 | 135.00 | 50 | 61,000 | ||||||||||||
KLA-Tencor Corp. | 01/2016 | 65.00 | 1,397 | 213,042 | ||||||||||||
Lam Research Corp.: | ||||||||||||||||
| 12/2015 | 75.00 | 193 | 16,888 | |||||||||||||
| 01/2016 | 75.00 | 550 | 101,750 | |||||||||||||
Media General, Inc. | 12/2015 | 15.00 | 177 | 7,523 | ||||||||||||
Precision Castparts Corp. | 12/2015 | 210.00 | 22 | 495 | ||||||||||||
Receptos, Inc.: | ||||||||||||||||
| 12/2015 | 180.00 | 134 | 0 | |||||||||||||
| 12/2015 | 185.00 | 163 | 0 | |||||||||||||
| 12/2015 | 190.00 | 512 | 0 | |||||||||||||
Rite Aid Corp. | 04/2016 | 7.00 | 4,747 | 123,422 | ||||||||||||
SanDisk Corp. | 01/2016 | 75.00 | 598 | 183,885 | ||||||||||||
Youku Tudou, Inc. | 03/2016 | 24.00 | 3,000 | 60,000 | ||||||||||||
ZS Pharma, Inc.: | ||||||||||||||||
| 12/2015 | 65.00 | 2,752 | 13,760 | |||||||||||||
| 01/2016 | 65.00 | 350 | 2,625 | |||||||||||||
|
| |||||||||||||||
| TOTAL PUT OPTIONS PURCHASED (Cost $2,551,749) | 1,225,340 | |||||||||||||||
|
| |||||||||||||||
| TOTAL PURCHASED OPTIONS (Cost $2,750,906) | 1,375,100 | |||||||||||||||
|
| |||||||||||||||
| Yield | Shares | Value | ||||||||||||||
SHORT-TERM INVESTMENTS - 11.25% |
| |||||||||||||||
Money Market Fund |
| |||||||||||||||
State Street Institutional Liquid Reserves Fund | 0.150% | (f) | 224,320,804 | $ | 224,320,804 | |||||||||||
|
| |||||||||||||||
| TOTAL SHORT-TERM INVESTMENTS (Cost $224,320,804) | 224,320,804 | |||||||||||||||
|
| |||||||||||||||
| Total Investments - 99.87% (Cost $1,989,441,304) | 1,992,432,281 | |||||||||||||||
| Other Assets in Excess of Liabilities - 0.13% | 2,630,348 | (g) | ||||||||||||||
|
| |||||||||||||||
| NET ASSETS - 100.00% | $ | 1,995,062,629 | ||||||||||||||
|
| |||||||||||||||
See Notes to Financial Statements.
| Semi-Annual Report | November 30, 2015 | 7 |
Table of Contents
| The Arbitrage Fund | Portfolio of Investments (continued) | |
| November 30, 2015 (Unaudited) |
| (a) | Non-income-producing security. |
| (b) | Underlying security for a written/purchased call/put option. |
| (c) | Security, or a portion of security, is being held as collateral for short sales or written option contracts. At period end, the aggregate market value of those securities was $211,428,000, representing 10.60% of net assets. |
| (d) | Security considered illiquid. On November 30, 2015, the total market value of these securities was $10,624,454, representing 0.53% of net assets. |
| (e) | Security fair valued using methods determined in good faith by the Pricing Committee. As of November 30, 2015, the total market value of these securities was $10,624,454, representing 0.53% of net assets. |
| (f) | Rate shown is the 7-day effective yield as of November 30, 2015. |
| (g) | Includes cash which is being held as collateral for short sales and written option contracts. |
Securities are determined to be illiquid under the procedures approved by the Funds’ Board of Trustees. Information related to the illiquid securities is as follows:
| Date of Purchase | Security | Cost | Market Value | % of Net Assets | ||||||||||
05/30/2014 | ArthroCare Corp., CVR | $ | 1,125,502 | $ | 1,206,539 | 0.06 | % | |||||||
01/30/2015 | Casa Ley, CVR | 6,316,054 | 2,360,508 | 0.12 | ||||||||||
06/24/2014 | Chelsea Therapeutics, CVR | 0 | 131,410 | 0.01 | ||||||||||
12/12/2011 | Cubist Pharmaceuticals, Inc., CPR | 0 | 0 | 0.00 | ||||||||||
03/14/2014 | Leap Wireless International, CVR | 4,600,630 | 6,686,962 | 0.33 | ||||||||||
01/30/2015 | PDC, CVR | 303,698 | 146,870 | 0.01 | ||||||||||
09/12/2013 | Trius Therapeutics, CVR | 0 | 92,165 | 0.00 | ||||||||||
|
| |||||||||||||
| $ | 10,624,454 | 0.53 | % | |||||||||||
|
| |||||||||||||
| SCHEDULE OF SECURITIES SOLD SHORT | Shares | Value | ||||||
| COMMON STOCKS - (15.81%) | ||||||||
| Banks - (0.86%) | ||||||||
BB&T Corp. | (443,654 | ) | $ | (17,133,918 | ) | |||
|
| |||||||
| Computers & Computer Services - (0.49%) | ||||||||
EMC Corp. | (385,009 | ) | (9,756,128 | ) | ||||
|
| |||||||
| Electric - (0.61%) | ||||||||
Enel SpA | (902,461 | ) | (3,979,888 | ) | ||||
Hawaiian Electric Industries, Inc. | (128,228 | ) | (3,664,756 | ) | ||||
Pepco Holdings, Inc. | (173,270 | ) | (4,447,841 | ) | ||||
|
| |||||||
| (12,092,485 | ) | |||||||
|
| |||||||
| Food - (0.41%) | ||||||||
Snyder’s-Lance, Inc. | (219,825 | ) | (8,148,913 | ) | ||||
|
| |||||||
See Notes to Financial Statements.
| 8 | www.arbitragefunds.com | 1-800-295-4485 |
Table of Contents
| The Arbitrage Fund | Portfolio of Investments (continued) | |
| November 30, 2015 (Unaudited) |
| SCHEDULE OF SECURITIES SOLD SHORT | Shares | Value | ||||||
| COMMON STOCKS - (15.81%) (Continued) | ||||||||
| Healthcare - Products - (0.24%) | ||||||||
STERIS Plc | (63,400 | ) | $ | (4,842,492 | ) | |||
|
| |||||||
| Healthcare - Services - (2.34%) | ||||||||
Centene Corp. | (809,602 | ) | (46,754,516 | ) | ||||
|
| |||||||
| Insurance - (2.41%) | ||||||||
ACE Ltd. | (419,071 | ) | (48,130,304 | ) | ||||
|
| |||||||
| Internet - (1.96%) | ||||||||
Expedia, Inc. | (317,477 | ) | (39,084,593 | ) | ||||
|
| |||||||
| Lodging - (0.51%) | ||||||||
Interval Leisure Group, Inc. | (60,119 | ) | (939,059 | ) | ||||
Marriott International, Inc., Class A | (129,168 | ) | (9,159,303 | ) | ||||
|
| |||||||
| (10,098,362 | ) | |||||||
|
| |||||||
| Media - (1.23%) | ||||||||
Charter Communications, Inc., Class A | (112,048 | ) | (20,993,313 | ) | ||||
Nexstar Broadcasting Group, Inc., Class A | (59,888 | ) | (3,508,838 | ) | ||||
|
| |||||||
| (24,502,151 | ) | |||||||
|
| |||||||
| Oil & Gas - (0.47%) | ||||||||
Suncor Energy, Inc. | (338,007 | ) | (9,339,517 | ) | ||||
|
| |||||||
| Oil & Gas Services - (1.79%) | ||||||||
Schlumberger Ltd. | (464,108 | ) | (35,805,932 | ) | ||||
|
| |||||||
| Pharmaceuticals - (0.21%) | ||||||||
Pfizer, Inc. | (129,950 | ) | (4,258,462 | ) | ||||
|
| |||||||
| Retail - (0.01%) | ||||||||
Pep Boys-Manny Moe & Jack | (7,900 | ) | (122,687 | ) | ||||
|
| |||||||
| Semiconductors - (2.27%) | ||||||||
Avago Technologies Ltd. | (175,477 | ) | (22,890,975 | ) | ||||
Freescale Semiconductor Ltd. | (205,017 | ) | (7,977,211 | ) | ||||
Lam Research Corp. | (57,685 | ) | (4,510,966 | ) | ||||
Microsemi Corp. | (277,366 | ) | (9,987,950 | ) | ||||
|
| |||||||
| (45,367,102 | ) | |||||||
|
| |||||||
| TOTAL COMMON STOCKS (Proceeds $313,613,051) | (315,437,562 | ) | ||||||
|
| |||||||
See Notes to Financial Statements.
| Semi-Annual Report | November 30, 2015 | 9 |
Table of Contents
| The Arbitrage Fund | Portfolio of Investments (continued) | |
| November 30, 2015 (Unaudited) |
| SCHEDULE OF SECURITIES SOLD SHORT | Shares | Value | ||||||
| LIMITED PARTNERSHIPS - (0.94%) | ||||||||
| Pipelines - (0.94%) | ||||||||
Energy Transfer Equity LP | (985,337 | ) | $ | (18,662,283 | ) | |||
|
| |||||||
| TOTAL LIMITED PARTNERSHIPS (Proceeds $23,084,387) | (18,662,283 | ) | ||||||
|
| |||||||
| RIGHTS - (0.00%)(a) | ||||||||
Chelsea Therapeutics, CVR, Expires 03/31/2018 | (1,100 | ) | (60 | ) | ||||
|
| |||||||
| TOTAL RIGHTS (Proceeds $0) | (60 | ) | ||||||
|
| |||||||
| TOTAL SECURITIES SOLD SHORT (Proceeds $336,697,438) | $ | (334,099,905 | ) | |||||
|
| |||||||
| (a) | Less than 0.005% of net assets. |
| SCHEDULE OF WRITTEN OPTIONS | Expiration Date | Exercise Price | Contracts | Value | ||||||||||||
| Written Call Options | ||||||||||||||||
ACE Ltd. | 12/2015 | $ | 115.00 | (254 | ) | $ | (41,275 | ) | ||||||||
Cablevision Systems Corp. | 12/2015 | 30.00 | (403 | ) | (40,082 | ) | ||||||||||
Diamond Foods, Inc.: | ||||||||||||||||
| 12/2015 | 37.00 | (206 | ) | (96,820 | ) | |||||||||||
| 12/2015 | 38.00 | (206 | ) | (64,375 | ) | |||||||||||
| 12/2015 | 39.00 | (336 | ) | (102,480 | ) | |||||||||||
| 12/2015 | 40.00 | (336 | ) | (68,040 | ) | |||||||||||
Energy Transfer Equity LP | 12/2015 | 20.00 | (99 | ) | (4,950 | ) | ||||||||||
King Digital Entertainment Plc: | ||||||||||||||||
| 12/2015 | 18.00 | (200 | ) | (500 | ) | |||||||||||
| 02/2016 | 18.00 | (6,984 | ) | (34,920 | ) | |||||||||||
| 02/2016 | 19.00 | (203 | ) | (507 | ) | |||||||||||
KLA-Tencor Corp. | 12/2015 | 67.50 | (1,438 | ) | (104,255 | ) | ||||||||||
Microsemi Corp. | 12/2015 | 35.00 | (163 | ) | (26,895 | ) | ||||||||||
Nexstar Broadcasting Group, Inc., Class A | 12/2015 | 60.00 | (108 | ) | (14,040 | ) | ||||||||||
Pep Boys-Manny Moe & Jack: | ||||||||||||||||
| 12/2015 | 15.00 | (2,591 | ) | (136,027 | ) | |||||||||||
| 01/2016 | 15.00 | (1,430 | ) | (75,075 | ) | |||||||||||
Rite Aid Corp.: | ||||||||||||||||
| 12/2015 | 8.00 | (600 | ) | (3,000 | ) | |||||||||||
| 01/2016 | 8.00 | (200 | ) | (2,952 | ) | |||||||||||
SanDisk Corp. | 12/2015 | 77.50 | (28 | ) | (630 | ) | ||||||||||
See Notes to Financial Statements.
| 10 | www.arbitragefunds.com | 1-800-295-4485 |
Table of Contents
| The Arbitrage Fund | Portfolio of Investments (continued) | |
| November 30, 2015 (Unaudited) |
| SCHEDULE OF WRITTEN OPTIONS | Expiration Date | Exercise Price | Contracts | Value | ||||||||||||
| Written Call Options (Continued) | ||||||||||||||||
Snyder’s-Lance, Inc. | 12/2015 | $ | 35.00 | (693 | ) | $ | (157,658 | ) | ||||||||
VMware, Inc., Class A: | ||||||||||||||||
| 12/2015 | 65.00 | (132 | ) | (9,240 | ) | |||||||||||
| 04/2016 | 75.00 | (218 | ) | (28,340 | ) | |||||||||||
Youku Tudou, Inc. | 03/2016 | 27.00 | (3,000 | ) | (142,500 | ) | ||||||||||
ZS Pharma, Inc.: | ||||||||||||||||
| 12/2015 | 90.00 | (2,252 | ) | (78,820 | ) | |||||||||||
| 12/2015 | 95.00 | (500 | ) | (6,250 | ) | |||||||||||
| 01/2016 | 90.00 | (350 | ) | (15,750 | ) | |||||||||||
|
| |||||||||||||||
| TOTAL WRITTEN CALL OPTIONS (Premiums received $1,008,528) | (1,255,381 | ) | ||||||||||||||
|
| |||||||||||||||
| Written Put Options | ||||||||||||||||
Airgas, Inc. | 12/2015 | 135.00 | (251 | ) | (5,648 | ) | ||||||||||
EMC Corp. | 12/2015 | 25.00 | (90 | ) | (3,060 | ) | ||||||||||
Microsemi Corp. | 12/2015 | 30.00 | (133 | ) | (3,325 | ) | ||||||||||
VMware, Inc., Class A: | ||||||||||||||||
| 12/2015 | 55.00 | (132 | ) | (4,290 | ) | |||||||||||
| 04/2016 | 50.00 | (218 | ) | (38,150 | ) | |||||||||||
|
| |||||||||||||||
| TOTAL WRITTEN PUT OPTIONS (Premiums received $89,316) | (54,473 | ) | ||||||||||||||
|
| |||||||||||||||
| TOTAL WRITTEN OPTIONS (Premiums received $1,097,844) | $ | (1,309,854 | ) | |||||||||||||
|
| |||||||||||||||
EQUITY SWAP CONTRACTS
| Swap Counterparty | Reference Obligation | Rate Paid/Received by the Fund | Termination Dates | Notional Amount | Unrealized Appreciation | |||||||||
Goldman, Sachs & Co. | Hellermann Tyton Group Plc | Paid 1 Month-LIBOR plus 0.90 bps | 08/03/2016 | $ | (31,246,111 | ) | $ | 5,272 | ||||||
Goldman, Sachs & Co. | Alent Plc | Paid 1 Month-LIBOR plus 0.60 bps | 10/19/2016 | (6,321,387 | ) | 70,622 | ||||||||
Goldman, Sachs & Co. | Amlin Plc | Paid 1 Month-LIBOR plus 0.45 bps | 10/24/2016 | (3,295,000 | ) | 3,765 | ||||||||
Morgan Stanley | Amlin Plc | Paid 1 Month-LIBOR plus 0.80 bps | 02/17/2017 | (10,539,775 | ) | 18,413 | ||||||||
See Notes to Financial Statements.
| Semi-Annual Report | November 30, 2015 | 11 |
Table of Contents
| The Arbitrage Fund | Portfolio of Investments (continued) | |
| November 30, 2015 (Unaudited) |
| Swap Counterparty | Reference Obligation | Rate Paid/Received by the Fund | Termination Dates | Notional Amount | Unrealized Appreciation | |||||||||
Morgan Stanley | BG Group Plc | Paid 1 Month-LIBOR plus 0.45 bps | 02/17/2017 | $ | (2,411,617 | ) | $ | 94,904 | ||||||
|
| |||||||||||||
| $ | (53,813,890 | ) | $ | 192,976 | ||||||||||
|
| |||||||||||||
| Swap Counterparty | Reference Obligation | Rate Paid/Received by the Fund | Termination Dates | Notional Amount | Unrealized Depreciation | |||||||||
Morgan Stanley | Hellermann Tyton Group Plc | Paid 1 Month-LIBOR plus 0.80 bps | 02/17/2017 | $ | (4,585,916 | ) | $ | (6,159 | ) | |||||
Morgan Stanley | Royal Dutch Shell Plc | Received 1 Month- LIBOR plus 0.45 bps | 02/17/2017 | 1,746,920 | (27,599 | ) | ||||||||
Morgan Stanley | SABMiller Plc | Received 1 Month- LIBOR plus 0.50 bps | 02/17/2017 | 3,028,633 | (32,167 | ) | ||||||||
|
| |||||||||||||
| $ | 189,637 | $ | (65,925 | ) | ||||||||||
|
| |||||||||||||
OUTSTANDING FORWARD FOREIGN CURRENCY EXCHANGE CONTRACTS
| Contract Description | Counterparty | Contracts to Deliver/Receive | Purchase/Sale Contract | Expiration Date | Current Value | Unrealized Appreciation | ||||||||||||
AUD | Goldman Sachs | 6,549,013 | Purchase | 12/15/2015 | 4,732,911 | $ | 90,389 | |||||||||||
AUD | Goldman Sachs | 2,945,800 | Sale | 12/15/2015 | 2,128,903 | 2,316 | ||||||||||||
CAD | Goldman Sachs | 35,071,700 | Sale | 12/15/2015 | 26,261,307 | 231,095 | ||||||||||||
EUR | Goldman Sachs | 156,750,798 | Sale | 12/15/2015 | 165,668,999 | 10,559,638 | ||||||||||||
GBP | Goldman Sachs | 102,182,900 | Sale | 12/15/2015 | 153,898,420 | 3,525,574 | ||||||||||||
JPY | Goldman Sachs | 273,300 | Sale | 12/15/2015 | 2,221 | 56 | ||||||||||||
|
| |||||||||||||||||
| $ | 14,409,068 | |||||||||||||||||
|
| |||||||||||||||||
| Contract Description | Counterparty | Contracts to Deliver/Receive | Purchase/Sale Contract | Expiration Date | Current Value | Unrealized Depreciation | ||||||||||||
AUD | Goldman Sachs | 2,856,200 | Purchase | 12/15/2015 | 2,064,150 | $ | (7,327 | ) | ||||||||||
AUD | Goldman Sachs | 9,209,413 | Sale | 12/15/2015 | 6,655,558 | (173,917 | ) | |||||||||||
CAD | Goldman Sachs | 17,334,700 | Purchase | 12/15/2015 | 12,980,034 | (267,551 | ) | |||||||||||
CAD | Goldman Sachs | 1,383,100 | Sale | 12/15/2015 | 1,035,650 | (1,053 | ) | |||||||||||
EUR | Goldman Sachs | 57,088,800 | Purchase | 12/15/2015 | 60,336,818 | (3,849,166 | ) | |||||||||||
GBP | Goldman Sachs | 32,250,200 | Purchase | 12/15/2015 | 48,572,265 | (720,076 | ) | |||||||||||
JPY | Goldman Sachs | 273,300 | Purchase | 12/15/2015 | 2,221 | (36 | ) | |||||||||||
|
| |||||||||||||||||
| $ | (5,019,126 | ) | ||||||||||||||||
|
| |||||||||||||||||
See Notes to Financial Statements.
| 12 | www.arbitragefunds.com | 1-800-295-4485 |
Table of Contents
| The Arbitrage Fund | Portfolio of Investments (continued) | |
| November 30, 2015 (Unaudited) |
The following is a summary of investments classified by country exposure:
| Country | % of Net Assets(a) | |||
Bermuda | 7.46% | |||
United Kingdom | 4.78% | |||
Netherlands | 2.76% | |||
Italy | 2.74% | |||
Bahamas | 1.66% | |||
Ireland | 1.51% | |||
Canada | 1.18% | |||
Israel | 0.86% | |||
China | 0.40% | |||
France | 0.33% | |||
Switzerland | 0.28% | |||
Australia | 0.10% | |||
United States | 75.81% | |||
Other Assets in Excess of Liabilities | 0.13% | |||
|
| |||
| 100.00% | ||||
|
| |||
| (a) | These percentages represent long positions only and are not net of short positions. |
Abbreviations:
ADR - American Depositary Receipt
AUD - Australian dollar
bps - Basis Points
CAD - Canadian dollar
CPR - Conditional Prepayment Rate
CVR - Contingent Value Rights
EUR - Euro
GBP - British pound
JPY - Japanese yen
LIBOR - London Interbank Offered Rate
LP - Limited Partnership
Ltd. - Limited
N.V. - Naamloze Vennootschap is the Dutch term for a public limited liability corporation
Plc - Public Limited Company
REIT - Real Estate Investment Trust
SpA - Societa per Azione
See Notes to Financial Statements.
| Semi-Annual Report | November 30, 2015 | 13 |
Table of Contents
| The Arbitrage Fund | Portfolio of Investments (continued) | |
| November 30, 2015 (Unaudited) |
The following table summarizes the Arbitrage Fund’s investments and derivative financial instruments categorized in the disclosure hierarchy as of November 30, 2015:
| Investments in Securities at Value* | Level 1 | Level 2 | Level 3 | Total | ||||||||||||
Assets | ||||||||||||||||
Common Stocks** | $ | 1,756,111,923 | $ | — | $ | — | $ | 1,756,111,923 | ||||||||
Rights | — | — | 10,624,454 | 10,624,454 | ||||||||||||
Purchased Options | 1,375,100 | — | — | 1,375,100 | ||||||||||||
Short-Term Investments | 224,320,804 | — | — | 224,320,804 | ||||||||||||
| ||||||||||||||||
TOTAL | $ | 1,981,807,827 | $ | — | $ | 10,624,454 | $ | 1,992,432,281 | ||||||||
| ||||||||||||||||
| Other Financial Instruments*** | ||||||||||||||||
Assets | ||||||||||||||||
Forward Foreign Currency Exchange Contracts | $ | — | $ | 14,409,068 | $ | — | $ | 14,409,068 | ||||||||
Equity Swaps | 192,976 | — | — | 192,976 | ||||||||||||
Liabilities | ||||||||||||||||
Common Stocks** | (315,437,562 | ) | — | — | (315,437,562 | ) | ||||||||||
Limited Partnerships | (18,662,283 | ) | — | — | (18,662,283 | ) | ||||||||||
Rights | — | — | (60 | ) | (60 | ) | ||||||||||
Written Options | (1,309,854 | ) | — | — | (1,309,854 | ) | ||||||||||
Forward Foreign Currency Exchange Contracts | — | (5,019,126 | ) | — | (5,019,126 | ) | ||||||||||
Equity Swaps | (65,925 | ) | — | — | (65,925 | ) | ||||||||||
| ||||||||||||||||
TOTAL | $ | (335,282,648 | ) | $ | 9,389,942 | $ | (60 | ) | $ | (325,892,766 | ) | |||||
| ||||||||||||||||
| * | Refer to footnote 2 where leveling hierarchy is defined. |
| ** | Refer to Portfolio of Investments for sector information. |
| *** | Other financial instruments are instruments such as written options, securities sold short, equity swaps and forward foreign currency exchange contracts. |
See Notes to Financial Statements.
| 14 | www.arbitragefunds.com | 1-800-295-4485 |
Table of Contents
| The Arbitrage Fund | Portfolio of Investments (continued) | |
| November 30, 2015 (Unaudited) |
The following is a reconciliation of the fair valuations using significant unobservable inputs (Level 3) for the Fund’s assets and liabilities during the six months ended November 30, 2015:
Investments in Securities | Balance as of May 31, 2015 | Realized Gain/(Loss) | Change in Unrealized Appreciation/ (Depreciation) | Purchases | Sales Proceeds | Transfers into Level 3 | Transfers out of Level 3 | Balance as of | Net change in Unrealized Appreciation/ (Depreciation) included in the Statement of Operations attributable to Level 3 investments held at November 30, 2015 | |||||||||||||||||||||||||||
Rights | $ | 10,711,137 | $ | — | $ | (86,683 | ) | $ | — | $ | — | $ | — | $ | — | $ | 10,624,454 | $ | (86,683 | ) | ||||||||||||||||
| ||||||||||||||||||||||||||||||||||||
Total | $ | 10,711,137 | $ | — | $ | (86,683 | ) | $ | — | $ | — | $ | — | $ | — | $ | 10,624,454 | $ | (86,683 | ) | ||||||||||||||||
| ||||||||||||||||||||||||||||||||||||
Other Financial Instruments | Balance as of May 31, 2015 | Realized Gain/(Loss) | Change in Unrealized Appreciation/ (Depreciation) | Purchases | Sales Proceeds | Transfers into Level 3 | Transfers out of | Balance as of | Net change in Unrealized Appreciation/ (Depreciation) included in the Statement of Operations attributable to Level 3 investments held at November 30, 2015 | |||||||||||||||||||||||||||
Rights | $ | (90 | ) | $ | — | $ | 30 | $ | — | $ | — | $ | — | $ | — | $ | (60 | ) | $ | 30 | ||||||||||||||||
| ||||||||||||||||||||||||||||||||||||
Total | $ | (90 | ) | $ | — | $ | 30 | $ | — | $ | — | $ | — | $ | — | $ | (60 | ) | $ | 30 | ||||||||||||||||
| ||||||||||||||||||||||||||||||||||||
See Notes to Financial Statements.
| Semi-Annual Report | November 30, 2015 | 15 |
Table of Contents
| The Arbitrage Event-Driven Fund | Portfolio Information | |
| November 30, 2015 (Unaudited) |
Performance (annualized returns as of November 30, 2015)
| One Year | Five Year | Since Inception* | ||||||||||
Arbitrage Event-Driven Fund, Class R | -8.89% | 0.01% | 0.30% | |||||||||
Arbitrage Event-Driven Fund, Class I | -8.68% | 0.26% | 0.54% | |||||||||
Arbitrage Event-Driven Fund, Class C** | -9.59% | N/A | -1.68% | |||||||||
Arbitrage Event-Driven Fund, Class A*** | -8.89% | N/A | -2.48% | |||||||||
Barclays Capital U.S. Aggregate Bond Index | 0.97% | 3.09% | 2.94% | |||||||||
HFRI Event Driven Index | -2.58% | 3.73% | 4.03% | |||||||||
Current performance may be higher or tower than performance quoted above. Any performance data quoted represents past performance, and the investment return and principal value of an investment in the Fund will fluctuate so that an investor’s shares, when redeemed, may be worth more or less than their original cost. Past performance is no guarantee of future results. Returns do not reflect a 2% redemption fee for shares that are redeemed from the fund within 30 days of purchase, which, if reflected, would reduce the performance quoted. Returns shown above include the reinvestment of all dividends and capital gains. Contractual fee waivers are currently in effect. Without such fee waivers, performance numbers would be reduced. You can obtain performance data current to the most recent month end by calling 1-800-295-4485 or going to www.arbitragefunds.com.
* Class R and Class I inception: 10/1/10; Class C inception: 6/1/12; Class A inception: 6/1/13.
** Class C shares are subject to a 1.00% contingent deferred sales charge on all purchases redeemed in 12 months of purchase.
*** Class A shares are subject to a maximum front-end sales load of 3.25% on purchases up to $500,000. The shares are also subject to a deferred sales charge of up to 1.00% on purchases of $500,000 or more purchased without a front-end sales load and redeemed within 18 months of purchase.
The Total Annual Fund Operating Expenses for Class R, Class I, Class C and Class A are 2.52%, 2.27%, 3.27% and 2.52%, respectively. The Advisor has agreed to waive fees (not including the effects of interest, dividends on short positions, brokerage commissions, acquired fund fees and expenses, taxes, or other extraordinary expenses) in excess of 1.69%, 1.44%, 2.44% and 1.69% for Class R, Class I, Class C and Class A, respectively, until at least August 31, 2016.
The HFRI Event Driven Index is an index of companies currently or prospectively involved in corporate transactions of a wide variety including but not limited to mergers, restructurings, financial distress, lender offers, shareholder buybacks, debt exchanges, security issuance or other capital structure adjustments. Security types can range from most senior in the capital structure to most junior or subordinated and frequently involve additional derivative securities. Event-Driven exposure includes a combination of sensitivities to equity markets, credit markets and idiosyncratic, company-specific developments.
The Barclays Capital U.S. Aggregate Bond Index is a market value-weighted index of investment- grade fixed-rated debt issues, including government, corporate, asset-backed and mortgage-backed securities with a maturity of one year or more.
An investor may not invest directly in an index.
| 16 | www.arbitragefunds.com | 1-800-295-4485 |
Table of Contents
| The Arbitrage Event-Driven Fund | Portfolio Information (continued) | |
| November 30, 2015 (Unaudited) |
Growth of $10,000 Investment
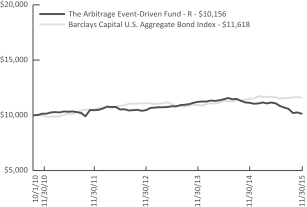 | The chart represents historical performance of a hypothetical investment of $10,000 in the Class R shares of the Fund since inception. Past performance does not guarantee future results. This chart does not reflect the deduction of taxes that a shareholder would pay on Fund distributions or the redemption of Fund shares. |
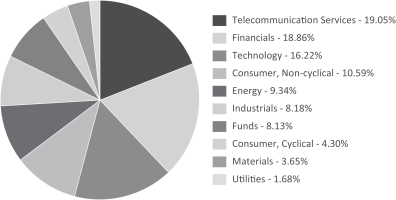
Sector Weighting
The following chart shows the sector weightings of Arbitrage Event-Driven Fund’s investments in common stock, limited partnerships, exchange-traded funds, corporate bonds and convertible corporate bonds as of the report date.
| Semi-Annual Report | November 30, 2015 | 17 |
Table of Contents
| The Arbitrage Event-Driven Fund | Portfolio of Investments | |
| November 30, 2015 (Unaudited) |
| Shares | Value | |||||||
| COMMON STOCKS - 70.95% | ||||||||
| Aerospace & Defense - 0.61% | ||||||||
Harris Corp. | 22,930 | $ | 1,906,171 | |||||
|
| |||||||
| Beverages - 0.25% | ||||||||
Anheuser-Busch InBev SA, Sponsored ADR | 4,202 | 539,789 | ||||||
Boston Beer Co., Inc., Class A(b) | 1,177 | 251,431 | ||||||
|
| |||||||
| 791,220 | ||||||||
|
| |||||||
| Chemicals - 4.33% | ||||||||
Cytec Industries, Inc.(a) | 180,138 | 13,486,932 | ||||||
|
| |||||||
| Coal - 0.37% | ||||||||
Cloud Peak Energy, Inc.(b) | 100,148 | 261,386 | ||||||
CONSOL Energy, Inc.(a)(c) | 101,772 | 801,964 | ||||||
Peabody Energy Corp. | 7,013 | 79,952 | ||||||
|
| |||||||
| 1,143,302 | ||||||||
|
| |||||||
| Computers & Computer Services - 2.87% | ||||||||
EMC Corp.(a) | 120,095 | 3,043,207 | ||||||
Hewlett Packard Enterprise Co.(b) | 299,844 | 4,455,682 | ||||||
NCR Corp.(b)(c) | 52,765 | 1,430,459 | ||||||
|
| |||||||
| 8,929,348 | ||||||||
|
| |||||||
| Electric - 0.55% | ||||||||
Dynegy, Inc.(a)(b)(c) | 75,844 | 1,222,605 | ||||||
NextEra Energy, Inc. | 4,818 | 481,126 | ||||||
|
| |||||||
| 1,703,731 | ||||||||
|
| |||||||
| Food - 0.85% | ||||||||
Kraft Heinz Co.(c) | 13,786 | 1,015,890 | ||||||
Nomad Foods Ltd.(b) | 117,665 | 1,459,046 | ||||||
Nomad Foods Ltd., London(b) | 12,749 | 158,215 | ||||||
|
| |||||||
| 2,633,151 | ||||||||
|
| |||||||
| Healthcare - Products - 0.40% | ||||||||
STERIS Plc | 16,300 | 1,244,994 | ||||||
|
| |||||||
| Healthcare - Services - 3.61% | ||||||||
Health Net, Inc.(b) | 177,361 | 11,219,857 | ||||||
|
| |||||||
| Insurance - 15.45% | ||||||||
ACE Ltd.(c) | 13,021 | 1,495,462 | ||||||
Chubb Corp. | 107,398 | 14,018,661 | ||||||
See Notes to Financial Statements.
| 18 | www.arbitragefunds.com | 1-800-295-4485 |
Table of Contents
| The Arbitrage Event-Driven Fund | Portfolio of Investments (continued) | |
| November 30, 2015 (Unaudited) |
| Shares | Value | |||||||
| COMMON STOCKS - 70.95% (Continued) | ||||||||
| Insurance - 15.45% (Continued) | ||||||||
PartnerRe Ltd. | 165,584 | $ | 23,037,702 | |||||
Symetra Financial Corp.(a) | 302,149 | 9,511,650 | ||||||
|
| |||||||
| 48,063,475 | ||||||||
|
| |||||||
| Internet - 4.56% | ||||||||
Yahoo!, Inc.(a)(b) | 419,276 | 14,175,722 | ||||||
|
| |||||||
| Media - 5.93% | ||||||||
Cablevision Systems Corp., Class A(a)(c) | 119,557 | 3,646,488 | ||||||
Comcast Corp., Class A(a) | 76,952 | 4,683,299 | ||||||
DISH Network Corp., Class A(b)(c) | 38,042 | 2,385,614 | ||||||
Media General, Inc.(a)(b)(c) | 497,958 | 7,733,288 | ||||||
|
| |||||||
| 18,448,689 | ||||||||
|
| |||||||
| Metal Fabricate & Hardware - 4.85% | ||||||||
Precision Castparts Corp. | 65,206 | 15,097,797 | ||||||
|
| |||||||
| Mining - 0.00%(d) | ||||||||
Nevada Copper Corp.(b)(e) | 6,725 | 3,525 | ||||||
|
| |||||||
| Oil & Gas - 0.44% | ||||||||
Canadian Oil Sands Ltd. | 213,141 | 1,366,196 | ||||||
|
| |||||||
| Oil & Gas Services - 2.23% | ||||||||
Cameron International Corp.(b) | 101,569 | 6,936,147 | ||||||
|
| |||||||
| Pharmaceuticals - 1.19% | ||||||||
Mylan N.V.(a)(b) | 24,661 | 1,265,110 | ||||||
Perrigo Co. Plc(c) | 16,293 | 2,434,011 | ||||||
|
| |||||||
| 3,699,121 | ||||||||
|
| |||||||
| Pipelines - 1.35% | ||||||||
Williams Companies, Inc.(a) | 115,125 | 4,208,970 | ||||||
|
| |||||||
| Real Estate Investment Trusts - 3.65% | ||||||||
BioMed Realty Trust, Inc.(a) | 291,517 | 6,841,904 | ||||||
Charter Hall Office REIT(b) | 78,651 | 58 | ||||||
InfraREIT, Inc.(a)(b) | 198,861 | 4,011,026 | ||||||
New York REIT, Inc. | 45,076 | 518,825 | ||||||
|
| |||||||
| 11,371,813 | ||||||||
|
| |||||||
See Notes to Financial Statements.
| Semi-Annual Report | November 30, 2015 | 19 |
Table of Contents
| The Arbitrage Event-Driven Fund | Portfolio of Investments (continued) | |
| November 30, 2015 (Unaudited) |
| Shares | Value | |||||||
| COMMON STOCKS - 70.95% (Continued) | ||||||||
| Retail - 2.33% | ||||||||
Macy’s, Inc.(c) | 73,194 | $ | 2,860,422 | |||||
Office Depot, Inc.(b)(c) | 191,097 | 1,259,329 | ||||||
Pep Boys-Manny Moe & Jack(a)(b)(c) | 202,191 | 3,140,026 | ||||||
|
| |||||||
| 7,259,777 | ||||||||
|
| |||||||
| Semiconductors - 9.19% | ||||||||
Altera Corp.(a)(c) | 115,942 | 6,121,738 | ||||||
Avago Technologies Ltd.(c) | 25,262 | 3,295,428 | ||||||
Broadcom Corp., Class A | 141,318 | 7,720,202 | ||||||
KLA-Tencor Corp.(a)(c) | 49,318 | 3,278,167 | ||||||
NXP Semiconductors N.V.(b) | 11,252 | 1,051,612 | ||||||
PMC-Sierra, Inc.(a)(b)(c) | 601,787 | 7,119,140 | ||||||
|
| |||||||
| 28,586,287 | ||||||||
|
| |||||||
| Software - 1.74% | ||||||||
Solera Holdings, Inc. | 100,475 | 5,399,526 | ||||||
|
| |||||||
| Telecommunications - 1.74% | ||||||||
Frontier Communications Corp.(a)(c) | 503,163 | 2,510,784 | ||||||
HC2 Holdings, Inc.(b) | 303,785 | 1,901,694 | ||||||
NII Holdings, Inc.(b) | 146,465 | 1,012,073 | ||||||
|
| |||||||
| 5,424,551 | ||||||||
|
| |||||||
| Transportation - 2.46% | ||||||||
Ansaldo STS SpA | 162,582 | 1,679,110 | ||||||
TNT Express N.V. | 732,152 | 5,964,109 | ||||||
|
| |||||||
| 7,643,219 | ||||||||
|
| |||||||
| TOTAL COMMON STOCKS (Cost $222,752,727) | 220,743,521 | |||||||
|
| |||||||
| LIMITED PARTNERSHIPS - 0.43% | ||||||||
| Coal - 0.43% | ||||||||
CNX Coal Resources LP | 115,916 | 1,348,103 | ||||||
|
| |||||||
| TOTAL LIMITED PARTNERSHIPS (Cost $1,766,313) | 1,348,103 | |||||||
|
| |||||||
See Notes to Financial Statements.
| 20 | www.arbitragefunds.com | 1-800-295-4485 |
Table of Contents
| The Arbitrage Event-Driven Fund | Portfolio of Investments (continued) | |
| November 30, 2015 (Unaudited) |
| Shares | Value | |||||||
| EXCHANGE-TRADED FUNDS - 0.68% | ||||||||
| Equity Funds - 0.68% | ||||||||
SPDR® S&P 500® ETF Trust(c) | 4,470 | $ | 932,844 | |||||
Consumer Staples Select Sector SPDR® Fund | 23,949 | 1,183,560 | ||||||
|
| |||||||
| 2,116,404 | ||||||||
|
| |||||||
| TOTAL EXCHANGE-TRADED FUNDS (Cost $2,041,119) | 2,116,404 | |||||||
|
| |||||||
| RIGHTS - 0.22% | ||||||||
ArthroCare Corp., CVR (No expiration)(b)(e)(f) | 157,791 | 59,203 | ||||||
Casa Ley, CVR, Expires 01/30/2018(b)(e)(f) | 891,084 | 337,988 | ||||||
Chelsea Therapeutics, CVR, Expires 03/31/2018(b)(e)(f) | 434,520 | 23,899 | ||||||
Cubist Pharmaceuticals, Inc., CPR, Expires 07/01/2019(b)(e)(f) | 34,500 | 0 | ||||||
Leap Wireless International, CVR, Expires 03/13/2017(b)(e)(f) | 64,802 | 243,007 | ||||||
PDC, CVR, Expires 03/31/2016(b)(e)(f) | 891,084 | 21,030 | ||||||
Trius Therapeutics, CVR, Expires 02/15/2017(b)(e)(f) | 103,378 | 9,211 | ||||||
|
| |||||||
| TOTAL RIGHTS (Cost $1,170,262) | 694,338 | |||||||
|
| |||||||
| Maturity Date | Rate | Principal Amount | Value | |||||||||||||
| CORPORATE BONDS - 13.45% | ||||||||||||||||
| Advertising - 1.15% | ||||||||||||||||
Visant Corp. | 10/01/2017 | 10.000% | $ | 3,476,000 | $ | 3,566,376 | ||||||||||
|
| |||||||||||||||
| Banks - 0.26% | ||||||||||||||||
Wells Fargo Capital X | 12/01/2086 | 5.950% | 790,000 | 799,875 | ||||||||||||
|
| |||||||||||||||
| Diversified Financial Services - 0.45% | ||||||||||||||||
Ally Financial, Inc. | 03/15/2020 | 8.000% | 326,000 | 379,383 | ||||||||||||
Corolla Trust(e)(g)(h) | 08/28/2039 | 0.000% | 1,598,000 | 1,006,740 | ||||||||||||
|
| |||||||||||||||
| 1,386,123 | ||||||||||||||||
|
| |||||||||||||||
| Electric - 0.94% | ||||||||||||||||
Energy Future Intermediate Holding Co. LLC / EFIH Finance, Inc.(g)(i) | 03/01/2022 | 11.750% | 2,751,602 | 2,933,896 | ||||||||||||
|
| |||||||||||||||
| Entertainment - 2.14% | ||||||||||||||||
Pinnacle Entertainment, Inc.(a) | ||||||||||||||||
| 05/15/2020 | 8.750% | 2,310,000 | 2,413,950 | |||||||||||||
| 04/01/2022 | 7.750% | 3,855,000 | 4,235,681 | |||||||||||||
|
| |||||||||||||||
| 6,649,631 | ||||||||||||||||
|
| |||||||||||||||
See Notes to Financial Statements.
| Semi-Annual Report | November 30, 2015 | 21 |
Table of Contents
| The Arbitrage Event-Driven Fund | Portfolio of Investments (continued) | |
| November 30, 2015 (Unaudited) |
| Maturity Date | Rate | Principal Amount | Value | |||||||||||||
| CORPORATE BONDS - 13.45% (Continued) | ||||||||||||||||
| Food - 1.70% | ||||||||||||||||
Bumble Bee Holdings, Inc.(g) | 12/15/2017 | 9.000% | $ | 274,000 | $ | 279,822 | ||||||||||
US Foods, Inc. | 06/30/2019 | 8.500% | 4,816,000 | 5,002,620 | ||||||||||||
|
| |||||||||||||||
| 5,282,442 | ||||||||||||||||
|
| |||||||||||||||
| Media - 1.35% | ||||||||||||||||
LIN Television Corp.(a) | 01/15/2021 | 6.375% | 2,092,000 | 2,191,370 | ||||||||||||
Univision Communications, Inc.(g) | 05/15/2021 | 8.500% | 1,926,000 | 2,003,040 | ||||||||||||
|
| |||||||||||||||
| 4,194,410 | ||||||||||||||||
|
| |||||||||||||||
| Miscellaneous Manufacturing - 1.31% | ||||||||||||||||
LSB Industries, Inc. | 08/01/2019 | 7.750% | 4,757,000 | 4,091,020 | ||||||||||||
|
| |||||||||||||||
| Oil & Gas - 0.02% | ||||||||||||||||
Southern Pacific Resource Corp.(g)(i) | 01/25/2018 | 8.750% | 4,828,000 | 72,305 | ||||||||||||
|
| |||||||||||||||
| Oil & Gas Services - 1.91% | ||||||||||||||||
Archrock, Inc. | 12/01/2018 | 7.250% | 5,830,000 | 5,935,523 | ||||||||||||
|
| |||||||||||||||
| Software - 1.92% | ||||||||||||||||
Audatex North America, Inc.(g) | 11/01/2023 | 6.125% | 5,930,000 | 5,974,475 | ||||||||||||
|
| |||||||||||||||
| Telecommunications - 0.30% | ||||||||||||||||
Frontier Communications Corp.(g) | 09/15/2025 | 11.000% | 963,000 | 943,740 | ||||||||||||
|
| |||||||||||||||
| TOTAL CORPORATE BONDS (Cost $46,686,829) | 41,829,816 | |||||||||||||||
|
| |||||||||||||||
| CONVERTIBLE CORPORATE BONDS - 0.02% | ||||||||||||||||
| Oil & Gas Services - 0.02% | ||||||||||||||||
Cal Dive International, Inc.(e)(i) | 07/15/2017 | 5.000% | 5,128,000 | 51,280 | ||||||||||||
|
| |||||||||||||||
| TOTAL CONVERTIBLE CORPORATE BONDS (Cost $3,947,432) | 51,280 | |||||||||||||||
|
| |||||||||||||||
See Notes to Financial Statements.
| 22 | www.arbitragefunds.com | 1-800-295-4485 |
Table of Contents
| The Arbitrage Event-Driven Fund | Portfolio of Investments (continued) | |
| November 30, 2015 (Unaudited) |
| Expiration Date | Exercise Price | Contracts | Value | |||||||||||||
| PURCHASED OPTIONS(b) - 0.25% | ||||||||||||||||
| Call Options Purchased - 0.18% | ||||||||||||||||
AbbVie, Inc. | 01/2016 | $ | 70.00 | 541 | $ | 4,057 | ||||||||||
Applied Materials, Inc. | 01/2016 | �� | 22.00 | 597 | 896 | |||||||||||
Avago Technologies Ltd. | 01/2016 | 120.00 | 245 | 360,150 | ||||||||||||
B/E Aerospace, Inc.: | ||||||||||||||||
| 01/2016 | 50.00 | 503 | 16,347 | |||||||||||||
| 01/2016 | 55.00 | 1,415 | 3,537 | |||||||||||||
DISH Network Corp., Class A | 01/2016 | 70.00 | 112 | 7,000 | ||||||||||||
Dynegy, Inc. | 12/2015 | 30.00 | 513 | 1,283 | ||||||||||||
Frontier Communications Corp. | 01/2016 | 6.00 | 1,323 | 3,307 | ||||||||||||
Molson Coors Brewing Co., Class B | 12/2015 | 97.50 | 114 | 3,420 | ||||||||||||
NCR Corp. | 01/2016 | 25.00 | 252 | 68,040 | ||||||||||||
PMC-Sierra, Inc. | 12/2015 | 12.00 | 23 | 58 | ||||||||||||
Staples, Inc. | 03/2016 | 16.00 | 2,348 | 99,790 | ||||||||||||
|
| |||||||||||||||
| TOTAL CALL OPTIONS PURCHASED (Cost $1,027,445) | 567,885 | |||||||||||||||
|
| |||||||||||||||
| Put Options Purchased - 0.07% | ||||||||||||||||
Altera Corp. | 02/2016 | 45.00 | 142 | 5,680 | ||||||||||||
AXIS Capital Holdings Ltd. | 12/2015 | 50.00 | 153 | 2,678 | ||||||||||||
DISH Network Corp., Class A: | ||||||||||||||||
| 12/2015 | 55.00 | 256 | 4,480 | |||||||||||||
| 12/2015 | 60.00 | 211 | 17,407 | |||||||||||||
KLA-Tencor Corp. | 01/2016 | 65.00 | 248 | 37,820 | ||||||||||||
Kraft Heinz Co. | 12/2015 | 75.00 | 166 | 35,275 | ||||||||||||
Lam Research Corp.: | ||||||||||||||||
| 12/2015 | 75.00 | 6 | 525 | |||||||||||||
| 01/2016 | 75.00 | 96 | 17,760 | |||||||||||||
Media General, Inc. | 12/2015 | 15.00 | 132 | 5,610 | ||||||||||||
Office Depot, Inc. | 04/2016 | 6.00 | 814 | 65,120 | ||||||||||||
Receptos, Inc.: | ||||||||||||||||
| 12/2015 | 180.00 | 7 | 0 | |||||||||||||
| 12/2015 | 190.00 | 103 | 0 | |||||||||||||
SPDR® S&P 500® ETF Trust | 01/2016 | 186.00 | 171 | 10,859 | ||||||||||||
Visteon Corp. | 12/2015 | 90.00 | 574 | 2,870 | ||||||||||||
|
| |||||||||||||||
| TOTAL PUT OPTIONS PURCHASED (Cost $581,672) | 206,084 | |||||||||||||||
|
| |||||||||||||||
| TOTAL PURCHASED OPTIONS (Cost $1,609,117) | 773,969 | |||||||||||||||
|
| |||||||||||||||
See Notes to Financial Statements.
| Semi-Annual Report | November 30, 2015 | 23 |
Table of Contents
| The Arbitrage Event-Driven Fund | Portfolio of Investments (continued) | |
| November 30, 2015 (Unaudited) |
| Yield | Shares | Value | ||||||||||||
| SHORT-TERM INVESTMENTS - 12.87% | ||||||||||||||
| Money Market Fund | ||||||||||||||
State Street Institutional Liquid Reserves Fund | 0.150% | (j) | 40,027,498 | $ | 40,027,498 | |||||||||
|
| |||||||||||||
| TOTAL SHORT-TERM INVESTMENTS (Cost $40,027,498) | 40,027,498 | |||||||||||||
|
| |||||||||||||
| Total Investments - 98.87% (Cost $320,001,297) | 307,584,929 | |||||||||||||
| Other Assets in Excess of Liabilities - 1.13% | 3,525,996 | (k) | ||||||||||||
|
| |||||||||||||
| NET ASSETS - 100.00% | $ | 311,110,925 | ||||||||||||
|
| |||||||||||||
| (a) | Security, or a portion of security, is being held as collateral for short sales or written option contracts. At period end, the aggregate market value of those securities was $58,949,545, representing 18.95% of net assets. |
| (b) | Non-income-producing security. |
| (c) | Underlying security for a written/purchased call/put option. |
| (d) | Less than 0.005% of net assets. |
| (e) | Security considered illiquid. On November 30, 2015, the total market value of these securities was $1,755,883, representing 0.56% of net assets. |
| (f) | Security fair valued using methods determined in good faith by the Pricing Committee. As of November 30, 2015, the total market value of these securities was $694,338, representing 0.22% of net assets. |
| (g) | Security exempt from registration under Rule 144A of the Securities Act of 1933. These securities may be resold in transactions exempt from registration, normally to qualified institutional buyers. As of November 30, 2015, these securities had a total value of $13,214,018 or 4.25% of net assets. |
| (h) | Interest rate will change at a future date. Interest rate shown reflects the rate in effect at November 30, 2015. |
| (i) | Security in default on interest payments. |
| (j) | Rate shown is the 7-day effective yield as of November 30, 2015. |
| (k) | Includes cash which is being held as collateral for short sales and written option contracts. |
See Notes to Financial Statements.
| 24 | www.arbitragefunds.com | 1-800-295-4485 |
Table of Contents
| The Arbitrage Event-Driven Fund | Portfolio of Investments (continued) | |
| November 30, 2015 (Unaudited) |
Securities are determined to be illiquid under the procedures approved by the Funds’ Board of Trustees. Information related to the illiquid securities is as follows:
| Date of Purchase | Security | Cost | Market Value | % of Net Assets | ||||||||||
05/30/2014 | ArthroCare Corp., CVR | $ | 55,227 | $ | 59,203 | 0.02 | % | |||||||
08/12/2014 | Cal Dive International, Inc. | 3,947,432 | 51,280 | 0.02 | ||||||||||
01/30/2015 | Casa Ley, CVR | 904,361 | 337,988 | 0.11 | ||||||||||
06/24/2014 | Chelsea Therapeutics, CVR | 0 | 23,899 | 0.01 | ||||||||||
08/15/2014 | Corolla Trust | 1,254,471 | 1,006,740 | 0.32 | ||||||||||
12/12/2011 | Cubist Pharmaceuticals, Inc., CPR | 0 | 0 | 0.00 | ||||||||||
03/17/2014 | Leap Wireless International, CVR | 167,189 | 243,007 | 0.07 | ||||||||||
07/07/2011 | Nevada Copper Corp. | 37,891 | 3,525 | 0.00 | ||||||||||
01/30/2015 | PDC, CVR | 43,485 | 21,030 | 0.01 | ||||||||||
09/12/2013 | Trius Therapeutics, CVR | 0 | 9,211 | 0.00 | ||||||||||
|
| |||||||||||||
| $ | 1,755,883 | 0.56 | % | |||||||||||
|
| |||||||||||||
| SCHEDULE OF SECURITIES SOLD SHORT | Shares | Value | ||||||
| COMMON STOCKS - (22.34%) | ||||||||
| Aerospace & Defense - (0.48%) | ||||||||
General Dynamics Corp. | (2,046 | ) | $ | (299,657 | ) | |||
Lockheed Martin Corp. | (1,307 | ) | (286,442 | ) | ||||
Northrop Grumman Corp. | (1,512 | ) | (281,777 | ) | ||||
Raytheon Co. | (2,671 | ) | (331,284 | ) | ||||
Rockwell Collins, Inc. | (3,285 | ) | (304,454 | ) | ||||
|
| |||||||
| (1,503,614 | ) | |||||||
|
| |||||||
| Beverages - (1.88%) | ||||||||
Molson Coors Brewing Co., Class B | (63,437 | ) | (5,838,107 | ) | ||||
|
| |||||||
| Coal - (0.03%) | ||||||||
Peabody Energy Corp. | (7,013 | ) | (79,952 | ) | ||||
|
| |||||||
| Commercial Services - (0.28%) | ||||||||
Booz Allen Hamilton Holding Corp. | (5,709 | ) | (173,839 | ) | ||||
H&R Block, Inc. | (18,756 | ) | (688,158 | ) | ||||
|
| |||||||
| (861,997 | ) | |||||||
|
| |||||||
| Computers & Computer Services - (0.54%) | ||||||||
International Business Machines Corp. | (10,705 | ) | (1,492,491 | ) | ||||
Leidos Holdings, Inc. | (3,461 | ) | (200,496 | ) | ||||
|
| |||||||
| (1,692,987 | ) | |||||||
|
| |||||||
See Notes to Financial Statements.
| Semi-Annual Report | November 30, 2015 | 25 |
Table of Contents
| The Arbitrage Event-Driven Fund | Portfolio of Investments (continued) | |
| November 30, 2015 (Unaudited) |
| SCHEDULE OF SECURITIES SOLD SHORT | Shares | Value | ||||||
| COMMON STOCKS - (22.34%) (Continued) | ||||||||
| Electric - (0.50%) | ||||||||
Calpine Corp. | (24,876 | ) | $ | (367,667 | ) | |||
Exelon Corp. | (6,225 | ) | (170,005 | ) | ||||
Hawaiian Electric Industries, Inc. | (20,012 | ) | (571,943 | ) | ||||
NRG Energy, Inc. | (9,502 | ) | (117,445 | ) | ||||
Pepco Holdings, Inc. | (7,339 | ) | (188,392 | ) | ||||
Talen Energy Corp. | (19,014 | ) | (148,119 | ) | ||||
|
| |||||||
| (1,563,571 | ) | |||||||
|
| |||||||
| Healthcare - Products - (0.40%) | ||||||||
STERIS Plc | (16,300 | ) | (1,244,994 | ) | ||||
|
| |||||||
| Healthcare - Services - (2.05%) | ||||||||
Centene Corp. | (110,318 | ) | (6,370,865 | ) | ||||
|
| |||||||
| Insurance - (2.61%) | ||||||||
ACE Ltd. | (70,751 | ) | (8,125,752 | ) | ||||
|
| |||||||
| Internet - (4.59%) | ||||||||
Alibaba Group Holding Ltd., Sponsored ADR | (169,687 | ) | (14,267,283 | ) | ||||
|
| |||||||
| Media - (2.35%) | ||||||||
Comcast Corp., Class A | (76,952 | ) | (4,697,150 | ) | ||||
Nexstar Broadcasting Group, Inc., Class A | (44,657 | ) | (2,616,454 | ) | ||||
|
| |||||||
| (7,313,604 | ) | |||||||
|
| |||||||
| Mining - (0.00%)(a) | ||||||||
Nevada Copper Corp. | (6,725 | ) | (3,525 | ) | ||||
|
| |||||||
| Oil & Gas - (0.47%) | ||||||||
Suncor Energy, Inc. | (53,303 | ) | (1,472,822 | ) | ||||
|
| |||||||
| Oil & Gas Services - (1.80%) | ||||||||
Schlumberger Ltd. | (72,715 | ) | (5,609,962 | ) | ||||
|
| |||||||
| Retail - (0.65%) | ||||||||
Dillard’s, Inc., Class A | (2,062 | ) | (154,650 | ) | ||||
JC Penney Co., Inc. | (11,079 | ) | (88,300 | ) | ||||
Kohl’s Corp. | (9,341 | ) | (440,241 | ) | ||||
Nordstrom, Inc. | (14,164 | ) | (797,575 | ) | ||||
Pep Boys-Manny Moe & Jack | (1,300 | ) | (20,189 | ) | ||||
Staples, Inc. | (41,812 | ) | (504,671 | ) | ||||
|
| |||||||
| (2,005,626 | ) | |||||||
|
| |||||||
See Notes to Financial Statements.
| 26 | www.arbitragefunds.com | 1-800-295-4485 |
Table of Contents
| The Arbitrage Event-Driven Fund | Portfolio of Investments (continued) | |
| November 30, 2015 (Unaudited) |
| SCHEDULE OF SECURITIES SOLD SHORT | Shares | Value | ||||||
| COMMON STOCKS - (22.34%) (Continued) | ||||||||
| Semiconductors - (3.02%) | ||||||||
Avago Technologies Ltd. | (28,401 | ) | $ | (3,704,910 | ) | |||
Freescale Semiconductor Ltd. | (31,910 | ) | (1,241,618 | ) | ||||
Intel Corp. | (59,999 | ) | (2,086,165 | ) | ||||
Lam Research Corp. | (10,068 | ) | (787,318 | ) | ||||
Microsemi Corp. | (43,897 | ) | (1,580,731 | ) | ||||
|
| |||||||
| (9,400,742 | ) | |||||||
|
| |||||||
| Telecommunications - (0.69%) | ||||||||
CenturyLink, Inc. | (42,013 | ) | (1,131,410 | ) | ||||
T-Mobile US, Inc. | (28,764 | ) | (1,021,122 | ) | ||||
|
| |||||||
| (2,152,532 | ) | |||||||
|
| |||||||
| TOTAL COMMON STOCKS (Proceeds $68,875,471) | (69,507,935 | ) | ||||||
|
| |||||||
| LIMITED PARTNERSHIPS - (1.23%) | ||||||||
| Coal - (0.19%) | ||||||||
Alliance Resource Partners LP | (34,648 | ) | (594,213 | ) | ||||
|
| |||||||
| Pipelines - (1.04%) | ||||||||
Energy Transfer Equity LP | (169,636 | ) | (3,212,906 | ) | ||||
|
| |||||||
| TOTAL LIMITED PARTNERSHIPS (Proceeds $5,147,455) | (3,807,119 | ) | ||||||
|
| |||||||
| EXCHANGE-TRADED FUNDS - (8.99%) | ||||||||
| Equity Funds - (8.99%) | ||||||||
Consumer Staples Select Sector SPDR® Fund | (39,402 | ) | (1,947,247 | ) | ||||
Health Care Select Sector SPDR® Fund | (3,139 | ) | (223,214 | ) | ||||
iShares® Nasdaq Biotechnology ETF | (5,098 | ) | (1,704,618 | ) | ||||
iShares® Russell 2000 ETF | (72,841 | ) | (8,674,635 | ) | ||||
iShares® Russell 2000 Growth ETF | (6,541 | ) | (960,023 | ) | ||||
iShares® Russell 2000 Value ETF | (6,165 | ) | (603,492 | ) | ||||
Market Vectors® Semiconductor ETF | (76,547 | ) | (4,271,323 | ) | ||||
SPDR® S&P® Dividend ETF | (15,497 | ) | (1,207,371 | ) | ||||
SPDR® S&P® Retail ETF | (24,281 | ) | (1,082,204 | ) | ||||
Technology Select Sector SPDR® Fund | (46,688 | ) | (2,052,404 | ) | ||||
Vanguard REIT ETF | (66,057 | ) | (5,244,265 | ) | ||||
|
| |||||||
| (27,970,796 | ) | |||||||
|
| |||||||
| TOTAL EXCHANGE-TRADED FUNDS (Proceeds $26,877,330) | (27,970,796 | ) | ||||||
|
| |||||||
See Notes to Financial Statements.
| Semi-Annual Report | November 30, 2015 | 27 |
Table of Contents
| The Arbitrage Event-Driven Fund | Portfolio of Investments (continued) | |
| November 30, 2015 (Unaudited) |
| SCHEDULE OF SECURITIES SOLD SHORT | Shares | Value | ||||||
| RIGHTS - (0.00%)(a) | ||||||||
Chelsea Therapeutics, CVR, Expires 03/31/2018 | (200 | ) | $ | (11 | ) | |||
|
| |||||||
| TOTAL RIGHTS (Cost $0) | (11 | ) | ||||||
|
| |||||||
Maturity Date | Rate | Principal Amount | Value | |||||||||||||
| CORPORATE BONDS - (0.81%) | ||||||||||||||||
| Oil & Gas - (0.36%) | ||||||||||||||||
Ensco Plc | 03/15/2021 | 4.700% | $ | (1,287,000 | ) | $ | (1,125,097 | ) | ||||||||
|
| |||||||||||||||
| Oil & Gas Services - (0.45%) | ||||||||||||||||
National Oilwell Varco, Inc. | 12/01/2022 | 2.600% | (1,531,000 | ) | (1,406,180 | ) | ||||||||||
|
| |||||||||||||||
| TOTAL CORPORATE BONDS (Proceeds $2,801,901) | (2,531,277 | ) | ||||||||||||||
|
| |||||||||||||||
| TOTAL SECURITIES SOLD SHORT (Proceeds $103,702,157) | $ | (103,817,138 | ) | |||||||||||||
|
| |||||||||||||||
| (a) | Less than 0.005% of net assets. |
| SCHEDULE OF WRITTEN OPTIONS | Expiration Date | Exercise Price | Contracts | Value | ||||||||||||
| Written Call Options | ||||||||||||||||
ACE Ltd. | 12/2015 | $ | 115.00 | (69 | ) | $ | (11,213 | ) | ||||||||
Avago Technologies Ltd. | 01/2016 | 130.00 | (270 | ) | (234,900 | ) | ||||||||||
Cablevision Systems Corp. | 12/2015 | 30.00 | (63 | ) | (6,266 | ) | ||||||||||
CONSOL Energy, Inc.: | ||||||||||||||||
| 12/2015 | 8.00 | (7 | ) | (360 | ) | |||||||||||
| 12/2015 | 9.00 | (15 | ) | (292 | ) | |||||||||||
DISH Network Corp., Class A | 01/2016 | 75.00 | (112 | ) | (2,520 | ) | ||||||||||
Energy Transfer Equity LP | 12/2015 | 20.00 | (17 | ) | (850 | ) | ||||||||||
KLA-Tencor Corp. | 12/2015 | 67.50 | (195 | ) | (14,138 | ) | ||||||||||
Macy’s, Inc. | 01/2016 | 75.00 | (553 | ) | (1,106 | ) | ||||||||||
Microsemi Corp. | 12/2015 | 35.00 | (25 | ) | (4,125 | ) | ||||||||||
Nexstar Broadcasting Group, Inc., Class A | 12/2015 | 60.00 | (80 | ) | (10,400 | ) | ||||||||||
Pep Boys-Manny Moe & Jack: | ||||||||||||||||
| 12/2015 | 15.00 | (435 | ) | (22,838 | ) | |||||||||||
| 01/2016 | 15.00 | (240 | ) | (12,600 | ) | |||||||||||
See Notes to Financial Statements.
| 28 | www.arbitragefunds.com | 1-800-295-4485 |
Table of Contents
| The Arbitrage Event-Driven Fund | Portfolio of Investments (continued) | |
| November 30, 2015 (Unaudited) |
| SCHEDULE OF WRITTEN OPTIONS | Expiration Date | Exercise Price | Contracts | Value | ||||||||||||
| Written Call Options (Continued) | ||||||||||||||||
Perrigo Co. Plc: | ||||||||||||||||
| 12/2015 | $ | 150.00 | (46 | ) | $ | (16,100 | ) | |||||||||
| 12/2015 | 155.00 | (46 | ) | (6,900 | ) | |||||||||||
Staples, Inc. | 01/2016 | 22.00 | (357 | ) | (892 | ) | ||||||||||
|
| |||||||||||||||
| TOTAL WRITTEN CALL OPTIONS (Premiums received $292,562) | (345,500 | ) | ||||||||||||||
|
| |||||||||||||||
| Written Put Options | ||||||||||||||||
DISH Network Corp., Class A | 12/2015 | 60.00 | (211 | ) | (17,407 | ) | ||||||||||
Microsemi Corp. | 12/2015 | 30.00 | (23 | ) | (575 | ) | ||||||||||
Molson Coors Brewing Co. | 12/2015 | 85.00 | (114 | ) | (3,135 | ) | ||||||||||
SPDR® S&P 500® ETF Trust | 01/2016 | 180.00 | (171 | ) | (6,669 | ) | ||||||||||
T-Mobile US, Inc. | 12/2015 | 36.00 | (154 | ) | (21,791 | ) | ||||||||||
|
| |||||||||||||||
| TOTAL WRITTEN PUT OPTIONS (Premiums received $140,740) | (49,577 | ) | ||||||||||||||
|
| |||||||||||||||
| TOTAL WRITTEN OPTIONS (Premiums received $433,302) | $ | (395,077 | ) | |||||||||||||
|
| |||||||||||||||
EQUITY SWAP CONTRACTS
| Swap Counterparty | Reference Obligation | Rate Paid/Received by the Fund | Termination Dates | Notional Amount | Unrealized Appreciation | |||||||||
Goldman, Sachs & Co. | Hellermann Tyton Group Plc | Paid 1 Month-LIBOR plus 0.90 bps | 09/01/2016 | $ | (3,986,731 | ) | $ | 1,267 | ||||||
Morgan Stanley | BG Group plc | Paid 1 Month-LIBOR plus 0.45 bps | 11/16/2017 | (376,502 | ) | 14,954 | ||||||||
|
| |||||||||||||
| $ | (4,363,233 | ) | $ | 16,221 | ||||||||||
|
| |||||||||||||
Swap Counterparty | Reference Obligation | Rate Paid/Received by the Fund | Termination Dates | Notional Amount | Unrealized Depreciation | |||||||||
Morgan Stanley | Royal Dutch Shell plc | Received 1 Month-LIBOR plus 0.45 bps | 11/16/2017 | $ | 272,736 | $ | (4,417 | ) | ||||||
Morgan Stanley | SABMiller plc | Received 1 Month-LIBORplus | 11/16/2017 | 478,324 | (5,120 | ) | ||||||||
|
| |||||||||||||
| $ | 751,060 | $ | (9,537 | ) | ||||||||||
|
| |||||||||||||
See Notes to Financial Statements.
| Semi-Annual Report | November 30, 2015 | 29 |
Table of Contents
| The Arbitrage Event-Driven Fund | Portfolio of Investments (continued) | |
| November 30, 2015 (Unaudited) |
OUTSTANDING FORWARD FOREIGN CURRENCY EXCHANGE CONTRACTS
| Contract Description | Counterparty | Contracts to Deliver/Receive | Purchase/Sale Contract | Expiration Date | Current Value | Unrealized Appreciation | ||||||||||||
AUD | Goldman Sachs | 10,000 | Purchase | 12/15/2015 | 7,226 | $ | 91 | |||||||||||
CAD | Goldman Sachs | 26,100 | Purchase | 12/15/2015 | 19,544 | 7 | ||||||||||||
CAD | Goldman Sachs | 3,976,000 | Sale | 12/15/2015 | 2,977,187 | 53,458 | ||||||||||||
EUR | Goldman Sachs | 8,682,800 | Sale | 12/15/2015 | 9,176,801 | 472,750 | ||||||||||||
GBP | Goldman Sachs | 9 | Purchase | 12/15/2015 | 14 | 0 | ||||||||||||
GBP | Goldman Sachs | 2,304,209 | Sale | 12/15/2015 | 3,470,387 | 80,759 | ||||||||||||
HKD | Goldman Sachs | 7,663,400 | Sale | 12/15/2015 | 988,431 | 399 | ||||||||||||
|
| |||||||||||||||||
| $ | 607,464 | |||||||||||||||||
|
| |||||||||||||||||
| Contract Description | Counterparty | Contracts to Deliver/Receive | Purchase/Sale Contract | Expiration Date | Current Value | Unrealized Depreciation | ||||||||||||
AUD | Goldman Sachs | 4,900 | Purchase | 12/15/2015 | 3,541 | $ | (31 | ) | ||||||||||
AUD | Goldman Sachs | 14,900 | Sale | 12/15/2015 | 10,768 | (271 | ) | |||||||||||
CAD | Goldman Sachs | 4,352,900 | Purchase | 12/15/2015 | 3,259,405 | (42,927 | ) | |||||||||||
CAD | Goldman Sachs | 351,300 | Sale | 12/15/2015 | 263,050 | (1,006 | ) | |||||||||||
EUR | Goldman Sachs | 1,281,100 | Purchase | 12/15/2015 | 1,353,987 | (85,901 | ) | |||||||||||
GBP | Goldman Sachs | 2,304,200 | Purchase | 12/15/2015 | 3,470,373 | (54,409 | ) | |||||||||||
HKD | Goldman Sachs | 7,663,400 | Purchase | 12/15/2015 | 988,433 | (551 | ) | |||||||||||
|
| |||||||||||||||||
| $ | (185,096 | ) | ||||||||||||||||
|
| |||||||||||||||||
The following is a summary of investments classified by country exposure:
| Country | % of Net Assets(a) | |||
Bermuda | 7.40% | |||
Netherlands | 2.26% | |||
Singapore | 1.06% | |||
United Kingdom | 0.92% | |||
Ireland | 0.78% | |||
Italy | 0.54% | |||
Switzerland | 0.48% | |||
Canada | 0.46% | |||
Belgium | 0.17% | |||
Australia | 0.00% | (b) | ||
United States | 84.80% | |||
Other Assets in Excess of Liabilities | 1.13% | |||
|
| |||
| 100.00% | ||||
|
| |||
| (a) | These percentages represent long positions only and are not net of short positions. |
| (b) | Less than 0.005% of net assets. |
See Notes to Financial Statements.
| 30 | www.arbitragefunds.com | 1-800-295-4485 |
Table of Contents
| The Arbitrage Event-Driven Fund | Portfolio of Investments (continued) | |
| November 30, 2015 (Unaudited) |
Abbreviations:
ADR - American Depositary Receipt
AUD - Australian dollar
bps - Basis Points
CAD - Canadian dollar
CPR - Conditional Prepayment Rate
CVR - Contingent Value Rights
ETF - Exchange-Traded Fund
EUR - Euro
GBP - British pound
HKD - Hong Kong dollar
LIBOR - London Interbank Offered Rate
LLC - Limited Liability Company
LP - Limited Partnership
Ltd. - Limited
N.V. - Naamloze Vennootschap is the Dutch term for a public limited liability corporation
Plc - Public Limited Company
REIT - Real Estate Investment Trust
SA - Generally designates corporations in various countries, mostly those employing civil law. This translates literally in all languages mentioned as anonymous company
S&P - Standard & Poor’s
SpA - Societa per Azione
The following table summarizes the Arbitrage Event-Driven Fund’s investments and derivative financial instruments categorized in the disclosure hierarchy as of November 30, 2015:
Investments in Securities at Value* | Level 1 | Level 2 | Level 3 | Total | ||||||||||||
Assets | ||||||||||||||||
Common Stocks** | $ | 220,743,521 | $ | — | $ | — | $ | 220,743,521 | ||||||||
Limited Partnerships | 1,348,103 | — | — | 1,348,103 | ||||||||||||
Exchange-Traded Funds | 2,116,404 | — | — | 2,116,404 | ||||||||||||
Rights | — | — | 694,338 | 694,338 | ||||||||||||
Corporate Bonds | — | 40,823,076 | 1,006,740 | 41,829,816 | ||||||||||||
Convertible Corporate Bonds | — | — | 51,280 | 51,280 | ||||||||||||
Purchased Options | 773,969 | — | — | 773,969 | ||||||||||||
Short-Term Investments | 40,027,498 | — | — | 40,027,498 | ||||||||||||
| ||||||||||||||||
TOTAL | $ | 265,009,495 | $ | 40,823,076 | $ | 1,752,358 | $ | 307,584,929 | ||||||||
| ||||||||||||||||
See Notes to Financial Statements.
| Semi-Annual Report | November 30, 2015 | 31 |
Table of Contents
| The Arbitrage Event-Driven Fund | Portfolio of Investments (continued) | |
| November 30, 2015 (Unaudited) |
| Other Financial Instruments*** | Level 1 | Level 2 | Level 3 | Total | ||||||||||||
Assets | ||||||||||||||||
Forward Foreign Currency Exchange Contracts | $ | — | $ | 607,464 | $ | — | $ | 607,464 | ||||||||
Equity Swaps | 16,221 | — | — | 16,221 | ||||||||||||
Liabilities | ||||||||||||||||
Common Stocks** | (69,507,935 | ) | — | — | (69,507,935 | ) | ||||||||||
Limited Partnerships | (3,807,119 | ) | — | — | (3,807,119 | ) | ||||||||||
Exchange-Traded Funds | (27,970,796 | ) | — | — | (27,970,796 | ) | ||||||||||
Rights | — | — | (11 | ) | (11 | ) | ||||||||||
Corporate Bonds | — | (2,531,277 | ) | — | (2,531,277 | ) | ||||||||||
Written Options | (395,077 | ) | — | — | (395,077 | ) | ||||||||||
Forward Foreign Currency Exchange Contracts | — | (185,096 | ) | — | (185,096 | ) | ||||||||||
Equity Swaps | (9,537 | ) | — | — | (9,537 | ) | ||||||||||
| ||||||||||||||||
TOTAL | $ | (101,674,243 | ) | $ | (2,108,909 | ) | $ | (11 | ) | $ | (103,783,163 | ) | ||||
| ||||||||||||||||
| * | Refer to footnote 2 where leveling hierarchy is defined. |
| ** | Refer to Portfolio of Investments for sector information. |
| *** | Other financial instruments are instruments such as written options, securities sold short, equity swaps and forward foreign currency exchange contracts. |
The following is a reconciliation of the fair valuations using significant unobservable inputs (Level 3) for the Fund’s assets and liabilities during the six months ended November 30, 2015:
| Investments in Securities | Balance as of May 31, 2015 | Realized Gain/(Loss) | Change in Unrealized Depreciation | Purchases | Sales Proceeds | Transfers into Level 3 | Amortization | Transfers out of Level 3 | Balance as of November 30, 2015 | Net change in Unrealized Depreciation included in the Statement of Operations attributable to Level 3 investments held at November 30, 2015 | ||||||||||||||||||||||||||||||
Rights | $ | 697,911 | $ | — | $ | (3,573 | ) | $ | — | $ | — | $ | — | $ | — | $ | — | $ | 694,338 | $ | (3,573 | ) | ||||||||||||||||||
Corporate Bonds | — | — | (278,066 | ) | — | — | 1,278,400 | 6,406 | — | 1,006,740 | (278,066 | ) | ||||||||||||||||||||||||||||
Convertible Corporate Bonds | — | — | (769,617 | ) | — | (2,043 | ) | 528,825 | 294,115 | — | 51,280 | (769,617 | ) | |||||||||||||||||||||||||||
| ||||||||||||||||||||||||||||||||||||||||
Total | $ | 697,911 | $ | — | $ | (1,051,256 | ) | $ | — | $ | (2,043 | ) | $ | 1,807,225 | $ | 300,521 | $ | — | $ | 1,752,358 | $ | (1,051,256 | ) | |||||||||||||||||
| ||||||||||||||||||||||||||||||||||||||||
See Notes to Financial Statements.
| 32 | www.arbitragefunds.com | 1-800-295-4485 |
Table of Contents
| The Arbitrage Event-Driven Fund | Portfolio of Investments (continued) | |
| November 30, 2015 (Unaudited) |
| Other Financial Instruments | Balance as of May 31, 2015 | Realized Gain/(Loss) | Change in Unrealized Appreciation | Purchases | Sales Proceeds | Transfers into Level 3 | Amortization | Transfers out of Level 3 | Balance as of November 30, 2015 | Net change in Unrealized Appreciation included in the Statement of Operations attributable to Level 3 investments held at November 30, 2015 | ||||||||||||||||||||||||||||||
Rights | $ | (16 | ) | $ | — | $ | 5 | $ | — | $ | — | $ | — | $ | — | $ | — | $ | (11 | ) | $ | 5 | ||||||||||||||||||
| ||||||||||||||||||||||||||||||||||||||||
Total | $ | (16 | ) | $ | — | $ | 5 | $ | — | $ | — | $ | — | $ | — | $ | — | $ | (11 | ) | $ | 5 | ||||||||||||||||||
| ||||||||||||||||||||||||||||||||||||||||
Corporate Bonds in the amount of $1,278,400 and Convertible Corporate Bonds in the amount of $528,825 transferred into level 3 as they were deemed illiquid and there was no tradeable market which resulted in a lack of available market inputs to determine price.
See Notes to Financial Statements.
| Semi-Annual Report | November 30, 2015 | 33 |
Table of Contents
| The Arbitrage Credit Opportunities Fund | Portfolio Information | |
| November 30, 2015 (Unaudited) |
Performance (annualized returns as of November 30, 2015)
| One Year | Since Inception* | |||||||
Arbitrage Credit Opportunities Fund, Class R | -1.87% | 1.72% | ||||||
Arbitrage Credit Opportunities Fund, Class I | -1.59% | 1.94% | ||||||
Arbitrage Credit Opportunities Fund, Class C** | -2.48% | 1.04% | ||||||
Arbitrage Credit Opportunities Fund, Class A*** | -1.87% | 1.23% | ||||||
Barclays Capital U.S. Aggregate Bond Index | 0.97% | 1.54% | ||||||
BofA Merrill Lynch High Yield Master II Index | -3.56% | 3.41% | ||||||
Current performance may be higher or lower than performance quoted above. Any performance data quoted represents past performance and the investment return and principal value of an investment in the Fund will fluctuate so that an investor’s shares, when redeemed, may be worth more or less than their original cost. Past performance is no guarantee of future results. Returns do not reflect a 2% redemption fee for shares that are redeemed from the fund within 60 days of purchase, which, if reflected, would reduce the performance quoted. Returns shown above include the reinvestment of all dividends and capital gains. Contractual fee waivers are currently in effect. Without such fee waivers, performance numbers would be reduced. You can obtain performance data current to the most recent month end by calling 1-800-295-4485 or going to www.arbitragefunds.com.
* Class R, Class I and Class C inception: 10/1/12; Class A inception: 6/1/13.
** Class C shares are subject to a 1.00% contingent deferred sales charge on all purchases redeemed in 12 months of purchase.
*** Class A shares are subject to a maximum front-end sales load of 3.25% on purchases up to $500,000. The shares are also subject to a deferred sales charge of up to 1.00% on purchases of $500,000 or more purchased without a front-end sales load and redeemed within 18 months of purchase.
The Total Annual Fund Operating Expenses for Class R, Class I, Class C and Class A are 2.30%, 2.05%, 3.05% and 2.30%, respectively. The Advisor has agreed to waive fees (not including the effects of interest, dividends on short positions, brokerage commissions, acquired fund fees and expenses, taxes, or other extraordinary expenses) in excess of 1.50%, 1.25%, 2.25% and 1.50% for Class R, Class I, Class C and Class A, respectively, until at least August 31, 2016.
The Barclays Capital U.S. Aggregate Bond Index is a market value-weighted index of investment grade fixed-rated debt issues, including government, corporate, asset-backed and mortgage-backed securities with a maturity of one year or more.
An investor may not invest directly in an index.
| 34 | www.arbitragefunds.com | 1-800-295-4485 |
Table of Contents
| The Arbitrage Credit Opportunities Fund | Portfolio Information (continued) | |
| November 30, 2015 (Unaudited) |
Growth of $10,000 Investment
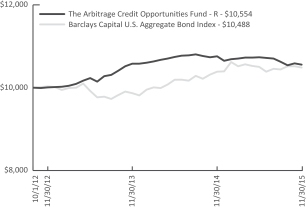 | The chart represents historical performance of a hypothetical investment of $10,000 in the Class R shares of the Fund since inception. Past performance does not guarantee future results. This chart does not reflect the deduction of taxes that a shareholder would pay on Fund distributions or the redemption of Fund shares. |
Sector Weighting
The following chart shows the sector weightings of Arbitrage Credit Opportunities Fund’s investments in common stock, corporate bonds and convertible corporate bonds as of the report date.
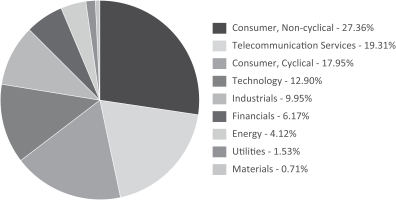
| Semi-Annual Report | November 30, 2015 | 35 |
Table of Contents
| The Arbitrage Credit Opportunities Fund | Portfolio of Investments | |
| November 30, 2015 (Unaudited) |
| Shares | Value | |||||||
| COMMON STOCKS - 2.08% | ||||||||
| Commercial Services - 0.55% | ||||||||
Macquarie Infrastructure Corp. | 4,800 | $ | 360,144 | |||||
|
| |||||||
| Software - 1.53% | ||||||||
Red Hat, Inc.(a) | 4,700 | 382,627 | ||||||
salesforce.com, Inc.(a) | 7,700 | 613,613 | ||||||
|
| |||||||
| 996,240 | ||||||||
|
| |||||||
| TOTAL COMMON STOCKS (Cost $1,179,358) | 1,356,384 | |||||||
|
| |||||||
| Maturity Date | Rate | Principal Amount | Value | |||||||||||||
| CORPORATE BONDS - 77.82% | ||||||||||||||||
| Advertising - 2.00% | ||||||||||||||||
Visant Corp. | 10/01/2017 | 10.000% | $ | 1,275,000 | $ | 1,308,150 | ||||||||||
|
| |||||||||||||||
| Aerospace & Defense - 1.19% | ||||||||||||||||
TransDigm, Inc. | 07/15/2021 | 7.500% | 742,000 | 777,245 | ||||||||||||
|
| |||||||||||||||
| Auto Parts & Equipment - 1.20% | ||||||||||||||||
Goodyear Tire & Rubber Co. | 08/15/2020 | 8.250% | 750,000 | 781,275 | ||||||||||||
|
| |||||||||||||||
| Banks - 1.07% | ||||||||||||||||
CIT Group, Inc. | 08/15/2017 | 4.250% | 550,000 | 560,829 | ||||||||||||
Wells Fargo Capital X | 12/15/2036 | 5.950% | 136,000 | 137,700 | ||||||||||||
|
| |||||||||||||||
| 698,529 | ||||||||||||||||
|
| |||||||||||||||
| Chemicals - 0.62% | ||||||||||||||||
Rentech Nitrogen Partners LP / Rentech Nitrogen Finance Corp.(b) | 04/15/2021 | 6.500% | 407,000 | 403,948 | ||||||||||||
|
| |||||||||||||||
| Commercial Services - 4.62% | ||||||||||||||||
Hertz Corp. | 10/15/2018 | 7.500% | 1,100,000 | 1,120,625 | ||||||||||||
Interactive Data Corp.(b) | 04/15/2019 | 5.875% | 429,000 | 438,374 | ||||||||||||
Service Corp. International | 06/15/2017 | 7.000% | 1,264,000 | 1,358,800 | ||||||||||||
| 01/15/2022 | 5.375% | 96,000 | 100,800 | |||||||||||||
|
| |||||||||||||||
| 3,018,599 | ||||||||||||||||
|
| |||||||||||||||
| Distribution/Wholesale - 2.82% | ||||||||||||||||
Brightstar Corp.(b) | 12/01/2016 | 9.500% | 1,435,000 | 1,438,587 | ||||||||||||
HD Supply, Inc. | 07/15/2020 | 7.500% | 380,000 | 401,850 | ||||||||||||
|
| |||||||||||||||
| 1,840,437 | ||||||||||||||||
|
| |||||||||||||||
See Notes to Financial Statements.
| 36 | www.arbitragefunds.com | 1-800-295-4485 |
Table of Contents
| The Arbitrage Credit Opportunities Fund | Portfolio of Investments (continued) | |
| November 30, 2015 (Unaudited) |
| Maturity Date | Rate | Principal Amount | Value | |||||||||||||
| CORPORATE BONDS - 77.82% (Continued) | ||||||||||||||||
| Diversified Financial Services - 4.29% | ||||||||||||||||
Ally Financial, Inc. | 02/15/2017 | 5.500% | $ | 650,000 | $ | 668,687 | ||||||||||
| 03/15/2020 | 8.000% | 391,000 | 455,026 | |||||||||||||
Corolla Trust(b)(c)(f) | 08/28/2039 | 0.000% | 146,000 | 91,980 | ||||||||||||
GFI Group, Inc. | 07/19/2018 | 8.625% | 443,000 | 479,548 | ||||||||||||
Icahn Enterprises LP / Icahn Enterprises Finance Corp. | 03/15/2017 | 3.500% | 315,000 | 315,000 | ||||||||||||
ROC Finance LLC / ROC Finance 1 Corp.(b) | 09/01/2018 | 12.125% | 750,000 | 791,250 | ||||||||||||
|
| |||||||||||||||
| 2,801,491 | ||||||||||||||||
|
| |||||||||||||||
| Electric - 1.17% | ||||||||||||||||
Energy Future Intermediate Holding Co. LLC / EFIH Finance, Inc.(b)(d) | 03/01/2022 | 11.750% | 717,257 | 764,776 | ||||||||||||
|
| |||||||||||||||
| Electrical Components & Equipment - 0.64% | ||||||||||||||||
General Cable Corp. | 10/01/2022 | 5.750% | 500,000 | 420,000 | ||||||||||||
|
| |||||||||||||||
| Entertainment - 3.62% | ||||||||||||||||
Mohegan Tribal Gaming Authority, PIK(b) | 09/15/2018 | 11.000% | 189,000 | 189,473 | ||||||||||||
Peninsula Gaming LLC / Peninsula Gaming Corp.(b) | 02/15/2018 | 8.375% | 650,000 | 667,875 | ||||||||||||
Pinnacle Entertainment, Inc. | 05/15/2020 | 8.750% | 437,000 | 456,665 | ||||||||||||
| 04/01/2022 | 7.750% | 955,000 | 1,049,306 | |||||||||||||
|
| |||||||||||||||
| 2,363,319 | ||||||||||||||||
|
| |||||||||||||||
| Food - 10.10% | ||||||||||||||||
Bumble Bee Holdco., SCA, PIK (10.38% PIK)(b) | 03/15/2018 | 9.625% | 250,000 | 253,125 | ||||||||||||
Bumble Bee Holdings, Inc.(b)(e) | 12/15/2017 | 9.000% | 1,350,000 | 1,378,687 | ||||||||||||
Chiquita Brands International, Inc. / Chiquita Brands LLC(e) | 02/01/2021 | 7.875% | 1,700,000 | 1,797,750 | ||||||||||||
Dean Holding Co. | 10/15/2017 | 6.900% | 1,199,000 | 1,258,950 | ||||||||||||
Simmons Foods, Inc.(b) | 10/01/2021 | 7.875% | 500,000 | 457,500 | ||||||||||||
US Foods, Inc. | 06/30/2019 | 8.500% | 1,393,000 | 1,446,979 | ||||||||||||
|
| |||||||||||||||
| 6,592,991 | ||||||||||||||||
|
| |||||||||||||||
| Food Service - 1.34% | ||||||||||||||||
Aramark Services, Inc. | 03/15/2020 | 5.750% | 845,000 | 877,216 | ||||||||||||
|
| |||||||||||||||
See Notes to Financial Statements.
| Semi-Annual Report | November 30, 2015 | 37 |
Table of Contents
| The Arbitrage Credit Opportunities Fund | Portfolio of Investments (continued) | |
| November 30, 2015 (Unaudited) |
| Maturity Date | Rate | Principal Amount | Value | |||||||||||||
| CORPORATE BONDS - 77.82% (Continued) | ||||||||||||||||
| Gas - 0.15% | ||||||||||||||||
AmeriGas Partners LP / AmeriGas Finance Corp. | 08/20/2019 | 6.250% | $ | 100,000 | $ | 101,250 | ||||||||||
|
| |||||||||||||||
| Healthcare - Products - 3.40% | ||||||||||||||||
Baxter International, Inc. | 06/01/2018 | 5.375% | 1,571,000 | 1,697,813 | ||||||||||||
Kinetic Concepts, Inc. / KCI USA, Inc. | 11/01/2018 | 10.500% | 538,000 | 522,398 | ||||||||||||
|
| |||||||||||||||
| 2,220,211 | ||||||||||||||||
|
| |||||||||||||||
| Healthcare - Services - 1.51% | ||||||||||||||||
CHS/Community Health Systems, Inc. | 08/15/2018 | 5.125% | 119,000 | 121,380 | ||||||||||||
| 11/15/2019 | 8.000% | 854,000 | 864,675 | |||||||||||||
|
| |||||||||||||||
| 986,055 | ||||||||||||||||
|
| |||||||||||||||
| Household Products - 1.57% | ||||||||||||||||
Edgewell Personal Care Co. | 05/19/2021 | 4.700% | 1,000,000 | 1,022,750 | ||||||||||||
|
| |||||||||||||||
| Lodging - 2.03% | ||||||||||||||||
Boyd Gaming Corp. | 07/01/2020 | 9.000% | 400,000 | 428,000 | ||||||||||||
Station Casinos LLC | 03/01/2021 | 7.500% | 850,000 | 901,000 | ||||||||||||
|
| |||||||||||||||
| 1,329,000 | ||||||||||||||||
|
| |||||||||||||||
| Machinery - Diversified - 2.25% | ||||||||||||||||
SPX FLOW, Inc.(e) | 09/01/2017 | 6.875% | 1,390,000 | 1,469,925 | ||||||||||||
|
| |||||||||||||||
| Media - 9.86% | ||||||||||||||||
CCO Holdings LLC / CCO Holdings Capital Corp. | 06/01/2020 | 7.375% | 1,500,000 | 1,563,750 | ||||||||||||
Clear Channel Worldwide Holdings, Inc., Series B | 03/15/2020 | 7.625% | 1,047,000 | 1,015,590 | ||||||||||||
Entercom Radio LLC(e) | 12/01/2019 | 10.500% | 1,060,000 | 1,105,050 | ||||||||||||
Gray Television, Inc.(e) | 10/01/2020 | 7.500% | 1,043,000 | 1,082,112 | ||||||||||||
LIN Television Corp. | 01/15/2021 | 6.375% | 787,000 | 824,383 | ||||||||||||
Univision Communications, Inc.(b) | 05/15/2021 | 8.500% | 815,000 | 847,600 | ||||||||||||
|
| |||||||||||||||
| 6,438,485 | ||||||||||||||||
|
| |||||||||||||||
| Miscellaneous Manufacturing - 1.80% | ||||||||||||||||
LSB Industries, Inc. | 08/01/2019 | 7.750% | 1,365,000 | 1,173,900 | ||||||||||||
|
| |||||||||||||||
| Oil & Gas - 0.01% | ||||||||||||||||
Southern Pacific Resource Corp.(b)(d) | 01/25/2018 | 8.750% | 356,000 | 5,332 | ||||||||||||
|
| |||||||||||||||
See Notes to Financial Statements.
| 38 | www.arbitragefunds.com | 1-800-295-4485 |
Table of Contents
| The Arbitrage Credit Opportunities Fund | Portfolio of Investments (continued) | |
| November 30, 2015 (Unaudited) |
| Maturity Date | Rate | Principal Amount | Value | |||||||||||||
| CORPORATE BONDS - 77.82% (Continued) | ||||||||||||||||
| Oil & Gas Services - 2.70% | ||||||||||||||||
Archrock, Inc. | 12/01/2018 | 7.250% | $ | 1,733,000 | $ | 1,764,367 | ||||||||||
|
| |||||||||||||||
| Packaging & Containers - 1.86% | ||||||||||||||||
Ardagh Finance Holdings SA, PIK(b) | 06/15/2019 | 8.625% | 805,210 | 839,431 | ||||||||||||
Reynolds Group Issuer, Inc. / Reynolds Group Issuer LLC / Reynolds Group Issuer (Luxembourg) SA | 04/15/2019 | 7.125% | 372,000 | 378,045 | ||||||||||||
|
| |||||||||||||||
| 1,217,476 | ||||||||||||||||
|
| |||||||||||||||
| Retail - 4.58% | ||||||||||||||||
AmeriGas Finance LLC / AmeriGas Finance Corp. | 05/20/2020 | 6.750% | 534,000 | 548,108 | ||||||||||||
Rite Aid Corp. | 03/15/2020 | 9.250% | 1,000,000 | 1,068,750 | ||||||||||||
Sally Holdings LLC / Sally Capital, Inc. | 11/15/2019 | 6.875% | 1,323,000 | 1,370,893 | ||||||||||||
|
| |||||||||||||||
| 2,987,751 | ||||||||||||||||
|
| |||||||||||||||
| Semiconductors - 0.31% | ||||||||||||||||
NXP BV / NXP Funding LLC(b) | 09/15/2016 | 3.500% | 200,000 | 200,500 | ||||||||||||
|
| |||||||||||||||
| Software - 6.79% | ||||||||||||||||
Audatex North America, Inc.(b) | 11/01/2023 | 6.125% | 1,790,000 | 1,803,425 | ||||||||||||
First Data Corp.(b) | 01/15/2022 | 8.750% | 2,500,000 | 2,627,500 | ||||||||||||
|
| |||||||||||||||
| 4,430,925 | ||||||||||||||||
|
| |||||||||||||||
| Telecommunications - 3.43% | ||||||||||||||||
Cincinnati Bell, Inc. | 10/15/2020 | 8.375% | 1,017,000 | 1,050,052 | ||||||||||||
FairPoint Communications, Inc.(b) | 08/15/2019 | 8.750% | 525,000 | 534,844 | ||||||||||||
Frontier Communications Corp.(b) | 09/15/2025 | 11.000% | 300,000 | 294,000 | ||||||||||||
Level 3 Financing, Inc. | 06/01/2020 | 7.000% | 40,000 | 42,250 | ||||||||||||
| 07/15/2020 | 8.625% | 100,000 | 105,125 | |||||||||||||
T-Mobile USA, Inc. | 11/15/2020 | 6.625% | 205,000 | 211,150 | ||||||||||||
|
| |||||||||||||||
| 2,237,421 | ||||||||||||||||
|
| |||||||||||||||
| Transportation - 0.89% | ||||||||||||||||
Overseas Shipholding Group, Inc. | 03/30/2018 | 8.125% | 569,000 | 584,647 | ||||||||||||
|
| |||||||||||||||
| TOTAL CORPORATE BONDS (Cost $51,916,941) | 50,817,971 | |||||||||||||||
|
| |||||||||||||||
See Notes to Financial Statements.
| Semi-Annual Report | November 30, 2015 | 39 |
Table of Contents
| The Arbitrage Credit Opportunities Fund | Portfolio of Investments (continued) | |
| November 30, 2015 (Unaudited) |
| Maturity Date | Rate | Principal Amount | Value | |||||||||||||
| CONVERTIBLE CORPORATE BONDS - 1.33% | ||||||||||||||||
| Internet - 1.33% | ||||||||||||||||
Twitter, Inc. | 09/15/2019 | 0.250% | $ | 1,000,000 | $ | 866,250 | ||||||||||
|
| |||||||||||||||
| Oil & Gas Services - 0.00%(g) | ||||||||||||||||
Cal Dive International, Inc.(d)(f) | 07/15/2017 | 5.000% | 314,000 | 3,140 | ||||||||||||
|
| |||||||||||||||
| TOTAL CONVERTIBLE CORPORATE BONDS (Cost $1,117,236) | 869,390 | |||||||||||||||
|
| |||||||||||||||
| Expiration Date | Exercise Price | Contracts | Value | |||||||||||||
| PURCHASED OPTIONS(a) - 0.02% | ||||||||||||||||
| Put Options Purchased - 0.02% | ||||||||||||||||
Rite Aid Corp. | 04/2016 | $ | 7.00 | 100 | $ | 2,600 | ||||||||||
SPDR® S&P 500® ETF Trust | 01/2016 | 186.00 | 182 | 11,557 | ||||||||||||
|
| |||||||||||||||
| TOTAL PUT OPTIONS PURCHASED (Cost $26,712) | 14,157 | |||||||||||||||
|
| |||||||||||||||
| TOTAL PURCHASED OPTIONS (Cost $26,712) | 14,157 | |||||||||||||||
|
| |||||||||||||||
| Yield | Shares | Value | ||||||||||||
| SHORT-TERM INVESTMENTS - 17.26% | ||||||||||||||
| Money Market Fund | ||||||||||||||
State Street Institutional Liquid Reserves Fund | 0.150% | (h) | 11,267,645 | $ | 11,267,645 | |||||||||
|
| |||||||||||||
| TOTAL SHORT-TERM INVESTMENTS (Cost $11,267,645) | 11,267,645 | |||||||||||||
|
| |||||||||||||
| Total Investments - 98.51% (Cost $65,507,892) | 64,325,547 | |||||||||||||
| Other Assets in Excess of Liabilities - 1.49% | 971,383 | (i) | ||||||||||||
|
| |||||||||||||
| NET ASSETS - 100.00% | $ | 65,296,930 | ||||||||||||
|
| |||||||||||||
| (a) | Non-income-producing security. |
| (b) | Security exempt from registration under Rule 144A of the Securities Act of 1933. These securities may be resold in transactions exempt from registration, normally to qualified institutional buyers. As of November 30, 2015, these securities had a total value of $14,028,207 or 21.48% of net assets. |
See Notes to Financial Statements.
| 40 | www.arbitragefunds.com | 1-800-295-4485 |
Table of Contents
| The Arbitrage Credit Opportunities Fund | Portfolio of Investments (continued) | |
| November 30, 2015 (Unaudited) |
| (c) | Interest rate will change at a future date. Interest rate shown reflects the rate in effect at November 30, 2015. |
| (d) | Security in default on interest payments. |
| (e) | Security, or a portion of security, is being held as collateral for short sales or written option contracts. At period end, the aggregate market value of those securities was $5,928,075, representing 9.08% of net assets. |
| (f) | Security considered illiquid. On November 30, 2015, the total market value of these securities was $95,120, representing 0.14% of net assets. |
| (g) | Less than 0.005% of net assets. |
| (h) | Rate shown is the 7-day effective yield as of November 30, 2015. |
| (i) | Includes cash which is being held as collateral for short sales and written option contracts. |
Securities are determined to be illiquid under the procedures approved by the Funds’ Board of Trustees. Information related to the illiquid securities is as follows:
| Date of Purchase | Security | Cost | Market Value | % of Net Assets | ||||||||||
08/12/2014 | Cal Dive International, Inc. | $ | 243,242 | $ | 3,140 | 0.00 | % | |||||||
08/15/2014 | Corolla Trust | 114,611 | 91,980 | 0.14 | ||||||||||
|
| |||||||||||||
| $ | 95,120 | 0.14 | % | |||||||||||
|
| |||||||||||||
| SCHEDULE OF SECURITIES SOLD SHORT | Shares | Value | ||||||
| COMMON STOCKS - (0.15%) | ||||||||
| Internet - (0.15%) | ||||||||
Twitter, Inc. | (3,900 | ) | $ | (99,060 | ) | |||
|
| |||||||
| TOTAL COMMON STOCKS (Proceeds $101,788) | (99,060 | ) | ||||||
|
| |||||||
| Maturity Date | Rate | Principal Amount | Value | |||||||||||||
| CORPORATE BONDS - (1.57%) | ||||||||||||||||
| Commercial Services - (0.70%) | ||||||||||||||||
Block Financial LLC | 11/01/2022 | 5.500% | $ | (429,000 | ) | $ | (459,006 | ) | ||||||||
|
| |||||||||||||||
| Oil & Gas - (0.52%) | ||||||||||||||||
Ensco Plc | 03/15/2021 | 4.700% | (387,000 | ) | (338,316 | ) | ||||||||||
|
| |||||||||||||||
| Oil & Gas Services - (0.35%) | ||||||||||||||||
National Oilwell Varco, Inc. | 12/01/2022 | 2.600% | (248,000 | ) | (227,781 | ) | ||||||||||
|
| |||||||||||||||
| TOTAL CORPORATE BONDS (Proceeds $1,099,153) | (1,025,103 | ) | ||||||||||||||
|
| |||||||||||||||
See Notes to Financial Statements.
| Semi-Annual Report | November 30, 2015 | 41 |
Table of Contents
| The Arbitrage Credit Opportunities Fund | Portfolio of Investments (continued) | |
| November 30, 2015 (Unaudited) |
| Maturity Date | Rate | Principal Amount | Value | |||||||||||||
| CONVERTIBLE CORPORATE BONDS - (3.91%) | ||||||||||||||||
| Commercial Services - (1.32%) | ||||||||||||||||
Macquarie Infrastructure Corp. | 07/15/2019 | 2.875% | $ | (750,000 | ) | $ | (860,156 | ) | ||||||||
|
| |||||||||||||||
| Software - (2.59%) | ||||||||||||||||
Red Hat, Inc. | 10/01/2019 | 0.250% | (550,000 | ) | (712,938 | ) | ||||||||||
salesforce.com, Inc. | 04/01/2018 | 0.250% | (750,000 | ) | (978,281 | ) | ||||||||||
|
| |||||||||||||||
| (1,691,219 | ) | |||||||||||||||
|
| |||||||||||||||
| TOTAL CONVERTIBLE CORPORATE BONDS (Proceeds $2,310,976) | (2,551,375 | ) | ||||||||||||||
|
| |||||||||||||||
| TOTAL SECURITIES SOLD SHORT (Proceeds $3,511,917) | $ | (3,675,538 | ) | |||||||||||||
|
| |||||||||||||||
| SCHEDULE OF WRITTEN OPTIONS | Expiration Date | Exercise Price | Contracts | Value | ||||||||||||
| Written Put Options | ||||||||||||||||
SPDR® S&P 500® ETF Trust | 01/2016 | $ | 180.00 | (182 | ) | $ | (7,098 | ) | ||||||||
|
| |||||||||||||||
| TOTAL WRITTEN PUT OPTIONS (Premiums received $15,484) | (7,098 | ) | ||||||||||||||
|
| |||||||||||||||
| TOTAL WRITTEN OPTIONS (Premiums received $15,484) | $ | (7,098 | ) | |||||||||||||
|
| |||||||||||||||
OUTSTANDING FORWARD FOREIGN CURRENCY EXCHANGE CONTRACTS
Contract Description | Counterparty | Contracts to Deliver/Receive | Purchase/Sale Contract | Expiration Date | Current Value | Unrealized Appreciation | ||||||||||||
CAD | Goldman Sachs | 246,600 | Sale | 12/15/2015 | $ | 184,652 | $ | 1,424 | ||||||||||
Contract Description | Counterparty | Contracts to Deliver/Receive | Purchase/Sale Contract | Expiration Date | Current Value | Unrealized Depreciation | ||||||||||||
CAD | Goldman Sachs | 239,500 | Purchase | 12/15/2015 | $ | 179,336 | $ | (3,456 | ) | |||||||||
See Notes to Financial Statements.
| 42 | www.arbitragefunds.com | 1-800-295-4485 |
Table of Contents
| The Arbitrage Credit Opportunities Fund | Portfolio of Investments (continued) | |
| November 30, 2015 (Unaudited) |
The following is a summary of investments classified by country exposure:
| Country | % of Net Assets(a) | |||
Luxembourg | 1.67% | |||
Netherlands | 0.31% | |||
Canada | 0.01% | |||
United States | 96.52% | |||
Other Assets in Excess of Liabilities | 1.49% | |||
|
| |||
| 100.00% | ||||
|
| |||
| (a) | These percentages represent long positions only and are not net of short positions. |
Abbreviations:
CAD - Canadian dollar
ETF - Exchange-Traded Fund
LLC - Limited Liability Company
LP - Limited Partnership
PIK - Payment-in-kind
Plc - Public Limited Company
SA - Generally designates corporations in various countries, mostly those employing civil law. This translates literally in all languages mentioned as anonymous company
SCA - Societe en commandite par actions is the French term for limited liability partnership
S&P - Standard & Poor’s
The following table summarizes the Arbitrage Credit Opportunities Fund’s investments and derivative financial instruments categorized in the disclosure hierarchy as of November 30, 2015:
| Investments in Securities at Value* | Level 1 | Level 2 | Level 3 | Total | ||||||||||||
Assets | ||||||||||||||||
Common Stocks** | $ | 1,356,384 | $ | — | $ | — | $ | 1,356,384 | ||||||||
Corporate Bonds | — | 50,725,991 | 91,980 | 50,817,971 | ||||||||||||
Convertible Corporate Bonds | — | 866,250 | 3,140 | 869,390 | ||||||||||||
Purchased Options | 14,157 | — | — | 14,157 | ||||||||||||
Short-Term Investments | 11,267,645 | — | — | 11,267,645 | ||||||||||||
| ||||||||||||||||
TOTAL | $ | 12,638,186 | $ | 51,592,241 | $ | 95,120 | $ | 64,325,547 | ||||||||
| ||||||||||||||||
See Notes to Financial Statements.
| Semi-Annual Report | November 30, 2015 | 43 |
Table of Contents
| The Arbitrage Credit Opportunities Fund | Portfolio of Investments (continued) | |
| November 30, 2015 (Unaudited) |
| Other Financial Instruments*** | Level 1 | Level 2 | Level 3 | Total | ||||||||||||
Assets | ||||||||||||||||
Forward Foreign Currency Exchange Contracts | $ | — | $ | 1,424 | $ | — | $ | 1,424 | ||||||||
Liabilities | ||||||||||||||||
Common Stocks** | (99,060 | ) | — | — | (99,060 | ) | ||||||||||
Corporate Bonds | — | (1,025,103 | ) | — | (1,025,103 | ) | ||||||||||
Convertible Bonds | — | (2,551,375 | ) | — | (2,551,375 | ) | ||||||||||
Written Options | (7,098 | ) | — | — | (7,098 | ) | ||||||||||
Forward Foreign Currency Exchange Contracts | — | (3,456 | ) | — | (3,456 | ) | ||||||||||
| ||||||||||||||||
TOTAL | $ | (106,158 | ) | $ | (3,578,510 | ) | $ | — | $ | (3,684,668 | ) | |||||
| ||||||||||||||||
| * | Refer to footnote 2 where leveling hierarchy is defined. |
| ** | Refer to Portfolio of Investments for sector information. |
| *** | Other financial instruments are instruments such as written options, securities sold short and forward foreign currency exchange contracts. |
The following is a reconciliation of the fair valuations using significant unobservable inputs (Level 3) for the Fund’s assets and liabilities during the six months ended November 30, 2015:
Investments in Securities | Balance as of May 31, 2015 | Realized Gain/(Loss) | Change in Unrealized Appreciation/ (Depreciation) | Purchases | Sales Proceeds | Transfers into Level 3 | Transfers out of Level 3 | Amortization Premium/ Discount | Balance as of November 30, 2015 | Net change in Unrealized Appreciation/ (Depreciation) included in the Statement of Operations attributable to Level 3 investments held at November 30, 2015 | ||||||||||||||||||||||||||||||
Corporate Bonds | $ | — | $ | — | $ | (25,403 | ) | $ | — | $ | — | $ | 116,800 | $ | — | $ | 583 | $ | 91,980 | $ | (25,403 | ) | ||||||||||||||||||
Convertible Corporate Bonds | — | — | (46,844 | ) | — | — | 32,381 | — | 17,603 | 3,140 | (46,844 | ) | ||||||||||||||||||||||||||||
| ||||||||||||||||||||||||||||||||||||||||
Total | $ | — | $ | — | $ | (72,247 | ) | $ | — | $ | — | $ | 149,181 | $ | — | $ | 18,186 | $ | 95,120 | $ | (72,247 | ) | ||||||||||||||||||
| ||||||||||||||||||||||||||||||||||||||||
Corporate Bonds in the amount of $116,800 and Convertible Corporate Bonds in the amount of $32,381 transferred into level 3 as they were deemed illiquid and there was no tradeable market which resulted in a lack of available market inputs to determine price.
See Notes to Financial Statements.
| 44 | www.arbitragefunds.com | 1-800-295-4485 |
Table of Contents
| The Arbitrage Tactical Equity Fund | Portfolio Information | |
| November 30, 2015 (Unaudited) |
Performance (annualized returns as of November 30, 2015)
| Since Inception* | ||||
Arbitrage Tactical Equity Fund, Class R | -7.84% | |||
Arbitrage Tactical Equity Fund, Class I | -7.84% | |||
Arbitrage Tactical Equity Fund, Class C** | -7.84% | |||
Arbitrage Tactical Equity Fund, Class A*** | -7.84% | |||
S&P 500® Index | 1.95% | |||
HFRX Event Driven: Special Situations Index | -2.55% | |||
HFRI Equity Hedge (Total) Index | 0.23% | |||
Current performance may be higher or lower than performance quoted above. Any performance data quoted represents past performance and the investment return and principal value of an investment in the Fund will fluctuate so that an investor’s shares, when redeemed, may be worth more or less than their original cost. Past performance is no guarantee of future results. Returns do not reflect a 2% redemption fee for shares that are redeemed from the fund within 60 days of purchase, which, if reflected, would reduce the performance quoted. Returns shown above include the reinvestment of all dividends and capital gains. Contractual fee waivers are currently in effect. Without such fee waivers, performance numbers would be reduced. You can obtain performance data current to the most recent month end by calling 1-800-295-4485 or going to mnv.arbitragefunds.com.
* Class R, Class I Class C and Class A inception: 12/31/14.
** Class C shares are subject to a 1.00% contingent deferred sales charge on all purchases redeemed in 12 months of purchase.
*** Class A shares are subject to a maximum front-end sales load of 3.25% on purchases up to $500,000. The shares are also subject to a deferred sales charge of up to 1.00% on purchases of $500,000 or more purchased without a front-end sales load and redeemed within 18 months of purchase.
The Total Annual Fund Operating Expenses for Class R, Class 1, Class C and Class A are 6.07%, 5.82%, 6.82% and 6.07%, respectively. The Advisor has agreed to waive fees (not including the effects of interest, dividends on short positions, brokerage commissions, acquired fund fees and expenses, taxes, or other extraordinary expenses) in excess of 1.69%, 1.44%, 2.44% and 1.69%, for Class R, Class I, Class C and Class A, respectively, until at least December 31, 2017.
The HFRX Event Driven: Special Situations Index is an index that employs an investment process primarily focused on opportunities in equity and equity related instruments of companies which are currently engaged in a corporate transaction, security issuance/repurchase, asset sales, division spin-off or other catalyst oriented situation. These involve both announced transactions as well as situations which pre-, postdate or situations in which no formal announcement is expected to occur. Strategies employ an investment process focusing broadly on a wide spectrum of corporate life cycle investing, including but not limited to distressed, bankruptcy and post-bankruptcy security issuance, announced acquisitions and corporate division spin-offs, asset sales and other security issuance impacting an individual capital structure focusing primarily on situations identified via fundamental research which are likely to result in a corporate transactions or other realization of
| Semi-Annual Report | November 30, 2015 | 45 |
Table of Contents
| The Arbitrage Tactical Equity Fund | Portfolio Information (continued) | |
| November 30, 2015 (Unaudited) |
shareholder value through the occurrence of some identifiable catalyst. Strategies effectively employ primarily equity (greater than 60%) but also corporate debt exposure, and in general focus more broadly on post-bankruptcy equity exposure and exit of restructuring proceedings.
The HFRI Equity Hedge (Total) Index is an index where Investment Managers maintain positions both long and short in primarily equity and equity derivative securities. A wide variety of investment processes can be employed to arrive at an investment decision, including both quantitative and fundamental techniques; strategies can be broadly diversified or narrowly focused on specific sectors and can range broadly in terms of levels of net exposure, leverage employed, holding period, concentrations of market capitalizations and valuation ranges of typical portfolios. EH managers would typically maintain at least 50% exposure to, and may in some cases be entirely invested in, equities, both long and short.
The S&P 500® Index is an unmanaged index consisting of 500 stocks.
An investor may not invest directly in an index.
| 46 | www.arbitragefunds.com | 1-800-295-4485 |
Table of Contents
| The Arbitrage Tactical Equity Fund | Portfolio Information (continued) | |
| November 30, 2015 (Unaudited) |
Growth of $10,000 Investment
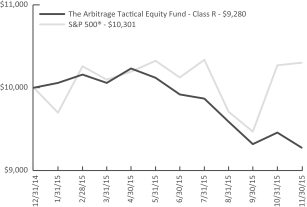 | The chart represents historical performance of a hypothetical investment of $10,000 in the Class R shares of the Fund since inception. Past performance does not guarantee future results. This chart does not reflect the deduction of taxes that a shareholder would pay on Fund distributions or the redemption of Fund shares. |
Sector Weighting
The following chart shows the sector weightings of Arbitrage Tactical Equity Fund’s investments in common stock, limited partnerships and exchange-traded funds as of the report date.
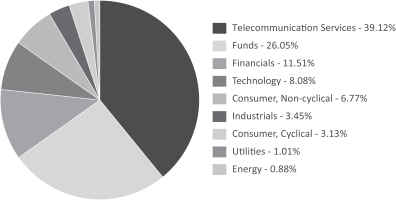
| Semi-Annual Report | November 30, 2015 | 47 |
Table of Contents
| The Arbitrage Tactical Equity Fund | Portfolio of Investments | |
| November 30, 2015 (Unaudited) |
| Shares | Value | |||||||
| COMMON STOCKS - 44.17% | ||||||||
| Advertising - 2.33% | ||||||||
Journal Media Group, Inc.(a) | 3,010 | $ | 36,301 | |||||
|
| |||||||
| Aerospace & Defense - 1.76% | ||||||||
Harris Corp.(a) | 329 | 27,350 | ||||||
|
| |||||||
| Beverages - 0.34% | ||||||||
Anheuser-Busch InBev SA, Sponsored ADR | 28 | 3,597 | ||||||
Boston Beer Co., Inc., Class A(b) | 8 | 1,709 | ||||||
|
| |||||||
| 5,306 | ||||||||
|
| |||||||
| Coal - 0.01% | ||||||||
Peabody Energy Corp. | 13 | 152 | ||||||
|
| |||||||
| Computers & Computer Services - 3.60% | ||||||||
EMC Corp.(a) | 635 | 16,091 | ||||||
Hewlett Packard Enterprise Co.(b) | 2,049 | 30,448 | ||||||
NCR Corp.(a)(b)(c) | 351 | 9,516 | ||||||
|
| |||||||
| 56,055 | ||||||||
|
| |||||||
| Diversified Financial Services - 1.34% | ||||||||
Synchrony Financial(b) | 656 | 20,868 | ||||||
|
| |||||||
| Electric - 0.56% | ||||||||
Dynegy, Inc.(a)(b)(c) | 537 | 8,656 | ||||||
|
| |||||||
| Food - 1.59% | ||||||||
Kraft Heinz Co.(c) | 93 | 6,853 | ||||||
Nomad Foods Ltd.(b) | 1,327 | 16,455 | ||||||
Nomad Foods Ltd., London(b) | 115 | 1,427 | ||||||
|
| |||||||
| 24,735 | ||||||||
|
| |||||||
| Internet - 4.75% | ||||||||
Yahoo!, Inc.(a)(b) | 2,187 | 73,942 | ||||||
|
| |||||||
| Media - 10.44% | ||||||||
Comcast Corp., Class A(a) | 1,526 | 92,872 | ||||||
DISH Network Corp., Class A(a)(b)(c) | 247 | 15,490 | ||||||
Media General, Inc.(a)(b) | 3,495 | 54,277 | ||||||
|
| |||||||
| 162,639 | ||||||||
|
| |||||||
See Notes to Financial Statements.
| 48 | www.arbitragefunds.com | 1-800-295-4485 |
Table of Contents
| The Arbitrage Tactical Equity Fund | Portfolio of Investments (continued) | |
| November 30, 2015 (Unaudited) |
| Shares | Value | |||||||
| COMMON STOCKS - 44.17% (Continued) | ||||||||
| Pharmaceuticals - 1.27% | ||||||||
Mylan N.V.(a)(b) | 140 | $ | 7,182 | |||||
Perrigo Co. Plc(a) | 84 | 12,549 | ||||||
|
| |||||||
| 19,731 | ||||||||
|
| |||||||
| Real Estate - 3.20% | ||||||||
Forest City Enterprises, Inc., Class A(a)(b) | 2,242 | 49,862 | ||||||
|
| |||||||
| Real Estate Investment Trusts - 4.59% | ||||||||
InfraREIT, Inc.(a)(b) | 1,528 | 30,820 | ||||||
New York REIT, Inc. | 305 | 3,511 | ||||||
Seritage Growth Properties, Class A(a)(b) | 1,017 | 37,120 | ||||||
|
| |||||||
| 71,451 | ||||||||
|
| |||||||
| Retail - 1.98% | ||||||||
Macy’s, Inc.(a)(c) | 426 | 16,648 | ||||||
Office Depot, Inc.(a)(b)(c) | 2,158 | 14,221 | ||||||
|
| |||||||
| 30,869 | ||||||||
|
| |||||||
| Semiconductors - 1.99% | ||||||||
Avago Technologies Ltd.(a)(c) | 238 | 31,047 | ||||||
|
| |||||||
| Telecommunications - 4.42% | ||||||||
Frontier Communications Corp.(a)(c) | 8,693 | 43,378 | ||||||
HC2 Holdings, Inc.(a)(b) | 4,069 | 25,472 | ||||||
|
| |||||||
| 68,850 | ||||||||
|
| |||||||
TOTAL COMMON STOCKS (Cost $685,817) | 687,814 | |||||||
|
| |||||||
| LIMITED PARTNERSHIPS - 0.54% | ||||||||
| Coal - 0.54% | ||||||||
CNX Coal Resources LP(a) | 727 | 8,455 | ||||||
|
| |||||||
TOTAL LIMITED PARTNERSHIPS (Cost $10,982) | 8,455 | |||||||
|
| |||||||
| EXCHANGE-TRADED FUNDS - 0.92% | ||||||||
| Equity Funds - 0.92% | ||||||||
SPDR® S&P 500® ETF Trust | 30 | 6,261 | ||||||
Consumer Staples Select Sector SPDR® Fund(a) | 162 | 8,006 | ||||||
|
| |||||||
| 14,267 | ||||||||
|
| |||||||
TOTAL EXCHANGE-TRADED FUNDS (Cost $13,752) | 14,267 | |||||||
|
| |||||||
See Notes to Financial Statements.
| Semi-Annual Report | November 30, 2015 | 49 |
Table of Contents
| The Arbitrage Tactical Equity Fund | Portfolio of Investments (continued) | |
| November 30, 2015 (Unaudited) |
| Expiration Date | Exercise Price | Contracts | Value | |||||||||||||
| PURCHASED OPTIONS(b) - 0.36% | ||||||||||||||||
| Call Options Purchased - 0.30% | ||||||||||||||||
AbbVie, Inc. | 01/2016 | $ | 70.00 | 3 | $ | 22 | ||||||||||
Applied Materials, Inc. | 01/2016 | 22.00 | 2 | 3 | ||||||||||||
Avago Technologies Ltd. | 01/2016 | 120.00 | 2 | 2,940 | ||||||||||||
B/E Aerospace, Inc.: | ||||||||||||||||
| 01/2016 | 50.00 | 2 | 65 | |||||||||||||
| 01/2016 | 55.00 | 6 | 15 | |||||||||||||
Bob Evans Farms, Inc. | 12/2015 | 45.00 | 6 | 240 | ||||||||||||
DISH Network Corp., Class A | 01/2016 | 70.00 | 1 | 62 | ||||||||||||
Dynegy, Inc. | 12/2015 | 30.00 | 3 | 8 | ||||||||||||
Frontier Communications Corp. | 01/2016 | 6.00 | 10 | 25 | ||||||||||||
Molson Coors Brewing Co., Class B | 12/2015 | 97.50 | 1 | 30 | ||||||||||||
NCR Corp. | 01/2016 | 25.00 | 1 | 270 | ||||||||||||
Staples, Inc. | 03/2016 | 16.00 | 22 | 935 | ||||||||||||
|
| |||||||||||||||
TOTAL CALL OPTIONS PURCHASED (Cost $8,274) | 4,615 | |||||||||||||||
|
| |||||||||||||||
| Put Options Purchased - 0.06% | ||||||||||||||||
Berry Plastics Group, Inc. | 12/2015 | 25.00 | 5 | 50 | ||||||||||||
DISH Network Corp., Class A: | ||||||||||||||||
| 12/2015 | 55.00 | 1 | 18 | |||||||||||||
| 12/2015 | 60.00 | 1 | 83 | |||||||||||||
Kraft Heinz Co. | 12/2015 | 75.00 | 1 | 212 | ||||||||||||
Office Depot, Inc. | 04/2016 | 6.00 | 8 | 640 | ||||||||||||
Visteon Corp. | 12/2015 | 90.00 | 3 | 15 | ||||||||||||
|
| |||||||||||||||
TOTAL PUT OPTIONS PURCHASED (Cost $2,464) | 1,018 | |||||||||||||||
|
| |||||||||||||||
TOTAL PURCHASED OPTIONS (Cost $10,738) | 5,633 | |||||||||||||||
|
| |||||||||||||||
See Notes to Financial Statements.
| 50 | www.arbitragefunds.com | 1-800-295-4485 |
Table of Contents
| The Arbitrage Tactical Equity Fund | Portfolio of Investments (continued) | |
| November 30, 2015 (Unaudited) |
| Yield | Shares | Value | ||||||||||||
| SHORT-TERM INVESTMENTS - 50.87% | ||||||||||||||
| Money Market Fund | ||||||||||||||
State Street Institutional Liquid Reserves Fund | 0.150% | (d) | 792,234 | $ | 792,234 | |||||||||
|
| |||||||||||||
TOTAL SHORT-TERM INVESTMENTS (Cost $792,234) | 792,234 | |||||||||||||
|
| |||||||||||||
Total Investments - 96.86% (Cost $1,513,523) | 1,508,403 | |||||||||||||
| Other Assets in Excess of Liabilities - 3.14% | 48,941 | (e) | ||||||||||||
|
| |||||||||||||
| NET ASSETS - 100.00% | $ | 1,557,344 | ||||||||||||
|
| |||||||||||||
| (a) | Security, or a portion of security, is being held as collateral for short sales or written option contracts. At period end, the aggregate market value of those securities was $579,662, representing 37.22% of net assets. |
| (b) | Non-income-producing security. |
| (c) | Underlying security for a written/purchased call/put option. |
| (d) | Rate shown is the 7-day effective yield as of November 30, 2015. |
| (e) | Includes cash which is being held as collateral for short sales and written option contracts. |
| SCHEDULE OF SECURITIES SOLD SHORT | Shares | Value | ||||||
| COMMON STOCKS - (22.31%) | ||||||||
| Aerospace & Defense - (1.39%) | ||||||||
General Dynamics Corp. | (29 | ) | $ | (4,247 | ) | |||
Lockheed Martin Corp. | (19 | ) | (4,164 | ) | ||||
Northrop Grumman Corp. | (22 | ) | (4,100 | ) | ||||
Raytheon Co. | (38 | ) | (4,713 | ) | ||||
Rockwell Collins, Inc. | (47 | ) | (4,356 | ) | ||||
|
| |||||||
| (21,580 | ) | |||||||
|
| |||||||
| Beverages - (2.53%) | ||||||||
Molson Coors Brewing Co., Class B | (429 | ) | (39,481 | ) | ||||
|
| |||||||
| Coal - (0.01%) | ||||||||
Peabody Energy Corp. | (13 | ) | (152 | ) | ||||
|
| |||||||
| Commercial Services - (0.42%) | ||||||||
Booz Allen Hamilton Holding Corp. | (82 | ) | (2,497 | ) | ||||
H&R Block, Inc. | (112 | ) | (4,109 | ) | ||||
|
| |||||||
| (6,606 | ) | |||||||
|
| |||||||
See Notes to Financial Statements.
| Semi-Annual Report | November 30, 2015 | 51 |
Table of Contents
| The Arbitrage Tactical Equity Fund | Portfolio of Investments (continued) | |
| November 30, 2015 (Unaudited) |
| SCHEDULE OF SECURITIES SOLD SHORT | Shares | Value | ||||||
| COMMON STOCKS - (22.31%) (Continued) | ||||||||
| Computers & Computer Services - (0.84%) | ||||||||
International Business Machines Corp. | (73 | ) | $ | (10,178 | ) | |||
Leidos Holdings, Inc. | (50 | ) | (2,897 | ) | ||||
|
| |||||||
| (13,075 | ) | |||||||
|
| |||||||
| Diversified Financial Services - (1.34%) | ||||||||
Synchrony Financial | (655 | ) | (20,849 | ) | ||||
|
| |||||||
| Electric - (0.36%) | ||||||||
Calpine Corp. | (176 | ) | (2,601 | ) | ||||
Exelon Corp. | (44 | ) | (1,202 | ) | ||||
NRG Energy, Inc. | (67 | ) | (828 | ) | ||||
Talen Energy Corp. | (135 | ) | (1,052 | ) | ||||
|
| |||||||
| (5,683 | ) | |||||||
|
| |||||||
| Internet - (4.78%) | ||||||||
Alibaba Group Holding Ltd., Sponsored ADR | (885 | ) | (74,411 | ) | ||||
|
| |||||||
| Media - (7.16%) | ||||||||
Comcast Corp., Class A | (1,526 | ) | (93,147 | ) | ||||
Nexstar Broadcasting Group, Inc., Class A | (313 | ) | (18,339 | ) | ||||
|
| |||||||
| (111,486 | ) | |||||||
|
| |||||||
| Retail - (0.86%) | ||||||||
Dillard’s, Inc., Class A | (11 | ) | (825 | ) | ||||
JC Penney Co., Inc. | (58 | ) | (462 | ) | ||||
Kohl’s Corp. | (49 | ) | (2,309 | ) | ||||
Nordstrom, Inc. | (74 | ) | (4,167 | ) | ||||
Staples, Inc. | (472 | ) | (5,697 | ) | ||||
|
| |||||||
| (13,460 | ) | |||||||
|
| |||||||
| Semiconductors - (0.92%) | ||||||||
Intel Corp. | (410 | ) | (14,256 | ) | ||||
|
| |||||||
| Telecommunications - (1.70%) | ||||||||
CenturyLink, Inc. | (726 | ) | (19,550 | ) | ||||
T-Mobile US, Inc. | (194 | ) | (6,887 | ) | ||||
|
| |||||||
| (26,437 | ) | |||||||
|
| |||||||
TOTAL COMMON STOCKS (Proceeds $337,413) | (347,476 | ) | ||||||
|
| |||||||
See Notes to Financial Statements.
| 52 | www.arbitragefunds.com | 1-800-295-4485 |
Table of Contents
| The Arbitrage Tactical Equity Fund | Portfolio of Investments (continued) | |
| November 30, 2015 (Unaudited) |
| SCHEDULE OF SECURITIES SOLD SHORT | Shares | Value | ||||||
| LIMITED PARTNERSHIPS - (0.24%) | ||||||||
| Coal - (0.24%) | ||||||||
Alliance Resource Partners LP | (217 | ) | $ | (3,722 | ) | |||
|
| |||||||
TOTAL LIMITED PARTNERSHIPS (Proceeds $5,962) | (3,722 | ) | ||||||
|
| |||||||
| EXCHANGE-TRADED FUNDS - (22.78%) | ||||||||
| Equity Funds - (22.78%) | ||||||||
Consumer Staples Select Sector SPDR® Fund | (436 | ) | (21,547 | ) | ||||
Health Care Select Sector SPDR® Fund | (18 | ) | (1,280 | ) | ||||
iShares® Nasdaq Biotechnology ETF | (28 | ) | (9,362 | ) | ||||
iShares® Russell 2000 ETF | (958 | ) | (114,088 | ) | ||||
iShares® Russell 2000 Growth ETF | (34 | ) | (4,990 | ) | ||||
iShares® Russell 2000 Value ETF | (44 | ) | (4,307 | ) | ||||
Market Vectors® Semiconductor ETF | (751 | ) | (41,906 | ) | ||||
SPDR® S&P® Dividend ETF | (268 | ) | (20,880 | ) | ||||
SPDR® S&P® Retail ETF | (127 | ) | (5,660 | ) | ||||
Technology Select Sector SPDR® Fund | (288 | ) | (12,661 | ) | ||||
Vanguard REIT ETF | (1,487 | ) | (118,053 | ) | ||||
|
| |||||||
| (354,734 | ) | |||||||
|
| |||||||
TOTAL EXCHANGE-TRADED FUNDS (Proceeds $339,415) | (354,734 | ) | ||||||
|
| |||||||
TOTAL SECURITIES SOLD SHORT (Proceeds $682,790) | $ | (705,932 | ) | |||||
|
| |||||||
| SCHEDULE OF WRITTEN OPTIONS | Expiration Date | Exercise Price | Contracts | Value | ||||||||||||
| Written Call Options | ||||||||||||||||
Avago Technologies Ltd. | 01/2016 | $ | 130.00 | (2 | ) | $ | (1,740 | ) | ||||||||
Bob Evans Farms, Inc. | 12/2015 | 55.00 | (7 | ) | (158 | ) | ||||||||||
DISH Network Corp., Class A | 01/2016 | 75.00 | (1 | ) | (23 | ) | ||||||||||
Macy’s, Inc. | 01/2016 | 75.00 | (2 | ) | (4 | ) | ||||||||||
Staples, Inc. | 01/2016 | 22.00 | (1 | ) | (2 | ) | ||||||||||
|
| |||||||||||||||
TOTAL WRITTEN CALL OPTIONS (Premiums received $1,782) | (1,927 | ) | ||||||||||||||
|
| |||||||||||||||
See Notes to Financial Statements.
| Semi-Annual Report | November 30, 2015 | 53 |
Table of Contents
| The Arbitrage Tactical Equity Fund | Portfolio of Investments (continued) | |
| November 30, 2015 (Unaudited) |
| SCHEDULE OF WRITTEN OPTIONS | Expiration Date | Exercise Price | Contracts | Value | ||||||||||||
| Written Put Options | ||||||||||||||||
DISH Network Corp., Class A | 12/2015 | $ | 60.00 | (1 | ) | $ | (82 | ) | ||||||||
Molson Coors Brewing Co. | 12/2015 | 85.00 | (1 | ) | (27 | ) | ||||||||||
T-Mobile US, Inc. | 12/2015 | 36.00 | (1 | ) | (142 | ) | ||||||||||
|
| |||||||||||||||
TOTAL WRITTEN PUT OPTIONS (Premiums received $630) | (251 | ) | ||||||||||||||
|
| |||||||||||||||
TOTAL WRITTEN OPTIONS (Premiums received $2,412) | $ | (2,178 | ) | |||||||||||||
|
| |||||||||||||||
OUTSTANDING FORWARD FOREIGN CURRENCY EXCHANGE CONTRACTS
Contract Description | Counterparty | Contracts to Deliver/Receive | Purchase/Sale Contract | Expiration Date | Current Value | Unrealized Appreciation | ||||||||||||
CAD | Goldman Sachs | 430 | Purchase | 12/15/2015 | $ | 322 | $ | 0 | ||||||||||
CAD | Goldman Sachs | 7,280 | Sale | 12/15/2015 | 5,450 | 50 | ||||||||||||
HKD | Goldman Sachs | 8,000 | Purchase | 12/15/2015 | 1,032 | 0 | ||||||||||||
HKD | Goldman Sachs | 34,800 | Sale | 12/15/2015 | 4,488 | 1 | ||||||||||||
|
| |||||||||||||||||
| $ | 51 | |||||||||||||||||
|
| |||||||||||||||||
Contract Description | Counterparty | Contracts to Deliver/Receive | Purchase/Sale Contract | Expiration Date | Current Value | Unrealized Depreciation | ||||||||||||
CAD | Goldman Sachs | 9,270 | Purchase | 12/15/2015 | $ | 6,940 | $ | (64 | ) | |||||||||
CAD | Goldman Sachs | 2,420 | Sale | 12/15/2015 | 1,813 | (7 | ) | |||||||||||
HKD | Goldman Sachs | 26,800 | Purchase | 12/15/2015 | 3,457 | (2 | ) | |||||||||||
|
| |||||||||||||||||
| $ | (73 | ) | ||||||||||||||||
|
| |||||||||||||||||
The following is a summary of investments classified by country exposure:
| Country | % of Net Assets(a) | |||
Singapore | 1.99% | |||
United Kingdom | 1.15% | |||
Ireland | 0.81% | |||
Belgium | 0.23% | |||
United States | 92.68% | |||
Other Assets in Excess of Liabilities | 3.14% | |||
|
| |||
| 100.00% | ||||
|
| |||
| (a) | These percentages represent long positions only and are not net of short positions. |
See Notes to Financial Statements.
| 54 | www.arbitragefunds.com | 1-800-295-4485 |
Table of Contents
| The Arbitrage Tactical Equity Fund | Portfolio of Investments (continued) | |
| November 30, 2015 (Unaudited) |
Abbreviations:
ADR - American Depositary Receipt
CAD - Canadian dollar
ETF - Exchange-Traded Fund
HKD - Hong Kong dollar
LP - Limited Partnership
Ltd. - Limited
N.V. - Naamloze Vennootschap is the Dutch term for a public limited liability corporation
Plc - Public Limited Company
REIT - Real Estate Investment Trust
SA - Generally designates corporations in various countries, mostly those employing civil law. This translates literally in all languages mentioned as anonymous company
S&P - Standard & Poor’s
The following table summarizes the Arbitrage Tactical Equity Fund’s investments and derivative financial instruments categorized in the disclosure hierarchy as of November 30, 2015:
| Investments in Securities at Value* | Level 1 | Level 2 | Level 3 | Total | ||||||||||||
Assets | ||||||||||||||||
Common Stocks** | $ | 687,814 | $ | — | $ | — | $ | 687,814 | ||||||||
Limited Partnerships | 8,455 | — | — | 8,455 | ||||||||||||
Exchange-Traded Funds | 14,267 | — | — | 14,267 | ||||||||||||
Purchased Options | 5,633 | — | — | 5,633 | ||||||||||||
Short-Term Investments | 792,234 | — | — | 792,234 | ||||||||||||
| ||||||||||||||||
TOTAL | $ | 1,508,403 | $ | — | $ | — | $ | 1,508,403 | ||||||||
| ||||||||||||||||
| Other Financial Instruments*** | ||||||||||||||||
Assets | ||||||||||||||||
Forward Foreign Currency Exchange Contracts | $ | — | $ | 51 | $ | — | $ | 51 | ||||||||
Liabilities | ||||||||||||||||
Common Stocks** | (347,476 | ) | — | — | (347,476 | ) | ||||||||||
Limited Partnerships | (3,722 | ) | — | — | (3,722 | ) | ||||||||||
Exchange-Traded Funds | (354,734 | ) | — | — | (354,734 | ) | ||||||||||
Written Options | (2,178 | ) | — | — | (2,178 | ) | ||||||||||
Forward Foreign Currency Exchange Contracts | — | (73 | ) | — | (73 | ) | ||||||||||
| ||||||||||||||||
TOTAL | $ | (708,110 | ) | $ | (22 | ) | $ | — | $ | (708,132 | ) | |||||
| ||||||||||||||||
| * | Refer to footnote 2 where leveling hierarchy is defined. |
| ** | Refer to Portfolio of Investments for sector information. |
| *** | Other financial instruments are instruments such as written options, securities sold short and forward foreign currency exchange contracts. |
See Notes to Financial Statements.
| Semi-Annual Report | November 30, 2015 | 55 |
Table of Contents
| The Arbitrage Funds |
ASSETS |
Investments: |
At cost |
At value (Note 2) |
Cash |
Cash denominated in foreign currency (Cost $30,812, $4,937, $0 and $0) |
Deposits with brokers for securities sold short (Note 2) |
Segregated cash for swaps (Note 2) |
Receivable for investment securities sold |
Receivable for capital shares sold |
Unrealized appreciation on forward foreign currency exchange contracts (Note 8) |
Unrealized appreciation on swap contracts |
Dividends and interest receivable |
Receivable due from Advisor |
Prepaid offering costs |
Prepaid expenses and other assets |
Total Assets |
LIABILITIES |
Securities sold short, at value (Note 2) (proceeds $336,697,438, $103,702,157, $3,511,917 and $682,790) |
Written options, at value (Note 2) (premiums received $1,097,844, $433,302, $15,484 and $2,412) |
Payable for investment securities purchased |
Unrealized depreciation on forward foreign currency exchange contracts (Note 8) |
Unrealized depreciation on swap contracts |
Payable for capital shares redeemed |
Payable to Advisor (Note 6) |
Dividends payable on securities sold short (Note 2) |
Payable to Distributor (Note 6) |
Payable to Administrator (Note 6) |
Payable to transfer agent (Note 6) |
Payable to custodian |
Interest expense payable |
Interest payable on swap contracts |
Audit and legal fees payable |
Payable to Trustees |
Payable to Chief Compliance Officer (Note 6) |
Payable to Chief Financial Officer (Note 6) |
Other accrued expenses and liabilities |
Total Liabilities |
NET ASSETS |
NET ASSETS CONSIST OF: |
Paid-in capital |
Accumulated net investment income (loss) |
Accumulated net realized loss on investments, swap contracts, securities sold short, written option contracts and foreign currencies |
Net unrealized appreciation (depreciation) on investments, swap contracts, securities sold short, written option contracts and translation of assets and liabilities denominated in foreign currencies |
NET ASSETS |
See Notes to Financial Statements.
| 56 | www.arbitragefunds.com | 1-800-295-4485 |
Table of Contents
| Statement of Assets and Liabilities | ||
| November 30, 2015 (Unaudited) |
| The Arbitrage Fund | The Arbitrage Event-Driven Fund | The Arbitrage Credit Opportunities Fund | The Arbitrage Tactical Equity Fund | |||||||||||
| $ | 1,989,441,304 | $ | 320,001,297 | $ | 65,507,892 | $ | 1,513,523 | |||||||
|
| |||||||||||||
| 1,992,432,281 | 307,584,929 | 64,325,547 | 1,508,403 | |||||||||||
| 57,698 | 11,584 | – | 23 | |||||||||||
| 30,764 | 4,929 | – | – | |||||||||||
| 312,352,321 | 100,943,399 | 3,697,200 | 715,281 | |||||||||||
| 8,480,000 | 1,840,000 | – | – | |||||||||||
| 51,176,460 | 12,147,056 | 182,596 | 29,895 | |||||||||||
| 1,400,600 | 75,599 | 9,464 | – | |||||||||||
| 14,409,068 | 607,464 | 1,424 | 51 | |||||||||||
| 192,976 | 16,221 | – | – | |||||||||||
| 2,417,948 | 1,005,335 | 1,022,923 | 446 | |||||||||||
| – | – | – | 29,340 | |||||||||||
| – | – | – | 11,716 | |||||||||||
| 62,237 | 39,643 | 34,221 | 13,178 | |||||||||||
|
| |||||||||||||
| 2,383,012,353 | 424,276,159 | 69,273,375 | 2,308,333 | |||||||||||
|
| |||||||||||||
| | 334,099,905 | | 103,817,138 | 3,675,538 | 705,932 | |||||||||
| 1,309,854 | 395,077 | 7,098 | 2,178 | |||||||||||
| 40,201,132 | 6,700,176 | 108,506 | 14,854 | |||||||||||
| 5,019,126 | 185,096 | 3,456 | 73 | |||||||||||
| 65,925 | 9,537 | – | – | |||||||||||
| 3,567,415 | 1,204,635 | 58,547 | – | |||||||||||
| 1,719,138 | 271,707 | 39,073 | – | |||||||||||
| 937,944 | 211,821 | – | 1,032 | |||||||||||
| 124,394 | 28,622 | 5,342 | 11 | |||||||||||
| 79,008 | 20,512 | 7,241 | 1,613 | |||||||||||
| 282,780 | 63,106 | 7,499 | 51 | |||||||||||
| 43,302 | 29,785 | 2,990 | 2,513 | |||||||||||
| 173,616 | 104,412 | 24,361 | 474 | |||||||||||
| 84,723 | 7,755 | – | – | |||||||||||
| 75,380 | 35,502 | 21,315 | 17,414 | |||||||||||
| 73,830 | 11,435 | 117 | 3 | |||||||||||
| 43,140 | 14,067 | 1,471 | 20 | |||||||||||
| 4,473 | 1,531 | 717 | 580 | |||||||||||
| 44,639 | 53,320 | 13,174 | 4,241 | |||||||||||
|
| |||||||||||||
| 387,949,724 | 113,165,234 | 3,976,445 | 750,989 | |||||||||||
|
| |||||||||||||
| $ | 1,995,062,629 | $ | 311,110,925 | $ | 65,296,930 | $ | 1,557,344 | |||||||
|
| |||||||||||||
| 1,984,707,746 | 382,708,660 | 68,259,891 | 1,684,992 | |||||||||||
| (3,378,898 | ) | (929,652 | ) | 387,221 | (16,493 | ) | ||||||||
| | (1,016,046 | ) | (58,602,130 | ) | (2,010,667 | ) | (83,105 | ) | ||||||
| | 14,749,827 | | (12,065,953 | ) | (1,339,515 | ) | (28,050 | ) | ||||||
|
| |||||||||||||
| $ | 1,995,062,629 | $ | 311,110,925 | $ | 65,296,930 | $ | 1,557,344 | |||||||
|
| |||||||||||||
| Semi-Annual Report | November 30, 2015 | 57 |
Table of Contents
| The Arbitrage Funds |
PRICING OF SHARES: |
CLASS R SHARES: |
Net assets applicable to Class R shares |
Shares of beneficial interest outstanding (unlimited number of shares authorized, no par value) |
Net asset value and offering price per share(a) |
CLASS I SHARES: |
Net assets applicable to Class I shares |
Shares of beneficial interest outstanding (unlimited number of shares authorized, no par value) |
Net asset value and offering price per share(a) |
CLASS C SHARES: |
Net assets applicable to Class C shares |
Shares of beneficial interest outstanding (unlimited number of shares authorized, no par value) |
Net asset value and offering price per share(a) |
CLASS A SHARES: |
Net assets applicable to Class A shares |
Shares of beneficial interest outstanding (unlimited number of shares authorized, no par value) |
Net asset value and offering price per share(a) |
Maximum offering price per share (NAV/(100%—maximum sales charge)) |
Maximum sales charge |
| (a) | Redemption price varies based on length of time held (Note 1). |
See Notes to Financial Statements.
| 58 | www.arbitragefunds.com | 1-800-295-4485 |
Table of Contents
| Statement of Assets and Liabilities | ||
| November 30, 2015 (Unaudited) |
| The Arbitrage Fund | The Arbitrage Event-Driven Fund | The Arbitrage Credit Opportunities Fund | The Arbitrage Tactical Equity Fund | |||||||||||
| $ | 451,608,426 | $ | 120,086,666 | $ | 18,967,286 | $ | 9,279 | |||||||
| 35,402,660 | 13,475,045 | 1,965,098 | 1,000 | |||||||||||
| $ | 12.76 | $ | 8.91 | $ | 9.65 | $ | 9.28 | |||||||
| $ | 1,492,750,073 | $ | 184,595,003 | $ | 44,108,154 | $ | 1,529,508 | |||||||
| 114,087,857 | 20,508,154 | 4,576,586 | 164,806 | |||||||||||
| $ | 13.08 | $ | 9.00 | $ | 9.64 | $ | 9.28 | |||||||
| $ | 32,819,759 | $ | 3,549,190 | $ | 1,619,853 | $ | 9,278 | |||||||
| 2,646,934 | 404,050 | 169,156 | 1,000 | |||||||||||
| $ | 12.40 | $ | 8.78 | $ | 9.58 | $ | 9.28 | |||||||
| $ | 17,884,371 | $ | 2,880,066 | $ | 601,637 | $ | 9,279 | |||||||
| 1,401,085 | 323,050 | 62,499 | 1,000 | |||||||||||
| $ | 12.76 | $ | 8.92 | $ | 9.63 | $ | 9.28 | |||||||
| $ | 13.09 | $ | 9.22 | $ | 9.95 | $ | 9.59 | |||||||
| 2.50 | % | 3.25 | % | 3.25 | % | 3.25 | % | |||||||
| Semi-Annual Report | November 30, 2015 | 59 |
Table of Contents
| The Arbitrage Funds |
INVESTMENT INCOME |
Dividend income |
Foreign taxes withheld on dividends |
Interest income |
Total Investment Income |
EXPENSES |
Investment advisory fees (Note 6) |
Distribution and service fees (Note 6) |
Class R |
Class C |
Class A |
Administrative fees (Note 6) |
Chief Compliance Officer fees (Note 6) |
Trustees’ fees |
Dividend expense |
Interest rebate expense |
Transfer agent fees (Note 6) |
Custodian and bank service fees |
Registration and filing fees |
Printing of shareholder reports |
Professional fees |
Line of credit interest expense (Note 4) |
Insurance expense |
Chief Financial Officer fees (Note 6) |
Offering costs |
Other expenses |
Total Expenses |
Fees waived by the Advisor, Class R (Note 6) |
Fees waived by the Advisor, Class I (Note 6) |
Fees waived by the Advisor, Class C (Note 6) |
Fees waived by the Advisor, Class A (Note 6) |
Net Expenses |
NET INVESTMENT INCOME (LOSS) |
REALIZED AND UNREALIZED GAINS (LOSSES) ON INVESTMENTS AND FOREIGN CURRENCIES |
Net realized gains (losses) from: |
Investments |
Swap contracts |
Securities sold short |
Written option contracts |
Foreign currency transactions (Note 8) |
Net change in unrealized appreciation (depreciation) on: |
Investments |
Swap contracts |
Securities sold short |
Written option contracts |
Foreign currency transactions (Note 8) |
NET REALIZED AND UNREALIZED LOSSES ON INVESTMENTS AND FOREIGN CURRENCIES |
NET DECREASE IN NET ASSETS RESULTING FROM OPERATIONS |
See Notes to Financial Statements.
| 60 | www.arbitragefunds.com | 1-800-295-4485 |
Table of Contents
| Statement of Operations | ||
| For the Six Months Ended November 30, 2015 (Unaudited) | ||
| The Arbitrage Fund | The Arbitrage Event-Driven Fund | The Arbitrage Credit Opportunities Fund | The Arbitrage Tactical Equity Fund | |||||||||||
| $ | 8,786,225 | $ | 1,711,241 | $ | 19,793 | $ | 3,335 | |||||||
| (77,582 | ) | (7,038 | ) | – | (6 | ) | ||||||||
| 210,625 | 2,083,748 | 1,435,305 | – | |||||||||||
|
| |||||||||||||
| 8,919,268 | 3,787,951 | 1,455,098 | 3,329 | |||||||||||
|
| |||||||||||||
| 10,597,145 | 2,791,820 | 346,353 | 9,489 | |||||||||||
| 593,270 | 186,664 | 25,957 | 12 | |||||||||||
| 167,448 | 21,379 | 9,075 | 48 | |||||||||||
| 22,634 | 5,050 | 783 | 12 | |||||||||||
| 194,376 | 50,379 | 12,879 | 2,773 | |||||||||||
| 83,612 | 23,713 | 2,878 | 53 | |||||||||||
| 101,402 | 27,542 | 13,127 | 12,516 | |||||||||||
| 3,646,720 | 1,383,528 | 1,456 | 5,950 | |||||||||||
| 503,733 | 432,066 | 59,195 | 2,889 | |||||||||||
| 663,799 | 246,733 | 25,236 | 4,640 | |||||||||||
| 208,300 | 81,870 | 11,822 | 9,377 | |||||||||||
| 50,671 | 57,005 | 26,686 | 9,882 | |||||||||||
| 86,621 | 41,711 | 2,572 | 48 | |||||||||||
| 133,730 | 47,669 | 18,916 | 11,821 | |||||||||||
| – | 26,805 | – | – | |||||||||||
| 51,658 | 14,942 | 834 | – | |||||||||||
| 14,022 | 4,197 | 1,927 | 1,501 | |||||||||||
| – | – | – | 66,996 | |||||||||||
| 48,470 | 45,280 | 16,020 | 5,988 | |||||||||||
|
| |||||||||||||
| 17,167,611 | 5,488,353 | 575,716 | 143,995 | |||||||||||
|
| |||||||||||||
| – | (72,695 | ) | (13,643 | ) | (790 | ) | ||||||||
| – | (139,782 | ) | (30,644 | ) | (121,784 | ) | ||||||||
| – | (2,084 | ) | (1,194 | ) | (790 | ) | ||||||||
| – | (1,959 | ) | (413 | ) | (790 | ) | ||||||||
|
| |||||||||||||
| 17,167,611 | 5,271,833 | 529,822 | 19,841 | |||||||||||
|
| |||||||||||||
| (8,248,343 | ) | (1,483,882 | ) | 925,276 | (16,512 | ) | ||||||||
|
| |||||||||||||
| (64,152,600 | ) | (46,454,934 | ) | (1,550,375 | ) | (125,786 | ) | |||||||
| 3,434,800 | 860,974 | 4,760 | 1,864 | |||||||||||
| 25,626,540 | 8,629,489 | 76,942 | 29,580 | |||||||||||
| 6,611,138 | 3,928,927 | 16,385 | 10,813 | |||||||||||
| (10,762,457 | ) | (534,416 | ) | 12,808 | (189 | ) | ||||||||
| 5,195,019 | (6,379,235 | ) | (715,589 | ) | (11,988 | ) | ||||||||
| 14,185 | 21,716 | 1,801 | – | |||||||||||
| (3,318,029 | ) | (202,530 | ) | 74,498 | (19,689 | ) | ||||||||
| (601,479 | ) | 76,438 | 6,946 | 639 | ||||||||||
| 14,198,839 | 969,546 | 3,161 | (4 | ) | ||||||||||
|
| |||||||||||||
| (23,754,044 | ) | (39,084,025 | ) | (2,068,663 | ) | (114,760 | ) | |||||||
|
| |||||||||||||
| $ | (32,002,387 | ) | $ | (40,567,907 | ) | $ | (1,143,387 | ) | $ | (131,272 | ) | |||
|
| |||||||||||||
| Semi-Annual Report | November 30, 2015 | 61 |
Table of Contents
| The Arbitrage Funds |
FROM OPERATIONS: |
Net investment income (loss) |
Net realized gains (losses) from: |
Investments |
Swap contracts |
Securities sold short |
Written option contracts |
Foreign currency transactions |
Net change in unrealized appreciation (depreciation) on: |
Investments |
Swap contracts |
Securities sold short |
Written option contracts |
Foreign currency transactions |
Net increase/(decrease) in net assets resulting from operations |
FROM DIVIDENDS AND DISTRIBUTIONS TO SHAREHOLDERS: |
NET INVESTMENT INCOME |
Distributions from net investment income, Class R |
Distributions from net investment income, Class I |
Distributions from net investment income, Class C |
Distributions from net investment income, Class A |
NET REALIZED GAINS |
Distributions from net realized gains, Class R |
Distributions from net realized gains, Class I |
Distributions from net realized gains, Class C |
Distributions from net realized gains, Class A |
Decrease in net assets from distributions to shareholders |
FROM CAPITAL SHARE TRANSACTIONS (NOTE 7): |
Proceeds from shares sold |
Shares issued in reinvestment of distributions |
Proceeds from redemption fees collected (Note 2) |
Payments for shares redeemed |
Net increase/(decrease) in net assets from capital share transactions |
TOTAL INCREASE/(DECREASE) IN NET ASSETS |
NET ASSETS: |
Beginning of period |
End of period* |
* Including accumulated net investment income (loss) of: |
See Notes to Financial Statements.
| 62 | www.arbitragefunds.com | 1-800-295-4485 |
Table of Contents
| Statement of Changes in Net Assets |
| The Arbitrage Fund | The Arbitrage Event-Driven Fund | |||||||||||||
| Six Months Ended November 30, 2015 (Unaudited) | Year Ended May 31, 2015 | Six Months Ended November 30, 2015 (Unaudited) | Year Ended May 31, 2015 | |||||||||||
| $ | (8,248,343 | ) | $ | (16,949,435 | ) | $ | (1,483,882 | ) | $ | 3,351,926 | ||||
| (64,152,600 | ) | 293,123,691 | (46,454,934 | ) | 13,840,851 | |||||||||
| 3,434,800 | (253,886 | ) | 860,974 | 778,445 | ||||||||||
| 25,626,540 | (222,961,312 | ) | 8,629,489 | (36,254,971 | ) | |||||||||
| 6,611,138 | 12,770,110 | 3,928,927 | 3,287,176 | |||||||||||
| (10,762,457 | ) | 25,301,697 | (534,416 | ) | 5,225,074 | |||||||||
| 5,195,019 | (61,391,553 | ) | (6,379,235 | ) | (16,801,049 | ) | ||||||||
| 14,185 | (164,901 | ) | 21,716 | (14,013 | ) | |||||||||
| (3,318,029 | ) | 48,301,456 | (202,530 | ) | 4,425,595 | |||||||||
| (601,479 | ) | 622 | 76,438 | (78,435 | ) | |||||||||
| 14,198,839 | (634,000 | ) | 969,546 | 14,868 | ||||||||||
|
| |||||||||||||
| (32,002,387 | ) | 77,142,489 | (40,567,907 | ) | (22,224,533 | ) | ||||||||
|
| |||||||||||||
| – | – | – | (1,765,025 | ) | ||||||||||
| – | – | – | (3,897,650 | ) | ||||||||||
| – | – | – | (22,154 | ) | ||||||||||
| – | – | – | (39,977 | ) | ||||||||||
| – | (1,270,987 | ) | – | (3,673,053 | ) | |||||||||
| – | (4,326,291 | ) | – | (6,881,389 | ) | |||||||||
| – | (79,686 | ) | – | (100,341 | ) | |||||||||
| – | (22,574 | ) | – | (84,204 | ) | |||||||||
|
| |||||||||||||
| – | (5,699,538 | ) | – | (16,463,793 | ) | |||||||||
|
| |||||||||||||
| 378,058,504 | 926,411,171 | 37,599,677 | 426,570,641 | |||||||||||
| – | 4,050,952 | – | 13,481,621 | |||||||||||
| 9,353 | 22,225 | 8,436 | 13,963 | |||||||||||
| (416,544,390 | ) | (1,449,499,845 | ) | (281,406,019 | ) | (309,016,808 | ) | |||||||
|
| |||||||||||||
| (38,476,533 | ) | (519,015,497 | ) | (243,797,906 | ) | 131,049,417 | ||||||||
|
| |||||||||||||
| (70,478,920 | ) | (447,572,546 | ) | (284,365,813 | ) | 92,361,091 | ||||||||
|
| |||||||||||||
| 2,065,541,549 | 2,513,114,095 | 595,476,738 | 503,115,647 | |||||||||||
|
| |||||||||||||
| $ | 1,995,062,629 | $ | 2,065,541,549 | $ | 311,110,925 | $ | 595,476,738 | |||||||
|
| |||||||||||||
| $ | (3,378,898 | ) | $ | 4,869,445 | $ | (929,652 | ) | $ | 554,230 | |||||
| Semi-Annual Report | November 30, 2015 | 63 |
Table of Contents
| The Arbitrage Funds |
FROM OPERATIONS: |
Net investment income (loss) |
Net realized gains (losses) from: |
Investments |
Swap contracts |
Securities sold short |
Written option contracts |
Foreign currency transactions |
Net change in unrealized appreciation (depreciation) on: |
Investments |
Swap contracts |
Securities sold short |
Written option contracts |
Foreign currency transactions |
Net increase/(decrease) in net assets resulting from operations |
FROM DIVIDENDS AND DISTRIBUTIONS TO SHAREHOLDERS: |
NET INVESTMENT INCOME |
Distributions from net investment income, Class R |
Distributions from net investment income, Class I |
Distributions from net investment income, Class C |
Distributions from net investment income, Class A |
NET REALIZED GAINS |
Distributions from net realized gains, Class R |
Distributions from net realized gains, Class I |
Distributions from net realized gains, Class C |
Distributions from net realized gains, Class A |
Decrease in net assets from distributions to shareholders |
FROM CAPITAL SHARE TRANSACTIONS (NOTE 7): |
Proceeds from shares sold |
Shares issued in reinvestment of distributions |
Proceeds from redemption fees collected (Note 2) |
Payments for shares redeemed |
Net increase/(decrease) in net assets from capital share transactions |
TOTAL INCREASE/(DECREASE) IN NET ASSETS |
NET ASSETS: |
Beginning of period |
End of period* |
* Including accumulated net investment income (loss) of: |
| (a) | Commenced operations on January 2, 2015. |
See Notes to Financial Statements.
| 64 | www.arbitragefunds.com | 1-800-295-4485 |
Table of Contents
| Statement of Changes in Net Assets |
| The Arbitrage Credit Opportunities Fund | The Arbitrage Tactical Equity Fund | |||||||||||||
| Six Months Ended November 30, 2015 (Unaudited) | Year Ended May 31, 2015 | Six Months Ended November 30, 2015 (Unaudited) | Period Ended May 31, 2015(a) | |||||||||||
| $ | 925,276 | $ | 1,505,436 | $ | (16,512 | ) | $ | (8,588 | ) | |||||
| (1,550,375 | ) | (896,060 | ) | (125,786 | ) | 13,267 | ||||||||
| 4,760 | (3,089 | ) | 1,864 | (269 | ) | |||||||||
| 76,942 | 331,588 | 29,580 | (10,041 | ) | ||||||||||
| 16,385 | 6,041 | 10,813 | 3,655 | |||||||||||
| 12,808 | (3,180 | ) | (189 | ) | (119 | ) | ||||||||
| (715,589 | ) | (635,543 | ) | (11,988 | ) | 6,868 | ||||||||
| 1,801 | (1,801 | ) | – | – | ||||||||||
| 74,498 | (169,697 | ) | (19,689 | ) | (3,453 | ) | ||||||||
| 6,946 | 355 | 639 | (405 | ) | ||||||||||
| 3,161 | 14,361 | (4 | ) | (18 | ) | |||||||||
|
| |||||||||||||
| (1,143,387 | ) | 148,411 | (131,272 | ) | 897 | |||||||||
|
| |||||||||||||
| (294,534 | ) | (235,746 | ) | – | – | |||||||||
| (679,349 | ) | (1,045,525 | ) | – | – | |||||||||
| (22,096 | ) | (37,249 | ) | – | – | |||||||||
| (8,957 | ) | (10,070 | ) | – | – | |||||||||
| – | – | – | – | |||||||||||
| – | – | – | – | |||||||||||
| – | – | – | – | |||||||||||
| – | – | – | – | |||||||||||
|
| |||||||||||||
| (1,004,936 | ) | (1,328,590 | ) | – | – | |||||||||
|
| |||||||||||||
| 11,662,351 | 65,269,484 | 317,330 | 1,415,609 | |||||||||||
| 1,003,564 | 1,320,031 | – | – | |||||||||||
| – | 234 | – | – | |||||||||||
| (16,716,869 | ) | (24,088,868 | ) | (45,157 | ) | �� | (63 | ) | ||||||
|
| |||||||||||||
| (4,050,954 | ) | 42,500,881 | 272,173 | 1,415,546 | ||||||||||
|
| |||||||||||||
| (6,199,277 | ) | 41,320,702 | 140,901 | 1,416,443 | ||||||||||
|
| |||||||||||||
| 71,496,207 | 30,175,505 | 1,416,443 | – | |||||||||||
|
| |||||||||||||
| $ | 65,296,930 | $ | 71,496,207 | $ | 1,557,344 | $ | 1,416,443 | |||||||
|
| |||||||||||||
| $ | 387,221 | $ | 466,881 | $ | (16,493 | ) | $ | 19 | ||||||
| Semi-Annual Report | November 30, 2015 | 65 |
Table of Contents
| The Arbitrage Fund – Class R |
Selected Per Share Data and Ratios for a Share Outstanding Throughout the Periods Presented:
Net asset value, beginning of period |
Income (loss) from investment operations |
Net investment loss(a) |
Net realized and unrealized gains (losses) on investments and foreign currencies |
Total from investment operations |
Less distributions |
From net investment income |
From net realized gains |
Total distributions |
Proceeds from redemption fees collected |
Net asset value, end of period |
Total return(c) |
Net assets, end of period (in 000s) |
RATIOS TO AVERAGE NET ASSETS: |
Expenses including interest and dividend expense |
Expenses excluding interest and dividend expense(f)(g) |
Expenses after advisory fees waived and expenses reimbursed excluding interest and dividend expense(f)(g) |
Net investment loss |
Portfolio turnover rate |
|
| (a) | Per share amounts were calculated using average shares outstanding for the period. |
| (b) | Amount rounds to less than $0.01 per share. |
| (c) | Total return is a measure of the change in the value of an investment in the Fund over the years covered, which assumes any dividends or capital gains distributions are reinvested in shares of the Fund. Returns shown do not reflect the deduction of taxes a shareholder would pay on Fund distributions or the redemption of Fund shares. |
| (d) | Not annualized. |
| (e) | Annualized. |
| (f) | Dividend expense totaled 0.36% (annualized), 0.68%, 0.60%, 0.42%, 0.58% and 0.51%, of average net assets for the six months ended November 30, 2015 and the years ended May 31, 2015, 2014, 2013, 2012 and 2011, respectively. |
| (g) | Interest rebate expense and line of credit interest expense totaled 0.05% (annualized), 0.18%, 0.12%, 0.10%, 0.20% and 0.13%, of average net assets for the six months ended November 30, 2015 and the years ended May 31, 2015, 2014, 2013, 2012 and 2011, respectively. |
See Notes to Financial Statements.
| 66 | www.arbitragefunds.com | 1-800-295-4485 |
Table of Contents
| Financial Highlights |
| Six Months Ended November 30, 2015 (Unaudited) | Year Ended May 31, 2015 | Year Ended May 31, 2014 | Year Ended May 31, 2013 | Year Ended May 31, 2012 | Year Ended May 31, 2011 | |||||||||||||||||
| $12.97 | $12.58 | $12.50 | $12.80 | $12.77 | $12.50 | |||||||||||||||||
| (0.06 | ) | (0.11 | ) | (0.09 | ) | (0.10 | ) | (0.11 | ) | (0.12 | ) | |||||||||||
| (0.15 | ) | 0.53 | 0.23 | 0.15 | 0.44 | 0.66 | ||||||||||||||||
|
| |||||||||||||||||||||
| (0.21 | ) | 0.42 | 0.14 | 0.05 | 0.33 | 0.54 | ||||||||||||||||
|
| |||||||||||||||||||||
| – | – | – | (0.09 | ) | – | – | ||||||||||||||||
| – | (0.03 | ) | (0.06 | ) | (0.26 | ) | (0.30 | ) | (0.27 | ) | ||||||||||||
|
| |||||||||||||||||||||
| – | (0.03 | ) | (0.06 | ) | (0.35 | ) | (0.30 | ) | (0.27 | ) | ||||||||||||
|
| |||||||||||||||||||||
| 0.00 | (b) | 0.00 | (b) | 0.00 | (b) | 0.00 | (b) | 0.00 | (b) | 0.00 | (b) | |||||||||||
|
| |||||||||||||||||||||
| $12.76 | $12.97 | $12.58 | $12.50 | $12.80 | $12.77 | |||||||||||||||||
|
| |||||||||||||||||||||
| (1.62% | )(d) | 3.35% | 1.10% | 0.42% | 2.54% | 4.37% | ||||||||||||||||
| $451,608 | $500,440 | $760,750 | $916,677 | $1,003,646 | $866,885 | |||||||||||||||||
| 1.87% | (e) | 2.31% | 2.17% | 1.97% | 2.23% | 2.16% | ||||||||||||||||
| 1.46% | (e) | 1.45% | 1.45% | 1.45% | 1.45% | 1.52% | ||||||||||||||||
| | 1.46% | (e) | 1.45% | 1.45% | 1.45% | 1.44% | 1.52% | |||||||||||||||
| (0.99% | )(e) | (0.87% | ) | (0.70% | ) | (0.78% | ) | (0.83% | ) | (0.93% | ) | |||||||||||
| 39% | (d) | 514% | 462% | 459% | 563% | 389% | ||||||||||||||||
|
| |||||||||||||||||||||
| Semi-Annual Report | November 30, 2015 | 67 |
Table of Contents
| The Arbitrage Fund – Class I |
Selected Per Share Data and Ratios for a Share Outstanding Throughout the Periods Presented:
Net asset value, beginning of period |
Income (loss) from investment operations |
Net investment loss(a) |
Net realized and unrealized gains (losses) on investments and foreign currencies |
Total from investment operations |
Less distributions |
From net investment income |
From net realized gains |
Total distributions |
Proceeds from redemption fees collected |
Net asset value, end of period |
Total return(c) |
Net assets, end of period (in 000s) |
RATIOS TO AVERAGE NET ASSETS: |
Expenses including interest and dividend expense |
Expenses excluding interest and dividend expense(f)(g) |
Expenses after advisory fees waived and expenses reimbursed excluding interest and dividend expense(f)(g) |
Net investment loss |
Portfolio turnover rate |
|
| (a) | Per share amounts were calculated using average shares outstanding for the period. |
| (b) | Amount rounds to less than $0.01 per share. |
| (c) | Total return is a measure of the change in the value of an investment in the Fund over the years covered, which assumes any dividends or capital gains distributions are reinvested in shares of the Fund. Returns shown do not reflect the deduction of taxes a shareholder would pay on Fund distributions or the redemption of Fund shares. |
| (d) | Not annualized. |
| (e) | Annualized. |
| (f) | Dividend expense totaled 0.36% (annualized), 0.68%, 0.60%, 0.42%, 0.58% and 0.51%, of average net assets for the six months ended November 30, 2015 and the years ended May 31, 2015, 2014, 2013, 2012 and 2011, respectively. |
| (g) | Interest rebate expense and line of credit interest expense totaled 0.05% (annualized), 0.18%, 0.12%, 0.10%, 0.20% and 0.13%, of average net assets for the six months ended November 30, 2015 and the years ended May 31, 2015, 2014, 2013, 2012 and 2011, respectively. |
See Notes to Financial Statements.
| 68 | www.arbitragefunds.com | 1-800-295-4485 |
Table of Contents
| Financial Highlights |
| Six Months Ended November 30, 2015 (Unaudited) | Year Ended May 31, 2015 | Year Ended May 31, 2014 | Year Ended May 31, 2013 | Year Ended May 31, 2012 | Year Ended May 31, 2011 | |||||||||||||||||
| $13.28 | $12.86 | $12.74 | $13.04 | $12.98 | $12.68 | |||||||||||||||||
| (0.05 | ) | (0.09 | ) | (0.05 | ) | (0.07 | ) | (0.07 | ) | (0.08 | ) | |||||||||||
| (0.15 | ) | 0.54 | 0.23 | 0.16 | 0.43 | 0.67 | ||||||||||||||||
|
| |||||||||||||||||||||
| (0.20 | ) | 0.45 | 0.18 | 0.09 | 0.36 | 0.59 | ||||||||||||||||
|
| |||||||||||||||||||||
| – | – | – | (0.13 | ) | – | (0.02 | ) | |||||||||||||||
| – | (0.03 | ) | (0.06 | ) | (0.26 | ) | (0.30 | ) | (0.27 | ) | ||||||||||||
|
| |||||||||||||||||||||
| – | (0.03 | ) | (0.06 | ) | (0.39 | ) | (0.30 | ) | (0.29 | ) | ||||||||||||
|
| |||||||||||||||||||||
| 0.00 | (b) | 0.00 | (b) | 0.00 | (b) | 0.00 | (b) | 0.00 | (b) | 0.00 | (b) | |||||||||||
|
| |||||||||||||||||||||
| $13.08 | $13.28 | $12.86 | $12.74 | $13.04 | $12.98 | |||||||||||||||||
|
| |||||||||||||||||||||
| (1.51% | )(d) | 3.51% | 1.39% | 0.67% | 2.74% | 4.74% | ||||||||||||||||
| $1,492,750 | $1,514,685 | $1,712,120 | $1,937,514 | $2,084,530 | $1,346,801 | |||||||||||||||||
| 1.62% | (e) | 2.06% | 1.92% | 1.72% | 1.98% | 1.91% | ||||||||||||||||
| 1.21% | (e) | 1.20% | 1.20% | 1.20% | 1.20% | 1.27% | ||||||||||||||||
| | 1.21% | (e) | 1.20% | 1.20% | 1.20% | 1.20% | 1.27% | |||||||||||||||
| (0.73% | )(e) | (0.65% | ) | (0.42% | ) | (0.51% | ) | (0.56% | ) | (0.62% | ) | |||||||||||
| 39% | (d) | 514% | 462% | 459% | 563% | 389% | ||||||||||||||||
|
| |||||||||||||||||||||
| Semi-Annual Report | November 30, 2015 | 69 |
Table of Contents
| The Arbitrage Fund – Class C |
Selected Per Share Data and Ratios for a Share Outstanding Throughout the Periods Presented:
Net asset value, beginning of period |
Income (loss) from investment operations |
Net investment loss(b) |
Net realized and unrealized gains (losses) on investments and foreign currencies |
Total from investment operations |
Less distributions |
From net investment income |
From net realized gains |
Total distributions |
Proceeds from redemption fees collected |
Net asset value, end of period |
Total return(d) |
Net assets, end of period (in 000s) |
RATIOS TO AVERAGE NET ASSETS: |
Expenses including interest and dividend expense |
Expenses excluding interest and dividend expense(g)(h) |
Expenses after advisory fees waived and expenses reimbursed excluding interest and dividend expense(g)(h) |
Net investment loss |
Portfolio turnover rate |
|
| (a) | Commenced operations on June 1, 2012. |
| (b) | Per share amounts were calculated using average shares outstanding for the period. |
| (c) | Amount rounds to less than $0.01 per share. |
| (d) | Total return is a measure of the change in the value of an investment in the Fund over the years covered, which assumes any dividends or capital gains distributions are reinvested in shares of the Fund. Returns shown do not reflect the deduction of taxes a shareholder would pay on Fund distributions or the redemption of Fund shares. |
| (e) | Not annualized. |
| (f) | Annualized. |
| (g) | Dividend expense totaled 0.36% (annualized), 0.68%, 0.60% and 0.42%, of average net assets for the six months ended November 30, 2015 and the years ended May 31, 2015, 2014 and 2013, respectively. |
| (h) | Interest rebate expense and line of credit interest expense totaled 0.05% (annualized), 0.18%, 0.12% and 0.11%, of average net assets for the six months ended November 30, 2015 and the years ended May 31, 2015, 2014 and 2013, respectively. |
See Notes to Financial Statements.
| 70 | www.arbitragefunds.com | 1-800-295-4485 |
Table of Contents
| Financial Highlights |
| Six Months Ended November 30, 2015 (Unaudited) | Year Ended May 31, 2015 | Year Ended May 31, 2014 | Year Ended May 31, 2013(a) | |||||||||||
| $12.65 | $12.37 | $12.38 | $12.80 | |||||||||||
| (0.11 | ) | (0.20 | ) | (0.18 | ) | (0.23 | ) | |||||||
| (0.14 | ) | 0.51 | 0.23 | 0.20 | ||||||||||
|
| |||||||||||||
| (0.25 | ) | 0.31 | 0.05 | (0.03 | ) | |||||||||
|
| |||||||||||||
| – | – | – | (0.13 | ) | ||||||||||
| – | (0.03 | ) | (0.06 | ) | (0.26 | ) | ||||||||
|
| |||||||||||||
| – | (0.03 | ) | (0.06 | ) | (0.39 | ) | ||||||||
|
| |||||||||||||
| – | – | – | 0.00 | (c) | ||||||||||
|
| |||||||||||||
| $12.40 | $12.65 | $12.37 | $12.38 | |||||||||||
|
| |||||||||||||
| (1.98% | )(e) | 2.52% | 0.38% | (0.27% | ) | |||||||||
| $32,820 | $32,958 | $33,589 | $18,741 | |||||||||||
| 2.62% | (f) | 3.06% | 2.92% | 2.75% | ||||||||||
| 2.21% | (f) | 2.20% | 2.20% | 2.20% | ||||||||||
| | 2.21% | (f) | 2.20% | 2.20% | 2.20% | |||||||||
| (1.73% | )(f) | (1.60% | ) | (1.45% | ) | (1.84% | ) | |||||||
| 39% | (e) | 514% | 462% | 459% | ||||||||||
|
| |||||||||||||
| Semi-Annual Report | November 30, 2015 | 71 |
Table of Contents
| The Arbitrage Fund – Class A |
Selected Per Share Data and Ratios for a Share Outstanding Throughout the Periods Presented:
Net asset value, beginning of period |
Income (loss) from investment operations |
Net investment loss(b) |
Net realized and unrealized gains (losses) on investments and foreign currencies |
Total from investment operations |
Less distributions |
From net realized gains |
Total distributions |
Proceeds from redemption fees collected |
Net asset value, end of period |
Total return(d) |
Net assets, end of period (in 000s) |
RATIOS TO AVERAGE NET ASSETS: |
Expenses including interest and dividend expense |
Expenses excluding interest and dividend expense(g)(h) |
Expenses after advisory fees waived and expenses reimbursed excluding interest and dividend expense(g)(h) |
Net investment loss |
Portfolio turnover rate |
|
| (a) | Commenced operations on June 1, 2013. |
| (b) | Per share amounts were calculated using average shares outstanding for the period. |
| (c) | Amount rounds to less than $0.01 per share. |
| (d) | Total return is a measure of the change in the value of an investment in the Fund over the years covered, which assumes any dividends or capital gains distributions are reinvested in shares of the Fund. Returns shown do not reflect the deduction of taxes a shareholder would pay on Fund distributions or the redemption of Fund shares. |
| (e) | Not annualized. |
| (f) | Annualized. |
| (g) | Dividend expense totaled 0.36% (annualized), 0.68% and 0.60%, of average net assets for the six months ended November 30, 2015 and the years ended May 31, 2015 and 2014, respectively. |
| (h) | Interest rebate expense and line of credit interest expense totaled 0.05% (annualized), 0.18% and 0.12% of average net assets for the six months ended November 30, 2015 and the years ended May 31, 2015 and 2014, respectively. |
See Notes to Financial Statements.
| 72 | www.arbitragefunds.com | 1-800-295-4485 |
Table of Contents
| Financial Highlights |
| Six Months Ended November 30, 2015 (Unaudited) | Year Ended May 31, 2015 | Year Ended May 31, 2014(a) | ||||||||
| $12.97 | $12.59 | $12.50 | ||||||||
| (0.06 | ) | (0.09 | ) | (0.09 | ) | |||||
| (0.15 | ) | 0.50 | 0.24 | |||||||
|
| |||||||||
| (0.21 | ) | 0.41 | 0.15 | |||||||
|
| |||||||||
| – | (0.03 | ) | (0.06 | ) | ||||||
|
| |||||||||
| – | (0.03 | ) | (0.06 | ) | ||||||
|
| |||||||||
| 0.00 | (c) | – | 0.00 | (c) | ||||||
|
| |||||||||
| $12.76 | $12.97 | $12.59 | ||||||||
|
| |||||||||
| (1.62% | )(e) | 3.27% | 1.18% | |||||||
| $17,884 | $17,458 | $6,655 | ||||||||
| 1.87% | (f) | 2.31% | 2.18% | |||||||
| 1.46% | (f) | 1.45% | 1.46% | |||||||
| | 1.46% | (f) | 1.45% | 1.46% | ||||||
| (0.98% | )(f) | (0.70% | ) | (0.69% | ) | |||||
| 39% | (e) | 514% | 462% | |||||||
|
| |||||||||
| Semi-Annual Report | November 30, 2015 | 73 |
Table of Contents
| The Arbitrage Event-Driven Fund – Class R |
Selected Per Share Data and Ratios for a Share Outstanding Throughout the Periods Presented:
Net asset value, beginning of period |
Income (loss) from investment operations |
Net investment income (loss)(b) |
Net realized and unrealized gains (losses) on investments and foreign currencies |
Total from investment operations |
Less distributions |
From net investment income |
From net realized gains |
Total distributions |
Proceeds from redemption fees collected |
Net asset value, end of period |
Total return(d) |
Net assets, end of period (in 000s) |
RATIOS TO AVERAGE NET ASSETS: |
Expenses including interest and dividend expense |
Expenses excluding interest and dividend expense(g)(h) |
Expenses after advisory fees waived and expenses reimbursed excluding interest and dividend expense(g)(h) |
Net investment income (loss) |
Portfolio turnover rate |
|
| (a) | Commenced operations on October 1, 2010. |
| (b) | Per share amounts were calculated using average shares outstanding for the period. |
| (c) | Amount rounds to less than $0.01 per share. |
| (d) | Total return is a measure of the change in the value of an investment in the Fund over the years covered, which assumes any dividends or capital gains distributions are reinvested in shares of the Fund. Returns shown do not reflect the deduction of taxes a shareholder would pay on Fund distributions or the redemption of Fund shares. |
| (e) | Not annualized. |
| (f) | Annualized. |
| (g) | Dividend expense totaled 0.62% (annualized), 0.55%, 0.49%, 0.36%, 0.27% and 0.28% (annualized) of average net assets for the six months ended November 30, 2015, the years ended May 31, 2015, 2014, 2013 and 2012 and the period ended May 31, 2011, respectively. |
| (h) | Interest rebate expense and line of credit interest expense totaled 0.20% (annualized), 0.26%, 0.13%, 0.13%, 0.21% and 0.21% (annualized) of average net assets for the six months ended November 30, 2015, the years ended May 31, 2015, 2014, 2013 and 2012 and the period ended May 31, 2011, respectively. |
See Notes to Financial Statements.
| 74 | www.arbitragefunds.com | 1-800-295-4485 |
Table of Contents
| Financial Highlights |
| Six Months Ended November 30, 2015 (Unaudited) | Year Ended May 31, 2015 | Year Ended May 31, 2014 | Year Ended May 31, 2013 | Year Ended May 31, 2012 | Year Ended May 31, 2011(a) | |||||||||||||||||
| $9.73 | $10.29 | $9.80 | $9.79 | $10.23 | $10.00 | |||||||||||||||||
| (0.04 | ) | 0.04 | 0.10 | 0.15 | 0.10 | (0.02 | ) | |||||||||||||||
| (0.78 | ) | (0.36 | ) | 0.46 | 0.11 | 0.09 | 0.36 | |||||||||||||||
|
| |||||||||||||||||||||
| (0.82 | ) | (0.32 | ) | 0.56 | 0.26 | 0.19 | 0.34 | |||||||||||||||
|
| |||||||||||||||||||||
| – | (0.08 | ) | (0.06 | ) | (0.10 | ) | (0.15 | ) | (0.01 | ) | ||||||||||||
| – | (0.16 | ) | (0.01 | ) | (0.15 | ) | (0.48 | ) | (0.10 | ) | ||||||||||||
|
| |||||||||||||||||||||
| – | (0.24 | ) | (0.07 | ) | (0.25 | ) | (0.63 | ) | (0.11 | ) | ||||||||||||
|
| |||||||||||||||||||||
| 0.00 | (c) | 0.00 | (c) | 0.00 | (c) | 0.00 | (c) | 0.00 | (c) | 0.00 | (c) | |||||||||||
|
| |||||||||||||||||||||
| $8.91 | $9.73 | $10.29 | $9.80 | $9.79 | $10.23 | |||||||||||||||||
|
| |||||||||||||||||||||
| (8.43% | )(e) | (3.12% | ) | 5.75% | 2.72% | 1.88% | 3.43% | (e) | ||||||||||||||
| $120,087 | $195,014 | $204,055 | $10,080 | $8,976 | $4,867 | |||||||||||||||||
| 2.62% | (f) | 2.52% | 2.33% | 2.55% | 2.67% | 4.33% | (f) | |||||||||||||||
| 1.79% | (f) | 1.71% | 1.71% | 2.06% | 2.19% | 3.84% | (f) | |||||||||||||||
| | 1.69% | (f) | 1.69% | 1.69% | 1.69% | 1.69% | 1.69% | (f) | ||||||||||||||
| (0.85% | )(f) | 0.37% | 1.04% | 1.58% | 1.02% | (0.26% | )(f) | |||||||||||||||
| 200% | (e) | 451% | 340% | 336% | 490% | 298% | (e) | |||||||||||||||
|
| |||||||||||||||||||||
| Semi-Annual Report | November 30, 2015 | 75 |
Table of Contents
| The Arbitrage Event-Driven Fund – Class I |
Selected Per Share Data and Ratios for a Share Outstanding Throughout the Periods Presented:
Net asset value, beginning of period |
Income (loss) from investment operations |
Net investment income (loss)(b) |
Net realized and unrealized gains (losses) on investments and foreign currencies |
Total from investment operations |
Less distributions |
From net investment income |
From net realized gains |
Total distributions |
Proceeds from redemption fees collected |
Net asset value, end of period |
Total return(d) |
Net assets, end of period (in 000s) |
RATIOS TO AVERAGE NET ASSETS: |
Expenses including interest and dividend expense |
Expenses excluding interest and dividend expense(g)(h) |
Expenses after advisory fees waived and expenses reimbursed excluding interest and dividend expense(g)(h) |
Net investment income (loss) |
Portfolio turnover rate |
|
| (a) | Commenced operations on October 1, 2010. |
| (b) | Per share amounts were calculated using average shares outstanding for the period. |
| (c) | Amount rounds to less than $0.01 per share. |
| (d) | Total return is a measure of the change in the value of an investment in the Fund over the years covered, which assumes any dividends or capital gains distributions are reinvested in shares of the Fund. Returns shown do not reflect the deduction of taxes a shareholder would pay on Fund distributions or the redemption of Fund shares. |
| (e) | Not annualized. |
| (f) | Annualized. |
| (g) | Dividend expense totaled 0.62% (annualized), 0.55%, 0.49%, 0.36%, 0.27% and 0.28% (annualized) of average net assets for the six months ended November 30, 2015, the years ended May 31, 2015, 2014, 2013 and 2012 and the period ended May 31, 2011, respectively. |
| (h) | Interest rebate expense and line of credit interest expense totaled 0.20% (annualized), 0.26%, 0.13%, 0.13%, 0.21% and 0.21% (annualized) of average net assets for the six months ended November 30, 2015, the years ended May 31, 2015, 2014, 2013 and 2012 and the period ended May 31, 2011, respectively. |
See Notes to Financial Statements.
| 76 | www.arbitragefunds.com | 1-800-295-4485 |
Table of Contents
| Financial Highlights |
| Six Months Ended November 30, 2015 (Unaudited) | Year Ended May 31, 2015 | Year Ended May 31, 2014 | Year Ended May 31, 2013 | Year Ended May 31, 2012 | Year Ended May 31, 2011(a) | |||||||||||||||||
| $9.81 | $10.37 | $9.86 | $9.82 | $10.24 | $10.00 | |||||||||||||||||
| (0.03 | ) | 0.06 | 0.13 | 0.16 | 0.12 | 0.01 | ||||||||||||||||
| (0.78 | ) | (0.37 | ) | 0.46 | 0.13 | 0.09 | 0.35 | |||||||||||||||
|
| |||||||||||||||||||||
| (0.81 | ) | (0.31 | ) | 0.59 | 0.29 | 0.21 | 0.36 | |||||||||||||||
|
| |||||||||||||||||||||
| – | (0.09 | ) | (0.07 | ) | (0.10 | ) | (0.15 | ) | (0.02 | ) | ||||||||||||
| – | (0.16 | ) | (0.01 | ) | (0.15 | ) | (0.48 | ) | (0.10 | ) | ||||||||||||
|
| |||||||||||||||||||||
| – | (0.25 | ) | (0.08 | ) | (0.25 | ) | (0.63 | ) | (0.12 | ) | ||||||||||||
|
| |||||||||||||||||||||
| 0.00 | (c) | 0.00 | (c) | 0.00 | (c) | 0.00 | (c) | 0.00 | (c) | 0.00 | (c) | |||||||||||
|
| |||||||||||||||||||||
| $9.00 | $9.81 | $10.37 | $9.86 | $9.82 | $10.24 | |||||||||||||||||
|
| |||||||||||||||||||||
| (8.26% | )(e) | (2.96% | ) | 6.02% | 3.04% | 2.09% | 3.57% | (e) | ||||||||||||||
| $184,595 | $390,102 | $290,999 | $41,493 | $21,389 | $11,701 | |||||||||||||||||
| 2.37% | (f) | 2.27% | 2.11% | 2.31% | 2.42% | 4.73% | (f) | |||||||||||||||
| 1.54% | (f) | 1.46% | 1.49% | 1.82% | 1.94% | 4.24% | (f) | |||||||||||||||
| | 1.44% | (f) | 1.44% | 1.44% | 1.44% | 1.44% | 1.44% | (f) | ||||||||||||||
| (0.55% | )(f) | 0.62% | 1.31% | 1.68% | 1.25% | 0.12% | (f) | |||||||||||||||
| 200% | (e) | 451% | 340% | 336% | 490% | 298% | (e) | |||||||||||||||
|
| |||||||||||||||||||||
| Semi-Annual Report | November 30, 2015 | 77 |
Table of Contents
| The Arbitrage Event-Driven Fund – Class C |
Selected Per Share Data and Ratios for a Share Outstanding Throughout the Periods Presented:
Net asset value, beginning of period |
Income (loss) from investment operations |
Net investment income (loss)(b) |
Net realized and unrealized gains (losses) on investments and foreign currencies |
Total from investment operations |
Less distributions |
From net investment income |
From net realized gains |
Total distributions |
Net asset value, end of period |
Total return(c) |
Net assets, end of period (in 000s) |
RATIOS TO AVERAGE NET ASSETS: |
Expenses including interest and dividend expense |
Expenses excluding interest and dividend expense(f)(g) |
Expenses after advisory fees waived and expenses reimbursed excluding interest and dividend expense(f)(g) |
Net investment income (loss) |
Portfolio turnover rate |
|
| (a) | Commenced operations on June 1, 2012. |
| (b) | Per share amounts were calculated using average shares outstanding for the period. |
| (c) | Total return is a measure of the change in the value of an investment in the Fund over the years covered, which assumes any dividends or capital gains distributions are reinvested in shares of the Fund. Returns shown do not reflect the deduction of taxes a shareholder would pay on Fund distributions or the redemption of Fund shares. |
| (d) | Not annualized. |
| (e) | Annualized. |
| (f) | Dividend expense totaled 0.62% (annualized), 0.55%, 0.49% and 0.36%, of average net assets for the six months ended November 30, 2015 and the years ended May 31, 2015, 2014 and 2013, respectively. |
| (g) | Interest rebate expense and line of credit interest expense totaled 0.20% (annualized), 0.26%, 0.13% and 0.13%, of average net assets for the six months ended November 30, 2015 and the years ended May 31, 2015, 2014 and 2013, respectively. |
| (h) | The amount shown for a share outstanding throughout the period may not correlate with the Statement of Operations for the period due to timing of sales and redemptions of Fund shares in relation to income earned and/or fluctuating market value of the investments of the Fund. |
See Notes to Financial Statements.
| 78 | www.arbitragefunds.com | 1-800-295-4485 |
Table of Contents
| Financial Highlights |
| Six Months Ended November 30, 2015 (Unaudited) | Year Ended May 31, 2015 | Year Ended May 31, 2014 | Year Ended May 31, 2013(a) | |||||||||||
| $9.62 | $10.22 | $9.78 | $9.79 | |||||||||||
| (0.07 | ) | (0.04 | ) | 0.03 | 0.09 | |||||||||
| (0.77 | ) | (0.36 | ) | 0.46 | 0.13 | |||||||||
|
| |||||||||||||
| (0.84 | ) | (0.40 | ) | 0.49 | 0.22 | |||||||||
|
| |||||||||||||
| – | (0.04 | ) | (0.04 | ) | (0.08 | ) | ||||||||
| – | (0.16 | ) | (0.01 | ) | (0.15 | ) | ||||||||
|
| |||||||||||||
| – | (0.20 | ) | (0.05 | ) | (0.23 | ) | ||||||||
|
| |||||||||||||
| $8.78 | $9.62 | $10.22 | $9.78 | |||||||||||
|
| |||||||||||||
| (8.73% | )(d) | (3.95% | ) | 5.05% | 2.33% | |||||||||
| $3,549 | $5,020 | $4,232 | $342 | |||||||||||
| 3.37% | (e) | 3.27% | 3.12% | 3.31% | ||||||||||
| 2.54% | (e) | 2.46% | 2.50% | 2.82% | ||||||||||
| 2.44% | (e) | 2.44% | 2.44% | 2.44% | ||||||||||
| (1.62% | )(e) | (0.37% | )(h) | 0.32% | 0.95% | |||||||||
| 200% | (d) | 451% | 340% | 336% | ||||||||||
|
| |||||||||||||
| Semi-Annual Report | November 30, 2015 | 79 |
Table of Contents
| The Arbitrage Event-Driven Fund – Class A |
Selected Per Share Data and Ratios for a Share Outstanding Throughout the Periods Presented:
Net asset value, beginning of period |
Income (loss) from investment operations |
Net investment income (loss)(b) |
Net realized and unrealized gains (losses) on investments and foreign currencies |
Total from investment operations |
Less distributions |
From net investment income |
From net realized gains |
Total distributions |
Proceeds from redemption fees collected |
Net asset value, end of period |
Total return(d) |
Net assets, end of period (in 000s) |
RATIOS TO AVERAGE NET ASSETS: |
Expenses including interest and dividend expense |
Expenses excluding interest and dividend expense(g)(h) |
Expenses after advisory fees waived and expenses reimbursed excluding interest and dividend expense(g)(h) |
Net investment income (loss) |
Portfolio turnover rate |
|
| (a) | Commenced operations on June 1, 2013. |
| (b) | Per share amounts were calculated using average shares outstanding for the period. |
| (c) | Amount rounds to less than $0.01 per share. |
| (d) | Total return is a measure of the change in the value of an investment in the Fund over the years covered, which assumes any dividends or capital gains distributions are reinvested in shares of the Fund. Returns shown do not reflect the deduction of taxes a shareholder would pay on Fund distributions or the redemption of Fund shares. |
| (e) | Not annualized. |
| (f) | Annualized. |
| (g) | Dividend expense totaled 0.62% (annualized), 0.55% and 0.49%, of average net assets for the six months ended November 30, 2015 and the years ended May 31, 2015 and 2014, respectively. |
| (h) | Interest rebate expense and line of credit interest expense totaled 0.20% (annualized), 0.26% and 0.13% of average net assets for the six months ended November 30, 2015 and the years ended May 31, 2015 and 2014, respectively. |
| (i) | The amount shown for a share outstanding throughout the period may not correlate with the Statement of Operations for the period due to timing of sales and redemptions of Fund shares in relation to income earned and/or fluctuating market value of the investments of the Fund. |
See Notes to Financial Statements.
| 80 | www.arbitragefunds.com | 1-800-295-4485 |
Table of Contents
| Financial Highlights |
| Six Months Ended November 30, 2015 (Unaudited) | Year Ended May 31, 2015 | Year Ended May 31, 2014(a) | ||||||||
| $9.73 | $10.30 | $9.80 | ||||||||
| (0.04 | ) | 0.03 | 0.10 | |||||||
| (0.77 | ) | (0.36 | ) | 0.47 | ||||||
|
| |||||||||
| (0.81 | ) | (0.33 | ) | 0.57 | ||||||
|
| |||||||||
| – | (0.08 | ) | (0.06 | ) | ||||||
| – | (0.16 | ) | (0.01 | ) | ||||||
|
| |||||||||
| – | (0.24 | ) | (0.07 | ) | ||||||
|
| |||||||||
| – | – | 0.00 | (c) | |||||||
|
| |||||||||
| $8.92 | $9.73 | $10.30 | ||||||||
|
| |||||||||
| (8.32% | )(e) | (3.22% | ) | 5.85% | ||||||
| $2,880 | $5,341 | $3,830 | ||||||||
| 2.62% | (f) | 2.52% | 2.36% | |||||||
| 1.79% | (f) | 1.71% | 1.74% | |||||||
| 1.69% | (f) | 1.69% | 1.69% | |||||||
| (0.81% | )(f) | 0.35% | (i) | 0.98% | ||||||
| 200% | (e) | 451% | 340% | |||||||
|
| |||||||||
| Semi-Annual Report | November 30, 2015 | 81 |
Table of Contents
| The Arbitrage Credit Opportunities Fund – Class R |
Selected Per Share Data and Ratios for a Share Outstanding Throughout the Periods Presented:
Net asset value, beginning of period |
Income (loss) from investment operations |
Net investment income(b) |
Net realized and unrealized gains (losses) on investments and foreign currencies |
Total from investment operations |
Less distributions |
From net investment income |
Total distributions |
Proceeds from redemption fees collected |
Net asset value, end of period |
Total return(d) |
Net assets, end of period (in 000s) |
RATIOS TO AVERAGE NET ASSETS: |
Expenses including interest and dividend expense |
Expenses excluding interest and dividend expense(g)(h) |
Expenses after advisory fees waived and expenses reimbursed excluding interest and dividend expense(g)(h) |
Net investment income |
Portfolio turnover rate |
|
| (a) | Commenced operations on October 1, 2012. |
| (b) | Per share amounts were calculated using average shares outstanding for the period. |
| (c) | Amount rounds to less than $0.01 per share. |
| (d) | Total return is a measure of the change in the value of an investment in the Fund over the years covered, which assumes any dividends or capital gains distributions are reinvested in shares of the Fund. Returns shown do not reflect the deduction of taxes a shareholder would pay on Fund distributions or the redemption of Fund shares. |
| (e) | Not annualized. |
| (f) | Annualized. |
| (g) | Dividend expense totaled 0.00% (annualized), 0.06%, 0.10% and 0.03% (annualized) of average net assets for the six months ended November 30, 2015, the years ended May 31, 2015 and 2014 and the period ended May 31, 2013, respectively. |
| (h) | Interest rebate expense and line of credit interest expense totaled 0.17% (annualized), 0.47%, 0.07% and 0.02% (annualized) of average net assets for the six months ended November 30, 2015, the years ended May 31, 2015 and 2014 and the period ended May 31, 2013, respectively. |
See Notes to Financial Statements.
| 82 | www.arbitragefunds.com | 1-800-295-4485 |
Table of Contents
| Financial Highlights |
| Six Months Ended November 30, 2015 (Unaudited) | Year Ended May 31, 2015 | Year Ended May 31, 2014 | Year Ended May 31, 2013(a) | |||||||||||
| $9.95 | $10.28 | $10.18 | $10.00 | |||||||||||
| 0.12 | 0.28 | 0.40 | 0.17 | |||||||||||
| (0.28 | ) | (0.29 | ) | 0.08 | 0.06 | |||||||||
|
| |||||||||||||
| (0.16 | ) | (0.01 | ) | 0.48 | 0.23 | |||||||||
|
| |||||||||||||
| (0.14 | ) | (0.32 | ) | (0.39 | ) | (0.05 | ) | |||||||
|
| |||||||||||||
| (0.14 | ) | (0.32 | ) | (0.39 | ) | (0.05 | ) | |||||||
|
| |||||||||||||
| – | 0.00 | (c) | 0.01 | 0.00 | (c) | |||||||||
|
| |||||||||||||
| $9.65 | $9.95 | $10.28 | $10.18 | |||||||||||
|
| |||||||||||||
| (1.67% | )(e) | (0.10% | ) | 4.99% | 2.33% | (e) | ||||||||
| $18,967 | $22,728 | $6,393 | $1,671 | |||||||||||
| 1.80% | (f) | 2.27% | 2.71% | 3.79% | (f) | |||||||||
| 1.63% | (f) | 1.74% | 2.54% | 3.74% | (f) | |||||||||
| 1.50% | (f) | 1.50% | 1.50% | 1.50% | (f) | |||||||||
| 2.52% | (f) | 2.84% | 3.97% | 2.49% | (f) | |||||||||
| 45% | (e) | 191% | 181% | 92% | (e) | |||||||||
|
| |||||||||||||
| Semi-Annual Report | November 30, 2015 | 83 |
Table of Contents
| The Arbitrage Credit Opportunities Fund – Class I |
Selected Per Share Data and Ratios for a Share Outstanding Throughout the Periods Presented:
Net asset value, beginning of period |
Income (loss) from investment operations |
Net investment income(b) |
Net realized and unrealized gains (losses) on investments and foreign currencies |
Total from investment operations |
Less distributions |
From net investment income |
Total distributions |
Proceeds from redemption fees collected |
Net asset value, end of period |
Total return(d) |
Net assets, end of period (in 000s) |
RATIOS TO AVERAGE NET ASSETS: |
Expenses including interest and dividend expense |
Expenses excluding interest and dividend expense(g)(h) |
Expenses after advisory fees waived and expenses reimbursed excluding interest and dividend expense(g)(h) |
Net investment income |
Portfolio turnover rate |
|
| (a) | Commenced operations on October 1, 2012. |
| (b) | Per share amounts were calculated using average shares outstanding for the period. |
| (c) | Amount rounds to less than $0.01 per share. |
| (d) | Total return is a measure of the change in the value of an investment in the Fund over the years covered, which assumes any dividends or capital gains distributions are reinvested in shares of the Fund. Returns shown do not reflect the deduction of taxes a shareholder would pay on Fund distributions or the redemption of Fund shares. |
| (e) | Not annualized. |
| (f) | Annualized. |
| (g) | Dividend expense totaled 0.00% (annualized), 0.06%, 0.10% and 0.03% (annualized) of average net assets for the six months ended November 30, 2015, the years ended May 31, 2015 and 2014 and the period ended May 31, 2013, respectively. |
| (h) | Interest rebate expense and line of credit interest expense totaled 0.17% (annualized), 0.47%, 0.07% and 0.01% (annualized) of average net assets for the six months ended November 30, 2015, the years ended May 31, 2015 and 2014 and the period ended May 31, 2013, respectively. |
See Notes to Financial Statements.
| 84 | www.arbitragefunds.com | 1-800-295-4485 |
Table of Contents
| Financial Highlights |
| Six Months Ended November 30, 2015 (Unaudited) | Year Ended May 31, 2015 | Year Ended May 31, 2014 | Year Ended May 31, 2013(a) | |||||||||||
| $9.93 | $10.25 | $10.16 | $10.00 | |||||||||||
| 0.14 | 0.33 | 0.42 | 0.17 | |||||||||||
| (0.29 | ) | (0.31 | ) | 0.08 | 0.08 | |||||||||
|
| |||||||||||||
| (0.15 | ) | 0.02 | 0.50 | 0.25 | ||||||||||
|
| |||||||||||||
| (0.14 | ) | (0.34 | ) | (0.41 | ) | (0.09 | ) | |||||||
|
| |||||||||||||
| (0.14 | ) | (0.34 | ) | (0.41 | ) | (0.09 | ) | |||||||
|
| |||||||||||||
| – | 0.00 | (c) | 0.00 | (c) | – | |||||||||
|
| |||||||||||||
| $9.64 | $9.93 | $10.25 | $10.16 | |||||||||||
|
| |||||||||||||
| (1.50% | )(e) | 0.16% | 5.08% | 2.49% | (e) | |||||||||
| $44,108 | $46,118 | $23,039 | $3,462 | |||||||||||
| 1.55% | (f) | 2.04% | 2.37% | 3.64% | (f) | |||||||||
| 1.38% | (f) | 1.51% | 2.20% | 3.60% | (f) | |||||||||
| 1.25% | (f) | 1.25% | 1.25% | 1.25% | (f) | |||||||||
| 2.77% | (f) | 3.28% | 4.16% | 2.62% | (f) | |||||||||
| 45% | (e) | 191% | 181% | 92% | (e) | |||||||||
|
| |||||||||||||
| Semi-Annual Report | November 30, 2015 | 85 |
Table of Contents
| The Arbitrage Credit Opportunities Fund – Class C |
Selected Per Share Data and Ratios for a Share Outstanding Throughout the Periods Presented:
Net asset value, beginning of period |
Income (loss) from investment operations |
Net investment income(b) |
Net realized and unrealized gains (losses) on investments and foreign currencies |
Total from investment operations |
Less distributions |
From net investment income |
Total distributions |
Net asset value, end of period |
Total return(c) |
Net assets, end of period (in 000s) |
RATIOS TO AVERAGE NET ASSETS: |
Expenses including interest and dividend expense |
Expenses excluding interest and dividend expense(f)(g) |
Expenses after advisory fees waived and expenses reimbursed excluding interest and dividend expense(f)(g) |
Net investment income |
Portfolio turnover rate |
|
| (a) | Commenced operations on October 1, 2012. |
| (b) | Per share amounts were calculated using average shares outstanding for the period. |
| (c) | Total return is a measure of the change in the value of an investment in the Fund over the years covered, which assumes any dividends or capital gains distributions are reinvested in shares of the Fund. Returns shown do not reflect the deduction of taxes a shareholder would pay on Fund distributions or the redemption of Fund shares. |
| (d) | Not annualized. |
| (e) | Annualized. |
| (f) | Dividend expense totaled 0.00% (annualized), 0.06%, 0.10% and 0.03% (annualized) of average net assets for the six months ended November 30, 2015, the years ended May 31, 2015 and 2014 and the period ended May 31, 2013, respectively. |
| (g) | Interest rebate expense and line of credit interest expense totaled 0.17% (annualized), 0.47%, 0.07% and 0.01% (annualized) of average net assets for the six months ended November 30, 2015, the years ended May 31, 2015 and 2014 and the period ended May 31, 2013, respectively. |
See Notes to Financial Statements.
| 86 | www.arbitragefunds.com | 1-800-295-4485 |
Table of Contents
| Financial Highlights |
| Six Months Ended November 30, 2015 (Unaudited) | Year Ended May 31, 2015 | Year Ended May 31, 2014 | Year Ended May 31, 2013(a) | |||||||||||
| $9.89 | $10.23 | $10.17 | $10.00 | |||||||||||
| 0.09 | 0.22 | 0.34 | 0.11 | |||||||||||
| (0.29 | ) | (0.30 | ) | 0.07 | 0.09 | |||||||||
|
| |||||||||||||
| (0.20 | ) | (0.08 | ) | 0.41 | 0.20 | |||||||||
|
| |||||||||||||
| (0.11 | ) | (0.26 | ) | (0.35 | ) | (0.03 | ) | |||||||
|
| |||||||||||||
| (0.11 | ) | (0.26 | ) | (0.35 | ) | (0.03 | ) | |||||||
|
| |||||||||||||
| $9.58 | $9.89 | $10.23 | $10.17 | |||||||||||
|
| |||||||||||||
| (2.02% | )(d) | (0.76% | ) | 4.17% | 2.01% | (d) | ||||||||
| $1,620 | $2,020 | $716 | $26 | |||||||||||
| 2.55% | (e) | 3.05% | 3.37% | 4.69% | (e) | |||||||||
| 2.38% | (e) | 2.52% | 3.20% | 4.64% | (e) | |||||||||
| 2.25% | (e) | 2.25% | 2.25% | 2.25% | (e) | |||||||||
| 1.86% | (e) | 2.24% | 3.37% | 1.58% | (e) | |||||||||
| 45% | (d) | 191% | 181% | 92% | (d) | |||||||||
|
| |||||||||||||
| Semi-Annual Report | November 30, 2015 | 87 |
Table of Contents
| The Arbitrage Credit Opportunities Fund – Class A |
Selected Per Share Data and Ratios for a Share Outstanding Throughout the Periods Presented:
Net asset value, beginning of period |
Income (loss) from investment operations |
Net investment income(b) |
Net realized and unrealized gains (losses) on investments and foreign currencies |
Total from investment operations |
Less distributions |
From net investment income |
Total distributions |
Net asset value, end of period |
Total return(c) |
Net assets, end of period (in 000s) |
RATIOS TO AVERAGE NET ASSETS: |
Expenses including interest and dividend expense |
Expenses excluding interest and dividend expense(f)(g) |
Expenses after advisory fees waived and expenses reimbursed excluding interest and dividend expense(f)(g) |
Net investment income |
Portfolio turnover rate |
|
| (a) | Commenced operations on June 1, 2013. |
| (b) | Per share amounts were calculated using average shares outstanding for the period. |
| (c) | Total return is a measure of the change in the value of an investment in the Fund over the years covered, which assumes any dividends or capital gains distributions are reinvested in shares of the Fund. Returns shown do not reflect the deduction of taxes a shareholder would pay on Fund distributions or the redemption of Fund shares. |
| (d) | Not annualized. |
| (e) | Annualized. |
| (f) | Dividend expense totaled 0.00% (annualized), 0.06% and 0.10%, of average net assets for the six months ended November 30, 2015 and the years ended May 31, 2015 and 2014, respectively. |
| (g) | Interest rebate expense and line of credit interest expense totaled 0.17% (annualized), 0.47% and 0.07% of average net assets for the six months ended November 30, 2015 and the years ended May 31, 2015 and 2014, respectively. |
See Notes to Financial Statements.
| 88 | www.arbitragefunds.com | 1-800-295-4485 |
Table of Contents
| Financial Highlights |
| Six Months Ended November 30, 2015 (Unaudited) | Year Ended May 31, 2015 | Year Ended May 31, 2014(a) | ||||||||
| $9.93 | $10.25 | $10.18 | ||||||||
| 0.12 | 0.29 | 0.39 | ||||||||
| (0.28 | ) | (0.29 | ) | 0.09 | ||||||
|
| |||||||||
| (0.16 | ) | – | 0.48 | |||||||
|
| |||||||||
| (0.14 | ) | (0.32 | ) | (0.41 | ) | |||||
|
| |||||||||
| (0.14 | ) | (0.32 | ) | (0.41 | ) | |||||
|
| |||||||||
| $9.63 | $9.93 | $10.25 | ||||||||
|
| |||||||||
| (1.67% | )(d) | (0.01% | ) | 4.86% | ||||||
| $602 | $630 | $28 | ||||||||
| 1.80% | (e) | 2.29% | 2.77% | |||||||
| 1.63% | (e) | 1.76% | 2.60% | |||||||
| 1.50% | (e) | 1.50% | 1.50% | |||||||
| 2.52% | (e) | 2.95% | 3.89% | |||||||
| 45% | (d) | 191% | 181% | |||||||
|
| |||||||||
| Semi-Annual Report | November 30, 2015 | 89 |
Table of Contents
| The Arbitrage Tactical Equity Fund – Class R |
Selected Per Share Data and Ratios for a Share Outstanding Throughout the Periods Presented:
Net asset value, beginning of period |
Income (loss) from investment operations |
Net investment loss(b) |
Net realized and unrealized gains (losses) on investments and foreign currencies |
Total from investment operations |
Net asset value, end of period |
Total return(c) |
Net assets, end of period (in 000s) |
RATIOS TO AVERAGE NET ASSETS: |
Expenses including interest and dividend expense |
Expenses excluding interest and dividend expense(f)(g) |
Expenses after advisory fees waived and expenses reimbursed excluding interest and dividend expense(f)(g) |
Net investment loss |
Portfolio turnover rate |
|
| (a) | Commenced operations on January 2, 2015. |
| (b) | Per share amounts were calculated using average shares outstanding for the period. |
| (c) | Total return is a measure of the change in the value of an investment in the Fund over the years covered, which assumes any dividends or capital gains distributions are reinvested in shares of the Fund. Returns shown do not reflect the deduction of taxes a shareholder would pay on Fund distributions or the redemption of Fund shares. |
| (d) | Not annualized. |
| (e) | Annualized. |
| (f) | Dividend expense totaled 0.78% (annualized) and 1.01% (annualized) of average net assets for the six months ended November 30, 2015 and the period ended May 31, 2015, respectively. |
| (g) | Interest rebate expense and line of credit interest expense totaled 0.38% (annualized) and 0.15% (annualized) of average net assets for the six months ended November 30, 2015 and the period ended May 31, 2015, respectively. |
See Notes to Financial Statements.
| 90 | www.arbitragefunds.com | 1-800-295-4485 |
Table of Contents
| Financial Highlights |
| Six Months Ended November 30, 2015 (Unaudited) | Period Ended May 31, 2015(a) | |||||
| $10.12 | $10.00 | |||||
| (0.12 | ) | (0.10 | ) | |||
| (0.72 | ) | 0.22 | ||||
|
| |||||
| (0.84 | ) | 0.12 | ||||
|
| |||||
| $9.28 | $10.12 | |||||
|
| |||||
| (8.30% | )(d) | 1.20% | (d) | |||
| $9 | $10 | |||||
| 19.21% | (e) | 44.48% | (e) | |||
| 18.05% | (e) | 43.32% | (e) | |||
| 1.69% | (e) | 1.69% | (e) | |||
| (2.40% | )(e) | (2.35% | )(e) | |||
| 189% | (d) | 235% | (d) | |||
|
| |||||
| Semi-Annual Report | November 30, 2015 | 91 |
Table of Contents
| The Arbitrage Tactical Equity Fund – Class I |
Selected Per Share Data and Ratios for a Share Outstanding Throughout the Periods Presented:
Net asset value, beginning of period |
Income (loss) from investment operations |
Net investment loss(b) |
Net realized and unrealized gains (losses) on investments and foreign currencies |
Total from investment operations |
Net asset value, end of period |
Total return(c) |
Net assets, end of period (in 000s) |
RATIOS TO AVERAGE NET ASSETS: |
Expenses including interest and dividend expense |
Expenses excluding interest and dividend expense(f)(g) |
Expenses after advisory fees waived and expenses reimbursed excluding interest and dividend expense(f)(g) |
Net investment loss |
Portfolio turnover rate |
|
| (a) | Commenced operations on January 2, 2015. |
| (b) | Per share amounts were calculated using average shares outstanding for the period. |
| (c) | Total return is a measure of the change in the value of an investment in the Fund over the years covered, which assumes any dividends or capital gains distributions are reinvested in shares of the Fund. Returns shown do not reflect the deduction of taxes a shareholder would pay on Fund distributions or the redemption of Fund shares. |
| (d) | Not annualized. |
| (e) | Annualized. |
| (f) | Dividend expense totaled 0.78% (annualized) and 1.01% (annualized) of average net assets for the six months ended November 30, 2015 and the period ended May 31, 2015, respectively. |
| (g) | Interest rebate expense and line of credit interest expense totaled 0.38% (annualized) and 0.15% (annualized) of average net assets for the six months ended November 30, 2015 and the period ended May 31, 2015, respectively. |
See Notes to Financial Statements.
| 92 | www.arbitragefunds.com | 1-800-295-4485 |
Table of Contents
| Financial Highlights |
| Six Months Ended November 30, 2015 (Unaudited) | Period Ended May 31, 2015(a) | |||||
| $10.12 | $10.00 | |||||
| (0.10 | ) | (0.09 | ) | |||
| (0.74 | ) | 0.21 | ||||
|
| |||||
| (0.84 | ) | 0.12 | ||||
|
| |||||
| $9.28 | $10.12 | |||||
|
| |||||
| (8.30% | )(d) | 1.20% | (d) | |||
| $1,530 | $1,386 | |||||
| 18.95% | (e) | 28.08% | (e) | |||
| 17.79% | (e) | 26.92% | (e) | |||
| 1.44% | (e) | 1.44% | (e) | |||
| (2.17% | )(e) | (2.15% | )(e) | |||
| 189% | (d) | 235% | (d) | |||
|
| |||||
| Semi-Annual Report | November 30, 2015 | 93 |
Table of Contents
| The Arbitrage Tactical Equity Fund – Class C |
Selected Per Share Data and Ratios for a Share Outstanding Throughout the Periods Presented:
Net asset value, beginning of period |
Income (loss) from investment operations |
Net investment loss(b) |
Net realized and unrealized gains (losses) on investments and foreign currencies |
Total from investment operations |
Net asset value, end of period |
Total return(c) |
Net assets, end of period (in 000s) |
RATIOS TO AVERAGE NET ASSETS: |
Expenses including interest and dividend expense |
Expenses excluding interest and dividend expense(f)(g) |
Expenses after advisory fees waived and expenses reimbursed excluding interest and dividend expense(f)(g) |
Net investment loss |
Portfolio turnover rate |
|
| (a) | Commenced operations on January 2, 2015. |
| (b) | Per share amounts were calculated using average shares outstanding for the period. |
| (c) | Total return is a measure of the change in the value of an investment in the Fund over the years covered, which assumes any dividends or capital gains distributions are reinvested in shares of the Fund. Returns shown do not reflect the deduction of taxes a shareholder would pay on Fund distributions or the redemption of Fund shares. |
| (d) | Not annualized. |
| (e) | Annualized. |
| (f) | Dividend expense totaled 0.78% (annualized) and 1.01% (annualized) of average net assets for the six months ended November 30, 2015 and the period ended May 31, 2015, respectively. |
| (g) | Interest rebate expense and line of credit interest expense totaled 0.38% (annualized) and 0.15% (annualized) of average net assets for the six months ended November 30, 2015 and the period ended May 31, 2015, respectively. |
See Notes to Financial Statements.
| 94 | www.arbitragefunds.com | 1-800-295-4485 |
Table of Contents
| Financial Highlights |
| Six Months Ended November 30, 2015 (Unaudited) | Period Ended May 31, 2015(a) | |||||
| $10.12 | $10.00 | |||||
| (0.15 | ) | (0.13 | ) | |||
| (0.69 | ) | 0.25 | ||||
|
| |||||
| (0.84 | ) | 0.12 | ||||
|
| |||||
| $9.28 | $10.12 | |||||
|
| |||||
| (8.30% | )(d) | 1.20% | (d) | |||
| $9 | $10 | |||||
| 19.96% | (e) | 45.25% | (e) | |||
| 18.80% | (e) | 44.09% | (e) | |||
| 2.44% | (e) | 2.44% | (e) | |||
| (3.15% | )(e) | (3.10% | )(e) | |||
| 189% | (d) | 235% | (d) | |||
|
| |||||
| Semi-Annual Report | November 30, 2015 | 95 |
Table of Contents
| The Arbitrage Tactical Equity Fund – Class A |
Selected Per Share Data and Ratios for a Share Outstanding Throughout the Periods Presented:
Net asset value, beginning of period |
Income (loss) from investment operations |
Net investment loss(b) |
Net realized and unrealized gains (losses) on investments and foreign currencies |
Total from investment operations |
Net asset value, end of period |
Total return(c) |
Net assets, end of period (in 000s) |
RATIOS TO AVERAGE NET ASSETS: |
Expenses including interest and dividend expense |
Expenses excluding interest and dividend expense(f)(g) |
Expenses after advisory fees waived and expenses reimbursed excluding interest and dividend expense(f)(g) |
Net investment loss |
Portfolio turnover rate |
|
| (a) | Commenced operations on January 2, 2015. |
| (b) | Per share amounts were calculated using average shares outstanding for the period. |
| (c) | Total return is a measure of the change in the value of an investment in the Fund over the years covered, which assumes any dividends or capital gains distributions are reinvested in shares of the Fund. Returns shown do not reflect the deduction of taxes a shareholder would pay on Fund distributions or the redemption of Fund shares. |
| (d) | Not annualized. |
| (e) | Annualized. |
| (f) | Dividend expense totaled 0.78% (annualized) and 1.01% (annualized) of average net assets for the six months ended November 30, 2015 and the period ended May 31, 2015, respectively. |
| (g) | Interest rebate expense and line of credit interest expense totaled 0.38% (annualized) and 0.15% (annualized) of average net assets for the six months ended November 30, 2015 and the period ended May 31, 2015, respectively. |
See Notes to Financial Statements.
| 96 | www.arbitragefunds.com | 1-800-295-4485 |
Table of Contents
| Financial Highlights |
| Six Months Ended November 30, 2015 (Unaudited) | Period Ended May 31, 2015(a) | |||||
| $10.12 | $10.00 | |||||
| (0.12 | ) | (0.10 | ) | |||
| (0.72 | ) | 0.22 | ||||
|
| |||||
| (0.84 | ) | 0.12 | ||||
|
| |||||
| $9.28 | $10.12 | |||||
|
| |||||
| (8.30% | )(d) | 1.20% | (d) | |||
| $9 | $10 | |||||
| 19.21% | (e) | 44.49% | (e) | |||
| 18.05% | (e) | 43.33% | (e) | |||
| 1.69% | (e) | 1.69% | (e) | |||
| (2.40% | )(e) | (2.35% | )(e) | |||
| 189% | (d) | 235% | (d) | |||
|
| |||||
| Semi-Annual Report | November 30, 2015 | 97 |
Table of Contents
| The Arbitrage Funds | Notes to Financial Statements | |
| November 30, 2015 (Unaudited) |
1. ORGANIZATION
The Arbitrage Funds (the “Trust”) was organized as a Delaware business trust on December 22, 1999 and is registered under the Investment Company Act of 1940, as amended (the “1940 Act”), as an open-end management investment company issuing its shares in series, each series representing a distinct portfolio with its own investment objective and policies. The four series presently authorized are The Arbitrage Fund (the “Arbitrage Fund”), The Arbitrage Event-Driven Fund (the “Event-Driven Fund”), The Arbitrage Credit Opportunities Fund (the “Credit Opportunities Fund”) and The Arbitrage Tactical Equity Fund (the “Tactical Equity Fund”), each a “Fund” and collectively the “Funds”, which offer four classes of shares. The Arbitrage Fund, the Event-Driven Fund and the Credit Opportunities Fund are each a diversified series of the Trust. The Tactical Equity Fund is a non-diversified series of the trust.
| Fund | Commencement of Operations | |
Arbitrage Fund | ||
Class R shares | September 18, 2000 | |
Class I shares | October 17, 2003 | |
Class C shares | June 1, 2012 | |
Class A shares | June 1, 2013 | |
Event-Driven Fund | ||
Class R shares | October 1, 2010 | |
Class I shares | October 1, 2010 | |
Class C shares | June 1, 2012 | |
Class A shares | June 1, 2013 | |
Credit Opportunities Fund | ||
Class R shares | October 1, 2012 | |
Class I shares | October 1, 2012 | |
Class C shares | October 1, 2012 | |
Class A shares | June 1, 2013 | |
Tactical Equity Fund | ||
Class R shares | January 2, 2015 | |
Class I shares | January 2, 2015 | |
Class C shares | January 2, 2015 | |
Class A shares | January 2, 2015 |
The investment objective of the Arbitrage Fund seeks to achieve capital growth by engaging in merger arbitrage. The investment objective of the Event-Driven Fund seeks to achieve capital growth by investing in companies that are impacted by corporate events such as mergers, acquisitions, restructurings, recapitalizations, refinancings, reorganizations and other special situations. The investment objective of the Credit Opportunities Fund seeks to provide current income and capital growth, by investing in debt securities impacted by events such as reorganizations, restructurings, recapitalizations, debt maturities, refinancings, mergers, acquisitions, regulatory changes and other special situations. The investment objective of the Tactical Equity Fund seeks to achieve capital appreciation by investing in securities of companies where the market may not fully appreciate the impact of fundamental changes to the business, industry or regulatory environment.
The Funds’ four classes of shares, Class R, Class I, Class C and Class A, represent interests in the same portfolio of investments and have the same rights, but differ primarily in the expenses to
| 98 | www.arbitragefunds.com | 1-800-295-4485 |
Table of Contents
| The Arbitrage Funds | Notes to Financial Statements (continued) | |
| November 30, 2015 (Unaudited) |
which they are subject and the investment eligibility requirements. Class R shares, Class C shares and Class A shares are subject to an annual distribution fee of up to 0.25%, 1.00% and 0.25%, respectively, of each Fund’s average daily net assets attributable to Class R shares, Class C shares and Class A shares, respectively, whereas Class I shares are not subject to any distribution fees. Class C shares are also subject to a 1.00% contingent deferred sales charge on all purchases redeemed in 12 months of purchase. Class A shares of the Arbitrage Fund are sold subject to a maximum front-end sales load equal to 2.50% of the offering price and are also subject to a 0.50% contingent deferred sales load on purchases at or above $250,000, purchased without a front-end sales charge and redeemed within 12 months of purchase. Class A shares of the Event-Driven Fund, the Credit Opportunities Fund and the Tactical Equity Fund are sold subject to a maximum front-end sales load equal to 3.25% of the offering price and are also subject to a 1.00% contingent deferred sales load on purchases at or above $500,000, purchased without a front-end sales charge and redeemed within 18 months of purchase.
2. SIGNIFICANT ACCOUNTING POLICIES
The following is a summary of significant accounting policies followed by the Funds. These policies are in conformity with U.S. generally accepted accounting principles (“GAAP”). The Funds are considered investment companies for financial reporting purposes under GAAP and Accounting Standards Codification Topic 946 — Investment Companies.
Use of Estimates — The preparation of financial statements in conformity with GAAP requires management to make estimates and assumptions that affect the reported amounts of assets and liabilities at the date of the financial statements and the reported amounts of increases and decreases in net assets from operations during the reporting period. Actual results could differ from those estimates.
Valuation of Investments — The Funds’ portfolio securities are valued as of the close of trading of the New York Stock Exchange (“NYSE”) (normally 4:00 p.m., Eastern time). Common stocks and other securities, including open short positions that are traded on a securities exchange, are valued at the last quoted sales price at the close of regular trading on the day the valuation is made. Securities which are quoted by NASDAQ are valued at the NASDAQ Official Closing Price. Price information on listed stocks is taken from the exchange where the security is primarily traded. Securities which are listed on an exchange but which are not traded on the valuation date are valued at the mean of the most recent bid and asked prices. Put and call options and securities traded in the over-the-counter market are valued at the mean of the most recent bid and asked prices. When there is no bid price available, put and call options will be valued using the average of the last ask price and zero. Foreign currency forward contracts are valued at the current day’s interpolated foreign exchange rate, as calculated using the current day’s spot rate, and the thirty, sixty, ninety and one-hundred eighty day forward rates provided by an independent source. Bank loans are valued at the composite mid-price which is calculated using the simple average of the dealer marks. If available, debt securities are priced based upon an evaluated bid provided by independent, third-party pricing agents. The third-party pricing agents may also value debt securities at an evaluated bid price by employing methodologies that utilize actual market transactions, broker-supplied valuations, or other methodologies designed to identify the market value for such securities. Unlisted securities for which market quotations are readily available are valued at the latest quoted bid price. Swap contracts that are listed or traded on a national securities exchange, commodities exchange, contract market or comparable over-the-counter
| Semi-Annual Report | November 30, 2015 | 99 |
Table of Contents
| The Arbitrage Funds | Notes to Financial Statements (continued) | |
| November 30, 2015 (Unaudited) |
market, and that are freely transferable, are valued at their closing settlement price on the exchange on which they are primarily traded or based upon the current settlement price for a like instrument acquired on the day on which the instrument is being valued. Over-the-counter swap contracts for which market quotations are readily available are valued based on quotes received from independent pricing services or one or more dealers that make markets in such securities. Other assets and securities for which no quotations are readily available are valued at fair value as determined in good faith under the supervision of the Board of Trustees of the Trust. Some of the more common reasons that may necessitate that a security be valued at fair value include: the security’s trading has been halted or suspended; the security has been delisted from a national exchange; the security’s primary trading market is temporarily closed at a time when under normal conditions it would be open; the security has been acquired through completion of a merger/tender or the security’s primary pricing source is not able or willing to provide a price. Such methods of fair valuation may include, but are not limited to: multiple of earnings, multiple of book value, discount from market of a similar freely traded security, purchase price of a security, subsequent private transactions in the security or related securities, or a combination of these and other factors. Foreign securities are translated from the local currency into U.S. dollars using currency exchange rates supplied by a quotation service (see Note 8).
Fair Value Measurements — In accordance with the authoritative guidance on fair value measurements under GAAP, the Funds disclose fair value of their investments in a hierarchy that prioritizes the inputs to valuation techniques used to measure the fair value. The objective of a fair value measurement is to determine the price that would be received to sell an asset or paid to transfer a liability in an orderly transaction between market participants at the measurement date (an exit price). Accordingly, the fair value hierarchy gives the highest priority to quoted prices (unadjusted) in active markets for identical assets or liabilities (Level 1) and the lowest priority to unobservable inputs (Level 3). The guidance establishes three levels of the fair value hierarchy as follows:
| Level 1 — | Unadjusted quoted prices in active markets for identical, unrestricted assets or liabilities that the Funds have the ability to access at the measurement date; |
| Level 2 — | Observable inputs other than quoted prices included in Level 1 that are observable (either directly or indirectly) for substantially the full term of the asset or liability; and |
| Level 3 — | Unobservable inputs for the asset or liability, to the extent relevant observable inputs are not available, representing each Fund’s own assumption about the assumptions a market participant would use in valuing the asset or liability, and would be based on the best information available. |
Investments are classified within the level of the lowest significant input considered in determining fair value. Investments classified within Level 3, whose fair value measurement considers several inputs, may include Level 1 or Level 2 inputs as components of the overall fair value measurement. The inputs or methodology used for valuing securities are not necessarily an indication of the risk associated with investing in those securities. The Funds recognize transfers between levels as of the beginning of the annual period in which the transfer occurred.
For the six months ended November 30, 2015, there were no significant changes to the Funds’ fair value methodologies. Additionally, during the six months ended November 30, 2015, there were no transfers between level 1 and 2 securities. Transfers for level 3 securities, if any, are shown as part of the leveling table in the Portfolio of Investments.
| 100 | www.arbitragefunds.com | 1-800-295-4485 |
Table of Contents
| The Arbitrage Funds | Notes to Financial Statements (continued) | |
| November 30, 2015 (Unaudited) |
Share Valuation and Redemption Fees — The net asset value per share of each class of shares of the Funds is calculated daily by dividing the total value of a Fund’s assets attributable to that class, less liabilities attributable to that class, by the number of shares of that class outstanding. The offering price and redemption price per share of each class of each Fund is equal to the net asset value per share, except that, shares of Class R, Class I and Class A are subject to a redemption fee of 2% if redeemed within 30 days for the Arbitrage Fund, Event-Driven Fund and Tactical Equity Fund and 60 days for the Credit Opportunities Fund from the date of purchase. The Class A redemption fee does not apply for purchases over $250,000 in the Arbitrage Fund and purchases over $500,000 in the Event-Driven Fund, Credit Opportunities Fund and Tactical Equity Fund, as these purchases are subject to a contingent deferred sales charge. Class C shares are not subject to a redemption fee. For the six months ended November 30, 2015, proceeds from redemption fees in the Arbitrage Fund were $2,831 in Class R, $6,244 in Class I and $278 in Class A. For the six months ended November 30, 2015, proceeds from redemption fees in the Event-Driven Fund were $994 in Class R, $7,442 in Class I and $0 in Class A. For the six months ended November 30, 2015, the Credit Opportunities Fund and the Tactical Equity Fund did not have any redemption fees. The redemption fee is paid directly to each Fund rather than the Adviser and is allocated pro-rata to the shareholders based on net assets attributed to the class.
Security Transactions — Security transactions are accounted for on trade date. Gains and losses on securities sold are determined on a specific identification basis.
Short Positions — The Funds may sell securities short for economic hedging purposes. Subsequent fluctuations in the market prices of securities sold short may require purchasing the securities at prices which may differ from the market value reflected on the Portfolio of Investments. The Funds are liable for any dividends and interest payable on securities while those securities are in a short position. As collateral for their short positions, the Funds are required under the 1940 Act to maintain assets consisting of cash, cash equivalents or liquid securities. The amount of the collateral is required to be adjusted daily to reflect changes in the value of the securities sold short. The Funds are charged an interest rebate expense by the prime broker on securities sold short. The interest rebate expense is charged for the duration of time that a security is sold short and is shown on the Statements of Operations.
Derivative Instruments and Hedging Activities — The following discloses the Funds’ use of derivative instruments and hedging activities.
The Funds’ investment objectives not only permit the Funds to purchase investment securities, but they also allow certain Funds to enter into various types of derivative contracts, including, but not limited to, swap contracts, forward foreign currency exchange contracts, and purchased and written options. In doing so, the Funds will employ strategies in differing combinations to permit them to increase, decrease, or change the level or types of exposure to market factors. Central to those strategies are features inherent to derivatives that make them more attractive for this purpose than equity or debt securities: they require little or no initial cash investment; they can focus exposure on only certain selected risk factors; and they may not require the ultimate receipt or delivery of the underlying security (or securities) to satisfy the contract. This may allow the Funds to pursue their objectives more quickly and efficiently than if they were to make direct purchases or sales of securities capable of effecting a similar response to market factors.
| Semi-Annual Report | November 30, 2015 | 101 |
Table of Contents
| The Arbitrage Funds | Notes to Financial Statements (continued) | |
| November 30, 2015 (Unaudited) |
Market Risk Factors: In pursuit of their investment objectives, the Funds may seek to use derivatives to increase or decrease their exposure to the following market risk factors:
Equity Risk: Equity risk relates to the change in value of equity securities as they relate to increases or decreases in the general market.
Interest Rate Risk: Interest rate risk refers to the fluctuations in value of fixed-income securities resulting from the inverse relationship between price and yield. For example, an increase in general interest rates will tend to reduce the market value of fixed income investments, and a decline in general interest rates will tend to increase the value of such investments. In addition, debt securities with longer maturities, which tend to have higher yields, are subject to potentially greater fluctuations in value from changes in interest rates than obligations with shorter maturities.
Foreign Exchange Rate Risk: Foreign exchange rate risk relates to the change in the U.S. dollar value of a security held that is denominated in a foreign currency. The value of a foreign currency denominated security will decrease as the dollar appreciates against the currency, while the value of the foreign currency denominated security will increase as the dollar depreciates against the currency.
Credit Risk: Credit risk relates to the ability of the issuer to meet interest and principal payments, or both, as they come due. In general, lower-grade, higher-yield bonds are subject to credit risk to a greater extent than lower-yield, higher-quality bonds.
Risk of Investing in Derivatives: The Funds’ use of derivatives can result in losses due to unanticipated changes in the market risk factors and the overall market. In instances where the Funds are using derivatives to decrease or hedge exposures to market risk factors for securities held by the Funds, there are also risks that those derivatives may not perform as expected, resulting in losses for the combined or hedged positions.
Derivatives may have little or no initial cash investment relative to their market value exposure and therefore can produce significant gains or losses in excess of their cost. This use of embedded leverage allows the Funds to increase their market value exposure relative to their net assets and can substantially increase the volatility of the Funds’ performance.
Additional associated risks from investing in derivatives also exist and potentially could have significant effects on the valuation of the derivative instruments and the Funds. Typically, the associated risks are not the risks that the Funds are attempting to increase or decrease exposure to, per their investment objectives, but are the additional risks from investing in derivatives.
Examples of these associated risks are liquidity risk, which is the risk that the Funds will not be able to sell the derivative in the open market in a timely manner, and counterparty credit risk, which is the risk that the counterparty to a transaction will not fulfill its obligation to the Funds. Associated risks can be different for each type of derivative and are discussed by derivative type in the notes that follow.
Option Writing/Purchasing: Certain Funds may write or purchase option contracts to adjust risk and return of their overall investment positions. When a Fund writes or purchases an option, an amount equal to the premium received or paid by the Fund is recorded as a liability or an asset and
| 102 | www.arbitragefunds.com | 1-800-295-4485 |
Table of Contents
| The Arbitrage Funds | Notes to Financial Statements (continued) | |
| November 30, 2015 (Unaudited) |
is subsequently adjusted to the current market value of the option written or purchased. Premiums received or paid from writing or purchasing options that expire unexercised are treated by the Fund on the expiration date as realized gains or losses. The difference between the premium and the amount paid or received on effecting a closing purchase or sale transaction, including brokerage commissions, is also treated as a realized gain or loss. If an option is exercised, the premium paid or received is added to the cost of the purchase or proceeds from the sale in determining whether the Fund has realized a gain or loss on investment transactions. Risks from entering into option transactions arise from the potential inability of counterparties to meet the terms of the contracts, the potential inability to enter into closing transactions because of an illiquid secondary market and from unexpected movements in security values.
A summary of put and call option contracts written during the six months ended November 30, 2015, is as follows:
| Arbitrage Fund | Put Contracts | Put Premiums | Call Contracts | Call Premiums | ||||||||||||
Options outstanding at beginning of period | 11,506 | $ | 656,452 | 11,655 | $ | 993,663 | ||||||||||
Options written | 26,800 | 4,075,297 | 120,570 | 7,572,087 | ||||||||||||
Options closed | (5,081 | ) | (563,873 | ) | (36,125 | ) | (2,636,189 | ) | ||||||||
Options exercised | (26,589 | ) | (3,459,338 | ) | (12,491 | ) | (1,127,268 | ) | ||||||||
Options expired | (5,812 | ) | (619,222 | ) | (64,198 | ) | (3,793,765 | ) | ||||||||
Stock split | – | – | 3,519 | – | ||||||||||||
|
| |||||||||||||||
Options outstanding at end of period | 824 | $ | 89,316 | 22,930 | $ | 1,008,528 | ||||||||||
|
| |||||||||||||||
| Event-Driven Fund | Put Contracts | Put Premiums | Call Contracts | Call Premiums | ||||||||||||
Options outstanding at beginning of period | 11,297 | $ | 494,670 | 12,095 | $ | 969,069 | ||||||||||
Options written | 31,532 | 3,365,723 | 48,732 | 4,667,870 | ||||||||||||
Options closed | (20,251 | ) | (2,325,744 | ) | (30,500 | ) | (3,190,944 | ) | ||||||||
Options exercised | (13,858 | ) | (867,608 | ) | (3,327 | ) | (290,180 | ) | ||||||||
Options expired | (8,047 | ) | (526,301 | ) | (24,844 | ) | (1,863,253 | ) | ||||||||
Stock split | – | – | 374 | – | ||||||||||||
|
| |||||||||||||||
Options outstanding at end of period | 673 | $ | 140,740 | 2,530 | $ | 292,562 | ||||||||||
|
| |||||||||||||||
| Credit Opportunities Fund | Put Contracts | Put Premiums | Call Contracts | Call Premiums | ||||||||||||
Options outstanding at beginning of period | 250 | $ | 7,315 | – | $ | – | ||||||||||
Options written | 2,272 | 116,106 | – | – | ||||||||||||
Options closed | (1,090 | ) | (39,513 | ) | – | – | ||||||||||
Options exercised | – | – | – | – | ||||||||||||
Options expired | (1,250 | ) | (68,424 | ) | – | – | ||||||||||
|
| |||||||||||||||
Options outstanding at end of period | 182 | $ | 15,484 | – | $ | – | ||||||||||
|
| |||||||||||||||
| Semi-Annual Report | November 30, 2015 | 103 |
Table of Contents
| The Arbitrage Funds | Notes to Financial Statements (continued) | |
| November 30, 2015 (Unaudited) |
| Tactical Equity Fund | Put Contracts | Put Premiums | Call Contracts | Call Premiums | ||||||||||||
Options outstanding at beginning of period | 9 | $ | 595 | 12 | $ | 1,606 | ||||||||||
Options written | 97 | 9,074 | 136 | 16,306 | ||||||||||||
Options closed | (46 | ) | (5,385 | ) | (58 | ) | (10,974 | ) | ||||||||
Options exercised | (19 | ) | (1,619 | ) | (1 | ) | (49 | ) | ||||||||
Options expired | (38 | ) | (2,035 | ) | (76 | ) | (5,107 | ) | ||||||||
|
| |||||||||||||||
Options outstanding at end of period | 3 | $ | 630 | 13 | $ | 1,782 | ||||||||||
|
| |||||||||||||||
Foreign Currency Exchange Contracts: The Funds may enter into forward foreign currency exchange contracts as a way of managing foreign exchange rate risk. The Funds may enter into these contracts for the purchase or sale of a specific foreign currency at a fixed price on a future date as a hedge or cross-hedge against either specific transactions or portfolio positions. The objective of the Funds’ foreign currency hedging transactions is to reduce risk that the U.S. dollar value of the Funds’ securities denominated in foreign currency will decline in value due to changes in foreign currency exchange rates.
Warrants/Rights: Each Fund may purchase or otherwise receive warrants or rights. Warrants and rights generally give the holder the right to receive, upon exercise, a security of the issuer at a set price. Funds typically use warrants and rights in a manner similar to their use of purchased options on securities, as described in options above. Risks associated with the use of warrants and rights are generally similar to risks associated with the use of purchased options. However, warrants and rights often do not have standardized terms, and may have longer maturities and may be less liquid than exchange-traded options. In addition, the terms of warrants or rights may limit each Fund’s ability to exercise the warrants or rights at such times and in such quantities as each Fund would otherwise wish. Warrants and rights generally pay no dividends and confer no voting or other rights other than to purchase the underlying security.
Swaps: Certain Funds may enter into interest rate, index, equity, total return and credit default swap agreements, for hedging and non-hedging purposes. These transactions would be entered into in an attempt to obtain a particular return when it is considered desirable to do so, possibly at a lower cost to a Fund than if the Fund had invested directly in the asset that yielded the desired return. Swap agreements may be executed in a multilateral or other trade facility program, such as a registered exchange (“centrally cleared swaps”) or may be privately negotiated in the over-the counter market. The duration of a swap agreement typically ranges from a few weeks to more than one year. In a standard swap transaction, two parties agree to exchange the returns (or differentials in rates of return) earned or realized on particular predetermined investments or instruments, which may be adjusted for an interest factor. The gross returns to be exchanged or “swapped” between the parties are generally calculated with respect to a “notional amount” (i.e., the return on or increase in value of a particular dollar amount invested at a particular interest rate, in a particular foreign currency, or in a “basket” of securities representing a particular index). In a centrally cleared swap, immediately following execution of the swap agreement, the swap agreement is novated to a central counterparty (the “CCP”) and the Fund’s counterparty on the swap agreement becomes the CCP.
Forms of swap agreements include interest rate caps, under which, in return for a premium, one party agrees to make payments to the other to the extent that interest rates exceed a specified
| 104 | www.arbitragefunds.com | 1-800-295-4485 |
Table of Contents
| The Arbitrage Funds | Notes to Financial Statements (continued) | |
| November 30, 2015 (Unaudited) |
rate, or “cap”; interest rate floors, under which, in return for a premium, one party agrees to make payments to the other to the extent that interest rates fall below a specified level, or “floor”; and interest rate collars, under which a party sells a cap and purchases a floor, or vice versa, in an attempt to protect itself against interest rate movements exceeding given minimum or maximum levels.
Credit default swaps are a type of swap agreement in which the protection “buyer” is generally obligated to pay the protection “seller” an upfront and/ or a periodic stream of payments over the term of the contract provided that no credit event, such as a default, on a reference obligation has occurred. The credit default swap agreement may have as reference obligations one or more securities that are not currently held by a Fund. If a credit event occurs, the seller generally must pay the buyer the “par value” (full notional value) of the swap in exchange for an equal face amount of deliverable obligations of the reference entity described in the swap, or the seller may be required to deliver the related net cash amount if the swap is cash settled. A Fund may be either the buyer or seller in the transaction. If a Fund is a buyer and no credit event occurs, the Fund may recover nothing if the swap is held through its termination date. However, if a credit event occurs, the buyer generally may elect to receive the full notional value of the swap in exchange for an equal face amount of deliverable obligations of the reference entity whose value may have significantly decreased. As a seller, a Fund generally receives an upfront payment and/or a fixed rate of income throughout the term of the swap provided that there is no credit event. As the seller, a Fund would effectively add leverage to its portfolio because, in addition to its total net assets, the Fund would be subject to investment exposure on the notional amount of the swap. Credit default swap agreements involve greater risks than if a Fund had invested in the reference obligation directly since, in addition to general market risks, credit default swaps are subject to illiquidity risk, counterparty risk and credit risk. A Fund will enter into credit default swap agreements only with counterparties that meet certain standards of creditworthiness or that are centrally cleared.
Total return swap agreements are contracts in which one party agrees to make periodic payments based on the change in market value of underlying assets, which may include a specified security, basket of securities, defined portfolios of bonds, loans and mortgages, or securities indexes during the specified period in return for periodic payments based on a fixed or variable interest rate or the total return from other underlying assets or indices. Total return swap agreements may be used to obtain exposure to a security or market index without owning or taking physical custody of such security or component securities of a market index. Total return swap agreements may effectively add leverage to a Fund’s portfolio because, in addition to its total net assets, the Fund would be subject to investment exposure on the notional amount of the swap. Total return swaps are a mechanism for the user to accept the economic benefits of asset ownership without utilizing the balance sheet. The other leg of the swap, usually the London Interbank Offered Rate (LIBOR), is spread to reflect the non-balance sheet nature of the product. Total return swaps can be designed with any underlying asset agreed upon between two parties. Typically no notional amounts are exchanged with total return swaps. Total return swap agreements entail the risk that a party will default on its payment obligations to a Fund thereunder. Swap agreements also entail the risk that a Fund will not be able to meet its obligation to the counterparty. Generally, a Fund will enter into total return swaps on a net basis (i.e., the two payment streams are netted out with the Fund receiving or paying, as the case may be, only the net amount of the two payments).
| Semi-Annual Report | November 30, 2015 | 105 |
Table of Contents
| The Arbitrage Funds | Notes to Financial Statements (continued) | |
| November 30, 2015 (Unaudited) |
Most swap agreements entered into by a Fund calculate the obligations of the parties to the agreement on a “net basis.” Consequently, a Fund’s current obligations (or rights) under a swap agreement will generally be equal only to the net present value of amounts to be paid or received under the agreement based on the relative values of the positions held by each party to the agreement (the “net amount”). A Fund’s current obligations under a swap agreement will be accrued daily (offset against amounts owed to the Fund), and any accrued but unpaid net amounts owed to a swap counterparty will be covered in accordance with applicable regulatory requirements to limit any potential leveraging of a Fund’s portfolio. Any net amount accrued but not yet paid to a Fund by the counterparty under a swap agreement (i.e., the Fund’s current rights under the swap agreement) is recorded as unrealized appreciation until the amount is paid to the Fund. The Fund’s maximum risk of loss from counterparty credit risk is generally limited to the net payment to be received by the Fund and/or the termination value at the end of the contract. Obligations under swap agreements so covered will not be construed to be “senior securities” for purposes of the Funds’ investment restriction concerning senior securities.
Whether a Fund’s use of swap agreements will be successful in furthering its investment objective will depend on Management’s ability to correctly predict whether certain types of investments are likely to produce greater returns than other investments. Swap agreements that cannot be terminated or sold within seven days may be considered to be illiquid investments. Moreover, a Fund bears the risk of loss of the amount expected to be received under a swap agreement in the event of the default or bankruptcy of a swap agreement counterparty. Although centrally cleared swaps typically present less counterparty risk than non-centrally cleared swaps, a Fund that has entered into centrally cleared swaps is subject to the risk of the failure of the CCP. A Fund will enter into swap agreements only with counterparties that meet certain standards for creditworthiness (generally, such counterparties would have to be eligible counterparties under the terms of the Fund’s repurchase agreement guidelines) or that are centrally cleared. Certain restrictions imposed on the Funds by the Internal Revenue Code of 1986, as amended (the “Code”) may limit a Fund’s ability to use swap agreements. It is possible that developments in the swap market, including additional government regulation, could adversely affect a Fund’s ability to terminate existing swap agreements or to realize amounts to be received under such agreements.
International Swaps and Derivatives Association, Inc. Master Agreements (“ISDA Master Agreements”) govern over-the-counter financial derivative transactions entered into by a Fund and counterparty. The ISDA Master Agreements maintain provisions for general obligations, representations, agreements, collateral and events of default or termination. Events of termination include conditions that may entitle counterparties to elect to terminate early and cause settlement of all outstanding transactions under the applicable ISDA Master Agreement. Any election to terminate early could be material to the financial statements.
Swap agreements held at November 30, 2015 are disclosed in the Portfolio of Investments.
| 106 | www.arbitragefunds.com | 1-800-295-4485 |
Table of Contents
| The Arbitrage Funds | Notes to Financial Statements (continued) | |
| November 30, 2015 (Unaudited) |
Fair Value of Derivative Instruments — Fair values of derivatives presented in the financial statements are not netted with the fair value of other derivatives or with any collateral amounts posted by the Funds or any counterparty. The fair value of derivative instruments for the Funds as of November 30, 2015, was as follows:
| Derivatives Not Accounted For As Hedging Instruments | Asset Derivatives Statement of Assets and Liabilities Location | Fair Value | Liability Derivatives Statement of Assets and Liabilities Location | Fair Value | ||||||||
Arbitrage Fund | ||||||||||||
Foreign Currency Contracts | Unrealized appreciation on forward foreign currency exchange contracts | $ | 14,409,068 | Unrealized depreciation on forward foreign currency exchange contracts | $ | 5,019,126 | ||||||
Equity Contracts | Unrealized appreciation on swap contracts | 192,976 | Unrealized depreciation on swap contracts | 65,925 | ||||||||
Equity Contracts | Investments: | 10,624,454 | Investments: | 60 | ||||||||
Equity Contracts | Investments: | 1,375,100 | ||||||||||
Equity Contracts | Written options, | 1,309,854 | ||||||||||
|
|
|
| |||||||||
| $ | 26,601,598 | $ | 6,394,965 | |||||||||
|
|
|
| |||||||||
| Semi-Annual Report | November 30, 2015 | 107 |
Table of Contents
| The Arbitrage Funds | Notes to Financial Statements (continued) | |
| November 30, 2015 (Unaudited) |
| Derivatives Not Accounted For As Hedging Instruments | Asset Derivatives Statement of Assets and Liabilities Location | Fair Value | Liability Derivatives Statement of Assets and Liabilities Location | Fair Value | ||||||||
Event-Driven Fund | ||||||||||||
Foreign Currency Contracts | Unrealized appreciation on forward foreign currency exchange contracts | $ | 607,464 | Unrealized depreciation on forward foreign currency exchange contracts | $ | 185,096 | ||||||
Equity Contracts | Unrealized appreciation on swap contracts | 16,221 | Unrealized depreciation on swap contracts | 9,537 | ||||||||
Equity Contracts | Investments: | 694,338 | Investments: | 11 | ||||||||
Equity Contracts | Investments: | 773,969 | ||||||||||
Equity Contracts | Written options, | 395,077 | ||||||||||
|
|
|
| |||||||||
| $ | 2,091,992 | $ | 589,721 | |||||||||
|
|
|
| |||||||||
Derivatives Not Accounted For As | Asset Derivatives Statement of Assets and Liabilities Location | Fair Value | Liability Derivatives Statement of Assets and Liabilities Location | Fair Value | ||||||||
Credit Opportunities Fund | ||||||||||||
Foreign Currency Contracts | Unrealized appreciation on forward foreign currency exchange contracts | $ 1,424 | Unrealized depreciation on forward foreign currency exchange contracts | $ 3,456 | ||||||||
Equity Contracts | Investments: | 14,157 | ||||||||||
Equity Contracts | Written options, | 7,098 | ||||||||||
|
|
|
| |||||||||
| $ 15,581 | $ 10,554 | |||||||||||
|
|
|
| |||||||||
| 108 | www.arbitragefunds.com | 1-800-295-4485 |
Table of Contents
| The Arbitrage Funds | Notes to Financial Statements (continued) | |
| November 30, 2015 (Unaudited) |
| Derivatives Not Accounted For As Hedging Instruments | Asset Derivatives Statement of Assets and Liabilities Location | Fair Value | Liability Derivatives Statement of Assets and Liabilities Location | Fair Value | ||||||||
Tactical Equity Fund | ||||||||||||
Foreign Currency Contracts | Unrealized appreciation on forward foreign currency exchange contracts | $ 51 | Unrealized depreciation on forward foreign currency exchange contracts | $ 73 | ||||||||
Equity Contracts | Investments: | 5,633 | ||||||||||
Equity Contracts | Written options, | 2,178 | ||||||||||
|
|
|
| |||||||||
| $ 5,684 | $ 2,251 | |||||||||||
|
|
|
| |||||||||
| Semi-Annual Report | November 30, 2015 | 109 |
Table of Contents
| The Arbitrage Funds | Notes to Financial Statements (continued) | |
| November 30, 2015 (Unaudited) |
The effect of derivative instruments on the Funds’ Statement of Operations for the six months ended November 30, 2015, was as follows:
| Derivatives Not Accounted For As Hedging Instruments | Location Of Gains/(Loss) On Derivatives Recognized In Income | Realized Gain/(Loss) Recognized In | Change in Unrealized Gain/(Loss) On Derivatives Recognized In Income | |||||||
Arbitrage Fund | ||||||||||
Foreign Currency Contracts | Net realized gains (losses) from: Foreign currency transactions / Net change in unrealized appreciation (depreciation) on: Foreign currency transactions | $ | (6,677,389 | ) | $ | 14,382,824 | ||||
Equity Contracts | Net realized gains (losses) from: Swap contracts / Net change in unrealized appreciation (depreciation) on: Swap contracts | 3,434,800 | 14,185 | |||||||
Equity Contracts Long | Net realized gains (losses) from: Investments / Net change in unrealized appreciation (depreciation) on: Investments | – | (86,683 | ) | ||||||
Equity Contracts Short | Net realized gains (losses) from: Investments / Net change in unrealized appreciation (depreciation) on: Securities sold short | – | 30 | |||||||
Equity Contracts | Net realized gains (losses) from: Investments / Net change in unrealized appreciation (depreciation) on: Investments | (7,515,450 | ) | (711,467 | ) | |||||
Equity Contracts | Net realized gains (losses) from: Written option contracts / Net change in unrealized appreciation (depreciation) on: Written option contracts | 6,611,138 | (601,479 | ) | ||||||
|
| |||||||||
| $ | (4,146,901 | ) | $ | 12,997,410 | ||||||
|
| |||||||||
| 110 | www.arbitragefunds.com | 1-800-295-4485 |
Table of Contents
| The Arbitrage Funds | Notes to Financial Statements (continued) | |
| November 30, 2015 (Unaudited) |
Derivatives Not | Location Of Gains/(Loss) On Derivatives Recognized In Income | Realized Gain/(Loss) On Derivatives Recognized In Income | Change in Unrealized Gain/(Loss) On Derivatives Recognized In Income | |||||||
Event-Driven Fund | ||||||||||
Foreign Currency Contracts | Net realized gains (losses) from: Foreign currency transactions / Net change in unrealized appreciation (depreciation) on: Foreign currency transactions | $ | (582,562 | ) | $ | 977,951 | ||||
Credit Contracts | Net realized gains (losses) from: Swap contracts / Net change in unrealized appreciation (depreciation) on: Swap contracts | 39,721 | 15,032 | |||||||
Equity Contracts | Net realized gains (losses) from: Swap contracts / Net change in unrealized appreciation (depreciation) on: Swap contracts | 821,253 | 6,684 | |||||||
Equity Contracts Long | Net realized gains (losses) from: Investments / Net change in unrealized appreciation (depreciation) on: Investments | – | (3,573 | ) | ||||||
Equity Contracts Short | Net realized gains (losses) from: Investments / Net change in unrealized appreciation (depreciation) on: Securities sold short | – | 5 | |||||||
Equity Contracts | Net realized gains (losses) from: Investments / Net change in unrealized appreciation (depreciation) on: Investments | (6,721,731 | ) | 362,681 | ||||||
Equity Contracts | Net realized gains (losses) from: Written option contracts / Net change in unrealized appreciation (depreciation) on: Written option contracts | 3,928,927 | 76,438 | |||||||
|
| |||||||||
| $ | (2,514,392 | ) | $ | 1,435,218 | ||||||
|
| |||||||||
| Semi-Annual Report | November 30, 2015 | 111 |
Table of Contents
| The Arbitrage Funds | Notes to Financial Statements (continued) | |
| November 30, 2015 (Unaudited) |
| Derivatives Not Accounted For As Hedging Instruments | Location Of Gains/(Loss) On Derivatives Recognized In Income | Realized Gain/(Loss) Recognized In | Change in Recognized In Income | |||||||
Credit Opportunities Fund | ||||||||||
Foreign Currency Contracts | Net realized gains (losses) from: Foreign currency transactions / Net change in unrealized appreciation (depreciation) on: Foreign currency transactions | $ | 6,728 | $ | 3,042 | |||||
Credit Contracts | Net realized gains (losses) from: Swap contracts / Net change in unrealized appreciation (depreciation) on: Swap contracts | 4,760 | 1,801 | |||||||
Equity Contracts | Net realized gains (losses) from: Investments / Net change in unrealized appreciation (depreciation) on: Investments | (37,139 | ) | (10,745 | ) | |||||
Equity Contracts | Net realized gains (losses) from: Written option contracts / Net change in unrealized appreciation (depreciation) on: Written option contracts | 16,385 | 6,946 | |||||||
|
| |||||||||
| $ | (9,266 | ) | $ | 1,044 | ||||||
|
| |||||||||
| 112 | www.arbitragefunds.com | 1-800-295-4485 |
Table of Contents
| The Arbitrage Funds | Notes to Financial Statements (continued) | |
| November 30, 2015 (Unaudited) |
Derivatives Not | Location Of Gains/(Loss) On | Realized Gain/(Loss) On Derivatives Recognized In Income | Change in Unrealized Gain/(Loss) On Derivatives Recognized In Income | |||||||
Tactical Equity Fund | ||||||||||
Foreign Currency Contracts | Net realized gains (losses) from: Foreign currency transactions / Net change in unrealized appreciation (depreciation) on: Foreign currency transactions | $ | (202 | ) | $ | (3 | ) | |||
Credit Contracts | Net realized gains (losses) from: Swap contracts / Net change in unrealized appreciation (depreciation) on: Swap contracts | 1,864 | – | |||||||
Equity Contracts | Net realized gains (losses) from: Investments / Net change in unrealized appreciation (depreciation) on: Investments | (22,330 | ) | (1,365 | ) | |||||
Equity Contracts | Net realized gains (losses) from: Written option contracts / Net change in unrealized appreciation (depreciation) on: Written option contracts | 10,813 | 639 | |||||||
|
| |||||||||
| $ | (9,855 | ) | $ | (729 | ) | |||||
|
| |||||||||
Volume of Derivative Instruments for the Funds during the six months ended November 30, 2015, was as follows:
| Derivative Type | Unit of Measurement | Monthly Average | ||||
Arbitrage Fund |
| |||||
Swap Contracts | Notional Quantity | (20,105,593 | ) | |||
Forward Foreign Currency Exchange Contracts | Net Contracts to Deliver/(Receive) | (201,449,475 | ) | |||
Purchased Option Contracts | Contracts | 37,275 | ||||
Rights | Shares | 20,988,582 | ||||
Rights — Short | Shares | (1,100 | ) | |||
Written Option Contracts | Contracts | (20,197 | ) | |||
| Semi-Annual Report | November 30, 2015 | 113 |
Table of Contents
| The Arbitrage Funds | Notes to Financial Statements (continued) | |
| November 30, 2015 (Unaudited) |
| Derivative Type | Unit of Measurement | Monthly Average | ||||
Event-Driven Fund |
| |||||
Swap Contracts | Notional Quantity | (2,842,332 | ) | |||
Forward Foreign Currency Exchange Contracts | Net Contracts to Deliver/(Receive) | (2,213,923 | ) | |||
Purchased Option Contracts | Contracts | 29,199 | ||||
Rights | Shares | 2,587,202 | ||||
Rights — Short | Shares | (200 | ) | |||
Written Option Contracts | Contracts | (10,401 | ) | |||
| Derivative Type | Unit of Measurement | Monthly Average | ||||
Credit Opportunities Fund |
| |||||
Swap Contracts | Notional Quantity | (88,275 | ) | |||
Forward Foreign Currency Exchange Contracts | Net Contracts to Deliver/(Receive) | (205,117 | ) | |||
Purchased Option Contracts | Contracts | 255 | ||||
Written Option Contracts | Contracts | (155 | ) | |||
| Derivative Type | Unit of Measurement | Monthly Average | ||||
Tactical Equity Fund |
| |||||
Swap Contracts | Notional Quantity | (2,311 | ) | |||
Forward Foreign Currency Exchange Contracts | Net Contracts to Deliver/(Receive) | 21,703 | ||||
Purchased Option Contracts | Contracts | 124 | ||||
Rights | Shares | 33 | ||||
Written Option Contracts | Contracts | (39 | ) | |||
Certain derivative contracts are executed under either standardized netting agreements or, for exchange-traded derivatives, the relevant contracts for a particular exchange which contain enforceable netting provisions. A derivative netting arrangement creates an enforceable right of set-off that becomes effective, and affects the realization of settlement on individual assets, liabilities and collateral amounts, only following a specified event of default or early termination. Default events may include the failure to make payments or deliver securities timely, material adverse changes in financial condition or insolvency, the breach of minimum regulatory capital requirements, or loss of license, charter or other legal authorization necessary to perform under the contract.
| 114 | www.arbitragefunds.com | 1-800-295-4485 |
Table of Contents
| The Arbitrage Funds | Notes to Financial Statements (continued) | |
| November 30, 2015 (Unaudited) |
The following table presents financial instruments that are subject to enforceable netting arrangements or other similar agreements as of November 30, 2015.
| Arbitrage Fund | ||||||||||||||||||||||||
Gross | Gross the Statements of Assets and | Net Amounts of Assets and Liabilities | Gross Amounts Not Offset in the Statement of Assets and Liabilities | |||||||||||||||||||||
| Description | Financial Instruments(a) | Cash Collateral Received(a) | Net Amount | |||||||||||||||||||||
| ||||||||||||||||||||||||
Equity Swaps | $ | 192,976 | $ | (145,584 | ) | $ | 47,392 | $ | – | $ | – | $ | 47,392 | |||||||||||
| ||||||||||||||||||||||||
Total | $ | 192,976 | $ | (145,584 | ) | $ | 47,392 | $ | – | $ | – | $ | 47,392 | |||||||||||
| ||||||||||||||||||||||||
Gross | Gross Amounts Offset in the Statements of Assets and Liabilities | Net Amounts | Gross Amounts Not Offset in the Statement of Assets and Liabilities | |||||||||||||||||||||
| Description | Financial Instruments(a) | Cash Collateral Pledged(a) | Net Amount | |||||||||||||||||||||
| ||||||||||||||||||||||||
Equity Swaps | $ | 65,925 | $ | (65,925 | ) | $ | – | $ | – | $ | – | $ | – | |||||||||||
| ||||||||||||||||||||||||
Total | $ | 65,925 | $ | (65,925 | ) | $ | – | $ | – | $ | – | $ | – | |||||||||||
| ||||||||||||||||||||||||
| Event-Driven Fund | ||||||||||||||||||||||||
Gross Recognized Assets | Gross of Assets and | Net Amounts the Statement of Assets and | Gross Amounts Not Offset in the Statement of Assets and Liabilities | |||||||||||||||||||||
| Description | Financial Instruments(a) | Cash Received(a) | Net Amount | |||||||||||||||||||||
| ||||||||||||||||||||||||
Equity Swaps | $ | 16,221 | $ | (10,804 | ) | $ | 5,417 | $ | – | $ | – | $ | 5,417 | |||||||||||
| ||||||||||||||||||||||||
Total | $ | 16,221 | $ | (10,804 | ) | $ | 5,417 | $ | – | $ | – | $ | 5,417 | |||||||||||
| ||||||||||||||||||||||||
Gross | Gross of Assets and | Net Amounts of Assets and | Gross Amounts Not Offset in the Statement of Assets and Liabilities | |||||||||||||||||||||
| Description | Financial Instruments(a) | Cash Pledged(a) | Net Amount | |||||||||||||||||||||
| ||||||||||||||||||||||||
Equity Swaps | $ | 9,537 | $ | (9,537 | ) | $ | – | $ | – | $ | – | $ | – | |||||||||||
| ||||||||||||||||||||||||
Total | $ | 9,537 | $ | (9,537 | ) | $ | – | $ | – | $ | – | $ | – | |||||||||||
| ||||||||||||||||||||||||
| (a) | These amounts are limited to the derivative asset/liability balance and, accordingly, do not include excess collateral received/pledged. |
Security Transactions and Investment Income: Security transactions are accounted for on a trade date basis. Interest income, adjusted for amortization of premium and accretion of discount, is recorded on the accrual basis. Dividend income is recorded on the ex-dividend date, net of any non-reclaimable tax withholdings.
Dividends and Distributions to Shareholders — Dividends arising from net investment income and net capital gain distributions, if any, are declared and paid at least annually to shareholders of the
| Semi-Annual Report | November 30, 2015 | 115 |
Table of Contents
| The Arbitrage Funds | Notes to Financial Statements (continued) | |
| November 30, 2015 (Unaudited) |
Arbitrage Fund, Event-Driven Fund and Tactical Equity Fund. Dividends arising from net investment income, if any, are declared and paid quarterly, and net capital gain distributions, if any, are declared and paid at least annually to shareholders of the Credit Opportunities Fund.
Allocation Between Classes — Investment income earned, realized capital gains and losses, and unrealized appreciation and depreciation are allocated daily to each class of shares based upon the proportionate shares of total net assets of each Fund. Class-specific expenses are charged directly to the class incurring the expense. Common expenses which are not attributable to a specific class are allocated daily to each class of shares based upon the proportionate share of total net assets of each Fund.
Offering costs — Offering costs, including costs of printing initial prospectuses, legal and registration fees, have been amortized over twelve months from the inception date of the Tactical Equity Fund. As of November 30, 2015, the offering costs remaining to be amortized are $11,716.
Federal Income Tax — It is the Funds’ policy to continue to comply with the special provisions of Subchapter M of the Internal Revenue Code of 1986, as amended, applicable to regulated investment companies. As provided therein, in any fiscal year in which a fund so qualifies and distributes at least 90% of its taxable net income, a fund (but not the shareholders) will be relieved of Federal income tax on the income distributed. Accordingly, no provision for income taxes has been made.
As of and during the six months ended November 30, 2015, the Funds did not have a liability for any unrecognized tax benefits. The Funds file U.S. federal, state, and local tax returns as required. The Funds’ tax returns are subject to examination by the relevant tax authorities until expiration of the applicable statute of limitations which is generally three years after the filing of the tax return. Tax returns for open years have incorporated no uncertain tax positions that require a provision for income taxes.
3. INVESTMENT TRANSACTIONS
During the six months ended November 30, 2015 for the Funds, cost of purchases and proceeds from sales and maturities of investment securities, other than short-term investments, U.S. government securities, equity swap contracts, purchased and written option contracts and securities sold short, were as follows:
| Arbitrage Fund | Event-Driven Fund | Credit Opportunities Fund | Tactical Equity Fund | |||||||||||||
Purchases | $ | 2,960,386,771 | $ | 1,328,849,397 | $ | 24,656,394 | $ | 1,855,656 | ||||||||
Sales and Maturities | 646,388,342 | 814,480,859 | 24,617,038 | 1,697,574 | ||||||||||||
4. LINE OF CREDIT
The Trust, on behalf of the Funds, entered into an agreement which enables the Arbitrage Fund, the Event-Driven Fund and the Credit Opportunities Fund to participate in a $300,000,000 unsecured committed revolving line of credit (the “Credit Agreement”) with State Street Bank and Trust Company (the “Custodian”). Borrowings will be made solely to temporary finance the purchase or sale of securities or to finance the redemption of the shares of an investor of the Funds. Interest is charged to the Funds based on their borrowings at a rate per annum of the
| 116 | www.arbitragefunds.com | 1-800-295-4485 |
Table of Contents
| The Arbitrage Funds | Notes to Financial Statements (continued) | |
| November 30, 2015 (Unaudited) |
higher of the LIBOR rate plus 1.25% and the overnight federal funds rate plus 1.25%. In addition, a commitment fee of 0.125% per annum is payable at the end of each calendar quarter. Effective December 8, 2015, the Credit Agreement was terminated and was replaced by a $100,000,000 unsecured committed revolving line of credit (the “Committed Line”) and a $100,000,000 unsecured uncommitted revolving line of credit (the “Uncommitted Line,” together with the Committed Line, the “New Credit Agreement”). Interest on borrowings under the New Credit Agreement is charged at a rate calculated using the same formula that was used for the Credit Agreement. The Committed Line has a commitment fee of 0.20% per annum on the unused portion of the Committed Line and is payable quarterly. The Uncommitted Line is held available on a discretionary demand basis and may be terminated by the Custodian at any time for any or no reason. The Trust accrues, on behalf of each of the Funds, the commitment fee on the unused portion of the line of credit. Such fees are included in the custodian and bank service fees on the Statement of Operations.
For the six months ended November 30, 2015, the Arbitrage Fund had no borrowings.
The Event-Driven Fund had outstanding borrowings of $0 at November 30, 2015. For the six months ended November 30, 2015, the Event-Driven Fund had average borrowings of $18,851,622 over a period of 37 days at a weighted average interest rate of 1.38%. Interest expense on the line of credit for the Event-Driven Fund during the six months ended November 30, 2015, is shown as line of credit interest expense on the Event-Driven Fund’s Statement of Operations.
For the six months ended November 30, 2015, the Credit Opportunities Fund had no borrowings.
5. LOAN PARTICIPATIONS AND ASSIGNMENTS
The Funds may invest in direct debt instruments which are interests in amounts owed to lenders or lending syndicates by corporate, governmental, or other borrowers. The Funds’ investments in loans may be in the form of participations in loans or assignments of all or a portion of the loans from third parties. A loan is often administered by a bank or other financial institution (the “lender”) that acts as agent for all holders. The agent administers the terms of the loan, as specified in the loan agreement. The Funds may invest in multiple series or tranches of a loan, which may have varying terms and carry different associated risks. The Funds generally have no right to enforce compliance with the terms of the loan agreement with the borrower. As a result, the Funds may be subject to the credit risk of both the borrower and the lender that is selling the loan agreement. When the Funds purchase assignments from lenders they acquire direct rights against the borrower of the loan. The Funds may enter into unfunded loan commitments, which are contractual obligations for future funding. Unfunded loan commitments represent a future obligation in full, even though a percentage of the notional loan amounts may not be utilized by the borrower. When investing in a loan participation, the Funds have the right to receive payments of principal, interest and any fees to which it is entitled only from the lender selling the loan agreement and only upon receipt of payments by the lender from the borrower. The Funds may receive a commitment fee based on the undrawn portion of the underlying line of credit portion of a floating rate loan. In certain circumstances, the Funds may receive a penalty fee upon the prepayment of a floating rate loan by a borrower. For the period ended November 30, 2015, no penalty fees were received by the Funds. Fees earned or paid are recorded as a component of interest income or interest expense, respectively, on the Statement of Operations. At
| Semi-Annual Report | November 30, 2015 | 117 |
Table of Contents
| The Arbitrage Funds | Notes to Financial Statements (continued) | |
| November 30, 2015 (Unaudited) |
November 30, 2015, the Arbitrage Fund, Event Driven Fund, Credit Opportunities Fund and Tactical Equity Fund had no outstanding loan commitments.
6. ADVISORY FEES, ADMINISTRATION FEES AND OTHER AGREEMENTS
Investment Advisory Agreement
The Funds’ investments are managed by Water Island Capital, LLC (the “Adviser”) according to the terms of Investment Advisory Agreements. Under the Investment Advisory Agreement between the Adviser and the Arbitrage Fund, as amended and restated on October 1, 2007, the Arbitrage Fund pays the Adviser an annual fee, which is computed and accrued daily and paid monthly, of 1.25% on the first $250 million, 1.20% on the next $50 million, 1.15% on the next $50 million, 1.10% on the next $75 million, 1.05% on the next $75 million and 1.00% for amounts over $500 million, based on the Arbitrage Fund’s average daily net assets. Under the Investment Advisory Agreement between the Adviser and the Event-Driven Fund dated September 27, 2010, the Event-Driven Fund pays the Adviser an annual fee, which is computed and accrued daily and paid monthly, of 1.25% based on the Event-Driven Fund’s average daily net assets. Under the Investment Advisory Agreement between the Adviser and the Credit Opportunities Fund dated October 1, 2012, the Credit Opportunities Fund pays the Adviser an annual fee, which is computed and accrued daily and paid monthly, of 1.00% based on the Credit Opportunities Fund’s average daily net assets. Under the Investment Advisory Agreement between the Adviser and the Tactical Equity Fund dated December 22, 2014, the Tactical Equity Fund pays the Adviser an annual fee, which is computed and accrued daily and paid monthly, of 1.25% based on the Tactical Equity Fund’s average daily net assets.
The Adviser has contractually agreed, at least until August 31, 2016 for the Arbitrage Fund, the Event-Driven Fund and the Credit Opportunities Fund, and December 31, 2017 for the Tactical Equity Fund, to waive its advisory fee and/or reimburse the Funds’ other expenses to the extent that total operating expenses (exclusive of interest, taxes, dividends on short positions, brokerage commissions, acquired fund fees and expenses and other costs incurred in connection with the purchase or sale of portfolio securities) exceed the annual rate of the Funds’ average daily net assets attributable to each share class as shown in the table below:
| Arbitrage Fund | Event-Driven Fund | Credit Opportunities Fund | Tactical Equity Fund | |||||
Class R | 1.69% | 1.69% | 1.50% | 1.69% | ||||
Class I | 1.44% | 1.44% | 1.25% | 1.44% | ||||
Class C | 2.44% | 2.44% | 2.25% | 2.44% | ||||
Class A | 1.69% | 1.69% | 1.50% | 1.69% |
For the six months ended November 30, 2015, the aggregate net fee paid to the Adviser as a percentage of average net assets for the Arbitrage Fund, Event-Driven Fund, Credit Opportunities Fund and Tactical Equity Fund was 1.05%, 1.25%, 1.00% and 1.25%, respectively.
The Adviser is permitted to recapture fees waived and expenses reimbursed to the extent actual fees and expenses for a period are less than the expense limitation of each class, provided, however, that the Adviser shall only be entitled to recapture such amounts for a period of three years from the end of the fiscal year during which such amount was waived or reimbursed. The Adviser can recapture any fees it has waived within three fiscal years of the year in which fees were waived period subject to the applicable annual rate of: 1.69% for Class R shares, 1.44% for
| 118 | www.arbitragefunds.com | 1-800-295-4485 |
Table of Contents
| The Arbitrage Funds | Notes to Financial Statements (continued) | |
| November 30, 2015 (Unaudited) |
Class I shares, 2.44% for Class C shares and 1.69% for Class A shares for Event-Driven Fund, 1.50% for Class R shares, 1.25% for Class I shares, 2.25% for Class C shares and 1.50% for Class A shares for Credit Opportunities Fund and 1.69% for Class R shares, 1.44% for Class I shares, 2.44% for Class C shares and 1.69% for Class A shares for Tactical Equity Fund, respectively.
As of November 30, 2015, the balances of future recaptures for each Fund were as follows:
Expiring May 31, 2016 | Expiring May 31, 2017 | Expiring May 31, 2018 | Total | |||||||||||||
Event-Driven Fund | ||||||||||||||||
Class R | $ | 30,441 | $ | 16,826 | $ | 42,377 | $ | 89,644 | ||||||||
Class I | $ | 127,460 | $ | 67,294 | $ | 96,022 | $ | 290,776 | ||||||||
Class C | $ | 620 | $ | 854 | $ | 1,230 | $ | 2,704 | ||||||||
Class A | N/A | $ | 756 | $ | 1,377 | $ | 2,133 | |||||||||
Credit Opportunities Fund | ||||||||||||||||
Class R | $ | 22,353 | $ | 36,515 | $ | 25,136 | $ | 84,004 | ||||||||
Class I | $ | 51,089 | $ | 113,965 | $ | 92,962 | $ | 258,016 | ||||||||
Class C | $ | 399 | $ | 1,393 | $ | 4,587 | $ | 6,379 | ||||||||
Class A | N/A | $ | 214 | $ | 1,194 | $ | 1,408 | |||||||||
Tactical Equity Fund | ||||||||||||||||
Class R | N/A | N/A | $ | 1,733 | $ | 1,733 | ||||||||||
Class I | N/A | N/A | $ | 97,858 | $ | 97,858 | ||||||||||
Class C | N/A | N/A | $ | 1,733 | $ | 1,733 | ||||||||||
Class A | N/A | N/A | $ | 1,733 | $ | 1,733 | ||||||||||
There were no amounts recaptured during the six months ended November 30, 2015, for the Funds.
Certain officers of the Trust are also officers of the Adviser. The Chief Compliance Officer (“CCO”) of the Trust also serves as the CCO of the Adviser. The Funds currently pay the Adviser between 50%-60% of the CCO’s salary for the CCO’s provision of services to the Funds.
Administration Agreement
State Street Bank & Trust Company serves as the Trust’s administrator pursuant to an Administration Agreement with the Trust. Prior to September 11, 2015, ALPS Fund Services, Inc. (“ALPS”) served as the Trust’s administrator.
Distribution Agreement
ALPS Distributors, Inc. (the “Distributor”) serves as the Funds’ distributors. The Distributor acts as an agent for the Funds and the distributor of their shares. The Funds have adopted, with respect to their Class R, Class C shares and Class A shares, a plan of distribution pursuant to Rule 12b-1 under the 1940 Act which permits each Fund to pay for expenses incurred in the distribution and promotion of the Funds’ Class R shares, Class C shares and Class A shares and for services provided to shareholders. The Plan is a “reimbursement” plan. This means that a Fund’s Class R shares, Class C shares and Class A shares only pay a particular 12b-1 fee to the extent that the Adviser, the Distributor or others have incurred expenses in the promotion and distribution of the shares, including but not limited to, the printing of prospectuses and reports used for sales purposes, expenses of preparation of sales literature and related expenses, advertisements, and other distribution-related expenses, as well as any distribution fees paid to securities dealers or others.
| Semi-Annual Report | November 30, 2015 | 119 |
Table of Contents
| The Arbitrage Funds | Notes to Financial Statements (continued) | |
| November 30, 2015 (Unaudited) |
Under the distribution plan, a Fund may pay compensation to any broker-dealer with whom the Distributor or the Funds has entered into a contract to distribute Class R shares, Class C shares or Class A shares, or to any other qualified financial services firm, for distribution and/or shareholder-related services with respect to shares held or purchased by their respective customers or in connection with the purchase of shares attributable to their efforts. The amount of payments under the Plan in any year shall not exceed 0.25% for Class R shares, 0.75% for Class C shares and 0.25% for Class A shares, respectively, of the average daily net assets allocable to a Fund’s Class R shares, Class C shares and Class A shares, respectively. In addition, the Plan permits each Fund to make payments at an annual rate of up to 0.25% of the Fund’s Class C shares for expenses incurred in connection with the provision of shareholder support or administrative services for the Fund’s Class C shares. During the six months ended November 30, 2015, The Arbitrage Fund’s Class R shares incurred $593,270, Class C shares incurred $167,448 and Class A shares incurred $22,634, respectively, in distribution expenses for Class R shares and Class A shares and distribution and shareholder support expenses for Class C shares, all of which was used to compensate broker-dealers. With respect to the Event-Driven Fund, during the six months ended November 30, 2015, the Event-Driven Fund’s Class R shares incurred $186,664, Class C shares incurred $21,379 and Class A shares incurred $5,050, respectively, in distribution expenses for Class R shares and Class A shares and distribution and shareholder support expenses for Class C shares, all of which was used to compensate broker-dealers. With respect to the Credit Opportunities Fund, during the six months ended November 30, 2015, the Credit Opportunities Fund’s Class R shares incurred $25,957, Class C shares incurred $9,075 and Class A shares incurred $783, respectively, in distribution expenses for Class R shares and Class A shares and distribution and shareholder support expenses for Class C shares, all of which was used to compensate broker-dealers. With respect to the Tactical Equity Fund, during the six months ended November 30, 2015, the Tactical Equity Fund’s Class R shares incurred $12, Class C shares incurred $48 and Class A shares incurred $12, respectively, in distribution expenses for Class R shares and Class A shares and distribution and shareholder support expenses for Class C shares, all of which was used to compensate broker-dealers.
Chief Financial Officer
Foreside Management Services, LLC provides Chief Financial Officer (“CFO”) services to the Trust. Foreside Management Services, LLC is compensated by the Trust under a Fund CFO/Treasurer Agreement. Prior to September 11, 2015, ALPS provided Principal Financial Officer services to the Trust.
Transfer Agent And Shareholder Services Agreement
DST Systems, Inc. (“DST”) maintains the records of each shareholder’s account, answers shareholders’ inquiries concerning their accounts, processes purchases and redemptions of the Funds shares, acts as dividend and distribution disbursing agent and performs other shareholder service functions.
| 120 | www.arbitragefunds.com | 1-800-295-4485 |
Table of Contents
| The Arbitrage Funds | Notes to Financial Statements (continued) | |
| November 30, 2015 (Unaudited) |
7. CAPITAL SHARE TRANSACTIONS
Proceeds and payments on capital shares as shown in the Statement of Changes in Net Assets are the result of the following capital share transactions for the periods shown:
| Six Months Ended November 30, 2015 (Unaudited) | Year Ended May 31, 2015 | |||||||||||||||
| Arbitrage Fund - Class R | Shares | Value | Shares | Value | ||||||||||||
Proceeds from shares sold | 4,095,729 | $ | 52,260,595 | 11,255,277 | $ | 143,205,442 | ||||||||||
Shares issued in reinvestment of distributions | – | – | 99,102 | 1,254,629 | ||||||||||||
Proceeds from redemption fees collected (Note 2) | – | 2,831 | – | 14,505 | ||||||||||||
Payments for shares redeemed | (7,284,935 | ) | (92,985,506 | ) | (33,222,538 | ) | (422,530,774 | ) | ||||||||
|
| |||||||||||||||
Net decrease | (3,189,206 | ) | (40,722,080 | ) | (21,868,159 | ) | (278,056,198 | ) | ||||||||
|
| |||||||||||||||
| Arbitrage Fund - Class I | ||||||||||||||||
Proceeds from shares sold | 24,395,349 | $ | 319,419,125 | 58,430,496 | $ | 761,461,203 | ||||||||||
Shares issued in reinvestment of distributions | – | – | 210,789 | 2,731,828 | ||||||||||||
Proceeds from redemption fees collected (Note 2) | – | 6,244 | – | 7,720 | ||||||||||||
Payments for shares redeemed | (24,328,853 | ) | (318,444,032 | ) | (77,787,900 | ) | (1,014,256,381 | ) | ||||||||
|
| |||||||||||||||
Net increase | 66,496 | 981,337 | (19,146,615 | ) | (250,055,630 | ) | ||||||||||
|
| |||||||||||||||
| Arbitrage Fund - Class C | ||||||||||||||||
Proceeds from shares sold | 302,196 | $ | 3,768,864 | 661,256 | $ | 8,265,996 | ||||||||||
Shares issued in reinvestment of distributions | – | – | 3,667 | 45,478 | ||||||||||||
Payments for shares redeemed | (260,121 | ) | (3,232,874 | ) | (775,588 | ) | (9,670,144 | ) | ||||||||
|
| |||||||||||||||
Net increase | 42,075 | 535,990 | (110,665 | ) | (1,358,670 | ) | ||||||||||
|
| |||||||||||||||
| Arbitrage Fund - Class A | ||||||||||||||||
Proceeds from shares sold | 203,840 | $ | 2,609,920 | 1,051,918 | $ | 13,478,530 | ||||||||||
Shares issued in reinvestment of distributions | – | – | 1,501 | 19,017 | ||||||||||||
Proceeds from redemption fees collected (Note 2) | – | 278 | – | – | ||||||||||||
Payments for shares redeemed | (148,290 | ) | (1,881,978 | ) | (236,527 | ) | (3,042,546 | ) | ||||||||
|
| |||||||||||||||
Net increase | 55,550 | 728,220 | 816,892 | 10,455,001 | ||||||||||||
|
| |||||||||||||||
| Semi-Annual Report | November 30, 2015 | 121 |
Table of Contents
| The Arbitrage Funds | Notes to Financial Statements (continued) | |
| November 30, 2015 (Unaudited) |
| Six Months Ended November 30, 2015 (Unaudited) | Year Ended May 31, 2015 | |||||||||||||||
| Event-Driven Fund - Class R | Shares | Value | Shares | Value | ||||||||||||
Proceeds from shares sold | 1,245,774 | $ | 11,566,883 | 10,854,265 | $ | 109,616,337 | ||||||||||
Shares issued in reinvestment of distributions | – | – | 508,594 | 4,943,527 | ||||||||||||
Proceeds from redemption fees collected (Note 2) | – | 994 | – | 3,548 | ||||||||||||
Payments for shares redeemed | (7,817,567 | ) | (73,046,810 | ) | (11,137,483 | ) | (111,326,249 | ) | ||||||||
|
| |||||||||||||||
Net decrease | (6,571,793 | ) | (61,478,933 | ) | 225,376 | 3,237,163 | ||||||||||
|
| |||||||||||||||
| Event-Driven Fund - Class I | ||||||||||||||||
Proceeds from shares sold | 2,713,683 | $ | 25,633,237 | 30,268,594 | $ | 309,977,406 | ||||||||||
Shares issued in reinvestment of distributions | – | – | 847,412 | 8,296,168 | ||||||||||||
Proceeds from redemption fees collected (Note 2) | – | 7,442 | – | 10,415 | ||||||||||||
Payments for shares redeemed | (21,954,447 | ) | (204,799,358 | ) | (19,422,828 | ) | (193,474,992 | ) | ||||||||
|
| |||||||||||||||
Net decrease | (19,240,764 | ) | (179,158,679 | ) | 11,693,178 | 124,808,997 | ||||||||||
|
| |||||||||||||||
| Event-Driven Fund - Class C | ||||||||||||||||
Proceeds from shares sold | 28,801 | $ | 269,816 | 335,583 | $ | 3,399,344 | ||||||||||
Shares issued in reinvestment of distributions | – | – | 12,404 | 119,703 | ||||||||||||
Payments for shares redeemed | (146,372 | ) | (1,341,608 | ) | (240,429 | ) | (2,343,450 | ) | ||||||||
|
| |||||||||||||||
Net decrease | (117,571 | ) | (1,071,792 | ) | 107,558 | 1,175,597 | ||||||||||
|
| |||||||||||||||
| Event-Driven Fund - Class A | ||||||||||||||||
Proceeds from shares sold | 13,868 | $ | 129,741 | 354,278 | $ | 3,577,554 | ||||||||||
Shares issued in reinvestment of distributions | – | – | 12,574 | 122,223 | ||||||||||||
Payments for shares redeemed | (239,566 | ) | (2,218,243 | ) | (190,018 | ) | (1,872,117 | ) | ||||||||
|
| |||||||||||||||
Net decrease | (225,698 | ) | (2,088,502 | ) | 176,834 | 1,827,660 | ||||||||||
|
| |||||||||||||||
| 122 | www.arbitragefunds.com | 1-800-295-4485 |
Table of Contents
| The Arbitrage Funds | Notes to Financial Statements (continued) | |
| November 30, 2015 (Unaudited) |
| Six Months Ended November 30, 2015 (Unaudited) | Year Ended May 31, 2015 | |||||||||||||||
| Credit Opportunities Fund - Class R | Shares | Value | Shares | Value | ||||||||||||
Proceeds from shares sold | 211,017 | $ | 2,069,676 | 2,217,255 | $ | 22,101,038 | ||||||||||
Shares issued in reinvestment of distributions | 30,011 | 294,534 | 23,448 | 235,574 | ||||||||||||
Proceeds from redemption fees collected (Note 2) | – | – | – | 210 | ||||||||||||
Payments for shares redeemed | (559,485 | ) | (5,474,058 | ) | (579,108 | ) | (5,848,897 | ) | ||||||||
|
| |||||||||||||||
Net decrease | (318,457 | ) | (3,109,848 | ) | 1,661,595 | 16,487,925 | ||||||||||
|
| |||||||||||||||
| Credit Opportunities Fund - Class I | ||||||||||||||||
Proceeds from shares sold | 959,835 | $ | 9,388,570 | 4,060,080 | $ | 40,623,905 | ||||||||||
Shares issued in reinvestment of distributions | 69,296 | 678,180 | 103,564 | 1,037,613 | ||||||||||||
Proceeds from redemption fees collected (Note 2) | – | – | – | 24 | ||||||||||||
Payments for shares redeemed | (1,094,998 | ) | (10,659,260 | ) | (1,769,150 | ) | (17,616,249 | ) | ||||||||
|
| |||||||||||||||
Net decrease | (65,867 | ) | (592,510 | ) | 2,394,494 | 24,045,293 | ||||||||||
|
| |||||||||||||||
| Credit Opportunities Fund - Class C | ||||||||||||||||
Proceeds from shares sold | 11,061 | $ | 106,167 | 160,924 | $ | 1,619,345 | ||||||||||
Shares issued in reinvestment of distributions | 2,263 | 22,095 | 3,722 | 37,247 | ||||||||||||
Payments for shares redeemed | (48,414 | ) | (467,971 | ) | (30,365 | ) | (301,086 | ) | ||||||||
|
| |||||||||||||||
Net decrease | (35,090 | ) | (339,709 | ) | 134,281 | 1,355,506 | ||||||||||
|
| |||||||||||||||
| Credit Opportunities Fund - Class A | ||||||||||||||||
Proceeds from shares sold | 9,924 | $ | 97,938 | 92,306 | $ | 925,196 | ||||||||||
Shares issued in reinvestment of distributions | 894 | 8,755 | 961 | 9,597 | ||||||||||||
Payments for shares redeemed | (11,779 | ) | (115,580 | ) | (32,561 | ) | (322,636 | ) | ||||||||
|
| |||||||||||||||
Net decrease | (961 | ) | (8,887 | ) | 60,706 | 612,157 | ||||||||||
|
| |||||||||||||||
| Semi-Annual Report | November 30, 2015 | 123 |
Table of Contents
| The Arbitrage Funds | Notes to Financial Statements (continued) | |
| November 30, 2015 (Unaudited) |
| Six Months Ended November 30, 2015 (Unaudited) | Year Ended May 31, 2015(a) | |||||||||||||||
| Tactical Equity Fund - Class R | Shares | Value | Shares | Value | ||||||||||||
Proceeds from shares sold | – | $ | – | 1,000 | $ | 10,000 | ||||||||||
|
| |||||||||||||||
Net increase | – | – | 1,000 | 10,000 | ||||||||||||
|
| |||||||||||||||
| Tactical Equity Fund - Class I | ||||||||||||||||
Proceeds from shares sold | 32,486 | $ | 317,330 | 136,916 | $ | 1,385,609 | ||||||||||
Payments for shares redeemed | (4,590 | ) | (45,157 | ) | (6 | ) | (63 | ) | ||||||||
|
| |||||||||||||||
Net increase | 27,896 | 272,173 | 136,910 | 1,385,546 | ||||||||||||
|
| |||||||||||||||
| Tactical Equity Fund - Class C | ||||||||||||||||
Proceeds from shares sold | – | $ | – | 1,000 | $ | 10,000 | ||||||||||
|
| |||||||||||||||
Net increase | – | – | 1,000 | 10,000 | ||||||||||||
|
| |||||||||||||||
| Tactical Equity Fund - Class A | ||||||||||||||||
Proceeds from shares sold | – | $ | – | 1,000 | $ | 10,000 | ||||||||||
|
| |||||||||||||||
Net increase | – | – | 1,000 | 10,000 | ||||||||||||
|
| |||||||||||||||
| (a) | Commenced operations on January 2, 2015. |
8. FOREIGN CURRENCY TRANSLATION
Amounts denominated in or expected to settle in foreign currencies are translated to U.S. dollars based on exchange rates on the basis below:
A. The market values of investment securities and other assets and liabilities are translated at the closing rate of exchange each day.
B. Purchases and sales of investment securities and income and expenses are translated at the rate of exchange prevailing on the respective dates of such transactions.
C. The Funds do not isolate that portion of the results of operations caused by changes in foreign exchange rates on investments from those caused by changes in market prices of securities held. Such fluctuations are included with the net realized and unrealized gains or losses on investments. Reported net realized foreign exchange gains or losses arise from 1) purchases and sales of foreign currencies; 2) currency gains or losses realized between the trade and settlement dates on security transactions; and 3) the difference between the amounts of dividends, interest and foreign withholding taxes recorded on the Funds’ books, and the U.S. dollar equivalent of the amounts actually received or paid. Reported net unrealized foreign exchange gains and losses arise from changes in the value of assets and liabilities, other than investment securities, resulting from changes in exchange rates.
9. CONTINGENCIES AND COMMITMENTS
The Funds indemnify the Trust’s officers and trustees for certain liabilities that might arise from their performance of their duties to the Funds. Additionally, in the normal course of business the Funds enter into contracts that contain a variety of representations and warranties and which provide general indemnifications. The Funds’ maximum exposure under these arrangements is unknown, as this would involve future claims that may be made against the Funds that have not yet occurred. However, based on experience, the Funds expect the risk of loss to be remote.
| 124 | www.arbitragefunds.com | 1-800-295-4485 |
Table of Contents
| The Arbitrage Funds | Notes to Financial Statements (continued) | |
| November 30, 2015 (Unaudited) |
10. SECURITIES LENDING
In order to generate additional income, the Funds may, from time to time, lend portfolio securities to broker-dealers, banks or institutional borrowers of securities. The Funds must receive 100% collateral in the form of cash or U.S. government securities. This collateral must be valued daily and, should the market value of the loaned securities increase, the borrower must furnish additional collateral to the Funds. During the time portfolio securities are on loan, the borrower pays the Funds any dividends or interest paid on such securities.
Loans are subject to termination by the Funds or the borrower at any time. While the Funds do not have the right to vote securities on loan they have the right to terminate the loan and regain the right to vote if that is considered important with respect to the investment. In the event the borrower defaults in its obligation to the Fund, the Funds bear the risk of delay in the recovery of portfolio securities and the risk of loss of rights in the collateral. The Funds did not engage in securities lending during the reporting period.
11. FEDERAL TAX INFORMATION
In order to avoid imposition of the excise tax applicable to regulated investment companies, it is also the Funds’ intention to declare as dividends in each calendar year at least 98% of its net investment income (earned during the calendar year) and 98.2% of its net realized capital gains (earned during the twelve months ended October 31) plus undistributed amounts from prior years.
The amount of distributions from net investment income and net realized gains, if any, are determined in accordance with Federal income tax regulations which may differ from accounting principles generally accepted in the United States of America. These “book/tax” differences are either temporary or permanent in nature and permanent differences are charged or credited to undistributed net investment income (loss), accumulated net realized gain (loss) or paid-in capital as appropriate in the period that the differences arise.
Permanent differences between the Funds’ financial statement and income tax reporting requirements are primarily attributable to gains and losses on certain foreign currency related transactions, short sale related dividend expense, investments in passive foreign investment companies, and investments in swaps. These have no effect on the Funds’ net assets or net asset value per share.
The tax character of dividends and distributions declared and paid during the years ended May 31, 2015 and May 31, 2014 was as follows:
| Fund | Year Ended | Ordinary Income | Long-Term Capital Gains* | Total Distributions | ||||||||||||
Arbitrage Fund | 5/31/2015 | $ | – | $ | 5,699,538 | $ | 5,699,538 | |||||||||
| 5/31/2014 | – | 12,319,798 | 12,319,798 | |||||||||||||
Event-Driven Fund | 5/31/2015 | $ | 16,463,793 | $ | – | $ | 16,463,793 | |||||||||
| 5/31/2014 | 982,616 | – | 982,616 | |||||||||||||
Credit Opportunities Fund | 5/31/2015 | $ | 1,328,590 | $ | – | $ | 1,328,590 | |||||||||
| 5/31/2014 | 440,526 | – | 440,526 | |||||||||||||
Tactical Equity Fund | 5/31/2015 | $ | – | $ | – | $ | – | |||||||||
| * | The Funds designate these distributions as long-term capital gains dividends per IRC code section 852(b)(3)(C). |
| Semi-Annual Report | November 30, 2015 | 125 |
Table of Contents
| The Arbitrage Funds | Notes to Financial Statements (continued) | |
| November 30, 2015 (Unaudited) |
The following information is computed on a tax basis for each item as of November 30, 2015:
| Fund | Gross over tax cost) | Gross Depreciation (excess of tax cost over value) | Net Appreciation/ (Depreciation) of Foreign Currency and Derivatives | Net Unrealized Appreciation (Depreciation) | Cost of Investments for Income Tax Purposes | |||||||||||||||
The Arbitrage Fund | $ | 27,710,058 | $ | (29,353,649 | ) | $ | 11,758,850 | $ | 10,115,259 | $ | 1,994,075,872 | |||||||||
The Event-Driven Fund | 2,844,987 | (20,622,848 | ) | 350,415 | (17,427,446 | ) | 325,362,790 | |||||||||||||
The Credit Opportunities Fund | 286,278 | (1,491,730 | ) | (157,170 | ) | (1,362,622 | ) | 65,530,999 | ||||||||||||
The Tactical Equity Fund | 34,603 | (44,633 | ) | (22,930 | ) | (32,960 | ) | 1,518,433 | ||||||||||||
The differences between book-basis and tax-basis net unrealized appreciation/(depreciation) for the Funds are attributable to constructive sales, dividends related to short securities, investments in passive foreign investment companies, and wash sales.
Capital Loss Carryovers:
Capital loss carryovers used during the period ended May 31, 2015, were $11,516,700 for the Arbitrage Fund.
Capital Losses:
As of May 31, 2015, the Arbitrage Credit Opportunities Fund had $116,168 of short term and $13,297 of long term capital loss carryforwards which may reduce the Funds’ taxable income arising from future net realized gains on investments, if any, to the extent permitted by the Code and thus may reduce the amount of the distributions to shareholders which would otherwise be necessary to relieve the Funds of any liability for federal tax.
Late Year Losses:
The Arbitrage Event-Driven Fund and the Arbitrage Credit Opportunities Fund elects to defer to the period ending May 31, 2016, capital losses recognized during the period November 1, 2014 to May 31, 2015 in the amount of $13,264,810 and $418,615, respectively.
12. INFORMATION REGARDING LEGAL PROCEEDINGS
The Arbitrage Fund and dozens of other entities and individuals have been named as defendants in an adversary proceeding pending in the United States Bankruptcy Court for the Southern District of New York (Weisfelner, as Trustee of the LB Creditor Trust v. Fund 1, et al., Adv. Pro. No. 10-04609). The complaint alleges that payments made to shareholders of Lyondell Chemical Company (“Lyondell”) in connection with the acquisition of Lyondell by Basell AF S.C.A. in a cash-out merger in or around December, 2007 constituted constructive or intentional “fraudulent transfers” under applicable state law and seeks to recover from the former Lyondell shareholders the payments received for the shares.
On January 14, 2014, the Court issued a decision and order on motions to dismiss granting in part, and denying in part, the motions. On April 9, 2014, plaintiff filed a Third Amended Complaint continuing to assert constructive or intentional fraudulent transfer claims under applicable state law. On August 1, 2014, defendants filed a motion to dismiss the Third Amended Complaint, and
| 126 | www.arbitragefunds.com | 1-800-295-4485 |
Table of Contents
| The Arbitrage Funds | Notes to Financial Statements (continued) | |
| November 30, 2015 (Unaudited) |
oral arguments on the motion to dismiss was held on January 14, 2015. Late last year, the Court issued a decision dismissing the intentional fraudulent transfer claim.
At this stage in the proceedings, it is not possible to assess with any reasonable certainty the probable outcome of the pending litigation. Consequently, at this time, management is unable to estimate the possible loss that may result.
13. SUBSEQUENT EVENTS
The Advisor has evaluated the need for disclosures and/or adjustments resulting from subsequent events relating to the Funds. There were no such events or transactions requiring adjustments to or disclosure in the Funds’ financial statements.
| Semi-Annual Report | November 30, 2015 | 127 |
Table of Contents
| The Arbitrage Funds | Disclosure of Fund Expenses | |
| November 30, 2015 (Unaudited) |
All mutual funds have operating expenses. As a shareholder of a mutual fund, your investment is affected by these ongoing costs, which include (among others) costs for portfolio management, administrative services, distribution (12b-1) expenses, redemption fees and shareholder reports like this one. It is important for you to understand the impact of these costs on your investment returns.
Operating expenses such as these are deducted from a mutual fund’s gross income and directly reduce its final investment return. These expenses are expressed as a percentage of a mutual fund’s average net assets; this percentage is known as a mutual fund’s expense ratio.
The following examples use the expense ratio and are intended to help you understand the ongoing costs (in dollars) of investing in your Fund and to compare these costs with those of other mutual funds. The examples are based on an investment of $1,000 made at the beginning of the period shown and held for the entire period.
The table on the following page illustrates your Fund’s cost in two ways:
Actual Fund Return. The section helps you to estimate the actual expenses after fee waivers that your Fund incurred over the period. The “Expenses Paid During Period” column shows the actual dollar expense cost incurred by a $1,000 investment in the Fund, and the “Ending Account Value” number is derived from deducting that expense cost from the Fund’s gross investment return.
You can use this information, together with the actual amount you invested in the Fund, to estimate the expenses you paid over that period. Simply divide your actual account value by $1,000 to arrive at a ratio (for example, an $8,600 account value divided by $1,000 = 8.6), then multiply that ratio by the number shown for your Fund under “Expenses Paid During Period.”
Hypothetical 5% Return. This section helps you compare your Fund’s costs with those of other mutual funds. It assumes that the Fund had an annual 5% return before expenses during the period, but that expense ratio (Column 3) for the period is unchanged. This example is useful in making comparisons because the Securities and Exchange Commission requires all mutual funds to make this 5% calculation. You can assess your Fund’s comparative cost by comparing the hypothetical result for your Fund in the “Expenses Paid During Period” column with those that appear in the same charts in the shareholder reports for other mutual funds.
Note: Because the return is set at 5% for comparison purposes — NOT your Fund’s actual return — the account values shown may not apply to your specific investment.
| 128 | www.arbitragefunds.com | 1-800-295-4485 |
Table of Contents
| The Arbitrage Funds | Disclosure of Fund Expenses (continued) | |
| November 30, 2015 (Unaudited) |
| Beginning Account Value 06/01/2015 | Ending Account Value 11/30/2015 | Expense Ratio(a) | Expenses Paid During Period(b) | |||||||||||||
The Arbitrage Fund |
| |||||||||||||||
Class R | ||||||||||||||||
Actual | $ | 1,000.00 | $ | 983.80 | 1.87 | % | $ | 9.27 | ||||||||
Hypothetical (5% return before expenses) | $ | 1,000.00 | $ | 1,015.65 | 1.87 | % | $ | 9.42 | ||||||||
Class I | ||||||||||||||||
Actual | $ | 1,000.00 | $ | 984.90 | 1.62 | % | $ | 8.04 | ||||||||
Hypothetical (5% return before expenses) | $ | 1,000.00 | $ | 1,016.90 | 1.62 | % | $ | 8.17 | ||||||||
Class C | ||||||||||||||||
Actual | $ | 1,000.00 | $ | 980.20 | 2.62 | % | $ | 12.97 | ||||||||
Hypothetical (5% return before expenses) | $ | 1,000.00 | $ | 1,011.90 | 2.62 | % | $ | 13.18 | ||||||||
Class A | ||||||||||||||||
Actual | $ | 1,000.00 | $ | 983.80 | 1.87 | % | $ | 9.27 | ||||||||
Hypothetical (5% return before expenses) | $ | 1,000.00 | $ | 1,015.65 | 1.87 | % | $ | 9.42 | ||||||||
| (a) | Annualized, based on the Fund’s most recent fiscal half-year expenses. |
| (b) | Expenses, are equal to the Fund’s annualized ratio multiplied by the average account value over the period, multiplied by the number of days in the most recent fiscal half year (183), divided by 366. |
| Beginning Account Value 06/01/2015 | Ending Account Value 11/30/2015 | Expense Ratio(a) | Expenses Paid During Period(b) | |||||||||||||
The Arbitrage Event-Driven Fund |
| |||||||||||||||
Class R | ||||||||||||||||
Actual | $ | 1,000.00 | $ | 915.70 | 2.52 | % | $ | 12.07 | ||||||||
Hypothetical (5% return before expenses) | $ | 1,000.00 | $ | 1,012.40 | 2.52 | % | $ | 12.68 | ||||||||
Class I | ||||||||||||||||
Actual | $ | 1,000.00 | $ | 917.40 | 2.27 | % | $ | 10.88 | ||||||||
Hypothetical (5% return before expenses) | $ | 1,000.00 | $ | 1,013.65 | 2.27 | % | $ | 11.43 | ||||||||
Class C | ||||||||||||||||
Actual | $ | 1,000.00 | $ | 912.70 | 3.27 | % | $ | 15.64 | ||||||||
Hypothetical (5% return before expenses) | $ | 1,000.00 | $ | 1,008.65 | 3.27 | % | $ | 16.42 | ||||||||
Class A | ||||||||||||||||
Actual | $ | 1,000.00 | $ | 916.80 | 2.52 | % | $ | 12.08 | ||||||||
Hypothetical (5% return before expenses) | $ | 1,000.00 | $ | 1,012.40 | 2.52 | % | $ | 12.68 | ||||||||
| (a) | Annualized, based on the Fund’s most recent fiscal half-year expenses. |
| (b) | Expenses, are equal to the Fund’s annualized ratio multiplied by the average account value over the period, multiplied by the number of days in the most recent fiscal half year (183), divided by 366. |
| Semi-Annual Report | November 30, 2015 | 129 |
Table of Contents
| The Arbitrage Funds | Disclosure of Fund Expenses (continued) | |
| November 30, 2015 (Unaudited) |
| Beginning Account Value 06/01/2015 | Ending Account Value 11/30/2015 | Expense Ratio(a) | Expenses Paid During Period(b) | |||||||||||||
The Arbitrage Credit Opportunities Fund |
| |||||||||||||||
Class R | ||||||||||||||||
Actual | $ | 1,000.00 | $ | 983.30 | 1.67 | % | $ | 8.28 | ||||||||
Hypothetical (5% return before expenses) | $ | 1,000.00 | $ | 1,016.65 | 1.67 | % | $ | 8.42 | ||||||||
Class I | ||||||||||||||||
Actual | $ | 1,000.00 | $ | 985.00 | 1.42 | % | $ | 7.05 | ||||||||
Hypothetical (5% return before expenses) | $ | 1,000.00 | $ | 1,017.90 | 1.42 | % | $ | 7.16 | ||||||||
Class C | ||||||||||||||||
Actual | $ | 1,000.00 | $ | 979.80 | 2.42 | % | $ | 11.98 | ||||||||
Hypothetical (5% return before expenses) | $ | 1,000.00 | $ | 1,012.90 | 2.42 | % | $ | 12.18 | ||||||||
Class A | ||||||||||||||||
Actual | $ | 1,000.00 | $ | 983.30 | 1.67 | % | $ | 8.28 | ||||||||
Hypothetical (5% return before expenses) | $ | 1,000.00 | $ | 1,016.65 | 1.67 | % | $ | 8.42 | ||||||||
| (a) | Annualized, based on the Fund’s most recent fiscal half-year expenses. |
| (b) | Expenses, are equal to the Fund’s annualized ratio multiplied by the average account value over the period, multiplied by the number of days in the most recent fiscal half year (183), divided by 366. |
| Beginning Account Value 06/01/2015 | Ending Account Value 11/30/2015 | Expense Ratio(a) | Expenses Paid During Period(b) | |||||||||||||
The Arbitrage Tactical Equity Fund |
| |||||||||||||||
Class R | ||||||||||||||||
Actual | $ | 1,000.00 | $ | 917.00 | 2.85 | % | $ | 13.66 | ||||||||
Hypothetical (5% return before expenses) | $ | 1,000.00 | $ | 1,010.75 | 2.85 | % | $ | 14.33 | ||||||||
Class I | ||||||||||||||||
Actual | $ | 1,000.00 | $ | 917.00 | 2.60 | % | $ | 12.46 | ||||||||
Hypothetical (5% return before expenses) | $ | 1,000.00 | $ | 1,012.00 | 2.60 | % | $ | 13.08 | ||||||||
Class C | ||||||||||||||||
Actual | $ | 1,000.00 | $ | 917.00 | 3.60 | % | $ | 17.25 | ||||||||
Hypothetical (5% return before expenses) | $ | 1,000.00 | $ | 1,007.00 | 3.60 | % | $ | 18.06 | ||||||||
Class A | ||||||||||||||||
Actual | $ | 1,000.00 | $ | 917.00 | 2.85 | % | $ | 13.66 | ||||||||
Hypothetical (5% return before expenses) | $ | 1,000.00 | $ | 1,010.75 | 2.85 | % | $ | 14.33 | ||||||||
| (a) | Annualized, based on the Fund’s most recent fiscal half-year expenses. |
| (b) | Expenses, are equal to the Fund’s annualized ratio multiplied by the average account value over the period, multiplied by the number of days in the most recent fiscal half year (183), divided by 366. |
| 130 | www.arbitragefunds.com | 1-800-295-4485 |
Table of Contents
| The Arbitrage Funds | Additional Information | |
| November 30, 2015 (Unaudited) |
1. PROXY VOTING POLICIES AND VOTING RECORD
A description of the policies and procedures that the Funds use to vote proxies relating to portfolio securities is available without charge upon request by calling toll-free 1-800-295-4485, or on the Securities and Exchange Commission’s (“SEC”) website at http://www.sec.gov. Information regarding how the Funds voted proxies will be available without charge upon request by calling toll-free 1-800-295-4485, or on the SEC’s website at http://www.sec.gov.
2. QUARTERLY PORTFOLIO HOLDINGS
The Funds file a complete listing of their portfolio holdings with the SEC as of the first and third quarters of each fiscal year on Form N-Q. The filings are available upon request by calling 1-800-295-4485. Furthermore, you may obtain a copy of the filing on the SEC’s website at http://www.sec.gov. The Funds’ Forms N-Q may also be reviewed and copied at the SEC’s Public Reference Room in Washington, D.C., and information on the operation of the Public Reference Room may be obtained by calling 1-800-SEC-0330.
| Semi-Annual Report | November 30, 2015 | 131 |
Table of Contents
| The Arbitrage Funds | Privacy Policy | |
| November 30, 2015 (Unaudited) |
Commitment to Consumer Privacy
The Arbitrage Funds are committed to handling consumer information responsibly. We recognize and respect the privacy expectations of each of our customers. We believe the confidentiality and protection of consumer information is one of our fundamental responsibilities.
Collection and Disclosure of Shareholder Information
Consumer information collected by, or on behalf, of The Arbitrage Funds generally comes from the following sources:
| • | Account applications, other required forms, correspondence, written or electronic, or telephone contacts with shareholders or consumers inquiring about The Arbitrage Funds; |
| • | Transaction history of a shareholder’s account; or |
| • | Third parties. |
We may disclose consumer information to third parties who are not affiliated with The Arbitrage Funds:
| • | as permitted by law, for example with service providers who maintain or service customer accounts for The Arbitrage Funds or to a shareholder’s broker/dealer; or |
| • | to perform marketing services on our behalf or pursuant to a joint marketing agreement with another financial institution. |
Security of Customer Information
We require service providers to The Arbitrage Funds:
| • | to maintain policies and procedures designed to assure only appropriate access to, and use of information about customers of The Arbitrage Funds; and |
| • | to maintain physical, electronic and procedural safeguards that comply with federal standards to guard non-public personal information of customers of The Arbitrage Funds. |
| 132 | www.arbitragefunds.com | 1-800-295-4485 |
Table of Contents

The Arbitrage Fund
The Arbitrage Event-Driven Fund
The Arbitrage Credit Opportunities Fund
The Arbitrage Tactical Equity Fund
800-295-4485
www.arbitragefunds.com
Adviser
Water Island Capital LLC
41 Madison Avenue, 42nd Floor
New York, NY 10010
Distributor
ALPS Distributors, Inc.
1290 Broadway, Suite 1100
Denver, CO 80203
Transfer Agent
DST Systems, Inc.
P.O. Box 219842
Kansas City, MO 64121-9842
Custodian
State Street Bank & Trust
225 Liberty Street
New York, NY 10281
This material must be preceded or accompanied by a prospectus. Please read it carefully before investing.
Table of Contents
| Item 2. | Code of Ethics. |
Not applicable to semi-annual report.
| Item 3. | Audit Committee Financial Expert. |
Not applicable to semi-annual report.
| Item 4. | Principal Accountant Fees and Services. |
Not applicable to semi-annual report.
| Item 5. | Audit Committee of Listed Registrants. |
Not applicable.
| Item 6. | Schedule of Investments. |
The Schedule of Investments is included as part of the Report to Stockholders filed under Item 1 of this form.
| Item 7. | Disclosure of Proxy Voting Policies and Procedures for Closed-End Management Investment Companies. |
Not applicable
| Item 8. | Portfolio Managers of Closed-End Management Investment Companies. |
Not applicable.
| Item 9. | Purchases of Equity Securities by Closed-End Management Investment Company and Affiliated Purchasers. |
Not applicable.
| Item 10. | Submission of Matters to Vote of Security Holders. |
There have been no material changes to the procedures by which shareholders may recommend nominees to the registrant’s Board of Trustees.
Table of Contents
| Item 11. | Controls and Procedures. |
| (a) | The registrant’s principal executive officer and principal financial officer have evaluated the registrant’s disclosure controls and procedures (as defined in Rule 30a-3(c) under the Investment Company Act of 1940, as amended) within 90 days of this filing and have concluded that the registrant’s disclosure controls and procedures were effective, as of that date. |
| (b) | There was no change in the registrant’s internal control over financial reporting (as defined in Rule 30a-3(d) under the Investment Company Act of 1940, as amended) during the second fiscal quarter of the period covered by this report that has materially affected, or is reasonably likely to materially affect, the registrant’s internal control over financial reporting. |
| Item 12. | Exhibits. |
| (a)(1) | Not applicable to semi-annual report. |
| (a)(2) | A separate certification for the principal executive officer and the principal financial officer of the registrant as required by Rule 30a-2(a) under the Investment Company Act of 1940, as amended (17 CFR 270.30a-2(a)), are attached hereto as exhibit Ex-99.CERT. |
| (a)(3) | Not applicable. |
| (b) | The certifications by the registrant’s principal executive officer and principal financial officer, as required by Rule 30a-2(b) of the Investment Company Act of 1940, as amended, and Section 906 of the Sarbanes-Oxley Act of 2002 are attached hereto as Ex-99.906CERT. |
Table of Contents
SIGNATURES
Pursuant to the requirements of the Securities Exchange Act of 1934 and the Investment Company Act of 1940, the registrant has duly caused this report to be signed on its behalf by the undersigned, thereunto duly authorized.
THE ARBITRAGE FUNDS
| By: | /s/ John S. Orrico | |
| John S. Orrico | ||
| President (Principal Executive Officer) | ||
| Date: | February 5, 2016 | |
Pursuant to the requirements of the Securities Exchange Act of 1934 and the Investment Company Act of 1940, this report has been signed below by the following persons on behalf of the registrant and in the capacities and on the dates indicated.
| By: | /s/ John S. Orrico | |
| John S. Orrico | ||
| President (Principal Executive Officer) | ||
| Date: | February 5, 2016 | |
| By: | /s/ Monique Labbe | |
| Monique Labbe | ||
Chief Financial Officer (Principal Financial Officer | ||
| Date: | February 5, 2016 | |