UNITED STATES SECURITIES AND EXCHANGE COMMISSION
Washington, D.C. 20549
FORM N-CSR
CERTIFIED SHAREHOLDER REPORT OF REGISTERED
MANAGEMENT INVESTMENT COMPANIES
Investment Company Act File number: 811-09877
CALVERT RESPONSIBLE INDEX SERIES, INC.
(Exact Name of Registrant as Specified in Charter)
1825 Connecticut Avenue NW, Suite 400, Washington, DC 20009
(Address of Principal Executive Offices)
Maureen A. Gemma
Two International Place, Boston, Massachusetts 02110
(Name and Address of Agent for Service)
(202) 238-2200
(Registrant's telephone number)
September 30
Date of Fiscal Year End
September 30, 2019
Date of Reporting Period
____________________________________________________________________________________
Item 1. Report to Stockholders.
Calvert US Large-Cap Core Responsible Index Fund
Calvert US Large-Cap Growth Responsible Index Fund
Calvert US Large-Cap Value Responsible Index Fund
Calvert US Mid-Cap Core Responsible Index Fund
Calvert International Responsible Index Fund
|
|
| Calvert US Large-Cap Core Responsible Index Fund |
Important Note. Beginning on January 1, 2021, as permitted by regulations adopted by the Securities and Exchange Commission, paper copies of the Fund’s annual and semi-annual shareholder reports will no longer be sent by mail unless you specifically request paper copies of the reports. Instead, the reports will be made available on the Fund’s website (calvert.com/prospectus), and you will be notified by mail each time a report is posted and provided with a website address to access the report.
If you already elected to receive shareholder reports electronically, you will not be affected by this change and you need not take any action. If you are a direct investor, you may elect to receive shareholder reports and other communications from the Fund electronically by signing up for e-Delivery at calvert.com. If you own your shares through a financial intermediary (such as a broker-dealer or bank), you must contact your financial intermediary to sign up.
You may elect to receive all future Fund shareholder reports in paper free of charge. If you are a direct investor, you can inform the Fund that you wish to continue receiving paper copies of your shareholder reports by calling 1-800-368-2745. If you own these shares through a financial intermediary, you must contact your financial intermediary or follow instructions included with this disclosure, if applicable, to elect to continue to receive paper copies of your shareholder reports. Your election to receive reports in paper will apply to all Calvert funds held directly or to all funds held through your financial intermediary, as applicable.
|
| |
Annual Report September 30, 2019 E-Delivery Sign-Up — Details Inside
| |
|
|
Commodity Futures Trading Commission Registration. Effective December 31, 2012, the Commodity Futures Trading Commission (“CFTC”) adopted certain regulatory changes that subject registered investment companies and advisers to regulation by the CFTC if a fund invests more than a prescribed level of its assets in certain CFTC-regulated instruments (including futures, certain options and swap agreements) or markets itself as providing investment exposure to such instruments. The Fund and its adviser have claimed an exclusion from the definition of the term “commodity pool operator” under the Commodity Exchange Act. Accordingly, neither the Fund nor the adviser is subject to CFTC regulation.
Fund shares are not insured by the FDIC and are not deposits or other obligations of, or guaranteed by, any depository institution. Shares are subject to investment risks, including possible loss of principal invested.
This report must be preceded or accompanied by a current summary prospectus or prospectus. Before investing, investors should consider carefully the investment objective, risks, and charges and expenses of a mutual fund. This and other important information is contained in the summary prospectus and prospectus, which can be obtained from a financial intermediary. Prospective investors should read the prospectus carefully before investing. For further information, please call 1-800-368-2745. |
Choose Planet-friendly E-delivery! Sign up now for on-line statements, prospectuses, and fund reports. In less than five minutes you can help reduce paper mail and lower fund costs. Just go to www.calvert.com. If you already have an online account with the Calvert funds, click on Login to access your Account and select the documents you would like to receive via e-mail. If you’re new to online account access, click on Login, then Register to create your user name and password. Once you’re in, click on the E-delivery sign-up on the Account Portfolio page and follow the quick, easy steps. Note: If your shares are not held directly with the Calvert funds but through a brokerage firm, you must contact your broker for electronic delivery options available through their firm. |
|
| | | | |
| | | TABLE OF CONTENTS |
| | | | | |
| | | | | Management’s Discussion of Fund Performance |
| | | | | Performance |
| | | | | Fund Profile |
| | | | | Endnotes and Additional Disclosures |
| | | | | Fund Expenses |
| | | | | Financial Statements |
| | | | | Report of Independent Registered Public Accounting Firm |
| | | | | Federal Tax Information |
| | | | | Management and Organization |
| | | | | Important Notices |
MANAGEMENT’S DISCUSSION OF FUND PERFORMANCE1 Economic and Market Conditions
In the midst of a yearlong trade war with China and slowing economic growth worldwide, U.S. stocks delivered mixed returns during the 12-month period ended September 30, 2019.
U.S. stocks opened the period on the downside as investors worried that President Trump’s imposition of broad import tariffs might provoke a wider trade dispute with China, the world’s second-largest economy behind the U.S.
With U.S. economic data largely positive throughout 2018, the U.S. Federal Reserve Board (the Fed) raised its benchmark federal funds rate four times ─ from a low range of 1.50%-1.75% to 2.25%-2.50% ─ with the last quarter-point increase on December 19, 2018.
U.S. stocks turned higher in early 2019 as trade fears eased and interest rates remained stable after the Fed signaled a slower pace for future rate hikes. However, around the same time, U.S. economic indicators began sending mixed signals. While the job market was robust during the period with the U.S. unemployment rate dipping below 4%, retail sales fell, raising concerns about consumer spending. Factory output also declined, dragged down by a large drop in auto production.
The U.S. equity market fluctuated through the spring of 2019. Heightened trade-conflict rhetoric drove stocks lower in May before easing tensions helped equities recover in June. Key economic indicators continued to be mixed, with job creation decelerating sharply in May.
After holding interest rates steady through the first half of 2019, the Fed cut its benchmark interest rate to 2.00%-2.25% on July 31 ─ its first reduction in over a decade ─ followed by a second interest-rate drop to 1.75%-2.00% on September 18. Lower rates are intended to help stimulate economic activity by making borrowing costs relatively more affordable.
After sliding in August, U.S. equities rebounded in early September before retreating in the final weeks of the period. During the 12-month period ended September 30, 2019, the blue-chip Dow Jones Industrial Average®2 gained 4.21%, while the broader U.S. equity market, as represented by the S&P 500® Index, rose 4.25%. The technology-laden Nasdaq Composite Index returned 0.52% during the period.
Large-cap U.S. stocks, as measured by the S&P 500® Index, generally outperformed their small-cap counterparts, as measured by the Russell 2000® Index, during the period.
As a group, value stocks outpaced growth stocks in both large- and small-cap categories, as measured by the Russell growth and value indexes.
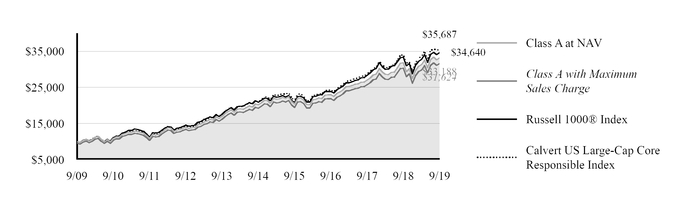
Fund Performance
For the 12-month period ended September 30, 2019, Calvert US Large-Cap Core Responsible Index Fund (the Fund) returned 4.33% for Class A shares at net asset value (NAV). The Fund outperformed its primary benchmark, the Russell 1000® Index, which returned 3.87%; and underperformed its secondary benchmark, the Calvert US Large-Cap Core Responsible Index (the Calvert Index), which returned 4.95% during the period.
The Fund’s underperformance versus its secondary benchmark was due to Fund expenses and fees, which the Calvert Index does not incur.
Nine of the Fund’s 11 market sectors had positive returns during the period. The weakest-performing sectors were energy, health care, and consumer discretionary. The strongest-performing sectors were utilities, consumer staples, and real estate.
|
|
See Endnotes and Additional Disclosures in this report.
Past performance is no guarantee of future results. Returns are historical and are calculated by determining the percentage change in net asset value (NAV) or offering price (as applicable) with all distributions reinvested. Investment return and principal value will fluctuate so that shares, when redeemed, may be worth more or less than their original cost. Performance less than or equal to one year is cumulative. Performance is for the stated time period only; due to market volatility, the Fund’s current performance may be lower or higher than quoted. Returns are before taxes unless otherwise noted. For performance as of the most recent month-end, please refer to www.calvert.com. |
2 www.calvert.com CALVERT US LARGE-CAP CORE RESPONSIBLE INDEX FUND ANNUAL REPORT (Unaudited)
PERFORMANCE
|
| | | | | | | | | | | | | | |
Performance2,3 | | | | | | | | | |
Portfolio Managers Thomas C. Seto, Christopher Madden, CFA and Jade Huang, each of Calvert Research and Management
|
| | | | | | | | | | |
| % Average Annual Total Returns | Class Inception Date |
| | Performance Inception Date |
| | One Year |
| | Five Years |
| | Ten Years |
|
| Class A at NAV | 06/30/2000 |
| | 06/30/2000 |
| | 4.33 | % | | 10.47 | % | | 12.74 | % |
| Class A with 4.75% Maximum Sales Charge | — |
| | — |
| | -0.62 |
| | 9.40 |
| | 12.20 |
|
| Class C at NAV | 06/30/2000 |
| | 06/30/2000 |
| | 3.55 |
| | 9.63 |
| | 11.79 |
|
| Class C with 1% Maximum Sales Charge | — |
| | — |
| | 2.55 |
| | 9.63 |
| | 11.79 |
|
| Class I at NAV | 06/30/2000 |
| | 06/30/2000 |
| | 4.68 |
| | 10.87 |
| | 13.25 |
|
| Class R6 at NAV | 10/03/2017 |
| | 06/30/2000 |
| | 4.70 |
| | 10.86 |
| | 13.25 |
|
| | | | | | | | | | |
| | | | | | | | | | |
Russell 1000® Index | — |
| | — |
| | 3.87 | % | | 10.61 | % | | 13.22 | % |
| Calvert US Large-Cap Core Responsible Index | — |
| | — |
| | 4.95 |
| | 11.18 |
| | 13.56 |
|
| | | | | | | | | | |
% Total Annual Operating Expense Ratios4 | | | Class A |
| | Class C |
| | Class I |
| | Class R6 |
|
| Gross | | | 0.62 | % | | 1.37 | % | | 0.37 | % | | 0.32 | % |
| Net | | | 0.49 |
| | 1.24 |
| | 0.24 |
| | 0.19 |
|
|
|
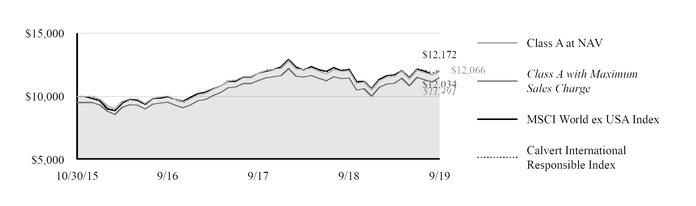
| Growth of $10,000 |
| This graph shows the change in value of a hypothetical investment of $10,000 in Class A of the Fund for the period indicated. For comparison, the same investment is shown in the indicated index. |
|
| | | | | | | | |
Growth of Investment3 | Amount Invested |
| Period Beginning | At NAV |
| With Maximum Sales Charge |
| Class C |
| $10,000 |
| 09/30/2009 |
| $30,507 |
| N.A. |
| Class I |
| $100,000 |
| 09/30/2009 |
| $347,231 |
| N.A. |
| Class R6 |
| $1,000,000 |
| 09/30/2009 |
| $3,471,619 |
| N.A. |
See Endnotes and Additional Disclosures in this report.
Past performance is no guarantee of future results. Returns are historical and are calculated by determining the percentage change in net asset value (NAV) or offering price (as applicable) with all distributions reinvested. Investment return and principal value will fluctuate so that shares, when redeemed, may be worth more or less than their original cost. Performance less than or equal to one year is cumulative. Performance is for the stated time period only; due to market volatility, the Fund’s current performance may be lower or higher than quoted. Returns are before taxes unless otherwise noted. For performance as of the most recent month-end, please refer to www.calvert.com.
www.calvert.com CALVERT US LARGE-CAP CORE RESPONSIBLE INDEX FUND ANNUAL REPORT (Unaudited) 3
FUND PROFILE
|
| | | | | | | |
| |
| | | | | |
| | SECTOR ALLOCATION (% of total investments)5 | | | TEN LARGEST HOLDINGS (% of net assets)6 |
| | | | | | |
| | Information Technology | 25.9 | % | | Microsoft Corp. | 4.2 | % |
| | Health Care | 14.9 | % | | Apple, Inc. | 3.9 | % |
| | Financials | 14.0 | % | | Amazon.com, Inc. | 3.0 | % |
| | Consumer Discretionary | 11.1 | % | | Alphabet, Inc., Class A | 2.9 | % |
| | Industrials | 10.5 | % | | JPMorgan Chase & Co. | 1.4 | % |
| | Communication Services | 9.5 | % | | Procter & Gamble Co. (The) | 1.3 | % |
| | Consumer Staples | 7.9 | % | | Visa, Inc., Class A | 1.3 | % |
| | Utilities | 3.3 | % | | AT&T, Inc. | 1.1 | % |
| | Materials | 2.5 | % | | MasterCard, Inc., Class A | 1.1 | % |
| | Real Estate | 0.2 | % | | Bank of America Corp. | 1.1 | % |
| | Energy | 0.2 | % | | Total | 21.3 | % |
| | Total | 100.0 | % | | | |
| | | | | | |
See Endnotes and Additional Disclosures in this report.
4 www.calvert.com CALVERT US LARGE-CAP CORE RESPONSIBLE INDEX FUND ANNUAL REPORT (Unaudited)
|
| | |
| Endnotes and Additional Disclosures | | |
| |
1 | The views expressed in this report are those of the portfolio manager(s) and are current only through the date stated at the top of this page. These views are subject to change at any time based upon market or other conditions, and Eaton Vance and the Fund(s) disclaim any responsibility to update such views. These views may not be relied upon as investment advice and, because investment decisions are based on many factors, may not be relied upon as an indication of trading intent on behalf of any Calvert fund. This commentary may contain statements that are not historical facts, referred to as “forward looking statements”. The Fund’s actual future results may differ significantly from those stated in any forward looking statement, depending on factors such as changes in securities or financial markets or general economic conditions, the volume of sales and purchases of Fund shares, the continuation of investment advisory, administrative and service contracts, and other risks discussed from time to time in the Fund’s filings with the Securities and Exchange Commission. |
| |
2 | Dow Jones Industrial Average® is a price-weighted average of 30 blue-chip stocks that are generally the leaders in their industry. S&P 500® Index is an unmanaged index of large-cap stocks commonly used as a measure of U.S. stock market performance. S&P Dow Jones Indices are a product of S&P Dow Jones Indices LLC (“S&P DJI”) and have been licensed for use. S&P® and S&P 500® are registered trademarks of S&P DJI; Dow Jones® is a registered trademark of Dow Jones Trademark Holdings LLC (“Dow Jones”); S&P DJI, Dow Jones and their respective affiliates do not sponsor, endorse, sell or promote the Fund, will not have any liability with respect thereto and do not have any liability for any errors, omissions, or interruptions of the S&P Dow Jones Indices. Nasdaq Composite Index is a market capitalization-weighted index of all domestic and international securities listed on Nasdaq. Source: Nasdaq, Inc. The information is provided by Nasdaq (with its affiliates, are referred to as the “Corporations”) and Nasdaq’s third party licensors on an “as is” basis and the Corporations make no guarantees and bear no liability of any kind with respect to the information or the Fund. Russell 2000® Index is an unmanaged index of 2,000 U.S. small-cap stocks. Russell 1000® Index is an unmanaged index of U.S. large-cap stocks. Calvert US Large-Cap Core Responsible Index (the “Calvert Index”) is composed of common stocks of large companies that operate their businesses in a manner consistent with the Calvert Principles for Responsible Investment. Large companies are the 1,000 largest publicly traded U.S. companies based on market capitalization, excluding real estate investment trusts and business development companies. The Calvert Principles for Responsible Investment serve as a framework for considering environmental, social and governance factors that may affect investment performance. Stocks are weighted in the Calvert Index based on their float-adjusted market capitalization within the relevant sector, subject to certain prescribed limits. Unless otherwise stated, index returns do not reflect the effect of any applicable sales charges, commissions, expenses, taxes or leverage, as applicable. |
It is not possible to invest directly in an index.
| |
3 | Total Returns at NAV do not include applicable sales charges. If sales charges were deducted, the returns would be lower. Total Returns shown with maximum sales charge reflect the stated maximum sales charge. Unless otherwise stated, performance does not reflect the deduction of taxes on Fund distributions or redemptions of Fund shares. |
Performance prior to the inception date of a class may be linked to the performance of an older class of the Fund. This linked performance is adjusted for any applicable sales charge, but is not adjusted for class expense differences. If adjusted for such differences, the performance would be different. The performance of Class R6 is linked to Class I. Performance since inception for an index, if presented, is the performance since the Fund’s or oldest share class’ inception, as applicable. Performance presented in the Financial Highlights included in the financial statements is not linked.
Calvert Research and Management became the investment adviser to the Fund on December 31, 2016. Performance reflected prior to such date is that of the Fund’s former investment adviser.
| |
4 | Source: Fund prospectus. Net expense ratios reflect a contractual expense reimbursement that continues through 1/31/20. Without the reimbursement, performance would have been lower. The expense ratios for the current reporting period can be found in the Financial Highlights section of this report. |
| |
5 | Does not include Short Term Investment of Cash Collateral for Securities Loaned. |
6 Excludes cash and cash equivalents.
www.calvert.com CALVERT US LARGE-CAP CORE RESPONSIBLE INDEX FUND ANNUAL REPORT (Unaudited) 5
FUND EXPENSES
Example
As a Fund shareholder, you incur two types of costs: (1) transaction costs, including sales charges (loads) on purchases and redemption fees (if applicable); and (2) ongoing costs, including management fees; distribution and/or service fees; and other Fund expenses. This Example is intended to help you understand your ongoing costs (in dollars) of Fund investing and to compare these costs with the ongoing costs of investing in other mutual funds. The Example is based on an investment of $1,000 invested at the beginning of the period and held for the entire period (April 1, 2019 to September 30, 2019).
Actual Expenses
The first section of the table below provides information about actual account values and actual expenses. You may use the information in this section, together with the amount you invested, to estimate the expenses that you paid over the period. Simply divide your account value by $1,000 (for example, an $8,600 account value divided by $1,000 = 8.6), then multiply the result by the number in the first section under the heading entitled “Expenses Paid During Period” to estimate the expenses you paid on your account during this period.
Hypothetical Example for Comparison Purposes
The second section of the table below provides information about hypothetical account values and hypothetical expenses based on the actual Fund expense ratio and an assumed rate of return of 5% per year (before expenses), which is not the actual Fund return. The hypothetical account values and expenses may not be used to estimate the actual ending account balance or expenses you paid for the period. You may use this information to compare the ongoing costs of investing in the Fund and other funds. To do so, compare this 5% hypothetical example with the 5% hypothetical examples that appear in the shareholder reports of the other funds.
Please note that the expenses shown in the table are meant to highlight your ongoing costs only and do not reflect any transactional costs, such as sales charges (loads) or redemption fees (if applicable). Therefore, the second section of the table is useful in comparing ongoing costs only, and will not help you determine the relative total costs of owning different funds. In addition, if these transactional costs were included, your costs would be higher.
|
| | | | |
| | BEGINNING ACCOUNT VALUE (4/1/19) | ENDING ACCOUNT VALUE (9/30/19) | EXPENSES PAID DURING PERIOD* (4/1/19 - 9/30/19) | ANNUALIZED EXPENSE RATIO |
| Actual | | | | |
| Class A | $1,000.00 | $1,060.80 | $2.53** | 0.49% |
| Class C | $1,000.00 | $1,056.90 | $6.39** | 1.24% |
| Class I | $1,000.00 | $1,062.60 | $1.24** | 0.24% |
| Class R6 | $1,000.00 | $1,062.70 | $0.98** | 0.19% |
| Hypothetical | | | | |
| (5% return per year before expenses) | | | | |
| Class A | $1,000.00 | $1,022.61 | $2.48** | 0.49% |
| Class C | $1,000.00 | $1,018.85 | $6.28** | 1.24% |
| Class I | $1,000.00 | $1,023.87 | $1.22** | 0.24% |
| Class R6 | $1,000.00 | $1,024.12 | $0.96** | 0.19% |
| | | | | |
| * Expenses are equal to the Fund’s annualized expense ratio for the indicated Class, multiplied by the average account value over the period, multiplied by 183/365 (to reflect the one-half year period). The Example assumes that the $1,000 was invested at the net asset value per share determined at the close of business on March 31, 2019. |
| ** Absent a waiver and/or reimbursement of expenses by an affiliate, expenses would be higher. |
6 www.calvert.com CALVERT US LARGE-CAP CORE RESPONSIBLE INDEX FUND ANNUAL REPORT (Unaudited)
CALVERT US LARGE-CAP CORE RESPONSIBLE INDEX FUND
SCHEDULE OF INVESTMENTS
SEPTEMBER 30, 2019
|
| | |
| | SHARES | VALUE ($) |
| COMMON STOCKS - 99.7% | | |
| Aerospace & Defense - 0.2% | | |
| Axon Enterprise, Inc. (1)(2) | 8,766 | 497,733 |
| HEICO Corp. | 5,510 | 688,089 |
| Hexcel Corp. | 15,890 | 1,305,046 |
| Mercury Systems, Inc. (1) | 4,697 | 381,256 |
| Moog, Inc., Class A | 3,509 | 284,650 |
| | | 3,156,774 |
| | | |
| Air Freight & Logistics - 0.7% | | |
| C.H. Robinson Worldwide, Inc. | 14,418 | 1,222,358 |
| Expeditors International of Washington, Inc. | 18,762 | 1,393,829 |
| FedEx Corp. | 23,545 | 3,427,445 |
| United Parcel Service, Inc., Class B | 69,590 | 8,338,274 |
| | | 14,381,906 |
| | | |
| Airlines - 0.4% | | |
| Alaska Air Group, Inc. | 13,638 | 885,242 |
| American Airlines Group, Inc. (2) | 35,308 | 952,257 |
| Delta Air Lines, Inc. | 54,899 | 3,162,182 |
| JetBlue Airways Corp. (1) | 34,796 | 582,833 |
| SkyWest, Inc. | 3,095 | 177,653 |
| Southwest Airlines Co. | 43,466 | 2,347,599 |
| Spirit Airlines, Inc. (1) | 6,099 | 221,394 |
| United Airlines Holdings, Inc. (1) | 3,946 | 348,866 |
| | | 8,678,026 |
| | | |
| Auto Components - 0.2% | | |
| Aptiv plc | 23,255 | 2,032,952 |
| Autoliv, Inc. | 8,426 | 664,643 |
| BorgWarner, Inc. | 11,997 | 440,050 |
| Gentex Corp. | 28,406 | 782,159 |
| Lear Corp. | 3,946 | 465,234 |
| | | 4,385,038 |
| | | |
| Automobiles - 0.4% | | |
| Ford Motor Co. | 398,536 | 3,650,590 |
| Harley-Davidson, Inc. (2) | 13,937 | 501,314 |
| Tesla, Inc. (1)(2) | 12,556 | 3,024,363 |
| Thor Industries, Inc. | 4,819 | 272,948 |
| | | 7,449,215 |
www.calvert.com CALVERT US LARGE-CAP CORE RESPONSIBLE INDEX FUND ANNUAL REPORT 7
|
| | |
| | SHARES | VALUE ($) |
| COMMON STOCKS - CONT’D | | |
| Banks - 5.9% | | |
| Associated Banc-Corp. | 11,694 | 236,804 |
| BancorpSouth Bank | 6,512 | 192,820 |
| Bank of America Corp. | 719,925 | 21,000,212 |
| Bank of Hawaii Corp. | 4,302 | 369,671 |
| Bank OZK | 9,911 | 270,273 |
| BankUnited, Inc. | 9,834 | 330,619 |
| BB&T Corp. | 71,373 | 3,809,177 |
| BOK Financial Corp. | 2,812 | 222,570 |
| CenterState Bank Corp. | 8,051 | 193,103 |
| CIT Group, Inc. | 8,792 | 398,366 |
| Citigroup, Inc. | 192,087 | 13,269,370 |
| Citizens Financial Group, Inc. | 44,798 | 1,584,505 |
| Comerica, Inc. | 15,563 | 1,027,002 |
| Commerce Bancshares, Inc. (2) | 9,763 | 592,126 |
| Community Bank System, Inc. | 2,847 | 175,631 |
| Cullen/Frost Bankers, Inc. (2) | 4,870 | 431,239 |
| CVB Financial Corp. | 8,553 | 178,501 |
| East West Bancorp, Inc. | 14,887 | 659,345 |
| Fifth Third Bancorp | 72,043 | 1,972,537 |
| First Citizens BancShares, Inc., Class A | 993 | 468,249 |
| First Financial Bankshares, Inc. (2) | 12,324 | 410,759 |
| First Hawaiian, Inc. | 14,479 | 386,589 |
| First Horizon National Corp. | 28,561 | 462,688 |
| First Republic Bank | 17,775 | 1,718,843 |
| FNB Corp. | 37,284 | 429,885 |
| Glacier Bancorp, Inc. | 7,847 | 317,490 |
| Hancock Whitney Corp. | 9,530 | 364,951 |
| Home BancShares, Inc. | 11,245 | 211,350 |
| Huntington Bancshares, Inc. | 98,820 | 1,410,161 |
| IBERIABANK Corp. | 6,035 | 455,884 |
| Investors Bancorp, Inc. | 19,723 | 224,053 |
| JPMorgan Chase & Co. | 238,232 | 28,037,524 |
| KeyCorp | 101,032 | 1,802,411 |
| M&T Bank Corp. | 12,667 | 2,001,006 |
| Old National Bancorp | 11,143 | 191,715 |
| PacWest Bancorp | 12,658 | 459,992 |
| People’s United Financial, Inc. | 31,260 | 488,750 |
| Pinnacle Financial Partners, Inc. | 9,033 | 512,623 |
| PNC Financial Services Group, Inc. (The) | 40,962 | 5,741,234 |
| Popular, Inc. | 8,844 | 478,284 |
| Prosperity Bancshares, Inc. | 5,222 | 368,830 |
| Regions Financial Corp. | 97,974 | 1,549,949 |
| Signature Bank | 6,217 | 741,191 |
| Sterling Bancorp | 16,872 | 338,452 |
| SunTrust Banks, Inc. | 41,986 | 2,888,637 |
| SVB Financial Group (1) | 5,077 | 1,060,839 |
8 www.calvert.com CALVERT US LARGE-CAP CORE RESPONSIBLE INDEX FUND ANNUAL REPORT
|
| | |
| | SHARES | VALUE ($) |
| COMMON STOCKS - CONT’D | | |
| Synovus Financial Corp. | 16,695 | 597,013 |
| Texas Capital Bancshares, Inc. (1) | 3,496 | 191,056 |
| U.S. Bancorp | 155,183 | 8,587,827 |
| UMB Financial Corp. | 4,561 | 294,549 |
| Umpqua Holdings Corp. | 15,457 | 254,422 |
| United Bankshares, Inc. | 13,413 | 507,950 |
| Valley National Bancorp | 33,233 | 361,243 |
| Webster Financial Corp. | 9,519 | 446,156 |
| Western Alliance Bancorp | 10,724 | 494,162 |
| Wintrust Financial Corp. | 5,082 | 328,450 |
| Zions BanCorp NA | 19,371 | 862,397 |
| | | 113,361,435 |
| | | |
| Beverages - 1.9% | | |
| Coca-Cola Co. (The) | 344,342 | 18,745,978 |
| Coca-Cola Consolidated, Inc. | 610 | 185,361 |
| Keurig Dr Pepper, Inc. (2) | 28,208 | 770,643 |
| PepsiCo, Inc. | 124,682 | 17,093,902 |
| | | 36,795,884 |
| | | |
| Biotechnology - 3.5% | | |
| AbbVie, Inc. | 142,547 | 10,793,659 |
| ACADIA Pharmaceuticals, Inc. (1)(2) | 12,149 | 437,243 |
| Alexion Pharmaceuticals, Inc. (1) | 25,085 | 2,456,825 |
| Alkermes plc (1) | 18,104 | 353,209 |
| Allogene Therapeutics, Inc. (1)(2) | 6,714 | 182,990 |
| Alnylam Pharmaceuticals, Inc. (1) | 10,212 | 821,249 |
| Amgen, Inc. | 60,995 | 11,803,142 |
| Amicus Therapeutics, Inc. (1) | 29,607 | 237,448 |
| Biogen, Inc. (1) | 18,367 | 4,276,205 |
| BioMarin Pharmaceutical, Inc. (1) | 21,891 | 1,475,453 |
| Bluebird Bio, Inc. (1)(2) | 6,542 | 600,686 |
| Blueprint Medicines Corp. (1) | 4,297 | 315,701 |
| Celgene Corp. (1) | 80,072 | 7,951,150 |
| Exact Sciences Corp. (1)(2) | 14,931 | 1,349,314 |
| Exelixis, Inc. (1) | 31,336 | 554,177 |
| FibroGen, Inc. (1) | 7,104 | 262,706 |
| Gilead Sciences, Inc. | 131,132 | 8,311,146 |
| Global Blood Therapeutics, Inc. (1)(2) | 6,749 | 327,461 |
| Incyte Corp. (1) | 21,206 | 1,574,121 |
| Ionis Pharmaceuticals, Inc. (1)(2) | 16,092 | 964,072 |
| Neurocrine Biosciences, Inc. (1) | 10,736 | 967,421 |
| Regeneron Pharmaceuticals, Inc. (1) | 9,620 | 2,668,588 |
| Repligen Corp. (1) | 5,086 | 390,045 |
| Sage Therapeutics, Inc. (1)(2) | 6,197 | 869,377 |
| Sarepta Therapeutics, Inc. (1) | 7,708 | 580,567 |
| Seattle Genetics, Inc. (1) | 11,407 | 974,158 |
www.calvert.com CALVERT US LARGE-CAP CORE RESPONSIBLE INDEX FUND ANNUAL REPORT 9
|
| | |
| | SHARES | VALUE ($) |
| COMMON STOCKS - CONT’D | | |
| Spark Therapeutics, Inc. (1) | 4,276 | 414,687 |
| Ultragenyx Pharmaceutical, Inc. (1)(2) | 6,228 | 266,434 |
| United Therapeutics Corp. (1) | 5,771 | 460,237 |
| Vertex Pharmaceuticals, Inc. (1) | 29,947 | 5,073,621 |
| | | 67,713,092 |
| | | |
| Building Products - 0.6% | | |
| Allegion plc | 14,629 | 1,516,296 |
| Armstrong World Industries, Inc. | 4,063 | 392,892 |
| Fortune Brands Home & Security, Inc. | 13,569 | 742,224 |
| Johnson Controls International plc | 118,888 | 5,217,994 |
| Masco Corp. | 26,236 | 1,093,517 |
| Owens Corning | 24,756 | 1,564,579 |
| Trex Co., Inc. (1)(2) | 6,435 | 585,135 |
| | | 11,112,637 |
| | | |
| Capital Markets - 3.7% | | |
| Affiliated Managers Group, Inc. | 5,309 | 442,505 |
| Ameriprise Financial, Inc. | 12,203 | 1,795,061 |
| Ares Management Corp., Class A | 6,671 | 178,850 |
| Bank of New York Mellon Corp. (The) | 82,788 | 3,742,845 |
| BlackRock, Inc. | 11,797 | 5,257,215 |
| Cboe Global Markets, Inc. | 11,506 | 1,322,154 |
| Charles Schwab Corp. (The) | 101,267 | 4,235,999 |
| CME Group, Inc. | 38,422 | 8,120,105 |
| E*Trade Financial Corp. | 24,031 | 1,049,914 |
| Evercore, Inc., Class A | 4,026 | 322,483 |
| FactSet Research Systems, Inc. (2) | 3,232 | 785,279 |
| Franklin Resources, Inc. | 25,559 | 737,633 |
| Goldman Sachs Group, Inc. (The) | 31,312 | 6,488,786 |
| Houlihan Lokey, Inc. | 3,696 | 166,690 |
| Interactive Brokers Group, Inc., Class A | 5,841 | 314,129 |
| Intercontinental Exchange, Inc. | 55,808 | 5,149,404 |
| Invesco Ltd. | 40,979 | 694,184 |
| KKR & Co., Inc., Class A (2) | 52,470 | 1,408,820 |
| Lazard Ltd., Class A | 13,216 | 462,560 |
| Legg Mason, Inc. | 11,212 | 428,186 |
| LPL Financial Holdings, Inc. | 7,905 | 647,420 |
| MarketAxess Holdings, Inc. | 4,921 | 1,611,627 |
| Moody’s Corp. | 15,011 | 3,074,703 |
| Morgan Stanley | 115,304 | 4,920,022 |
| Morningstar, Inc. | 2,902 | 424,098 |
| MSCI, Inc. | 7,539 | 1,641,617 |
| Nasdaq, Inc. | 12,690 | 1,260,752 |
| Northern Trust Corp. | 20,392 | 1,902,981 |
| Raymond James Financial, Inc. | 13,162 | 1,085,339 |
| S&P Global, Inc. | 22,785 | 5,581,869 |
10 www.calvert.com CALVERT US LARGE-CAP CORE RESPONSIBLE INDEX FUND ANNUAL REPORT
|
| | |
| | SHARES | VALUE ($) |
| COMMON STOCKS - CONT’D | | |
| SEI Investments Co. | 12,840 | 760,834 |
| State Street Corp. | 28,841 | 1,707,099 |
| Stifel Financial Corp. | 6,656 | 381,921 |
| T. Rowe Price Group, Inc. | 22,364 | 2,555,087 |
| TD Ameritrade Holding Corp. | 26,111 | 1,219,384 |
| Virtu Financial, Inc., Class A (2) | 8,078 | 132,156 |
| | | 72,009,711 |
| | | |
| Chemicals - 1.5% | | |
| Air Products & Chemicals, Inc. | 28,537 | 6,331,219 |
| Axalta Coating Systems Ltd. (1) | 34,588 | 1,042,828 |
| Eastman Chemical Co. | 21,182 | 1,563,867 |
| Ecolab, Inc. | 32,892 | 6,513,932 |
| International Flavors & Fragrances, Inc. (2) | 15,745 | 1,931,754 |
| Mosaic Co. (The) | 36,384 | 745,872 |
| PPG Industries, Inc. | 36,280 | 4,299,543 |
| Sensient Technologies Corp. | 4,746 | 325,813 |
| Sherwin-Williams Co. (The) | 11,367 | 6,250,372 |
| | | 29,005,200 |
| | | |
| Commercial Services & Supplies - 0.8% | | |
| ADT, Inc. (2) | 29,389 | 184,269 |
| Cintas Corp. | 7,597 | 2,036,756 |
| Copart, Inc. (1) | 18,568 | 1,491,567 |
| IAA, Inc. (1) | 11,682 | 487,490 |
| KAR Auction Services, Inc. (2) | 11,506 | 282,472 |
| MSA Safety, Inc. | 5,497 | 599,778 |
| Republic Services, Inc. | 39,225 | 3,394,924 |
| Tetra Tech, Inc. | 9,993 | 866,993 |
| UniFirst Corp. | 1,093 | 213,266 |
| Waste Management, Inc. | 58,089 | 6,680,235 |
| | | 16,237,750 |
| | | |
| Communications Equipment - 1.3% | | |
| Arista Networks, Inc. (1) | 5,042 | 1,204,635 |
| Ciena Corp. (1) | 9,248 | 362,799 |
| Cisco Systems, Inc. | 356,615 | 17,620,347 |
| CommScope Holding Co., Inc. (1) | 15,668 | 184,256 |
| EchoStar Corp., Class A (1) | 4,037 | 159,946 |
| F5 Networks, Inc. (1) | 4,804 | 674,578 |
| Juniper Networks, Inc. | 35,129 | 869,443 |
| Lumentum Holdings, Inc. (1) | 6,465 | 346,265 |
| Motorola Solutions, Inc. | 15,147 | 2,581,200 |
| ViaSat, Inc. (1) | 5,469 | 411,925 |
| Viavi Solutions, Inc. (1) | 13,498 | 189,039 |
| | | 24,604,433 |
| | | |
www.calvert.com CALVERT US LARGE-CAP CORE RESPONSIBLE INDEX FUND ANNUAL REPORT 11
|
| | |
| | SHARES | VALUE ($) |
| COMMON STOCKS - CONT’D | | |
| Construction & Engineering - 0.1% | | |
| EMCOR Group, Inc. | 10,517 | 905,724 |
| Quanta Services, Inc. | 25,764 | 973,879 |
| | | 1,879,603 |
| | | |
| Consumer Finance - 1.0% | | |
| Ally Financial, Inc. | 38,176 | 1,265,916 |
| American Express Co. | 68,494 | 8,101,470 |
| Capital One Financial Corp. | 44,183 | 4,019,770 |
| Credit Acceptance Corp. (1) | 1,434 | 661,519 |
| Discover Financial Services | 33,202 | 2,692,350 |
| FirstCash, Inc. | 4,396 | 402,981 |
| OneMain Holdings, Inc. | 7,356 | 269,818 |
| SLM Corp. | 36,212 | 319,571 |
| Synchrony Financial | 70,300 | 2,396,527 |
| | | 20,129,922 |
| | | |
| Containers & Packaging - 0.7% | | |
| AptarGroup, Inc. | 10,511 | 1,245,028 |
| Ardagh Group S.A. | 8,520 | 133,593 |
| Avery Dennison Corp. | 15,389 | 1,747,729 |
| Ball Corp. | 58,985 | 4,294,698 |
| Berry Global Group, Inc. (1) | 17,404 | 683,455 |
| Crown Holdings, Inc. (1) | 21,320 | 1,408,399 |
| Sealed Air Corp. | 25,985 | 1,078,637 |
| Sonoco Products Co. | 17,113 | 996,148 |
| WestRock Co. | 39,077 | 1,424,357 |
| | | 13,012,044 |
| | | |
| Distributors - 0.1% | | |
| Genuine Parts Co. | 12,174 | 1,212,409 |
| LKQ Corp. (1) | 14,414 | 453,320 |
| Pool Corp. | 3,778 | 762,023 |
| | | 2,427,752 |
| | | |
| Diversified Consumer Services - 0.2% | | |
| Bright Horizons Family Solutions, Inc. (1) | 6,742 | 1,028,155 |
| Chegg, Inc. (1) | 9,213 | 275,930 |
| frontdoor, Inc. (1) | 7,418 | 360,292 |
| Graham Holdings Co., Class B | 360 | 238,842 |
| Grand Canyon Education, Inc. (1) | 4,376 | 429,723 |
| H&R Block, Inc. (2) | 16,968 | 400,784 |
| Laureate Education, Inc., Class A (1) | 11,854 | 196,480 |
| Service Corp. International | 18,074 | 864,118 |
| ServiceMaster Global Holdings, Inc. (1) | 15,248 | 852,363 |
| Strategic Education, Inc. | 1,152 | 156,534 |
| | | 4,803,221 |
12 www.calvert.com CALVERT US LARGE-CAP CORE RESPONSIBLE INDEX FUND ANNUAL REPORT
|
| | |
| | SHARES | VALUE ($) |
| COMMON STOCKS - CONT’D | | |
| Diversified Financial Services - 0.1% | | |
| AXA Equitable Holdings, Inc. | 25,484 | 564,725 |
| Jefferies Financial Group, Inc. | 9,894 | 182,050 |
| Voya Financial, Inc. | 14,284 | 777,621 |
| | | 1,524,396 |
| | | |
| Diversified Telecommunication Services - 2.3% | | |
| AT&T, Inc. | 577,200 | 21,841,248 |
| CenturyLink, Inc. | 90,097 | 1,124,410 |
| GCI Liberty, Inc., Class A (1) | 9,494 | 589,293 |
| Iridium Communications, Inc. (1) | 7,792 | 165,814 |
| Verizon Communications, Inc. | 345,059 | 20,827,761 |
| Vonage Holdings Corp. (1) | 16,186 | 182,902 |
| Zayo Group Holdings, Inc. (1) | 18,603 | 630,642 |
| | | 45,362,070 |
| | | |
| Electric Utilities - 1.4% | | |
| Alliant Energy Corp. | 45,384 | 2,447,559 |
| Avangrid, Inc. | 10,097 | 527,568 |
| Eversource Energy | 56,954 | 4,867,859 |
| NextEra Energy, Inc. | 49,891 | 11,624,104 |
| Portland General Electric Co. | 16,997 | 958,121 |
| Xcel Energy, Inc. | 88,956 | 5,772,355 |
| | | 26,197,566 |
| | | |
| Electrical Equipment - 1.1% | | |
| Acuity Brands, Inc. | 6,339 | 854,434 |
| AMETEK, Inc. | 36,527 | 3,353,909 |
| Eaton Corp. plc | 59,660 | 4,960,729 |
| Emerson Electric Co. | 82,982 | 5,548,176 |
| Generac Holdings, Inc. (1) | 10,022 | 785,123 |
| GrafTech International Ltd. (2) | 16,166 | 206,925 |
| Hubbell, Inc. | 9,714 | 1,276,420 |
| nVent Electric plc | 15,542 | 342,546 |
| Regal-Beloit Corp. | 8,124 | 591,833 |
| Rockwell Automation, Inc. | 18,697 | 3,081,266 |
| | | 21,001,361 |
| | | |
| Electronic Equipment, Instruments & Components - 0.9% | | |
| Amphenol Corp., Class A | 45,613 | 4,401,654 |
| Arrow Electronics, Inc. (1) | 6,901 | 514,677 |
| Avnet, Inc. | 7,362 | 327,499 |
| CDW Corp. | 13,425 | 1,654,497 |
| Corning, Inc. | 66,494 | 1,896,409 |
| Dolby Laboratories, Inc., Class A | 4,229 | 273,363 |
| FLIR Systems, Inc. | 12,533 | 659,110 |
| IPG Photonics Corp. (1) | 3,804 | 515,822 |
www.calvert.com CALVERT US LARGE-CAP CORE RESPONSIBLE INDEX FUND ANNUAL REPORT 13
|
| | |
| | SHARES | VALUE ($) |
| COMMON STOCKS - CONT’D | | |
| Jabil, Inc. | 15,935 | 569,995 |
| Keysight Technologies, Inc. (1) | 28,640 | 2,785,240 |
| National Instruments Corp. | 6,075 | 255,089 |
| Novanta, Inc. (1) | 4,451 | 363,736 |
| SYNNEX Corp. | 3,656 | 412,762 |
| Tech Data Corp. (1) | 2,537 | 264,457 |
| Trimble, Inc. (1) | 39,732 | 1,541,999 |
| Zebra Technologies Corp., Class A (1) | 4,426 | 913,394 |
| | | 17,349,703 |
| | | |
| Energy Equipment & Services - 0.2% | | |
| Baker Hughes, a GE Co. | 109,894 | 2,549,541 |
| National Oilwell Varco, Inc. | 68,391 | 1,449,889 |
| | | 3,999,430 |
| | | |
| Entertainment - 2.1% | | |
| Activision Blizzard, Inc. | 65,726 | 3,478,220 |
| Cinemark Holdings, Inc. | 11,916 | 460,434 |
| Electronic Arts, Inc. (1) | 26,616 | 2,603,577 |
| Liberty Formula One, Series A (1) | 3,959 | 156,737 |
| Lions Gate Entertainment Corp., Class A | 21,949 | 203,028 |
| Live Nation Entertainment, Inc. (1) | 12,666 | 840,263 |
| Madison Square Garden Co. (The), Class A (1) | 1,503 | 396,071 |
| Netflix, Inc. (1) | 38,964 | 10,427,546 |
| Take-Two Interactive Software, Inc. (1) | 9,886 | 1,239,111 |
| Viacom, Inc., Class B | 24,441 | 587,317 |
| Walt Disney Co. (The) | 152,057 | 19,816,068 |
| World Wrestling Entertainment, Inc., Class A (2) | 4,389 | 312,277 |
| Zynga, Inc., Class A (1) | 67,168 | 390,918 |
| | | 40,911,567 |
| | | |
| Food & Staples Retailing - 2.0% | | |
| BJ’s Wholesale Club Holdings, Inc. (1) | 7,691 | 198,966 |
| Casey’s General Stores, Inc. | 3,463 | 558,097 |
| Costco Wholesale Corp. | 37,023 | 10,666,697 |
| Kroger Co. (The) | 96,007 | 2,475,060 |
| Performance Food Group Co. (1) | 13,397 | 616,396 |
| Sysco Corp. | 63,342 | 5,029,355 |
| US Foods Holding Corp. (1) | 29,592 | 1,216,231 |
| Walgreens Boots Alliance, Inc. | 73,829 | 4,083,482 |
| Walmart, Inc. | 113,720 | 13,496,290 |
| | | 38,340,574 |
| | | |
| Food Products - 1.8% | | |
| Bunge Ltd. | 14,495 | 820,707 |
| Campbell Soup Co. | 19,495 | 914,705 |
| Conagra Brands, Inc. | 59,779 | 1,834,020 |
14 www.calvert.com CALVERT US LARGE-CAP CORE RESPONSIBLE INDEX FUND ANNUAL REPORT
|
| | |
| | SHARES | VALUE ($) |
| COMMON STOCKS - CONT’D | | |
| Darling Ingredients, Inc. (1) | 14,274 | 273,062 |
| Flowers Foods, Inc. | 21,301 | 492,692 |
| General Mills, Inc. | 74,526 | 4,107,873 |
| Hershey Co. (The) | 18,221 | 2,824,073 |
| Hormel Foods Corp. (2) | 32,622 | 1,426,560 |
| Ingredion, Inc. | 7,283 | 595,312 |
| J&J Snack Foods Corp. | 2,391 | 459,072 |
| JM Smucker Co. (The) | 14,447 | 1,589,459 |
| Kellogg Co. | 33,327 | 2,144,592 |
| Kraft Heinz Co. (The) | 72,745 | 2,032,132 |
| Lamb Weston Holdings, Inc. | 17,875 | 1,299,870 |
| Lancaster Colony Corp. | 2,069 | 286,867 |
| McCormick & Co., Inc. | 17,947 | 2,805,116 |
| Mondelez International, Inc., Class A | 161,094 | 8,911,720 |
| Post Holdings, Inc. (1) | 8,789 | 930,228 |
| TreeHouse Foods, Inc. (1) | 6,207 | 344,178 |
| | | 34,092,238 |
| | | |
| Gas Utilities - 0.4% | | |
| Atmos Energy Corp. | 22,073 | 2,513,894 |
| New Jersey Resources Corp. | 18,146 | 820,562 |
| ONE Gas, Inc. | 10,327 | 992,528 |
| Southwest Gas Holdings, Inc. | 10,650 | 969,576 |
| Spire, Inc. | 8,720 | 760,733 |
| UGI Corp. | 31,727 | 1,594,916 |
| | | 7,652,209 |
| | | |
| Health Care Equipment & Supplies - 4.2% | | |
| Abbott Laboratories | 169,172 | 14,154,621 |
| ABIOMED, Inc. (1) | 5,448 | 969,145 |
| Align Technology, Inc. (1) | 7,715 | 1,395,798 |
| Baxter International, Inc. | 56,952 | 4,981,591 |
| Becton Dickinson and Co. | 29,085 | 7,357,342 |
| Boston Scientific Corp. (1) | 161,174 | 6,558,170 |
| Cantel Medical Corp. | 4,075 | 304,810 |
| Cooper Cos., Inc. (The) | 5,165 | 1,534,005 |
| Danaher Corp. | 68,045 | 9,827,739 |
| DENTSPLY SIRONA, Inc. | 26,055 | 1,388,992 |
| DexCom, Inc. (1) | 12,333 | 1,840,577 |
| Edwards Lifesciences Corp. (1) | 22,820 | 5,018,346 |
| Globus Medical, Inc., Class A (1) | 7,568 | 386,876 |
| Haemonetics Corp. (1) | 6,800 | 857,752 |
| Hill-Rom Holdings, Inc. | 8,729 | 918,553 |
| Hologic, Inc. (1) | 26,454 | 1,335,662 |
| ICU Medical, Inc. (1) | 1,563 | 249,455 |
| IDEXX Laboratories, Inc. (1) | 9,464 | 2,573,545 |
| Insulet Corp. (1) | 7,106 | 1,171,993 |
www.calvert.com CALVERT US LARGE-CAP CORE RESPONSIBLE INDEX FUND ANNUAL REPORT 15
|
| | |
| | SHARES | VALUE ($) |
| COMMON STOCKS - CONT’D | | |
| Integra LifeSciences Holdings Corp. (1) | 6,514 | 391,296 |
| Intuitive Surgical, Inc. (1) | 12,478 | 6,737,246 |
| Masimo Corp. (1) | 5,720 | 851,079 |
| Merit Medical Systems, Inc. (1) | 4,384 | 133,537 |
| Neogen Corp. (1) | 8,694 | 592,148 |
| Novocure Ltd. (1) | 8,156 | 609,906 |
| NuVasive, Inc. (1) | 5,628 | 356,703 |
| Penumbra, Inc. (1)(2) | 3,195 | 429,695 |
| ResMed, Inc. | 15,561 | 2,102,447 |
| STERIS plc | 9,409 | 1,359,506 |
| Tandem Diabetes Care, Inc. (1) | 6,298 | 371,456 |
| Teleflex, Inc. | 6,121 | 2,079,610 |
| Varian Medical Systems, Inc. (1) | 9,174 | 1,092,532 |
| West Pharmaceutical Services, Inc. | 8,261 | 1,171,575 |
| | | 81,103,708 |
| | | |
| Health Care Providers & Services - 1.9% | | |
| Acadia Healthcare Co., Inc. (1) | 9,288 | 288,671 |
| Amedisys, Inc. (1) | 2,901 | 380,060 |
| Anthem, Inc. | 28,430 | 6,826,043 |
| Centene Corp. (1) | 50,594 | 2,188,696 |
| Chemed Corp. | 1,440 | 601,301 |
| Covetrus, Inc. (1)(2) | 10,663 | 126,783 |
| CVS Health Corp. | 134,392 | 8,476,103 |
| DaVita, Inc. (1) | 16,233 | 926,417 |
| Encompass Health Corp. | 11,306 | 715,444 |
| Ensign Group, Inc. (The) | 4,254 | 201,767 |
| Guardant Health, Inc. (1) | 3,357 | 214,277 |
| HCA Healthcare, Inc. | 26,318 | 3,169,214 |
| HealthEquity, Inc. (1) | 7,056 | 403,215 |
| Henry Schein, Inc. (1) | 15,409 | 978,472 |
| Humana, Inc. | 15,894 | 4,063,619 |
| Laboratory Corp. of America Holdings (1) | 10,806 | 1,815,408 |
| LHC Group, Inc. (1) | 3,446 | 391,328 |
| Molina Healthcare, Inc. (1) | 6,700 | 735,124 |
| Premier, Inc., Class A (1) | 10,424 | 301,462 |
| Quest Diagnostics, Inc. | 15,750 | 1,685,723 |
| WellCare Health Plans, Inc. (1) | 6,055 | 1,569,274 |
| | | 36,058,401 |
| | | |
| Health Care Technology - 0.3% | | |
| Cerner Corp. | 27,231 | 1,856,337 |
| Medidata Solutions, Inc. (1) | 6,358 | 581,757 |
| Omnicell, Inc. (1) | 2,768 | 200,044 |
| Teladoc Health, Inc. (1)(2) | 7,556 | 511,692 |
| Veeva Systems, Inc., Class A (1) | 14,659 | 2,238,283 |
| | | 5,388,113 |
16 www.calvert.com CALVERT US LARGE-CAP CORE RESPONSIBLE INDEX FUND ANNUAL REPORT
|
| | |
| | SHARES | VALUE ($) |
| COMMON STOCKS - CONT’D | | |
| Hotels, Restaurants & Leisure - 2.0% | | |
| Aramark | 32,018 | 1,395,344 |
| Chipotle Mexican Grill, Inc. (1) | 3,580 | 3,008,883 |
| Choice Hotels International, Inc. | 4,491 | 399,519 |
| Cracker Barrel Old Country Store, Inc. (2) | 2,829 | 460,137 |
| Darden Restaurants, Inc. | 16,473 | 1,947,438 |
| Domino’s Pizza, Inc. | 5,080 | 1,242,517 |
| Dunkin’ Brands Group, Inc. | 9,191 | 729,398 |
| Extended Stay America, Inc. | 10,727 | 157,043 |
| Hilton Worldwide Holdings, Inc. | 25,775 | 2,399,910 |
| Hyatt Hotels Corp., Class A | 3,935 | 289,891 |
| Marriott International, Inc., Class A | 24,631 | 3,063,358 |
| Marriott Vacations Worldwide Corp. | 4,782 | 495,463 |
| Planet Fitness, Inc., Class A (1) | 7,853 | 454,453 |
| Royal Caribbean Cruises Ltd. | 18,206 | 1,972,256 |
| Six Flags Entertainment Corp. | 8,945 | 454,317 |
| Starbucks Corp. | 124,209 | 10,982,560 |
| Texas Roadhouse, Inc. | 7,578 | 397,997 |
| Vail Resorts, Inc. | 3,822 | 869,734 |
| Wendy’s Co. (The) | 19,670 | 393,007 |
| Wyndham Destinations, Inc. | 9,867 | 454,079 |
| Wyndham Hotels & Resorts, Inc. | 8,011 | 414,489 |
| Yum China Holdings, Inc. | 43,020 | 1,954,399 |
| Yum! Brands, Inc. | 36,905 | 4,186,134 |
| | | 38,122,326 |
| | | |
| Household Durables - 0.4% | | |
| Helen of Troy Ltd. (1) | 1,337 | 210,791 |
| Leggett & Platt, Inc. (2) | 10,819 | 442,930 |
| Lennar Corp., Class A | 51,412 | 2,871,360 |
| Mohawk Industries, Inc. (1) | 4,997 | 619,978 |
| Newell Brands, Inc. | 40,503 | 758,216 |
| Roku, Inc. (1)(2) | 6,141 | 624,908 |
| Tempur Sealy International, Inc. (1) | 2,504 | 193,309 |
| Toll Brothers, Inc. | 27,692 | 1,136,757 |
| Whirlpool Corp. | 5,757 | 911,678 |
| | | 7,769,927 |
| | | |
| Household Products - 2.0% | | |
| Church & Dwight Co., Inc. | 22,366 | 1,682,818 |
| Clorox Co. (The) | 11,538 | 1,752,276 |
| Colgate-Palmolive Co. | 73,904 | 5,432,683 |
| Energizer Holdings, Inc. (2) | 4,550 | 198,289 |
| Kimberly-Clark Corp. | 29,135 | 4,138,627 |
| Procter & Gamble Co. (The) | 207,476 | 25,805,865 |
| Spectrum Brands Holdings, Inc. | 247 | 13,040 |
| | | 39,023,598 |
www.calvert.com CALVERT US LARGE-CAP CORE RESPONSIBLE INDEX FUND ANNUAL REPORT 17
|
| | |
| | SHARES | VALUE ($) |
| COMMON STOCKS - CONT’D | | |
| Independent Power and Renewable Electricity Producers - 0.2% | | |
| AES Corp. | 110,876 | 1,811,714 |
| Clearway Energy, Inc., Class C | 13,141 | 239,823 |
| Ormat Technologies, Inc. | 7,630 | 566,833 |
| TerraForm Power, Inc., Class A | 36,108 | 658,068 |
| | | 3,276,438 |
| | | |
| Industrial Conglomerates - 0.9% | | |
| 3M Co. | 57,545 | 9,460,398 |
| Carlisle Cos., Inc. | 12,256 | 1,783,738 |
| Roper Technologies, Inc. | 15,274 | 5,446,709 |
| | | 16,690,845 |
| | | |
| Insurance - 3.1% | | |
| Aflac, Inc. | 68,585 | 3,588,367 |
| Alleghany Corp. (1) | 1,516 | 1,209,404 |
| Allstate Corp. (The) | 31,859 | 3,462,436 |
| American Financial Group, Inc. | 7,562 | 815,562 |
| American International Group, Inc. | 86,292 | 4,806,464 |
| American National Insurance Co. | 964 | 119,276 |
| Arch Capital Group Ltd. (1) | 40,682 | 1,707,830 |
| Arthur J. Gallagher & Co. | 17,293 | 1,548,934 |
| Assurant, Inc. | 6,385 | 803,361 |
| Assured Guaranty Ltd. | 8,004 | 355,858 |
| Athene Holding Ltd., Class A (1) | 13,907 | 584,928 |
| Axis Capital Holdings Ltd. | 7,432 | 495,863 |
| Brighthouse Financial, Inc. (1) | 10,755 | 435,255 |
| Brown & Brown, Inc. | 22,047 | 795,015 |
| Cincinnati Financial Corp. | 16,059 | 1,873,604 |
| Enstar Group Ltd. (1) | 2,225 | 422,572 |
| Erie Indemnity Co., Class A | 2,468 | 458,184 |
| Everest Re Group Ltd. | 4,221 | 1,123,166 |
| Fidelity National Financial, Inc. | 25,271 | 1,122,285 |
| First American Financial Corp. | 9,087 | 536,224 |
| Globe Life, Inc. | 9,501 | 909,816 |
| Hanover Insurance Group, Inc. (The) | 4,418 | 598,816 |
| Hartford Financial Services Group, Inc. (The) | 35,626 | 2,159,292 |
| Kemper Corp. | 6,395 | 498,490 |
| Lincoln National Corp. | 18,744 | 1,130,638 |
| Marsh & McLennan Cos., Inc. | 44,616 | 4,463,831 |
| Mercury General Corp. | 2,997 | 167,472 |
| MetLife, Inc. | 76,422 | 3,604,061 |
| Old Republic International Corp. | 22,722 | 535,558 |
| Primerica, Inc. | 4,092 | 520,625 |
| Principal Financial Group, Inc. | 28,305 | 1,617,348 |
| Progressive Corp. (The) | 62,121 | 4,798,847 |
| Prudential Financial, Inc. | 34,648 | 3,116,588 |
18 www.calvert.com CALVERT US LARGE-CAP CORE RESPONSIBLE INDEX FUND ANNUAL REPORT
|
| | |
| | SHARES | VALUE ($) |
| COMMON STOCKS - CONT’D | | |
| Reinsurance Group of America, Inc. | 6,483 | 1,036,502 |
| RenaissanceRe Holdings Ltd. | 4,135 | 799,916 |
| RLI Corp. | 4,743 | 440,672 |
| Selective Insurance Group, Inc. | 4,278 | 321,663 |
| Travelers Cos., Inc. (The) | 25,345 | 3,768,548 |
| Unum Group | 11,691 | 347,456 |
| White Mountains Insurance Group Ltd. | 279 | 301,320 |
| Willis Towers Watson plc | 12,489 | 2,410,002 |
| | | 59,812,049 |
| | | |
| Interactive Media & Services - 3.1% | | |
| Alphabet, Inc., Class A (1) | 45,284 | 55,298,104 |
| ANGI Homeservices, Inc., Class A (1)(2) | 12,135 | 85,976 |
| Cargurus, Inc. (1)(2) | 4,970 | 153,822 |
| IAC/InterActiveCorp (1) | 7,196 | 1,568,512 |
| Match Group, Inc. (2) | 4,584 | 327,481 |
| TripAdvisor, Inc. (1) | 7,427 | 287,276 |
| Twitter, Inc. (1) | 67,431 | 2,778,157 |
| | | 60,499,328 |
| | | |
| Internet & Direct Marketing Retail - 3.6% | | |
| Amazon.com, Inc. (1) | 32,864 | 57,048,946 |
| Booking Holdings, Inc. (1) | 3,718 | 7,296,984 |
| eBay, Inc. | 68,036 | 2,652,043 |
| Etsy, Inc. (1) | 10,195 | 576,018 |
| Expedia Group, Inc. | 10,369 | 1,393,697 |
| GrubHub, Inc. (1)(2) | 8,404 | 472,389 |
| Qurate Retail, Inc., Class A (1) | 38,923 | 401,491 |
| Wayfair, Inc., Class A (1)(2) | 5,125 | 574,615 |
| | | 70,416,183 |
| | | |
| IT Services - 6.6% | | |
| Accenture plc, Class A | 57,223 | 11,006,844 |
| Akamai Technologies, Inc. (1) | 13,942 | 1,274,020 |
| Alliance Data Systems Corp. | 4,657 | 596,701 |
| Amdocs Ltd. | 11,580 | 765,554 |
| Automatic Data Processing, Inc. | 40,308 | 6,506,517 |
| Black Knight, Inc. (1) | 12,081 | 737,666 |
| Booz Allen Hamilton Holding Corp. | 10,840 | 769,857 |
| Broadridge Financial Solutions, Inc. | 9,488 | 1,180,592 |
| Cognizant Technology Solutions Corp., Class A | 51,470 | 3,101,840 |
| CoreLogic, Inc. (1) | 8,647 | 400,097 |
| DXC Technology Co. | 22,759 | 671,390 |
| EPAM Systems, Inc. (1) | 4,507 | 821,716 |
| Fidelity National Information Services, Inc. | 59,491 | 7,898,025 |
| Fiserv, Inc. (1) | 54,689 | 5,665,234 |
| Gartner, Inc. (1) | 9,201 | 1,315,651 |
www.calvert.com CALVERT US LARGE-CAP CORE RESPONSIBLE INDEX FUND ANNUAL REPORT 19
|
| | |
| | SHARES | VALUE ($) |
| COMMON STOCKS - CONT’D | | |
| Genpact Ltd. | 11,866 | 459,807 |
| GoDaddy, Inc., Class A (1) | 15,270 | 1,007,515 |
| International Business Machines Corp. | 73,812 | 10,733,741 |
| Jack Henry & Associates, Inc. | 6,808 | 993,764 |
| LiveRamp Holdings, Inc. (1) | 4,575 | 196,542 |
| MasterCard, Inc., Class A | 78,724 | 21,379,077 |
| MAXIMUS, Inc. | 4,457 | 344,348 |
| MongoDB, Inc. (1)(2) | 2,645 | 318,670 |
| Okta, Inc. (1) | 13,553 | 1,334,428 |
| Paychex, Inc. | 29,211 | 2,417,794 |
| PayPal Holdings, Inc. (1) | 112,829 | 11,687,956 |
| Perspecta, Inc. | 9,040 | 236,125 |
| Sabre Corp. | 30,357 | 679,845 |
| Science Applications International Corp. | 5,196 | 453,871 |
| Square, Inc., Class A (1)(2) | 27,491 | 1,703,067 |
| Twilio, Inc., Class A (1)(2) | 13,072 | 1,437,397 |
| VeriSign, Inc. (1) | 12,378 | 2,334,862 |
| Visa, Inc., Class A | 148,600 | 25,560,686 |
| WEX, Inc. (1) | 4,249 | 858,595 |
| | | 126,849,794 |
| | | |
| Leisure Products - 0.1% | | |
| Brunswick Corp. | 10,100 | 526,412 |
| Hasbro, Inc. | 9,420 | 1,118,060 |
| Mattel, Inc. (1) | 27,163 | 309,386 |
| | | 1,953,858 |
| | | |
| Life Sciences Tools & Services - 1.5% | | |
| Agilent Technologies, Inc. | 29,043 | 2,225,565 |
| Bio-Rad Laboratories, Inc., Class A (1) | 2,432 | 809,224 |
| Bio-Techne Corp. | 4,129 | 807,921 |
| Bruker Corp. | 11,873 | 521,581 |
| Charles River Laboratories International, Inc. (1) | 5,121 | 677,867 |
| Illumina, Inc. (1) | 16,087 | 4,893,987 |
| IQVIA Holdings, Inc. (1) | 19,741 | 2,948,911 |
| Mettler-Toledo International, Inc. (1) | 2,716 | 1,913,150 |
| PerkinElmer, Inc. | 13,328 | 1,135,146 |
| PRA Health Sciences, Inc. (1) | 5,992 | 594,586 |
| Syneos Health, Inc. (1) | 6,861 | 365,074 |
| Thermo Fisher Scientific, Inc. | 38,194 | 11,124,766 |
| Waters Corp. (1) | 7,935 | 1,771,330 |
| | | 29,789,108 |
| | | |
| Machinery - 3.6% | | |
| AGCO Corp. | 11,069 | 837,923 |
| Allison Transmission Holdings, Inc. | 20,806 | 978,922 |
| Caterpillar, Inc. | 57,530 | 7,266,614 |
20 www.calvert.com CALVERT US LARGE-CAP CORE RESPONSIBLE INDEX FUND ANNUAL REPORT
|
| | |
| | SHARES | VALUE ($) |
| COMMON STOCKS - CONT’D | | |
| CNH Industrial NV | 139,818 | 1,419,153 |
| Colfax Corp. (1) | 17,074 | 496,171 |
| Crane Co. | 9,033 | 728,331 |
| Cummins, Inc. | 21,282 | 3,461,943 |
| Deere & Co. | 40,127 | 6,768,622 |
| Donaldson Co., Inc. | 14,837 | 772,711 |
| Dover Corp. | 22,497 | 2,239,801 |
| Flowserve Corp. | 14,376 | 671,503 |
| Fortive Corp. | 48,674 | 3,337,090 |
| Gardner Denver Holdings, Inc. (1) | 23,835 | 674,292 |
| Gates Industrial Corp. plc (1)(2) | 17,405 | 175,268 |
| Graco, Inc. | 27,728 | 1,276,597 |
| IDEX Corp. | 12,113 | 1,985,079 |
| Illinois Tool Works, Inc. | 40,760 | 6,378,533 |
| Ingersoll-Rand plc | 38,004 | 4,682,473 |
| ITT, Inc. | 15,105 | 924,275 |
| John Bean Technologies Corp. | 3,989 | 396,626 |
| Lincoln Electric Holdings, Inc. | 6,612 | 573,657 |
| Middleby Corp. (The) (1) | 9,329 | 1,090,560 |
| Navistar International Corp. (1) | 11,202 | 314,888 |
| Nordson Corp. | 6,198 | 906,520 |
| Oshkosh Corp. | 7,265 | 550,687 |
| PACCAR, Inc. | 47,192 | 3,303,912 |
| Parker-Hannifin Corp. | 19,874 | 3,589,443 |
| Pentair plc | 20,331 | 768,512 |
| RBC Bearings, Inc. (1) | 3,034 | 503,371 |
| Rexnord Corp. (1) | 19,358 | 523,634 |
| Snap-on, Inc. (2) | 5,065 | 792,875 |
| Stanley Black & Decker, Inc. | 19,993 | 2,887,189 |
| Timken Co. (The) | 5,306 | 230,864 |
| Toro Co. (The) | 18,370 | 1,346,521 |
| WABCO Holdings, Inc. (1) | 8,427 | 1,127,111 |
| Wabtec Corp. (2) | 25,402 | 1,825,388 |
| Watts Water Technologies, Inc., Class A | 4,503 | 422,066 |
| Woodward, Inc. | 10,294 | 1,110,002 |
| Xylem, Inc. | 27,786 | 2,212,321 |
| | | 69,551,448 |
| | | |
| Media - 1.8% | | |
| Altice USA, Inc., Class A (1) | 26,506 | 760,192 |
| AMC Networks, Inc., Class A (1) | 4,417 | 217,140 |
| Cable One, Inc. | 449 | 563,360 |
| CBS Corp., Class B | 32,195 | 1,299,712 |
| Charter Communications, Inc., Class A (1) | 14,076 | 5,801,001 |
| Comcast Corp., Class A | 374,431 | 16,879,349 |
| Discovery, Inc., Class A (1)(2) | 42,746 | 1,138,326 |
| DISH Network Corp., Class A (1) | 21,025 | 716,322 |
www.calvert.com CALVERT US LARGE-CAP CORE RESPONSIBLE INDEX FUND ANNUAL REPORT 21
|
| | |
| | SHARES | VALUE ($) |
| COMMON STOCKS - CONT’D | | |
| Interpublic Group of Cos., Inc. (The) | 39,028 | 841,444 |
| Liberty Broadband Corp., Class A (1) | 15,855 | 1,657,165 |
| Liberty Latin America Ltd., Class C (1) | 10,358 | 177,070 |
| New York Times Co. (The), Class A (2) | 11,362 | 323,590 |
| Nexstar Media Group, Inc., Class A | 3,511 | 359,210 |
| Omnicom Group, Inc. | 21,943 | 1,718,137 |
| Sinclair Broadcast Group, Inc., Class A | 4,782 | 204,383 |
| Sirius XM Holdings, Inc. (2) | 148,536 | 929,093 |
| TEGNA, Inc. | 16,393 | 254,583 |
| | | 33,840,077 |
| | | |
| Metals & Mining - 0.3% | | |
| Nucor Corp. | 63,734 | 3,244,698 |
| Reliance Steel & Aluminum Co. | 14,107 | 1,405,904 |
| Steel Dynamics, Inc. | 33,493 | 998,091 |
| | | 5,648,693 |
| | | |
| Multi-Utilities - 1.1% | | |
| Ameren Corp. | 43,193 | 3,457,600 |
| CenterPoint Energy, Inc. | 91,775 | 2,769,769 |
| CMS Energy Corp. | 56,649 | 3,622,704 |
| Consolidated Edison, Inc. | 55,717 | 5,263,585 |
| Sempra Energy | 39,733 | 5,864,988 |
| | | 20,978,646 |
| | | |
| Multiline Retail - 0.5% | | |
| Dollar General Corp. | 23,007 | 3,656,733 |
| Kohl’s Corp. | 13,802 | 685,407 |
| Macy’s, Inc. (2) | 12,373 | 192,276 |
| Nordstrom, Inc. (2) | 10,531 | 354,579 |
| Ollie’s Bargain Outlet Holdings, Inc. (1)(2) | 6,247 | 366,324 |
| Target Corp. | 41,492 | 4,435,910 |
| | | 9,691,229 |
| | | |
| Personal Products - 0.2% | | |
| Coty, Inc., Class A | 19,901 | 209,160 |
| Estee Lauder Cos., Inc. (The), Class A | 18,033 | 3,587,665 |
| | | 3,796,825 |
| | | |
| Pharmaceuticals - 3.5% | | |
| Bristol-Myers Squibb Co. | 174,882 | 8,868,266 |
| Catalent, Inc. (1) | 17,091 | 814,557 |
| Elanco Animal Health, Inc. (1) | 46,754 | 1,243,189 |
| Eli Lilly & Co. | 92,925 | 10,391,803 |
| Horizon Therapeutics plc (1) | 21,295 | 579,863 |
| Jazz Pharmaceuticals plc (1) | 5,771 | 739,496 |
| Merck & Co., Inc. | 232,499 | 19,571,766 |
22 www.calvert.com CALVERT US LARGE-CAP CORE RESPONSIBLE INDEX FUND ANNUAL REPORT
|
| | |
| | SHARES | VALUE ($) |
| COMMON STOCKS - CONT’D | | |
| Nektar Therapeutics (1)(2) | 20,027 | 364,792 |
| Perrigo Co. plc | 14,795 | 826,892 |
| Pfizer, Inc. | 469,433 | 16,866,727 |
| Zoetis, Inc. | 57,454 | 7,158,194 |
| | | 67,425,545 |
| | | |
| Professional Services - 0.6% | | |
| CoStar Group, Inc. (1) | 3,526 | 2,091,623 |
| Exponent, Inc. | 4,320 | 301,968 |
| FTI Consulting, Inc. (1) | 2,673 | 283,311 |
| IHS Markit Ltd. (1) | 39,207 | 2,622,164 |
| Insperity, Inc. | 4,680 | 461,542 |
| ManpowerGroup, Inc. | 5,287 | 445,377 |
| Nielsen Holdings plc | 34,224 | 727,260 |
| Robert Half International, Inc. | 11,371 | 632,910 |
| TransUnion | 16,662 | 1,351,455 |
| TriNet Group, Inc. (1) | 3,026 | 188,187 |
| Verisk Analytics, Inc. | 15,953 | 2,522,807 |
| | | 11,628,604 |
| | | |
| Real Estate Management & Development - 0.2% | | |
| CBRE Group, Inc., Class A (1) | 58,258 | 3,088,257 |
| Jones Lang LaSalle, Inc. | 8,153 | 1,133,756 |
| | | 4,222,013 |
| | | |
| Road & Rail - 1.1% | | |
| AMERCO | 974 | 379,899 |
| Genesee & Wyoming, Inc., Class A (1) | 5,598 | 618,635 |
| JB Hunt Transport Services, Inc. | 8,786 | 972,171 |
| Kansas City Southern | 10,176 | 1,353,510 |
| Knight-Swift Transportation Holdings, Inc. | 14,062 | 510,451 |
| Landstar System, Inc. | 5,012 | 564,251 |
| Norfolk Southern Corp. | 24,887 | 4,471,198 |
| Old Dominion Freight Line, Inc. | 8,006 | 1,360,780 |
| Schneider National, Inc., Class B | 6,631 | 144,025 |
| Union Pacific Corp. | 68,075 | 11,026,788 |
| | | 21,401,708 |
| | | |
| Semiconductors & Semiconductor Equipment - 4.2% | | |
| Advanced Micro Devices, Inc. (1)(2) | 95,468 | 2,767,617 |
| Analog Devices, Inc. | 30,998 | 3,463,407 |
| Applied Materials, Inc. | 80,094 | 3,996,691 |
| Broadcom, Inc. | 33,319 | 9,198,376 |
| Cabot Microelectronics Corp. | 1,655 | 233,703 |
| Cree, Inc. (1) | 8,589 | 420,861 |
| Cypress Semiconductor Corp. | 30,257 | 706,198 |
| Entegris, Inc. | 9,992 | 470,223 |
www.calvert.com CALVERT US LARGE-CAP CORE RESPONSIBLE INDEX FUND ANNUAL REPORT 23
|
| | |
| | SHARES | VALUE ($) |
| COMMON STOCKS - CONT’D | | |
| First Solar, Inc. (1) | 6,205 | 359,952 |
| Intel Corp. | 350,766 | 18,074,972 |
| KLA Corp. | 13,373 | 2,132,325 |
| Lam Research Corp. | 11,887 | 2,747,205 |
| Marvell Technology Group Ltd. | 57,317 | 1,431,205 |
| Maxim Integrated Products, Inc. | 23,299 | 1,349,245 |
| Microchip Technology, Inc. (2) | 20,069 | 1,864,611 |
| Micron Technology, Inc. (1) | 87,172 | 3,735,320 |
| MKS Instruments, Inc. | 4,109 | 379,179 |
| Monolithic Power Systems, Inc. | 3,813 | 593,417 |
| NVIDIA Corp. | 47,171 | 8,211,056 |
| ON Semiconductor Corp. (1) | 34,257 | 658,077 |
| Qorvo, Inc. (1) | 11,581 | 858,615 |
| Silicon Laboratories, Inc. (1) | 4,605 | 512,767 |
| Skyworks Solutions, Inc. | 13,884 | 1,100,307 |
| Teradyne, Inc. | 24,927 | 1,443,523 |
| Texas Instruments, Inc. | 81,932 | 10,588,892 |
| Universal Display Corp. | 3,567 | 598,899 |
| Versum Materials, Inc. | 20,875 | 1,104,914 |
| Xilinx, Inc. | 22,847 | 2,191,027 |
| | | 81,192,584 |
| | | |
| Software - 8.5% | | |
| ACI Worldwide, Inc. (1) | 9,237 | 289,349 |
| Adobe, Inc. (1) | 44,457 | 12,281,246 |
| Alteryx, Inc., Class A (1)(2) | 7,278 | 781,875 |
| Anaplan, Inc. (1) | 12,067 | 567,149 |
| ANSYS, Inc. (1) | 6,970 | 1,542,879 |
| Appfolio, Inc., Class A (1)(2) | 1,712 | 162,880 |
| Aspen Technology, Inc. (1) | 5,924 | 729,126 |
| Autodesk, Inc. (1) | 19,058 | 2,814,867 |
| Avalara, Inc. (1) | 4,530 | 304,824 |
| Blackbaud, Inc. | 3,029 | 273,640 |
| Blackline, Inc. (1) | 3,421 | 163,558 |
| Cadence Design Systems, Inc. (1) | 22,608 | 1,493,937 |
| CDK Global, Inc. | 12,284 | 590,738 |
| Ceridian HCM Holding, Inc. (1)(2) | 4,631 | 228,632 |
| Citrix Systems, Inc. | 11,013 | 1,062,975 |
| Cornerstone OnDemand, Inc. (1) | 3,179 | 174,273 |
| Coupa Software, Inc. (1) | 4,638 | 600,946 |
| DocuSign, Inc. (1) | 9,769 | 604,896 |
| Dropbox, Inc., Class A (1) | 14,917 | 300,876 |
| Elastic NV (1) | 2,364 | 194,652 |
| Envestnet, Inc. (1) | 2,639 | 149,631 |
| Fair Isaac Corp. (1) | 2,809 | 852,588 |
| FireEye, Inc. (1) | 16,363 | 218,282 |
| Five9, Inc. (1) | 6,126 | 329,211 |
24 www.calvert.com CALVERT US LARGE-CAP CORE RESPONSIBLE INDEX FUND ANNUAL REPORT
|
| | |
| | SHARES | VALUE ($) |
| COMMON STOCKS - CONT’D | | |
| Fortinet, Inc. (1) | 12,744 | 978,229 |
| Guidewire Software, Inc. (1) | 7,502 | 790,561 |
| HubSpot, Inc. (1) | 3,234 | 490,307 |
| Intuit, Inc. | 25,218 | 6,706,475 |
| j2 Global, Inc. (2) | 2,902 | 263,560 |
| LogMeIn, Inc. | 4,385 | 311,160 |
| Manhattan Associates, Inc. (1) | 4,472 | 360,756 |
| Microsoft Corp. | 584,338 | 81,240,512 |
| New Relic, Inc. (1) | 3,504 | 215,321 |
| Nuance Communications, Inc. (1) | 22,461 | 366,339 |
| Nutanix, Inc., Class A (1) | 16,036 | 420,945 |
| Oracle Corp. | 194,412 | 10,698,492 |
| Palo Alto Networks, Inc. (1) | 7,867 | 1,603,531 |
| Paycom Software, Inc. (1) | 4,649 | 973,919 |
| Paylocity Holding Corp. (1) | 2,429 | 237,022 |
| Pegasystems, Inc. | 2,109 | 143,517 |
| Pivotal Software, Inc., Class A (1) | 16,181 | 241,420 |
| Pluralsight, Inc., Class A (1)(2) | 7,011 | 117,750 |
| Proofpoint, Inc. (1) | 4,752 | 613,246 |
| PTC, Inc. (1) | 9,542 | 650,574 |
| Q2 Holdings, Inc. (1) | 2,531 | 199,620 |
| Qualys, Inc. (1) | 2,286 | 172,753 |
| RealPage, Inc. (1) | 6,906 | 434,111 |
| RingCentral, Inc., Class A (1) | 6,882 | 864,792 |
| salesforce.com, Inc. (1) | 78,583 | 11,664,860 |
| ServiceNow, Inc. (1) | 16,880 | 4,284,988 |
| Smartsheet, Inc., Class A (1) | 5,333 | 192,148 |
| SolarWinds Corp. (1)(2) | 9,749 | 179,869 |
| Splunk, Inc. (1) | 13,561 | 1,598,299 |
| SS&C Technologies Holdings, Inc. | 17,509 | 902,939 |
| Symantec Corp. | 53,220 | 1,257,589 |
| Synopsys, Inc. (1) | 13,277 | 1,822,268 |
| Teradata Corp. (1) | 8,463 | 262,353 |
| Trade Desk, Inc. (The), Class A (1)(2) | 2,950 | 553,272 |
| Tyler Technologies, Inc. (1) | 3,418 | 897,225 |
| Verint Systems, Inc. (1) | 7,164 | 306,476 |
| VMware, Inc., Class A | 7,735 | 1,160,714 |
| Workday, Inc., Class A (1) | 14,651 | 2,490,084 |
| Zendesk, Inc. (1) | 9,745 | 710,216 |
| Zscaler, Inc. (1)(2) | 4,729 | 223,492 |
| | | 164,314,734 |
| | | |
| Specialty Retail - 2.7% | | |
| Aaron’s, Inc. | 3,241 | 208,267 |
| Advance Auto Parts, Inc. | 3,951 | 653,495 |
| American Eagle Outfitters, Inc. | 11,161 | 181,031 |
| AutoNation, Inc. (1) | 4,233 | 214,613 |
www.calvert.com CALVERT US LARGE-CAP CORE RESPONSIBLE INDEX FUND ANNUAL REPORT 25
|
| | |
| | SHARES | VALUE ($) |
| COMMON STOCKS - CONT’D | | |
| AutoZone, Inc. (1) | 2,062 | 2,236,486 |
| Best Buy Co., Inc. | 20,954 | 1,445,616 |
| Burlington Stores, Inc. (1) | 5,663 | 1,131,581 |
| CarMax, Inc. (1)(2) | 14,240 | 1,253,120 |
| Dick’s Sporting Goods, Inc. (2) | 8,261 | 337,131 |
| Five Below, Inc. (1) | 4,724 | 595,696 |
| Floor & Decor Holdings, Inc., Class A (1)(2) | 4,638 | 237,234 |
| Foot Locker, Inc. | 4,778 | 206,219 |
| Gap, Inc. (The) (2) | 16,734 | 290,502 |
| Home Depot, Inc. (The) | 89,347 | 20,730,291 |
| L Brands, Inc. | 17,311 | 339,123 |
| Lowe’s Cos., Inc. | 62,390 | 6,860,404 |
| O’Reilly Automotive, Inc. (1) | 5,665 | 2,257,559 |
| Penske Automotive Group, Inc. | 4,934 | 233,280 |
| Ross Stores, Inc. | 30,094 | 3,305,826 |
| Tiffany & Co. (2) | 6,517 | 603,670 |
| TJX Cos., Inc. (The) | 94,924 | 5,291,064 |
| Tractor Supply Co. | 10,995 | 994,388 |
| Ulta Beauty, Inc. (1) | 4,940 | 1,238,211 |
| Williams-Sonoma, Inc. (2) | 7,909 | 537,654 |
| | | 51,382,461 |
| | | |
| Technology Hardware, Storage & Peripherals - 4.4% | | |
| Apple, Inc. | 333,465 | 74,686,156 |
| Dell Technologies, Class C (1) | 13,809 | 716,135 |
| Hewlett Packard Enterprise Co. | 125,058 | 1,897,130 |
| HP, Inc. | 130,619 | 2,471,312 |
| NCR Corp. (1) | 10,633 | 335,577 |
| NetApp, Inc. | 14,578 | 765,491 |
| Pure Storage, Inc., Class A (1) | 16,198 | 274,394 |
| Seagate Technology plc | 23,612 | 1,270,089 |
| Western Digital Corp. | 26,392 | 1,574,019 |
| Xerox Holdings Corp. (1) | 19,442 | 581,510 |
| | | 84,571,813 |
| | | |
| Textiles, Apparel & Luxury Goods - 0.8% | | |
| Capri Holdings Ltd. (1) | 5,972 | 198,031 |
| Carter’s, Inc. | 4,899 | 446,838 |
| Columbia Sportswear Co. | 2,163 | 209,573 |
| Deckers Outdoor Corp. (1) | 2,041 | 300,762 |
| Hanesbrands, Inc. (2) | 29,803 | 456,582 |
| lululemon Athletica, Inc. (1) | 9,975 | 1,920,487 |
| NIKE, Inc., Class B | 77,418 | 7,271,099 |
| PVH Corp. | 2,960 | 261,161 |
| Ralph Lauren Corp. | 4,242 | 404,984 |
| Skechers U.S.A., Inc., Class A (1) | 10,572 | 394,864 |
| Tapestry, Inc. | 11,888 | 309,682 |
26 www.calvert.com CALVERT US LARGE-CAP CORE RESPONSIBLE INDEX FUND ANNUAL REPORT
|
| | |
| | SHARES | VALUE ($) |
| COMMON STOCKS - CONT’D | | |
| Under Armour, Inc., Class A (1)(2) | 30,460 | 607,372 |
| VF Corp. | 27,162 | 2,417,146 |
| | | 15,198,581 |
| | | |
| Thrifts & Mortgage Finance - 0.1% | | |
| Essent Group Ltd. | 10,766 | 513,215 |
| LendingTree, Inc. (1)(2) | 587 | 182,222 |
| MGIC Investment Corp. | 26,159 | 329,080 |
| New York Community Bancorp, Inc. | 45,259 | 568,001 |
| Radian Group, Inc. | 17,030 | 388,965 |
| TFS Financial Corp. (2) | 9,601 | 173,010 |
| | | 2,154,493 |
| | | |
| Trading Companies & Distributors - 0.3% | | |
| Air Lease Corp. | 11,709 | 489,670 |
| Fastenal Co. | 37,334 | 1,219,702 |
| HD Supply Holdings, Inc. (1) | 29,300 | 1,147,828 |
| MSC Industrial Direct Co., Inc., Class A | 7,733 | 560,874 |
| United Rentals, Inc. (1) | 9,177 | 1,143,821 |
| Univar Solutions, Inc. (1) | 22,702 | 471,294 |
| W.W. Grainger, Inc. | 2,755 | 818,648 |
| | | 5,851,837 |
| | | |
| Transportation Infrastructure - 0.0% (3) | | |
| Macquarie Infrastructure Corp. | 6,335 | 250,042 |
| | | |
| Water Utilities - 0.3% | | |
| American Water Works Co., Inc. | 34,143 | 4,241,585 |
| Aqua America, Inc. | 36,602 | 1,640,867 |
| | | 5,882,452 |
| | | |
| Wireless Telecommunication Services - 0.1% | | |
| Sprint Corp. (1) | 48,672 | 300,306 |
| T-Mobile US, Inc. (1) | 27,430 | 2,160,661 |
| Telephone & Data Systems, Inc. | 5,570 | 143,706 |
| United States Cellular Corp. (1) | 3,730 | 140,174 |
| | | 2,744,847 |
| | | |
| Total Common Stocks (Cost $1,484,874,202) | | 1,926,057,065 |
|
| | |
| SHORT TERM INVESTMENT OF CASH COLLATERAL FOR SECURITIES LOANED - 0.3% | | |
| State Street Navigator Securities Lending Government Money Market Portfolio, 2.07% | 5,583,767 | 5,583,767 |
| | | |
| Total Short Term Investment of Cash Collateral for Securities Loaned (Cost $5,583,767) | | 5,583,767 |
| | | |
| | | |
| TOTAL INVESTMENTS (Cost $1,490,457,969) - 100.0% | | 1,931,640,832 |
| Other assets and liabilities, net - (0.0%) (3) | | (139,256) |
NET ASSETS - 100.0% | | 1,931,501,576 |
www.calvert.com CALVERT US LARGE-CAP CORE RESPONSIBLE INDEX FUND ANNUAL REPORT 27
|
|
| NOTES TO SCHEDULE OF INVESTMENTS |
| (1) Non-income producing security. |
| (2) All or a portion of this security was on loan at September 30, 2019. The aggregate market value of securities on loan at September 30, 2019 was $41,217,135. |
| (3) Amount is less than 0.05% or (0.05)%, as applicable. |
| See notes to financial statements. |
28 www.calvert.com CALVERT US LARGE-CAP CORE RESPONSIBLE INDEX FUND ANNUAL REPORT
CALVERT US LARGE-CAP CORE RESPONSIBLE INDEX FUND
STATEMENT OF ASSETS AND LIABILITIES
SEPTEMBER 30, 2019
|
| | | |
| ASSETS | |
Investments in securities of unaffiliated issuers, at value (identified cost $1,490,457,969) - including $41,217,135 of securities on loan |
| $1,931,640,832 |
|
| Cash | 5,295,963 |
|
| Receivable for capital shares sold | 3,807,129 |
|
| Dividends and interest receivable | 1,320,360 |
|
| Securities lending income receivable | 6,117 |
|
| Receivable from affiliate | 166,359 |
|
| Directors’ deferred compensation plan | 682,070 |
|
| Other assets | 63,015 |
|
| Total assets | 1,942,981,845 |
|
| | |
| LIABILITIES | |
| Payable for capital shares redeemed | 4,248,766 |
|
| Deposits for securities loaned | 5,583,767 |
|
| Payable to affiliates: | |
| Investment advisory fee | 190,419 |
|
| Administrative fee | 190,419 |
|
| Distribution and service fees | 113,313 |
|
| Sub-transfer agency fee | 17,362 |
|
| Directors’ deferred compensation plan | 682,070 |
|
| Accrued expenses | 454,153 |
|
| Total liabilities | 11,480,269 |
|
| NET ASSETS |
| $1,931,501,576 |
|
| | |
| NET ASSETS CONSIST OF: | |
| Paid-in capital applicable to common stock | |
| (75,000,000 shares per class of $0.01 par value authorized) |
| $1,499,313,234 |
|
| Distributable earnings | 432,188,342 |
|
| Total |
| $1,931,501,576 |
|
| | |
| NET ASSET VALUE PER SHARE | |
| Class A (based on net assets of $321,690,088 and 12,974,942 shares outstanding) |
| $24.79 |
|
| Class C (based on net assets of $57,166,629 and 2,462,858 shares outstanding) |
| $23.21 |
|
| Class I (based on net assets of $1,143,303,548 and 44,911,986 shares outstanding) |
| $25.46 |
|
| Class R6 (based on net assets of $409,341,311 and 16,092,430 shares outstanding) |
| $25.44 |
|
| | |
| OFFERING PRICE PER SHARE* | |
| Class A (100/95.25 of net asset value per share) |
| $26.03 |
|
| * On sales of $50,000 or more, the offering price of Class A shares is reduced. | |
| See notes to financial statements. |
www.calvert.com CALVERT US LARGE-CAP CORE RESPONSIBLE INDEX FUND ANNUAL REPORT 29
CALVERT US LARGE-CAP CORE RESPONSIBLE INDEX FUND
STATEMENT OF OPERATIONS
YEAR ENDED SEPTEMBER 30, 2019
|
| | | |
| INVESTMENT INCOME | |
| Dividend income (net of foreign taxes withheld of $1,733) |
| $28,108,772 |
|
| Interest income | 87,241 |
|
| Securities lending income, net | 97,543 |
|
| Total investment income | 28,293,556 |
|
| | |
| EXPENSES | |
| Investment advisory fee | 2,087,362 |
|
| Administrative fee | 1,947,365 |
|
| Distribution and service fees: | |
| Class A | 731,918 |
|
| Class C | 560,649 |
|
| Directors’ fees and expenses | 97,902 |
|
| Custodian fees | 83,065 |
|
| Transfer agency fees and expenses | 942,407 |
|
| Accounting fees | 325,050 |
|
| Professional fees | 125,016 |
|
| Registration fees | 139,800 |
|
| Reports to shareholders | 61,875 |
|
| Miscellaneous | 104,878 |
|
| Total expenses | 7,207,287 |
|
| Waiver and/or reimbursement of expenses by affiliates | (2,220,961) |
|
| Reimbursement of expenses-other | (40,371) |
|
| Net expenses | 4,945,955 |
|
| Net investment income | 23,347,601 |
|
| | |
| | |
| REALIZED AND UNREALIZED GAIN (LOSS) | |
| Net realized loss on investment securities | (12,567,412) |
|
| | |
| Net change in unrealized appreciation (depreciation) on investment securities | 82,987,543 |
|
| | |
| Net realized and unrealized gain | 70,420,131 |
|
| | |
| Net increase in net assets resulting from operations |
| $93,767,732 |
|
| | |
| See notes to financial statements. |
30 www.calvert.com CALVERT US LARGE-CAP CORE RESPONSIBLE INDEX FUND ANNUAL REPORT
CALVERT US LARGE-CAP CORE RESPONSIBLE INDEX FUND
STATEMENTS OF CHANGES IN NET ASSETS
|
| | | | | | | |
| INCREASE (DECREASE) IN NET ASSETS | Year Ended September 30, 2019 | | Year Ended September 30, 2018 |
| Operations: | | | |
| Net investment income |
| $23,347,601 |
| |
| $15,623,324 |
|
| Net realized gain (loss) | (12,567,412) |
| | 40,238,078 |
|
| Net change in unrealized appreciation (depreciation) | 82,987,543 |
| | 129,722,123 |
|
| Net increase in net assets resulting from operations | 93,767,732 |
| | 185,583,525 |
|
| | | | |
| Distributions to shareholders: | | | |
| Class A shares | (10,046,100) |
| | (5,903,213) |
|
| Class C shares | (1,863,717) |
| | (886,272) |
|
| Class I shares | (34,899,222) |
| | (14,198,777) |
|
| Class R6 shares | (7,520,553) |
| | (2,429,582) |
|
| Total distributions to shareholders | (54,329,592) |
| | (23,417,844) |
|
| | | | |
| Capital share transactions: | | | |
| Class A shares | 25,897,552 |
| | (12,287,621) |
|
| Class C shares | (4,368,090) |
| | 2,722,942 |
|
| Class I shares | 211,002,163 |
| | 279,927,291 |
|
Class R6 shares (1) | 212,488,537 |
| | 158,817,675 |
|
Class Y shares (2) | — |
| | (98,789,579) |
|
| Net increase in net assets from capital share transactions | 445,020,162 |
| | 330,390,708 |
|
| | | | |
| TOTAL INCREASE IN NET ASSETS | 484,458,302 |
| | 492,556,389 |
|
| | | | |
| | | | |
| NET ASSETS | | | |
| Beginning of year | 1,447,043,274 |
| | 954,486,885 |
|
| End of year |
| $1,931,501,576 |
| |
| $1,447,043,274 |
|
| | | | |
(1) For the period from the commencement of operations, October 3, 2017 to September 30, 2018. |
(2) Effective December 8, 2017, Class Y shares of the Fund converted to Class I shares at net asset value. Thereafter, Class Y shares were terminated. |
| See notes to financial statements. |
www.calvert.com CALVERT US LARGE-CAP CORE RESPONSIBLE INDEX FUND ANNUAL REPORT 31
CALVERT US LARGE-CAP CORE RESPONSIBLE INDEX FUND
FINANCIAL HIGHLIGHTS
|
| | | | | | | | | | | | | | | |
| | Year Ended September 30, | |
| CLASS A SHARES | 2019 | | 2018 | | 2017 | | 2016 | | 2015 | |
| Net asset value, beginning | $24.66 | | $21.41 | | $18.80 | | $17.90 | | $18.30 | |
| Income from investment operations: | | | | | | | | | | |
Net investment income (1) | 0.29 |
| | 0.27 |
| | 0.30 |
| | 0.26 |
| | 0.23 |
| |
| Net realized and unrealized gain (loss) | 0.69 |
| | 3.46 |
| | 2.95 |
| | 1.94 |
| | (0.01) |
| |
| Total from investment operations | 0.98 |
| | 3.73 |
| | 3.25 |
| | 2.20 |
| | 0.22 |
| |
| Distributions from: | | | | | | | | | | |
| Net investment income | (0.22) |
| | (0.25) |
| | (0.22) |
| | (0.18) |
| | (0.13) |
| |
| Net realized gain | (0.63) |
| | (0.23) |
| | (0.42) |
| | (1.12) |
| | (0.49) |
| |
| Total distributions | (0.85) |
| | (0.48) |
| | (0.64) |
| | (1.30) |
| | (0.62) |
| |
| Total increase (decrease) in net asset value | 0.13 |
| | 3.25 |
| | 2.61 |
| | 0.90 |
| | (0.40) |
| |
| Net asset value, ending | $24.79 | | $24.66 | | $21.41 | | $18.80 | | $17.90 | |
Total return (2) | 4.33 | % | | 17.67 | % | | 17.71 | % | | 12.68 | % | | 1.06 | % | |
Ratios to average net assets: (3) | | | | | | | | | | |
| Total expenses | 0.62 | % | | 0.65 | % | | 0.70 | % | | 0.71 | % | | 0.77 | % | |
| Net expenses | 0.51 | % | | 0.54 | % | | 0.54 | % | | 0.54 | % | | 0.68 | % | |
| Net investment income | 1.24 | % | | 1.19 | % | | 1.51 | % | | 1.46 | % | | 1.21 | % | |
| Portfolio turnover | 17 | % | | 28 | % | | 31 | % | | 27 | % | | 33 | % | |
| Net assets, ending (in thousands) | $321,690 | | $291,891 | | $264,814 | | $319,773 | | $269,684 | |
| | | | | | | | | | | |
(1) Computed using average shares outstanding. |
(2) Returns are historical and are calculated by determining the percentage change in net asset value with all distributions reinvested and do not reflect the effect of sales charges, if any. |
(3) Total expenses do not reflect amounts reimbursed and/or waived by the adviser and certain of its affiliates, if applicable. Net expenses are net of all reductions and represent the net expenses paid by the Fund. |
| See notes to financial statements. |
32 www.calvert.com CALVERT US LARGE-CAP CORE RESPONSIBLE INDEX FUND ANNUAL REPORT
CALVERT US LARGE-CAP CORE RESPONSIBLE INDEX FUND
FINANCIAL HIGHLIGHTS
|
| | | | | | | | | | | | | | | |
| | Year Ended September 30, | |
| CLASS C SHARES | 2019 | | 2018 | | 2017 | | 2016 | | 2015 | |
| Net asset value, beginning | $23.16 | | $20.16 | | $17.71 | | $16.97 | | $17.41 | |
| Income from investment operations: | | | | | | | | | | |
Net investment income (1) | 0.11 |
| | 0.09 |
| | 0.15 |
| | 0.12 |
| | 0.08 |
| |
| Net realized and unrealized gain | 0.64 |
| | 3.26 |
| | 2.78 |
| | 1.82 |
| | — |
| (2) |
| Total from investment operations | 0.75 |
| | 3.35 |
| | 2.93 |
| | 1.94 |
| | 0.08 |
| |
| Distributions from: | | | | | | | | | | |
| Net investment income | (0.07) |
| | (0.12) |
| | (0.06) |
| | (0.08) |
| | (0.03) |
| |
| Net realized gain | (0.63) |
| | (0.23) |
| | (0.42) |
| | (1.12) |
| | (0.49) |
| |
| Total distributions | (0.70) |
| | (0.35) |
| | (0.48) |
| | (1.20) |
| | (0.52) |
| |
| Total increase (decrease) in net asset value | 0.05 |
| | 3.00 |
| | 2.45 |
| | 0.74 |
| | (0.44) |
| |
| Net asset value, ending | $23.21 | | $23.16 | | $20.16 | | $17.71 | | $16.97 | |
Total return (3) | 3.55 | % | | 16.79 | % | | 16.85 | % | | 11.78 | % | | 0.30 | % | |
Ratios to average net assets: (4) | | | | | | | | | | |
| Total expenses | 1.38 | % | | 1.40 | % | | 1.50 | % | | 1.53 | % | | 1.57 | % | |
| Net expenses | 1.26 | % | | 1.29 | % | | 1.29 | % | | 1.29 | % | | 1.44 | % | |
| Net investment income | 0.49 | % | | 0.44 | % | | 0.77 | % | | 0.70 | % | | 0.45 | % | |
| Portfolio turnover | 17 | % | | 28 | % | | 31 | % | | 27 | % | | 33 | % | |
| Net assets, ending (in thousands) | $57,167 | | $61,814 | | $51,301 | | $43,579 | | $36,398 | |
| | | | | | | | | | | |
(1) Computed using average shares outstanding. |
(2) Amount is less than $0.005. |
(3) Returns are historical and are calculated by determining the percentage change in net asset value with all distributions reinvested and do not reflect the effect of sales charges, if any. |
(4) Total expenses do not reflect amounts reimbursed and/or waived by the adviser and certain of its affiliates, if applicable. Net expenses are net of all reductions and represent the net expenses paid by the Fund. |
| See notes to financial statements. |
www.calvert.com CALVERT US LARGE-CAP CORE RESPONSIBLE INDEX FUND ANNUAL REPORT 33
CALVERT US LARGE-CAP CORE RESPONSIBLE INDEX FUND
FINANCIAL HIGHLIGHTS
|
| | | | | | | | | | | | | | | |
| | Year Ended September 30, | |
| CLASS I SHARES | 2019 | | 2018 | | 2017 | | 2016 | | 2015 | |
| Net asset value, beginning | $25.29 | | $21.94 | | $19.26 | | $18.33 | | $18.69 | |
| Income from investment operations: | | | | | | | | | | |
Net investment income (1) | 0.36 |
| | 0.36 |
| | 0.38 |
| | 0.33 |
| | 0.33 |
| |
| Net realized and unrealized gain (loss) | 0.72 |
| | 3.54 |
| | 3.03 |
| | 1.98 |
| | (0.01) |
| |
| Total from investment operations | 1.08 |
| | 3.90 |
| | 3.41 |
| | 2.31 |
| | 0.32 |
| |
| Distributions from: | | | | | | | | | | |
| Net investment income | (0.28) |
| | (0.32) |
| | (0.31) |
| | (0.26) |
| | (0.19) |
| |
| Net realized gain | (0.63) |
| | (0.23) |
| | (0.42) |
| | (1.12) |
| | (0.49) |
| |
| Total distributions | (0.91) |
| | (0.55) |
| | (0.73) |
| | (1.38) |
| | (0.68) |
| |
| Total increase (decrease) in net asset value | 0.17 |
| | 3.35 |
| | 2.68 |
| | 0.93 |
| | (0.36) |
| |
| Net asset value, ending | $25.46 | | $25.29 | | $21.94 | | $19.26 | | $18.33 | |
Total return (2) | 4.68 | % | | 18.06 | % | | 18.17 | % | | 13.00 | % | | 1.54 | % | |
Ratios to average net assets: (3) | | | | | | | | | | |
| Total expenses | 0.37 | % | | 0.41 | % | | 0.35 | % | | 0.36 | % | | 0.36 | % | |
| Net expenses | 0.22 | % | | 0.19 | % | | 0.19 | % | | 0.19 | % | | 0.20 | % | |
| Net investment income | 1.52 | % | | 1.53 | % | | 1.87 | % | | 1.80 | % | | 1.69 | % | |
| Portfolio turnover | 17 | % | | 28 | % | | 31 | % | | 27 | % | | 33 | % | |
| Net assets, ending (in thousands) | $1,143,304 | | $920,394 | | $544,751 | | $387,043 | | $186,257 | |
| | | | | | | | | | | |
(1) Computed using average shares outstanding. |
(2) Returns are historical and are calculated by determining the percentage change in net asset value with all distributions reinvested and do not reflect the effect of sales charges, if any. |
(3) Total expenses do not reflect amounts reimbursed and/or waived by the adviser and certain of its affiliates, if applicable. Net expenses are net of all reductions and represent the net expenses paid by the Fund. |
| See notes to financial statements. |
34 www.calvert.com CALVERT US LARGE-CAP CORE RESPONSIBLE INDEX FUND ANNUAL REPORT
CALVERT US LARGE-CAP CORE RESPONSIBLE INDEX FUND
FINANCIAL HIGHLIGHTS
|
| | | | | | | |
| | Year Ended September 30, 2019 | | Period Ended September 30, 2018 (1) | | |
| CLASS R6 SHARES | | | |
| Net asset value, beginning | $25.28 | | $22.09 | | |
| Income from investment operations: | | | | | |
Net investment income (2) | 0.37 |
| | 0.37 |
| | |
| Net realized and unrealized gain | 0.72 |
| | 3.37 |
| | |
| Total from investment operations | 1.09 |
| | 3.74 |
| | |
| Distributions from: | | | | | |
| Net investment income | (0.30) |
| | (0.32) |
| | |
| Net realized gain | (0.63) |
| | (0.23) |
| | |
| Total distributions | (0.93) |
| | (0.55) |
| | |
| Total increase in net asset value | 0.16 |
| | 3.19 |
| | |
| Net asset value, ending | $25.44 | | $25.28 | | |
Total return (3) | 4.70 | % | | 17.21 | % | (4) | |
Ratios to average net assets: (5) | | | | | |
| Total expenses | 0.32 | % | | 0.35 | % | (6) | |
| Net expenses | 0.19 | % | | 0.19 | % | (6) | |
| Net investment income | 1.55 | % | | 1.58 | % | (6) | |
| Portfolio turnover | 17 | % | | 28 | % | (7) | |
| Net assets, ending (in thousands) | $409,341 | | $172,944 | | |
| | | | | | |
(1) For the period from the commencement of operations, October 3, 2017, to September 30, 2018. |
(2) Computed using average shares outstanding. |
(3) Returns are historical and are calculated by determining the percentage change in net asset value with all distributions reinvested and do not reflect the effect of sales charges, if any. |
(4) Not annualized. |
(5) Total expenses do not reflect amounts reimbursed and/or waived by the adviser and certain of its affiliates, if applicable. Net expenses are net of all reductions and represent the net expenses paid by the Fund. |
(6) Annualized. |
(7) For the year ended September 30, 2018. |
| See notes to financial statements. |
www.calvert.com CALVERT US LARGE-CAP CORE RESPONSIBLE INDEX FUND ANNUAL REPORT 35
NOTES TO FINANCIAL STATEMENTS
NOTE 1 — SIGNIFICANT ACCOUNTING POLICIES
Calvert US Large-Cap Core Responsible Index Fund (the Fund) is a diversified series of Calvert Responsible Index Series, Inc. (the Corporation). The Corporation is a Maryland corporation registered under the Investment Company Act of 1940, as amended (the 1940 Act), as an open-end management investment company. The investment objective of the Fund is to seek to track the performance of the Calvert US Large-Cap Core Responsible Index which measures the investment return of large-capitalization stocks.
The Fund offers four classes of shares. Class A shares are generally sold subject to a sales charge imposed at time of purchase. A contingent deferred sales charge of 0.25% may apply to certain redemptions of Class A shares for accounts for which no sales charge was paid, if redeemed within 12 months of purchase. Class C shares are sold without a front-end sales charge, and with certain exceptions, are charged a contingent deferred sales charge of 1% on shares redeemed within 12 months of purchase. Class C shares are only available for purchase through a financial intermediary. Effective January 25, 2019, Class C shares generally automatically convert to Class A shares ten years after their purchase as described in the Fund’s prospectus. Class I and Class R6 shares are sold at net asset value, are not subject to a sales charge and are sold only to certain eligible investors. Each class represents a pro rata interest in the Fund, but votes separately on class-specific matters and is subject to different expenses.
The Fund applies the accounting and reporting guidance in the Financial Accounting Standards Board (FASB) Accounting Standards Codification Topic 946, Financial Services – Investment Companies (ASC 946). Subsequent events, if any, through the date that the financial statements were issued have been evaluated in the preparation of the financial statements.
A. Investment Valuation: Net asset value per share is determined every business day as of the close of the regular session of the New York Stock Exchange (generally 4:00 p.m. Eastern time). The Fund uses independent pricing services approved by the Board of Directors (the Board) to value its investments wherever possible. Investments for which market quotations are not available or deemed not reliable are fair valued in good faith under the direction of the Board.
U.S. generally accepted accounting principles (U.S. GAAP) establishes a disclosure hierarchy that categorizes the inputs to valuation techniques used to value assets and liabilities at measurement date. These inputs are summarized in the three broad levels listed below:
Level 1 - quoted prices in active markets for identical securities
Level 2 - other significant observable inputs (including quoted prices for similar securities, interest rates, prepayment speeds, credit risk, etc.)
Level 3 - significant unobservable inputs (including the Fund’s own assumptions in determining the fair value of investments)
The inputs or methodologies used for valuing securities are not necessarily an indication of the risk associated with investing in those securities.
Valuation techniques used to value the Fund’s investments by major category are as follows:
Equity Securities. Equity securities (including warrants and rights) listed on a U.S. securities exchange generally are valued at the last sale or closing price as reported by an independent pricing service on the primary market or exchange on which they are traded and are categorized as Level 1 in the hierarchy. Equity securities listed on the NASDAQ Global or Global Select Market are valued at the NASDAQ official closing price and are categorized as Level 1 in the hierarchy. Unlisted or listed securities for which closing sales prices or closing quotations are not available are valued at the mean between the latest available bid and ask prices and are categorized as Level 2 in the hierarchy.
Other Securities. Investments in registered investment companies (including money market funds) that do not trade on an exchange are valued at the net asset value per share on the valuation day and are categorized as Level 1 in the hierarchy.
Fair Valuation. If a market value cannot be determined for a security using the methodologies described above, or if, in the good faith opinion of the Fund’s adviser, the market value does not constitute a readily available market quotation, or if a significant event has occurred that would materially affect the value of the security, the security will be fair valued as determined in good faith by or at the direction of the Board in a manner that most fairly reflects the security’s “fair value”, which is the amount that the Fund might reasonably expect to receive for the security upon its current sale in the ordinary course. Each such determination is based on a consideration of relevant factors, which are likely to vary from one pricing context to another. These factors may include, but are not limited to, the type of security, the existence of any contractual restrictions on the security’s disposition, the price and extent of public trading in similar securities of the issuer or of comparable companies or entities, quotations or relevant information obtained from broker/dealers or other market participants, information obtained from the issuer, analysts, and/or the
36 www.calvert.com CALVERT US LARGE-CAP CORE RESPONSIBLE INDEX FUND ANNUAL REPORT
appropriate stock exchange (for exchange-traded securities), an analysis of the company’s or entity’s financial statements, and an evaluation of the forces that influence the issuer and the market(s) in which the security is purchased and sold.
The values assigned to fair value investments are based on available information and do not necessarily represent amounts that might ultimately be realized. Further, due to the inherent uncertainty of valuations of such investments, the fair values may differ significantly from the values that would have been used had an active market existed, and the differences could be material.
The following table summarizes the market value of the Fund’s holdings as of September 30, 2019, based on the inputs used to value them:
|
| | | | | | | | | | | | | |
| Assets | Level 1 | | Level 2 | Level 3 | Total |
| Common Stocks | $ | 1,926,057,065 |
| (1) | $ | — |
| $ | — |
| $ | 1,926,057,065 |
|
| Short Term Investment of Cash Collateral for Securities Loaned | 5,583,767 |
| | — |
| — |
| 5,583,767 |
|
| Total Investments | $ | 1,931,640,832 |
| | $ | — |
| $ | — |
| $ | 1,931,640,832 |
|
| | | | | | |
(1) The level classification by major category of investments is the same as the category presentation in the Schedule of Investments. |
B. Investment Transactions and Income: Investment transactions for financial statement purposes are accounted for on trade date. Realized gains and losses are recorded on an identified cost basis and may include proceeds from litigation. Dividend income is recorded on the ex-dividend date for dividends received in cash and/or securities or, in the case of dividends on certain foreign securities, as soon as the Fund is informed of the ex-dividend date. Non-cash dividends are recorded at the fair value of the securities received. Withholding taxes on foreign dividends, if any, have been provided for in accordance with the Fund’s understanding of the applicable country’s tax rules and rates. Distributions received that represent a return of capital are recorded as a reduction of cost of investments. Distributions received that represent a capital gain are recorded as a realized gain. Interest income, is accrued as earned.
C. Share Class Accounting: Realized and unrealized gains and losses and net investment income and losses, other than class-specific expenses, are allocated daily to each class of shares based upon the relative net assets of each class to the total net assets of the Fund. Expenses arising in connection with a specific class are charged directly to that class. Sub-accounting, recordkeeping and similar administrative fees payable to financial intermediaries, which are a component of transfer agency fees and expenses on the Statement of Operations, are not allocated to Class R6 shares.
D. Distributions to Shareholders: Distributions to shareholders are recorded by the Fund on ex-dividend date. Dividends from net investment income and distributions from net realized capital gains, if any, are paid at least annually. Distributions are determined in accordance with income tax regulations which may differ from U.S. GAAP; accordingly, periodic reclassifications are made within the Fund’s capital accounts to reflect income and gains available for distribution under income tax regulations.
E. Estimates: The preparation of financial statements in conformity with U.S. GAAP requires management to make estimates and assumptions that affect the reported amounts of assets and liabilities and disclosure of contingent assets and liabilities at the date of the financial statements and the reported amounts of increases and decreases in net assets from operations during the reporting period. Actual results could differ from those estimates.
F. Indemnifications: The Corporation’s By-Laws provide for indemnification for Directors or officers of the Corporation and certain other parties, to the fullest extent permitted by Maryland law and the 1940 Act, provided certain conditions are met. Additionally, in the normal course of business, the Fund enters into agreements with service providers that may contain indemnification clauses. The Fund’s maximum exposure under these arrangements is unknown as this would involve future claims that may be made against the Fund that have not yet occurred.
G. Federal Income Taxes: No provision for federal income or excise tax is required since the Fund intends to continue to qualify as a regulated investment company under the Internal Revenue Code and to distribute substantially all of its taxable earnings.
Management has analyzed the Fund’s tax positions taken for all open federal income tax years and has concluded that no provision for federal income tax is required in the Fund’s financial statements. A Fund’s federal tax return is subject to examination by the Internal Revenue Service for a period of three years from the date of filing.
NOTE 2 — RELATED PARTY TRANSACTIONS
The investment advisory fee is earned by Calvert Research Management (CRM), a subsidiary of Eaton Vance Management (EVM), as compensation for investment advisory services rendered to the Fund. Pursuant to the investment advisory agreement, CRM receives a fee, payable monthly, at the annual rate of 0.12% (0.15% prior to February 1, 2019) of the Fund’s average daily net assets. For the year ended September 30, 2019, the investment advisory fee amounted to $2,087,362.
www.calvert.com CALVERT US LARGE-CAP CORE RESPONSIBLE INDEX FUND ANNUAL REPORT 37
CRM has agreed to reimburse the Fund’s operating expenses to the extent that total annual operating expenses (relating to ordinary operating expenses only and excluding expenses such as brokerage commissions, acquired fund fees and expenses of unaffiliated funds, interest expense, taxes or litigation expenses) exceed 0.49%, 1.24%, 0.24% and 0.19% (0.54%, 1.29%, 0.19% and 0.19% prior to February 1, 2019) for Class A, Class C, Class I and Class R6, respectively, of such class’ average daily net assets. The expense reimbursement agreement with CRM may be changed or terminated after January 31, 2020. For the year ended September 30, 2019, CRM waived or reimbursed expenses of $2,220,961.
The administrative fee is earned by CRM as compensation for administrative services rendered to the Fund. The fee is computed at an annual rate of 0.12% of the Fund’s average daily net assets attributable to Class A, Class C, Class I and Class R6, and is payable monthly. For the year ended September 30, 2019, CRM was paid administrative fees of $1,947,365.
The Fund has in effect a distribution plan for Class A shares (Class A Plan) pursuant to Rule 12b-1 under the 1940 Act. Pursuant to the Class A Plan, the Fund pays Eaton Vance Distributors, Inc. (EVD), an affiliate of CRM and the Fund’s principal underwriter, a distribution and service fee of 0.25% per annum of its average daily net assets attributable to Class A shares for distribution services and facilities provided to the Fund by EVD, as well as for personal services and/or the maintenance of shareholder accounts. The Fund also has in effect a distribution plan for Class C shares (Class C Plan) pursuant to Rule 12b-1 under the 1940 Act. Pursuant to the Class C Plan, the Fund pays EVD amounts equal to 0.75% per annum of its average daily net assets attributable to Class C shares for providing ongoing distribution services and facilities to the Fund. In addition, pursuant to the Class C Plan, the Fund also makes payments of service fees to EVD, financial intermediaries and other persons in amounts equal to 0.25% per annum of its average daily net assets attributable to that class. Service fees paid or accrued are for personal services and/or maintenance of shareholder accounts. Distribution and service fees paid or accrued for the year ended September 30, 2019 amounted to $731,918 and $560,649 for Class A shares and Class C shares, respectively.
The Fund was informed that EVD received $119,604 as its portion of the sales charge on sales of Class A shares for the year ended September 30, 2019. The Fund was also informed that EVD received $132 and $2,547 of contingent deferred sales charges (CDSC) paid by Class A and Class C shareholders, respectively for the same period.
EVM provides sub-transfer agency and related services to the Fund pursuant to a Sub-Transfer Agency Support Services Agreement. For the year ended September 30, 2019, sub-transfer agency fees and expenses incurred to EVM amounted to $70,763 and are included in transfer agency fees and expenses on the Statement of Operations.
Each Director of the Fund who is not an employee of CRM or its affiliates receives a fee of $3,000 for each Board meeting attended in person and $2,000 for each Board meeting attended by phone plus an annual fee of $117,000, and $1,500 for each Committee meeting attended in person and $1,000 for each Committee meeting attended by phone plus an annual Committee fee of $2,500. The Board chair receives an additional $15,000 annual retainer and Committee chairs receive an additional $6,000 annual retainer. Eligible Directors may participate in a Deferred Compensation Plan (the Plan). Amounts deferred under the Plan are treated as though equal dollar amounts had been invested in shares of the Fund or other Calvert funds selected by the Directors. The Fund purchases shares of the funds selected equal to the dollar amounts deferred under the Plan, resulting in an asset equal to the deferred compensation liability. Obligations of the Plan are paid solely from the Fund’s assets. Directors’ fees are allocated to each of the Calvert funds served. Salaries and fees of officers and Directors of the Fund who are employees of CRM or its affiliates are paid by CRM. In addition, an advisory council was established to aid the Board and CRM in advancing the cause of responsible investing through original scholarship and thought leadership. The advisory council consists of CRM’s Chief Executive Officer and four additional members. Each member (other than CRM’s Chief Executive Officer) receives annual compensation of $75,000, which is being reimbursed by Calvert Investment Management, Inc. (CIM), the Calvert funds’ former investment adviser and Ameritas Holding Company, CIM’s parent company, through the end of 2019. For the year ended September 30, 2019, the Fund’s allocated portion of such expense and reimbursement was $40,371, which are included in miscellaneous expense and reimbursement of expenses-other, respectively, on the Statement of Operations.
NOTE 3 — INVESTMENT ACTIVITY
During the year ended September 30, 2019, the cost of purchases and proceeds from sales of investments, other than short-term securities, were $687,718,298 and $272,393,344, respectively.
38 www.calvert.com CALVERT US LARGE-CAP CORE RESPONSIBLE INDEX FUND ANNUAL REPORT
NOTE 4 — DISTRIBUTIONS TO SHAREHOLDERS AND INCOME TAX INFORMATION
The tax character of distributions declared for the years ended September 30, 2019 and September 30, 2018 was as follows:
|
| | | | | | |
| | Year Ended
September 30, |
| | 2019 | 2018 |
| Ordinary income |
| $19,210,410 |
|
| $15,669,667 |
|
| Long-term capital gains |
| $35,119,182 |
|
| $7,748,177 |
|
During the year ended September 30, 2019, distributable earnings was decreased by $2,031,592 and paid-in capital was increased by $2,031,592 due to the Fund’s use of equalization accounting. Tax equalization accounting allows the Fund to treat as a distribution that portion of redemption proceeds representing a redeeming shareholder’s portion of undistributed taxable income and net capital gains. These reclassifications had no effect on the net assets or net asset value per share of the Fund.
As of September 30, 2019, the components of distributable earnings (accumulated loss) on a tax basis were as follows:
|
| | | |
| Undistributed ordinary income |
| $16,569,879 |
|
| Post October capital losses | $(5,871,235) |
| Net unrealized appreciation (depreciation) |
| $421,489,698 |
|
At September 30, 2019, the Fund had a net capital loss of $5,871,235 attributable to security transactions incurred after October 31, 2018 that it has elected to defer. This net capital loss is treated as arising on the first day of the Fund’s taxable year ending September 30, 2020.
The cost and unrealized appreciation (depreciation) of investments of the Fund at September 30, 2019, as determined on a federal income tax basis, were as follows:
|
| | | |
| Aggregate cost |
| $1,510,151,134 |
|
| Gross unrealized appreciation |
| $454,577,997 |
|
| Gross unrealized depreciation | (33,088,299) |
|
| Net unrealized appreciation (depreciation) |
| $421,489,698 |
|
NOTE 5 — SECURITIES LENDING
To generate additional income, the Fund may lend its securities pursuant to a securities lending agency agreement with State Street Bank and Trust Company (SSBT), the securities lending agent. Security loans are subject to termination by the Fund at any time and, therefore, are not considered illiquid investments. The Fund requires that the loan be continuously collateralized by either cash or securities as collateral equal at all times to at least 102% of the market value of the domestic securities loaned and 105% of the market value of the international securities loaned (if applicable). The market value of securities loaned is determined daily and any additional required collateral is delivered to the Fund on the next business day. Cash collateral is generally invested in a money market fund registered under the 1940 Act that is managed by an affiliate of SSBT. Any gain or loss in the market price of the loaned securities that might occur and any interest earned or dividends declared during the term of the loan would accrue to the account of the Fund. Income earned on the investment of collateral, net of broker rebates and other expenses incurred by the securities lending agent, is split between the Fund and the securities lending agent on the basis of agreed upon contractual terms. Non-cash collateral, if any, is held by the lending agent on behalf of the Fund and cannot be sold or re-pledged by the Fund; accordingly, such collateral is not reflected in the Statement of Assets and Liabilities.
The risks associated with lending portfolio securities include, but are not limited to, possible delays in receiving additional collateral or in the recovery of the loaned securities, possible loss of rights to the collateral should the borrower fail financially, as well as risk of loss in the value of the collateral or the value of the investments made with the collateral. The securities lending agent shall indemnify the Fund in the case of default of any securities borrower.
At September 30, 2019, the total value of securities on loan was $41,217,135 and the total value of collateral received was $41,979,464 comprised of cash of $5,583,767 and U.S. government and/or agencies securities of $36,395,697.
www.calvert.com CALVERT US LARGE-CAP CORE RESPONSIBLE INDEX FUND ANNUAL REPORT 39
The following table provides a breakdown of securities lending transactions accounted for as secured borrowings, the obligations by class of collateral pledged, and the remaining contractual maturity of those transactions as of September 30, 2019.
|
| | | | | | | | | | | | | | | |
| | Remaining Contractual Maturity of the Transactions |
| | Overnight and Continuous | <30 days | 30 to 90 days | >90 days | Total |
| Securities Lending Transactions | | | | | |
| Common Stocks |
| $41,979,464 |
|
| $— |
|
| $— |
|
| $— |
|
| $41,979,464 |
|
The carrying amount of the liability for deposits for securities loaned at September 30, 2019 approximated its fair value. If measured at fair value, such liability would have been considered as Level 2 in the fair value hierarchy (see Note 1A) at September 30, 2019.
NOTE 6 — LINE OF CREDIT
The Fund participates with other funds managed by CRM in a $100 million ($62.5 million prior to June 21, 2019) committed unsecured line of credit agreement with SSBT, which is in effect through June 19, 2020. Borrowings may be made for temporary or emergency purposes only. Borrowings bear interest at the higher of the One-Month London Interbank Offered Rate (LIBOR) in effect that day or the overnight Federal Funds Rate, plus 1.00% per annum. A commitment fee of 0.20% per annum is incurred on the unused portion of the committed facility. An administrative fee of $37,500 was incurred in connection with the increase of the facility in June 2019. These fees are allocated to all participating funds. Because the line of credit is not available exclusively to the Fund, it may be unable to borrow some or all of its requested amounts at any particular time. The Fund had no borrowings outstanding pursuant to this line of credit at September 30, 2019. The Fund did not have any significant borrowings or allocated fees during the year ended September 30, 2019.
Effective at the close of business on October 28, 2019, the Fund and other participating funds managed by CRM terminated the line of credit agreement. Effective October 29, 2019, the Fund participates with other funds managed by EVM and its affiliates, including CRM, in an $800 million unsecured line of credit agreement with a syndicate of banks, which is in effect through October 27, 2020, at terms that are more favorable than the terminated agreement.
40 www.calvert.com CALVERT US LARGE-CAP CORE RESPONSIBLE INDEX FUND ANNUAL REPORT
NOTE 7 — CAPITAL SHARES
Transactions in capital shares for the years ended September 30, 2019 and September 30, 2018 were as follows:
|
| | | | | | | | | | | |
| | Year Ended
September 30, 2019 | | Year Ended
September 30, 2018 |
| | Shares | Amount | | Shares | Amount |
| Class A | | | | | |
| Shares sold | 2,722,940 |
|
| $63,137,685 |
| | 2,371,025 |
|
| $53,979,910 |
|
| Reinvestment of distributions | 424,532 |
| 9,467,075 |
| | 247,751 |
| 5,487,695 |
|
| Shares redeemed | (2,202,944 | ) | (50,918,507 | ) | | (3,150,293 | ) | (71,755,226 | ) |
| Converted from Class C | 192,053 |
| 4,211,299 |
| | — |
| — |
|
| Net increase (decrease) | 1,136,581 |
|
| $25,897,552 |
| | (531,517 | ) |
| ($12,287,621 | ) |
| | | | | | |
| Class C | | | | | |
| Shares sold | 432,146 |
|
| $9,401,441 |
| | 484,496 |
|
| $10,447,748 |
|
| Reinvestment of distributions | 77,141 |
| 1,620,740 |
| | 34,884 |
| 730,119 |
|
| Shares redeemed | (511,788 | ) | (11,178,972 | ) | | (395,017 | ) | (8,454,925 | ) |
| Converted to Class A | (204,127 | ) | (4,211,299 | ) | | — |
| — |
|
| Net increase (decrease) | (206,628 | ) |
| ($4,368,090 | ) | | 124,363 |
|
| $2,722,942 |
|
| | | | | | |
| Class I | | | | | |
| Shares sold | 21,971,120 |
|
| $525,308,306 |
| | 16,497,847 |
|
| $394,348,574 |
|
| Reinvestment of distributions | 1,457,832 |
| 33,296,893 |
| | 611,981 |
| 13,867,487 |
|
| Shares redeemed | (14,907,892 | ) | (347,603,036 | ) | | (10,042,868 | ) | (232,112,974 | ) |
| Converted from Class Y | — |
| — |
| | 4,490,414 |
| 103,824,204 |
|
| Net increase | 8,521,060 |
|
| $211,002,163 |
| | 11,557,374 |
|
| $279,927,291 |
|
| | | | | | |
Class R6 (1) | | | | | |
| Shares sold | 11,533,607 |
|
| $268,652,048 |
| | 7,067,041 |
|
| $164,419,844 |
|
| Reinvestment of distributions | 329,560 |
| 7,520,554 |
| | 107,266 |
| 2,429,582 |
|
| Shares redeemed | (2,611,743 | ) | (63,684,065 | ) | | (333,301 | ) | (8,031,751 | ) |
| Net increase | 9,251,424 |
|
| $212,488,537 |
| | 6,841,006 |
|
| $158,817,675 |
|
| | | | | | |
Class Y (2) | | | | | |
| Shares sold | — |
|
| $— |
| | 380,358 |
|
| $8,368,552 |
|
| Shares redeemed | — |
| — |
| | (151,902 | ) | (3,333,927 | ) |
| Converted to Class I | — |
| — |
| | (4,594,764 | ) | (103,824,204 | ) |
| Net decrease | — |
|
| $— |
| | (4,366,308 | ) |
| ($98,789,579 | ) |
| | | | | | |
(1) For the period from the commencement of operations, October 3, 2017, to September 30, 2018. |
(2) Effective December 8, 2017, Class Y shares of the Fund converted to Class I shares at net asset value. Thereafter, Class Y shares were terminated. |
www.calvert.com CALVERT US LARGE-CAP CORE RESPONSIBLE INDEX FUND ANNUAL REPORT 41
REPORT OF INDEPENDENT REGISTERED PUBLIC ACCOUNTING FIRM
To the Shareholders and Board of Directors
Calvert Responsible Index Series, Inc.:
Opinion on the Financial Statements
We have audited the accompanying statement of assets and liabilities of Calvert US Large-Cap Core Responsible Index Fund (the Fund), a series of Calvert Responsible Index Series, Inc., including the schedule of investments, as of September 30, 2019, the related statement of operations for the year then ended, the statements of changes in net assets for each of the years in the two‑year period then ended, and the related notes (collectively, the financial statements) and the financial highlights for each of the years or periods in the five‑year period then ended. In our opinion, the financial statements and financial highlights present fairly, in all material respects, the financial position of the Fund as of September 30, 2019, the results of its operations for the year then ended, the changes in its net assets for each of the years in the two‑year period then ended, and the financial highlights for each of the years or periods in the five‑year period then ended, in conformity with U.S. generally accepted accounting principles.
Basis for Opinion
These financial statements and financial highlights are the responsibility of the Fund’s management. Our responsibility is to express an opinion on these financial statements and financial highlights based on our audits. We are a public accounting firm registered with the Public Company Accounting Oversight Board (United States) (PCAOB) and are required to be independent with respect to the Fund in accordance with the U.S. federal securities laws and the applicable rules and regulations of the Securities and Exchange Commission and the PCAOB.
We conducted our audits in accordance with the standards of the PCAOB. Those standards require that we plan and perform the audit to obtain reasonable assurance about whether the financial statements and financial highlights are free of material misstatement, whether due to error or fraud. Our audits included performing procedures to assess the risks of material misstatement of the financial statements and financial highlights, whether due to error or fraud, and performing procedures that respond to those risks. Such procedures included examining, on a test basis, evidence regarding the amounts and disclosures in the financial statements and financial highlights. Such procedures also included confirmation of securities owned as of September 30, 2019, by correspondence with the custodian. Our audits also included evaluating the accounting principles used and significant estimates made by management, as well as evaluating the overall presentation of the financial statements and financial highlights. We believe that our audits provide a reasonable basis for our opinion.
We have served as the auditor of one or more of the Calvert Funds since 2002.
Philadelphia, Pennsylvania
November 20, 2019
42 www.calvert.com CALVERT US LARGE-CAP CORE RESPONSIBLE INDEX FUND ANNUAL REPORT
FEDERAL TAX INFORMATION
The Form 1099-DIV you receive in February 2020 will show the tax status of all distributions paid to your account in calendar year 2019. Shareholders are advised to consult their own tax adviser with respect to the tax consequences of their investment in the Fund. As required by the Internal Revenue Code and/or regulations, shareholders must be notified regarding the status of qualified dividend income for individuals, the dividends received deduction for corporations and capital gains dividends.
Qualified Dividend Income. For the fiscal year ended September 30, 2019, the Fund designates approximately $27,361,168, or up to the maximum amount of such dividends allowable pursuant to the Internal Revenue Code, as qualified dividend income eligible for the reduced tax rate of 15%.
Dividends Received Deduction. Corporate shareholders are generally entitled to take the dividends received deduction on the portion of the Fund’s dividend distribution that qualifies under tax law. For the Fund’s fiscal 2019 ordinary income dividends, 95.04% qualifies for the corporate dividends received deduction.
Capital Gains Dividends. The Fund hereby designates as a capital gain dividend with respect to the taxable year ended September 30, 2019, $998,939 or, if subsequently determined to be different, the net capital gain of such year.
www.calvert.com CALVERT US LARGE-CAP CORE RESPONSIBLE INDEX FUND ANNUAL REPORT (Unaudited) 43
MANAGEMENT AND ORGANIZATION
Fund Management. The Directors of Calvert Responsible Index Series, Inc. (the Corporation) are responsible for the overall management and supervision of the Corporation’s affairs. The Directors and officers of the Corporation are listed below. Except as indicated, each individual has held the office shown or other offices in the same company for the last five years. Directors and officers of the Corporation hold indefinite terms of office. The “Independent Directors” consist of those Directors who are not “interested persons” of the Corporation, as that term is defined under the 1940 Act. The business address of each Director and officer, with the exception of Ms. Gemma and Mr. Kirchner, is 1825 Connecticut Avenue NW, Suite 400, Washington, DC 20009. As used below, “CRM” refers to Calvert Research and Management. Each Director oversees 39 funds in the Calvert fund complex. Each officer serves as an officer of certain other Calvert funds.
|
| | | |
| Name and Year of Birth |
Corporation Position(s) | Position
Start Date | Principal Occupation(s) and Other Directorships
During Past Five Years and Other Relevant Experience |
| | | | |
| Interested Director | | | |
John H. Streur(1)
1960 | Director & President | 2015 | President and Chief Executive Officer of Calvert Research and Management (since December 31, 2016). President and Chief Executive Officer of Calvert Investments, Inc. (January 2015 - December 2016); Chief Executive Officer of Calvert Investment Distributors, Inc. (August 2015 - December 2016); Chief Compliance Officer of Calvert Investment Management, Inc. (August 2015 - April 2016); President and Director, Portfolio 21 Investments, Inc. (through October 2014); President, Chief Executive Officer and Director, Managers Investment Group LLC (through January 2012); President and Director, The Managers Funds and Managers AMG Funds (through January 2012). Other Directorships in the Last Five Years. Portfolio 21 Investments, Inc. (asset management) (through October 2014); Managers Investment Group LLC (asset management) (through January 2012); The Managers Funds (asset management) (through January 2012); Managers AMG Funds (asset management) (through January 2012); Calvert Impact Capital, Inc. |
| Independent Directors | | | |
Richard L. Baird, Jr.
1948 | Director | 2000 | Regional Disaster Recovery Lead, American Red Cross of Greater Pennsylvania (since 2017). Volunteer, American Red Cross (since 2015). Former President and CEO of Adagio Health Inc. (retired in 2014) in Pittsburgh, PA. Other Directorships in the Last Five Years. None. |
Alice Gresham Bullock
1950 | Chair & Director | 2016 | Professor Emerita at Howard University School of Law. Dean Emerita of Howard University School of Law and Deputy Director of the Association of American Law Schools (1992-1994). Other Directorships in the Last Five Years. None. |
Cari M. Dominguez
1949 | Director | 2016 | Former Chair of the U.S. Equal Employment Opportunity Commission. Other Directorships in the Last Five Years. Manpower, Inc. (employment agency); Triple S Management Corporation (managed care); National Association of Corporate Directors. |
John G. Guffey, Jr.(2)
1948 | Director | 2000 | President of Aurora Press Inc., a privately held publisher of trade paperbacks (since January 1997). Other Directorships in the Last Five Years. Calvert Impact Capital, Inc. (through December 31, 2018); Calvert Ventures, LLC. |
Miles D. Harper, III
1962 | Director | 2005 | Partner, Carr Riggs & Ingram (public accounting firm) since October 2014. Partner, Gainer Donnelly & Desroches (public accounting firm) (now Carr Riggs & Ingram), November 1999 - September 2014). Other Directorships in the Last Five Years. Bridgeway Funds (9) (asset management). |
Joy V. Jones
1950 | Director | 2000 | Attorney. Other Directorships in the Last Five Years. Conduit Street Restaurants SUD 2 Limited; Palm Management Restaurant Corporation. |
Anthony A. Williams
1951 | Director | 2016 | CEO and Executive Director of the Federal City Council (July 2012 to present); Senior Adviser and Independent Consultant for McKenna Long & Aldridge LLP (September 2011 to present); Executive Director of Global Government Practice at the Corporate Executive Board (January 2010 to January 2012). Other Directorships in the Last Five Years. Freddie Mac; Evoq Properties/ Meruelo Maddux Properties, Inc. (real estate management); Weston Solutions, Inc. (environmental services); Bipartisan Policy Center’s Debt Reduction Task Force; Chesapeake Bay Foundation; Catholic University of America; Urban Institute (research organization). |
44 www.calvert.com CALVERT US LARGE-CAP CORE RESPONSIBLE INDEX FUND ANNUAL REPORT (Unaudited)
|
| | | |
| Principal Officers who are not Directors | |
Name and
Year of Birth | Corporation Position(s) | Position Start Date | Principal Occupation(s)
During Past Five Years |
| | | | |
Hope L. Brown
1973 | Chief Compliance Officer | 2014 | Chief Compliance Officer of 39 registered investment companies advised by CRM (since 2014). Vice President and Chief Compliance Officer, Wilmington Funds (2012-2014). |
Maureen A. Gemma(3)
1960 | Secretary, Vice President and Chief Legal Officer | 2016 | Vice President of CRM and officer of 39 registered investment companies advised by CRM (since 2016). Also Vice President of Eaton Vance and certain of its affiliates and officer of 162 registered investment companies advised or administered by Eaton Vance. |
James F. Kirchner(3)
1967 | Treasurer | 2016 | Vice President of CRM and officer of 39 registered investment companies advised by CRM (since 2016). Also Vice President of Eaton Vance and certain of its affiliates and officer of 162 registered investment companies advised or administered by Eaton Vance. |
| | | | |
| |
(1) | Mr. Streur is an interested person of the Fund because of his positions with the Fund’s adviser and certain affiliates. |
| |
(2) | Mr. Guffey is currently married to Rebecca L. Adamson, who serves as a member of the Advisory Council. |
| |
(3) | The business address for Ms. Gemma and Mr. Kirchner is Two International Place, Boston, MA 02110. |
The SAI for the Fund includes additional information about the Directors and officers of the Fund and can be obtained without charge on Calvert’s website at www.calvert.com or by calling 1-800-368-2745.
www.calvert.com CALVERT US LARGE-CAP CORE RESPONSIBLE INDEX FUND ANNUAL REPORT (Unaudited) 45
IMPORTANT NOTICES
Privacy. The Calvert Funds and Calvert Research and Management are committed to ensuring your financial privacy. Each of the financial institutions identified below has in effect the following policy (“Privacy Policy”) with respect to nonpublic personal information about its customers:
| |
| • | Only such information received from you, through application forms or otherwise, and information about your Calvert fund transactions will be collected. This may include information such as name, address, social security number, tax status, account balances and transactions. |
| |
| • | None of such information about you (or former customers) will be disclosed to anyone, except as permitted by law (which includes disclosure to employees necessary to service your account). In the normal course of servicing a customer’s account, Calvert Research and Management may share information with unaffiliated third parties that perform various required services such as transfer agents, custodians and broker-dealers. |
| |
| • | Policies and procedures (including physical, electronic and procedural safeguards) are in place that are designed to protect the confidentiality of such information. |
| |
| • | The Funds reserve the right to change this Privacy Policy at any time upon proper notification to you. Customers may want to review the Funds’ Privacy Policy periodically for changes by accessing the link on our homepage: www.calvert.com. |
Our pledge of privacy applies to the following entities: the Calvert Family of Funds, Calvert Research and Management and their affiliated service providers, Eaton Vance Management and Eaton Vance Distributors, Inc. In addition, our Privacy Policy applies only to those Calvert customers who are individuals and who have a direct relationship with us. If a customer’s account (i.e., fund shares) is held in the name of a third-party financial advisor/broker-dealer, it is likely that only such advisor’s privacy policies apply to the customer. This notice supersedes all previously issued privacy disclosures. For more information about Calvert’s Privacy Policy, please call 1-800-368-2745.
Delivery of Shareholder Documents. The Securities and Exchange Commission (SEC) permits funds to deliver only one copy of shareholder documents, including prospectuses, proxy statements and shareholder reports, to fund investors with multiple accounts at the same residential or post office box address. This practice is often called “householding” and it helps eliminate duplicate mailings to shareholders. Calvert funds, or your financial intermediary, may household the mailing of your documents indefinitely unless you instruct Calvert funds, or your financial intermediary, otherwise. If you would prefer that your Calvert fund documents not be householded, please contact Calvert funds at 1-800-368-2745, or contact your financial intermediary. Your instructions that householding not apply to delivery of your Calvert fund documents will typically be effective within 30 days of receipt by Calvert funds or your financial intermediary. Separate statements will be generated for each separate account and will be householded as described above.
Portfolio Holdings. Each Calvert fund files a schedule of portfolio holdings on Part F to Form N-PORT with the SEC for the first and third quarters of each fiscal year. The Form N-PORT will be available on the Calvert funds’ website at www.calvert.com, by calling Calvert funds at 1-800-368-2745 or in the EDGAR database on the SEC’s website at www.sec.gov.
Proxy Voting. The Proxy Voting Guidelines that each Calvert fund uses to determine how to vote proxies relating to portfolio securities is provided as an Appendix to the fund’s Statement of Additional Information. The Statement of Additional Information can be obtained free of charge by calling the Calvert funds at 1-800-368-2745, by visiting the Calvert funds’ website at www.calvert.com or visiting the SEC’s website at www.sec.gov. Information regarding how a Calvert fund voted proxies relating to portfolio securities during the most recent 12-month period ended June 30 is available by calling Calvert funds, by visiting the Calvert funds’ website at www.calvert.com or by visiting the SEC’s website at www.sec.gov.
46 www.calvert.com CALVERT US LARGE-CAP CORE RESPONSIBLE INDEX FUND ANNUAL REPORT (Unaudited)
|
|
| This page intentionally left blank. |
|
|
| This page intentionally left blank. |
|
| |
| CALVERT US LARGE-CAP CORE RESPONSIBLE INDEX FUND |
Investment Adviser and Administrator Calvert Research and Management 1825 Connecticut Avenue NW, Suite 400 Washington, DC 20009 | Transfer Agent DST Asset Manager Solutions, Inc. 2000 Crown Colony Drive Quincy, MA 02169 |
Principal Underwriter* Eaton Vance Distributors, Inc. Two International Place Boston, MA 02110 (617) 482-8260 | Independent Registered Public Accounting Firm KPMG LLP 1601 Market Street Philadelphia, PA 19103-2499 |
Custodian State Street Bank and Trust Company State Street Financial Center, One Lincoln Street Boston, MA 02111 | Fund Offices 1825 Connecticut Avenue NW, Suite 400 Washington, DC 20009 |
| | |
* FINRA BrokerCheck. Investors may check the background of their Investment Professional by contacting the Financial Industry Regulatory Authority (FINRA). FINRA BrokerCheck is a free tool to help investors check the professional background of current and former FINRA-registered securities firms and brokers. FINRA BrokerCheck is available by calling 1-800-289-9999 and at www.FINRA.org. The FINRA BrokerCheck brochure describing this program is available to investors at www.FINRA.org.
|
| |
| | |
| Printed on recycled paper. |
| 24187 9.30.19 | |
|
|
| Calvert US Large-Cap Growth Responsible Index Fund |
Important Note. Beginning on January 1, 2021, as permitted by regulations adopted by the Securities and Exchange Commission, paper copies of the Fund’s annual and semi-annual shareholder reports will no longer be sent by mail unless you specifically request paper copies of the reports. Instead, the reports will be made available on the Fund’s website (calvert.com/prospectus), and you will be notified by mail each time a report is posted and provided with a website address to access the report.
If you already elected to receive shareholder reports electronically, you will not be affected by this change and you need not take any action. If you are a direct investor, you may elect to receive shareholder reports and other communications from the Fund electronically by signing up for e-Delivery at calvert.com. If you own your shares through a financial intermediary (such as a broker-dealer or bank), you must contact your financial intermediary to sign up.
You may elect to receive all future Fund shareholder reports in paper free of charge. If you are a direct investor, you can inform the Fund that you wish to continue receiving paper copies of your shareholder reports by calling 1-800-368-2745. If you own these shares through a financial intermediary, you must contact your financial intermediary or follow instructions included with this disclosure, if applicable, to elect to continue to receive paper copies of your shareholder reports. Your election to receive reports in paper will apply to all Calvert funds held directly or to all funds held through your financial intermediary, as applicable.
|
| |
Annual Report September 30, 2019 E-Delivery Sign-Up — Details Inside
| |
|
|
Commodity Futures Trading Commission Registration. Effective December 31, 2012, the Commodity Futures Trading Commission (“CFTC”) adopted certain regulatory changes that subject registered investment companies and advisers to regulation by the CFTC if a fund invests more than a prescribed level of its assets in certain CFTC-regulated instruments (including futures, certain options and swap agreements) or markets itself as providing investment exposure to such instruments. The Fund and its adviser have claimed an exclusion from the definition of the term “commodity pool operator” under the Commodity Exchange Act. Accordingly, neither the Fund nor the adviser is subject to CFTC regulation.
Fund shares are not insured by the FDIC and are not deposits or other obligations of, or guaranteed by, any depository institution. Shares are subject to investment risks, including possible loss of principal invested.
This report must be preceded or accompanied by a current summary prospectus or prospectus. Before investing, investors should consider carefully the investment objective, risks, and charges and expenses of a mutual fund. This and other important information is contained in the summary prospectus and prospectus, which can be obtained from a financial intermediary. Prospective investors should read the prospectus carefully before investing. For further information, please call 1-800-368-2745.
|
Choose Planet-friendly E-delivery! Sign up now for on-line statements, prospectuses, and fund reports. In less than five minutes you can help reduce paper mail and lower fund costs. Just go to www.calvert.com. If you already have an online account with the Calvert funds, click on Login to access your Account and select the documents you would like to receive via e-mail. If you’re new to online account access, click on Login, then Register to create your user name and password. Once you’re in, click on the E-delivery sign-up on the Account Portfolio page and follow the quick, easy steps. Note: If your shares are not held directly with the Calvert funds but through a brokerage firm, you must contact your broker for electronic delivery options available through their firm. |
|
| | | | |
| | | TABLE OF CONTENTS |
| | | | | |
| | | | | Management’s Discussion of Fund Performance |
| | | | | Performance |
| | | | | Fund Profile |
| | | | | Endnotes and Additional Disclosures |
| | | | | Fund Expenses |
| | | | | Financial Statements |
| | | | | Report of Independent Registered Public Accounting Firm |
| | | | | Federal Tax Information |
| | | | | Management and Organization |
| | | | | Important Notices |
MANAGEMENT’S DISCUSSION OF FUND PERFORMANCE1 Economic and Market Conditions
In the midst of a yearlong trade war with China and slowing economic growth worldwide, U.S. stocks delivered mixed returns during the 12-month period ended September 30, 2019.
U.S. stocks opened the period on the downside as investors worried that President Trump’s imposition of broad import tariffs might provoke a wider trade dispute with China, the world’s second-largest economy behind the U.S.
With U.S. economic data largely positive throughout 2018, the U.S. Federal Reserve Board (the Fed) raised its benchmark federal funds rate four times ─ from a low range of 1.50%-1.75% to 2.25%-2.50% ─ with the last quarter-point increase on December 19, 2018.
U.S. stocks turned higher in early 2019 as trade fears eased and interest rates remained stable after the Fed signaled a slower pace for future rate hikes. However, around the same time, U.S. economic indicators began sending mixed signals. While the job market was robust during the period with the U.S. unemployment rate dipping below 4%, retail sales fell, raising concerns about consumer spending. Factory output also declined, dragged down by a large drop in auto production.
The U.S. equity market fluctuated through the spring of 2019. Heightened trade-conflict rhetoric drove stocks lower in May before easing tensions helped equities recover in June. Key economic indicators continued to be mixed, with job creation decelerating sharply in May.
After holding interest rates steady through the first half of 2019, the Fed cut its benchmark interest rate to 2.00%-2.25% on July 31 ─ its first reduction in over a decade ─ followed by a second interest-rate drop to 1.75%-2.00% on September 18. Lower rates are intended to help stimulate economic activity by making borrowing costs relatively more affordable.
After sliding in August, U.S. equities rebounded in early September before retreating in the final weeks of the period. During the 12-month period ended September 30, 2019, the blue-chip Dow Jones Industrial Average®2 gained 4.21%, while the broader U.S. equity market, as represented by the S&P 500® Index, rose 4.25%. The technology-laden Nasdaq Composite Index returned 0.52% during the period.
Large-cap U.S. stocks, as measured by the S&P 500® Index, generally outperformed their small-cap counterparts, as measured by the Russell 2000® Index, during the period.
As a group, value stocks outpaced growth stocks in both large- and small-cap categories, as measured by the Russell growth and value indexes.
Fund Performance
For the 12-month period ended September 30, 2019, Calvert US Large-Cap Growth Responsible Index Fund (the Fund) returned 4.51% for Class A shares at net asset value (NAV). The Fund outperformed its primary benchmark, the Russell 1000® Growth Index, which returned 3.71%; and underperformed its secondary benchmark, the Calvert US Large-Cap Growth Responsible Index (the Calvert Index), which returned 5.09% during the period.
The Fund’s underperformance versus its secondary benchmark was due to Fund expenses and fees, which the Calvert Index does not incur.
Eight of the Fund’s 11 market sectors delivered positive returns during the period. The weakest-performing sectors were energy, communication services, and health care. The strongest-performing sectors were utilities, consumer staples, and materials.
|
|
See Endnotes and Additional Disclosures in this report. Past performance is no guarantee of future results. Returns are historical and are calculated by determining the percentage change in net asset value (NAV) or offering price (as applicable) with all distributions reinvested. Investment return and principal value will fluctuate so that shares, when redeemed, may be worth more or less than their original cost. Performance less than or equal to one year is cumulative. Performance is for the stated time period only; due to market volatility, the Fund’s current performance may be lower or higher than quoted. Returns are before taxes unless otherwise noted. For performance as of the most recent month-end, please refer to www.calvert.com. |
2 www.calvert.com CALVERT US LARGE-CAP GROWTH RESPONSIBLE INDEX FUND ANNUAL REPORT (Unaudited)
PERFORMANCE
|
| | | | | | | | | | | | | | |
Performance2,3 | | | | | | | | | |
Portfolio Managers Thomas C. Seto, Christopher Madden, CFA and Jade Huang, each of Calvert Research and Management |
| | | | | | | | | | |
| % Average Annual Total Returns | Class Inception Date |
| | Performance Inception Date |
| | One Year |
| | Five Years |
| | Since Inception |
|
| Class A at NAV | 06/19/2015 |
| | 06/19/2015 |
| | 4.51 | % | | — | % | | 11.70 | % |
| Class A with 4.75% Maximum Sales Charge | — |
| | — |
| | -0.46 |
| | — |
| | 10.44 |
|
| Class I at NAV | 06/19/2015 |
| | 06/19/2015 |
| | 4.82 |
| | — |
| | 12.08 |
|
| | | | | | | | | | |
| | | | | | | | | | |
Russell 1000® Growth Index | — |
| | — |
| | 3.71 | % | | 13.38 | % | | 12.92 | % |
| Calvert US Large-Cap Growth Responsible Index | — |
| | — |
| | 5.09 |
| | — |
| | 12.37 |
|
| | | | | | | | | | |
% Total Annual Operating Expense Ratios4 | | | | | | | Class A |
| | Class I |
|
| Gross | | | | | | | 0.82 | % | | 0.57 | % |
| Net | | | | | | | 0.49 |
| | 0.24 |
|
|
|
| Growth of $10,000 |
| This graph shows the change in value of a hypothetical investment of $10,000 in Class A of the Fund for the period indicated. For comparison, the same investment is shown in the indicated index. |
|
| | | | | | | | |
| Growth of Investment | Amount Invested |
| Period Beginning | At NAV |
| With Maximum Sales Charge |
| Class I |
| $100,000 |
| 06/19/2015 |
| $163,031 |
| N.A. |
See Endnotes and Additional Disclosures in this report.
Past performance is no guarantee of future results. Returns are historical and are calculated by determining the percentage change in net asset value (NAV) or offering price (as applicable) with all distributions reinvested. Investment return and principal value will fluctuate so that shares, when redeemed, may be worth more or less than their original cost. Performance less than or equal to one year is cumulative. Performance is for the stated time period only; due to market volatility, the Fund’s current performance may be lower or higher than quoted. Returns are before taxes unless otherwise noted. For performance as of the most recent month-end, please refer to www.calvert.com.
www.calvert.com CALVERT US LARGE-CAP GROWTH RESPONSIBLE INDEX FUND ANNUAL REPORT (Unaudited) 3
FUND PROFILE
|
| | | | | | | |
| |
| | | | | |
| | SECTOR ALLOCATION (% of total investments)5 | | | TEN LARGEST HOLDINGS (% of net assets)6 |
| | | | | | |
| | Information Technology | 36.6 | % | | Microsoft Corp. | 7.2 | % |
| | Health Care | 17.6 | % | | Apple, Inc. | 5.4 | % |
| | Consumer Discretionary | 15.0 | % | | Amazon.com. Inc. | 5.1 | % |
| | Communication Services | 9.3 | % | | Alphabet, Inc., Class A | 4.9 | % |
| | Industrials | 8.4 | % | | Visa, Inc., Class A | 2.2 | % |
| | Consumer Staples | 5.7 | % | | MasterCard, Inc., Class A | 1.8 | % |
| | Financials | 3.7 | % | | Home Depot, Inc. (The) | 1.8 | % |
| | Materials | 2.2 | % | | Merck & Co., Inc. | 1.2 | % |
| | Utilities | 1.4 | % | | Abbott Laboratories | 1.1 | % |
| | Real Estate | 0.1 | % | | Adobe, Inc. | 1.1 | % |
| | Energy | 0.0 | % | * | Total | 31.8 | % |
| | Total | 100.0 | % | | | |
| | | | | | |
| | * Amount is less than 0.05%. | | | | |
See Endnotes and Additional Disclosures in this report.
4 www.calvert.com CALVERT US LARGE-CAP GROWTH RESPONSIBLE INDEX FUND ANNUAL REPORT (Unaudited)
|
| | |
| Endnotes and Additional Disclosures | | |
| |
1 | The views expressed in this report are those of the portfolio manager(s) and are current only through the date stated on the cover. These views are subject to change at any time based upon market or other conditions, and Calvert and the Fund(s) disclaim any responsibility to update such views. These views may not be relied upon as investment advice and, because investment decisions are based on many factors, may not be relied upon as an indication of trading intent on behalf of any Calvert fund. This commentary may contain statements that are not historical facts, referred to as “forward looking statements.” The Fund’s actual future results may differ significantly from those stated in any forward looking statement, depending on factors such as changes in securities or financial markets or general economic conditions, the volume of sales and purchases of Fund shares, the continuation of investment advisory, administrative and service contracts, and other risks discussed from time to time in the Fund’s filings with the Securities and Exchange Commission. |
| |
2 | Dow Jones Industrial Average® is a price-weighted average of 30 blue-chip stocks that are generally the leaders in their industry. S&P 500® Index is an unmanaged index of large-cap stocks commonly used as a measure of U.S. stock market performance. S&P Dow Jones Indices are a product of S&P Dow Jones Indices LLC (“S&P DJI”) and have been licensed for use. S&P® and S&P 500® are registered trademarks of S&P DJI; Dow Jones® is a registered trademark of Dow Jones Trademark Holdings LLC (“Dow Jones”); S&P DJI, Dow Jones and their respective affiliates do not sponsor, endorse, sell or promote the Fund, will not have any liability with respect thereto and do not have any liability for any errors, omissions, or interruptions of the S&P Dow Jones Indices. Nasdaq Composite Index is a market capitalization-weighted index of all domestic and international securities listed on Nasdaq. Source: Nasdaq, Inc. The information is provided by Nasdaq (with its affiliates, are referred to as the “Corporations”) and Nasdaq’s third party licensors on an “as is” basis and the Corporations make no guarantees and bear no liability of any kind with respect to the information or the Fund. Russell 2000® Index is an unmanaged index of 2,000 U.S. small-cap stocks. Russell 1000® Growth Index is an unmanaged index of U.S. large-cap growth stocks. Calvert US Large-Cap Growth Responsible Index (the “Calvert Index”) is composed of common stocks of large growth companies that operate their businesses in a manner that is consistent with the Calvert Principles for Responsible Investment. Large growth companies are selected from the 1,000 largest publicly traded U.S. companies based on market capitalization and growth style factors, excluding real estate investment trusts and business development companies. The Calvert Principles for Responsible Investment serve as a framework for considering environmental, social and governance factors that may affect investment performance. Stocks are weighted in the Calvert Index based on their float-adjusted market capitalization within the relevant sector, subject to certain prescribed limits. Unless otherwise stated, index returns do not reflect the effect of any applicable sales charges, commissions, expenses, taxes or |
leverage, as applicable. It is not possible to invest directly in an index.
| |
3 | Total Returns at NAV do not include applicable sales charges. If sales charges were deducted, the returns would be lower. Total Returns shown with maximum sales charge reflect the stated maximum sales charge. Unless otherwise stated, performance does not reflect the deduction of taxes on Fund distributions or redemptions of Fund shares. Performance since inception for an index, if presented, is the performance since the Fund’s or oldest share class’ inception, as applicable. |
Calvert Research and Management became the investment adviser to the Fund on December 31, 2016. Performance reflected prior to such date is that of the Fund’s former investment adviser.
| |
4 | Source: Fund prospectus. Net expense ratios reflect a contractual expense reimbursement that continues through 1/31/20. Without the reimbursement, performance would have been lower. The expense ratios for the current reporting period can be found in the Financial Highlights section of this report. |
| |
5 | Does not include Short Term Investment of Cash Collateral for Securities Loaned. |
6 Excludes cash and cash equivalents.
www.calvert.com CALVERT US LARGE-CAP GROWTH RESPONSIBLE INDEX FUND ANNUAL REPORT (Unaudited) 5
FUND EXPENSES
Example
As a Fund shareholder, you incur two types of costs: (1) transaction costs, including sales charges (loads) on purchases and redemption fees (if applicable); and (2) ongoing costs, including management fees; distribution and/or service fees; and other Fund expenses. This Example is intended to help you understand your ongoing costs (in dollars) of Fund investing and to compare these costs with the ongoing costs of investing in other mutual funds. The Example is based on an investment of $1,000 invested at the beginning of the period and held for the entire period (April 1, 2019 to September 30, 2019).
Actual Expenses
The first section of the table below provides information about actual account values and actual expenses. You may use the information in this section, together with the amount you invested, to estimate the expenses that you paid over the period. Simply divide your account value by $1,000 (for example, an $8,600 account value divided by $1,000 = 8.6), then multiply the result by the number in the first section under the heading entitled “Expenses Paid During Period” to estimate the expenses you paid on your account during this period.
Hypothetical Example for Comparison Purposes
The second section of the table below provides information about hypothetical account values and hypothetical expenses based on the actual Fund expense ratio and an assumed rate of return of 5% per year (before expenses), which is not the actual Fund return. The hypothetical account values and expenses may not be used to estimate the actual ending account balance or expenses you paid for the period. You may use this information to compare the ongoing costs of investing in the Fund and other funds. To do so, compare this 5% hypothetical example with the 5% hypothetical examples that appear in the shareholder reports of the other funds.
Please note that the expenses shown in the table are meant to highlight your ongoing costs only and do not reflect any transactional costs, such as sales charges (loads) or redemption fees (if applicable). Therefore, the second section of the table is useful in comparing ongoing costs only, and will not help you determine the relative total costs of owning different funds. In addition, if these transactional costs were included, your costs would be higher.
|
| | | | |
| | Beginning
Account Value
(4/1/19) | Ending
Account Value
(9/30/19) | Expenses Paid
During Period*
(4/1/19 - 9/30/19) | Annualized
Expense Ratio |
| Actual | | | | |
| Class A | $1,000.00 | $1,055.90 | $2.53** | 0.49% |
| Class I | $1,000.00 | $1,057.30 | $1.24** | 0.24% |
| Hypothetical | | | | |
| (5% return per year before expenses) | | | | |
| Class A | $1,000.00 | $1,022.61 | $2.48** | 0.49% |
| Class I | $1,000.00 | $1,023.87 | $1.22** | 0.24% |
| | | | | |
| * Expenses are equal to the Fund’s annualized expense ratio for the indicated Class, multiplied by the average account value over the period, multiplied by 183/365 (to reflect the one-half year period). The Example assumes that the $1,000 was invested at the net asset value per share determined at the close of business on March 31, 2019. |
| **Absent a waiver and/or reimbursement of expenses by an affiliate, expenses would be higher. |
6 www.calvert.com CALVERT US LARGE-CAP GROWTH RESPONSIBLE INDEX FUND ANNUAL REPORT (Unaudited)
CALVERT US LARGE-CAP GROWTH RESPONSIBLE INDEX FUND
SCHEDULE OF INVESTMENTS
SEPTEMBER 30, 2019
|
| | | | |
| | SHARES | VALUE ($) |
| COMMON STOCKS - 99.7% | | |
| Aerospace & Defense - 0.3% | | |
| Axon Enterprise, Inc. (1)(2) | 695 |
| 39,462 |
|
| HEICO Corp. | 581 |
| 72,555 |
|
| Hexcel Corp. | 986 |
| 80,980 |
|
| Mercury Systems, Inc. (1) | 373 |
| 30,277 |
|
| Moog, Inc., Class A | 114 |
| 9,248 |
|
| | | 232,522 |
|
| | | |
| Air Freight & Logistics - 0.3% | | |
| C.H. Robinson Worldwide, Inc. | 277 |
| 23,484 |
|
| Expeditors International of Washington, Inc. | 1,191 |
| 88,479 |
|
| United Parcel Service, Inc., Class B | 1,647 |
| 197,344 |
|
| | | 309,307 |
|
| | | |
| Airlines - 0.1% | | |
| Alaska Air Group, Inc. | 166 |
| 10,775 |
|
| JetBlue Airways Corp. (1) | 1,727 |
| 28,927 |
|
| Southwest Airlines Co. | 302 |
| 16,311 |
|
| Spirit Airlines, Inc. (1) | 207 |
| 7,514 |
|
| | | 63,527 |
|
| | | |
| Auto Components - 0.1% | | |
| Aptiv plc | 457 |
| 39,951 |
|
| Autoliv, Inc. | 135 |
| 10,649 |
|
| Gentex Corp. | 1,100 |
| 30,288 |
|
| | | 80,888 |
|
| | | |
| Automobiles - 0.3% | | |
| Tesla, Inc. (1)(2) | 980 |
| 236,053 |
|
| Thor Industries, Inc. | 174 |
| 9,855 |
|
| | | 245,908 |
|
| | | |
| Banks - 0.1% | | |
| Commerce Bancshares, Inc. (2) | 213 |
| 12,918 |
|
| Community Bank System, Inc. | 147 |
| 9,068 |
|
| First Financial Bankshares, Inc. (2) | 282 |
| 9,399 |
|
| First Republic Bank | 329 |
| 31,814 |
|
| Glacier Bancorp, Inc. | 156 |
| 6,312 |
|
| SVB Financial Group (1) | 45 |
| 9,403 |
|
| Western Alliance Bancorp | 283 |
| 13,041 |
|
| | | 91,955 |
|
www.calvert.com CALVERT US LARGE-CAP GROWTH RESPONSIBLE INDEX FUND ANNUAL REPORT 7
|
| | | | |
| | SHARES | VALUE ($) |
| COMMON STOCKS - CONT’D | | |
| Beverages - 1.3% | | |
| Coca-Cola Co. (The) | 10,322 |
| 561,930 |
|
| Coca-Cola Consolidated, Inc. | 48 |
| 14,586 |
|
| PepsiCo, Inc. | 4,351 |
| 596,522 |
|
| | | 1,173,038 |
|
| | | |
| Biotechnology - 3.8% | | |
| AbbVie, Inc. | 9,445 |
| 715,175 |
|
| ACADIA Pharmaceuticals, Inc. (1)(2) | 601 |
| 21,630 |
|
| Alexion Pharmaceuticals, Inc. (1) | 1,809 |
| 177,174 |
|
| Alkermes plc (1) | 1,096 |
| 21,383 |
|
| Alnylam Pharmaceuticals, Inc. (1) | 885 |
| 71,172 |
|
| Amgen, Inc. | 1,908 |
| 369,217 |
|
| Biogen, Inc. (1) | 1,020 |
| 237,476 |
|
| BioMarin Pharmaceutical, Inc. (1) | 1,585 |
| 106,829 |
|
| Bluebird Bio, Inc. (1)(2) | 460 |
| 42,237 |
|
| Blueprint Medicines Corp. (1) | 106 |
| 7,788 |
|
| Celgene Corp. (1) | 5,742 |
| 570,181 |
|
| Exact Sciences Corp. (1)(2) | 1,226 |
| 110,794 |
|
| Exelixis, Inc. (1) | 2,634 |
| 46,582 |
|
| Incyte Corp. (1) | 1,479 |
| 109,786 |
|
| Ionis Pharmaceuticals, Inc. (1) | 1,076 |
| 64,463 |
|
| Neurocrine Biosciences, Inc. (1) | 829 |
| 74,701 |
|
| Regeneron Pharmaceuticals, Inc. (1) | 713 |
| 197,786 |
|
| Repligen Corp. (1) | 461 |
| 35,354 |
|
| Sarepta Therapeutics, Inc. (1) | 667 |
| 50,238 |
|
| Seattle Genetics, Inc. (1) | 123 |
| 10,504 |
|
| Spark Therapeutics, Inc. (1) | 364 |
| 35,301 |
|
| United Therapeutics Corp. (1) | 358 |
| 28,551 |
|
| Vertex Pharmaceuticals, Inc. (1) | 2,279 |
| 386,108 |
|
| | | 3,490,430 |
|
| | | |
| Building Products - 0.3% | | |
| Allegion plc | 1,152 |
| 119,405 |
|
| Armstrong World Industries, Inc. | 327 |
| 31,621 |
|
| Fortune Brands Home & Security, Inc. | 250 |
| 13,675 |
|
| Masco Corp. | 1,321 |
| 55,059 |
|
| Trex Co., Inc. (1) | 368 |
| 33,462 |
|
| | | 253,222 |
|
| | | |
| Capital Markets - 2.4% | | |
| Affiliated Managers Group, Inc. | 109 |
| 9,085 |
|
| Ares Management Corp., Class A | 364 |
| 9,759 |
|
| BlackRock, Inc. | 19 |
| 8,467 |
|
| Cboe Global Markets, Inc. | 799 |
| 91,813 |
|
| Charles Schwab Corp. (The) | 3,677 |
| 153,809 |
|
| CME Group, Inc. | 1,582 |
| 334,340 |
|
8 www.calvert.com CALVERT US LARGE-CAP GROWTH RESPONSIBLE INDEX FUND ANNUAL REPORT
|
| | | | |
| | SHARES | VALUE ($) |
| COMMON STOCKS - CONT’D | | |
| E*Trade Financial Corp. | 695 |
| 30,365 |
|
| Evercore, Inc., Class A | 203 |
| 16,260 |
|
| FactSet Research Systems, Inc. | 271 |
| 65,845 |
|
| Houlihan Lokey, Inc. | 244 |
| 11,004 |
|
| Interactive Brokers Group, Inc., Class A | 162 |
| 8,712 |
|
| Intercontinental Exchange, Inc. | 1,792 |
| 165,348 |
|
| Legg Mason, Inc. | 270 |
| 10,311 |
|
| LPL Financial Holdings, Inc. | 298 |
| 24,406 |
|
| MarketAxess Holdings, Inc. | 299 |
| 97,922 |
|
| Moody’s Corp. | 1,267 |
| 259,520 |
|
| Morningstar, Inc. | 167 |
| 24,405 |
|
| MSCI, Inc. | 623 |
| 135,658 |
|
| Nasdaq, Inc. | 373 |
| 37,058 |
|
| S&P Global, Inc. | 1,917 |
| 469,627 |
|
| SEI Investments Co. | 814 |
| 48,234 |
|
| T. Rowe Price Group, Inc. | 1,008 |
| 115,164 |
|
| TD Ameritrade Holding Corp. | 753 |
| 35,165 |
|
| | | 2,162,277 |
|
| | | |
| Chemicals - 1.5% | | |
| Air Products & Chemicals, Inc. | 1,177 |
| 261,129 |
|
| Axalta Coating Systems Ltd. (1) | 2,606 |
| 78,571 |
|
| Ecolab, Inc. | 2,093 |
| 414,498 |
|
| International Flavors & Fragrances, Inc. (2) | 934 |
| 114,593 |
|
| PPG Industries, Inc. | 936 |
| 110,925 |
|
| Sensient Technologies Corp. | 134 |
| 9,199 |
|
| Sherwin-Williams Co. (The) | 751 |
| 412,952 |
|
| | | 1,401,867 |
|
| | | |
| Commercial Services & Supplies - 0.9% | | |
| ADT, Inc. (2) | 1,603 |
| 10,051 |
|
| Cintas Corp. | 586 |
| 157,107 |
|
| Copart, Inc. (1) | 1,311 |
| 105,313 |
|
| IAA, Inc. (1) | 561 |
| 23,410 |
|
| KAR Auction Services, Inc. | 561 |
| 13,772 |
|
| MSA Safety, Inc. | 379 |
| 41,353 |
|
| Republic Services, Inc. | 989 |
| 85,598 |
|
| Tetra Tech, Inc. | 433 |
| 37,567 |
|
| UniFirst Corp. | 48 |
| 9,366 |
|
| Waste Management, Inc. | 3,180 |
| 365,700 |
|
| | | 849,237 |
|
| | | |
| Communications Equipment - 0.7% | | |
| Arista Networks, Inc. (1) | 379 |
| 90,551 |
|
| Ciena Corp. (1) | 976 |
| 38,289 |
|
| Cisco Systems, Inc. | 3,671 |
| 181,384 |
|
| CommScope Holding Co., Inc. (1) | 828 |
| 9,737 |
|
www.calvert.com CALVERT US LARGE-CAP GROWTH RESPONSIBLE INDEX FUND ANNUAL REPORT 9
|
| | | | |
| | SHARES | VALUE ($) |
| COMMON STOCKS - CONT’D | | |
| F5 Networks, Inc. (1) | 418 |
| 58,696 |
|
| Lumentum Holdings, Inc. (1) | 507 |
| 27,155 |
|
| Motorola Solutions, Inc. | 1,306 |
| 222,555 |
|
| ViaSat, Inc. (1) | 323 |
| 24,328 |
|
| Viavi Solutions, Inc. (1) | 860 |
| 12,044 |
|
| | | 664,739 |
|
| | | |
| Construction & Engineering - 0.0% (3) | | |
| EMCOR Group, Inc. | 88 |
| 7,579 |
|
| | | |
| Consumer Finance - 0.3% | | |
| American Express Co. | 1,539 |
| 182,033 |
|
| Credit Acceptance Corp. (1) | 78 |
| 35,982 |
|
| FirstCash, Inc. | 259 |
| 23,743 |
|
| | | 241,758 |
|
| | | |
| Containers & Packaging - 0.7% | | |
| AptarGroup, Inc. | 700 |
| 82,915 |
|
| Ardagh Group S.A. | 767 |
| 12,027 |
|
| Avery Dennison Corp. | 987 |
| 112,094 |
|
| Ball Corp. | 4,098 |
| 298,375 |
|
| Berry Global Group, Inc. (1) | 762 |
| 29,924 |
|
| Crown Holdings, Inc. (1) | 506 |
| 33,426 |
|
| Sealed Air Corp. | 316 |
| 13,117 |
|
| Sonoco Products Co. | 153 |
| 8,906 |
|
| | | 590,784 |
|
| | | |
| Distributors - 0.1% | | |
| Genuine Parts Co. | 97 |
| 9,660 |
|
| LKQ Corp. (1) | 587 |
| 18,461 |
|
| Pool Corp. | 247 |
| 49,820 |
|
| | | 77,941 |
|
| | | |
| Diversified Consumer Services - 0.2% | | |
| Bright Horizons Family Solutions, Inc. (1) | 491 |
| 74,877 |
|
| Chegg, Inc. (1) | 442 |
| 13,238 |
|
| frontdoor, Inc. (1) | 623 |
| 30,259 |
|
| Grand Canyon Education, Inc. (1) | 387 |
| 38,003 |
|
| Service Corp. International | 344 |
| 16,447 |
|
| ServiceMaster Global Holdings, Inc. (1) | 467 |
| 26,105 |
|
| Strategic Education, Inc. | 104 |
| 14,132 |
|
| | | 213,061 |
|
| | | |
10 www.calvert.com CALVERT US LARGE-CAP GROWTH RESPONSIBLE INDEX FUND ANNUAL REPORT
|
| | | | |
| | SHARES | VALUE ($) |
| COMMON STOCKS - CONT’D | | |
| Diversified Telecommunication Services - 0.1% | | |
| Iridium Communications, Inc. (1) | 632 |
| 13,449 |
|
| Vonage Holdings Corp. (1) | 1,667 |
| 18,837 |
|
| Zayo Group Holdings, Inc. (1) | 1,697 |
| 57,528 |
|
| | | 89,814 |
|
| | | |
| Electric Utilities - 0.8% | | |
| Alliant Energy Corp. | 201 |
| 10,840 |
|
| Eversource Energy | 130 |
| 11,111 |
|
| NextEra Energy, Inc. | 2,770 |
| 645,383 |
|
| Xcel Energy, Inc. | 370 |
| 24,009 |
|
| | | 691,343 |
|
| | | |
| Electrical Equipment - 0.5% | | |
| Acuity Brands, Inc. | 265 |
| 35,719 |
|
| AMETEK, Inc. | 2,517 |
| 231,111 |
|
| Emerson Electric Co. | 532 |
| 35,570 |
|
| Generac Holdings, Inc. (1) | 634 |
| 49,668 |
|
| Hubbell, Inc. | 161 |
| 21,155 |
|
| nVent Electric plc | 528 |
| 11,637 |
|
| Rockwell Automation, Inc. | 645 |
| 106,296 |
|
| | | 491,156 |
|
| | | |
| Electronic Equipment, Instruments & Components - 1.1% | | |
| Amphenol Corp., Class A | 3,162 |
| 305,133 |
|
| CDW Corp. | 860 |
| 105,986 |
|
| Corning, Inc. | 2,364 |
| 67,421 |
|
| Dolby Laboratories, Inc., Class A | 182 |
| 11,765 |
|
| FLIR Systems, Inc. | 561 |
| 29,503 |
|
| IPG Photonics Corp. (1) | 225 |
| 30,510 |
|
| Keysight Technologies, Inc. (1) | 2,425 |
| 235,831 |
|
| National Instruments Corp. | 486 |
| 20,407 |
|
| Novanta, Inc. (1) | 417 |
| 34,077 |
|
| Trimble, Inc. (1) | 3,091 |
| 119,962 |
|
| Zebra Technologies Corp., Class A (1) | 373 |
| 76,976 |
|
| | | 1,037,571 |
|
| | | |
| Energy Equipment & Services - 0.0% (3) | | |
| Baker Hughes, a GE Co. | 798 |
| 18,514 |
|
| | | |
| Entertainment - 2.4% | | |
| Activision Blizzard, Inc. | 3,644 |
| 192,840 |
|
| Cinemark Holdings, Inc. | 270 |
| 10,433 |
|
| Electronic Arts, Inc. (1) | 2,059 |
| 201,411 |
|
| Liberty Formula One, Series A (1) | 203 |
| 8,037 |
|
| Lions Gate Entertainment Corp., Class A | 834 |
| 7,715 |
|
| Live Nation Entertainment, Inc. (1) | 1,064 |
| 70,586 |
|
www.calvert.com CALVERT US LARGE-CAP GROWTH RESPONSIBLE INDEX FUND ANNUAL REPORT 11
|
| | | | |
| | SHARES | VALUE ($) |
| COMMON STOCKS - CONT’D | | |
| Madison Square Garden Co. (The), Class A (1) | 97 |
| 25,561 |
|
| Netflix, Inc. (1) | 3,070 |
| 821,593 |
|
| Take-Two Interactive Software, Inc. (1) | 880 |
| 110,299 |
|
| Walt Disney Co. (The) | 5,182 |
| 675,318 |
|
| World Wrestling Entertainment, Inc., Class A (2) | 325 |
| 23,124 |
|
| Zynga, Inc., Class A (1) | 6,036 |
| 35,130 |
|
| | | 2,182,047 |
|
| | | |
| Food & Staples Retailing - 0.9% | | |
| Costco Wholesale Corp. | 1,580 |
| 455,214 |
|
| Sysco Corp. | 1,825 |
| 144,905 |
|
| Walmart, Inc. | 1,722 |
| 204,367 |
|
| | | 804,486 |
|
| | | |
| Food Products - 1.3% | | |
| Campbell Soup Co. | 776 |
| 36,410 |
|
| Darling Ingredients, Inc. (1) | 1,569 |
| 30,015 |
|
| Flowers Foods, Inc. | 330 |
| 7,633 |
|
| General Mills, Inc. | 796 |
| 43,876 |
|
| Hershey Co. (The) | 1,633 |
| 253,099 |
|
| Hormel Foods Corp. (2) | 1,176 |
| 51,426 |
|
| J&J Snack Foods Corp. | 140 |
| 26,880 |
|
| JM Smucker Co. (The) | 302 |
| 33,226 |
|
| Kellogg Co. | 278 |
| 17,889 |
|
| Lamb Weston Holdings, Inc. | 1,510 |
| 109,807 |
|
| Lancaster Colony Corp. | 143 |
| 19,827 |
|
| McCormick & Co., Inc. | 1,242 |
| 194,125 |
|
| Mondelez International, Inc., Class A | 4,807 |
| 265,923 |
|
| Post Holdings, Inc. (1) | 392 |
| 41,489 |
|
| TreeHouse Foods, Inc. (1) | 182 |
| 10,092 |
|
| | | 1,141,717 |
|
| | | |
| Gas Utilities - 0.1% | | |
| Atmos Energy Corp. | 95 |
| 10,820 |
|
| New Jersey Resources Corp. | 398 |
| 17,998 |
|
| ONE Gas, Inc. | 110 |
| 10,572 |
|
| UGI Corp. | 561 |
| 28,201 |
|
| | | 67,591 |
|
| | | |
| Health Care Equipment & Supplies - 6.2% | | |
| Abbott Laboratories | 12,321 |
| 1,030,898 |
|
| ABIOMED, Inc. (1) | 399 |
| 70,978 |
|
| Align Technology, Inc. (1) | 635 |
| 114,884 |
|
| Baxter International, Inc. | 3,020 |
| 264,159 |
|
| Becton Dickinson and Co. | 2,152 |
| 544,370 |
|
| Boston Scientific Corp. (1) | 12,110 |
| 492,756 |
|
| Cantel Medical Corp. | 352 |
| 26,330 |
|
12 www.calvert.com CALVERT US LARGE-CAP GROWTH RESPONSIBLE INDEX FUND ANNUAL REPORT
|
| | | | |
| | SHARES | VALUE ($) |
| COMMON STOCKS - CONT’D | | |
| Cooper Cos., Inc. (The) | 450 |
| 133,650 |
|
| Danaher Corp. | 3,696 |
| 533,813 |
|
| DENTSPLY SIRONA, Inc. | 1,127 |
| 60,080 |
|
| DexCom, Inc. (1) | 905 |
| 135,062 |
|
| Edwards Lifesciences Corp. (1) | 1,756 |
| 386,162 |
|
| Globus Medical, Inc., Class A (1) | 664 |
| 33,944 |
|
| Haemonetics Corp. (1) | 451 |
| 56,889 |
|
| Hill-Rom Holdings, Inc. | 602 |
| 63,348 |
|
| Hologic, Inc. (1) | 2,355 |
| 118,904 |
|
| ICU Medical, Inc. (1) | 142 |
| 22,663 |
|
| IDEXX Laboratories, Inc. (1) | 805 |
| 218,904 |
|
| Insulet Corp. (1) | 550 |
| 90,712 |
|
| Integra LifeSciences Holdings Corp. (1) | 542 |
| 32,558 |
|
| Intuitive Surgical, Inc. (1) | 956 |
| 516,173 |
|
| Masimo Corp. (1) | 435 |
| 64,724 |
|
| Merit Medical Systems, Inc. (1) | 388 |
| 11,819 |
|
| Neogen Corp. (1) | 429 |
| 29,219 |
|
| Novocure Ltd. (1) | 167 |
| 12,488 |
|
| NuVasive, Inc. (1) | 420 |
| 26,620 |
|
| Penumbra, Inc. (1)(2) | 283 |
| 38,061 |
|
| ResMed, Inc. | 1,305 |
| 176,319 |
|
| STERIS plc | 623 |
| 90,017 |
|
| Teleflex, Inc. | 437 |
| 148,471 |
|
| Varian Medical Systems, Inc. (1) | 583 |
| 69,429 |
|
| West Pharmaceutical Services, Inc. | 577 |
| 81,830 |
|
| | | 5,696,234 |
|
| | | |
| Health Care Providers & Services - 0.8% | | |
| Acadia Healthcare Co., Inc. (1) | 411 |
| 12,774 |
|
| Amedisys, Inc. (1) | 249 |
| 32,622 |
|
| Anthem, Inc. | 325 |
| 78,033 |
|
| Centene Corp. (1) | 624 |
| 26,994 |
|
| Chemed Corp. | 135 |
| 56,372 |
|
| Covetrus, Inc. (1)(2) | 605 |
| 7,193 |
|
| DaVita, Inc. (1) | 1,053 |
| 60,095 |
|
| Encompass Health Corp. | 354 |
| 22,401 |
|
| Ensign Group, Inc. (The) | 354 |
| 16,790 |
|
| HCA Healthcare, Inc. | 751 |
| 90,435 |
|
| HealthEquity, Inc. (1) | 490 |
| 28,001 |
|
| Henry Schein, Inc. (1) | 420 |
| 26,670 |
|
| Humana, Inc. | 203 |
| 51,901 |
|
| Laboratory Corp. of America Holdings (1) | 353 |
| 59,304 |
|
| LHC Group, Inc. (1) | 214 |
| 24,302 |
|
| Molina Healthcare, Inc. (1) | 61 |
| 6,693 |
|
| | | |
www.calvert.com CALVERT US LARGE-CAP GROWTH RESPONSIBLE INDEX FUND ANNUAL REPORT 13
|
| | | | |
| | SHARES | VALUE ($) |
| COMMON STOCKS - CONT’D | | |
| Premier, Inc., Class A (1) | 569 |
| 16,456 |
|
| Quest Diagnostics, Inc. | 205 |
| 21,941 |
|
| WellCare Health Plans, Inc. (1) | 283 |
| 73,345 |
|
| | | 712,322 |
|
| | | |
| Health Care Technology - 0.4% | | |
| Cerner Corp. | 2,360 |
| 160,881 |
|
| Medidata Solutions, Inc. (1) | 484 |
| 44,286 |
|
| Omnicell, Inc. (1) | 262 |
| 18,935 |
|
| Veeva Systems, Inc., Class A (1) | 1,112 |
| 169,791 |
|
| | | 393,893 |
|
| | | |
| Hotels, Restaurants & Leisure - 2.6% | | |
| Chipotle Mexican Grill, Inc. (1) | 304 |
| 255,503 |
|
| Choice Hotels International, Inc. | 220 |
| 19,571 |
|
| Cracker Barrel Old Country Store, Inc. (2) | 61 |
| 9,922 |
|
| Darden Restaurants, Inc. | 759 |
| 89,729 |
|
| Domino’s Pizza, Inc. | 410 |
| 100,282 |
|
| Dunkin’ Brands Group, Inc. | 847 |
| 67,218 |
|
| Extended Stay America, Inc. | 585 |
| 8,564 |
|
| Hilton Worldwide Holdings, Inc. | 1,674 |
| 155,866 |
|
| Hyatt Hotels Corp., Class A | 116 |
| 8,546 |
|
| Marriott International, Inc., Class A | 1,258 |
| 156,457 |
|
| Marriott Vacations Worldwide Corp. | 228 |
| 23,623 |
|
| Planet Fitness, Inc., Class A (1) | 702 |
| 40,625 |
|
| Royal Caribbean Cruises Ltd. | 275 |
| 29,791 |
|
| Six Flags Entertainment Corp. | 175 |
| 8,888 |
|
| Starbucks Corp. | 9,059 |
| 800,997 |
|
| Texas Roadhouse, Inc. | 376 |
| 19,748 |
|
| Vail Resorts, Inc. | 204 |
| 46,422 |
|
| Wendy’s Co. (The) | 454 |
| 9,071 |
|
| Wyndham Hotels & Resorts, Inc. | 660 |
| 34,148 |
|
| Yum China Holdings, Inc. | 3,524 |
| 160,095 |
|
| Yum! Brands, Inc. | 3,171 |
| 359,687 |
|
| | | 2,404,753 |
|
| | | |
| Household Durables - 0.1% | | |
| Helen of Troy Ltd. (1) | 146 |
| 23,018 |
|
| Roku, Inc. (1)(2) | 600 |
| 61,056 |
|
| Tempur Sealy International, Inc. (1) | 230 |
| 17,756 |
|
| Whirlpool Corp. | 52 |
| 8,235 |
|
| | | 110,065 |
|
| | | |
| Household Products - 1.9% | | |
| Church & Dwight Co., Inc. | 1,791 |
| 134,755 |
|
| Clorox Co. (The) | 679 |
| 103,120 |
|
| Colgate-Palmolive Co. | 5,649 |
| 415,258 |
|
14 www.calvert.com CALVERT US LARGE-CAP GROWTH RESPONSIBLE INDEX FUND ANNUAL REPORT
|
| | | | |
| | SHARES | VALUE ($) |
| COMMON STOCKS - CONT’D | | |
| Energizer Holdings, Inc. (2) | 359 |
| 15,645 |
|
| Kimberly-Clark Corp. | 1,491 |
| 211,796 |
|
| Procter & Gamble Co. (The) | 7,029 |
| 874,267 |
|
| | | 1,754,841 |
|
| | | |
| Independent Power and Renewable Electricity Producers - 0.0% (3) | | |
| Clearway Energy, Inc., Class C | 754 |
| 13,760 |
|
| Ormat Technologies, Inc. | 341 |
| 25,333 |
|
| | | 39,093 |
|
| | | |
| Industrial Conglomerates - 0.9% | | |
| 3M Co. | 2,271 |
| 373,352 |
|
| Carlisle Cos., Inc. | 555 |
| 80,775 |
|
| Roper Technologies, Inc. | 1,020 |
| 363,732 |
|
| | | 817,859 |
|
| | | |
| Insurance - 0.9% | | |
| Alleghany Corp. (1) | 16 |
| 12,764 |
|
| Arch Capital Group Ltd. (1) | 215 |
| 9,026 |
|
| Arthur J. Gallagher & Co. | 416 |
| 37,261 |
|
| Axis Capital Holdings Ltd. | 395 |
| 26,354 |
|
| Brighthouse Financial, Inc. (1) | 581 |
| 23,513 |
|
| Brown & Brown, Inc. | 1,007 |
| 36,313 |
|
| Erie Indemnity Co., Class A | 119 |
| 22,092 |
|
| Everest Re Group Ltd. | 204 |
| 54,282 |
|
| Kemper Corp. | 125 |
| 9,744 |
|
| Marsh & McLennan Cos., Inc. | 3,052 |
| 305,353 |
|
| Primerica, Inc. | 125 |
| 15,904 |
|
| Progressive Corp. (The) | 1,464 |
| 113,094 |
|
| RenaissanceRe Holdings Ltd. | 97 |
| 18,765 |
|
| RLI Corp. | 112 |
| 10,406 |
|
| Selective Insurance Group, Inc. | 112 |
| 8,421 |
|
| Willis Towers Watson plc | 553 |
| 106,712 |
|
| | | 810,004 |
|
| | | |
| Interactive Media & Services - 5.3% | | |
| Alphabet, Inc., Class A (1) | 3,664 |
| 4,474,257 |
|
| ANGI Homeservices, Inc., Class A (1)(2) | 674 |
| 4,775 |
|
| Cargurus, Inc. (1)(2) | 526 |
| 16,280 |
|
| IAC/InterActiveCorp (1) | 643 |
| 140,155 |
|
| Match Group, Inc. (2) | 472 |
| 33,719 |
|
| TripAdvisor, Inc. (1) | 771 |
| 29,822 |
|
| Twitter, Inc. (1) | 4,124 |
| 169,909 |
|
| | | 4,868,917 |
|
| | | |
www.calvert.com CALVERT US LARGE-CAP GROWTH RESPONSIBLE INDEX FUND ANNUAL REPORT 15
|
| | | | |
| | SHARES | VALUE ($) |
| COMMON STOCKS - CONT’D | | |
| Internet & Direct Marketing Retail - 6.1% | | |
| Amazon.com, Inc. (1) | 2,672 |
| 4,638,351 |
|
| Booking Holdings, Inc. (1) | 293 |
| 575,045 |
|
| eBay, Inc. | 3,715 |
| 144,811 |
|
| Etsy, Inc. (1) | 730 |
| 41,245 |
|
| Expedia Group, Inc. | 970 |
| 130,378 |
|
| GrubHub, Inc. (1)(2) | 618 |
| 34,738 |
|
| Wayfair, Inc., Class A (1)(2) | 311 |
| 34,869 |
|
| | | 5,599,437 |
|
| | | |
| IT Services - 9.5% | | |
| Accenture plc, Class A | 4,723 |
| 908,469 |
|
| Akamai Technologies, Inc. (1) | 1,121 |
| 102,437 |
|
| Amdocs Ltd. | 527 |
| 34,840 |
|
| Automatic Data Processing, Inc. | 2,927 |
| 472,476 |
|
| Black Knight, Inc. (1) | 1,006 |
| 61,427 |
|
| Booz Allen Hamilton Holding Corp. | 783 |
| 55,609 |
|
| Broadridge Financial Solutions, Inc. | 914 |
| 113,729 |
|
| Cognizant Technology Solutions Corp., Class A | 2,786 |
| 167,898 |
|
| CoreLogic, Inc. (1) | 466 |
| 21,562 |
|
| EPAM Systems, Inc. (1) | 419 |
| 76,392 |
|
| Fidelity National Information Services, Inc. | 4,687 |
| 622,246 |
|
| Fiserv, Inc. (1) | 4,362 |
| 451,860 |
|
| Gartner, Inc. (1) | 572 |
| 81,790 |
|
| Genpact Ltd. | 1,234 |
| 47,818 |
|
| GoDaddy, Inc., Class A (1) | 992 |
| 65,452 |
|
| Jack Henry & Associates, Inc. | 502 |
| 73,277 |
|
| MasterCard, Inc., Class A | 6,088 |
| 1,653,318 |
|
| MAXIMUS, Inc. | 289 |
| 22,328 |
|
| MongoDB, Inc. (1)(2) | 386 |
| 46,505 |
|
| Okta, Inc. (1) | 979 |
| 96,392 |
|
| Paychex, Inc. | 1,961 |
| 162,312 |
|
| PayPal Holdings, Inc. (1) | 7,605 |
| 787,802 |
|
| Perspecta, Inc. | 903 |
| 23,586 |
|
| Sabre Corp. | 496 |
| 11,108 |
|
| Science Applications International Corp. | 168 |
| 14,675 |
|
| Square, Inc., Class A (1)(2) | 2,637 |
| 163,362 |
|
| Twilio, Inc., Class A (1)(2) | 1,031 |
| 113,369 |
|
| VeriSign, Inc. (1) | 924 |
| 174,294 |
|
| Visa, Inc., Class A | 11,570 |
| 1,990,156 |
|
| WEX, Inc. (1) | 315 |
| 63,652 |
|
| | | 8,680,141 |
|
| | | |
16 www.calvert.com CALVERT US LARGE-CAP GROWTH RESPONSIBLE INDEX FUND ANNUAL REPORT
|
| | | | |
| | SHARES | VALUE ($) |
| COMMON STOCKS - CONT’D | | |
| Leisure Products - 0.1% | | |
| Brunswick Corp. | 474 |
| 24,705 |
|
| Hasbro, Inc. | 339 |
| 40,236 |
|
| Mattel, Inc. (1)(2) | 887 |
| 10,103 |
|
| | | 75,044 |
|
| | | |
| Life Sciences Tools & Services - 2.3% | | |
| Agilent Technologies, Inc. | 1,367 |
| 104,753 |
|
| Bio-Rad Laboratories, Inc., Class A (1) | 82 |
| 27,285 |
|
| Bio-Techne Corp. | 316 |
| 61,832 |
|
| Bruker Corp. | 876 |
| 38,483 |
|
| Charles River Laboratories International, Inc. (1) | 414 |
| 54,801 |
|
| Illumina, Inc. (1) | 1,145 |
| 348,332 |
|
| IQVIA Holdings, Inc. (1) | 1,513 |
| 226,012 |
|
| Mettler-Toledo International, Inc. (1) | 195 |
| 137,358 |
|
| PerkinElmer, Inc. | 880 |
| 74,949 |
|
| PRA Health Sciences, Inc. (1) | 552 |
| 54,775 |
|
| Syneos Health, Inc. (1) | 561 |
| 29,851 |
|
| Thermo Fisher Scientific, Inc. | 2,844 |
| 828,372 |
|
| Waters Corp. (1) | 532 |
| 118,758 |
|
| | | 2,105,561 |
|
| | | |
| Machinery - 2.7% | | |
| Allison Transmission Holdings, Inc. | 1,083 |
| 50,955 |
|
| Caterpillar, Inc. | 1,357 |
| 171,403 |
|
| Colfax Corp. (1) | 386 |
| 11,217 |
|
| Crane Co. | 108 |
| 8,708 |
|
| Deere & Co. | 637 |
| 107,449 |
|
| Donaldson Co., Inc. | 949 |
| 49,424 |
|
| Dover Corp. | 933 |
| 92,889 |
|
| Flowserve Corp. | 477 |
| 22,281 |
|
| Fortive Corp. | 602 |
| 41,273 |
|
| Gardner Denver Holdings, Inc. (1) | 1,478 |
| 41,813 |
|
| Graco, Inc. | 2,121 |
| 97,651 |
|
| IDEX Corp. | 815 |
| 133,562 |
|
| Illinois Tool Works, Inc. | 2,217 |
| 346,938 |
|
| Ingersoll-Rand plc | 1,646 |
| 202,804 |
|
| ITT, Inc. | 255 |
| 15,603 |
|
| John Bean Technologies Corp. | 371 |
| 36,889 |
|
| Lincoln Electric Holdings, Inc. | 528 |
| 45,809 |
|
| Middleby Corp. (The) (1) | 627 |
| 73,296 |
|
| Nordson Corp. | 546 |
| 79,858 |
|
| Parker-Hannifin Corp. | 298 |
| 53,822 |
|
| Pentair plc | 262 |
| 9,904 |
|
| RBC Bearings, Inc. (1) | 311 |
| 51,598 |
|
| Rexnord Corp. (1) | 1,134 |
| 30,675 |
|
| Snap-on, Inc. (2) | 84 |
| 13,149 |
|
www.calvert.com CALVERT US LARGE-CAP GROWTH RESPONSIBLE INDEX FUND ANNUAL REPORT 17
|
| | | | |
| | SHARES | VALUE ($) |
| COMMON STOCKS - CONT’D | | |
| Stanley Black & Decker, Inc. | 1,174 |
| 169,537 |
|
| Toro Co. (The) | 1,386 |
| 101,594 |
|
| WABCO Holdings, Inc. (1) | 628 |
| 83,995 |
|
| Wabtec Corp. (2) | 705 |
| 50,661 |
|
| Watts Water Technologies, Inc., Class A | 111 |
| 10,404 |
|
| Woodward, Inc. | 659 |
| 71,060 |
|
| Xylem, Inc. | 1,840 |
| 146,501 |
|
| | | 2,422,722 |
|
| | | |
| Media - 1.4% | | |
| Altice USA, Inc., Class A (1) | 2,650 |
| 76,002 |
|
| Cable One, Inc. | 31 |
| 38,896 |
|
| Charter Communications, Inc., Class A (1) | 1,123 |
| 462,811 |
|
| Comcast Corp., Class A | 7,948 |
| 358,296 |
|
| Discovery, Inc., Class A (1)(2) | 2,685 |
| 71,501 |
|
| Liberty Broadband Corp., Class A (1) | 1,235 |
| 129,082 |
|
| Liberty Latin America Ltd., Class C (1) | 530 |
| 9,060 |
|
| New York Times Co. (The), Class A (2) | 860 |
| 24,493 |
|
| Nexstar Media Group, Inc., Class A | 158 |
| 16,165 |
|
| Sinclair Broadcast Group, Inc., Class A | 188 |
| 8,035 |
|
| Sirius XM Holdings, Inc. (2) | 11,482 |
| 71,820 |
|
| | | 1,266,161 |
|
| | | |
| Multi-Utilities - 0.3% | | |
| Ameren Corp. | 130 |
| 10,406 |
|
| CenterPoint Energy, Inc. | 3,227 |
| 97,391 |
|
| CMS Energy Corp. | 727 |
| 46,492 |
|
| Sempra Energy | 974 |
| 143,772 |
|
| | | 298,061 |
|
| | | |
| Multiline Retail - 0.3% | | |
| Dollar General Corp. | 1,367 |
| 217,271 |
|
| Ollie’s Bargain Outlet Holdings, Inc. (1)(2) | 332 |
| 19,468 |
|
| | | 236,739 |
|
| | | |
| Personal Products - 0.4% | | |
| Coty, Inc., Class A | 1,075 |
| 11,298 |
|
| Estee Lauder Cos., Inc. (The), Class A | 1,522 |
| 302,802 |
|
| | | 314,100 |
|
| | | |
| Pharmaceuticals - 4.0% | | |
| Bristol-Myers Squibb Co. | 8,435 |
| 427,739 |
|
| Catalent, Inc. (1) | 1,156 |
| 55,095 |
|
| Elanco Animal Health, Inc. (1) | 1,190 |
| 31,642 |
|
| Eli Lilly & Co. | 6,575 |
| 735,282 |
|
| Horizon Therapeutics plc (1) | 1,728 |
| 47,054 |
|
| Jazz Pharmaceuticals plc (1) | 459 |
| 58,816 |
|
18 www.calvert.com CALVERT US LARGE-CAP GROWTH RESPONSIBLE INDEX FUND ANNUAL REPORT
|
| | | | |
| | SHARES | VALUE ($) |
| COMMON STOCKS - CONT’D | | |
| Merck & Co., Inc. | 12,480 |
| 1,050,566 |
|
| Nektar Therapeutics (1)(2) | 1,222 |
| 22,259 |
|
| Perrigo Co. plc | 687 |
| 38,396 |
|
| Pfizer, Inc. | 17,590 |
| 632,009 |
|
| Zoetis, Inc. | 4,254 |
| 530,006 |
|
| | | 3,628,864 |
|
| | | |
| Professional Services - 0.9% | | |
| CoStar Group, Inc. (1) | 292 |
| 173,214 |
|
| Exponent, Inc. | 259 |
| 18,104 |
|
| FTI Consulting, Inc. (1) | 119 |
| 12,613 |
|
| IHS Markit Ltd. (1) | 2,743 |
| 183,452 |
|
| Insperity, Inc. | 284 |
| 28,008 |
|
| Nielsen Holdings plc | 1,894 |
| 40,248 |
|
| Robert Half International, Inc. | 529 |
| 29,444 |
|
| TransUnion | 1,428 |
| 115,825 |
|
| TriNet Group, Inc. (1) | 334 |
| 20,771 |
|
| Verisk Analytics, Inc. | 1,255 |
| 198,466 |
|
| | | 820,145 |
|
| | | |
| Real Estate Management & Development - 0.1% | | |
| CBRE Group, Inc., Class A (1) | 1,874 |
| 99,341 |
|
| | | |
| Road & Rail - 1.2% | | |
| AMERCO | 27 |
| 10,531 |
|
| Genesee & Wyoming, Inc., Class A (1) | 104 |
| 11,493 |
|
| JB Hunt Transport Services, Inc. | 441 |
| 48,797 |
|
| Kansas City Southern | 377 |
| 50,145 |
|
| Landstar System, Inc. | 261 |
| 29,383 |
|
| Norfolk Southern Corp. | 1,155 |
| 207,507 |
|
| Old Dominion Freight Line, Inc. | 545 |
| 92,634 |
|
| Union Pacific Corp. | 4,007 |
| 649,054 |
|
| | | 1,099,544 |
|
| | | |
| Semiconductors & Semiconductor Equipment - 5.3% | | |
| Advanced Micro Devices, Inc. (1)(2) | 7,763 |
| 225,049 |
|
| Analog Devices, Inc. | 2,118 |
| 236,644 |
|
| Applied Materials, Inc. | 6,147 |
| 306,735 |
|
| Broadcom, Inc. | 2,742 |
| 756,984 |
|
| Cabot Microelectronics Corp. | 216 |
| 30,501 |
|
| Cree, Inc. (1) | 271 |
| 13,279 |
|
| Cypress Semiconductor Corp. | 550 |
| 12,837 |
|
| Entegris, Inc. | 970 |
| 45,648 |
|
| Intel Corp. | 5,370 |
| 276,716 |
|
| KLA Corp. | 681 |
| 108,586 |
|
| Lam Research Corp. | 883 |
| 204,070 |
|
| Marvell Technology Group Ltd. | 2,305 |
| 57,556 |
|
www.calvert.com CALVERT US LARGE-CAP GROWTH RESPONSIBLE INDEX FUND ANNUAL REPORT 19
|
| | | | |
| | SHARES | VALUE ($) |
| COMMON STOCKS - CONT’D | | |
| Maxim Integrated Products, Inc. | 1,008 |
| 58,373 |
|
| Microchip Technology, Inc. (2) | 1,573 |
| 146,148 |
|
| Micron Technology, Inc. (1) | 4,354 |
| 186,569 |
|
| MKS Instruments, Inc. | 494 |
| 45,586 |
|
| Monolithic Power Systems, Inc. | 280 |
| 43,576 |
|
| NVIDIA Corp. | 3,892 |
| 677,481 |
|
| ON Semiconductor Corp. (1) | 1,608 |
| 30,890 |
|
| Qorvo, Inc. (1) | 804 |
| 59,609 |
|
| Silicon Laboratories, Inc. (1) | 317 |
| 35,298 |
|
| Skyworks Solutions, Inc. | 528 |
| 41,844 |
|
| Teradyne, Inc. | 1,797 |
| 104,064 |
|
| Texas Instruments, Inc. | 6,473 |
| 836,571 |
|
| Universal Display Corp. | 357 |
| 59,940 |
|
| Versum Materials, Inc. | 1,431 |
| 75,743 |
|
| Xilinx, Inc. | 1,846 |
| 177,031 |
|
| | | 4,853,328 |
|
| | | |
| Software - 13.9% | | |
| ACI Worldwide, Inc. (1) | 691 |
| 21,646 |
|
| Adobe, Inc. (1) | 3,512 |
| 970,190 |
|
| Alteryx, Inc., Class A (1)(2) | 477 |
| 51,244 |
|
| ANSYS, Inc. (1) | 606 |
| 134,144 |
|
| Appfolio, Inc., Class A (1)(2) | 102 |
| 9,704 |
|
| Aspen Technology, Inc. (1) | 546 |
| 67,202 |
|
| Autodesk, Inc. (1) | 1,193 |
| 176,206 |
|
| Blackbaud, Inc. | 369 |
| 33,335 |
|
| Blackline, Inc. (1) | 356 |
| 17,020 |
|
| Cadence Design Systems, Inc. (1) | 2,128 |
| 140,618 |
|
| CDK Global, Inc. | 881 |
| 42,367 |
|
| Ceridian HCM Holding, Inc. (1) | 519 |
| 25,623 |
|
| Citrix Systems, Inc. | 919 |
| 88,702 |
|
| Cornerstone OnDemand, Inc. (1) | 317 |
| 17,378 |
|
| Coupa Software, Inc. (1) | 485 |
| 62,841 |
|
| Envestnet, Inc. (1) | 349 |
| 19,788 |
|
| Fair Isaac Corp. (1) | 245 |
| 74,362 |
|
| FireEye, Inc. (1) | 765 |
| 10,205 |
|
| Five9, Inc. (1) | 471 |
| 25,312 |
|
| Fortinet, Inc. (1) | 1,095 |
| 84,052 |
|
| Guidewire Software, Inc. (1) | 456 |
| 48,053 |
|
| HubSpot, Inc. (1) | 355 |
| 53,822 |
|
| Intuit, Inc. | 2,020 |
| 537,199 |
|
| j2 Global, Inc. (2) | 355 |
| 32,241 |
|
| LogMeIn, Inc. | 296 |
| 21,004 |
|
| Manhattan Associates, Inc. (1) | 476 |
| 38,399 |
|
| Microsoft Corp. | 47,501 |
| 6,604,064 |
|
| New Relic, Inc. (1) | 377 |
| 23,167 |
|
| Nuance Communications, Inc. (1) | 911 |
| 14,858 |
|
20 www.calvert.com CALVERT US LARGE-CAP GROWTH RESPONSIBLE INDEX FUND ANNUAL REPORT
|
| | | | |
| | SHARES | VALUE ($) |
| COMMON STOCKS - CONT’D | | |
| Nutanix, Inc., Class A (1) | 970 |
| 25,463 |
|
| Oracle Corp. | 7,807 |
| 429,619 |
|
| Palo Alto Networks, Inc. (1) | 640 |
| 130,451 |
|
| Paycom Software, Inc. (1) | 436 |
| 91,338 |
|
| Paylocity Holding Corp. (1) | 255 |
| 24,883 |
|
| Pegasystems, Inc. | 232 |
| 15,788 |
|
| Proofpoint, Inc. (1) | 392 |
| 50,588 |
|
| PTC, Inc. (1) | 792 |
| 53,999 |
|
| Q2 Holdings, Inc. (1) | 364 |
| 28,709 |
|
| Qualys, Inc. (1) | 248 |
| 18,741 |
|
| RealPage, Inc. (1) | 559 |
| 35,139 |
|
| RingCentral, Inc., Class A (1) | 588 |
| 73,888 |
|
| salesforce.com, Inc. (1) | 6,244 |
| 926,859 |
|
| ServiceNow, Inc. (1) | 1,385 |
| 351,582 |
|
| SolarWinds Corp. (1)(2) | 532 |
| 9,815 |
|
| Splunk, Inc. (1) | 1,069 |
| 125,992 |
|
| SS&C Technologies Holdings, Inc. | 1,475 |
| 76,066 |
|
| Symantec Corp. | 4,274 |
| 100,995 |
|
| Synopsys, Inc. (1) | 1,143 |
| 156,877 |
|
| Teradata Corp. (1) | 808 |
| 25,048 |
|
| Trade Desk, Inc. (The), Class A (1)(2) | 333 |
| 62,454 |
|
| Tyler Technologies, Inc. (1) | 261 |
| 68,513 |
|
| Verint Systems, Inc. (1) | 475 |
| 20,321 |
|
| VMware, Inc., Class A | 565 |
| 84,784 |
|
| Workday, Inc., Class A (1) | 1,273 |
| 216,359 |
|
| Zendesk, Inc. (1) | 875 |
| 63,770 |
|
| | | 12,712,787 |
|
| | | |
| Specialty Retail - 4.0% | | |
| Aaron’s, Inc. | 164 |
| 10,539 |
|
| Advance Auto Parts, Inc. | 189 |
| 31,261 |
|
| American Eagle Outfitters, Inc. | 548 |
| 8,888 |
|
| AutoZone, Inc. (1) | 161 |
| 174,624 |
|
| Burlington Stores, Inc. (1) | 441 |
| 88,121 |
|
| CarMax, Inc. (1) | 296 |
| 26,048 |
|
| Five Below, Inc. (1) | 347 |
| 43,757 |
|
| Floor & Decor Holdings, Inc., Class A (1) | 432 |
| 22,097 |
|
| Home Depot, Inc. (The) | 7,119 |
| 1,651,750 |
|
| Lowe’s Cos., Inc. | 4,516 |
| 496,579 |
|
| O’Reilly Automotive, Inc. (1) | 482 |
| 192,082 |
|
| Ross Stores, Inc. | 2,364 |
| 259,685 |
|
| Tiffany & Co. (2) | 268 |
| 24,825 |
|
| TJX Cos., Inc. (The) | 7,942 |
| 442,687 |
|
| | | |
www.calvert.com CALVERT US LARGE-CAP GROWTH RESPONSIBLE INDEX FUND ANNUAL REPORT 21
|
| | | | |
| | SHARES | VALUE ($) |
| COMMON STOCKS - CONT’D | | |
| Tractor Supply Co. | 810 |
| 73,256 |
|
| Ulta Beauty, Inc. (1) | 389 |
| 97,503 |
|
| Williams-Sonoma, Inc. (2) | 117 |
| 7,954 |
|
| | | 3,651,656 |
|
| | | |
| Technology Hardware, Storage & Peripherals - 5.8% | | |
| Apple, Inc. | 22,117 |
| 4,953,544 |
|
| Dell Technologies, Class C (1) | 806 |
| 41,799 |
|
| Hewlett Packard Enterprise Co. | 8,636 |
| 131,008 |
|
| NCR Corp. (1) | 773 |
| 24,396 |
|
| NetApp, Inc. | 566 |
| 29,721 |
|
| Pure Storage, Inc., Class A (1) | 1,012 |
| 17,143 |
|
| Western Digital Corp. | 1,918 |
| 114,390 |
|
| | | 5,312,001 |
|
| | | |
| Textiles, Apparel & Luxury Goods - 1.0% | | |
| Capri Holdings Ltd. (1) | 254 |
| 8,423 |
|
| Carter’s, Inc. | 93 |
| 8,483 |
|
| Columbia Sportswear Co. | 98 |
| 9,495 |
|
| Deckers Outdoor Corp. (1) | 176 |
| 25,935 |
|
| lululemon Athletica, Inc. (1) | 743 |
| 143,050 |
|
| NIKE, Inc., Class B | 6,038 |
| 567,089 |
|
| Ralph Lauren Corp. | 77 |
| 7,351 |
|
| Skechers U.S.A., Inc., Class A (1) | 281 |
| 10,495 |
|
| Under Armour, Inc., Class A (1)(2) | 2,084 |
| 41,555 |
|
| VF Corp. | 1,284 |
| 114,263 |
|
| | | 936,139 |
|
| | | |
| Thrifts & Mortgage Finance - 0.1% | | |
| Essent Group Ltd. | 458 |
| 21,833 |
|
| LendingTree, Inc. (1)(2) | 44 |
| 13,659 |
|
| TFS Financial Corp. (2) | 442 |
| 7,965 |
|
| | | 43,457 |
|
| | | |
| Trading Companies & Distributors - 0.3% | | |
| Fastenal Co. | 3,559 |
| 116,273 |
|
| HD Supply Holdings, Inc. (1) | 931 |
| 36,472 |
|
| MSC Industrial Direct Co., Inc., Class A | 133 |
| 9,646 |
|
| United Rentals, Inc. (1) | 97 |
| 12,090 |
|
| Univar Solutions, Inc. (1) | 1,604 |
| 33,299 |
|
| W.W. Grainger, Inc. | 176 |
| 52,298 |
|
| | | 260,078 |
|
| | | |
| Transportation Infrastructure - 0.0% (3) | | |
| Macquarie Infrastructure Corp. | 248 |
| 9,789 |
|
| | | |
22 www.calvert.com CALVERT US LARGE-CAP GROWTH RESPONSIBLE INDEX FUND ANNUAL REPORT
|
| | | | |
| | SHARES | VALUE ($) |
| COMMON STOCKS - CONT’D | | |
| Water Utilities - 0.2% | | |
| American Water Works Co., Inc. | 987 |
| 122,615 |
|
| Aqua America, Inc. | 1,249 |
| 55,993 |
|
| | | 178,608 |
|
| | | |
| Wireless Telecommunication Services - 0.1% | | |
| Sprint Corp. (1) | 2,459 |
| 15,172 |
|
| T-Mobile US, Inc. (1) | 1,111 |
| 87,513 |
|
| | | 102,685 |
|
| | | |
| Total Common Stocks (Cost $66,578,032) | | 90,988,648 |
|
| | | |
| | SHARES | VALUE ($) |
| SHORT TERM INVESTMENT OF CASH COLLATERAL FOR SECURITIES LOANED - 0.4% | | |
| State Street Navigator Securities Lending Government Money Market Portfolio, 2.07% | 373,176 |
| 373,176 |
|
| | | |
| Total Short Term Investment of Cash Collateral for Securities Loaned (Cost $373,176) | | 373,176 |
|
| | | |
| | | |
| TOTAL INVESTMENTS (Cost $66,951,208) - 100.1% | | 91,361,824 |
|
| Other assets and liabilities, net - (0.1%) | | (52,604) |
|
NET ASSETS - 100.0% | | 91,309,220 |
|
|
|
| NOTES TO SCHEDULE OF INVESTMENTS |
| (1) Non-income producing security. |
| (2) All or a portion of this security was on loan at September 30, 2019. The aggregate market value of securities on loan at September 30, 2019 was $2,047,751. |
| (3) Amount is less than 0.05%. |
| See notes to financial statements. |
www.calvert.com CALVERT US LARGE-CAP GROWTH RESPONSIBLE INDEX FUND ANNUAL REPORT 23
CALVERT US LARGE-CAP GROWTH RESPONSIBLE INDEX FUND
STATEMENT OF ASSETS AND LIABILITIES
SEPTEMBER 30, 2019
|
| | | |
| ASSETS | |
Investments in securities of unaffiliated issuers, at value (identified cost $66,951,208) - including $2,047,751 of securities on loan |
| $91,361,824 |
|
| Cash | 374 |
|
| Receivable for investments sold | 1,506,058 |
|
| Receivable for capital shares sold | 370,394 |
|
| Dividends receivable | 39,764 |
|
| Securities lending income receivable | 353 |
|
| Receivable from affiliate | 13,543 |
|
| Directors’ deferred compensation plan | 37,332 |
|
| Other assets | 3,225 |
|
| Total assets | 93,332,867 |
|
| | |
| LIABILITIES | |
| Payable for investments purchased | 203,208 |
|
| Payable for capital shares redeemed | 21,988 |
|
| Deposits for securities loaned | 373,176 |
|
| Payable to affiliates: | |
| Investment advisory fee | 9,135 |
|
| Administrative fee | 9,135 |
|
| Distribution and service fees | 3,434 |
|
| Sub-transfer agency fee | 1,841 |
|
| Directors’ deferred compensation plan | 37,332 |
|
| Accrued expenses | 66,203 |
|
| Demand note payable | 1,298,195 |
|
| Total liabilities | 2,023,647 |
|
| NET ASSETS |
| $91,309,220 |
|
| | |
| NET ASSETS CONSIST OF: | |
| Paid-in capital applicable to common stock | |
| (75,000,000 shares per class of $0.01 par value authorized) |
| $66,366,365 |
|
| Distributable earnings | 24,942,855 |
|
| Total |
| $91,309,220 |
|
| | |
| NET ASSET VALUE PER SHARE | |
| Class A (based on net assets of $16,361,394 and 551,753 shares outstanding) |
| $29.65 |
|
| Class I (based on net assets of $74,947,826 and 2,508,556 shares outstanding) |
| $29.88 |
|
| | |
| OFFERING PRICE PER SHARE* | |
| Class A (100/95.25 of net asset value per share) |
| $31.13 |
|
| * On sales of $50,000 or more, the offering price of Class A shares is reduced. | |
| See notes to financial statements. |
24 www.calvert.com CALVERT US LARGE-CAP GROWTH RESPONSIBLE INDEX FUND ANNUAL REPORT
CALVERT US LARGE-CAP GROWTH RESPONSIBLE INDEX FUND
STATEMENT OF OPERATIONS
YEAR ENDED SEPTEMBER 30, 2019
|
| | | |
| INVESTMENT INCOME | |
| Dividend income (net of foreign taxes withheld of $62) |
| $975,163 |
|
| Interest income | 4,355 |
|
| Securities lending income, net | 3,824 |
|
| Total investment income | 983,342 |
|
| | |
| EXPENSES | |
| Investment advisory fee | 102,465 |
|
| Administrative fee | 95,452 |
|
| Distribution and service fees: | |
| Class A | 37,539 |
|
| Directors’ fees and expenses | 4,723 |
|
| Custodian fees | 40,185 |
|
| Transfer agency fees and expenses | 37,277 |
|
| Accounting fees | 18,873 |
|
| Professional fees | 30,274 |
|
| Registration fees | 53,127 |
|
| Reports to shareholders | 15,274 |
|
| Miscellaneous | 16,376 |
|
| Total expenses | 451,565 |
|
| Waiver and/or reimbursement of expenses by affiliate | (220,341) |
|
| Reimbursement of expenses-other | (1,955) |
|
| Net expenses | 229,269 |
|
| Net investment income | 754,073 |
|
| | |
| | |
| REALIZED AND UNREALIZED GAIN (LOSS) | |
| Net realized gain on investment securities | 442,366 |
|
| | |
| Net change in unrealized appreciation (depreciation) on investment securities | 3,588,965 |
|
| | |
| Net realized and unrealized gain | 4,031,331 |
|
| | |
| Net increase in net assets resulting from operations |
| $4,785,404 |
|
| See notes to financial statements. |
www.calvert.com CALVERT US LARGE-CAP GROWTH RESPONSIBLE INDEX FUND ANNUAL REPORT 25
CALVERT US LARGE-CAP GROWTH RESPONSIBLE INDEX FUND
STATEMENTS OF CHANGES IN NET ASSETS
|
| | | | | | | |
| INCREASE (DECREASE) IN NET ASSETS | Year Ended September 30, 2019 | | Year Ended September 30, 2018 |
| Operations: | | | |
| Net investment income |
| $754,073 |
| |
| $569,558 |
|
| Net realized gain | 442,366 |
| | 3,169,430 |
|
| Net change in unrealized appreciation (depreciation) | 3,588,965 |
| | 10,385,967 |
|
| Net increase in net assets resulting from operations | 4,785,404 |
| | 14,124,955 |
|
| | | | |
| Distributions to shareholders: | | | |
| Class A shares | (659,649) |
| | (179,504) |
|
| Class I shares | (2,888,632) |
| | (1,025,061) |
|
| Total distributions to shareholders | (3,548,281) |
| | (1,204,565) |
|
| | | | |
| Capital share transactions: | | | |
| Class A shares | 2,133,569 |
| | 5,729,907 |
|
Class C shares (1) | — |
| | (1,384,779) |
|
| Class I shares | 13,535,760 |
| | 8,997,243 |
|
Class Y shares (1) | — |
| | (3,565,268) |
|
| Net increase in net assets from capital share transactions | 15,669,329 |
| | 9,777,103 |
|
| | | | |
| TOTAL INCREASE IN NET ASSETS | 16,906,452 |
| | 22,697,493 |
|
| | | | |
| | | | |
| NET ASSETS | | | |
| Beginning of year | 74,402,768 |
| | 51,705,275 |
|
| End of year |
| $91,309,220 |
| |
| $74,402,768 |
|
| | | | |
| | | | |
(1) Effective December 8, 2017, Class C shares of the Fund converted to Class A shares and Class Y shares converted to Class I shares at net asset value. Thereafter, Class C shares and Class Y shares were terminated. |
| See notes to financial statements. |
26 www.calvert.com CALVERT US LARGE-CAP GROWTH RESPONSIBLE INDEX FUND ANNUAL REPORT
CALVERT US LARGE-CAP GROWTH RESPONSIBLE INDEX FUND
FINANCIAL HIGHLIGHTS
|
| | | | | | | | | | | | | | | |
| | Year Ended September 30, | | Period Ended September 30, | |
| CLASS A SHARES | 2019 | | 2018 | | 2017 | | 2016 | | 2015 (1) | |
| Net asset value, beginning | $29.83 | | $24.35 | | $20.66 | | $18.55 | | $20.00 | |
| Income from investment operations: | | | | | | | | | | |
Net investment income (2) | 0.20 |
| | 0.17 |
| | 0.21 |
| | 0.15 |
| | 0.03 |
| |
| Net realized and unrealized gain (loss) | 0.96 |
| | 5.84 |
| | 3.64 |
| | 2.00 |
| | (1.48) |
| |
| Total from investment operations | 1.16 |
| | 6.01 |
| | 3.85 |
| | 2.15 |
| | (1.45) |
| |
| Distributions from: | | | | | | | | | | |
| Net investment income | (0.20) |
| | (0.19) |
| | (0.16) |
| | (0.04) |
| | — |
| |
| Net realized gain | (1.14) |
| | (0.34) |
| | — |
| | — |
| (3) | — |
| |
| Total distributions | (1.34) |
| | (0.53) |
| | (0.16) |
| | (0.04) |
| | — |
| |
| Total increase (decrease) in net asset value | (0.18) |
| | 5.48 |
| | 3.69 |
| | 2.11 |
| | (1.45) |
| |
| Net asset value, ending | $29.65 | | $29.83 | | $24.35 | | $20.66 | | $18.55 | |
Total return (4) | 4.51 | % | | 25.03 | % | | 18.76 | % | | 11.63 | % | | (7.25 | %) | (5) |
Ratios to average net assets: (6) | | | | | | | | | | |
| Total expenses | 0.77 | % | | 0.82 | % | | 1.53 | % | | 1.45 | % | | 7.70 | % | (7) |
| Net expenses | 0.51 | % | | 0.57 | % | | 0.57 | % | | 0.57 | % | | 0.57 | % | (7) |
| Net investment income | 0.72 | % | | 0.63 | % | | 0.92 | % | | 0.77 | % | | 0.60 | % | (7) |
| Portfolio turnover | 34 | % | | 54 | % | | 75 | % | | 43 | % | | 3 | % | (5) |
| Net assets, ending (in thousands) | $16,361 | | $14,036 | | $6,214 | | $4,403 | | $2,100 | |
| | | | | | | | | | | |
(1) From June 19, 2015 inception. |
(2) Computed using average shares outstanding. |
(3) Amount is less than $0.005. |
(4) Returns are historical and are calculated by determining the percentage change in net asset value with all distributions reinvested and do not reflect the effect of sales charges, if any. |
(5) Not annualized. |
(6) Total expenses do not reflect amounts reimbursed and/or waived by the adviser and certain of its affiliates, if applicable. Net expenses are net of all reductions and represent the net expenses paid by the Fund. |
(7) Annualized. |
| See notes to financial statements. |
www.calvert.com CALVERT US LARGE-CAP GROWTH RESPONSIBLE INDEX FUND ANNUAL REPORT 27
CALVERT US LARGE-CAP GROWTH RESPONSIBLE INDEX FUND
FINANCIAL HIGHLIGHTS
|
| | | | | | | | | | | | | | | |
| | Year Ended September 30, | | Period Ended September 30, | |
| CLASS I SHARES | 2019 | | 2018 | | 2017 | | 2016 | | 2015 (1) | |
| Net asset value, beginning | $30.02 | | $24.45 | | $20.74 | | $18.57 | | $20.00 | |
| Income from investment operations: | | | | | | | | | | |
Net investment income (2) | 0.28 |
| | 0.26 |
| | 0.28 |
| | 0.22 |
| | 0.05 |
| |
| Net realized and unrealized gain (loss) | 0.97 |
| | 5.87 |
| | 3.66 |
| | 2.01 |
| | (1.48) |
| |
| Total from investment operations | 1.25 |
| | 6.13 |
| | 3.94 |
| | 2.23 |
| | (1.43) |
| |
| Distributions from: | | | | | | | | | | |
| Net investment income | (0.25) |
| | (0.22) |
| | (0.23) |
| | (0.06) |
| | — |
| |
| Net realized gain | (1.14) |
| | (0.34) |
| | — |
| | — |
| (3) | — |
| |
| Total distributions | (1.39) |
| | (0.56) |
| | (0.23) |
| | (0.06) |
| | — |
| |
| Total increase (decrease) in net asset value | (0.14) |
| | 5.57 |
| | 3.71 |
| | 2.17 |
| | (1.43) |
| |
| Net asset value, ending | $29.88 | | $30.02 | | $24.45 | | $20.74 | | $18.57 | |
Total return (4) | 4.82 | % | | 25.46 | % | | 19.20 | % | | 12.02 | % | | (7.15 | %) | (5) |
Ratios to average net assets: (6) | | | | | | | | | | |
| Total expenses | 0.52 | % | | 0.58 | % | | 0.58 | % | | 0.61 | % | | 7.16 | % | (7) |
| Net expenses | 0.24 | % | | 0.22 | % | | 0.22 | % | | 0.22 | % | | 0.22 | % | (7) |
| Net investment income | 1.00 | % | | 0.98 | % | | 1.26 | % | | 1.12 | % | | 0.95 | % | (7) |
| Portfolio turnover | 34 | % | | 54 | % | | 75 | % | | 43 | % | | 3 | % | (5) |
| Net assets, ending (in thousands) | $74,948 | | $60,367 | | $40,821 | | $38,646 | | $1,964 | |
| | | | | | | | | | | |
(1) From June 19, 2015 inception. |
(2) Computed using average shares outstanding. |
(3) Amount is less than $0.005. |
(4) Returns are historical and are calculated by determining the percentage change in net asset value with all distributions reinvested and do not reflect the effect of sales charges, if any. |
(5) Not annualized. |
(6) Total expenses do not reflect amounts reimbursed and/or waived by the adviser and certain of its affiliates, if applicable. Net expenses are net of all reductions and represent the net expenses paid by the Fund. |
(7) Annualized. |
| See notes to financial statements. |
28 www.calvert.com CALVERT US LARGE-CAP GROWTH RESPONSIBLE INDEX FUND ANNUAL REPORT
NOTES TO FINANCIAL STATEMENTS
NOTE 1 — SIGNIFICANT ACCOUNTING POLICIES
Calvert US Large-Cap Growth Responsible Index Fund (the Fund) is a diversified series of Calvert Responsible Index Series, Inc. (the Corporation). The Corporation is a Maryland corporation registered under the Investment Company Act of 1940, as amended (the 1940 Act), as an open-end management investment company. The investment objective of the Fund is to seek to track the performance of the Calvert US Large-Cap Growth Responsible Index, which measures the investment return of large-capitalization stocks.
The Fund offers two classes of shares. Class A shares are generally sold subject to a sales charge imposed at time of purchase. A contingent deferred sales charge of 0.25% may apply to certain redemptions of Class A shares for accounts for which no sales charge was paid, if redeemed within 12 months of purchase. Class I shares are sold at net asset value, are not subject to a sales charge and are sold only to certain eligible investors. Each class represents a pro rata interest in the Fund, but votes separately on class-specific matters and is subject to different expenses.
The Fund applies the accounting and reporting guidance in the Financial Accounting Standards Board (FASB) Accounting Standards Codification Topic 946, Financial Services – Investment Companies (ASC 946). Subsequent events, if any, through the date that the financial statements were issued have been evaluated in the preparation of the financial statements.
A. Investment Valuation: Net asset value per share is determined every business day as of the close of the regular session of the New York Stock Exchange (generally 4:00 p.m. Eastern time). The Fund uses independent pricing services approved by the Board of Directors (the Board) to value its investments wherever possible. Investments for which market quotations are not available or deemed not reliable are fair valued in good faith under the direction of the Board.
U.S. generally accepted accounting principles (U.S. GAAP) establishes a disclosure hierarchy that categorizes the inputs to valuation techniques used to value assets and liabilities at measurement date. These inputs are summarized in the three broad levels listed below:
Level 1 - quoted prices in active markets for identical securities
Level 2 - other significant observable inputs (including quoted prices for similar securities, interest rates, prepayment speeds, credit risk, etc.)
Level 3 - significant unobservable inputs (including the Fund’s own assumptions in determining the fair value of investments)
The inputs or methodologies used for valuing securities are not necessarily an indication of the risk associated with investing in those securities.
Valuation techniques used to value the Fund’s investments by major category are as follows:
Equity Securities. Equity securities (including warrants and rights) listed on a U.S. securities exchange generally are valued at the last sale or closing price as reported by an independent pricing service on the primary market or exchange on which they are traded and are categorized as Level 1 in the hierarchy. Equity securities listed on the NASDAQ Global or Global Select Market are valued at the NASDAQ official closing price and are categorized as Level 1 in the hierarchy. Unlisted or listed securities for which closing sales prices or closing quotations are not available are valued at the mean between the latest available bid and ask prices and are categorized as Level 2 in the hierarchy.
Other Securities. Investments in registered investment companies (including money market funds) that do not trade on an exchange are valued at the net asset value per share on the valuation day and are categorized as Level 1 in the hierarchy.
Fair Valuation. If a market value cannot be determined for a security using the methodologies described above, or if, in the good faith opinion of the Fund’s adviser, the market value does not constitute a readily available market quotation, or if a significant event has occurred that would materially affect the value of the security, the security will be fair valued as determined in good faith by or at the direction of the Board in a manner that most fairly reflects the security’s “fair value”, which is the amount that the Fund might reasonably expect to receive for the security upon its current sale in the ordinary course. Each such determination is based on a consideration of relevant factors, which are likely to vary from one pricing context to another. These factors may include, but are not limited to, the type of security, the existence of any contractual restrictions on the security’s disposition, the price and extent of public trading in similar securities of the issuer or of comparable companies or entities, quotations or relevant information obtained from broker/dealers or other market participants, information obtained from the issuer, analysts, and/or the appropriate stock exchange (for exchange-traded securities), an analysis of the company’s or entity’s financial statements, and an evaluation of the forces that influence the issuer and the market(s) in which the security is purchased and sold.
www.calvert.com CALVERT US LARGE-CAP GROWTH RESPONSIBLE INDEX FUND ANNUAL REPORT 29
The values assigned to fair value investments are based on available information and do not necessarily represent amounts that might ultimately be realized. Further, due to the inherent uncertainty of valuations of such investments, the fair values may differ significantly from the values that would have been used had an active market existed, and the differences could be material.
The following table summarizes the market value of the Fund’s holdings as of September 30, 2019, based on the inputs used to value them:
|
| | | | | | | | | | | | | |
| Assets | Level 1 | | Level 2 | Level 3 | Total |
| Common Stocks | $ | 90,988,648 |
| (1) | $ | — |
| $ | — |
| $ | 90,988,648 |
|
| Short Term Investment of Cash Collateral for Securities Loaned | 373,176 |
| | — |
| — |
| 373,176 |
|
| Total Investments | $ | 91,361,824 |
| | $ | — |
| $ | — |
| $ | 91,361,824 |
|
| | | | | | |
(1) The level classification by major category of investments is the same as the category presentation in the Schedule of Investments. |
B. Investment Transactions and Income: Investment transactions for financial statement purposes are accounted for on trade date. Realized gains and losses are recorded on an identified cost basis and may include proceeds from litigation. Dividend income is recorded on the ex-dividend date for dividends received in cash and/or securities or, in the case of dividends on certain foreign securities, as soon as the Fund is informed of the ex-dividend date. Non-cash dividends are recorded at the fair value of the securities received. Withholding taxes on foreign dividends, if any, have been provided for in accordance with the Fund’s understanding of the applicable country’s tax rules and rates. Distributions received that represent a return of capital are recorded as a reduction of cost of investments. Distributions received that represent a capital gain are recorded as a realized gain. Interest income is accrued as earned.
C. Share Class Accounting: Realized and unrealized gains and losses and net investment income and losses, other than class-specific expenses, are allocated daily to each class of shares based upon the relative net assets of each class to the total net assets of the Fund. Expenses arising in connection with a specific class are charged directly to that class.
D. Distributions to Shareholders: Distributions to shareholders are recorded by the Fund on ex-dividend date. Dividends from net investment income and distributions from net realized capital gains, if any, are paid at least annually. Distributions are determined in accordance with income tax regulations which may differ from U.S. GAAP; accordingly, periodic reclassifications are made within the Fund’s capital accounts to reflect income and gains available for distribution under income tax regulations.
E. Estimates: The preparation of financial statements in conformity with U.S. GAAP requires management to make estimates and assumptions that affect the reported amounts of assets and liabilities and disclosure of contingent assets and liabilities at the date of the financial statements and the reported amounts of increases and decreases in net assets from operations during the reporting period. Actual results could differ from those estimates.
F. Indemnifications: The Corporation’s By-Laws provide for indemnification for Directors or officers of the Corporation and certain other parties, to the fullest extent permitted by Maryland law and the 1940 Act, provided certain conditions are met. Additionally, in the normal course of business, the Fund enters into agreements with service providers that may contain indemnification clauses. The Fund’s maximum exposure under these arrangements is unknown as this would involve future claims that may be made against the Fund that have not yet occurred.
G. Federal Income Taxes: No provision for federal income or excise tax is required since the Fund intends to continue to qualify as a regulated investment company under the Internal Revenue Code and to distribute substantially all of its taxable earnings.
Management has analyzed the Fund’s tax positions taken for all open federal income tax years and has concluded that no provision for federal income tax is required in the Fund’s financial statements. A Fund’s federal tax return is subject to examination by the Internal Revenue Service for a period of three years from the date of filing.
NOTE 2 — RELATED PARTY TRANSACTIONS
The investment advisory fee is earned by Calvert Research and Management (CRM), a subsidiary of Eaton Vance Management (EVM), as compensation for investment advisory services rendered to the Fund. Pursuant to the investment advisory agreement, CRM receives a fee, payable monthly, at the annual rate of 0.12% (0.15% prior to February 1, 2019) of the Fund’s average daily net assets. For the year ended September 30, 2019, the investment advisory fee amounted to $102,465.
CRM has agreed to reimburse the Fund’s operating expenses to the extent that total annual operating expenses (relating to ordinary operating expenses only and excluding expenses such as brokerage commissions, acquired fund fees and expenses of unaffiliated funds, interest expense, taxes or litigation expenses) exceed 0.49% and 0.24% (0.57% and 0.22% prior to February 1, 2019) for Class A and Class I, respectively, of such class’ average daily net assets. The expense reimbursement agreement with
30 www.calvert.com CALVERT US LARGE-CAP GROWTH RESPONSIBLE INDEX FUND ANNUAL REPORT
CRM may be changed or terminated after January 31, 2020. For the year ended September 30, 2019, CRM waived or reimbursed expenses of $220,341.
The administrative fee is earned by CRM as compensation for administrative services rendered to the Fund. The fee is computed at an annual rate of 0.12% of the Fund’s average daily net assets attributable to Class A and Class I and is payable monthly. For the year ended September 30, 2019, CRM was paid administrative fee of $95,452.
The Fund has in effect a distribution plan for Class A shares (Class A Plan) pursuant to Rule 12b-1 under the 1940 Act. Pursuant to the Class A Plan, the Fund pays Eaton Vance Distributors, Inc. (EVD), an affiliate of CRM and the Fund’s principal underwriter, a distribution and service fee of 0.25% per annum of its average daily net assets attributable to Class A shares for distribution services and facilities provided to the Fund by EVD, as well as for personal services and/or the maintenance of shareholder accounts. Distribution and service fees paid or accrued for the year ended September 30, 2019 amounted to $37,539 for Class A shares.
The Fund was informed that EVD received $12,356 as its portion of the sales charge on sales of Class A shares for the year ended September 30, 2019.
EVM provides sub-transfer agency and related services to the Fund pursuant to a Sub-Transfer Agency Support Services Agreement. For the year ended September 30, 2019, sub-transfer agency fees and expenses incurred to EVM amounted to $7,165 and are included in transfer agency fees and expenses on the Statement of Operations.
Each Director of the Fund who is not an employee of CRM or its affiliates receives a fee of $3,000 for each Board meeting attended in person and $2,000 for each Board meeting attended by phone plus an annual fee of $117,000, and $1,500 for each Committee meeting attended in person and $1,000 for each Committee meeting attended by phone plus an annual Committee fee of $2,500. The Board chair receives an additional $15,000 annual retainer and Committee chairs receive an additional $6,000 annual retainer. Eligible Directors may participate in a Deferred Compensation Plan (the Plan). Amounts deferred under the Plan are treated as though equal dollar amounts had been invested in shares of the Fund or other Calvert funds selected by the Directors. The Fund purchases shares of the funds selected equal to the dollar amounts deferred under the Plan, resulting in an asset equal to the deferred compensation liability. Obligations of the Plan are paid solely from the Fund’s assets. Directors’ fees are allocated to each of the Calvert funds served. Salaries and fees of officers and Directors of the Fund who are employees of CRM or its affiliates are paid by CRM. In addition, an advisory council was established to aid the Board and CRM in advancing the cause of responsible investing through original scholarship and thought leadership. The advisory council consists of CRM’s Chief Executive Officer and four additional members. Each member (other than CRM’s Chief Executive Officer) receives annual compensation of $75,000, which is being reimbursed by Calvert Investment Management, Inc. (CIM), the Calvert funds’ former investment adviser and Ameritas Holding Company, CIM’s parent company, through the end of 2019. For the year ended September 30, 2019, the Fund’s allocated portion of such expense and reimbursement was $1,955, which are included in miscellaneous expense and reimbursement of expenses-other, respectively, on the Statement of Operations.
NOTE 3 — INVESTMENT ACTIVITY
During the year ended September 30, 2019, the cost of purchases and proceeds from sales of investments, other than short-term securities, were $40,284,146 and $27,284,181, respectively.
NOTE 4 — DISTRIBUTIONS TO SHAREHOLDERS AND INCOME TAX INFORMATION
The tax character of distributions declared for the years ended September 30, 2019 and September 30, 2018 was as follows:
|
| | | | | | |
| | Year Ended
September 30, |
| | 2019 | 2018 |
| Ordinary income |
| $1,256,114 |
|
| $971,621 |
|
| Long-term capital gains |
| $2,292,167 |
|
| $232,944 |
|
During the year ended September 30, 2019, distributable earnings was decreased by $114,307 and paid-in capital was increased by $114,307 due to the Fund’s use of equalization accounting. Tax equalization accounting allows the Fund to treat as a distribution that portion of redemption proceeds representing a redeeming shareholder’s portion of undistributed taxable income and net capital gains. These reclassifications had no effect on the net assets or net asset value per share of the Fund.
www.calvert.com CALVERT US LARGE-CAP GROWTH RESPONSIBLE INDEX FUND ANNUAL REPORT 31
As of September 30, 2019, the components of distributable earnings (accumulated loss) on a tax basis were as follows:
|
| | | |
| Undistributed ordinary income |
| $510,875 |
|
| Undistributed long-term capital gains |
| $854,258 |
|
| Net unrealized appreciation (depreciation) |
| $23,577,722 |
|
The cost and unrealized appreciation (depreciation) of investments of the Fund at September 30, 2019, as determined on a federal income tax basis, were as follows:
|
| | | |
| Aggregate cost |
| $67,784,102 |
|
| Gross unrealized appreciation |
| $24,893,841 |
|
| Gross unrealized depreciation | (1,316,119) |
|
| Net unrealized appreciation (depreciation) |
| $23,577,722 |
|
NOTE 5 — SECURITIES LENDING
To generate additional income, the Fund may lend its securities pursuant to a securities lending agency agreement with State Street Bank and Trust Company (SSBT), the securities lending agent. Security loans are subject to termination by the Fund at any time and, therefore, are not considered illiquid investments. The Fund requires that the loan be continuously collateralized by either cash or securities as collateral equal at all times to at least 102% of the market value of the domestic securities loaned and 105% of the market value of the international securities loaned (if applicable). The market value of securities loaned is determined daily and any additional required collateral is delivered to the Fund on the next business day. Cash collateral is generally invested in a money market fund registered under the 1940 Act that is managed by an affiliate of SSBT. Any gain or loss in the market price of the loaned securities that might occur and any interest earned or dividends declared during the term of the loan would accrue to the account of the Fund. Income earned on the investment of collateral, net of broker rebates and other expenses incurred by the securities lending agent, is split between the Fund and the securities lending agent on the basis of agreed upon contractual terms. Non-cash collateral, if any, is held by the lending agent on behalf of the Fund and cannot be sold or re-pledged by the Fund; accordingly, such collateral is not reflected in the Statement of Assets and Liabilities.
The risks associated with lending portfolio securities include, but are not limited to, possible delays in receiving additional collateral or in the recovery of the loaned securities, possible loss of rights to the collateral should the borrower fail financially, as well as risk of loss in the value of the collateral or the value of the investments made with the collateral. The securities lending agent shall indemnify the Fund in the case of default of any securities borrower.
At September 30, 2019, the total value of securities on loan was $2,047,751 and the total value of collateral received was $2,081,642, comprised of cash of $373,176 and U.S. government and/or agencies securities of $1,708,466.
The following table provides a breakdown of securities lending transactions accounted for as secured borrowings, the obligations by class of collateral pledged, and the remaining contractual maturity of those transactions as of September 30, 2019.
|
| | | | | | | | | |
| | Remaining Contractual Maturity of the Transactions |
| | Overnight and
Continuous | <30 days | 30 to 90 days | >90 days | Total |
| Securities Lending Transactions |
| Common Stocks |
| $2,081,642 |
| $— | $— | $— |
| $2,081,642 |
|
The carrying amount of the liability for deposits for securities loaned at September 30, 2019 approximated its fair value. If measured at fair value, such liability would have been considered as Level 2 in the fair value hierarchy (see Note 1A) at September 30, 2019.
NOTE 6 — LINE OF CREDIT
The Fund participates with other funds managed by CRM in a $100 million ($62.5 million prior to June 21, 2019) committed unsecured line of credit agreement with SSBT, which is in effect through June 19, 2020. Borrowings may be made for temporary or emergency purposes only. Borrowings bear interest at the higher of the One-Month London Interbank Offered Rate (LIBOR) in effect that day or the overnight Federal Funds Rate, plus 1.00% per annum. A commitment fee of 0.20% per annum is incurred on the unused portion of the committed facility. An administrative fee of $37,500 was incurred in connection with the increase of the facility in June 2019. These fees are allocated to all participating funds. Because the line of credit is not available exclusively to the Fund, it may be unable to borrow some or all of its requested amounts at any particular time. At September 30, 2019, the Fund
32 www.calvert.com CALVERT US LARGE-CAP GROWTH RESPONSIBLE INDEX FUND ANNUAL REPORT
had a balance outstanding pursuant to this line of credit of $1,298,195 at an interest rate of 3.02%. Based on the short-term nature of the borrowings under the line of credit and variable interest rate, the carrying value of the borrowings approximated its fair value at September 30, 2019. If measured at fair value, borrowings under the line of credit would have been considered as Level 2 in the fair value hierarchy (see Note 1A) at September 30, 2019. The Fund did not have any significant borrowings or allocated fees during the year ended September 30, 2019.
Effective at the close of business on October 28, 2019, the Fund and other participating funds managed by CRM terminated the line of credit agreement. Effective October 29, 2019, the Fund participates with other funds managed by EVM and its affiliates, including CRM, in an $800 million unsecured line of credit agreement with a syndicate of banks, which is in effect through October 27, 2020, at terms that are more favorable than the terminated agreement.
NOTE 7 — CAPITAL SHARES
Transactions in capital shares for the years ended September 30, 2019 and September 30, 2018 were as follows:
|
| | | | | | | | | | | |
| | Year Ended September 30, 2019 | | Year Ended
September 30, 2018 |
| | Shares | Amount | | Shares | Amount |
| Class A | | | | | |
| Shares sold | 213,791 |
|
| $5,900,799 |
| | 209,278 |
|
| $5,642,635 |
|
| Reinvestment of distributions | 24,401 |
| 636,373 |
| | 6,567 |
| 168,039 |
|
| Shares redeemed | (156,940 | ) | (4,403,603 | ) | | (60,689 | ) | (1,629,132 | ) |
| Converted from Class C | — |
| — |
| | 60,153 |
| 1,548,365 |
|
| Net increase | 81,252 |
|
| $2,133,569 |
| | 215,309 |
|
| $5,729,907 |
|
| | | | | | |
Class C (1) | | | | | |
| Shares sold | — |
| $— |
| | 6,771 |
|
| $168,220 |
|
| Shares redeemed | — |
| — |
| | (188 | ) | (4,634 | ) |
| Converted to Class A | — |
| — |
| | (60,884 | ) | (1,548,365 | ) |
| Net decrease | — |
| $— |
| | (54,301 | ) |
| ($1,384,779 | ) |
| | | | | | |
| Class I | | | | | |
| Shares sold | 812,027 |
|
| $22,472,686 |
| | 338,223 |
|
| $9,334,833 |
|
| Reinvestment of distributions | 107,074 |
| 2,807,470 |
| | 39,836 |
| 1,022,977 |
|
| Shares redeemed | (421,553 | ) | (11,744,396 | ) | | (189,969 | ) | (5,318,806 | ) |
| Converted from Class Y | — |
| — |
| | 153,064 |
| 3,958,239 |
|
| Net increase | 497,548 |
|
| $13,535,760 |
| | 341,154 |
|
| $8,997,243 |
|
| | | | | | |
Class Y (1) | | | | | |
| Shares sold | — |
| $— |
| | 20,856 |
|
| $526,772 |
|
| Shares redeemed | — |
| — |
| | (5,271 | ) | (133,801 | ) |
| Converted to Class I | — |
| — |
| | (153,307 | ) | (3,958,239 | ) |
| Net decrease | — |
| $— |
| | (137,722 | ) |
| ($3,565,268 | ) |
| | | | | | |
(1) Effective December 8, 2017, Class C shares of the Fund converted to Class A shares and Class Y shares converted to Class I shares at net asset value. Thereafter, Class C shares and Class Y shares were terminated.
|
At September 30, 2019, Calvert Aggressive Allocation Fund and Calvert Moderate Allocation Fund owned in the aggregate 39.4% of the value of the outstanding shares of the Fund.
www.calvert.com CALVERT US LARGE-CAP GROWTH RESPONSIBLE INDEX FUND ANNUAL REPORT 33
REPORT OF INDEPENDENT REGISTERED PUBLIC ACCOUNTING FIRM
To the Shareholders and Board of Directors
Calvert Responsible Index Series, Inc.:
Opinion on the Financial Statements
We have audited the accompanying statement of assets and liabilities of Calvert US Large-Cap Growth Responsible Index Fund (the Fund), a series of Calvert Responsible Index Series, Inc., including the schedule of investments, as of September 30, 2019, the related statement of operations for the year then ended, the statements of changes in net assets for each of the years in the two‑year period then ended, and the related notes (collectively, the financial statements) and the financial highlights for each of the years or periods in the five‑year period then ended. In our opinion, the financial statements and financial highlights present fairly, in all material respects, the financial position of the Fund as of September 30, 2019, the results of its operations for the year then ended, the changes in its net assets for each of the years in the two‑year period then ended, and the financial highlights for each of the years or periods in the five‑year period then ended, in conformity with U.S. generally accepted accounting principles.
Basis for Opinion
These financial statements and financial highlights are the responsibility of the Fund’s management. Our responsibility is to express an opinion on these financial statements and financial highlights based on our audits. We are a public accounting firm registered with the Public Company Accounting Oversight Board (United States) (PCAOB) and are required to be independent with respect to the Fund in accordance with the U.S. federal securities laws and the applicable rules and regulations of the Securities and Exchange Commission and the PCAOB.
We conducted our audits in accordance with the standards of the PCAOB. Those standards require that we plan and perform the audit to obtain reasonable assurance about whether the financial statements and financial highlights are free of material misstatement, whether due to error or fraud. Our audits included performing procedures to assess the risks of material misstatement of the financial statements and financial highlights, whether due to error or fraud, and performing procedures that respond to those risks. Such procedures included examining, on a test basis, evidence regarding the amounts and disclosures in the financial statements and financial highlights. Such procedures also included confirmation of securities owned as of September 30, 2019, by correspondence with the custodian and brokers. Our audits also included evaluating the accounting principles used and significant estimates made by management, as well as evaluating the overall presentation of the financial statements and financial highlights. We believe that our audits provide a reasonable basis for our opinion.
We have served as the auditor of one or more of the Calvert Funds since 2002.
Philadelphia, Pennsylvania
November 20, 2019
34 www.calvert.com CALVERT US LARGE-CAP GROWTH RESPONSIBLE INDEX FUND ANNUAL REPORT
FEDERAL TAX INFORMATION
The Form 1099-DIV you receive in February 2020 will show the tax status of all distributions paid to your account in calendar year 2019. Shareholders are advised to consult their own tax adviser with respect to the tax consequences of their investment in the Fund. As required by the Internal Revenue Code and/or regulations, shareholders must be notified regarding the status of qualified dividend income for individuals, the dividends received deduction for corporations and capital gains dividends.
Qualified Dividend Income. For the fiscal year ended September 30, 2019, the Fund designates approximately $950,939, or up to the maximum amount of such dividends allowable pursuant to the Internal Revenue Code, as qualified dividend income eligible for the reduced tax rate of 15%.
Dividends Received Deduction. Corporate shareholders are generally entitled to take the dividends received deduction on the portion of the Fund’s dividend distribution that qualifies under tax law. For the Fund’s fiscal 2019 ordinary income dividends, 60.69% qualifies for the corporate dividends received deduction.
Capital Gains Dividends. The Fund hereby designates as a capital gain dividend with respect to the taxable year ended September 30, 2019, $999,413 or, if subsequently determined to be different, the net capital gain of such year.
www.calvert.com CALVERT US LARGE-CAP GROWTH RESPONSIBLE INDEX FUND ANNUAL REPORT (Unaudited) 35
MANAGEMENT AND ORGANIZATION
Fund Management. The Directors of Calvert Responsible Index Series, Inc. (the Corporation) are responsible for the overall management and supervision of the Corporation’s affairs. The Directors and officers of the Corporation are listed below. Except as indicated, each individual has held the office shown or other offices in the same company for the last five years. Directors and officers of the Corporation hold indefinite terms of office. The “Independent Directors” consist of those Directors who are not “interested persons” of the Corporation, as that term is defined under the 1940 Act. The business address of each Director and officer, with the exception of Ms. Gemma and Mr. Kirchner, is 1825 Connecticut Avenue NW, Suite 400, Washington, DC 20009. As used below, “CRM” refers to Calvert Research and Management. Each Director oversees 39 funds in the Calvert fund complex. Each officer serves as an officer of certain other Calvert funds.
|
| | | |
| Name and Year of Birth |
Corporation Position(s) | Position
Start Date | Principal Occupation(s) and Other Directorships
During Past Five Years and Other Relevant Experience |
| | | | |
| Interested Director | | | |
John H. Streur(1)
1960 | Director & President | 2015 | President and Chief Executive Officer of Calvert Research and Management (since December 31, 2016). President and Chief Executive Officer of Calvert Investments, Inc. (January 2015 - December 2016); Chief Executive Officer of Calvert Investment Distributors, Inc. (August 2015 - December 2016); Chief Compliance Officer of Calvert Investment Management, Inc. (August 2015 - April 2016); President and Director, Portfolio 21 Investments, Inc. (through October 2014); President, Chief Executive Officer and Director, Managers Investment Group LLC (through January 2012); President and Director, The Managers Funds and Managers AMG Funds (through January 2012). Other Directorships in the Last Five Years. Portfolio 21 Investments, Inc. (asset management) (through October 2014); Managers Investment Group LLC (asset management) (through January 2012); The Managers Funds (asset management) (through January 2012); Managers AMG Funds (asset management) (through January 2012); Calvert Impact Capital, Inc. |
| Independent Directors | | | |
Richard L. Baird, Jr.
1948 | Director | 2000 | Regional Disaster Recovery Lead, American Red Cross of Greater Pennsylvania (since 2017). Volunteer, American Red Cross (since 2015). Former President and CEO of Adagio Health Inc. (retired in 2014) in Pittsburgh, PA. Other Directorships in the Last Five Years. None. |
Alice Gresham Bullock
1950 | Chair & Director | 2016 | Professor Emerita at Howard University School of Law. Dean Emerita of Howard University School of Law and Deputy Director of the Association of American Law Schools (1992-1994). Other Directorships in the Last Five Years. None. |
Cari M. Dominguez
1949 | Director | 2016 | Former Chair of the U.S. Equal Employment Opportunity Commission. Other Directorships in the Last Five Years. Manpower, Inc. (employment agency); Triple S Management Corporation (managed care); National Association of Corporate Directors. |
John G. Guffey, Jr.(2)
1948 | Director | 2000 | President of Aurora Press Inc., a privately held publisher of trade paperbacks (since January 1997). Other Directorships in the Last Five Years. Calvert Impact Capital, Inc. (through December 31, 2018); Calvert Ventures, LLC. |
Miles D. Harper, III
1962 | Director | 2005 | Partner, Carr Riggs & Ingram (public accounting firm) since October 2014. Partner, Gainer Donnelly & Desroches (public accounting firm) (now Carr Riggs & Ingram), November 1999 - September 2014). Other Directorships in the Last Five Years. Bridgeway Funds (9) (asset management). |
36 www.calvert.com CALVERT US LARGE-CAP GROWTH RESPONSIBLE INDEX FUND ANNUAL REPORT (Unaudited)
|
| | | |
| Name and Year of Birth |
Corporation Position(s) | Position
Start Date | Principal Occupation(s) and Other Directorships
During Past Five Years and Other Relevant Experience |
| | | | |
Joy V. Jones
1950 | Director | 2000 | Attorney. Other Directorships in the Last Five Years. Conduit Street Restaurants SUD 2 Limited; Palm Management Restaurant Corporation. |
Anthony A. Williams
1951 | Director | 2016 | CEO and Executive Director of the Federal City Council (July 2012 to present); Senior Adviser and Independent Consultant for McKenna Long & Aldridge LLP (September 2011 to present); Executive Director of Global Government Practice at the Corporate Executive Board (January 2010 to January 2012). Other Directorships in the Last Five Years. Freddie Mac; Evoq Properties/ Meruelo Maddux Properties, Inc. (real estate management); Weston Solutions, Inc. (environmental services); Bipartisan Policy Center’s Debt Reduction Task Force; Chesapeake Bay Foundation; Catholic University of America; Urban Institute (research organization). |
|
| | | |
| Principal Officers who are not Directors | |
Name and
Year of Birth | Corporation Position(s) | Position Start Date | Principal Occupation(s)
During Past Five Years |
| | | | |
Hope L. Brown
1973 | Chief Compliance Officer | 2014 | Chief Compliance Officer of 39 registered investment companies advised by CRM (since 2014). Vice President and Chief Compliance Officer, Wilmington Funds (2012-2014). |
Maureen A. Gemma(3)
1960 | Secretary, Vice President and Chief Legal Officer | 2016 | Vice President of CRM and officer of 39 registered investment companies advised by CRM (since 2016). Also Vice President of Eaton Vance and certain of its affiliates and officer of 162 registered investment companies advised or administered by Eaton Vance. |
James F. Kirchner(3)
1967 | Treasurer | 2016 | Vice President of CRM and officer of 39 registered investment companies advised by CRM (since 2016). Also Vice President of Eaton Vance and certain of its affiliates and officer of 162 registered investment companies advised or administered by Eaton Vance. |
| | | | |
| |
(1) | Mr. Streur is an interested person of the Fund because of his positions with the Fund’s adviser and certain affiliates. |
| |
(2) | Mr. Guffey is currently married to Rebecca L. Adamson, who serves as a member of the Advisory Council. |
| |
(3) | The business address for Ms. Gemma and Mr. Kirchner is Two International Place, Boston, MA 02110. |
The SAI for the Fund includes additional information about the Directors and officers of the Fund and can be obtained without charge on Calvert’s website at www.calvert.com or by calling 1-800-368-2745.
www.calvert.com CALVERT US LARGE-CAP GROWTH RESPONSIBLE INDEX FUND ANNUAL REPORT (Unaudited) 37
IMPORTANT NOTICES
Privacy. The Calvert Funds and Calvert Research and Management are committed to ensuring your financial privacy. Each of the financial institutions identified below has in effect the following policy (“Privacy Policy”) with respect to nonpublic personal information about its customers:
| |
| • | Only such information received from you, through application forms or otherwise, and information about your Calvert fund transactions will be collected. This may include information such as name, address, social security number, tax status, account balances and transactions. |
| |
| • | None of such information about you (or former customers) will be disclosed to anyone, except as permitted by law (which includes disclosure to employees necessary to service your account). In the normal course of servicing a customer’s account, Calvert Research and Management may share information with unaffiliated third parties that perform various required services such as transfer agents, custodians and broker-dealers. |
| |
| • | Policies and procedures (including physical, electronic and procedural safeguards) are in place that are designed to protect the confidentiality of such information. |
| |
| • | The Funds reserve the right to change this Privacy Policy at any time upon proper notification to you. Customers may want to review the Funds’ Privacy Policy periodically for changes by accessing the link on our homepage: www.calvert.com. |
Our pledge of privacy applies to the following entities: the Calvert Family of Funds, Calvert Research and Management and their affiliated service providers, Eaton Vance Management and Eaton Vance Distributors, Inc. In addition, our Privacy Policy applies only to those Calvert customers who are individuals and who have a direct relationship with us. If a customer’s account (i.e., fund shares) is held in the name of a third-party financial advisor/broker-dealer, it is likely that only such advisor’s privacy policies apply to the customer. This notice supersedes all previously issued privacy disclosures. For more information about Calvert’s Privacy Policy, please call 1-800-368-2745.
Delivery of Shareholder Documents. The Securities and Exchange Commission (SEC) permits funds to deliver only one copy of shareholder documents, including prospectuses, proxy statements and shareholder reports, to fund investors with multiple accounts at the same residential or post office box address. This practice is often called “householding” and it helps eliminate duplicate mailings to shareholders. Calvert funds, or your financial intermediary, may household the mailing of your documents indefinitely unless you instruct Calvert funds, or your financial intermediary, otherwise. If you would prefer that your Calvert fund documents not be householded, please contact Calvert funds at 1-800-368-2745, or contact your financial intermediary. Your instructions that householding not apply to delivery of your Calvert fund documents will typically be effective within 30 days of receipt by Calvert funds or your financial intermediary. Separate statements will be generated for each separate account and will be householded as described above.
Portfolio Holdings. Each Calvert fund files a schedule of portfolio holdings on Part F to Form N-PORT with the SEC for the first and third quarters of each fiscal year. The Form N-PORT will be available on the Calvert funds’ website at www.calvert.com, by calling Calvert funds at 1-800-368-2745 or in the EDGAR database on the SEC’s website at www.sec.gov.
Proxy Voting. The Proxy Voting Guidelines that each Calvert fund uses to determine how to vote proxies relating to portfolio securities is provided as an Appendix to the fund’s Statement of Additional Information. The Statement of Additional Information can be obtained free of charge by calling the Calvert funds at 1-800-368-2745, by visiting the Calvert funds’ website at www.calvert.com or visiting the SEC’s website at www.sec.gov. Information regarding how a Calvert fund voted proxies relating to portfolio securities during the most recent 12-month period ended June 30 is available by calling Calvert funds, by visiting the Calvert funds’ website at www.calvert.com or by visiting the SEC’s website at www.sec.gov.
38 www.calvert.com CALVERT US LARGE-CAP GROWTH RESPONSIBLE INDEX FUND ANNUAL REPORT (Unaudited)
|
|
| This page intentionally left blank. |
This page intentionally left blank.
|
| |
| CALVERT US LARGE-CAP GROWTH RESPONSIBLE INDEX FUND |
Investment Adviser and Administrator Calvert Research and Management 1825 Connecticut Avenue NW, Suite 400 Washington, DC 20009 | Transfer Agent DST Asset Manager Solutions, Inc. 2000 Crown Colony Drive Quincy, MA 02169 |
Principal Underwriter* Eaton Vance Distributors, Inc. Two International Place Boston, MA 02110 (617) 482-8260 | Independent Registered Public Accounting Firm KPMG LLP 1601 Market Street Philadelphia, PA 19103-2499 |
Custodian State Street Bank and Trust Company State Street Financial Center, One Lincoln Street Boston, MA 02111 | Fund Offices 1825 Connecticut Avenue NW, Suite 400 Washington, DC 20009 |
| | |
* FINRA BrokerCheck. Investors may check the background of their Investment Professional by contacting the Financial Industry Regulatory Authority (FINRA). FINRA BrokerCheck is a free tool to help investors check the professional background of current and former FINRA-registered securities firms and brokers. FINRA BrokerCheck is available by calling 1-800-289-9999 and at www.FINRA.org. The FINRA BrokerCheck brochure describing this program is available to investors at www.FINRA.org.
|
| |
| | |
Printed on recycled paper. |
| 24189 9.30.19 | |
|
|
| Calvert US Large-Cap Value Responsible Index Fund |
Important Note. Beginning on January 1, 2021, as permitted by regulations adopted by the Securities and Exchange Commission, paper copies of the Fund’s annual and semi-annual shareholder reports will no longer be sent by mail unless you specifically request paper copies of the reports. Instead, the reports will be made available on the Fund’s website (calvert.com/prospectus), and you will be notified by mail each time a report is posted and provided with a website address to access the report.
If you already elected to receive shareholder reports electronically, you will not be affected by this change and you need not take any action. If you are a direct investor, you may elect to receive shareholder reports and other communications from the Fund electronically by signing up for e-Delivery at calvert.com. If you own your shares through a financial intermediary (such as a broker-dealer or bank), you must contact your financial intermediary to sign up.
You may elect to receive all future Fund shareholder reports in paper free of charge. If you are a direct investor, you can inform the Fund that you wish to continue receiving paper copies of your shareholder reports by calling 1-800-368-2745. If you own these shares through a financial intermediary, you must contact your financial intermediary or follow instructions included with this disclosure, if applicable, to elect to continue to receive paper copies of your shareholder reports. Your election to receive reports in paper will apply to all Calvert funds held directly or to all funds held through your financial intermediary, as applicable.
|
| |
Annual Report September 30, 2019 E-Delivery Sign-Up — Details Inside
| |
|
|
Commodity Futures Trading Commission Registration. Effective December 31, 2012, the Commodity Futures Trading Commission (“CFTC”) adopted certain regulatory changes that subject registered investment companies and advisers to regulation by the CFTC if a fund invests more than a prescribed level of its assets in certain CFTC-regulated instruments (including futures, certain options and swap agreements) or markets itself as providing investment exposure to such instruments. The Fund and its adviser have claimed an exclusion from the definition of the term “commodity pool operator” under the Commodity Exchange Act. Accordingly, neither the Fund nor the adviser is subject to CFTC regulation.
Fund shares are not insured by the FDIC and are not deposits or other obligations of, or guaranteed by, any depository institution. Shares are subject to investment risks, including possible loss of principal invested.
This report must be preceded or accompanied by a current summary prospectus or prospectus. Before investing, investors should consider carefully the investment objective, risks, and charges and expenses of a mutual fund. This and other important information is contained in the summary prospectus and prospectus, which can be obtained from a financial intermediary. Prospective investors should read the prospectus carefully before investing. For further information, please call 1-800-368-2745.
|
Choose Planet-friendly E-delivery! Sign up now for on-line statements, prospectuses, and fund reports. In less than five minutes you can help reduce paper mail and lower fund costs. Just go to www.calvert.com. If you already have an online account with the Calvert funds, click on Login to access your Account and select the documents you would like to receive via e-mail. If you’re new to online account access, click on Login, then Register to create your user name and password. Once you’re in, click on the E-delivery sign-up on the Account Portfolio page and follow the quick, easy steps. Note: If your shares are not held directly with the Calvert funds but through a brokerage firm, you must contact your broker for electronic delivery options available through their firm. |
|
| | | | |
| | | TABLE OF CONTENTS |
| | | | | |
| | | | | Management’s Discussion of Fund Performance |
| | | | | Performance |
| | | | | Fund Profile |
| | | | | Endnotes and Additional Disclosures |
| | | | | Fund Expenses |
| | | | | Financial Statements |
| | | | | Report of Independent Registered Public Accounting Firm |
| | | | | Federal Tax Information |
| �� | | | | Management and Organization |
| | | | | Important Notices |
MANAGEMENT’S DISCUSSION OF FUND PERFORMANCE1 Economic and Market Conditions
In the midst of a yearlong trade war with China and slowing economic growth worldwide, U.S. stocks delivered mixed returns during the 12-month period ended September 30, 2019.
U.S. stocks opened the period on the downside as investors worried that President Trump’s imposition of broad import tariffs might provoke a wider trade dispute with China, the world’s second-largest economy behind the U.S.
With U.S. economic data largely positive throughout 2018, the U.S. Federal Reserve Board (the Fed) raised its benchmark federal funds rate four times ─ from a low range of 1.50%-1.75% to 2.25%-2.50% ─ with the last quarter-point increase on December 19, 2018.
U.S. stocks turned higher in early 2019 as trade fears eased and interest rates remained stable after the Fed signaled a slower pace for future rate hikes. However, around the same time, U.S. economic indicators began sending mixed signals. While the job market was robust during the period with the U.S. unemployment rate dipping below 4%, retail sales fell, raising concerns about consumer spending. Factory output also declined, dragged down by a large drop in auto production.
The U.S. equity market fluctuated through the spring of 2019. Heightened trade-conflict rhetoric drove stocks lower in May before easing tensions helped equities recover in June. Key economic indicators continued to be mixed, with job creation decelerating sharply in May.
After holding interest rates steady through the first half of 2019, the Fed cut its benchmark interest rate to 2.00%-2.25% on July 31 ─ its first reduction in over a decade ─ followed by a second interest-rate drop to 1.75%-2.00% on September 18. Lower rates are intended to help stimulate economic activity by making borrowing costs relatively more affordable.
After sliding in August, U.S. equities rebounded in early September before retreating in the final weeks of the period. During the 12-month period ended September 30, 2019, the blue-chip Dow Jones Industrial Average®2 gained 4.21%, while the broader U.S. equity market, as represented by the S&P 500® Index, rose 4.25%. The technology-laden Nasdaq Composite Index returned 0.52% during the period.
Large-cap U.S. stocks, as measured by the S&P 500® Index, generally outperformed their small-cap counterparts, as measured by the Russell 2000® Index, during the period. As
a group, value stocks outpaced growth stocks in both large- and small-cap categories, as measured by the Russell growth and value indexes.
Fund Performance
For the 12-month period ended September 30, 2019, Calvert US Large-Cap Value Responsible Index Fund (the Fund) returned 3.18% for Class A shares at net asset value (NAV). The Fund underperformed its primary benchmark, the Russell 1000® Value Index, which returned 4.00%; and underperformed its secondary benchmark, the Calvert US Large-Cap Value Responsible Index (the Calvert Index), which returned 3.71% during the period.
The Fund’s underperformance versus its secondary benchmark was due to Fund expenses and fees, which the Calvert Index does not incur.
Eight of the Fund’s 11 market sectors delivered positive returns during the period. The weakest-performing sectors were energy, health care, and consumer discretionary. The strongest-performing sectors were utilities, consumer staples, and communication services.
|
|
See Endnotes and Additional Disclosures in this report. Past performance is no guarantee of future results. Returns are historical and are calculated by determining the percentage change in net asset value (NAV) or offering price (as applicable) with all distributions reinvested. Investment return and principal value will fluctuate so that shares, when redeemed, may be worth more or less than their original cost. Performance less than or equal to one year is cumulative. Performance is for the stated time period only; due to market volatility, the Fund’s current performance may be lower or higher than quoted. Returns are before taxes unless otherwise noted. For performance as of the most recent month-end, please refer to www.calvert.com. |
2 www.calvert.com CALVERT US LARGE-CAP VALUE RESPONSIBLE INDEX FUND ANNUAL REPORT (Unaudited)
PERFORMANCE
|
| | | | | | | | | | | | | | |
Performance2,3 | | | | | | | | | |
Portfolio Managers Thomas C. Seto, Christopher Madden, CFA and Jade Huang, each of Calvert Research and Management |
| | | | | | | | | | |
| % Average Annual Total Returns | Class Inception Date |
| | Performance Inception Date |
| | One Year |
| | Five Years |
| | Since Inception |
|
| Class A at NAV | 06/19/2015 |
| | 06/19/2015 |
| | 3.18 | % | | — | % | | 6.89 | % |
| Class A with 4.75% Maximum Sales Charge | — |
| | — |
| | -1.73 |
| | — |
| | 5.68 |
|
| Class I at NAV | 06/19/2015 |
| | 06/19/2015 |
| | 3.46 |
| | — |
| | 7.24 |
|
| | | | | | | | | | |
| | | | | | | | | | |
Russell 1000® Value Index | — |
| | — |
| | 4.00 | % | | 7.79 | % | | 7.51 | % |
| Calvert US Large-Cap Value Responsible Index | — |
| | — |
| | 3.71 |
| | — |
| | 7.54 |
|
| | | | | | | | | | |
% Total Annual Operating Expense Ratios4 | | | | | | | Class A |
| | Class I |
|
| Gross | | | | | | | 0.71 | % | | 0.46 | % |
| Net | | | | | | | 0.49 |
| | 0.24 |
|
|
|
| Growth of $10,000 |
| This graph shows the change in value of a hypothetical investment of $10,000 in Class A of the Fund for the period indicated. For comparison, the same investment is shown in the indicated index. |
|
| | | | | | | | |
| Growth of Investment | Amount Invested |
| Period Beginning | At NAV |
| With Maximum Sales Charge |
| Class I |
| $100,000 |
| 06/19/2015 |
| $134,919 |
| N.A. |
See Endnotes and Additional Disclosures in this report.
Past performance is no guarantee of future results. Returns are historical and are calculated by determining the percentage change in net asset value (NAV) or offering price (as applicable) with all distributions reinvested. Investment return and principal value will fluctuate so that shares, when redeemed, may be worth more or less than their original cost. Performance less than or equal to one year is cumulative. Performance is for the stated time period only; due to market volatility, the Fund’s current performance may be lower or higher than quoted. Returns are before taxes unless otherwise noted. For performance as of the most recent month-end, please refer to www.calvert.com.
www.calvert.com CALVERT US LARGE-CAP VALUE RESPONSIBLE INDEX FUND ANNUAL REPORT (Unaudited) 3
FUND PROFILE
|
| | | | | | | |
| |
| | | | | |
| | SECTOR ALLOCATION (% of total investments)5 | | | TEN LARGEST HOLDINGS (% of net assets)6 |
| | | | | | |
| | Financials | 29.8 | % | | JPMorgan Chase & Co. | 3.2 | % |
| | Industrials | 13.1 | % | | AT&T, Inc. | 2.5 | % |
| | Consumer Staples | 11.3 | % | | Bank of America Corp. | 2.4 | % |
| | Information Technology | 11.1 | % | | Verizon Communications, Inc. | 2.3 | % |
| | Health Care | 10.3 | % | | Apple, Inc. | 1.8 | % |
| | Communication Services | 9.4 | % | | Procter & Gamble Co. (The) | 1.7 | % |
| | Consumer Discretionary | 6.5 | % | | Cisco Systems, Inc. | 1.7 | % |
| | Utilities | 4.9 | % | | Intel Corp. | 1.7 | % |
| | Materials | 2.7 | % | | Citigroup, Inc. | 1.4 | % |
| | Energy | 0.5 | % | | Coca-Cola Co. (The) | 1.4 | % |
| | Real Estate | 0.4 | % | | Total | 20.1 | % |
| | Total | 100.0 | % | | | |
See Endnotes and Additional Disclosures in this report.
4 www.calvert.com CALVERT US LARGE-CAP VALUE RESPONSIBLE INDEX FUND ANNUAL REPORT (Unaudited)
|
| | |
| Endnotes and Additional Disclosures | | |
| |
1 | The views expressed in this report are those of the portfolio manager(s) and are current only through the date stated on the cover. These views are subject to change at any time based upon market or other conditions, and Calvert and the Fund(s) disclaim any responsibility to update such views. These views may not be relied upon as investment advice and, because investment decisions are based on many factors, may not be relied upon as an indication of trading intent on behalf of any Calvert fund. This commentary may contain statements that are not historical facts, referred to as “forward looking statements.” The Fund’s actual future results may differ significantly from those stated in any forward looking statement, depending on factors such as changes in securities or financial markets or general economic conditions, the volume of sales and purchases of Fund shares, the continuation of investment advisory, administrative and service contracts, and other risks discussed from time to time in the Fund’s filings with the Securities and Exchange Commission. |
| |
2 | Dow Jones Industrial Average® is a price-weighted average of 30 blue-chip stocks that are generally the leaders in their industry. S&P 500® Index is an unmanaged index of large-cap stocks commonly used as a measure of U.S. stock market performance. S&P Dow Jones Indices are a product of S&P Dow Jones Indices LLC (“S&P DJI”) and have been licensed for use. S&P® and S&P 500® are registered trademarks of S&P DJI; Dow Jones® is a registered trademark of Dow Jones Trademark Holdings LLC (“Dow Jones”); S&P DJI, Dow Jones and their respective affiliates do not sponsor, endorse, sell or promote the Fund, will not have any liability with respect thereto and do not have any liability for any errors, omissions, or interruptions of the S&P Dow Jones Indices. Nasdaq Composite Index is a market capitalization-weighted index of all domestic and international securities listed on Nasdaq. Source: Nasdaq, Inc. The information is provided by Nasdaq (with its affiliates, are referred to as the “Corporations”) and Nasdaq’s third party licensors on an “as is” basis and the Corporations make no guarantees and bear no liability of any kind with respect to the information or the Fund. Russell 2000® Index is an unmanaged index of 2,000 U.S. small-cap stocks. Russell 1000® Value Index is an unmanaged index of U.S. large-cap value stocks. Calvert US Large-Cap Value Responsible Index (the “Calvert Index”) is composed of common stocks of large value companies that operate their businesses in a manner that is consistent with the Calvert Principles for Responsible Investment. Large value companies are selected from the 1,000 largest publicly traded U.S. companies based on market capitalization and value style factors, excluding real estate investment trusts and business development companies. The Calvert Principles for Responsible Investment serve as a framework for considering environmental, social and governance factors that may affect investment performance. Stocks are weighted in the Calvert Index based on their float-adjusted market capitalization within the relevant sector, subject to certain prescribed limits. Unless otherwise stated, index returns do not reflect the effect of any applicable sales charges, commissions, expenses, taxes or leverage, as applicable. |
It is not possible to invest directly in an index.
| |
3 | Total Returns at NAV do not include applicable sales charges. If sales charges were deducted, the returns would be lower. Total Returns shown with maximum sales charge reflect the stated maximum sales charge. Unless otherwise stated, performance does not reflect the deduction of taxes on Fund distributions or redemptions of Fund shares. Performance since inception for an index, if presented, is the performance since the Fund’s or oldest share class’ inception, as applicable. |
Calvert Research and Management became the investment adviser to the Fund on December 31, 2016. Performance reflected prior to such date is that of the Fund’s former investment adviser.
| |
4 | Source: Fund prospectus. Net expense ratios reflect a contractual expense reimbursement that continues through 1/31/20. Without the reimbursement, performance would have been lower. The expense ratios for the current reporting period can be found in the Financial Highlights section of this report. |
| |
5 | Does not include Short Term Investment of Cash Collateral for Securities Loaned. |
6 Excludes cash and cash equivalents.
www.calvert.com CALVERT US LARGE-CAP VALUE RESPONSIBLE INDEX FUND ANNUAL REPORT (Unaudited) 5
FUND EXPENSES
Example
As a Fund shareholder, you incur two types of costs: (1) transaction costs, including sales charges (loads) on purchases and redemption fees (if applicable); and (2) ongoing costs, including management fees; distribution and/or service fees; and other Fund expenses. This Example is intended to help you understand your ongoing costs (in dollars) of Fund investing and to compare these costs with the ongoing costs of investing in other mutual funds. The Example is based on an investment of $1,000 invested at the beginning of the period and held for the entire period (April 1, 2019 to September 30, 2019).
Actual Expenses
The first section of the table below provides information about actual account values and actual expenses. You may use the information in this section, together with the amount you invested, to estimate the expenses that you paid over the period. Simply divide your account value by $1,000 (for example, an $8,600 account value divided by $1,000 = 8.6), then multiply the result by the number in the first section under the heading entitled “Expenses Paid During Period” to estimate the expenses you paid on your account during this period.
Hypothetical Example for Comparison Purposes
The second section of the table below provides information about hypothetical account values and hypothetical expenses based on the actual Fund expense ratio and an assumed rate of return of 5% per year (before expenses), which is not the actual Fund return. The hypothetical account values and expenses may not be used to estimate the actual ending account balance or expenses you paid for the period. You may use this information to compare the ongoing costs of investing in the Fund and other funds. To do so, compare this 5% hypothetical example with the 5% hypothetical examples that appear in the shareholder reports of the other funds.
Please note that the expenses shown in the table are meant to highlight your ongoing costs only and do not reflect any transactional costs, such as sales charges (loads) or redemption fees (if applicable). Therefore, the second section of the table is useful in comparing ongoing costs only, and will not help you determine the relative total costs of owning different funds. In addition, if these transactional costs were included, your costs would be higher.
|
| | | | |
| | BEGINNING ACCOUNT VALUE
(4/1/19) | ENDING ACCOUNT VALUE
(9/30/19) | EXPENSES PAID DURING PERIOD*
(4/1/19 - 9/30/19) | ANNUALIZED
EXPENSE RATIO |
| Actual | | | | |
| Class A | $1,000.00 | $1,063.70 | $2.53** | 0.49% |
| Class I | $1,000.00 | $1,064.70 | $1.24** | 0.24% |
| Hypothetical | | | | |
| (5% return per year before expenses) | | | | |
| Class A | $1,000.00 | $1,022.61 | $2.48** | 0.49% |
| Class I | $1,000.00 | $1,023.87 | $1.22** | 0.24% |
| | | | | |
| * Expenses are equal to the Fund’s annualized expense ratio for the indicated Class, multiplied by the average account value over the period, multiplied by 183/365 (to reflect the one-half year period). The Example assumes that the $1,000 was invested at the net asset value per share determined at the close of business on March 31, 2019. |
| ** Absent a waiver and/or reimbursement of expenses by an affiliate, expenses would be higher. |
6 www.calvert.com CALVERT US LARGE-CAP VALUE RESPONSIBLE INDEX FUND ANNUAL REPORT (Unaudited)
CALVERT US LARGE-CAP VALUE RESPONSIBLE INDEX FUND
SCHEDULE OF INVESTMENTS
SEPTEMBER 30, 2019
|
| | |
| | SHARES | VALUE ($) |
| COMMON STOCKS - 99.5% | | |
| | | |
| Aerospace & Defense - 0.1% | | |
| Hexcel Corp. | 1,445 | 118,678 |
| Moog, Inc., Class A | 3,019 | 244,901 |
| | | 363,579 |
| | | |
| Air Freight & Logistics - 1.2% | | |
| C.H. Robinson Worldwide, Inc. | 6,894 | 584,473 |
| Expeditors International of Washington, Inc. | 328 | 24,367 |
| FedEx Corp. | 12,047 | 1,753,682 |
| United Parcel Service, Inc., Class B | 22,891 | 2,742,800 |
| | | 5,105,322 |
| | | |
| Airlines - 1.2% | | |
| Alaska Air Group, Inc. | 7,397 | 480,139 |
| American Airlines Group, Inc. (1) | 25,970 | 700,411 |
| Delta Air Lines, Inc. | 31,229 | 1,798,790 |
| JetBlue Airways Corp. (2) | 2,216 | 37,118 |
| SkyWest, Inc. | 3,151 | 180,867 |
| Southwest Airlines Co. | 26,644 | 1,439,043 |
| Spirit Airlines, Inc. (2) | 3,646 | 132,350 |
| United Airlines Holdings, Inc. (2) | 3,875 | 342,589 |
| | | 5,111,307 |
| | | |
| Auto Components - 0.6% | | |
| Aptiv plc | 12,407 | 1,084,620 |
| Autoliv, Inc. | 3,894 | 307,159 |
| BorgWarner, Inc. | 13,379 | 490,741 |
| Gentex Corp. | 6,021 | 165,788 |
| Lear Corp. | 3,832 | 451,793 |
| | | 2,500,101 |
| | | |
| Automobiles - 0.6% | | |
| Ford Motor Co. | 209,386 | 1,917,976 |
| Harley-Davidson, Inc. (1) | 10,113 | 363,764 |
| Thor Industries, Inc. | 2,164 | 122,569 |
| | | 2,404,309 |
| | | |
| Banks - 14.0% | | |
| Associated Banc-Corp. | 10,419 | 210,985 |
| BancorpSouth Bank | 5,920 | 175,291 |
| Bank of America Corp. | 340,755 | 9,939,823 |
| Bank of Hawaii Corp. (1) | 2,913 | 250,314 |
www.calvert.com CALVERT US LARGE-CAP VALUE RESPONSIBLE INDEX FUND ANNUAL REPORT 7
|
| | |
| | SHARES | VALUE ($) |
| COMMON STOCKS - CONT’D | | |
| Bank OZK | 8,317 | 226,805 |
| BankUnited, Inc. | 6,290 | 211,470 |
| BB&T Corp. | 37,837 | 2,019,361 |
| BOK Financial Corp. | 2,379 | 188,298 |
| CenterState Bank Corp. | 9,255 | 221,981 |
| CIT Group, Inc. | 5,884 | 266,604 |
| Citigroup, Inc. | 87,140 | 6,019,631 |
| Citizens Financial Group, Inc. | 29,404 | 1,040,020 |
| Comerica, Inc. | 10,425 | 687,946 |
| Commerce Bancshares, Inc. (1) | 6,691 | 405,809 |
| Community Bank System, Inc. | 3,051 | 188,216 |
| Cullen/Frost Bankers, Inc. (1) | 4,024 | 356,325 |
| CVB Financial Corp. | 6,927 | 144,567 |
| East West Bancorp, Inc. | 9,728 | 430,853 |
| Fifth Third Bancorp | 48,505 | 1,328,067 |
| First Citizens BancShares, Inc., Class A | 427 | 201,352 |
| First Financial Bankshares, Inc. (1) | 3,774 | 125,787 |
| First Hawaiian, Inc. | 8,926 | 238,324 |
| First Horizon National Corp. | 20,662 | 334,724 |
| First Republic Bank | 6,789 | 656,496 |
| FNB Corp. | 22,014 | 253,821 |
| Glacier Bancorp, Inc. | 5,210 | 210,797 |
| Hancock Whitney Corp. | 5,799 | 222,073 |
| Home BancShares, Inc. | 10,525 | 197,817 |
| Huntington Bancshares, Inc. | 69,592 | 993,078 |
| IBERIABANK Corp. | 3,472 | 262,275 |
| Investors Bancorp, Inc. | 16,650 | 189,144 |
| JPMorgan Chase & Co. | 114,731 | 13,502,691 |
| KeyCorp | 67,548 | 1,205,056 |
| M&T Bank Corp. | 8,273 | 1,306,886 |
| Old National Bancorp | 9,343 | 160,746 |
| PacWest Bancorp | 7,743 | 281,381 |
| People’s United Financial, Inc. | 25,342 | 396,222 |
| Pinnacle Financial Partners, Inc. | 4,712 | 267,406 |
| PNC Financial Services Group, Inc. (The) | 20,309 | 2,846,510 |
| Popular, Inc. | 6,673 | 360,876 |
| Prosperity Bancshares, Inc. | 4,472 | 315,857 |
| Regions Financial Corp. | 64,092 | 1,013,936 |
| Signature Bank | 3,668 | 437,299 |
| Sterling Bancorp | 11,022 | 221,101 |
| SunTrust Banks, Inc. | 24,408 | 1,679,270 |
| SVB Financial Group (2) | 2,418 | 505,241 |
| Synovus Financial Corp. | 10,340 | 369,758 |
| Texas Capital Bancshares, Inc. (2) | 3,373 | 184,335 |
| U.S. Bancorp | 67,209 | 3,719,346 |
| UMB Financial Corp. | 3,299 | 213,049 |
| Umpqua Holdings Corp. | 14,941 | 245,929 |
8 www.calvert.com CALVERT US LARGE-CAP VALUE RESPONSIBLE INDEX FUND ANNUAL REPORT
|
| | |
| | SHARES | VALUE ($) |
| COMMON STOCKS - CONT’D | | |
| United Bankshares, Inc. | 6,884 | 260,697 |
| Valley National Bancorp | 20,904 | 227,227 |
| Webster Financial Corp. | 6,043 | 283,235 |
| Western Alliance Bancorp | 6,238 | 287,447 |
| Wintrust Financial Corp. | 3,490 | 225,559 |
| Zions BanCorp NA | 11,898 | 529,699 |
| | | 59,244,813 |
| | | |
| Beverages - 2.7% | | |
| Coca-Cola Co. (The) | 110,239 | 6,001,411 |
| Keurig Dr Pepper, Inc. (1) | 14,612 | 399,200 |
| PepsiCo, Inc. | 37,457 | 5,135,355 |
| | | 11,535,966 |
| | | |
| Biotechnology - 2.8% | | |
| AbbVie, Inc. | 13,980 | 1,058,566 |
| Allogene Therapeutics, Inc. (1)(2) | 3,335 | 90,895 |
| Amgen, Inc. | 18,975 | 3,671,852 |
| Amicus Therapeutics, Inc. (2) | 18,176 | 145,772 |
| Biogen, Inc. (2) | 4,517 | 1,051,648 |
| Blueprint Medicines Corp. (2) | 3,638 | 267,284 |
| FibroGen, Inc. (2) | 7,187 | 265,775 |
| Gilead Sciences, Inc. | 54,674 | 3,465,238 |
| Global Blood Therapeutics, Inc. (1)(2) | 4,257 | 206,550 |
| Sage Therapeutics, Inc. (1)(2) | 4,701 | 659,503 |
| Seattle Genetics, Inc. (1)(2) | 7,854 | 670,732 |
| Ultragenyx Pharmaceutical, Inc. (1)(2) | 5,386 | 230,413 |
| | | 11,784,228 |
| | | |
| Building Products - 0.7% | | |
| Fortune Brands Home & Security, Inc. | 5,668 | 310,040 |
| Johnson Controls International plc | 43,440 | 1,906,582 |
| Masco Corp. | 4,862 | 202,648 |
| Owens Corning | 11,721 | 740,767 |
| | | 3,160,037 |
| | | |
| Capital Markets - 5.8% | | |
| Affiliated Managers Group, Inc. | 1,345 | 112,106 |
| Ameriprise Financial, Inc. | 8,324 | 1,224,460 |
| Bank of New York Mellon Corp. (The) | 45,676 | 2,065,012 |
| BlackRock, Inc. | 5,633 | 2,510,290 |
| Charles Schwab Corp. (The) | 32,898 | 1,376,123 |
| CME Group, Inc. | 8,290 | 1,752,009 |
| E*Trade Financial Corp. | 8,022 | 350,481 |
| Evercore, Inc., Class A | 426 | 34,123 |
| Franklin Resources, Inc. (1) | 18,991 | 548,080 |
| Goldman Sachs Group, Inc. (The) | 14,677 | 3,041,515 |
www.calvert.com CALVERT US LARGE-CAP VALUE RESPONSIBLE INDEX FUND ANNUAL REPORT 9
|
| | |
| | SHARES | VALUE ($) |
| COMMON STOCKS - CONT’D | | |
| Houlihan Lokey, Inc. | 996 | 44,920 |
| Interactive Brokers Group, Inc., Class A | 3,778 | 203,181 |
| Intercontinental Exchange, Inc. | 18,700 | 1,725,449 |
| Invesco Ltd. | 25,158 | 426,176 |
| KKR & Co., Inc., Class A (1) | 34,396 | 923,533 |
| Lazard Ltd., Class A | 8,593 | 300,755 |
| Legg Mason, Inc. | 5,132 | 195,991 |
| LPL Financial Holdings, Inc. | 2,348 | 192,301 |
| Morgan Stanley | 57,883 | 2,469,868 |
| Nasdaq, Inc. | 3,485 | 346,235 |
| Northern Trust Corp. | 13,491 | 1,258,980 |
| Raymond James Financial, Inc. | 8,058 | 664,463 |
| State Street Corp. | 22,202 | 1,314,136 |
| Stifel Financial Corp. | 4,863 | 279,039 |
| T. Rowe Price Group, Inc. | 3,589 | 410,043 |
| TD Ameritrade Holding Corp. | 10,059 | 469,755 |
| Virtu Financial, Inc., Class A (1) | 4,340 | 71,002 |
| | | 24,310,026 |
| | | |
| Chemicals - 1.4% | | |
| Air Products & Chemicals, Inc. | 7,899 | 1,752,472 |
| Axalta Coating Systems Ltd. (2) | 1,257 | 37,899 |
| Eastman Chemical Co. | 13,201 | 974,630 |
| Ecolab, Inc. | 3,581 | 709,181 |
| International Flavors & Fragrances, Inc. (1) | 2,060 | 252,741 |
| Mosaic Co. (The) | 29,745 | 609,773 |
| PPG Industries, Inc. | 10,614 | 1,257,865 |
| Sensient Technologies Corp. | 2,794 | 191,808 |
| | | 5,786,369 |
| | | |
| Commercial Services & Supplies - 0.6% | | |
| ADT, Inc. (1) | 5,980 | 37,495 |
| IAA, Inc. (2) | 3,006 | 125,440 |
| KAR Auction Services, Inc. | 4,309 | 105,786 |
| MSA Safety, Inc. | 361 | 39,389 |
| Republic Services, Inc. | 12,037 | 1,041,802 |
| UniFirst Corp. | 578 | 112,779 |
| Waste Management, Inc. | 10,824 | 1,244,760 |
| | | 2,707,451 |
| | | |
| Communications Equipment - 1.8% | | |
| Ciena Corp. (2) | 911 | 35,738 |
| Cisco Systems, Inc. | 143,687 | 7,099,575 |
| EchoStar Corp., Class A (2) | 2,611 | 103,448 |
10 www.calvert.com CALVERT US LARGE-CAP VALUE RESPONSIBLE INDEX FUND ANNUAL REPORT
|
| | |
| | SHARES | VALUE ($) |
| COMMON STOCKS - CONT’D | | |
| Juniper Networks, Inc. | 17,489 | 432,853 |
| ViaSat, Inc. (2) | 821 | 61,838 |
| Viavi Solutions, Inc. (2) | 2,794 | 39,130 |
| | | 7,772,582 |
| | | |
| Construction & Engineering - 0.3% | | |
| EMCOR Group, Inc. | 5,978 | 514,825 |
| Quanta Services, Inc. | 15,110 | 571,158 |
| | | 1,085,983 |
| | | |
| Consumer Finance - 2.2% | | |
| Ally Financial, Inc. | 25,250 | 837,290 |
| American Express Co. | 22,784 | 2,694,891 |
| Capital One Financial Corp. | 23,143 | 2,105,550 |
| Discover Financial Services | 19,242 | 1,560,334 |
| FirstCash, Inc. | 540 | 49,502 |
| OneMain Holdings, Inc. | 5,053 | 185,344 |
| SLM Corp. | 29,374 | 259,226 |
| Synchrony Financial | 42,617 | 1,452,813 |
| | | 9,144,950 |
| | | |
| Containers & Packaging - 0.7% | | |
| AptarGroup, Inc. | 1,245 | 147,470 |
| Ardagh Group S.A. | 1,821 | 28,553 |
| Berry Global Group, Inc. (2) | 6,206 | 243,710 |
| Crown Holdings, Inc. (2) | 10,014 | 661,525 |
| Sealed Air Corp. | 14,497 | 601,771 |
| Sonoco Products Co. | 8,583 | 499,616 |
| WestRock Co. | 24,320 | 886,464 |
| | | 3,069,109 |
| | | |
| Distributors - 0.2% | | |
| Genuine Parts Co. | 6,730 | 670,241 |
| LKQ Corp. (2) | 8,422 | 264,872 |
| | | 935,113 |
| | | |
| Diversified Consumer Services - 0.3% | | |
| Chegg, Inc. (2) | 4,017 | 120,309 |
| Graham Holdings Co., Class B | 242 | 160,555 |
| H&R Block, Inc. (1) | 11,618 | 274,417 |
| Laureate Education, Inc., Class A (2) | 4,265 | 70,692 |
| Service Corp. International | 7,162 | 342,415 |
| ServiceMaster Global Holdings, Inc. (2) | 3,824 | 213,762 |
| Strategic Education, Inc. | 308 | 41,851 |
| | | 1,224,001 |
| | | |
www.calvert.com CALVERT US LARGE-CAP VALUE RESPONSIBLE INDEX FUND ANNUAL REPORT 11
|
| | |
| | SHARES | VALUE ($) |
| COMMON STOCKS - CONT’D | | |
| Diversified Financial Services - 0.3% | | |
| AXA Equitable Holdings, Inc. | 20,260 | 448,961 |
| Jefferies Financial Group, Inc. | 16,425 | 302,220 |
| Voya Financial, Inc. | 9,704 | 528,286 |
| | | 1,279,467 |
| | | |
| Diversified Telecommunication Services - 5.0% | | |
| AT&T, Inc. | 273,368 | 10,344,245 |
| CenturyLink, Inc. | 55,591 | 693,776 |
| GCI Liberty, Inc., Class A (2) | 5,946 | 369,068 |
| Iridium Communications, Inc. (2) | 1,586 | 33,750 |
| Verizon Communications, Inc. | 162,164 | 9,788,219 |
| | | 21,229,058 |
| | | |
| Electric Utilities - 1.8% | | |
| Alliant Energy Corp. | 20,583 | 1,110,041 |
| Avangrid, Inc. | 5,745 | 300,176 |
| Eversource Energy | 18,955 | 1,620,084 |
| NextEra Energy, Inc. | 8,147 | 1,898,170 |
| Portland General Electric Co. | 10,361 | 584,050 |
| Xcel Energy, Inc. | 29,068 | 1,886,222 |
| | | 7,398,743 |
| | | |
| Electrical Equipment - 1.5% | | |
| Acuity Brands, Inc. | 1,719 | 231,704 |
| AMETEK, Inc. | 2,713 | 249,108 |
| Eaton Corp. plc | 21,844 | 1,816,329 |
| Emerson Electric Co. | 29,454 | 1,969,294 |
| GrafTech International Ltd. (1) | 5,183 | 66,342 |
| Hubbell, Inc. | 3,872 | 508,781 |
| nVent Electric plc | 13,930 | 307,017 |
| Regal-Beloit Corp. | 4,035 | 293,950 |
| Rockwell Automation, Inc. | 6,094 | 1,004,291 |
| | | 6,446,816 |
| | | |
| Electronic Equipment, Instruments & Components - 0.6% | | |
| Arrow Electronics, Inc. (2) | 4,560 | 340,085 |
| Avnet, Inc. | 5,685 | 252,897 |
| CDW Corp. | 1,866 | 229,966 |
| Corning, Inc. | 23,274 | 663,774 |
| Dolby Laboratories, Inc., Class A | 1,974 | 127,599 |
| FLIR Systems, Inc. | 2,820 | 148,304 |
| Jabil, Inc. | 7,103 | 254,074 |
| National Instruments Corp. | 2,219 | 93,176 |
12 www.calvert.com CALVERT US LARGE-CAP VALUE RESPONSIBLE INDEX FUND ANNUAL REPORT
|
| | |
| | SHARES | VALUE ($) |
| COMMON STOCKS - CONT’D | | |
| SYNNEX Corp. | 2,564 | 289,476 |
| Tech Data Corp. (2) | 2,333 | 243,192 |
| Zebra Technologies Corp., Class A (2) | 186 | 38,385 |
| | | 2,680,928 |
| | | |
| Energy Equipment & Services - 0.4% | | |
| Baker Hughes, a GE Co. | 44,311 | 1,028,015 |
| National Oilwell Varco, Inc. | 39,367 | 834,581 |
| | | 1,862,596 |
| | | |
| Entertainment - 1.8% | | |
| Activision Blizzard, Inc. | 10,341 | 547,246 |
| Cinemark Holdings, Inc. | 5,204 | 201,083 |
| Lions Gate Entertainment Corp., Class A | 9,204 | 85,137 |
| Madison Square Garden Co. (The), Class A (2) | 168 | 44,271 |
| Viacom, Inc., Class B | 22,260 | 534,908 |
| Walt Disney Co. (The) | 45,835 | 5,973,217 |
| | | 7,385,862 |
| | | |
| Food & Staples Retailing - 3.6% | | |
| BJ’s Wholesale Club Holdings, Inc. (2) | 8,772 | 226,932 |
| Casey’s General Stores, Inc. | 2,680 | 431,909 |
| Costco Wholesale Corp. | 10,032 | 2,890,319 |
| Kroger Co. (The) | 52,435 | 1,351,774 |
| Performance Food Group Co. (2) | 8,607 | 396,008 |
| Sysco Corp. | 19,946 | 1,583,712 |
| US Foods Holding Corp. (2) | 16,969 | 697,426 |
| Walgreens Boots Alliance, Inc. | 38,105 | 2,107,588 |
| Walmart, Inc. | 47,317 | 5,615,582 |
| | | 15,301,250 |
| | | |
| Food Products - 2.8% | | |
| Bunge Ltd. | 10,490 | 593,944 |
| Campbell Soup Co. | 6,944 | 325,812 |
| Conagra Brands, Inc. | 36,338 | 1,114,850 |
| Flowers Foods, Inc. | 13,902 | 321,553 |
| General Mills, Inc. | 30,907 | 1,703,594 |
| Hershey Co. (The) | 272 | 42,157 |
| Hormel Foods Corp. (1) | 11,716 | 512,341 |
| Ingredion, Inc. | 4,807 | 392,924 |
| J&J Snack Foods Corp. | 229 | 43,968 |
| JM Smucker Co. (The) | 6,467 | 711,499 |
| Kellogg Co. | 19,021 | 1,224,001 |
| Kraft Heinz Co. (The) | 42,731 | 1,193,691 |
| Lancaster Colony Corp. | 302 | 41,872 |
| McCormick & Co., Inc. | 1,187 | 185,528 |
www.calvert.com CALVERT US LARGE-CAP VALUE RESPONSIBLE INDEX FUND ANNUAL REPORT 13
|
| | |
| | SHARES | VALUE ($) |
| COMMON STOCKS - CONT’D | | |
| Mondelez International, Inc., Class A | 49,577 | 2,742,600 |
| Post Holdings, Inc. (2) | 2,783 | 294,553 |
| TreeHouse Foods, Inc. (2) | 3,413 | 189,251 |
| | | 11,634,138 |
| | | |
| Gas Utilities - 0.8% | | |
| Atmos Energy Corp. | 9,601 | 1,093,458 |
| New Jersey Resources Corp. | 3,646 | 164,872 |
| ONE Gas, Inc. | 4,398 | 422,692 |
| Southwest Gas Holdings, Inc. | 5,802 | 528,214 |
| Spire, Inc. | 5,491 | 479,035 |
| UGI Corp. | 17,630 | 886,260 |
| | | 3,574,531 |
| | | |
| Health Care Equipment & Supplies - 1.2% | | |
| Abbott Laboratories | 4,103 | 343,298 |
| Baxter International, Inc. | 13,713 | 1,199,476 |
| Danaher Corp. | 12,216 | 1,764,357 |
| DENTSPLY SIRONA, Inc. | 8,406 | 448,124 |
| Novocure Ltd. (2) | 6,358 | 475,452 |
| STERIS plc | 980 | 141,600 |
| Tandem Diabetes Care, Inc. (2) | 5,040 | 297,259 |
| Varian Medical Systems, Inc. (2) | 1,533 | 182,565 |
| | | 4,852,131 |
| | | |
| Health Care Providers & Services - 3.4% | | |
| Acadia Healthcare Co., Inc. (2) | 1,421 | 44,165 |
| Anthem, Inc. | 11,133 | 2,673,033 |
| Centene Corp. (2) | 26,203 | 1,133,542 |
| Covetrus, Inc. (1)(2) | 5,122 | 60,901 |
| CVS Health Corp. | 56,083 | 3,537,155 |
| Encompass Health Corp. | 4,873 | 308,363 |
| Ensign Group, Inc. (The) | 653 | 30,972 |
| Guardant Health, Inc. (2) | 3,497 | 223,214 |
| HCA Healthcare, Inc. | 11,125 | 1,339,672 |
| Henry Schein, Inc. (2) | 7,477 | 474,789 |
| Humana, Inc. | 6,573 | 1,680,519 |
| Laboratory Corp. of America Holdings (2) | 4,694 | 788,592 |
| LHC Group, Inc. (2) | 328 | 37,248 |
| Molina Healthcare, Inc. (2) | 5,620 | 616,626 |
| Quest Diagnostics, Inc. | 9,498 | 1,016,571 |
| WellCare Health Plans, Inc. (2) | 1,311 | 339,772 |
| | | 14,305,134 |
| | | |
| Health Care Technology - 0.1% | | |
| Teladoc Health, Inc. (1)(2) | 5,280 | 357,562 |
| | | |
14 www.calvert.com CALVERT US LARGE-CAP VALUE RESPONSIBLE INDEX FUND ANNUAL REPORT
|
| | |
| | SHARES | VALUE ($) |
| COMMON STOCKS - CONT’D | | |
| Hotels, Restaurants & Leisure - 1.1% | | |
| Aramark | 19,039 | 829,720 |
| Cracker Barrel Old Country Store, Inc. (1) | 1,301 | 211,608 |
| Darden Restaurants, Inc. | 3,889 | 459,758 |
| Extended Stay America, Inc. | 10,208 | 149,445 |
| Hilton Worldwide Holdings, Inc. | 3,682 | 342,831 |
| Hyatt Hotels Corp., Class A | 1,298 | 95,624 |
| Marriott International, Inc., Class A | 5,132 | 638,267 |
| Royal Caribbean Cruises Ltd. | 9,049 | 980,278 |
| Six Flags Entertainment Corp. | 4,018 | 204,074 |
| Texas Roadhouse, Inc. | 2,372 | 124,577 |
| Vail Resorts, Inc. | 806 | 183,413 |
| Wendy’s Co. (The) | 13,044 | 260,619 |
| Wyndham Destinations, Inc. | 5,127 | 235,944 |
| | | 4,716,158 |
| | | |
| Household Durables - 0.8% | | |
| Helen of Troy Ltd. (2) | 272 | 42,884 |
| Leggett & Platt, Inc. (1) | 5,463 | 223,655 |
| Lennar Corp., Class A | 21,559 | 1,204,070 |
| Mohawk Industries, Inc. (2) | 3,498 | 433,997 |
| Newell Brands, Inc. (1) | 20,968 | 392,521 |
| Tempur Sealy International, Inc. (2) | 510 | 39,372 |
| Toll Brothers, Inc. | 13,717 | 563,083 |
| Whirlpool Corp. | 2,682 | 424,721 |
| | | 3,324,303 |
| | | |
| Household Products - 2.1% | | |
| Church & Dwight Co., Inc. | 490 | 36,868 |
| Clorox Co. (The) | 1,535 | 233,120 |
| Colgate-Palmolive Co. | 3,372 | 247,876 |
| Kimberly-Clark Corp. | 7,830 | 1,112,252 |
| Procter & Gamble Co. (The) | 59,169 | 7,359,440 |
| Spectrum Brands Holdings, Inc. | 411 | 21,648 |
| | | 9,011,204 |
| | | |
| Independent Power and Renewable Electricity Producers - 0.4% | | |
| AES Corp. | 66,608 | 1,088,375 |
| Ormat Technologies, Inc. | 1,292 | 95,983 |
| TerraForm Power, Inc., Class A | 21,585 | 393,386 |
| | | 1,577,744 |
| | | |
| Industrial Conglomerates - 0.7% | | |
| 3M Co. | 15,393 | 2,530,609 |
| Carlisle Cos., Inc. | 2,527 | 367,780 |
| | | 2,898,389 |
| | | |
www.calvert.com CALVERT US LARGE-CAP VALUE RESPONSIBLE INDEX FUND ANNUAL REPORT 15
|
| | |
| | SHARES | VALUE ($) |
| COMMON STOCKS - CONT’D | | |
| Insurance - 7.2% | | |
| Aflac, Inc. | 39,400 | 2,061,408 |
| Alleghany Corp. (2) | 674 | 537,690 |
| Allstate Corp. (The) | 18,103 | 1,967,434 |
| American Financial Group, Inc. | 5,133 | 553,594 |
| American International Group, Inc. | 40,242 | 2,241,480 |
| American National Insurance Co. | 714 | 88,343 |
| Arch Capital Group Ltd. (2) | 23,933 | 1,004,707 |
| Arthur J. Gallagher & Co. | 8,383 | 750,865 |
| Assurant, Inc. | 4,121 | 518,504 |
| Assured Guaranty Ltd. | 7,281 | 323,713 |
| Athene Holding Ltd., Class A (2) | 9,419 | 396,163 |
| Brown & Brown, Inc. | 6,517 | 235,003 |
| Cincinnati Financial Corp. | 10,889 | 1,270,420 |
| Enstar Group Ltd. (2) | 996 | 189,160 |
| Erie Indemnity Co., Class A | 392 | 72,775 |
| Everest Re Group Ltd. | 444 | 118,144 |
| Fidelity National Financial, Inc. | 19,027 | 844,989 |
| First American Financial Corp. | 7,955 | 469,425 |
| Globe Life, Inc. | 7,553 | 723,275 |
| Hanover Insurance Group, Inc. (The) | 2,894 | 392,253 |
| Hartford Financial Services Group, Inc. (The) | 23,557 | 1,427,790 |
| Kemper Corp. | 2,830 | 220,599 |
| Lincoln National Corp. | 12,354 | 745,193 |
| Marsh & McLennan Cos., Inc. | 6,244 | 624,712 |
| Mercury General Corp. | 1,929 | 107,793 |
| MetLife, Inc. | 40,303 | 1,900,690 |
| Old Republic International Corp. | 20,645 | 486,603 |
| Primerica, Inc. | 1,736 | 220,871 |
| Principal Financial Group, Inc. | 18,695 | 1,068,232 |
| Progressive Corp. (The) | 24,040 | 1,857,090 |
| Prudential Financial, Inc. | 20,324 | 1,828,144 |
| Reinsurance Group of America, Inc. | 4,306 | 688,443 |
| RenaissanceRe Holdings Ltd. | 2,229 | 431,200 |
| RLI Corp. | 1,379 | 128,123 |
| Selective Insurance Group, Inc. | 3,928 | 295,346 |
| Travelers Cos., Inc. (The) | 14,354 | 2,134,296 |
| Unum Group | 11,219 | 333,429 |
| White Mountains Insurance Group Ltd. | 197 | 212,760 |
| Willis Towers Watson plc | 3,825 | 738,110 |
| | | 30,208,769 |
| | | |
| Interactive Media & Services - 0.1% | | |
| Twitter, Inc. (2) | 10,045 | 413,854 |
| | | |
16 www.calvert.com CALVERT US LARGE-CAP VALUE RESPONSIBLE INDEX FUND ANNUAL REPORT
|
| | |
| | SHARES | VALUE ($) |
| COMMON STOCKS - CONT’D | | |
| Internet & Direct Marketing Retail - 0.2% | | |
| eBay, Inc. | 13,926 | 542,835 |
| Qurate Retail, Inc., Class A (2) | 17,642 | 181,977 |
| Wayfair, Inc., Class A (1)(2) | 447 | 50,118 |
| | | 774,930 |
| | | |
| IT Services - 2.1% | | |
| Alliance Data Systems Corp. | 3,472 | 444,868 |
| Amdocs Ltd. | 3,563 | 235,550 |
| Automatic Data Processing, Inc. | 3,994 | 644,712 |
| Booz Allen Hamilton Holding Corp. | 2,053 | 145,804 |
| Cognizant Technology Solutions Corp., Class A | 9,962 | 600,360 |
| CoreLogic, Inc. (2) | 1,164 | 53,858 |
| DXC Technology Co. | 14,714 | 434,063 |
| Genpact Ltd. | 971 | 37,626 |
| GoDaddy, Inc., Class A (2) | 516 | 34,046 |
| International Business Machines Corp. | 35,884 | 5,218,251 |
| LiveRamp Holdings, Inc. (2) | 4,341 | 186,489 |
| MAXIMUS, Inc. | 431 | 33,299 |
| Paychex, Inc. | 3,183 | 263,457 |
| Sabre Corp. | 11,631 | 260,476 |
| Science Applications International Corp. | 2,275 | 198,721 |
| | | 8,791,580 |
| | | |
| Leisure Products - 0.2% | | |
| Brunswick Corp. | 2,918 | 152,086 |
| Hasbro, Inc. | 3,058 | 362,954 |
| Mattel, Inc. (2) | 11,754 | 133,878 |
| | | 648,918 |
| | | |
| Life Sciences Tools & Services - 0.3% | | |
| Agilent Technologies, Inc. | 10,783 | 826,301 |
| Bio-Rad Laboratories, Inc., Class A (2) | 1,007 | 335,069 |
| PerkinElmer, Inc. | 390 | 33,217 |
| | | 1,194,587 |
| | | |
| Machinery - 4.9% | | |
| AGCO Corp. | 6,577 | 497,879 |
| Allison Transmission Holdings, Inc. | 3,193 | 150,231 |
| Caterpillar, Inc. | 19,685 | 2,486,412 |
| CNH Industrial NV | 93,270 | 946,690 |
| Colfax Corp. (2) | 4,721 | 137,192 |
| Crane Co. | 4,950 | 399,119 |
| Cummins, Inc. | 8,965 | 1,458,337 |
| Deere & Co. | 13,356 | 2,252,890 |
| Donaldson Co., Inc. | 4,718 | 245,713 |
| Dover Corp. | 7,125 | 709,365 |
| Flowserve Corp. | 8,382 | 391,523 |
www.calvert.com CALVERT US LARGE-CAP VALUE RESPONSIBLE INDEX FUND ANNUAL REPORT 17
|
| | |
| | SHARES | VALUE ($) |
| COMMON STOCKS - CONT’D | | |
| Fortive Corp. | 18,503 | 1,268,566 |
| Gardner Denver Holdings, Inc. (2) | 1,073 | 30,355 |
| Gates Industrial Corp. plc (1)(2) | 3,618 | 36,433 |
| IDEX Corp. | 783 | 128,318 |
| Illinois Tool Works, Inc. | 7,286 | 1,140,186 |
| Ingersoll-Rand plc | 8,953 | 1,103,099 |
| ITT, Inc. | 6,767 | 414,073 |
| Lincoln Electric Holdings, Inc. | 1,703 | 147,752 |
| Navistar International Corp. (2) | 6,199 | 174,254 |
| Nordson Corp. | 452 | 66,110 |
| Oshkosh Corp. | 6,398 | 484,968 |
| PACCAR, Inc. | 20,533 | 1,437,515 |
| Parker-Hannifin Corp. | 7,280 | 1,314,841 |
| Pentair plc | 17,506 | 661,727 |
| Snap-on, Inc. (1) | 2,631 | 411,857 |
| Stanley Black & Decker, Inc. | 4,226 | 610,277 |
| Timken Co. (The) | 6,521 | 283,729 |
| WABCO Holdings, Inc. (2) | 284 | 37,985 |
| Wabtec Corp. (1) | 12,113 | 870,440 |
| Watts Water Technologies, Inc., Class A | 1,418 | 132,909 |
| Woodward, Inc. | 788 | 84,970 |
| Xylem, Inc. | 4,023 | 320,311 |
| | | 20,836,026 |
| | | |
| Media - 2.3% | | |
| AMC Networks, Inc., Class A (2) | 2,598 | 127,718 |
| CBS Corp., Class B | 20,145 | 813,254 |
| Comcast Corp., Class A | 132,766 | 5,985,091 |
| Discovery, Inc., Class A (1)(2) | 8,199 | 218,339 |
| DISH Network Corp., Class A (2) | 11,337 | 386,252 |
| Interpublic Group of Cos., Inc. (The) | 23,581 | 508,406 |
| Liberty Latin America Ltd., Class C (2) | 3,507 | 59,952 |
| New York Times Co. (The), Class A (1) | 1,109 | 31,584 |
| Nexstar Media Group, Inc., Class A | 1,589 | 162,571 |
| Omnicom Group, Inc. (1) | 12,608 | 987,207 |
| Sinclair Broadcast Group, Inc., Class A | 2,191 | 93,643 |
| TEGNA, Inc. | 12,934 | 200,865 |
| | | 9,574,882 |
| | | |
| Metals & Mining - 0.6% | | |
| Nucor Corp. | 22,569 | 1,148,988 |
| Reliance Steel & Aluminum Co. | 6,640 | 661,742 |
| Steel Dynamics, Inc. | 18,671 | 556,396 |
| | | 2,367,126 |
| | | |
| Multi-Utilities - 1.5% | | |
| Ameren Corp. | 17,613 | 1,409,921 |
| CenterPoint Energy, Inc. | 11,598 | 350,027 |
18 www.calvert.com CALVERT US LARGE-CAP VALUE RESPONSIBLE INDEX FUND ANNUAL REPORT
|
| | |
| | SHARES | VALUE ($) |
| COMMON STOCKS - CONT’D | | |
| CMS Energy Corp. | 19,335 | 1,236,473 |
| Consolidated Edison, Inc. | 19,755 | 1,866,255 |
| Sempra Energy | 11,347 | 1,674,931 |
| | | 6,537,607 |
| | | |
| Multiline Retail - 0.9% | | |
| Dollar General Corp. | 3,048 | 484,449 |
| Kohl’s Corp. | 7,526 | 373,741 |
| Macy’s, Inc. (1) | 13,079 | 203,248 |
| Nordstrom, Inc. (1) | 6,640 | 223,569 |
| Target Corp. | 24,939 | 2,666,228 |
| | | 3,951,235 |
| | | |
| Personal Products - 0.0% (3) | | |
| Coty, Inc., Class A | 6,159 | 64,731 |
| | | |
| Pharmaceuticals - 2.6% | | |
| Bristol-Myers Squibb Co. | 35,140 | 1,781,949 |
| Catalent, Inc. (2) | 784 | 37,366 |
| Elanco Animal Health, Inc. (2) | 19,219 | 511,033 |
| Jazz Pharmaceuticals plc (2) | 277 | 35,495 |
| Merck & Co., Inc. | 42,207 | 3,552,985 |
| Perrigo Co. plc | 3,497 | 195,447 |
| Pfizer, Inc. | 131,031 | 4,707,944 |
| | | 10,822,219 |
| | | |
| Professional Services - 0.2% | | |
| FTI Consulting, Inc. (2) | 1,383 | 146,584 |
| ManpowerGroup, Inc. | 3,231 | 272,180 |
| Nielsen Holdings plc | 4,560 | 96,900 |
| Robert Half International, Inc. | 2,532 | 140,931 |
| | | 656,595 |
| | | |
| Real Estate Management & Development - 0.4% | | |
| CBRE Group, Inc., Class A (2) | 15,282 | 810,099 |
| Jones Lang LaSalle, Inc. | 5,220 | 725,893 |
| | | 1,535,992 |
| | | |
| Road & Rail - 1.0% | | |
| AMERCO | 391 | 152,506 |
| Genesee & Wyoming, Inc., Class A (2) | 3,043 | 336,282 |
| JB Hunt Transport Services, Inc. | 1,627 | 180,028 |
| Kansas City Southern | 3,616 | 480,964 |
| Knight-Swift Transportation Holdings, Inc. | 8,316 | 301,871 |
| Landstar System, Inc. | 355 | 39,966 |
www.calvert.com CALVERT US LARGE-CAP VALUE RESPONSIBLE INDEX FUND ANNUAL REPORT 19
|
| | |
| | SHARES | VALUE ($) |
| COMMON STOCKS - CONT’D | | |
| Norfolk Southern Corp. | 7,250 | 1,302,535 |
| Schneider National, Inc., Class B | 4,691 | 101,888 |
| Union Pacific Corp. | 9,343 | 1,513,379 |
| | | 4,409,419 |
| | | |
| Semiconductors & Semiconductor Equipment - 2.7% | | |
| Analog Devices, Inc. | 3,633 | 405,915 |
| Applied Materials, Inc. | 989 | 49,351 |
| Cree, Inc. (2) | 4,530 | 221,970 |
| Cypress Semiconductor Corp. | 18,224 | 425,348 |
| First Solar, Inc. (2) | 3,896 | 226,007 |
| Intel Corp. | 135,941 | 7,005,040 |
| KLA Corp. | 3,389 | 540,376 |
| Lam Research Corp. | 316 | 73,031 |
| Marvell Technology Group Ltd. | 14,799 | 369,531 |
| Maxim Integrated Products, Inc. | 6,252 | 362,053 |
| Micron Technology, Inc. (2) | 22,784 | 976,294 |
| ON Semiconductor Corp. (2) | 6,772 | 130,090 |
| Skyworks Solutions, Inc. | 5,110 | 404,968 |
| Teradyne, Inc. | 810 | 46,907 |
| | | 11,236,881 |
| | | |
| Software - 1.3% | | |
| Anaplan, Inc. (2) | 5,409 | 254,223 |
| Autodesk, Inc. (2) | 3,043 | 449,451 |
| Avalara, Inc. (2) | 2,758 | 185,586 |
| Ceridian HCM Holding, Inc. (1)(2) | 709 | 35,003 |
| Cornerstone OnDemand, Inc. (2) | 647 | 35,469 |
| DocuSign, Inc. (2) | 4,404 | 272,696 |
| Dropbox, Inc., Class A (2) | 9,061 | 182,760 |
| Elastic NV (2) | 2,215 | 182,383 |
| FireEye, Inc. (2) | 2,957 | 39,446 |
| Nuance Communications, Inc. (2) | 9,911 | 161,648 |
| Oracle Corp. | 51,388 | 2,827,882 |
| Pivotal Software, Inc., Class A (2) | 7,019 | 104,723 |
| Pluralsight, Inc., Class A (1)(2) | 4,036 | 67,785 |
| Q2 Holdings, Inc. (2) | 479 | 37,779 |
| Smartsheet, Inc., Class A (2) | 6,045 | 217,801 |
| Zendesk, Inc. (2) | 404 | 29,444 |
| Zscaler, Inc. (1)(2) | 5,241 | 247,690 |
| | | 5,331,769 |
| | | |
| Specialty Retail - 1.0% | | |
| Aaron’s, Inc. | 2,914 | 187,254 |
| Advance Auto Parts, Inc. | 1,894 | 313,268 |
| American Eagle Outfitters, Inc. | 10,694 | 173,457 |
| AutoNation, Inc. (2) | 3,400 | 172,380 |
20 www.calvert.com CALVERT US LARGE-CAP VALUE RESPONSIBLE INDEX FUND ANNUAL REPORT
|
| | |
| | SHARES | VALUE ($) |
| COMMON STOCKS - CONT’D | | |
| Best Buy Co., Inc. | 11,961 | 825,189 |
| CarMax, Inc. (1)(2) | 6,757 | 594,616 |
| Dick’s Sporting Goods, Inc. (1) | 4,863 | 198,459 |
| Foot Locker, Inc. | 6,456 | 278,641 |
| Gap, Inc. (The) | 7,921 | 137,508 |
| L Brands, Inc. | 9,823 | 192,433 |
| Lowe’s Cos., Inc. | 4,763 | 523,739 |
| Penske Automotive Group, Inc. | 1,996 | 94,371 |
| Tiffany & Co. (1) | 3,280 | 303,826 |
| Williams-Sonoma, Inc. (1) | 4,520 | 307,270 |
| | | 4,302,411 |
| | | |
| Technology Hardware, Storage & Peripherals - 2.6% | | |
| Apple, Inc. | 33,729 | 7,554,284 |
| Dell Technologies, Class C (2) | 3,011 | 156,151 |
| HP, Inc. | 81,109 | 1,534,582 |
| NetApp, Inc. | 6,330 | 332,388 |
| Pure Storage, Inc., Class A (2) | 4,149 | 70,284 |
| Seagate Technology plc | 14,946 | 803,945 |
| Xerox Holdings Corp. (2) | 10,358 | 309,808 |
| | | 10,761,442 |
| | | |
| Textiles, Apparel & Luxury Goods - 0.6% | | |
| Capri Holdings Ltd. (2) | 5,209 | 172,730 |
| Carter’s, Inc. | 1,517 | 138,366 |
| Columbia Sportswear Co. | 773 | 74,896 |
| Hanesbrands, Inc. (1) | 15,317 | 234,656 |
| NIKE, Inc., Class B | 3,544 | 332,853 |
| PVH Corp. | 3,032 | 267,513 |
| Ralph Lauren Corp. | 1,894 | 180,820 |
| Skechers U.S.A., Inc., Class A (2) | 4,724 | 176,441 |
| Tapestry, Inc. | 13,595 | 354,150 |
| VF Corp. | 6,355 | 565,532 |
| | | 2,497,957 |
| | | |
| Thrifts & Mortgage Finance - 0.2% | | |
| Essent Group Ltd. | 1,063 | 50,673 |
| MGIC Investment Corp. | 23,041 | 289,856 |
| New York Community Bancorp, Inc. | 25,588 | 321,129 |
| Radian Group, Inc. | 14,469 | 330,472 |
| TFS Financial Corp. (1) | 2,077 | 37,428 |
| | | 1,029,558 |
| | | |
| Trading Companies & Distributors - 0.5% | | |
| Air Lease Corp. | 10,611 | 443,752 |
| HD Supply Holdings, Inc. (2) | 10,401 | 407,459 |
www.calvert.com CALVERT US LARGE-CAP VALUE RESPONSIBLE INDEX FUND ANNUAL REPORT 21
|
| | |
| | SHARES | VALUE ($) |
| COMMON STOCKS - CONT’D | | |
| MSC Industrial Direct Co., Inc., Class A | 4,098 | 297,228 |
| United Rentals, Inc. (2) | 6,489 | 808,789 |
| W.W. Grainger, Inc. | 735 | 218,405 |
| | | 2,175,633 |
| | | |
| Transportation Infrastructure - 0.0% (3) | | |
| Macquarie Infrastructure Corp. | 4,381 | 172,918 |
| | | |
| Water Utilities - 0.3% | | |
| American Water Works Co., Inc. | 8,675 | 1,077,695 |
| Aqua America, Inc. | 8,640 | 387,331 |
| | | 1,465,026 |
| | | |
| Wireless Telecommunication Services - 0.2% | | |
| Sprint Corp. (2) | 13,712 | 84,603 |
| T-Mobile US, Inc. (2) | 9,049 | 712,790 |
| Telephone & Data Systems, Inc. | 5,018 | 129,464 |
| United States Cellular Corp. (2) | 759 | 28,523 |
| | | 955,380 |
| | | |
| Total Common Stocks (Cost $390,190,735) | | 419,798,705 |
| | | |
| | | |
| SHORT TERM INVESTMENT OF CASH COLLATERAL FOR SECURITIES LOANED - 0.3% | | |
| State Street Navigator Securities Lending Government Money Market Portfolio, 2.07% | 1,149,842 | 1,149,842 |
| | | |
| Total Short Term Investment of Cash Collateral for Securities Loaned (Cost $1,149,842) | | 1,149,842 |
| | | |
| | | |
| TOTAL INVESTMENTS (Cost $391,340,577) - 99.8% | | 420,948,547 |
| Other assets and liabilities, net - 0.2% | | 932,390 |
NET ASSETS - 100.0% | | 421,880,937 |
| | | |
|
|
| NOTES TO SCHEDULE OF INVESTMENTS |
| (1) All or a portion of this security was on loan at September 30, 2019. The aggregate market value of securities on loan at September 30, 2019 was $11,403,846. |
| (2) Non-income producing security. |
| (3) Amount is less than 0.05%. |
| See notes to financial statements. |
22 www.calvert.com CALVERT US LARGE-CAP VALUE RESPONSIBLE INDEX FUND ANNUAL REPORT
CALVERT US LARGE-CAP VALUE RESPONSIBLE INDEX FUND
STATEMENT OF ASSETS AND LIABILITIES
SEPTEMBER 30, 2019
|
| | | |
| ASSETS | |
Investments in securities of unaffiliated issuers, at value (identified cost $391,340,577) - including $11,403,846 of securities on loan |
| $420,948,547 |
|
| Cash | 2,386,930 |
|
| Receivable for capital shares sold | 1,895,875 |
|
| Dividends receivable | 459,239 |
|
| Securities lending income receivable | 1,366 |
|
| Receivable from affiliate | 51,201 |
|
| Directors’ deferred compensation plan | 152,862 |
|
| Other assets | 12,341 |
|
| Total assets | 425,908,361 |
|
| | |
| LIABILITIES | |
| Payable for investments purchased | 2,149,974 |
|
| Payable for capital shares redeemed | 333,187 |
|
| Deposits for securities loaned | 1,149,842 |
|
| Payable to affiliates: | |
| Investment advisory fee | 40,630 |
|
| Administrative fee | 40,630 |
|
| Distribution and service fees | 10,740 |
|
| Sub-transfer agency fee | 2,804 |
|
| Directors’ deferred compensation plan | 152,862 |
|
| Accrued expenses | 146,755 |
|
| Total liabilities | 4,027,424 |
|
| NET ASSETS |
| $421,880,937 |
|
| | |
| NET ASSETS CONSIST OF: | |
| Paid-in capital applicable to common stock | |
| (75,000,000 shares per class of $0.01 par value authorized) |
| $389,205,642 |
|
| Distributable earnings | 32,675,295 |
|
| Total |
| $421,880,937 |
|
| | |
| NET ASSET VALUE PER SHARE | |
| Class A (based on net assets of $52,887,721 and 2,262,117 shares outstanding) |
| $23.38 |
|
| Class I (based on net assets of $368,993,216 and 15,679,314 shares outstanding) |
| $23.53 |
|
| | |
| OFFERING PRICE PER SHARE* | |
| Class A (100/95.25 of net asset value per share) |
| $24.55 |
|
| * On sales of $50,000 or more, the offering price of Class A shares is reduced. | |
| See notes to financial statements. |
www.calvert.com CALVERT US LARGE-CAP VALUE RESPONSIBLE INDEX FUND ANNUAL REPORT 23
CALVERT US LARGE-CAP VALUE RESPONSIBLE INDEX FUND
STATEMENT OF OPERATIONS
YEAR ENDED SEPTEMBER 30, 2019
|
| | | |
| INVESTMENT INCOME | |
| Dividend income (net of foreign taxes withheld of $789) |
| $8,256,406 |
|
| Interest income | 14,788 |
|
| Securities lending income, net | 23,829 |
|
| Total investment income | 8,295,023 |
|
| | |
| EXPENSES | |
| Investment advisory fee | 433,066 |
|
| Administrative fee | 404,206 |
|
| Distribution and service fees: | |
| Class A | 116,103 |
|
| Directors’ fees and expenses | 20,427 |
|
| Custodian fees | 48,800 |
|
| Transfer agency fees and expenses | 283,720 |
|
| Accounting fees | 77,591 |
|
| Professional fees | 46,631 |
|
| Registration fees | 81,558 |
|
| Reports to shareholders | 28,945 |
|
| Miscellaneous | 27,980 |
|
| Total expenses | 1,569,027 |
|
| Waiver and/or reimbursement of expenses by affiliate | (639,857) |
|
| Reimbursement of expenses-other | (8,240) |
|
| Net expenses | 920,930 |
|
| Net investment income | 7,374,093 |
|
| | |
| | |
| REALIZED AND UNREALIZED GAIN (LOSS) | |
| Net realized gain on investment securities | 328,259 |
|
| | |
| Net change in unrealized appreciation (depreciation) on investment securities | 7,984,314 |
|
| | |
| Net realized and unrealized gain | 8,312,573 |
|
| | |
| Net increase in net assets resulting from operations |
| $15,686,666 |
|
| See notes to financial statements. |
24 www.calvert.com CALVERT US LARGE-CAP VALUE RESPONSIBLE INDEX FUND ANNUAL REPORT
CALVERT US LARGE-CAP VALUE RESPONSIBLE INDEX FUND
STATEMENTS OF CHANGES IN NET ASSETS
|
| | | | | | | |
| INCREASE (DECREASE) IN NET ASSETS | Year Ended September 30, 2019 | | Year Ended September 30, 2018 |
| Operations: | | | |
| Net investment income |
| $7,374,093 |
| |
| $4,443,840 |
|
| Net realized gain | 328,259 |
| | 6,827,373 |
|
| Net change in unrealized appreciation (depreciation) | 7,984,314 |
| | 6,683,161 |
|
| Net increase in net assets resulting from operations | 15,686,666 |
| | 17,954,374 |
|
| | | | |
| Distributions to shareholders: | | | |
| Class A shares | (1,701,251) |
| | (2,198,042) |
|
| Class I shares | (10,772,221) |
| | (7,031,652) |
|
| Total distributions to shareholders | (12,473,472) |
| | (9,229,694) |
|
| | | | |
| Capital share transactions: | | | |
| Class A shares | 8,682,178 |
| | 9,716,909 |
|
Class C shares (1) | — |
| | (1,096,243) |
|
| Class I shares | 111,130,215 |
| | 162,752,116 |
|
Class Y shares (1) | — |
| | (15,194,355) |
|
| Net increase in net assets from capital share transactions | 119,812,393 |
| | 156,178,427 |
|
| | | | |
| TOTAL INCREASE IN NET ASSETS | 123,025,587 |
| | 164,903,107 |
|
| | | | |
| | | | |
| NET ASSETS | | | |
| Beginning of year | 298,855,350 |
| | 133,952,243 |
|
| End of year |
| $421,880,937 |
| |
| $298,855,350 |
|
| | | | |
| | | | |
(1) Effective December 8, 2017, Class C shares of the Fund converted to Class A shares and Class Y shares converted to Class I shares at net asset value. Thereafter, Class C shares and Class Y shares were terminated. |
| See notes to financial statements. |
www.calvert.com CALVERT US LARGE-CAP VALUE RESPONSIBLE INDEX FUND ANNUAL REPORT 25
CALVERT US LARGE-CAP VALUE RESPONSIBLE INDEX FUND
FINANCIAL HIGHLIGHTS
|
| | | | | | | | | | | | | | | |
| | Year Ended September 30, | | Period Ended September 30, | |
| CLASS A SHARES | 2019 | | 2018 | | 2017 | | 2016 | | 2015 (1) | |
| Net asset value, beginning | $23.60 | | $23.02 | | $20.10 | | $17.85 | | $20.00 | |
| Income from investment operations: | | | | | | | | | | |
Net investment income (2) | 0.43 |
| | 0.41 |
| | 0.46 |
| | 0.38 |
| | 0.09 |
| |
| Net realized and unrealized gain (loss) | 0.25 |
| | 1.68 |
| | 2.87 |
| | 1.98 |
| | (2.24) |
| |
| Total from investment operations | 0.68 |
| | 2.09 |
| | 3.33 |
| | 2.36 |
| | (2.15) |
| |
| Distributions from: | | | | | | | | | | |
| Net investment income | (0.34) |
| | (0.35) |
| | (0.35) |
| | (0.11) |
| | — |
| |
| Net realized gain | (0.56) |
| | (1.16) |
| | (0.06) |
| | — |
| (3) | — |
| |
| Total distributions | (0.90) |
| | (1.51) |
| | (0.41) |
| | (0.11) |
| | — |
| |
| Total increase (decrease) in net asset value | (0.22) |
| | 0.58 |
| | 2.92 |
| | 2.25 |
| | (2.15) |
| |
| Net asset value, ending | $23.38 | | $23.60 | | $23.02 | | $20.10 | | $17.85 | |
Total return (4) | 3.18 | % | | 9.30 | % | | 16.72 | % | | 13.24 | % | | (10.75%) |
| (5) |
Ratios to average net assets: (6) | | | | | | | | | | |
| Total expenses | 0.68 | % | | 0.71 | % | | 0.84 | % | | 0.85 | % | | 7.30 | % | (7) |
| Net expenses | 0.51 | % | | 0.57 | % | | 0.57 | % | | 0.57 | % | | 0.57 | % | (7) |
| Net investment income | 1.95 | % | | 1.80 | % | | 2.09 | % | | 2.04 | % | | 1.79 | % | (7) |
| Portfolio turnover | 39 | % | | 67 | % | | 73 | % | | 53 | % | | 3 | % | (5) |
| Net assets, ending (in thousands) | $52,888 | | $44,047 | | $33,233 | | $22,309 | | $3,547 | |
| | | | | | | | | | | |
(1) From June 19, 2015 inception. |
(2) Computed using average shares outstanding. |
(3) Amount is less than $0.005. |
(4) Returns are historical and are calculated by determining the percentage change in net asset value with all distributions reinvested and do not reflect the effect of sales charges, if any. |
(5) Not annualized. |
(6) Total expenses do not reflect amounts reimbursed and/or waived by the adviser and certain of its affiliates, if applicable. Net expenses are net of all reductions and represent the net expenses paid by the Fund. |
(7) Annualized. |
| See notes to financial statements. |
26 www.calvert.com CALVERT US LARGE-CAP VALUE RESPONSIBLE INDEX FUND ANNUAL REPORT
CALVERT US LARGE-CAP VALUE RESPONSIBLE INDEX FUND
FINANCIAL HIGHLIGHTS
|
| | | | | | | | | | | | | | | |
| | Year Ended September 30, | | Period Ended September 30, | |
| CLASS I SHARES | 2019 | | 2018 | | 2017 | | 2016 | | 2015 (1) | |
| Net asset value, beginning | $23.74 | | $23.12 | | $20.18 | | $17.87 | | $20.00 | |
| Income from investment operations: | | | | | | | | | | |
Net investment income (2) | 0.50 |
| | 0.50 |
| | 0.53 |
| | 0.45 |
| | 0.11 |
| |
| Net realized and unrealized gain (loss) | 0.25 |
| | 1.67 |
| | 2.89 |
| | 1.97 |
| | (2.24) |
| |
| Total from investment operations | 0.75 |
| | 2.17 |
| | 3.42 |
| | 2.42 |
| | (2.13) |
| |
| Distributions from: | | | | | | | | | | |
| Net investment income | (0.40) |
| | (0.39) |
| | (0.42) |
| | (0.11) |
| | — |
| |
| Net realized gain | (0.56) |
| | (1.16) |
| | (0.06) |
| | — |
| (3) | — |
| |
| Total distributions | (0.96) |
| | (1.55) |
| | (0.48) |
| | (0.11) |
| | — |
| |
| Total increase (decrease) in net asset value | (0.21) |
| | 0.62 |
| | 2.94 |
| | 2.31 |
| | (2.13) |
| |
| Net asset value, ending | $23.53 | | $23.74 | | $23.12 | | $20.18 | | $17.87 | |
Total return (4) | 3.46 | % | | 9.67 | % | | 17.15 | % | | 13.60 | % | | (10.65%) |
| (5) |
Ratios to average net assets: (6) | | | | | | | | | | |
| Total expenses | 0.43 | % | | 0.47 | % | | 0.46 | % | | 0.47 | % | | 6.88 | % | (7) |
| Net expenses | 0.23 | % | | 0.22 | % | | 0.22 | % | | 0.22 | % | | 0.22 | % | (7) |
| Net investment income | 2.22 | % | | 2.15 | % | | 2.43 | % | | 2.38 | % | | 2.09 | % | (7) |
| Portfolio turnover | 39 | % | | 67 | % | | 73 | % | | 53 | % | | 3 | % | (5) |
| Net assets, ending (in thousands) | $368,993 | | $254,809 | | $85,240 | | $67,315 | | $2,144 | |
| | | | | | | | | | | |
(1) From June 19, 2015 inception. |
(2) Computed using average shares outstanding. |
(3) Amount is less than $0.005. |
(4) Returns are historical and are calculated by determining the percentage change in net asset value with all distributions reinvested and do not reflect the effect of sales charges, if any. |
(5) Not annualized. |
(6) Total expenses do not reflect amounts reimbursed and/or waived by the adviser and certain of its affiliates, if applicable. Net expenses are net of all reductions and represent the net expenses paid by the Fund. |
(7) Annualized. |
| See notes to financial statements. |
www.calvert.com CALVERT US LARGE-CAP VALUE RESPONSIBLE INDEX FUND ANNUAL REPORT 27
NOTES TO FINANCIAL STATEMENTS
NOTE 1 — SIGNIFICANT ACCOUNTING POLICIES
Calvert US Large-Cap Value Responsible Index Fund (the Fund) is a diversified series of Calvert Responsible Index Series, Inc. (the Corporation). The Corporation is a Maryland corporation registered under the Investment Company Act of 1940, as amended (the 1940 Act), as an open-end management investment company. The investment objective of the Fund is to seek to track the performance of the Calvert US Large-Cap Value Responsible Index, which measures the investment return of large-capitalization stocks.
The Fund offers two classes of shares. Class A shares are generally sold subject to a sales charge imposed at time of purchase. A contingent deferred sales charge of 0.25% may apply to certain redemptions of Class A shares for accounts for which no sales charge was paid, if redeemed within 12 months of purchase. Class I shares are sold at net asset value, are not subject to a sales charge and are sold only to certain eligible investors. Each class represents a pro rata interest in the Fund, but votes separately on class-specific matters and is subject to different expenses.
The Fund applies the accounting and reporting guidance in the Financial Accounting Standards Board (FASB) Accounting Standards Codification Topic 946, Financial Services – Investment Companies (ASC 946). Subsequent events, if any, through the date that the financial statements were issued have been evaluated in the preparation of the financial statements.
A. Investment Valuation: Net asset value per share is determined every business day as of the close of the regular session of the New York Stock Exchange (generally 4:00 p.m. Eastern time). The Fund uses independent pricing services approved by the Board of Directors (the Board) to value its investments wherever possible. Investments for which market quotations are not available or deemed not reliable are fair valued in good faith under the direction of the Board.
U.S. generally accepted accounting principles (U.S. GAAP) establishes a disclosure hierarchy that categorizes the inputs to valuation techniques used to value assets and liabilities at measurement date. These inputs are summarized in the three broad levels listed below:
Level 1 - quoted prices in active markets for identical securities
Level 2 - other significant observable inputs (including quoted prices for similar securities, interest rates, prepayment speeds, credit risk, etc.)
Level 3 - significant unobservable inputs (including the Fund’s own assumptions in determining the fair value of investments)
The inputs or methodologies used for valuing securities are not necessarily an indication of the risk associated with investing in those securities.
Valuation techniques used to value the Fund’s investments by major category are as follows:
Equity Securities. Equity securities (including warrants and rights) listed on a U.S. securities exchange generally are valued at the last sale or closing price as reported by an independent pricing service on the primary market or exchange on which they are traded and are categorized as Level 1 in the hierarchy. Equity securities listed on the NASDAQ Global or Global Select Market are valued at the NASDAQ official closing price and are categorized as Level 1 in the hierarchy. Unlisted or listed securities for which closing sales prices or closing quotations are not available are valued at the mean between the latest available bid and ask prices and are categorized as Level 2 in the hierarchy.
Other Securities. Investments in registered investment companies (including money market funds) that do not trade on an exchange are valued at the net asset value per share on the valuation day and are categorized as Level 1 in the hierarchy.
Fair Valuation. If a market value cannot be determined for a security using the methodologies described above, or if, in the good faith opinion of the Fund’s adviser, the market value does not constitute a readily available market quotation, or if a significant event has occurred that would materially affect the value of the security, the security will be fair valued as determined in good faith by or at the direction of the Board in a manner that most fairly reflects the security’s “fair value”, which is the amount that the Fund might reasonably expect to receive for the security upon its current sale in the ordinary course. Each such determination is based on a consideration of relevant factors, which are likely to vary from one pricing context to another. These factors may include, but are not limited to, the type of security, the existence of any contractual restrictions on the security’s disposition, the price and extent of public trading in similar securities of the issuer or of comparable companies or entities, quotations or relevant information obtained from broker/dealers or other market participants, information obtained from the issuer, analysts, and/or the appropriate stock exchange (for exchange-traded securities), an analysis of the company’s or entity’s financial statements, and an evaluation of the forces that influence the issuer and the market(s) in which the security is purchased and sold.
28 www.calvert.com CALVERT US LARGE-CAP VALUE RESPONSIBLE INDEX FUND ANNUAL REPORT
The values assigned to fair value investments are based on available information and do not necessarily represent amounts that might ultimately be realized. Further, due to the inherent uncertainty of valuations of such investments, the fair values may differ significantly from the values that would have been used had an active market existed, and the differences could be material.
The following table summarizes the market value of the Fund’s holdings as of September 30, 2019, based on the inputs used to value them:
|
| | | | | | | | | | | | | |
| Assets | Level 1 | | Level 2 | Level 3 | Total |
| Common Stocks | $ | 419,798,705 |
| (1) | $ | — |
| $ | — |
| $ | 419,798,705 |
|
| Short Term Investment of Cash Collateral for Securities Loaned | 1,149,842 |
| | — |
| — |
| 1,149,842 |
|
| Total Investments | $ | 420,948,547 |
| | $ | — |
| $ | — |
| $ | 420,948,547 |
|
| | | | | | |
(1) The level classification by major category of investments is the same as the category presentation in the Schedule of Investments. |
B. Investment Transactions and Income: Investment transactions for financial statement purposes are accounted for on trade date. Realized gains and losses are recorded on an identified cost basis and may include proceeds from litigation. Dividend income is recorded on the ex-dividend date for dividends received in cash and/or securities or, in the case of dividends on certain foreign securities, as soon as the Fund is informed of the ex-dividend date. Non-cash dividends are recorded at the fair value of the securities received. Withholding taxes on foreign dividends, if any, have been provided for in accordance with the Fund’s understanding of the applicable country’s tax rules and rates. Distributions received that represent a return of capital are recorded as a reduction of cost of investments. Distributions received that represent a capital gain are recorded as a realized gain. Interest income is accrued as earned.
C. Share Class Accounting: Realized and unrealized gains and losses and net investment income and losses, other than class-specific expenses, are allocated daily to each class of shares based upon the relative net assets of each class to the total net assets of the Fund. Expenses arising in connection with a specific class are charged directly to that class.
D. Distributions to Shareholders: Distributions to shareholders are recorded by the Fund on ex-dividend date. Dividends from net investment income and distributions from net realized capital gains, if any, are paid at least annually. Distributions are determined in accordance with income tax regulations which may differ from U.S. GAAP; accordingly, periodic reclassifications are made within the Fund’s capital accounts to reflect income and gains available for distribution under income tax regulations.
E. Estimates: The preparation of financial statements in conformity with U.S. GAAP requires management to make estimates and assumptions that affect the reported amounts of assets and liabilities and disclosure of contingent assets and liabilities at the date of the financial statements and the reported amounts of increases and decreases in net assets from operations during the reporting period. Actual results could differ from those estimates.
F. Indemnifications: The Corporation’s By-Laws provide for indemnification for Directors or officers of the Corporation and certain other parties, to the fullest extent permitted by Maryland law and the 1940 Act, provided certain conditions are met. Additionally, in the normal course of business, the Fund enters into agreements with service providers that may contain indemnification clauses. The Fund’s maximum exposure under these arrangements is unknown as this would involve future claims that may be made against the Fund that have not yet occurred.
G. Federal Income Taxes: No provision for federal income or excise tax is required since the Fund intends to continue to qualify as a regulated investment company under the Internal Revenue Code and to distribute substantially all of its taxable earnings.
Management has analyzed the Fund’s tax positions taken for all open federal income tax years and has concluded that no provision for federal income tax is required in the Fund’s financial statements. A Fund’s federal tax return is subject to examination by the Internal Revenue Service for a period of three years from the date of filing.
NOTE 2 — RELATED PARTY TRANSACTIONS
The investment advisory fee is earned by Calvert Research and Management (CRM), a subsidiary of Eaton Vance Management (EVM), as compensation for investment advisory services rendered to the Fund. Pursuant to the investment advisory agreement, CRM receives a fee, payable monthly, at the annual rate of 0.12% (0.15% prior to February 1, 2019) of the Fund’s average daily net assets. For the year ended September 30, 2019, the investment advisory fee amounted to $433,066.
CRM has agreed to reimburse the Fund’s operating expenses to the extent that total annual operating expenses (relating to ordinary operating expenses only and excluding expenses such as brokerage commissions, acquired fund fees and expenses of unaffiliated funds, interest expense, taxes or litigation expenses) exceed 0.49% and 0.24% (0.57% and 0.22% prior to February 1, 2019) for Class A and Class I, respectively, of such class’ average daily net assets. The expense reimbursement agreement with
www.calvert.com CALVERT US LARGE-CAP VALUE RESPONSIBLE INDEX FUND ANNUAL REPORT 29
CRM may be changed or terminated after January 31, 2020. For the year ended September 30, 2019, CRM waived or reimbursed expenses of $639,857.
The administrative fee is earned by CRM as compensation for administrative services rendered to the Fund. The fee is computed at an annual rate of 0.12% of the Fund’s average daily net assets attributable to Class A and Class I and is payable monthly. For the year ended September 30, 2019, CRM was paid administrative fees of $404,206.
The Fund has in effect a distribution plan for Class A shares (Class A Plan) pursuant to Rule 12b-1 under the 1940 Act. Pursuant to the Class A Plan, the Fund pays Eaton Vance Distributors, Inc. (EVD), an affiliate of CRM and the Fund’s principal underwriter, a distribution and service fee of 0.25% per annum of its average daily net assets attributable to Class A shares for distribution services and facilities provided to the Fund by EVD, as well as for personal services and/or the maintenance of shareholder accounts. Distribution and service fees paid or accrued for the year ended September 30, 2019 amounted to $116,103 for Class A shares.
The Fund was informed that EVD received $20,275 as its portion of the sales charge on sales of Class A shares and less than $100 of contingent deferred sales charges paid by Fund shareholders for the year ended September 30, 2019.
EVM provides sub-transfer agency and related services to the Fund pursuant to a Sub-Transfer Agency Support Services Agreement. For the year ended September 30, 2019, sub-transfer agency fees and expenses incurred to EVM amounted to $11,022 and are included in transfer agency fees and expenses on the Statement of Operations.
During the year ended September 30, 2019, CRM reimbursed the Fund $4,165 for a net realized loss due to a trading error. The impact of the reimbursement was less than $0.01 per share for each class and had no significant impact on total return.
Each Director of the Fund who is not an employee of CRM or its affiliates receives a fee of $3,000 for each Board meeting attended in person and $2,000 for each Board meeting attended by phone plus an annual fee of $117,000, and $1,500 for each Committee meeting attended in person and $1,000 for each Committee meeting attended by phone plus an annual Committee fee of $2,500. The Board chair receives an additional $15,000 annual retainer and Committee chairs receive an additional $6,000 annual retainer. Eligible Directors may participate in a Deferred Compensation Plan (the Plan). Amounts deferred under the Plan are treated as though equal dollar amounts had been invested in shares of the Fund or other Calvert funds selected by the Directors. The Fund purchases shares of the funds selected equal to the dollar amounts deferred under the Plan, resulting in an asset equal to the deferred compensation liability. Obligations of the Plan are paid solely from the Fund’s assets. Directors’ fees are allocated to each of the Calvert funds served. Salaries and fees of officers and Directors of the Fund who are employees of CRM or its affiliates are paid by CRM. In addition, an advisory council was established to aid the Board and CRM in advancing the cause of responsible investing through original scholarship and thought leadership. The advisory council consists of CRM’s Chief Executive Officer and four additional members. Each member (other than CRM’s Chief Executive Officer) receives annual compensation of $75,000, which is being reimbursed by Calvert Investment Management, Inc. (CIM), the Calvert funds’ former investment adviser and Ameritas Holding Company, CIM’s parent company, through the end of 2019. For the year ended September 30, 2019, the Fund’s allocated portion of such expense and reimbursement was $8,240, which are included in miscellaneous expense and reimbursement of expenses-other, respectively, on the Statement of Operations.
NOTE 3 — INVESTMENT ACTIVITY
During the year ended September 30, 2019, the cost of purchases and proceeds from sales of investments, other than short-term securities, were $245,416,718 and $130,823,378, respectively.
NOTE 4 — DISTRIBUTIONS TO SHAREHOLDERS AND INCOME TAX INFORMATION
The tax character of distributions declared for the years ended September 30, 2019 and September 30, 2018 was as follows:
|
| | | | | | |
| | Year Ended
September 30, |
| | 2019 | 2018 |
| Ordinary income |
| $7,689,642 |
|
| $5,436,863 |
|
| Long-term capital gains |
| $4,783,830 |
|
| $3,792,831 |
|
During the year ended September 30, 2019, distributable earnings was decreased by $484,897 and paid-in capital was increased by $484,897 due to the Fund’s use of equalization accounting. Tax equalization accounting allows the Fund to treat as a distribution that portion of redemption proceeds representing a redeeming shareholder’s portion of undistributed taxable income and net capital gains. These reclassifications had no effect on the net assets or net asset value per share of the Fund.
30 www.calvert.com CALVERT US LARGE-CAP VALUE RESPONSIBLE INDEX FUND ANNUAL REPORT
As of September 30, 2019, the components of distributable earnings (accumulated loss) on a tax basis were as follows:
|
| | | |
| Undistributed ordinary income |
| $5,213,983 |
|
| Undistributed long-term capital gains |
| $2,945,758 |
|
| Net unrealized appreciation (depreciation) |
| $24,515,554 |
|
The cost and unrealized appreciation (depreciation) of investments of the Fund at September 30, 2019, as determined on a federal income tax basis, were as follows:
|
| | | |
| Aggregate cost |
| $396,432,993 |
|
| Gross unrealized appreciation |
| $39,331,825 |
|
| Gross unrealized depreciation | (14,816,271) |
|
| Net unrealized appreciation (depreciation) |
| $24,515,554 |
|
NOTE 5 — SECURITIES LENDING
To generate additional income, the Fund may lend its securities pursuant to a securities lending agency agreement with State Street Bank and Trust Company (SSBT), the securities lending agent. Security loans are subject to termination by the Fund at any time and, therefore, are not considered illiquid investments. The Fund requires that the loan be continuously collateralized by either cash or securities as collateral equal at all times to at least 102% of the market value of the domestic securities loaned and 105% of the market value of the international securities loaned (if applicable). The market value of securities loaned is determined daily and any additional required collateral is delivered to the Fund on the next business day. Cash collateral is generally invested in a money market fund registered under the 1940 Act that is managed by an affiliate of SSBT. Any gain or loss in the market price of the loaned securities that might occur and any interest earned or dividends declared during the term of the loan would accrue to the account of the Fund. Income earned on the investment of collateral, net of broker rebates and other expenses incurred by the securities lending agent, is split between the Fund and the securities lending agent on the basis of agreed upon contractual terms. Non-cash collateral, if any, is held by the lending agent on behalf of the Fund and cannot be sold or re-pledged by the Fund; accordingly, such collateral is not reflected in the Statement of Assets and Liabilities.
The risks associated with lending portfolio securities include, but are not limited to, possible delays in receiving additional collateral or in the recovery of the loaned securities, possible loss of rights to the collateral should the borrower fail financially, as well as risk of loss in the value of the collateral or the value of the investments made with the collateral. The securities lending agent shall indemnify the Fund in the case of default of any securities borrower.
At September 30, 2019, the total value of securities on loan was $11,403,846 and the total value of collateral received was $11,638,102, comprised of cash of $1,149,842 and U.S. government and/or agencies securities of $10,488,260.
The following table provides a breakdown of securities lending transactions accounted for as secured borrowings, the obligations by class of collateral pledged, and the remaining contractual maturity of those transactions as of September 30, 2019.
|
| | | | | | | | | | | | | | | |
| | Remaining Contractual Maturity of the Transactions |
| | Overnight and
Continuous | <30 days | 30 to 90 days | >90 days | Total |
| Securities Lending Transactions |
| Common Stocks |
| $11,638,102 |
|
| $— |
|
| $— |
|
| $— |
|
| $11,638,102 |
|
The carrying amount of the liability for deposits for securities loaned at September 30, 2019 approximated its fair value. If measured at fair value, such liability would have been considered as Level 2 in the fair value hierarchy (see Note 1A) at September 30, 2019.
NOTE 6 — LINE OF CREDIT
The Fund participates with other funds managed by CRM in a $100 million ($62.5 million prior to June 21, 2019) committed unsecured line of credit agreement with SSBT, which is in effect through June 19, 2020. Borrowings may be made for temporary or emergency purposes only. Borrowings bear interest at the higher of the One-Month London Interbank Offered Rate (LIBOR) in effect that day or the overnight Federal Funds Rate, plus 1.00% per annum. A commitment fee of 0.20% per annum is incurred on the unused portion of the committed facility. An administrative fee of $37,500 was incurred in connection with the increase of the facility in June 2019. These fees are allocated to all participating funds. Because the line of credit is not available exclusively to the Fund, it may be unable to borrow some or all of its requested amounts at any particular time. The Fund had no borrowings
www.calvert.com CALVERT US LARGE-CAP VALUE RESPONSIBLE INDEX FUND ANNUAL REPORT 31
outstanding pursuant to this line of credit at September 30, 2019. The Fund did not have any significant borrowings or allocated fees during the year ended September 30, 2019.
Effective at the close of business on October 28, 2019, the Fund and other participating funds managed by CRM terminated the line of credit agreement. Effective October 29, 2019, the Fund participates with other funds managed by EVM and its affiliates, including CRM, in an $800 million unsecured line of credit agreement with a syndicate of banks, which is in effect through October 27, 2020, at terms that are more favorable than the terminated agreement.
NOTE 7 — CAPITAL SHARES
Transactions in capital shares for the years ended September 30, 2019 and September 30, 2018 were as follows:
|
| | | | | | | | | | | |
| | Year Ended
September 30, 2019 | | Year Ended
September 30, 2018 |
| | Shares | Amount | | Shares | Amount |
| Class A | | | | | |
| Shares sold | 796,134 |
|
| $17,569,473 |
| | 967,264 |
|
| $22,173,593 |
|
| Reinvestment of distributions | 66,830 |
| 1,457,552 |
| | 95,047 |
| 2,163,267 |
|
| Shares redeemed | (467,328 | ) | (10,344,847 | ) | | (687,552 | ) | (15,778,719 | ) |
| Converted from Class C | — |
| — |
| | 47,995 |
| 1,158,768 |
|
| Net increase | 395,636 |
|
| $8,682,178 |
| | 422,754 |
|
| $9,716,909 |
|
| | | | | | |
Class C (1) | | | | | |
| Shares sold | — |
|
| $— |
| | 4,467 |
|
| $103,068 |
|
| Shares redeemed | — |
| — |
| | (1,744 | ) | (40,543 | ) |
| Converted to Class A | — |
| — |
| | (48,587 | ) | (1,158,768 | ) |
| Net decrease | — |
|
| $— |
| | (45,864 | ) |
| ($1,096,243 | ) |
| | | | | | |
| Class I | | | | | |
| Shares sold | 6,880,840 |
|
| $152,786,529 |
| | 7,564,893 |
|
| $174,693,789 |
|
| Reinvestment of distributions | 342,232 |
| 7,498,299 |
| | 288,601 |
| 6,588,758 |
|
| Shares redeemed | (2,276,786 | ) | (49,154,613 | ) | | (1,488,172 | ) | (35,030,476 | ) |
| Converted from Class Y | — |
| — |
| | 680,109 |
| 16,500,045 |
|
| Net increase | 4,946,286 |
|
| $111,130,215 |
| | 7,045,431 |
|
| $162,752,116 |
|
| | | | | | |
Class Y (1) | | | | | |
| Shares sold | — |
|
| $— |
| | 87,106 |
|
| $2,042,977 |
|
| Shares redeemed | — |
| — |
| | (31,241 | ) | (737,287 | ) |
| Converted to Class I | — |
| — |
| | (681,029 | ) | (16,500,045 | ) |
| Net decrease | — |
|
| $— |
| | (625,164 | ) |
| ($15,194,355 | ) |
| | | | | | |
(1) Effective December 8, 2017, Class C shares of the Fund converted to Class A shares and Class Y shares converted to Class I shares at net asset value. Thereafter, Class C shares and Class Y shares were terminated. |
32 www.calvert.com CALVERT US LARGE-CAP VALUE RESPONSIBLE INDEX FUND ANNUAL REPORT
REPORT OF INDEPENDENT REGISTERED PUBLIC ACCOUNTING FIRM
To the Shareholders and Board of Directors
Calvert Responsible Index Series, Inc.:
Opinion on the Financial Statements
We have audited the accompanying statement of assets and liabilities of Calvert US Large-Cap Value Responsible Index Fund (the Fund), a series of Calvert Responsible Index Series, Inc., including the schedule of investments, as of September 30, 2019, the related statement of operations for the year then ended, the statements of changes in net assets for each of the years in the two‑year period then ended, and the related notes (collectively, the financial statements) and the financial highlights for each of the years or periods in the five‑year period then ended. In our opinion, the financial statements and financial highlights present fairly, in all material respects, the financial position of the Fund as of September 30, 2019, the results of its operations for the year then ended, the changes in its net assets for each of the years in the two‑year period then ended, and the financial highlights for each of the years or periods in the five‑year period then ended, in conformity with U.S. generally accepted accounting principles.
Basis for Opinion
These financial statements and financial highlights are the responsibility of the Fund’s management. Our responsibility is to express an opinion on these financial statements and financial highlights based on our audits. We are a public accounting firm registered with the Public Company Accounting Oversight Board (United States) (PCAOB) and are required to be independent with respect to the Fund in accordance with the U.S. federal securities laws and the applicable rules and regulations of the Securities and Exchange Commission and the PCAOB.
We conducted our audits in accordance with the standards of the PCAOB. Those standards require that we plan and perform the audit to obtain reasonable assurance about whether the financial statements and financial highlights are free of material misstatement, whether due to error or fraud. Our audits included performing procedures to assess the risks of material misstatement of the financial statements and financial highlights, whether due to error or fraud, and performing procedures that respond to those risks. Such procedures included examining, on a test basis, evidence regarding the amounts and disclosures in the financial statements and financial highlights. Such procedures also included confirmation of securities owned as of September 30, 2019, by correspondence with the custodian and brokers. Our audits also included evaluating the accounting principles used and significant estimates made by management, as well as evaluating the overall presentation of the financial statements and financial highlights. We believe that our audits provide a reasonable basis for our opinion.
We have served as the auditor of one or more of the Calvert Funds since 2002.
Philadelphia, Pennsylvania
November 20, 2019
www.calvert.com CALVERT US LARGE-CAP VALUE RESPONSIBLE INDEX FUND ANNUAL REPORT 33
FEDERAL TAX INFORMATION
The Form 1099-DIV you receive in February 2020 will show the tax status of all distributions paid to your account in calendar year 2019. Shareholders are advised to consult their own tax adviser with respect to the tax consequences of their investment in the Fund. As required by the Internal Revenue Code and/or regulations, shareholders must be notified regarding the status of qualified dividend income for individuals, the dividends received deduction for corporations and capital gains dividends.
Qualified Dividend Income. For the fiscal year ended September 30, 2019, the Fund designates approximately $5,989,591, or up to the maximum amount of such dividends allowable pursuant to the Internal Revenue Code, as qualified dividend income eligible for the reduced tax rate of 15%.
Dividends Received Deduction. Corporate shareholders are generally entitled to take the dividends received deduction on the portion of the Fund’s dividend distribution that qualifies under tax law. For the Fund’s fiscal 2019 ordinary income dividends, 73.00% qualifies for the corporate dividends received deduction.
Capital Gains Dividends. The Fund hereby designates as a capital gain dividend with respect to the taxable year ended September 30, 2019, $3,369,367 or, if subsequently determined to be different, the net capital gain of such year.
34 www.calvert.com CALVERT US LARGE-CAP VALUE RESPONSIBLE INDEX FUND ANNUAL REPORT (Unaudited)
MANAGEMENT AND ORGANIZATION
Fund Management. The Directors of Calvert Responsible Index Series, Inc. (the Corporation) are responsible for the overall management and supervision of the Corporation’s affairs. The Directors and officers of the Corporation are listed below. Except as indicated, each individual has held the office shown or other offices in the same company for the last five years. Directors and officers of the Corporation hold indefinite terms of office. The “Independent Directors” consist of those Directors who are not “interested persons” of the Corporation, as that term is defined under the 1940 Act. The business address of each Director and officer, with the exception of Ms. Gemma and Mr. Kirchner, is 1825 Connecticut Avenue NW, Suite 400, Washington, DC 20009. As used below, “CRM” refers to Calvert Research and Management. Each Director oversees 39 funds in the Calvert fund complex. Each officer serves as an officer of certain other Calvert funds.
|
| | | |
| Name and Year of Birth |
Corporation Position(s) | Position
Start Date | Principal Occupation(s) and Other Directorships
During Past Five Years and Other Relevant Experience |
| | | | |
| Interested Director | | | |
John H. Streur(1)
1960 | Director & President | 2015 | President and Chief Executive Officer of Calvert Research and Management (since December 31, 2016). President and Chief Executive Officer of Calvert Investments, Inc. (January 2015 - December 2016); Chief Executive Officer of Calvert Investment Distributors, Inc. (August 2015 - December 2016); Chief Compliance Officer of Calvert Investment Management, Inc. (August 2015 - April 2016); President and Director, Portfolio 21 Investments, Inc. (through October 2014); President, Chief Executive Officer and Director, Managers Investment Group LLC (through January 2012); President and Director, The Managers Funds and Managers AMG Funds (through January 2012). Other Directorships in the Last Five Years. Portfolio 21 Investments, Inc. (asset management) (through October 2014); Managers Investment Group LLC (asset management) (through January 2012); The Managers Funds (asset management) (through January 2012); Managers AMG Funds (asset management) (through January 2012); Calvert Impact Capital, Inc. |
| Independent Directors | | | |
Richard L. Baird, Jr.
1948 | Director | 2000 | Regional Disaster Recovery Lead, American Red Cross of Greater Pennsylvania (since 2017). Volunteer, American Red Cross (since 2015). Former President and CEO of Adagio Health Inc. (retired in 2014) in Pittsburgh, PA. Other Directorships in the Last Five Years. None. |
Alice Gresham Bullock
1950 | Chair & Director | 2016 | Professor Emerita at Howard University School of Law. Dean Emerita of Howard University School of Law and Deputy Director of the Association of American Law Schools (1992-1994). Other Directorships in the Last Five Years. None. |
Cari M. Dominguez
1949 | Director | 2016 | Former Chair of the U.S. Equal Employment Opportunity Commission. Other Directorships in the Last Five Years. Manpower, Inc. (employment agency); Triple S Management Corporation (managed care); National Association of Corporate Directors. |
John G. Guffey, Jr.(2)
1948 | Director | 2000 | President of Aurora Press Inc., a privately held publisher of trade paperbacks (since January 1997). Other Directorships in the Last Five Years. Calvert Impact Capital, Inc. (through December 31, 2018); Calvert Ventures, LLC. |
Miles D. Harper, III
1962 | Director | 2005 | Partner, Carr Riggs & Ingram (public accounting firm) since October 2014. Partner, Gainer Donnelly & Desroches (public accounting firm) (now Carr Riggs & Ingram), November 1999 - September 2014). Other Directorships in the Last Five Years. Bridgeway Funds (9) (asset management). |
Joy V. Jones
1950 | Director | 2000 | Attorney. Other Directorships in the Last Five Years. Conduit Street Restaurants SUD 2 Limited; Palm Management Restaurant Corporation. |
Anthony A. Williams
1951 | Director | 2016 | CEO and Executive Director of the Federal City Council (July 2012 to present); Senior Adviser and Independent Consultant for McKenna Long & Aldridge LLP (September 2011 to present); Executive Director of Global Government Practice at the Corporate Executive Board (January 2010 to January 2012). Other Directorships in the Last Five Years. Freddie Mac; Evoq Properties/ Meruelo Maddux Properties, Inc. (real estate management); Weston Solutions, Inc. (environmental services); Bipartisan Policy Center’s Debt Reduction Task Force; Chesapeake Bay Foundation; Catholic University of America; Urban Institute (research organization). |
www.calvert.com CALVERT US LARGE-CAP VALUE RESPONSIBLE INDEX FUND ANNUAL REPORT (Unaudited) 35
|
| | | |
| Principal Officers who are not Directors | |
Name and
Year of Birth | Corporation Position(s) | Position Start Date | Principal Occupation(s)
During Past Five Years |
| | | | |
Hope L. Brown
1973 | Chief Compliance Officer | 2014 | Chief Compliance Officer of 39 registered investment companies advised by CRM (since 2014). Vice President and Chief Compliance Officer, Wilmington Funds (2012-2014). |
Maureen A. Gemma(3)
1960 | Secretary, Vice President and Chief Legal Officer | 2016 | Vice President of CRM and officer of 39 registered investment companies advised by CRM (since 2016). Also Vice President of Eaton Vance and certain of its affiliates and officer of 162 registered investment companies advised or administered by Eaton Vance. |
James F. Kirchner(3)
1967 | Treasurer | 2016 | Vice President of CRM and officer of 39 registered investment companies advised by CRM (since 2016). Also Vice President of Eaton Vance and certain of its affiliates and officer of 162 registered investment companies advised or administered by Eaton Vance. |
| | | | |
| |
(1) | Mr. Streur is an interested person of the Fund because of his positions with the Fund’s adviser and certain affiliates. |
| |
(2) | Mr. Guffey is currently married to Rebecca L. Adamson, who serves as a member of the Advisory Council. |
| |
(3) | The business address for Ms. Gemma and Mr. Kirchner is Two International Place, Boston, MA 02110. |
The SAI for the Fund includes additional information about the Directors and officers of the Fund and can be obtained without charge on Calvert’s website at www.calvert.com or by calling 1-800-368-2745.
36 www.calvert.com CALVERT US LARGE-CAP VALUE RESPONSIBLE INDEX FUND ANNUAL REPORT (Unaudited)
IMPORTANT NOTICES
Privacy. The Calvert Funds and Calvert Research and Management are committed to ensuring your financial privacy. Each of the financial institutions identified below has in effect the following policy (“Privacy Policy”) with respect to nonpublic personal information about its customers:
| |
| • | Only such information received from you, through application forms or otherwise, and information about your Calvert fund transactions will be collected. This may include information such as name, address, social security number, tax status, account balances and transactions. |
| |
| • | None of such information about you (or former customers) will be disclosed to anyone, except as permitted by law (which includes disclosure to employees necessary to service your account). In the normal course of servicing a customer’s account, Calvert Research and Management may share information with unaffiliated third parties that perform various required services such as transfer agents, custodians and broker-dealers. |
| |
| • | Policies and procedures (including physical, electronic and procedural safeguards) are in place that are designed to protect the confidentiality of such information. |
| |
| • | The Funds reserve the right to change this Privacy Policy at any time upon proper notification to you. Customers may want to review the Funds’ Privacy Policy periodically for changes by accessing the link on our homepage: www.calvert.com. |
Our pledge of privacy applies to the following entities: the Calvert Family of Funds, Calvert Research and Management and their affiliated service providers, Eaton Vance Management and Eaton Vance Distributors, Inc. In addition, our Privacy Policy applies only to those Calvert customers who are individuals and who have a direct relationship with us. If a customer’s account (i.e., fund shares) is held in the name of a third-party financial advisor/broker-dealer, it is likely that only such advisor’s privacy policies apply to the customer. This notice supersedes all previously issued privacy disclosures. For more information about Calvert’s Privacy Policy, please call 1-800-368-2745.
Delivery of Shareholder Documents. The Securities and Exchange Commission (SEC) permits funds to deliver only one copy of shareholder documents, including prospectuses, proxy statements and shareholder reports, to fund investors with multiple accounts at the same residential or post office box address. This practice is often called “householding” and it helps eliminate duplicate mailings to shareholders. Calvert funds, or your financial intermediary, may household the mailing of your documents indefinitely unless you instruct Calvert funds, or your financial intermediary, otherwise. If you would prefer that your Calvert fund documents not be householded, please contact Calvert funds at 1-800-368-2745, or contact your financial intermediary. Your instructions that householding not apply to delivery of your Calvert fund documents will typically be effective within 30 days of receipt by Calvert funds or your financial intermediary. Separate statements will be generated for each separate account and will be householded as described above.
Portfolio Holdings. Each Calvert fund files a schedule of portfolio holdings on Part F to Form N-PORT with the SEC for the first and third quarters of each fiscal year. The Form N-PORT will be available on the Calvert funds’ website at www.calvert.com, by calling Calvert funds at 1-800-368-2745 or in the EDGAR database on the SEC’s website at www.sec.gov.
Proxy Voting. The Proxy Voting Guidelines that each Calvert fund uses to determine how to vote proxies relating to portfolio securities is provided as an Appendix to the fund’s Statement of Additional Information. The Statement of Additional Information can be obtained free of charge by calling the Calvert funds at 1-800-368-2745, by visiting the Calvert funds’ website at www.calvert.com or visiting the SEC’s website at www.sec.gov. Information regarding how a Calvert fund voted proxies relating to portfolio securities during the most recent 12-month period ended June 30 is available by calling Calvert funds, by visiting the Calvert funds’ website at www.calvert.com or by visiting the SEC’s website at www.sec.gov.
37 www.calvert.com CALVERT US LARGE-CAP VALUE RESPONSIBLE INDEX FUND ANNUAL REPORT (Unaudited)
|
|
| This page intentionally left blank. |
This page intentionally left blank.
|
|
| This page intentionally left blank. |
|
| |
| CALVERT US LARGE-CAP VALUE RESPONSIBLE INDEX FUND |
Investment Adviser and Administrator Calvert Research and Management 1825 Connecticut Avenue NW, Suite 400 Washington, DC 20009 | Transfer Agent DST Asset Manager Solutions, Inc. 2000 Crown Colony Drive Quincy, MA 02169 |
Principal Underwriter* Eaton Vance Distributors, Inc. Two International Place Boston, MA 02110 (617) 482-8260 | Independent Registered Public Accounting Firm KPMG LLP 1601 Market Street Philadelphia, PA 19103-2499 |
Custodian State Street Bank and Trust Company State Street Financial Center, One Lincoln Street Boston, MA 02111 | Fund Offices 1825 Connecticut Avenue NW, Suite 400 Washington, DC 20009 |
| | |
* FINRA BrokerCheck. Investors may check the background of their Investment Professional by contacting the Financial Industry Regulatory Authority (FINRA). FINRA BrokerCheck is a free tool to help investors check the professional background of current and former FINRA-registered securities firms and brokers. FINRA BrokerCheck is available by calling 1-800-289-9999 and at www.FINRA.org. The FINRA BrokerCheck brochure describing this program is available to investors at www.FINRA.org.
|
| |
| | |
Printed on recycled paper. |
| 24191 9.30.19 | |
|
|
| Calvert US Mid-Cap Core Responsible Index Fund |
Important Note. Beginning on January 1, 2021, as permitted by regulations adopted by the Securities and Exchange Commission, paper copies of the Fund’s annual and semi-annual shareholder reports will no longer be sent by mail unless you specifically request paper copies of the reports. Instead, the reports will be made available on the Fund’s website (calvert.com/prospectus), and you will be notified by mail each time a report is posted and provided with a website address to access the report.
If you already elected to receive shareholder reports electronically, you will not be affected by this change and you need not take any action. If you are a direct investor, you may elect to receive shareholder reports and other communications from the Fund electronically by signing up for e-Delivery at calvert.com. If you own your shares through a financial intermediary (such as a broker-dealer or bank), you must contact your financial intermediary to sign up.
You may elect to receive all future Fund shareholder reports in paper free of charge. If you are a direct investor, you can inform the Fund that you wish to continue receiving paper copies of your shareholder reports by calling 1-800-368-2745. If you own these shares through a financial intermediary, you must contact your financial intermediary or follow instructions included with this disclosure, if applicable, to elect to continue to receive paper copies of your shareholder reports. Your election to receive reports in paper will apply to all Calvert funds held directly or to all funds held through your financial intermediary, as applicable.
|
| |
Annual Report September 30, 2019 E-Delivery Sign-Up — Details Inside
| |
|
|
Commodity Futures Trading Commission Registration. Effective December 31, 2012, the Commodity Futures Trading Commission (“CFTC”) adopted certain regulatory changes that subject registered investment companies and advisers to regulation by the CFTC if a fund invests more than a prescribed level of its assets in certain CFTC-regulated instruments (including futures, certain options and swap agreements) or markets itself as providing investment exposure to such instruments. The Fund and its adviser have claimed an exclusion from the definition of the term “commodity pool operator” under the Commodity Exchange Act. Accordingly, neither the Fund nor the adviser is subject to CFTC regulation.
Fund shares are not insured by the FDIC and are not deposits or other obligations of, or guaranteed by, any depository institution. Shares are subject to investment risks, including possible loss of principal invested.
This report must be preceded or accompanied by a current summary prospectus or prospectus. Before investing, investors should consider carefully the investment objective, risks, and charges and expenses of a mutual fund. This and other important information is contained in the summary prospectus and prospectus, which can be obtained from a financial intermediary. Prospective investors should read the prospectus carefully before investing. For further information, please call 1-800-368-2745.
|
Choose Planet-friendly E-delivery! Sign up now for on-line statements, prospectuses, and fund reports. In less than five minutes you can help reduce paper mail and lower fund costs. Just go to www.calvert.com. If you already have an online account with the Calvert funds, click on Login to access your Account and select the documents you would like to receive via e-mail. If you’re new to online account access, click on Login, then Register to create your user name and password. Once you’re in, click on the E-delivery sign-up on the Account Portfolio page and follow the quick, easy steps. Note: If your shares are not held directly with the Calvert funds but through a brokerage firm, you must contact your broker for electronic delivery options available through their firm. |
|
| | | | |
| | | TABLE OF CONTENTS |
| | | | | |
| | | | | Management’s Discussion of Fund Performance |
| | | | | Performance |
| | | | | Fund Profile |
| | | | | Endnotes and Additional Disclosures |
| | | | | Fund Expenses |
| | | | | Financial Statements |
| | | | | Report of Independent Registered Public Accounting Firm |
| | | | | Federal Tax Information |
| | | | | Management and Organization |
| | | | | Important Notices |
MANAGEMENT’S DISCUSSION OF FUND PERFORMANCE1 Economic and Market Conditions
In the midst of a yearlong trade war with China and slowing economic growth worldwide, U.S. stocks delivered mixed returns during the 12-month period ended September 30, 2019.
U.S. stocks opened the period on the downside as investors worried that President Trump’s imposition of broad import tariffs might provoke a wider trade dispute with China, the world’s second-largest economy behind the U.S.
With U.S. economic data largely positive throughout 2018, the U.S. Federal Reserve Board (the Fed) raised its benchmark federal funds rate four times ─ from a low range of 1.50%-1.75% to 2.25%-2.50% ─ with the last quarter-point increase on December 19, 2018.
U.S. stocks turned higher in early 2019 as trade fears eased and interest rates remained stable after the Fed signaled a slower pace for future rate hikes. However, around the same time, U.S. economic indicators began sending mixed signals. While the job market was robust during the period with the U.S. unemployment rate dipping below 4%, retail sales fell, raising concerns about consumer spending. Factory output also declined, dragged down by a large drop in auto production.
The U.S. equity market fluctuated through the spring of 2019. Heightened trade-conflict rhetoric drove stocks lower in May before easing tensions helped equities recover in June. Key economic indicators continued to be mixed, with job creation decelerating sharply in May.
After holding interest rates steady through the first half of 2019, the Fed cut its benchmark interest rate to 2.00%-2.25% on July 31 ─ its first reduction in over a decade ─ followed by a second interest-rate drop to 1.75%-2.00% on September 18. Lower rates are intended to help stimulate economic activity by making borrowing costs relatively more affordable.
After sliding in August, U.S. equities rebounded in early September before retreating in the final weeks of the period. During the 12-month period ended September 30, 2019, the blue-chip Dow Jones Industrial Average®2 gained 4.21%, while the broader U.S. equity market, as represented by the S&P 500® Index, rose 4.25%. The technology-laden Nasdaq Composite Index returned 0.52% during the period.
Large-cap U.S. stocks, as measured by the S&P 500® Index, generally outperformed their small-cap counterparts, as measured by the Russell 2000® Index, during the period.
As a group, value stocks outpaced growth stocks in both large- and small-cap categories, as measured by the Russell growth and value indexes.
Fund Performance
For the 12-month period ended September 30, 2019, Calvert US Mid-Cap Core Responsible Index Fund (the Fund) returned 1.05% for Class A shares at net asset value (NAV). The Fund underperformed its primary benchmark, the Russell Midcap® Index, which returned 3.19%; and underperformed its secondary benchmark, the Calvert US Mid-Cap Core Responsible Index (the Calvert Index), which returned 1.63% during the period.
The Fund’s underperformance versus its secondary benchmark was due to Fund expenses and fees, which the Calvert Index does not incur.
Six of the Fund’s 11 market sectors delivered positive returns during the period. The weakest-performing sectors were energy, heath care, and communication services. The strongest-performing sectors were utilities, consumer staples, and real estate.
|
|
See Endnotes and Additional Disclosures in this report. Past performance is no guarantee of future results. Returns are historical and are calculated by determining the percentage change in net asset value (NAV) or offering price (as applicable) with all distributions reinvested. Investment return and principal value will fluctuate so that shares, when redeemed, may be worth more or less than their original cost. Performance less than or equal to one year is cumulative. Performance is for the stated time period only; due to market volatility, the Fund’s current performance may be lower or higher than quoted. Returns are before taxes unless otherwise noted. For performance as of the most recent month-end, please refer to www.calvert.com. |
2 www.calvert.com CALVERT US MID-CAP CORE RESPONSIBLE INDEX FUND ANNUAL REPORT (Unaudited)
PERFORMANCE
|
| | | | | | | | | | | | | | |
Performance2,3 | | | | | | | | | |
Portfolio Managers Thomas C. Seto, Christopher Madden, CFA and Jade Huang, each of Calvert Research and Management |
| | | | | | | | | | |
| % Average Annual Total Returns | Class Inception Date |
| | Performance Inception Date |
| | One Year |
| | Five Years |
| | Since Inception |
|
| Class A at NAV | 10/30/2015 |
| | 10/30/2015 |
| | 1.05 | % | | — | % | | 9.83 | % |
| Class A with 4.75% Maximum Sales Charge | — |
| | — |
| | -3.76 |
| | — |
| | 8.48 |
|
| Class I at NAV | 10/30/2015 |
| | 10/30/2015 |
| | 1.30 |
| | — |
| | 10.19 |
|
| | | | | | | | | | |
| | | | | | | | | | |
Russell Midcap® Index | — |
| | — |
| | 3.19 | % | | 9.10 | % | | 10.12 | % |
| Calvert US Mid-Cap Core Responsible Index | — |
| | — |
| | 1.63 |
| | — |
| | 10.59 |
|
| | | | | | | | | | |
% Total Annual Operating Expense Ratios4 | | | | | | | Class A |
| | Class I |
|
| Gross | | | | | | | 0.94 | % | | 0.69 | % |
| Net | | | | | | | 0.49 |
| | 0.24 |
|
|
|
| Growth of $10,000 |
| This graph shows the change in value of a hypothetical investment of $10,000 in Class A of the Fund for the period indicated. For comparison, the same investment is shown in the indicated index. |
|
| | | | | | | | |
| Growth of Investment | Amount Invested |
| Period Beginning | At NAV |
| With Maximum Sales Charge |
| Class I |
| $100,000 |
| 10/30/2015 |
| $146,297 |
| N.A. |
See Endnotes and Additional Disclosures in this report.
Past performance is no guarantee of future results. Returns are historical and are calculated by determining the percentage change in net asset value (NAV) or offering price (as applicable) with all distributions reinvested. Investment return and principal value will fluctuate so that shares, when redeemed, may be worth more or less than their original cost. Performance less than or equal to one year is cumulative. Performance is for the stated time period only; due to market volatility, the Fund’s current performance may be lower or higher than quoted. Returns are before taxes unless otherwise noted. For performance as of the most recent month-end, please refer to www.calvert.com.
www.calvert.com CALVERT US MID-CAP CORE RESPONSIBLE INDEX FUND ANNUAL REPORT (Unaudited) 3
FUND PROFILE
|
| | | | | | | |
| |
| | | | | |
| | SECTOR ALLOCATION (% of total investments)5 | | | TEN LARGEST HOLDINGS (% of net assets)6 |
| | | | | | |
| | Information Technology | 21.5 | % | | Motorola Solutions, Inc. | 0.5 | % |
| | Financials | 17.0 | % | | Lam Research Corp. | 0.5 | % |
| | Industrials | 16.5 | % | | IQVIA Holdings, Inc. | 0.5 | % |
| | Health Care | 14.0 | % | | Eversource Energy | 0.5 | % |
| | Consumer Discretionary | 12.7 | % | | Verisk Analytics, Inc. | 0.5 | % |
| | Consumer Staples | 4.7 | % | | SunTrust Banks, Inc. | 0.5 | % |
| | Communication Services | 4.6 | % | | Amphenol Corp., Class A | 0.5 | % |
| | Utilities | 4.5 | % | | Ball Corp | 0.5 | % |
| | Materials | 3.6 | % | | PPG Industries, Inc. | 0.5 | % |
| | Real Estate | 0.5 | % | | IHS Markit Ltd. | 0.5 | % |
| | Energy | 0.4 | % | | Total | 5.0 | % |
| | Total | 100.0 | % | | | |
See Endnotes and Additional Disclosures in this report.
4 www.calvert.com CALVERT US MID-CAP CORE RESPONSIBLE INDEX FUND ANNUAL REPORT (Unaudited)
|
| | |
| Endnotes and Additional Disclosures | | |
| |
1 | The views expressed in this report are those of the portfolio manager(s) and are current only through the date stated on the cover. These views are subject to change at any time based upon market or other conditions, and Calvert and the Fund(s) disclaim any responsibility to update such views. These views may not be relied upon as investment advice and, because investment decisions are based on many factors, may not be relied upon as an indication of trading intent on behalf of any Calvert fund. This commentary may contain statements that are not historical facts, referred to as “forward looking statements.” The Fund’s actual future results may differ significantly from those stated in any forward looking statement, depending on factors such as changes in securities or financial markets or general economic conditions, the volume of sales and purchases of Fund shares, the continuation of investment advisory, administrative and service contracts, and other risks discussed from time to time in the Fund’s filings with the Securities and Exchange Commission. |
| |
2 | Dow Jones Industrial Average® is a price-weighted average of 30 blue-chip stocks that are generally the leaders in their industry. S&P 500® Index is an unmanaged index of large-cap stocks commonly used as a measure of U.S. stock market performance. S&P Dow Jones Indices are a product of S&P Dow Jones Indices LLC (“S&P DJI”) and have been licensed for use. S&P® and S&P 500® are registered trademarks of S&P DJI; Dow Jones® is a registered trademark of Dow Jones Trademark Holdings LLC (“Dow Jones”); S&P DJI, Dow Jones and their respective affiliates do not sponsor, endorse, sell or promote the Fund, will not have any liability with respect thereto and do not have any liability for any errors, omissions, or interruptions of the S&P Dow Jones Indices. Nasdaq Composite Index is a market capitalization-weighted index of all domestic and international securities listed on Nasdaq. Source: Nasdaq, Inc. The information is provided by Nasdaq (with its affiliates, are referred to as the “Corporations”) and Nasdaq’s third party licensors on an “as is” basis and the Corporations make no guarantees and bear no liability of any kind with respect to the information or the Fund. Russell 2000® Index is an unmanaged index of 2,000 U.S. small-cap stocks. Russell Midcap® Index is an unmanaged index of U.S. mid-cap stocks. Calvert US Mid-Cap Core Responsible Index (the “Calvert Index”) is composed of common stocks of mid-sized companies that operate their businesses in a manner that is consistent with the Calvert Principles for Responsible Investment. Mid-size companies are the 1,000 largest publicly traded U.S. companies based on market capitalization, excluding real estate investment trusts, business development companies and approximately the 200 largest publicly traded U.S. companies. The Calvert Principles for Responsible Investment serve as a framework for considering environmental, social and governance factors that may affect investment performance. Stocks are weighted in the Calvert Index based on their float-adjusted market capitalization within the relevant sector, subject to certain prescribed limits. Unless otherwise stated, index returns do not reflect the effect of any applicable sales charges, commissions, expenses, taxes or leverage, as applicable. It is not possible to invest directly in an index. |
| |
3 | Total Returns at NAV do not include applicable sales charges. If sales charges were deducted, the returns would be lower. Total Returns shown with maximum sales charge reflect the stated maximum sales charge. Unless otherwise stated, performance does not reflect the deduction of taxes on Fund distributions or redemptions of Fund shares. Performance since inception for an index, if presented, is the performance since the Fund’s or oldest share class’ inception, as applicable. |
Calvert Research and Management became the investment adviser to the Fund on December 31, 2016. Performance reflected prior to such date is that of the Fund’s former investment adviser.
| |
4 | Source: Fund prospectus. Net expense ratios reflect a contractual expense reimbursement that continues through 1/31/20. Without the reimbursement, performance would have been lower. The expense ratios for the current reporting period can be found in the Financial Highlights section of this report. |
| |
5 | Does not include Short Term Investment of Cash Collateral for Securities Loaned. |
6 Excludes cash and cash equivalents.
www.calvert.com CALVERT US MID-CAP CORE RESPONSIBLE INDEX FUND ANNUAL REPORT (Unaudited) 5
FUND EXPENSES
Example
As a Fund shareholder, you incur two types of costs: (1) transaction costs, including sales charges (loads) on purchases and redemption fees (if applicable); and (2) ongoing costs, including management fees; distribution and/or service fees; and other Fund expenses. This Example is intended to help you understand your ongoing costs (in dollars) of Fund investing and to compare these costs with the ongoing costs of investing in other mutual funds. The Example is based on an investment of $1,000 invested at the beginning of the period and held for the entire period (April 1, 2019 to September 30, 2019).
Actual Expenses
The first section of the table below provides information about actual account values and actual expenses. You may use the information in this section, together with the amount you invested, to estimate the expenses that you paid over the period. Simply divide your account value by $1,000 (for example, an $8,600 account value divided by $1,000 = 8.6), then multiply the result by the number in the first section under the heading entitled “Expenses Paid During Period” to estimate the expenses you paid on your account during this period.
Hypothetical Example for Comparison Purposes
The second section of the table below provides information about hypothetical account values and hypothetical expenses based on the actual Fund expense ratio and an assumed rate of return of 5% per year (before expenses), which is not the actual Fund return. The hypothetical account values and expenses may not be used to estimate the actual ending account balance or expenses you paid for the period. You may use this information to compare the ongoing costs of investing in the Fund and other funds. To do so, compare this 5% hypothetical example with the 5% hypothetical examples that appear in the shareholder reports of the other funds.
Please note that the expenses shown in the table are meant to highlight your ongoing costs only and do not reflect any transactional costs, such as sales charges (loads) or redemption fees (if applicable). Therefore, the second section of the table is useful in comparing ongoing costs only, and will not help you determine the relative total costs of owning different funds. In addition, if these transactional costs were included, your costs would be higher.
|
| | | | |
| | BEGINNING ACCOUNT VALUE
(4/1/19) | ENDING ACCOUNT VALUE
(9/30/19) | EXPENSES PAID DURING PERIOD*
(4/1/19 - 9/30/19) | ANNUALIZED EXPENSE RATIO |
| Actual | | | | |
| Class A | $1,000.00 | $1,038.40 | $2.50** | 0.49% |
| Class I | $1,000.00 | $1,039.60 | $1.23** | 0.24% |
| Hypothetical | | | | |
| (5% return per year before expenses) | | | | |
| Class A | $1,000.00 | $1,022.61 | $2.48** | 0.49% |
| Class I | $1,000.00 | $1,023.87 | $1.22** | 0.24% |
| | | | | |
| * Expenses are equal to the Fund’s annualized expense ratio for the indicated Class, multiplied by the average account value over the period, multiplied by 183/365 (to reflect the one-half year period). The Example assumes that the $1,000 was invested at the net asset value per share determined at the close of business on March 31, 2019. |
| ** Absent a waiver and/or reimbursement of expenses by an affiliate, expenses would be higher. |
6 www.calvert.com CALVERT US MID-CAP CORE RESPONSIBLE INDEX FUND ANNUAL REPORT (Unaudited)
CALVERT US MID-CAP CORE RESPONSIBLE INDEX FUND
SCHEDULE OF INVESTMENTS
SEPTEMBER 30, 2019
|
| | |
| | SHARES | VALUE ($) |
| COMMON STOCKS - 99.7% | | |
| Aerospace & Defense - 0.5% | | |
| Axon Enterprise, Inc. (1)(2) | 762 | 43,266 |
| HEICO Corp. | 666 | 83,170 |
| Hexcel Corp. | 1,209 | 99,295 |
| Mercury Systems, Inc. (1) | 640 | 51,949 |
| Moog, Inc., Class A | 439 | 35,612 |
| | | 313,292 |
| | | |
| Air Freight & Logistics - 0.4% | | |
| C.H. Robinson Worldwide, Inc. | 1,484 | 125,814 |
| Expeditors International of Washington, Inc. | 1,863 | 138,402 |
| | | 264,216 |
| | | |
| Airlines - 1.1% | | |
| Alaska Air Group, Inc. | 1,303 | 84,578 |
| American Airlines Group, Inc. | 4,253 | 114,703 |
| JetBlue Airways Corp. (1) | 3,666 | 61,405 |
| SkyWest, Inc. | 507 | 29,102 |
| Southwest Airlines Co. | 5,238 | 282,904 |
| Spirit Airlines, Inc. (1) | 705 | 25,592 |
| United Airlines Holdings, Inc. (1) | 655 | 57,909 |
| | | 656,193 |
| | | |
| Auto Components - 0.9% | | |
| Aptiv plc | 2,769 | 242,066 |
| Autoliv, Inc. | 828 | 65,312 |
| BorgWarner, Inc. | 1,851 | 67,895 |
| Gentex Corp. | 2,949 | 81,201 |
| Lear Corp. | 599 | 70,622 |
| | | 527,096 |
| | | |
| Automobiles - 0.2% | | |
| Harley-Davidson, Inc. (2) | 1,623 | 58,379 |
| Thor Industries, Inc. | 603 | 34,154 |
| | | 92,533 |
| | | |
| Banks - 5.6% | | |
| Associated Banc-Corp. | 1,795 | 36,349 |
| BancorpSouth Bank | 1,009 | 29,877 |
| Bank of Hawaii Corp. (2) | 397 | 34,114 |
| Bank OZK | 1,159 | 31,606 |
| BankUnited, Inc. | 748 | 25,148 |
www.calvert.com CALVERT US MID-CAP CORE RESPONSIBLE INDEX FUND ANNUAL REPORT 7
|
| | |
| | SHARES | VALUE ($) |
| COMMON STOCKS - CONT’D | | |
| BOK Financial Corp. | 379 | 29,998 |
| CenterState Bank Corp. | 1,360 | 32,620 |
| CIT Group, Inc. | 1,016 | 46,035 |
| Citizens Financial Group, Inc. | 4,566 | 161,499 |
| Comerica, Inc. | 1,560 | 102,944 |
| Commerce Bancshares, Inc. (2) | 1,181 | 71,628 |
| Community Bank System, Inc. | 536 | 33,066 |
| Cullen/Frost Bankers, Inc. (2) | 493 | 43,655 |
| CVB Financial Corp. | 1,180 | 24,627 |
| East West Bancorp, Inc. | 1,540 | 68,207 |
| Fifth Third Bancorp | 7,540 | 206,445 |
| First Citizens BancShares, Inc., Class A | 44 | 20,748 |
| First Financial Bankshares, Inc. (2) | 1,360 | 45,329 |
| First Hawaiian, Inc. | 1,491 | 39,810 |
| First Horizon National Corp. | 3,401 | 55,096 |
| First Republic Bank | 1,748 | 169,032 |
| FNB Corp. | 3,606 | 41,577 |
| Glacier Bancorp, Inc. | 985 | 39,853 |
| Hancock Whitney Corp. | 975 | 37,338 |
| Home BancShares, Inc. | 1,715 | 32,233 |
| Huntington Bancshares, Inc. | 10,110 | 144,270 |
| IBERIABANK Corp. | 593 | 44,795 |
| Investors Bancorp, Inc. | 1,833 | 20,823 |
| KeyCorp | 10,149 | 181,058 |
| M&T Bank Corp. | 1,290 | 203,781 |
| Old National Bancorp | 1,592 | 27,390 |
| PacWest Bancorp | 942 | 34,232 |
| People’s United Financial, Inc. | 3,325 | 51,986 |
| Pinnacle Financial Partners, Inc. | 804 | 45,627 |
| Popular, Inc. | 1,049 | 56,730 |
| Prosperity Bancshares, Inc. (2) | 721 | 50,924 |
| Regions Financial Corp. | 9,953 | 157,457 |
| Signature Bank | 583 | 69,505 |
| Sterling Bancorp | 2,222 | 44,573 |
| SunTrust Banks, Inc. | 4,415 | 303,752 |
| SVB Financial Group (1) | 500 | 104,475 |
| Synovus Financial Corp. | 1,351 | 48,312 |
| Texas Capital Bancshares, Inc. (1) | 516 | 28,199 |
| UMB Financial Corp. | 523 | 33,775 |
| Umpqua Holdings Corp. | 2,357 | 38,796 |
| United Bankshares, Inc. | 1,156 | 43,778 |
| Valley National Bancorp | 3,219 | 34,991 |
| Webster Financial Corp. | 1,030 | 48,276 |
8 www.calvert.com CALVERT US MID-CAP CORE RESPONSIBLE INDEX FUND ANNUAL REPORT
|
| | |
| | SHARES | VALUE ($) |
| COMMON STOCKS - CONT’D | | |
| Western Alliance Bancorp | 1,040 | 47,923 |
| Wintrust Financial Corp. | 565 | 36,516 |
| Zions BanCorp NA | 1,844 | 82,095 |
| | | 3,442,873 |
| | | |
| Beverages - 0.0% (3) | | |
| Coca-Cola Consolidated, Inc. | 74 | 22,486 |
| | | |
| Biotechnology - 2.9% | | |
| ACADIA Pharmaceuticals, Inc. (1)(2) | 773 | 27,820 |
| Alexion Pharmaceuticals, Inc. (1) | 2,429 | 237,896 |
| Alkermes plc (1) | 1,684 | 32,855 |
| Allogene Therapeutics, Inc. (1)(2) | 544 | 14,827 |
| Alnylam Pharmaceuticals, Inc. (1) | 1,280 | 102,938 |
| Amicus Therapeutics, Inc. (1) | 2,784 | 22,328 |
| BioMarin Pharmaceutical, Inc. (1) | 2,225 | 149,965 |
| Bluebird Bio, Inc. (1)(2) | 640 | 58,765 |
| Blueprint Medicines Corp. (1) | 537 | 39,453 |
| Exact Sciences Corp. (1)(2) | 1,715 | 154,984 |
| Exelixis, Inc. (1) | 3,708 | 65,576 |
| FibroGen, Inc. (1) | 945 | 34,946 |
| Global Blood Therapeutics, Inc. (1)(2) | 568 | 27,559 |
| Incyte Corp. (1) | 2,218 | 164,642 |
| Ionis Pharmaceuticals, Inc. (1) | 1,490 | 89,266 |
| Neurocrine Biosciences, Inc. (1) | 1,128 | 101,644 |
| Repligen Corp. (1) | 635 | 48,698 |
| Sage Therapeutics, Inc. (1)(2) | 662 | 92,872 |
| Sarepta Therapeutics, Inc. (1) | 902 | 67,939 |
| Seattle Genetics, Inc. (1) | 1,333 | 113,838 |
| Spark Therapeutics, Inc. (1) | 444 | 43,059 |
| Ultragenyx Pharmaceutical, Inc. (1)(2) | 733 | 31,358 |
| United Therapeutics Corp. (1) | 516 | 41,151 |
| | | 1,764,379 |
| | | |
| Building Products - 0.9% | | |
| Allegion plc | 1,308 | 135,574 |
| Armstrong World Industries, Inc. | 569 | 55,022 |
| Fortune Brands Home & Security, Inc. | 1,384 | 75,705 |
| Masco Corp. | 3,163 | 131,834 |
| Owens Corning | 1,792 | 113,255 |
| Trex Co., Inc. (1)(2) | 609 | 55,376 |
| | | 566,766 |
| | | |
| Capital Markets - 4.2% | | |
| Affiliated Managers Group, Inc. | 553 | 46,093 |
| Ameriprise Financial, Inc. | 1,275 | 187,553 |
| Ares Management Corp., Class A | 935 | 25,067 |
www.calvert.com CALVERT US MID-CAP CORE RESPONSIBLE INDEX FUND ANNUAL REPORT 9
|
| | |
| | SHARES | VALUE ($) |
| COMMON STOCKS - CONT’D | | |
| Cboe Global Markets, Inc. | 1,341 | 154,094 |
| E*Trade Financial Corp. | 2,544 | 111,147 |
| Evercore, Inc., Class A | 363 | 29,076 |
| FactSet Research Systems, Inc. (2) | 438 | 106,421 |
| Franklin Resources, Inc. | 2,733 | 78,874 |
| Houlihan Lokey, Inc. | 394 | 17,770 |
| Interactive Brokers Group, Inc., Class A | 679 | 36,517 |
| Invesco Ltd. | 3,929 | 66,557 |
| KKR & Co., Inc., Class A (2) | 5,409 | 145,232 |
| Lazard Ltd., Class A | 1,374 | 48,090 |
| Legg Mason, Inc. | 868 | 33,149 |
| LPL Financial Holdings, Inc. | 768 | 62,899 |
| MarketAxess Holdings, Inc. | 493 | 161,458 |
| Morningstar, Inc. | 246 | 35,951 |
| MSCI, Inc. | 1,007 | 219,274 |
| Nasdaq, Inc. | 1,234 | 122,598 |
| Northern Trust Corp. | 2,112 | 197,092 |
| Raymond James Financial, Inc. | 1,270 | 104,724 |
| SEI Investments Co. | 1,276 | 75,609 |
| State Street Corp. | 3,474 | 205,626 |
| Stifel Financial Corp. | 698 | 40,051 |
| T. Rowe Price Group, Inc. | 2,392 | 273,286 |
| Virtu Financial, Inc., Class A (2) | 667 | 10,912 |
| | | 2,595,120 |
| | | |
| Chemicals - 1.3% | | |
| Axalta Coating Systems Ltd. (1) | 2,996 | 90,330 |
| Eastman Chemical Co. | 1,751 | 129,276 |
| International Flavors & Fragrances, Inc. (2) | 1,251 | 153,485 |
| Mosaic Co. (The) | 4,218 | 86,469 |
| PPG Industries, Inc. | 2,502 | 296,512 |
| Sensient Technologies Corp. | 536 | 36,796 |
| | | 792,868 |
| | | |
| Commercial Services & Supplies - 1.2% | | |
| ADT, Inc. (2) | 1,030 | 6,458 |
| Cintas Corp. | 999 | 267,832 |
| Copart, Inc. (1) | 2,085 | 167,488 |
| IAA, Inc. (1) | 1,718 | 71,692 |
| KAR Auction Services, Inc. | 1,489 | 36,555 |
| MSA Safety, Inc. | 518 | 56,519 |
| Tetra Tech, Inc. | 1,087 | 94,308 |
| UniFirst Corp. | 183 | 35,707 |
| | | 736,559 |
| | | |
10 www.calvert.com CALVERT US MID-CAP CORE RESPONSIBLE INDEX FUND ANNUAL REPORT
|
| | |
| | SHARES | VALUE ($) |
| COMMON STOCKS - CONT’D | | |
| Communications Equipment - 1.5% | | |
| Arista Networks, Inc. (1) | 592 | 141,441 |
| Ciena Corp. (1) | 1,790 | 70,222 |
| CommScope Holding Co., Inc. (1) | 1,987 | 23,367 |
| EchoStar Corp., Class A (1) | 597 | 23,653 |
| F5 Networks, Inc. (1) | 677 | 95,064 |
| Juniper Networks, Inc. | 3,788 | 93,753 |
| Lumentum Holdings, Inc. (1) | 795 | 42,580 |
| Motorola Solutions, Inc. | 1,986 | 338,434 |
| ViaSat, Inc. (1) | 719 | 54,155 |
| Viavi Solutions, Inc. (1) | 2,746 | 38,458 |
| | | 921,127 |
| | | |
| Construction & Engineering - 0.3% | | |
| EMCOR Group, Inc. | 1,033 | 88,962 |
| Quanta Services, Inc. | 2,348 | 88,754 |
| | | 177,716 |
| | | |
| Consumer Finance - 1.3% | | |
| Ally Financial, Inc. | 3,957 | 131,214 |
| Credit Acceptance Corp. (1) | 132 | 60,893 |
| Discover Financial Services | 3,352 | 271,814 |
| FirstCash, Inc. | 440 | 40,335 |
| OneMain Holdings, Inc. | 746 | 27,363 |
| SLM Corp. | 4,692 | 41,407 |
| Synchrony Financial | 6,929 | 236,209 |
| | | 809,235 |
| | | |
| Containers & Packaging - 1.7% | | |
| AptarGroup, Inc. | 990 | 117,265 |
| Ardagh Group S.A. | 485 | 7,605 |
| Avery Dennison Corp. | 1,214 | 137,874 |
| Ball Corp. | 4,114 | 299,540 |
| Berry Global Group, Inc. (1) | 1,722 | 67,623 |
| Crown Holdings, Inc. (1) | 2,022 | 133,573 |
| Sealed Air Corp. | 2,103 | 87,296 |
| Sonoco Products Co. | 1,314 | 76,488 |
| WestRock Co. | 3,287 | 119,811 |
| | | 1,047,075 |
| | | |
| Distributors - 0.5% | | |
| Genuine Parts Co. | 1,416 | 141,019 |
| LKQ Corp. (1) | 2,591 | 81,487 |
| Pool Corp. | 461 | 92,984 |
| | | 315,490 |
| | | |
www.calvert.com CALVERT US MID-CAP CORE RESPONSIBLE INDEX FUND ANNUAL REPORT 11
|
| | |
| | SHARES | VALUE ($) |
| COMMON STOCKS - CONT’D | | |
| Diversified Consumer Services - 1.0% | | |
| Bright Horizons Family Solutions, Inc. (1) | 705 | 107,513 |
| Chegg, Inc. (1) | 1,494 | 44,745 |
| frontdoor, Inc. (1) | 1,069 | 51,921 |
| Graham Holdings Co., Class B | 48 | 31,846 |
| Grand Canyon Education, Inc. (1) | 643 | 63,143 |
| H&R Block, Inc. (2) | 2,574 | 60,798 |
| Laureate Education, Inc., Class A (1) | 1,266 | 20,984 |
| Service Corp. International | 2,062 | 98,584 |
| ServiceMaster Global Holdings, Inc. (1) | 1,768 | 98,831 |
| Strategic Education, Inc. | 298 | 40,492 |
| | | 618,857 |
| | | |
| Diversified Financial Services - 0.3% | | |
| AXA Equitable Holdings, Inc. | 2,994 | 66,347 |
| Jefferies Financial Group, Inc. | 2,327 | 42,817 |
| Voya Financial, Inc. | 1,285 | 69,955 |
| | | 179,119 |
| | | |
| Diversified Telecommunication Services - 0.6% | | |
| CenturyLink, Inc. | 11,407 | 142,359 |
| GCI Liberty, Inc., Class A (1) | 1,130 | 70,139 |
| Iridium Communications, Inc. (1) | 1,050 | 22,344 |
| Vonage Holdings Corp. (1) | 2,589 | 29,256 |
| Zayo Group Holdings, Inc. (1) | 2,602 | 88,208 |
| | | 352,306 |
| | | |
| Electric Utilities - 1.1% | | |
| Alliant Energy Corp. | 3,300 | 177,969 |
| Avangrid, Inc. | 1,277 | 66,723 |
| Eversource Energy | 3,565 | 304,701 |
| Portland General Electric Co. | 1,820 | 102,593 |
| | | 651,986 |
| | | |
| Electrical Equipment - 1.3% | | |
| Acuity Brands, Inc. | 504 | 67,934 |
| AMETEK, Inc. | 2,513 | 230,744 |
| Generac Holdings, Inc. (1) | 870 | 68,156 |
| GrafTech International Ltd. (2) | 612 | 7,834 |
| Hubbell, Inc. | 780 | 102,492 |
| nVent Electric plc | 2,256 | 49,722 |
| Regal-Beloit Corp. | 632 | 46,041 |
| Rockwell Automation, Inc. | 1,304 | 214,899 |
| | | 787,822 |
| | | |
12 www.calvert.com CALVERT US MID-CAP CORE RESPONSIBLE INDEX FUND ANNUAL REPORT
|
| | |
| | SHARES | VALUE ($) |
| COMMON STOCKS - CONT’D | | |
| Electronic Equipment, Instruments & Components - 2.8% | | |
| Amphenol Corp., Class A | 3,129 | 301,949 |
| Arrow Electronics, Inc. (1) | 883 | 65,854 |
| Avnet, Inc. | 1,055 | 46,932 |
| CDW Corp. | 1,701 | 209,631 |
| Corning, Inc. | 8,451 | 241,023 |
| Dolby Laboratories, Inc., Class A | 650 | 42,016 |
| FLIR Systems, Inc. | 1,565 | 82,303 |
| IPG Photonics Corp. (1) | 337 | 45,697 |
| Jabil, Inc. | 1,630 | 58,305 |
| Keysight Technologies, Inc. (1) | 2,203 | 214,242 |
| National Instruments Corp. | 1,374 | 57,694 |
| Novanta, Inc. (1) | 420 | 34,323 |
| SYNNEX Corp. | 421 | 47,531 |
| Tech Data Corp. (1) | 338 | 35,233 |
| Trimble, Inc. (1) | 3,467 | 134,554 |
| Zebra Technologies Corp., Class A (1) | 641 | 132,283 |
| | | 1,749,570 |
| | | |
| Energy Equipment & Services - 0.4% | | |
| Baker Hughes, a GE Co. | 6,561 | 152,215 |
| National Oilwell Varco, Inc. | 5,382 | 114,099 |
| | | 266,314 |
| | | |
| Entertainment - 1.0% | | |
| Cinemark Holdings, Inc. | 1,208 | 46,677 |
| Liberty Formula One, Series A (1) | 343 | 13,579 |
| Lions Gate Entertainment Corp., Class A | 1,615 | 14,939 |
| Live Nation Entertainment, Inc. (1) | 1,756 | 116,493 |
| Madison Square Garden Co. (The), Class A (1) | 192 | 50,596 |
| Take-Two Interactive Software, Inc. (1) | 1,407 | 176,353 |
| Viacom, Inc., Class B | 4,356 | 104,675 |
| World Wrestling Entertainment, Inc., Class A (2) | 585 | 41,623 |
| Zynga, Inc., Class A (1) | 10,193 | 59,323 |
| | | 624,258 |
| | | |
| Food & Staples Retailing - 0.8% | | |
| BJ’s Wholesale Club Holdings, Inc. (1) | 1,337 | 34,588 |
| Casey’s General Stores, Inc. | 450 | 72,522 |
| Kroger Co. (The) | 8,593 | 221,528 |
| Performance Food Group Co. (1) | 1,403 | 64,552 |
| US Foods Holding Corp. (1) | 2,695 | 110,764 |
| | | 503,954 |
| | | |
| Food Products - 3.1% | | |
| Bunge Ltd. | 1,740 | 98,519 |
| Campbell Soup Co. | 2,180 | 102,286 |
www.calvert.com CALVERT US MID-CAP CORE RESPONSIBLE INDEX FUND ANNUAL REPORT 13
|
| | |
| | SHARES | VALUE ($) |
| COMMON STOCKS - CONT’D | | |
| Conagra Brands, Inc. | 5,998 | 184,019 |
| Darling Ingredients, Inc. (1) | 1,870 | 35,773 |
| Flowers Foods, Inc. | 2,649 | 61,271 |
| Hershey Co. (The) | 1,768 | 274,022 |
| Hormel Foods Corp. (2) | 3,411 | 149,163 |
| Ingredion, Inc. | 744 | 60,815 |
| J&J Snack Foods Corp. | 207 | 39,744 |
| JM Smucker Co. (The) | 1,367 | 150,397 |
| Kellogg Co. | 3,164 | 203,603 |
| Lamb Weston Holdings, Inc. | 1,853 | 134,750 |
| Lancaster Colony Corp. | 209 | 28,978 |
| McCormick & Co., Inc. | 1,589 | 248,361 |
| Post Holdings, Inc. (1) | 809 | 85,624 |
| TreeHouse Foods, Inc. (1) | 635 | 35,211 |
| | | 1,892,536 |
| | | |
| Gas Utilities - 1.1% | | |
| Atmos Energy Corp. | 1,592 | 181,313 |
| New Jersey Resources Corp. | 2,030 | 91,797 |
| ONE Gas, Inc. | 957 | 91,977 |
| Southwest Gas Holdings, Inc. | 967 | 88,036 |
| Spire, Inc. | 976 | 85,146 |
| UGI Corp. | 2,791 | 140,303 |
| | | 678,572 |
| | | |
| Health Care Equipment & Supplies - 4.7% | | |
| ABIOMED, Inc. (1) | 559 | 99,441 |
| Align Technology, Inc. (1) | 906 | 163,914 |
| Cantel Medical Corp. | 499 | 37,325 |
| Cooper Cos., Inc. (The) | 592 | 175,824 |
| DENTSPLY SIRONA, Inc. | 2,712 | 144,577 |
| DexCom, Inc. (1) | 1,268 | 189,236 |
| Globus Medical, Inc., Class A (1) | 838 | 42,839 |
| Haemonetics Corp. (1) | 621 | 78,333 |
| Hill-Rom Holdings, Inc. | 861 | 90,603 |
| Hologic, Inc. (1) | 3,213 | 162,224 |
| ICU Medical, Inc. (1) | 246 | 39,262 |
| IDEXX Laboratories, Inc. (1) | 1,061 | 288,518 |
| Insulet Corp. (1) | 771 | 127,161 |
| Integra LifeSciences Holdings Corp. (1) | 807 | 48,476 |
| Masimo Corp. (1) | 593 | 88,232 |
| Merit Medical Systems, Inc. (1) | 811 | 24,703 |
| Neogen Corp. (1) | 584 | 39,776 |
| Novocure Ltd. (1) | 1,106 | 82,707 |
| NuVasive, Inc. (1) | 571 | 36,190 |
| Penumbra, Inc. (1)(2) | 360 | 48,416 |
| ResMed, Inc. | 1,798 | 242,928 |
14 www.calvert.com CALVERT US MID-CAP CORE RESPONSIBLE INDEX FUND ANNUAL REPORT
|
| | |
| | SHARES | VALUE ($) |
| COMMON STOCKS - CONT’D | | |
| STERIS plc | 1,072 | 154,893 |
| Tandem Diabetes Care, Inc. (1) | 735 | 43,350 |
| Teleflex, Inc. | 612 | 207,927 |
| Varian Medical Systems, Inc. (1) | 1,010 | 120,281 |
| West Pharmaceutical Services, Inc. | 861 | 122,107 |
| | | 2,899,243 |
| | | |
| Health Care Providers & Services - 2.3% | | |
| Acadia Healthcare Co., Inc. (1) | 951 | 29,557 |
| Amedisys, Inc. (1) | 383 | 50,177 |
| Centene Corp. (1) | 4,955 | 214,353 |
| Chemed Corp. | 187 | 78,085 |
| Covetrus, Inc. (1)(2) | 1,070 | 12,722 |
| DaVita, Inc. (1) | 1,486 | 84,806 |
| Encompass Health Corp. | 1,150 | 72,772 |
| Ensign Group, Inc. (The) | 634 | 30,071 |
| Guardant Health, Inc. (1) | 498 | 31,787 |
| HealthEquity, Inc. (1) | 777 | 44,402 |
| Henry Schein, Inc. (1) | 1,722 | 109,347 |
| Laboratory Corp. of America Holdings (1) | 1,097 | 184,296 |
| LHC Group, Inc. (1) | 325 | 36,907 |
| Molina Healthcare, Inc. (1) | 780 | 85,582 |
| Premier, Inc., Class A (1) | 696 | 20,128 |
| Quest Diagnostics, Inc. | 1,591 | 170,285 |
| WellCare Health Plans, Inc. (1) | 616 | 159,649 |
| | | 1,414,926 |
| | | |
| Health Care Technology - 1.1% | | |
| Cerner Corp. | 3,651 | 248,889 |
| Medidata Solutions, Inc. (1) | 702 | 64,233 |
| Omnicell, Inc. (1) | 477 | 34,473 |
| Teladoc Health, Inc. (1)(2) | 727 | 49,232 |
| Veeva Systems, Inc., Class A (1) | 1,743 | 266,139 |
| | | 662,966 |
| | | |
| Hotels, Restaurants & Leisure - 3.4% | | |
| Aramark | 3,026 | 131,873 |
| Chipotle Mexican Grill, Inc. (1) | 336 | 282,398 |
| Choice Hotels International, Inc. | 374 | 33,271 |
| Cracker Barrel Old Country Store, Inc. (2) | 286 | 46,518 |
| Darden Restaurants, Inc. | 1,445 | 170,828 |
| Domino’s Pizza, Inc. | 501 | 122,540 |
| Dunkin’ Brands Group, Inc. | 1,126 | 89,359 |
| Extended Stay America, Inc. | 2,120 | 31,037 |
| Hilton Worldwide Holdings, Inc. | 3,084 | 287,151 |
| Hyatt Hotels Corp., Class A | 451 | 33,225 |
| Marriott Vacations Worldwide Corp. | 474 | 49,111 |
www.calvert.com CALVERT US MID-CAP CORE RESPONSIBLE INDEX FUND ANNUAL REPORT 15
|
| | |
| | SHARES | VALUE ($) |
| COMMON STOCKS - CONT’D | | |
| Planet Fitness, Inc., Class A (1) | 1,132 | 65,509 |
| Royal Caribbean Cruises Ltd. | 1,835 | 198,786 |
| Six Flags Entertainment Corp. | 984 | 49,977 |
| Texas Roadhouse, Inc. | 834 | 43,802 |
| Vail Resorts, Inc. | 490 | 111,505 |
| Wendy’s Co. (The) | 2,888 | 57,702 |
| Wyndham Destinations, Inc. | 1,099 | 50,576 |
| Wyndham Hotels & Resorts, Inc. | 1,126 | 58,259 |
| Yum China Holdings, Inc. | 4,119 | 187,126 |
| | | 2,100,553 |
| | | |
| Household Durables - 1.3% | | |
| Helen of Troy Ltd. (1) | 298 | 46,983 |
| Leggett & Platt, Inc. | 1,242 | 50,847 |
| Lennar Corp., Class A | 3,556 | 198,602 |
| Mohawk Industries, Inc. (1) | 615 | 76,303 |
| Newell Brands, Inc. (2) | 4,182 | 78,287 |
| Roku, Inc. (1)(2) | 989 | 100,641 |
| Tempur Sealy International, Inc. (1) | 523 | 40,376 |
| Toll Brothers, Inc. | 2,303 | 94,538 |
| Whirlpool Corp. | 617 | 97,708 |
| | | 784,285 |
| | | |
| Household Products - 0.8% | | |
| Church & Dwight Co., Inc. | 3,003 | 225,946 |
| Clorox Co. (The) | 1,425 | 216,415 |
| Energizer Holdings, Inc. (2) | 577 | 25,145 |
| Spectrum Brands Holdings, Inc. | 58 | 3,067 |
| | | 470,573 |
| | | |
| Independent Power and Renewable Electricity Producers - 0.6% | | |
| AES Corp. | 9,211 | 150,508 |
| Clearway Energy, Inc., Class C | 2,194 | 40,040 |
| Ormat Technologies, Inc. | 1,063 | 78,970 |
| TerraForm Power, Inc., Class A | 4,727 | 86,150 |
| | | 355,668 |
| | | |
| Industrial Conglomerates - 0.2% | | |
| Carlisle Cos., Inc. | 842 | 122,545 |
| | | |
| Insurance - 5.1% | | |
| Alleghany Corp. (1) | 151 | 120,462 |
| American Financial Group, Inc. | 805 | 86,819 |
| American National Insurance Co. | 128 | 15,837 |
| Arch Capital Group Ltd. (1) | 4,277 | 179,549 |
| Arthur J. Gallagher & Co. | 2,380 | 213,177 |
| Assurant, Inc. | 660 | 83,041 |
16 www.calvert.com CALVERT US MID-CAP CORE RESPONSIBLE INDEX FUND ANNUAL REPORT
|
| | |
| | SHARES | VALUE ($) |
| COMMON STOCKS - CONT’D | | |
| Assured Guaranty Ltd. | 1,099 | 48,862 |
| Athene Holding Ltd., Class A (1) | 1,511 | 63,553 |
| Axis Capital Holdings Ltd. | 927 | 61,849 |
| Brighthouse Financial, Inc. (1) | 1,160 | 46,945 |
| Brown & Brown, Inc. | 3,089 | 111,389 |
| Cincinnati Financial Corp. | 1,629 | 190,055 |
| Enstar Group Ltd. (1) | 162 | 30,767 |
| Erie Indemnity Co., Class A | 299 | 55,509 |
| Everest Re Group Ltd. | 416 | 110,693 |
| Fidelity National Financial, Inc. | 2,894 | 128,523 |
| First American Financial Corp. | 1,113 | 65,678 |
| Globe Life, Inc. | 1,161 | 111,177 |
| Hanover Insurance Group, Inc. (The) | 457 | 61,942 |
| Hartford Financial Services Group, Inc. (The) | 3,925 | 237,894 |
| Kemper Corp. | 631 | 49,187 |
| Lincoln National Corp. | 1,938 | 116,900 |
| Mercury General Corp. | 366 | 20,452 |
| Old Republic International Corp. | 3,128 | 73,727 |
| Primerica, Inc. | 444 | 56,490 |
| Principal Financial Group, Inc. | 2,884 | 164,792 |
| Reinsurance Group of America, Inc. | 680 | 108,718 |
| RenaissanceRe Holdings Ltd. | 486 | 94,017 |
| RLI Corp. | 456 | 42,367 |
| Selective Insurance Group, Inc. | 619 | 46,543 |
| Unum Group | 1,738 | 51,653 |
| White Mountains Insurance Group Ltd. | 30 | 32,400 |
| Willis Towers Watson plc | 1,478 | 285,210 |
| | | 3,166,177 |
| | | |
| Interactive Media & Services - 0.6% | | |
| ANGI Homeservices, Inc., Class A (1)(2) | 818 | 5,795 |
| Cargurus, Inc. (1)(2) | 821 | 25,410 |
| IAC/InterActiveCorp (1) | 1,040 | 226,689 |
| Match Group, Inc. (2) | 700 | 50,008 |
| TripAdvisor, Inc. (1) | 1,176 | 45,488 |
| | | 353,390 |
| | | |
| Internet & Direct Marketing Retail - 0.7% | | |
| Etsy, Inc. (1) | 1,225 | 69,213 |
| Expedia Group, Inc. | 1,623 | 218,147 |
| GrubHub, Inc. (1)(2) | 973 | 54,692 |
| Qurate Retail, Inc., Class A (1) | 3,945 | 40,693 |
| Wayfair, Inc., Class A (1)(2) | 605 | 67,833 |
| | | 450,578 |
| | | |
www.calvert.com CALVERT US MID-CAP CORE RESPONSIBLE INDEX FUND ANNUAL REPORT 17
|
| | |
| | SHARES | VALUE ($) |
| COMMON STOCKS - CONT’D | | |
| IT Services - 4.5% | | |
| Akamai Technologies, Inc. (1) | 1,907 | 174,262 |
| Alliance Data Systems Corp. | 545 | 69,831 |
| Amdocs Ltd. | 1,510 | 99,826 |
| Black Knight, Inc. (1) | 1,664 | 101,604 |
| Booz Allen Hamilton Holding Corp. | 1,764 | 125,279 |
| Broadridge Financial Solutions, Inc. | 1,424 | 177,188 |
| CoreLogic, Inc. (1) | 1,036 | 47,936 |
| DXC Technology Co. | 3,188 | 94,046 |
| EPAM Systems, Inc. (1) | 641 | 116,867 |
| Gartner, Inc. (1) | 1,085 | 155,144 |
| Genpact Ltd. | 1,961 | 75,989 |
| GoDaddy, Inc., Class A (1) | 1,929 | 127,275 |
| Jack Henry & Associates, Inc. | 877 | 128,016 |
| LiveRamp Holdings, Inc. (1) | 748 | 32,134 |
| MAXIMUS, Inc. | 786 | 60,726 |
| MongoDB, Inc. (1)(2) | 575 | 69,276 |
| Okta, Inc. (1) | 1,537 | 151,333 |
| Perspecta, Inc. | 1,547 | 40,408 |
| Sabre Corp. | 3,122 | 69,917 |
| Science Applications International Corp. | 597 | 52,148 |
| Square, Inc., Class A (1)(2) | 4,198 | 260,066 |
| Twilio, Inc., Class A (1)(2) | 1,631 | 179,345 |
| VeriSign, Inc. (1) | 1,468 | 276,909 |
| WEX, Inc. (1) | 517 | 104,470 |
| | | 2,789,995 |
| | | |
| Leisure Products - 0.4% | | |
| Brunswick Corp. | 1,108 | 57,749 |
| Hasbro, Inc. | 1,207 | 143,259 |
| Mattel, Inc. (1)(2) | 3,446 | 39,250 |
| | | 240,258 |
| | | |
| Life Sciences Tools & Services - 2.3% | | |
| Agilent Technologies, Inc. | 3,299 | 252,802 |
| Bio-Rad Laboratories, Inc., Class A (1) | 252 | 83,850 |
| Bio-Techne Corp. | 408 | 79,833 |
| Bruker Corp. | 1,250 | 54,913 |
| Charles River Laboratories International, Inc. (1) | 554 | 73,333 |
| IQVIA Holdings, Inc. (1) | 2,062 | 308,022 |
| Mettler-Toledo International, Inc. (1) | 269 | 189,484 |
| PerkinElmer, Inc. | 1,292 | 110,040 |
| PRA Health Sciences, Inc. (1) | 741 | 73,529 |
| Syneos Health, Inc. (1) | 719 | 38,258 |
| Waters Corp. (1) | 704 | 157,154 |
| | | 1,421,218 |
| | | |
18 www.calvert.com CALVERT US MID-CAP CORE RESPONSIBLE INDEX FUND ANNUAL REPORT
|
| | |
| | SHARES | VALUE ($) |
| COMMON STOCKS - CONT’D | | |
| Machinery - 6.0% | | |
| AGCO Corp. | 822 | 62,225 |
| Allison Transmission Holdings, Inc. | 1,685 | 79,279 |
| CNH Industrial NV | 12,796 | 129,879 |
| Colfax Corp. (1) | 1,196 | 34,756 |
| Crane Co. | 702 | 56,602 |
| Cummins, Inc. | 1,627 | 264,664 |
| Donaldson Co., Inc. | 1,701 | 88,588 |
| Dover Corp. | 1,699 | 169,152 |
| Flowserve Corp. | 1,714 | 80,061 |
| Fortive Corp. | 3,544 | 242,977 |
| Gardner Denver Holdings, Inc. (1) | 1,858 | 52,563 |
| Gates Industrial Corp. plc (1)(2) | 547 | 5,508 |
| Graco, Inc. | 2,236 | 102,945 |
| IDEX Corp. | 943 | 154,539 |
| ITT, Inc. | 1,206 | 73,795 |
| John Bean Technologies Corp. | 377 | 37,485 |
| Lincoln Electric Holdings, Inc. | 847 | 73,486 |
| Middleby Corp. (The) (1) | 741 | 86,623 |
| Navistar International Corp. (1) | 827 | 23,247 |
| Nordson Corp. | 711 | 103,991 |
| Oshkosh Corp. | 920 | 69,736 |
| PACCAR, Inc. | 3,701 | 259,107 |
| Parker-Hannifin Corp. | 1,361 | 245,810 |
| Pentair plc | 2,402 | 90,796 |
| RBC Bearings, Inc. (1) | 337 | 55,912 |
| Rexnord Corp. (1) | 1,476 | 39,926 |
| Snap-on, Inc. (2) | 571 | 89,384 |
| Stanley Black & Decker, Inc. | 1,628 | 235,100 |
| Timken Co. (The) | 830 | 36,113 |
| Toro Co. (The) | 1,463 | 107,238 |
| WABCO Holdings, Inc. (1) | 739 | 98,841 |
| Wabtec Corp. (2) | 2,182 | 156,799 |
| Watts Water Technologies, Inc., Class A | 353 | 33,087 |
| Woodward, Inc. | 870 | 93,812 |
| Xylem, Inc. | 2,279 | 181,454 |
| | | 3,715,480 |
| | | |
| Media - 2.3% | | |
| Altice USA, Inc., Class A (1) | 4,299 | 123,295 |
| AMC Networks, Inc., Class A (1) | 560 | 27,530 |
| Cable One, Inc. | 57 | 71,518 |
| CBS Corp., Class B | 3,906 | 157,685 |
| Discovery, Inc., Class A (1)(2) | 5,888 | 156,797 |
| DISH Network Corp., Class A (1) | 2,244 | 76,453 |
| Interpublic Group of Cos., Inc. (The) | 4,548 | 98,055 |
| Liberty Broadband Corp., Class A (1) | 2,005 | 209,563 |
www.calvert.com CALVERT US MID-CAP CORE RESPONSIBLE INDEX FUND ANNUAL REPORT 19
|
| | |
| | SHARES | VALUE ($) |
| COMMON STOCKS - CONT’D | | |
| Liberty Latin America Ltd., Class C (1) | 1,737 | 29,694 |
| New York Times Co. (The), Class A (2) | 1,578 | 44,941 |
| Nexstar Media Group, Inc., Class A | 533 | 54,531 |
| Omnicom Group, Inc. (2) | 2,473 | 193,636 |
| Sinclair Broadcast Group, Inc., Class A | 616 | 26,328 |
| Sirius XM Holdings, Inc. (2) | 19,549 | 122,279 |
| TEGNA, Inc. | 2,632 | 40,875 |
| | | 1,433,180 |
| | | |
| Metals & Mining - 0.6% | | |
| Nucor Corp. | 3,383 | 172,229 |
| Reliance Steel & Aluminum Co. | 1,036 | 103,248 |
| Steel Dynamics, Inc. | 3,263 | 97,237 |
| | | 372,714 |
| | | |
| Multi-Utilities - 1.0% | | |
| Ameren Corp. | 2,880 | 230,544 |
| CenterPoint Energy, Inc. | 6,112 | 184,460 |
| CMS Energy Corp. | 3,446 | 220,372 |
| | | 635,376 |
| | | |
| Multiline Retail - 0.3% | | |
| Kohl’s Corp. | 1,650 | 81,939 |
| Macy’s, Inc. | 2,800 | 43,512 |
| Nordstrom, Inc. (2) | 976 | 32,862 |
| Ollie’s Bargain Outlet Holdings, Inc. (1)(2) | 602 | 35,301 |
| | | 193,614 |
| | | |
| Personal Products - 0.0% (3) | | |
| Coty, Inc., Class A | 2,788 | 29,302 |
| | | |
| Pharmaceuticals - 0.7% | | |
| Catalent, Inc. (1) | 1,813 | 86,408 |
| Elanco Animal Health, Inc. (1) | 4,179 | 111,120 |
| Horizon Therapeutics plc (1) | 2,350 | 63,990 |
| Jazz Pharmaceuticals plc (1) | 611 | 78,294 |
| Nektar Therapeutics (1)(2) | 1,844 | 33,588 |
| Perrigo Co. plc | 1,308 | 73,104 |
| | | 446,504 |
| | | |
| Professional Services - 2.4% | | |
| CoStar Group, Inc. (1) | 455 | 269,906 |
| Exponent, Inc. | 575 | 40,192 |
| FTI Consulting, Inc. (1) | 439 | 46,530 |
| IHS Markit Ltd. (1) | 4,402 | 294,406 |
| Insperity, Inc. | 443 | 43,689 |
| ManpowerGroup, Inc. | 709 | 59,726 |
20 www.calvert.com CALVERT US MID-CAP CORE RESPONSIBLE INDEX FUND ANNUAL REPORT
|
| | |
| | SHARES | VALUE ($) |
| COMMON STOCKS - CONT’D | | |
| Nielsen Holdings plc | 4,020 | 85,425 |
| Robert Half International, Inc. | 1,331 | 74,083 |
| TransUnion | 2,451 | 198,801 |
| TriNet Group, Inc. (1) | 515 | 32,028 |
| Verisk Analytics, Inc. | 1,925 | 304,419 |
| | | 1,449,205 |
| | | |
| Real Estate Management & Development - 0.5% | | |
| CBRE Group, Inc., Class A (1) | 3,927 | 208,170 |
| Jones Lang LaSalle, Inc. | 798 | 110,970 |
| | | 319,140 |
| | | |
| Road & Rail - 1.0% | | |
| AMERCO | 85 | 33,153 |
| Genesee & Wyoming, Inc., Class A (1) | 684 | 75,589 |
| JB Hunt Transport Services, Inc. | 890 | 98,478 |
| Kansas City Southern | 1,071 | 142,454 |
| Knight-Swift Transportation Holdings, Inc. | 1,375 | 49,913 |
| Landstar System, Inc. | 509 | 57,303 |
| Old Dominion Freight Line, Inc. | 792 | 134,616 |
| Schneider National, Inc., Class B | 630 | 13,684 |
| | | 605,190 |
| | | |
| Semiconductors & Semiconductor Equipment - 4.2% | | |
| Cabot Microelectronics Corp. | 320 | 45,187 |
| Cree, Inc. (1) | 1,034 | 50,666 |
| Cypress Semiconductor Corp. | 4,194 | 97,888 |
| Entegris, Inc. | 1,468 | 69,084 |
| First Solar, Inc. (1) | 781 | 45,306 |
| KLA Corp. | 1,799 | 286,851 |
| Lam Research Corp. | 1,420 | 328,176 |
| Marvell Technology Group Ltd. | 7,002 | 174,840 |
| Maxim Integrated Products, Inc. | 2,986 | 172,919 |
| Microchip Technology, Inc. (2) | 2,505 | 232,740 |
| MKS Instruments, Inc. | 677 | 62,474 |
| Monolithic Power Systems, Inc. | 436 | 67,855 |
| ON Semiconductor Corp. (1) | 4,029 | 77,397 |
| Qorvo, Inc. (1) | 1,244 | 92,230 |
| Silicon Laboratories, Inc. (1) | 506 | 56,343 |
| Skyworks Solutions, Inc. | 1,885 | 149,386 |
| Teradyne, Inc. | 2,214 | 128,213 |
| Universal Display Corp. | 579 | 97,214 |
| Versum Materials, Inc. | 1,512 | 80,030 |
| Xilinx, Inc. | 2,816 | 270,054 |
| | | 2,584,853 |
| | | |
www.calvert.com CALVERT US MID-CAP CORE RESPONSIBLE INDEX FUND ANNUAL REPORT 21
|
| | |
| | SHARES | VALUE ($) |
| COMMON STOCKS - CONT’D | | |
| Software - 7.0% | | |
| ACI Worldwide, Inc. (1) | 1,326 | 41,537 |
| Alteryx, Inc., Class A (1)(2) | 754 | 81,002 |
| Anaplan, Inc. (1) | 1,052 | 49,444 |
| ANSYS, Inc. (1) | 981 | 217,154 |
| Appfolio, Inc., Class A (1)(2) | 192 | 18,267 |
| Aspen Technology, Inc. (1) | 860 | 105,849 |
| Avalara, Inc. (1) | 540 | 36,337 |
| Blackbaud, Inc. | 537 | 48,513 |
| Blackline, Inc. (1) | 624 | 29,833 |
| Cadence Design Systems, Inc. (1) | 3,449 | 227,910 |
| CDK Global, Inc. | 1,255 | 60,353 |
| Ceridian HCM Holding, Inc. (1)(2) | 1,010 | 49,864 |
| Citrix Systems, Inc. | 1,548 | 149,413 |
| Cornerstone OnDemand, Inc. (1) | 697 | 38,210 |
| Coupa Software, Inc. (1) | 774 | 100,287 |
| DocuSign, Inc. (1) | 892 | 55,233 |
| Dropbox, Inc., Class A (1) | 2,149 | 43,345 |
| Elastic NV (1) | 427 | 35,159 |
| Envestnet, Inc. (1) | 606 | 34,360 |
| Fair Isaac Corp. (1) | 385 | 116,855 |
| FireEye, Inc. (1)(2) | 2,409 | 32,136 |
| Five9, Inc. (1) | 791 | 42,508 |
| Fortinet, Inc. (1) | 1,673 | 128,420 |
| Guidewire Software, Inc. (1) | 912 | 96,107 |
| HubSpot, Inc. (1) | 553 | 83,840 |
| j2 Global, Inc. (1)(2) | 560 | 50,859 |
| LogMeIn, Inc. | 589 | 41,795 |
| Manhattan Associates, Inc. (1) | 741 | 59,776 |
| New Relic, Inc. (1) | 561 | 34,473 |
| Nuance Communications, Inc. (1) | 2,953 | 48,163 |
| Nutanix, Inc., Class A (1) | 1,536 | 40,320 |
| Palo Alto Networks, Inc. (1) | 1,084 | 220,952 |
| Paycom Software, Inc. (1) | 707 | 148,109 |
| Paylocity Holding Corp. (1) | 432 | 42,155 |
| Pegasystems, Inc. | 428 | 29,125 |
| Pivotal Software, Inc., Class A (1) | 886 | 13,219 |
| Pluralsight, Inc., Class A (1)(2) | 791 | 13,285 |
| Proofpoint, Inc. (1) | 562 | 72,526 |
| PTC, Inc. (1) | 1,254 | 85,498 |
| Q2 Holdings, Inc. (1) | 548 | 43,221 |
| Qualys, Inc. (1) | 343 | 25,921 |
| RealPage, Inc. (1) | 1,043 | 65,563 |
| RingCentral, Inc., Class A (1) | 899 | 112,968 |
| Smartsheet, Inc., Class A (1) | 1,227 | 44,209 |
| SolarWinds Corp. (1)(2) | 493 | 9,096 |
| Splunk, Inc. (1) | 1,736 | 204,605 |
22 www.calvert.com CALVERT US MID-CAP CORE RESPONSIBLE INDEX FUND ANNUAL REPORT
|
| | |
| | SHARES | VALUE ($) |
| COMMON STOCKS - CONT’D | | |
| SS&C Technologies Holdings, Inc. | 2,272 | 117,167 |
| Symantec Corp. | 6,923 | 163,591 |
| Synopsys, Inc. (1) | 1,880 | 258,030 |
| Teradata Corp. (1) | 1,314 | 40,734 |
| Trade Desk, Inc. (The), Class A (1)(2) | 524 | 98,276 |
| Tyler Technologies, Inc. (1) | 437 | 114,713 |
| Verint Systems, Inc. (1) | 886 | 37,903 |
| Zendesk, Inc. (1) | 1,457 | 106,186 |
| Zscaler, Inc. (1)(2) | 1,061 | 50,143 |
| | | 4,314,517 |
| | | |
| Specialty Retail - 2.8% | | |
| Aaron’s, Inc. | 730 | 46,910 |
| Advance Auto Parts, Inc. | 713 | 117,930 |
| American Eagle Outfitters, Inc. | 1,689 | 27,396 |
| AutoNation, Inc. (1) | 628 | 31,840 |
| AutoZone, Inc. (1) | 263 | 285,255 |
| Best Buy Co., Inc. | 2,482 | 171,233 |
| Burlington Stores, Inc. (1) | 776 | 155,060 |
| CarMax, Inc. (1) | 1,792 | 157,696 |
| Dick’s Sporting Goods, Inc. (2) | 728 | 29,710 |
| Five Below, Inc. (1) | 565 | 71,247 |
| Floor & Decor Holdings, Inc., Class A (1) | 699 | 35,754 |
| Foot Locker, Inc. | 1,121 | 48,382 |
| Gap, Inc. (The) | 1,731 | 30,050 |
| L Brands, Inc. | 2,350 | 46,037 |
| Penske Automotive Group, Inc. | 337 | 15,933 |
| Tiffany & Co. (2) | 1,159 | 107,358 |
| Tractor Supply Co. | 1,400 | 126,616 |
| Ulta Beauty, Inc. (1) | 668 | 167,434 |
| Williams-Sonoma, Inc. (2) | 849 | 57,715 |
| | | 1,729,556 |
| | | |
| Technology Hardware, Storage & Peripherals - 1.3% | | |
| Hewlett Packard Enterprise Co. | 14,024 | 212,744 |
| NCR Corp. (1) | 1,206 | 38,061 |
| NetApp, Inc. | 2,477 | 130,067 |
| Pure Storage, Inc., Class A (1) | 2,451 | 41,520 |
| Seagate Technology plc | 2,844 | 152,979 |
| Western Digital Corp. | 3,019 | 180,053 |
| Xerox Holdings Corp. (1) | 2,282 | 68,255 |
| | | 823,679 |
| | | |
| Textiles, Apparel & Luxury Goods - 1.2% | | |
| Capri Holdings Ltd. (1) | 1,276 | 42,312 |
| Carter’s, Inc. | 488 | 44,511 |
| Columbia Sportswear Co. | 322 | 31,199 |
www.calvert.com CALVERT US MID-CAP CORE RESPONSIBLE INDEX FUND ANNUAL REPORT 23
|
| | |
| | SHARES | VALUE ($) |
| COMMON STOCKS - CONT’D | | |
| Deckers Outdoor Corp. (1) | 311 | 45,829 |
| Hanesbrands, Inc. (2) | 3,227 | 49,438 |
| lululemon Athletica, Inc. (1) | 1,229 | 236,619 |
| PVH Corp. | 736 | 64,937 |
| Ralph Lauren Corp. | 492 | 46,971 |
| Skechers U.S.A., Inc., Class A (1) | 1,124 | 41,981 |
| Tapestry, Inc. | 2,530 | 65,907 |
| Under Armour, Inc., Class A (1)(2) | 3,666 | 73,100 |
| | | 742,804 |
| | | |
| Thrifts & Mortgage Finance - 0.4% | | |
| Essent Group Ltd. | 978 | 46,621 |
| LendingTree, Inc. (1)(2) | 84 | 26,076 |
| MGIC Investment Corp. | 3,726 | 46,873 |
| New York Community Bancorp, Inc. | 4,656 | 58,433 |
| Radian Group, Inc. | 2,135 | 48,764 |
| TFS Financial Corp. (2) | 652 | 11,749 |
| | | 238,516 |
| | | |
| Trading Companies & Distributors - 1.1% | | |
| Air Lease Corp. | 1,480 | 61,894 |
| Fastenal Co. | 5,729 | 187,166 |
| HD Supply Holdings, Inc. (1) | 2,544 | 99,661 |
| MSC Industrial Direct Co., Inc., Class A | 599 | 43,446 |
| United Rentals, Inc. (1) | 961 | 119,779 |
| Univar Solutions, Inc. (1) | 2,059 | 42,745 |
| W.W. Grainger, Inc. | 462 | 137,283 |
| | | 691,974 |
| | | |
| Transportation Infrastructure - 0.1% | | |
| Macquarie Infrastructure Corp. | 1,032 | 40,733 |
| | | |
| Water Utilities - 0.7% | | |
| American Water Works Co., Inc. | 2,226 | 276,536 |
| Aqua America, Inc. | 3,132 | 140,408 |
| | | 416,944 |
| | | |
| Wireless Telecommunication Services - 0.1% | | |
| Telephone & Data Systems, Inc. | 1,192 | 30,753 |
| United States Cellular Corp. (1) | 139 | 5,224 |
| | | 35,977 |
| | | |
| Total Common Stocks (Cost $51,811,126) | | 61,401,951 |
| | | |
|
| | |
| | SHARES | VALUE ($) |
| SHORT TERM INVESTMENT OF CASH COLLATERAL FOR SECURITIES LOANED - 0.1% | | |
| State Street Navigator Securities Lending Government Money Market Portfolio, 2.07% | 96,169 | 96,169 |
| | | |
| Total Short Term Investment of Cash Collateral for Securities Loaned (Cost $96,169) | | 96,169 |
| | | |
| | | |
| TOTAL INVESTMENTS (Cost $51,907,295) - 99.8% | | 61,498,120 |
| Other assets and liabilities, net - 0.2% | | 108,202 |
NET ASSETS - 100.0% | | 61,606,322 |
|
|
| NOTES TO SCHEDULE OF INVESTMENTS |
| (1) Non-income producing security. |
| (2) All or a portion of this security was on loan at September 30, 2019. The aggregate market value of securities on loan at September 30, 2019 was $4,186,981. |
(3) Amount is less than 0.05%.
|
| See notes to financial statements. |
24 www.calvert.com CALVERT US MID-CAP CORE RESPONSIBLE INDEX FUND ANNUAL REPORT
www.calvert.com CALVERT US MID-CAP CORE RESPONSIBLE INDEX FUND ANNUAL REPORT 25
CALVERT US MID-CAP CORE RESPONSIBLE INDEX FUND
STATEMENT OF ASSETS AND LIABILITIES
SEPTEMBER 30, 2019
|
| | | |
| ASSETS | |
Investments in securities of unaffiliated issuers, at value (identified cost $51,907,295) - including $4,186,981 of securities on loan |
| $61,498,120 |
|
| Cash | 149,152 |
|
| Receivable for capital shares sold | 67,619 |
|
| Dividends receivable | 49,803 |
|
| Securities lending income receivable | 485 |
|
| Receivable from affiliate | 8,247 |
|
| Directors’ deferred compensation plan | 35,778 |
|
| Other assets | 2,770 |
|
| Total assets | 61,811,974 |
|
| | |
| LIABILITIES | |
| Payable for capital shares redeemed | 1,554 |
|
| Deposits for securities loaned | 96,169 |
|
| Payable to affiliates: | |
| Investment advisory fee | 5,785 |
|
| Administrative fee | 5,785 |
|
| Distribution and service fees | 2,533 |
|
| Sub-transfer agency fee | 2,847 |
|
| Directors’ deferred compensation plan | 35,778 |
|
| Accrued expenses | 55,201 |
|
| Total liabilities | 205,652 |
|
| NET ASSETS |
| $61,606,322 |
|
| | |
| NET ASSETS CONSIST OF: | |
| Paid-in capital applicable to common stock | |
| (75,000,000 shares per class of $0.01 par value authorized) |
| $52,517,272 |
|
| Distributable earnings | 9,089,050 |
|
| Total |
| $61,606,322 |
|
| | |
| NET ASSET VALUE PER SHARE | |
| Class A (based on net assets of $12,385,088 and 462,179 shares outstanding) |
| $26.80 |
|
| Class I (based on net assets of $49,221,234 and 1,820,609 shares outstanding) |
| $27.04 |
|
| | |
| OFFERING PRICE PER SHARE* | |
| Class A (100/95.25 of net asset value per share) |
| $28.14 |
|
| * On sales of $50,000 or more, the offering price of Class A shares is reduced. | |
| See notes to financial statements. |
26 www.calvert.com CALVERT US MID-CAP CORE RESPONSIBLE INDEX FUND ANNUAL REPORT
CALVERT US MID-CAP CORE RESPONSIBLE INDEX FUND
STATEMENT OF OPERATIONS
YEAR ENDED SEPTEMBER 30, 2019
|
| | | |
| INVESTMENT INCOME | |
| Dividend income (net of foreign taxes withheld of $172) |
| $866,056 |
|
| Interest income | 2,771 |
|
| Securities lending income, net | 7,321 |
|
| Total investment income | 876,148 |
|
| | |
| EXPENSES | |
| Investment advisory fee | 78,305 |
|
| Administrative fee | 71,839 |
|
| Distribution and service fees: | |
| Class A | 39,842 |
|
| Directors’ fees and expenses | 3,411 |
|
| Custodian fees | 47,737 |
|
| Transfer agency fees and expenses | 68,349 |
|
| Accounting fees | 14,234 |
|
| Professional fees | 29,735 |
|
| Registration fees | 44,466 |
|
| Reports to shareholders | 11,208 |
|
| Miscellaneous | 16,482 |
|
| Total expenses | 425,608 |
|
| Waiver and/or reimbursement of expenses by affiliate | (235,682) |
|
| Reimbursement of expenses-other | (1,535) |
|
| Net expenses | 188,391 |
|
| Net investment income | 687,757 |
|
| | |
| | |
| REALIZED AND UNREALIZED GAIN (LOSS) | |
| Net realized loss on investment securities | (105,280) |
|
| | |
| Net change in unrealized appreciation (depreciation) on investment securities | (514,228) |
|
| | |
| Net realized and unrealized loss | (619,508) |
|
| | |
| Net increase in net assets resulting from operations |
| $68,249 |
|
| See notes to financial statements. |
www.calvert.com CALVERT US MID-CAP CORE RESPONSIBLE INDEX FUND ANNUAL REPORT 27
CALVERT US MID-CAP CORE RESPONSIBLE INDEX FUND
STATEMENTS OF CHANGES IN NET ASSETS
|
| | | | | | | |
| INCREASE (DECREASE) IN NET ASSETS | Year Ended September 30, 2019 | | Year Ended September 30, 2018 |
| Operations: | | | |
| Net investment income |
| $687,757 |
| |
| $716,653 |
|
| Net realized gain (loss) | (105,280) |
| | 1,116,426 |
|
| Net change in unrealized appreciation (depreciation) | (514,228) |
| | 6,344,024 |
|
| Net increase in net assets resulting from operations | 68,249 |
| | 8,177,103 |
|
| | | | |
| Distributions to shareholders: | | | |
| Class A shares | (548,723) |
| | (444,241) |
|
| Class I shares | (1,261,327) |
| | (1,070,731) |
|
| Total distributions to shareholders | (1,810,050) |
| | (1,514,972) |
|
| | | | |
| Capital share transactions: | | | |
| Class A shares | (9,305,867) |
| | 6,224,013 |
|
Class C shares (1) | — |
| | (841,689) |
|
| Class I shares | 3,266,862 |
| | 21,669,312 |
|
Class Y shares (1) | — |
| | (10,333,261) |
|
| Net increase (decrease) in net assets from capital share transactions | (6,039,005) |
| | 16,718,375 |
|
| | | | |
| TOTAL INCREASE (DECREASE) IN NET ASSETS | (7,780,806) |
| | 23,380,506 |
|
| | | | |
| | | | |
| NET ASSETS | | | |
| Beginning of year | 69,387,128 |
| | 46,006,622 |
|
| End of year |
| $61,606,322 |
| |
| $69,387,128 |
|
| | | | |
| | | | |
(1) Effective December 8, 2017, Class C shares of the Fund converted to Class A shares and Class Y shares converted to Class I shares at net asset value. Thereafter, Class C shares and Class Y shares were terminated. |
| See notes to financial statements. |
28 www.calvert.com CALVERT US MID-CAP CORE RESPONSIBLE INDEX FUND ANNUAL REPORT
CALVERT US MID-CAP CORE RESPONSIBLE INDEX FUND
FINANCIAL HIGHLIGHTS
|
| | | | | | | | | | | | |
| | Year Ended September 30, | | Period Ended September 30, | |
| CLASS A SHARES | 2019 | | 2018 | | 2017 | | 2016 (1) | |
| Net asset value, beginning | $27.23 | | $24.44 | | $21.25 | | $20.00 | |
| Income from investment operations: | | | | | | | | |
Net investment income (2) | 0.24 |
| | 0.25 |
| | 0.38 |
| | 0.23 |
| |
| Net realized and unrealized gain (loss) | (0.02) |
| | 3.25 |
| | 3.22 |
| | 1.08 |
| |
| Total from investment operations | 0.22 |
| | 3.50 |
| | 3.60 |
| | 1.31 |
| |
| Distributions from: | | | | | | | | |
| Net investment income | (0.24) |
| | (0.24) |
| | (0.16) |
| | (0.06) |
| |
| Net realized gain | (0.41) |
| | (0.47) |
| | (0.25) |
| | — |
| |
| Total distributions | (0.65) |
| | (0.71) |
| | (0.41) |
| | (0.06) |
| |
| Total increase (decrease) in net asset value | (0.43) |
| | 2.79 |
| | 3.19 |
| | 1.25 |
| |
| Net asset value, ending | $26.80 | | $27.23 | | $24.44 | | $21.25 | |
Total return (3) | 1.05 | % | | 14.55 | % | | 17.12 | % | | 6.55 | % | (4) |
Ratios to average net assets: (5) | | | | | | | | |
| Total expenses | 0.90 | % | | 0.94 | % | | 1.53 | % | | 3.20 | % | (6) |
| Net expenses | 0.53 | % | | 0.57 | % | | 0.57 | % | | 0.57 | % | (6) |
| Net investment income | 0.93 | % | | 0.95 | % | | 1.64 | % | | 1.26 | % | (6) |
| Portfolio turnover | 57 | % | | 39 | % | | 63 | % | | 42 | % | (4) |
| Net assets, ending (in thousands) | $12,385 | | $22,575 | | $14,339 | | $5,442 | |
| | | | | | | | | |
(1) From October 30, 2015 inception. |
(2) Computed using average shares outstanding. |
(3) Returns are historical and are calculated by determining the percentage change in net asset value with all distributions reinvested and do not reflect the effect of sales charges, if any. |
(4) Not annualized. |
(5) Total expenses do not reflect amounts reimbursed and/or waived by the adviser and certain of its affiliates, if applicable. Net expenses are net of all reductions and represent the net expenses paid by the Fund. |
(6) Annualized. |
| See notes to financial statements. |
www.calvert.com CALVERT US MID-CAP CORE RESPONSIBLE INDEX FUND ANNUAL REPORT 29
CALVERT US MID-CAP CORE RESPONSIBLE INDEX FUND
FINANCIAL HIGHLIGHTS
|
| | | | | | | | | | | | |
| | Year Ended September 30, | | Period Ended September 30, | |
| CLASS I SHARES | 2019 | | 2018 | | 2017 | | 2016 (1) | |
| Net asset value, beginning | $27.45 | | $24.56 | | $21.31 | | $20.00 | |
| Income from investment operations: | | | | | | | | |
Net investment income (2) | 0.32 |
| | 0.34 |
| | 0.52 |
| | 0.29 |
| |
| Net realized and unrealized gain (loss) | (0.02) |
| | 3.27 |
| | 3.17 |
| | 1.09 |
| |
| Total from investment operations | 0.30 |
| | 3.61 |
| | 3.69 |
| | 1.38 |
| |
| Distributions from: | | | | | | | | |
| Net investment income | (0.30) |
| | (0.25) |
| | (0.19) |
| | (0.07) |
| |
| Net realized gain | (0.41) |
| | (0.47) |
| | (0.25) |
| | — |
| |
| Total distributions | (0.71) |
| | (0.72) |
| | (0.44) |
| | (0.07) |
| |
| Total increase (decrease) in net asset value | (0.41) |
| | 2.89 |
| | 3.25 |
| | 1.31 |
| |
| Net asset value, ending | $27.04 | | $27.45 | | $24.56 | | $21.31 | |
Total return (3) | 1.30 | % | | 14.96 | % | | 17.50 | % | | 6.91 | % | (4) |
Ratios to average net assets: (5) | | | | | | | | |
| Total expenses | 0.64 | % | | 0.69 | % | | 0.87 | % | | 2.72 | % | (6) |
| Net expenses | 0.24 | % | | 0.22 | % | | 0.22 | % | | 0.22 | % | (6) |
| Net investment income | 1.23 | % | | 1.31 | % | | 2.21 | % | | 1.62 | % | (6) |
| Portfolio turnover | 57 | % | | 39 | % | | 63 | % | | 42 | % | (4) |
| Net assets, ending (in thousands) | $49,221 | | $46,812 | | $21,075 | | $4,791 | |
| | | | | | | | | |
(1) From October 30, 2015 inception. |
(2) Computed using average shares outstanding. |
(3) Returns are historical and are calculated by determining the percentage change in net asset value with all distributions reinvested and do not reflect the effect of sales charges, if any. |
(4) Not annualized. |
(5) Total expenses do not reflect amounts reimbursed and/or waived by the adviser and certain of its affiliates, if applicable. Net expenses are net of all reductions and represent the net expenses paid by the Fund. |
(6) Annualized. |
| See notes to financial statements. |
30 www.calvert.com CALVERT US MID-CAP CORE RESPONSIBLE INDEX FUND ANNUAL REPORT
NOTES TO FINANCIAL STATEMENTS
NOTE 1 — SIGNIFICANT ACCOUNTING POLICIES
Calvert US Mid-Cap Core Responsible Index Fund (the Fund) is a diversified series of Calvert Responsible Index Series, Inc. (the Corporation). The Corporation is a Maryland corporation registered under the Investment Company Act of 1940, as amended (the 1940 Act), as an open-end management investment company. The investment objective of the Fund is to seek to track the performance of the Calvert US Mid-Cap Core Responsible Index, which measures the investment return of mid-capitalization stocks.
The Fund offers two classes of shares. Class A shares are generally sold subject to a sales charge imposed at time of purchase. A contingent deferred sales charge of 0.25% may apply to certain redemptions of Class A shares for accounts for which no sales charge was paid, if redeemed within 12 months of purchase. Class I shares are sold at net asset value, are not subject to a sales charge and are sold only to certain eligible investors. Each class represents a pro rata interest in the Fund, but votes separately on class-specific matters and is subject to different expenses.
The Fund applies the accounting and reporting guidance in the Financial Accounting Standards Board (FASB) Accounting Standards Codification Topic 946, Financial Services – Investment Companies (ASC 946). Subsequent events, if any, through the date that the financial statements were issued have been evaluated in the preparation of the financial statements.
A. Investment Valuation: Net asset value per share is determined every business day as of the close of the regular session of the New York Stock Exchange (generally 4:00 p.m. Eastern time). The Fund uses independent pricing services approved by the Board of Directors (the Board) to value its investments wherever possible. Investments for which market quotations are not available or deemed not reliable are fair valued in good faith under the direction of the Board.
U.S. generally accepted accounting principles (U.S. GAAP) establishes a disclosure hierarchy that categorizes the inputs to valuation techniques used to value assets and liabilities at measurement date. These inputs are summarized in the three broad levels listed below:
Level 1 - quoted prices in active markets for identical securities
Level 2 - other significant observable inputs (including quoted prices for similar securities, interest rates, prepayment speeds, credit risk, etc.)
Level 3 - significant unobservable inputs (including the Fund’s own assumptions in determining the fair value of investments)
The inputs or methodologies used for valuing securities are not necessarily an indication of the risk associated with investing in those securities.
Valuation techniques used to value the Fund’s investments by major category are as follows:
Equity Securities. Equity securities (including warrants and rights) listed on a U.S. securities exchange generally are valued at the last sale or closing price as reported by an independent pricing service on the primary market or exchange on which they are traded and are categorized as Level 1 in the hierarchy. Equity securities listed on the NASDAQ Global or Global Select Market are valued at the NASDAQ official closing price and are categorized as Level 1 in the hierarchy. Unlisted or listed securities for which closing sales prices or closing quotations are not available are valued at the mean between the latest available bid and ask prices and are categorized as Level 2 in the hierarchy.
Other Securities. Investments in registered investment companies (including money market funds) that do not trade on an exchange are valued at the net asset value per share on the valuation day and are categorized as Level 1 in the hierarchy.
Fair Valuation. If a market value cannot be determined for a security using the methodologies described above, or if, in the good faith opinion of the Fund’s adviser, the market value does not constitute a readily available market quotation, or if a significant event has occurred that would materially affect the value of the security, the security will be fair valued as determined in good faith by or at the direction of the Board in a manner that most fairly reflects the security’s “fair value”, which is the amount that the Fund might reasonably expect to receive for the security upon its current sale in the ordinary course. Each such determination is based on a consideration of relevant factors, which are likely to vary from one pricing context to another. These factors may include, but are not limited to, the type of security, the existence of any contractual restrictions on the security’s disposition, the price and extent of public trading in similar securities of the issuer or of comparable companies or entities, quotations or relevant information obtained from broker/dealers or other market participants, information obtained from the issuer, analysts, and/or the appropriate stock exchange (for exchange-traded securities), an analysis of the company’s or entity’s financial statements, and an evaluation of the forces that influence the issuer and the market(s) in which the security is purchased and sold.
www.calvert.com CALVERT US MID-CAP CORE RESPONSIBLE INDEX FUND ANNUAL REPORT 31
The values assigned to fair value investments are based on available information and do not necessarily represent amounts that might ultimately be realized. Further, due to the inherent uncertainty of valuations of such investments, the fair values may differ significantly from the values that would have been used had an active market existed, and the differences could be material.
The following table summarizes the market value of the Fund’s holdings as of September 30, 2019, based on the inputs used to value them:
|
| | | | | | | | | | | | | |
| Assets | Level 1 | | Level 2 | Level 3 | Total |
| Common Stocks | $ | 61,401,951 |
| (1) | $ | — |
| $ | — |
| $ | 61,401,951 |
|
| Short Term Investment of Cash Collateral for Securities Loaned | 96,169 |
| | — |
| — |
| 96,169 |
|
| Total Investments | $ | 61,498,120 |
| | $ | — |
| $ | — |
| $ | 61,498,120 |
|
| | | | | | |
(1) The level classification by major category of investments is the same as the category presentation in the Schedule of Investments. |
B. Investment Transactions and Income: Investment transactions for financial statement purposes are accounted for on trade date. Realized gains and losses are recorded on an identified cost basis and may include proceeds from litigation. Dividend income is recorded on the ex-dividend date for dividends received in cash and/or securities or, in the case of dividends on certain foreign securities, as soon as the Fund is informed of the ex-dividend date. Non-cash dividends are recorded at the fair value of the securities received. Withholding taxes on foreign dividends, if any, have been provided for in accordance with the Fund’s understanding of the applicable country’s tax rules and rates. Distributions received that represent a return of capital are recorded as a reduction of cost of investments. Distributions received that represent a capital gain are recorded as a realized gain. Interest income is accrued as earned.
C. Share Class Accounting: Realized and unrealized gains and losses and net investment income and losses, other than class-specific expenses, are allocated daily to each class of shares based upon the relative net assets of each class to the total net assets of the Fund. Expenses arising in connection with a specific class are charged directly to that class.
D. Distributions to Shareholders: Distributions to shareholders are recorded by the Fund on ex-dividend date. Dividends from net investment income and distributions from net realized capital gains, if any, are paid at least annually. Distributions are determined in accordance with income tax regulations which may differ from U.S. GAAP; accordingly, periodic reclassifications are made within the Fund’s capital accounts to reflect income and gains available for distribution under income tax regulations.
E. Estimates: The preparation of financial statements in conformity with U.S. GAAP requires management to make estimates and assumptions that affect the reported amounts of assets and liabilities and disclosure of contingent assets and liabilities at the date of the financial statements and the reported amounts of increases and decreases in net assets from operations during the reporting period. Actual results could differ from those estimates.
F. Indemnifications: The Corporation’s By-Laws provide for indemnification for Directors or officers of the Corporation and certain other parties, to the fullest extent permitted by Maryland law and the 1940 Act, provided certain conditions are met. Additionally, in the normal course of business, the Fund enters into agreements with service providers that may contain indemnification clauses. The Fund’s maximum exposure under these arrangements is unknown as this would involve future claims that may be made against the Fund that have not yet occurred.
G. Federal Income Taxes: No provision for federal income or excise tax is required since the Fund intends to continue to qualify as a regulated investment company under the Internal Revenue Code and to distribute substantially all of its taxable earnings.
Management has analyzed the Fund’s tax positions taken for all open federal income tax years and has concluded that no provision for federal income tax is required in the Fund’s financial statements. A Fund’s federal tax return is subject to examination by the Internal Revenue Service for a period of three years from the date of filing.
NOTE 2 — RELATED PARTY TRANSACTIONS
The investment advisory fee is earned by Calvert Research and Management (CRM), a subsidiary of Eaton Vance Management (EVM), as compensation for investment advisory services rendered to the Fund. Pursuant to the investment advisory agreement, CRM receives a fee, payable monthly, at the annual rate of 0.12% (0.15% prior to February 1, 2019) of the Fund’s average daily net assets. For the year ended September 30, 2019, the investment advisory fee amounted to $78,305.
CRM has agreed to reimburse the Fund’s operating expenses to the extent that total annual operating expenses (relating to ordinary operating expenses only and excluding expenses such as brokerage commissions, acquired fund fees and expenses of unaffiliated funds, interest expense, taxes or litigation expenses) exceed 0.49% and 0.24% (0.57% and 0.22% prior to February 1, 2019) for Class A and Class I, respectively, of such class’ average daily net assets. The expense reimbursement agreement with
32 www.calvert.com CALVERT US MID-CAP CORE RESPONSIBLE INDEX FUND ANNUAL REPORT
CRM may be changed or terminated after January 31, 2020. For the year ended September 30, 2019, CRM waived or reimbursed expenses of $235,682.
The administrative fee is earned by CRM as compensation for administrative services rendered to the Fund. The fee is computed at an annual rate of 0.12% of each Fund’s average daily net assets attributable to Class A and Class I and is payable monthly. For the year ended September 30, 2019, CRM was paid administrative fees of $71,839.
The Fund has in effect a distribution plan for Class A shares (Class A Plan) pursuant to Rule 12b-1 under the 1940 Act. Pursuant to the Class A Plan, the Fund pays Eaton Vance Distributors, Inc. (EVD), an affiliate of CRM and the Fund’s principal underwriter, a distribution and service fee of 0.25% per annum of its average daily net assets attributable to Class A shares for distribution services and facilities provided to the Fund by EVD, as well as for personal services and/or the maintenance of shareholder accounts. Distribution and service fees paid or accrued for the year ended September 30, 2019 amounted to $39,842 for Class A shares.
The Fund was informed that EVD received $5,935 as its portion of the sales charge on sales of Class A shares and less than $100 of contingent deferred sales charges paid by Fund shareholders for the year ended September 30, 2019.
EVM provides sub-transfer agency and related services to the Fund pursuant to a Sub-Transfer Agency Support Services Agreement. For the year ended September 30, 2019, sub-transfer agency fees and expenses incurred to EVM amounted to $11,835 and are included in transfer agency fees and expenses on the Statement of Operations.
Each Director of the Fund who is not an employee of CRM or its affiliates receives a fee of $3,000 for each Board meeting attended in person and $2,000 for each Board meeting attended by phone plus an annual fee of $117,000, and $1,500 for each Committee meeting attended in person and $1,000 for each Committee meeting attended by phone plus an annual Committee fee of $2,500. The Board chair receives an additional $15,000 annual retainer and Committee chairs receive an additional $6,000 annual retainer. Eligible Directors may participate in a Deferred Compensation Plan (the Plan). Amounts deferred under the Plan are treated as though equal dollar amounts had been invested in shares of the Fund or other Calvert funds selected by the Directors. The Fund purchases shares of the funds selected equal to the dollar amounts deferred under the Plan, resulting in an asset equal to the deferred compensation liability. Obligations of the Plan are paid solely from the Fund’s assets. Directors’ fees are allocated to each of the Calvert funds served. Salaries and fees of officers and Directors of the Fund who are employees of CRM or its affiliates are paid by CRM. In addition, an advisory council was established to aid the Board and CRM in advancing the cause of responsible investing through original scholarship and thought leadership. The advisory council consists of CRM’s Chief Executive Officer and four additional members. Each member (other than CRM’s Chief Executive Officer) receives annual compensation of $75,000, which is being reimbursed by Calvert Investment Management, Inc. (CIM), the Calvert funds’ former investment adviser and Ameritas Holding Company, CIM’s parent company, through the end of 2019. For the year ended September 30, 2019, the Fund’s allocated portion of such expense and reimbursement was $1,535, which are included in miscellaneous expense and reimbursement of expenses-other, respectively, on the Statement of Operations.
NOTE 3 — INVESTMENT ACTIVITY
During the year ended September 30, 2019, the cost of purchases and proceeds from sales of investments, other than short-term securities, were $34,223,643 and $41,387,612, respectively.
NOTE 4 — DISTRIBUTIONS TO SHAREHOLDERS AND INCOME TAX INFORMATION
The tax character of distributions declared for the years ended September 30, 2019 and September 30, 2018 was as follows:
|
| | | | | | |
| | Year Ended
September 30, |
| | 2019 | 2018 |
| Ordinary income |
| $943,782 |
|
| $1,085,075 |
|
| Long-term capital gains |
| $866,268 |
|
| $429,897 |
|
During the year ended September 30, 2019, distributable earnings was decreased by $196,371 and paid-in capital was increased by $196,371 due to the Fund’s use of equalization accounting. Tax equalization accounting allows the Fund to treat as a distribution that portion of redemption proceeds representing a redeeming shareholder’s portion of undistributed taxable income and net capital gains. These reclassifications had no effect on the net assets or net asset value per share of the Fund.
www.calvert.com CALVERT US MID-CAP CORE RESPONSIBLE INDEX FUND ANNUAL REPORT 33
As of September 30, 2019, the components of distributable earnings (accumulated loss) on a tax basis were as follows:
|
| | | |
| Undistributed ordinary income |
| $407,702 |
|
| Undistributed long-term capital gains |
| $597,691 |
|
| Net unrealized appreciation (depreciation) |
| $8,083,657 |
|
The cost and unrealized appreciation (depreciation) of investments of the Fund at September 30, 2019, as determined on a federal income tax basis, were as follows:
|
| | | |
| Aggregate cost |
| $53,414,463 |
|
| Gross unrealized appreciation |
| $10,070,821 |
|
| Gross unrealized depreciation | (1,987,164) |
|
| Net unrealized appreciation (depreciation) |
| $8,083,657 |
|
NOTE 5 — SECURITIES LENDING
To generate additional income, the Fund may lend its securities pursuant to a securities lending agency agreement with State Street Bank and Trust Company (SSBT), the securities lending agent. Security loans are subject to termination by the Fund at any time and, therefore, are not considered illiquid investments. The Fund requires that the loan be continuously collateralized by either cash or securities as collateral equal at all times to at least 102% of the market value of the domestic securities loaned and 105% of the market value of the international securities loaned (if applicable). The market value of securities loaned is determined daily and any additional required collateral is delivered to the Fund on the next business day. Cash collateral is generally invested in a money market fund registered under the 1940 Act that is managed by an affiliate of SSBT. Any gain or loss in the market price of the loaned securities that might occur and any interest earned or dividends declared during the term of the loan would accrue to the account of the Fund. Income earned on the investment of collateral, net of broker rebates and other expenses incurred by the securities lending agent, is split between the Fund and the securities lending agent on the basis of agreed upon contractual terms. Non-cash collateral, if any, is held by the lending agent on behalf of the Fund and cannot be sold or re-pledged by the Fund; accordingly, such collateral is not reflected in the Statement of Assets and Liabilities.
The risks associated with lending portfolio securities include, but are not limited to, possible delays in receiving additional collateral or in the recovery of the loaned securities, possible loss of rights to the collateral should the borrower fail financially, as well as risk of loss in the value of the collateral or the value of the investments made with the collateral. The securities lending agent shall indemnify the Fund in the case of default of any securities borrower.
At September 30, 2019, the total value of securities on loan was $4,186,981 and the total value of collateral received was $4,257,343, comprised of cash of $96,169 and U.S. government and/or agencies securities of $4,161,174.
The following table provides a breakdown of securities lending transactions accounted for as secured borrowings, the obligations by class of collateral pledged, and the remaining contractual maturity of those transactions as of September 30, 2019.
|
| | | | | | | | | | | | | | | |
| | Remaining Contractual Maturity of the Transactions |
| | Overnight and Continuous | <30 days | 30 to 90 days | >90 days | Total |
| Securities Lending Transactions | | | | | |
| Common Stocks |
| $4,257,343 |
|
| $— |
|
| $— |
|
| $— |
|
| $4,257,343 |
|
The carrying amount of the liability for deposits for securities loaned at September 30, 2019 approximated its fair value. If measured at fair value, such liability would have been considered as Level 2 in the fair value hierarchy (see Note 1A) at September 30, 2019.
NOTE 6 — LINE OF CREDIT
The Fund participates with other funds managed by CRM in a $100 million ($62.5 million prior to June 21, 2019) committed unsecured line of credit agreement with SSBT, which is in effect through June 19, 2020. Borrowings may be made for temporary or emergency purposes only. Borrowings bear interest at the higher of the One-Month London Interbank Offered Rate (LIBOR) in effect that day or the overnight Federal Funds Rate, plus 1.00% per annum. A commitment fee of 0.20% per annum is incurred on the unused portion of the committed facility. An administrative fee of $37,500 was incurred in connection with the increase of the facility in June 2019. These fees are allocated to all participating funds. Because the line of credit is not available exclusively to the Fund, it may be unable to borrow some or all of its requested amounts at any particular time. The Fund had no borrowings
34 www.calvert.com CALVERT US MID-CAP CORE RESPONSIBLE INDEX FUND ANNUAL REPORT
outstanding pursuant to this line of credit at September 30, 2019. The Fund did not have any significant borrowings or allocated fees during the year ended September 30, 2019.
Effective at the close of business on October 28, 2019, the Fund and other participating funds managed by CRM terminated the line of credit agreement. Effective October 29, 2019, the Fund participates with other funds managed by EVM and its affiliates, including CRM, in an $800 million unsecured line of credit agreement with a syndicate of banks, which is in effect through October 27, 2020, at terms that are more favorable than the terminated agreement.
NOTE 7 — CAPITAL SHARES
Transactions in capital shares for the years ended September 30, 2019 and September 30, 2018 were as follows:
|
| | | | | | | | | | | |
| | Year Ended
September 30, 2019 | | Year Ended
September 30, 2018 |
| | Shares | Amount | | Shares | Amount |
| Class A | | | | | |
| Shares sold | 212,360 |
|
| $5,411,584 |
| | 332,234 |
|
| $8,552,502 |
|
| Reinvestment of distributions | 21,810 |
| 537,820 |
| | 16,986 |
| 427,720 |
|
| Shares redeemed | (601,154 | ) | (15,255,271 | ) | | (137,039 | ) | (3,535,876 | ) |
| Converted from Class C | — |
| — |
| | 30,328 |
| 779,667 |
|
| Net increase (decrease) | (366,984 | ) |
| ($9,305,867 | ) | | 242,509 |
|
| $6,224,013 |
|
| | | | | | |
Class C (1) | | | | | |
| Shares sold | — |
|
| $— |
| | 1,595 |
|
| $39,353 |
|
| Shares redeemed | — |
| — |
| | (4,037 | ) | (101,375 | ) |
| Converted to Class A | — |
| — |
| | (30,699 | ) | (779,667 | ) |
| Net decrease | — |
|
| $— |
| | (33,141 | ) |
| ($841,689 | ) |
| | | | | | |
| Class I | | | | | |
| Shares sold | 1,074,807 |
|
| $27,546,107 |
| | 611,183 |
|
| $15,672,923 |
|
| Reinvestment of distributions | 47,929 |
| 1,189,603 |
| | 41,505 |
| 1,050,499 |
|
| Shares redeemed | (1,007,725 | ) | (25,468,848 | ) | | (240,884 | ) | (6,319,084 | ) |
| Converted from Class Y | — |
| — |
| | 435,772 |
| 11,264,974 |
|
| Net increase | 115,011 |
|
| $3,266,862 |
| | 847,576 |
|
| $21,669,312 |
|
| | | | | | |
Class Y (1) | | | | | |
| Shares sold | — |
|
| $— |
| | 41,621 |
|
| $1,034,568 |
|
| Shares redeemed | — |
| — |
| | (4,148 | ) | (102,855 | ) |
| Converted to Class I | — |
| — |
| | (438,307 | ) | (11,264,974 | ) |
| Net decrease | — |
|
| $— |
| | (400,834 | ) |
| ($10,333,261 | ) |
| | | | | | |
(1) Effective December 8, 2017, Class C shares of the Fund converted to Class A shares and Class Y shares converted to Class I shares at net asset value. Thereafter, Class C shares and Class Y shares were terminated. |
www.calvert.com CALVERT US MID-CAP CORE RESPONSIBLE INDEX FUND ANNUAL REPORT 35
REPORT OF INDEPENDENT REGISTERED PUBLIC ACCOUNTING FIRM
To the Shareholders and Board of Directors
Calvert Responsible Index Series, Inc.:
Opinion on the Financial Statements
We have audited the accompanying statement of assets and liabilities of Calvert US Mid-Cap Core Responsible Index Fund (the Fund), a series of Calvert Responsible Index Series, Inc., including the schedule of investments, as of September 30, 2019, the related statement of operations for the year then ended, the statements of changes in net assets for each of the years in the two‑year period then ended, and the related notes (collectively, the financial statements) and the financial highlights for each of the years or periods in the four‑year period then ended. In our opinion, the financial statements and financial highlights present fairly, in all material respects, the financial position of the Fund as of September 30, 2019, the results of its operations for the year then ended, the changes in its net assets for each of the years in the two‑year period then ended, and the financial highlights for each of the years or periods in the four‑year period then ended, in conformity with U.S. generally accepted accounting principles.
Basis for Opinion
These financial statements and financial highlights are the responsibility of the Fund’s management. Our responsibility is to express an opinion on these financial statements and financial highlights based on our audits. We are a public accounting firm registered with the Public Company Accounting Oversight Board (United States) (PCAOB) and are required to be independent with respect to the Fund in accordance with the U.S. federal securities laws and the applicable rules and regulations of the Securities and Exchange Commission and the PCAOB.
We conducted our audits in accordance with the standards of the PCAOB. Those standards require that we plan and perform the audit to obtain reasonable assurance about whether the financial statements and financial highlights are free of material misstatement, whether due to error or fraud. Our audits included performing procedures to assess the risks of material misstatement of the financial statements and financial highlights, whether due to error or fraud, and performing procedures that respond to those risks. Such procedures included examining, on a test basis, evidence regarding the amounts and disclosures in the financial statements and financial highlights. Such procedures also included confirmation of securities owned as of September 30, 2019, by correspondence with the custodian or brokers. Our audits also included evaluating the accounting principles used and significant estimates made by management, as well as evaluating the overall presentation of the financial statements and financial highlights. We believe that our audits provide a reasonable basis for our opinion.
We have served as the auditor of one or more of the Calvert Funds since 2002.
Philadelphia, Pennsylvania
November 20, 2019
36 www.calvert.com CALVERT US MID-CAP CORE RESPONSIBLE INDEX FUND ANNUAL REPORT
FEDERAL TAX INFORMATION
The Form 1099-DIV you receive in February 2020 will show the tax status of all distributions paid to your account in calendar year 2019. Shareholders are advised to consult their own tax adviser with respect to the tax consequences of their investment in the Fund. As required by the Internal Revenue Code and/or regulations, shareholders must be notified regarding the status of qualified dividend income for individuals, the dividends received deduction for corporations and capital gains dividends.
Qualified Dividend Income. For the fiscal year ended September 30, 2019, the Fund designates approximately $785,946, or up to the maximum amount of such dividends allowable pursuant to the Internal Revenue Code, as qualified dividend income eligible for the reduced tax rate of 15%.
Dividends Received Deduction. Corporate shareholders are generally entitled to take the dividends received deduction on the portion of the Fund’s dividend distribution that qualifies under tax law. For the Fund’s fiscal 2019 ordinary income dividends, 82.83% qualifies for the corporate dividends received deduction.
Capital Gains Dividends. The Fund hereby designates as a capital gain dividend with respect to the taxable year ended September 30, 2019, $714,386 or, if subsequently determined to be different, the net capital gain of such year.
www.calvert.com CALVERT US MID-CAP CORE RESPONSIBLE INDEX FUND ANNUAL REPORT (Unaudited) 37
MANAGEMENT AND ORGANIZATION
Fund Management. The Directors of Calvert Responsible Index Series, Inc. (the Corporation) are responsible for the overall management and supervision of the Corporation’s affairs. The Directors and officers of the Corporation are listed below. Except as indicated, each individual has held the office shown or other offices in the same company for the last five years. Directors and officers of the Corporation hold indefinite terms of office. The “Independent Directors” consist of those Directors who are not “interested persons” of the Corporation, as that term is defined under the 1940 Act. The business address of each Director and officer, with the exception of Ms. Gemma and Mr. Kirchner, is 1825 Connecticut Avenue NW, Suite 400, Washington, DC 20009. As used below, “CRM” refers to Calvert Research and Management. Each Director oversees 39 funds in the Calvert fund complex. Each officer serves as an officer of certain other Calvert funds.
|
| | | |
| Name and Year of Birth |
Corporation Position(s) | Position
Start Date | Principal Occupation(s) and Other Directorships
During Past Five Years and Other Relevant Experience |
| | | | |
| Interested Director | | | |
John H. Streur(1)
1960 | Director & President | 2015 | President and Chief Executive Officer of Calvert Research and Management (since December 31, 2016). President and Chief Executive Officer of Calvert Investments, Inc. (January 2015 - December 2016); Chief Executive Officer of Calvert Investment Distributors, Inc. (August 2015 - December 2016); Chief Compliance Officer of Calvert Investment Management, Inc. (August 2015 - April 2016); President and Director, Portfolio 21 Investments, Inc. (through October 2014); President, Chief Executive Officer and Director, Managers Investment Group LLC (through January 2012); President and Director, The Managers Funds and Managers AMG Funds (through January 2012). Other Directorships in the Last Five Years. Portfolio 21 Investments, Inc. (asset management) (through October 2014); Managers Investment Group LLC (asset management) (through January 2012); The Managers Funds (asset management) (through January 2012); Managers AMG Funds (asset management) (through January 2012); Calvert Impact Capital, Inc. |
| Independent Directors | | | |
Richard L. Baird, Jr.
1948 | Director | 2000 | Regional Disaster Recovery Lead, American Red Cross of Greater Pennsylvania (since 2017). Volunteer, American Red Cross (since 2015). Former President and CEO of Adagio Health Inc. (retired in 2014) in Pittsburgh, PA. Other Directorships in the Last Five Years. None. |
Alice Gresham Bullock
1950 | Chair & Director | 2016 | Professor Emerita at Howard University School of Law. Dean Emerita of Howard University School of Law and Deputy Director of the Association of American Law Schools (1992-1994). Other Directorships in the Last Five Years. None. |
Cari M. Dominguez
1949 | Director | 2016 | Former Chair of the U.S. Equal Employment Opportunity Commission. Other Directorships in the Last Five Years. Manpower, Inc. (employment agency); Triple S Management Corporation (managed care); National Association of Corporate Directors. |
John G. Guffey, Jr.(2)
1948 | Director | 2000 | President of Aurora Press Inc., a privately held publisher of trade paperbacks (since January 1997). Other Directorships in the Last Five Years. Calvert Impact Capital, Inc. (through December 31, 2018); Calvert Ventures, LLC. |
Miles D. Harper, III
1962 | Director | 2005 | Partner, Carr Riggs & Ingram (public accounting firm) since October 2014. Partner, Gainer Donnelly & Desroches (public accounting firm) (now Carr Riggs & Ingram), November 1999 - September 2014). Other Directorships in the Last Five Years. Bridgeway Funds (9) (asset management). |
Joy V. Jones
1950 | Director | 2000 | Attorney. Other Directorships in the Last Five Years. Conduit Street Restaurants SUD 2 Limited; Palm Management Restaurant Corporation. |
Anthony A. Williams
1951 | Director | 2016 | CEO and Executive Director of the Federal City Council (July 2012 to present); Senior Adviser and Independent Consultant for McKenna Long & Aldridge LLP (September 2011 to present); Executive Director of Global Government Practice at the Corporate Executive Board (January 2010 to January 2012). Other Directorships in the Last Five Years. Freddie Mac; Evoq Properties/ Meruelo Maddux Properties, Inc. (real estate management); Weston Solutions, Inc. (environmental services); Bipartisan Policy Center’s Debt Reduction Task Force; Chesapeake Bay Foundation; Catholic University of America; Urban Institute (research organization). |
38 www.calvert.com CALVERT US MID-CAP CORE RESPONSIBLE INDEX FUND ANNUAL REPORT (Unaudited)
|
| | | |
| Principal Officers who are not Directors | |
Name and
Year of Birth | Corporation Position(s) | Position Start Date | Principal Occupation(s)
During Past Five Years |
| | | | |
Hope L. Brown
1973 | Chief Compliance Officer | 2014 | Chief Compliance Officer of 39 registered investment companies advised by CRM (since 2014). Vice President and Chief Compliance Officer, Wilmington Funds (2012-2014). |
Maureen A. Gemma(3)
1960 | Secretary, Vice President and Chief Legal Officer | 2016 | Vice President of CRM and officer of 39 registered investment companies advised by CRM (since 2016). Also Vice President of Eaton Vance and certain of its affiliates and officer of 162 registered investment companies advised or administered by Eaton Vance. |
James F. Kirchner(3)
1967 | Treasurer | 2016 | Vice President of CRM and officer of 39 registered investment companies advised by CRM (since 2016). Also Vice President of Eaton Vance and certain of its affiliates and officer of 162 registered investment companies advised or administered by Eaton Vance. |
| | | | |
| |
(1) | Mr. Streur is an interested person of the Fund because of his positions with the Fund’s adviser and certain affiliates. |
| |
(2) | Mr. Guffey is currently married to Rebecca L. Adamson, who serves as a member of the Advisory Council. |
| |
(3) | The business address for Ms. Gemma and Mr. Kirchner is Two International Place, Boston, MA 02110. |
The SAI for the Fund includes additional information about the Directors and officers of the Fund and can be obtained without charge on Calvert’s website at www.calvert.com or by calling 1-800-368-2745.
www.calvert.com CALVERT US MID-CAP CORE RESPONSIBLE INDEX FUND ANNUAL REPORT (Unaudited) 39
IMPORTANT NOTICES
Privacy. The Calvert Funds and Calvert Research and Management are committed to ensuring your financial privacy. Each of the financial institutions identified below has in effect the following policy (“Privacy Policy”) with respect to nonpublic personal information about its customers:
| |
| • | Only such information received from you, through application forms or otherwise, and information about your Calvert fund transactions will be collected. This may include information such as name, address, social security number, tax status, account balances and transactions. |
| |
| • | None of such information about you (or former customers) will be disclosed to anyone, except as permitted by law (which includes disclosure to employees necessary to service your account). In the normal course of servicing a customer’s account, Calvert Research and Management may share information with unaffiliated third parties that perform various required services such as transfer agents, custodians and broker-dealers. |
| |
| • | Policies and procedures (including physical, electronic and procedural safeguards) are in place that are designed to protect the confidentiality of such information. |
| |
| • | The Funds reserve the right to change this Privacy Policy at any time upon proper notification to you. Customers may want to review the Funds’ Privacy Policy periodically for changes by accessing the link on our homepage: www.calvert.com. |
Our pledge of privacy applies to the following entities: the Calvert Family of Funds, Calvert Research and Management and their affiliated service providers, Eaton Vance Management and Eaton Vance Distributors, Inc. In addition, our Privacy Policy applies only to those Calvert customers who are individuals and who have a direct relationship with us. If a customer’s account (i.e., fund shares) is held in the name of a third-party financial advisor/broker-dealer, it is likely that only such advisor’s privacy policies apply to the customer. This notice supersedes all previously issued privacy disclosures. For more information about Calvert’s Privacy Policy, please call 1-800-368-2745.
Delivery of Shareholder Documents. The Securities and Exchange Commission (SEC) permits funds to deliver only one copy of shareholder documents, including prospectuses, proxy statements and shareholder reports, to fund investors with multiple accounts at the same residential or post office box address. This practice is often called “householding” and it helps eliminate duplicate mailings to shareholders. Calvert funds, or your financial intermediary, may household the mailing of your documents indefinitely unless you instruct Calvert funds, or your financial intermediary, otherwise. If you would prefer that your Calvert fund documents not be householded, please contact Calvert funds at 1-800-368-2745, or contact your financial intermediary. Your instructions that householding not apply to delivery of your Calvert fund documents will typically be effective within 30 days of receipt by Calvert funds or your financial intermediary. Separate statements will be generated for each separate account and will be householded as described above.
Portfolio Holdings. Each Calvert fund files a schedule of portfolio holdings on Part F to Form N-PORT with the SEC for the first and third quarters of each fiscal year. The Form N-PORT will be available on the Calvert funds’ website at www.calvert.com, by calling Calvert funds at 1-800-368-2745 or in the EDGAR database on the SEC’s website at www.sec.gov.
Proxy Voting. The Proxy Voting Guidelines that each Calvert fund uses to determine how to vote proxies relating to portfolio securities is provided as an Appendix to the fund’s Statement of Additional Information. The Statement of Additional Information can be obtained free of charge by calling the Calvert funds at 1-800-368-2745, by visiting the Calvert funds’ website at www.calvert.com or visiting the SEC’s website at www.sec.gov. Information regarding how a Calvert fund voted proxies relating to portfolio securities during the most recent 12-month period ended June 30 is available by calling Calvert funds, by visiting the Calvert funds’ website at www.calvert.com or by visiting the SEC’s website at www.sec.gov.
40 www.calvert.com CALVERT US MID-CAP CORE RESPONSIBLE INDEX FUND ANNUAL REPORT (Unaudited)
|
| |
| CALVERT US MID-CAP CORE RESPONSIBLE INDEX FUND |
Investment Adviser and Administrator Calvert Research and Management 1825 Connecticut Avenue NW, Suite 400 Washington, DC 20009 | Transfer Agent DST Asset Manager Solutions, Inc. 2000 Crown Colony Drive Quincy, MA 02169 |
Principal Underwriter* Eaton Vance Distributors, Inc. Two International Place Boston, MA 02110 (617) 482-8260 | Independent Registered Public Accounting Firm KPMG LLP 1601 Market Street Philadelphia, PA 19103-2499 |
Custodian State Street Bank and Trust Company State Street Financial Center, One Lincoln Street Boston, MA 02111 | Fund Offices 1825 Connecticut Avenue NW, Suite 400 Washington, DC 20009 |
| | |
* FINRA BrokerCheck. Investors may check the background of their Investment Professional by contacting the Financial Industry Regulatory Authority (FINRA). FINRA BrokerCheck is a free tool to help investors check the professional background of current and former FINRA-registered securities firms and brokers. FINRA BrokerCheck is available by calling 1-800-289-9999 and at www.FINRA.org. The FINRA BrokerCheck brochure describing this program is available to investors at www.FINRA.org.
|
| |
| | |
Printed on recycled paper. |
| 24193 9.30.19 | |
|
|
| Calvert International Responsible Index Fund |
Important Note. Beginning on January 1, 2021, as permitted by regulations adopted by the Securities and Exchange Commission, paper copies of the Fund’s annual and semi-annual shareholder reports will no longer be sent by mail unless you specifically request paper copies of the reports. Instead, the reports will be made available on the Fund’s website (calvert.com/prospectus), and you will be notified by mail each time a report is posted and provided with a website address to access the report.
If you already elected to receive shareholder reports electronically, you will not be affected by this change and you need not take any action. If you are a direct investor, you may elect to receive shareholder reports and other communications from the Fund electronically by signing up for e-Delivery at calvert.com. If you own your shares through a financial intermediary (such as a broker-dealer or bank), you must contact your financial intermediary to sign up.
You may elect to receive all future Fund shareholder reports in paper free of charge. If you are a direct investor, you can inform the Fund that you wish to continue receiving paper copies of your shareholder reports by calling 1-800-368-2745. If you own these shares through a financial intermediary, you must contact your financial intermediary or follow instructions included with this disclosure, if applicable, to elect to continue to receive paper copies of your shareholder reports. Your election to receive reports in paper will apply to all Calvert funds held directly or to all funds held through your financial intermediary, as applicable.
|
| |
Annual Report September 30, 2019 E-Delivery Sign-Up — Details Inside
| |
|
|
Commodity Futures Trading Commission Registration. Effective December 31, 2012, the Commodity Futures Trading Commission (“CFTC”) adopted certain regulatory changes that subject registered investment companies and advisers to regulation by the CFTC if a fund invests more than a prescribed level of its assets in certain CFTC-regulated instruments (including futures, certain options and swap agreements) or markets itself as providing investment exposure to such instruments. The Fund and its adviser have claimed an exclusion from the definition of the term “commodity pool operator” under the Commodity Exchange Act. Accordingly, neither the Fund nor the adviser is subject to CFTC regulation.
Fund shares are not insured by the FDIC and are not deposits or other obligations of, or guaranteed by, any depository institution. Shares are subject to investment risks, including possible loss of principal invested.
This report must be preceded or accompanied by a current summary prospectus or prospectus. Before investing, investors should consider carefully the investment objective, risks, and charges and expenses of a mutual fund. This and other important information is contained in the summary prospectus and prospectus, which can be obtained from a financial intermediary. Prospective investors should read the prospectus carefully before investing. For further information, please call 1-800-368-2745.
|
Choose Planet-friendly E-delivery! Sign up now for on-line statements, prospectuses, and fund reports. In less than five minutes you can help reduce paper mail and lower fund costs. Just go to www.calvert.com. If you already have an online account with the Calvert funds, click on Login to access your Account and select the documents you would like to receive via e-mail. If you’re new to online account access, click on Login, then Register to create your user name and password. Once you’re in, click on the E-delivery sign-up on the Account Portfolio page and follow the quick, easy steps. Note: If your shares are not held directly with the Calvert funds but through a brokerage firm, you must contact your broker for electronic delivery options available through their firm. |
|
| | | | |
| | | TABLE OF CONTENTS |
| | | | | |
| | | | | Management’s Discussion of Fund Performance |
| | | | | Performance |
| | | | | Fund Profile |
| | | | | Endnotes and Additional Disclosures |
| | | | | Fund Expenses |
| | | | | Financial Statements |
| | | | | Report of Independent Registered Public Accounting Firm |
| | | | | Federal Tax Information |
| | | | | Management and Organization |
| | | | | Important Notices |
MANAGEMENT’S DISCUSSION OF FUND PERFORMANCE1 Economic and Market Conditions
In the midst of a yearlong U.S.-China trade war and slowing economic growth worldwide, global stocks delivered mixed returns during the 12-month period ended September 30, 2019.
U.S. stocks opened the period on the downside as investors worried that President Trump’s imposition of broad import tariffs might provoke a wider trade dispute with China, the world’s second-largest economy behind the U.S.
With U.S. economic data largely positive in calendar year 2018, the U.S. Federal Reserve Board (the Fed) raised its benchmark federal funds rate four times ─ from a low range of 1.50%-1.75% to 2.25%-2.50% ─ with the last quarter-point increase on December 19, 2018.
U.S. stocks turned higher in early 2019 as trade fears eased and interest rates remained stable after the Fed signaled a slower pace for future rate hikes. However, around the same time, U.S. economic indicators began sending mixed signals. While the U.S. job market was robust during the period with the unemployment rate dipping below 4%, retail sales fell, raising concerns about consumer spending. Factory output also declined, dragged down by a large drop in auto production.
The U.S. equity market fluctuated through the spring of 2019. Heightened trade-conflict rhetoric drove stocks lower in May before easing tensions helped equities recover in June. Key economic indicators continued to be mixed, with job creation decelerating sharply in May.
After holding interest rates steady through the first half of 2019, the Fed cut its benchmark interest rate to 2.00%-2.25% on July 31 ─ its first reduction in over a decade ─ followed by a second interest-rate drop to 1.75%-2.00% on September 18. Lower rates are intended to help stimulate economic activity by making borrowing costs relatively more affordable.
After sliding in August, U.S. equities rebounded in early September before pulling back in the final weeks of the period. Like U.S. stocks, global equity markets were volatile during the period. In addition to concerns about U.S.-China trade tensions, investors confronted widespread evidence of a global economic slowdown from Germany to China to India. In Europe, markets faced the added uncertainties of Brexit. The United Kingdom is expected to exit the European Union this fall despite the political turmoil the pending move has already created inside and outside its borders.
During the 12-month period ended September 30, 2019, the MSCI World Index,2 a proxy for global equities, returned 1.83%. In the U.S., the blue-chip Dow Jones Industrial Average® gained 4.21%, while the broader U.S. equity market represented by the S&P 500® Index rose 4.25%. The MSCI EAFE Index of developed-market international equities fell -1.34%, and the MSCI Emerging Markets Index fell -2.02% during the period.
Fund Performance
For the 12-month period ended September 30, 2019, Calvert International Responsible Index Fund (the Fund) returned 0.34% for Class A shares at net asset value (NAV). The Fund outperformed its primary benchmark, the MSCI World ex USA Index, which returned -0.95%; and underperformed its secondary benchmark, the Calvert International Responsible Index (the Calvert Index), which returned 0.51% during the period.
The Fund’s underperformance versus its secondary benchmark was due to Fund expenses and fees, which the Calvert Index does not incur.
Six of the Fund’s 11 market sectors delivered positive returns during the period. The weakest-performing sectors were energy, materials, and financials. The strongest-performing sectors were utilities, consumer staples, and health care.
|
|
See Endnotes and Additional Disclosures in this report. Past performance is no guarantee of future results. Returns are historical and are calculated by determining the percentage change in net asset value (NAV) or offering price (as applicable) with all distributions reinvested. Investment return and principal value will fluctuate so that shares, when redeemed, may be worth more or less than their original cost. Performance less than or equal to one year is cumulative. Performance is for the stated time period only; due to market volatility, the Fund’s current performance may be lower or higher than quoted. Returns are before taxes unless otherwise noted. For performance as of the most recent month-end, please refer to www.calvert.com. |
2 www.calvert.com CALVERT INTERNATIONAL RESPONSIBLE INDEX FUND ANNUAL REPORT (Unaudited)
PERFORMANCE
|
| | | | | | | | | | | | | |
Performance2,3 | | | | | | | | |
Portfolio Managers Thomas C. Seto, Christopher Madden, CFA and Jade Huang, each of Calvert Research and Management |
| | | | | | | | | |
| % Average Annual Total Returns | Class Inception Date |
| Performance Inception Date |
| | One Year |
| | Five Years |
| | Since Inception |
|
| Class A at NAV | 10/30/2015 |
| 10/30/2015 |
| | 0.34 | % | | — | % | | 4.91 | % |
| Class A with 4.75% Maximum Sales Charge | — |
| — |
| | -4.44 |
| | — |
| | 3.61 |
|
| Class I at NAV | 10/30/2015 |
| 10/30/2015 |
| | 0.60 |
| | — |
| | 5.26 |
|
| Class R6 at NAV | 02/01/2019 |
| 10/30/2015 |
| | 0.60 |
| | — |
| | 5.26 |
|
| | | | | | | | | |
| | | | | | | | | |
| MSCI World ex USA Index | — |
| — |
| | -0.95 | % | | 3.06 | % | | 4.84 | % |
| Calvert International Responsible Index | — |
| — |
| | 0.51 |
| | — |
| | 5.14 |
|
| | | | | | | | | |
% Total Annual Operating Expense Ratios4 | | | | Class A |
| | Class I |
| | Class R6 |
|
| Gross | | | | 1.02 | % | | 0.77 | % | | 0.74 | % |
| Net | | | | 0.54 |
| | 0.29 |
| | 0.26 |
|
|
|
| Growth of $10,000 |
| This graph shows the change in value of a hypothetical investment of $10,000 in Class A of the Fund for the period indicated. For comparison, the same investment is shown in the indicated index. |
|
| | | | | | | | |
Growth of Investment3 | Amount Invested |
| Period Beginning | At NAV |
| With Maximum Sales Charge |
| Class I |
| $100,000 |
| 10/30/2015 |
| $122,252 |
| N.A. |
| Class R6 | $1,000,000 | 10/31/2015 | $1,222,516 | N.A. |
See Endnotes and Additional Disclosures in this report.
Past performance is no guarantee of future results. Returns are historical and are calculated by determining the percentage change in net asset value (NAV) or offering price (as applicable) with all distributions reinvested. Investment return and principal value will fluctuate so that shares, when redeemed, may be worth more or less than their original cost. Performance less than or equal to one year is cumulative. Performance is for the stated time period only; due to market volatility, the Fund’s current performance may be lower or higher than quoted. Returns are before taxes unless otherwise noted. For performance as of the most recent month-end, please refer to www.calvert.com.
www.calvert.com CALVERT INTERNATIONAL RESPONSIBLE INDEX FUND ANNUAL REPORT (Unaudited) 3
FUND PROFILE
|
| | | | | | | |
| |
| | | | | |
| | SECTOR ALLOCATION (% of total investments)5 | | | TEN LARGEST HOLDINGS (% of net assets)6 |
| | | | | | |
| | Financials | 22.3 | % | | Nestle SA | 2.2 | % |
| | Industrials | 13.9 | % | | Roche Holding AG | 1.4 | % |
| | Health Care | 12.2 | % | | Taiwan Semiconductor Manufacturing Co. Ltd. | 1.3 | % |
| | Consumer Discretionary | 11.3 | % | | Samsung Electronics Co. Ltd. | 1.3 | % |
| | Information Technology | 10.9 | % | | Toyota Motor Corp. | 1.3 | % |
| | Consumer Staples | 10.3 | % | | Novartis AG | 1.3 | % |
| | Communication Services | 6.6 | % | | Unilever plc | 1.1 | % |
| | Materials | 5.7 | % | | AstraZeneca plc | 0.9 | % |
| | Utilities | 3.9 | % | | SAP SE | 0.8 | % |
| | Real Estate | 2.4 | % | | GlaxoSmithKline plc | 0.8 | % |
| | Energy | 0.5 | % | | Total | 12.4 | % |
| | Total | 100.0 | % | | | |
See Endnotes and Additional Disclosures in this report.
4 www.calvert.com CALVERT INTERNATIONAL RESPONSIBLE INDEX FUND ANNUAL REPORT (Unaudited)
|
| | |
| Endnotes and Additional Disclosures | | |
1 The views expressed in this report are those of the portfolio manager(s) and are current only through the date stated on the cover. These views are subject to change at any time based upon market or other conditions, and Calvert and the Fund(s) disclaim any responsibility to update such views. These views may not be relied upon as investment advice and, because investment decisions are based on many factors, may not be relied upon as an indication of trading intent on behalf of any Calvert fund. This commentary may contain statements that are not historical facts, referred to as “forward looking statements.” The Fund’s actual future results may differ significantly from those stated in any forward looking statement, depending on factors such as changes in securities or financial markets or general economic conditions, the volume of sales and purchases of Fund shares, the continuation of investment advisory, administrative and service contracts, and other risks discussed from time to time in the Fund’s filings with the Securities and Exchange Commission.
2 MSCI World Index is an unmanaged index of equity securities in the developed markets. MSCI EAFE Index is an unmanaged index of equities in the developed markets, excluding the U.S. and Canada. MSCI Emerging Markets Index is an unmanaged index of emerging markets common stocks. MSCI World ex USA Index is an unmanaged index of equity securities in the developed markets, excluding the United States. MSCI indexes are net of foreign withholding taxes. Source: MSCI. MSCI data may not be reproduced or used for any other purpose. MSCI provides no warranties, has not prepared or approved this report, and has no liability hereunder. Dow Jones Industrial Average® is a price-weighted average of 30 blue-chip stocks that are generally the leaders in their industry. S&P 500® Index is an unmanaged index of large-cap stocks commonly used as a measure of U.S. stock market performance. S&P Dow Jones Indices are a product of S&P Dow Jones Indices LLC (“S&P DJI”) and have been licensed for use. S&P® and S&P 500® are registered trademarks of S&P DJI; Dow Jones® is a registered trademark of Dow Jones Trademark Holdings LLC (“Dow Jones”); S&P DJI, Dow Jones and their respective affiliates do not sponsor, endorse, sell or promote the Fund, will not have any liability with respect thereto and do not have any liability for any errors, omissions, or interruptions of the S&P Dow Jones Indices. Calvert International Responsible Index (the “Calvert Index”) is composed of common stocks of large companies in developed markets, excluding the U.S. Large companies in developed markets are the 1,000 largest publicly traded companies in markets that Calvert Research and Management determines to be developed markets based on a set of criteria including level of economic development, existence of capital controls, openness to foreign direct investment, market trading and liquidity conditions, regulatory environment, treatment of minority shareholders, and investor expectations. The Calvert Principles for Responsible Investment serve as a framework for considering environmental, social and governance factors that may affect investment performance. Stocks are weighted in the Calvert Index based on their float-adjusted market capitalization, by country and by sector, subject to certain prescribed limits.
Unless otherwise stated, index returns do not reflect the effect of any applicable sales charges, commissions, expenses, taxes or leverage, as applicable. It is not possible to invest directly in an index.
3 Total Returns at NAV do not include applicable sales charges. If sales charges were deducted, the returns would be lower. Total Returns shown with maximum sales charge reflect the stated maximum sales charge. Unless otherwise stated, performance does not reflect the deduction of taxes on Fund distributions or redemptions of Fund shares.
Performance prior to the inception date of a class may be linked to the performance of an older class of the Fund. This linked performance is adjusted for any applicable sales charge, but is not adjusted for class expense differences. If adjusted for such differences, the performance would be different. The performance of Class R6 is linked to Class I. Performance since inception for an index, if presented, is the performance since the Fund’s or oldest share class’ inception, as applicable. Performance presented in the Financial Highlights included in the financial statements is not linked.
Calvert Research and Management became the investment adviser to the Fund on December 31, 2016. Performance reflected prior to such date is that of the Fund’s former investment adviser.
4 Source: Fund prospectus. Net expense ratios reflect a contractual expense reimbursement that continues through 1/31/20. Without the reimbursement, performance would have been lower. The expense ratios for the current reporting period can be found in the Financial Highlights section of this report.
| |
5 | Does not include Short Term Investment of Cash Collateral for Securities Loaned. |
| |
6 | Excludes cash and cash equivalents. |
www.calvert.com CALVERT INTERNATIONAL RESPONSIBLE INDEX FUND ANNUAL REPORT (Unaudited) 5
FUND EXPENSES
Example
As a Fund shareholder, you incur two types of costs: (1) transaction costs, including sales charges (loads) on purchases and redemption fees (if applicable); and (2) ongoing costs, including management fees; distribution and/or service fees; and other Fund expenses. This Example is intended to help you understand your ongoing costs (in dollars) of Fund investing and to compare these costs with the ongoing costs of investing in other mutual funds. The Example is based on an investment of $1,000 invested at the beginning of the period and held for the entire period (April 1, 2019 to September 30, 2019).
Actual Expenses
The first section of the table below provides information about actual account values and actual expenses. You may use the information in this section, together with the amount you invested, to estimate the expenses that you paid over the period. Simply divide your account value by $1,000 (for example, an $8,600 account value divided by $1,000 = 8.6), then multiply the result by the number in the first section under the heading entitled “Expenses Paid During Period” to estimate the expenses you paid on your account during this period.
Hypothetical Example for Comparison Purposes
The second section of the table below provides information about hypothetical account values and hypothetical expenses based on the actual Fund expense ratio and an assumed rate of return of 5% per year (before expenses), which is not the actual Fund return. The hypothetical account values and expenses may not be used to estimate the actual ending account balance or expenses you paid for the period. You may use this information to compare the ongoing costs of investing in the Fund and other funds. To do so, compare this 5% hypothetical example with the 5% hypothetical examples that appear in the shareholder reports of the other funds.
Please note that the expenses shown in the table are meant to highlight your ongoing costs only and do not reflect any transactional costs, such as sales charges (loads) or redemption fees (if applicable). Therefore, the second section of the table is useful in comparing ongoing costs only, and will not help you determine the relative total costs of owning different funds. In addition, if these transactional costs were included, your costs would be higher.
|
| | | | |
| | BEGINNING
ACCOUNT VALUE
(4/1/19) | ENDING
ACCOUNT VALUE
(9/30/19) | EXPENSES PAID
DURING PERIOD
(4/1/19 - 9/30/19)* | ANNUALIZED
EXPENSE RATIO |
| Actual | | | | |
| Class A | $1,000.00 | $1040.60 | $2.76** | 0.54% |
| Class I | $1,000.00 | $1041.90 | $1.48** | 0.29% |
| Class R6 | $1,000.00 | $1,041.90 | $1.33** | 0.26% |
| Hypothetical | | | | |
| (5% return per year before expenses) | | | | |
| Class A | $1,000.00 | $1,022.36 | $2.74** | 0.54% |
| Class I | $1,000.00 | $1,023.61 | $1.47** | 0.29% |
| Class R6 | $1,000.00 | $1,023.77 | $1.32** | 0.26% |
| | | | | |
| * Expenses are equal to the Fund’s annualized expense ratio for the indicated Class, multiplied by the average account value over the period, multiplied by 183/365 (to reflect the one-half year period). The Example assumes that the $1,000 was invested at the net asset value per share determined at the close of business on March 31, 2019. |
| ** Absent a waiver and/or reimbursement of expenses by an affiliate, expenses would be higher. |
6 www.calvert.com CALVERT INTERNATIONAL RESPONSIBLE INDEX FUND ANNUAL REPORT (Unaudited)
CALVERT INTERNATIONAL RESPONSIBLE INDEX FUND
SCHEDULE OF INVESTMENTS
SEPTEMBER 30, 2019
|
| | |
| | SHARES | VALUE ($) |
| COMMON STOCKS - 98.6% | | |
| Australia - 5.2% | | |
| APA Group | 25,190 | 195,093 |
| ASX Ltd. | 2,041 | 111,846 |
| Australia & New Zealand Banking Group Ltd. | 25,343 | 486,831 |
| Brambles Ltd. | 20,043 | 154,351 |
| Cochlear Ltd. | 692 | 97,381 |
| Coles Group Ltd. | 15,785 | 164,109 |
| Commonwealth Bank of Australia | 14,098 | 769,037 |
| Computershare Ltd. | 4,213 | 46,056 |
| CSL Ltd. | 4,453 | 704,072 |
| Insurance Australia Group Ltd. | 22,019 | 117,492 |
| Lend Lease Group | 5,929 | 70,323 |
| Macquarie Group Ltd. | 2,961 | 262,469 |
| Magellan Financial Group Ltd. | 989 | 34,447 |
| Medibank Pvt Ltd. | 25,863 | 59,395 |
| National Australia Bank Ltd. | 25,498 | 511,240 |
| Orica Ltd. | 4,633 | 70,553 |
| Qantas Airways Ltd. | 8,761 | 37,232 |
| QBE Insurance Group Ltd. | 13,500 | 114,512 |
| Ramsay Health Care Ltd. (1) | 1,646 | 72,111 |
| REA Group Ltd. (1) | 419 | 30,632 |
| Sonic Healthcare Ltd. | 4,200 | 79,636 |
| Suncorp Group Ltd. | 12,981 | 119,598 |
| Sydney Airport | 11,496 | 62,380 |
| Telstra Corp. Ltd. | 39,424 | 93,453 |
| Transurban Group | 34,663 | 344,116 |
| Wesfarmers Ltd. | 14,387 | 386,547 |
| Westpac Banking Corp. | 29,547 | 590,131 |
| WiseTech Global Ltd. | 1,272 | 29,892 |
| Woolworths Group Ltd. | 16,770 | 421,994 |
| | | 6,236,929 |
| | | |
| Austria - 0.2% | | |
| Erste Group Bank AG | 2,409 | 79,616 |
| Raiffeisen Bank International AG | 1,286 | 29,824 |
| Telekom Austria AG | 2,137 | 15,537 |
| Verbund AG | 1,051 | 57,506 |
| Voestalpine AG | 2,320 | 53,342 |
| | | 235,825 |
| | | |
www.calvert.com CALVERT INTERNATIONAL RESPONSIBLE INDEX FUND ANNUAL REPORT 7
|
| | |
| | SHARES | VALUE ($) |
| COMMON STOCKS - CONT’D | | |
| Belgium - 1.0% | | |
| Ackermans & van Haaren NV | 268 | 40,707 |
| Ageas | 2,409 | 133,543 |
| Colruyt SA | 1,096 | 60,041 |
| Galapagos NV (2) | 623 | 94,917 |
| KBC Groep NV | 4,485 | 291,307 |
| Proximus | 1,882 | 55,922 |
| Sofina SA | 195 | 43,304 |
| Solvay SA | 1,172 | 121,334 |
| Telenet Group Holding NV | 486 | 22,934 |
| UCB SA | 2,067 | 149,966 |
| Umicore SA (1) | 3,124 | 118,035 |
| | | 1,132,010 |
| | | |
| Canada - 8.4% | | |
| Air Canada (2) | 1,688 | 55,054 |
| Algonquin Power & Utilities Corp. (1) | 6,805 | 93,175 |
| Alimentation Couche-Tard, Inc., Class B | 12,168 | 372,888 |
| Bank of Montreal | 6,111 | 450,097 |
| Bank of Nova Scotia (The) | 10,606 | 602,409 |
| BCE, Inc. | 3,018 | 145,974 |
| Brookfield Asset Management, Inc., Class A | 10,073 | 534,880 |
| CAE, Inc. | 3,270 | 83,080 |
| Canadian Imperial Bank of Commerce | 4,271 | 352,389 |
| Canadian National Railway Co. | 7,351 | 660,056 |
| Canadian Pacific Railway Ltd. | 1,706 | 379,122 |
| Canadian Tire Corp. Ltd., Class A (1) | 618 | 69,350 |
| CCL Industries, Inc., Class B | 2,161 | 87,167 |
| CGI, Inc. (2) | 2,597 | 205,353 |
| Constellation Software, Inc. | 210 | 209,730 |
| Dollarama, Inc. | 3,567 | 127,700 |
| Empire Co. Ltd. | 3,060 | 82,849 |
| Fairfax Financial Holdings Ltd. | 294 | 129,597 |
| George Weston Ltd. | 1,164 | 97,928 |
| Gildan Activewear, Inc. | 2,212 | 78,506 |
| Great-West Lifeco, Inc. | 2,376 | 57,048 |
| Hydro One Ltd. (3) | 3,543 | 65,493 |
| IGM Financial, Inc. (1) | 884 | 25,102 |
| Intact Financial Corp. | 1,336 | 134,462 |
| Loblaw Cos. Ltd. | 2,566 | 146,153 |
| Magna International, Inc. | 3,006 | 160,310 |
| Manulife Financial Corp. | 18,785 | 344,549 |
| Metro, Inc. | 3,781 | 166,468 |
8 www.calvert.com CALVERT INTERNATIONAL RESPONSIBLE INDEX FUND ANNUAL REPORT
|
| | |
| | SHARES | VALUE ($) |
| COMMON STOCKS - CONT’D | | |
| National Bank of Canada | 3,185 | 158,475 |
| Open Text Corp. | 2,803 | 114,333 |
| Power Corp. of Canada | 2,637 | 60,747 |
| Power Financial Corp. (1) | 2,282 | 52,914 |
| Quebecor, Inc., Class B | 1,707 | 38,756 |
| Restaurant Brands International, Inc. (4) | 950 | 67,547 |
| Restaurant Brands International, Inc. (4) | 2,808 | 199,761 |
| Rogers Communications, Inc., Class B | 3,646 | 177,587 |
| Royal Bank of Canada | 11,174 | 906,419 |
| Saputo, Inc. | 3,574 | 109,849 |
| Shaw Communications, Inc., Class B | 5,087 | 99,947 |
| Shopify, Inc., Class A (2) | 1,175 | 365,666 |
| Sun Life Financial, Inc. | 5,808 | 259,702 |
| TELUS Corp. | 1,728 | 61,498 |
| Thomson Reuters Corp. | 1,902 | 127,125 |
| Toronto-Dominion Bank (The) | 14,600 | 851,304 |
| Waste Connections, Inc. (4) | 1,510 | 138,719 |
| Waste Connections, Inc. (4) | 1,922 | 176,824 |
| WSP Global, Inc. | 1,307 | 76,387 |
| | | 9,960,449 |
| | | |
| China - 0.5% | | |
| China Mengniu Dairy Co. Ltd. | 41,000 | 153,474 |
| China Resources Pharmaceutical Group Ltd. (3) | 28,500 | 26,663 |
| CSPC Pharmaceutical Group Ltd. | 54,000 | 108,368 |
| Fosun International Ltd. | 67,500 | 83,549 |
| Geely Automobile Holdings Ltd. | 50,000 | 84,971 |
| Lenovo Group Ltd. | 70,000 | 46,699 |
| Shenzhou International Group Holdings Ltd. | 7,400 | 96,535 |
| | | 600,259 |
| | | |
| Denmark - 1.6% | | |
| AP Moller - Maersk A/S, Class B | 78 | 88,174 |
| Ascendis Pharma AS ADR (2) | 372 | 35,831 |
| Chr Hansen Holding A/S | 1,233 | 104,452 |
| Coloplast A/S, Class B | 1,123 | 135,115 |
| Danske Bank A/S | 3,987 | 55,469 |
| Demant A/S (2) | 463 | 11,853 |
| DSV A/S | 1,490 | 141,624 |
| Genmab A/S (2) | 556 | 112,970 |
| GN Store Nord AS | 1,316 | 53,346 |
| H Lundbeck A/S | 382 | 12,664 |
| ISS A/S | 1,117 | 27,616 |
| Novo Nordisk A/S, Class B | 14,320 | 740,002 |
www.calvert.com CALVERT INTERNATIONAL RESPONSIBLE INDEX FUND ANNUAL REPORT 9
|
| | |
| | SHARES | VALUE ($) |
| COMMON STOCKS - CONT’D | | |
| Novozymes A/S, Class B | 1,976 | 83,113 |
| Orsted A/S (3) | 1,504 | 139,810 |
| Rockwool International A/S, Class B | 113 | 22,594 |
| Topdanmark AS | 447 | 21,578 |
| Tryg A/S | 1,459 | 41,801 |
| Vestas Wind Systems A/S | 1,584 | 122,883 |
| | | 1,950,895 |
| | | |
| Finland - 1.1% | | |
| Elisa Oyj | 1,348 | 69,495 |
| Kesko Oyj, Class B | 1,031 | 65,122 |
| Kone Oyj, Class B | 3,176 | 180,747 |
| Metso Oyj | 943 | 35,190 |
| Neste Oyj | 8,829 | 292,104 |
| Nokia Oyj | 40,316 | 203,608 |
| Nordea Bank Abp | 19,269 | 136,683 |
| Orion Oyj, Class B | 766 | 28,544 |
| Sampo Oyj, Class A | 3,140 | 124,759 |
| Stora Enso Oyj, Class R | 5,928 | 71,339 |
| UPM-Kymmene Oyj | 3,820 | 112,799 |
| Wartsila Oyj Abp | 4,111 | 45,998 |
| | | 1,366,388 |
| | | |
| France - 8.9% | | |
| Accor SA | 1,981 | 82,575 |
| Aeroports de Paris | 294 | 52,294 |
| Air Liquide SA | 4,469 | 636,028 |
| ALD SA (3) | 1,044 | 14,903 |
| Alstom SA | 1,553 | 64,330 |
| Amundi SA (3) | 477 | 33,227 |
| Arkema SA | 736 | 68,615 |
| Atos SE | 870 | 61,239 |
| AXA SA | 17,275 | 441,096 |
| BioMerieux | 314 | 25,968 |
| BNP Paribas SA | 8,809 | 428,266 |
| Bouygues SA | 2,264 | 90,666 |
| Bureau Veritas SA | 2,947 | 70,934 |
| Capgemini SE | 1,378 | 162,261 |
| Carrefour SA | 6,666 | 116,603 |
| Cie de Saint-Gobain | 7,916 | 310,249 |
| Cie Generale des Etablissements Michelin SCA | 1,548 | 172,359 |
| CNP Assurances | 705 | 13,624 |
| Credit Agricole SA | 8,680 | 105,061 |
| Danone SA | 6,778 | 597,018 |
10 www.calvert.com CALVERT INTERNATIONAL RESPONSIBLE INDEX FUND ANNUAL REPORT
|
| | |
| | SHARES | VALUE ($) |
| COMMON STOCKS - CONT’D | | |
| Dassault Systemes SE | 1,258 | 179,210 |
| Edenred | 2,589 | 124,194 |
| Eiffage SA | 1,095 | 113,513 |
| Engie SA | 19,559 | 319,245 |
| EssilorLuxottica SA | 2,872 | 414,083 |
| Eurazeo SE | 638 | 47,447 |
| Faurecia SE | 678 | 32,141 |
| Getlink SE | 4,076 | 61,204 |
| Hermes International | 354 | 244,500 |
| Iliad SA | 254 | 23,856 |
| Ingenico Group SA | 467 | 45,516 |
| Ipsen SA | 360 | 34,152 |
| JC Decaux SA | 460 | 12,448 |
| Kering SA | 637 | 324,606 |
| L’Oreal SA | 2,283 | 638,484 |
| Legrand SA | 2,964 | 211,443 |
| LVMH Moet Hennessy Louis Vuitton SE | 2,147 | 851,843 |
| Natixis SA | 6,124 | 25,373 |
| Orange SA | 18,155 | 284,161 |
| Orpea | 625 | 76,334 |
| Peugeot SA | 4,734 | 118,155 |
| Publicis Groupe SA | 1,919 | 94,425 |
| Rubis SCA | 1,218 | 70,744 |
| Sanofi SA | 9,934 | 920,214 |
| Sartorius Stedim Biotech | 158 | 22,100 |
| Schneider Electric SE | 5,701 | 498,507 |
| SCOR SE | 1,292 | 53,343 |
| SEB SA | 200 | 30,354 |
| Societe Generale SA | 7,039 | 192,813 |
| Sodexo SA | 1,054 | 118,315 |
| Suez | 4,314 | 67,801 |
| Teleperformance | 532 | 115,272 |
| Ubisoft Entertainment SA (2) | 680 | 49,022 |
| Valeo SA | 2,708 | 87,758 |
| Veolia Environnement SA | 6,383 | 161,692 |
| Vivendi SA | 8,742 | 239,205 |
| Wendel SA | 211 | 29,076 |
| Worldline SA (2)(3) | 1,028 | 64,760 |
| | | 10,544,625 |
| | | |
| Germany - 7.0% | | |
| 1&1 Drillisch AG | 812 | 25,312 |
| adidas AG | 1,583 | 492,740 |
| Allianz SE | 3,352 | 780,251 |
www.calvert.com CALVERT INTERNATIONAL RESPONSIBLE INDEX FUND ANNUAL REPORT 11
|
| | |
| | SHARES | VALUE ($) |
| COMMON STOCKS - CONT’D | | |
| Axel Springer SE (2) | 415 | 28,497 |
| Bayerische Motoren Werke AG | 2,886 | 203,250 |
| Bechtle AG | 231 | 23,510 |
| Beiersdorf AG | 986 | 116,254 |
| Brenntag AG | 1,740 | 84,153 |
| Carl Zeiss Meditec AG | 472 | 53,796 |
| Commerzbank AG | 8,284 | 47,955 |
| Continental AG | 998 | 128,050 |
| Covestro AG (3) | 1,500 | 74,223 |
| Daimler AG | 7,170 | 356,470 |
| Delivery Hero SE (2)(3) | 911 | 40,444 |
| Deutsche Boerse AG | 1,464 | 228,324 |
| Deutsche Lufthansa AG | 2,642 | 41,942 |
| Deutsche Post AG | 9,424 | 314,057 |
| Deutsche Telekom AG | 27,829 | 466,776 |
| Deutsche Wohnen SE | 3,894 | 142,144 |
| DWS Group GmbH & Co. KGaA (3) | 746 | 22,023 |
| Evonik Industries AG | 2,008 | 49,570 |
| Fielmann AG | 364 | 26,796 |
| Fraport AG Frankfurt Airport Services Worldwide | 241 | 20,426 |
| Fresenius Medical Care AG & Co. KGaA | 2,080 | 139,777 |
| Fresenius SE & Co. KGaA | 3,802 | 177,860 |
| GEA Group AG | 1,883 | 50,799 |
| GRENKE AG | 145 | 11,945 |
| Hannover Rueck SE | 459 | 77,575 |
| HeidelbergCement AG | 2,945 | 212,776 |
| Hella GmbH & Co. KGaA | 271 | 12,114 |
| Infineon Technologies AG | 8,497 | 152,664 |
| KION Group AG | 754 | 39,652 |
| Knorr-Bremse AG | 412 | 38,733 |
| Lanxess AG | 982 | 59,976 |
| LEG Immobilien AG | 755 | 86,397 |
| Merck KGaA | 1,127 | 126,956 |
| METRO AG | 1,473 | 23,239 |
| MTU Aero Engines AG | 537 | 142,690 |
| Muenchener Rueckversicherungs-Gesellschaft AG | 1,204 | 310,991 |
| Nemetschek SE | 486 | 24,764 |
| Puma SE | 930 | 71,959 |
| Rational AG | 37 | 26,533 |
| RTL Group SA | 226 | 10,866 |
| SAP SE | 8,224 | 967,745 |
| Schaeffler AG, PFC Shares | 2,000 | 15,337 |
| Scout24 AG (3) | 750 | 42,711 |
| Siemens AG | 6,950 | 743,963 |
12 www.calvert.com CALVERT INTERNATIONAL RESPONSIBLE INDEX FUND ANNUAL REPORT
|
| | |
| | SHARES | VALUE ($) |
| COMMON STOCKS - CONT’D | | |
| Siemens Healthineers AG (3) | 1,226 | 48,209 |
| Symrise AG | 1,362 | 132,398 |
| Talanx AG | 268 | 11,581 |
| Telefonica Deutschland Holding AG (3) | 3,869 | 10,786 |
| ThyssenKrupp AG | 9,415 | 130,281 |
| TUI AG (1) | 4,121 | 47,861 |
| Uniper SE | 1,669 | 54,737 |
| United Internet AG | 844 | 30,076 |
| Vonovia SE | 6,417 | 325,568 |
| Wirecard AG | 890 | 142,435 |
| Zalando SE (2)(3) | 1,040 | 47,486 |
| | | 8,316,403 |
| | | |
| Hong Kong - 3.1% | | |
| AIA Group Ltd. | 92,783 | 875,040 |
| Alibaba Health Information Technology Ltd. (1)(2) | 46,000 | 40,166 |
| Alibaba Pictures Group Ltd. (2) | 140,000 | 22,686 |
| Bank of East Asia Ltd. (The) | 12,800 | 31,525 |
| Beijing Enterprises Water Group Ltd. | 62,000 | 31,724 |
| BOC Hong Kong Holdings Ltd. | 35,850 | 121,647 |
| Cathay Pacific Airways Ltd. (1) | 19,000 | 23,733 |
| China Everbright International Ltd. | 46,777 | 35,981 |
| China Gas Holdings Ltd. | 44,000 | 169,972 |
| China Overseas Land & Investment Ltd. | 48,000 | 151,017 |
| China Resources Gas Group Ltd. | 10,000 | 49,485 |
| China Taiping Insurance Holdings Co. Ltd. | 14,400 | 32,140 |
| Chow Tai Fook Jewellery Group Ltd. | 15,000 | 12,382 |
| Guangdong Investment Ltd. | 36,000 | 70,456 |
| Haier Electronics Group Co. Ltd. | 18,000 | 46,869 |
| Hang Lung Properties Ltd. | 28,000 | 63,546 |
| Hang Seng Bank Ltd. | 7,479 | 161,154 |
| Henderson Land Development Co. Ltd. | 21,355 | 99,468 |
| HKT Trust & HKT Ltd. | 42,000 | 66,626 |
| Hong Kong Exchanges & Clearing Ltd. | 13,099 | 383,932 |
| Hongkong Land Holdings Ltd. | 13,900 | 78,149 |
| Hysan Development Co. Ltd. | 5,881 | 23,716 |
| MTR Corp. Ltd. | 22,376 | 125,488 |
| NWS Holdings Ltd. | 27,000 | 41,819 |
| Sino Biopharmaceutical Ltd. | 81,000 | 102,843 |
| Sino Land Co. Ltd. | 34,000 | 51,103 |
| Sun Art Retail Group Ltd. | 44,500 | 45,136 |
| Sun Hung Kai Properties Ltd. | 21,301 | 306,111 |
| Swire Pacific Ltd., Class A | 7,893 | 73,462 |
| Swire Properties Ltd. | 11,400 | 35,778 |
www.calvert.com CALVERT INTERNATIONAL RESPONSIBLE INDEX FUND ANNUAL REPORT 13
|
| | |
| | SHARES | VALUE ($) |
| COMMON STOCKS - CONT’D | | |
| Techtronic Industries Co. Ltd. | 13,493 | 93,914 |
| Vitasoy International Holdings Ltd. | 10,000 | 40,534 |
| WH Group Ltd. (3) | 138,002 | 123,589 |
| Wharf Holdings Ltd. (The) | 19,779 | 43,141 |
| Wheelock & Co. Ltd. | 8,000 | 45,577 |
| | | 3,719,909 |
| | | |
| Ireland - 1.0% | | |
| AIB Group plc | 9,241 | 27,413 |
| Amarin Corp. plc ADR (1)(2) | 4,420 | 67,007 |
| Bank of Ireland Group plc | 8,442 | 33,451 |
| CRH plc | 10,598 | 363,767 |
| DCC plc | 1,998 | 174,254 |
| Glanbia plc | 2,698 | 33,517 |
| ICON plc (2) | 418 | 61,588 |
| Kerry Group plc, Class A | 1,776 | 207,590 |
| Kingspan Group plc | 3,112 | 151,875 |
| Smurfit Kappa Group plc | 2,110 | 62,743 |
| | | 1,183,205 |
| | | |
| Israel - 0.5% | | |
| Azrieli Group Ltd. | 1,010 | 79,591 |
| Bank Hapoalim BM | 9,024 | 71,103 |
| Bank Leumi Le-Israel BM | 15,218 | 108,350 |
| Check Point Software Technologies Ltd. (2) | 1,053 | 115,304 |
| Mellanox Technologies Ltd. (2) | 433 | 47,452 |
| Nice Ltd. (2) | 562 | 81,000 |
| Wix.com Ltd. (2) | 380 | 44,361 |
| | | 547,161 |
| | | |
| Italy - 2.1% | | |
| A2A SpA | 25,373 | 46,564 |
| Amplifon SpA | 1,040 | 25,515 |
| Assicurazioni Generali SpA | 9,383 | 181,840 |
| Atlantia SpA | 5,745 | 138,844 |
| Banca Mediolanum SpA | 1,639 | 12,303 |
| DiaSorin SpA | 374 | 43,495 |
| Enel SpA | 81,745 | 610,578 |
| FinecoBank Banca Fineco SpA | 4,982 | 52,710 |
| Hera SpA | 6,972 | 28,611 |
| Infrastrutture Wireless Italiane SpA (3) | 2,632 | 27,310 |
| Intesa Sanpaolo SpA | 127,122 | 301,129 |
| Italgas SpA | 5,204 | 33,582 |
| Mediobanca Banca di Credito Finanziario SpA | 5,366 | 58,574 |
14 www.calvert.com CALVERT INTERNATIONAL RESPONSIBLE INDEX FUND ANNUAL REPORT
|
| | |
| | SHARES | VALUE ($) |
| COMMON STOCKS - CONT’D | | |
| Moncler SpA | 1,655 | 58,990 |
| Pirelli & C SpA (3) | 6,163 | 36,497 |
| Poste Italiane SpA (3) | 5,123 | 58,234 |
| PRADA SpA | 7,700 | 22,415 |
| Prysmian SpA | 2,676 | 57,461 |
| Recordati SpA | 904 | 38,771 |
| Snam SpA | 44,926 | 226,931 |
| Telecom Italia SpA (2) | 103,805 | 59,271 |
| Terna Rete Elettrica Nazionale SpA | 19,255 | 123,669 |
| UniCredit SpA | 17,918 | 211,199 |
| UnipolSai Assicurazioni SpA | 5,520 | 14,678 |
| | | 2,469,171 |
| | | |
| Japan - 18.7% | | |
| Acom Co. Ltd. | 3,100 | 12,216 |
| AEON Co. Ltd. (1) | 5,479 | 100,664 |
| AGC, Inc. | 3,755 | 117,015 |
| Aisin Seiki Co. Ltd. | 1,600 | 50,586 |
| Ajinomoto Co., Inc. | 5,108 | 96,682 |
| Alfresa Holdings Corp. | 1,300 | 29,128 |
| ANA Holdings, Inc. | 956 | 32,207 |
| Asahi Intecc Co. Ltd. | 1,600 | 42,214 |
| Astellas Pharma, Inc. | 16,271 | 232,743 |
| Bandai Namco Holdings, Inc. | 1,375 | 85,742 |
| Bridgestone Corp. | 5,200 | 202,363 |
| Canon, Inc. | 7,968 | 213,082 |
| Central Japan Railway Co. | 1,967 | 405,614 |
| Chugai Pharmaceutical Co. Ltd. | 2,052 | 160,358 |
| Dai Nippon Printing Co. Ltd. | 1,529 | 39,664 |
| Dai-ichi Life Holdings, Inc. | 6,994 | 106,329 |
| Daifuku Co. Ltd. (1) | 1,000 | 52,026 |
| Daiichi Sankyo Co. Ltd. | 4,913 | 310,449 |
| Daikin Industries Ltd. | 3,300 | 435,234 |
| Daiwa House Industry Co. Ltd. | 5,392 | 175,265 |
| Daiwa Securities Group, Inc. (1) | 10,400 | 46,542 |
| Denso Corp. | 3,647 | 161,151 |
| Dentsu, Inc. | 1,900 | 67,184 |
| East Japan Railway Co. | 3,726 | 356,289 |
| Eisai Co. Ltd. (1) | 2,125 | 108,560 |
| FamilyMart Co. Ltd. | 2,552 | 62,354 |
| FANUC Corp. | 1,951 | 368,785 |
| Fast Retailing Co. Ltd. (1) | 542 | 323,330 |
| FUJIFILM Holdings Corp. | 3,126 | 137,702 |
| Fujitsu Ltd. | 1,748 | 140,487 |
www.calvert.com CALVERT INTERNATIONAL RESPONSIBLE INDEX FUND ANNUAL REPORT 15
|
| | |
| | SHARES | VALUE ($) |
| COMMON STOCKS - CONT’D | | |
| Hakuhodo DY Holdings, Inc. | 1,600 | 23,249 |
| Hamamatsu Photonics KK | 1,021 | 38,092 |
| Hankyu Hanshin Holdings, Inc. | 2,400 | 92,809 |
| Hikari Tsushin, Inc. | 200 | 43,389 |
| Hitachi Chemical Co. Ltd. | 900 | 29,523 |
| Hitachi High-Technologies Corp. | 500 | 29,065 |
| Hitachi Ltd. | 8,949 | 335,142 |
| Hoshizaki Corp. (1) | 652 | 51,395 |
| HOYA Corp. | 3,487 | 285,595 |
| Hulic Co. Ltd. | 6,000 | 61,600 |
| Itochu Techno-Solutions Corp. | 1,000 | 26,562 |
| Japan Airlines Co. Ltd. | 789 | 23,433 |
| Japan Exchange Group, Inc. | 4,600 | 72,691 |
| Japan Post Holdings Co. Ltd. | 13,000 | 119,959 |
| Japan Post Insurance Co. Ltd. | 1,400 | 21,192 |
| Kansai Paint Co. Ltd. (1) | 2,100 | 49,087 |
| Kao Corp. | 4,063 | 301,381 |
| KDDI Corp. | 14,318 | 373,596 |
| Keio Corp. | 1,223 | 76,366 |
| Keisei Electric Railway Co. Ltd. | 1,100 | 45,411 |
| Kikkoman Corp. | 1,909 | 91,583 |
| Kintetsu Group Holdings Co. Ltd. | 1,705 | 88,998 |
| Kobayashi Pharmaceutical Co. Ltd. | 300 | 22,911 |
| Komatsu Ltd. | 8,146 | 187,845 |
| Kose Corp. | 331 | 56,200 |
| Kubota Corp. | 10,594 | 161,121 |
| Kyocera Corp. | 2,613 | 162,922 |
| Kyowa Kirin Co. Ltd. (1) | 1,806 | 35,171 |
| LINE Corp. (1)(2) | 500 | 17,943 |
| Lion Corp. | 2,300 | 45,500 |
| M3, Inc. (1) | 3,000 | 72,600 |
| Makita Corp. | 2,292 | 72,733 |
| Mazda Motor Corp. | 4,706 | 42,181 |
| McDonald’s Holdings Co. (Japan), Ltd. | 700 | 33,906 |
| Medipal Holdings Corp. | 1,100 | 24,554 |
| MEIJI Holdings Co. Ltd. (1) | 1,371 | 100,285 |
| MinebeaMitsumi, Inc. | 2,500 | 39,909 |
| MISUMI Group, Inc. | 2,400 | 56,852 |
| Mitsubishi Chemical Holdings Corp. | 11,960 | 85,722 |
| Mitsubishi Electric Corp. | 17,107 | 228,210 |
| Mitsubishi Estate Co. Ltd. | 11,708 | 226,392 |
| Mitsubishi Tanabe Pharma Corp. | 1,677 | 18,481 |
| Mitsubishi UFJ Financial Group, Inc. | 88,357 | 449,990 |
| Mitsui Fudosan Co. Ltd. | 9,500 | 236,428 |
16 www.calvert.com CALVERT INTERNATIONAL RESPONSIBLE INDEX FUND ANNUAL REPORT
|
| | |
| | SHARES | VALUE ($) |
| COMMON STOCKS - CONT’D | | |
| Mizuho Financial Group, Inc. (1) | 187,573 | 288,253 |
| MonotaRO Co. Ltd. (1) | 1,100 | 29,016 |
| MS&AD Insurance Group Holdings, Inc. | 3,600 | 117,015 |
| Murata Manufacturing Co. Ltd. | 5,553 | 269,140 |
| Nagoya Railroad Co. Ltd. | 1,600 | 47,937 |
| NEC Corp. | 2,530 | 106,985 |
| Nidec Corp. | 1,690 | 228,862 |
| Nikon Corp. (1) | 2,113 | 26,508 |
| Nintendo Co. Ltd. | 929 | 346,049 |
| Nippon Express Co. Ltd. | 1,094 | 56,031 |
| Nippon Paint Holdings Co. Ltd. | 2,309 | 120,767 |
| Nippon Telegraph & Telephone Corp. | 5,620 | 268,881 |
| Nissan Motor Co. Ltd. (1) | 20,485 | 127,895 |
| Nisshin Seifun Group, Inc. | 3,886 | 72,058 |
| Nissin Foods Holdings Co. Ltd. | 599 | 43,410 |
| Nitori Holdings Co. Ltd. | 568 | 83,354 |
| Nitto Denko Corp. | 1,286 | 62,313 |
| Nomura Holdings, Inc. (1) | 25,200 | 107,121 |
| Nomura Research Institute Ltd. | 2,500 | 49,955 |
| NTT Data Corp. | 6,535 | 84,815 |
| NTT DoCoMo, Inc. (1) | 10,297 | 262,930 |
| Obayashi Corp. | 5,700 | 57,005 |
| Obic Co. Ltd. | 600 | 68,755 |
| Odakyu Electric Railway Co. Ltd. | 3,046 | 73,166 |
| Oji Holdings Corp. | 12,154 | 57,063 |
| Omron Corp. | 1,882 | 103,708 |
| Ono Pharmaceutical Co. Ltd. | 5,622 | 102,388 |
| Oracle Corp. Japan | 326 | 28,419 |
| Oriental Land Co. Ltd. | 2,197 | 334,857 |
| ORIX Corp. | 10,167 | 152,088 |
| Otsuka Corp. | 688 | 27,535 |
| Otsuka Holdings Co. Ltd. | 3,520 | 132,229 |
| Pan Pacific International Holdings Corp. | 5,568 | 93,222 |
| PeptiDream, Inc. (2) | 1,200 | 57,359 |
| Pola Orbis Holdings, Inc. | 700 | 15,780 |
| Rakuten, Inc. | 7,649 | 75,821 |
| Recruit Holdings Co. Ltd. | 10,879 | 332,391 |
| Renesas Electronics Corp. (2) | 7,100 | 46,528 |
| Resona Holdings, Inc. | 14,433 | 62,107 |
| Ricoh Co. Ltd. (1) | 5,684 | 51,425 |
| Rohm Co. Ltd. | 876 | 67,541 |
| Santen Pharmaceutical Co. Ltd. | 3,700 | 64,660 |
| SBI Holdings, Inc. | 1,800 | 38,728 |
| Seiko Epson Corp. (1) | 1,559 | 22,145 |
www.calvert.com CALVERT INTERNATIONAL RESPONSIBLE INDEX FUND ANNUAL REPORT 17
|
| | |
| | SHARES | VALUE ($) |
| COMMON STOCKS - CONT’D | | |
| Sekisui Chemical Co. Ltd. | 4,072 | 63,369 |
| Sekisui House Ltd. | 6,070 | 119,774 |
| Seven & I Holdings Co. Ltd. | 8,301 | 318,138 |
| SG Holdings Co. Ltd. (1) | 1,300 | 31,858 |
| Sharp Corp. | 1,199 | 13,389 |
| Shimadzu Corp. | 2,026 | 51,515 |
| Shimano, Inc. | 672 | 101,542 |
| Shimizu Corp. (1) | 6,600 | 59,954 |
| Shin-Etsu Chemical Co. Ltd. | 3,437 | 369,857 |
| Shionogi & Co. Ltd. | 2,354 | 131,243 |
| Shiseido Co. Ltd. | 3,541 | 284,198 |
| SMC Corp. | 532 | 228,669 |
| SoftBank Group Corp. | 13,490 | 532,321 |
| Sompo Holdings, Inc. | 2,137 | 89,747 |
| Sony Corp. | 10,200 | 602,903 |
| Sony Financial Holdings, Inc. | 932 | 20,293 |
| Subaru Corp. | 5,208 | 147,283 |
| Sumitomo Chemical Co. Ltd. | 12,100 | 54,629 |
| Sumitomo Dainippon Pharma Co. Ltd. | 1,900 | 31,436 |
| Sumitomo Electric Industries Ltd. | 6,973 | 88,985 |
| Sumitomo Mitsui Financial Group, Inc. (1) | 10,053 | 345,442 |
| Sumitomo Mitsui Trust Holdings, Inc. | 2,216 | 80,246 |
| Suntory Beverage & Food Ltd. | 1,800 | 77,061 |
| Suzuken Co. Ltd. | 700 | 37,681 |
| Sysmex Corp. | 1,126 | 75,647 |
| T&D Holdings, Inc. | 4,719 | 50,426 |
| Taisho Pharmaceutical Holdings Co. Ltd. (1) | 500 | 36,560 |
| Taiyo Nippon Sanso Corp. | 1,300 | 26,423 |
| Takeda Pharmaceutical Co. Ltd. | 13,552 | 465,046 |
| TDK Corp. | 914 | 82,623 |
| Terumo Corp. | 6,246 | 202,109 |
| Tobu Railway Co. Ltd. | 1,617 | 52,531 |
| Toho Co. Ltd. | 900 | 39,505 |
| Tokio Marine Holdings, Inc. | 4,800 | 257,506 |
| Tokyo Electron Ltd. | 1,226 | 235,544 |
| Tokyu Corp. | 5,032 | 94,659 |
| Toray Industries, Inc. | 13,350 | 99,423 |
| TOTO Ltd. (1) | 1,064 | 40,071 |
| Toyota Industries Corp. | 1,375 | 79,391 |
| Toyota Motor Corp. | 22,683 | 1,523,395 |
| Trend Micro, Inc. | 993 | 47,454 |
| Unicharm Corp. | 3,802 | 120,843 |
| USS Co. Ltd. | 1,500 | 29,212 |
| West Japan Railway Co. | 1,510 | 127,763 |
18 www.calvert.com CALVERT INTERNATIONAL RESPONSIBLE INDEX FUND ANNUAL REPORT
|
| | |
| | SHARES | VALUE ($) |
| COMMON STOCKS - CONT’D | | |
| Yahoo Japan Corp. | 24,300 | 68,462 |
| Yakult Honsha Co. Ltd. | 2,186 | 122,717 |
| Yamaha Corp. | 1,344 | 60,594 |
| Yamaha Motor Co. Ltd. | 2,225 | 40,562 |
| Yaskawa Electric Corp. | 3,000 | 111,351 |
| Yokogawa Electric Corp. | 2,000 | 36,751 |
| ZOZO, Inc. (1) | 1,600 | 37,062 |
| | | 22,239,317 |
| | | |
| Luxembourg - 0.2% | | |
| Aroundtown SA | 9,616 | 78,653 |
| B&M European Value Retail SA | 9,527 | 44,422 |
| Eurofins Scientific SE (1) | 107 | 49,759 |
| SES SA FDR | 3,574 | 65,145 |
| | | 237,979 |
| | | |
| Netherlands - 3.3% | | |
| ABN AMRO Bank NV (3) | 4,256 | 74,975 |
| Adyen NV (2)(3) | 212 | 139,416 |
| Aegon NV | 16,977 | 70,508 |
| AerCap Holdings NV (2) | 1,186 | 64,934 |
| Akzo Nobel NV | 2,849 | 253,853 |
| Argenx SE (1)(2) | 399 | 45,279 |
| ASML Holding NV | 3,140 | 778,762 |
| ASR Nederland NV | 1,140 | 42,066 |
| Euronext NV (3) | 639 | 52,322 |
| GrandVision NV (3) | 755 | 22,609 |
| ING Groep NV | 32,007 | 334,368 |
| InterXion Holding NV (2) | 751 | 61,177 |
| Koninklijke Ahold Delhaize NV | 14,041 | 351,132 |
| Koninklijke DSM NV | 2,098 | 252,561 |
| Koninklijke KPN NV | 39,825 | 124,112 |
| Koninklijke Philips NV | 9,483 | 438,201 |
| Koninklijke Vopak NV | 1,312 | 67,435 |
| NN Group NV | 2,487 | 88,136 |
| NXP Semiconductors NV | 2,466 | 269,090 |
| QIAGEN NV (2) | 1,999 | 65,465 |
| Randstad NV | 961 | 47,181 |
| STMicroelectronics NV (4) | 1,813 | 35,085 |
| STMicroelectronics NV (4) | 3,487 | 67,563 |
| Takeaway.com NV (2)(3) | 381 | 30,360 |
| Wolters Kluwer NV | 2,884 | 210,431 |
| | | 3,987,021 |
| | | |
www.calvert.com CALVERT INTERNATIONAL RESPONSIBLE INDEX FUND ANNUAL REPORT 19
|
| | |
| | SHARES | VALUE ($) |
| COMMON STOCKS - CONT’D | | |
| New Zealand - 0.2% | | |
| a2 Milk Co., Ltd. (2) | 7,877 | 65,447 |
| Auckland International Airport Ltd. | 7,759 | 44,490 |
| Fisher & Paykel Healthcare Corp. Ltd. | 4,308 | 46,742 |
| Meridian Energy Ltd. | 10,196 | 33,207 |
| Xero Ltd. (2) | 729 | 30,739 |
| | | 220,625 |
| | | |
| Norway - 0.7% | | |
| DNB ASA | 7,881 | 138,926 |
| Gjensidige Forsikring ASA | 1,997 | 39,605 |
| Mowi ASA | 6,604 | 152,534 |
| Norsk Hydro ASA | 24,027 | 84,604 |
| Orkla ASA | 12,172 | 110,757 |
| Salmar ASA | 644 | 28,273 |
| Schibsted ASA, Class A | 1,510 | 44,686 |
| Telenor ASA | 6,066 | 121,708 |
| Tomra Systems ASA | 1,140 | 30,463 |
| Yara International ASA | 1,935 | 83,427 |
| | | 834,983 |
| | | |
| Portugal - 0.1% | | |
| EDP - Energias de Portugal SA | 29,557 | 114,706 |
| Jeronimo Martins SGPS SA | 3,252 | 54,840 |
| | | 169,546 |
| | | |
| Russia - 0.1% | | |
| Yandex NV, Class A (2) | 2,365 | 82,799 |
| | | |
| Singapore - 1.0% | | |
| BOC Aviation Ltd. (3) | 2,900 | 26,764 |
| CapitaLand Ltd. | 25,241 | 64,520 |
| City Developments Ltd. | 7,330 | 52,143 |
| DBS Group Holdings Ltd. | 15,829 | 286,364 |
| Oversea-Chinese Banking Corp. Ltd. | 37,571 | 295,361 |
| Singapore Airlines Ltd. | 7,056 | 46,670 |
| Singapore Exchange Ltd. | 6,600 | 40,491 |
| Singapore Telecommunications Ltd. | 10,700 | 24,095 |
| Singapore Telecommunications Ltd. | 58,312 | 130,837 |
| United Overseas Bank Ltd. | 11,159 | 207,390 |
| | | 1,174,635 |
| | | |
20 www.calvert.com CALVERT INTERNATIONAL RESPONSIBLE INDEX FUND ANNUAL REPORT
|
| | |
| | SHARES | VALUE ($) |
| COMMON STOCKS - CONT’D | | |
| South Korea - 3.1% | | |
| Amorepacific Corp. | 159 | 18,656 |
| Celltrion Healthcare Co. Ltd. (2) | 349 | 14,674 |
| Celltrion, Inc. (2) | 786 | 107,528 |
| Hana Financial Group, Inc. | 2,333 | 68,676 |
| Hanon Systems | 2,459 | 24,661 |
| Hyundai Mobis Co. Ltd. | 582 | 122,478 |
| Hyundai Motor Co. | 1,383 | 154,848 |
| Industrial Bank of Korea | 1,915 | 21,125 |
| Kakao Corp. | 386 | 43,701 |
| KB Financial Group, Inc. | 2,985 | 106,539 |
| Kia Motors Corp. | 2,192 | 83,575 |
| KT Corp. | 614 | 14,078 |
| LG Chem Ltd. | 520 | 130,025 |
| LG Corp. | 840 | 49,130 |
| LG Electronics, Inc. | 942 | 53,032 |
| LG Household & Health Care Ltd. | 71 | 77,491 |
| NAVER Corp. | 1,116 | 146,380 |
| NCSoft Corp. | 122 | 53,125 |
| Netmarble Corp. (2)(3) | 143 | 11,280 |
| Samsung Biologics Co. Ltd. (2)(3) | 153 | 39,269 |
| Samsung C&T Corp. | 553 | 41,433 |
| Samsung Electro-Mechanics Co. Ltd. | 504 | 43,369 |
| Samsung Electronics Co. Ltd. | 38,378 | 1,571,350 |
| Samsung Fire & Marine Insurance Co. Ltd. | 307 | 57,201 |
| Samsung Life Insurance Co. Ltd. | 425 | 25,256 |
| Samsung SDI Co. Ltd. | 413 | 76,888 |
| Samsung SDS Co. Ltd. | 234 | 37,238 |
| Shinhan Financial Group Co. Ltd. | 2,735 | 95,569 |
| SK Hynix, Inc. | 4,004 | 274,996 |
| SK Telecom Co. Ltd. | 361 | 72,743 |
| Woori Financial Group, Inc. | 2,393 | 24,875 |
| | | 3,661,189 |
| | | |
| Spain - 2.7% | | |
| Acciona SA | 220 | 23,283 |
| Aena SME SA (3) | 641 | 117,337 |
| Amadeus IT Group SA, Class A | 3,470 | 248,631 |
| Banco Bilbao Vizcaya Argentaria SA | 48,248 | 251,154 |
| Banco de Sabadell SA | 37,068 | 35,938 |
| Banco Santander SA | 123,497 | 502,487 |
| Bankia SA | 13,270 | 25,039 |
| Bankinter SA | 4,041 | 25,500 |
| CaixaBank SA | 22,001 | 57,708 |
www.calvert.com CALVERT INTERNATIONAL RESPONSIBLE INDEX FUND ANNUAL REPORT 21
|
| | |
| | SHARES | VALUE ($) |
| COMMON STOCKS - CONT’D | | |
| Cellnex Telecom SA (3) | 1,914 | 79,055 |
| EDP Renovaveis SA | 1,719 | 18,533 |
| Enagas SA | 4,625 | 106,914 |
| Fomento de Construcciones y Contratas SA | 1,846 | 21,163 |
| Grifols SA | 4,054 | 119,504 |
| Iberdrola SA | 66,512 | 691,310 |
| Industria de Diseno Textil SA | 10,221 | 316,315 |
| International Consolidated Airlines Group SA (4) | 16,783 | 97,953 |
| International Consolidated Airlines Group SA (4) | 7,334 | 42,738 |
| Mapfre SA | 10,241 | 27,582 |
| Red Electrica Corp. SA | 3,898 | 78,957 |
| Siemens Gamesa Renewable Energy SA (1) | 1,605 | 21,774 |
| Telefonica SA | 35,672 | 272,575 |
| | | 3,181,450 |
| | | |
| Sweden - 2.4% | | |
| AAK AB | 2,778 | 53,841 |
| Alfa Laval AB | 1,913 | 37,732 |
| Assa Abloy AB, Class B | 9,137 | 203,126 |
| Atlas Copco AB, Class A | 8,681 | 267,315 |
| Boliden AB | 4,754 | 109,183 |
| Castellum AB | 2,854 | 61,101 |
| Electrolux AB, Series B (1) | 2,234 | 52,924 |
| Elekta AB, Class B | 2,583 | 33,989 |
| Epiroc AB, Class A | 8,607 | 93,215 |
| Essity AB, Class B | 5,520 | 161,065 |
| Fabege AB | 1,673 | 27,560 |
| Fastighets AB Balder, Class B (2) | 730 | 27,636 |
| Hennes & Mauritz AB, Class B (1) | 6,321 | 122,529 |
| Hexagon AB, Class B | 2,280 | 109,828 |
| Husqvarna AB, Class B | 2,458 | 18,693 |
| ICA Gruppen AB | 1,096 | 50,617 |
| Industrivarden AB, Class A | 1,391 | 31,271 |
| Industrivarden AB, Class C | 49 | 1,072 |
| Investment AB Latour, Class B | 1,139 | 14,990 |
| Kinnevik AB, Class B | 1,797 | 47,246 |
| Nibe Industrier AB, Class B | 3,273 | 41,485 |
| Sandvik AB | 9,008 | 140,236 |
| Securitas AB, Class B | 3,041 | 46,567 |
| Skandinaviska Enskilda Banken AB, Class A | 11,467 | 105,367 |
| Skanska AB, Class B | 2,653 | 53,710 |
| SKF AB, Class B | 4,217 | 69,636 |
| Spotify Technology SA (2) | 832 | 94,848 |
| Svenska Cellulosa AB SCA, Class B | 5,908 | 52,645 |
22 www.calvert.com CALVERT INTERNATIONAL RESPONSIBLE INDEX FUND ANNUAL REPORT
|
| | |
| | SHARES | VALUE ($) |
| COMMON STOCKS - CONT’D | | |
| Svenska Handelsbanken AB, Class A | 11,368 | 106,349 |
| Swedbank AB, Class A | 7,409 | 106,702 |
| Swedish Orphan Biovitrum AB (2) | 1,815 | 27,767 |
| Tele2 AB, Class B (1) | 3,802 | 56,545 |
| Telefonaktiebolaget LM Ericsson, Class B | 22,288 | 177,999 |
| Telia Co. AB | 20,745 | 92,803 |
| Volvo AB, Class B | 14,905 | 209,164 |
| | | 2,906,756 |
| | | |
| Switzerland - 9.0% | | |
| ABB Ltd. | 16,948 | 333,297 |
| Adecco Group AG | 1,056 | 58,437 |
| Alcon, Inc. (2) | 3,992 | 232,853 |
| Baloise Holding AG | 279 | 49,990 |
| Banque Cantonale Vaudoise | 25 | 19,130 |
| Barry Callebaut AG | 26 | 53,626 |
| Chocoladefabriken Lindt & Sprungli AG PC | 13 | 96,014 |
| Chubb Ltd. | 3,321 | 536,142 |
| Cie Financiere Richemont SA | 3,777 | 276,800 |
| Clariant AG | 1,264 | 24,620 |
| Coca-Cola HBC AG | 2,100 | 68,587 |
| Dufry AG | 238 | 19,909 |
| Emmi AG | 28 | 22,827 |
| Flughafen Zuerich AG | 143 | 26,469 |
| Garmin Ltd. | 1,079 | 91,380 |
| Geberit AG | 248 | 118,515 |
| Givaudan SA | 86 | 240,028 |
| Helvetia Holding AG | 340 | 46,926 |
| Julius Baer Group Ltd. | 1,620 | 71,751 |
| Kuehne & Nagel International AG | 485 | 71,369 |
| Logitech International SA | 1,335 | 54,251 |
| Lonza Group AG | 730 | 247,040 |
| Nestle SA | 24,469 | 2,653,772 |
| Novartis AG | 17,481 | 1,517,123 |
| Partners Group Holding AG | 130 | 99,834 |
| PSP Swiss Property AG | 294 | 37,327 |
| Roche Holding AG | 5,701 | 1,659,929 |
| SGS SA | 36 | 89,241 |
| Sika AG | 1,116 | 163,284 |
| Sonova Holding AG | 442 | 102,845 |
| Straumann Holding AG | 75 | 61,346 |
| Swatch Group AG (The), Bearer Shares | 274 | 72,747 |
| Swiss Life Holding AG | 226 | 108,051 |
| Swiss Prime Site AG | 666 | 65,178 |
www.calvert.com CALVERT INTERNATIONAL RESPONSIBLE INDEX FUND ANNUAL REPORT 23
|
| | |
| | SHARES | VALUE ($) |
| COMMON STOCKS - CONT’D | | |
| Swiss Re AG | 2,058 | 214,739 |
| Swisscom AG | 195 | 96,208 |
| TE Connectivity Ltd. | 3,012 | 280,658 |
| Temenos AG | 450 | 75,352 |
| UBS Group AG | 23,974 | 272,211 |
| Vifor Pharma AG | 306 | 48,908 |
| Zurich Insurance Group AG | 993 | 380,327 |
| | | 10,759,041 |
| | | |
| Taiwan - 2.8% | | |
| Advantech Co. Ltd. | 3,000 | 26,388 |
| ASE Technology Holding Co. Ltd. | 16,904 | 38,487 |
| Cathay Financial Holding Co. Ltd. | 69,952 | 92,200 |
| Chang Hwa Commercial Bank Ltd. | 42,840 | 29,884 |
| China Steel Corp. | 223,000 | 165,301 |
| Chunghwa Telecom Co. Ltd. | 34,055 | 121,787 |
| Delta Electronics, Inc. | 16,319 | 69,721 |
| E.Sun Financial Holding Co. Ltd. | 114,091 | 96,514 |
| Far Eastern New Century Corp. | 27,000 | 24,900 |
| Far EasTone Telecommunications Co. Ltd. | 19,073 | 44,553 |
| First Financial Holding Co. Ltd. | 81,214 | 57,030 |
| Fubon Financial Holding Co. Ltd. | 57,000 | 81,836 |
| Hotai Motor Co. Ltd. | 3,000 | 45,567 |
| Hua Nan Financial Holdings Co. Ltd. | 98,310 | 66,357 |
| MediaTek, Inc. | 11,883 | 141,380 |
| Mega Financial Holding Co. Ltd. | 81,668 | 75,651 |
| Nanya Technology Corp. | 15,000 | 38,961 |
| President Chain Store Corp. | 7,828 | 73,171 |
| Quanta Computer, Inc. | 24,398 | 44,510 |
| Shanghai Commercial & Savings Bank Ltd. (The) | 21,000 | 35,277 |
| Taishin Financial Holding Co. Ltd. | 80,642 | 35,989 |
| Taiwan Cooperative Financial Holding Co. Ltd. | 69,425 | 45,852 |
| Taiwan High Speed Rail Corp. | 24,000 | 27,303 |
| Taiwan Mobile Co. Ltd. | 13,748 | 49,621 |
| Taiwan Semiconductor Manufacturing Co. Ltd. | 181,240 | 1,609,688 |
| Uni-President Enterprises Corp. | 56,000 | 135,136 |
| Yuanta Financial Holding Co. Ltd. | 91,000 | 54,299 |
| | | 3,327,363 |
| | | |
| United Kingdom - 13.6% | | |
| 3i Group plc | 11,398 | 163,132 |
| Admiral Group plc | 2,666 | 69,328 |
| Amcor plc (2) | 23,729 | 231,358 |
| Aon plc | 2,483 | 480,634 |
24 www.calvert.com CALVERT INTERNATIONAL RESPONSIBLE INDEX FUND ANNUAL REPORT
|
| | |
| | SHARES | VALUE ($) |
| COMMON STOCKS - CONT’D | | |
| Ashtead Group plc | 6,935 | 192,859 |
| Associated British Foods plc | 5,931 | 167,900 |
| AstraZeneca plc | 11,500 | 1,026,824 |
| Atlassian Corp. plc, Class A (2) | 1,643 | 206,098 |
| Auto Trader Group plc (3) | 10,168 | 63,730 |
| AVEVA Group plc | 874 | 39,714 |
| Aviva plc | 39,817 | 195,469 |
| Barratt Developments plc | 13,673 | 108,846 |
| Berkeley Group Holdings plc | 1,634 | 83,897 |
| BT Group plc | 95,503 | 209,477 |
| Bunzl plc | 4,708 | 123,064 |
| Burberry Group plc | 4,681 | 125,037 |
| Cineworld Group plc (1) | 8,608 | 24,099 |
| Coca-Cola European Partners plc | 3,709 | 205,664 |
| Compass Group plc | 19,468 | 500,964 |
| Croda International plc | 1,707 | 101,969 |
| Direct Line Insurance Group plc | 16,814 | 62,035 |
| DS Smith plc | 17,236 | 76,321 |
| Farfetch Ltd., Class A (1)(2) | 1,771 | 15,301 |
| Ferguson plc | 3,564 | 260,103 |
| GlaxoSmithKline plc | 45,142 | 967,600 |
| Halma plc | 5,463 | 132,234 |
| Hargreaves Lansdown plc | 3,421 | 87,345 |
| Hikma Pharmaceuticals plc | 2,069 | 55,933 |
| Hiscox Ltd. | 2,656 | 54,200 |
| HomeServe plc | 3,922 | 57,182 |
| Informa plc | 18,962 | 198,587 |
| InterContinental Hotels Group plc | 2,293 | 143,095 |
| Intermediate Capital Group plc | 2,914 | 52,107 |
| Intertek Group plc | 2,276 | 153,203 |
| Investec plc | 8,846 | 45,507 |
| ITV plc | 53,765 | 83,277 |
| J Sainsbury plc | 25,565 | 68,984 |
| JD Sports Fashion plc | 3,399 | 31,372 |
| Johnson Matthey plc | 2,613 | 98,146 |
| Just Eat plc (2) | 8,300 | 68,180 |
| Kingfisher plc | 22,536 | 57,273 |
| Legal & General Group plc | 57,428 | 175,289 |
| Liberty Global plc, Class A (2) | 8,173 | 202,282 |
| Linde plc | 4,971 | 962,982 |
| Lloyds Banking Group plc | 646,924 | 428,858 |
| London Stock Exchange Group plc | 3,383 | 303,792 |
| Marks & Spencer Group plc | 27,223 | 61,659 |
| Melrose Industries plc | 48,203 | 119,422 |
www.calvert.com CALVERT INTERNATIONAL RESPONSIBLE INDEX FUND ANNUAL REPORT 25
|
| | |
| | SHARES | VALUE ($) |
| COMMON STOCKS - CONT’D | | |
| Merlin Entertainments plc (3) | 8,121 | 45,187 |
| Micro Focus International plc | 4,430 | 62,251 |
| Mondi plc | 7,117 | 136,272 |
| National Grid plc | 42,679 | 462,098 |
| Next plc | 1,591 | 120,940 |
| NMC Health plc (1) | 871 | 29,030 |
| Ocado Group plc (2) | 7,446 | 121,114 |
| Pearson plc | 10,301 | 93,411 |
| Persimmon plc | 3,703 | 98,760 |
| Phoenix Group Holdings plc | 5,428 | 46,136 |
| Prudential plc | 23,285 | 421,953 |
| RELX plc | 22,967 | 545,460 |
| Rentokil Initial plc | 24,264 | 139,504 |
| Rightmove plc | 11,147 | 75,423 |
| RSA Insurance Group plc | 11,418 | 74,915 |
| Sage Group plc (The) | 13,787 | 117,164 |
| Schroders plc | 1,155 | 43,658 |
| Severn Trent plc | 3,199 | 85,149 |
| Smith & Nephew plc | 11,793 | 283,998 |
| Smiths Group plc | 5,925 | 114,328 |
| Spirax-Sarco Engineering plc | 1,009 | 97,211 |
| SSE plc | 14,746 | 225,582 |
| St James’s Place plc | 5,510 | 66,272 |
| Standard Chartered plc | 31,110 | 261,135 |
| Standard Life Aberdeen plc | 28,878 | 101,423 |
| Taylor Wimpey plc | 38,241 | 75,906 |
| TechnipFMC plc | 9,237 | 222,981 |
| Tesco plc | 118,661 | 350,818 |
| Unilever plc | 21,852 | 1,313,348 |
| United Utilities Group plc | 10,081 | 102,327 |
| Vodafone Group plc | 249,825 | 497,727 |
| Weir Group plc (The) | 4,302 | 75,361 |
| Whitbread plc | 1,745 | 92,100 |
| WM Morrison Supermarkets plc | 33,451 | 82,364 |
| WPP plc | 15,643 | 195,872 |
| | | 16,219,510 |
| | | |
| United States - 0.1% | | |
| Burford Capital Ltd. | 3,144 | 31,741 |
| Sensata Technologies Holding plc (2) | 2,063 | 103,274 |
| | | 135,015 |
| | | |
| Total Common Stocks (Cost $110,762,472) | | 117,400,458 |
| | | |
26 www.calvert.com CALVERT INTERNATIONAL RESPONSIBLE INDEX FUND ANNUAL REPORT
|
| | |
| | SHARES | VALUE ($) |
| SHORT TERM INVESTMENT OF CASH COLLATERAL FOR SECURITIES LOANED - 0.9% | | |
| State Street Navigator Securities Lending Government Money Market Portfolio, 2.07% | 1,013,429 | 1,013,429 |
| | | |
| Total Short Term Investment of Cash Collateral for Securities Loaned (Cost $1,013,429) | | 1,013,429 |
| | | |
| | | |
| TOTAL INVESTMENTS (Cost $111,775,901) - 99.5% | | 118,413,887 |
| Other assets and liabilities, net - 0.5% | | 652,163 |
NET ASSETS - 100.0% | | 119,066,050 |
| | | |
|
| | |
| NOTES TO SCHEDULE OF INVESTMENTS |
| |
| The country classifications used for financial reporting purposes may differ from the classifications determined by Calvert Research and Management (CRM). |
| (1) All or a portion of this security was on loan at September 30, 2019. The aggregate market value of securities on loan at September 30, 2019 was $2,980,181. |
| (2) Non-income producing security. |
| (3) Security is exempt from registration under Rule 144A of the Securities Act of 1933. These securities may be resold in transactions exempt from registration, normally to qualified institutional buyers. Total market value of Rule 144A securities amounts to $1,578,672, which represents 1.3% of the net assets of the Fund as of September 30, 2019. |
| (4) Securities are traded on separate exchanges for the same entity. |
| |
| Abbreviations: |
| ADR: | American Depositary Receipt | |
| FDR: | Fiduciary Depositary Receipt | |
| PC: | Participation Certificate | |
| PFC Shares: | Preference Shares | |
www.calvert.com CALVERT INTERNATIONAL RESPONSIBLE INDEX FUND ANNUAL REPORT 27
|
|
| At September 30, 2019, the concentration of the Fund’s investments in the various sectors, determined as a percentage of total investments, was as follows: |
|
| | |
| ECONOMIC SECTORS | % OF TOTAL INVESTMENTS* |
| Financials | 22.3 | % |
| Industrials | 13.9 | % |
| Health Care | 12.2 | % |
| Consumer Discretionary | 11.3 | % |
| Information Technology | 10.9 | % |
| Consumer Staples | 10.3 | % |
| Communication Services | 6.6 | % |
| Materials | 5.7 | % |
| Utilities | 3.9 | % |
| Real Estate | 2.4 | % |
| Energy | 0.5 | % |
| Total | 100.0 | % |
| * Does not include Short Term Investment of Cash Collateral for Securities Loaned. | |
| See notes to financial statements. |
28 www.calvert.com CALVERT INTERNATIONAL RESPONSIBLE INDEX FUND ANNUAL REPORT
CALVERT INTERNATIONAL RESPONSIBLE INDEX FUND
STATEMENT OF ASSETS AND LIABILITIES
September 30, 2019
|
| | | |
| ASSETS | |
Investments in securities of unaffiliated issuers, at value (identified cost $111,775,901) - including $2,980,181 of securities on loan |
| $118,413,887 |
|
| Cash | 655 |
|
| Cash denominated in foreign currency, at value (cost $252,692) | 252,257 |
|
| Receivable for investments sold | 8,945,250 |
|
| Receivable for capital shares sold | 671,831 |
|
| Dividends receivable | 310,155 |
|
| Securities lending income receivable | 1,045 |
|
| Tax reclaims receivable | 139,764 |
|
| Receivable from affiliate | 42,637 |
|
| Directors’ deferred compensation plan | 52,129 |
|
| Other assets | 4,301 |
|
| Total assets | 128,833,911 |
|
| | |
| LIABILITIES | |
| Payable for investments purchased | 24,754 |
|
| Payable for capital shares redeemed | 53,226 |
|
| Deposits for securities loaned | 1,013,429 |
|
| Payable to affiliates: | |
| Investment advisory fee | 12,377 |
|
| Administrative fee | 12,377 |
|
| Distribution and service fees | 6,935 |
|
| Sub-transfer agency fee | 2,321 |
|
| Directors’ deferred compensation plan | 52,129 |
|
| Accrued expenses | 101,216 |
|
| Demand note payable | 8,489,097 |
|
| Total liabilities | 9,767,861 |
|
| NET ASSETS |
| $119,066,050 |
|
| | |
| NET ASSETS CONSIST OF: | |
| Paid-in capital applicable to common stock | |
| (75,000,000 shares per class of $0.01 par value authorized) |
| $116,760,308 |
|
| Distributable earnings | 2,305,742 |
|
| Total |
| $119,066,050 |
|
| | |
| NET ASSET VALUE PER SHARE | |
| Class A (based on net assets of $34,344,385 and 1,505,525 shares outstanding) |
| $22.81 |
|
| Class I (based on net assets of $67,854,361 and 2,935,053 shares outstanding) |
| $23.12 |
|
| Class R6 (based on net assets of $16,867,304 and 729,635 shares outstanding) |
| $23.12 |
|
| | |
| OFFERING PRICE PER SHARE* | |
| Class A (100/95.25 of net asset value per share) |
| $23.95 |
|
| * On sales of $50,000 or more, the offering price of Class A shares is reduced. | |
| See notes to financial statements. |
www.calvert.com CALVERT INTERNATIONAL RESPONSIBLE INDEX FUND ANNUAL REPORT 29
CALVERT INTERNATIONAL RESPONSIBLE INDEX FUND
STATEMENT OF OPERATIONS
YEAR ENDED SEPTEMBER 30, 2019
|
| | | |
| INVESTMENT INCOME | |
| Dividend income (net of foreign taxes withheld of $373,158) |
| $3,390,999 |
|
| Interest income | 5,955 |
|
| Securities lending income, net | 24,958 |
|
| Total investment income | 3,421,912 |
|
| | |
| EXPENSES | |
| Investment advisory fee | 142,094 |
|
| Administrative fee | 131,841 |
|
| Distribution and service fees: | |
| Class A | 70,963 |
|
| Directors’ fees and expenses | 6,590 |
|
| Custodian fees | 131,990 |
|
| Transfer agency fees and expenses | 84,826 |
|
| Accounting fees | 44,897 |
|
| Professional fees | 35,405 |
|
| Registration fees | 74,812 |
|
| Reports to shareholders | 10,000 |
|
| Miscellaneous | 32,979 |
|
| Total expenses | 766,397 |
|
| Waiver and/or reimbursement of expenses by affiliate | (370,877) |
|
| Reimbursement of expenses-other | (2,694) |
|
| Net expenses | 392,826 |
|
| Net investment income | 3,029,086 |
|
| | |
| | |
| REALIZED AND UNREALIZED GAIN (LOSS) | |
| Net realized gain (loss) on: | |
| Investment securities | (5,510,111) |
|
| Foreign currency transactions | (36,236) |
|
| | (5,546,347) |
|
| | |
| Net change in unrealized appreciation (depreciation) on: | |
| Investment securities | 2,812,600 |
|
| Foreign currency | 328 |
|
| | 2,812,928 |
|
| | |
| Net realized and unrealized loss | (2,733,419) |
|
| | |
| Net increase in net assets resulting from operations |
| $295,667 |
|
| See notes to financial statements. |
30 www.calvert.com CALVERT INTERNATIONAL RESPONSIBLE INDEX FUND ANNUAL REPORT
CALVERT INTERNATIONAL RESPONSIBLE INDEX FUND
STATEMENTS OF CHANGES IN NET ASSETS
|
| | | | | | | |
| INCREASE (DECREASE) IN NET ASSETS | Year Ended September 30, 2019 | | Year Ended September 30, 2018 |
| Operations: | | | |
| Net investment income |
| $3,029,086 |
| |
| $2,127,188 |
|
| Net realized loss | (5,546,347) |
| | (534,756) |
|
| Net change in unrealized appreciation (depreciation) | 2,812,928 |
| | (851,144 | ) |
| Net increase in net assets resulting from operations | 295,667 |
| | 741,288 |
|
| | | | |
| Distributions to shareholders: | | | |
| Class A shares | (485,837) |
| | (109,069) |
|
| Class I shares | (1,756,165 | ) | | (789,465) |
|
| Total distributions to shareholders | (2,242,002) |
| | (898,534) |
|
| | | | |
| Capital share transactions: | | | |
| Class A shares | 9,896,812 |
| | 18,640,233 |
|
Class C shares (1) | — |
| | (437,424 | ) |
| Class I shares | (18,412,010) |
| | 57,589,636 |
|
Class R6 shares (2) | 16,859,470 |
| | — |
|
Class Y shares (1) | — |
| | (9,188,848 | ) |
| Net increase in net assets from capital share transactions | 8,344,272 |
| | 66,603,597 |
|
| | | | |
| TOTAL INCREASE IN NET ASSETS | 6,397,937 |
| | 66,446,351 |
|
| | | | |
| | | | |
| NET ASSETS | | | |
| Beginning of year | 112,668,113 |
| | 46,221,762 |
|
| End of year |
| $119,066,050 |
| |
| $112,668,113 |
|
| | | | |
| | | | |
(1) Effective December 8, 2017, Class C shares of the Fund converted to Class A shares and Class Y shares converted to Class I shares at net asset value. Thereafter, Class C shares and Class Y shares were terminated. |
(2) For the period from the commencement of operations, February 1, 2019, to September 30, 2019. |
| See notes to financial statements. |
www.calvert.com CALVERT INTERNATIONAL RESPONSIBLE INDEX FUND ANNUAL REPORT 31
CALVERT INTERNATIONAL RESPONSIBLE INDEX FUND
FINANCIAL HIGHLIGHTS
|
| | | | | | | | | | | | | |
| | Year Ended September 30, | | Period Ended September 30, | | |
| CLASS A SHARES | 2019 | | 2018 | | 2017 | | 2016 (1) | | |
| Net asset value, beginning | $23.18 | | $23.11 | | $20.03 | | $20.00 | | |
| Income from investment operations: | | | | | | | | | |
Net investment income (2) | 0.56 |
| | 0.62 |
| | 0.41 |
| | 0.43 |
| | |
| Net realized and unrealized gain (loss) | (0.51) |
| | (0.23) |
| | 3.10 |
| | (0.38) |
| | |
| Total from investment operations | 0.05 |
| | 0.39 |
| | 3.51 |
| | 0.05 |
| | |
| Distributions from: | | | | | | | | | |
| Net investment income | (0.42) |
| | (0.32) |
| | (0.43) |
| | (0.02) |
| | |
| Total distributions | (0.42) |
| | (0.32) |
| | (0.43) |
| | (0.02) |
| | |
| Total increase (decrease) in net asset value | (0.37) |
| | 0.07 |
| | 3.08 |
| | 0.03 |
| | |
| Net asset value, ending | $22.81 | | $23.18 | | $23.11 | | $20.03 | | |
Total return (3) | 0.34 | % | | 1.67 | % | | 17.98 | % | | 0.25 | % | (4) | |
Ratios to average net assets: (5) | | | | | | | | | |
| Total expenses | 0.89 | % | | 1.03 | % | | 3.00 | % | | 5.53 | % | (6) | |
| Net expenses | 0.57 | % | | 0.62 | % | | 0.62 | % | | 0.62 | % | (6) | |
| Net investment income | 2.56 | % | | 2.66 | % | | 1.96 | % | | 2.47 | % | (6) | |
| Portfolio turnover | 51 | % | | 24 | % | | 26 | % | | 35 | % | (4) | |
| Net assets, ending (in thousands) | $34,344 | | $24,415 | | $5,968 | | $3,714 | | |
| | | | | | | | | | |
(1) From October 30, 2015 inception. |
(2) Computed using average shares outstanding. |
(3) Returns are historical and are calculated by determining the percentage change in net asset value with all distributions reinvested and do not reflect the effect of sales charges, if any. |
(4) Not annualized. |
(5) Total expenses do not reflect amounts reimbursed and/or waived by the adviser and certain of its affiliates, if applicable. Net expenses are net of all reductions and represent the net expenses paid by the Fund. |
(6) Annualized. |
| See notes to financial statements. |
32 www.calvert.com CALVERT INTERNATIONAL RESPONSIBLE INDEX FUND ANNUAL REPORT
CALVERT INTERNATIONAL RESPONSIBLE INDEX FUND
FINANCIAL HIGHLIGHTS
|
| | | | | | | | | | | | | |
| | Year Ended September 30, | | Period Ended September 30, | | |
| CLASS I SHARES | 2019 | | 2018 | | 2017 | | 2016 (1) | | |
| Net asset value, beginning | $23.47 | | $23.32 | | $20.08 | | $20.00 | | |
| Income from investment operations: | | | | | | | | | |
Net investment income (2) | 0.60 |
| | 0.64 |
| | 0.63 |
| | 0.51 |
| | |
| Net realized and unrealized gain (loss) | (0.50) |
| | (0.17) |
| | 3.00 |
| | (0.40) |
| | |
| Total from investment operations | 0.10 |
| | 0.47 |
| | 3.63 |
| | 0.11 |
| | |
| Distributions from: | | | | | | | | | |
| Net investment income | (0.45) |
| | (0.32) |
| | (0.39) |
| | (0.03) |
| | |
| Total distributions | (0.45) |
| | (0.32) |
| | (0.39) |
| | (0.03) |
| | |
| Total increase (decrease) in net asset value | (0.35) |
| | 0.15 |
| | 3.24 |
| | 0.08 |
| | |
| Net asset value, ending | $23.12 | | $23.47 | | $23.32 | | $20.08 | | |
Total return (3) | 0.6 | % | | 2.04 | % | | 18.42 | % | | 0.56 | % | (4) | |
Ratios to average net assets: (5) | | | | | | | | | |
| Total expenses | 0.64 | % | | 0.79 | % | | 1.43 | % | | 4.81 | % | (6) | |
| Net expenses | 0.29 | % | | 0.27 | % | | 0.27 | % | | 0.27 | % | (6) | |
| Net investment income | 2.73 | % | | 2.71 | % | | 2.85 | % | | 2.90 | % | (6) | |
| Portfolio turnover | 51 | % | | 24 | % | | 26 | % | | 35 | % | (4) | |
| Net assets, ending (in thousands) | $67,854 | | $88,253 | | $30,815 | | $2,571 | | |
| | | | | | | | | | |
(1) From October 30, 2015 inception. |
(2) Computed using average shares outstanding. |
(3) Returns are historical and are calculated by determining the percentage change in net asset value with all distributions reinvested and do not reflect the effect of sales charges, if any. |
(4) Not annualized. |
(5) Total expenses do not reflect amounts reimbursed and/or waived by the adviser and certain of its affiliates, if applicable. Net expenses are net of all reductions and represent the net expenses paid by the Fund. |
(6) Annualized. |
| See notes to financial statements. |
www.calvert.com CALVERT INTERNATIONAL RESPONSIBLE INDEX FUND ANNUAL REPORT 33
CALVERT INTERNATIONAL RESPONSIBLE INDEX FUND
FINANCIAL HIGHLIGHTS
|
| | | | |
| | Period Ended September 30, 2019 (1) | | |
| CLASS R6 SHARES | | |
| Net asset value, beginning | $21.50 | | |
| Income from investment operations: | | | |
| Net investment income (2) | 0.51 |
| | |
| Net realized and unrealized gain | 1.11 |
| | |
| Total from investment operations | 1.62 |
| | |
| Total increase in net asset value | 1.62 |
| | |
| Net asset value, ending | $23.12 | | |
| Total return (3) | 7.54 | % | (4) | |
| Ratios to average net assets: (5) | | | |
| Total expenses | 0.56 | % | (6) | |
| Net expenses | 0.26 | % | (6) | |
| Net investment income | 3.40 | % | (6) | |
| Portfolio turnover | 51 | % | (7) | |
| Net assets, ending (in thousands) | $16,867 | | |
| | | | |
(1) For the period from the commencement of operations, February 1, 2019, to September 30, 2019. |
(2) Computed using average shares outstanding. |
(3) Returns are historical and are calculated by determining the percentage change in net asset value with all distributions reinvested and do not reflect the effect of sales charges, if any. |
(4) Not annualized. |
(5) Total expenses do not reflect amounts reimbursed and/or waived by the adviser and certain of its affiliates, if applicable. Net expenses are net of all reductions and represent the net expenses paid by the Fund. |
(6) Annualized. |
(7) For the year ended September 30, 2019. |
| See notes to financial statements. |
34 www.calvert.com CALVERT INTERNATIONAL RESPONSIBLE INDEX FUND ANNUAL REPORT
NOTES TO FINANCIAL STATEMENTS
NOTE 1 — SIGNIFICANT ACCOUNTING POLICIES
Calvert International Responsible Index Fund (the Fund) is a diversified series of Calvert Responsible Index Series, Inc. (the Corporation). The Corporation is a Maryland corporation registered under the Investment Company Act of 1940, as amended (the 1940 Act), as an open-end management investment company. The investment objective of the Fund is to seek to track the performance of the Calvert International Responsible Index, which measures the investment return of stocks issued by companies that are located in countries (other than the U.S.) with developed markets.
The Fund offers three classes of shares. Class A shares are generally sold subject to a sales charge imposed at time of purchase. A contingent deferred sales charge of 0.25% may apply to certain redemptions of Class A shares for accounts for which no sales charge was paid, if redeemed within 12 months of purchase. Class I and Class R6 shares are sold at net asset value, are not subject to a sales charge and are sold only to certain eligible investors. Each class represents a “pro rata interest in the Fund, but votes separately on class-specific matters and is subject to different expenses.
The Fund applies the accounting and reporting guidance in the Financial Accounting Standards Board (FASB) Accounting Standards Codification Topic 946, Financial Services – Investment Companies (ASC 946). Subsequent events, if any, through the date that the financial statements were issued have been evaluated in the preparation of the financial statements.
A. Investment Valuation: Net asset value per share is determined every business day as of the close of the regular session of the New York Stock Exchange (generally 4:00 p.m. Eastern time). The Fund uses independent pricing services approved by the Board of Directors (the Board) to value its investments wherever possible. Investments for which market quotations are not available or deemed not reliable are fair valued in good faith under the direction of the Board.
U.S. generally accepted accounting principles (U.S. GAAP) establishes a disclosure hierarchy that categorizes the inputs to valuation techniques used to value assets and liabilities at measurement date. These inputs are summarized in the three broad levels listed below:
Level 1 - quoted prices in active markets for identical securities
Level 2 - other significant observable inputs (including quoted prices for similar securities, interest rates, prepayment speeds, credit risk, etc.)
Level 3 - significant unobservable inputs (including the Fund’s own assumptions in determining the fair value of investments)
The inputs or methodologies used for valuing securities are not necessarily an indication of the risk associated with investing in those securities.
Valuation techniques used to value the Fund’s investments by major category are as follows:
Equity Securities. Equity securities (including warrants and rights) listed on a U.S. securities exchange generally are valued at the last sale or closing price as reported by an independent pricing service on the primary market or exchange on which they are traded and are categorized as Level 1 in the hierarchy. Equity securities listed on the NASDAQ Global or Global Select Market are valued at the NASDAQ official closing price and are categorized as Level 1 in the hierarchy. Unlisted or listed securities for which closing sales prices or closing quotations are not available are valued at the mean between the latest available bid and ask prices and are categorized as Level 2 in the hierarchy. The daily valuation of exchange-traded foreign securities generally is determined as of the close of trading on the principal exchange on which such securities trade. Events occurring after the close of trading on foreign exchanges may result in adjustments to the valuation of foreign securities to more accurately reflect their fair value as of the close of regular trading on the New York Stock Exchange. When valuing foreign equity securities that meet certain criteria, the Fund’s Board has approved the use of a fair value service that values such securities to reflect market trading that occurs after the close of the applicable foreign markets of comparable securities or other instruments that have a strong correlation to the fair-valued securities. Such securities are categorized as Level 2 in the hierarchy.
Other Securities. Investments in registered investment companies (including money market funds) that do not trade on an exchange are valued at the net asset value per share on the valuation day and are categorized as Level 1 in the hierarchy.
Fair Valuation. If a market value cannot be determined for a security using the methodologies described above, or if, in the good faith opinion of the Fund’s adviser, the market value does not constitute a readily available market quotation, or if a significant event has occurred that would materially affect the value of the security, the security will be fair valued as determined in good faith by or at the direction of the Board in a manner that most fairly reflects the security’s “fair value”, which is the amount that the Fund might reasonably expect to receive for the security upon its current sale in the ordinary course. Each such determination is based on a consideration of relevant factors, which are likely to vary from one pricing context to another. These factors may include, but are not limited to, the type of security, the existence of any contractual restrictions on the security’s disposition, the
www.calvert.com CALVERT INTERNATIONAL RESPONSIBLE INDEX FUND ANNUAL REPORT 35
price and extent of public trading in similar securities of the issuer or of comparable companies or entities, quotations or relevant information obtained from broker/dealers or other market participants, information obtained from the issuer, analysts, and/or the appropriate stock exchange (for exchange-traded securities), an analysis of the company’s or entity’s financial statements, and an evaluation of the forces that influence the issuer and the market(s) in which the security is purchased and sold.
The values assigned to fair value investments are based on available information and do not necessarily represent amounts that might ultimately be realized. Further, due to the inherent uncertainty of valuations of such investments, the fair values may differ significantly from the values that would have been used had an active market existed, and the differences could be material.
The following table summarizes the market value of the Fund’s holdings as of September 30, 2019, based on the inputs used to value them:
|
| | | | | | | | | | | | | |
| Assets | Level 1 | Level 2 | | Level 3 | Total |
| Common Stocks | | | | | |
| Australia | $ | 119,598 |
| $ | 6,117,331 |
| | $ | — |
| $ | 6,236,929 |
|
| Canada | 9,960,449 |
| — |
| | — |
| 9,960,449 |
|
| Denmark | 35,831 |
| 1,915,064 |
| | — |
| 1,950,895 |
|
| Germany | 28,497 |
| 8,287,906 |
| | — |
| 8,316,403 |
|
| Ireland | 128,595 |
| 1,054,610 |
| | — |
| 1,183,205 |
|
| Israel | 207,117 |
| 340,044 |
| | — |
| 547,161 |
|
| Netherlands | 395,201 |
| 3,591,820 |
| | — |
| 3,987,021 |
|
| Russia | 82,799 |
| — |
| | — |
| 82,799 |
|
| Sweden | 94,848 |
| 2,811,908 |
| | — |
| 2,906,756 |
|
| Switzerland | 908,180 |
| 9,850,861 |
| | — |
| 10,759,041 |
|
| United Kingdom | 2,527,300 |
| 13,692,210 |
| | — |
| 16,219,510 |
|
| United States | 103,274 |
| 31,741 |
| | — |
| 135,015 |
|
Other Countries(1) | — |
| 55,115,274 |
| | — |
| 55,115,274 |
|
| Total Common Stocks | $ | 14,591,689 |
| $ | 102,808,769 |
| (2) | $ | — |
| $ | 117,400,458 |
|
| Short Term Investment of Cash Collateral for Securities Loaned | 1,013,429 |
| — |
| | — |
| 1,013,429 |
|
| Total Investments | $ | 15,605,118 |
| $ | 102,808,769 |
| | $ | — |
| $ | 118,413,887 |
|
| | | | | | |
(1) For further breakdown of equity securities by country, please refer to the Schedule of Investments. |
(2) Includes foreign equity securities whose values were adjusted to reflect market trading of comparable securities or other correlated instruments that occurred after the close of trading in their applicable foreign markets. |
B. Investment Transactions and Income: Investment transactions for financial statement purposes are accounted for on trade date. Realized gains and losses are recorded on an identified cost basis and may include proceeds from litigation. Dividend income is recorded on the ex-dividend date for dividends received in cash and/or securities or, in the case of dividends on certain foreign securities, as soon as the Fund is informed of the ex-dividend date. Non-cash dividends are recorded at the fair value of the securities received. Withholding taxes on foreign dividends, if any, have been provided for in accordance with the Fund’s understanding of the applicable country’s tax rules and rates. Distributions received that represent a return of capital are recorded as a reduction of cost of investments. Distributions received that represent a capital gain are recorded as a realized gain. Interest income is accrued as earned.
C. Share Class Accounting: Realized and unrealized gains and losses and net investment income and losses, other than class-specific expenses, are allocated daily to each class of shares based upon the relative net assets of each class to the total net assets of the Fund. Expenses arising in connection with a specific class are charged directly to that class. Sub-accounting, recordkeeping and similar administrative fees payable to financial intermediaries, which are a component of transfer agency fees and expenses on the Statement of Operations, are not allocated to Class R6 shares.
D. Foreign Currency Transactions: The Fund’s accounting records are maintained in U.S. dollars. For valuation of assets and liabilities on each date of net asset value determination, foreign denominations are converted into U.S. dollars using the current exchange rate. Security transactions, income, and expenses are translated at the prevailing rate of exchange on the date of the event. Recognized gains or losses on investment transactions attributable to changes in foreign currency exchange rates are recorded for financial statement purposes as net realized gains and losses on investments. That portion of unrealized gains and losses on investments that results from fluctuations in foreign currency exchange rates is not separately disclosed.
36 www.calvert.com CALVERT INTERNATIONAL RESPONSIBLE INDEX FUND ANNUAL REPORT
E. Distributions to Shareholders: Distributions to shareholders are recorded by the Fund on ex-dividend date. Dividends from net investment income and distributions from net realized capital gains, if any, are paid at least annually. Distributions are determined in accordance with income tax regulations which may differ from U.S. GAAP; accordingly, periodic reclassifications are made within the Fund’s capital accounts to reflect income and gains available for distribution under income tax regulations.
F. Estimates: The preparation of financial statements in conformity with U.S. GAAP requires management to make estimates and assumptions that affect the reported amounts of assets and liabilities and disclosure of contingent assets and liabilities at the date of the financial statements and the reported amounts of increases and decreases in net assets from operations during the reporting period. Actual results could differ from those estimates.
G. Indemnifications: The Corporation’s By-Laws provide for indemnification for Directors or officers of the Corporation and certain other parties, to the fullest extent permitted by Maryland law and the 1940 Act, provided certain conditions are met. Additionally, in the normal course of business, the Fund enters into agreements with service providers that may contain indemnification clauses. The Fund’s maximum exposure under these arrangements is unknown as this would involve future claims that may be made against the Fund that have not yet occurred.
H. Federal Income Taxes: No provision for federal income or excise tax is required since the Fund intends to continue to qualify as a regulated investment company under the Internal Revenue Code and to distribute substantially all of its taxable earnings.
Management has analyzed the Fund’s tax positions taken for all open federal income tax years and has concluded that no provision for federal income tax is required in the Fund’s financial statements. A Fund’s federal tax return is subject to examination by the Internal Revenue Service for a period of three years from the date of filing.
NOTE 2 — RELATED PARTY TRANSACTIONS
The investment advisory fee is earned by Calvert Research and Management (CRM), a subsidiary of Eaton Vance Management (EVM), as compensation for investment advisory services rendered to the Fund. Pursuant to the investment advisory agreement, CRM receives a fee, payable monthly, at the annual rate of 0.12% (0.15% prior to February 1, 2019) of the Fund’s average daily net assets. For the year ended September 30, 2019, the investment advisory fee amounted to $142,094.
CRM has agreed to reimburse the Fund’s operating expenses to the extent that total annual operating expenses (relating to ordinary operating expenses only and excluding expenses such as brokerage commissions, acquired fund fees and expenses of unaffiliated funds, interest expense, taxes or litigation expenses) exceed 0.54% and 0.29% (0.62% and 0.27% prior to February 1, 2019) Class A and Class I, respectively, and 0.26% for Class R6 of such class’ average daily net assets. The expense reimbursement agreement with CRM may be changed or terminated after January 31, 2020. For the year ended September 30, 2019, CRM waived or reimbursed expenses of $370,877.
The administrative fee is earned by CRM as compensation for administrative services rendered to the Fund. The fee is computed at an annual rate of 0.12% of the Fund’s average daily net assets attributable to Class A, Class I and Class R6 and is payable monthly. For the year ended September 30, 2019, CRM was paid administrative fees of $131,841.
The Fund has in effect a distribution plan for Class A shares (Class A Plan) pursuant to Rule 12b-1 under the 1940 Act. Pursuant to the Class A Plan, the Fund pays Eaton Vance Distributors, Inc. (EVD), an affiliate of CRM and the Fund’s principal underwriter, a distribution and service fee of 0.25% per annum of its average daily net assets attributable to Class A shares for distribution services and facilities provided to the Fund by EVD, as well as for personal services and/or the maintenance of shareholder accounts. Distribution and service fees paid or accrued for the year ended September 30, 2019 amounted to $70,963 for Class A shares.
The Fund was informed that EVD received $4,459 as its portion of the sales charge on sales of Class A shares for the year ended September 30, 2019.
EVM provides sub-transfer agency and related services to the Fund pursuant to a Sub-Transfer Agency Support Services Agreement. For the year ended September 30, 2019, sub-transfer agency fees and expenses incurred to EVM amounted to $9,210 and are included in transfer agency fees and expenses on the Statement of Operations.
Each Director of the Fund who is not an employee of CRM or its affiliates receives a fee of $3,000 for each Board meeting attended in person and $2,000 for each Board meeting attended by phone plus an annual fee of $117,000, and $1,500 for each Committee meeting attended in person and $1,000 for each Committee meeting attended by phone plus an annual Committee fee of $2,500. The Board chair receives an additional $15,000 annual retainer and Committee chairs receive an additional $6,000 annual retainer. Eligible Directors may participate in a Deferred Compensation Plan (the Plan). Amounts deferred under the Plan are treated as though equal dollar amounts had been invested in shares of the Fund or other Calvert funds selected by the Directors. The Fund purchases shares of the funds selected equal to the dollar amounts deferred under the Plan, resulting in an asset equal to the deferred compensation liability. Obligations of the Plan are paid solely from the Fund’s assets. Directors’ fees
www.calvert.com CALVERT INTERNATIONAL RESPONSIBLE INDEX FUND ANNUAL REPORT 37
are allocated to each of the Calvert funds served. Salaries and fees of officers and Directors of the Fund who are employees of CRM or its affiliates are paid by CRM. In addition, an advisory council was established to aid the Board and CRM in advancing the cause of responsible investing through original scholarship and thought leadership. The advisory council consists of CRM’s Chief Executive Officer and four additional members. Each member (other than CRM’s Chief Executive Officer) receives annual compensation of $75,000, which is being reimbursed by Calvert Investment Management, Inc. (CIM), the Calvert funds’ former investment adviser and Ameritas Holding Company, CIM’s parent company, through the end of 2019. For the year ended September 30, 2019, the Fund’s allocated portion of such expense and reimbursement was $2,694, which are included in miscellaneous expense and reimbursement of expenses-other, respectively, on the Statement of Operations.
NOTE 3 — INVESTMENT ACTIVITY
During the year ended September 30, 2019, the cost of purchases and proceeds from sales of investments, other than short-term securities, were $63,774,657 and $55,585,875, respectively.
NOTE 4 — DISTRIBUTIONS TO SHAREHOLDERS AND INCOME TAX INFORMATION
The tax character of distributions declared for the years ended September 30, 2019 and September 30, 2018 was as follows:
|
| | | | | | |
| | Year Ended
September 30, |
| | 2019 | 2018 |
| Ordinary income |
| $2,242,002 |
|
| $898,534 |
|
During the year ended September 30, 2019, distributable earnings was decreased by $551,141 and paid-in capital was increased by $551,141 due to the Fund’s use of equalization accounting. Tax equalization accounting allows the Fund to treat as a distribution that portion of redemption proceeds representing a redeeming shareholder’s portion of undistributed taxable income and net capital gains. These reclassifications had no effect on the net assets or net asset value per share of the Fund.
As of September 30, 2019, the components of distributable earnings (accumulated loss) on a tax basis were as follows:
|
| | | |
| Undistributed ordinary income |
| $2,107,823 |
|
| Deferred capital losses |
| ($2,977,690 | ) |
| Net unrealized appreciation (depreciation) |
| $3,175,609 |
|
At September 30, 2019, the Fund, for federal income tax purposes, had deferred capital losses of $2,977,690 which would reduce the Fund’s taxable income arising from future net realized gains on investment transactions, if any, to the extent permitted by the Internal Revenue Code, and thus would reduce the amount of distributions to shareholders, which would otherwise be necessary to relieve the Fund of any liability for federal income or excise tax. The deferred capital losses are treated as arising on the first day of the Fund’s next taxable year, can be carried forward for an unlimited period, and retain the same short-term or long-term character as when originally deferred. Of the deferred capital losses at September 30, 2019, $2,177,798 are short-term and $799,892 are long term.
The cost and unrealized appreciation (depreciation) of investments of the Fund at September 30, 2019, as determined on a federal income tax basis, were as follows:
|
| | | |
| Aggregate cost |
| $115,236,745 |
|
| Gross unrealized appreciation |
| $8,727,156 |
|
| Gross unrealized depreciation | (5,550,014 | ) |
| Net unrealized appreciation (depreciation) |
| $3,177,142 |
|
NOTE 5 — SECURITIES LENDING
To generate additional income, the Fund may lend its securities pursuant to a securities lending agency agreement with State Street Bank and Trust Company (SSBT), the securities lending agent. Security loans are subject to termination by the Fund at any time and, therefore, are not considered illiquid investments. The Fund requires that the loan be continuously collateralized by either cash or securities as collateral equal at all times to at least 102% of the market value of the domestic securities loaned and 105% of the market value of the international securities loaned (if applicable). The market value of securities loaned is determined daily and any additional required collateral is delivered to the Fund on the next business day. Cash collateral is generally invested in a money market fund registered under the 1940 Act that is managed by an affiliate of SSBT. Any gain or loss in the market
38 www.calvert.com CALVERT INTERNATIONAL RESPONSIBLE INDEX FUND ANNUAL REPORT
price of the loaned securities that might occur and any interest earned or dividends declared during the term of the loan would accrue to the account of the Fund. Income earned on the investment of collateral, net of broker rebates and other expenses incurred by the securities lending agent, is split between the Fund and the securities lending agent on the basis of agreed upon contractual terms. Non-cash collateral, if any, is held by the lending agent on behalf of the Fund and cannot be sold or re-pledged by the Fund; accordingly, such collateral is not reflected in the Statement of Assets and Liabilities.
The risks associated with lending portfolio securities include, but are not limited to, possible delays in receiving additional collateral or in the recovery of the loaned securities, possible loss of rights to the collateral should the borrower fail financially, as well as risk of loss in the value of the collateral or the value of the investments made with the collateral. The securities lending agent shall indemnify the Fund in the case of default of any securities borrower.
At September 30, 2019, the total value of securities on loan was $2,980,181 and the total value of collateral received was $3,146,719, comprised of cash of $1,013,429 and U.S. government and/or agencies securities of $2,133,290.
The following table provides a breakdown of securities lending transactions accounted for as secured borrowings, the obligations by class of collateral pledged, and the remaining contractual maturity of those transactions as of September 30, 2019.
|
| | | | | | | | | | | | | | | |
| | Remaining Contractual Maturity of the Transactions |
| | Overnight and Continuous | <30 days | 30 to 90 days | >90 days | Total |
| Securities Lending Transactions | | | | | |
| Common Stocks |
| $3,146,719 |
|
| $— |
|
| $— |
|
| $— |
|
| $3,146,719 |
|
The carrying amount of the liability for deposits for securities loaned at September 30, 2019 approximated its fair value. If measured at fair value, such liability would have been considered as Level 2 in the fair value hierarchy (see Note 1A) at September 30, 2019.
NOTE 6 — LINE OF CREDIT
The Fund participates with other funds managed by CRM in a $100 million ($62.5 million prior to June 21, 2019) committed unsecured line of credit agreement with SSBT, which is in effect through June 19, 2020. Borrowings may be made for temporary or emergency purposes only. Borrowings bear interest at the higher of the One-Month London Interbank Offered Rate (LIBOR) in effect that day or the overnight Federal Funds Rate, plus 1.00% per annum. A commitment fee of 0.20% per annum is incurred on the unused portion of the committed facility. An administrative fee of $37,500 was incurred in connection with the increase of the facility in June 2019. These fees are allocated to all participating funds. Because the line of credit is not available exclusively to the Fund, it may be unable to borrow some or all of its requested amounts at any particular time. At September 30, 2019, the Fund had a balance outstanding pursuant to the line of credit of $8,489,097 at an interest rate of 3.02%. Based on the short-term nature of the borrowings under the line of credit and variable interest rate, the carrying value of the borrowings approximated its fair value at September 30, 2019. If measured at fair value, borrowings under the line of credit would have been considered as Level 2 in the fair value hierarchy (See Note 1A) at September 30, 2019. The Fund did not have any significant borrowings or allocated fees during the year ended September 30, 2019.
Effective at the close of business on October 28, 2019, the Fund and other participating funds managed by CRM terminated the line of credit agreement. Effective October 29, 2019, the Fund participates with other funds managed by EVM and its affiliates, including CRM, in an $800 million unsecured line of credit agreement with a syndicate of banks, which is in effect through October 27, 2020, at terms that are more favorable than the terminated agreement.
www.calvert.com CALVERT INTERNATIONAL RESPONSIBLE INDEX FUND ANNUAL REPORT 39
NOTE 7 — CAPITAL SHARES
Transactions in capital shares for the years ended September 30, 2019 and September 30, 2018 were as follows:
|
| | | | | | | | | | | |
| | Year Ended
September 30, 2019 | | Year Ended
September 30, 2018 |
| | Shares | Amount | | Shares | Amount |
| Class A | | | | | |
| Shares sold | 703,350 |
|
| $15,299,942 |
| | 895,591 |
|
| $20,996,189 |
|
| Reinvestment of distributions | 10,990 |
| 232,322 |
| | 4,353 |
| 102,689 |
|
| Shares redeemed | (261,852 | ) | (5,635,452 | ) | | (125,555 | ) | (2,940,089 | ) |
| Converted from Class C | — |
| — |
| | 20,436 |
| 481,444 |
|
| Net increase | 452,488 |
|
| $9,896,812 |
| | 794,825 |
|
| $18,640,233 |
|
| | | | | | |
Class C (1) | | | | | |
| Shares sold | — |
| $— |
| | 2,525 |
|
| $58,247 |
|
| Shares redeemed | — |
| — |
| | (614 | ) | (14,227 | ) |
| Converted to Class A | — |
| — |
| | (20,667 | ) | (481,444 | ) |
| Net decrease | — |
| $— |
| | (18,756 | ) |
| ($437,424 | ) |
| | | | | | |
| Class I | | | | | |
| Shares sold | 1,993,882 |
|
| $43,601,493 |
| | 2,323,891 |
|
| $54,818,645 |
|
| Reinvestment of distributions | 82,038 |
| 1,753,971 |
| | 33,082 |
| 788,017 |
|
| Shares redeemed | (2,901,221 | ) | (63,767,474 | ) | | (331,397 | ) | (7,841,439 | ) |
| Converted from Class Y | — |
| — |
| | 413,119 |
| 9,824,413 |
|
| Net increase (decrease) | (825,301 | ) |
| ($18,412,010 | ) | | 2,438,695 |
|
| $57,589,636 |
|
| | | | | | |
Class R6 (2) | | | | | |
| Shares sold | 1,337,787 |
|
| $30,718,857 |
| | — |
|
| $— |
|
| Shares redeemed | (608,152 | ) |
| ($13,859,387 | ) | | | |
| Net increase | 729,635 |
|
| $16,859,470 |
| | — |
|
| $— |
|
| | | | | | |
Class Y (1) | | | | | |
| Shares sold | — |
|
| $— |
| | 32,376 |
|
| $760,383 |
|
| Shares redeemed | — |
| — |
| | (5,322 | ) | (124,818 | ) |
| Converted to Class I | — |
| — |
| | (417,047 | ) | (9,824,413 | ) |
| Net decrease | — |
|
| $— |
| | (389,993 | ) |
| ($9,188,848 | ) |
| | | | | | |
(1) Effective December 8, 2017, Class C shares of the Fund converted to Class A shares and Class Y shares converted to Class I shares at net asset value. Thereafter, Class C shares and Class Y shares were terminated. |
(2) For the period from the commencement of operations, February 1, 2019, to September 30, 2019. |
NOTE 8 — RISKS ASSOCIATED WITH FOREIGN INVESTMENTS
Investing in foreign securities involves additional risks relating to political, social, and economic developments abroad. Other risks result from differences between regulations that apply to U.S. and foreign issuers and markets, and the potential for foreign markets to be less liquid and more volatile than U.S. markets. Securities that trade or are denominated in currencies other than the U.S. dollar may be adversely affected by fluctuations in currency exchange rates.
40 www.calvert.com CALVERT INTERNATIONAL RESPONSIBLE INDEX FUND ANNUAL REPORT
REPORT OF INDEPENDENT REGISTERED PUBLIC ACCOUNTING FIRM
To the Shareholders and Board of Directors
Calvert Responsible Index Series, Inc.:
Opinion on the Financial Statements
We have audited the accompanying statement of assets and liabilities of Calvert International Responsible Index Fund (the Fund), a series of Calvert Responsible Index Series, Inc., including the schedule of investments, as of September 30, 2019, the related statement of operations for the year then ended, the statements of changes in net assets for each of the years in the two‑year period then ended, and the related notes (collectively, the financial statements) and the financial highlights for each of the years or periods in the four‑year period then ended. In our opinion, the financial statements and financial highlights present fairly, in all material respects, the financial position of the Fund as of September 30, 2019, the results of its operations for the year then ended, the changes in its net assets for each of the years in the two‑year period then ended, and the financial highlights for each of the years or periods in the four‑year period then ended, in conformity with U.S. generally accepted accounting principles.
Basis for Opinion
These financial statements and financial highlights are the responsibility of the Fund’s management. Our responsibility is to express an opinion on these financial statements and financial highlights based on our audits. We are a public accounting firm registered with the Public Company Accounting Oversight Board (United States) (PCAOB) and are required to be independent with respect to the Fund in accordance with the U.S. federal securities laws and the applicable rules and regulations of the Securities and Exchange Commission and the PCAOB.
We conducted our audits in accordance with the standards of the PCAOB. Those standards require that we plan and perform the audit to obtain reasonable assurance about whether the financial statements and financial highlights are free of material misstatement, whether due to error or fraud. Our audits included performing procedures to assess the risks of material misstatement of the financial statements and financial highlights, whether due to error or fraud, and performing procedures that respond to those risks. Such procedures included examining, on a test basis, evidence regarding the amounts and disclosures in the financial statements and financial highlights. Such procedures also included confirmation of securities owned as of September 30, 2019, by correspondence with the custodian and brokers. Our audits also included evaluating the accounting principles used and significant estimates made by management, as well as evaluating the overall presentation of the financial statements and financial highlights. We believe that our audits provide a reasonable basis for our opinion.
We have served as the auditor of one or more of the Calvert Funds since 2002.
Philadelphia, Pennsylvania
November 20, 2019
www.calvert.com CALVERT INTERNATIONAL RESPONSIBLE INDEX FUND ANNUAL REPORT 41
FEDERAL TAX INFORMATION
The Form 1099-DIV you receive in February 2020 will show the tax status of all distributions paid to your account in calendar year 2019. Shareholders are advised to consult their own tax adviser with respect to the tax consequences of their investment in the Fund. As required by the Internal Revenue Code and/or regulations, shareholders must be notified regarding the status of qualified dividend income for individuals and the foreign tax credit.
Qualified Dividend Income. For the fiscal year ended September 30, 2019, the Fund designates approximately $2,640,477, or up to the maximum amount of such dividends allowable pursuant to the Internal Revenue Code, as qualified dividend income eligible for the reduced tax rate of 15%.
Foreign Tax Credit. For the fiscal year ended September 30, 2019, the Fund paid foreign taxes of $266,993 and recognized foreign source income of $3,069,835.
42 www.calvert.com CALVERT INTERNATIONAL RESPONSIBLE INDEX FUND ANNUAL REPORT (Unaudited)
MANAGEMENT AND ORGANIZATION
Fund Management. The Directors of Calvert Responsible Index Series, Inc. (the Corporation) are responsible for the overall management and supervision of the Corporation’s affairs. The Directors and officers of the Corporation are listed below. Except as indicated, each individual has held the office shown or other offices in the same company for the last five years. Directors and officers of the Corporation hold indefinite terms of office. The “Independent Directors” consist of those Directors who are not “interested persons” of the Corporation, as that term is defined under the 1940 Act. The business address of each Director and officer, with the exception of Ms. Gemma and Mr. Kirchner, is 1825 Connecticut Avenue NW, Suite 400, Washington, DC 20009. As used below, “CRM” refers to Calvert Research and Management. Each Director oversees 39 funds in the Calvert fund complex. Each officer serves as an officer of certain other Calvert funds.
|
| | | |
| Name and Year of Birth |
Corporation Position(s) | Position
Start Date | Principal Occupation(s) and Other Directorships
During Past Five Years and Other Relevant Experience |
| | | | |
| Interested Director | | | |
John H. Streur(1)
1960 | Director & President | 2015 | President and Chief Executive Officer of Calvert Research and Management (since December 31, 2016). President and Chief Executive Officer of Calvert Investments, Inc. (January 2015 - December 2016); Chief Executive Officer of Calvert Investment Distributors, Inc. (August 2015 - December 2016); Chief Compliance Officer of Calvert Investment Management, Inc. (August 2015 - April 2016); President and Director, Portfolio 21 Investments, Inc. (through October 2014); President, Chief Executive Officer and Director, Managers Investment Group LLC (through January 2012); President and Director, The Managers Funds and Managers AMG Funds (through January 2012). Other Directorships in the Last Five Years. Portfolio 21 Investments, Inc. (asset management) (through October 2014); Managers Investment Group LLC (asset management) (through January 2012); The Managers Funds (asset management) (through January 2012); Managers AMG Funds (asset management) (through January 2012); Calvert Impact Capital, Inc. |
| Independent Directors | | | |
Richard L. Baird, Jr.
1948 | Director | 2000 | Regional Disaster Recovery Lead, American Red Cross of Greater Pennsylvania (since 2017). Volunteer, American Red Cross (since 2015). Former President and CEO of Adagio Health Inc. (retired in 2014) in Pittsburgh, PA. Other Directorships in the Last Five Years. None. |
Alice Gresham Bullock
1950 | Chair & Director | 2016 | Professor Emerita at Howard University School of Law. Dean Emerita of Howard University School of Law and Deputy Director of the Association of American Law Schools (1992-1994). Other Directorships in the Last Five Years. None. |
Cari M. Dominguez
1949 | Director | 2016 | Former Chair of the U.S. Equal Employment Opportunity Commission. Other Directorships in the Last Five Years. Manpower, Inc. (employment agency); Triple S Management Corporation (managed care); National Association of Corporate Directors. |
John G. Guffey, Jr.(2)
1948 | Director | 2000 | President of Aurora Press Inc., a privately held publisher of trade paperbacks (since January 1997). Other Directorships in the Last Five Years. Calvert Impact Capital, Inc. (through December 31, 2018); Calvert Ventures, LLC. |
Miles D. Harper, III
1962 | Director | 2005 | Partner, Carr Riggs & Ingram (public accounting firm) since October 2014. Partner, Gainer Donnelly & Desroches (public accounting firm) (now Carr Riggs & Ingram), November 1999 - September 2014). Other Directorships in the Last Five Years. Bridgeway Funds (9) (asset management). |
Joy V. Jones
1950 | Director | 2000 | Attorney. Other Directorships in the Last Five Years. Conduit Street Restaurants SUD 2 Limited; Palm Management Restaurant Corporation. |
Anthony A. Williams
1951 | Director | 2016 | CEO and Executive Director of the Federal City Council (July 2012 to present); Senior Adviser and Independent Consultant for McKenna Long & Aldridge LLP (September 2011 to present); Executive Director of Global Government Practice at the Corporate Executive Board (January 2010 to January 2012). Other Directorships in the Last Five Years. Freddie Mac; Evoq Properties/ Meruelo Maddux Properties, Inc. (real estate management); Weston Solutions, Inc. (environmental services); Bipartisan Policy Center’s Debt Reduction Task Force; Chesapeake Bay Foundation; Catholic University of America; Urban Institute (research organization). |
www.calvert.com CALVERT INTERNATIONAL RESPONSIBLE INDEX FUND ANNUAL REPORT (Unaudited) 43
|
| | | |
| Principal Officers who are not Directors | |
Name and
Year of Birth | Corporation Position(s) | Position Start Date | Principal Occupation(s)
During Past Five Years |
| | | | |
Hope L. Brown
1973 | Chief Compliance Officer | 2014 | Chief Compliance Officer of 39 registered investment companies advised by CRM (since 2014). Vice President and Chief Compliance Officer, Wilmington Funds (2012-2014). |
Maureen A. Gemma(3)
1960 | Secretary, Vice President and Chief Legal Officer | 2016 | Vice President of CRM and officer of 39 registered investment companies advised by CRM (since 2016). Also Vice President of Eaton Vance and certain of its affiliates and officer of 162 registered investment companies advised or administered by Eaton Vance. |
James F. Kirchner(3)
1967 | Treasurer | 2016 | Vice President of CRM and officer of 39 registered investment companies advised by CRM (since 2016). Also Vice President of Eaton Vance and certain of its affiliates and officer of 162 registered investment companies advised or administered by Eaton Vance. |
| | | | |
| |
(1) | Mr. Streur is an interested person of the Fund because of his positions with the Fund’s adviser and certain affiliates. |
| |
(2) | Mr. Guffey is currently married to Rebecca L. Adamson, who serves as a member of the Advisory Council. |
| |
(3) | The business address for Ms. Gemma and Mr. Kirchner is Two International Place, Boston, MA 02110. |
The SAI for the Fund includes additional information about the Directors and officers of the Fund and can be obtained without charge on Calvert’s website at www.calvert.com or by calling 1-800-368-2745.
44 www.calvert.com CALVERT INTERNATIONAL RESPONSIBLE INDEX FUND ANNUAL REPORT (Unaudited)
IMPORTANT NOTICES
Privacy. The Calvert Funds and Calvert Research and Management are committed to ensuring your financial privacy. Each of the financial institutions identified below has in effect the following policy (“Privacy Policy”) with respect to nonpublic personal information about its customers:
| |
| • | Only such information received from you, through application forms or otherwise, and information about your Calvert fund transactions will be collected. This may include information such as name, address, social security number, tax status, account balances and transactions. |
| |
| • | None of such information about you (or former customers) will be disclosed to anyone, except as permitted by law (which includes disclosure to employees necessary to service your account). In the normal course of servicing a customer’s account, Calvert Research and Management may share information with unaffiliated third parties that perform various required services such as transfer agents, custodians and broker-dealers. |
| |
| • | Policies and procedures (including physical, electronic and procedural safeguards) are in place that are designed to protect the confidentiality of such information. |
| |
| • | The Funds reserve the right to change this Privacy Policy at any time upon proper notification to you. Customers may want to review the Funds’ Privacy Policy periodically for changes by accessing the link on our homepage: www.calvert.com. |
Our pledge of privacy applies to the following entities: the Calvert Family of Funds, Calvert Research and Management and their affiliated service providers, Eaton Vance Management and Eaton Vance Distributors, Inc. In addition, our Privacy Policy applies only to those Calvert customers who are individuals and who have a direct relationship with us. If a customer’s account (i.e., fund shares) is held in the name of a third-party financial advisor/broker-dealer, it is likely that only such advisor’s privacy policies apply to the customer. This notice supersedes all previously issued privacy disclosures. For more information about Calvert’s Privacy Policy, please call 1-800-368-2745.
Delivery of Shareholder Documents. The Securities and Exchange Commission (SEC) permits funds to deliver only one copy of shareholder documents, including prospectuses, proxy statements and shareholder reports, to fund investors with multiple accounts at the same residential or post office box address. This practice is often called “householding” and it helps eliminate duplicate mailings to shareholders. Calvert funds, or your financial intermediary, may household the mailing of your documents indefinitely unless you instruct Calvert funds, or your financial intermediary, otherwise. If you would prefer that your Calvert fund documents not be householded, please contact Calvert funds at 1-800-368-2745, or contact your financial intermediary. Your instructions that householding not apply to delivery of your Calvert fund documents will typically be effective within 30 days of receipt by Calvert funds or your financial intermediary. Separate statements will be generated for each separate account and will be householded as described above.
Portfolio Holdings. Each Calvert fund files a schedule of portfolio holdings on Part F to Form N-PORT with the SEC for the first and third quarters of each fiscal year. The Form N-PORT will be available on the Calvert funds’ website at www.calvert.com, by calling Calvert funds at 1-800-368-2745 or in the EDGAR database on the SEC’s website at www.sec.gov.
Proxy Voting. The Proxy Voting Guidelines that each Calvert fund uses to determine how to vote proxies relating to portfolio securities is provided as an Appendix to the fund’s Statement of Additional Information. The Statement of Additional Information can be obtained free of charge by calling the Calvert funds at 1-800-368-2745, by visiting the Calvert funds’ website at www.calvert.com or visiting the SEC’s website at www.sec.gov. Information regarding how a Calvert fund voted proxies relating to portfolio securities during the most recent 12-month period ended June 30 is available by calling Calvert funds, by visiting the Calvert funds’ website at www.calvert.com or by visiting the SEC’s website at www.sec.gov.
www.calvert.com CALVERT INTERNATIONAL RESPONSIBLE INDEX FUND ANNUAL REPORT (Unaudited) 45
|
|
| This page intentionally left blank. |
|
|
| This page intentionally left blank. |
|
|
| This page intentionally left blank. |
|
| |
| CALVERT INTERNATIONAL RESPONSIBLE INDEX FUND |
Investment Adviser and Administrator Calvert Research and Management 1825 Connecticut Avenue NW, Suite 400 Washington, DC 20009 | Transfer Agent DST Asset Manager Solutions, Inc. 2000 Crown Colony Drive Quincy, MA 02169 |
Principal Underwriter* Eaton Vance Distributors, Inc. Two International Place Boston, MA 02110 (617) 482-8260 | Independent Registered Public Accounting Firm KPMG LLP 1601 Market Street Philadelphia, PA 19103-2499 |
Custodian State Street Bank and Trust Company State Street Financial Center, One Lincoln Street Boston, MA 02111 | Fund Offices 1825 Connecticut Avenue NW, Suite 400 Washington, DC 20009 |
| | |
* FINRA BrokerCheck. Investors may check the background of their Investment Professional by contacting the Financial Industry Regulatory Authority (FINRA). FINRA BrokerCheck is a free tool to help investors check the professional background of current and former FINRA-registered securities firms and brokers. FINRA BrokerCheck is available by calling 1-800-289-9999 and at www.FINRA.org. The FINRA BrokerCheck brochure describing this program is available to investors at www.FINRA.org.
|
| |
| | |
Printed on recycled paper. |
| 24195 9.30.19 | |
Item 2. Code of Ethics.
The registrant has adopted a code of ethics applicable to its Principal Executive Officer, Principal Financial Officer and Principal Accounting Officer. The registrant undertakes to provide a copy of such code of ethics to any person upon request, without charge, by calling 1-800-368-2745. The registrant has not amended the code of ethics as described in Form N-CSR during the period covered by this report. The registrant has not granted any waiver, including an implicit waiver, from a provision of the code of ethics as described in Form N-CSR during the period covered by this report.
Item 3. Audit Committee Financial Expert.
The registrant's Board of Directors has determined that Miles D. Harper III, an “independent” Director serving on the registrant’s audit committee, is an “audit committee financial expert,” as defined in Item 3 of Form N-CSR. Under applicable securities laws, a person who is determined to be an audit committee financial expert will not be deemed an "expert" for any purpose, including without limitation for the purposes of Section 11 of the Securities Act of 1933, as a result of being designated or identified as an audit committee financial expert. The designation or identification of a person as an audit committee financial expert does not impose on such person any duties, obligations, or liabilities that are greater than the duties, obligations, and liabilities imposed on such person as a member of the audit committee and Board of Directors in the absence of such designation or identification.
Item 4. Principal Accountant Fees and Services.
(a) - (d)
The following table presents the aggregate fees billed to the registrant for the registrant’s fiscal years ended September 30, 2018 and September 30, 2019 by KPMG for professional services rendered for the audit of the registrant’s annual financial statements and fees billed for other services rendered by KPMG during such periods.
|
| | | | |
| Fiscal Years Ended | 9/30/18 | %* | 9/30/19 | %* |
| | | | | |
| Audit Fees | $101,640 | 0% | $109,859 | 0% |
| | | | | |
Audit-Related Fees(1) | $0 | 0% | $0 | 0% |
| | | | | |
Tax Fees(2) | $24,250 | 0% | $26,500 | 0% |
| | | | | |
All Other Fees(3) | $0 | 0% | $0 | 0% |
| | | | | |
| Total | $125,890 | 0% | $136,359 | 0% |
| | | | | |
*Percentage of fees approved by the Audit Committee pursuant to (c)(7)(i)(C) of Rule 2-01 of Reg. S-X (statutory de minimus waiver of Committee’s requirement to pre-approve).
| |
| (1) | Audit-related fees consist of the aggregate fees billed for assurance and related services that are reasonably related to the performance of the audit of the registrant’s financial statements and are not reported under the category of audit fees. |
| |
| (2) | Tax fees consist of the aggregate fees billed for professional services rendered by the principal accountant relating to tax compliance, tax advice, and tax planning and specifically include fees for tax return preparation and other related tax compliance/planning matters. |
| |
| (3) | All other fees consist of the aggregate fees billed for products and services provided by the principal accountant other than audit, audit-related, and tax services. |
| |
| (e) | The Audit Committee is required to pre-approve all audit and non-audit services provided to the registrant by the auditors, and to the registrant’s investment adviser, and any entity controlling, controlled by, or under common control with the adviser that provides ongoing services to the registrant. In determining whether to pre-approve non-audit services, the Audit Committee considers whether the services are consistent with maintaining the independence of the auditors. The Committee may delegate its authority to pre-approve certain matters to one or more of its members. In this regard, the Committee has delegated authority jointly to the Audit Committee Chair together with another Committee member with respect to non-audit services not exceeding $25,000 in each instance. In addition, the Committee has pre-approved the retention of the auditors to provide tax-related services related to the tax treatment and tax accounting of newly acquired securities, upon request by the investment adviser in each instance. |
| |
| (g) | Aggregate non-audit fees billed by the registrant’s accountant for services rendered to the registrant, and rendered to the registrant’s investment adviser, and any entity controlling, controlled by, or under common control with the adviser that provides ongoing services to the registrant for each of the last two fiscal years of the registrant: |
|
| | | |
| Fiscal Year ended 9/30/18 | Fiscal Year ended 9/30/19 |
| $ | %* | $ | %* |
| | | | |
| $24,250 | 0% | $26,500 | 0% |
| | | | |
*Percentage of fees approved by the Audit Committee pursuant to (c)(7)(i)(C) of Rule 2-01 of Reg. S-X (statutory de minimus waiver of Committee’s requirement to pre-approve).
| |
| (h) | The registrant’s audit committee has considered whether the provision by the registrant’s principal accountant of non-audit services to the registrant’s investment adviser and any entity controlling, controlled by, or under common control with the adviser that provides ongoing services to the registrant that were not pre-approved pursuant to Rule 2-01(c)(7)(ii) of Regulation S-X is compatible with maintaining the principal accountant’s independence. |
Item 5. Audit Committee of Listed Registrants.
Not applicable.
Item 6. Schedule of Investments.
Please see schedule of investments contained in the Report to Shareholders included under Item 1 of this Form N-CSR.
Item 7. Disclosure of Proxy Voting Policies and Procedures for Closed-End Management Investment Companies.
Not applicable.
Item 8. Portfolio Managers of Closed-End Management Investment Companies.
Not applicable.
Item 9. Purchases of Equity Securities by Closed-End Management Investment Company and Affiliated Purchasers.
Not applicable.
Item 10. Submission of Matters to a Vote of Security Holders.
No material changes.
Item 11. Controls and Procedures.
(a) The registrant’s principal executive and principal financial officers have concluded that the registrant's disclosure controls and procedures (as defined in Rule 30a-3(c) under the Investment Company Act of 1940 Act, as amended (the “1940 Act”) are effective, based on the evaluation of these controls and procedures required by Rule 30a-3(b) under the 1940 Act and Rules 13a-15(b) or 15d-15(b) under the Securities Exchange Act of 1934 (“Exchange Act”), as of a date within 90 days of the filing date of this report.
(b) There was no change in the registrant's internal control over financial reporting (as defined in Rule 30a-3(d) under the 1940 Act) that occurred during the second fiscal quarter of the period covered by this report that has materially affected, or is reasonably likely to materially affect, the registrant's internal control over financial reporting.
Item 12. Disclosure of Securities Lending Activities for Closed-End Management Investment Companies
Not applicable.
Item 13. Exhibits.
(a)(1) Registrant’s Code of Ethics- Not applicable (please see Item 2)
(a)(2)(i) President’s Section 302 certification.
(a)(2)(ii) Treasurer’s Section 302 certification.
(b) Combined Section 906 certification.
Signatures
Pursuant to the requirements of the Securities Exchange Act of 1934 and the Investment Company Act of 1940, the registrant has duly caused this report to be signed on its behalf by the undersigned, thereunto duly authorized.
Calvert Responsible Index Series, Inc.
By: /s/ John H. Streur
John H. Streur
President
Date: November 21, 2019
Pursuant to the requirements of the Securities Exchange Act of 1934 and the Investment Company Act of 1940, this report has been signed below by the following persons on behalf of the registrant and in the capacities and on the dates indicated.
By: /s/ James F. Kirchner
James F. Kirchner
Treasurer
Date: November 21, 2019
By: /s/ John H. Streur
John H. Streur
President
Date: November 21, 2019