| OMB APPROVAL |
OMB Number: 3235-0570 Expires: January 31, 2014 Estimated average burden hours per response: 20.6 |
UNITED STATES
SECURITIES AND EXCHANGE COMMISSION
Washington, D.C. 20549
FORM N-CSR
CERTIFIED SHAREHOLDER REPORT OF REGISTERED
MANAGEMENT INVESTMENT COMPANIES
Investment Company Act file number 811-09913
AIM Counselor Series Trust (Invesco Counselor Series Trust)
(Exact name of registrant as specified in charter)
11 Greenway Plaza,
Suite 1000 Houston, Texas 77046
(Address of principal executive offices) (Zip code)
Philip A. Taylor
11 Greenway Plaza,
Suite 1000 Houston, Texas 77046
(Name and address of agent for service)
Registrant’s telephone number, including area code: (713) 626-1919
Date of fiscal year end: 8/31
Date of reporting period: 08/31/13
Item 1. Report to Stockholders.
|
| ||||||
Annual Report to Shareholders | August 31, 2013 | ||||||
Invesco American Franchise Fund |
| ||||||
| Nasdaq: | |||||||
| A: VAFAX ¡ B: VAFBX ¡ C: VAFCX ¡ R: VAFRX ¡ Y: VAFIX ¡ R5: VAFNX ¡ R6: VAFFX | |||||||


Letters to Shareholders
Philip Taylor | Dear Shareholders: Enclosed in this annual report, you’ll find information about your Fund and the factors that affected its performance during the reporting period. Inside, you’ll also find a discussion from your portfolio managers about how they managed your Fund, as well as performance data for your Fund, a complete list of your Fund’s investments as of the close of the reporting period and other important information. I hope you find this report of interest. During the reporting period covered by this report, major US equity indexes made multiyear or even all-time highs.1 Economic data were generally positive; housing and consumer spending data were particularly encouraging. Nonetheless, economic uncertainty and concern about continuing political and budget gridlock in Washington persisted. The US Federal Reserve’s deliberate vagueness about when, and to what degree, it might begin to curtail its | ||||||||

extraordinarily accommodative monetary policies – together with uncertainty about who will next lead the central bank – affected fixed income and equity markets alike. Most developed, non-US stock markets remained positive for the first half of 2013, despite a difficult second quarter.
Periods of market volatility and economic uncertainty can weaken the will of even the most resolute investor. That’s why Invesco believes it’s often helpful to work with a skilled and trusted financial adviser who can emphasize the importance of adhering to an investment plan designed to achieve long-term goals rather than being sidetracked by short-term uncertainty that can result in inaction. A financial adviser who is familiar with your individual financial situation, investment goals and risk tolerance can be an invaluable partner as you work toward your financial goals. He or she can provide insight and perspective when markets are volatile; encouragement and reassurance when times are uncertain; and advice and guidance when your financial situation or investment goals change.
Our website, invesco.com/us, is another source of timely insight and information for investors. On the website, you’ll find fund-specific as well as more general information from many of Invesco’s investment professionals. You’ll find in-depth articles, video clips and audio commentaries – and, of course, you also can access information about your Invesco account whenever it’s convenient for you.
What we mean by Intentional Investing
At Invesco, all of our people and all of our resources are dedicated to helping investors achieve their financial objectives. It’s a philosophy we call Intentional Investing, and it guides the way we:
| n | Manage investments – Our dedicated investment professionals search the world for the best opportunities, and each investment team follows a clear, disciplined process to build portfolios and mitigate risk. |
| n | Provide choices – We offer multiple investment strategies, allowing you and your financial adviser to build a portfolio that’s purpose-built for your needs. |
| n | Connect with you – We’re committed to giving you the expert insights you need to make informed investing decisions, and we are well-equipped to provide high-quality support for investors and advisers. |
At Invesco, we believe in putting investors first. That’s why investment management is all we do. Our sole focus on managing your money allows you and your financial adviser to build a portfolio of Invesco funds appropriate for your investment needs and goals today and when your circumstances change.
Have questions?
For questions about your account, feel free to contact an Invesco client services representative at 800 959 4246. For Invesco-related questions or comments, please email me directly at phil@invesco.com.
All of us at Invesco look forward to serving your investment management needs for many years to come. Thank you for investing with us.
Sincerely,

Philip Taylor
Senior Managing Director, Invesco Ltd.
1 Source: Reuters
2 Invesco American Franchise Fund
Bruce Crockett | Dear Fellow Shareholders: The Invesco Funds Board has worked on a variety of issues over the last several months, and I’d like to take this opportunity to discuss two that affect you and our fellow fund shareholders. The first issue on which your Board has been working is our annual review of the funds’ advisory and sub-advisory contracts with Invesco Advisers and its affiliates. This annual review, which is required by the Investment Company Act of 1940, focuses on the nature and quality of the services Invesco provides as adviser to the Invesco Funds and the reasonableness of the fees that it charges for those services. Each year, we spend months reviewing detailed information that we request from Invesco that allows us to evaluate its services and fees. We also use information from many independent sources, including materials provided by the independent Senior Officer of the Invesco Funds, who reports directly to the independent Trustees on the Board. Additionally, we meet with independent legal counsel and review | ||||||||

performance and fee data prepared by Lipper Inc., an independent, third-party firm widely recognized as a leader in its field.
I’m pleased to report that the Board determined in June that renewing the investment advisory agreement and the sub-advisory contracts with Invesco Advisers and its affiliates would serve the best interests of each fund and its shareholders.
The second area of focus to highlight is the Board’s efforts to ensure that we provide a lineup of funds that allow financial advisers to build portfolios that meet shareholders’ changing financial needs and goals. Today, more and more investors are reaching, or approaching, retirement. But interest rates remain low, making it difficult for many investors to generate the income they need, or will soon need, in their retirement years.
The members of your Board think about these things, too, and we’ve worked with Invesco Advisers to provide more income-generating options in the Invesco Funds lineup to help shareholders potentially meet their income needs. Your Board recently approved changes to three existing equity mutual funds, increasing their focus on generating income while also seeking to provide long-term growth of capital.
As a result of these changes, the funds and their respective management teams now have more flexibility to invest in the types of securities that could meet investors’ growing need for income generation, and in some cases, also help investors diversify their sources of income. These equity funds complement an array of fixed-income, asset allocation and alternative investment options in the Invesco Funds lineup designed to accommodate a variety of risk tolerances.
Be assured that your Board will continue working on behalf of fund shareholders, keeping your needs and interests uppermost in our minds.
As always, please contact me at bruce@brucecrockett.com with any questions or concerns you may have. On behalf of the Board, we look forward to continuing to represent your interests and serving your needs.
Sincerely,

Bruce L. Crockett
Independent Chair
Invesco Funds Board of Trustees
3 Invesco American Franchise Fund
Management’s Discussion of Fund Performance
Performance summary
For the fiscal year ended August 31, 2013, Invesco American Franchise Fund, at net asset value (NAV), had positive returns and outperformed its style-specific benchmark, the Russell 1000 Growth Index. Outperformance was driven primarily by stock selection in several sectors, including the information technology (IT), consumer discretionary, health care and telecommunication services sectors.
Your Fund’s long-term performance appears later in this report.
Fund vs. Indexes
Total returns, 8/31/12 to 8/31/13, at net asset value (NAV). Performance shown does not include applicable contingent deferred sales charges (CDSC) or front-end sales charges, which would have reduced performance.
| Class A Shares | 18.89 | % | |||
| Class B Shares | 18.90 | ||||
| Class C Shares | 17.93 | ||||
| Class R Shares | 18.58 | ||||
| Class Y Shares | 19.13 | ||||
| Class R5 Shares | 19.22 | ||||
| Class R6 Shares* | 19.40 | ||||
| S&P 500 Index‚ (Broad Market Index) | 18.70 | ||||
| Russell 1000 Growth Indexn (Style-Specific Index) | 16.43 | ||||
| Lipper Large-Cap Growth Funds Index¿ (Peer Group Index) | 17.56 |
| Source(s): | ‚Invesco, S&P-Dow Jones via FactSet Research Systems Inc.; |
| nInvesco, Russell via FactSet Research Systems Inc.; ¿Lipper Inc. |
| * | Share class incepted during the reporting period. See page 7 for a detailed explanation of Fund performance. |
How we invest
Under normal market conditions, the Fund invests at least 80% of its net assets (plus any borrowing for investment purposes) in securities of US issuers at the time of investment.
We believe a growth investment strategy is an essential component of a diversified portfolio.
Our investment process emphasizes rigorous bottom-up analysis of individual companies. We seek to invest in companies with strong or improving fundamentals, attractive valuation relative to growth prospects and earnings expectations that appear fair to conservative.
To narrow our investment universe, we utilize a holistic approach that emphasizes fundamental research and, to a lesser extent, includes quantitative analysis.
At the end of this distillation process, we have a set of stocks to analyze in greater depth.
Our fundamental analysis focuses on identifying companies with strong drivers of growth. We conduct rigorous bottom-up analysis to develop higher conviction in each company’s prospects for growth. Through our analysis, we develop a mosaic of each company through detailed discussions with company management teams, competitors, distributors, suppliers, Wall Street analysts and customers. We also utilize a variety of valuation techniques based on the company in question, the industry in which the company operates, the stage of the business cycle and other factors that best reflect a company’s value.
Risk management plays an important role in portfolio construction as we attempt to maximize the relationship between risk and return. We seek to accomplish this goal by investing in companies with attractive fundamental prospects for growth, and we divide the portfolio between stable growth stocks and catalyst-driven stocks.
We consider selling a stock for any of the following reasons:
| n | The price target set at purchase has been reached. |
| n | There is deterioration in fundamentals. |
| n | The catalysts for growth are no longer present or are reflected in the stock price. |
| n | There is a more attractive investment opportunity. |
Market conditions and your Fund
The fiscal year ended August 31, 2013, began with some downward volatility in US equity markets. Starting in the fall of 2012, markets began an upward trend that continued through much of the reporting period. In early fall, the European Central Bank implemented new measures to support member economies and the US Federal Reserve (the Fed) initiated a third round of quantitative easing (QE), or fiscal stimulus, which caused consumer sentiment to improve. Uncertainty surrounding US election results, “fiscal cliff” negotiations and sequestration spending cuts in early 2013, however, made many businesses hesitant to spend during the first quarter of the year. However, for the first time in years, markets appeared willing to look past headline events.
From late May through June, the capital markets began a sell-off following Fed Chairman Ben Bernanke’s comments about reducing QE. Since December 2012, the Fed has purchased $85 billion1 of US Treasuries and mortage-backed
| Portfolio Composition | |||||
By sector
| |||||
| Information Technology | 32.4 | % | |||
| Consumer Discretionary | 22.8 | ||||
| Health Care | 14.0 | ||||
| Industrials | 10.5 | ||||
| Financials | 6.7 | ||||
| Energy | 6.2 | ||||
| Consumer Staples | 4.3 | ||||
| Telecommunication Services | 2.1 | ||||
| Money Market Funds | |||||
| Plus Other Assets Less Liabilities | 1.0 | ||||
Top 10 Equity Holdings
| |||||
| 1. Apple Inc. | 6.0 | % | |||
| 2. Facebook Inc.-Class A | 5.9 | ||||
| 3. DISH Network Corp.-Class A | 4.2 | ||||
| 4. Gilead Sciences, Inc. | 4.1 | ||||
| 5. Google Inc.-Class A | 3.6 | ||||
| 6. QUALCOMM, Inc. | 2.9 | ||||
| 7. Lowe’s Cos., Inc. | 2.8 | ||||
| 8. Celgene Corp. | 2.7 | ||||
| 9. Priceline.com Inc. | 2.3 | ||||
| 10. Mondelez International Inc.-Class A | 2.3 | ||||
| Total Net Assets | $6.3 billion | ||||
| Total Number of Holdings* | 75 | ||||
The Fund’s holdings are subject to change, and there is no assurance that the Fund will continue to hold any particular security.
*Excluding money market fund holdings.
4 Invesco American Franchise Fund
securities each month to increase liquidity and ensure low long-term interest rates in an effort to spur the housing and real estate markets. Few asset classes were immune from this broad sell-off, which caused bonds, stocks and commodities to decline. Precious metals were particularly hard hit, and fixed-income investors scrambled to sell bonds in anticipation of higher yields. The markets stabilized in mid-summer; however, August brought more selling in the equity and bond markets and yields continued to rise.
During the reporting period, the Fund, at NAV, had double-digit positive returns and outperformed the Russell 1000 Growth Index due primarily to positive stock selection in several sectors. The Fund outperformed its style-specific index by the widest margins in the IT, consumer discretionary, health care and telecommunication services sectors. Some of this outperformance was offset by negative stock selection in the industrials sector.
The IT sector was the leading contributor to relative Fund performance, driven primarily by strong stock selection. The largest individual stock contributor was social networking company Facebook. The company benefited from an increase in ad revenue due primarily to progress made in promotions on smartphones and tablets. Additional IT contributors included Internet search giant Google and credit card company Visa.
Strong stock selection also drove the Fund’s outperformance versus the Russell 1000 Growth Index in the consumer discretionary sector. One of the leading contributors for the Fund was Dish Network, a leading provider of satellite cable television. The stock benefited from significant discussions about strategic corporate partnerships resulting from its valuable broadband spectrum assets. Another contributor to Fund performance was Priceline.com, an online travel company. The company benefited from a merger with online services provider Kayak Software (not a Fund holding) during the reporting period.
Strong stock selection in the health care sector also contributed to the Fund’s positive performance. One of the strongest contributors to Fund performance was biopharmaceutical company Gilead Sciences. The company is a leader in the treatment of HIV; however, the stock benefited most from news that tests for a new drug to treat hepatitis C were successful. Additionally, it announced that development of a potential cancer treatment
was progressing more quickly than had been anticipated. Another strong contributor in the health care sector was Celgene, a biotechnology company with a growing leadership in cancer drugs. During the reporting period, Celgene successfully introduced several additional products to diversify its business and drive growth.
The telecommunication services sector was the strongest performing sector for the Fund on an absolute basis during the reporting period. Wireless communications company Sprint Corp. was a strong contributor to performance as it entertained several offers for a strategic partnership, resulting in a higher stock price before the company finally agreed to a merger during the reporting period.
Some of the Fund’s outperformance was offset by underperformance in the industrials sector, driven primarily by weak stock selection. Despite posting strong positive returns in this sector, the Fund underperformed its style-specific benchmark due to not owning several of the strongest performing names that were part of the Russell 1000 Growth Index during the reporting period, including Honeywell International and 3M.
As we’ve discussed, the stock market experienced volatile performance during the reporting period. We would like to caution investors against making investment decisions based on short-term performance.
We thank you for your commitment to Invesco American Franchise Fund.
1 Source: US Federal Reserve
The views and opinions expressed in management’s discussion of Fund performance are those of Invesco Advisers, Inc. These views and opinions are subject to change at any time based on factors such as market and economic conditions. These views and opinions may not be relied upon as investment advice or recommendations, or as an offer for a particular security. The information is not a complete analysis of every aspect of any market, country, industry, security or the Fund. Statements of fact are from sources considered reliable, but Invesco Advisers, Inc. makes no representation or warranty as to their completeness or accuracy. Although historical performance is no guarantee of future results, these insights may help you understand our investment management philosophy.
See important Fund and, if applicable, index disclosures later in this report.
 | Erik Voss Chartered Financial Analyst, portfolio manager, is lead manager of Invesco American Franchise Fund. He joined | |
| Invesco in 2010. Mr. Voss earned a BS in mathematics and an MS in finance from the University of Wisconsin. | ||
 | Ido Cohen Portfolio manager, is manager of Invesco American Franchise Fund. He joined Invesco in 2010. Mr. Cohen earned a | |
| BS in economics from The Wharton School of the University of Pennsylvania. | ||
5 Invesco American Franchise Fund
Your Fund’s Long-Term Performance
Results of a $10,000 Investment – Oldest Share Class(es) since Inception
Fund data from 6/23/05; index data from 6/30/05
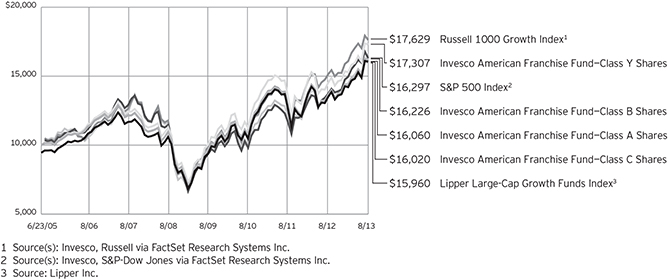
Past performance cannot guarantee comparable future results.
The data shown in the chart include reinvested distributions, applicable sales charges and Fund expenses including management fees. Results for Class B shares are calculated as if a hypothetical
shareholder had liquidated his entire investment in the Fund at the close of the reporting period and paid the contingent deferred sales charges, if applicable. Index results include reinvested dividends, but they do not reflect sales charges. Performance of the peer group,
if applicable, reflects fund expenses and management fees; performance of a market index does not. Performance shown in the chart and table(s) does not reflect deduction of taxes a shareholder would pay on Fund distributions or sale of Fund shares.
6 Invesco American Franchise Fund
Average Annual Total Returns
As of 8/31/13, including maximum applicable sales charges
| Class A Shares | |||||
| Inception (6/23/05) | 5.96 | % | |||
| 5 Years | 7.44 | ||||
| 1 Year | 12.31 | ||||
| Class B Shares | |||||
| Inception (6/23/05) | 6.09 | % | |||
| 5 Years | 7.91 | ||||
| 1 Year | 13.90 | ||||
| Class C Shares | |||||
| Inception (6/23/05) | 5.92 | % | |||
| 5 Years | 7.91 | ||||
| 1 Year | 16.93 | ||||
| Class R Shares | |||||
| Inception | 6.42 | % | |||
| 5 Years | 8.40 | ||||
| 1 Year | 18.58 | ||||
| Class Y Shares | |||||
| Inception (6/23/05) | 6.93 | % | |||
| 5 Years | 8.92 | ||||
| 1 Year | 19.13 | ||||
| Class R5 Shares | |||||
| Inception | 6.82 | % | |||
| 5 Years | 8.89 | ||||
| 1 Year | 19.22 | ||||
| Class R6 Shares | |||||
| Inception | 6.74 | % | |||
| 5 Years | 8.77 | ||||
| 1 Year | 19.40 | ||||
Effective June 1, 2010, Class A, Class B, Class C and Class I shares of the predecessor fund, Van Kampen American Franchise Fund, advised by Van Kampen Asset Management were reorganized into Class A, Class B, Class C and Class Y shares, respectively, of Invesco Van Kampen American Franchise Fund (renamed Invesco American Franchise Fund). Returns shown above for Class A, Class B, Class C and Class Y shares are blended returns of the predecessor fund and Invesco American Franchise Fund. Share class returns will differ from the predecessor fund because of different expenses.
Class R shares incepted on May 23, 2011. Performance shown prior to that date is that of the Fund’s and the predecessor fund’s Class A shares, restated to reflect the higher 12b-1 fees applicable to Class R shares. Class A share performance reflects any applicable fee waivers or expense reimbursements.
Average Annual Total Returns
As of 6/30/13, the most recent calendar quarter end, including maximum applicable sales charges
| Class A Shares | |||||
| Inception (6/23/05) | 5.10 | % | |||
| 5 Years | 7.14 | ||||
| 1 Year | 7.63 | ||||
| Class B Shares | |||||
| Inception (6/23/05) | 5.23 | % | |||
| 5 Years | 7.56 | ||||
| 1 Year | 8.83 | ||||
| Class C Shares | |||||
| Inception (6/23/05) | 5.09 | % | |||
| 5 Years | 7.63 | ||||
| 1 Year | 12.16 | ||||
| Class R Shares | |||||
| Inception | 5.58 | % | |||
| 5 Years | 8.09 | ||||
| 1 Year | 13.62 | ||||
| Class Y Shares | |||||
| Inception (6/23/05) | 6.08 | % | |||
| 5 Years | 8.62 | ||||
| 1 Year | 14.24 | ||||
| Class R5 Shares | |||||
| Inception | 5.97 | % | |||
| 5 Years | 8.57 | ||||
| 1 Year | 14.31 | ||||
| Class R6 Shares | |||||
| Inception | 5.89 | % | |||
| 5 Years | 8.43 | ||||
| 1 Year | 14.25 | ||||
Class R5 shares incepted on December 22, 2010. Performance shown prior to that date is that of the Fund’s and the predecessor fund’s Class A shares and includes the 12b-1 fees applicable to Class A shares. Class A share performance reflects any applicable fee waivers or expense reimbursements.
Class R6 shares incepted on September 24, 2012. Performance shown prior to that date is that of the Fund’s and the predecessor fund’s Class A shares and includes the 12b-1 fees applicable to Class A shares. Class A share performance reflects any applicable fee waivers or expense reimbursements.
The performance data quoted represent past performance and cannot guarantee comparable future results; current performance may be lower or higher. Please visit invesco.com/performance for the most recent month-end performance. Performance figures reflect reinvested
distributions, changes in net asset value and the effect of the maximum sales charge unless otherwise stated. Investment return and principal value will fluctuate so that you may have a gain or loss when you sell shares.
The total annual Fund operating expense ratio set forth in the most recent Fund prospectus as of the date of this report for Class A, Class B, Class C, Class R, Class Y, Class R5 and Class R6 shares was 1.18%, 1.18%, 1.93%, 1.43%, 0.93%, 0.69% and 0.64%, respectively. The expense ratios presented above may vary from the expense ratios presented in other sections of this report that are based on expenses incurred during the period covered by this report.
Class A share performance reflects the maximum 5.50% sales charge, and Class B and Class C share performance reflects the applicable contingent deferred sales charge (CDSC) for the period involved. For shares purchased prior to June 1, 2010, the CDSC on Class B shares declines from 5% at the time of purchase to 0% at the beginning of the sixth year. For shares purchased on or after June 1, 2010, the CDSC on Class B shares declines from 5% at the time of purchase to 0% at the beginning of the seventh year. The CDSC on Class C shares is 1% for the first year after purchase. Class R, Class Y, Class R5 and Class R6 shares do not have a front-end sales charge or a CDSC; therefore, performance is at net asset value.
The performance of the Fund’s share classes will differ primarily due to different sales charge structures and class expenses.
Had the adviser not waived fees and/or reimbursed expenses on Class B shares in the past, performance would have been lower.
7 Invesco American Franchise Fund
Invesco American Franchise Fund’s investment objective is to seek long-term capital appreciation.
| n | Unless otherwise stated, information presented in this report is as of August 31, 2013, and is based on total net assets. |
| n | Unless otherwise noted, all data provided by Invesco. |
| n | To access your Fund’s reports/prospectus, visit invesco.com/fundreports. |
About share classes
| n | Class B shares may not be purchased for new or additional investments. Please see the prospectus for more information. |
| n | Class R shares are generally available only to employer sponsored retirement and benefit plans. Please see the prospectus for more information. |
| n | Class Y shares are available only to certain investors. Please see the prospectus for more information. |
| n | Class R5 shares and Class R6 shares are primarily intended for employer sponsored retirement and benefit plans that meet certain standards and for institutional investors. On September 24, 2012, Institutional Class shares were renamed Class R5 shares. Please see the prospectus for more information. |
Principal risks of investing in the Fund
| n | Foreign risk. The risks of investing in securities of foreign issuers can include fluctuations in foreign currencies, foreign currency exchange controls, political and economic instability, differences in financial reporting, differences in securities regulation and trading, and foreign taxation issues. |
| n | Growth investing risk. Growth stocks tend to be more expensive relative to their earnings or assets compared with other types of stock. As a result they tend to be more sensitive to changes in their earnings and can be more volatile. |
| n | Management risk. The investment techniques and risk analysis used by the Fund’s portfolio managers may not produce the desired results. |
| n | Market risk. The prices of and the income generated by the Fund’s securities may decline in response to, among other things, investor sentiment, general economic and market conditions, regional or global instability, and currency and interest rate fluctuations. |
| n | Medium-sized companies risk. The securities of medium-sized companies may be subject to more abrupt or erratic market movements than securities of larger-sized companies or the market averages in general. In addition, such companies typically are subject to a greater degree of change in earnings and business prospects than are larger companies. Thus, to the extent the Fund invests in medium-sized companies, the Fund may be subject to greater investment risk than that assumed through investment in the equity securities of larger-sized companies. |
About indexes used in this report
| n | The S&P 500® Index is an unmanaged index considered representative of the US stock market. |
| n | The Russell 1000® Growth Index is an unmanaged index considered representative of large-cap growth stocks. The Russell 1000 Growth Index is a trademark/service mark of the Frank Russell Co. Russell® is a trademark of the Frank Russell Co. |
| n | The Lipper Large-Cap Growth Funds Index is an unmanaged index considered representative of large-cap growth funds tracked by Lipper. |
| n | The Fund is not managed to track the performance of any particular index, including the index(es) described here, and consequently, the performance of the Fund may deviate significantly from the performance of the index(es). |
| n | A direct investment cannot be made in an index. Unless otherwise indicated, index results include reinvested dividends, and they do not reflect sales charges. Performance of the peer group, if applicable, reflects fund expenses; performance of a market index does not. |
Other information
| n | The returns shown in management’s discussion of Fund performance are based on net asset values calculated for shareholder transactions. Generally accepted accounting principles require adjustments to be made to the net assets of the Fund at period end for financial reporting purposes, and as such, the net asset values for shareholder transactions and the returns based on those net asset values may differ from the net asset values and returns reported in the Financial Highlights. |
| n | Industry classifications used in this report are generally according to the Global Industry Classification Standard, which was developed by and is the exclusive property and a service mark of MSCI Inc. and Standard & Poor’s. |
This report must be accompanied or preceded by a currently effective Fund prospectus, which contains more complete information, including sales charges and expenses. Investors should read it carefully before investing.
NOT FDIC INSURED | MAY LOSE VALUE | NO BANK GUARANTEE
| Fund Nasdaq Symbols | |||||
| Class A Shares | VAFAX | ||||
| Class B Shares | VAFBX | ||||
| Class C Shares | VAFCX | ||||
| Class R Shares | VAFRX | ||||
| Class Y Shares | VAFIX | ||||
| Class R5 Shares | VAFNX | ||||
| Class R6 Shares | VAFFX | ||||
8 Invesco American Franchise Fund
Schedule of Investments(a)
August 31, 2013
| Shares | Value | |||||||
Common Stocks & Other Equity Interests–98.94% |
| |||||||
| Aerospace & Defense–3.48% | ||||||||
Boeing Co. (The) | 1,033,122 | $ | 107,362,038 | |||||
Honeywell International Inc. | 397,153 | 31,601,464 | ||||||
United Technologies Corp. | 800,763 | 80,156,377 | ||||||
| 219,119,879 | ||||||||
| Apparel Retail–1.06% | ||||||||
Gap, Inc. (The) | 1,656,232 | 66,978,022 | ||||||
| Apparel, Accessories & Luxury Goods–2.04% | ||||||||
Michael Kors Holdings Ltd.(b) | 983,544 | 72,870,775 | ||||||
Prada S.p.A. (Italy) | 2,772,992 | 27,179,656 | ||||||
PVH Corp. | 223,118 | 28,726,443 | ||||||
| 128,776,874 | ||||||||
| Application Software–2.47% | ||||||||
Citrix Systems, Inc.(b) | 754,834 | 53,419,602 | ||||||
Salesforce.com, Inc.(b) | 2,077,616 | 102,073,274 | ||||||
| 155,492,876 | ||||||||
| Asset Management & Custody Banks–1.03% | ||||||||
BlackRock, Inc. | 249,376 | 64,917,560 | ||||||
| Automobile Manufacturers–1.69% | ||||||||
General Motors Co.(b) | 3,121,246 | 106,372,064 | ||||||
| Biotechnology–8.83% | ||||||||
Amgen Inc. | 830,164 | 90,438,066 | ||||||
Biogen Idec Inc.(b) | 207,605 | 44,224,017 | ||||||
Celgene Corp.(b) | 1,193,206 | 167,024,976 | ||||||
Gilead Sciences, Inc.(b) | 4,233,225 | 255,136,471 | ||||||
| 556,823,530 | ||||||||
| Brewers–1.13% | ||||||||
Anheuser-Busch InBev N.V.–ADR (Belgium) | 762,068 | 71,139,048 | ||||||
| Broadcasting–1.07% | ||||||||
CBS Corp.–Class B | 1,317,347 | 67,316,432 | ||||||
| Cable & Satellite–7.37% | ||||||||
Comcast Corp.–Class A | 1,149,359 | 48,376,520 | ||||||
DIRECTV(b) | 1,160,092 | 67,494,153 | ||||||
DISH Network Corp.–Class A | 5,928,615 | 266,550,530 | ||||||
Sirius XM Radio Inc. | 9,570,372 | 34,261,932 | ||||||
Time Warner Cable Inc. | 448,086 | 48,102,032 | ||||||
| 464,785,167 | ||||||||
| Casinos & Gaming–0.90% | ||||||||
Las Vegas Sands Corp. | 1,009,049 | 56,859,911 | ||||||
| Communications Equipment–4.34% | ||||||||
F5 Networks, Inc.(b) | 662,254 | 55,218,739 | ||||||
QUALCOMM, Inc. | 2,714,299 | 179,903,738 | ||||||
Telefonaktiebolaget LM Ericsson–ADR (Sweden) | 3,249,766 | 38,282,243 | ||||||
| 273,404,720 | ||||||||
| Shares | Value | |||||||
| Computer Hardware–5.99% | ||||||||
Apple Inc. | 775,969 | $ | 377,935,701 | |||||
| Computer Storage & Peripherals–1.22% | ||||||||
EMC Corp. | 2,995,031 | 77,211,899 | ||||||
| Construction & Engineering–1.51% | ||||||||
Foster Wheeler AG (Switzerland)(b) | 2,246,169 | 52,066,198 | ||||||
Jacobs Engineering Group, Inc.(b) | 739,101 | 43,074,806 | ||||||
| 95,141,004 | ||||||||
| Construction & Farm Machinery & Heavy Trucks–0.51% | ||||||||
Cummins Inc. | 260,516 | 32,095,571 | ||||||
| Data Processing & Outsourced Services–2.26% | ||||||||
MasterCard, Inc.–Class A | 151,759 | 91,978,094 | ||||||
Visa Inc.–Class A | 288,702 | 50,355,403 | ||||||
| 142,333,497 | ||||||||
| Electrical Components & Equipment–0.75% | ||||||||
Roper Industries, Inc. | 380,939 | 47,122,154 | ||||||
| General Merchandise Stores–0.88% | ||||||||
Dollar General Corp.(b) | 1,024,756 | 55,306,081 | ||||||
| Health Care Equipment–0.49% | ||||||||
Abbott Laboratories | 936,336 | 31,208,079 | ||||||
| Health Care Facilities–0.49% | ||||||||
HCA Holdings, Inc. | 817,219 | 31,209,594 | ||||||
| Health Care Services–0.70% | ||||||||
Express Scripts Holding Co.(b) | 691,562 | 44,176,981 | ||||||
| Home Improvement Retail–2.83% | ||||||||
Lowe’s Cos., Inc. | 3,894,352 | 178,439,209 | ||||||
| Industrial Conglomerates–2.42% | ||||||||
Danaher Corp. | 999,850 | 65,510,172 | ||||||
General Electric Co. | 3,760,622 | 87,020,793 | ||||||
| 152,530,965 | ||||||||
| Industrial Machinery–1.08% | ||||||||
Flowserve Corp. | 225,806 | 12,597,717 | ||||||
Ingersoll-Rand PLC | 941,704 | 55,692,374 | ||||||
| 68,290,091 | ||||||||
| Insurance Brokers–0.93% | ||||||||
Aon PLC | 886,801 | 58,865,850 | ||||||
| Internet Retail–4.19% | ||||||||
Amazon.com, Inc.(b) | 430,643 | 121,002,070 | ||||||
Priceline.com Inc.(b) | 152,594 | 143,214,047 | ||||||
| 264,216,117 | ||||||||
| Internet Software & Services–11.69% | ||||||||
Baidu, Inc.–ADR (China)(b) | 174,095 | 23,595,095 | ||||||
eBay Inc.(b) | 1,804,742 | 90,219,053 | ||||||
Facebook Inc.–Class A(b) | 9,008,298 | 371,862,542 | ||||||
See accompanying Notes to Financial Statements which are an integral part of the financial statements.
9 Invesco American Franchise Fund
| Shares | Value | |||||||
| Internet Software & Services–(continued) | ||||||||
Google Inc.–Class A(b) | 270,677 | $ | 229,236,351 | |||||
LinkedIn Corp.–Class A(b) | 91,102 | 21,868,124 | ||||||
| 736,781,165 | ||||||||
| Investment Banking & Brokerage–0.80% | ||||||||
Goldman Sachs Group, Inc. (The) | 331,017 | 50,357,616 | ||||||
| Life Sciences Tools & Services–0.66% | ||||||||
Thermo Fisher Scientific, Inc. | 466,579 | 41,446,213 | ||||||
| Managed Health Care–0.52% | ||||||||
UnitedHealth Group Inc. | 461,001 | 33,072,212 | ||||||
| Movies & Entertainment–0.53% | ||||||||
Walt Disney Co. (The) | 549,870 | 33,448,592 | ||||||
| Oil & Gas Equipment & Services–3.85% | ||||||||
Schlumberger Ltd. | 1,411,470 | 114,244,382 | ||||||
Weatherford International Ltd.(b) | 8,600,688 | 128,236,258 | ||||||
| 242,480,640 | ||||||||
| Oil & Gas Exploration & Production–2.38% | ||||||||
Anadarko Petroleum Corp. | 1,049,785 | 95,971,345 | ||||||
EOG Resources, Inc. | 345,032 | 54,187,275 | ||||||
| 150,158,620 | ||||||||
| Other Diversified Financial Services–2.11% | ||||||||
Citigroup Inc. | 2,758,337 | 133,310,427 | ||||||
| Packaged Foods & Meats–2.26% | ||||||||
Mondelez International Inc.–Class A | 4,641,402 | 142,351,799 | ||||||
| Pharmaceuticals–2.29% | ||||||||
Actavis Inc.(b) | 168,120 | 22,726,461 | ||||||
Johnson & Johnson | 342,732 | 29,615,472 | ||||||
Pfizer Inc. | 2,226,727 | 62,815,969 | ||||||
Zoetis Inc. | 1,007,191 | 29,359,618 | ||||||
| 144,517,520 | ||||||||
| Shares | Value | |||||||
| Restaurants–0.30% | ||||||||
McDonald’s Corp. | 197,908 | $ | 18,674,599 | |||||
| Semiconductor Equipment–0.93% | ||||||||
Applied Materials, Inc. | 3,918,013 | 58,809,375 | ||||||
| Semiconductors–0.92% | ||||||||
Altera Corp. | 1,646,546 | 57,909,023 | ||||||
| Specialized Finance–0.59% | ||||||||
CME Group Inc.–Class A | 519,396 | 36,934,250 | ||||||
| Specialized REIT’s–1.20% | ||||||||
American Tower Corp. | 1,093,080 | 75,958,129 | ||||||
| Systems Software–2.57% | ||||||||
Microsoft Corp. | 4,237,785 | 141,542,019 | ||||||
Symantec Corp. | 788,141 | 20,184,291 | ||||||
| 161,726,310 | ||||||||
| Tobacco–0.88% | ||||||||
Philip Morris International Inc. | 666,374 | 55,602,246 | ||||||
| Trucking–0.73% | ||||||||
J.B. Hunt Transport Services, Inc. | 642,447 | 46,256,184 | ||||||
| Wireless Telecommunication Services–2.07% | ||||||||
Sprint Corp.(b) | 19,408,172 | 130,228,835 | ||||||
Total Common Stocks & Other Equity Interests |
| 6,238,092,631 | ||||||
Money Market Funds–1.02% |
| |||||||
Liquid Assets Portfolio– | 32,101,841 | 32,101,841 | ||||||
Premier Portfolio– | 32,101,840 | 32,101,840 | ||||||
Total Money Market Funds |
| 64,203,681 | ||||||
TOTAL INVESTMENTS–99.96% |
| 6,302,296,312 | ||||||
OTHER ASSETS LESS LIABILITIES–0.04% |
| 2,265,645 | ||||||
NET ASSETS–100.00% |
| $ | 6,304,561,957 | |||||
Investment Abbreviations:
| ADR | – American Depositary Receipt | |||
| REIT | – Real Estate Investment Trust | |||
Notes to Schedule of Investments:
| (a) | Industry and/or sector classifications used in this report are generally according to the Global Industry Classification Standard, which was developed by and is the exclusive property and a service mark of MSCI Inc. and Standard & Poor’s. |
| (b) | Non-income producing security. |
| (c) | The money market fund and the Fund are affiliated by having the same investment adviser. |
See accompanying Notes to Financial Statements which are an integral part of the financial statements.
10 Invesco American Franchise Fund
Statement of Assets and Liabilities
August 31, 2013
Assets: |
| |||
Investments, at value (Cost $4,769,383,324) | $ | 6,238,092,631 | ||
Investments in affiliated money market funds, at value and cost | 64,203,681 | |||
Total investments, at value (Cost $4,833,587,005) | 6,302,296,312 | |||
Receivable for: | ||||
Investments sold | 59,955,363 | |||
Fund shares sold | 1,152,790 | |||
Dividends | 6,938,265 | |||
Fund expenses absorbed | 7,824 | |||
Investment for trustee deferred compensation and retirement plans | 243,211 | |||
Other assets | 54,474 | |||
Total assets | 6,370,648,239 | |||
Liabilities: |
| |||
Payable for: | ||||
Investments purchased | 55,119,055 | |||
Fund shares reacquired | 4,725,199 | |||
Amount due custodian | 134,105 | |||
Accrued fees to affiliates | 4,600,555 | |||
Accrued trustees’ and officers’ fees and benefits | 14,372 | |||
Accrued other operating expenses | 556,475 | |||
Trustee deferred compensation and retirement plans | 936,521 | |||
Total liabilities | 66,086,282 | |||
Net assets applicable to shares outstanding | $ | 6,304,561,957 | ||
Net assets consist of: |
| |||
Shares of beneficial interest | $ | 4,617,671,048 | ||
Undistributed net investment income | 8,309,634 | |||
Undistributed net realized gain | 209,870,543 | |||
Net unrealized appreciation | 1,468,710,732 | |||
| $ | 6,304,561,957 | |||
Net Assets: |
| |||
Class A | $ | 5,428,321,205 | ||
Class B | $ | 226,796,467 | ||
Class C | $ | 271,960,186 | ||
Class R | $ | 19,575,720 | ||
Class Y | $ | 92,418,194 | ||
Class R5 | $ | 151,534,704 | ||
Class R6 | $ | 113,955,481 | ||
Shares outstanding, $0.01 par value per share, |
| |||
Class A | 366,234,326 | |||
Class B | 15,639,791 | |||
Class C | 18,962,077 | |||
Class R | 1,328,082 | |||
Class Y | 6,188,475 | |||
Class R5 | 10,167,466 | |||
Class R6 | 7,640,198 | |||
Class A: | ||||
Net asset value per share | $ | 14.82 | ||
Maximum offering price per share | ||||
(Net asset value of $14.82 ¸ 94.50%) | $ | 15.68 | ||
Class B: | ||||
Net asset value and offering price per share | $ | 14.50 | ||
Class C: | ||||
Net asset value and offering price per share | $ | 14.34 | ||
Class R: | ||||
Net asset value and offering price per share | $ | 14.74 | ||
Class Y: | ||||
Net asset value and offering price per share | $ | 14.93 | ||
Class R5: | ||||
Net asset value and offering price per share | $ | 14.90 | ||
Class R6: | ||||
Net asset value and offering price per share | $ | 14.92 | ||
See accompanying Notes to Financial Statements which are an integral part of the financial statements.
11 Invesco American Franchise Fund
Statement of Operations
For the year ended August 31, 2013
Investment income: |
| |||
Dividends (net of foreign withholding taxes of $455,575) | $ | 69,460,859 | ||
Dividends from affiliated money market funds (includes securities lending income of $486,545) | 580,257 | |||
Total investment income | 70,041,116 | |||
Expenses: | ||||
Advisory fees | 34,867,835 | |||
Administrative services fees | 651,042 | |||
Custodian fees | 167,795 | |||
Distribution fees: | ||||
Class A | 12,089,599 | |||
Class B | 613,844 | |||
Class C | 2,512,202 | |||
Class R | 92,939 | |||
Transfer agent fees — A, B, C, R and Y | 13,249,273 | |||
Transfer agent fees — R5 | 166,300 | |||
Transfer agent fees — R6 | 2,027 | |||
Trustees’ and officers’ fees and benefits | 206,751 | |||
Other | 1,166,045 | |||
Total expenses | 65,785,652 | |||
Less: Fees waived, expenses reimbursed and expense offset arrangement(s) | (4,287,998 | ) | ||
Net expenses | 61,497,654 | |||
Net investment income | 8,543,462 | |||
Realized and unrealized gain (loss) from: | ||||
Net realized gain (loss) from: | ||||
Investment securities (includes net gains from securities sold to affiliates of $10,239,424) | 787,955,978 | |||
Foreign currencies | (1,434 | ) | ||
| 787,954,544 | ||||
Change in net unrealized appreciation of: | ||||
Investment securities | 189,233,144 | |||
Foreign currencies | 1,317 | |||
| 189,234,461 | ||||
Net realized and unrealized gain | 977,189,005 | |||
Net increase in net assets resulting from operations | $ | 985,732,467 | ||
See accompanying Notes to Financial Statements which are an integral part of the financial statements.
12 Invesco American Franchise Fund
Statement of Changes in Net Assets
For the years ended August 31, 2013 and 2012
| 2013 | 2012 | |||||||
Operations: |
| |||||||
Net investment income (loss) | $ | 8,543,462 | $ | (3,482,880 | ) | |||
Net realized gain | 787,954,544 | 5,600,794 | ||||||
Change in net unrealized appreciation | 189,234,461 | 422,392,232 | ||||||
Net increase in net assets resulting from operations | 985,732,467 | 424,510,146 | ||||||
Distributions to shareholders from net investment income: | ||||||||
Class A | (1,680,357 | ) | — | |||||
Class B | (88,298 | ) | — | |||||
Class Y | (269,635 | ) | — | |||||
Class R5 | (655,036 | ) | — | |||||
Class R6 | (545,579 | ) | — | |||||
Total distributions from net investment income | (3,238,905 | ) | — | |||||
Distributions to shareholders from net realized gains: | ||||||||
Class A | — | (49,936,307 | ) | |||||
Class B | — | (3,657,657 | ) | |||||
Class C | — | (2,792,450 | ) | |||||
Class R | — | (188,148 | ) | |||||
Class Y | — | (1,138,913 | ) | |||||
Class R5 | — | (2,112,110 | ) | |||||
Total distributions from net realized gains | — | (59,825,585 | ) | |||||
Share transactions–net: | ||||||||
Class A | (135,809,151 | ) | (464,391,426 | ) | ||||
Class B | (87,558,797 | ) | (119,780,165 | ) | ||||
Class C | (22,109,739 | ) | (28,808,170 | ) | ||||
Class R | (2,317,486 | ) | (165,660 | ) | ||||
Class Y | (22,131,891 | ) | (23,439,291 | ) | ||||
Class R5 | (181,966,427 | ) | 79,335,971 | |||||
Class R6 | 99,950,199 | — | ||||||
Net increase (decrease) in net assets resulting from share transactions | (351,943,292 | ) | (557,248,741 | ) | ||||
Net increase (decrease) in net assets | 630,550,270 | (192,564,180 | ) | |||||
Net assets: | ||||||||
Beginning of year | 5,674,011,687 | 5,866,575,867 | ||||||
End of year (includes undistributed net investment income of $8,309,634 and $2,859,270, respectively) | $ | 6,304,561,957 | $ | 5,674,011,687 | ||||
Notes to Financial Statements
August 31, 2013
NOTE 1—Significant Accounting Policies
Invesco American Franchise Fund (the “Fund”) is a series portfolio of AIM Counselor Series Trust (Invesco Counselor Series Trust) (the “Trust”). The Trust is a Delaware statutory trust registered under the Investment Company Act of 1940, as amended (the “1940 Act”), as an open-end series management investment company consisting of twelve separate portfolios, each authorized to issue an unlimited number of shares of beneficial interest. The assets, liabilities and operations of each portfolio are accounted for separately. Information presented in these financial statements pertains only to the Fund. Matters affecting each portfolio or class will be voted on exclusively by the shareholders of such portfolio or class.
The Fund’s investment objective is to seek long-term capital appreciation.
The Fund currently consists of seven different classes of shares: Class A, Class B, Class C, Class R, Class Y, Class R5 and Class R6. On September 24, 2012, Institutional Class shares were renamed Class R5 shares and the Fund began offering Class R6 shares. Class A shares are sold with a front-end sales charge unless certain waiver criteria are met and under certain circumstances load waived shares may be subject to contingent deferred sales charges (“CDSC”). Class C shares are sold with a CDSC. Class R, Class Y, Class R5 and Class R6 shares are sold at net asset value. Effective November 30, 2010, new or additional investments in Class B shares are no longer permitted. Existing shareholders of Class B shares may continue to reinvest dividends and capital gains distributions in Class B shares until they convert to Class A shares. Also, shareholders in Class B
13 Invesco American Franchise Fund
shares will be able to exchange those shares for Class B shares of other Invesco Funds offering such shares until they convert to Class A shares. Generally, Class B shares will automatically convert to Class A shares on or about the month-end, which is at least eight years after the date of purchase. Redemption of Class B shares prior to the conversion date will be subject to a CDSC.
The following is a summary of the significant accounting policies followed by the Fund in the preparation of its financial statements.
| A. | Security Valuations — Securities, including restricted securities, are valued according to the following policy. |
A security listed or traded on an exchange (except convertible bonds) is valued at its last sales price or official closing price as of the close of the customary trading session on the exchange where the security is principally traded, or lacking any sales or official closing price on a particular day, the security may be valued at the closing bid price on that day. Securities traded in the over-the-counter market are valued based on prices furnished by independent pricing services or market makers. When such securities are valued by an independent pricing service they may be considered fair valued. Futures contracts are valued at the final settlement price set by an exchange on which they are principally traded. Listed options are valued at the mean between the last bid and ask prices from the exchange on which they are principally traded. Options not listed on an exchange are valued by an independent source at the mean between the last bid and ask prices. For purposes of determining net asset value per share, futures and option contracts generally are valued 15 minutes after the close of the customary trading session of the New York Stock Exchange (“NYSE”).
Investments in open-end and closed-end registered investment companies that do not trade on an exchange are valued at the end of day net asset value per share. Investments in open-end and closed-end registered investment companies that trade on an exchange are valued at the last sales price or official closing price as of the close of the customary trading session on the exchange where the security is principally traded.
Debt obligations (including convertible bonds) and unlisted equities are fair valued using an evaluated quote provided by an independent pricing service. Evaluated quotes provided by the pricing service may be determined without exclusive reliance on quoted prices, and may reflect appropriate factors such as institution-size trading in similar groups of securities, developments related to specific securities, dividend rate (for unlisted equities), yield (for debt obligations), quality, type of issue, coupon rate (for debt obligations), maturity (for debt obligations), individual trading characteristics and other market data. Debt obligations are subject to interest rate and credit risks. In addition, all debt obligations involve some risk of default with respect to interest and/or principal payments.
Foreign securities’ (including foreign exchange contracts) prices are converted into U.S. dollar amounts using the applicable exchange rates as of the close of the NYSE. If market quotations are available and reliable for foreign exchange-traded equity securities, the securities will be valued at the market quotations. Because trading hours for certain foreign securities end before the close of the NYSE, closing market quotations may become unreliable. If between the time trading ends on a particular security and the close of the customary trading session on the NYSE, events occur that the Adviser determines are significant and make the closing price unreliable, the Fund may fair value the security. If the event is likely to have affected the closing price of the security, the security will be valued at fair value in good faith using procedures approved by the Board of Trustees. Adjustments to closing prices to reflect fair value may also be based on a screening process of an independent pricing service to indicate the degree of certainty, based on historical data, that the closing price in the principal market where a foreign security trades is not the current value as of the close of the NYSE. Foreign securities’ prices meeting the approved degree of certainty that the price is not reflective of current value will be priced at the indication of fair value from the independent pricing service. Multiple factors may be considered by the independent pricing service in determining adjustments to reflect fair value and may include information relating to sector indices, American Depositary Receipts and domestic and foreign index futures. Foreign securities may have additional risks including exchange rate changes, potential for sharply devalued currencies and high inflation, political and economic upheaval, the relative lack of issuer information, relatively low market liquidity and the potential lack of strict financial and accounting controls and standards.
Securities for which market prices are not provided by any of the above methods may be valued based upon quotes furnished by independent sources. The last bid price may be used to value equity securities. The mean between the last bid and asked prices is used to value debt obligations, including corporate loans.
Securities for which market quotations are not readily available or became unreliable are valued at fair value as determined in good faith by or under the supervision of the Trust’s officers following procedures approved by the Board of Trustees. Issuer specific events, market trends, bid/ask quotes of brokers and information providers and other market data may be reviewed in the course of making a good faith determination of a security’s fair value.
Valuations change in response to many factors including the historical and prospective earnings of the issuer, the value of the issuer’s assets, general economic conditions, interest rates, investor perceptions and market liquidity. Because of the inherent uncertainties of valuation, the values reflected in the financial statements may materially differ from the value received upon actual sale of those investments.
| B. | Securities Transactions and Investment Income — Securities transactions are accounted for on a trade date basis. Realized gains or losses on sales are computed on the basis of specific identification of the securities sold. Interest income is recorded on the accrual basis from settlement date. Dividend income (net of withholding tax, if any) is recorded on the ex-dividend date. |
The Fund may periodically participate in litigation related to Fund investments. As such, the Fund may receive proceeds from litigation settlements. Any proceeds received are included in the Statement of Operations as realized gain (loss) for investments no longer held and as unrealized gain (loss) for investments still held.
Brokerage commissions and mark ups are considered transaction costs and are recorded as an increase to the cost basis of securities purchased and/or a reduction of proceeds on a sale of securities. Such transaction costs are included in the determination of net realized and unrealized gain (loss) from investment securities reported in the Statement of Operations and the Statement of Changes in Net Assets and the net realized and unrealized gains (losses) on securities per share in the Financial Highlights. Transaction costs are included in the calculation of the Fund’s net asset value and, accordingly, they reduce the Fund’s total returns. These transaction costs are not considered operating expenses and are not reflected in net investment income reported in the Statement of Operations and Statement of Changes in Net Assets, or the net investment income per share and ratios of expenses and net investment income reported in the Financial Highlights, nor are they limited by any expense limitation arrangements between the Fund and the investment adviser.
The Fund allocates income and realized and unrealized capital gains and losses to a class based on the relative net assets of each class.
| C. | Country Determination — For the purposes of making investment selection decisions and presentation in the Schedule of Investments, the investment adviser may determine the country in which an issuer is located and/or credit risk exposure based on various factors. These factors |
14 Invesco American Franchise Fund
| include the laws of the country under which the issuer is organized, where the issuer maintains a principal office, the country in which the issuer derives 50% or more of its total revenues and the country that has the primary market for the issuer’s securities, as well as other criteria. Among the other criteria that may be evaluated for making this determination are the country in which the issuer maintains 50% or more of its assets, the type of security, financial guarantees and enhancements, the nature of the collateral and the sponsor organization. Country of issuer and/or credit risk exposure has been determined to be the United States of America, unless otherwise noted. |
| D. | Distributions — Distributions from income and net realized capital gain, if any, are generally declared and paid annually and recorded on the ex-dividend date. The Fund may elect to treat a portion of the proceeds from redemptions as distributions for federal income tax purposes. |
| E. | Federal Income Taxes — The Fund intends to comply with the requirements of Subchapter M of the Internal Revenue Code of 1986, as amended (the “Internal Revenue Code”), necessary to qualify as a regulated investment company and to distribute substantially all of the Fund’s taxable earnings to shareholders. As such, the Fund will not be subject to federal income taxes on otherwise taxable income (including net realized capital gain) that is distributed to shareholders. Therefore, no provision for federal income taxes is recorded in the financial statements. |
The Fund files tax returns in the U.S. Federal jurisdiction and certain other jurisdictions. Generally, the Fund is subject to examinations by such taxing authorities for up to three years after the filing of the return for the tax period.
| F. | Expenses — Fees provided for under the Rule 12b-1 plan of a particular class of the Fund are charged to the operations of such class. Transfer agency fees and expenses and other shareholder recordkeeping fees and expenses attributable to Class R5 and Class R6 are allocated to each share class based on relative net assets. Sub-accounting fees attributable to Class R5 are charged to the operations of the class. Transfer agency fees and expenses and other shareholder recordkeeping fees and expenses relating to all other classes are allocated among those classes based on relative net assets. All other expenses are allocated among the classes based on relative net assets. Prior to June 1, 2010, incremental transfer agency fees which were unique to each class of shares were charged to the operations of such class. |
| G. | Accounting Estimates — The preparation of financial statements in conformity with accounting principles generally accepted in the United States of America (“GAAP”) requires management to make estimates and assumptions that affect the reported amounts of assets and liabilities at the date of the financial statements and the reported amounts of revenues and expenses during the reporting period including estimates and assumptions related to taxation. Actual results could differ from those estimates by a significant amount. In addition, the Fund monitors for material events or transactions that may occur or become known after the period-end date and before the date the financial statements are released to print. |
| H. | Indemnifications — Under the Trust’s organizational documents, each Trustee, officer, employee or other agent of the Trust is indemnified against certain liabilities that may arise out of the performance of their duties to the Fund. Additionally, in the normal course of business, the Fund enters into contracts, including the Fund’s servicing agreements, that contain a variety of indemnification clauses. The Fund’s maximum exposure under these arrangements is unknown as this would involve future claims that may be made against the Fund that have not yet occurred. The risk of material loss as a result of such indemnification claims is considered remote. |
| I. | Securities Lending — The Fund may lend portfolio securities having a market value up to one-third of the Fund’s total assets. Such loans are secured by collateral equal to no less than the market value of the loaned securities determined daily by the securities lending provider. Such collateral will be cash or debt securities issued or guaranteed by the U.S. Government or any of its sponsored agencies. Cash collateral received in connection with these loans is invested in short-term money market instruments or affiliated money market funds and is shown as such on the Schedule of Investments. It is the Fund’s policy to obtain additional collateral from or return excess collateral to the borrower by the end of the next business day, following the valuation date of the securities loaned. Therefore, the value of the collateral held may be temporarily less than the value of the securities on loan. Lending securities entails a risk of loss to the Fund if and to the extent that the market value of the securities loaned were to increase and the borrower did not increase the collateral accordingly, and the borrower fails to return the securities. Upon the failure of the borrower to return the securities, collateral may be liquidated and the securities may be purchased on the open market to replace the loaned securities. The Fund could experience delays and costs in gaining access to the collateral. The Fund bears the risk of any deficiency in the amount of the collateral available for return to the borrower due to any loss on the collateral invested. Dividends received on cash collateral investments for securities lending transactions, which are net of compensation to counterparties, is included in Dividends from affiliated money market funds on the Statement of Operations. The aggregate value of securities out on loan is shown as a footnote on the Statement of Assets and Liabilities, if any. |
| J. | Foreign Currency Translations — Foreign currency is valued at the close of the NYSE based on quotations posted by banks and major currency dealers. Portfolio securities and other assets and liabilities denominated in foreign currencies are translated into U.S. dollar amounts at date of valuation. Purchases and sales of portfolio securities (net of foreign taxes withheld on disposition) and income items denominated in foreign currencies are translated into U.S. dollar amounts on the respective dates of such transactions. The Fund does not separately account for the portion of the results of operations resulting from changes in foreign exchange rates on investments and the fluctuations arising from changes in market prices of securities held. The combined results of changes in foreign exchange rates and the fluctuation of market prices on investments (net of estimated foreign tax withholding) are included with the net realized and unrealized gain or loss from investments in the Statement of Operations. Reported net realized foreign currency gains or losses arise from (1) sales of foreign currencies, (2) currency gains or losses realized between the trade and settlement dates on securities transactions, and (3) the difference between the amounts of dividends, interest, and foreign withholding taxes recorded on the Fund’s books and the U.S. dollar equivalent of the amounts actually received or paid. Net unrealized foreign currency gains and losses arise from changes in the fair values of assets and liabilities, other than investments in securities at fiscal period end, resulting from changes in exchange rates. |
The Fund may invest in foreign securities which may be subject to foreign taxes on income, gains on investments or currency repatriation, a portion of which may be recoverable.
| K. | Foreign Currency Contracts — The Fund may enter into foreign currency contracts to manage or minimize currency or exchange rate risk. The Fund may also enter into foreign currency contracts for the purchase or sale of a security denominated in a foreign currency in order to “lock in” the U.S. dollar price of that security. A foreign currency contract is an obligation to purchase or sell a specific currency for an agreed-upon price at a future date. The use of foreign currency contracts does not eliminate fluctuations in the price of the underlying securities the Fund owns or intends to acquire but establishes a rate of exchange in advance. Fluctuations in the value of these contracts are measured by the difference in the contract date and reporting date exchange rates and are recorded as unrealized appreciation (depreciation) until the contracts |
15 Invesco American Franchise Fund
| are closed. When the contracts are closed, realized gains (losses) are recorded. Realized and unrealized gains (losses) on the contracts are included in the Statement of Operations. The primary risks associated with foreign currency contracts include failure of the counterparty to meet the terms of the contract and the value of the foreign currency changing unfavorably. These risks may be in excess of the amounts reflected in the Statement of Assets and Liabilities. |
NOTE 2—Advisory Fees and Other Fees Paid to Affiliates
The Trust has entered into a master investment advisory agreement with Invesco Advisers, Inc. (the “Adviser” or “Invesco”). Under the terms of the investment advisory agreement, the Fund pays an advisory fee to the Adviser based on the annual rate of the Fund’s average daily net assets as follows:
| Average Daily Net Assets | Rate | |||||
First $250 million | 0 | .695% | ||||
Next $250 million | 0 | .67% | ||||
Next $500 million | 0 | .645% | ||||
Next $550 million | 0 | .62% | ||||
Next $3.45 billion | 0 | .60% | ||||
Next $250 million | 0 | .595% | ||||
Next $2.25 billion | 0 | .57% | ||||
Next $2.5 billion | 0 | .545% | ||||
Over $10 billion | 0 | .52% | ||||
Under the terms of a master sub-advisory agreement between the Adviser and each of Invesco Asset Management Deutschland GmbH, Invesco Asset Management Limited, Invesco Asset Management (Japan) Limited, Invesco Australia Limited, Invesco Hong Kong Limited, Invesco Senior Secured Management, Inc. and Invesco Canada Ltd. (collectively, the “Affiliated Sub-Advisers”) the Adviser, not the Fund, may pay 40% of the fees paid to the Adviser to any such Affiliated Sub-Adviser(s) that provide(s) discretionary investment management services to the Fund based on the percentage of assets allocated to such Sub-Adviser(s).
Effective July 1, 2013, the Adviser has contractually agreed, through at least June 30, 2014, to waive advisory fees and/or reimburse expenses of all shares to the extent necessary to limit total annual fund operating expenses after fee waiver and/or expense reimbursement (excluding certain items discussed below) of Class A, Class B, Class C, Class R, Class Y, Class R5 and Class R6 shares to 2.00%, 2.75% (after 12b-1 fee waivers), 2.75%, 2.25%, 1.75%, 1.75% and 1.75%, respectively, of average daily net assets. Prior to July 1, 2013, the Adviser had contractually agreed to waive advisory fees and/or reimburse expenses of all shares to the extent necessary to limit total annual fund operating expenses after fee waiver and/or expense reimbursement (excluding certain items discussed below) of Class A, Class B, Class C, Class R, Class Y, Class R5 and Class R6 shares to 1.05%, 1.22% (after 12b-1fee waivers), 1.80%, 1.30%, 0.80%, 0.80% and 0.80%, respectively, of average daily net assets. In determining the Adviser’s obligation to waive advisory fees and/or reimburse expenses, the following expenses are not taken into account, and could cause the total annual fund operating expenses after fee waiver and/or expense reimbursement to exceed the numbers reflected above: (1) interest; (2) taxes; (3) dividend expense on short sales; (4) extraordinary or non-routine items, including litigation expenses; and (5) expenses that the Fund has incurred but did not actually pay because of an expense offset arrangement. Unless the Board of Trustees and Invesco mutually agree to amend or continue the fee waiver agreement, it will terminate on June 30, 2014.
The Adviser has contractually agreed, through at least June 30, 2014, to waive the advisory fee payable by the Fund in an amount equal to 100% of the net advisory fees the Adviser receives from the affiliated money market funds on investments by the Fund of uninvested cash (excluding investments of cash collateral from securities lending) in such affiliated money market funds.
For the year ended August 31, 2013, the Adviser waived advisory fees of $130,280 and reimbursed class level expenses of $3,670,025, $186,344, $190,656, $14,107 and $67,208 of Class A, Class B, Class C, Class R and Class Y shares, respectively.
The Trust has entered into a master administrative services agreement with Invesco pursuant to which the Fund has agreed to pay Invesco for certain administrative costs incurred in providing accounting services to the Fund. For the year ended August 31, 2013, expenses incurred under the agreement are shown in the Statement of Operations as Administrative services fees.
The Trust has entered into a transfer agency and service agreement with Invesco Investment Services, Inc. (“IIS”) pursuant to which the Fund has agreed to pay IIS a fee for providing transfer agency and shareholder services to the Fund and reimburse IIS for certain expenses incurred by IIS in the course of providing such services. IIS may make payments to intermediaries that provide omnibus account services, sub-accounting services and/or networking services. All fees payable by IIS to intermediaries that provide omnibus account services or sub-accounting are charged back to the Fund, subject to certain limitations approved by the Trust’s Board of Trustees. For the year ended August 31, 2013, expenses incurred under the agreement are shown in the Statement of Operations as Transfer agent fees.
Shares of the Fund are distributed by Invesco Distributors, Inc. (“IDI”). The Fund has adopted a distribution plan pursuant to Rule 12b-1 under the 1940 Act, and a service plan (collectively, the “Plans”) for Class A, Class B, Class C and Class R shares to compensate IDI for the sale, distribution, shareholder servicing and maintenance of shareholder accounts for these shares. Under the Plans, the Fund will incur annual fees of up to 0.25% of Class A average daily net assets, up to 1.00% each of Class B and Class C average daily net assets and up to 0.50% of Class R average daily net assets.
With respect to Class B and Class C shares, the Fund is authorized to reimburse in future years any distribution related expenses that exceed the maximum annual reimbursement rate for such class, so long as such reimbursement does not cause the Fund to exceed the Class B and Class C maximum annual reimbursement rate, respectively. With respect to Class A shares, distribution related expenses that exceed the maximum annual reimbursement rate for such class are not carried forward to future years and the Fund will not reimburse IDI for any such expenses.
IDI had contractually agreed to limit Rule 12b-1 plan fees on Class B shares to 0.42% of average daily net assets, through June 30, 2013. The Distributor did not waive fees during the period under this expense limitation.
Front-end sales commissions and CDSC (collectively, the “sales charges”) are not recorded as expenses of the Fund. Front-end sales commissions are deducted from proceeds from the sales of Fund shares prior to investment in Class A shares of the Fund. CDSC are deducted from redemption
16 Invesco American Franchise Fund
proceeds prior to remittance to the shareholder. During the year ended August 31, 2013, IDI advised the Fund that IDI retained $334,787 in front-end sales commissions from the sale of Class A shares and $1,438, $156,132 and $13,502 from Class A, Class B and Class C shares, respectively, for CDSC imposed on redemptions by shareholders.
For the year ended August 31, 2013, the Fund incurred $127,319 in brokerage commissions with Invesco Capital Markets, Inc., an affiliate of the Adviser and IDI, for portfolio transactions executed on behalf of the Fund.
Certain officers and trustees of the Trust are officers and directors of the Adviser, IIS and/or IDI.
NOTE 3—Additional Valuation Information
GAAP defines fair value as the price that would be received to sell an asset or paid to transfer a liability in an orderly transaction between market participants at the measurement date, under current market conditions. GAAP establishes a hierarchy that prioritizes the inputs to valuation methods, giving the highest priority to readily available unadjusted quoted prices in an active market for identical assets (Level 1) and the lowest priority to significant unobservable inputs (Level 3), generally when market prices are not readily available or are unreliable. Based on the valuation inputs, the securities or other investments are tiered into one of three levels. Changes in valuation methods may result in transfers in or out of an investment’s assigned level:
| Level 1 — | Prices are determined using quoted prices in an active market for identical assets. |
| Level 2 — | Prices are determined using other significant observable inputs. Observable inputs are inputs that other market participants may use in pricing a security. These may include quoted prices for similar securities, interest rates, prepayment speeds, credit risk, yield curves, loss severities, default rates, discount rates, volatilities and others. |
| Level 3 — | Prices are determined using significant unobservable inputs. In situations where quoted prices or observable inputs are unavailable (for example, when there is little or no market activity for an investment at the end of the period), unobservable inputs may be used. Unobservable inputs reflect the Fund’s own assumptions about the factors market participants would use in determining fair value of the securities or instruments and would be based on the best available information. |
The following is a summary of the tiered valuation input levels, as of August 31, 2013. The level assigned to the securities valuations may not be an indication of the risk or liquidity associated with investing in those securities. Because of the inherent uncertainties of valuation, the values reflected in the financial statements may materially differ from the value received upon actual sale of those investments.
| Level 1 | Level 2 | Level 3 | Total | |||||||||||||
Equity Securities | $ | 6,275,116,656 | $ | 27,179,656 | $ | — | $ | 6,302,296,312 | ||||||||
NOTE 4—Trustees’ and Officers’ Fees and Benefits
“Trustees’ and Officers’ Fees and Benefits” include amounts accrued by the Fund to pay remuneration to certain Trustees and Officers of the Fund. Trustees have the option to defer compensation payable by the Fund, and “Trustees’ and Officers’ Fees and Benefits” also include amounts accrued by the Fund to fund such deferred compensation amounts. Those Trustees who defer compensation have the option to select various Invesco Funds in which their deferral accounts shall be deemed to be invested. Finally, certain current Trustees are eligible to participate in a retirement plan that provides for benefits to be paid upon retirement to Trustees over a period of time based on the number of years of service. The Fund may have certain former Trustees who also participate in a retirement plan and receive benefits under such plan. “Trustees’ and Officers’ Fees and Benefits” include amounts accrued by the Fund to fund such retirement benefits. Obligations under the deferred compensation and retirement plans represent unsecured claims against the general assets of the Fund.
NOTE 5—Security Transactions with Affiliated Funds
The Fund is permitted to purchase or sell securities from or to certain other Invesco Funds under specified conditions outlined in procedures adopted by the Board of Trustees of the Trust. The procedures have been designed to ensure that any purchase or sale of securities by the Fund from or to another fund or portfolio that is or could be considered an affiliate by virtue of having a common investment adviser (or affiliated investment advisers), common Trustees and/or common officers complies with Rule 17a-7 of the 1940 Act. Further, as defined under the procedures, each transaction is effected at the current market price. Pursuant to these procedures, for the year ended August 31, 2013, the Fund engaged in securities purchases of $13,131,857 and securities sales of $48,113,780, which resulted in net realized gains of $10,239,424.
NOTE 6—Expense Offset Arrangement(s)
The expense offset arrangement is comprised of transfer agency credits which result from balances in Demand Deposit Accounts (DDA) used by the transfer agent for clearing shareholder transactions. For the year ended August 31, 2013, the Fund received credits from this arrangement, which resulted in the reduction of the Fund’s total expenses of $29,378.
NOTE 7—Cash Balances
The Fund is permitted to temporarily carry a negative or overdrawn balance in its account with State Street Bank and Trust Company, the custodian bank. Such balances, if any at period end, are shown in the Statement of Assets and Liabilities under the payable caption Amount due custodian. To compensate the custodian bank for such overdrafts, the overdrawn Fund may either (1) leave funds as a compensating balance in the account so the custodian bank can be compensated by earning the additional interest; or (2) compensate by paying the custodian bank at a rate agreed upon by the custodian bank and Invesco, not to exceed the contractually agreed upon rate.
17 Invesco American Franchise Fund
NOTE 8—Distributions to Shareholders and Tax Components of Net Assets
Tax Character of Distributions to Shareholders Paid During the Years Ended August 31, 2013 and 2012:
| 2013 | 2012 | |||||||
Ordinary income | $ | 3,238,905 | $ | — | ||||
Long-term capital gain | — | 59,825,585 | ||||||
Total distributions | $ | 3,238,905 | $ | 59,825,585 | ||||
Tax Components of Net Assets at Period-End:
| 2013 | ||||
Undistributed ordinary income | $ | 9,212,385 | ||
Undistributed long-term gain | 277,018,328 | |||
Net unrealized appreciation — investments | 1,453,560,022 | |||
Net unrealized appreciation — other investments | 1,425 | |||
Temporary book/tax differences | (902,751 | ) | ||
Capital loss carryforward | (51,998,500 | ) | ||
Shares of beneficial interest | 4,617,671,048 | |||
Total net assets | $ | 6,304,561,957 | ||
The difference between book-basis and tax-basis unrealized appreciation (depreciation) is due to differences in the timing of recognition of gains and losses on investments for tax and book purposes. The Fund’s net unrealized appreciation difference is attributable primarily to wash sales.
The temporary book/tax differences are a result of timing differences between book and tax recognition of income and/or expenses. The Fund’s temporary book/tax differences are the result of the trustee deferral of compensation and retirement plan benefits.
Capital loss carryforward is calculated and reported as of a specific date. Results of transactions and other activity after that date may affect the amount of capital loss carryforward actually available for the Fund to utilize. The Regulated Investment Company Modernization Act of 2010 eliminated the eight-year carryover period for capital losses that arise in taxable years beginning after its enactment date of December 22, 2010. Consequently, these capital losses can be carried forward for an unlimited period. However, capital losses with an expiration period may not be used to offset capital gains until all net capital losses without an expiration date have been utilized. Additionally, post-enactment capital loss carryovers will retain their character as either short-term or long-term capital losses instead of as short-term capital losses as under prior law. The ability to utilize capital loss carryforward in the future may be limited under the Internal Revenue Code and related regulations based on the results of future transactions.
The Fund utilized $345,814,377 of capital loss carryforward in the current period to offset net realized capital gain for federal income tax purposes. The Fund has a capital loss carryforward as of August 31, 2013, which expires as follows:
| Capital Loss Carryforward* | ||||||||||||
| Expiration | Short-Term | Long-Term | Total | |||||||||
August 31, 2015 | $ | 2,422,410 | $ | — | $ | 2,422,410 | ||||||
August 31, 2016 | 49,576,090 | — | 49,576,090 | |||||||||
| $ | 51,998,500 | $ | — | $ | 51,998,500 | |||||||
| * | Capital loss carryforward as of the date listed above is reduced for limitations, if any, to the extent required by the Internal Revenue Code. To the extent that unrealized gains as of May 23, 2011, the date of the reorganization of Invesco Large Cap Growth Fund, Invesco Van Kampen Capital Growth Fund and Invesco Van Kampen Enterprise Fund and as of July 15, 2013, the date of the reorganization of Invesco Leisure Fund into the Fund and realized on securities held in each fund at such date of the reorganization, the capital loss carryforward may be further limited for up to five years from the date of the reorganization. |
NOTE 9—Investment Securities
The aggregate amount of investment securities (other than short-term securities, U.S. Treasury obligations and money market funds, if any) purchased and sold by the Fund during the year ended August 31, 2013 was $4,452,496,044 and $4,961,303,704, respectively. Cost of investments on a tax basis includes the adjustments for financial reporting purposes as of the most recently completed federal income tax reporting period-end.
| Unrealized Appreciation (Depreciation) of Investment Securities on a Tax Basis | ||||
Aggregate unrealized appreciation of investment securities | $ | 1,500,932,731 | ||
Aggregate unrealized (depreciation) of investment securities | (47,372,709 | ) | ||
Net unrealized appreciation of investment securities | $ | 1,453,560,022 | ||
Cost of investments for tax purposes is $4,848,736,290.
NOTE 10—Reclassification of Permanent Differences
Primarily as a result of differing book/tax treatment of fair funds settlements, on August 31, 2013, undistributed net investment income was increased by $257,428 and undistributed net realized gain was decreased by $257,428.
Further, as a result of tax deferrals acquired in the reorganization of Invesco Leisure Fund into the Fund, undistributed net investment income was decreased by $111,621, undistributed net realized gain was decreased by $798,578 and shares of beneficial interest was increased by $910,199. These reclassifications had no effect on the net assets of the Fund.
18 Invesco American Franchise Fund
NOTE 11—Share Information
| Summary of Share Activity | ||||||||||||||||
| Years ended August 31, | ||||||||||||||||
| 2013(a) | 2012 | |||||||||||||||
| Shares | Amount | Shares | Amount | |||||||||||||
Sold: | ||||||||||||||||
Class A | 9,792,627 | $ | 131,507,521 | 14,165,188 | $ | 170,566,557 | ||||||||||
Class B | 136,087 | 1,766,668 | 226,851 | 2,659,926 | ||||||||||||
Class C | 1,034,373 | 13,366,766 | 1,717,250 | 19,978,836 | ||||||||||||
Class R | 251,276 | 3,336,107 | 402,087 | 4,755,689 | ||||||||||||
Class Y | 1,654,188 | 22,565,414 | 2,652,299 | 31,747,725 | ||||||||||||
Class R5 | 1,428,763 | 19,009,427 | 11,756,254 | 134,787,606 | ||||||||||||
Class R6(b) | 13,767,716 | 181,744,390 | — | — | ||||||||||||
Issued as reinvestment of dividends: | ||||||||||||||||
Class A | 120,687 | 1,561,209 | 4,169,056 | 47,193,711 | ||||||||||||
Class B | 6,819 | 86,110 | 322,943 | 3,578,212 | ||||||||||||
Class C | — | — | 231,774 | 2,572,693 | ||||||||||||
Class R | — | — | 16,635 | 188,148 | ||||||||||||
Class Y | 18,246 | 230,140 | 86,240 | 982,277 | ||||||||||||
Class R5 | 52,093 | 654,994 | 185,905 | 2,111,886 | ||||||||||||
Class R6 | 43,407 | 545,579 | — | — | ||||||||||||
Issued in connection with acquisitions:(c) | ||||||||||||||||
Class A | 28,493,895 | 414,344,182 | — | — | ||||||||||||
Class B | 240,442 | 3,419,085 | — | — | ||||||||||||
Class C | 1,148,422 | 16,170,371 | — | — | ||||||||||||
Class R | 100,907 | 1,459,285 | — | — | ||||||||||||
Class Y | 801,793 | 11,737,602 | — | — | ||||||||||||
Automatic conversion of Class B shares to Class A shares: | ||||||||||||||||
Class A | 4,333,763 | 57,758,261 | 6,324,818 | 75,981,272 | ||||||||||||
Class B | (4,429,532 | ) | (57,758,261 | ) | (6,303,285 | ) | (75,981,272 | ) | ||||||||
Reacquired: | ||||||||||||||||
Class A | (55,559,122 | ) | (740,980,324 | ) | (63,303,335 | ) | (758,132,966 | ) | ||||||||
Class B | (2,697,669 | ) | (35,072,399 | ) | (4,407,859 | ) | (50,037,031 | ) | ||||||||
Class C | (4,005,957 | ) | (51,646,876 | ) | (4,365,929 | ) | (51,359,699 | ) | ||||||||
Class R | (532,067 | ) | (7,112,878 | ) | (422,570 | ) | (5,109,497 | ) | ||||||||
Class Y | (4,221,766 | ) | (56,665,047 | ) | (4,776,818 | ) | (56,169,293 | ) | ||||||||
Class R5 | (15,318,838 | ) | (201,630,848 | ) | (4,716,593 | ) | (57,563,521 | ) | ||||||||
Class R6 | (6,170,925 | ) | (82,339,770 | ) | — | — | ||||||||||
Net increase (decrease) in share activity | (29,510,372 | ) | $ | (351,943,292 | ) | (46,039,089 | ) | $ | (557,248,741 | ) | ||||||
| (a) | There are entities that are record owners of more than 5% of the outstanding shares of the Fund and in the aggregate own 24% of the outstanding shares of the Fund. IDI has an agreement with these entities to sell Fund shares. The Fund, Invesco and/or Invesco affiliates may make payments to these entities, which are considered to be related to the Fund, for providing services to the Fund, Invesco and/or Invesco affiliates including but not limited to services such as securities brokerage, distribution, third party record keeping and account servicing. The Fund has no knowledge as to whether all or any portion of the shares owned of record by these entities are also owned beneficially. |
| (b) | Commencement date of September 24, 2012. |
| (c) | As of the opening of business on July 15, 2013, the Fund acquired all the net assets of Invesco Leisure Fund (the “Target Fund”) pursuant to a plan of reorganization approved by the Trustees of the Fund and by the shareholders of the Target Fund on April 24, 2013. The acquisition was accomplished by a tax-free exchange of 30,785,459 shares of the Fund for 10,245,465 shares outstanding of the Target Fund as of the close of business on July 12, 2013. Shares of the Target Fund were exchanged for the like class of shares of the Fund, based on the relative net asset value of the Target Fund to the net asset value of the Fund on the close of business, July 12, 2013. The Target Fund’s net assets as of the close of business on July 12, 2013 of $447,130,525, including $168,476,621 of unrealized appreciation (depreciation), were combined with those of the Fund. The net assets of the Fund immediately before the acquisition were $5,828,287,238 and $6,275,415,763 immediately after the acquisition. |
| The pro forma results of operations for the year ended August 31, 2013 assuming the reorganization had been completed on September 1, 2012, the beginning of the annual reporting period are as follows: |
Net investment income | $ | 8,281,484 | ||
Net realized/unrealized gains | 1,210,553,562 | |||
Change in net assets resulting from operations | $ | 1,218,835,046 |
| The combined investment portfolios have been managed as a single integrated portfolio since the acquisition was completed, it is not practicable to separate the amounts of revenue and earnings of the Target Fund that have been included in the Fund’s Statement of Operations since July 15, 2013. |
19 Invesco American Franchise Fund
NOTE 12—Financial Highlights
The following schedule presents financial highlights for a share of the Fund outstanding throughout the periods indicated.
| Net asset value, beginning of period | Net investment income (loss)(a) | Net gains (losses) on securities (both realized and unrealized) | Total from investment operations | Dividends from net investment income | Distributions from net realized gains | Total distributions | Net asset value, end of period | Total return | Net assets, end of period (000’s omitted) | Ratio of expenses to average net assets with fee waivers and/or expenses absorbed | Ratio of expenses to average net assets without fee waivers and/or expenses absorbed | Ratio of net investment income (loss) to average net assets | Portfolio turnover(b) | |||||||||||||||||||||||||||||||||||||||||||
Class A |
| |||||||||||||||||||||||||||||||||||||||||||||||||||||||
Year ended 08/31/13 | $ | 12.47 | $ | 0.02 | $ | 2.33 | $ | 2.35 | $ | (0.00 | ) | $ | — | $ | (0.00 | ) | $ | 14.82 | 18.89 | %(c) | $ | 5,428,321 | 1.06 | %(d) | 1.14 | %(d) | 0.17 | %(d) | 80 | % | ||||||||||||||||||||||||||
Year ended 08/31/12 | 11.72 | (0.01 | ) | 0.88 | 0.87 | — | (0.12 | ) | (0.12 | ) | 12.47 | 7.55 | (c) | 4,728,364 | 1.05 | 1.18 | (0.05 | ) | 96 | |||||||||||||||||||||||||||||||||||||
Year ended 08/31/11 | 9.79 | (0.05 | ) | 1.98 | 1.93 | — | — | — | 11.72 | 19.71 | (c) | 4,894,163 | 1.06 | 1.17 | (0.43 | ) | 179 | |||||||||||||||||||||||||||||||||||||||
Year ended 08/31/10 | 8.87 | 0.01 | 1.03 | 1.04 | (0.12 | ) | — | (0.12 | ) | 9.79 | 11.75 | (c) | 168,731 | 1.30 | 1.30 | 0.11 | 101 | |||||||||||||||||||||||||||||||||||||||
Year ended 08/31/09 | 10.23 | 0.13 | (1.33 | ) | (1.20 | ) | (0.16 | ) | (0.00 | ) | (0.16 | ) | 8.87 | (11.40 | )(e) | 200,127 | 1.35 | 1.41 | 1.60 | 105 | ||||||||||||||||||||||||||||||||||||
Class B |
| |||||||||||||||||||||||||||||||||||||||||||||||||||||||
Year ended 08/31/13 | 12.20 | 0.02 | 2.28 | 2.30 | (0.00 | ) | — | (0.00 | ) | 14.50 | 18.90 | (c)(f) | 226,796 | 1.06 | (d)(f) | 1.14 | (d)(f) | 0.17 | (d)(f) | 80 | ||||||||||||||||||||||||||||||||||||
Year ended 08/31/12 | 11.47 | (0.01 | ) | 0.86 | 0.85 | — | (0.12 | ) | (0.12 | ) | 12.20 | 7.54 | (c)(f) | 273,177 | 1.05 | (f) | 1.18 | (f) | (0.05 | )(f) | 96 | |||||||||||||||||||||||||||||||||||
Year ended 08/31/11 | 9.64 | (0.08 | ) | 1.91 | 1.83 | — | — | — | 11.47 | 18.98 | (c)(f) | 373,157 | 1.28 | (f) | 1.65 | (f) | (0.64 | )(f) | 179 | |||||||||||||||||||||||||||||||||||||
Year ended 08/31/10 | 8.75 | (0.06 | ) | 1.01 | 0.95 | (0.06 | ) | — | (0.06 | ) | 9.64 | 10.89 | (c) | 22,332 | 2.05 | 2.05 | (0.64 | ) | 101 | |||||||||||||||||||||||||||||||||||||
Year ended 08/31/09 | 10.08 | 0.07 | (1.31 | ) | (1.24 | ) | (0.09 | ) | (0.00 | ) | (0.09 | ) | 8.75 | (12.09 | )(g) | 23,466 | 2.10 | 2.16 | 0.86 | 105 | ||||||||||||||||||||||||||||||||||||
Class C |
| |||||||||||||||||||||||||||||||||||||||||||||||||||||||
Year ended 08/31/13 | 12.16 | (0.08 | ) | 2.26 | 2.18 | — | — | — | 14.34 | 17.93 | (c) | 271,960 | 1.81 | (d) | 1.89 | (d) | (0.58 | )(d) | 80 | |||||||||||||||||||||||||||||||||||||
Year ended 08/31/12 | 11.51 | (0.09 | ) | 0.86 | 0.77 | — | (0.12 | ) | (0.12 | ) | 12.16 | 6.82 | (c) | 252,685 | 1.80 | 1.93 | (0.80 | ) | 96 | |||||||||||||||||||||||||||||||||||||
Year ended 08/31/11 | 9.68 | (0.11 | ) | 1.94 | 1.83 | — | — | — | 11.51 | 18.90 | (c)(h) | 266,990 | 1.60 | (h) | 1.71 | (h) | (0.97 | )(h) | 179 | |||||||||||||||||||||||||||||||||||||
Year ended 08/31/10 | 8.76 | (0.05 | ) | 1.03 | 0.98 | (0.06 | ) | — | (0.06 | ) | 9.68 | 11.14 | (c)(h) | 23,718 | 1.93 | (h) | 1.93 | (h) | (0.52 | )(h) | 101 | |||||||||||||||||||||||||||||||||||
Year ended 08/31/09 | 10.10 | 0.06 | (1.30 | ) | (1.24 | ) | (0.10 | ) | (0.00 | ) | (0.10 | ) | 8.76 | (12.11 | )(i) | 25,063 | 2.16 | 2.22 | 0.78 | 105 | ||||||||||||||||||||||||||||||||||||
Class R |
| |||||||||||||||||||||||||||||||||||||||||||||||||||||||
Year ended 08/31/13 | 12.43 | (0.01 | ) | 2.32 | 2.31 | — | — | — | 14.74 | 18.58 | (c) | 19,576 | 1.31 | (d) | 1.39 | (d) | (0.08 | )(d) | 80 | |||||||||||||||||||||||||||||||||||||
Year ended 08/31/12 | 11.71 | (0.04 | ) | 0.88 | 0.84 | — | (0.12 | ) | (0.12 | ) | 12.43 | 7.30 | (c) | 18,746 | 1.30 | 1.43 | (0.30 | ) | 96 | |||||||||||||||||||||||||||||||||||||
Year ended 08/31/11(j) | 12.81 | (0.02 | ) | (1.08 | ) | (1.10 | ) | — | — | — | 11.71 | (8.59 | )(c) | 17,698 | 1.30 | (k) | 1.42 | (k) | (0.66 | )(k) | 179 | |||||||||||||||||||||||||||||||||||
Class Y |
| |||||||||||||||||||||||||||||||||||||||||||||||||||||||
Year ended 08/31/13 | 12.57 | 0.06 | 2.34 | 2.40 | (0.04 | ) | — | (0.04 | ) | 14.93 | 19.13 | (c) | 92,418 | 0.81 | (d) | 0.89 | (d) | 0.42 | (d) | 80 | ||||||||||||||||||||||||||||||||||||
Year ended 08/31/12 | 11.78 | 0.02 | 0.89 | 0.91 | — | (0.12 | ) | (0.12 | ) | 12.57 | 7.86 | (c) | 99,758 | 0.80 | 0.93 | 0.20 | 96 | |||||||||||||||||||||||||||||||||||||||
Year ended 08/31/11 | 9.83 | (0.02 | ) | 1.97 | 1.95 | — | — | — | 11.78 | 19.84 | (c) | 117,471 | 0.81 | 0.92 | (0.18 | ) | 179 | |||||||||||||||||||||||||||||||||||||||
Year ended 08/31/10 | 8.91 | 0.04 | 1.02 | 1.06 | (0.14 | ) | — | (0.14 | ) | 9.83 | 11.95 | (c) | 2,592 | 1.05 | 1.05 | 0.35 | 101 | |||||||||||||||||||||||||||||||||||||||
Year ended 08/31/09 | 10.27 | 0.14 | (1.31 | ) | (1.17 | ) | (0.19 | ) | (0.00 | ) | (0.19 | ) | 8.91 | (11.07 | )(l) | 1,451 | 1.10 | 1.18 | 1.77 | 105 | ||||||||||||||||||||||||||||||||||||
Class R5 |
| |||||||||||||||||||||||||||||||||||||||||||||||||||||||
Year ended 08/31/13 | 12.55 | 0.06 | 2.34 | 2.40 | (0.05 | ) | — | (0.05 | ) | 14.90 | 19.22 | (c) | 151,535 | 0.75 | (d) | 0.75 | (d) | 0.48 | (d) | 80 | ||||||||||||||||||||||||||||||||||||
Year ended 08/31/12 | 11.75 | 0.04 | 0.88 | 0.92 | — | (0.12 | ) | (0.12 | ) | 12.55 | 7.96 | (c) | 301,283 | 0.69 | 0.69 | 0.31 | 96 | |||||||||||||||||||||||||||||||||||||||
Year ended 08/31/11(j) | 12.07 | (0.00 | ) | (0.32 | ) | (0.32 | ) | — | — | — | 11.75 | (2.65 | )(c) | 197,097 | 0.66 | (k) | 0.66 | (k) | (0.03 | )(k) | 179 | |||||||||||||||||||||||||||||||||||
Class R6 |
| |||||||||||||||||||||||||||||||||||||||||||||||||||||||
Year ended 08/31/13(j) | 13.03 | 0.07 | 1.87 | 1.94 | (0.05 | ) | — | (0.05 | ) | 14.92 | 14.98 | (c) | 113,955 | 0.65 | (d)(k) | 0.65 | (d)(k) | 0.58 | (d)(k) | 80 | ||||||||||||||||||||||||||||||||||||
| (a) | Calculated using average shares outstanding. |
| (b) | Portfolio turnover is calculated at the fund level and is not annualized for periods less than one year, if applicable. For the year ended August 31, 2011, the portfolio turnover calculation excludes the value of securities purchased of $4,947,460,310 and sold of $2,251,028,915 in the effort to realign the fund’s portfolio holdings after the reorganization of Invesco Large Cap Growth Fund, Invesco Van Kampen Capital Growth Fund and Invesco Van Kampen Enterprise Fund into the Fund. For the year ended August 31, 2013, the portfolio turnover calculation excludes the value of securities purchased of $279,161,573 and sales of $299,305,234 in the effort to realign the Fund’s portfolio holdings after the reorganization of Invesco Leisure Fund into the Fund. |
| (c) | Includes adjustments in accordance with accounting principles generally accepted in the United States of America and as such, the net asset value for financial reporting purposes and the returns based upon those net asset values may differ from the net asset value and returns for shareholder transactions. Does not include sales charges and is not annualized for periods less than one year, if applicable. |
| (d) | Ratios are based on average daily net assets (000’s omitted) of $4,835,840, $245,538, $251,220, $18,588, $88,557, $169,515 and $109,547 for Class A, Class B, Class C, Class R, Class Y, Class R5 and Class R6 shares, respectively. |
| (e) | Assumes reinvestment of all distributions for the period and does not include payment of the maximum sales charge of 5.75% or contingent deferred sales charge (CDSC). On purchases of $1 million or more, a CDSC of 1% may be imposed on certain redemptions made within eighteen months of purchase. If the sales charges were included, total returns would be lower. These returns include combined Rule 12b-1 fees and service fees of up to 0.25% and do not reflect the deduction of taxes that a shareholder would pay on Fund distributions or the redemption of Fund shares. |
| (f) | The total return, ratio of expenses to average net assets and ratio of net investment income (loss) to average net assets reflect actual 12b-1 fees of 0.25%, 0.25% and 0.47% for the years ended August 31, 2013, 2012 and 2011, respectively. |
| (g) | Assumes reinvestment of all distributions for the period and does not include payment of the maximum CDSC of 5%, charged on certain redemptions made within one year of purchase and declining to 0% after the fifth year. If the sales charge was included, total returns would be lower. These returns include combined Rule 12b-1 fees and service fees of up to 1% and do not reflect the deduction of taxes that a shareholder would pay on Fund distributions or the redemption of Fund shares. |
| (h) | The total return, ratio of expenses to average net assets and ratio of net investment income (loss) to average net assets reflect actual 12b-1 fees of 0.79% and 0.88% for the years ended August 31, 2011 and 2010, respectively. |
| (i) | Assumes reinvestment of all distributions for the period and does not include payment of the maximum CDSC of 1%, charged on certain redemptions made within one year of purchase. If the sales charge was included, total returns would be lower. These returns include combined Rule 12b-1 fees and service fees of up to 1% and do not reflect the deduction of taxes that a shareholder would pay on Fund distributions or the redemption of Fund shares. |
| (j) | Commencement date of May 23, 2011 for Class R shares, December 22, 2010 for Class R5 shares and September 24, 2012 for Class R6 shares. |
| (k) | Annualized. |
| (l) | Assumes reinvestment of all distributions for the period. These returns do not reflect the deduction of taxes that a shareholder would pay on Fund distributions or the redemption on Fund shares. |
NOTE 13—Subsequent Event
The Board of Trustees unanimously approved an Agreement and Plan of Reorganization (the “Agreement”) pursuant to which the Fund would acquire all of the assets and liabilities of Invesco Constellation Fund (the “Target Fund”) in exchange for shares of the Fund (the “Reorganization”).
The Agreement was approved by the Target Fund’s shareholders on August 27, 2013 and the Reorganization was consummated on September 16, 2013. Upon the closing of the Reorganization, shareholders of the Target Fund received a corresponding class of shares of the Fund in exchange for their shares of the Target Fund and the Target Fund liquidated and ceased operations.
20 Invesco American Franchise Fund
Report of Independent Registered Public Accounting Firm
To the Board of Trustees of AIM Counselor Series Trust (Invesco Counselor Series Trust) and Shareholders of Invesco American Franchise Fund:
In our opinion, the accompanying statement of assets and liabilities, including the schedule of investments, and the related statements of operations and of changes in net assets and the financial highlights present fairly, in all material respects, the financial position of Invesco American Franchise Fund (one of the funds constituting AIM Counselor Series Trust (Invesco Counselor Series Trust), hereafter referred to as the “Fund”) at August 31, 2013, the results of its operations for the year then ended, the changes in its net assets for each of the two years in the period then ended and the financial highlights for each of the four years in the period then ended, in conformity with accounting principles generally accepted in the United States of America. These financial statements and financial highlights (hereafter referred to as “financial statements”) are the responsibility of the Fund’s management; our responsibility is to express an opinion on these financial statements based on our audits. We conducted our audits of these financial statements in accordance with the standards of the Public Company Accounting Oversight Board (United States). Those standards require that we plan and perform the audit to obtain reasonable assurance about whether the financial statements are free of material misstatement. An audit includes examining, on a test basis, evidence supporting the amounts and disclosures in the financial statements, assessing the accounting principles used and significant estimates made by management, and evaluating the overall financial statement presentation. We believe that our audits, which included confirmation of securities at August 31, 2013 by correspondence with the custodian and brokers, provide a reasonable basis for our opinion. The financial highlights of the Fund for the period ended August 31, 2009 was audited by another independent registered public accounting firm whose report dated October 26, 2009 expressed an unqualified opinion on such financial statement.
PRICEWATERHOUSECOOPERS LLP
October 25, 2013
Houston, Texas
21 Invesco American Franchise Fund
Calculating your ongoing Fund expenses
Example
As a shareholder of the Fund, you incur two types of costs: (1) transaction costs, which may include sales charges (loads) on purchase payments or contingent deferred sales charges on redemptions, if any; and (2) ongoing costs, including management fees, distribution and/or service (12b-1) fees, and other Fund expenses. This example is intended to help you understand your ongoing costs (in dollars) of investing in the Fund and to compare these costs with ongoing costs of investing in other mutual funds. The example is based on an investment of $1,000 invested at the beginning of the period and held for the entire period March 1, 2013 through August 31, 2013.
Actual expenses
The table below provides information about actual account values and actual expenses. You may use the information in this table, together with the amount you invested, to estimate the expenses that you paid over the period. Simply divide your account value by $1,000 (for example, an $8,600 account value divided by $1,000 = 8.6), then multiply the result by the number in the table under the heading entitled “Actual Expenses Paid During Period” to estimate the expenses you paid on your account during this period.
Hypothetical example for comparison purposes
The table below also provides information about hypothetical account values and hypothetical expenses based on the Fund’s actual expense ratio and an assumed rate of return of 5% per year before expenses, which is not the Fund’s actual return.
The hypothetical account values and expenses may not be used to estimate the actual ending account balance or expenses you paid for the period. You may use this information to compare the ongoing costs of investing in the Fund and other funds. To do so, compare this 5% hypothetical example with the 5% hypothetical examples that appear in the shareholder reports of the other funds.
Please note that the expenses shown in the table are meant to highlight your ongoing costs only and do not reflect any transaction costs, such as sales charges (loads) on purchase payments or contingent deferred sales charges on redemptions, if any. Therefore, the hypothetical information is useful in comparing ongoing costs only, and will not help you determine the relative total costs of owning different funds. In addition, if these transaction costs were included, your costs would have been higher.
| Class | Beginning Account Value (03/01/13) | ACTUAL | HYPOTHETICAL (5% annual return before expenses) | Annualized Expense Ratio2 | ||||||||||||||||||||
| Ending Account Value (08/31/13)1 | Expenses Paid During Period2,3 | Ending Account Value (08/31/13) | Expenses Paid During Period2,4 | |||||||||||||||||||||
| A | $ | 1,000.00 | $ | 1,130.60 | $ | 5.80 | $ | 1,019.76 | $ | 5.50 | 1.08 | % | ||||||||||||
| B | 1,000.00 | 1,131.20 | 5.80 | 1,019.76 | 5.50 | 1.08 | ||||||||||||||||||
| C | 1,000.00 | 1,126.50 | 9.81 | 1,015.98 | 9.30 | 1.83 | ||||||||||||||||||
| R | 1,000.00 | 1,129.50 | 7.14 | 1,018.50 | 6.77 | 1.33 | ||||||||||||||||||
| Y | 1,000.00 | 1,132.10 | 4.46 | 1,021.02 | 4.23 | 0.83 | ||||||||||||||||||
| R5 | 1,000.00 | 1,132.40 | 4.03 | 1,021.42 | 3.82 | 0.75 | ||||||||||||||||||
| R6 | 1,000.00 | 1,133.90 | 3.50 | 1,021.93 | 3.31 | 0.65 | ||||||||||||||||||
| 1 | The actual ending account value is based on the actual total return of the Fund for the period March 1, 2013 through August 31, 2013, after actual expenses and will differ from the hypothetical ending account value which is based on the Fund’s expense ratio and a hypothetical annual return of 5% before expenses. |
| 2 | Expenses are equal to the Fund’s annualized expense ratio as indicated above multiplied by the average account value over the period, multiplied by 184/365 to reflect the most recent fiscal half year. Effective July 1, 2013, the Fund’s adviser has contractually agreed to waive advisory fees and/or reimburse expenses to the extent necessary to limit total annual fund operating expense of Class A, Class B, Class C, Class R, Class Y, Class R5 and Class R6 shares to 2.00%, 2.75% (after 12b-1 fee waivers), 2.75%, 2.25%, 1.75%, 1.75% and 1.75% of average daily net assets, respectively. The annualized expense ratios restated as if these agreements had been in effect throughout the entire most recent fiscal half year are 1.13%, 1.13%, 1.88%, 1.38%, 0.88%, 0.75% and 0.65% for Class A, Class B, Class C, Class R, Class Y, Class R5 and Class R6 shares, respectively. |
| 3 | The actual expenses paid restated as if the changes discussed above had been in effect throughout the entire most recent fiscal half year are $6.07, $6.07, $10.08, $7.41, $4.73, $4.03 and $3.50 for Class A, Class B, Class C, Class R, Class Y, Class R5 and Class R6 shares, respectively. |
| 4 | The hypothetical expenses paid restated as if the changes discussed above had been in effect throughout the entire most recent fiscal half year are $5.75, $5.75, $9.55, $7.02, $4.48, $3.82 and $3.31 for Class A, Class B, Class C, Class R, Class Y, Class R5 and Class R6 shares, respectively. |
22 Invesco American Franchise Fund
Approval of Investment Advisory and Sub-Advisory Contracts
The Board of Trustees (the Board) of AIM Counselor Series Trust (Invesco Counselor Series Trust) is required under the Investment Company Act of 1940, as amended, to approve annually the renewal of Invesco American Franchise Fund’s (the Fund) investment advisory agreement with Invesco Advisers, Inc. (Invesco Advisers) and the Master Intergroup Sub-Advisory Contract for Mutual Funds (the sub-advisory contracts) with Invesco Asset Management Deutschland GmbH, Invesco Asset Management Limited, Invesco Asset Management (Japan) Limited, Invesco Australia Limited, Invesco Hong Kong Limited, Invesco Senior Secured Management, Inc., and Invesco Canada Ltd. (collectively, the Affiliated Sub-Advisers). During contract renewal meetings held on June 17-19, 2013, the Board as a whole, and the disinterested or “independent” Trustees, who comprise over 75% of the Board, voting separately, approved the continuance of the Fund’s investment advisory agreement and the sub-advisory contracts for another year, effective July 1, 2013. The Board determined that the continuation of the Fund’s investment advisory agreement and the sub-advisory contracts are in the best interests of the Fund and its shareholders and the compensation payable to Invesco Advisers and the Affiliated Sub-Advisers under the agreements is fair and reasonable.
The Board’s Fund Evaluation Process
The Board’s Investments Committee has established three Sub-Committees, each of which is primarily responsible for overseeing the management of a number of the funds advised by Invesco Advisers (the Invesco Funds). The Sub-Committees meet throughout the year to review the performance of their assigned Invesco Funds, including reviewing materials prepared under the direction of the independent Senior Officer, an officer of the Invesco Funds who reports directly to the independent Trustees. Over the course of each year, the Sub-Committees meet with portfolio managers for their assigned Invesco Funds and other members of management to review the performance, investment objective(s), policies, strategies, limitations and investment risks of these funds. The Sub-Committees meet regularly and at designated contract renewal meetings each year to conduct a review of the performance, fees, expenses and other matters related to their assigned Invesco Funds. Each Sub-Committee recommends to the Investments Committee, which in turn recommends to the full Board, whether and on what terms to approve the continuance of each Invesco Fund’s investment advisory agreement and sub-advisory contracts for another year.
During the contract renewal process, the Trustees receive comparative performance and fee data regarding the Invesco Funds prepared by Invesco Advisers and Lipper Inc. (Lipper), an independent provider of investment company
data. The Trustees also receive an independent written evaluation from the Senior Officer. The Senior Officer’s evaluation is prepared as part of his responsibility to manage the process by which the Invesco Funds’ proposed management fees are negotiated during the annual contract renewal process to ensure they are negotiated in a manner that is at arms’ length and reasonable. The independent Trustees are assisted in their annual evaluation of the Fund’s investment advisory agreement by the Senior Officer and by independent legal counsel. In addition to meetings with Invesco Advisers and fund counsel, the independent Trustees also discuss the continuance of the investment advisory agreement and sub-advisory contracts in separate sessions with the Senior Officer and with independent legal counsel.
In evaluating the fairness and reasonableness of compensation under the Fund’s investment advisory agreement and sub-advisory contracts, the Board considered, among other things, the factors discussed below. The Trustees recognized that the advisory fee rates for the Invesco Funds are, in many cases, the result of years of review and negotiation between the Trustees and Invesco Advisers as well as advisory fees previously approved by different predecessor boards. The Trustees’ deliberations and conclusions in a particular year may be based in part on their deliberations and conclusions regarding these same arrangements throughout the year and in prior years. The Trustees’ review and conclusions are based on the comprehensive consideration of all information presented to them and are not the result of any single determinative factor. Moreover, one Trustee may have weighed a particular piece of information or factor differently than another Trustee.
The discussion below serves as the Senior Officer’s independent written evaluation with respect to the Fund’s investment advisory agreement as well as a discussion of the material factors and related conclusions that formed the basis for the Board’s approval of the Fund’s investment advisory agreement and sub-advisory contracts. Unless otherwise stated, this information is current as of June 19, 2013, and may not reflect consideration of factors that became known to the Board after that date, including, for example, changes to the Fund’s performance, advisory fees, expense limitations and/or fee waivers.
Factors and Conclusions and Summary of Independent Written Fee Evaluation
| A. | Nature, Extent and Quality of Services Provided by Invesco Advisers and the Affiliated Sub-Advisers |
The Board reviewed the advisory services provided to the Fund by Invesco Advisers under the Fund’s investment advisory agreement, the performance of Invesco Advisers in providing these services, and the credentials and
experience of the officers and employees of Invesco Advisers who provide these services, including the Fund’s portfolio manager or managers, with whom the Sub-Committees met during the year. The Board’s review of the qualifications of Invesco Advisers to provide advisory services included the Board’s consideration of Invesco Advisers’ investment process oversight, independent credit analysis and investment risk management.
In determining whether to continue the Fund’s investment advisory agreement, the Board considered the benefits of reapproving an existing relationship and the greater uncertainty that may be associated with entering into a new relationship. The Board also considered non-advisory services that Invesco Advisers and its affiliates provide to the Invesco Funds such as various back office support functions, equity and fixed income trading operations, internal audit, distribution and legal and compliance. The Board concluded that the nature, extent and quality of the services provided to the Fund by Invesco Advisers are appropriate and satisfactory and consistent with the terms of the Fund’s investment advisory agreement.
The Board reviewed the services that may be provided by the Affiliated Sub-Advisers under the sub-advisory contracts and the credentials and experience of the officers and employees of the Affiliated Sub-Advisers who provide these services. The Board noted that the Affiliated Sub-Advisers have offices and personnel that are located in financial centers around the world. As a result, the Affiliated Sub-Advisers can provide research and investment analysis on the markets and economies of various countries in which the Fund may invest, make recommendations regarding securities and assist with security trades. The Board concluded that the sub-advisory contracts benefit the Fund and its shareholders by permitting Invesco Advisers to use the resources and talents of the Affiliated Sub-Advisers in managing the Fund. The Board concluded that the nature, extent and quality of the services that may be provided by the Affiliated Sub-Advisers are appropriate and satisfactory and consistent with the terms of the Fund’s sub-advisory contracts.
| B. | Fund Performance |
The Board considered Fund performance as a relevant factor in considering whether to approve the investment advisory agreement. The Board did not view Fund performance as a relevant factor in considering whether to approve the sub-advisory contracts for the Fund, as no Affiliated Sub-Adviser currently manages assets of the Fund.
The Board compared the Fund’s performance during the past one, three and five calendar years to the performance of funds in the Lipper performance universe and against the Lipper Large-Cap Growth Funds Index. The Board noted that performance of Class A shares of the Fund
23 Invesco American Franchise Fund
was in the fourth quintile of the performance universe for the one and three year periods and the first quintile for the five year period (the first quintile being the best performing funds and the fifth quintile being the worst performing funds). The Board noted that performance of Class A shares of the Fund was below the performance of the Index for the one and three year periods and above the performance of the Index for the five year period. Invesco Advisers noted that abrupt market changes have created a challenging environment for the trend driven process employed by the portfolio management team leading to a high probability of relative underperformance. The Trustees also reviewed more recent Fund performance and this review did not change their conclusions.
| C. | Advisory and Sub-Advisory Fees |
The Board compared the Fund’s contractual management fee rate to the contractual management fee rates of funds in the Fund’s Lipper expense group at a common asset level. The Board noted that the contractual management fee rate for Class A shares of the Fund was at the median contractual management fee rate of funds in the expense group. The Board noted that the term “contractual management fee” may include both advisory and certain administrative services fees and that Invesco does not charge the Invesco Funds for the administrative services included in the term as defined by Lipper. The Board also reviewed the methodology used by Lipper in providing expense group information, which includes using each fund’s contractual management fee schedule (including any applicable breakpoints) as reported in the most recent prospectus or statement of additional information for each fund in the expense group.
The Board also compared the Fund’s effective advisory fee rate (the advisory fee rate after advisory fee waivers and before other expense limitations/waivers) to the effective advisory fee rates of other mutual funds advised by Invesco Advisers and its affiliates with investment strategies comparable to those of the Fund. The Board noted that the Fund’s rate was below the rate of the two mutual funds advised by Invesco Advisers with comparable investment strategies. The Board also noted that Invesco Advisers sub-advises two other mutual funds with investment strategies comparable to those of the Fund and that the sub-advisory effective fee rate was below the advisory effective fee rate of the Fund.
Other than the mutual funds described above, the Board noted that Invesco Advisers and the Affiliated Sub-Advisers do not manage other mutual funds or client accounts in a manner substantially similar to the management of the Fund.
The Board also considered the services that may be provided by the Affiliated Sub-Advisers pursuant to the sub-advisory contracts, as well as the fees payable by Invesco Advisers to the Affiliated Sub-Advisers pursuant to the sub-advisory contracts. The Board also noted that
the sub-advisory fees are not paid directly by the Fund, but rather, are payable by Invesco Advisers to the Affiliated Sub-Advisers.
Based upon the information and considerations described above, the Board concluded that the compensation payable to Invesco Advisers and the Affiliated Sub-Advisers is fair and reasonable.
| D. | Economies of Scale and Breakpoints |
The Board considered the extent to which there are economies of scale in the provision of advisory services to the Fund. The Board also considered whether the Fund benefits from economies of scale through contractual breakpoints in the Fund’s advisory fee schedule and was assisted in this review by a report from the Senior Officer. The Board also noted that the Fund shares directly in economies of scale through lower fees charged by third party service providers based on the combined size of the Invesco Funds and other clients advised by Invesco Advisers.
| E. | Profitability and Financial Resources |
The Board reviewed information from Invesco Advisers concerning the costs of the advisory and other services that Invesco Advisers and its affiliates provide to the Fund and the profitability of Invesco Advisers and its affiliates in providing these services for the year ended December 31, 2012. The Board received information from Invesco Advisers about the methodology used to prepare the profitability information. The Board considered the profitability of Invesco Advisers in managing the Fund and the Invesco Funds. The Board noted that Invesco Advisers continues to operate at a net profit from services Invesco Advisers and its subsidiaries provide to the Invesco Funds and the Fund. The Board did not deem the level of profits realized by Invesco Advisers and its affiliates from providing services to the Fund to be excessive given the nature, quality and extent of the services provided to the Invesco Funds. The Board received and accepted information from Invesco Advisers demonstrating that Invesco Advisers and each Affiliated Sub-Adviser are financially sound and have the resources necessary to perform their obligations under the investment advisory agreement and sub-advisory contracts.
| F. | Collateral Benefits to Invesco Advisers and its Affiliates |
The Board considered various other benefits received by Invesco Advisers and its affiliates from the relationship with the Fund, including the fees received for their provision of transfer agency and distribution services to the Fund. The Board considered comparative information regarding fees charged for these services, including information provided by Lipper and other independent sources. The Board considered the performance of Invesco Advisers and its affiliates in providing these services and the organizational structure employed to provide these services. The Board also considered that these services are provided to the Fund pursuant to written contracts that are reviewed and approved on an annual basis by
the Board; that the services are required for the operation of the Fund; that Invesco Advisers and its affiliates can provide services, the nature and quality of which are at least equal to those provided by others offering the same or similar services; and that the fees for such services are fair and reasonable in light of the usual and customary charges by others for services of the same nature and quality.
The Board considered the benefits realized by Invesco Advisers and the Affiliated Sub-Advisers as a result of portfolio brokerage transactions executed through “soft dollar” arrangements. The Board noted that soft dollar arrangements shift the payment obligation for research services from Invesco Advisers and the Affiliated Sub-Advisers to the Invesco Funds and that the research received may be used with other clients of Invesco Advisers and may reduce Invesco Advisers’ and the Affiliated Sub-Advisers’ expenses. The Board also considered periodic reports from the Chief Compliance Officer of the Invesco Funds demonstrating that these arrangements are consistent with regulatory requirements. The Board did not deem the soft dollar arrangements to be inappropriate.
The Board considered that the Fund’s uninvested cash and cash collateral from any securities lending arrangements may be invested in money market funds advised by Invesco Advisers pursuant to procedures approved by the Board. The Board noted that Invesco Advisers receives advisory fees from these affiliated money market funds attributable to such investments, although Invesco Advisers has contractually agreed to waive through varying periods the advisory fees payable by the Invesco Funds. The waiver is in an amount equal to 100% of the net advisory fee Invesco Advisers receives from the affiliated money market funds with respect to the Fund’s investment in the affiliated money market funds of uninvested cash, but not cash collateral. The Board concluded that the Fund’s investment of uninvested cash and cash collateral from any securities lending arrangements in the affiliated money market funds is in the best interests of the Fund and its shareholders.
The Board also considered use of an affiliated broker to execute certain trades for the Fund to among other things, control information leakage, and were advised that such trades are executed in compliance with rules under the Investment Company Act of 1940, as amended.
24 Invesco American Franchise Fund
Tax Information
Form 1099-DIV, Form 1042-S and other year-end tax information provide shareholders with actual calendar year amounts that should be included in their tax returns. Shareholders should consult their tax advisors.
The following distribution information is being provided as required by the Internal Revenue Code or to meet a specific state’s requirement.
The Fund designates the following amounts or, if subsequently determined to be different, the maximum amount allowable for its fiscal year ended August 31, 2013:
Federal and State Income Tax | ||||
Qualified Dividend Income* | 100 | % | ||
Corporate Dividends Received Deduction* | 100 | % | ||
| * | The above percentages are based on ordinary income dividends paid to shareholders during the Fund’s fiscal year. |
25 Invesco American Franchise Fund
Trustees and Officers
The address of each trustee and officer is AIM Counselor Series Trust (Invesco Counselor Series Trust) (the “Trust”), 11 Greenway Plaza, Suite 1000, Houston, Texas 77046-1173. The trustees serve for the life of the Trust, subject to their earlier death, incapacitation, resignation, retirement or removal as more specifically provided in the Trust’s organizational documents. Each officer serves for a one year term or until their successors are elected and qualified. Column two below includes length of time served with predecessor entities, if any.
Name, Year of Birth and Position(s) Held with the Trust | Trustee and/ or Officer Since | Principal Occupation(s) During Past 5 Years | Number of Funds in Fund Complex Overseen by Trustee | Other Directorship(s) Held by Trustee During Past 5 Years | ||||
| Interested Persons | ||||||||
| Martin L. Flanagan1 — 1960 Trustee | 2007 | Executive Director, Chief Executive Officer and President, Invesco Ltd. (ultimate parent of Invesco and a global investment management firm); Advisor to the Board, Invesco Advisers, Inc. (formerly known as Invesco Institutional (N.A.), Inc.); Trustee, The Invesco Funds; Vice Chair, Investment Company Institute; and Member of Executive Board, SMU Cox School of Business
Formerly: Chairman and Chief Executive Officer, Invesco Advisers, Inc. (registered investment adviser); Director, Chairman, Chief Executive Officer and President, IVZ Inc. (holding company), INVESCO Group Services, Inc. (service provider) and Invesco North American Holdings, Inc. (holding company); Director, Chief Executive Officer and President, Invesco Holding Company Limited (parent of Invesco and a global investment management firm); Director, Invesco Ltd.; Chairman, Investment Company Institute and President, Co-Chief Executive Officer, Co-President, Chief Operating Officer and Chief Financial Officer, Franklin Resources, Inc. (global investment management organization) | 117 | None | ||||
| Philip A. Taylor2 — 1954 Trustee, President and Principal Executive Officer | 2006 | Head of North American Retail and Senior Managing Director, Invesco Ltd.; Director, Co-Chairman, Co-President and Co-Chief Executive Officer, Invesco Advisers, Inc. (formerly known as Invesco Institutional (N.A.), Inc.) (registered investment adviser); Director, Chairman, Chief Executive Officer and President, Invesco Management Group, Inc. (formerly known as Invesco Aim Management Group, Inc.) (financial services holding company); Director and President, INVESCO Funds Group, Inc. (registered investment adviser and registered transfer agent); Director and Chairman, Invesco Investment Services, Inc. (formerly known as Invesco Aim Investment Services, Inc.) (registered transfer agent) and IVZ Distributors, Inc. (formerly known as INVESCO Distributors, Inc.) (registered broker dealer); Director, President and Chairman, Invesco Inc. (holding company) and Invesco Canada Holdings Inc. (holding company); Chief Executive Officer, Invesco Corporate Class Inc. (corporate mutual fund company) and Invesco Canada Fund Inc. (corporate mutual fund company); Director, Chairman and Chief Executive Officer, Invesco Canada Ltd. (formerly known as Invesco Trimark Ltd./Invesco Trimark Ltèe) (registered investment adviser and registered transfer agent); Trustee, President and Principal Executive Officer, The Invesco Funds (other than AIM Treasurer’s Series Trust (Invesco Treasurer’s Series Trust) and Short-Term Investments Trust); Trustee and Executive Vice President, The Invesco Funds (AIM Treasurer’s Series Trust (Invesco Treasurer’s Series Trust) and Short-Term Investments Trust only); Director, Invesco Investment Advisers LLC (formerly known as Van Kampen Asset Management); Director, Chief Executive Officer and President, Van Kampen Exchange Corp.
Formerly: Director and Chairman, Van Kampen Investor Services Inc.: Director, Chief Executive Officer and President, 1371 Preferred Inc. (holding company); and Van Kampen Investments Inc.; Director and President, AIM GP Canada Inc. (general partner for limited partnerships); and Van Kampen Advisors, Inc.; Director and Chief Executive Officer, Invesco Trimark Dealer Inc. (registered broker dealer); Director, Invesco Distributors, Inc. (formerly known as Invesco Aim Distributors, Inc.) (registered broker dealer); Manager, Invesco PowerShares Capital Management LLC; Director, Chief Executive Officer and President, Invesco Advisers, Inc.; Director, Chairman, Chief Executive Officer and President, Invesco Aim Capital Management, Inc.; President, Invesco Trimark Dealer Inc. and Invesco Trimark Ltd./Invesco Trimark Ltèe; Director and President, AIM Trimark Corporate Class Inc. and AIM Trimark Canada Fund Inc.; Senior Managing Director, Invesco Holding Company Limited; Trustee and Executive Vice President, Tax-Free Investments Trust; Director and Chairman, Fund Management Company (former registered broker dealer); President and Principal Executive Officer, The Invesco Funds (AIM Treasurer’s Series Trust (Invesco Treasurer’s Series Trust), Short-Term Investments Trust and Tax-Free Investments Trust only); President, AIM Trimark Global Fund Inc. and AIM Trimark Canada Fund Inc. | 117 | None | ||||
Wayne W. Whalen3 — 1939 Trustee | 2010 | Of Counsel, and prior to 2010, partner in the law firm of Skadden, Arps, Slate, Meagher & Flom LLP, legal counsel to certain funds in the Fund Complex
| 130 | Director of the Mutual Fund Directors Forum, a nonprofit membership organization for investment directors; Chairman and Director of the Abraham Lincoln Presidential Library Foundation; and Director of the Stevenson Center for Democracy |
| 1 | Mr. Flanagan is considered an interested person of the Trust because he is an officer of the adviser to the Trust, and an officer and a director of Invesco Ltd., ultimate parent of the adviser to the Trust. |
| 2 | Mr. Taylor is considered an interested person of the Trust because he is an officer and a director of the adviser to, and a director of the principal underwriter of, the Trust. |
| 3 | Mr. Whalen is considered an “interested person” (within the meaning of Section 2(a)(19) of the 1940 Act) of certain Funds in the Invesco Fund Complex because he and his firm currently provide legal services as legal counsel to such Funds. |
T-1 Invesco American Franchise Fund
Trustees and Officers—(continued)
Name, Year of Birth and Position(s) Held with the Trust | Trustee and/ or Officer Since | Principal Occupation(s) During Past 5 Years | Number of Funds in Fund Complex Overseen by Trustee | Other Directorship(s) Held by Trustee During Past 5 Years | ||||
| Independent Trustees | ||||||||
Bruce L. Crockett — 1944 Trustee and Chair | 2003 | Chairman, Crockett Technologies Associates (technology consulting company)
Formerly: Director, Captaris (unified messaging provider); Director, President and Chief Executive Officer COMSAT Corporation; and Chairman, Board of Governors of INTELSAT (international communications company) | 117 | ACE Limited (insurance company); Investment Company Institute | ||||
David C. Arch — 1945 Trustee | 2010 | Chairman and Chief Executive Officer of Blistex Inc., (consumer health care products manufacturer)
Formerly: Member of the Heartland Alliance Advisory Board, a nonprofit organization serving human needs based in Chicago | 130 | Board member of the Illinois Manufacturers’ Association; Member of the Board of Visitors, Institute for the Humanities, University of Michigan | ||||
Frank S. Bayley — 1939 Trustee | 2003 | Retired
Formerly: Director, Badgley Funds, Inc. (registered investment company) (2 portfolios) and General Partner and Of Counsel, law firm of Baker & McKenzie, LLP | 117 | Director and Chairman, C.D. Stimson Company (a real estate investment company); Trustee and Overseer, The Curtis Institute of Music | ||||
James T. Bunch — 1942 Trustee | 2000 | Managing Member, Grumman Hill Group LLC (family office private equity management)
Formerly: Founder, Green, Manning & Bunch Ltd. (investment banking firm)(1988-2010); Executive Committee, United States Golf Association; and Director, Policy Studies, Inc. and Van Gilder Insurance Corporation | 117 | Chairman, Board of Governors, Western Golf Association; Chairman-elect, Evans Scholars Foundation; and Director, Denver Film Society | ||||
Rodney F. Dammeyer — 1940 Trustee | 2010 | Chairman of CAC, LLC, (private company offering capital investment and management advisory services)
Formerly: Prior to 2001, Managing Partner at Equity Group Corporate Investments; Prior to 1995, Chief Executive Officer of Itel Corporation (formerly Anixter International); Prior to 1985, experience includes Senior Vice President and Chief Financial Officer of Household International, Inc., Executive Vice President and Chief Financial Officer of Northwest Industries, Inc. and Partner of Arthur Andersen & Co.; From 1987 to 2010, Director/Trustee of investment companies in the Van Kampen Funds complex | 117 | Director of Quidel Corporation and Stericycle, Inc.; Prior to May 2008, Trustee of The Scripps Research Institute; Prior to February 2008, Director of Ventana Medical Systems, Inc. | ||||
Albert R. Dowden — 1941 Trustee | 2003 | Director of a number of public and private business corporations, including the Boss Group, Ltd. (private investment and management); Reich & Tang Funds (5 portfolios) (registered investment company); and Homeowners of America Holding Corporation/ Homeowners of America Insurance Company (property casualty company)
Formerly: Director, Continental Energy Services, LLC (oil and gas pipeline service); Director, CompuDyne Corporation (provider of product and services to the public security market) and Director, Annuity and Life Re (Holdings), Ltd. (reinsurance company); Director, President and Chief Executive Officer, Volvo Group North America, Inc.; Senior Vice President, AB Volvo; Director of various public and private corporations; Chairman, DHJ Media, Inc.; Director Magellan Insurance Company; and Director, The Hertz Corporation, Genmar Corporation (boat manufacturer), National Media Corporation; Advisory Board of Rotary Power International (designer, manufacturer, and seller of rotary power engines); and Chairman, Cortland Trust, Inc. (registered investment company) | 117 | Director of Nature’s Sunshine Products, Inc. | ||||
Jack M. Fields — 1952 Trustee | 2003 | Chief Executive Officer, Twenty First Century Group, Inc. (government affairs company); Owner and Chief Executive Officer, Dos Angeles Ranch, L.P. (cattle, hunting, corporate entertainment); and Discovery Global Education Fund (non-profit)
Formerly: Chief Executive Officer, Texana Timber LP (sustainable forestry company); Director of Cross Timbers Quail Research Ranch (non-profit); and member of the U.S. House of Representatives | 117 | Insperity, Inc. (formerly known as Administaff) | ||||
Prema Mathai-Davis — 1950 Trustee | 2003 | Retired
Formerly: Chief Executive Officer, YWCA of the U.S.A. | 117 | None | ||||
Larry Soll — 1942 Trustee | 1997 | Retired
Formerly: Chairman, Chief Executive Officer and President, Synergen Corp. (a biotechnology company) | 117 | None | ||||
Hugo F. Sonnenschein — 1940 Trustee | 2010 | Distinguished Service Professor and President Emeritus of the University of Chicago and the Adam Smith Distinguished Service Professor in the Department of Economics at the University of Chicago
Formerly: President of the University of Chicago | 130 | Trustee of the University of Rochester and a member of its investment committee. Member of the National Academy of Sciences, the American Philosophical Society and a fellow of the American Academy of Arts and Sciences |
T-2 Invesco American Franchise Fund
Trustees and Officers—(continued)
Name, Year of Birth and Position(s) Held with the Trust | Trustee and/ or Officer Since | Principal Occupation(s) During Past 5 Years | Number of Funds in Fund Complex Overseen by Trustee | Other Directorship(s) Held by Trustee During Past 5 Years | ||||
| Independent Trustees—(continued) | ||||||||
Raymond Stickel, Jr. — 1944 Trustee | 2005 | Retired
Formerly: Director, Mainstay VP Series Funds, Inc. (25 portfolios) and Partner, Deloitte & Touche | 117 | None | ||||
| Other Officers | ||||||||
| Russell C. Burk — 1958 Senior Vice President and Senior Officer | 2005 | Senior Vice President and Senior Officer, The Invesco Funds | N/A | N/A | ||||
| John M. Zerr — 1962 Senior Vice President, Chief Legal Officer and Secretary | 2006 | Director, Senior Vice President, Secretary and General Counsel, Invesco Management Group, Inc. (formerly known as Invesco Aim Management Group, Inc.) and Van Kampen Exchange Corp.; Senior Vice President, Invesco Advisers, Inc. (formerly known as Invesco Institutional (N.A.), Inc.) (registered investment adviser); Senior Vice President and Secretary, Invesco Distributors, Inc. (formerly known as Invesco Aim Distributors, Inc.); Director, Vice President and Secretary, Invesco Investment Services, Inc. (formerly known as Invesco Aim Investment Services, Inc.) and IVZ Distributors, Inc. (formerly known as INVESCO Distributors, Inc.); Director and Vice President, INVESCO Funds Group, Inc.; Senior Vice President, Chief Legal Officer and Secretary, The Invesco Funds; Manager, Invesco PowerShares Capital Management LLC; Director, Secretary and General Counsel, Invesco Investment Advisers LLC (formerly known as Van Kampen Asset Management); Secretary and General Counsel, Invesco Capital Markets, Inc. (formerly known as Van Kampen Funds Inc.) and Chief Legal Officer, PowerShares Exchange-Traded Fund Trust, PowerShares Exchange-Traded Fund Trust II, PowerShares India Exchange-Traded Fund Trust and PowerShares Actively Managed Exchange-Traded Fund Trust
Formerly: Director and Vice President, Van Kampen Advisors Inc.; Director, Vice President, Secretary and General Counsel, Van Kampen Investor Services Inc.; Director, Invesco Distributors, Inc. (formerly known as Invesco Aim Distributors, Inc.); Director, Senior Vice President, General Counsel and Secretary, Invesco Aim Advisers, Inc. and Van Kampen Investments Inc.; Director, Vice President and Secretary, Fund Management Company; Director, Senior Vice President, Secretary, General Counsel and Vice President, Invesco Aim Capital Management, Inc.; Chief Operating Officer and General Counsel, Liberty Ridge Capital, Inc. (an investment adviser); Vice President and Secretary, PBHG Funds (an investment company) and PBHG Insurance Series Fund (an investment company); Chief Operating Officer, General Counsel and Secretary, Old Mutual Investment Partners (a broker-dealer); General Counsel and Secretary, Old Mutual Fund Services (an administrator) and Old Mutual Shareholder Services (a shareholder servicing center); Executive Vice President, General Counsel and Secretary, Old Mutual Capital, Inc. (an investment adviser); and Vice President and Secretary, Old Mutual Advisors Funds (an investment company) | N/A | N/A | ||||
| Karen Dunn Kelley — 1960 Vice President | 2003 | Head of Invesco’s World Wide Fixed Income and Cash Management Group; Director, Co-President, Co-Chief Executive Officer, and Co-Chairman, Invesco Advisers, Inc. (formerly known as Invesco Institutional (N.A.), Inc.) (registered investment adviser); Chairman, Invesco Senior Secured Management, Inc.; Senior Vice President, Invesco Management Group, Inc. (formerly known as Invesco Aim Management Group, Inc.); Executive Vice President, Invesco Distributors, Inc. (formerly known as Invesco Aim Distributors, Inc.); Director, Invesco Mortgage Capital Inc., and Invesco Management Company Limited; Director and President, INVESCO Asset Management (Bermuda) Ltd., Vice President, The Invesco Funds (other than AIM Treasurer’s Series Trust (Invesco Treasurer’s Series Trust) and Short-Term Investments Trust); and President and Principal Executive Officer, The Invesco Funds (AIM Treasurer’s Series Trust (Invesco Treasurer’s Series Trust) and Short-Term Investments Trust only)
Formerly: Director, INVESCO Global Asset Management Limited and INVESCO Management S.A.; Senior Vice President, Van Kampen Investments Inc. and Invesco Advisers, Inc. (formerly known as Invesco Institutional (N.A.), Inc.) (registered investment adviser); Vice President, Invesco Advisers, Inc. (formerly known as Invesco Institutional (N.A.), Inc.); Director of Cash Management and Senior Vice President, Invesco Advisers, Inc. and Invesco Aim Capital Management, Inc.; President and Principal Executive Officer, Tax-Free Investments Trust; Director and President, Fund Management Company; Chief Cash Management Officer, Director of Cash Management, Senior Vice President, and Managing Director, Invesco Aim Capital Management, Inc.; Director of Cash Management, Senior Vice President, and Vice President, Invesco Advisers, Inc. and The Invesco Funds (AIM Treasurer’s Series Trust (Invesco Treasurer’s Series Trust), Short-Term Investments Trust and Tax-Free Investments Trust only) | N/A | N/A | ||||
T-3 Invesco American Franchise Fund
Trustees and Officers—(continued)
Name, Year of Birth and Position(s) Held with the Trust | Trustee and/ or Officer Since | Principal Occupation(s) During Past 5 Years | Number of Funds in Fund Complex Overseen by Trustee | Other Directorship(s) Held by Trustee During Past 5 Years | ||||
| Other Officers—(continued) | ||||||||
| Sheri Morris — 1964 Vice President, Treasurer and Principal Financial Officer | 2003 | Vice President, Treasurer and Principal Financial Officer, The Invesco Funds; Vice President, Invesco Advisers, Inc. (formerly known as Invesco Institutional (N.A.), Inc.) (registered investment adviser); and Vice President, PowerShares Exchange-Traded Fund Trust, PowerShares Exchange-Traded Fund Trust II, PowerShares India Exchange-Traded Fund Trust and PowerShares Actively Managed Exchange-Traded Fund Trust
Formerly: Vice President, Invesco Aim Advisers, Inc., Invesco Aim Capital Management, Inc. and Invesco Aim Private Asset Management, Inc.; Assistant Vice President and Assistant Treasurer, The Invesco Funds and Assistant Vice President, Invesco Advisers, Inc., Invesco Aim Capital Management, Inc. and Invesco Aim Private Asset Management, Inc.; and Treasurer, PowerShares Exchange-Traded Fund Trust, PowerShares Exchange-Traded Fund Trust II, PowerShares India Exchange-Traded Fund Trust and PowerShares Actively Managed Exchange-Traded Fund Trust | N/A | N/A | ||||
Crissie M. Wisdom — 1969 Anti-Money Laundering Compliance Officer | 2013 | Anti-Money Laundering Compliance Officer, Invesco Advisers, Inc. (formerly known as Invesco Institutional (N.A.), Inc.) (registered investment adviser), Invesco Capital Markets, Inc. (formerly known as Van Kampen Funds Inc.), Invesco Distributors, Inc., Invesco Investment Services, Inc., Invesco Management Group, Inc., Van Kampen Exchange Corp., The Invesco Funds, Invesco Funds (Chicago), and PowerShares Exchange-Traded Fund Trust, PowerShares Exchange-Traded Fund Trust II, PowerShares India Exchange-Traded Fund Trust, and PowerShares Actively Managed Exchange-Traded Fund Trust; and Fraud Prevention Manager and Controls and Risk Analysis Manager for Invesco Investment Services, Inc. | N/A | N/A | ||||
| Todd L. Spillane — 1958 Chief Compliance Officer | 2006 | Senior Vice President, Invesco Management Group, Inc. (formerly known as Invesco Aim Management Group, Inc.) and Van Kampen Exchange Corp.; Senior Vice President and Chief Compliance Officer, Invesco Advisers, Inc. (registered investment adviser) (formerly known as Invesco Institutional (N.A.), Inc.); Chief Compliance Officer, The Invesco Funds; Vice President, Invesco Distributors, Inc. (formerly known as Invesco Aim Distributors, Inc.) and Invesco Investment Services, Inc. (formerly known as Invesco Aim Investment Services, Inc.)
Formerly: Chief Compliance Officer, Invesco Funds (Chicago); Senior Vice President, Van Kampen Investments Inc.; Senior Vice President and Chief Compliance Officer, Invesco Aim Advisers, Inc. and Invesco Aim Capital Management, Inc.; Chief Compliance Officer, INVESCO Private Capital Investments, Inc. (holding company), Invesco Private Capital, Inc. (registered investment adviser), Invesco Global Asset Management (N.A.), Inc., Invesco Senior Secured Management, Inc. (registered investment adviser), Van Kampen Investor Services Inc., PowerShares Exchange-Traded Fund Trust, PowerShares Exchange-Traded Fund Trust II, PowerShares India Exchange-Traded Fund Trust and PowerShares Actively Managed Exchange-Traded Fund Trust; and Vice President, Invesco Aim Capital Management, Inc. and Fund Management Company | N/A | N/A |
The Statement of Additional Information of the Trust includes additional information about the Fund’s Trustees and is available upon request, without charge, by calling 1.800.959.4246. Please refer to the Fund’s prospectus for information on the Fund’s sub-advisers.
Office of the Fund 11 Greenway Plaza, Suite 1000 Houston, TX 77046-1173 | Investment Adviser Invesco Advisers, Inc. 1555 Peachtree Street, N.E. Atlanta, GA 30309 | Distributor Invesco Distributors, Inc. 11 Greenway Plaza, Suite 1000 Houston, TX 77046-1173 | Auditors PricewaterhouseCoopers LLP 1201 Louisiana Street, Suite 2900 Houston, TX 77002-5678 | |||
Counsel to the Fund Stradley Ronon Stevens & Young, LLP 2005 Market Street, Suite 2600 Philadelphia, PA 19103-7018 | Counsel to the Independent Trustees Goodwin Procter LLP 901 New York Avenue, N.W. Washington, D.C. 20001 | Transfer Agent Invesco Investment Services, Inc. 11 Greenway Plaza, Suite 1000 Houston, TX 77046-1173 | Custodian State Street Bank and Trust Company 225 Franklin Street Boston, MA 02110-2801 | |||
T-4 Invesco American Franchise Fund

Invesco mailing information
Send general correspondence to Invesco Investment Services, Inc., P.O. Box 219078, Kansas City, MO 64121-9078.
Invesco privacy policy
You share personal and financial information with us that is necessary for your transactions and your account records. We take very seriously the obligation to keep that information confidential and private.
Invesco collects nonpublic personal information about you from account applications or other forms you complete and from your transactions with us or our affiliates. We do not disclose information about you or our former customers to service providers or other third parties except to the extent necessary to service your account and in other limited circumstances as permitted by law. For example, we use this information to facilitate the delivery of transaction confirmations, financial reports, prospectuses and tax forms.
Even within Invesco, only people involved in the servicing of your accounts and compliance monitoring have access to your information. To ensure the highest level of confidentiality and security, Invesco maintains physical, electronic and procedural safeguards that meet or exceed federal standards. Special measures, such as data encryption and authentication, apply to your communications with us on our website. More detail is available to you at invesco.com/privacy.
Important notice regarding delivery of security holder documents
To reduce Fund expenses, only one copy of most shareholder documents may be mailed to shareholders with multiple accounts at the same address (Householding). Mailing of your shareholder documents may be householded indefinitely unless you instruct us otherwise. If you do not want the mailing of these documents to be combined with those for other members of your household, please contact Invesco Investment Services, Inc. at 800 959 4246 or contact your financial institution. We will begin sending you individual copies for each account within 30 days after receiving your request.
Fund holdings and proxy voting information
The Fund provides a complete list of its holdings four times in each fiscal year, at the quarter ends. For the second and fourth quarters, the lists appear in the Fund’s semiannual and annual reports to shareholders. For the first and third quarters, the Fund files the lists with the Securities and Exchange Commission (SEC) on Form N-Q. The most recent list of portfolio holdings is available at invesco.com/completeqtrholdings. Shareholders can also look up the Fund’s Forms N-Q on the SEC website at sec.gov. Copies of the Fund’s Forms N-Q may be reviewed and copied at the SEC Public Reference Room in Washington, D.C. You can obtain information on the operation of the Public Reference Room, including information about duplicating fee charges, by calling 202 551 8090 or 800 732 0330, or by electronic request at the following email address: publicinfo@sec.gov. The SEC file numbers for the Fund are shown below.
A description of the policies and procedures that the Fund uses to determine how to vote proxies relating to portfolio securities is available without charge, upon request, from our Client Services department at 800 959 4246 or at invesco.com/proxyguidelines. The information is also available on the SEC website, sec.gov. Information regarding how the Fund voted proxies related to its portfolio securities during the most recent 12-month period ended June 30 is available at invesco.com/proxysearch. The information is also available on the SEC website, sec.gov. Invesco Advisers, Inc. is an investment adviser; it provides investment advisory services to individual and institutional clients and does not sell securities. Invesco Distributors, Inc. is the US distributor for Invesco Ltd.’s retail mutual funds, exchange-traded funds and institutional money market funds. Both are wholly owned, indirect subsidiaries of Invesco Ltd. |
| |
| ||
SEC file numbers: 811-09913 and 333-36074 VK-AMFR-AR-1 Invesco Distributors, Inc. | ||

Letters to Shareholders
Phillip Taylor | Dear Shareholders: Enclosed in this annual report, you’ll find information about your Fund and the factors that affected its performance during the reporting period. Inside, you’ll also find a discussion from your portfolio managers about how they managed your Fund, as well as performance data for your Fund, a complete list of your Fund’s investments as of the close of the reporting period and other important information. I hope you find this report of interest. During the reporting period covered by this report, major US equity indexes made multiyear or even all-time highs.1 Economic data were generally positive; housing and consumer spending data were particularly encouraging. Nonetheless, economic uncertainty and concern about continuing political and budget gridlock in Washington persisted. The US Federal Reserve’s deliberate vagueness about when, and to what degree, it might begin to curtail its extraordinarily accommodative monetary policies – together with uncertainty about who will next lead the central bank – affected fixed income and equity markets alike. Most developed, non-US stock markets remained positive for the first half of 2013, despite a difficult second quarter. | ||||||||

Periods of market volatility and economic uncertainty can weaken the will of even the most resolute investor. That’s why Invesco believes it’s often helpful to work with a skilled and trusted financial adviser who can emphasize the importance of adhering to an investment plan designed to achieve long-term goals rather than being sidetracked by short-term uncertainty that can result in inaction. A financial adviser who is familiar with your individual financial situation, investment goals and risk tolerance can be an invaluable partner as you work toward your financial goals. He or she can provide insight and perspective when markets are volatile; encouragement and reassurance when times are uncertain; and advice and guidance when your financial situation or investment goals change.
Our website, invesco.com/us, is another source of timely insight and information for investors. On the website, you’ll find fund-specific as well as more general information from many of Invesco’s investment professionals. You’ll find in-depth articles, video clips and audio commentaries – and, of course, you also can access information about your Invesco account whenever it’s convenient for you.
What we mean by Intentional Investing
At Invesco, all of our people and all of our resources are dedicated to helping investors achieve their financial objectives. It’s a philosophy we call Intentional Investing, and it guides the way we:
| n | Manage investments – Our dedicated investment professionals search the world for the best opportunities, and each investment team follows a clear, disciplined process to build portfolios and mitigate risk. |
| n | Provide choices – We offer multiple investment strategies, allowing you and your financial adviser to build a portfolio that’s purpose-built for your needs. |
| n | Connect with you – We’re committed to giving you the expert insights you need to make informed investing decisions, and we are well-equipped to provide high-quality support for investors and advisers. |
At Invesco, we believe in putting investors first. That’s why investment management is all we do. Our sole focus on managing your money allows you and your financial adviser to build a portfolio of Invesco funds appropriate for your investment needs and goals today and when your circumstances change.
Have questions?
For questions about your account, feel free to contact an Invesco client services representative at 800 959 4246. For Invesco-related questions or comments, please email me directly at phil@invesco.com.
All of us at Invesco look forward to serving your investment management needs for many years to come. Thank you for investing with us.
Sincerely,

Philip Taylor
Senior Managing Director, Invesco Ltd.
| 1 | Source: Reuters |
2 Invesco California Tax-Free Income Fund
Bruce Crockett | Dear Fellow Shareholders: The Invesco Funds Board has worked on a variety of issues over the last several months, and I’d like to take this opportunity to discuss two that affect you and our fellow fund shareholders. The first issue on which your Board has been working is our annual review of the funds’ advisory and sub-advisory contracts with Invesco Advisers and its affiliates. This annual review, which is required by the Investment Company Act of 1940, focuses on the nature and quality of the services Invesco provides as adviser to the Invesco Funds and the reasonableness of the fees that it charges for those services. Each year, we spend months reviewing detailed information that we request from Invesco that allows us to evaluate its services and fees. We also use information from many independent sources, including materials provided by the independent Senior Officer of the Invesco Funds, who reports directly to the independent Trustees on the Board. Additionally, we meet with independent legal counsel and review performance and fee data prepared by Lipper Inc., an independent, third-party firm widely recognized as a leader in its field. | ||||||||

I’m pleased to report that the Board determined in June that renewing the investment advisory agreement and the sub-advisory contracts with Invesco Advisers and its affiliates would serve the best interests of each fund and its shareholders.
The second area of focus to highlight is the Board’s efforts to ensure that we provide a lineup of funds that allow financial advisers to build portfolios that meet shareholders’ changing financial needs and goals. Today, more and more investors are reaching, or approaching, retirement. But interest rates remain low, making it difficult for many investors to generate the income they need, or will soon need, in their retirement years.
The members of your Board think about these things, too, and we’ve worked with Invesco Advisers to provide more income-generating options in the Invesco Funds lineup to help shareholders potentially meet their income needs. Your Board recently approved changes to three existing equity mutual funds, increasing their focus on generating income while also seeking to provide long-term growth of capital.
As a result of these changes, the funds and their respective management teams now have more flexibility to invest in the types of securities that could meet investors’ growing need for income generation, and in some cases, also help investors diversify their sources of income. These equity funds complement an array of fixed-income, asset allocation and alternative investment options in the Invesco Funds lineup designed to accommodate a variety of risk tolerances.
Be assured that your Board will continue working on behalf of fund shareholders, keeping your needs and interests uppermost in our minds.
As always, please contact me at bruce@brucecrockett.com with any questions or concerns you may have. On behalf of the Board, we look forward to continuing to represent your interests and serving your needs.
Sincerely,

Bruce L. Crockett
Independent Chair
Invesco Funds Board of Trustees
3 Invesco California Tax-Free Income Fund
Management’s Discussion of Fund Performance
Performance summary
Invesco California Tax-Free Income Fund posted negative returns for the fiscal year ended August 31, 2013. The Fund underperformed its broad market/style-specific benchmark, the Barclays California Municipal Index. The Fund’s overweight allocation to, and security selection in, the long end of the municipal yield curve were the main contributors to its relative performance versus its broad market/style-specific benchmark.
Your Fund’s long-term performance appears later in this report.
Fund vs. Indexes
Total returns, 8/31/12 to 8/31/13, at net asset value (NAV). Performance shown does not include applicable contingent deferred sales charges (CDSC) or front-end sales charges, which would have reduced performance.
| Class A Shares | -5.06 | % | |||
| Class B Shares | -5.11 | ||||
| Class C Shares | -5.57 | ||||
| Class Y Shares | -4.88 | ||||
| Barclays California Municipal Index‚(Broad Market/Style-Specific Index) | -3.03 | ||||
| Lipper California Municipal Debt Funds Indexn(Peer Group Index) | -4.46 |
Source(s): ‚Barclays via FactSet Research Systems Inc.; nLipper Inc.
How we invest
The Fund normally invests at least 80% of its assets in securities that pay interest exempt from federal and California state income tax. We generally invest the Fund’s assets in investment-grade California municipal obligations. These municipal obligations will have the following ratings at the time of purchase:
| n | Municipal bonds – within the four highest grades by Moody’s Investors Service, Inc. (Moody’s), Standard & Poor’s Ratings Group (S&P) or Fitch Ratings (Fitch). |
| n | Municipal notes – within the two highest grades or, if not rated, have outstanding bonds within the four highest grades by Moody’s, S&P or Fitch. |
| n | Municipal commercial paper – within the highest grade by Moody’s, S&P or Fitch. |
We may also invest in unrated securities that we judge to be of comparable quality to the securities described above. Additionally, we may invest up to 5% of the Fund’s net assets in municipal obligations rated below investment grade or, if unrated, of comparable quality as we determine.
We buy and sell California municipal securities with a view toward seeking a high level of current income exempt from federal and California income tax that we believe entail reasonable credit risk considered in relation to the investment policies of the Fund. In selecting securities for purchase and sale, we use our research capabilities to identify and monitor investment opportunities. In conducting research and analysis, we consider a number of factors, including general market and economic conditions and credit interest rate and prepayment risk.
We typically sell portfolio securities when our assessments of any of these factors materially change. Measures of interest rate risk that we evaluate include duration, coupon, maturity and call protection. Measures of credit risk that we evaluate include individual issuer analysis, sector weightings, geographic distribution and quality spreads.
Market conditions and your Fund
California benefits from a large, diverse economy, high wealth levels and a moderate debt burden. As the most populous state in the union, California’s economy
represents 13% of US gross domestic product (GDP).1 California’s financial performance is volatile relative to most states. Its revenue is sensitive to both GDP and equity market valuations, stemming from the high percentage of personal income taxes collected from a small population of California’s highest income earners. Passage of temporary tax increases in November 2012 improved the state’s short-term financial standing, but also increased the sensitivity of tax revenues to the economic cycle. California’s economy is improving, with a declining unemployment rate and an improving housing market.
Throughout the Fund’s reporting period, fundamentals for municipal debt issuers improved on the whole. Quarterly state tax collections increased year-over-year for 15 consecutive quarters through the second quarter of 2013 (the most recent results available).2 Rising home prices and expanding new housing starts, which drive property tax receipts, were also supportive for municipal issuers.
Performance for the municipal bond asset class, however, can be divided into distinct time periods. From September 2012 through April 2013, performance generally followed the improving credit trends in the municipal market. Positive returns were further bolstered by limited new issuance and continued inflows into the asset class. Municipal bond funds recorded $50 billion of net inflows in 2012 and an additional $9 billion during the first quarter of 2013.3 In fact, the quarter ending March 31, 2013, marked the ninth consecutive4 quarter of positive performance for the broad municipal bond market. April was also a strong month for the market.
Beginning in May, market sentiment began to shift and technical market forces drove performance to diverge from issuer fundamentals. As the economy gradually improved, the market became increasingly wary over the specter of rising interest rates. In late June, fixed income investors’ concerns were further
| Portfolio Composition | |||||
| By security type, based on total investments | |||||
| Revenue Bonds | 80.2 | % | |||
| General Obligation Bonds | 15.6 | ||||
| Pre-refunded Bonds | 3.3 | ||||
| Other | 0.9 | ||||
| Top Five Fixed Income Holdings | |||||
1. Long Beach (City of) Financing Authority; Series 1992 | 4.4 | % | |||
2. Southern California Metropolitan Water District; Series 2009 B | 2.6 | ||||
3. Bay Area Toll Authority (San Francisco Bay Area); Series 2009 F-1 | 1.6 | ||||
4. San Francisco (City & County of) Airport Commission (San Francisco International Airport); Series 2011 C | 1.5 | ||||
5. California (State of); Series 2009 | 1.5 | ||||
| Total Net Assets | $363.2 million | ||||
| Total Number of Holdings | 215 | ||||
The Fund’s holdings are subject to change, and there is no assurance that the Fund will continue to hold any particular security.
4 Invesco California Tax-Free Income Fund
inflamed when the US Federal Reserve made public comments on the timing for tapering its government and mortgage bond buying program. Relatively modest outflows from municipal bond funds of more than $750 million in May turned into a deluge of redemptions in excess of $16 billion in June.3
While nearly all fixed income asset classes sold off in June, municipal bonds were particularly hard hit. Retail investors who saw their funds’ net asset values (NAVs) drop sold shares, prompting fund managers to raise cash to meet redemptions by selling bonds. Bond selling in the unidirectional market put further pressure on NAVs, causing more investors to exit the municipal bond asset class.
Additional concerns crept into the market in July, when the city of Detroit filed the largest municipal bankruptcy on record5 and Moody’s downgraded Chicago’s general obligation debt three notches. These idiosyncratic events were largely anticipated by professional investors. Nonetheless, municipal bond funds experienced additional volatility from the reintroduction of headline risk, notwithstanding broad based credit improvement across the municipal bond asset class. In July and August, municipal bond funds experienced net outflows of approximately $10 billion and $11.5 billion, respectively.3 For the reporting period, net outflows totaled approximately $20 billion.3
We recognize this summer’s sell-off was painful for investors. The current environment, however, may present opportunities for long-term investors. As of the end of the fiscal year, municipal bonds were priced attractively relative to Treasuries. The muni-to-Treasury yield ratio of 121% compares to a 10-year historical average of 100%.6 A higher ratio indicates relative cheapness. Additionally, higher rates have limited, and may continue to limit, the supply of municipal refinancing deals coming to market. While redemptions remain elevated, the pace of net outflows has decreased since June. Finally, more and higher taxes, including the 3.8% Medicare tax on investment income,7 from which municipal bonds are exempt, make municipal bond yields more attractive on an after-tax basis for tax-affected investors.
For the reporting period, rising rates during the summer sell-off had the largest negative impact on both the Fund and its broad market/style-specific index. Longer duration, interest-rate-sensitive bonds were most affected and were the largest negative contributor to absolute
performance. The Fund’s longer duration bonds and overweight position in the long-end of the yield curve were also the largest source of underperformance relative to its broad market/style-specific index. Security selection in the middle of the yield curve partially offset underperformance.
The Fund held an off-index position in Puerto Rican revenue bonds, which also contributed to underperformance. Following the Detroit bankruptcy filing and Chicago downgrades this summer, investors moved out of more volatile names like Puerto Rico. Puerto Rican debt is held in single-state municipal funds as a tool to diversify risk and because of its triple tax exempt status. While Puerto Rico negatively impacted returns from revenue bonds, security selection in general obligation bonds made a positive contribution to relative performance.
During the reporting period, leverage made a negative contribution to the performance of the Fund. The Fund achieved a leveraged position through the use of inverse floating rate securities. The Fund uses leverage because we believe that, over time, leveraging provides opportunities for additional income and total return for shareholders. However, use of leverage also can expose shareholders to additional volatility. For more information about the Fund’s use of leverage, see the Notes to Financial Statements later in this report.
Thank you for investing in Invesco California Tax-Free Income Fund and for sharing our long-term investment horizon.
| 1 | Source: California Legislative Analyst’s Office |
| 2 | Source: US Census Bureau |
| 3 | Source: Morningstar |
| 4 | Source: Barclays |
| 5 | Source: Moody’s |
| 6 | Source: Thomson Municipal Market Data |
| 7 | Source: Internal Revenue Service |
The views and opinions expressed in management’s discussion of Fund performance are those of Invesco Advisers, Inc. These views and opinions are subject to change at any time based on factors such as market and economic conditions. These views and opinions may not be relied upon as investment advice or recommendations, or as an offer for a particular security. The information is not a complete analysis of every aspect of any market, country, industry, security or the Fund. Statements of fact are from sources considered reliable, but Invesco Advisers, Inc. makes no representation or warranty as to their completeness or accuracy. Although historical performance is no guarantee of future results, these insights may help you understand our investment management philosophy.
See important Fund and, if applicable, index disclosures later in this report.
 | Thomas Byron Portfolio manager, is manager of Invesco California Tax-Free Income Fund. He joined Invesco in 2010. Mr. Byron | |
| earned a BS in finance from Marquette University and an MBA in finance from DePaul University. | ||
 | Robert Stryker Chartered Financial Analyst, portfolio manager, is manager of Invesco California Tax-Free Income Fund. He joined | |
| Invesco in 2010. Mr. Stryker earned a BS in finance from the University of Illinois at Chicago. | ||
 | Julius Williams Portfolio manager, is manager of Invesco California Tax-Free Income Fund. He joined Invesco in 2010. Mr. Williams | |
| earned a BA in economics and sociology and a Master of Education degree in educational psychology from the University of Virginia. | ||
 | Robert Wimmel Portfolio manager, is manager of Invesco California Tax-Free Income Fund. He joined Invesco in 2010. Mr. Wimmel | |
| earned a BA in anthropology from the University of Cincinnati and an MA in economics from the University of Illinois at Chicago. | ||
| 5 Invesco California Tax-Free Income Fund |
Your Fund’s Long-Term Performance
Results of a $10,000 Investment – Oldest Share Class(es)
Fund and index data from 8/31/03
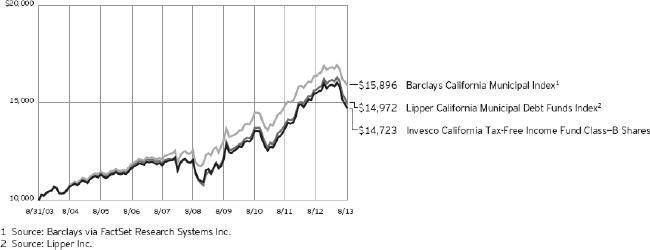
Past performance cannot guarantee comparable future results.
The data shown in the chart include reinvested distributions, applicable sales charges and Fund expenses including management fees. Results for Class B shares are calculated as if a hypothetical
shareholder had liquidated his entire investment in the Fund at the close of the reporting period and paid the contingent deferred sales charges, if applicable. Index results include reinvested dividends, but they do not reflect sales charges. Performance of the peer group,
if applicable, reflects fund expenses and management fees; performance of a market index does not. Performance shown in the chart above and before tax table(s) does not reflect deduction of taxes a shareholder would pay on Fund distributions or sale of Fund shares.
continued from page 8
economic developments. Values of junk bonds can decline significantly over short periods of time.
| n | Municipal securities risk. Under normal market conditions, the Fund invests primarily in municipal securities. The yields of municipal securities may move differently and adversely compared to the yields of the overall debt securities markets. There could be changes in applicable tax laws or tax treatments that adversely affect the current federal or state tax status of municipal securities. |
| n | Synthetic securities risk. Fluctuations in the values of synthetic securities may not correlate perfectly with the instruments they are designed to replicate . Synthetic securities may be subject to interest rate changes, market price fluctuations, counterparty risk and liquidity risk. |
About indexes used in this report
| n | The Barclays California Municipal Index is an unmanaged index considered representative of California investment grade municipal bonds. |
| n | The Lipper California Municipal Debt Funds Index is an unmanaged index considered representative of California municipal debt funds tracked by Lipper. |
| n | The Fund is not managed to track the performance of any particular index, including the index(es) described here, and consequently, the performance of the Fund may deviate significantly from the performance of the index(es). |
| n | A direct investment cannot be made in an index. Unless otherwise indicated, index results include reinvested dividends, and they do not reflect sales charges. Performance of the peer group, if applicable, reflects fund expenses; performance of a market index does not. |
Other information
| n | The returns shown in management’s discussion of Fund performance are based on net asset values calculated for shareholder transactions. Generally accepted accounting principles require adjustments to be made to the net assets of the Fund at period end for financial reporting purposes, and as such, the net asset values for shareholder transactions and the returns based on those net asset values may differ from the net asset values and returns reported in the Financial Highlights. |
6 Invesco California Tax-Free Income Fund
| Average Annual Total Returns | |||||||||||||||
| As of 8/31/13, including maximum applicable sales charges | |||||||||||||||
Before Taxes | After Taxes on Distributions | After Taxes on Distributions and Sale of Fund Shares | |||||||||||||
| Class A Shares | |||||||||||||||
| Inception (7/28/97) | 3.86 | % | 3.77 | % | 3.97 | % | |||||||||
| 10 Years | 3.44 | 3.37 | 3.64 | ||||||||||||
| 5 Years | 3.17 | 3.15 | 3.46 | ||||||||||||
| 1 Year | -9.13 | -9.13 | -3.49 | ||||||||||||
| Class B Shares | |||||||||||||||
| Inception (7/11/84) | 6.08 | % | 5.97 | % | 6.00 | % | |||||||||
| 10 Years | 3.94 | 3.87 | 4.07 | ||||||||||||
| 5 Years | 3.73 | 3.71 | 3.93 | ||||||||||||
| 1 Year | -9.67 | -9.67 | -3.74 | ||||||||||||
| Class C Shares | |||||||||||||||
| Inception (7/28/97) | 3.63 | % | 3.55 | % | 3.71 | % | |||||||||
| 10 Years | 3.36 | 3.29 | 3.49 | ||||||||||||
| 5 Years | 3.55 | 3.54 | 3.66 | ||||||||||||
| 1 Year | -6.48 | -6.48 | -2.14 | ||||||||||||
| Class Y Shares | |||||||||||||||
| Inception (7/28/97) | 4.40 | % | 4.31 | % | 4.47 | % | |||||||||
| 10 Years | 4.13 | 4.06 | 4.26 | ||||||||||||
| 5 Years | 4.32 | 4.31 | 4.44 | ||||||||||||
1 Year | -4.88 | -4.88 | -0.90 | ||||||||||||
| Average Annual Total Returns | |||||||||||||||
| As of 6/30/13, the most recent calendar quarter end, including maximum applicable sales charges | |||||||||||||||
Before Taxes | After Taxes on Distributions | After Taxes on Distributions and Sale of Fund Shares | |||||||||||||
| Class A Shares | |||||||||||||||
| Inception (7/28/97) | 4.11 | % | 4.02 | % | 4.16 | % | |||||||||
| 10 Years | 3.43 | 3.36 | 3.60 | ||||||||||||
| 5 Years | 3.98 | 3.97 | 4.07 | ||||||||||||
| 1 Year | -3.95 | -3.95 | -0.53 | ||||||||||||
| Class B Shares | |||||||||||||||
| Inception (7/11/84) | 6.23 | % | 6.12 | % | 6.12 | % | |||||||||
| 10 Years | 3.95 | 3.88 | 4.04 | ||||||||||||
| 5 Years | 4.56 | 4.55 | 4.55 | ||||||||||||
| 1 Year | -4.57 | -4.57 | -0.81 | ||||||||||||
| Class C Shares | |||||||||||||||
| Inception (7/28/97) | 3.88 | % | 3.80 | % | 3.90 | ||||||||||
| 10 Years | 3.36 | 3.29 | 3.46 | ||||||||||||
| 5 Years | 4.36 | 4.35 | 4.27 | ||||||||||||
| 1 Year | -1.19 | -1.19 | 0.87 | ||||||||||||
| Class Y Shares | |||||||||||||||
| Inception (7/28/97) | 4.65 | % | 4.57 | % | 4.66 | % | |||||||||
| 10 Years | 4.13 | 4.07 | 4.22 | ||||||||||||
| 5 Years | 5.16 | 5.15 | 5.07 | ||||||||||||
1 Year | 0.51 | 0.51 | 2.18 | ||||||||||||
Effective June 1, 2010, Class A, Class B, Class C and Class I shares of the predecessor fund, Morgan Stanley California Tax-Free Income Fund, advised by Morgan Stanley Investment Advisors Inc. were reorganized into Class A, Class B, Class C and Class Y shares, respectively, of Invesco California Tax-Free Income Fund. Returns shown above for Class A, Class B, Class C and Class Y shares are blended returns of the predecessor fund and Invesco California Tax-Free Income Fund. Share class returns will differ from the predecessor fund because of different expenses.
The performance data quoted represent past performance and cannot guarantee comparable future results; current performance may be lower or higher. Please visit invesco.com/performance for the most recent month-end performance. Performance figures reflect reinvested distributions, changes in net asset value and the effect of the maximum sales charge unless otherwise stated. Investment return and principal value will fluctuate so that you may have a gain or loss when you sell shares.
The total annual Fund operating expense ratio set forth in the most recent Fund prospectus as of the date of this report for Class A, Class B, Class C and Class Y shares was 0.87%, 0.88%, 1.38% and 0.63%, respectively. The expense ratios presented above may vary from the expense ratios presented in other sections of this report that are based on expenses incurred during the period covered by this report.
Class A share performance reflects the maximum 4.25% sales charge, and Class B and Class C share performance reflects the applicable contingent deferred sales charge (CDSC) for the period involved. The CDSC on Class B shares declines from 5% beginning at the time of purchase to 0% at the beginning of the seventh year. The CDSC on Class C shares is 1% for the first year after purchase. Class Y shares do not have a front-end sales charge or a CDSC; therefore, performance is at net asset value.
The performance of the Fund’s share classes will differ primarily due to different sales charge structures and class expenses.
After-tax returns are calculated using the historical highest individual federal marginal income tax rate. They do not reflect the effect of state and local taxes. Actual after-tax returns depend on the investor’s tax situation and may differ from those shown. After-tax returns shown are not relevant to investors who hold their shares in tax-deferred accounts such as
401(k)s or IRAs. The Fund’s past performance, before and after taxes, is not necessarily an indication of how the Fund will perform in the future.
7 Invesco California Tax-Free Income Fund
Invesco California Tax-Free Income Fund’s investment objective is to provide a high level of current income exempt from federal and California income tax, consistent with the preservation of capital.
| n | Unless otherwise stated, information presented in this report is as of August 31, 2013, and is based on total net assets. |
| n | Unless otherwise noted, all data provided by Invesco. |
| n | To access your Fund’s reports/prospectus, visit invesco.com/fundreports. |
About share classes
| n | Class B shares may not be purchased for new or additional investments. Please see the prospectus for more information. |
| n | Class Y shares are available to only certain investors. Please see the prospectus for more information. |
Principal risks of investing in the Fund
| n | Credit risk. Credit risk refers to the possibility that the issuer of a security will be unable or unwilling to make interest payments and/or repay the principal on its debt. In the case of revenue bonds, notes or commercial paper, for example, the credit risk is the possibility that the user fees from a project or other specified revenue sources are insufficient to meet interest and/or principal payment obligations. Private activity bonds used to finance projects, such as industrial development and pollution control, may also be negatively impacted by the general credit of the user of the project. |
| n | Interest rate risk. Interest rate risk refers to fluctuations in the value of a fixed-income security resulting from changes in the general level of interest rates. When the general level of interest rates goes up, the prices of most fixed-income securities go down. When the general level of interest rates goes down, the prices of most fixed-income securities go up. Zero coupon securities are typically subject to greater price fluctuations than comparable securities that pay current interest. |
| n | Derivatives risk. The performance of derivative instruments is tied to the performance of an underlying currency, security, index or other instrument. In addition to risks relating to their underlying instruments, the use of derivatives may include other, possibly greater, risks. Derivatives involve costs, may be volatile, and may involve a small initial investment relative to the risk assumed. Risks |
associated with the use of derivatives include counterparty, leverage, correlation, liquidity, tax, market, interest rate and management risks. Derivatives may also be more difficult to purchase, sell or value than other investments. The Fund may lose more than the cash amount invested on investments in derivatives. Investors should bear in mind that, while the Fund intends to use derivative strategies, it is not obligated to actively engage in these transactions, generally or in any particular kind of derivative, if the investment manager elects not to do so due to availability, cost, market conditions or other factors. |
| n | Lease obligations risk. Leases and installment purchase or conditional sale contracts (which may provide for title to the leased asset to pass eventually to the issuer) have developed as a means for governmental issuers to acquire property and equipment without the necessity of complying with the constitutional and statutory requirements generally applicable for the issuance of debt. Certain lease obligations contain non-appropriation clauses that provide that the governmental issuer has no obligation to make future payments under the lease or contract unless money is appropriated for that purpose by the appropriate legislative body on an annual or other periodic basis. Consequently, continued lease payments on those lease obligations containing non-appropriation clauses are dependent on future legislative actions. If these legislative actions do not occur, the holders of the lease obligation may experience difficulty in exercising their rights, including disposition of the property. |
| n | Private activity bonds risk. The issuers of private activity bonds in which the Fund may invest may be negatively impacted by conditions affecting either the general credit of the user of the private activity project or the project itself. Conditions such as regulatory |
and environmental restrictions and economic downturns may lower the need for these facilities and the ability of users of the project to pay for the facilities. This could cause your investment in the Fund to lose value. |
| n | Inverse floating rate municipal obligations risk. The inverse floating rate municipal obligations in which the Fund may invest include derivative instruments such as residual interest bonds (RIBs) or tender option bonds (TOBs). Such instruments are typically created by a special purpose trust that holds long-term fixed rate bonds and sells two classes of beneficial interests: short-term floating rate interests, which are sold to third party investors, and inverse floating residual interests, which are purchased by the Fund. The short-term floating rate interests have first priority on the cash flow from the bond held by the special purpose trust and the Fund is paid the residual cash flow from the bond held by the special purpose trust. The interest rates on these obligations generally move in the reverse direction of market interest rates. If market interest rates fall, the interest rate on the obligations will increase and if market interest rates increase, the interest rate on the obligations will fall. |
| n | Alternative minimum tax risk. A portion of the Fund’s otherwise tax-exempt income may be taxable to those shareholders subject to the federal alternative minimum tax. |
| n | State-Specific risk. The Fund is more susceptible to political, economic, regulatory or other factors affecting issuers of California municipal securities than a fund that does not limit its investments to such issuers. |
| n | High yield bond (junk bond) risk. Junk bonds involve a greater risk of default or price changes due to changes in the credit quality of the issuer. The values of junk bonds fluctuate more than those of high-quality bonds in response to company, political, regulatory or |
continued on page 6
| This report must be accompanied or preceded by a currently effective Fund prospectus, which contains more complete information, including sales charges and expenses. Investors should read it carefully before investing. |
NOT FDIC INSURED | MAY LOSE VALUE | NO BANK GUARANTEE
8 Invesco California Tax-Free Income Fund
| Fund Nasdaq Symbols | |||||
| Class A Shares | CLFAX | ||||
| Class B Shares | CLFBX | ||||
| Class C Shares | CLFCX | ||||
| Class Y Shares | CLFDX | ||||
Schedule of Investments
August 31, 2013
| Interest Rate | Maturity Date | Principal Amount (000) | Value | |||||||||||||
Municipal Obligations–106.37% |
| |||||||||||||||
| California–99.88% | ||||||||||||||||
ABAG Finance Authority for Non-profit Corps. (Episcopal Senior Communities); Series 2012, Ref. RB | 5.00 | % | 07/01/32 | $ | 2,000 | $ | 1,853,600 | |||||||||
ABAG Finance Authority for Non-profit Corps. (Sharp Healthcare); Series 2012 A, RB | 5.00 | % | 08/01/28 | 900 | 917,622 | |||||||||||
Adelanto (City of) Public Utility Authority (Utility System); Series 2009 A, Ref. RB | 6.75 | % | 07/01/39 | 2,300 | 2,369,966 | |||||||||||
Alameda (County of) Joint Powers Authority (Juvenile Justice Refunding); Series 2008 A, Lease RB (INS–AGM)(a) | 5.00 | % | 12/01/25 | 750 | 793,418 | |||||||||||
Alhambra (City of) (Atherton Baptist Homes); Series 2010 A, RB | 7.63 | % | 01/01/40 | 1,575 | 1,601,554 | |||||||||||
Alhambra Unified School District (Election of 1999); Series 1999 A, Unlimited Tax CAB GO Bonds (INS–AGM)(a)(b) | 0.00 | % | 09/01/20 | 1,925 | 1,501,769 | |||||||||||
Anaheim (City of) Public Financing Authority (Anaheim Public Improvements); Series 1997 C, Sub. Lease RB (INS–AGM)(a) | 6.00 | % | 09/01/16 | 4,000 | 4,453,520 | |||||||||||
Anaheim (City of) Public Financing Authority (Electric System Distribution Facilities); Series 2011 A, RB | 5.38 | % | 10/01/36 | 2,500 | 2,642,950 | |||||||||||
Arcadia Unified School District (Election of 2006); Series 2007 A, Unlimited Tax GO Bonds | 5.00 | % | 08/01/37 | 1,500 | 1,503,210 | |||||||||||
Bakersfield (City of); Series 2007 A, Wastewater RB (INS–AGM)(a) | 5.00 | % | 09/15/32 | 2,215 | 2,236,397 | |||||||||||
Bay Area Governments Association (California Capital); Series 2001 A, Lease RB (INS–AMBAC)(a) | 5.25 | % | 07/01/17 | 1,430 | 1,495,237 | |||||||||||
Bay Area Governments Association (West Sacramento); Series 2004 A, Lease RB(c)(d) | 5.00 | % | 09/01/14 | 2,735 | 2,865,924 | |||||||||||
Bay Area Toll Authority (San Francisco Bay Area); |
| |||||||||||||||
Series 2008 F-1, Toll Bridge RB(e) | 5.00 | % | 04/01/39 | 1,250 | 1,268,350 | |||||||||||
Series 2008 F-1, Toll Bridge RB | 5.00 | % | 04/01/39 | 2,500 | 2,536,700 | |||||||||||
Series 2009 F-1, Toll Bridge RB(e) | 5.25 | % | 04/01/26 | 4,685 | 5,191,308 | |||||||||||
Series 2009 F-1, Toll Bridge RB(e) | 5.25 | % | 04/01/29 | 5,205 | 5,689,898 | |||||||||||
Series 2009 F-1, Toll Bridge RB(e) | 5.13 | % | 04/01/39 | 1,500 | 1,514,070 | |||||||||||
Bay Area Water Supply & Conservation Agency; Series 2013 A, RB | 5.00 | % | 10/01/34 | 1,500 | 1,539,015 | |||||||||||
Beverly Hills Unified School District (Election of 2008); |
| |||||||||||||||
Series 2009, Unlimited Tax CAB GO Bonds(b) | 0.00 | % | 08/01/26 | 1,465 | 837,555 | |||||||||||
Series 2009, Unlimited Tax CAB GO Bonds(b) | 0.00 | % | 08/01/32 | 3,045 | 1,127,655 | |||||||||||
Bonita Unified School District (Election of 2004); Series 2004 A, Unlimited Tax GO Bonds(c)(d) | 5.00 | % | 08/01/14 | 1,000 | 1,044,200 | |||||||||||
Brea Olinda Unified School District; Series 2002 A, Ref. COP (INS–AGM)(a) | 5.50 | % | 08/01/18 | 1,850 | 1,857,770 | |||||||||||
California (State of) Educational Facilities Authority (California College of the Arts); Series 2005, RB | 5.00 | % | 06/01/35 | 2,000 | 1,796,660 | |||||||||||
California (State of) Educational Facilities Authority (Chapman University); Series 2011, RB | 5.00 | % | 04/01/31 | 1,250 | 1,264,100 | |||||||||||
California (State of) Educational Facilities Authority (Claremont McKenna College); | 5.00 | % | 01/01/38 | 2,100 | 2,150,799 | |||||||||||
California (State of) Educational Facilities Authority (Pitzer College); |
| |||||||||||||||
Series 2005 A, RB | 5.00 | % | 04/01/35 | 2,000 | 2,000,220 | |||||||||||
Series 2009, RB | 6.00 | % | 04/01/40 | 2,000 | 2,144,540 | |||||||||||
California (State of) Educational Facilities Authority (University of Southern California); Series 2009 B, RB(e) | 5.25 | % | 10/01/39 | 1,800 | 1,881,072 | |||||||||||
California (State of) Health Facilities Financing Authority (Adventist Health System West); Series 2009 A, RB | 5.75 | % | 09/01/39 | 500 | 510,540 | |||||||||||
California (State of) Health Facilities Financing Authority (Catholic Healthcare West); |
| |||||||||||||||
Series 2009 A, RB | 6.00 | % | 07/01/39 | 500 | 534,250 | |||||||||||
Series 2011 A, RB | 5.25 | % | 03/01/41 | 2,500 | 2,465,975 | |||||||||||
California (State of) Health Facilities Financing Authority (Children’s Hospital Los Angeles); Series 2010, RB (INS–AGM)(a) | 5.25 | % | 07/01/38 | 2,950 | 2,829,345 | |||||||||||
California (State of) Health Facilities Financing Authority (Kaiser Permanente); Series 2006 A, RB | 5.25 | % | 04/01/39 | 2,000 | 2,001,100 | |||||||||||
California (State of) Health Facilities Financing Authority (Providence Health & Services); |
| |||||||||||||||
Series 2008, RB(c)(d) | 6.50 | % | 10/01/18 | 20 | 24,826 | |||||||||||
Series 2008, RB | 6.50 | % | 10/01/38 | 980 | 1,114,995 | |||||||||||
California (State of) Health Facilities Financing Authority (Scripps Health); Series 2010 A, RB | 5.00 | % | 11/15/36 | 4,000 | 3,903,120 | |||||||||||
California (State of) Health Facilities Financing Authority (St. Joseph Health System); Series 2013 A, RB | 5.00 | % | 07/01/37 | 1,000 | 968,800 | |||||||||||
California (State of) Health Facilities Financing Authority (Stanford Hospital); Series 2008 A-2, Ref. RB | 5.25 | % | 11/15/40 | 2,000 | 2,028,460 | |||||||||||
See accompanying Notes to Financial Statements which are an integral part of the financial statements.
9 Invesco California Tax-Free Income Fund
| Interest Rate | Maturity Date | Principal Amount (000) | Value | |||||||||||||
| California–(continued) | ||||||||||||||||
California (State of) Health Facilities Financing Authority (Sutter Health); Series 2011 B, RB | 5.50 | % | 08/15/26 | $ | 1,000 | $ | 1,087,230 | |||||||||
California (State of) Municipal Finance Authority (American Heritage Education Foundation); Series 2006 A, Education RB | 5.25 | % | 06/01/26 | 1,000 | 879,670 | |||||||||||
California (State of) Municipal Finance Authority (Caritas); Series 2012 A, Mobile Home Park RB | 5.50 | % | 08/15/47 | 1,500 | 1,429,230 | |||||||||||
California (State of) Municipal Finance Authority (Community Hospitals of Central California Obligated Group); | ||||||||||||||||
Series 2007, COP | 5.00 | % | 02/01/20 | 2,385 | 2,513,170 | |||||||||||
Series 2007, COP | 5.25 | % | 02/01/37 | 500 | 464,085 | |||||||||||
California (State of) Municipal Finance Authority (Eisenhower Medical Center); |
| |||||||||||||||
Series 2010 A, RB | 5.50 | % | 07/01/30 | 1,000 | 985,360 | |||||||||||
Series 2010 A, RB | 5.75 | % | 07/01/40 | 1,500 | 1,481,685 | |||||||||||
California (State of) Municipal Finance Authority (Emerson College); Series 2011, RB | 5.75 | % | 01/01/33 | 1,315 | 1,396,188 | |||||||||||
California (State of) Municipal Finance Authority (University of La Verne); Series 2010 A, RB | 6.13 | % | 06/01/30 | 1,000 | 1,033,620 | |||||||||||
California (State of) Pollution Control Finance Authority; |
| |||||||||||||||
Series 2012, Water Furnishing RB(f)(g) | 5.00 | % | 07/01/27 | 1,000 | 900,710 | |||||||||||
Series 2012, Water Furnishing RB(f)(g) | 5.00 | % | 07/01/37 | 2,500 | 2,030,325 | |||||||||||
California (State of) Pollution Control Financing Authority (Waste Management Inc.); Series 2002 A, Ref. Solid Waste Disposal RB(f) | 5.00 | % | 01/01/22 | 2,000 | 2,007,600 | |||||||||||
California (State of) Public Works Board (Various Capital); Series 2011 A, Lease RB | 5.13 | % | 10/01/31 | 2,000 | 2,011,080 | |||||||||||
California (State of) Statewide Communities Development Authority (Adventist Health System/West); Series 2005 A, Health Facility RB | 5.00 | % | 03/01/30 | 5,000 | 4,882,000 | |||||||||||
California (State of) Statewide Communities Development Authority (Alliance for College-Ready Public Schools); Series 2012, School Facility RB | 6.10 | % | 07/01/32 | 820 | 798,450 | |||||||||||
California (State of) Statewide Communities Development Authority (American Baptist Homes of the West); Series 2010, RB | 6.25 | % | 10/01/39 | 2,000 | 2,033,700 | |||||||||||
California (State of) Statewide Communities Development Authority (California Baptist University); Series 2007 A, RB | 5.40 | % | 11/01/27 | 1,785 | 1,701,587 | |||||||||||
California (State of) Statewide Communities Development Authority (Cottage Health System Obligated Group); Series 2010, RB | 5.25 | % | 11/01/30 | 1,675 | 1,716,573 | |||||||||||
California (State of) Statewide Communities Development Authority (Methodist Hospital); Series 2009, RB (INS–FHA)(a) | 6.75 | % | 02/01/38 | 445 | 513,499 | |||||||||||
California (State of) Statewide Communities Development Authority (Southern California Presbyterian Homes); | ||||||||||||||||
Series 2009, Senior Living RB | 6.25 | % | 11/15/19 | 2,000 | 2,218,980 | |||||||||||
Series 2009, Senior Living RB | 7.25 | % | 11/15/41 | 500 | 535,810 | |||||||||||
California (State of) Statewide Communities Development Authority (Terraces at San Joaquin Garden); Series 2012, RB | 5.63 | % | 10/01/32 | 1,000 | 947,340 | |||||||||||
California (State of) Statewide Communities Development Authority (University of California—Irvine East Campus Apartments); Series 2012, Ref. Student Housing RB | 5.38 | % | 05/15/38 | 2,000 | 1,960,960 | |||||||||||
California (State of); |
| |||||||||||||||
Series 2004 A1, VRD Unlimited Tax GO Bonds (LOC-Citibank, N.A.)(h)(i) | 0.04 | % | 05/01/34 | 3,600 | 3,600,000 | |||||||||||
Series 2009, Various Purpose Unlimited Tax GO Bonds | 5.75 | % | 04/01/31 | 5,000 | 5,341,100 | |||||||||||
Series 2009, Various Purpose Unlimited Tax GO Bonds | 6.00 | % | 11/01/35 | 1,750 | 1,963,955 | |||||||||||
Series 2009, Various Purpose Unlimited Tax GO Bonds | 6.00 | % | 04/01/38 | 1,250 | 1,384,537 | |||||||||||
Series 2010, Unlimited Tax GO Bonds | 5.25 | % | 11/01/40 | 3,000 | 3,046,320 | |||||||||||
Series 2011, Various Purpose Unlimited Tax GO Bonds | 5.00 | % | 09/01/32 | 2,450 | 2,514,998 | |||||||||||
Series 2011, Various Purpose Unlimited Tax GO Bonds | 5.00 | % | 10/01/41 | 2,500 | 2,492,400 | |||||||||||
Series 2012, Ref. Unlimited Tax GO Bonds | 5.25 | % | 02/01/30 | 2,000 | 2,102,660 | |||||||||||
California Infrastructure & Economic Development Bank (Broad Museum); Series 2011 A, RB | 5.00 | % | 06/01/21 | 3,000 | 3,483,120 | |||||||||||
California Special Districts Association Finance Corp. (Special Districts Finance Program); Series 1997 DD, COP (INS–AGM)(a) | 5.63 | % | 01/01/27 | 1,050 | 1,050,473 | |||||||||||
California State University; Series 2009 A, Systemwide RB (INS–AGC)(a) | 5.25 | % | 11/01/38 | 1,000 | 1,031,190 | |||||||||||
Chino Basin Regional Financing Authority (Inland Empire Utilities Agency); Series 2008 A, RB | 5.00 | % | 11/01/33 | 725 | 729,285 | |||||||||||
Clovis Unified School District (Election of 2004); Series 2004 A, Unlimited Tax CAB GO Bonds | 0.00 | % | 08/01/29 | 735 | 311,302 | |||||||||||
Desert Community College District (Election of 2004); Series 2007 C, Unlimited Tax GO Bonds (INS–AGM)(a) | 5.00 | % | 08/01/37 | 2,500 | 2,509,600 | |||||||||||
See accompanying Notes to Financial Statements which are an integral part of the financial statements.
10 Invesco California Tax-Free Income Fund
| Interest Rate | Maturity Date | Principal Amount (000) | Value | |||||||||||||
| California–(continued) | ||||||||||||||||
East Bay Municipal Utility District; Series 2010 A, Ref. Sub. Water System RB | 5.00 | % | 06/01/36 | $ | 2,000 | $ | 2,081,040 | |||||||||
Eden (Township of) Healthcare District; Series 2010, COP | 6.13 | % | 06/01/34 | 1,000 | 1,007,850 | |||||||||||
El Dorado (County of) Irrigation District; Series 2009 A, COP (INS–AGC)(a) | 5.75 | % | 08/01/39 | 1,000 | 1,032,260 | |||||||||||
El Monte Union High School District (Election of 2008); Series 2009 A, Unlimited Tax GO Bonds (INS–AGC)(a) | 5.50 | % | 06/01/34 | 1,000 | 1,051,150 | |||||||||||
El Segundo Unified School District (Election of 2008); Series 2009 A, Unlimited Tax CAB GO Bonds(b) | 0.00 | % | 08/01/33 | 4,430 | 1,391,197 | |||||||||||
Fairfield (City of) Community Facilities District No. 3 (North Cordelia General Improvements); Series 2008, Special Tax RB | 6.00 | % | 09/01/32 | 1,800 | 1,864,314 | |||||||||||
Fontana (City of) Public Financing Authority (North Fontana Redevelopment); Series 2003 A, Tax Allocation RB (INS–AMBAC)(a) | 5.38 | % | 09/01/25 | 1,500 | 1,501,155 | |||||||||||
Fontana (City of) Redevelopment Agency (Downtown Redevelopment); Series 2000, Ref. Tax Allocation RB (INS–NATL)(a) | 5.00 | % | 09/01/21 | 1,480 | 1,480,178 | |||||||||||
Foothill-Eastern Transportation Corridor Agency; Series 1999, Ref. Toll Road RB (INS–NATL)(a) | 5.13 | % | 01/15/19 | 4,000 | 4,002,400 | |||||||||||
Fullerton (City of) Community Facilities District No. 1 (Amerige Heights); |
| |||||||||||||||
Series 2012, Ref. Special Tax RB | 5.00 | % | 09/01/26 | 960 | 984,240 | |||||||||||
Series 2012, Ref. Special Tax RB | 5.00 | % | 09/01/32 | 1,090 | 1,052,395 | |||||||||||
Gilroy Unified School District (Election of 2008); |
| |||||||||||||||
Series 2009 A, Unlimited Tax CAB GO Bonds(b)(c)(d) | 0.00 | % | 08/01/29 | 615 | 321,307 | |||||||||||
Series 2009 A, Unlimited Tax CAB GO Bonds (INS–AGC)(a)(b) | 0.00 | % | 08/01/29 | 4,735 | 1,953,377 | |||||||||||
Series 2009 A, Unlimited Tax CAB GO Bonds(b)(c)(d) | 0.00 | % | 08/01/31 | 2,235 | 1,057,490 | |||||||||||
Series 2009 A, Unlimited Tax CAB GO Bonds (INS–AGC)(a)(b) | 0.00 | % | 08/01/31 | 1,415 | 512,371 | |||||||||||
Glendora (City of) Public Finance Authority; Series 2003 A, Project No. One Tax Allocation RB (INS–NATL)(a) | 5.00 | % | 09/01/24 | 2,425 | 2,434,166 | |||||||||||
Golden State Tobacco Securitization Corp.; Series 2013 A, Enhanced Tobacco Settlement Asset-Backed RB | 5.00 | % | 06/01/30 | 2,000 | 1,988,620 | |||||||||||
Hanford Joint Union High School District (Election of 1998); Series 2004 C, Unlimited Tax GO Bonds (INS–NATL)(a) | 5.70 | % | 08/01/28 | 2,230 | 2,267,865 | |||||||||||
Inglewood (City of) Redevelopment Agency (Merged Redevelopment); Series 1998 A, Ref. Tax Allocation RB (INS–AMBAC)(a) | 5.25 | % | 05/01/23 | 1,000 | 1,028,180 | |||||||||||
Irvine (City of) (Reassessment District No. 12-1); Series 2012, Limited Obligation Improvement Bonds | 4.00 | % | 09/02/22 | 2,150 | 2,170,468 | |||||||||||
Irvine (City of) (Reassessment District No. 13-1); Series 2013, Limited Obligation Special Assessment RB | 5.00 | % | 09/02/24 | 825 | 845,237 | |||||||||||
Irvine Unified School District (Community Facilities District No. 06-1- Portola Springs); Series 2010, Special Tax RB | 6.70 | % | 09/01/35 | 515 | 548,367 | |||||||||||
Kern (County of) (Capital Improvements); Series 2009 A, COP (INS–AGC)(a) | 5.75 | % | 08/01/35 | 1,000 | 1,075,650 | |||||||||||
Kern (County of) Water Agency Improvement District No. 4; Series 2008 A, COP (INS–AGC)(a) | 5.00 | % | 05/01/28 | 1,700 | 1,748,314 | |||||||||||
Lodi (City of); Series 2007 A, Wastewater System Revenue COP (INS–AGM)(a) | 5.00 | % | 10/01/37 | 1,000 | 1,005,460 | |||||||||||
Long Beach (City of) Bond Finance Authority (Aquarium of the Pacific); Series 2012, Ref. RB | 5.00 | % | 11/01/29 | 2,000 | 2,038,820 | |||||||||||
Long Beach (City of) Financing Authority; Series 1992, RB (INS–AMBAC)(a) | 6.00 | % | 11/01/17 | 15,095 | 15,786,653 | |||||||||||
Long Beach (City of); Series 2010 A, Sr. Airport RB | 5.00 | % | 06/01/40 | 2,500 | 2,376,075 | |||||||||||
Los Angeles (City of) (FHA Insured Mortgage Loans—Section 8 Assisted); Series 1997 A, Ref. Mortgage RB (INS–NATL)(a) | 6.10 | % | 07/01/25 | 460 | 460,547 | |||||||||||
Los Angeles (City of) Department of Airports (Los Angeles International Airport); |
| |||||||||||||||
Series 2010 A, Sr. RB | 5.00 | % | 05/15/35 | 2,500 | 2,508,300 | |||||||||||
Series 2010 B, Sub. RB | 5.00 | % | 05/15/40 | 1,000 | 1,003,320 | |||||||||||
Los Angeles (City of) Department of Water & Power; |
| |||||||||||||||
Series 2004 C, Water System RB(c)(d) | 5.00 | % | 07/01/14 | 1,000 | 1,040,380 | |||||||||||
Series 2011 A, Power System RB(e) | 5.00 | % | 07/01/22 | 1,800 | 2,056,464 | |||||||||||
Series 2011 A, Water System RB | 5.25 | % | 07/01/39 | 1,500 | 1,560,975 | |||||||||||
SubSeries 2006 A-1, Water System RB (INS–AMBAC)(a) | 5.00 | % | 07/01/36 | 1,485 | 1,524,961 | |||||||||||
SubSeries 2007 A-1, Power System RB (INS–AMBAC)(a) | 5.00 | % | 07/01/37 | 1,000 | 1,013,540 | |||||||||||
SubSeries 2008 A-1, Power System RB | 5.25 | % | 07/01/38 | 2,000 | 2,050,180 | |||||||||||
Los Angeles (City of); Series 2012 B, Ref. Sub. Wastewater System RB | 5.00 | % | 06/01/32 | 3,000 | 3,107,340 | |||||||||||
Los Angeles (County of) Metropolitan Transportation Authority; Series 2005 A, Proposition A First Tier Sr. Sales Tax RB (INS–AMBAC)(a) | 5.00 | % | 07/01/35 | 1,000 | 1,019,100 | |||||||||||
Los Angeles Community College District (Election of 2003); Series 2008 F-1, Unlimited Tax GO Bonds(e) | 5.00 | % | 08/01/33 | 2,000 | 2,017,620 | |||||||||||
See accompanying Notes to Financial Statements which are an integral part of the financial statements.
11 Invesco California Tax-Free Income Fund
| Interest Rate | Maturity Date | Principal Amount (000) | Value | |||||||||||||
| California–(continued) | ||||||||||||||||
Los Angeles County Schools Regionalized Business Services Corp. (Los Angeles County Schools Pooled Financing Program); Series 1999 A, CAB COP (INS–AMBAC)(a)(b) | 0.00 | % | 08/01/24 | $ | 1,265 | $ | 685,402 | |||||||||
Los Angeles Unified School District (Election of 2004); |
| |||||||||||||||
Series 2007 H, Unlimited Tax GO Bonds (INS–AGM)(a) | 5.00 | % | 07/01/32 | 1,000 | 1,031,920 | |||||||||||
Series 2009 I, Unlimited Tax GO Bonds (INS–AGC)(a) | 5.00 | % | 01/01/34 | 3,000 | 3,023,970 | |||||||||||
Madera (County of) (Valley Children’s Hospital); Series 1995, COP (INS–NATL)(a) | 6.50 | % | 03/15/15 | 3,285 | 3,434,172 | |||||||||||
Menifee Union School District (Election of 2008); Series 2009 C, Unlimited Tax CAB GO Bonds (INS–AGC)(a)(b) | 0.00 | % | 08/01/35 | 940 | 244,447 | |||||||||||
Montclair (City of) Redevelopment Agency (Montclair Redevelopment Project No. V); Series 2001, Ref. Tax Allocation RB (INS–NATL)(a) | 5.00 | % | 10/01/20 | 1,495 | 1,496,884 | |||||||||||
Montebello Unified School District (Election of 2004); Series 2009 A-1, Unlimited Tax GO Bonds (INS–AGC)(a) | 5.25 | % | 08/01/34 | 1,000 | 1,016,210 | |||||||||||
Moorpark Unified School District (Election of 2008); Series 2009 A, Unlimited Tax CAB GO Bonds (INS–AGC)(a)(b) | 0.00 | % | 08/01/31 | 840 | 305,760 | |||||||||||
Morongo Band of Mission Indians (The) (Enterprise Casino); Series 2008 B, RB(g) | 6.50 | % | 03/01/28 | 1,000 | 1,080,280 | |||||||||||
Mountain View (City of) Shoreline Regional Park Community; Series 2001 A, Tax Allocation RB (INS–NATL)(a) | 5.25 | % | 08/01/16 | 1,570 | 1,574,066 | |||||||||||
National City (City of) Community Development Commission (National City Redevelopment); Series 2011, Tax Allocation RB | 7.00 | % | 08/01/32 | 1,500 | 1,707,795 | |||||||||||
Norco (City of) Financing Authority; Series 2009, Ref. Enterprise RB (INS–AGM)(a) | 5.63 | % | 10/01/34 | 1,000 | 1,041,980 | |||||||||||
Palomar Pomerado Health; Series 2009, COP | 6.75 | % | 11/01/39 | 2,000 | 2,046,220 | |||||||||||
Panama-Buena Vista Union School District (School Construction); Series 2006, COP (INS–NATL)(a) | 5.00 | % | 09/01/30 | 1,045 | 1,049,326 | |||||||||||
Paramount Unified School District (Election of 2006); Series 2007, Unlimited Tax GO Bonds | 5.25 | % | 08/01/30 | 1,600 | 1,640,304 | |||||||||||
Pittsburg Unified School District (Election of 2006); Series 2009 B, Unlimited Tax GO Bonds | 5.50 | % | 08/01/31 | 1,000 | 1,083,620 | |||||||||||
Pomona (City of) Public Financing Authority (Merged Redevelopment); |
| |||||||||||||||
Series 2001 AD, Tax Allocation RB (INS–NATL)(a) | 5.00 | % | 02/01/15 | 2,020 | 2,024,343 | |||||||||||
Series 2001 AD, Tax Allocation RB (INS–NATL)(a) | 5.00 | % | 02/01/16 | 1,110 | 1,111,954 | |||||||||||
Series 2007 AW, Sub. RB | 5.13 | % | 02/01/33 | 1,075 | 933,928 | |||||||||||
Port Hueneme (City of) (Capital Improvement Program); Series 1992, Ref. COP (INS–NATL)(a) | 6.00 | % | 04/01/19 | 1,195 | 1,319,519 | |||||||||||
Poway Unified School District (Election of 2008—School Facilities Improvement District No. 2007-1); Series 2009 A, Unlimited Tax CAB GO Bonds(b) | 0.00 | % | 08/01/32 | 6,460 | 2,190,005 | |||||||||||
Rancho Cordova (City of) Community Facilities District No. 2003-1 (Sunridge Anatolia); |
| |||||||||||||||
Series 2012, Ref. Special Tax RB | 5.00 | % | 09/01/24 | 730 | 724,518 | |||||||||||
Series 2012, Ref. Special Tax RB | 5.00 | % | 09/01/27 | 1,000 | 960,100 | |||||||||||
Rancho Cucamonga (City of) Redevelopment Agency (Rancho Redevelopment Housing Set Aside) Series 2007 A, Tax Allocation RB (INS–NATL)(a) | 5.00 | % | 09/01/34 | 1,000 | 913,770 | |||||||||||
Rancho Cucamonga (City of) Redevelopment Agency (Rancho Redevelopment); Series 2001, Tax Allocation RB (INS–NATL)(a) | 5.38 | % | 09/01/25 | 3,000 | 3,000,180 | |||||||||||
Redding (City of) Redevelopment Agency (Canby-Hilltop-Cypress Redevelopment); Series 2003 A, Tax Allocation RB (INS–NATL)(a) | 5.00 | % | 09/01/23 | 1,400 | 1,404,200 | |||||||||||
Regents of the University of California; |
| |||||||||||||||
Series 2009 E, Medical Center Pooled RB | 5.50 | % | 05/15/27 | 2,500 | 2,708,225 | |||||||||||
Series 2009 O, General RB(e) | 5.75 | % | 05/15/23 | 705 | 826,309 | |||||||||||
Series 2009 O, General RB(e) | 5.75 | % | 05/15/25 | 1,050 | 1,228,794 | |||||||||||
Series 2009 Q, General RB(e)(j) | 5.00 | % | 05/15/34 | 920 | 951,252 | |||||||||||
Riverside (City of); |
| |||||||||||||||
Series 2008 B, Water RB (INS–AGM)(a) | 5.00 | % | 10/01/33 | 1,000 | 1,013,840 | |||||||||||
Series 2008 D, Electric RB (INS–AGM)(a) | 5.00 | % | 10/01/28 | 500 | 519,755 | |||||||||||
Series 2008 D, Electric RB (INS–AGM)(a) | 5.00 | % | 10/01/38 | 1,800 | 1,833,876 | |||||||||||
Riverside (County of) Transportation Commission; |
| |||||||||||||||
Series 2010 A, Limited Sales Tax RB | 5.00 | % | 06/01/32 | 1,500 | 1,545,795 | |||||||||||
Series 2013 A, Limited Sales Tax RB | 5.25 | % | 06/01/24 | 1,325 | 1,533,409 | |||||||||||
Sacramento (City of) Municipal Utility District; Series 2011 X, Ref. Electric RB | 5.00 | % | 08/15/27 | 2,150 | 2,279,860 | |||||||||||
Sacramento (County of) Sanitation Districts Financing Authority (Sacramento Regional County Sanitation District); | ||||||||||||||||
Series 2006, RB (INS–NATL)(a) | 5.00 | % | 12/01/29 | 2,000 | 2,078,340 | |||||||||||
Series 2011 A, Ref. RB | 5.00 | % | 12/01/26 | 1,500 | 1,625,475 | |||||||||||
See accompanying Notes to Financial Statements which are an integral part of the financial statements.
12 Invesco California Tax-Free Income Fund
| Interest Rate | Maturity Date | Principal Amount (000) | Value | |||||||||||||
| California–(continued) | ||||||||||||||||
Sacramento (County of); |
| |||||||||||||||
Series 2008 A, Sr. Airport System RB (INS–AGM)(a) | 5.00 | % | 07/01/32 | $ | 1,000 | $ | 1,006,330 | |||||||||
Series 2008 A, Sr. Airport System RB (INS–AGM)(a) | 5.00 | % | 07/01/41 | 1,015 | 1,007,388 | |||||||||||
Series 2010, Sr. Airport System RB | 5.00 | % | 07/01/40 | 2,200 | 2,102,870 | |||||||||||
San Buenaventura (City of) (Community Memorial Health System); Series 2011, RB | 7.50 | % | 12/01/41 | 2,000 | 2,159,000 | |||||||||||
San Diego (City of) Public Facilities Financing Authority (Southcrest & Central Imperial Redevelopment); Series 2007 B, Pooled Financing Tax Allocation RB (INS–Radian)(a) | 5.25 | % | 10/01/27 | 2,535 | 2,431,344 | |||||||||||
San Diego (City of) Public Facilities Financing Authority; SubSeries 2012 A, Ref. Water RB | 5.00 | % | 08/01/32 | 2,215 | 2,305,461 | |||||||||||
San Diego (County of) Regional Airport Authority; Series 2013 B, Sr. RB(f) | 5.00 | % | 07/01/29 | 1,270 | 1,265,784 | |||||||||||
San Diego Community College District (Election of 2002); Series 2009, Unlimited Tax GO Bonds(e) | 5.25 | % | 08/01/33 | 1,500 | 1,628,685 | |||||||||||
San Diego Community College District (Election of 2006); Series 2011, Unlimited Tax GO Bonds | 5.00 | % | 08/01/31 | 2,500 | 2,607,800 | |||||||||||
San Francisco (City & County of) Airport Commission (San Francisco International Airport); |
| |||||||||||||||
Series 2009 E, Second Series RB | 6.00 | % | 05/01/39 | 1,000 | 1,128,780 | |||||||||||
Series 2011 C, Ref. Second Series RB(f) | 5.00 | % | 05/01/23 | 5,000 | 5,366,000 | |||||||||||
Series 2011 G, Second Series RB | 5.25 | % | 05/01/28 | 2,000 | 2,108,200 | |||||||||||
San Francisco (City & County of) Public Utilities Commission (Water System Improvement Program); SubSeries 2011 A, Water RB | 5.00 | % | 11/01/36 | 4,000 | 4,077,640 | |||||||||||
San Francisco (City & County of) Redevelopment Financing Authority (Mission Bay North Redevelopment); Series 2011 C, Tax Allocation RB | 6.75 | % | 08/01/41 | 1,000 | 1,096,290 | |||||||||||
San Francisco (City & County of) Redevelopment Financing Authority (Mission Bay South Redevelopment); Series 2011 D, Tax Allocation RB | 7.00 | % | 08/01/33 | 500 | 536,640 | |||||||||||
San Francisco (City & County of) Successor Agency to the Redevelopment Agency Community Facilities District No. 6 (Mission Bay South Public Improvements); Series 2013 A, Ref. Special Tax RB | 5.00 | % | 08/01/33 | 500 | 476,340 | |||||||||||
San Francisco (City of) Bay Area Rapid Transit District; Series 2012 A, RB | 5.00 | % | 07/01/36 | 1,000 | 1,022,880 | |||||||||||
San Jose Evergreen Community College District (Election of 2004); Series 2008 B, Unlimited Tax CAB GO Bonds (INS–AGM)(a)(b) | 0.00 | % | 09/01/31 | 3,110 | 1,181,271 | |||||||||||
San Luis Obispo (County of) Financing Authority (Lopez Dam Improvement); Series 2011 A, Ref. RB (INS–AGM)(a) | 5.00 | % | 08/01/30 | 1,500 | 1,520,505 | |||||||||||
San Mateo (City of) Community Facilities District No. 2008-1 (Bay Meadows); Series 2013, Special Tax RB | 5.00 | % | 09/01/42 | 1,000 | 930,670 | |||||||||||
Santa Clara (County of) Financing Authority (Multiple Facilities); Series 2008 L, Ref. Lease RB | 5.25 | % | 05/15/36 | 3,000 | 3,113,130 | |||||||||||
Santa Margarita Water District (Community Facilities District No. 2013-1); |
| |||||||||||||||
Series 2013, Special Tax RB | 5.63 | % | 09/01/36 | 1,000 | 991,720 | |||||||||||
Series 2013, Special Tax RB | 5.63 | % | 09/01/43 | 1,000 | 976,640 | |||||||||||
Santaluz Community Facilities District No. 2 (Improvement Area No. 1); |
| |||||||||||||||
Series 2011 A, Ref. Special Tax RB(c)(d) | 5.00 | % | 09/01/28 | 825 | 829,323 | |||||||||||
Series 2011 A, Ref. Special Tax RB(c)(d) | 5.00 | % | 09/01/29 | 715 | 709,559 | |||||||||||
Series 2011 A, Ref. Special Tax RB(c)(d) | 5.10 | % | 09/01/30 | 465 | 460,308 | |||||||||||
Sierra View Local Health Care District; Series 2007, RB | 5.25 | % | 07/01/32 | 1,500 | 1,410,180 | |||||||||||
Simi Valley Unified School District (Election of 2004); |
| |||||||||||||||
Series 2007 C, Unlimited Tax CAB GO Bonds (INS–AGM)(a)(b) | 0.00 | % | 08/01/28 | 3,480 | 1,589,942 | |||||||||||
Series 2007 C, Unlimited Tax CAB GO Bonds (INS–AGM)(a)(b) | 0.00 | % | 08/01/30 | 2,765 | 1,073,650 | |||||||||||
Sonoma-Marin Area Rail Transit District; Series 2012 A, Measure Q Sales Tax RB | 5.00 | % | 03/01/29 | 2,000 | 2,075,740 | |||||||||||
South Gate (City of) Public Financing Authority (South Gate Redevelopment Project No. 1); Series 2002, Tax Allocation RB (INS–SGI)(a) | 5.75 | % | 09/01/22 | 1,000 | 1,012,070 | |||||||||||
Southern California Metropolitan Water District; |
| |||||||||||||||
Series 2005 A, RB (INS–AGM)(a) | 5.00 | % | 07/01/35 | 1,520 | 1,553,136 | |||||||||||
Series 2009 B, Ref. RB(e) | 5.00 | % | 07/01/27 | 8,585 | 9,342,197 | |||||||||||
Southern California Public Power Authority (Mead-Adelanto); Series 1994 A, RB (INS–AMBAC)(a)(k) | 9.68 | % | 07/01/15 | 3,500 | 3,807,020 | |||||||||||
Southern California Public Power Authority (Mead-Phoenix); Series 1994 A, RB (INS–AMBAC)(a)(k) | 9.68 | % | 07/01/15 | 2,500 | 2,720,950 | |||||||||||
Southern California Public Power Authority (Milford Wind Corridor Phase II); |
| |||||||||||||||
Series 2011 1, RB(e) | 5.25 | % | 07/01/29 | 2,100 | 2,202,900 | |||||||||||
Series 2011 1, RB(e) | 5.25 | % | 07/01/31 | 2,100 | 2,174,844 | |||||||||||
See accompanying Notes to Financial Statements which are an integral part of the financial statements.
13 Invesco California Tax-Free Income Fund
| Interest Rate | Maturity Date | Principal Amount (000) | Value | |||||||||||||
| California–(continued) | ||||||||||||||||
Tejon Ranch Public Facilities Financing Authority Community Facilities District No. 2008-1 (Tejon Industrial Complex Public Improvements-East); | ||||||||||||||||
Series 2012 A, Ref. Special Tax RB | 5.00 | % | 09/01/32 | $ | 750 | $ | 674,280 | |||||||||
Series 2012 B, Special Tax RB | 5.00 | % | 09/01/32 | 750 | 674,280 | |||||||||||
Temecula (City of) Redevelopment Agency (Temecula Redevelopment Project No. 1); Series 2002, Tax Allocation RB (INS–NATL)(a) | 5.13 | % | 08/01/27 | 2,150 | 2,183,217 | |||||||||||
Tustin (City of) Public Financing Authority; Series 2011 A, Water RB | 5.00 | % | 04/01/41 | 1,000 | 1,015,090 | |||||||||||
Twin Rivers Unified School District; Series 2009, Unlimited Tax CAB GO BAN(b) | 0.00 | % | 04/01/14 | 1,700 | 1,693,404 | |||||||||||
Val Verde Unified School District; Series 2009 A, Ref. COP (INS–AGC)(a) | 5.13 | % | 03/01/36 | 1,475 | 1,466,224 | |||||||||||
Vernon (City of); Series 2009 A, Electric System RB | 5.13 | % | 08/01/21 | 2,000 | 2,139,320 | |||||||||||
Walnut (City of) Energy Center Authority; Series 2010 A, Ref. RB | 5.00 | % | 01/01/35 | 3,000 | 2,953,380 | |||||||||||
West Contra Costa Unified School District; Series 2005, Unlimited Tax CAB GO Bonds | 0.00 | % | 08/01/25 | 2,500 | 1,327,250 | |||||||||||
Western Riverside (County of) Water & Wastewater Financing Authority (Eastern Municipal Water District Improvement); Series 2009, RB (INS–AGC)(a) | 5.63 | % | 09/01/39 | 1,000 | 1,034,680 | |||||||||||
Yosemite Community College District (Election of 2004); Series 2008 C, Unlimited Tax CAB GO Bonds (INS–AGM)(a)(b) | 0.00 | % | 08/01/24 | 4,685 | 2,876,731 | |||||||||||
| 362,750,454 | ||||||||||||||||
| Guam–1.58% | ||||||||||||||||
Guam (Territory of) (Section 30); | ||||||||||||||||
Series 2009 A, Limited Obligation RB | 5.38 | % | 12/01/24 | 1,000 | 1,033,840 | |||||||||||
Series 2009 A, Limited Obligation RB | 5.63 | % | 12/01/29 | 660 | 676,163 | |||||||||||
Guam (Territory of) International Airport Authority; Series 2013 C, General RB(f) | 6.25 | % | 10/01/34 | 1,000 | 998,770 | |||||||||||
Guam (Territory of) Power Authority; Series 2012 A, Ref. RB (INS–AGM)(a) | 5.00 | % | 10/01/25 | 1,500 | 1,604,430 | |||||||||||
Guam (Territory of); Series 2011 A, Business Privilege Tax RB | 5.13 | % | 01/01/42 | 1,500 | 1,427,850 | |||||||||||
| 5,741,053 | ||||||||||||||||
| Puerto Rico–3.95% | ||||||||||||||||
Puerto Rico (Commonwealth of) Electric Power Authority; | ||||||||||||||||
Series 2007 TT, RB | 5.00 | % | 07/01/37 | 2,000 | 1,370,180 | |||||||||||
Series 2010 AAA, RB | 5.25 | % | 07/01/29 | 2,000 | 1,518,160 | |||||||||||
Puerto Rico (Commonwealth of) Industrial Tourist Educational, Medical & Environmental Control Facilities Financing Authority (Ana G. Mendez University System); Series 2012, Ref. RB | 5.38 | % | 04/01/42 | 2,000 | 1,463,820 | |||||||||||
Puerto Rico (Commonwealth of) Public Buildings Authority; Series 2002 D, RB(c)(d) | 5.45 | % | 07/01/17 | 3,680 | 4,259,416 | |||||||||||
Puerto Rico Sales Tax Financing Corp.; | ||||||||||||||||
First SubSeries 2010 C, RB | 5.00 | % | 08/01/35 | 1,500 | 1,190,220 | |||||||||||
First SubSeries 2011 A-1, RB | 5.00 | % | 08/01/43 | 3,000 | 2,249,100 | |||||||||||
Series 2011 C, RB | 5.00 | % | 08/01/40 | 2,750 | 2,295,453 | |||||||||||
| 14,346,349 | ||||||||||||||||
| Virgin Islands–0.96% | ||||||||||||||||
Virgin Islands (Government of) Public Finance Authority (Matching Fund Loan Note–Diageo); Series 2009 A, Sub. RB | 6.63 | % | 10/01/29 | 1,675 | 1,823,087 | |||||||||||
Virgin Islands (Government of) Public Finance Authority (Matching Fund Loan Note); Series 2010 A, Sr. Lien RB | 5.00 | % | 10/01/25 | 1,600 | 1,645,088 | |||||||||||
| 3,468,175 | ||||||||||||||||
TOTAL INVESTMENTS(l)–106.37% (Cost $380,506,412) | 386,306,031 | |||||||||||||||
FLOATING RATE NOTE OBLIGATIONS–(6.78)% | ||||||||||||||||
Notes with interest and fee rates ranging from 0.58% to 0.61% at 08/31/13 and contractual maturities of collateral ranging from 07/01/22 to 10/01/39 (See Note 1K)(m) | (24,620,000 | ) | ||||||||||||||
OTHER ASSETS LESS LIABILITIES–0.41% | 1,483,420 | |||||||||||||||
NET ASSETS–100.00% | $ | 363,169,451 | ||||||||||||||
See accompanying Notes to Financial Statements which are an integral part of the financial statements.
14 Invesco California Tax-Free Income Fund
Investment Abbreviations:
| AGC | – Assured Guaranty Corp. | |
| AGM | – Assured Guaranty Municipal Corp. | |
| AMBAC | – American Municipal Bond Assurance Corp. | |
| BAN | – Bond Anticipation Notes | |
| CAB | – Capital Appreciation Bonds | |
| COP | – Certificates of Participation | |
| FHA | – Federal Housing Administration | |
| GO | – General Obligation | |
| INS | – Insurer | |
| LOC | – Letter of Credit | |
| NATL | – National Public Finance Guarantee Corp. | |
| Radian | – Radian Asset Assurance, Inc. | |
| RB | – Revenue Bonds | |
| Ref. | – Refunding | |
| SGI | – Syncora Guarantee, Inc. | |
| Sr. | – Senior | |
| Sub. | – Subordinated | |
| VRD | – Variable Rate Demand |
Notes to Schedule of Investments:
| (a) | Principal and/or interest payments are secured by the bond insurance company listed. |
| (b) | Zero coupon bond issued at a discount. |
| (c) | Security has an irrevocable call by the issuer or mandatory put by the holder. Maturity date reflects such call or put. |
| (d) | Advance refunded; secured by an escrow fund of U.S. Government obligations or other highly rated collateral. |
| (e) | Underlying security related to Dealer Trusts entered into by the Fund. See Note 1K. |
| (f) | Security subject to the alternative minimum tax. |
| (g) | Security purchased or received in a transaction exempt from registration under the Securities Act of 1933, as amended (the “1933 Act”). The security may be resold pursuant to an exemption from registration under the 1933 Act, typically to qualified institutional buyers. The aggregate value of these securities at August 31, 2013 was $4,011,315, which represented 1.10% of the Fund’s Net Assets. |
| (h) | Demand security payable upon demand by the Fund at specified time intervals no greater than thirteen months. Interest rate is redetermined periodically. Rate shown is the rate in effect on August 31, 2013. |
| (i) | Principal and interest payments are fully enhanced by a letter of credit from the bank listed or a predecessor bank, branch or subsidiary. |
| (j) | Security is subject to a shortfall agreement which may require the Fund to pay amounts to a counterparty in the event of a significant decline in the market value of the security underlying the Dealer Trusts. In case of a shortfall, the maximum potential amount of payments the Fund could ultimately be required to make under the agreement is $615,000. However, such shortfall payment would be reduced by the proceeds from the sale of the security underlying the Dealer Trusts. |
| (k) | Current coupon rate for inverse floating rate municipal obligations. This rate resets periodically as the rate on the related security changes. Positions in inverse floating rate municipal obligations have a total value of $6,527,970, which represented 1.80% of the Fund’s Net Assets. |
| (l) | This table provides a listing of those entities that have either issued, guaranteed, backed or otherwise enhanced the credit quality of more than 5% of the securities held in the portfolio. In instances where the entity has guaranteed, backed or otherwise enhanced the credit quality of a security, it is not primarily responsible for the issuer’s obligations but may be called upon to satisfy the issuer’s obligations. |
| Entities | Percentage | |||
Assured Guaranty Municipal Corp. | 10.7 | % | ||
National Public Finance Guarantee Corp. | 9.0 | |||
American Municipal Bond Assurance Corp. | 8.1 | |||
| (m) | Floating rate note obligations related to securities held. The interest rates shown reflect the rates in effect at August 31, 2013. At August 31, 2013, the Fund’s investments with a value of $40,124,562 are held by Dealer Trusts and serve as collateral for the $24,620,000 in the floating rate note obligations outstanding at that date. |
See accompanying Notes to Financial Statements which are an integral part of the financial statements.
15 Invesco California Tax-Free Income Fund
Statement of Assets and Liabilities
August 31, 2013
Assets: |
| |||
Investments, at value (Cost $380,506,412) | $ | 386,306,031 | ||
Receivable for: | ||||
Investments sold | 175,000 | |||
Fund shares sold | 128,238 | |||
Interest | 5,300,200 | |||
Investment for trustee deferred compensation and retirement plans | 16,708 | |||
Other assets | 5,160 | |||
Total assets | 391,931,337 | |||
Liabilities: | ||||
Floating rate note obligations | 24,620,000 | |||
Payable for: | ||||
Investments purchased | 995,320 | |||
Fund shares reacquired | 831,842 | |||
Amount due custodian | 1,454,253 | |||
Dividends | 601,939 | |||
Accrued fees to affiliates | 117,108 | |||
Accrued trustees’ and officers’ fees and benefits | 3,720 | |||
Accrued other operating expenses | 32,304 | |||
Trustee deferred compensation and retirement plans | 105,400 | |||
Total liabilities | 28,761,886 | |||
Net assets applicable to shares outstanding | $ | 363,169,451 | ||
Net assets consist of: | ||||
Shares of beneficial interest | $ | 386,137,814 | ||
Undistributed net investment income | 1,194,328 | |||
Undistributed net realized gain (loss) | (29,962,310 | ) | ||
Net unrealized appreciation | 5,799,619 | |||
| $ | 363,169,451 | |||
Net Assets: |
| |||
Class A | $ | 165,142,254 | ||
Class B | $ | 155,899,614 | ||
Class C | $ | 21,558,215 | ||
Class Y | $ | 20,569,368 | ||
Shares outstanding, $0.01 par value per share, |
| |||
Class A | 14,746,563 | |||
Class B | 13,822,368 | |||
Class C | 1,912,839 | |||
Class Y | 1,829,793 | |||
Class A: | ||||
Net asset value per share | $ | 11.20 | ||
Maximum offering price per share | ||||
(Net asset value of $11.20 ¸ 95.75%) | $ | 11.70 | ||
Class B: | ||||
Net asset value and offering price per share | $ | 11.28 | ||
Class C: | ||||
Net asset value and offering price per share | $ | 11.27 | ||
Class Y: | ||||
Net asset value and offering price per share | $ | 11.24 | ||
See accompanying Notes to Financial Statements which are an integral part of the financial statements.
16 Invesco California Tax-Free Income Fund
Statement of Operations
For the year ended August 31, 2013
Investment income: |
| |||
Interest | $ | 20,374,372 | ||
Expenses: | ||||
Advisory fees | 1,949,887 | |||
Administrative services fees | 110,420 | |||
Custodian fees | 9,490 | |||
Distribution fees: | ||||
Class A | 424,724 | |||
Class B | 517,730 | |||
Class C | 181,540 | |||
Interest, facilities and maintenance fees | 204,418 | |||
Transfer agent fees | 193,465 | |||
Trustees’ and officers’ fees and benefits | 41,140 | |||
Other | 192,266 | |||
Total expenses | 3,825,080 | |||
Less: Expense offset arrangement(s) | (141 | ) | ||
Net expenses | 3,824,939 | |||
Net investment income | 16,549,433 | |||
Realized and unrealized gain (loss) from: | ||||
Net realized gain from investment securities | 763,454 | |||
Change in net unrealized appreciation (depreciation) of investment securities | (37,091,954 | ) | ||
Net realized and unrealized gain (loss) | (36,328,500 | ) | ||
Net increase (decrease) in net assets resulting from operations | $ | (19,779,067 | ) | |
See accompanying Notes to Financial Statements which are an integral part of the financial statements.
17 Invesco California Tax-Free Income Fund
Statement of Changes in Net Assets
For the years ended August 31, 2013 and 2012
| 2013 | 2012 | |||||||
Operations: |
| |||||||
Net investment income | $ | 16,549,433 | $ | 17,900,578 | ||||
Net realized gain (loss) | 763,454 | (930,630 | ) | |||||
Change in net unrealized appreciation (depreciation) | (37,091,954 | ) | 32,828,385 | |||||
Net increase (decrease) in net assets resulting from operations | (19,779,067 | ) | 49,798,333 | |||||
Distributions to shareholders from net investment income: | ||||||||
Class A | (7,115,529 | ) | (6,564,668 | ) | ||||
Class B | (7,488,596 | ) | (9,274,169 | ) | ||||
Class C | (843,990 | ) | (935,612 | ) | ||||
Class Y | (1,028,342 | ) | (1,087,150 | ) | ||||
Total distributions from net investment income | (16,476,457 | ) | (17,861,599 | ) | ||||
Share transactions–net: | ||||||||
Class A | 18,657,510 | 3,515,850 | ||||||
Class B | (46,199,280 | ) | (20,479,447 | ) | ||||
Class C | (3,584,104 | ) | 3,695,906 | |||||
Class Y | (2,122,326 | ) | (1,352,895 | ) | ||||
Net increase (decrease) in net assets resulting from share transactions | (33,248,200 | ) | (14,620,586 | ) | ||||
Net increase (decrease) in net assets | (69,503,724 | ) | 17,316,148 | |||||
Net assets: | ||||||||
Beginning of year | 432,673,175 | 415,357,027 | ||||||
End of year (includes undistributed net investment income of $1,194,328 and $1,077,451, respectively) | $ | 363,169,451 | $ | 432,673,175 | ||||
Notes to Financial Statements
August 31, 2013
NOTE 1—Significant Accounting Policies
Invesco California Tax-Free Income Fund (the “Fund”) is a series portfolio of AIM Counselor Series Trust (Invesco Counselor Series Trust) (the “Trust”). The Trust is a Delaware statutory trust registered under the Investment Company Act of 1940, as amended (the “1940 Act”), as an open-end series management investment company consisting of twelve separate portfolios, each authorized to issue an unlimited number of shares of beneficial interest. The assets, liabilities and operations of each portfolio are accounted for separately. Information presented in these financial statements pertains only to the Fund. Matters affecting each portfolio or class will be voted on exclusively by the shareholders of such portfolio or class.
The Fund’s investment objective is to provide a high level of current income exempt from federal and California income tax, consistent with the preservation of capital.
The Fund currently consists of four different classes of shares: Class A, Class B, Class C and Class Y. Class A shares are sold with a front-end sales charge unless certain waiver criteria are met and under certain circumstances load waived shares may be subject to contingent deferred sales charges (“CDSC”). Class C shares are sold with a CDSC. Class Y shares are sold at net asset value. Effective November 30, 2010, new or additional investments in Class B shares are no longer permitted. Existing shareholders of Class B shares may continue to reinvest dividends and capital gains distributions in Class B shares until they convert to Class A shares. Also, shareholders in Class B shares will be able to exchange those shares for Class B shares of other Invesco Funds offering such shares until they convert to Class A shares. Generally, Class B shares will automatically convert to Class A shares on or about the month-end, which is at least eight years after the date of purchase. Redemption of Class B shares prior to conversion date will be subject to a CDSC.
The following is a summary of the significant accounting policies followed by the Fund in the preparation of its financial statements.
| A. | Security Valuations — Securities, including restricted securities, are valued according to the following policy. |
Securities are fair valued using an evaluated quote provided by an independent pricing service approved by the Board of Trustees. Evaluated quotes provided by the pricing service may be determined without exclusive reliance on quoted prices, and may reflect appropriate factors such as institution-size trading in similar groups of securities, developments related to specific securities, dividend rate (for unlisted equities), yield (for debt obligations), quality, type of issue, coupon rate (for debt obligations), maturity (for debt obligations), individual trading characteristics and other market data. Debt obligations are subject to interest rate and credit risks. In addition, all debt obligations involve some risk of default with respect to interest and/or principal payments.
Securities for which market quotations either are not readily available or became unreliable are valued at fair value as determined in good faith by or under the supervision of the Trust’s officers following procedures approved by the Board of Trustees. Some of the factors which may be considered in determining fair value are fundamental analytical data relating to the investment; the nature and duration of any restrictions on
18 Invesco California Tax-Free Income Fund
transferability or disposition; trading in similar securities by the same issuer or comparable companies; relevant political, economic or issuer specific news; and other relevant factors under the circumstances.
Valuations change in response to many factors including the historical and prospective earnings of the issuer, the value of the issuer’s assets, general economic conditions, interest rates, investor perceptions and market liquidity. Because of the inherent uncertainties of valuation, the values reflected in the financial statements may materially differ from the value received upon actual sale of those investments.
| B. | Securities Transactions and Investment Income — Securities transactions are accounted for on a trade date basis. Realized gains or losses on sales are computed on the basis of specific identification of the securities sold. Interest income, adjusted for amortization of premiums and accretion of discounts on investments, is recorded on the accrual basis from settlement date. |
The Fund may periodically participate in litigation related to Fund investments. As such, the Fund may receive proceeds from litigation settlements. Any proceeds received are included in the Statement of Operations as realized gain (loss) for investments no longer held and as unrealized gain (loss) for investments still held.
Brokerage commissions and mark ups are considered transaction costs and are recorded as an increase to the cost basis of securities purchased and/or a reduction of proceeds on a sale of securities. Such transaction costs are included in the determination of net realized gain (loss) from investment securities reported in the Statement of Operations and the Statement of Changes in Net Assets and the net realized gains (losses) on securities per share in the Financial Highlights. Transaction costs are included in the calculation of the Fund’s net asset value and, accordingly, they reduce the Fund’s total returns. These transaction costs are not considered operating expenses and are not reflected in net investment income reported in the Statement of Operations and Statement of Changes in Net Assets, or the net investment income per share and ratios of expenses and net investment income reported in the Financial Highlights, nor are they limited by any expense limitation arrangements between the Fund and the investment adviser.
The Fund allocates realized capital gains and losses to a class based on the relative net assets of each class. The Fund allocates income to a class based on the relative value of the settled shares of each class.
| C. | Country Determination — For the purposes of making investment selection decisions and presentation in the Schedule of Investments, the investment adviser may determine the country in which an issuer is located and/or credit risk exposure based on various factors. These factors include the laws of the country under which the issuer is organized, where the issuer maintains a principal office, the country in which the issuer derives 50% or more of its total revenues and the country that has the primary market for the issuer’s securities, as well as other criteria. Among the other criteria that may be evaluated for making this determination are the country in which the issuer maintains 50% or more of its assets, the type of security, financial guarantees and enhancements, the nature of the collateral and the sponsor organization. Country of issuer and/or credit risk exposure has been determined to be the United States of America, unless otherwise noted. |
| D. | Distributions — Distributions from income are declared daily and paid monthly. Distributions from net realized capital gain, if any, are generally declared and paid annually and recorded on the ex-dividend date. The Fund may elect to treat a portion of the proceeds from redemptions as distributions for federal income tax purposes. |
| E. | Federal Income Taxes — The Fund intends to comply with the requirements of Subchapter M of the Internal Revenue Code of 1986, as amended (the “Internal Revenue Code”), necessary to qualify as a regulated investment company and to distribute substantially all of the Fund’s taxable and tax-exempt earnings to shareholders. As such, the Fund will not be subject to federal income taxes on otherwise taxable income (including net realized capital gain) that is distributed to shareholders. Therefore, no provision for federal income taxes is recorded in the financial statements. |
In addition, the Fund intends to invest in such municipal securities to allow it to qualify to pay shareholders “exempt-interest dividends”, as defined in the Internal Revenue Code.
The Fund files tax returns in the U.S. Federal jurisdiction and certain other jurisdictions. Generally, the Fund is subject to examinations by such taxing authorities for up to three years after the filing of the return for the tax period.
| F. | Expenses — Fees provided for under the Rule 12b-1 plan of a particular class of the Fund and which are directly attributable to that class are charged to the operations of such class. All other expenses are allocated among the classes based on relative net assets. |
| G. | Interest, Facilities and Maintenance Fees — Interest, Facilities and Maintenance Fees include interest and related borrowing costs such as commitment fees and other expenses associated with lines of credit and interest and administrative expenses related to establishing and maintaining floating rate note obligations, if any. |
| H. | Accounting Estimates — The preparation of financial statements in conformity with accounting principles generally accepted in the United States of America (“GAAP”) requires management to make estimates and assumptions that affect the reported amounts of assets and liabilities at the date of the financial statements and the reported amounts of revenues and expenses during the reporting period including estimates and assumptions related to taxation. Actual results could differ from those estimates by a significant amount. In addition, the Fund monitors for material events or transactions that may occur or become known after the period-end date and before the date the financial statements are released to print. |
| I. | Indemnifications — Under the Trust’s organizational documents, each Trustee, officer, employee or other agent of the Trust is indemnified against certain liabilities that may arise out of the performance of their duties to the Fund. Additionally, in the normal course of business, the Fund enters into contracts, including the Fund’s servicing agreements, that contain a variety of indemnification clauses. The Fund’s maximum exposure under these arrangements is unknown as this would involve future claims that may be made against the Fund that have not yet occurred. The risk of material loss as a result of such indemnification claims is considered remote. |
| J. | Other Risks — The value of, payment of interest on, repayment of principal for and the ability to sell a municipal security may be affected by constitutional amendments, legislative enactments, executive orders, administrative regulations, voter initiatives and the economics of the regions in which the issuers are located. |
Since many municipal securities are issued to finance similar projects, especially those relating to education, health care, transportation and utilities, conditions in those sectors can affect the overall municipal securities market and a Fund’s investments in municipal securities.
There is some risk that a portion or all of the interest received from certain tax-free municipal securities could become taxable as a result of determinations by the Internal Revenue Service.
19 Invesco California Tax-Free Income Fund
| K. | Floating Rate Note Obligations — The Fund invests in inverse floating rate securities, such as Residual Interest Bonds (“RIBs”) or Tender Option Bonds (“TOBs”) for investment purposes and to enhance the yield of the Fund. Inverse floating rate investments tend to underperform the market for fixed rate bonds in a rising interest rate environment, but tend to outperform the market for fixed rate bonds when interest rates decline or remain relatively stable. Such transactions may be purchased in the secondary market without first owning the underlying bond or by the sale of fixed rate bonds by the Fund to special purpose trusts established by a broker dealer (“Dealer Trusts”) in exchange for cash and residual interests in the Dealer Trusts’ assets and cash flows, which are in the form of inverse floating rate securities. The Dealer Trusts finance the purchases of the fixed rate bonds by issuing floating rate notes to third parties and allowing the Fund to retain residual interests in the bonds. The floating rate notes issued by the Dealer Trusts have interest rates that reset weekly and the floating rate note holders have the option to tender their notes to the Dealer Trusts for redemption at par at each reset date. The residual interests held by the Fund (inverse floating rate investments) include the right of the Fund (1) to cause the holders of the floating rate notes to tender their notes at par at the next interest rate reset date, and (2) to transfer the municipal bond from the Dealer Trusts to the Fund, thereby collapsing the Dealer Trusts. |
TOBs are presently classified as private placement securities. Private placement securities are subject to restrictions on resale because they have not been registered under the Securities Act of 1933, as amended (the “1933 Act”), or are otherwise not readily marketable. As a result of the absence of a public trading market for these securities, they may be less liquid than publicly traded securities. Although these securities may be resold in privately negotiated transactions, the prices realized from these sales could be less than those originally paid by the Fund or less than what may be considered the fair value of such securities.
The Fund accounts for the transfer of bonds to the Dealer Trusts as secured borrowings, with the securities transferred remaining in the Fund’s investment assets, and the related floating rate notes reflected as Fund liabilities under the caption Floating rate note obligations on the Statement of Assets and Liabilities. The Fund records the interest income from the fixed rate bonds under the caption Interest and records the expenses related to floating rate obligations and any administrative expenses of the Dealer Trusts as a component of Interest, facilities and maintenance fees on the Statement of Operations.
The Fund generally invests in inverse floating rate securities that include embedded leverage, thus exposing the Fund to greater risks and increased costs. The primary risks associated with inverse floating rate securities are varying degrees of liquidity and the changes in the value of such securities in response to changes in market rates of interest to a greater extent than the value of an equal principal amount of a fixed rate security having similar credit quality, redemption provisions and maturity which may cause the Fund’s net asset value to be more volatile than if it had not invested in inverse floating rate securities. In certain instances, the short-term floating rate interests created by the special purpose trust may not be able to be sold to third parties or, in the case of holders tendering (or putting) such interests for repayment of principal, may not be able to be remarketed to third parties. In such cases, the special purpose trust holding the long-term fixed rate bonds may be collapsed. In the case of RIBs or TOBs created by the contribution of long-term fixed income bonds by the Fund, the Fund will then be required to repay the principal amount of the tendered securities. During times of market volatility, illiquidity or uncertainty, the Fund could be required to sell other portfolio holdings at a disadvantageous time to raise cash to meet that obligation.
NOTE 2—Advisory Fees and Other Fees Paid to Affiliates
The Trust has entered into a master investment advisory agreement with Invesco Advisers, Inc. (the “Adviser” or “Invesco”). Under the terms of the investment advisory agreement, the Fund pays an advisory fee to the Adviser based on the annual rate of the Fund’s average daily net assets as follows:
| Average Daily Net Assets | Rate | |||||
First $500 million | 0 | .47% | ||||
Next $250 million | 0 | .445% | ||||
Next $250 million | 0 | .42% | ||||
Next $250 million | 0 | .395% | ||||
Over $1.25 billion | 0 | .37% | ||||
Under the terms of a master sub-advisory agreement between the Adviser and each of Invesco Asset Management Deutschland GmbH, Invesco Asset Management Limited, Invesco Asset Management (Japan) Limited, Invesco Australia Limited, Invesco Hong Kong Limited, Invesco Senior Secured Management, Inc. and Invesco Canada Ltd. (collectively, the “Affiliated Sub-Advisers”) the Adviser, not the Fund, may pay 40% of the fees paid to the Adviser to any such Affiliated Sub-Adviser(s) that provide(s) discretionary investment management services to the Fund based on the percentage of assets allocated to such Sub-Adviser(s).
The Adviser has contractually agreed, through at least June 30, 2014, to waive advisory fees and/or reimburse expenses to the extent necessary to limit total annual fund operating expenses and/or reimbursement (excluding certain items discussed below) of Class A, Class B, Class C and Class Y shares to 1.50%, 2.00%, 2.00% and 1.25% of average daily net assets, respectively. In determining the Adviser’s obligation to waive advisory fees and/or reimburse expenses, the following expenses are not taken into account, and could cause the net annual fund operating expenses and/or reimbursement to exceed the numbers reflected above: (1) interest, facilities and maintenance fees; (2) taxes; (3) dividend expense on short sales; (4) extraordinary or non-routine items, including litigation expenses; and (5) expenses that the Fund has incurred but did not actually pay because of an expense offset arrangement. Unless the Board of Trustees and Invesco mutually agree to amend or continue the fee waiver agreement, it will terminate on June 30, 2014. The Adviser did not waive fees and/or reimburse expenses during the period under this expense limitation.
The Trust has entered into a master administrative services agreement with Invesco pursuant to which the Fund has agreed to pay Invesco for certain administrative costs incurred in providing accounting services to the Fund. For the year ended August 31, 2013, expenses incurred under the agreement are shown in the Statement of Operations as Administrative services fees.
The Trust has entered into a transfer agency and service agreement with Invesco Investment Services, Inc. (“IIS”) pursuant to which the Fund has agreed to pay IIS a fee for providing transfer agency and shareholder services to the Fund and reimburse IIS for certain expenses incurred by IIS in the course of providing such services. IIS may make payments to intermediaries that provide omnibus account services, sub-accounting services and/or
20 Invesco California Tax-Free Income Fund
networking services. All fees payable by IIS to intermediaries that provide omnibus account services or sub-accounting are charged back to the Fund, subject to certain limitations approved by the Trust’s Board of Trustees. For the year ended August 31, 2013, expenses incurred under the agreement are shown in the Statement of Operations as Transfer agent fees.
Shares of the Fund are distributed by Invesco Distributors, Inc. (“IDI”), an affiliate of the Adviser. The Fund has adopted a Plan of Distribution (the “Plan”) pursuant to Rule 12b-1 under the 1940 Act. The Plan provides that the Fund will reimburse IDI for distribution related expenses that IDI incurs up to a maximum of the following annual rates: (1) Class A — up to 0.25% of the average daily net assets of Class A shares; (2) Class B — up to 0.75% of the average daily net assets of Class B shares; and (3) Class C — up to 0.75% of the average daily net assets of Class C shares.
In the case of Class B shares, provided that the Plan continues in effect, any cumulative expenses incurred by IDI, but not yet reimbursed to IDI, may be recovered through the payment of future distribution fees from the Fund pursuant to the Plan and contingent deferred sales charges paid by investors upon redemption of Class B shares.
For the year ended August 31, 2013, expenses incurred under these agreements are shown in the Statement of Operations as Distribution fees.
Front-end sales commissions and CDSC (collectively, the “sales charges”) are not recorded as expenses of the Fund. Front-end sales commissions are deducted from proceeds from the sales of Fund shares prior to investment in Class A shares of the Fund. CDSC are deducted from redemption proceeds prior to remittance to the shareholder. During the year ended August 31, 2013, IDI advised the Fund that IDI retained $51,077 in front-end sales commissions from the sale of Class A shares and $16,582 and $1,813 from Class B and Class C shares, respectively, for CDSC imposed on redemptions by shareholders.
Certain officers and trustees of the Trust are officers and directors of the Adviser, IIS and/or IDI.
NOTE 3—Additional Valuation Information
GAAP defines fair value as the price that would be received to sell an asset or paid to transfer a liability in an orderly transaction between market participants at the measurement date, under current market conditions. GAAP establishes a hierarchy that prioritizes the inputs to valuation methods, giving the highest priority to readily available unadjusted quoted prices in an active market for identical assets (Level 1) and the lowest priority to significant unobservable inputs (Level 3), generally when market prices are not readily available or are unreliable. Based on the valuation inputs, the securities or other investments are tiered into one of three levels. Changes in valuation methods may result in transfers in or out of an investment’s assigned level:
| Level 1 — | Prices are determined using quoted prices in an active market for identical assets. |
| Level 2 — | Prices are determined using other significant observable inputs. Observable inputs are inputs that other market participants may use in pricing a security. These may include quoted prices for similar securities, interest rates, prepayment speeds, credit risk, yield curves, loss severities, default rates, discount rates, volatilities and others. |
| Level 3 — | Prices are determined using significant unobservable inputs. In situations where quoted prices or observable inputs are unavailable (for example, when there is little or no market activity for an investment at the end of the period), unobservable inputs may be used. Unobservable inputs reflect the Fund’s own assumptions about the factors market participants would use in determining fair value of the securities or instruments and would be based on the best available information. |
As of August 31, 2013, all of the securities in this Fund were valued based on Level 2 inputs (see the Schedule of Investments for security categories). The level assigned to the securities valuations may not be an indication of the risk or liquidity associated with investing in those securities. Because of the inherent uncertainties of valuation, the values reflected in the financial statements may materially differ from the value received upon actual sale of those investments.
NOTE 4—Expense Offset Arrangement(s)
The expense offset arrangement is comprised of transfer agency credits which result from balances in Demand Deposit Accounts (DDA) used by the transfer agent for clearing shareholder transactions. For the year ended August 31, 2013, the Fund received credits from this arrangement, which resulted in the reduction of the Fund’s total expenses of $141.
NOTE 5—Trustees’ and Officers’ Fees and Benefits
“Trustees’ and Officers’ Fees and Benefits” include amounts accrued by the Fund to pay remuneration to certain Trustees and Officers of the Fund. Trustees have the option to defer compensation payable by the Fund, and “Trustees’ and Officers’ Fees and Benefits” also include amounts accrued by the Fund to fund such deferred compensation amounts. Those Trustees who defer compensation have the option to select various Invesco Funds in which their deferral accounts shall be deemed to be invested. Finally, certain current Trustees are eligible to participate in a retirement plan that provides for benefits to be paid upon retirement to Trustees over a period of time based on the number of years of service. The Fund may have certain former Trustees who also participate in a retirement plan and receive benefits under such plan. “Trustees’ and Officers’ Fees and Benefits” include amounts accrued by the Fund to fund such retirement benefits. Obligations under the deferred compensation and retirement plans represent unsecured claims against the general assets of the Fund.
NOTE 6—Cash Balances and Borrowings
The Trust is permitted to temporarily carry a negative or overdrawn balance in its account with State Street Bank and Trust Company, the custodian bank. Such balances, if any at period end, are shown in the Statement of Assets and Liabilities under the payable caption Amount due custodian. To compensate the custodian bank for such overdrafts, the overdrawn Trust may either (1) leave funds as a compensating balance in the account so the custodian bank can be compensated by earning the additional interest; or (2) compensate by paying the custodian bank at a rate agreed upon by the custodian bank and Invesco, not to exceed the contractually agreed upon rate.
Inverse floating rate obligations resulting from the transfer of bonds to Dealer Trusts are accounted for as secured borrowings. The average floating rate notes outstanding and average annual interest and fee rate related to inverse floating rate note obligations during the year ended August 31, 2013 were $24,635,000 and 0.83%, respectively.
21 Invesco California Tax-Free Income Fund
NOTE 7—Distributions to Shareholders and Tax Components of Net Assets
Tax Character of Distributions to Shareholders Paid During the Years Ended August 31, 2013 and 2012:
| 2013 | 2012 | |||||||
Ordinary income | $ | 16,476,457 | $ | 17,861,599 | ||||
Tax Components of Net Assets at Period-End:
| 2013 | ||||
Undistributed ordinary income | $ | 857,899 | ||
Net unrealized appreciation — investments | 6,049,108 | |||
Temporary book/tax differences | (103,142 | ) | ||
Post-October deferrals | (1,207,266 | ) | ||
Capital loss carryforward | (28,564,962 | ) | ||
Shares of beneficial interest | 386,137,814 | |||
Total net assets | $ | 363,169,451 | ||
The difference between book-basis and tax-basis unrealized appreciation (depreciation) is due to differences in the timing of recognition of gains and losses on investments for tax and book purposes. The Fund’s net unrealized appreciation difference is attributable primarily to TOBs and book to tax accretion and amortization differences.
The temporary book/tax differences are a result of timing differences between book and tax recognition of income and/or expenses. The Fund’s temporary book/tax differences are the result of the trustee deferral of compensation and retirement plan benefits and bond market discount recognition.
Capital loss carryforward is calculated and reported as of a specific date. Results of transactions and other activity after that date may affect the amount of capital loss carryforward actually available for the Fund to utilize. The Regulated Investment Company Modernization Act of 2010 eliminated the eight-year carryover period for capital losses that arise in taxable years beginning after its enactment date of December 22, 2010. Consequently, these capital losses can be carried forward for an unlimited period. However, capital losses with an expiration period may not be used to offset capital gains until all net capital losses without an expiration date have been utilized. Additionally, post-enactment capital loss carryovers will retain their character as either short-term or long-term capital losses instead of as short-term capital losses as under prior law. The ability to utilize capital loss carryforward in the future may be limited under the Internal Revenue Code and related regulations based on the results of future transactions.
The Fund utilized $1,970,720 of capital loss carryforward in the current period to offset net realized capital gain for federal income tax purposes. The Fund has a capital loss carryforward as of August 31, 2013, which expires as follows:
| Capital Loss Carryforward* | ||||||||||||
| Expiration | Short-Term | Long-Term | Total | |||||||||
August 31, 2015 | $ | 803,875 | $ | — | $ | 803,875 | ||||||
August 31, 2016 | 4,399,730 | — | 4,399,730 | |||||||||
August 31, 2017 | 9,460,903 | — | 9,460,903 | |||||||||
August 31, 2018 | 6,678,872 | — | 6,678,872 | |||||||||
August 31, 2019 | 1,906,728 | — | 1,906,728 | |||||||||
Not subject to expiration | 266,902 | 5,047,952 | 5,314,854 | |||||||||
| $ | 23,517,010 | $ | 5,047,952 | $ | 28,564,962 | |||||||
| * | Capital loss carryforward as of the date listed above is reduced for limitations, if any, to the extent required by the Internal Revenue Code. To the extent that unrealized gains as of June 6, 2011, the date of reorganization of Invesco Van Kampen California Insured Tax Free Fund into the Fund, are realized on securities held in each fund at such date of reorganization, the capital loss carryforward may be further limited for up to five years from the date of the reorganization. |
NOTE 8—Investment Securities
The aggregate amount of investment securities (other than short-term securities, U.S. Treasury obligations and money market funds, if any) purchased and sold by the Fund during the year ended August 31, 2013 was $53,734,363 and $83,106,736, respectively. Cost of investments on a tax basis includes the adjustments for financial reporting purposes as of the most recently completed federal income tax reporting period-end.
| Unrealized Appreciation (Depreciation) of Investment Securities on a Tax Basis | ||||
Aggregate unrealized appreciation of investment securities | $ | 13,985,528 | ||
Aggregate unrealized (depreciation) of investment securities | (7,936,420 | ) | ||
Net unrealized appreciation of investment securities | $ | 6,049,108 | ||
Cost of investments for tax purposes is $380,256,923.
NOTE 9—Reclassification of Permanent Differences
Primarily as a result of differing book/tax treatment of taxable income and federal income taxes paid, on August 31, 2013, undistributed net investment income was increased by $43,901 and shares of beneficial interest was decreased by $43,901. This reclassification had no effect on the net assets of the Fund.
22 Invesco California Tax-Free Income Fund
NOTE 10—Share Information
| Summary of Share Activity | ||||||||||||||||
| Years ended August 31, | ||||||||||||||||
| 2013(a) | 2012 | |||||||||||||||
| Shares | Amount | Shares | Amount | |||||||||||||
Sold: | ||||||||||||||||
Class A | 2,224,815 | $ | 27,215,833 | 1,639,489 | $ | 21,137,398 | ||||||||||
Class B | 6,140 | 76,451 | 22,625 | 315,968 | ||||||||||||
Class C | 501,900 | 6,196,506 | 1,218,195 | 14,630,674 | ||||||||||||
Class Y | 333,425 | 4,091,272 | 217,431 | 2,652,455 | ||||||||||||
Issued as reinvestment of dividends: | ||||||||||||||||
Class A | 359,160 | 4,327,235 | 338,136 | 4,039,533 | ||||||||||||
Class B | 299,001 | 3,622,292 | 388,933 | 4,693,892 | ||||||||||||
Class C | 32,695 | 394,972 | 42,402 | 511,702 | ||||||||||||
Class Y | 36,081 | 434,393 | 42,726 | 513,795 | ||||||||||||
Automatic conversion of Class B shares to Class A shares: | ||||||||||||||||
Class A | 2,053,203 | 25,178,400 | — | — | ||||||||||||
Class B | (2,038,370 | ) | (25,178,400 | ) | — | — | ||||||||||
Reacquired: | ||||||||||||||||
Class A | (3,169,198 | ) | (38,063,958 | ) | (1,827,423 | ) | (21,661,081 | ) | ||||||||
Class B | (2,031,233 | ) | (24,719,623 | ) | (2,128,577 | ) | (25,489,307 | ) | ||||||||
Class C | (838,544 | ) | (10,175,582 | ) | (953,703 | ) | (11,446,470 | ) | ||||||||
Class Y | (547,077 | ) | (6,647,991 | ) | (378,170 | ) | (4,519,145 | ) | ||||||||
Net increase (decrease) in share activity | (2,778,002 | ) | $ | (33,248,200 | ) | (1,377,936 | ) | $ | (14,620,586 | ) | ||||||
| (a) | There are entities that are record owners of more than 5% of the outstanding shares of the Fund and in the aggregate own 68% of the outstanding shares of the Fund. IDI has an agreement with these entities to sell Fund shares. The Fund, Invesco and/or Invesco affiliates may make payments to these entities, which are considered to be related to the Fund, for providing services to the Fund, Invesco and/or Invesco affiliates including but not limited to services such as securities brokerage, distribution, third party record keeping and account servicing. The Fund has no knowledge as to whether all or any portion of the shares owned of record by these entities are also owned beneficially. |
23 Invesco California Tax-Free Income Fund
NOTE 11—Financial Highlights
The following schedule presents financial highlights for a share of the Fund outstanding throughout the periods indicated.
| Net asset value, beginning of period | Net investment income | Net gains (losses) on securities (both realized and unrealized) | Total from investment operations | Dividends from net investment income | Distributions from net realized gains | Total distributions | Net asset value, end of period | Total return(a) | Net assets, end of period (000’s omitted) | Ratio of expenses to average net assets with fee waivers and/or expenses absorbed | Ratio of expenses to average net assets without fee waivers and/or expenses absorbed | Supplemental ratio of expenses to average net assets (excluding interest, facilities and maintenance fees)(b) | Ratio of net investment income to average net assets | Portfolio turnover(c) | ||||||||||||||||||||||||||||||||||||||||||||||
Class A |
| |||||||||||||||||||||||||||||||||||||||||||||||||||||||||||
Year ended 08/31/13 | $ | 12.28 | $ | 0.49 | (d) | $ | (1.08 | ) | $ | (0.59 | ) | $ | (0.49 | ) | $ | – | $ | (0.49 | ) | $ | 11.20 | (5.06 | )% | $ | 165,142 | 0.89 | %(e) | 0.89 | %(e) | 0.84 | %(e) | 4.02 | %(e) | 12 | % | |||||||||||||||||||||||||
Year ended 08/31/12 | 11.34 | 0.50 | (d) | 0.94 | 1.44 | (0.50 | ) | – | (0.50 | ) | 12.28 | 12.91 | 163,047 | 0.87 | 0.87 | 0.82 | 4.21 | 18 | ||||||||||||||||||||||||||||||||||||||||||
Year ended 08/31/11 | 11.75 | 0.52 | (d) | (0.41 | ) | 0.11 | (0.52 | ) | – | (0.52 | ) | 11.34 | 1.13 | 148,884 | 0.90 | 0.90 | 0.85 | 4.66 | 25 | |||||||||||||||||||||||||||||||||||||||||
Eight months ended 08/31/10 | 11.21 | 0.37 | 0.52 | 0.89 | (0.35 | ) | – | (0.35 | ) | 11.75 | 8.05 | 26,015 | 0.88 | (f) | 0.91 | (f) | 0.84 | (f) | 4.88 | (f) | 15 | |||||||||||||||||||||||||||||||||||||||
Year ended 12/31/09 | 10.23 | 0.51 | 0.97 | 1.48 | (0.50 | ) | – | (0.50 | ) | 11.21 | 14.74 | 24,377 | 0.86 | 0.92 | 0.85 | 4.65 | 19 | |||||||||||||||||||||||||||||||||||||||||||
Year ended 12/31/08 | 11.83 | 0.49 | (1.56 | ) | (1.07 | ) | (0.49 | ) | (0.04 | ) | (0.53 | ) | 10.23 | (9.28 | ) | 22,799 | 0.86 | 0.90 | 0.86 | 4.33 | 10 | |||||||||||||||||||||||||||||||||||||||
Class B | ||||||||||||||||||||||||||||||||||||||||||||||||||||||||||||
Year ended 08/31/13 | 12.37 | 0.49 | (d) | (1.09 | ) | (0.60 | ) | (0.49 | ) | – | (0.49 | ) | 11.28 | (5.11 | )(g) | 155,900 | 0.93 | (e)(g) | 0.93 | (e)(g) | 0.88 | (e)(g) | 3.98 | (e)(g) | 12 | |||||||||||||||||||||||||||||||||||
Year ended 08/31/12 | 11.42 | 0.50 | (d) | 0.95 | 1.45 | (0.50 | ) | – | (0.50 | ) | 12.37 | 12.93 | (g) | 217,489 | 0.88 | (g) | 0.88 | (g) | 0.83 | (g) | 4.20 | (g) | 18 | |||||||||||||||||||||||||||||||||||||
Year ended 08/31/11 | 11.83 | 0.52 | (d) | (0.41 | ) | 0.11 | (0.52 | ) | – | (0.52 | ) | 11.42 | 1.16 | (g) | 220,478 | 0.89 | (g) | 0.89 | (g) | 0.84 | (g) | 4.67 | (g) | 25 | ||||||||||||||||||||||||||||||||||||
Eight months ended 08/31/10 | 11.28 | 0.37 | 0.53 | 0.90 | (0.35 | ) | – | (0.35 | ) | 11.83 | 8.10 | 254,907 | 0.88 | (f) | 0.91 | (f) | 0.84 | (f) | 4.88 | (f) | 15 | |||||||||||||||||||||||||||||||||||||||
Year ended 12/31/09 | 10.30 | 0.51 | 0.98 | �� | 1.49 | (0.51 | ) | – | (0.51 | ) | 11.28 | 14.68 | 266,270 | 0.85 | 0.94 | 0.84 | 4.66 | 19 | ||||||||||||||||||||||||||||||||||||||||||
Year ended 12/31/08 | 11.91 | 0.50 | (1.57 | ) | (1.07 | ) | (0.50 | ) | (0.04 | ) | (0.54 | ) | 10.30 | (9.23 | ) | 267,308 | 0.85 | 0.89 | 0.85 | 4.34 | 10 | |||||||||||||||||||||||||||||||||||||||
Class C |
| |||||||||||||||||||||||||||||||||||||||||||||||||||||||||||
Year ended 08/31/13 | 12.36 | 0.43 | (d) | (1.09 | ) | (0.66 | ) | (0.43 | ) | – | (0.43 | ) | 11.27 | (5.57 | ) | 21,558 | 1.40 | (e) | 1.40 | (e) | 1.35 | (e) | 3.51 | (e) | 12 | |||||||||||||||||||||||||||||||||||
Year ended 08/31/12 | 11.41 | 0.44 | (d) | 0.95 | 1.39 | (0.44 | ) | – | (0.44 | ) | 12.36 | 12.37 | 27,394 | 1.38 | 1.38 | 1.33 | 3.70 | 18 | ||||||||||||||||||||||||||||||||||||||||||
Year ended 08/31/11 | 11.82 | 0.46 | (d) | (0.40 | ) | 0.06 | (0.47 | ) | – | (0.47 | ) | 11.41 | 0.65 | 21,800 | 1.40 | 1.40 | 1.35 | 4.16 | 25 | |||||||||||||||||||||||||||||||||||||||||
Eight months ended 08/31/10 | 11.27 | 0.34 | 0.52 | 0.86 | (0.31 | ) | – | (0.31 | ) | 11.82 | 7.76 | 17,528 | 1.38 | (f) | 1.41 | (f) | 1.34 | (f) | 4.38 | (f) | 15 | |||||||||||||||||||||||||||||||||||||||
Year ended 12/31/09 | 10.29 | 0.46 | 0.97 | 1.43 | (0.45 | ) | – | (0.45 | ) | 11.27 | 14.11 | 17,245 | 1.36 | 1.42 | 1.35 | 4.15 | 19 | |||||||||||||||||||||||||||||||||||||||||||
Year ended 12/31/08 | 11.90 | 0.44 | (1.57 | ) | (1.13 | ) | (0.44 | ) | (0.04 | ) | (0.48 | ) | 10.29 | (9.74 | ) | 17,105 | 1.36 | 1.40 | 1.36 | 3.83 | 10 | |||||||||||||||||||||||||||||||||||||||
Class Y |
| |||||||||||||||||||||||||||||||||||||||||||||||||||||||||||
Year ended 08/31/13 | 12.33 | 0.52 | (d) | (1.09 | ) | (0.57 | ) | (0.52 | ) | – | (0.52 | ) | 11.24 | (4.88 | ) | 20,569 | 0.65 | (e) | 0.65 | (e) | 0.60 | (e) | 4.26 | (e) | 12 | |||||||||||||||||||||||||||||||||||
Year ended 08/31/12 | 11.38 | 0.53 | (d) | 0.95 | 1.48 | (0.53 | ) | – | (0.53 | ) | 12.33 | 13.24 | 24,742 | 0.63 | 0.63 | 0.58 | 4.45 | 18 | ||||||||||||||||||||||||||||||||||||||||||
Year ended 08/31/11 | 11.79 | 0.55 | (d) | (0.41 | ) | 0.14 | (0.55 | ) | – | (0.55 | ) | 11.38 | 1.40 | 24,195 | 0.65 | 0.65 | 0.60 | 4.91 | 25 | |||||||||||||||||||||||||||||||||||||||||
Eight months ended 08/31/10 | 11.25 | 0.39 | 0.52 | 0.91 | (0.37 | ) | – | (0.37 | ) | 11.79 | 8.21 | 26,837 | 0.63 | (f) | 0.66 | (f) | 0.59 | (f) | 5.13 | (f) | 15 | |||||||||||||||||||||||||||||||||||||||
Year ended 12/31/09 | 10.26 | 0.54 | 0.98 | 1.52 | (0.53 | ) | – | (0.53 | ) | 11.25 | 15.10 | 27,388 | 0.61 | 0.67 | 0.60 | 4.90 | 19 | |||||||||||||||||||||||||||||||||||||||||||
Year ended 12/31/08 | 11.86 | 0.52 | (1.56 | ) | (1.04 | ) | (0.52 | ) | (0.04 | ) | (0.56 | ) | 10.26 | (9.02 | ) | 28,450 | 0.61 | 0.65 | 0.61 | 4.58 | 10 | |||||||||||||||||||||||||||||||||||||||
| (a) | Includes adjustments in accordance with accounting principles generally accepted in the United States of America and as such, the net asset value for financial reporting purposes and the returns based upon those net asset values may differ from the net asset value and returns for shareholder transactions. Does not include sales charges and is not annualized for periods less than one year, if applicable. |
| (b) | For the years ended August 31, 2011 and prior, ratio does not exclude facilities and maintenance fees. |
| (c) | Portfolio turnover is calculated at the fund level and is not annualized for periods less than one year, if applicable. For the period ending August 31, 2011, the portfolio turnover calculation excludes the value of securities purchased of $139,542,348 and sold of $13,399,363 in the effort to realign the Fund’s portfolio holdings after the reorganization of Invesco Van Kampen California Insured Tax Free Income Fund into the Fund. |
| (d) | Calculated using average shares outstanding. |
| (e) | Ratios are based on average daily net assets (000’s omitted) of $177,678, $188,736, $24,205 and $24,250 for Class A, Class B, Class C and Class Y shares, respectively. |
| (f) | Annualized. |
| (g) | The total return, ratio of expenses to average net assets and ratio of net investment income (loss) to average net assets reflect actual 12b-1 fees of 0.27%, 0.25% and 0.25% for the years ended August 31, 2013, 2012 and 2011, respectively. |
24 Invesco California Tax-Free Income Fund
Report of Independent Registered Public Accounting Firm
To the Board of Trustees of AIM Counselor Series Trust (Invesco Counselor Series Trust)
and Shareholders of Invesco California Tax-Free Income Fund:
In our opinion, the accompanying statement of assets and liabilities, including the schedule of investments, and the related statements of operations and of changes in net assets and the financial highlights present fairly, in all material respects, the financial position of Invesco California Tax-Free Income Fund (one of the funds constituting AIM Counselor Series Trust (Invesco Counselor Series Trust), hereafter referred to as the “Fund”) at August 31, 2013, the results of its operations for the year then ended, the changes in its net assets for each of the two years in the period then ended and the financial highlights for each of the three years in the period then ended and the eight month period ended August 31, 2010, in conformity with accounting principles generally accepted in the United States of America. These financial statements and financial highlights (hereafter referred to as “financial statements”) are the responsibility of the Fund’s management; our responsibility is to express an opinion on these financial statements based on our audits. We conducted our audits of these financial statements in accordance with the standards of the Public Company Accounting Oversight Board (United States). Those standards require that we plan and perform the audit to obtain reasonable assurance about whether the financial statements are free of material misstatement. An audit includes examining, on a test basis, evidence supporting the amounts and disclosures in the financial statements, assessing the accounting principles used and significant estimates made by management, and evaluating the overall financial statement presentation. We believe that our audits, which included confirmation of securities at August 31, 2013 by correspondence with the custodian and brokers, provide a reasonable basis for our opinion. The financial highlights of the Fund for the periods ended December 31, 2009 and prior were audited by another independent registered public accounting firm whose report dated February 25, 2010 expressed an unqualified opinion on those financial statements.
PRICEWATERHOUSECOOPERS LLP
October 25, 2013
Houston, Texas
25 Invesco California Tax-Free Income Fund
Calculating your ongoing Fund expenses
Example
As a shareholder of the Fund, you incur two types of costs: (1) transaction costs, which may include sales charges (loads) on purchase payments or contingent deferred sales charges on redemptions, if any; and (2) ongoing costs, including management fees, distribution and/or service (12b-1) fees, and other Fund expenses. This example is intended to help you understand your ongoing costs (in dollars) of investing in the Fund and to compare these costs with ongoing costs of investing in other mutual funds. The example is based on an investment of $1,000 invested at the beginning of the period and held for the entire period March 1, 2013 through August 31, 2013.
Actual expenses
The table below provides information about actual account values and actual expenses. You may use the information in this table, together with the amount you invested, to estimate the expenses that you paid over the period. Simply divide your account value by $1,000 (for example, an $8,600 account value divided by $1,000 = 8.6), then multiply the result by the number in the table under the heading entitled “Actual Expenses Paid During Period” to estimate the expenses you paid on your account during this period.
Hypothetical example for comparison purposes
The table below also provides information about hypothetical account values and hypothetical expenses based on the Fund’s actual expense ratio and an assumed rate of return of 5% per year before expenses, which is not the Fund’s actual return.
The hypothetical account values and expenses may not be used to estimate the actual ending account balance or expenses you paid for the period. You may use this information to compare the ongoing costs of investing in the Fund and other funds. To do so, compare this 5% hypothetical example with the 5% hypothetical examples that appear in the shareholder reports of the other funds.
Please note that the expenses shown in the table are meant to highlight your ongoing costs only and do not reflect any transaction costs, such as sales charges (loads) on purchase payments or contingent deferred sales charges on redemptions, if any. Therefore, the hypothetical information is useful in comparing ongoing costs only, and will not help you determine the relative total costs of owning different funds. In addition, if these transaction costs were included, your costs would have been higher.
| Class | Beginning Account Value (03/01/13) | ACTUAL | HYPOTHETICAL (5% annual return before expenses) | Annualized Expense Ratio | ||||||||||||||||||||
| Ending Account Value (08/31/13)1 | Expenses Paid During Period2 | Ending Account Value (08/31/13) | Expenses Paid During Period2 | |||||||||||||||||||||
| A | $ | 1,000.00 | $ | 922.80 | $ | 4.31 | $ | 1,020.72 | $ | 4.53 | 0.89 | % | ||||||||||||
| B | 1,000.00 | 923.20 | 4.51 | 1,020.52 | 4.74 | 0.93 | ||||||||||||||||||
| C | 1,000.00 | 921.00 | 6.78 | 1,018.15 | 7.12 | 1.40 | ||||||||||||||||||
| Y | 1,000.00 | 924.20 | 3.15 | 1,021.93 | 3.31 | 0.65 | ||||||||||||||||||
| 1 | The actual ending account value is based on the actual total return of the Fund for the period March 1, 2013 through August 31, 2013, after actual expenses and will differ from the hypothetical ending account value which is based on the Fund’s expense ratio and a hypothetical annual return of 5% before expenses. |
| 2 | Expenses are equal to the Fund’s annualized expense ratio as indicated above multiplied by the average account value over the period, multiplied by 184/365 to reflect the most recent fiscal half year. |
26 Invesco California Tax-Free Income Fund
Approval of Investment Advisory and Sub-Advisory Contracts
The Board of Trustees (the Board) of AIM Counselor Series Trust (Invesco Counselor Series Trust) is required under the Investment Company Act of 1940, as amended, to approve annually the renewal of Invesco California Tax-Free Income Fund’s (the Fund) investment advisory agreement with Invesco Advisers, Inc. (Invesco Advisers) and the Master Intergroup Sub-Advisory Contract for Mutual Funds (the sub-advisory contracts) with Invesco Asset Management Deutschland GmbH, Invesco Asset Management Limited, Invesco Asset Management (Japan) Limited, Invesco Australia Limited, Invesco Hong Kong Limited, Invesco Senior Secured Management, Inc. and Invesco Canada Ltd. (collectively, the Affiliated Sub-Advisers). During contract renewal meetings held on June 17-19, 2013, the Board as a whole, and the disinterested or “independent” Trustees, who comprise over 75% of the Board, voting separately, approved the continuance of the Fund’s investment advisory agreement and the sub-advisory contracts for another year, effective July 1, 2013. The Board determined that continuation of the Fund’s investment advisory agreement and the sub-advisory contracts are in the best interests of the Fund and its shareholders and the compensation payable to Invesco Advisers and the Affiliated Sub-Advisers under the agreements is fair and reasonable.
The Board’s Fund Evaluation Process
The Board’s Investments Committee has established three Sub-Committees, each of which is primarily responsible for overseeing the management of a number of the funds advised by Invesco Advisers (the Invesco Funds). The Sub-Committees meet throughout the year to review the performance of their assigned Invesco Funds, including reviewing materials prepared under the direction of the independent Senior Officer, an officer of the Invesco Funds who reports directly to the independent Trustees. Over the course of each year, the Sub-Committees meet with portfolio managers for their assigned Invesco Funds and other members of management to review the performance, investment objective(s), policies, strategies, limitations and investment risks of these funds. The Sub-Committees meet regularly and at designated contract renewal meetings each year to conduct a review of the performance, fees, expenses and other matters related to their assigned Invesco Funds. Each Sub-Committee recommends to the Investments Committee, which in turn recommends to the full Board, whether and on what terms to approve the continuance of each Invesco Fund’s investment advisory agreement and sub-advisory contracts for another year.
During the contract renewal process, the Trustees receive comparative performance and fee data regarding the Invesco Funds prepared by Invesco Advisers and Lipper Inc. (Lipper), an independent provider of investment company
data. The Trustees also receive an independent written evaluation from the Senior Officer. The Senior Officer’s evaluation is prepared as part of his responsibility to manage the process by which the Invesco Funds’ proposed management fees are negotiated during the annual contract renewal process to ensure they are negotiated in a manner that is at arms’ length and reasonable. The independent Trustees are assisted in their annual evaluation of the Fund’s investment advisory agreement by the Senior Officer and by independent legal counsel. In addition to meetings with Invesco Advisers and fund counsel, the independent Trustees also discuss the continuance of the investment advisory agreement and sub-advisory contracts in separate sessions with the Senior Officer and with independent legal counsel.
In evaluating the fairness and reasonableness of compensation under the Fund’s investment advisory agreement and sub-advisory contracts, the Board considered, among other things, the factors discussed below. The Trustees recognized that the advisory fee rates for the Invesco Funds are, in many cases, the result of years of review and negotiation between the Trustees and Invesco Advisers as well as advisory fees previously approved by different predecessor boards. The Trustees’ deliberations and conclusions in a particular year may be based in part on their deliberations and conclusions regarding these same arrangements throughout the year and in prior years. The Trustees’ review and conclusions are based on the comprehensive consideration of all information presented to them and are not the result of any single determinative factor. Moreover, one Trustee may have weighed a particular piece of information or factor differently than another Trustee.
The discussion below serves as the Senior Officer’s independent written evaluation with respect to the Fund’s investment advisory agreement as well as a discussion of the material factors and related conclusions that formed the basis for the Board’s approval of the Fund’s investment advisory agreement and sub-advisory contracts. Unless otherwise stated, this information is current as of June 19, 2013, and may not reflect consideration of factors that became known to the Board after that date, including, for example, changes to the Fund’s performance, advisory fees, expense limitations and/or fee waivers.
Factors and Conclusions and Summary of Independent Written Fee Evaluation
| A. | Nature, Extent and Quality of Services Provided by Invesco Advisers and the Affiliated Sub-Advisers |
The Board reviewed the advisory services provided to the Fund by Invesco Advisers under the Fund’s investment advisory agreement, the performance of Invesco Advisers in providing these services, and the credentials and
experience of the officers and employees of Invesco Advisers who provide these services, including the Fund’s portfolio manager or managers, with whom the Sub-Committees met during the year. The Board’s review of the qualifications of Invesco Advisers to provide advisory services included the Board’s consideration of Invesco Advisers’ investment process oversight, independent credit analysis and investment risk management.
In determining whether to continue the Fund’s investment advisory agreement, the Board considered the benefits of reapproving an existing relationship and the greater uncertainty that may be associated with entering into a new relationship. The Board also considered non-advisory services that Invesco Advisers and its affiliates provide to the Invesco Funds such as various back office support functions, equity and fixed income trading operations, internal audit, distribution and legal and compliance. The Board concluded that the nature, extent and quality of the services provided to the Fund by Invesco Advisers are appropriate and satisfactory and consistent with the terms of the Fund’s investment advisory agreement.
The Board reviewed the services that may be provided by the Affiliated Sub-Advisers under the sub-advisory contracts and the credentials and experience of the officers and employees of the Affiliated Sub-Advisers who provide these services. The Board concluded that the sub-advisory contracts benefit the Fund and its shareholders by permitting Invesco Advisers to use the resources and talents of the Affiliated Sub-Advisers in managing the Fund. The Board concluded that the nature, extent and quality of the services that may be provided by the Affiliated Sub-Advisers are appropriate and satisfactory and consistent with the terms of the Fund’s sub-advisory contracts.
| B. | Fund Performance |
The Board considered Fund performance as a relevant factor in considering whether to approve the investment advisory agreement. The Board did not view Fund performance as a relevant factor in considering whether to approve the sub-advisory contracts for the Fund, as no Affiliated Sub-Adviser currently manages assets of the Fund.
The Board compared the Fund’s performance during the past one, three and five calendar years to the performance of funds in the Lipper performance universe and against the Lipper California Municipal Debt Funds Index. The Board noted that performance of Class A shares of the Fund was in the third quintile of its performance universe for the one and five year periods and the second quintile for the three year period (the first quintile being the best performing funds and the fifth quintile being the worst performing funds). The Board noted that performance of Class A shares of the Fund was below the performance of the Index for the one,
27 Invesco California Tax-Free Income Fund
three and five year periods. The Trustees also reviewed more recent Fund performance and this review did not change their conclusions.
| C. | Advisory and Sub-Advisory Fees |
The Board compared the Fund’s contractual management fee rate to the contractual management fee rates of funds in the Fund’s Lipper expense group at a common asset level. The Board noted that the contractual management fee rate for Class A shares of the Fund was below the median contractual management fee rate of funds in its expense group. The Board noted that the term “contractual management fee” may include both advisory and certain administrative services fees and that Invesco Advisers does not charge the Invesco Funds for the administrative services included in the term as defined by Lipper. The Board also reviewed the methodology used by Lipper in providing expense group information, which includes using each fund’s contractual management fee schedule (including any applicable breakpoints) as reported in the most recent prospectus or statement of additional information for each fund in the expense group.
The Board noted that Invesco Advisers and the Affiliated Sub-Advisers do not manage other mutual funds or client accounts in a manner substantially similar to the management of the Fund.
The Board also considered the services that may be provided by the Affiliated Sub-Advisers pursuant to the sub-advisory contracts, as well as the fees payable by Invesco Advisers to Affiliated Sub-Advisers pursuant to the sub-advisory contracts. The Board also noted that the sub-advisory fees are not paid directly by the Fund, but rather, are payable by Invesco Advisers to the Affiliated Sub-Advisers.
Based upon the information and considerations described above, the Board concluded that the compensation payable to Invesco Advisers and the Affiliated Sub-Advisers is fair and reasonable.
| D. | Economies of Scale and Breakpoints |
The Board considered the extent to which there are economies of scale in the provision of advisory services to the Fund. The Board also considered whether the Fund benefits from economies of scale through contractual breakpoints in the Fund’s advisory fee schedule and was assisted in this review by a report from the Senior Officer. The Board also noted that the Fund shares directly in economies of scale through lower fees charged by third party service providers based on the combined size of the Invesco Funds and other clients advised by Invesco Advisers.
| E. | Profitability and Financial Resources |
The Board reviewed information from Invesco Advisers concerning the costs of the advisory and other services that Invesco Advisers and its affiliates provide to the Fund and the profitability of Invesco Advisers and its affiliates in providing these services for the year ended December 31, 2012. The Board received information from Invesco Advisers about the
methodology used to prepare the profitability information. The Board considered the profitability of Invesco Advisers in managing the Fund and the Invesco Funds. The Board noted that Invesco Advisers continues to operate at a net profit from services Invesco Advisers and its subsidiaries provide to the Invesco Funds and the Fund. The Board did not deem the level of profits realized by Invesco Advisers and its affiliates from providing services to the Fund to be excessive given the nature, quality and extent of the services provided to the Invesco Funds. The Board received and accepted information from Invesco Advisers demonstrating that Invesco Advisers and each Affiliated Sub-Adviser are financially sound and have the resources necessary to perform their obligations under the investment advisory agreement and sub-advisory contracts.
| F. | Collateral Benefits to Invesco Advisers and its Affiliates |
The Board considered various other benefits received by Invesco Advisers and its affiliates from the relationship with the Fund, including the fees received for their provision of transfer agency and distribution services to the Fund. The Board considered comparative information regarding fees charged for these services, including information provided by Lipper and other independent sources. The Board considered the performance of Invesco Advisers and its affiliates in providing these services and the organizational structure employed to provide these services. The Board also considered that these services are provided to the Fund pursuant to written contracts that are reviewed and approved on an annual basis by the Board; that the services are required for the operation of the Fund; that Invesco Advisers and its affiliates can provide services, the nature and quality of which are at least equal to those provided by others offering the same or similar services; and that the fees for such services are fair and reasonable in light of the usual and customary charges by others for services of the same nature and quality.
The Board considered the benefits realized by Invesco Advisers and the Affiliated Sub-Advisers as a result of portfolio brokerage transactions executed through “soft dollar” arrangements. Invesco Advisers noted that the Fund does not execute brokerage transactions through “soft dollar” arrangements to any significant degree.
The Board considered that the Fund’s uninvested cash and cash collateral from any securities lending arrangements may be invested in money market funds advised by Invesco Advisers pursuant to procedures approved by the Board. The Board noted that Invesco Advisers receives advisory fees from these affiliated money market funds attributable to such investments, although Invesco Advisers has contractually agreed to waive through varying periods the advisory fees payable by the Invesco Funds. The waiver is in an amount equal to 100% of the net advisory fee Invesco Advisers receives from the affiliated money market funds with respect to the Fund’s
investment in the affiliated money market funds of uninvested cash, but not cash collateral. The Board concluded that the Fund’s investment of uninvested cash and cash collateral from any securities lending arrangements in the affiliated money market funds is in the best interests of the Fund and its shareholders.
28 Invesco California Tax-Free Income Fund
Tax Information
Form 1099-DIV, Form 1042-S and other year–end tax information provide shareholders with actual calendar year amounts that should be included in their tax returns. Shareholders should consult their tax advisors.
The following distribution information is being provided as required by the Internal Revenue Code or to meet a specific state’s requirement.
The Fund designates the following amounts or, if subsequently determined to be different, the maximum amount allowable for its fiscal year ended August 31, 2013:
Federal and State Income Tax | ||||
Qualified Dividend Income* | 0.00 | % | ||
Corporate Dividends Received Deduction* | 0.00 | % | ||
Tax-Exempt Interest Dividends* | 100 | % | ||
| * | The above percentages are based on ordinary income dividends paid to shareholders during the Fund’s fiscal year. |
29 Invesco California Tax-Free Income Fund
Trustees and Officers
The address of each trustee and officer is AIM Counselor Series Trust (Invesco Counselor Series Trust) (the “Trust”), 11 Greenway Plaza, Suite 1000, Houston, Texas 77046-1173. The trustees serve for the life of the Trust, subject to their earlier death, incapacitation, resignation, retirement or removal as more specifically provided in the Trust’s organizational documents. Each officer serves for a one year term or until their successors are elected and qualified. Column two below includes length of time served with predecessor entities, if any.
Name, Year of Birth and Position(s) Held with the Trust | Trustee and/ or Officer Since | Principal Occupation(s) During Past 5 Years | Number of Funds in Fund Complex Overseen by Trustee | Other Directorship(s) Held by Trustee During Past 5 Years | ||||
| Interested Persons | ||||||||
| Martin L. Flanagan1 — 1960 Trustee | 2007 | Executive Director, Chief Executive Officer and President, Invesco Ltd. (ultimate parent of Invesco and a global investment management firm); Advisor to the Board, Invesco Advisers, Inc. (formerly known as Invesco Institutional (N.A.), Inc.); Trustee, The Invesco Funds; Vice Chair, Investment Company Institute; and Member of Executive Board, SMU Cox School of Business
Formerly: Chairman and Chief Executive Officer, Invesco Advisers, Inc. (registered investment adviser); Director, Chairman, Chief Executive Officer and President, IVZ Inc. (holding company), INVESCO Group Services, Inc. (service provider) and Invesco North American Holdings, Inc. (holding company); Director, Chief Executive Officer and President, Invesco Holding Company Limited (parent of Invesco and a global investment management firm); Director, Invesco Ltd.; Chairman, Investment Company Institute and President, Co-Chief Executive Officer, Co-President, Chief Operating Officer and Chief Financial Officer, Franklin Resources, Inc. (global investment management organization) | 117 | None | ||||
| Philip A. Taylor2 — 1954 Trustee, President and Principal Executive Officer | 2006 | Head of North American Retail and Senior Managing Director, Invesco Ltd.; Director, Co-Chairman, Co-President and Co-Chief Executive Officer, Invesco Advisers, Inc. (formerly known as Invesco Institutional (N.A.), Inc.) (registered investment adviser); Director, Chairman, Chief Executive Officer and President, Invesco Management Group, Inc. (formerly known as Invesco Aim Management Group, Inc.) (financial services holding company); Director and President, INVESCO Funds Group, Inc. (registered investment adviser and registered transfer agent); Director and Chairman, Invesco Investment Services, Inc. (formerly known as Invesco Aim Investment Services, Inc.) (registered transfer agent) and IVZ Distributors, Inc. (formerly known as INVESCO Distributors, Inc.) (registered broker dealer); Director, President and Chairman, Invesco Inc. (holding company) and Invesco Canada Holdings Inc. (holding company); Chief Executive Officer, Invesco Corporate Class Inc. (corporate mutual fund company) and Invesco Canada Fund Inc. (corporate mutual fund company); Director, Chairman and Chief Executive Officer, Invesco Canada Ltd. (formerly known as Invesco Trimark Ltd./Invesco Trimark Ltèe) (registered investment adviser and registered transfer agent); Trustee, President and Principal Executive Officer, The Invesco Funds (other than AIM Treasurer’s Series Trust (Invesco Treasurer’s Series Trust) and Short-Term Investments Trust); Trustee and Executive Vice President, The Invesco Funds (AIM Treasurer’s Series Trust (Invesco Treasurer’s Series Trust) and Short-Term Investments Trust only); Director, Invesco Investment Advisers LLC (formerly known as Van Kampen Asset Management); Director, Chief Executive Officer and President, Van Kampen Exchange Corp.
Formerly: Director and Chairman, Van Kampen Investor Services Inc.: Director, Chief Executive Officer and President, 1371 Preferred Inc. (holding company); and Van Kampen Investments Inc.; Director and President, AIM GP Canada Inc. (general partner for limited partnerships); and Van Kampen Advisors, Inc.; Director and Chief Executive Officer, Invesco Trimark Dealer Inc. (registered broker dealer); Director, Invesco Distributors, Inc. (formerly known as Invesco Aim Distributors, Inc.) (registered broker dealer); Manager, Invesco PowerShares Capital Management LLC; Director, Chief Executive Officer and President, Invesco Advisers, Inc.; Director, Chairman, Chief Executive Officer and President, Invesco Aim Capital Management, Inc.; President, Invesco Trimark Dealer Inc. and Invesco Trimark Ltd./Invesco Trimark Ltèe; Director and President, AIM Trimark Corporate Class Inc. and AIM Trimark Canada Fund Inc.; Senior Managing Director, Invesco Holding Company Limited; Trustee and Executive Vice President, Tax-Free Investments Trust; Director and Chairman, Fund Management Company (former registered broker dealer); President and Principal Executive Officer, The Invesco Funds (AIM Treasurer’s Series Trust (Invesco Treasurer’s Series Trust), Short-Term Investments Trust and Tax-Free Investments Trust only); President, AIM Trimark Global Fund Inc. and AIM Trimark Canada Fund Inc. | 117 | None | ||||
Wayne W. Whalen3 — 1939 Trustee | 2010 | Of Counsel, and prior to 2010, partner in the law firm of Skadden, Arps, Slate, Meagher & Flom LLP, legal counsel to certain funds in the Fund Complex
| 130 | Director of the Mutual Fund Directors Forum, a nonprofit membership organization for investment directors; Chairman and Director of the Abraham Lincoln Presidential Library Foundation; and Director of the Stevenson Center for Democracy |
| 1 | Mr. Flanagan is considered an interested person of the Trust because he is an officer of the adviser to the Trust, and an officer and a director of Invesco Ltd., ultimate parent of the adviser to the Trust. |
| 2 | Mr. Taylor is considered an interested person of the Trust because he is an officer and a director of the adviser to, and a director of the principal underwriter of, the Trust. |
| 3 | Mr. Whalen is considered an “interested person” (within the meaning of Section 2(a)(19) of the 1940 Act) of certain Funds in the Invesco Fund Complex because he and his firm currently provide legal services as legal counsel to such Funds. |
T-1 Invesco California Tax-Free Income Fund
Trustees and Officers—(continued)
Name, Year of Birth and Position(s) Held with the Trust | Trustee and/ or Officer Since | Principal Occupation(s) During Past 5 Years | Number of Funds in Fund Complex Overseen by Trustee | Other Directorship(s) Held by Trustee During Past 5 Years | ||||
| Independent Trustees | ||||||||
Bruce L. Crockett — 1944 Trustee and Chair | 2003 | Chairman, Crockett Technologies Associates (technology consulting company)
Formerly: Director, Captaris (unified messaging provider); Director, President and Chief Executive Officer COMSAT Corporation; and Chairman, Board of Governors of INTELSAT (international communications company) | 117 | ACE Limited (insurance company); Investment Company Institute | ||||
David C. Arch — 1945 Trustee | 2010 | Chairman and Chief Executive Officer of Blistex Inc., (consumer health care products manufacturer)
Formerly: Member of the Heartland Alliance Advisory Board, a nonprofit organization serving human needs based in Chicago | 130 | Board member of the Illinois Manufacturers’ Association; Member of the Board of Visitors, Institute for the Humanities, University of Michigan | ||||
Frank S. Bayley — 1939 Trustee | 2003 | Retired
Formerly: Director, Badgley Funds, Inc. (registered investment company) (2 portfolios) and General Partner and Of Counsel, law firm of Baker & McKenzie, LLP | 117 | Director and Chairman, C.D. Stimson Company (a real estate investment company); Trustee and Overseer, The Curtis Institute of Music | ||||
James T. Bunch — 1942 Trustee | 2000 | Managing Member, Grumman Hill Group LLC (family office private equity management)
Formerly: Founder, Green, Manning & Bunch Ltd. (investment banking firm)(1988-2010); Executive Committee, United States Golf Association; and Director, Policy Studies, Inc. and Van Gilder Insurance Corporation | 117 | Chairman, Board of Governors, Western Golf Association; Chairman-elect, Evans Scholars Foundation; and Director, Denver Film Society | ||||
Rodney F. Dammeyer — 1940 Trustee | 2010 | Chairman of CAC, LLC, (private company offering capital investment and management advisory services)
Formerly: Prior to 2001, Managing Partner at Equity Group Corporate Investments; Prior to 1995, Chief Executive Officer of Itel Corporation (formerly Anixter International); Prior to 1985, experience includes Senior Vice President and Chief Financial Officer of Household International, Inc., Executive Vice President and Chief Financial Officer of Northwest Industries, Inc. and Partner of Arthur Andersen & Co.; From 1987 to 2010, Director/Trustee of investment companies in the Van Kampen Funds complex | 117 | Director of Quidel Corporation and Stericycle, Inc.; Prior to May 2008, Trustee of The Scripps Research Institute; Prior to February 2008, Director of Ventana Medical Systems, Inc. | ||||
Albert R. Dowden — 1941 Trustee | 2003 | Director of a number of public and private business corporations, including the Boss Group, Ltd. (private investment and management); Reich & Tang Funds (5 portfolios) (registered investment company); and Homeowners of America Holding Corporation/ Homeowners of America Insurance Company (property casualty company)
Formerly: Director, Continental Energy Services, LLC (oil and gas pipeline service); Director, CompuDyne Corporation (provider of product and services to the public security market) and Director, Annuity and Life Re (Holdings), Ltd. (reinsurance company); Director, President and Chief Executive Officer, Volvo Group North America, Inc.; Senior Vice President, AB Volvo; Director of various public and private corporations; Chairman, DHJ Media, Inc.; Director Magellan Insurance Company; and Director, The Hertz Corporation, Genmar Corporation (boat manufacturer), National Media Corporation; Advisory Board of Rotary Power International (designer, manufacturer, and seller of rotary power engines); and Chairman, Cortland Trust, Inc. (registered investment company) | 117 | Director of Nature’s Sunshine Products, Inc. | ||||
Jack M. Fields — 1952 Trustee | 2003 | Chief Executive Officer, Twenty First Century Group, Inc. (government affairs company); Owner and Chief Executive Officer, Dos Angeles Ranch, L.P. (cattle, hunting, corporate entertainment); and Discovery Global Education Fund (non-profit)
Formerly: Chief Executive Officer, Texana Timber LP (sustainable forestry company); Director of Cross Timbers Quail Research Ranch (non-profit); and member of the U.S. House of Representatives | 117 | Insperity, Inc. (formerly known as Administaff) | ||||
Prema Mathai-Davis — 1950 Trustee | 2003 | Retired
Formerly: Chief Executive Officer, YWCA of the U.S.A. | 117 | None | ||||
Larry Soll — 1942 Trustee | 1997 | Retired
Formerly: Chairman, Chief Executive Officer and President, Synergen Corp. (a biotechnology company) | 117 | None | ||||
Hugo F. Sonnenschein — 1940 Trustee | 2010 | Distinguished Service Professor and President Emeritus of the University of Chicago and the Adam Smith Distinguished Service Professor in the Department of Economics at the University of Chicago
Formerly: President of the University of Chicago | 130 | Trustee of the University of Rochester and a member of its investment committee. Member of the National Academy of Sciences, the American Philosophical Society and a fellow of the American Academy of Arts and Sciences |
T-2 Invesco California Tax-Free Income Fund
Trustees and Officers—(continued)
Name, Year of Birth and Position(s) Held with the Trust | Trustee and/ or Officer Since | Principal Occupation(s) During Past 5 Years | Number of Funds in Fund Complex Overseen by Trustee | Other Directorship(s) Held by Trustee During Past 5 Years | ||||
| Independent Trustees—(continued) | ||||||||
Raymond Stickel, Jr. — 1944 Trustee | 2005 | Retired
Formerly: Director, Mainstay VP Series Funds, Inc. (25 portfolios) and Partner, Deloitte & Touche | 117 | None | ||||
| Other Officers | ||||||||
| Russell C. Burk — 1958 Senior Vice President and Senior Officer | 2005 | Senior Vice President and Senior Officer, The Invesco Funds | N/A | N/A | ||||
| John M. Zerr — 1962 Senior Vice President, Chief Legal Officer and Secretary | 2006 | Director, Senior Vice President, Secretary and General Counsel, Invesco Management Group, Inc. (formerly known as Invesco Aim Management Group, Inc.) and Van Kampen Exchange Corp.; Senior Vice President, Invesco Advisers, Inc. (formerly known as Invesco Institutional (N.A.), Inc.) (registered investment adviser); Senior Vice President and Secretary, Invesco Distributors, Inc. (formerly known as Invesco Aim Distributors, Inc.); Director, Vice President and Secretary, Invesco Investment Services, Inc. (formerly known as Invesco Aim Investment Services, Inc.) and IVZ Distributors, Inc. (formerly known as INVESCO Distributors, Inc.); Director and Vice President, INVESCO Funds Group, Inc.; Senior Vice President, Chief Legal Officer and Secretary, The Invesco Funds; Manager, Invesco PowerShares Capital Management LLC; Director, Secretary and General Counsel, Invesco Investment Advisers LLC (formerly known as Van Kampen Asset Management); Secretary and General Counsel, Invesco Capital Markets, Inc. (formerly known as Van Kampen Funds Inc.) and Chief Legal Officer, PowerShares Exchange-Traded Fund Trust, PowerShares Exchange-Traded Fund Trust II, PowerShares India Exchange-Traded Fund Trust and PowerShares Actively Managed Exchange-Traded Fund Trust
Formerly: Director and Vice President, Van Kampen Advisors Inc.; Director, Vice President, Secretary and General Counsel, Van Kampen Investor Services Inc.; Director, Invesco Distributors, Inc. (formerly known as Invesco Aim Distributors, Inc.); Director, Senior Vice President, General Counsel and Secretary, Invesco Aim Advisers, Inc. and Van Kampen Investments Inc.; Director, Vice President and Secretary, Fund Management Company; Director, Senior Vice President, Secretary, General Counsel and Vice President, Invesco Aim Capital Management, Inc.; Chief Operating Officer and General Counsel, Liberty Ridge Capital, Inc. (an investment adviser); Vice President and Secretary, PBHG Funds (an investment company) and PBHG Insurance Series Fund (an investment company); Chief Operating Officer, General Counsel and Secretary, Old Mutual Investment Partners (a broker-dealer); General Counsel and Secretary, Old Mutual Fund Services (an administrator) and Old Mutual Shareholder Services (a shareholder servicing center); Executive Vice President, General Counsel and Secretary, Old Mutual Capital, Inc. (an investment adviser); and Vice President and Secretary, Old Mutual Advisors Funds (an investment company) | N/A | N/A | ||||
| Karen Dunn Kelley — 1960 Vice President | 2003 | Head of Invesco’s World Wide Fixed Income and Cash Management Group; Director, Co-President, Co-Chief Executive Officer, and Co-Chairman, Invesco Advisers, Inc. (formerly known as Invesco Institutional (N.A.), Inc.) (registered investment adviser); Chairman, Invesco Senior Secured Management, Inc.; Senior Vice President, Invesco Management Group, Inc. (formerly known as Invesco Aim Management Group, Inc.); Executive Vice President, Invesco Distributors, Inc. (formerly known as Invesco Aim Distributors, Inc.); Director, Invesco Mortgage Capital Inc., and Invesco Management Company Limited; Director and President, INVESCO Asset Management (Bermuda) Ltd., Vice President, The Invesco Funds (other than AIM Treasurer’s Series Trust (Invesco Treasurer’s Series Trust) and Short-Term Investments Trust); and President and Principal Executive Officer, The Invesco Funds (AIM Treasurer’s Series Trust (Invesco Treasurer’s Series Trust) and Short-Term Investments Trust only)
Formerly: Director, INVESCO Global Asset Management Limited and INVESCO Management S.A.; Senior Vice President, Van Kampen Investments Inc. and Invesco Advisers, Inc. (formerly known as Invesco Institutional (N.A.), Inc.) (registered investment adviser); Vice President, Invesco Advisers, Inc. (formerly known as Invesco Institutional (N.A.), Inc.); Director of Cash Management and Senior Vice President, Invesco Advisers, Inc. and Invesco Aim Capital Management, Inc.; President and Principal Executive Officer, Tax-Free Investments Trust; Director and President, Fund Management Company; Chief Cash Management Officer, Director of Cash Management, Senior Vice President, and Managing Director, Invesco Aim Capital Management, Inc.; Director of Cash Management, Senior Vice President, and Vice President, Invesco Advisers, Inc. and The Invesco Funds (AIM Treasurer’s Series Trust (Invesco Treasurer’s Series Trust), Short-Term Investments Trust and Tax-Free Investments Trust only) | N/A | N/A | ||||
T-3 Invesco California Tax-Free Income Fund
Trustees and Officers—(continued)
Name, Year of Birth and Position(s) Held with the Trust | Trustee and/ or Officer Since | Principal Occupation(s) During Past 5 Years | Number of Funds in Fund Complex Overseen by Trustee | Other Directorship(s) Held by Trustee During Past 5 Years | ||||
| Other Officers—(continued) | ||||||||
| Sheri Morris — 1964 Vice President, Treasurer and Principal Financial Officer | 2003 | Vice President, Treasurer and Principal Financial Officer, The Invesco Funds; Vice President, Invesco Advisers, Inc. (formerly known as Invesco Institutional (N.A.), Inc.) (registered investment adviser); and Vice President, PowerShares Exchange-Traded Fund Trust, PowerShares Exchange-Traded Fund Trust II, PowerShares India Exchange-Traded Fund Trust and PowerShares Actively Managed Exchange-Traded Fund Trust
Formerly: Vice President, Invesco Aim Advisers, Inc., Invesco Aim Capital Management, Inc. and Invesco Aim Private Asset Management, Inc.; Assistant Vice President and Assistant Treasurer, The Invesco Funds and Assistant Vice President, Invesco Advisers, Inc., Invesco Aim Capital Management, Inc. and Invesco Aim Private Asset Management, Inc.; and Treasurer, PowerShares Exchange-Traded Fund Trust, PowerShares Exchange-Traded Fund Trust II, PowerShares India Exchange-Traded Fund Trust and PowerShares Actively Managed Exchange-Traded Fund Trust | N/A | N/A | ||||
Crissie M. Wisdom — 1969 Anti-Money Laundering Compliance Officer | 2013 | Anti-Money Laundering Compliance Officer, Invesco Advisers, Inc. (formerly known as Invesco Institutional (N.A.), Inc.) (registered investment adviser), Invesco Capital Markets, Inc. (formerly known as Van Kampen Funds Inc.), Invesco Distributors, Inc., Invesco Investment Services, Inc., Invesco Management Group, Inc., Van Kampen Exchange Corp., The Invesco Funds, Invesco Funds (Chicago), and PowerShares Exchange-Traded Fund Trust, PowerShares Exchange-Traded Fund Trust II, PowerShares India Exchange-Traded Fund Trust, and PowerShares Actively Managed Exchange-Traded Fund Trust; and Fraud Prevention Manager and Controls and Risk Analysis Manager for Invesco Investment Services, Inc. | N/A | N/A | ||||
| Todd L. Spillane — 1958 Chief Compliance Officer | 2006 | Senior Vice President, Invesco Management Group, Inc. (formerly known as Invesco Aim Management Group, Inc.) and Van Kampen Exchange Corp.; Senior Vice President and Chief Compliance Officer, Invesco Advisers, Inc. (registered investment adviser) (formerly known as Invesco Institutional (N.A.), Inc.); Chief Compliance Officer, The Invesco Funds; Vice President, Invesco Distributors, Inc. (formerly known as Invesco Aim Distributors, Inc.) and Invesco Investment Services, Inc. (formerly known as Invesco Aim Investment Services, Inc.)
Formerly: Chief Compliance Officer, Invesco Funds (Chicago); Senior Vice President, Van Kampen Investments Inc.; Senior Vice President and Chief Compliance Officer, Invesco Aim Advisers, Inc. and Invesco Aim Capital Management, Inc.; Chief Compliance Officer, INVESCO Private Capital Investments, Inc. (holding company), Invesco Private Capital, Inc. (registered investment adviser), Invesco Global Asset Management (N.A.), Inc., Invesco Senior Secured Management, Inc. (registered investment adviser), Van Kampen Investor Services Inc., PowerShares Exchange-Traded Fund Trust, PowerShares Exchange-Traded Fund Trust II, PowerShares India Exchange-Traded Fund Trust and PowerShares Actively Managed Exchange-Traded Fund Trust; and Vice President, Invesco Aim Capital Management, Inc. and Fund Management Company | N/A | N/A |
The Statement of Additional Information of the Trust includes additional information about the Fund’s Trustees and is available upon request, without charge, by calling 1.800.959.4246. Please refer to the Fund’s prospectus for information on the Fund’s sub-advisers.
Office of the Fund 11 Greenway Plaza, Suite 1000 Houston, TX 77046-1173 | Investment Adviser Invesco Advisers, Inc. 1555 Peachtree Street, N.E. Atlanta, GA 30309 | Distributor Invesco Distributors, Inc. 11 Greenway Plaza, Suite 1000 Houston, TX 77046-1173 | Auditors PricewaterhouseCoopers LLP 1201 Louisiana Street, Suite 2900 Houston, TX 77002-5678 | |||
Counsel to the Fund Stradley Ronon Stevens & Young, LLP 2005 Market Street, Suite 2600 Philadelphia, PA 19103-7018 | Counsel to the Independent Trustees Goodwin Procter LLP 901 New York Avenue, N.W. Washington, D.C. 20001 | Transfer Agent Invesco Investment Services, Inc. 11 Greenway Plaza, Suite 1000 Houston, TX 77046-1173 | Custodian State Street Bank and Trust Company 225 Franklin Street Boston, MA 02110-2801 | |||
T-4 Invesco California Tax-Free Income Fund

Invesco mailing information
Send general correspondence to Invesco Investment Services, Inc., P.O. Box 219078, Kansas City, MO 64121-9078.
Invesco privacy policy
You share personal and financial information with us that is necessary for your transactions and your account records. We take very seriously the obligation to keep that information confidential and private.
Invesco collects nonpublic personal information about you from account applications or other forms you complete and from your transactions with us or our affiliates. We do not disclose information about you or our former customers to service providers or other third parties except to the extent necessary to service your account and in other limited circumstances as permitted by law. For example, we use this information to facilitate the delivery of transaction confirmations, financial reports, prospectuses and tax forms.
Even within Invesco, only people involved in the servicing of your accounts and compliance monitoring have access to your information. To ensure the highest level of confidentiality and security, Invesco maintains physical, electronic and procedural safeguards that meet or exceed federal standards. Special measures, such as data encryption and authentication, apply to your communications with us on our website. More detail is available to you at invesco.com/privacy.
Important notice regarding delivery of security holder documents
To reduce Fund expenses, only one copy of most shareholder documents may be mailed to shareholders with multiple accounts at the same address (Householding). Mailing of your shareholder documents may be householded indefinitely unless you instruct us otherwise. If you do not want the mailing of these documents to be combined with those for other members of your household, please contact Invesco Investment Services, Inc. at 800 959 4246 or contact your financial institution. We will begin sending you individual copies for each account within 30 days after receiving your request.
Fund holdings and proxy voting information
The Fund provides a complete list of its holdings four times in each fiscal year, at the quarter ends. For the second and fourth quarters, the lists appear in the Fund’s semiannual and annual reports to shareholders. For the first and third quarters, the Fund files the lists with the Securities and Exchange Commission (SEC) on Form N-Q. The most recent list of portfolio holdings is available at invesco.com/completeqtrholdings. Shareholders can also look up the Fund’s Forms N-Q on the SEC website at sec.gov. Copies of the Fund’s Forms N-Q may be reviewed and copied at the SEC Public Reference Room in Washington, D.C. You can obtain information on the operation of the Public Reference Room, including information about duplicating fee charges, by calling 202 551 8090 or 800 732 0330, or by electronic request at the following email address: publicinfo@sec.gov. The SEC file numbers for the Fund are shown below.
A description of the policies and procedures that the Fund uses to determine how to vote proxies relating to portfolio securities is available without charge, upon request, from our Client Services department at 800 959 4246 or at invesco.com/proxyguidelines. The information is also available on the SEC website, sec.gov.
Information regarding how the Fund voted proxies related to its portfolio securities during the most recent 12-month period ended June 30 is available at invesco.com/proxysearch. The information is also available on the SEC website, sec.gov.
| Invesco Advisers, Inc. is an investment adviser; it provides investment advisory services to individual and institutional clients and does not sell securities. Invesco Distributors, Inc. is the US distributor for Invesco Ltd.’s retail mutual funds, exchange-traded funds and institutional money market funds. Both are wholly owned, indirect subsidiaries of Invesco Ltd. |  | |
| SEC file numbers: 811-09913 and 333-36074 MS-CTFI-AR-1 Invesco Distributors, Inc. | ||

Letters to Shareholders
Phillip Taylor | Dear Shareholders: Enclosed in this annual report, you’ll find information about your Fund and the factors that affected its performance during the reporting period. Inside, you’ll also find a discussion from your portfolio managers about how they managed your Fund, as well as performance data for your Fund, a complete list of your Fund’s investments as of the close of the reporting period and other important information. I hope you find this report of interest. During the reporting period covered by this report, major US equity indexes made multiyear or even all-time highs.1 Economic data were generally positive; housing and consumer spending data were particularly encouraging. Nonetheless, economic uncertainty and concern about continuing political and budget gridlock in Washington persisted. The US Federal Reserve’s deliberate vagueness about when, and to what degree, it might begin to curtail its extraordinarily accommodative monetary policies – together with uncertainty about | ||||||||

who will next lead the central bank – affected fixed income and equity markets alike. Most developed, non-US stock markets remained positive for the first half of 2013, despite a difficult second quarter.
Periods of market volatility and economic uncertainty can weaken the will of even the most resolute investor. That’s why Invesco believes it’s often helpful to work with a skilled and trusted financial adviser who can emphasize the importance of adhering to an investment plan designed to achieve long-term goals rather than being sidetracked by short-term uncertainty that can result in inaction. A financial adviser who is familiar with your individual financial situation, investment goals and risk tolerance can be an invaluable partner as you work toward your financial goals. He or she can provide insight and perspective when markets are volatile; encouragement and reassurance when times are uncertain; and advice and guidance when your financial situation or investment goals change.
Our website, invesco.com/us, is another source of timely insight and information for investors. On the website, you’ll find fund-specific as well as more general information from many of Invesco’s investment professionals. You’ll find in-depth articles, video clips and audio commentaries – and, of course, you also can access information about your Invesco account whenever it’s convenient for you.
What we mean by Intentional Investing
At Invesco, all of our people and all of our resources are dedicated to helping investors achieve their financial objectives. It’s a philosophy we call Intentional Investing, and it guides the way we:
| n | Manage investments - Our dedicated investment professionals search the world for the best opportunities, and each investment team follows a clear, disciplined process to build portfolios and mitigate risk. |
| n | Provide choices - We offer multiple investment strategies, allowing you and your financial adviser to build a portfolio that’s purpose-built for your needs. |
| n | Connect with you - We’re committed to giving you the expert insights you need to make informed investing decisions, and we are well-equipped to provide high-quality support for investors and advisers. |
At Invesco, we believe in putting investors first. That’s why investment management is all we do. Our sole focus on managing your money allows you and your financial adviser to build a portfolio of Invesco funds appropriate for your investment needs and goals today and when your circumstances change.
Have questions?
For questions about your account, feel free to contact an Invesco client services representative at 800 959 4246. For Invesco-related questions or comments, please email me directly at phil@invesco.com.
All of us at Invesco look forward to serving your investment management needs for many years to come. Thank you for investing with us.
Sincerely,

Philip Taylor
Senior Managing Director, Invesco Ltd.
| 1 | Source: Reuters |
2 Invesco Core Plus Bond Fund
Bruce Crockett | Dear Fellow Shareholders: The Invesco Funds Board has worked on a variety of issues over the last several months, and I’d like to take this opportunity to discuss two that affect you and our fellow fund shareholders. The first issue on which your Board has been working is our annual review of the funds’ advisory and sub-advisory contracts with Invesco Advisers and its affiliates. This annual review, which is required by the Investment Company Act of 1940, focuses on the nature and quality of the services Invesco provides as adviser to the Invesco Funds and the reasonableness of the fees that it charges for those services. Each year, we spend months reviewing detailed information that we request from Invesco that allows us to evaluate its services and fees. We also use information from many independent sources, including materials provided by the independent Senior Officer of the Invesco Funds, who reports directly to the independent |

Trustees on the Board. Additionally, we meet with independent legal counsel and review performance and fee data prepared by Lipper Inc., an independent, third-party firm widely recognized as a leader in its field.
I’m pleased to report that the Board determined in June that renewing the investment advisory agreement and the sub-advisory contracts with Invesco Advisers and its affiliates would serve the best interests of each fund and its shareholders.
The second area of focus to highlight is the Board’s efforts to ensure that we provide a lineup of funds that allow financial advisers to build portfolios that meet shareholders’ changing financial needs and goals. Today, more and more investors are reaching, or approaching, retirement. But interest rates remain low, making it difficult for many investors to generate the income they need, or will soon need, in their retirement years.
The members of your Board think about these things, too, and we’ve worked with Invesco Advisers to provide more income-generating options in the Invesco Funds lineup to help shareholders potentially meet their income needs. Your Board recently approved changes to three existing equity mutual funds, increasing their focus on generating income while also seeking to provide long-term growth of capital.
As a result of these changes, the funds and their respective management teams now have more flexibility to invest in the types of securities that could meet investors’ growing need for income generation, and in some cases, also help investors diversify their sources of income. These equity funds complement an array of fixed-income, asset allocation and alternative investment options in the Invesco Funds lineup designed to accommodate a variety of risk tolerances.
Be assured that your Board will continue working on behalf of fund shareholders, keeping your needs and interests uppermost in our minds.
As always, please contact me at bruce@brucecrockett.com with any questions or concerns you may have. On behalf of the Board, we look forward to continuing to represent your interests and serving your needs.
Sincerely,

Bruce L. Crockett
Independent Chair
Invesco Funds Board of Trustees
3 Invesco Core Plus Bond Fund
Management’s Discussion of Fund Performance
Performance summary
For the fiscal year ended August 31, 2013, Invesco Core Plus Bond Fund, at net asset value, generally performed in line with its broad market/style-specific index. Sector and security selection were the major contributors to performance for the reporting period.
Your Fund’s long-term performance appears later in this report.
Fund vs. Indexes
Total returns, 8/31/12 to 8/31/13, at net asset value (NAV). Performance shown does not include applicable contingent deferred sales charges (CDSC) or front-end sales charges, which would have reduced performance.
| Class A Shares | -1.92 | % | |||
| Class B Shares | -2.66 | ||||
| Class C Shares | -2.56 | ||||
| Class R Shares | -2.16 | ||||
| Class Y Shares | -1.58 | ||||
| Class R5 Shares | -1.58 | ||||
| Class R6 Shares* | -1.60 | ||||
| Barclays U.S. Aggregate Index‚(Broad Market/Style-Specific Index) | -2.47 | ||||
| Lipper Intermediate Investment Grade Debt Funds Indexn(Peer Group Index) | -1.48 |
Source(s): ‚Invesco, Barclays via FactSet Research Systems Inc.; nLipper Inc.
| * | Share class incepted during the reporting period. See page 7 for a detailed explanation of Fund performance. |
How we invest
The Fund invests primarily in investment-grade fixed income securities generally represented by the Barclays U.S. Aggregate Index (the Fund’s broad market/ style-specific index) which includes corporate bonds, US Treasury and agency securities, mortgage-backed securities (MBS) and asset-backed securities (ABS). We seek to maintain a dollar-weighted average portfolio maturity of between three and 10 years. The Fund may invest up to 30% of its total assets in foreign debt securities, up to 20% in high yield debt securities (“junk bonds”), up to 30% in developing markets debt securities and up to 20% in securities denominated in currencies other than the US dollar.
The Fund invests from time to time in derivative instruments such as futures contracts and swap
| Portfolio Composition | |||||
| By security type | |||||
| U.S. Dollar Denominated Bonds and Notes | 58.5 | % | |||
| U.S. Government Sponsored Mortgage-Backed Securities | 25.2 | ||||
| Asset-Backed Securities | 19.2 | ||||
| U.S. Treasury Securities | 7.3 | ||||
| Preferred Stocks | 1.8 | ||||
| Non-U.S. Dollar Denominated Bonds & Notes | 0.4 | ||||
| Municipal Obligations | 0.4 | ||||
| Common Stocks & Other Equity Interests | 0.0 | ||||
| Money Market Funds Plus Other Assets Less Liabilities | -12.8 | ||||
agreements, including interest rate futures and credit derivatives, including credit default swaps (CDS) and/ or credit default swap indexes (CDX). It also can engage in mortgage dollar roll transactions, a form of repurchase agreement activity in the to-be-announced (TBA) market for agency MBS. These strategies are implemented within the risk profile of the guidelines set forth in the Fund’s prospectus.
We believe dynamic and complex fixed income markets may create opportunities for investors that are best captured by specialist decision makers interconnected as a global team. We use this philosophy in an effort to generate a total return consisting of current income and capital appreciation.
Portfolio construction begins with a well-defined Fund design that establishes the target investment
| Top 5 Fixed Income Issuers | |||||
1. Federal Home Loan Mortgage Corp. | 12.0 | % | |||
2. Federal National Mortgage Association | 12.0 | ||||
3. U.S. Treasury Notes | 5.0 | ||||
4. Sequoia Mortgage Trust | 2.0 | ||||
5. U.S. Treasury Bonds | 1.9 | ||||
| Total Net Assets | $567.9 million | ||||
| Total Number of Holdings* | 957 | ||||
The Fund’s holdings are subject to change, and there is no assurance that the Fund will continue to hold any particular security.
| * | Excluding money market fund holdings. |
vehicles for generating the desired “alpha” (the extra return above a specific benchmark) as well as the risk parameters for the Fund. Investment vehicles are evaluated for liquidity and risk versus relative value.
Our security selection is supported by a team of specialists. Team members conduct top-down macroeconomic analysis as well as bottom-up analysis on individual securities. Recommendations are communicated to portfolio managers through proprietary technology that allows all investment professionals to communicate in a timely manner.
Sell decisions are based on:
| n | A conscious decision to alter the Fund’s macroeconomic risk exposure (for example, duration, yield curve positioning and sector exposure). |
| n | The need to limit or reduce exposure to a particular security or issuer. |
| n | Degradation of an issuer’s credit quality. |
| n | General liquidity needs of the Fund. |
Market conditions and your Fund
Accommodative central bank policies during the second half of 2012 helped support bond investors’ risk appetites early in the reporting period. The US elections and US “fiscal cliff” situation brought little surprising news and very little negative news of note appeared to weigh on investor psychology. US Treasury yields rose modestly. With short-maturity yields somewhat fixed by US Federal Reserve (the Fed) policy expectations, this increase in yields translated directly into a slightly steeper yield curve which muted otherwise healthy bond market returns. Yield premiums (“credit spreads”) demanded by bond investors for accepting credit risk were driven lower as investors’ appetite for credit risk flourished. In this environment, emerging market debt, high yield corporate bonds and other less interest-rate-sensitive bond sectors were in demand and performed well. Though economic data looked increasingly positive, notable headwinds to US economic growth endured and gross domestic product expectations remained modest.
In May and June, the capital markets began a sell-off following Fed Chairman Ben Bernanke’s comments about reducing the Fed’s program of quantitative easing (QE). Under the program, the Fed has purchased $85 billion1 of US Treasuries and mortgage backed securities each month since December 2012 to increase liquidity and ensure low long-term interest rates in an effort to spur the housing and real estate markets. Few asset classes were immune from this broad sell-off,
4 Invesco Core Plus Bond Fund
which caused bonds, stocks and commodities to decline. The markets stabilized in mid-summer; however, August brought more selling in the equity and bond markets and yields continued to rise.
The volatility experienced during the second half of the reporting period caused most taxable US bond market sectors to turn negative for the full fiscal year, with the notable exception of high yield corporate bonds.
Given this economic and market environment, the Fund generated negative returns for the reporting period, as did its broad market/style-specific benchmark, the Barclays U.S. Aggregate Index. Sustained overweight risk weightings across various non-government bond sectors and security selection across the portfolio contributed to the Fund’s performance.
Sector allocation decisions emphasized non-government market exposure throughout the fiscal year. Despite the bond market volatility during the second half of the reporting period, the Fund’s sustained overweight positions in financials and commercial mortgage-backed securities (CMBS) developed into principal drivers of our performance, along with our strategic out-of-index “plus” sector allocation to high yield securities. Conversely, the Fund’s short average life collateralized mortgage obligations and marginal holdings in high quality credit card and auto loan ABS were peripheral drags on performance versus the benchmark.
Security selection overall contributed to the Fund’s relative performance for the reporting period. This was particularly true in the financials, consumer cyclical, telecommunications, media and technology sub-sectors.
The Fund also benefited from incremental income earned by engaging in mortgage dollar roll activity, which involves the Fund selling an MBS to a financial institution with an agreement to repurchase a substantially similar security at an agreed upon price and date. Excess portfolio cash resulting from the use of this strategy is subsequently invested in short-term instruments to generate additional return for the Fund.
The Fund also may use active duration and yield curve positioning for risk management and for generating alpha versus its broad market/style-specific benchmark. Duration measures a portfolio’s price sensitivity to interest rate changes. Yield curve positioning refers to actively emphasizing particular points (maturities) along the yield curve with favorable risk/return expectations. The contribution
to Fund performance from duration and yield curve positioning versus the benchmark was mixed over the reporting period but, overall, detracted from relative return. We maintained the portfolio’s duration slightly longer than that of its broad market/style-specific benchmark on average during a period of volatile interest rates, and the timing of changes and the degree of variance from the benchmark during the reporting period detracted from relative returns. Buying and selling US Treasury futures contracts was an important tool we used for the management of interest rate risk and to maintain our targeted portfolio duration.
Part of our strategy to manage credit and currency risk in the portfolio during the reporting period entailed buying and selling credit protection through credit derivatives and hedging currency risk associated with non-US dollar-denominated bonds. We hedged credit market risk by purchasing protection through CDX and used CDS for select banking sector names. The currency hedging activity was carried out on an as-needed basis for select non-US dollar-denominated securities and was effective in managing unwanted currency risk of non-US dollar-denominated holdings.
Thank you for investing in Invesco Core Plus Bond Fund and for sharing our long-term investment horizon.
| 1 | Source: US Federal Reserve |
The views and opinions expressed in management’s discussion of Fund performance are those of Invesco Advisers, Inc. These views and opinions are subject to change at any time based on factors such as market and economic conditions. These views and opinions may not be relied upon as investment advice or recommendations, or as an offer for a particular security. The information is not a complete analysis of every aspect of any market, country, industry, security or the Fund. Statements of fact are from sources considered reliable, but Invesco Advisers, Inc. makes no representation or warranty as to their completeness or accuracy. Although historical performance is no guarantee of future results, these insights may help you understand our investment management philosophy.
See important Fund and, if applicable, index disclosures later in this report.
Chuck Burge
Portfolio manager, is manager of Invesco Core Plus Bond Fund. He joined Invesco in 2002. Mr. Burge earned a BS in economics from Texas A&M University and an MBA in finance and accounting from Rice University.
Darren Hughes
Chartered Financial Analyst, portfolio manager, is manager of Invesco Core Plus Bond Fund. He joined Invesco in 1992. Mr. Hughes earned a BBA in finance and economics from Baylor University.
Michael Hyman
Portfolio manager, is manager of Invesco Core Plus Bond Fund. He began managing the Fund in 2013. Mr. Hyman earned a BSE in finance from Pennsylvania State University and an MBA from the Stern School of Business at New York University.
Scott Roberts
Chartered Financial Analyst, portfolio manager, is manager of Invesco Core Plus Bond Fund. He joined Invesco in 2000. Mr. Roberts earned a BBA in finance from the University of Houston.
Robert Waldner
Chartered Financial Analyst, portfolio manager, is manager of Invesco Core Plus Bond Fund. He joined Invesco in 2013. Mr. Waldner earned a BSE degree in civil engineering from Princeton University.
Effective September 18, 2013, after the close of the reporting period, Eric Lindenbaum left the management team and Jack Deino and Joseph Portera joined the management team.
5 Invesco Core Plus Bond Fund
Your Fund’s Long-Term Performance
Results of a $10,000 Investment – Oldest Share Class(es) since Inception
Fund data from 6/3/09; index data from 5/31/09
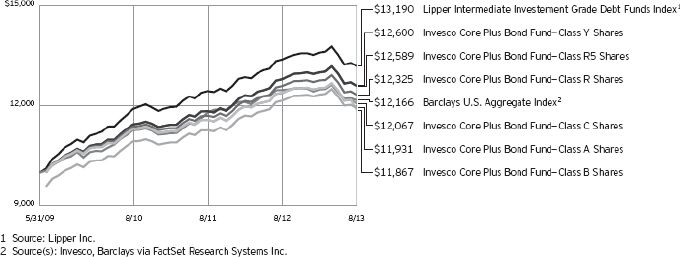
Past performance cannot guarantee comparable future results.
The data shown in the chart include reinvested distributions, applicable sales charges and Fund expenses including management fees. Results for Class B shares are calculated as if a hypothetical
shareholder had liquidated his entire investment in the Fund at the close of the reporting period and paid the contingent deferred sales charges, if applicable. Index results include reinvested dividends, but they do not reflect sales charges. Performance of the peer group,
if applicable, reflects fund expenses and management fees; performance of a market index does not. Performance shown in the chart and table(s) does not reflect deduction of taxes a shareholder would pay on Fund distributions or sale of Fund shares.
continued from page 8
tend to be more volatile. Securities may be prepaid at a price less than the original purchase value. An unexpectedly high rate of defaults on the mortgages held by a mortgage pool may adversely affect the value of mortgage-backed securities and could result in losses to the Fund. The risk of such defaults is generally higher in the case of mortgage pools that include subprime mortgages. Subprime mortgages refer to loans made to borrowers with weakened credit histories or with lower capacity to make timely payments on their mortgages.
| n | Non-diversification risk. The Fund is non-diversified and can invest a greater portion of its assets in a small number of issuers or a single issuer. A change in the value of the issuer could affect the value of the Fund more than if it was a diversified fund. |
| n | Reinvestment risk. Reinvestment risk is the risk that a bond’s cash flows (coupon income and principal repayment) will be reinvested at an interest rate below that on the original bond. |
| n | Synthetic securities risk. Fluctuations in the values of synthetic securities may not correlate perfectly with the instruments |
they are designed to replicate. Synthetic securities may be subject to interest rate changes, market price fluctuations, counterparty risk and liquidity risk. |
| n | US government obligations risk. The Fund may invest in obligations issued by US government agencies and instrumentalities that may receive varying levels of support from the government, which could affect the Fund’s ability to recover should they default. |
About indexes used in this report
| n | The Barclays U.S. Aggregate Index is an unmanaged index considered representative of the US investment-grade, fixed-rate bond market. |
| n | The Lipper Intermediate Investment Grade Debt Funds Index is an unmanaged index considered representative of intermediate investment-grade debt funds tracked by Lipper. |
| n | The Fund is not managed to track the performance of any particular index, including the index(es) described here, and consequently, the performance of the Fund may deviate significantly from the performance of the index(es). |
| n | A direct investment cannot be made in an index. Unless otherwise indicated, |
index results include reinvested dividends, and they do not reflect sales charges. Performance of the peer group, if applicable, reflects fund expenses; performance of a market index does not. |
Other information
| n | The returns shown in management’s discussion of Fund performance are based on net asset values calculated for shareholder transactions. Generally accepted accounting principles require adjustments to be made to the net assets of the Fund at period end for financial reporting purposes, and as such, the net asset values for shareholder transactions and the returns based on those net asset values may differ from the net asset values and returns reported in the Financial Highlights. |
| n | Industry classifications used in this report are generally according to the Global Industry Classification Standard, which was developed by and is the exclusive property and a service mark of MSCI Inc. and Standard & Poor’s. |
6 Invesco Core Plus Bond Fund
| Average Annual Total Returns | |||||
| As of 8/31/13, including maximum applicable sales charges | |||||
| Class A Shares | |||||
| Inception (6/3/09) | 4.25 | % | |||
1 Year | -6.12 | ||||
| Class B Shares | |||||
| Inception (6/3/09) | 4.12 | % | |||
1 Year | -7.41 | ||||
| Class C Shares | |||||
| Inception (6/3/09) | 4.53 | % | |||
1 Year | -3.52 | ||||
| Class R Shares | |||||
| Inception (6/3/09) | 5.05 | % | |||
1 Year | -2.16 | ||||
| Class Y Shares | |||||
| Inception (6/3/09) | 5.60 | % | |||
1 Year | -1.58 | ||||
| Class R5 Shares | |||||
| Inception (6/3/09) | 5.57 | % | |||
1 Year | -1.58 | ||||
| Class R6 Shares | |||||
| Inception | 5.39 | % | |||
1 Year | -1.60 | ||||
Class R6 shares incepted on September 24, 2012. Performance shown prior to that date is that of Class A shares and includes the 12b-1 fees applicable to Class A shares. Class A share performance reflects any applicable fee waivers or expense reimbursements.
The performance data quoted represent past performance and cannot guarantee comparable future results; current performance may be lower or higher. Please visit invesco.com/performance for the most recent month-end performance. Performance figures reflect reinvested distributions, changes in net asset value and the effect of the maximum sales charge unless otherwise stated. Investment return and principal value will fluctuate so that you may have a gain or loss when you sell shares.
The net annual Fund operating expense ratio set forth in the most recent Fund prospectus as of the date of this report for Class A, Class B, Class C, Class R, Class Y, Class R5 and Class R6 shares was 0.75%, 1.50% 1.50%, 1.00%, 0.50%, 0.50% and 0.50%, respectively.1 The total annual Fund operating expense ratio set forth in the most recent Fund prospectus as
| Average Annual Total Returns | |||||
| As of 6/30/13, the most recent calendar quarter end, including maximum applicable sales charges | |||||
| Class A Shares | |||||
| Inception (6/3/09) | 4.61 | % | |||
1 Year | -3.36 | ||||
| Class B Shares | |||||
| Inception (6/3/09) | 4.51 | % | |||
1 Year | -4.70 | ||||
| Class C Shares | |||||
| Inception (6/3/09) | 4.91 | % | |||
1 Year | -0.88 | ||||
| Class R Shares | |||||
| Inception (6/3/09) | 5.44 | % | |||
1 Year | 0.59 | ||||
| Class Y Shares | |||||
| Inception (6/3/09) | 5.99 | % | |||
1 Year | 1.10 | ||||
| Class R5 Shares | |||||
| Inception (6/3/09) | 5.96 | % | |||
1 Year | 1.10 | ||||
| Class R6 Shares | |||||
| Inception | 5.77 | % | |||
1 Year | 1.13 | ||||
of the date of this report for Class A, Class B, Class C, Class R, Class Y, Class R5 and Class R6 shares was 1.01%, 1.76%, 1.76%, 1.26%, 0.76%, 0.56% and 0.56%, respectively. The expense ratios presented above may vary from the expense ratios presented in other sections of this report that are based on expenses incurred during the period covered by this report.
Class A share performance reflects the maximum 4.25% sales charge, and Class B and Class C share performance reflects the applicable contingent deferred sales charge (CDSC) for the period involved. The CDSC on Class B shares declines from 5% beginning at the time of purchase to 0% at the beginning of the seventh year. The CDSC on Class C shares is 1% for the first year after purchase. Class R, Class Y, Class R5 and Class R6 shares do not have a front-end sales charge or a CDSC; therefore, performance is at net asset value.
The performance of the Fund’s share classes will differ primarily due to different sales charge structures and class expenses.
Had the adviser not waived fees and/or reimbursed expenses on Class A, Class B, Class C, Class R and Class Y shares, performance would have been lower. Had the adviser not waived fees and/or reimbursed expenses on Class R5 shares in the past, performance would have been lower.
| 1 | Total annual Fund operating expenses after any contractual fee waivers and/or expense reimbursements by the adviser in effect through at least December 31, 2013. See current prospectus for more information. |
7 Invesco Core Plus Bond Fund
Invesco Core Plus Bond Fund’s investment objective is total return, comprised of current income and capital appreciation.
| n | Unless otherwise stated, information presented in this report is as of August 31, 2013, and is based on total net assets. |
| n | Unless otherwise noted, all data provided by Invesco. |
| n | To access your Fund’s reports/prospectus, visit invesco.com/fundreports. |
About share classes
| n | Class B shares may not be purchased for new or additional investments. Please see the prospectus for more information. |
| n | Class R shares are generally available only to employer sponsored retirement and benefit plans. Please see the prospectus for more information. |
| n | Class Y shares are available only to certain investors. Please see the prospectus for more information. |
| n | Class R5 shares and Class R6 shares are primarily intended for employer sponsored retirement and benefit plans that meet certain standards and for institutional investors. On September 24, 2012, Institutional Class shares were renamed Class R5 shares. Please see the prospectus for more information. |
Principal risks of investing in the Fund
| n | Active trading risk. The Fund engages in frequent trading of portfolio securities. Active trading results in added expenses and may result in a lower return and increased tax liability. |
| n | Counterparty risk. Counterparty risk is the risk that the other party to the contract will not fulfill its contractual obligations, which may cause losses or additional costs to the Fund. |
| n | Credit risk. The issuer of instruments in which the Fund invests may be unable to meet interest and/or principal payments, thereby causing its instruments to decrease in value and lowering the issuer’s credit rating. |
| n | Currency/exchange rate risk. The dollar value of the Fund’s foreign investments will be affected by changes in the exchange rates between the dollar and the currencies in which those investments are traded. |
| n | Derivatives risk. The performance of derivative instruments is tied to the performance of an underlying currency, security, index, commodity or other instrument. In addition to risks relating to their underlying instruments, the use of derivatives may |
include other, possibly greater, risks. Derivatives involve costs, may be volatile, and may involve a small initial investment relative to the risk assumed. Risks associated with the use of derivatives may include counterparty, leverage, correlation, liquidity, tax, market, interest rate and management risks. Derivatives may also be more difficult to purchase, sell or value than other investments. The Fund may lose more than the cash amount invested on investments in derivatives.
Investors should bear in mind that, while the Fund intends to use derivative strategies, it is not obligated to actively engage in these transactions, generally or in any particular kind of derivative, if the adviser elects not to do so due to availability, cost, market conditions or other factors.
| n | Developing/emerging markets securities risk. The prices of securities issued by foreign companies and governments located in developing/emerging markets countries may be affected more negatively by inflation, devaluation of their currencies, higher transaction costs, delays in settlement, adverse political developments, the introduction of capital controls, withholding taxes, nationalization of private assets, expropriation, social unrest, war or lack of timely information than those in developed countries. |
| n | Dollar roll transactions risk. Dollar roll transactions involve the risk that the market value and yield of the securities retained by the Fund may decline below the price of the mortgage-related securities sold by the Fund that it is obligated to repurchase. |
| n | Foreign securities risk. The Fund’s foreign investments may be affected by changes in a foreign country’s exchange rates, political and social instability, changes in economic or taxation policies, difficulties when enforcing obligations, decreased liquidity, and increased volatility. Foreign companies may be subject to less regulation resulting in less publicly available information about the companies. |
| n | High yield bond (junk bond) risk. Junk bonds involve a greater risk of default or price changes due to changes in the credit quality of the issuer. The values of junk bonds fluctuate more than those of high-quality bonds in response to company, political, regulatory or economic developments. Values of junk bonds can decline significantly over short periods of time. |
| n | Interest rate risk. Interest rate risk refers to the risk that bond prices generally fall as interest rates rise; conversely, bond prices generally rise as interest rates fall. Specific bonds differ in their sensitivity to changes in interest rates depending on their individual characteristics, including duration. |
| n | Liquidity risk. The Fund may hold illiquid securities that it is unable to sell at the preferred time or price and could lose its entire investment in such securities. |
| n | Management risk. The investment techniques and risk analysis used by the Fund’s portfolio managers may not produce the desired results. |
| n | Market risk. The prices of and the income generated by the Fund’s securities may decline in response to, among other things, investor sentiment, general economic and market conditions, regional or global instability, and currency and interest rate fluctuations. |
| n | Mortgage- and asset-backed securities risk. The Fund may invest in mortgage- and asset-backed securities that are subject to prepayment or call risk, which is the risk that the borrower’s payments may be received earlier or later than expected due to changes in prepayment rates on underlying loans. Faster prepayments often happen when interest rates are falling. As a result, the Fund may reinvest these early payments at lower interest rates, thereby reducing the Fund’s income. Conversely, when interest rates rise, prepayments may happen more slowly, causing the security to lengthen in duration. Longer duration securities |
continued on page 6
| |||||||
| Fund Nasdaq Symbols | |||||||
| This report must be accompanied or preceded by a currently effective Fund prospectus, which contains more complete information, including sales charges and expenses. Investors should read it carefully before investing. | Class A Shares | ACPSX | |||||
| Class B Shares | CPBBX | ||||||
| Class C Shares | CPCFX | ||||||
| Class R Shares | CPBRX | ||||||
| Class Y Shares | CPBYX | ||||||
| NOT FDIC INSURED | MAY LOSE VALUE | NO BANK GUARANTEE | Class R5 Shares | CPIIX | |||||
| Class R6 Shares | CPBFX | ||||||
8 Invesco Core Plus Bond Fund
Schedule of Investments(a)
August 31, 2013
| Principal Amount | Value | |||||||
U.S. Dollar Denominated Bonds and Notes–58.49% |
| |||||||
| Advertising–0.16% | ||||||||
Omnicom Group Inc., Sr. Unsec. Gtd. Global Notes, 3.63%, 05/01/22 | $ | 550,000 | $ | 530,583 | ||||
WPP Finance (United Kingdom), | 365,000 | 390,275 | ||||||
| 920,858 | ||||||||
| Aerospace & Defense–0.16% | ||||||||
B/E Aerospace Inc., Sr. Unsec. Notes, 5.25%, 04/01/22 | 90,000 | 89,550 | ||||||
Bombardier Inc. (Canada), | ||||||||
Sr. Unsec. Notes, | 115,000 | 112,412 | ||||||
6.13%, 01/15/23(b) | 23,000 | 22,598 | ||||||
7.75%, 03/15/20(b) | 70,000 | 77,700 | ||||||
DigitalGlobe Inc., Sr. Unsec. Gtd. Notes, 5.25%, 02/01/21(b) | 85,000 | 80,112 | ||||||
GenCorp Inc., Sr. Sec. Gtd. Notes, 7.13%, 03/15/21(b) | 177,000 | 186,735 | ||||||
Huntington Ingalls Industries Inc., Sr. Unsec. Gtd. Global Notes, 6.88%, 03/15/18 | 60,000 | 65,025 | ||||||
Kratos Defense & Security Solutions Inc., Sr. Sec. Gtd. Global Notes, 10.00%, 06/01/17 | 99,000 | 107,415 | ||||||
Sequa Corp., Sr. Unsec. Gtd. Notes, 7.00%, 12/15/17(b) | 70,000 | 70,088 | ||||||
TransDigm Inc., | ||||||||
Sr. Unsec. Gtd. Sub. Global Notes, 5.50%, 10/15/20 | 45,000 | 43,875 | ||||||
Sr. Unsec. Gtd. Sub. Notes, 7.50%, 07/15/21(b) | 50,000 | 52,750 | ||||||
| 908,260 | ||||||||
| Agricultural Products–0.32% | ||||||||
Ingredion Inc., | 1,030,000 | 1,009,016 | ||||||
Sr. Unsec. Notes, | 75,000 | 78,060 | ||||||
6.63%, 04/15/37 | 635,000 | 722,984 | ||||||
| 1,810,060 | ||||||||
| Airlines–1.73% | ||||||||
Air Canada Pass Through Trust (Canada), Series 2013-1, Class B, Sec. Pass Through Ctfs., 5.38%, 05/15/21(b) | 35,000 | 33,950 | ||||||
American Airlines Pass Through Trust, Series 2011-1, Class A, Sr. Sec. Pass Through Ctfs., 5.25%, 01/31/21 | 989,077 | 1,044,095 | ||||||
Series 2011-1, Class B, Sec. Pass Through Ctfs., 7.00%, 01/31/18(b) | 322,681 | 333,975 | ||||||
Series 2013-2, Class A, Sr. Sec. Pass Through Ctfs., 4.95%, 01/15/23(b) | 880,000 | 877,800 | ||||||
| Principal Amount | Value | |||||||
| Airlines–(continued) | ||||||||
Continental Airlines Pass Through Trust, | $ | 5,638 | $ | 5,740 | ||||
Series 2009-1, Sec. Pass Through Ctfs., 9.00%, 07/08/16 | 1,131,965 | 1,293,270 | ||||||
Series 2009-2, Class B, Sec. Global Pass Through Ctfs., 9.25%, 05/10/17 | 3,339 | 3,658 | ||||||
Series 2010-1, Class B, Sec. Pass Through Ctfs., 6.00%, 01/12/19 | 22,335 | 22,774 | ||||||
Series 2012-1, Class A, Sec. Pass Through Ctfs., 4.15%, 04/11/24 | 500,000 | 494,062 | ||||||
Series 2012-3, Class C, Sec. Pass Through Ctfs., 6.13%, 04/29/18 | 120,000 | 121,950 | ||||||
Delta Air Lines Pass Through Trust, Series 2009-1, Class A, Sr. Sec. Pass Through Ctfs., 7.75%, 12/17/19 | 457,103 | 531,954 | ||||||
Series 2012-1, Class A, Sr. Sec. Pass Through Ctfs., 4.75%, 05/07/20 | 1,287,330 | 1,365,374 | ||||||
Hawaiian Airlines, | 2,045,000 | 1,885,234 | ||||||
Series 2013-1, Class B, Sr. Sec. Gtd. Pass Through Ctfs., 4.95%, 01/15/22 | 995,000 | 925,350 | ||||||
United Airlines Pass Through Trust, Series 2013-1, Class A, Sr. Sec. Pass Through Ctfs., 4.30%, 08/15/25 | 675,000 | 662,766 | ||||||
United Continental Holdings Inc., Sr. Unsec. Gtd. Notes, 6.38%, 06/01/18 | 145,000 | 146,813 | ||||||
US Airways Pass Through Trust, Series 1998-1, Class C, Sec. Pass Through Ctfs., 6.82%, 01/30/14 | 18,860 | 18,601 | ||||||
Series 2012-1, Class A, Sr. Sec. Pass Through Ctfs., 5.90%, 10/01/24 | 9,982 | 10,500 | ||||||
Series 2012-1, Class B, Sec. Pass Through Ctfs., 8.00%, 10/01/19 | 9,993 | 10,842 | ||||||
Series 2012-1, Class C, Sec. Pass Through Ctfs., 9.13%, 10/01/15 | 9,992 | 10,492 | ||||||
| 9,799,200 | ||||||||
| Alternative Carriers–0.08% | ||||||||
Cogent Communications Group, Inc., Sr. Sec. Gtd. Notes, 8.38%, 02/15/18(b) | 30,000 | 32,925 | ||||||
Level 3 Communications Inc., | 30,000 | 32,025 | ||||||
11.88%, 02/01/19 | 30,000 | 34,425 | ||||||
Level 3 Financing Inc., Sr. Unsec. Gtd. Global Notes, | 60,000 | 60,750 | ||||||
8.13%, 07/01/19 | 110,000 | 116,325 | ||||||
8.63%, 07/15/20 | 15,000 | 16,087 | ||||||
9.38%, 04/01/19 | 160,000 | 175,200 | ||||||
| 467,737 | ||||||||
See accompanying Notes to Financial Statements which are an integral part of the financial statements.
9 Invesco Core Plus Bond Fund
| Principal Amount | Value | |||||||
| Apparel Retail–0.03% | ||||||||
L Brands Inc., | $ | 5,000 | $ | 5,963 | ||||
Sr. Unsec. Gtd. Notes, 6.63%, 04/01/21 | 170,000 | 181,050 | ||||||
| 187,013 | ||||||||
| Apparel, Accessories & Luxury Goods–0.12% | ||||||||
Jones Group Inc./Apparel Group Holdings/Apparel Group USA/Footwear Accessories Retail, Sr. Unsec. Notes, 6.88%, 03/15/19 | 252,000 | 258,300 | ||||||
Levi Strauss & Co., Sr. Unsec. Global Notes, | 151,000 | 161,570 | ||||||
7.63%, 05/15/20 | 100,000 | 108,000 | ||||||
PVH Corp., Sr. Unsec. Global Notes, 4.50%, 12/15/22 | 120,000 | 112,050 | ||||||
William Carter Co. (The), Sr. Unsec. Gtd. Notes, 5.25%, 08/15/21(b) | 16,000 | 16,120 | ||||||
| 656,040 | ||||||||
| Application Software–0.01% | ||||||||
Nuance Communications Inc., Sr. Unsec. Gtd. Notes, 5.38%, 08/15/20(b) | 85,000 | 81,388 | ||||||
| Asset Management & Custody Banks–0.99% | ||||||||
Ashton Woods USA LLC/Ashton Woods Finance Co., Sr. Unsec. Notes, 6.88%, 02/15/21(b) | 120,000 | 119,100 | ||||||
Bank of New York Mellon (The), Series D, Jr. Unsec. Sub. Global Notes, 4.50%(c) | 2,025,000 | 1,812,375 | ||||||
Blackstone Holdings Finance Co. LLC, Sr. Unsec. Gtd. Notes, 6.25%, 08/15/42(b) | 1,070,000 | 1,119,637 | ||||||
Carlyle Holdings II Finance LLC, Sr. Sec. Gtd. Notes, 5.63%, 03/30/43(b) | 1,430,000 | 1,325,825 | ||||||
Prospect Capital Corp., Sr. Unsec. Global Notes, 5.88%, 03/15/23 | 1,280,000 | 1,219,147 | ||||||
| 5,596,084 | ||||||||
| Auto Parts & Equipment–0.05% | ||||||||
Allison Transmission Inc., Sr. Unsec. Gtd. Notes, 7.13%, 05/15/19(b) | 146,000 | 155,490 | ||||||
American Axle & Manufacturing Inc., Sr. Unsec. Gtd. Notes, | 120,000 | 122,700 | ||||||
6.63%, 10/15/22 | 25,000 | 25,688 | ||||||
| 303,878 | ||||||||
| Automobile Manufacturers–1.57% | ||||||||
Chrysler Group LLC/CG Co-Issuer Inc., Sr. Sec. Gtd. Global Notes, 8.00%, 06/15/19 | 200,000 | 218,000 | ||||||
Ford Motor Co., Sr. Unsec. Global Notes, 4.75%, 01/15/43 | 600,000 | 530,609 | ||||||
| Principal Amount | Value | |||||||
| Automobile Manufacturers–(continued) | ||||||||
Ford Motor Credit Co. LLC, Sr. Unsec. Global Notes, | $ | 1,820,000 | $ | 1,776,790 | ||||
Sr. Unsec. Notes, | 2,300,000 | 2,404,791 | ||||||
4.25%, 09/20/22 | 2,700,000 | 2,628,476 | ||||||
Hyundai Capital America (South Korea), Sr. Unsec. Notes, | 1,349,000 | 1,336,475 | ||||||
| 8,895,141 | ||||||||
| Automotive–0.01% | ||||||||
Goodyear Tire & Rubber Co., 6.50%, 03/01/21 | 50,000 | 50,625 | ||||||
| Biotechnology–0.59% | ||||||||
Celgene Corp., Sr. Unsec. Global Notes, 4.00%, 08/15/23 | 3,375,000 | 3,327,639 | ||||||
| Brewers–0.26% | ||||||||
Anheuser-Busch InBev Worldwide Inc. (Belgium), Sr. Unsec. Gtd. Global Notes, 5.38%, 11/15/14 | 125,000 | 132,084 | ||||||
Heineken NV (Netherlands), Sr. Unsec. Notes, 1.40%, 10/01/17(b) | 1,360,000 | 1,325,497 | ||||||
| 1,457,581 | ||||||||
| Broadcasting–0.78% | ||||||||
Clear Channel Worldwide Holdings Inc., Series A, Sr. Unsec. Gtd. Global Notes, 6.50%, 11/15/22 | 15,000 | 14,925 | ||||||
Series A Sr. Unsec. Gtd. Sub. Global Notes, 7.63%, 03/15/20 | 8,000 | 7,960 | ||||||
Series B, Sr. Unsec. Gtd. Global Notes, 6.50%, 11/15/22 | 40,000 | 40,100 | ||||||
Series B Sr. Unsec. Gtd. Sub. Global Notes, 7.63%, 03/15/20 | 185,000 | 186,388 | ||||||
COX Communications Inc., | 1,470,000 | 1,163,009 | ||||||
8.38%, 03/01/39(b) | 1,220,000 | 1,457,392 | ||||||
9.38%, 01/15/19(b) | 25,000 | 31,869 | ||||||
Discovery Communications LLC, Sr. Unsec. Gtd. Global Notes, 6.35%, 06/01/40 | 1,275,000 | 1,407,938 | ||||||
LIN Television Corp., Sr. Unsec. Gtd. Global Notes, 6.38%, 01/15/21 | 105,000 | 105,525 | ||||||
Starz LLC/Starz Finance Corp., Sr. Unsec. Gtd. Global Notes, 5.00%, 09/15/19 | 5,000 | 4,916 | ||||||
| 4,420,022 | ||||||||
| Building Products–0.18% | ||||||||
Builders FirstSource Inc., Sr. Sec. Notes, 7.63%, 06/01/21(b) | 215,000 | 213,925 | ||||||
Gibraltar Industries Inc., Sr. Unsec. Gtd. Sub. Global Notes, 6.25%, 02/01/21 | 180,000 | 182,250 | ||||||
Nortek Inc., Sr. Unsec. Gtd. Global Notes, 8.50%, 04/15/21 | 211,000 | 229,462 | ||||||
10.00%, 12/01/18 | 125,000 | 137,500 | ||||||
See accompanying Notes to Financial Statements which are an integral part of the financial statements.
10 Invesco Core Plus Bond Fund
| Principal Amount | Value | |||||||
| Building Products–(continued) | ||||||||
USG Corp., | $ | 60,000 | $ | 66,300 | ||||
Sr. Unsec. Notes, 9.75%, 01/15/18 | 155,000 | 179,413 | ||||||
| 1,008,850 | ||||||||
| Cable & Satellite–1.32% | ||||||||
British Sky Broadcasting Group PLC (United Kingdom), Sr. Unsec. Gtd. Notes, 9.50%, 11/15/18(b) | 25,000 | 32,380 | ||||||
CCO Holdings LLC/CCO Holdings Capital Corp., Sr. Unsec. Gtd. Notes, 5.25%, 03/15/21(b) | 100,000 | 95,250 | ||||||
Comcast Corp., | 20,000 | 21,578 | ||||||
Sr. Unsec. Gtd. Notes, 6.45%, 03/15/37 | 80,000 | 95,403 | ||||||
DIRECTV Holdings LLC/DIRECTV Financing Co., Inc., Sr. Unsec. Gtd. Global Notes, 2.40%, 03/15/17 | 620,000 | 615,239 | ||||||
DISH DBS Corp., Sr. Unsec. Gtd. Global Notes, | 135,000 | 125,550 | ||||||
5.13%, 05/01/20 | 90,000 | 87,525 | ||||||
5.88%, 07/15/22 | 90,000 | 88,537 | ||||||
Hughes Satellite Systems Corp., | 31,000 | 32,782 | ||||||
Sr. Unsec. Gtd. Global Notes, 7.63%, 06/15/21 | 26,000 | 28,080 | ||||||
Intelsat Jackson Holdings S.A. (Luxembourg), | 30,000 | 32,175 | ||||||
7.50%, 04/01/21 | 115,000 | 124,775 | ||||||
Sr. Unsec. Gtd. Notes, 6.63%, 12/15/22(b) | 190,000 | 190,475 | ||||||
Intelsat Luxembourg S.A. (Luxembourg), Sr. Unsec. Gtd. Notes, 7.75%, 06/01/21(b) | 70,000 | 72,450 | ||||||
8.13%, 06/01/23(b) | 60,000 | 63,000 | ||||||
Nara Cable Funding Ltd. (Spain), Sr. Sec. Gtd. Notes, 8.88%, 12/01/18(b) | 200,000 | 206,500 | ||||||
NBC Universal Media LLC, Sr. Unsec. Gtd. Global Notes, | 775,000 | 782,847 | ||||||
5.15%, 04/30/20 | 350,000 | 394,313 | ||||||
5.95%, 04/01/41 | 740,000 | 836,942 | ||||||
Time Warner Cable, Inc., Sr. Unsec. Gtd. Notes, 5.00%, 02/01/20 | 680,000 | 687,640 | ||||||
ViaSat Inc., Sr. Unsec. Gtd. Global Notes, 6.88%, 06/15/20 | 210,000 | 221,025 | ||||||
Virgin Media Secured Finance PLC (United Kingdom), | 200,000 | 199,849 | ||||||
6.50%, 01/15/18 | 2,155,000 | 2,265,918 | ||||||
Sr. Sec. Gtd. Notes, 5.38%, 04/15/21(b) | 200,000 | 196,500 | ||||||
| 7,496,733 | ||||||||
| Principal Amount | Value | |||||||
| Casinos & Gaming–0.25% | ||||||||
Boyd Gaming Corp., Sr. Unsec. Gtd. Global Notes, | $ | 155,000 | $ | 167,012 | ||||
9.13%, 12/01/18 | 20,000 | 21,900 | ||||||
Caesars Entertainment Operating Co. Inc., Sec. Gtd. Global Notes, 10.00%, 12/15/15 | 25,000 | 21,688 | ||||||
Sr. Sec. Gtd. Global Notes, 9.00%, 02/15/20 | 70,000 | 67,550 | ||||||
CityCenter Holdings LLC/CityCenter Finance Corp., Sec. Gtd. Global PIK Notes, 10.75%, 01/15/17 | 111,816 | 121,181 | ||||||
Codere Finance Luxembourg S.A. (Spain), Sr. Sec. Gtd. Notes, 9.25%, 02/15/19(b) | 10,000 | 5,150 | ||||||
MCE Finance Ltd. (China), Sr. Unsec. Gtd. Notes, 5.00%, 02/15/21(b) | 200,000 | 185,500 | ||||||
MGM Resorts International, | 245,000 | 249,900 | ||||||
Sr. Unsec. Gtd. Notes, 7.75%, 03/15/22 | 223,000 | 238,610 | ||||||
Pinnacle Entertainment Inc., Sr. Unsec. Gtd. Global Notes, 7.50%, 04/15/21 | 85,000 | 91,588 | ||||||
Seneca Gaming Corp., Sr. Unsec. Gtd. Notes, 8.25%, 12/01/18(b) | 99,000 | 105,682 | ||||||
Wynn Las Vegas LLC/Wynn Las Vegas Capital Corp., Sr. Unsec. Global Notes, 5.38%, 03/15/22 | 55,000 | 53,934 | ||||||
7.75%, 08/15/20 | 85,000 | 95,200 | ||||||
| 1,424,895 | ||||||||
| Catalog Retail–0.73% | ||||||||
QVC Inc., Sr. Sec. Notes, 7.50%, 10/01/19(b) | 3,825,000 | 4,150,125 | ||||||
| Coal & Consumable Fuels–0.08% | ||||||||
CONSOL Energy Inc., Sr. Unsec. Gtd. Global Notes, 8.25%, 04/01/20 | 145,000 | 154,062 | ||||||
Peabody Energy Corp., | 86,000 | 85,785 | ||||||
Sr. Unsec. Gtd. Notes, 6.50%, 09/15/20 | 200,000 | 199,500 | ||||||
| 439,347 | ||||||||
| Commercial Printing–0.02% | ||||||||
RR Donnelley & Sons Co., Sr. Unsec. Global Notes, 7.88%, 03/15/21 | 90,000 | 96,525 | ||||||
| Communications Equipment–0.04% | ||||||||
Avaya Inc., | 40,000 | 30,800 | ||||||
Sr. Sec. Gtd. Notes, | 135,000 | 123,694 | ||||||
9.00%, 04/01/19(b) | 74,000 | 71,040 | ||||||
| 225,534 | ||||||||
| Computer & Electronics Retail–0.03% | ||||||||
Rent-A-Center Inc., Sr. Unsec. Gtd. Global Notes, 6.63%, 11/15/20 | 150,000 | 157,688 | ||||||
See accompanying Notes to Financial Statements which are an integral part of the financial statements.
11 Invesco Core Plus Bond Fund
| Principal Amount | Value | |||||||
| Computer Storage & Peripherals–0.05% | ||||||||
Seagate HDD Cayman, Sr. Unsec. Gtd. Global Notes, 7.00%, 11/01/21 | $ | 242,000 | $ | 262,570 | ||||
| Construction & Engineering–0.23% | ||||||||
Dycom Investments Inc., Sr. Unsec. Gtd. Sub. Global Notes, 7.13%, 01/15/21 | 105,000 | 111,038 | ||||||
Tutor Perini Corp., Sr. Unsec. Gtd. Global Notes, 7.63%, 11/01/18 | 125,000 | 130,625 | ||||||
URS Corp., Sr. Unsec. Gtd. Notes, 5.50%, 04/01/22(b) | 1,050,000 | 1,071,498 | ||||||
| 1,313,161 | ||||||||
| Construction & Farm Machinery & Heavy Trucks–0.22% | ||||||||
Case New Holland Inc., Sr. Unsec. Gtd. Global Notes, 7.88%, 12/01/17 | 40,000 | 46,100 | ||||||
Commercial Vehicle Group Inc., Sec. Gtd. Global Notes, 7.88%, 04/15/19 | 94,000 | 94,235 | ||||||
John Deere Capital Corp., Sr. Unsec. Global Notes, 0.88%, 04/17/15 | 670,000 | 672,906 | ||||||
Manitowoc Co. Inc. (The), | 90,000 | 89,325 | ||||||
Sr. Unsec. Gtd. Notes, 8.50%, 11/01/20 | 100,000 | 111,250 | ||||||
Navistar International Corp., Sr. Unsec. Gtd. Notes, 8.25%, 11/01/21 | 128,000 | 128,000 | ||||||
Terex Corp., | 70,000 | 70,700 | ||||||
Sr. Unsec. Gtd. Notes, 6.50%, 04/01/20 | 25,000 | 26,063 | ||||||
Titan International Inc., Sr. Sec. Gtd. Global Notes, 7.88%, 10/01/17 | 14,000 | 14,875 | ||||||
| 1,253,454 | ||||||||
| Construction Materials–0.08% | ||||||||
Odebrecht Offshore Drilling Finance Ltd. (Brazil), Sr. Sec. Gtd. Notes, 6.75%, 10/01/22(b) | 200,000 | 194,824 | ||||||
Ply Gem Industries Inc., Sr. Unsec. Gtd. Global Notes, 9.38%, 04/15/17 | 15,000 | 15,863 | ||||||
Texas Industries Inc., Sr. Unsec. Gtd. Global Notes, 9.25%, 08/15/20 | 230,000 | 252,425 | ||||||
| 463,112 | ||||||||
| Consumer Finance–0.25% | ||||||||
Ally Financial Inc., Sr. Unsec. Gtd. Global Notes, | 200,000 | 226,000 | ||||||
8.00%, 03/15/20 | 160,000 | 185,200 | ||||||
SLM Corp., | 355,000 | 379,356 | ||||||
Series A, Sr. Unsec. Medium-Term Notes, 5.00%, 10/01/13 | 615,000 | 615,071 | ||||||
| 1,405,627 | ||||||||
| Containers & Glass Products–0.04% | ||||||||
Reynolds Group Holdings Inc., Sr. Sec. Gtd. Global Notes, 5.75%, 10/15/20 | 215,000 | 213,925 | ||||||
| Principal Amount | Value | |||||||
| Data Processing & Outsourced Services–0.29% | ||||||||
Computer Sciences Corp., Sr. Unsec. Global Notes, 4.45%, 09/15/22 | $ | 760,000 | $ | 743,223 | ||||
CoreLogic, Inc., Sr. Unsec. Gtd. Global Notes, 7.25%, 06/01/21 | 228,000 | 244,530 | ||||||
First Data Corp., | ||||||||
Sec. Gtd. Notes, | 399,000 | 409,972 | ||||||
Sr. Sec. Gtd. Notes, | 79,000 | 80,778 | ||||||
7.38%, 06/15/19(b) | 44,000 | 45,760 | ||||||
Sr. Unsec. Gtd. Sub. Global Notes, 11.25%, 03/31/16 | 53,000 | 52,868 | ||||||
Sr. Unsec. Gtd. Sub. Notes, 11.75%, 08/15/21(b) | 30,000 | 28,200 | ||||||
WEX Inc., Sr. Unsec. Gtd. Notes, 4.75%, 02/01/23(b) | 50,000 | 45,625 | ||||||
| 1,650,956 | ||||||||
| Distillers & Vintners–0.03% | ||||||||
CEDC Finance Corp. International Inc. (Poland), Sr. Sec. Gtd. Global Notes, 10.00%, 04/30/18(d) | 41,281 | 37,526 | ||||||
Constellation Brands Inc., | 60,000 | 68,550 | ||||||
Sr. Unsec. Gtd. Notes, 6.00%, 05/01/22 | 35,000 | 37,012 | ||||||
| 143,088 | ||||||||
| Diversified Banks–4.87% | ||||||||
Abbey National Treasury Services PLC (United Kingdom), Sr. Unsec. Gtd. Medium-Term Euro Notes, 3.88%, 11/10/14(b) | 420,000 | 430,375 | ||||||
Access Finance B.V. (Nigeria), Sr. Unsec. Gtd. Notes, | 200,000 | 197,664 | ||||||
Akbank TAS (Turkey), Sr. Unsec. Notes, 5.13%, 07/22/15(b) | 100,000 | 101,110 | ||||||
6.50%, 03/09/18(b) | 200,000 | 208,683 | ||||||
Alfa Bank OJSC Via Alfa Bond Issuance PLC (Russia), Sr. Unsec. Loan Participation Notes, 7.75%, 04/28/21(b) | 200,000 | 210,985 | ||||||
Banco Bradesco S.A. (Brazil), | 415,000 | 427,145 | ||||||
Unsec. Sub. Notes, | 200,000 | 185,881 | ||||||
Banco Davivienda S.A. (Colombia), Sr. Unsec. Notes, 2.95%, 01/29/18(b) | 200,000 | 186,752 | ||||||
Unsec. Sub. Notes, | 200,000 | 189,221 | ||||||
Banco de Credito e Inversiones (Chile), Sr. Unsec. Notes, 3.00%, 09/13/17(b) | 200,000 | 196,067 | ||||||
4.00%, 02/11/23(b) | 500,000 | 452,759 | ||||||
Bancolombia S.A. (Colombia), Unsec. Sub. Global Notes, 5.13%, 09/11/22 | 340,000 | 301,155 | ||||||
See accompanying Notes to Financial Statements which are an integral part of the financial statements.
12 Invesco Core Plus Bond Fund
| Principal Amount | Value | |||||||
| Diversified Banks–(continued) | ||||||||
Bangkok Bank PCL (Thailand), Sr. Unsec. Notes, 4.80%, 10/18/20(b) | $ | 100,000 | $ | 102,704 | ||||
Bank of Montreal (Canada), Sr. Unsec. Medium-Term Notes, 0.80%, 11/06/15 | 1,330,000 | 1,329,145 | ||||||
Barclays Bank PLC (United Kingdom), Unsec. Sub. Global Notes, 5.14%, 10/14/20 | 810,000 | 840,380 | ||||||
BBVA Bancomer S.A. (Mexico), Unsec. Sub. Notes, 6.75%, 09/30/22(b) | 400,000 | 416,887 | ||||||
Caixa Economica Federal (Brazil), Sr. Unsec. Notes, | 400,000 | 321,060 | ||||||
DBS Bank Ltd. (Singapore), Unsec. Sub. Notes, 3.63%, 09/21/22(b) | 200,000 | 204,277 | ||||||
Eurasian Development Bank (Supranational), Sr. Unsec. Notes, 4.77%, 09/20/22(b) | 200,000 | 187,445 | ||||||
Grupo Aval Ltd. (Colombia), Sr. Unsec. Gtd. Notes, 4.75%, 09/26/22(b) | 400,000 | 351,792 | ||||||
Hana Bank (South Korea), Sr. Unsec. Notes, 4.25%, 06/14/17(b) | 700,000 | 736,032 | ||||||
HBOS PLC (United Kingdom), Unsec. Sub. Medium-Term Global Notes, 6.75%, 05/21/18(b) | 1,360,000 | 1,486,831 | ||||||
HSBC Holdings PLC (United Kingdom), Sr. Unsec. Global Notes, 4.00%, 03/30/22 | 1,050,000 | 1,058,221 | ||||||
Industrial Senior Trust (Guatemala), Sr. Unsec. Gtd. Notes, 5.50%, 11/01/22(b) | 100,000 | 90,221 | ||||||
ING Bank N.V. (Netherlands), | 255,000 | 261,708 | ||||||
3.75%, 03/07/17(b) | 330,000 | 342,048 | ||||||
Itau Unibanco Holding S.A. (Brazil), Unsec. Sub. Notes, 5.13%, 05/13/23(b) | 600,000 | 529,554 | ||||||
Korea Development Bank (The) (South Korea), Sr. Unsec. Global Notes, 3.50%, 08/22/17 | 730,000 | 755,410 | ||||||
Lloyds TSB Bank PLC (United Kingdom), Unsec. Gtd. Sub. Medium-Term Notes, 6.50%, 09/14/20(b) | 955,000 | 1,035,063 | ||||||
Nordea Bank AB (Sweden), Sr. Unsec. Notes, 4.88%, 01/27/20(b) | 575,000 | 619,025 | ||||||
PNC Bank, N.A., Unsec. Sub. Global Notes, 3.80%, 07/25/23 | 1,255,000 | 1,215,026 | ||||||
RBS Capital Trust II (United Kingdom), Jr. Unsec. Gtd. Sub. Global Bonds, 6.43%(c) | 11,000 | 9,267 | ||||||
Royal Bank of Scotland Group PLC (The) (United Kingdom), Unsec. Sub. Notes, 6.13%, 12/15/22 | 95,000 | 91,371 | ||||||
Russian Agricultural Bank OSJC via RSHB Capital SA (Russia), Sr. Unsec. Notes, 5.10%, 07/25/18(b) | 250,000 | 249,660 | ||||||
Santander U.S. Debt S.A. Unipersonal (Spain), Sr. Unsec. Gtd. Notes, 3.72%, 01/20/15(b) | 700,000 | 698,807 | ||||||
| Principal Amount | Value | |||||||
| Diversified Banks–(continued) | ||||||||
Societe Generale S.A. (France), Sr. Unsec. Medium-Term Notes, 5.20%, 04/15/21(b) | $ | 1,460,000 | $ | 1,557,494 | ||||
Sr. Unsec. Notes, 2.50%, 01/15/14(b) | 1,940,000 | 1,945,543 | ||||||
Standard Chartered PLC (Hong Kong), Sr. Unsec. Notes, 3.85%, 04/27/15(b) | 775,000 | 807,687 | ||||||
5.50%, 11/18/14(b) | 1,880,000 | 1,977,373 | ||||||
Turkiye Halk Bankasi A.S. (Turkey), Sr. Unsec. Notes, 3.88%, 02/05/20(b) | 600,000 | 515,107 | ||||||
4.88%, 07/19/17(b) | 200,000 | 194,345 | ||||||
Turkiye Is Bankasi A.S. (Turkey), Sr. Unsec. Notes, 3.88%, 11/07/17(b) | 890,000 | 818,795 | ||||||
U.S. Bank N.A., Unsec. Sub. Notes, 3.78%, 04/29/20 | 1,400,000 | 1,459,833 | ||||||
VTB Bank OJSC Via VTB Capital | 1,415,000 | 1,484,180 | ||||||
6.55%, 10/13/20(b) | 660,000 | 680,324 | ||||||
Sr. Unsec. Notes, 6.00%, 04/12/17(b) | 200,000 | 209,115 | ||||||
| 27,669,527 | ||||||||
| Diversified Capital Markets–0.87% | ||||||||
Credit Suisse AG (Switzerland), Unsec. Sub. Notes, 6.50%, 08/08/23(b) | 4,085,000 | 4,109,510 | ||||||
UBS AG (Switzerland), | 200,000 | 230,342 | ||||||
Sr. Unsec. Medium-Term Bank Notes, 3.88%, 01/15/15 | 560,000 | 583,262 | ||||||
| 4,923,114 | ||||||||
| Diversified Chemicals–0.33% | ||||||||
Dow Chemical Co. (The), Sr. Unsec. Global Notes, 3.00%, 11/15/22 | 2,030,000 | 1,867,153 | ||||||
Eagle Spinco Inc., Sr. Unsec. Gtd. Notes, 4.63%, 02/15/21(b) | 10,000 | 9,500 | ||||||
| 1,876,653 | ||||||||
| Diversified Metals & Mining–1.31% | ||||||||
Anglo American Capital PLC (United Kingdom), Sr. Unsec. Gtd. Notes, 9.38%, 04/08/19(b) | 170,000 | 210,355 | ||||||
Corporacion Nacional del Cobre de Chile (Chile), Sr. Unsec. Notes, 3.00%, 07/17/22(b) | 200,000 | 177,120 | ||||||
FMG Resources Pty. Ltd. (Australia), Sr. Unsec. Gtd. Notes, 8.25%, 11/01/19(b) | 160,000 | 170,400 | ||||||
Freeport-McMoran Copper & Gold Inc., Sr. Unsec. Notes, 3.88%, 03/15/23(b) | 2,000,000 | 1,788,442 | ||||||
Rio Tinto Finance USA Ltd. (United Kingdom), Sr. Unsec. Gtd. Global Notes, 7.13%, 07/15/28 | 565,000 | 688,914 | ||||||
See accompanying Notes to Financial Statements which are an integral part of the financial statements.
13 Invesco Core Plus Bond Fund
| Principal Amount | Value | |||||||
| Diversified Metals & Mining–(continued) | ||||||||
Rio Tinto Finance USA PLC (United Kingdom), Sr. Unsec. Gtd. Global Notes, 3.50%, 03/22/22 | $ | 1,700,000 | $ | 1,613,323 | ||||
Southern Copper Corp., Sr. Unsec. Global Notes, | 1,720,000 | 1,338,345 | ||||||
5.38%, 04/16/20 | 150,000 | 157,486 | ||||||
6.75%, 04/16/40 | 725,000 | 677,342 | ||||||
Vedanta Resources PLC (India), Sr. Unsec. Notes, 9.50%, 07/18/18(b) | 100,000 | 104,376 | ||||||
Walter Energy Inc., Sr. Unsec. Gtd. Notes, 8.50%, 04/15/21(b) | 41,000 | 32,595 | ||||||
Xstrata Finance Canada Ltd. (Canada), Sr. Unsec. Gtd. Notes, 5.55%, 10/25/42(b) | 550,000 | 460,230 | ||||||
| 7,418,928 | ||||||||
| Diversified REIT’s–0.22% | ||||||||
Qatari Diar Finance Co. (Qatar), Sr. Unsec. Gtd. Notes, 5.00%, 07/21/20(b) | 1,175,000 | 1,272,416 | ||||||
| Drug Retail–0.29% | ||||||||
CVS Caremark Corp., Sr. Unsec. Global Notes, 2.75%, 12/01/22 | 1,555,000 | 1,436,386 | ||||||
CVS Pass Through Trust, Sr. Sec. Global Pass Through Ctfs., 6.04%, 12/10/28 | 200,830 | 220,474 | ||||||
| 1,656,860 | ||||||||
| Electric Utilities–1.01% | ||||||||
Comision Federal de Electricidad (Mexico), Sr. Unsec. Notes, 5.75%, 02/14/42(b) | 500,000 | 449,669 | ||||||
LSP Energy L.P./LSP Batesville Funding Corp., Series D, Sr. Sec. Bonds, 8.16%, 07/15/25(e) | 5,000 | 0 | ||||||
Majapahit Holding B.V. (Indonesia), REGS, Sr. Unsec. Gtd. Euro Notes, 7.75%, 01/20/20(b) | 200,000 | 212,000 | ||||||
Sr. Unsec. Gtd. Notes, 7.75%, 01/20/20(b) | 100,000 | 105,666 | ||||||
Mississippi Power Co., Series 12, Class A, Sr. Unsec. Notes, 4.25%, 03/15/42 | 767,000 | 678,675 | ||||||
NextEra Energy Capital Holdings Inc., Sr. Unsec. Gtd. Notes, 1.20%, 06/01/15 | 300,000 | 301,213 | ||||||
Ohio Power Co., Series M, Sr. Unsec. Notes, 5.38%, 10/01/21 | 2,370,000 | 2,654,711 | ||||||
Saudi Electricity Global Sukuk Co. 2 (Saudi Arabia), Sr. Unsec. Bonds, 3.47%, 04/08/23(b) | 200,000 | 184,796 | ||||||
5.06%, 04/08/43(b) | 200,000 | 169,449 | ||||||
System Energy Resources Inc., Sec. First Mortgage Bonds, 4.10%, 04/01/23 | 1,000,000 | 988,015 | ||||||
| 5,744,194 | ||||||||
| Electrical Components & Equipment–0.02% | ||||||||
Belden Inc., Sr. Unsec. Gtd. Sub. Notes, 5.50%, 09/01/22(b) | 75,000 | 73,125 | ||||||
| Principal Amount | Value | |||||||
| Electrical Components & Equipment–(continued) | ||||||||
Polypore International Inc., Sr. Unsec. Gtd. Global Notes, 7.50%, 11/15/17 | $ | 55,000 | $ | 58,575 | ||||
| 131,700 | ||||||||
| Electronic Components–0.20% | ||||||||
Corning, Inc., Sr. Unsec. Notes, 4.75%, 03/15/42 | 1,155,000 | 1,136,703 | ||||||
| Electronic Manufacturing Services–0.02% | ||||||||
Sanmina Corp., Sr. Unsec. Gtd. Notes, 7.00%, 05/15/19(b) | 132,000 | 138,930 | ||||||
| Environmental & Facilities Services–0.19% | ||||||||
Clean Harbors Inc., Sr. Unsec. Gtd. Global Notes, | 15,000 | 14,662 | ||||||
5.25%, 08/01/20 | 10,000 | 9,925 | ||||||
Waste Management, Inc., Sr. Unsec. Gtd. Notes, 5.00%, 03/15/14 | 1,050,000 | 1,074,384 | ||||||
| 1,098,971 | ||||||||
| Food Retail–0.54% | ||||||||
Kroger Co. (The), Sr. Unsec. Global Notes, 3.85%, 08/01/23 | 1,340,000 | 1,313,606 | ||||||
5.15%, 08/01/43 | 1,820,000 | 1,780,999 | ||||||
| 3,094,605 | ||||||||
| Forest Products–0.01% | ||||||||
Boise Cascade Co., | 40,000 | 41,500 | ||||||
Sr. Unsec. Gtd. Notes, 6.38%, 11/01/20(b) | 24,000 | 24,900 | ||||||
| 66,400 | ||||||||
| Gas Utilities–0.05% | ||||||||
AmeriGas Finance LLC/Corp., Sr. Unsec. Gtd. Global Notes, 7.00%, 05/20/22 | 55,000 | 58,300 | ||||||
Ferrellgas L.P./Ferrellgas Finance Corp., Sr. Unsec. Global Notes, 6.50%, 05/01/21 | 73,000 | 73,365 | ||||||
Suburban Propane Partners, L.P./ Suburban Energy Finance Corp., Sr. Unsec. Global Notes, 7.38%, 08/01/21 | 54,000 | 57,105 | ||||||
Sr. Unsec. Notes, 7.38%, 03/15/20 | 110,000 | 117,425 | ||||||
| 306,195 | ||||||||
| General Merchandise Stores–0.47% | ||||||||
Dollar General Corp., Sr. Unsec. Global Notes, | 1,660,000 | 1,596,835 | ||||||
3.25%, 04/15/23 | 1,210,000 | 1,101,553 | ||||||
| 2,698,388 | ||||||||
| Gold–1.06% | ||||||||
AngloGold Ashanti Holdings PLC (South Africa), Sr. Unsec. Gtd. Global Notes, 5.13%, 08/01/22 | 610,000 | 520,406 | ||||||
See accompanying Notes to Financial Statements which are an integral part of the financial statements.
14 Invesco Core Plus Bond Fund
| Principal Amount | Value | |||||||
| Gold–(continued) | ||||||||
Barrick Gold Corp. (Canada), Sr. Unsec. Global Notes, 2.90%, 05/30/16 | $ | 1,210,000 | $ | 1,218,212 | ||||
Barrick North America Finance LLC (Canada), Sr. Unsec. Gtd. Global Notes, 5.70%, 05/30/41 | 600,000 | 510,629 | ||||||
Eldorado Gold Corp. (Canada), Sr. Unsec. Notes, 6.13%, 12/15/20(b) | 30,000 | 28,800 | ||||||
Gold Fields Orogen Holding BVI Ltd. (South Africa), Sr. Unsec. Gtd. Notes, 4.88%, 10/07/20(b) | 2,435,000 | 1,938,755 | ||||||
Kinross Gold Corp. (Canada), Sr. Unsec. Gtd. Global Notes, 6.88%, 09/01/41 | 1,365,000 | 1,180,482 | ||||||
Newcrest Finance Pty Ltd. (Australia), Sr. Unsec. Gtd. Notes, 5.75%, 11/15/41(b) | 815,000 | 628,919 | ||||||
| 6,026,203 | ||||||||
| Health Care Equipment–0.40% | ||||||||
Biomet Inc., | 70,000 | 70,175 | ||||||
Sr. Unsec. Gtd. Global Notes, 6.50%, 08/01/20 | 25,000 | 25,750 | ||||||
Boston Scientific Corp., Sr. Unsec. Global Notes, 4.13%, 10/01/23 | 2,053,000 | 2,013,254 | ||||||
DJO Finance LLC/Corp., | 54,000 | 53,392 | ||||||
Sr. Unsec. Gtd. Sub. Global Notes, 9.75%, 10/15/17 | 21,000 | 21,263 | ||||||
Universal Hospital Services Inc., Sec. Gtd. Global Notes, 7.63%, 08/15/20 | 90,000 | 94,050 | ||||||
| 2,277,884 | ||||||||
| Health Care Facilities–0.09% | ||||||||
HCA Holdings, Inc., Sr. Unsec. Notes, 6.25%, 02/15/21 | 100,000 | 100,750 | ||||||
HCA, Inc., | 130,000 | 134,875 | ||||||
Sr. Unsec. Gtd. Global Notes, 5.88%, 05/01/23 | 105,000 | 103,163 | ||||||
Tenet Healthcare Corp., | 5,000 | 4,756 | ||||||
Sr. Unsec. Global Notes, 6.75%, 02/01/20 | 40,000 | 39,600 | ||||||
8.00%, 08/01/20 | 107,000 | 111,547 | ||||||
| 494,691 | ||||||||
| Health Care Services–0.16% | ||||||||
DaVita HealthCare Partners Inc., Sr. Unsec. Gtd. Global Notes, 5.75%, 08/15/22 | 25,000 | 24,875 | ||||||
Express Scripts Holding Co., Sr. Unsec. Gtd. Notes, 3.13%, 05/15/16 | 190,000 | 198,119 | ||||||
Medco Health Solutions Inc., Sr. Unsec. Gtd. Notes, 2.75%, 09/15/15 | 585,000 | 604,125 | ||||||
| Principal Amount | Value | |||||||
| Health Care Services–(continued) | ||||||||
Prospect Medical Holdings Inc., Sr. Sec. Notes, 8.38%, 05/01/19(b) | $ | 85,000 | $ | 89,463 | ||||
| 916,582 | ||||||||
| Home Improvement Retail–0.04% | ||||||||
Michaels Stores Inc., Sr. Unsec. Gtd. Global Notes, 7.75%, 11/01/18 | 200,000 | 215,500 | ||||||
| Homebuilding–0.20% | ||||||||
Beazer Homes USA Inc., | 79,000 | 79,790 | ||||||
Sr. Unsec. Gtd. Notes, 9.13%, 06/15/18 | 70,000 | 73,937 | ||||||
DR Horton Inc., Sr. Unsec. Gtd. Global Notes, 4.75%, 02/15/23 | 110,000 | 100,650 | ||||||
K. Hovnanian Enterprises Inc., | 60,000 | 63,750 | ||||||
Sr. Unsec. Gtd. Global Notes, 6.25%, 01/15/16 | 100,000 | 103,250 | ||||||
Sr. Unsec. Gtd. Notes, 7.50%, 05/15/16 | 115,000 | 121,756 | ||||||
11.88%, 10/15/15 | 10,000 | 11,400 | ||||||
KB Home, Sr. Unsec. Gtd. Notes, 7.50%, 09/15/22 | 20,000 | 20,950 | ||||||
Lennar Corp., | 87,000 | 94,721 | ||||||
Sr. Unsec. Gtd. Notes, 4.75%, 11/15/22(b) | 145,000 | 133,581 | ||||||
M/I Homes Inc., Sr. Unsec. Gtd. Global Notes, 8.63%, 11/15/18 | 65,000 | 69,713 | ||||||
Meritage Homes Corp., Sr. Unsec. Gtd. Global Notes, 7.00%, 04/01/22 | 55,000 | 59,400 | ||||||
Ryland Group Inc. (The), Sr. Unsec. Gtd. Notes, 5.38%, 10/01/22 | 65,000 | 60,369 | ||||||
Taylor Morrison Communities Inc./ Monarch Communities Inc., Sr. Unsec. Gtd. Notes, 7.75%, 04/15/20(b) | 100,000 | 110,000 | ||||||
Toll Brothers Finance Corp., Sr. Unsec. Gtd. Notes, 5.88%, 02/15/22 | 18,000 | 18,315 | ||||||
| 1,121,582 | ||||||||
| Hotels, Resorts & Cruise Lines–0.59% | ||||||||
Carnival Corp., Sr. Unsec. Gtd. Global Notes, 1.88%, 12/15/17 | 1,045,000 | 1,014,810 | ||||||
Royal Caribbean Cruises Ltd., | 605,000 | 592,900 | ||||||
7.25%, 03/15/18 | 25,000 | 28,938 | ||||||
7.50%, 10/15/27 | 70,000 | 75,950 | ||||||
Wyndham Worldwide Corp., Sr. Unsec. Notes, 5.63%, 03/01/21 | 1,530,000 | 1,639,061 | ||||||
| 3,351,659 | ||||||||
| Household Products–0.10% | ||||||||
Central Garden & Pet Co., Sr. Unsec. Gtd. Sub. Notes, 8.25%, 03/01/18 | 35,000 | 33,906 | ||||||
See accompanying Notes to Financial Statements which are an integral part of the financial statements.
15 Invesco Core Plus Bond Fund
| Principal Amount | Value | |||||||
| Household Products–(continued) | ||||||||
Controladora Mabe S.A. de C.V. (Mexico), Sr. Unsec. Gtd. Notes, 7.88%, 10/28/19(b) | $ | 500,000 | $ | 542,837 | ||||
| 576,743 | ||||||||
| Housewares & Specialties–0.01% | ||||||||
American Greetings Corp., Sr. Unsec. Gtd. Notes, | 45,000 | 44,213 | ||||||
| Hypermarkets & Super Centers–0.10% | ||||||||
Cencosud S.A. (Chile), Sr. Unsec. Gtd. Notes, 4.88%, 01/20/23(b) | 600,000 | 548,056 | ||||||
| Independent Power Producers & Energy Traders–0.02% | ||||||||
AES Corp. (The), Sr. Unsec. Global Notes, | 50,000 | 54,875 | ||||||
8.00%, 10/15/17 | 8,000 | 9,250 | ||||||
NRG Energy Inc., Sr. Unsec. Gtd. Global Notes, | 15,000 | 14,962 | ||||||
7.63%, 01/15/18 | 9,000 | 10,013 | ||||||
| 89,100 | ||||||||
| Industrial Conglomerates–0.70% | ||||||||
General Electric Capital Corp., Sr. Unsec. Notes, 2.25%, 11/09/15 | 65,000 | 66,547 | ||||||
Hutchison Whampoa International Ltd. (Hong Kong), | 1,000,000 | 1,120,972 | ||||||
7.63%, 04/09/19(b) | 925,000 | 1,119,784 | ||||||
Unsec. Gtd. Sub. Notes, 6.00%(b)(c) | 200,000 | 211,000 | ||||||
Sigma Alimentos S.A. de C.V. (Mexico), Sr. Unsec. Gtd. Notes, 5.63%, 04/14/18(b) | 1,350,000 | 1,457,480 | ||||||
| 3,975,783 | ||||||||
| Industrial Machinery–0.70% | ||||||||
Actuant Corp., Sr. Unsec. Gtd. Global Notes, 5.63%, 06/15/22 | 50,000 | 50,375 | ||||||
Pentair Finance S.A., Sr. Unsec. Gtd. Global Notes, | 2,700,000 | 2,715,662 | ||||||
3.15%, 09/15/22 | 1,355,000 | 1,231,198 | ||||||
| 3,997,235 | ||||||||
| Industrial REIT’s–0.24% | ||||||||
ProLogis L.P., Sr. Unsec. Gtd. Global Notes, 4.25%, 08/15/23 | 1,415,000 | 1,390,932 | ||||||
| Integrated Oil & Gas–0.72% | ||||||||
Gazprom OAO Via Gaz Capital S.A. (Russia), Sr. Unsec. Loan Participation Notes, 4.95%, 05/23/16(b) | 200,000 | 210,250 | ||||||
KazMunayGaz National Co. JSC (Kazakhstan), | 210,000 | 232,202 | ||||||
Sr. Unsec. Notes, | 240,000 | 194,963 | ||||||
| Principal Amount | Value | |||||||
| Integrated Oil & Gas–(continued) | ||||||||
Lukoil International Finance B.V. (Russia), Sr. Unsec. Gtd. Notes, 7.25%, 11/05/19(b) | $ | 100,000 | $ | 111,427 | ||||
Petrobras Global Finance B.V. (Brazil), Sr. Unsec. Gtd. Global Notes, 3.00%, 01/15/19 | 200,000 | 184,455 | ||||||
4.38%, 05/20/23 | 200,000 | 175,910 | ||||||
Petroleos de Venezuela S.A. (Venezuela), Sr. Unsec. Gtd. Notes, 8.50%, 11/02/17(b) | 200,000 | 179,606 | ||||||
REGS, Sr. Unsec. Gtd. Euro Notes, 8.50%, 11/02/17(b) | 110,000 | 98,560 | ||||||
Rosneft Oil Co. via Rosneft International Finance Ltd. (Russia), Sr. Unsec. Bonds, | 500,000 | 491,792 | ||||||
Shell International Finance B.V. (Netherlands), Sr. Unsec. Gtd. Global Notes, 3.40%, 08/12/23 | 2,053,000 | 2,022,049 | ||||||
State Oil Co. of the Azerbaijan Republic (Azerbaijan), Sr. Unsec. Euro Notes, 5.45%, 02/09/17 | 200,000 | 209,500 | ||||||
| 4,110,714 | ||||||||
| Integrated Telecommunication Services–0.68% | ||||||||
AT&T Corp., Sr. Unsec. Gtd. Global Notes, 8.00%, 11/15/31 | 13,000 | 17,983 | ||||||
AT&T Inc., Sr. Unsec. Global Notes, 2.50%, 08/15/15 | 905,000 | 934,358 | ||||||
2.95%, 05/15/16 | 160,000 | 167,138 | ||||||
Globo Comunicacao e Participacoes S.A. (Brazil), Sr. Sec. Euro Notes, 9.38%(b)(c)(d) | 100,000 | 104,974 | ||||||
Qtel International Finance Ltd. (Qatar), Sr. Unsec. Gtd. Notes, 3.88%, 01/31/28(b) | 200,000 | 173,034 | ||||||
Sr. Unsec. Gtd. Notes, 3.25%, 02/21/23(b) | 1,950,000 | 1,755,342 | ||||||
Telefonica Emisiones S.A. Unipersonal (Spain), Sr. Unsec. Gtd. Global Notes, 5.46%, 02/16/21 | 415,000 | 423,775 | ||||||
Windstream Georgia Communications Corp., Sr. Unsec. Notes, 6.50%, 11/15/13 | 265,000 | 266,595 | ||||||
| 3,843,199 | ||||||||
| Internet Software & Services–0.07% | ||||||||
Bankrate Inc., Sr. Unsec. Gtd. Notes, 6.13%, 08/15/18(b) | 35,000 | 34,913 | ||||||
CyrusOne L.P./CyrusOne Finance Corp., Sr. Unsec. Gtd. Global Notes, 6.38%, 11/15/22 | 125,000 | 126,562 | ||||||
Equinix Inc., Sr. Unsec. Notes, | 145,000 | 138,837 | ||||||
7.00%, 07/15/21 | 100,000 | 107,500 | ||||||
| 407,812 | ||||||||
| Investment Banking & Brokerage–2.10% | ||||||||
Charles Schwab Corp. (The), | 2,400,000 | 2,604,000 | ||||||
See accompanying Notes to Financial Statements which are an integral part of the financial statements.
16 Invesco Core Plus Bond Fund
| Principal Amount | Value | |||||||
| Investment Banking & Brokerage–(continued) | ||||||||
Goldman Sachs Group, Inc. (The), Sr. Unsec. Global Notes, 5.25%, 07/27/21 | $ | 1,110,000 | $ | 1,185,932 | ||||
Macquarie Group Ltd. (Australia), Sr. Unsec. Notes, 6.00%, 01/14/20(b) | 505,000 | 530,877 | ||||||
Morgan Stanley, | 450,000 | 470,583 | ||||||
6.00%, 05/13/14 | 955,000 | 987,009 | ||||||
Sr. Unsec. Notes, | 2,010,000 | 2,085,031 | ||||||
5.75%, 01/25/21 | 985,000 | 1,086,245 | ||||||
Unsec. Sub. Medium-Term Notes, 4.10%, 05/22/23 | 3,040,000 | 2,791,359 | ||||||
Raymond James Financial, Inc., Sr. Unsec. Notes, 4.25%, 04/15/16 | 170,000 | 179,055 | ||||||
| 11,920,091 | ||||||||
| Leisure Facilities–0.02% | ||||||||
Cedar Fair L.P./Canada’s Wonderland Co./Magnum Management Corp., Sr. Unsec. Gtd. Notes, 5.25%, 03/15/21(b) | 75,000 | 71,625 | ||||||
Speedway Motorsports Inc., Sr. Unsec. Gtd. Global Notes, 6.75%, 02/01/19 | 50,000 | 53,125 | ||||||
| 124,750 | ||||||||
| Life & Health Insurance–1.31% | ||||||||
Forethought Financial Group, Inc., Sr. Unsec. Notes, 8.63%, 04/15/21(b) | 50,000 | 56,380 | ||||||
MetLife Inc., Sr. Unsec. Global Notes, 4.13%, 08/13/42 | 2,200,000 | 1,949,180 | ||||||
Nationwide Financial Services, Inc., Sr. Unsec. Notes, 5.38%, 03/25/21(b) | 735,000 | 786,803 | ||||||
Pacific LifeCorp., Sr. Unsec. Notes, 6.00%, 02/10/20(b) | 425,000 | 472,681 | ||||||
Prudential Financial, Inc., | 1,640,000 | 1,980,300 | ||||||
Sr. Unsec. Medium-Term Notes, 7.38%, 06/15/19 | 130,000 | 159,885 | ||||||
Series D, Sr. Unsec. Disc. Medium-Term Notes, 4.75%, 09/17/15 | 550,000 | 591,816 | ||||||
Series D, Sr. Unsec. Medium-Term Notes, 3.88%, 01/14/15 | 1,405,000 | 1,462,950 | ||||||
| 7,459,995 | ||||||||
| Lodging & Casinos–0.01% | ||||||||
Caesars Entertainment Operating Co. Inc., 9.00%, 02/15/20 | 50,000 | 48,250 | ||||||
| Managed Health Care–0.32% | ||||||||
Cigna Corp., | 725,000 | 764,522 | ||||||
Sr. Unsec. Notes, | 180,000 | 191,044 | ||||||
| Principal Amount | Value | |||||||
| Managed Health Care–(continued) | ||||||||
Humana Inc., Sr. Unsec. Global Notes, 4.63%, 12/01/42 | $ | 950,000 | $ | 845,730 | ||||
| 1,801,296 | ||||||||
| Marine–0.00% | ||||||||
Navios Maritime Acquisition Corp./Navios Acquisition Finance U.S. Inc., Sr. Sec. Gtd. Global Notes, 8.63%, 11/01/17 | 22,000 | 22,935 | ||||||
| Movies & Entertainment–1.33% | ||||||||
Cinemark USA Inc., Sr. Unsec. Gtd. Global Notes, 5.13%, 12/15/22 | 94,000 | 88,360 | ||||||
DreamWorks Animation SKG, Inc., Sr. Unsec. Gtd. Notes, 6.88%, 08/15/20(b) | 80,000 | 82,800 | ||||||
Live Nation Entertainment Inc., Sr. Unsec. Gtd. Notes, 7.00%, 09/01/20(b) | 180,000 | 188,100 | ||||||
Outerwall Inc., Sr. Unsec. Gtd. Notes, 6.00%, 03/15/19(b) | 125,000 | 125,313 | ||||||
Time Warner, Inc., Sr. Unsec. Gtd. Notes, 5.88%, 11/15/16 | 285,000 | 322,784 | ||||||
Viacom Inc., Sr. Unsec. Global Notes, 4.25%, 09/01/23 | 2,940,000 | 2,903,769 | ||||||
5.85%, 09/01/43 | 3,800,000 | 3,852,114 | ||||||
| 7,563,240 | ||||||||
| Multi-Line Insurance–1.07% | ||||||||
American Financial Group, Inc., Sr. Unsec. Notes, 9.88%, 06/15/19 | 10,000 | 12,866 | ||||||
Fairfax Financial Holdings Ltd. (Canada), Sr. Unsec. Notes, 5.80%, 05/15/21(b) | 3,000 | 3,064 | ||||||
Genworth Holdings Inc., Sr. Unsec. Gtd. Global Notes, 4.90%, 08/15/23 | 1,428,000 | 1,410,971 | ||||||
Hartford Financial Services Group Inc. (The), Jr. Unsec. Sub. Deb., 8.13%, 06/15/38 | 73,000 | 83,220 | ||||||
Liberty Mutual Group Inc., | 100,000 | 113,500 | ||||||
Sr. Unsec. Gtd. Notes, 4.25%, 06/15/23(b) | 1,920,000 | 1,853,030 | ||||||
Trinity Acquisition PLC (United Kingdom), Sr. Unsec. Gtd. Global Notes, 6.13%, 08/15/43 | 2,634,000 | 2,574,723 | ||||||
| 6,051,374 | ||||||||
| Multi-Sector Holdings–0.25% | ||||||||
Burlington Northern Santa Fe, LLC, Sr. Unsec. Notes, 3.85%, 09/01/23 | 1,430,000 | 1,419,031 | ||||||
| Office REIT’s–0.12% | ||||||||
Digital Realty Trust L.P., Sr. Unsec. Gtd. Global Notes, 4.50%, 07/15/15 | 675,000 | 709,405 | ||||||
| Office Services & Supplies–0.00% | ||||||||
Interface Inc., Sr. Unsec. Gtd. Global Notes, 7.63%, 12/01/18 | 5,000 | 5,369 | ||||||
See accompanying Notes to Financial Statements which are an integral part of the financial statements.
17 Invesco Core Plus Bond Fund
| Principal Amount | Value | |||||||
| Oil & Gas Drilling–0.21% | ||||||||
Atwood Oceanics Inc., Sr. Unsec. Notes, 6.50%, 02/01/20 | $ | 46,000 | $ | 49,393 | ||||
Parker Drilling Co., Sr. Unsec. Gtd. Notes, 7.50%, 08/01/20(b) | 58,000 | 57,565 | ||||||
Precision Drilling Corp. (Canada), Sr. Unsec. Gtd. Global Notes, 6.50%, 12/15/21 | 95,000 | 99,987 | ||||||
Transocean Inc., Sr. Unsec. Gtd. Global Notes, 4.95%, 11/15/15 | 930,000 | 998,467 | ||||||
| 1,205,412 | ||||||||
| Oil & Gas Equipment & Services–0.15% | ||||||||
Bristow Group, Inc., Sr. Unsec. Gtd. Notes, 6.25%, 10/15/22 | 35,000 | 36,487 | ||||||
Calfrac Holdings L.P. (Canada), Sr. Unsec. Gtd. Notes, 7.50%, 12/01/20(b) | 200,000 | 202,500 | ||||||
Exterran Partners L.P./EXLP Finance Corp., Sr. Unsec. Gtd. Notes, 6.00%, 04/01/21(b) | 30,000 | 29,063 | ||||||
Gulfmark Offshore Inc., Sr. Unsec. Global Notes, 6.38%, 03/15/22 | 152,000 | 154,660 | ||||||
Key Energy Services, Inc., Sr. Unsec. Gtd. Notes, 6.75%, 03/01/21 | 18,000 | 17,865 | ||||||
TMK OAO Via TMK Capital S.A. (Russia), Sr. Unsec. Notes, | 400,000 | 384,235 | ||||||
| 824,810 | ||||||||
| Oil & Gas Exploration & Production–1.97% | ||||||||
Access Midstream Partners L.P./ACMP Finance Corp., Sr. Unsec. Gtd. Global Notes, 6.13%, 07/15/22 | 5,000 | 5,163 | ||||||
Anadarko Petroleum Corp., Sr. Unsec. Notes, 7.63%, 03/15/14 | 50,000 | 51,816 | ||||||
Apache Corp., Sr. Unsec. Global Notes, 4.75%, 04/15/43 | 1,325,000 | 1,269,484 | ||||||
Berry Petroleum Co., Sr. Unsec. Notes, | 25,000 | 25,000 | ||||||
6.75%, 11/01/20 | 80,000 | 82,400 | ||||||
Bonanza Creek Energy Inc., Sr. Unsec. Gtd. Global Notes, 6.75%, 04/15/21 | 118,000 | 120,655 | ||||||
Chaparral Energy Inc., Sr. Unsec. Gtd. Global Notes, | 105,000 | 106,575 | ||||||
8.25%, 09/01/21 | 75,000 | 78,938 | ||||||
Chesapeake Energy Corp., | 25,000 | 27,188 | ||||||
Sr. Unsec. Gtd. Notes, 6.13%, 02/15/21 | 40,000 | 41,800 | ||||||
6.63%, 08/15/20 | 96,000 | 103,320 | ||||||
Cimarex Energy Co., Sr. Unsec. Gtd. Notes, 5.88%, 05/01/22 | 155,000 | 158,100 | ||||||
Dolphin Energy Ltd. (United Arab Emirates), Sr. Sec. Bonds, 5.50%, 12/15/21(b) | 600,000 | 642,477 | ||||||
Endeavor Energy Resources, L.P./EER Finance, Inc., Sr. Unsec. Notes, 7.00%, 08/15/21(b) | 121,000 | 119,790 | ||||||
| Principal Amount | Value | |||||||
| Oil & Gas Exploration & Production–(continued) | ||||||||
EV Energy Partners L.P./EV Energy Finance Corp., Sr. Unsec. Gtd. Global Notes, 8.00%, 04/15/19 | $ | 92,000 | $ | 92,460 | ||||
EXCO Resources Inc., Sr. Unsec. Gtd. Notes, 7.50%, 09/15/18 | 81,000 | 79,785 | ||||||
GeoPark Latin America Ltd. Agencia en Chile (Chile), Sr. Sec. Gtd. Notes, 7.50%, 02/11/20(b) | 350,000 | 349,363 | ||||||
Halcon Resources Corp., Sr. Unsec. Gtd. Global Notes, 8.88%, 05/15/21 | 225,000 | 226,125 | ||||||
Kodiak Oil & Gas Corp., Sr. Unsec. Gtd. Notes, 5.50%, 02/01/22(b) | 23,000 | 22,885 | ||||||
Laredo Petroleum Inc., Sr. Unsec. Gtd. Global Notes, 7.38%, 05/01/22 | 7,000 | 7,455 | ||||||
Legacy Reserves L.P./Legacy Reserves Finance Corp., Sr. Unsec. Gtd. Notes, 6.63%, 12/01/21(b) | 33,000 | 31,680 | ||||||
MEG Energy Corp. (Canada), Sr. Unsec. Gtd. Notes, | 49,000 | 49,123 | ||||||
6.50%, 03/15/21(b) | 75,000 | 76,875 | ||||||
Memorial Production Partners L.P./Memorial Production Finance Corp., Sr. Unsec. Gtd. Global Notes, 7.63%, 05/01/21 | 94,000 | 91,180 | ||||||
Pemex Project Funding Master Trust (Mexico), Sr. Unsec. Gtd. Global Bonds, 6.63%, 06/15/35 | 340,000 | 349,079 | ||||||
Pertamina Persero PT (Indonesia), REGS, Sr. Unsec. Euro Notes, 4.88%, 05/03/22(b) | 450,000 | 392,625 | ||||||
Sr. Unsec. Notes, | 200,000 | 163,686 | ||||||
4.88%, 05/03/22(b) | 200,000 | 175,115 | ||||||
5.63%, 05/20/43(b) | 200,000 | 143,481 | ||||||
6.00%, 05/03/42(b) | 200,000 | 154,525 | ||||||
Petrobras International Finance Co. (Brazil), Sr. Unsec. Gtd. Global Notes, | 1,495,000 | 1,493,652 | ||||||
5.38%, 01/27/21 | 210,000 | 205,992 | ||||||
5.75%, 01/20/20 | 645,000 | 657,498 | ||||||
6.88%, 01/20/40 | 625,000 | 592,413 | ||||||
Petrohawk Energy Corp., Sr. Unsec. Gtd. Global Notes, 7.88%, 06/01/15 | 1,930,000 | 1,963,872 | ||||||
Petroleos Mexicanos (Mexico), | 200,000 | 173,125 | ||||||
Sr. Unsec. Gtd. Global Notes, 5.50%, 01/21/21 | 20,000 | 21,138 | ||||||
6.50%, 06/02/41 | 100,000 | 100,373 | ||||||
QEP Resources Inc., | 25,000 | 23,625 | ||||||
Sr. Unsec. Notes, | 48,000 | 46,320 | ||||||
Range Resources Corp., Sr. Unsec. Gtd. Sub. Notes, | 25,000 | 24,531 | ||||||
5.75%, 06/01/21 | 160,000 | 169,600 | ||||||
See accompanying Notes to Financial Statements which are an integral part of the financial statements.
18 Invesco Core Plus Bond Fund
| Principal Amount | Value | |||||||
| Oil & Gas Exploration & Production–(continued) | ||||||||
SandRidge Energy Inc., Sr. Unsec. Gtd. Global Notes, 7.50%, 03/15/21 | $ | 132,000 | $ | 132,000 | ||||
SM Energy Co., Sr. Unsec. Global Notes, 6.50%, 11/15/21 | 125,000 | 132,500 | ||||||
6.63%, 02/15/19 | 110,000 | 115,225 | ||||||
WPX Energy Inc., Sr. Unsec. Global Notes, 6.00%, 01/15/22 | 105,000 | 105,525 | ||||||
| 11,195,537 | ||||||||
| Oil & Gas Refining & Marketing–0.18% | ||||||||
Crosstex Energy L.P./Crosstex Energy Finance Corp., Sr. Unsec. Gtd. Global Notes, 7.13%, 06/01/22 | 45,000 | 46,463 | ||||||
CVR Refining LLC/Coffeyville Finance Inc., Sec. Gtd. Notes, 6.50%, 11/01/22(b) | 153,000 | 148,027 | ||||||
United Refining Co., Sr. Sec. Gtd. Global Notes, 10.50%, 02/28/18 | 55,000 | 61,187 | ||||||
Valero Energy Corp., Sr. Unsec. Gtd. Global Notes, 6.63%, 06/15/37 | 680,000 | 740,392 | ||||||
| 996,069 | ||||||||
| Oil & Gas Storage & Transportation–2.60% | ||||||||
Access Midstream Partners L.P./ACMP Finance Corp., Sr. Unsec. Gtd. Global Notes, 5.88%, 04/15/21 | 88,000 | 90,640 | ||||||
Atlas Pipeline Partners L.P./Atlas Pipeline Finance Corp., Sr. Unsec. Gtd. Notes, 5.88%, 08/01/23(b) | 75,000 | 70,687 | ||||||
6.63%, 10/01/20(b) | 75,000 | 75,750 | ||||||
Eagle Rock Energy Partners L.P./Eagle Rock Energy Finance Corp., Sr. Unsec. Gtd. Global Notes, 8.38%, 06/01/19 | 66,000 | 66,495 | ||||||
El Paso Pipeline Partners Operating Co. LLC, Sr. Unsec. Gtd. Notes, 4.70%, 11/01/42 | 820,000 | 724,862 | ||||||
Energy Transfer Equity L.P., Sr. Sec. Gtd. Notes, 7.50%, 10/15/20 | 82,000 | 89,585 | ||||||
Enterprise Products Operating LLC, Sr. Unsec. Gtd. Notes, 6.45%, 09/01/40 | 1,005,000 | 1,167,820 | ||||||
Series N, Sr. Unsec. Gtd. Notes, 6.50%, 01/31/19 | 420,000 | 494,613 | ||||||
Inergy Midstream L.P./NRGM Finance Corp., Sr. Unsec. Gtd. Notes, 6.00%, 12/15/20(b) | 83,000 | 82,792 | ||||||
Kinder Morgan Energy Partners, L.P., Sr. Unsec. Notes, | 1,368,000 | 1,350,513 | ||||||
5.00%, 03/01/43 | 8,735,000 | 8,169,852 | ||||||
MarkWest Energy Partners L.P./MarkWest Energy Finance Corp., Sr. Unsec. Gtd. Notes, | 200,000 | 197,500 | ||||||
6.50%, 08/15/21 | 84,000 | 89,775 | ||||||
Penn Virginia Resource Partners L.P./Penn Virginia Resource Finance Corp. II, Sr. Unsec. Gtd. Notes, 6.50%, 05/15/21(b) | 54,000 | 51,030 | ||||||
| Principal Amount | Value | |||||||
| Oil & Gas Storage & Transportation–(continued) | ||||||||
Targa Resources Partners L.P./Targa Resources Partners Finance Corp., Sr. Unsec. Gtd. Global Notes, 6.38%, 08/01/22 | $ | 11,000 | $ | 11,440 | ||||
6.88%, 02/01/21 | 205,000 | 218,325 | ||||||
Teekay Corp. (Canada), Sr. Unsec. Global Notes, 8.50%, 01/15/20 | 35,000 | 37,975 | ||||||
Tesoro Logistics L.P./Tesoro Logistics Finance Corp., Sr. Unsec. Gtd. Notes, 5.88%, 10/01/20(b) | 95,000 | 95,237 | ||||||
6.13%, 10/15/21(b) | 28,000 | 28,070 | ||||||
Texas Eastern Transmission L.P., | 255,000 | 306,512 | ||||||
Williams Partners L.P., Sr. Unsec. Global Notes, 3.80%, 02/15/15 | 1,305,000 | 1,358,131 | ||||||
| 14,777,604 | ||||||||
| Other Diversified Financial Services–3.45% | ||||||||
Bank of America Corp., Sr. Unsec. Global Notes, | 700,000 | 731,191 | ||||||
4.10%, 07/24/23 | 3,805,000 | 3,733,136 | ||||||
4.50%, 04/01/15 | 40,000 | 41,979 | ||||||
6.50%, 08/01/16 | 10,000 | 11,279 | ||||||
Citigroup Inc., | 2,145,000 | 2,287,184 | ||||||
Sr. Unsec. Notes, | 25,000 | 26,528 | ||||||
Series A, Jr. Unsec. Sub. Global Notes, 5.95%(c) | 1,640,000 | 1,570,300 | ||||||
General Electric Capital Corp., | 25,000 | 25,955 | ||||||
Class C, Jr. Unsec. Sub. Global Notes, 5.25%(c) | 2,500,000 | 2,316,250 | ||||||
ING US Inc., Jr. Unsec. Gtd. Sub. Global Notes, 5.65%, 05/15/53 | 3,335,000 | 3,068,200 | ||||||
JPMorgan Chase & Co., | 825,000 | 894,053 | ||||||
6.30%, 04/23/19 | 190,000 | 220,407 | ||||||
Series Q, Jr. Unsec. Sub. Global Notes, 5.15%(c) | 1,940,000 | 1,731,450 | ||||||
Series R, Jr. Unsec. Sub. Global Notes, 6.00%(c) | 2,980,000 | 2,845,900 | ||||||
Oxford Finance LLC/Oxford Finance Co-Issuer Inc., Sr. Unsec. Notes, 7.25%, 01/15/18(b) | 75,000 | 77,250 | ||||||
| 19,581,062 | ||||||||
| Packaged Foods & Meats–0.32% | ||||||||
Grupo Bimbo S.A.B. de C.V. (Mexico), Sr. Unsec. Gtd. Notes, 4.50%, 01/25/22(b) | 250,000 | 250,462 | ||||||
4.88%, 06/30/20(b) | 1,065,000 | 1,107,291 | ||||||
See accompanying Notes to Financial Statements which are an integral part of the financial statements.
19 Invesco Core Plus Bond Fund
| Principal Amount | Value | |||||||
| Packaged Foods & Meats–(continued) | ||||||||
Mondelez International Inc., Sr. Unsec. Global Notes, 7.00%, 08/11/37 | $ | 70,000 | $ | 85,886 | ||||
Post Holdings Inc., Sr. Unsec. Gtd. Global Notes, 7.38%, 02/15/22 | 145,000 | 153,700 | ||||||
Simmons Foods Inc., Sr. Sec. Notes, 10.50%, 11/01/17(b) | 80,000 | 85,800 | ||||||
Sun Merger Sub, Inc., Sr. Unsec. Notes, 5.25%, 08/01/18(b) | 24,000 | 24,120 | ||||||
5.88%, 08/01/21(b) | 24,000 | 24,000 | ||||||
Wells Enterprises Inc., Sr. Sec. Notes, 6.75%, 02/01/20(b) | 65,000 | 67,275 | ||||||
| 1,798,534 | ||||||||
| Paper Packaging–0.14% | ||||||||
Cascades Inc. (Canada), Sr. Unsec. Gtd. Global Notes, 7.88%, 01/15/20 | 40,000 | 42,500 | ||||||
Rock-Tenn Co., Sr. Unsec. Gtd. Global Notes, 4.00%, 03/01/23 | 800,000 | 769,177 | ||||||
| 811,677 | ||||||||
| Paper Products–0.10% | ||||||||
International Paper Co., Sr. Unsec. Global Notes, 4.75%, 02/15/22 | 265,000 | 278,084 | ||||||
Neenah Paper Inc., Sr. Unsec. Gtd. Notes, 5.25%, 05/15/21(b) | 19,000 | 18,145 | ||||||
PH Glatfelter Co., Sr. Unsec. Gtd. Global Notes, 5.38%, 10/15/20 | 115,000 | 115,288 | ||||||
Unifrax I LLC/Unifrax Holding Co., Sr. Unsec. Gtd. Notes, 7.50%, 02/15/19(b) | 170,000 | 171,062 | ||||||
| 582,579 | ||||||||
| Personal Products–0.56% | ||||||||
Avon Products Inc., Sr. Unsec. Global Notes, 5.00%, 03/15/23 | 2,005,000 | 1,998,449 | ||||||
Estee Lauder Cos. Inc. (The), Sr. Unsec. Global Notes, 3.70%, 08/15/42 | 1,340,000 | 1,159,063 | ||||||
First Quality Finance Co. Inc., Sr. Unsec. Notes, 4.63%, 05/15/21(b) | 12,000 | 11,130 | ||||||
Revlon Consumer Products Corp., Sr. Unsec. Gtd. Notes, 5.75%, 02/15/21(b) | 15,000 | 14,438 | ||||||
| 3,183,080 | ||||||||
| Pharmaceuticals–1.41% | ||||||||
AbbVie Inc., Sr. Unsec. Global Notes, 4.40%, 11/06/42 | 7,266,000 | 6,765,466 | ||||||
Actavis Inc., Sr. Unsec. Global Notes, 1.88%, 10/01/17 | 1,000,000 | 984,358 | ||||||
Valeant Pharmaceuticals International, Sr. Unsec. Gtd. Notes, 6.38%, 10/15/20(b) | 150,000 | 153,000 | ||||||
VPII Escrow Corp., Sr. Unsec. Notes, 6.75%, 08/15/18(b) | 50,000 | 53,000 | ||||||
7.50%, 07/15/21(b) | 50,000 | 53,875 | ||||||
| 8,009,699 | ||||||||
| Principal Amount | Value | |||||||
| Property & Casualty Insurance–0.62% | ||||||||
Allstate Corp., Unsec. Sub. Global Notes, 5.75%, 08/15/53 | $ | 3,520,000 | $ | 3,484,800 | ||||
CNA Financial Corp., Sr. Unsec. Global Bonds, 5.88%, 08/15/20 | 20,000 | 22,670 | ||||||
| 3,507,470 | ||||||||
| Railroads–0.23% | ||||||||
CSX Corp., | 130,000 | 148,368 | ||||||
Sr. Unsec. Notes, | 900,000 | 959,483 | ||||||
Georgian Railway JSC (Georgia), Sr. Unsec. Notes, 7.75%, 07/11/22(b) | 200,000 | 216,720 | ||||||
| 1,324,571 | ||||||||
| Real Estate Development–0.03% | ||||||||
Country Garden Holdings Co. Ltd. (China), Sr. Unsec. Gtd. Notes, 7.50%, 01/10/23(b) | 200,000 | 184,075 | ||||||
| Real Estate Services–0.01% | ||||||||
CB Richard Ellis Services Inc., Sr. Unsec. Gtd. Global Notes, 6.63%, 10/15/20 | 28,000 | 29,820 | ||||||
| Regional Banks–0.66% | ||||||||
Banco Internacional del Peru SAA (Peru), Sr. Unsec. Bonds, 5.75%, 10/07/20(b) | 400,000 | 399,773 | ||||||
Fifth Third Bancorp, Sr. Unsec. Notes, 3.50%, 03/15/22 | 1,550,000 | 1,516,235 | ||||||
First Niagara Financial Group Inc., Unsec. Sub. Notes, 7.25%, 12/15/21 | 650,000 | 746,113 | ||||||
Nationwide Building Society (United Kingdom), Sr. Unsec. Notes, 6.25%, 02/25/20(b) | 465,000 | 519,827 | ||||||
Regions Financial Corp., Unsec. Sub. Notes, 7.38%, 12/10/37 | 215,000 | 230,969 | ||||||
Synovus Financial Corp., | 60,000 | 69,450 | ||||||
Unsec. Sub. Global Notes, 5.13%, 06/15/17 | 185,000 | 189,163 | ||||||
Zions Bancorp., Series I, Jr. Unsec. Sub. Notes, 5.80%(c) | 120,000 | 105,900 | ||||||
| 3,777,430 | ||||||||
| Research & Consulting Services–0.02% | ||||||||
FTI Consulting Inc., Sr. Unsec. Gtd. Global Notes, 6.75%, 10/01/20 | 102,000 | 108,375 | ||||||
| Residential REIT’s–0.36% | ||||||||
Essex Portfolio L.P., Sr. Unsec. Gtd. Global Notes, 3.63%, 08/15/22 | 2,135,000 | 2,020,760 | ||||||
| Retail REIT’s–0.52% | ||||||||
Realty Income Corp., Sr. Unsec. Notes, 2.00%, 01/31/18 | 2,115,000 | 2,051,247 | ||||||
See accompanying Notes to Financial Statements which are an integral part of the financial statements.
20 Invesco Core Plus Bond Fund
| Principal Amount | Value | |||||||
| Retail REIT’s–(continued) | ||||||||
Simon Property Group L.P., Sr. Unsec. Notes, 4.75%, 03/15/42 | $ | 610,000 | $ | 583,105 | ||||
WEA Finance LLC (Australia), Sr. Unsec. Gtd. Notes, 7.13%, 04/15/18(b) | 250,000 | 297,421 | ||||||
| 2,931,773 | ||||||||
| Semiconductor Equipment–0.05% | ||||||||
Amkor Technology Inc., | 180,000 | 177,975 | ||||||
Sr. Unsec. Gtd. Global Notes, 7.38%, 05/01/18 | 112,000 | 118,160 | ||||||
| 296,135 | ||||||||
| Semiconductors–0.08% | ||||||||
Freescale Semiconductor Inc., Sr. Unsec. Gtd. Global Notes, | 170,000 | 177,225 | ||||||
10.75%, 08/01/20 | 60,000 | 66,300 | ||||||
NXP BV/NXP Funding LLC (Netherlands), Sr. Unsec. Gtd. Notes, 5.75%, 02/15/21(b) | 200,000 | 201,000 | ||||||
| 444,525 | ||||||||
| Soft Drinks–0.36% | ||||||||
Dr. Pepper Snapple Group Inc., Sr. Unsec. Gtd. Global Notes, 2.00%, 01/15/20 | 750,000 | 697,597 | ||||||
Fomento Economico Mexicano S.A.B. de C.V. (Mexico), Sr. Unsec. Global Notes, 2.88%, 05/10/23 | 200,000 | 180,501 | ||||||
4.38%, 05/10/43 | 1,345,000 | 1,150,783 | ||||||
| 2,028,881 | ||||||||
| Sovereign Debt–4.23% | ||||||||
Argentina Boden Bonds (Argentina), Sr. Unsec. Bonds, 7.00%, 10/03/15 | 400,000 | 359,489 | ||||||
Bolivian Government International Bond (Bolivia), Sr. Unsec. Notes, 4.88%, 10/29/22(b) | 600,000 | 546,000 | ||||||
Chile Government International Bond (Chile), Sr. Unsec. Global Notes, 2.25%, 10/30/22 | 200,000 | 174,880 | ||||||
3.25%, 09/14/21 | 1,390,000 | 1,346,910 | ||||||
Colombia Government International Bond (Colombia), Sr. Unsec. Global Bonds, 4.38%, 07/12/21 | 320,000 | 327,200 | ||||||
6.13%, 01/18/41 | 520,000 | 549,250 | ||||||
Costa Rica Government International Bond (Costa Rica), Sr. Unsec. Notes, 4.25%, 01/26/23(b) | 400,000 | 364,000 | ||||||
4.38%, 04/30/25(b) | 200,000 | 178,000 | ||||||
Croatia Government International Bond (Croatia), Sr. Unsec. Notes, 5.50%, 04/04/23(b) | 200,000 | 192,000 | ||||||
Dominican Republic International Bond (Dominican Repubic), | 100,000 | 107,500 | ||||||
Sr. Unsec. Notes, | 403,308 | 442,631 | ||||||
| Principal Amount | Value | |||||||
| Sovereign Debt–(continued) | ||||||||
Guatemala Government Bond (Guatemala), | $ | 520,000 | $ | 653,900 | ||||
REGS, Sr. Unsec. Euro Bonds, 8.13%, 10/06/19(b)(f) | 90,000 | 113,175 | ||||||
Hungary Government International Bond (Hungary), Sr. Unsec. Global Notes, 4.13%, 02/19/18 | 300,000 | 290,817 | ||||||
4.75%, 02/03/15 | 60,000 | 61,725 | ||||||
5.38%, 02/21/23 | 400,000 | 377,366 | ||||||
Indonesia Government International Bond (Indonesia), | 300,000 | 281,250 | ||||||
Sr. Unsec. Notes, | 300,000 | 241,500 | ||||||
3.75%, 04/25/22(b) | 300,000 | 254,250 | ||||||
Ivory Coast Government International Bond (Ivory Coast), REGS, Sr. Unsec. Euro Bonds, 7.10%, 12/31/32(b)(d) | 330,000 | 282,150 | ||||||
Lithuania Government International Bond (Lithuania), Sr. Unsec. Notes, 6.13%, 03/09/21(b) | 200,000 | 223,000 | ||||||
Mexico Government International Bond (Mexico), | 2,150,000 | 2,092,549 | ||||||
Sr. Unsec. Medium-Term Global Notes, 4.75%, 03/08/44 | 310,000 | 271,715 | ||||||
Series A, Sr. Unsec. Medium-Term Global Notes, 6.05%, 01/11/40 | 300,000 | 317,250 | ||||||
Namibia International Bonds (Namibia), Sr. Unsec. Notes, 5.50%, 11/03/21(b) | 200,000 | 203,000 | ||||||
Nigeria Government International Bond (Nigeria), Sr. Unsec. Bonds, 5.13%, 07/12/18(b) | 200,000 | 202,000 | ||||||
6.38%, 07/12/23(b) | 200,000 | 202,250 | ||||||
Panama Government International Bond (Panama), Sr. Unsec. Global Bonds, 5.20%, 01/30/20 | 1,250,000 | 1,356,250 | ||||||
Perusahaan Penerbit SBSN (Indonesia), Sr. Unsec. Notes, 4.00%, 11/21/18(b) | 200,000 | 188,000 | ||||||
Peruvian Government International Bond (Peru), Sr. Unsec. Global Bonds, 8.75%, 11/21/33 | 436,000 | 606,040 | ||||||
Philippine Government International Bond (Philippines), Sr. Unsec. Global Bonds, 5.00%, 01/13/37 | 300,000 | 312,180 | ||||||
Poland Government International Bond (Poland), Sr. Unsec. Global Notes, | 60,000 | 62,910 | ||||||
5.13%, 04/21/21 | 220,000 | 233,475 | ||||||
Provincia de Buenos Aires (Argentina), Sr.Unsec. Notes, 11.75%, 10/05/15(b) | 300,000 | 265,500 | ||||||
Qatar Government International Bond (Qatar), Sr. Unsec. Notes, 6.40%, 01/20/40(b) | 1,100,000 | 1,226,500 | ||||||
See accompanying Notes to Financial Statements which are an integral part of the financial statements.
21 Invesco Core Plus Bond Fund
| Principal Amount | Value | |||||||
| Sovereign Debt–(continued) | ||||||||
Republic of Angola Via Northern Lights III BV (Angola), REGS, Sr. Unsec. Euro Notes, 7.00%, 08/16/19(b) | $ | 450,000 | $ | 478,687 | ||||
Republic of Paraguay (Paraguay), Sr. Unsec. Bonds, | 400,000 | 368,000 | ||||||
Republic of Serbia (Serbia), Sr. Unsec. Bonds, 4.88%, 02/25/20(b) | 200,000 | 182,040 | ||||||
Romanian Government International Bond (Romania), Sr. Unsec. Notes, | 230,000 | 216,057 | ||||||
6.75%, 02/07/22(b) | 110,000 | 122,535 | ||||||
Russian Foreign Bond (Russia), Sr. Unsec. Euro Notes, | 1,700,000 | 1,772,250 | ||||||
5.00%, 04/29/20(b) | 600,000 | 633,600 | ||||||
South Africa Government International Bond (South Africa), Sr. Unsec. Global Notes, 5.88%, 05/30/22 | 100,000 | 104,063 | ||||||
Sri Lanka Government International Bond (Sri Lanka), | 150,000 | 143,625 | ||||||
REGS, Unsec. Euro Notes, 7.40%, 01/22/15(b) | 150,000 | 157,125 | ||||||
Turkey Government International Bond (Turkey), | 150,000 | 151,163 | ||||||
Sr. Unsec. Global Notes, 6.75%, 05/30/40 | 100,000 | 98,750 | ||||||
8.00%, 02/14/34 | 325,000 | 368,144 | ||||||
Unsec. Global Notes, 4.88%, 04/16/43 | 200,000 | 156,550 | ||||||
5.13%, 03/25/22 | 200,000 | 192,550 | ||||||
6.00%, 01/14/41 | 200,000 | 179,500 | ||||||
Ukraine Government International Bond (Ukraine), | 750,000 | 644,062 | ||||||
Sr. Unsec. Notes, | 150,000 | 134,063 | ||||||
Uruguay Government International Bond (Uruguay), Unsec. Global Notes, 8.00%, 11/18/22 | 763,519 | 942,946 | ||||||
Venezuela Government International Bond (Venezuela), | 195,000 | 158,632 | ||||||
REGS, Sr. Unsec. Euro Bonds, 11.75%, 10/21/26(b) | 700,000 | 637,000 | ||||||
REGS, Sr. Unsec. Euro Notes, 12.75%, 08/23/22(b) | 700,000 | 696,500 | ||||||
Vietnam Government International Bond (Vietnam), Sr. Unsec. Bonds, 6.75%, 01/29/20(b) | 100,000 | 105,316 | ||||||
Vnesheconombank Via VEB Finance PLC (Russia), Sr. Unsec. Notes, 6.03%, 07/05/22(b) | 200,000 | 202,400 | ||||||
| Principal Amount | Value | |||||||
| Sovereign Debt–(continued) | ||||||||
Wakala Global Sukuk Bhd (Malaysia), Sr. Unsec. Bonds, 2.99%, 07/06/16(b) | $ | 250,000 | $ | 259,884 | ||||
| 24,012,054 | ||||||||
| Specialized Finance–2.20% | ||||||||
Air Lease Corp., | 115,000 | 123,510 | ||||||
Sr. Unsec. Gtd. Global Notes, 4.75%, 03/01/20 | 77,000 | 76,808 | ||||||
Aircastle Ltd., Sr. Unsec. Global Notes, 6.25%, 12/01/19 | 10,000 | 10,475 | ||||||
6.75%, 04/15/17 | 110,000 | 116,875 | ||||||
7.63%, 04/15/20 | 195,000 | 216,937 | ||||||
CIT Group Inc., | 125,000 | 118,437 | ||||||
5.25%, 03/15/18 | 90,000 | 93,150 | ||||||
Sr. Unsec. Notes, | 205,000 | 211,150 | ||||||
International Lease Finance Corp., Sr. Sec. Gtd. Notes, 6.50%, 09/01/14(b) | 1,915,000 | 1,997,584 | ||||||
Sr. Unsec. Global Notes, 4.63%, 04/15/21 | 65,000 | 59,963 | ||||||
4.88%, 04/01/15 | 1,050,000 | 1,080,844 | ||||||
5.75%, 05/15/16 | 400,000 | 420,500 | ||||||
5.88%, 04/01/19 | 20,000 | 20,338 | ||||||
5.88%, 08/15/22 | 155,000 | 151,222 | ||||||
8.75%, 03/15/17 | 85,000 | 96,177 | ||||||
Sr. Unsec. Notes, | 155,000 | 173,212 | ||||||
Moody’s Corp., Sr. Unsec. Global Notes, 4.88%, 02/15/24 | 4,595,000 | 4,543,608 | ||||||
National Rural Utilities Cooperative Finance Corp., Sr. Sec. Collateral Trust Global Bonds, 10.38%, 11/01/18 | 2,130,000 | 2,920,463 | ||||||
Waha Aerospace B.V. (United Arab Emirates), Sr. Unsec. Gtd. Bonds, 3.93%, 07/28/20(b) | 70,000 | 73,444 | ||||||
| 12,504,697 | ||||||||
| Specialized REIT’s–1.63% | ||||||||
American Tower Corp., | 1,250,000 | 1,123,297 | ||||||
4.63%, 04/01/15 | 430,000 | 450,009 | ||||||
Sr. Unsec. Notes, | 100,000 | 105,544 | ||||||
EPR Properties, Sr. Unsec. Gtd. Global Notes, 7.75%, 07/15/20 | 3,880,000 | 4,374,522 | ||||||
Geo Group Inc. (The), Sr. Unsec. Gtd. Notes, 5.13%, 04/01/23(b) | 50,000 | 46,250 | ||||||
MPT Operating Partnership L.P./MPT Finance Corp., Sr. Unsec. Gtd. Global Notes, 6.88%, 05/01/21 | 65,000 | 69,225 | ||||||
See accompanying Notes to Financial Statements which are an integral part of the financial statements.
22 Invesco Core Plus Bond Fund
| Principal Amount | Value | |||||||
| Specialized REIT’s–(continued) | ||||||||
RHP Hotel Properties L.P./RHP Finance Corp., Sr. Unsec. Gtd. Notes, 5.00%, 04/15/21(b) | $ | 115,000 | $ | 107,525 | ||||
Senior Housing Properties Trust, Sr. Unsec. Notes, 4.30%, 01/15/16 | 1,495,000 | 1,549,194 | ||||||
Ventas Realty L.P./Ventas Capital Corp., Sr. Unsec. Gtd. Notes, 2.00%, 02/15/18 | 1,500,000 | 1,454,499 | ||||||
| 9,280,065 | ||||||||
| Specialty Chemicals–0.07% | ||||||||
Chemtura Corp., Sr. Unsec. Gtd. Notes, 5.75%, 07/15/21 | 51,000 | 50,745 | ||||||
Ferro Corp., Sr. Unsec. Notes, 7.88%, 08/15/18 | 63,000 | 67,252 | ||||||
Magnetation LLC/ Mag Finance Corp., Sr. Sec. Gtd. Notes, 11.00%, 05/15/18(b) | 45,000 | 43,200 | ||||||
PolyOne Corp., Sr. Unsec. Notes, 5.25%, 03/15/23(b) | 220,000 | 212,300 | ||||||
PQ Corp., Sr. Sec. Notes, 8.75%, 05/01/18(b) | 35,000 | 37,013 | ||||||
| 410,510 | ||||||||
| Steel–0.86% | ||||||||
ArcelorMittal (Luxembourg), Sr. Unsec. Global Notes, | 30,000 | 30,933 | ||||||
5.00%, 02/25/17 | 400,000 | 412,717 | ||||||
6.13%, 06/01/18 | 845,000 | 873,358 | ||||||
6.75%, 02/25/22 | 20,000 | 20,437 | ||||||
7.25%, 03/01/41 | 1,280,000 | 1,160,475 | ||||||
Commercial Metals Co., Sr. Unsec. Notes, 4.88%, 05/15/23 | 20,000 | 18,000 | ||||||
OJSC Novolipetsk Steel via Steel Funding Ltd. (Russia), Unsec. Bonds, 4.45%, 02/19/18(b) | 500,000 | 484,520 | ||||||
Samarco Mineracao S.A. (Brazil), Sr. Unsec. Notes, | 300,000 | 254,903 | ||||||
Steel Dynamics Inc., Sr. Unsec. Gtd. Global Notes, 6.13%, 08/15/19 | 60,000 | 62,850 | ||||||
SunCoke Energy Partners L.P./SunCoke Energy Partners Finance Corp., Sr. Unsec. Gtd. Notes, 7.38%, 02/01/20(b) | 138,000 | 143,865 | ||||||
United States Steel Corp., | 160,000 | 160,800 | ||||||
Sr. Unsec. Notes, | 50,000 | 52,875 | ||||||
Vale Overseas Ltd. (Brazil), Sr. Unsec. Gtd. Global Notes, 4.63%, 09/15/20 | 730,000 | 728,327 | ||||||
Vale S.A. (Brazil), Sr. Unsec. Global Notes, 5.63%, 09/11/42 | 600,000 | 502,660 | ||||||
| 4,906,720 | ||||||||
| Principal Amount | Value | |||||||
| Technology Distributors–0.01% | ||||||||
Anixter Inc., Sr. Unsec. Gtd. Global Notes, 5.63%, 05/01/19 | $ | 50,000 | $ | 51,875 | ||||
| Tires & Rubber–0.04% | ||||||||
Cooper Tire & Rubber Co., Sr. Unsec. Notes, 8.00%, 12/15/19 | 45,000 | 47,025 | ||||||
Gajah Tunggal Tbk PT (Indonesia), Sr. Sec. Gtd. Notes, 7.75%, 02/06/18(b) | 200,000 | 194,111 | ||||||
| 241,136 | ||||||||
| Tobacco–0.34% | ||||||||
Altria Group, Inc., Sr. Unsec. Gtd. Global Notes, 4.75%, 05/05/21 | 1,845,000 | 1,952,560 | ||||||
| Trading Companies & Distributors–0.02% | ||||||||
United Rentals North America Inc., Sr. Sec. Gtd. Global Notes, 5.75%, 07/15/18 | 5,000 | 5,363 | ||||||
Sr. Unsec. Global Notes, 8.25%, 02/01/21 | 65,000 | 71,987 | ||||||
Sr. Unsec. Gtd. Notes, 6.13%, 06/15/23 | 25,000 | 24,563 | ||||||
| 101,913 | ||||||||
| Trucking–0.23% | ||||||||
Avis Budget Car Rental LLC/Avis Budget Finance Inc., Sr. Unsec. Gtd. Global Notes, | 120,000 | 131,250 | ||||||
9.75%, 03/15/20 | 15,000 | 17,269 | ||||||
Hertz Corp. (The), Sr. Unsec. Gtd. Global Notes, | 100,000 | 102,750 | ||||||
6.75%, 04/15/19 | 120,000 | 128,550 | ||||||
7.38%, 01/15/21 | 25,000 | 27,094 | ||||||
Ryder System, Inc., Sr. Unsec. Medium-Term Notes, 3.15%, 03/02/15 | 860,000 | 886,205 | ||||||
| 1,293,118 | ||||||||
| Wireless Telecommunication Services–1.32% | ||||||||
America Movil S.A.B. de C.V. (Mexico), Sr. Unsec. Global Notes, 4.38%, 07/16/42 | 200,000 | 157,417 | ||||||
Sr. Unsec. Gtd. Global Notes, 6.13%, 03/30/40 | 1,115,000 | 1,156,585 | ||||||
Bharti Airtel International Netherlands B.V. (India), Sr. Unsec. Gtd. Notes, 5.13%, 03/11/23(b) | 400,000 | 334,000 | ||||||
Cricket Communications, Inc., Sr. Unsec. Gtd. Global Notes, 7.75%, 10/15/20 | 317,000 | 361,776 | ||||||
Crown Castle Towers LLC, Sr. Sec. Gtd. Notes, | 25,000 | 25,745 | ||||||
4.88%, 08/15/20(b) | 1,835,000 | 1,910,690 | ||||||
Digicel Ltd. (Jamaica), Sr. Unsec. Notes, 6.00%, 04/15/21(b) | 200,000 | 198,500 | ||||||
See accompanying Notes to Financial Statements which are an integral part of the financial statements.
23 Invesco Core Plus Bond Fund
| Principal Amount | Value | |||||||
| Wireless Telecommunication Services–(continued) | ||||||||
MetroPCS Wireless Inc., Sr. Unsec. Gtd. Notes, | $ | 75,000 | $ | 75,187 | ||||
6.63%, 11/15/20 | 255,000 | 266,475 | ||||||
6.63%, 04/01/23(b) | 75,000 | 74,812 | ||||||
7.88%, 09/01/18 | 20,000 | 21,750 | ||||||
Rogers Communications Inc. (Canada), Sr. Unsec. Gtd. Global Notes, 4.50%, 03/15/43 | 695,000 | 606,584 | ||||||
SBA Communications Corp., Sr. Unsec. Global Notes, 5.63%, 10/01/19 | 55,000 | 54,313 | ||||||
Sprint Capital Corp., Sr. Unsec. Gtd. Global Notes, | 320,000 | 290,400 | ||||||
6.90%, 05/01/19 | 107,000 | 110,745 | ||||||
Sprint Communications Inc., | 95,000 | 89,062 | ||||||
7.00%, 08/15/20 | 74,000 | 76,775 | ||||||
11.50%, 11/15/21 | 15,000 | 19,725 | ||||||
Sr. Unsec. Gtd. Notes, 7.00%, 03/01/20(b) | 105,000 | 113,400 | ||||||
9.00%, 11/15/18(b) | 40,000 | 47,000 | ||||||
VimpelCom Holdings B.V. (Russia), Sr. Unsec. Gtd. Notes, 5.20%, 02/13/19(b) | 300,000 | 292,129 | ||||||
5.95%, 02/13/23(b) | 300,000 | 268,568 | ||||||
7.50%, 03/01/22(b) | 600,000 | 609,000 | ||||||
Wind Acquisition Finance S.A. (Italy), Sec. Gtd. Notes, 11.75%, 07/15/17(b) | 300,000 | 315,000 | ||||||
| 7,475,638 | ||||||||
Total U.S. Dollar Denominated Bonds and Notes (Cost $335,615,310) |
| 332,184,488 | ||||||
U.S. Government Sponsored Mortgage-Backed Securities–25.17% |
| |||||||
| Collateralized Mortgage Obligations–0.28% | ||||||||
Fannie Mae REMICs, | 991,579 | 1,008,149 | ||||||
Fannie Mae REMICs, IO, 7.00%, 05/25/33 | 28,337 | 6,807 | ||||||
Fannie Mae REMICS, IO, 6.00%, 07/25/33 | 29,054 | 5,994 | ||||||
Federal Deposit Insurance Co., Series 2010-S1, Class 1A, Gtd. Notes, 0.73%, 02/25/48 (Acquired 03/05/10; Cost $580,935)(b)(g) | 580,935 | 581,813 | ||||||
Freddie Mac REMICS, 5.00%, 11/15/17 | 12,293 | 12,351 | ||||||
| 1,615,114 | ||||||||
| Principal Amount | Value | |||||||
| Federal Home Loan Mortgage Corp. (FHLMC)–12.03% | ||||||||
Federal Home Loan | ||||||||
Pass Through Ctfs., | ||||||||
6.00%, 08/01/14 to 02/01/34 | $ | 700,748 | $ | 767,507 | ||||
5.50%, 05/01/16 to 07/01/40 | 8,626,377 | 9,438,831 | ||||||
6.50%, 05/01/16 to 09/01/36 | 1,569,931 | 1,761,607 | ||||||
7.00%, 06/01/16 to 10/01/34 | 2,758,985 | 3,114,563 | ||||||
7.50%, 04/01/17 to 05/01/35 | 1,183,435 | 1,403,583 | ||||||
3.50%, 08/01/26 | 2,432,503 | 2,550,191 | ||||||
8.50%, 08/01/31 | 106,928 | 129,858 | ||||||
8.00%, 08/01/32 | 90,606 | 108,648 | ||||||
5.00%, 07/01/34 to 06/01/40 | 9,062,711 | 9,829,493 | ||||||
4.50%, 06/01/41 | 5,813,839 | 6,134,864 | ||||||
Pass Through Ctfs., TBA, | ||||||||
3.50%, 09/01/43(h) | 17,500,000 | 17,447,363 | ||||||
4.00%, 09/01/43(h) | 10,100,000 | 10,415,625 | ||||||
Pass Through Ctfs., ARM, | ||||||||
2.85%, 12/01/36(g) | 251,426 | 267,339 | ||||||
3.00%, 02/01/37(g) | 79,578 | 84,914 | ||||||
2.63%, 05/01/37(g) | 502,926 | 533,293 | ||||||
2.37%, 06/01/43(g) | 4,446,433 | 4,336,414 | ||||||
| 68,324,093 | ||||||||
| Federal National Mortgage Association (FNMA)–11.97% | ||||||||
Federal National | ||||||||
Pass Through Ctfs., | ||||||||
7.50%, 11/01/15 to 08/01/37 | 1,520,780 | 1,764,024 | ||||||
7.00%, 12/01/15 to 02/01/34 | 1,404,049 | 1,589,573 | ||||||
6.50%, 05/01/16 to 01/01/37 | 480,104 | 531,777 | ||||||
6.00%, 05/01/17 to 10/01/39 | 255,140 | 278,467 | ||||||
5.00%, 03/01/18 to 12/01/39 | 2,888,840 | 3,127,819 | ||||||
5.50%, 11/01/18 to 06/01/40 | 4,246,131 | 4,637,722 | ||||||
8.00%, 08/01/21 to 04/01/33 | 207,982 | 246,604 | ||||||
9.50%, 04/01/30 | 48,245 | 57,263 | ||||||
8.50%, 10/01/32 | 166,695 | 205,030 | ||||||
Pass Through Ctfs., ARM, | ||||||||
2.34%, 05/01/35(g) | 778,789 | 825,578 | ||||||
2.53%, 01/01/37(g) | 374,575 | 397,193 | ||||||
2.61%, 03/01/38(g) | 198,205 | 209,630 | ||||||
Pass Through Ctfs., TBA, | ||||||||
3.00%, 09/01/28 to 10/01/43(h) | 14,200,000 | 13,819,886 | ||||||
3.50%, 09/01/43(h) | 4,100,000 | 4,100,000 | ||||||
4.50%, 09/01/43(h) | 21,600,000 | 22,822,595 | ||||||
4.00%, 10/01/43(h) | 12,960,000 | 13,352,851 | ||||||
| 67,966,012 | ||||||||
See accompanying Notes to Financial Statements which are an integral part of the financial statements.
24 Invesco Core Plus Bond Fund
| Principal Amount | Value | |||||||
| Government National Mortgage Association (GNMA)–0.89% | ||||||||
Government National Mortgage Association, | ||||||||
7.50%, 06/15/23 to 05/15/32 | $ | 52,455 | $ | 58,533 | ||||
9.00%, 09/15/24 to 10/15/24 | 23,127 | 23,369 | ||||||
8.50%, 02/15/25 | 7,521 | 7,652 | ||||||
8.00%, 08/15/25 to 09/15/26 | 89,546 | 100,400 | ||||||
6.56%, 01/15/27 | 168,587 | 192,684 | ||||||
7.00%, 04/15/28 to 09/15/32 | 463,129 | 535,495 | ||||||
6.00%, 11/15/28 to 02/15/33 | 155,394 | 173,056 | ||||||
6.50%, 01/15/29 to 09/15/34 | 343,256 | 383,708 | ||||||
5.50%, 06/15/35 | 255,761 | 279,599 | ||||||
5.00%, 07/15/35 to 08/15/35 | 76,008 | 82,210 | ||||||
Pass Through Ctfs., ARM, | ||||||||
2.00%, 01/20/25 to | 92,599 | 96,323 | ||||||
3.00%, 06/20/25(g) | 11,032 | 11,433 | ||||||
Pass Through Ctfs., TBA, | ||||||||
4.00%, 09/01/43(h) | 3,000,000 | 3,123,750 | ||||||
| 5,068,212 | ||||||||
Total U.S. Government Sponsored Mortgage-Backed Securities (Cost $141,759,365) |
| 142,973,431 | ||||||
Asset-Backed Securities–19.22% |
| |||||||
AmeriCredit Automobile Receivables Trust, Series 2011-2, Class D, Pass Through Ctfs., 4.00%, 05/08/17 | 3,135,000 | 3,255,470 | ||||||
Banc of America Mortgage Securities Inc., Series 2005-12, Class A2, Floating Rate Pass Through Ctfs., 1.08%, 01/25/36(g) | 666,559 | 585,128 | ||||||
Bear Stearns Adjustable Rate Mortgage Trust, Series 2003-6, Class 1A3, Floating Rate Pass Through Ctfs., 2.31%, 08/25/33(g) | 763,361 | 751,655 | ||||||
Bear Stearns Commercial Mortgage Securities, | 43,431 | 45,365 | ||||||
Series 2006-PW11, Class AAB, Variable Rate Pass Through Ctfs., 5.61%, 03/11/39(g) | 17,258 | 17,506 | ||||||
CGBAM Commercial Mortgage Trust, Series 2013-BREH, Class B, Floating Rate Pass Through Ctfs., 1.99%, 05/15/30(b)(g) | 2,570,000 | 2,576,235 | ||||||
Citigroup Mortgage Loan Trust, Inc., Series 2004-UST1, Class A4, Floating Rate Pass Through Ctfs., 2.30%, 08/25/34(g) | 2,359,224 | 2,358,899 | ||||||
COMM Mortgage Trust, | 3,990,000 | 3,631,074 | ||||||
Series 2013-THL, Class A2, Floating Rate Pass Through Ctfs., 1.24%, 06/08/30(b)(g) | 2,875,000 | 2,872,082 | ||||||
Countrywide Asset-Backed Ctfs., Series 2003-1, Class 3A, Floating Rate Pass Through Ctfs., 0.86%, 06/25/33(g) | 178,442 | 170,526 | ||||||
| Principal Amount | Value | |||||||
Countrywide Home Loans Mortgage Pass Through Trust, Series 2007-13, Class A10, Pass Through Ctfs., 6.00%, 08/25/37 | $ | 1,236,960 | $ | 1,109,653 | ||||
Credit Suisse Mortgage Trust, Series 2009-2R, Class 1A11, Floating Rate Pass Through Ctfs., 2.63%, 09/26/34(b)(g) | 696,960 | 700,880 | ||||||
Series 2010-6R, Class 1A1, Pass Through Ctfs., 5.50%, 02/27/37 (Acquired 03/01/10; Cost $292,406)(b) | 283,890 | 297,641 | ||||||
First Horizon Alternative Mortgage Securities, | 435,733 | 446,668 | ||||||
Series 2006-FA5, Class A3, Pass Through Ctfs., 6.25%, 08/25/36 | 515,733 | 434,640 | ||||||
Fontainebleau Miami Beach Trust, Series 2012, Class B, Pass Through Ctfs., 3.88%, 05/05/27(b) | 3,000,000 | 3,080,921 | ||||||
GS Mortgage Securities Corp. II, Series 2005-GG4, Class A4A, Pass Through Ctfs., 4.75%, 07/10/39 | 2,760,000 | 2,882,167 | ||||||
GS Mortgage Securities Corp. Trust, Series 2012-ALOH, Class B, Pass Through Ctfs., 4.05%, 04/10/34(b) | 1,500,000 | 1,490,782 | ||||||
GS Mortgage Securities Trust, Series 2013-GC14, Class B, Floating Rate Pass Through Ctfs., 4.94%, 08/10/46(b)(g) | 4,000,000 | 4,060,260 | ||||||
Harborview Mortgage Loan Trust, Series 2005-9, Class 2A1C, Floating Rate Pass Through Ctfs., 0.63%, 06/20/35(g) | 49,351 | 42,613 | ||||||
JP Morgan Chase Commercial Mortgage Securities Corp., Series 2012-LC9, Class B, Variable Rate Pass Through Ctfs., 3.81%, 12/15/47(b)(g) | 5,000,000 | 4,720,205 | ||||||
JP Morgan Chase Commercial Mortgage Securities Trust, | 900,000 | 987,823 | ||||||
Series 2013-C13, Class C, Variable Rate Pass Through Ctfs., 4.19%, 01/15/46(g) | 5,631,000 | 5,072,864 | ||||||
JPMBB Commercial Mortgage Securities Trust, Series 2013-C12, Class A, Variable Rate Pass Through Ctfs., 4.22%, 07/15/45(g) | 546,292 | 492,292 | ||||||
LB-UBS Commercial Mortgage Trust, Series 2005-C1, Class A4, Pass Through Ctfs., 4.74%, 02/15/30 | 780,000 | 809,872 | ||||||
Series 2006-C1, Class A4, Pass Through Ctfs., 5.16%, 02/15/31 | 845,000 | 908,225 | ||||||
Series 2006-C7, Class A3, Pass Through Ctfs., 5.35%, 11/15/38 | 300,000 | 330,290 | ||||||
Lehman Mortgage Trust, Series 2006-1, Class 3A5, Pass Through Ctfs., 5.50%, 02/25/36 | 793,551 | 781,315 | ||||||
See accompanying Notes to Financial Statements which are an integral part of the financial statements.
25 Invesco Core Plus Bond Fund
| Principal Amount | Value | |||||||
MBNA Credit Card Master Note Trust, Series 2004-B1, Pass Through Ctfs., 4.45%, 08/15/16 | $ | 4,200,000 | $ | 4,284,481 | ||||
Morgan Stanley Capital I Trust, Series 2005-HQ5, Class A3, Pass Through Ctfs., 5.01%, 01/14/42 | 1,987 | 1,995 | ||||||
Series 2005-HQ7, Class A4, Variable Rate Pass Through Ctfs., 5.38%, 11/14/42(g) | 35,000 | 37,293 | ||||||
Series 2005-HQ7, Class AJ, Variable Rate Pass Through Ctfs., 5.38%, 11/14/42(g) | 2,615,000 | 2,728,499 | ||||||
Series 2005-T19, Class A4A, Pass Through Ctfs., 4.89%, 06/12/47 | 2,638,000 | 2,785,554 | ||||||
Provident Bank Home Equity Loan Trust, Series 2000-2, Class A1, Floating Rate Pass Through Ctfs., 0.72%, 08/25/31(g) | 359,860 | 247,248 | ||||||
RBSCF Trust, Series 2010-RR3, Class MS4A, Variable Rate Pass Through Ctfs., 4.97%, 04/16/40(b)(g) | 2,947,893 | 3,010,816 | ||||||
Santander Drive Auto Receivables Trust, Series 2011-1, Class D, Pass Through Ctfs., 4.01%, 02/15/17 | 1,545,000 | 1,587,631 | ||||||
Series 2012-6, Class A2, Pass Through Ctfs., 0.47%, 09/15/15 | 1,654,572 | 1,654,121 | ||||||
Sequoia Mortgage Trust, | 3,092,520 | 2,715,498 | ||||||
Series 2013-4, Class A3, Variable Rate Pass Through Ctfs., 1.55%, 04/25/43(g) | 2,879,969 | 2,783,763 | ||||||
Series 2013-6, Class A2, Variable Rate Pass Through Ctfs., 3.00%, 05/25/43(g) | 3,841,897 | 3,681,947 | ||||||
Series 2013-7, Class A2, Variable Rate Pass Through Ctfs., 3.00%, 06/25/43(g) | 2,499,851 | 2,345,242 | ||||||
Shellpoint Asset Funding Trust, Series 2013-1, Class A3, Floating Rate Pass Through Ctfs., 3.75%, 07/25/43(b)(g) | 4,787,044 | 4,609,866 | ||||||
Sierra Timeshare Receivables Funding LLC, Series 2013-2, Class 2A, Pass Through Ctfs., 2.28%, 11/20/25(b) | 2,438,422 | 2,433,376 | ||||||
Specialty Underwriting & Residential Finance Trust, Series 2004-BC2, Class A2, Floating Rate Pass Through Ctfs., 0.72%, 05/25/35(g) | 41,645 | 38,069 | ||||||
Structured Adjustable Rate Mortgage Loan Trust, Series 2007-3, Class 4A2, Floating Rate Pass Through Ctfs., 5.04%, 04/25/47(g) | 1,064,316 | 699,778 | ||||||
Structured Asset Investment Loan Trust, Series 2003-BC12, Class 3A, Floating Rate Pass Through Ctfs., 0.92%, 11/25/33(g) | 27,024 | 25,895 | ||||||
Suntrust Alternative Loan Trust, Series 2005-1F, Class 2A8, Pass Through Ctfs., 6.00%, 12/25/35 | 810,858 | 736,011 | ||||||
| Principal Amount | Value | |||||||
Wachovia Bank Commercial Mortgage Trust, | $ | 3,670,000 | $ | 3,855,952 | ||||
Series 2005-C21, Class A4, Variable Rate Pass Through Ctfs., 5.41%, 10/15/44(g) | 1,312,600 | 1,400,824 | ||||||
Series 2005-C21, Class AJ, Variable Rate Pass Through Ctfs., 5.41%, 10/15/44(g) | 1,515,000 | 1,596,306 | ||||||
Series 2005-C21, Class AM, Variable Rate Pass Through Ctfs., 5.41%, 10/15/44(g) | 1,680,000 | 1,785,911 | ||||||
Series 2005-C22, Class A4, Variable Rate Pass Through Ctfs., 5.47%, 12/15/44(g) | 2,000,000 | 2,141,362 | ||||||
WaMu Mortgage Pass Through Ctfs., Series 2003-AR8, Class A, Floating Rate Pass Through Ctfs., 2.45%, 08/25/33(g) | 1,688,370 | 1,691,264 | ||||||
Series 2005-AR10, Class 1A3, Floating Rate Pass Through Ctfs., 2.44%, 09/25/35(g) | 525,000 | 473,196 | ||||||
Wells Fargo Mortgage Backed Securities Trust, | 1,463,091 | 1,448,139 | ||||||
Series 2004-Z, Class 2A1, Floating Rate Pass Through Ctfs., 2.62%, 12/25/34(g) | 1,872,329 | 1,873,456 | ||||||
WFRBS Commercial Mortgage Trust, Series 2011-C5, Class B, Variable Rate Pass Through Ctfs., 5.82%, 11/15/44(b)(g) | 5,000,000 | 5,469,183 | ||||||
Series 2013-C12, Class A2, Pass Throught Ctfs., 2.07%, 03/15/48 | 2,415,000 | 2,387,257 | ||||||
Series 2013-C15, Class B, Variable Rate Pass Through Ctfs., 4.64%, 08/15/46(g) | 3,800,000 | 3,737,425 | ||||||
Total Asset-Backed Securities |
| 109,180,409 | ||||||
U.S. Treasury Securities–7.26% |
| |||||||
| U.S. Treasury Bills–0.32% | ||||||||
0.08%, 05/01/14(i)(j) | 1,050,000 | 1,049,509 | ||||||
0.09%, 05/01/14(i)(j) | 275,000 | 274,872 | ||||||
0.10%, 05/01/14(i)(j) | 100,000 | 99,953 | ||||||
0.11%, 05/01/14(i)(j) | 400,000 | 399,813 | ||||||
| 1,824,147 | ||||||||
| U.S. Treasury Notes–5.00% | ||||||||
1.38%, 06/30/18 | 3,875,000 | 3,839,118 | ||||||
1.38%, 07/31/18 | 13,260,000 | 13,118,590 | ||||||
2.50%, 08/15/23 | 11,689,000 | 11,410,224 | ||||||
| 28,367,932 | ||||||||
See accompanying Notes to Financial Statements which are an integral part of the financial statements.
26 Invesco Core Plus Bond Fund
| Principal Amount | Value | |||||||
| U.S. Treasury Bonds–1.94% | ||||||||
2.88%, 05/15/43 | $13,033,000 | $ 11,027,706 | ||||||
Total U.S. Treasury Securities |
| 41,219,785 | ||||||
| Shares | ||||||||
Preferred Stocks–1.75% |
| |||||||
| Consumer Finance–0.00% | ||||||||
Ally Financial, Inc., Series G, 7.00% Pfd.(b) | 4 | 3,743 | ||||||
| Diversified Banks–0.93% | ||||||||
CoBank ACB, Series F, 6.25% Pfd.(b) | 20,000 | 2,044,376 | ||||||
Royal Bank of Scotland Group PLC (The) (United Kingdom), Series T, | 3,910 | 89,695 | ||||||
Wells Fargo & Co., | 130,000 | 3,140,800 | ||||||
| 5,274,871 | ||||||||
| Investment Banking & Brokerage–0.54% | ||||||||
Goldman Sachs Group, Inc. (The), Series J, 5.50% Pfd. | 135,000 | 3,057,750 | ||||||
| Multi-Line Insurance–0.02% | ||||||||
Hartford Financial Services Group Inc. (The), 7.88% Jr. Sub. Pfd. | 4,070 | 113,268 | ||||||
| Office REIT’s–0.00% | ||||||||
DuPont Fabros Technology, Inc., Series B, 7.63% Pfd. | 200 | 4,854 | ||||||
| Regional Banks–0.13% | ||||||||
PNC Financial Services Group, Inc. (The), Series P, 6.13% Pfd. | 27,000 | 688,770 | ||||||
Zions Bancorp., Series H, 5.75% Pfd. | 2,000 | 43,860 | ||||||
| 732,630 | ||||||||
| Reinsurance–0.13% | ||||||||
Reinsurance Group of America, Inc., 6.20% Sr. Unsec. Sub. Pfd. | 30,000 | 721,800 | ||||||
| Tires & Rubber–0.00% | ||||||||
Goodyear Tire & Rubber Co. (The), $2.94 Conv. Pfd. | 165 | 9,686 | ||||||
Total Preferred Stocks |
| 9,918,602 | ||||||
| Principal Amount | ||||||||
Non-U.S. Dollar Denominated |
| |||||||
| Broadcasting–0.03% | ||||||||
Central European Media Enterprises Ltd. (Czech Republic), REGS, Jr. Sec. Gtd. Euro Notes, 11.63%, 09/15/16(b) | EUR | 100,000 | 140,090 | |||||
| Casinos & Gaming–0.02% | ||||||||
Codere Finance Luxembourg S.A. (Spain), REGS, Sr. Sec. Gtd. Euro Notes, 8.25%, 06/15/15(b) | EUR | 50,000 | 33,409 | |||||
| Principal Amount | Value | |||||||
| Casinos & Gaming–(continued) | ||||||||
Great Canadian Gaming Corp. (Canada), Sr. Unsec. Gtd. Notes, 6.63%, 07/25/22(b) | CAD | 75,000 | $ | 72,807 | ||||
| 106,216 | ||||||||
| Diversified Banks–0.03% | ||||||||
Export-Import Bank of Korea (South Korea), Sr. Unsec. Notes, 4.00%, 11/26/15(b) | PHP | 3,300,000 | 75,829 | |||||
Itau Unibanco Holding S.A. (Brazil), Sr. Unsec. Notes, 10.50%, 11/23/15(b) | BRL | 150,000 | 60,973 | |||||
| 136,802 | ||||||||
| Electric Utilities–0.04% | ||||||||
RusHydro JSC via RusHydro Finance Ltd. (Russia), Sr. Unsec. Medium-Term Euro Loan Participation Notes, 7.88%, 10/28/15 | RUB | 8,000,000 | 238,260 | |||||
| Food Distributors–0.03% | ||||||||
Bakkavor Finance 2 PLC (United Kingdom), REGS, Sr. Sec. Gtd. Euro Notes, 8.25%, 02/15/18(b) | GBP | 100,000 | 162,331 | |||||
| Independent Power Producers & Energy Traders–0.03% | ||||||||
Infinis PLC (United Kingdom), Sr. Sec. Notes, 7.00%, 02/15/19(b) | GBP | 100,000 | 161,169 | |||||
| Investment Banking & Brokerage–0.02% | ||||||||
Morgan Stanley (United States), Sr. Unsec. Notes, 10.09%, 05/03/17(b) | BRL | 340,000 | 134,287 | |||||
| Leisure Facilities–0.02% | ||||||||
Cirsa Funding Luxembourg S.A. (Spain), REGS, Sr. Unsec. Gtd. Euro Notes, 8.75%, 05/15/18(b) | EUR | 100,000 | 134,803 | |||||
| Other Diversified Financial Services–0.06% | ||||||||
Cabot Financial Luxembourg S.A. (United Kingdom), REGS, Sr. Sec. Gtd. Euro Notes, 10.38%, 10/01/19(b) | GBP | 100,000 | 175,116 | |||||
Lowell Group Financing PLC (United Kingdom), REGS, Sr. Sec. Gtd. Euro Notes, 10.75%, 04/01/19(b) | GBP | 100,000 | 175,116 | |||||
| 350,232 | ||||||||
| Sovereign Debt–0.14% | ||||||||
Mexican Bonos (Mexico), | MXN | 4,500,000 | 357,317 | |||||
Series M20, Bonds, 10.00%, 12/05/24 | MXN | 1,300,000 | 125,621 | |||||
Peruvian Government International Bond (Peru), Sr. Unsec. Notes, 8.60%, 08/12/17(b) | PEN | 210,000 | 84,635 | |||||
Republic of Costa Rica (Costa Rica), Unsec. Bonds, 11.50%, 12/21/22(b) | CRC | 90,000,000 | 216,094 | |||||
| 783,667 | ||||||||
See accompanying Notes to Financial Statements which are an integral part of the financial statements.
27 Invesco Core Plus Bond Fund
| Principal Amount | Value | |||||||
| Wireless Telecommunication Services–0.02% | ||||||||
Mobile Challenger Intermediate Group S.A. (Switzerland), Sr. Sec. PIK Notes, 8.75%, 03/15/19(b) | EUR | 100,000 | $ | 131,830 | ||||
Total Non-U.S. Dollar Denominated |
| 2,479,687 | ||||||
Municipal Obligations–0.43% |
| |||||||
Florida Hurricane Catastrophe Fund Finance Corp. Series 2013 A, RB, 3.00%, 07/01/20 | $ | 1,450,000 | 1,340,902 | |||||
Georgia (State of) Municipal Electric Authority (Plant Vogtle Units 3 & 4 | ||||||||
Series 2010, Build America RB, 6.66%, 04/01/57 | 550,000 | 571,879 | ||||||
Series 2010 A, Taxable Build America RB, 6.64%, 04/01/57 | 500,000 | 522,915 | ||||||
Total Municipal Obligations | 2,435,696 | |||||||
| Shares | Value | |||||||
Common Stocks–0.00% |
| |||||||
| Paper Products–0.00% | ||||||||
NewPage Holdings Inc. (Acquired 07/21/11-08/29/11; Cost $34,248)(b)(l) | 160 | $ | 12,800 | |||||
Money Market Funds–0.76% |
| |||||||
Liquid Assets Portfolio– | 2,155,565 | 2,155,565 | ||||||
Premier Portfolio– | 2,155,566 | 2,155,566 | ||||||
Total Money Market Funds | 4,311,131 | |||||||
TOTAL INVESTMENTS–113.52% |
| 644,716,029 | ||||||
OTHER ASSETS LESS LIABILITIES–(13.52)% |
| (76,783,819 | ) | |||||
NET ASSETS–100.00% |
| $ | 567,932,210 | |||||
Investment Abbreviations:
| ARM | — Adjustable Rate Mortgage | |
| BRL | — Brazilian Real | |
| CAD | — Canadian Dollar | |
| Conv. | — Convertible | |
| CRC | — Costa Rican Colon | |
| Ctfs. | — Certificates | |
| Deb. | — Debentures | |
| Disc. | — Discounted | |
| EUR | — Euro | |
| FHLMC | — Federal Home Loan Mortgage Corp. | |
| FNMA | — Federal National Mortgage Association | |
| GBP | — British Pound | |
| GNMA | — Government National Mortgage Association | |
| Gtd. | — Guaranteed | |
| Jr. | — Junior |
| MXN | — Mexican Peso | |
| PEN | — Peru Nuevo Sol | |
| Pfd. | — Preferred | |
| PHP | — Philippine Peso | |
| PIK | — Payment in Kind | |
| RB | — Revenue Bonds | |
| REGS | — Regulation S | |
| REIT | — Real Estate Investment Trust | |
| REMICS | — Real Estate Mortgage Investment Conduits | |
| RUB | — Russian Rouble | |
| Sec. | — Secured | |
| Sr. | — Senior | |
| Sub. | — Subordinated | |
| TBA | — To Be Announced | |
| Unsec. | — Unsecured |
Notes to Schedule of Investments:
| (a) | Industry and/or sector classifications used in this report are generally according to the Global Industry Classification Standard, which was developed by and is the exclusive property and a service mark of MSCI Inc. and Standard & Poor’s. |
| (b) | Security purchased or received in a transaction exempt from registration under the Securities Act of 1933, as amended (the “1933 Act”). The security may be resold pursuant to an exemption from registration under the 1933 Act, typically to qualified institutional buyers. The aggregate value of these securities at August 31, 2013 was $135,686,539, which represented 23.89% of the Fund’s Net Assets. |
| (c) | Perpetual bond with no specified maturity date. |
| (d) | Step coupon bond. The interest rate represents the coupon rate at which the bond will accrue at a specified future date. |
| (e) | Defaulted security. Currently, the issuer is partially or fully in default with respect to interest payments. The value of this security at August 31, 2013 represented less than 1% of the Fund’s Net Assets. |
| (f) | Security has an irrevocable call by the issuer or mandatory put by the holder. Maturity date reflects such call or put. |
| (g) | Interest or dividend rate is redetermined periodically. Rate shown is the rate in effect on August 31, 2013. |
| (h) | Security purchased on a forward commitment basis. This security is subject to dollar roll transactions. See Note 1I. |
| (i) | All or a portion of the value was pledged as collateral to cover margin requirements for open futures contracts. See Note 1L and Note 4. |
| (j) | Security traded on a discount basis. The interest rate shown represents the discount rate at the time of purchase by the Fund. |
| (k) | Foreign denominated security. Principal amount is denominated in currency indicated. |
| (l) | Non-income producing security acquired as part of the NewPage Corp. bankruptcy reorganization. |
| (m) | The money market fund and the Fund are affiliated by having the same investment adviser. |
See accompanying Notes to Financial Statements which are an integral part of the financial statements.
28 Invesco Core Plus Bond Fund
Statement of Assets and Liabilities
August 31, 2013
Assets: |
| |||
Investments, at value (Cost $640,896,578) | $ | 640,404,898 | ||
Investments in affiliated money market funds, at value and cost | 4,311,131 | |||
Total investments, at value (Cost $645,207,709) | 644,716,029 | |||
Cash | 2,178,467 | |||
Foreign currencies, at value (Cost $2,560,591) | 2,559,682 | |||
Receivable for: | ||||
Investments sold | 56,426,124 | |||
Fund shares sold | 879,941 | |||
Dividends and interest | 5,344,990 | |||
Fund expenses absorbed | 102,928 | |||
Principal paydowns | 26,140 | |||
Premiums paid on swap agreements | 328,984 | |||
Investment for trustee deferred compensation and retirement plans | 46,457 | |||
Other assets | 40,137 | |||
Total assets | 712,649,879 | |||
Liabilities: |
| |||
Payable for: | ||||
Investments purchased | 142,393,307 | |||
Fund shares reacquired | 1,216,703 | |||
Dividends | 134,982 | |||
Foreign currency contracts outstanding | 5,260 | |||
Swap agreements | 10,639 | |||
Variation margin | 13,750 | |||
Accrued fees to affiliates | 286,719 | |||
Accrued trustees’ and officers’ fees and benefits | 4,052 | |||
Accrued other operating expenses | 180,290 | |||
Trustee deferred compensation and retirement plans | 105,553 | |||
Unrealized depreciation on swap agreements | 366,414 | |||
Total liabilities | 144,717,669 | |||
Net assets applicable to shares outstanding | $ | 567,932,210 | ||
Net assets consist of: |
| |||
Shares of beneficial interest | $ | 654,294,820 | ||
Undistributed net investment income | 943,304 | |||
Undistributed net realized gain (loss) | (85,841,332 | ) | ||
Net unrealized appreciation (depreciation) | (1,464,582 | ) | ||
| $ | 567,932,210 | |||
Net Assets: |
| |||
Class A | $ | 324,536,681 | ||
Class B | $ | 15,875,602 | ||
Class C | $ | 35,770,282 | ||
Class R | $ | 2,820,488 | ||
Class Y | $ | 1,456,099 | ||
Class R5 | $ | 1,960,199 | ||
Class R6 | $ | 185,512,859 | ||
Shares outstanding, $0.01 par value per share, |
| |||
Class A | 31,170,457 | |||
Class B | 1,525,130 | |||
Class C | 3,436,863 | |||
Class R | 270,971 | |||
Class Y | 139,763 | |||
Class R5 | 188,395 | |||
Class R6 | 17,829,093 | |||
Class A: | ||||
Net asset value per share | $ | 10.41 | ||
Maximum offering price per share | ||||
(Net asset value of $10.41 ¸ 95.75%) | $ | 10.87 | ||
Class B: | ||||
Net asset value and offering price per share | $ | 10.41 | ||
Class C: | ||||
Net asset value and offering price per share | $ | 10.41 | ||
Class R: | ||||
Net asset value and offering price per share | $ | 10.41 | ||
Class Y: | ||||
Net asset value and offering price per share | $ | 10.42 | ||
Class R5: | ||||
Net asset value and offering price per share | $ | 10.40 | ||
Class R6: | ||||
Net asset value and offering price per share | $ | 10.41 | ||
See accompanying Notes to Financial Statements which are an integral part of the financial statements.
29 Invesco Core Plus Bond Fund
Statement of Operations
For the year ended August 31, 2013
Investment income: |
| |||
Interest (net of foreign withholding taxes of $ 765) | $ | 20,390,162 | ||
Dividends | 285,955 | |||
Dividends from affiliated money market funds | 77,875 | |||
Total investment income | 20,753,992 | |||
Expenses: | ||||
Advisory fees | 2,584,084 | |||
Administrative services fees | 162,765 | |||
Custodian fees | 39,447 | |||
Distribution fees: | ||||
Class A | 825,243 | |||
Class B | 204,154 | |||
Class C | 404,158 | |||
Class R | 16,623 | |||
Transfer agent fees — A, B, C, R and Y | 779,091 | |||
Transfer agent fees — R5 | 2,230 | |||
Transfer agent fees — R6 | 427 | |||
Trustees’ and officers’ fees and benefits | 41,358 | |||
Other | 303,620 | |||
Total expenses | 5,363,200 | |||
Less: Fees waived, expenses reimbursed and expense offset arrangement(s) | (1,132,431 | ) | ||
Net expenses | 4,230,769 | |||
Net investment income | 16,523,223 | |||
Realized and unrealized gain (loss) from: | ||||
Net realized gain (loss) from: | ||||
Investment securities | 3,902,294 | |||
Foreign currencies | (16,607 | ) | ||
Foreign currency contracts | (25,999 | ) | ||
Futures contracts | 1,824,954 | |||
Swap agreements | (477,323 | ) | ||
| 5,207,319 | ||||
Change in net unrealized appreciation (depreciation) of: | ||||
Investment securities | (33,388,070 | ) | ||
Foreign currencies | (2,255 | ) | ||
Foreign currency contracts | 2,000 | |||
Futures contracts | (453,802 | ) | ||
Swap agreements | (29,987 | ) | ||
| (33,872,114 | ) | |||
Net realized and unrealized gain (loss) | (28,664,795 | ) | ||
Net increase (decrease) in net assets resulting from operations | $ | (12,141,572 | ) | |
See accompanying Notes to Financial Statements which are an integral part of the financial statements.
30 Invesco Core Plus Bond Fund
Statement of Changes in Net Assets
For the years ended August 31, 2013 and 2012
| 2013 | 2012 | |||||||
Operations: |
| |||||||
Net investment income | $ | 16,523,223 | $ | 16,609,289 | ||||
Net realized gain | 5,207,319 | 11,951,519 | ||||||
Change in net unrealized appreciation (depreciation) | (33,872,114 | ) | 8,386,426 | |||||
Net increase (decrease) in net assets resulting from operations | (12,141,572 | ) | 36,947,234 | |||||
Distributions to shareholders from net investment income: | ||||||||
Class A | (10,265,479 | ) | (10,466,088 | ) | ||||
Class B | (483,301 | ) | (808,278 | ) | ||||
Class C | (953,544 | ) | (1,160,409 | ) | ||||
Class R | (95,262 | ) | (104,533 | ) | ||||
Class Y | (141,229 | ) | (238,402 | ) | ||||
Class R5 | (498,139 | ) | (7,232,345 | ) | ||||
Class R6 | (5,578,061 | ) | — | |||||
Total distributions from net investment income | (18,015,015 | ) | (20,010,055 | ) | ||||
Distributions to shareholders from net realized gains: | ||||||||
Class A | — | (418,836 | ) | |||||
Class B | — | (43,158 | ) | |||||
Class C | — | (58,620 | ) | |||||
Class R | — | (4,312 | ) | |||||
Class Y | — | (9,454 | ) | |||||
Class R5 | — | (289,097 | ) | |||||
Total distributions from net realized gains | — | (823,477 | ) | |||||
Share transactions–net: | ||||||||
Class A | 46,603,321 | 61,184,360 | ||||||
Class B | (5,686,495 | ) | (2,679,847 | ) | ||||
Class C | (32,154 | ) | 3,325,390 | |||||
Class R | (335,712 | ) | 918,843 | |||||
Class Y | (4,179,243 | ) | 341,572 | |||||
Class R5 | (167,831,897 | ) | (2,421,580 | ) | ||||
Class R6 | 195,283,747 | — | ||||||
Net increase in net assets resulting from share transactions | 63,821,567 | 60,668,738 | ||||||
Net increase in net assets | 33,664,980 | 76,782,440 | ||||||
Net assets: | ||||||||
Beginning of year | 534,267,230 | 457,484,790 | ||||||
End of year (includes undistributed net investment income of $943,304 and $(605,532), respectively) | $ | 567,932,210 | $ | 534,267,230 | ||||
Notes to Financial Statements
August 31, 2013
NOTE 1—Significant Accounting Policies
Invesco Core Plus Bond Fund (the “Fund”) is a series portfolio of AIM Counselor Series Trust (Invesco Counselor Series Trust) (the “Trust”). The Trust is a Delaware statutory trust registered under the Investment Company Act of 1940, as amended (the “1940 Act”), as an open-end series management investment company consisting of twelve separate portfolios, each authorized to issue an unlimited number of shares of beneficial interest. The assets, liabilities and operations of each portfolio are accounted for separately. Information presented in these financial statements pertains only to the Fund. Matters affecting each portfolio or class will be voted on exclusively by the shareholders of such portfolio or class.
The Fund’s investment objective is total return, comprised of current income and capital appreciation.
The Fund currently consists of seven different classes of shares: Class A, Class B, Class C, Class R, Class Y, Class R5 and Class R6. On September 24, 2012, Institutional Class shares were renamed Class R5 shares and the Fund began offering Class R6 shares. Class A shares are sold with a front-end sales charge unless certain waiver criteria are met and under certain circumstances load waived shares may be subject to contingent
31 Invesco Core Plus Bond Fund
deferred sales charges (“CDSC”). Class C shares are sold with a CDSC. Class R, Class Y, Class R5 and Class R6 shares are sold at net asset value. Effective November 30, 2010, new or additional investments in Class B shares are no longer permitted. Existing shareholders of Class B shares may continue to reinvest dividends and capital gains distributions in Class B shares until they convert to Class A shares. Also, shareholders in Class B shares will be able to exchange those shares for Class B shares of other Invesco Funds offering such shares until they convert to Class A shares. Generally, Class B shares will automatically convert to Class A shares on or about the month-end, which is at least eight years after the date of purchase. Redemption of Class B shares prior to the conversion date will be subject to a CDSC.
The following is a summary of the significant accounting policies followed by the Fund in the preparation of its financial statements.
| A. | Security Valuations — Securities, including restricted securities, are valued according to the following policy. |
Debt obligations (including convertible bonds) and unlisted equities are fair valued using an evaluated quote provided by an independent pricing service. Evaluated quotes provided by the pricing service may be determined without exclusive reliance on quoted prices, and may reflect appropriate factors such as institution-size trading in similar groups of securities, developments related to specific securities, dividend rate (for unlisted equities), yield (for debt obligations), quality, type of issue, coupon rate (for debt obligations), maturity (for debt obligations), individual trading characteristics and other market data. Debt obligations are subject to interest rate and credit risks. In addition, all debt obligations involve some risk of default with respect to interest and/or principal payments.
A security listed or traded on an exchange (except convertible bonds) is valued at its last sales price or official closing price as of the close of the customary trading session on the exchange where the security is principally traded, or lacking any sales or official closing price on a particular day, the security may be valued at the closing bid price on that day. Securities traded in the over-the-counter market are valued based on prices furnished by independent pricing services or market makers. When such securities are valued by an independent pricing service they may be considered fair valued. Futures contracts are valued at the final settlement price set by an exchange on which they are principally traded. Listed options are valued at the mean between the last bid and ask prices from the exchange on which they are principally traded. Options not listed on an exchange are valued by an independent source at the mean between the last bid and ask prices. For purposes of determining net asset value per share, futures and option contracts generally are valued 15 minutes after the close of the customary trading session of the New York Stock Exchange (“NYSE”).
Investments in open-end and closed-end registered investment companies that do not trade on an exchange are valued at the end of day net asset value per share. Investments in open-end and closed-end registered investment companies that trade on an exchange are valued at the last sales price or official closing price as of the close of the customary trading session on the exchange where the security is principally traded.
Swap agreements are fair valued using an evaluated quote provided by an independent pricing service. Evaluated quotes provided by the pricing service are valued based on a model which may include end of day net present values, spreads, ratings, industry, and company performance.
Foreign securities’ (including foreign exchange contracts) prices are converted into U.S. dollar amounts using the applicable exchange rates as of the close of the NYSE. If market quotations are available and reliable for foreign exchange-traded equity securities, the securities will be valued at the market quotations. Because trading hours for certain foreign securities end before the close of the NYSE, closing market quotations may become unreliable. If between the time trading ends on a particular security and the close of the customary trading session on the NYSE, events occur that the Adviser determines are significant and make the closing price unreliable, the Fund may fair value the security. If the event is likely to have affected the closing price of the security, the security will be valued at fair value in good faith using procedures approved by the Board of Trustees. Adjustments to closing prices to reflect fair value may also be based on a screening process of an independent pricing service to indicate the degree of certainty, based on historical data, that the closing price in the principal market where a foreign security trades is not the current value as of the close of the NYSE. Foreign securities’ prices meeting the approved degree of certainty that the price is not reflective of current value will be priced at the indication of fair value from the independent pricing service. Multiple factors may be considered by the independent pricing service in determining adjustments to reflect fair value and may include information relating to sector indices, American Depositary Receipts and domestic and foreign index futures. Foreign securities may have additional risks including exchange rate changes, potential for sharply devalued currencies and high inflation, political and economic upheaval, the relative lack of issuer information, relatively low market liquidity and the potential lack of strict financial and accounting controls and standards.
Securities for which market prices are not provided by any of the above methods may be valued based upon quotes furnished by independent sources. The last bid price may be used to value equity securities. The mean between the last bid and asked prices is used to value debt obligations, including corporate loans.
Securities for which market quotations are not readily available or became unreliable are valued at fair value as determined in good faith by or under the supervision of the Trust’s officers following procedures approved by the Board of Trustees. Issuer specific events, market trends, bid/ask quotes of brokers and information providers and other market data may be reviewed in the course of making a good faith determination of a security’s fair value.
Valuations change in response to many factors including the historical and prospective earnings of the issuer, the value of the issuer’s assets, general economic conditions, interest rates, investor perceptions and market liquidity. Because of the inherent uncertainties of valuation, the values reflected in the financial statements may materially differ from the value received upon actual sale of those investments.
| B. | Securities Transactions and Investment Income — Securities transactions are accounted for on a trade date basis. Realized gains or losses on sales are computed on the basis of specific identification of the securities sold. Interest income is recorded on the accrual basis from settlement date. Paydown gains and losses on mortgage and asset-backed securities are recorded as adjustments to interest income. Dividend income (net of withholding tax, if any) is recorded on the ex-dividend date. Bond premiums and discounts are amortized and/or accreted for financial reporting purposes. |
The Fund may periodically participate in litigation related to Fund investments. As such, the Fund may receive proceeds from litigation settlements. Any proceeds received are included in the Statement of Operations as realized gain (loss) for investments no longer held and as unrealized gain (loss) for investments still held.
Brokerage commissions and mark ups are considered transaction costs and are recorded as an increase to the cost basis of securities purchased and/or a reduction of proceeds on a sale of securities. Such transaction costs are included in the determination of net realized and unrealized gain (loss) from investment securities reported in the Statement of Operations and the Statement of Changes in Net Assets and the net
32 Invesco Core Plus Bond Fund
realized and unrealized gains (losses) on securities per share in the Financial Highlights. Transaction costs are included in the calculation of the Fund’s net asset value and, accordingly, they reduce the Fund’s total returns. These transaction costs are not considered operating expenses and are not reflected in net investment income reported in the Statement of Operations and Statement of Changes in Net Assets, or the net investment income per share and ratios of expenses and net investment income reported in the Financial Highlights, nor are they limited by any expense limitation arrangements between the Fund and the investment adviser.
The Fund allocates realized and unrealized capital gains and losses to a class based on the relative net assets of each class. The Fund allocates income to a class based on the relative value of the settled shares of each class.
| C. | Country Determination — For the purposes of making investment selection decisions and presentation in the Schedule of Investments, the investment adviser may determine the country in which an issuer is located and/or credit risk exposure based on various factors. These factors include the laws of the country under which the issuer is organized, where the issuer maintains a principal office, the country in which the issuer derives 50% or more of its total revenues and the country that has the primary market for the issuer’s securities, as well as other criteria. Among the other criteria that may be evaluated for making this determination are the country in which the issuer maintains 50% or more of its assets, the type of security, financial guarantees and enhancements, the nature of the collateral and the sponsor organization. Country of issuer and/or credit risk exposure has been determined to be the United States of America, unless otherwise noted. |
| D. | Distributions — Distributions from income are declared daily and paid monthly. Distributions from net realized capital gain, if any, are generally declared and paid annually and recorded on the ex-dividend date. The Fund may elect to treat a portion of the proceeds from redemptions as distributions for federal income tax purposes. |
| E. | Federal Income Taxes — The Fund intends to comply with the requirements of Subchapter M of the Internal Revenue Code of 1986, as amended (the “Internal Revenue Code”), necessary to qualify as a regulated investment company and to distribute substantially all of the Fund’s taxable earnings to shareholders. As such, the Fund will not be subject to federal income taxes on otherwise taxable income (including net realized capital gain) that is distributed to shareholders. Therefore, no provision for federal income taxes is recorded in the financial statements. |
The Fund files tax returns in the U.S. Federal jurisdiction and certain other jurisdictions. Generally, the Fund is subject to examinations by such taxing authorities for up to three years after the filing of the return for the tax period.
| F. | Expenses — Fees provided for under the Rule 12b-1 plan of a particular class of the Fund are charged to the operations of such class. Transfer agency fees and expenses and other shareholder recordkeeping fees and expenses attributable to Class R5 and Class R6 are allocated to each share class based on relative net assets. Sub-accounting fees attributable to Class R5 are charged to the operations of the class. Transfer agency fees and expenses and other shareholder recordkeeping fees and expenses relating to all other classes are allocated among those classes based on relative net assets. All other expenses are allocated among the classes based on relative net assets. |
| G. | Accounting Estimates — The preparation of financial statements in conformity with accounting principles generally accepted in the United States of America (“GAAP”) requires management to make estimates and assumptions that affect the reported amounts of assets and liabilities at the date of the financial statements and the reported amounts of revenues and expenses during the reporting period including estimates and assumptions related to taxation. Actual results could differ from those estimates by a significant amount. In addition, the Fund monitors for material events or transactions that may occur or become known after the period-end date and before the date the financial statements are released to print. |
| H. | Indemnifications — Under the Trust’s organizational documents, each Trustee, officer, employee or other agent of the Trust is indemnified against certain liabilities that may arise out of the performance of their duties to the Fund. Additionally, in the normal course of business, the Fund enters into contracts, including the Fund’s servicing agreements, that contain a variety of indemnification clauses. The Fund’s maximum exposure under these arrangements is unknown as this would involve future claims that may be made against the Fund that have not yet occurred. The risk of material loss as a result of such indemnification claims is considered remote. |
| I. | Dollar Rolls and Forward Commitment Transactions — The Fund may enter into dollar roll transactions to enhance the Fund’s performance. The Fund executes its dollar roll transactions in the to be announced (“TBA”) market whereby the Fund makes a forward commitment to purchase a security and, instead of accepting delivery, the position is offset by the sale of the security with a simultaneous agreement to repurchase at a future date. |
The Fund accounts for dollar roll transactions as purchases and sales and realizes gains and losses on these transactions. These transactions increase the Fund’s portfolio turnover rate. The Fund will segregate liquid assets in an amount equal to its dollar roll commitments. Dollar roll transactions are considered borrowings under the 1940 Act.
Dollar roll transactions involve the risk that a counter-party to the transaction may fail to complete the transaction. If this occurs, the Fund may lose the opportunity to purchase or sell the security at the agreed upon price. Dollar rolls transactions also involve the risk that the value of the securities retained by the Fund may decline below the price of the securities that the Fund has sold but is obligated to purchase under the agreement.
| J. | Foreign Currency Translations — Foreign currency is valued at the close of the NYSE based on quotations posted by banks and major currency dealers. Portfolio securities and other assets and liabilities denominated in foreign currencies are translated into U.S. dollar amounts at date of valuation. Purchases and sales of portfolio securities (net of foreign taxes withheld on disposition) and income items denominated in foreign currencies are translated into U.S. dollar amounts on the respective dates of such transactions. The Fund does not separately account for the portion of the results of operations resulting from changes in foreign exchange rates on investments and the fluctuations arising from changes in market prices of securities held. The combined results of changes in foreign exchange rates and the fluctuation of market prices on investments (net of estimated foreign tax withholding) are included with the net realized and unrealized gain or loss from investments in the Statement of Operations. Reported net realized foreign currency gains or losses arise from (1) sales of foreign currencies, (2) currency gains or losses realized between the trade and settlement dates on securities transactions, and (3) the difference between the amounts of dividends, interest, and foreign withholding taxes recorded on the Fund’s books and the U.S. dollar equivalent of the amounts actually received or paid. Net unrealized foreign currency gains and losses arise from changes in the fair values of assets and liabilities, other than investments in securities at fiscal period end, resulting from changes in exchange rates. |
The Fund may invest in foreign securities which may be subject to foreign taxes on income, gains on investments or currency repatriation, a portion of which may be recoverable.
33 Invesco Core Plus Bond Fund
| K. | Foreign Currency Contracts — The Fund may enter into foreign currency contracts to manage or minimize currency or exchange rate risk. The Fund may also enter into foreign currency contracts for the purchase or sale of a security denominated in a foreign currency in order to “lock in” the U.S. dollar price of that security. A foreign currency contract is an obligation to purchase or sell a specific currency for an agreed-upon price at a future date. The use of foreign currency contracts does not eliminate fluctuations in the price of the underlying securities the Fund owns or intends to acquire but establishes a rate of exchange in advance. Fluctuations in the value of these contracts are measured by the difference in the contract date and reporting date exchange rates and are recorded as unrealized appreciation (depreciation) until the contracts are closed. When the contracts are closed, realized gains (losses) are recorded. Realized and unrealized gains (losses) on the contracts are included in the Statement of Operations. The primary risks associated with foreign currency contracts include failure of the counterparty to meet the terms of the contract and the value of the foreign currency changing unfavorably. These risks may be in excess of the amounts reflected in the Statement of Assets and Liabilities. |
| L. | Futures Contracts — The Fund may enter into futures contracts to manage exposure to interest rate, equity and market price movements and/or currency risks. A futures contract is an agreement between two parties to purchase or sell a specified underlying security, currency or commodity (or delivery of a cash settlement price, in the case of an index future) for a fixed price at a future date. The Fund currently invests only in exchange-traded futures and they are standardized as to maturity date and underlying financial instrument. Initial margin deposits required upon entering into futures contracts are satisfied by the segregation of specific securities or cash as collateral at the futures commission merchant (broker). During the period the futures contracts are open, changes in the value of the contracts are recognized as unrealized gains or losses by recalculating the value of the contracts on a daily basis. Subsequent or variation margin payments are received or made depending upon whether unrealized gains or losses are incurred. These amounts are reflected as receivables or payables on the Statement of Assets and Liabilities. When the contracts are closed or expire, the Fund recognizes a realized gain or loss equal to the difference between the proceeds from, or cost of, the closing transaction and the Fund’s basis in the contract. The net realized gain (loss) and the change in unrealized gain (loss) on futures contracts held during the period is included on the Statement of Operations. The primary risks associated with futures contracts are market risk and the absence of a liquid secondary market. If the Fund were unable to liquidate a futures contract and/or enter into an offsetting closing transaction, the Fund would continue to be subject to market risk with respect to the value of the contracts and continue to be required to maintain the margin deposits on the futures contracts. Futures contracts have minimal counterparty risk since the exchange’s clearinghouse, as counterparty to all exchange-traded futures, guarantees the futures against default. Risks may exceed amounts recognized in the Statement of Assets and Liabilities. |
| M. | Swap Agreements — The Fund may enter into various swap transactions, including interest rate, total return, index, currency exchange rate and credit default swap contracts (“CDS”) for investment purposes or to manage interest rate, currency or credit risk. Such transactions are agreements between two parties (“Counterparties”). These agreements may contain among other conditions, events of default and termination events, and various covenants and representations such as provisions that require the Fund to maintain a pre-determined level of net assets, and/or provide limits regarding the decline of the Fund’s NAV over specific periods of time. If the Fund were to trigger such provisions and have open derivative positions at that time, the Counterparty may be able to terminate such agreement and request immediate payment in an amount equal to the net liability positions, if any. |
Interest rate, total return, index, and currency exchange rate swap agreements are two-party contracts entered into primarily to exchange the returns (or differentials in rates of returns) earned or realized on particular predetermined investments or instruments. The gross returns to be exchanged or “swapped” between the parties are calculated with respect to a notional amount, i.e., the return on or increase in value of a particular dollar amount invested at a particular interest rate or return of an underlying asset, in a particular foreign currency, or in a “basket” of securities representing a particular index.
A CDS is an agreement between Counterparties to exchange the credit risk of an issuer. A buyer of a CDS is said to buy protection by paying a fixed payment over the life of the agreement and in some situations an upfront payment to the seller of the CDS. If a defined credit event occurs (such as payment default or bankruptcy), the Fund as a protection buyer would cease paying its fixed payment, the Fund would deliver eligible bonds issued by the reference entity to the seller, and the seller would pay the full notional value, or the “par value”, of the referenced obligation to the Fund. A seller of a CDS is said to sell protection and thus would receive a fixed payment over the life of the agreement and an upfront payment, if applicable. If a credit event occurs, the Fund as a protection seller would cease to receive the fixed payment stream, the Fund would pay the buyer “par value” or the full notional value of the referenced obligation, and the Fund would receive the eligible bonds issued by the reference entity. In turn, these bonds may be sold in order to realize a recovery value. Alternatively, the seller of the CDS and its counterparty may agree to net the notional amount and the market value of the bonds and make a cash payment equal to the difference to the buyer of protection. If no credit event occurs, the Fund receives the fixed payment over the life of the agreement. As the seller, the Fund would effectively add leverage to its portfolio because, in addition to its total net assets, the Fund would be subject to investment exposure on the notional amount of the CDS. In connection with these agreements, cash and securities may be identified as collateral in accordance with the terms of the respective swap agreements to provide assets of value and recourse in the event of default under the swap agreement or bankruptcy/insolvency of a party to the swap agreement. If a counterparty becomes bankrupt or otherwise fails to perform its obligations due to financial difficulties, the Fund may experience significant delays in obtaining any recovery in a bankruptcy or other reorganization proceeding. The Fund may obtain only limited recovery or may obtain no recovery in such circumstances. The Fund’s maximum risk of loss from counterparty risk, either as the protection seller or as the protection buyer, is the value of the contract. The risk may be mitigated by having a master netting arrangement between the Fund and the counterparty and by the designation of collateral by the counterparty to cover the Fund’s exposure to the counterparty.
Implied credit spreads represent the current level at which protection could be bought or sold given the terms of the existing CDS contract and serve as an indicator of the current status of the payment/performance risk of the CDS. An implied spread that has widened or increased since entry into the initial contract may indicate a deteriorating credit profile and increased risk of default for the reference entity. A declining or narrowing spread may indicate an improving credit profile or decreased risk of default for the reference entity. Alternatively, credit spreads may increase or decrease reflecting the general tolerance for risk in the credit markets.
Changes in the value of swap agreements are recognized as unrealized gains (losses) in the Statement of Operations by “marking to market” on a daily basis to reflect the value of the swap agreement at the end of each trading day. Payments received or paid at the beginning of the agreement are reflected as such on the Statement of Assets and Liabilities and may be referred to as upfront payments. The Fund accrues for the fixed payment
34 Invesco Core Plus Bond Fund
stream and amortizes upfront payments, if any, on swap agreements on a daily basis with the net amount, recorded as a component of realized gain (loss) on the Statement of Operations. A liquidation payment received or made at the termination of a swap agreement is recorded as realized gain (loss) on the Statement of Operations. The Fund segregates liquid securities having a value at least equal to the amount of the potential obligation of a Fund under any swap transaction. Entering into these agreements involves, to varying degrees, lack of liquidity and elements of credit, market, and counterparty risk in excess of amounts recognized on the Statement of Assets and Liabilities. Such risks involve the possibility that a swap is difficult to sell or liquidate; the counterparty does not honor its obligations under the agreement and unfavorable interest rates and market fluctuations. It is possible that developments in the swaps market, including potential government regulation, could adversely affect the Fund’s ability to terminate existing swap agreements or to realize amounts to be received under such agreements.
| N. | Other Risks — The Funds may invest in obligations issued by agencies and instrumentalities of the U.S. Government that may vary in the level of support they receive from the government. The government may choose not to provide financial support to government sponsored agencies or instrumentalities if it is not legally obligated to do so. In this case, if the issuer defaulted, the underlying fund holding securities of such issuer might not be able to recover its investment from the U.S. Government. Many securities purchased by the Fund are not guaranteed by the U.S. Government. |
| O. | Leverage Risk — Leverage exists when a Fund can lose more than it originally invests because it purchases or sells an instrument or enters into a transaction without investing an amount equal to the full economic exposure of the instrument or transaction. |
| P. | Collateral — To the extent the Fund has designated or segregated a security as collateral and that security is subsequently sold, it is the Fund’s practice to replace such collateral no later than the next business day. |
NOTE 2—Advisory Fees and Other Fees Paid to Affiliates
The Trust has entered into a master investment advisory agreement with Invesco Advisers, Inc. (the “Adviser” or “Invesco”). Under the terms of the investment advisory agreement, the Fund pays an advisory fee to the Adviser based on the annual rate of the Fund’s average daily net assets as follows:
| Average Daily Net Assets | Rate | |||||
First $500 million | 0 | .45% | ||||
Next $500 million | 0 | .425% | ||||
Next $1.5 billion | 0 | .40% | ||||
Next $2.5 billion | 0 | .375% | ||||
Over $5 billion | 0 | .35% | ||||
Under the terms of a master sub-advisory agreement between the Adviser and each of Invesco Asset Management Deutschland GmbH, Invesco Asset Management Limited, Invesco Asset Management (Japan) Limited, Invesco Australia Limited, Invesco Hong Kong Limited, Invesco Senior Secured Management, Inc. and Invesco Canada Ltd. (collectively, the “Affiliated Sub-Advisers”) the Adviser, not the Fund, may pay 40% of the fees paid to the Adviser to any such Affiliated Sub-Adviser(s) that provide(s) discretionary investment management services to the Fund based on the percentage of assets allocated to such Sub-Adviser(s).
The Adviser has contractually agreed, through at least December 31, 2013, to waive advisory fees and/or reimburse expenses of all shares to the extent necessary to limit total annual fund operating expenses after fee waiver and/or expense reimbursement (excluding certain items discussed below) of Class A, Class B, Class C, Class R, Class Y, Class R5 and Class R6 shares to 0.75%, 1.50%, 1.50%, 1.00%, 0.50%, 0.50% and 0.50%, respectively, of average daily net assets. In determining the Adviser’s obligation to waive advisory fees and/or reimburse expenses, the following expenses are not taken into account, and could cause the total annual fund operating expenses after fee waiver and/or reimbursement to exceed the numbers reflected above: (1) interest; (2) taxes; (3) dividend expense on short sales; (4) extraordinary or non-routine items, including litigation expenses; and (5) expenses that the Fund has incurred but did not actually pay because of an expense offset arrangement. Unless the Board of Trustees and Invesco mutually agree to amend or continue the fee waiver agreement, it will terminate on December 31, 2013.
Further, the Adviser has contractually agreed, through at least June 30, 2014, to waive the advisory fee payable by the Fund in an amount equal to 100% of the net advisory fees the Adviser receives from the affiliated money market funds on investments by the Fund of uninvested cash in such affiliated money market funds.
For the year ended August 31, 2013, the Adviser waived advisory fees of $350,683 and reimbursed Class specific expenses of $644,364, $39,852, $78,893, $6,490, $8,071, $2,230 and $427 for Class A, Class B, Class C, Class R, Class Y, Class R5 and Class R6 shares, respectively.
The Trust has entered into a master administrative services agreement with Invesco pursuant to which the Fund has agreed to pay Invesco for certain administrative costs incurred in providing accounting services to the Fund. For the year ended August 31, 2013, expenses incurred under the agreement are shown in the Statement of Operations as Administrative services fees.
The Trust has entered into a transfer agency and service agreement with Invesco Investment Services, Inc. (“IIS”) pursuant to which the Fund has agreed to pay IIS a fee for providing transfer agency and shareholder services to the Fund and reimburse IIS for certain expenses incurred by IIS in the course of providing such services. IIS may make payments to intermediaries that provide omnibus account services, sub-accounting services and/or networking services. All fees payable by IIS to intermediaries that provide omnibus account services or sub-accounting are charged back to the Fund, subject to certain limitations approved by the Trust’s Board of Trustees. For the year ended August 31, 2013, expenses incurred under the agreement are shown in the Statement of Operations as Transfer agent fees.
The Trust has entered into master distribution agreements with Invesco Distributors, Inc. (“IDI”) to serve as the distributor for the Class A, Class B, Class C, Class R, Class Y, Class R5 and Class R6 shares of the Fund. The Trust has adopted plans pursuant to Rule 12b-1 under the 1940 Act with respect to the Fund’s Class A, Class B, Class C and Class R shares (collectively, the “Plans”). The Fund, pursuant to the Plans, pays IDI compensation at the annual rate of 0.25% of the Fund’s average daily net assets of Class A shares, 1.00% of the average daily net assets of Class B and Class C shares and 0.50% of the average daily net assets of Class R shares. Of the Plan payments, up to 0.25% of the average daily net assets of each class of shares may be paid to furnish continuing personal shareholder services to customers who purchase and own shares of such classes. Any amounts not paid as a service fee under the Plans would constitute an asset-based sales charge. Rules of the Financial Industry Regulatory Authority (“FINRA”)
35 Invesco Core Plus Bond Fund
impose a cap on the total sales charges, including asset-based sales charges, that may be paid by any class of shares of the Fund. For the year ended August 31, 2013, expenses incurred under the Plans are shown in the Statement of Operations as Distribution fees.
Front-end sales commissions and CDSC (collectively, the “sales charges”) are not recorded as expenses of the Fund. Front-end sales commissions are deducted from proceeds from the sales of Fund shares prior to investment in Class A shares of the Fund. CDSC are deducted from redemption proceeds prior to remittance to the shareholder. During the year ended August 31, 2013, IDI advised the Fund that IDI retained $187,648 in front-end sales commissions from the sale of Class A shares and $3,695, $22,904 and $4,909 from Class A, Class B and Class C shares, respectively, for CDSC imposed on redemptions by shareholders.
Certain officers and trustees of the Trust are officers and directors of the Adviser, IIS and/or IDI.
NOTE 3—Additional Valuation Information
GAAP defines fair value as the price that would be received to sell an asset or paid to transfer a liability in an orderly transaction between market participants at the measurement date, under current market conditions. GAAP establishes a hierarchy that prioritizes the inputs to valuation methods, giving the highest priority to readily available unadjusted quoted prices in an active market for identical assets (Level 1) and the lowest priority to significant unobservable inputs (Level 3), generally when market prices are not readily available or are unreliable. Based on the valuation inputs, the securities or other investments are tiered into one of three levels. Changes in valuation methods may result in transfers in or out of an investment’s assigned level:
| Level 1 — | Prices are determined using quoted prices in an active market for identical assets. |
| Level 2 — | Prices are determined using other significant observable inputs. Observable inputs are inputs that other market participants may use in pricing a security. These may include quoted prices for similar securities, interest rates, prepayment speeds, credit risk, yield curves, loss severities, default rates, discount rates, volatilities and others. |
| Level 3 — | Prices are determined using significant unobservable inputs. In situations where quoted prices or observable inputs are unavailable (for example, when there is little or no market activity for an investment at the end of the period), unobservable inputs may be used. Unobservable inputs reflect the Fund’s own assumptions about the factors market participants would use in determining fair value of the securities or instruments and would be based on the best available information. |
The following is a summary of the tiered valuation input levels, as of August 31, 2013. The level assigned to the securities valuations may not be an indication of the risk or liquidity associated with investing in those securities. Because of the inherent uncertainties of valuation, the values reflected in the financial statements may materially differ from the value received upon actual sale of those investments.
| Level 1 | Level 2 | Level 3 | Total | |||||||||||||
Equity Securities | $ | 12,181,614 | $ | 2,060,919 | $ | — | $ | 14,242,533 | ||||||||
U.S. Treasury Securities | — | 41,219,785 | — | 41,219,785 | ||||||||||||
U.S. Government Sponsored Agency Securities | — | 142,973,431 | — | 142,973,431 | ||||||||||||
Corporate Debt Securities | — | 308,172,434 | 0 | 308,172,434 | ||||||||||||
Asset-Backed Securities | — | 109,180,409 | — | 109,180,409 | ||||||||||||
Municipal Obligations | — | 2,435,696 | — | 2,435,696 | ||||||||||||
Foreign Securities Debt | — | 2,479,687 | — | 2,479,687 | ||||||||||||
Foreign Sovereign Debt | — | 24,012,054 | — | 24,012,054 | ||||||||||||
| $ | 12,181,614 | $ | 632,534,415 | $ | 0 | $ | 644,716,029 | |||||||||
Foreign Currency Contracts* | — | (5,260 | ) | — | (5,260 | ) | ||||||||||
Futures* | (599,399 | ) | — | — | (599,399 | ) | ||||||||||
Swap Agreements* | — | (366,414 | ) | — | (366,414 | ) | ||||||||||
Total Investments | $ | 11,582,215 | $ | 632,162,741 | $ | 0 | $ | 643,744,956 | ||||||||
| * | Unrealized appreciation (depreciation). |
NOTE 4—Derivative Investments
Value of Derivative Investments at Period-End
The table below summarizes the value of the Fund’s derivative investments, detailed by primary risk exposure, held as of August 31, 2013:
| Value | ||||||||
| Risk Exposure/Derivative Type | Assets | Liabilities | ||||||
Credit risk | ||||||||
Swap agreements(a) | $ | — | $ | (366,414 | ) | |||
Currency risk | ||||||||
Foreign currency contracts(a) | 1,606 | (6,866 | ) | |||||
Interest rate risk | ||||||||
Futures contracts(a) | — | (599,399 | ) | |||||
Total | $ | 1,606 | $ | (972,679 | ) | |||
| (a) | Values are disclosed on the Statement of Assets and Liabilities under Unrealized depreciation on swap agreements. |
| (b) | Values are disclosed on the Statement of Assets and Liabilities under Foreign currency contracts outstanding. |
| (c) | Includes cumulative appreciation (depreciation) of futures contracts. Only current day’s variation margin payable is reported within the Statement of Assets and Liabilities. |
36 Invesco Core Plus Bond Fund
Effect of Derivative Investments for the year ended August 31, 2013
The table below summarizes the gains (losses) on derivative investments, detailed by primary risk exposure, recognized in earnings during the period:
| Location of Gain (Loss) on Statement of Operations | ||||||||||||
| Futures* | Foreign Currency Contracts* | Swap Agreements* | ||||||||||
Realized Gain (Loss) | ||||||||||||
Credit risk | $ | — | $ | — | $ | (477,323 | ) | |||||
Currency risk | — | (25,999 | ) | — | ||||||||
Interest rate risk | 1,824,954 | — | — | |||||||||
Change in Unrealized Appreciation (Depreciation) | ||||||||||||
Credit risk | $ | — | $ | — | $ | (29,987 | ) | |||||
Currency risk | — | 2,000 | — | |||||||||
Interest rate risk | (453,802 | ) | — | — | ||||||||
Total | $ | 1,371,152 | $ | (23,999 | ) | $ | (507,310 | ) | ||||
| * | The average notional value of futures contracts, foreign currency contracts and swap agreements outstanding during the period was $24,704,707, $933,781 and $6,875,000, respectively. |
| Open Foreign Currency Contracts | ||||||||||||||||||||||||||
Settlement
| Counterparty | Contract to | Notional Value | Unrealized Appreciation (Depreciation) | ||||||||||||||||||||||
| Deliver | Receive | |||||||||||||||||||||||||
12/09/13 | Morgan Stanley & Co., Inc. | EUR | 365,000 | USD | 484,191 | $ | 482,585 | $ | 1,606 | |||||||||||||||||
12/09/13 | RBC Capital Markets Corp. | GBP | 416,000 | USD | 637,312 | 644,178 | (6,866 | ) | ||||||||||||||||||
| $ | (5,260 | ) | ||||||||||||||||||||||||
Currency Abbreviations:
| EUR | – Euro | |
| GBP | – British Pound Sterling | |
| USD | – U.S. Dollar |
| Open Futures Contracts | ||||||||||||||||
| Short Contracts | Number of Contracts | Expiration Month | Notional Value | Unrealized Appreciation (Depreciation) | ||||||||||||
U.S. Ultra Bond | 119 | December-2013 | $ | (16,883,125 | ) | $ | (193,836 | ) | ||||||||
U.S. 10 Year Treasury Notes | 845 | December-2013 | (105,017,656 | ) | (405,563 | ) | ||||||||||
Total | $ | (599,399 | ) | |||||||||||||
| Open Credit Default Swap Agreements | ||||||||||||||||||||||||||||||
| Counterparty | Reference Entity | Buy/Sell Protection | (Pay)/Receive Fixed Rate | Expiration Date | Implied Credit | Notional Value | Upfront Payments | Unrealized Appreciation (Depreciation) | ||||||||||||||||||||||
Bank of America Securities LLC | Citigroup Inc. | Buy | (1.00 | )% | 06/20/17 | 0.82 | % | $ | 5,500,000 | $ | 328,984 | $ | (366,414 | ) | ||||||||||||||||
| (a) | Implied credit spreads represent the current level as of August 31, 2013 at which protection could be bought or sold given the terms of the existing credit default swap contract and serve as an indicator of the current status of the payment/performance risk of the credit default swap contract. An implied credit spread that has widened or increased since entry into the initial contract may indicate a deteriorating credit profile and increased risk of default for the reference entity. A declining or narrowing spread may indicate an improving credit profile or decreased risk of default for the reference entity. Alternatively, credit spreads may increase or decrease reflecting the general tolerance for risk in the credit markets generally. |
NOTE 5—Expense Offset Arrangement(s)
The expense offset arrangement is comprised of transfer agency credits which result from balances in Demand Deposit Accounts (DDA) used by the transfer agent for clearing shareholder transactions. For the year ended August 31, 2013, the Fund received credits from this arrangement, which resulted in the reduction of the Fund’s total expenses of $1,421.
37 Invesco Core Plus Bond Fund
NOTE 6—Trustees’ and Officers’ Fees and Benefits
“Trustees’ and Officers’ Fees and Benefits” include amounts accrued by the Fund to pay remuneration to certain Trustees and Officers of the Fund. Trustees have the option to defer compensation payable by the Fund, and “Trustees’ and Officers’ Fees and Benefits” also include amounts accrued by the Fund to fund such deferred compensation amounts. Those Trustees who defer compensation have the option to select various Invesco Funds in which their deferral accounts shall be deemed to be invested. Finally, certain current Trustees are eligible to participate in a retirement plan that provides for benefits to be paid upon retirement to Trustees over a period of time based on the number of years of service. The Fund may have certain former Trustees who also participate in a retirement plan and receive benefits under such plan. “Trustees’ and Officers’ Fees and Benefits” include amounts accrued by the Fund to fund such retirement benefits. Obligations under the deferred compensation and retirement plans represent unsecured claims against the general assets of the Fund.
NOTE 7—Cash Balances
The Fund may borrow for leveraging in an amount up to 5% of the Fund’s total assets (excluding the amount borrowed) at the time the borrowing is made. In doing so, the Fund is permitted to temporarily carry a negative or overdrawn balance in its account with State Street Bank and Trust Company, the custodian bank. Such balances, if any at period end, are shown in the Statement of Assets and Liabilities under the payable caption Amount due custodian. To compensate the custodian bank for such overdrafts, the overdrawn Fund may either (1) leave funds as a compensating balance in the account so the custodian bank can be compensated by earning the additional interest; or (2) compensate by paying the custodian bank at a rate agreed upon by the custodian bank and Invesco, not to exceed the contractually agreed upon rate. A Fund may not purchase additional securities when any borrowings from banks exceeds 5% of the Fund’s total assets.
NOTE 8—Distributions to Shareholders and Tax Components of Net Assets
Tax Character of Distributions to Shareholders Paid During the Years Ended August 31, 2013 and 2012:
| 2013 | 2012 | |||||||
Ordinary income | $ | 18,015,015 | $ | 20,605,590 | ||||
Long-term capital gain | — | 227,942 | ||||||
Total distributions | $ | 18,015,015 | $ | 20,833,532 | ||||
Tax Components of Net Assets at Period-End:
| 2013 | ||||
Undistributed ordinary income | $ | 1,742,403 | ||
Net unrealized appreciation (depreciation) — investments | (1,437,695 | ) | ||
Net unrealized appreciation (depreciation) — other investments | (368,242 | ) | ||
Temporary book/tax differences | (143,065 | ) | ||
Post-October deferrals | (5,061,906 | ) | ||
Capital loss carryforward | (81,094,105 | ) | ||
Shares of beneficial interest | 654,294,820 | |||
Total net assets | $ | 567,932,210 | ||
The difference between book-basis and tax-basis unrealized appreciation (depreciation) is due to differences in the timing of recognition of gains and losses on investments for tax and book purposes. The Fund’s net unrealized appreciation (depreciation) difference is attributable primarily to wash sales, book to tax accretion and amortization differences and mortgage-backed dollar rolls.
The temporary book/tax differences are a result of timing differences between book and tax recognition of income and/or expenses. The Fund’s temporary book/tax differences are the result of the trustee deferral of compensation and retirement plan benefits.
Capital loss carryforward is calculated and reported as of a specific date. Results of transactions and other activity after that date may affect the amount of capital loss carryforward actually available for the Fund to utilize. The Regulated Investment Company Modernization Act of 2010 eliminated the eight-year carryover period for capital losses that arise in taxable years beginning after its enactment date of December 22, 2010. Consequently, these capital losses can be carried forward for an unlimited period. However, capital losses with an expiration period may not be used to offset capital gains until all net capital losses without an expiration date have been utilized. Additionally, post-enactment capital loss carryovers will retain their character as either short-term or long-term capital losses instead of as short-term capital losses as under prior law. The ability to utilize capital loss carryforward in the future may be limited under the Internal Revenue Code and related regulations based on the results of future transactions.
The Fund utilized $6,843,187 of capital loss carryforward in the current period to offset net realized capital gain for federal income tax purposes. The Fund has a capital loss carryforward as of August 31, 2013, which expires as follows:
| Capital Loss Carryforward* | ||||||||||||
| Expiration | Short-Term | Long-Term | Total | |||||||||
August 31, 2016 | $ | 81,094,105 | $ | — | $ | 81,094,105 | ||||||
| * | Capital loss carryforward as of the date listed above is reduced for limitations, if any, to the extent required by the Internal Revenue Code. To the extent that unrealized gains as of June 6, 2011, the date of reorganizations of Invesco Core Bond Fund and Invesco Van Kampen Core Plus Fixed Income Fund into the Fund, are realized on securities held in each fund at such date of reorganizations, the capital loss carryforward may be further limited for up to five years from the date of the reorganizations. |
38 Invesco Core Plus Bond Fund
NOTE 9—Investment Securities
The aggregate amount of investment securities (other than short-term securities, U.S. Treasury obligations and money market funds, if any) purchased and sold by the Fund during the year ended August 31, 2013 was $1,505,868,252 and $1,356,754,778, respectively. During the same period, purchases and sales of U.S. Treasury obligations were $113,655,502 and $142,680,980, respectively. Cost of investments on a tax basis includes the adjustments for financial reporting purposes as of the most recently completed federal income tax reporting period-end.
| Unrealized Appreciation (Depreciation) of Investment Securities on a Tax Basis | ||||
Aggregate unrealized appreciation of investment securities | $ | 15,058,950 | ||
Aggregate unrealized (depreciation) of investment securities | (16,496,645 | ) | ||
Net unrealized appreciation (depreciation) of investment securities | $ | (1,437,695 | ) | |
Cost of investments for tax purposes is $646,153,724.
NOTE 10—Reclassification of Permanent Differences
Primarily as a result of differing book/tax treatment of mortgage-backed dollar rolls, paydown gains and bond premium amortization, on August 31, 2013, undistributed net investment income was increased by $3,040,628, undistributed net realized gain (loss) was decreased by $3,160,360 and shares of beneficial interest was increased by $119,732. This reclassification had no effect on the net assets of the Fund.
NOTE 11—Share Information
| Summary of Share Activity | ||||||||||||||||
| Years ended August 31, | ||||||||||||||||
| 2013(a) | 2012 | |||||||||||||||
| Shares | Amount | Shares | Amount | |||||||||||||
Sold: | ||||||||||||||||
Class A | 11,443,179 | $ | 124,770,153 | 9,948,952 | $ | 106,394,842 | ||||||||||
Class B | 259,725 | 2,842,268 | 484,939 | 5,170,584 | ||||||||||||
Class C | 1,644,469 | 17,949,741 | 1,374,205 | 14,701,103 | ||||||||||||
Class R | 97,728 | 1,065,927 | 128,962 | 1,380,248 | ||||||||||||
Class Y | 342,319 | 3,760,180 | 65,961 | 707,807 | ||||||||||||
Class R5 | 302,401 | 3,240,211 | 1,896,102 | 20,306,223 | ||||||||||||
Class R6(b) | 17,635,417 | 193,142,924 | — | — | ||||||||||||
Issued as reinvestment of dividends: | ||||||||||||||||
Class A | 816,836 | 8,849,484 | 894,234 | 9,577,150 | ||||||||||||
Class B | 37,163 | 403,488 | 66,220 | 707,879 | ||||||||||||
Class C | 74,719 | 809,654 | 98,725 | 1,056,143 | ||||||||||||
Class R | 8,695 | 94,324 | 10,094 | 108,082 | ||||||||||||
Class Y | 4,187 | 45,485 | 5,812 | 62,515 | ||||||||||||
Class R5 | 8,502 | 92,331 | 703,096 | 7,518,852 | ||||||||||||
Class R6 | 515,819 | 5,577,578 | — | — | ||||||||||||
Automatic conversion of Class B shares to Class A shares: | ||||||||||||||||
Class A | 311,678 | 3,391,634 | 368,284 | 3,989,575 | ||||||||||||
Class B | (311,701 | ) | (3,391,634 | ) | (369,811 | ) | (3,989,575 | ) | ||||||||
Reacquired: | ||||||||||||||||
Class A | (8,373,749 | ) | (90,407,950 | ) | (5,503,380 | ) | (58,777,207 | ) | ||||||||
Class B | (512,456 | ) | (5,540,617 | ) | (431,301 | ) | (4,568,735 | ) | ||||||||
Class C | (1,749,709 | ) | (18,791,549 | ) | (1,164,354 | ) | (12,431,856 | ) | ||||||||
Class R | (138,164 | ) | (1,495,963 | ) | (53,449 | ) | (569,487 | ) | ||||||||
Class Y | (731,992 | ) | (7,984,908 | ) | (40,125 | ) | (428,750 | ) | ||||||||
Class R5 | (15,607,029 | ) | (171,164,439 | ) | (2,841,591 | ) | (30,246,655 | ) | ||||||||
Class R6 | (322,143 | ) | (3,436,755 | ) | — | — | ||||||||||
Net increase in share activity | 5,755,894 | $ | 63,821,567 | 5,641,575 | $ | 60,668,738 | ||||||||||
| (a) | There are entities that are record owners of more than 5% of the outstanding shares of the Fund and in the aggregate own 33% of the outstanding shares of the Fund. IDI has an agreement with these entities to sell Fund shares. The Fund, Invesco and/or Invesco affiliates may make payments to these entities, which are considered to be related to the Fund, for providing services to the Fund, Invesco and/or Invesco affiliates including but not limited to services such as securities brokerage, distribution, third party record keeping and account servicing. The Fund has no knowledge as to whether all or any portion of the shares owned of record by these entities are also owned beneficially. |
| In addition, 33% of the outstanding shares of the Fund are owned by affiliated mutual funds. Affiliated mutual funds are mutual funds that are advised by Invesco. |
| (b) | Commencement date of September 24, 2012. |
39 Invesco Core Plus Bond Fund
NOTE 12—Financial Highlights
The following schedule presents financial highlights for a share of the Fund outstanding throughout the periods indicated.
| Net asset value, beginning of period | Net investment income(a) | Net gains (losses) on securities (both realized and unrealized) | Total from investment operations | Dividends from net investment income | Distributions from net realized gains | Total distributions | Net asset value, end of period | Total return(b) | Net assets, end of period (000’s omitted) | Ratio of expenses to average net assets with fee waivers and/or expenses absorbed | Ratio of expenses to average net assets without fee waivers and/or expenses absorbed | Ratio of net investment income to average net assets | Portfolio turnover(c) | |||||||||||||||||||||||||||||||||||||||||||
Class A | ||||||||||||||||||||||||||||||||||||||||||||||||||||||||
Year ended 08/31/13 | $ | 10.95 | $ | 0.31 | $ | (0.51 | ) | $ | (0.20 | ) | $ | (0.34 | ) | $ | — | $ | (0.34 | ) | $ | 10.41 | (1.92 | )% | $ | 324,537 | 0.73 | %(d) | 0.99 | %(d) | 2.86 | %(d) | 252 | % | ||||||||||||||||||||||||
Year ended 08/31/12 | 10.60 | 0.37 | 0.44 | 0.81 | (0.44 | ) | (0.02 | ) | (0.46 | ) | 10.95 | 7.86 | 295,311 | 0.74 | 1.01 | 3.44 | 297 | |||||||||||||||||||||||||||||||||||||||
Year ended 08/31/11 | 10.75 | 0.35 | (0.03 | ) | 0.32 | (0.32 | ) | (0.15 | ) | (0.47 | ) | 10.60 | 3.10 | 225,417 | 0.75 | 1.20 | 3.27 | 138 | ||||||||||||||||||||||||||||||||||||||
Year ended 08/31/10 | 10.29 | 0.37 | 0.65 | 1.02 | (0.49 | ) | (0.07 | ) | (0.56 | ) | 10.75 | 10.26 | 7,219 | 0.87 | 5.61 | 3.55 | 78 | |||||||||||||||||||||||||||||||||||||||
Year ended 08/31/09(e) | 10.00 | 0.09 | 0.27 | 0.36 | (0.07 | ) | — | (0.07 | ) | 10.29 | 3.58 | 2,882 | 0.84 | (f) | 12.89 | (f) | 3.47 | (f) | 43 | |||||||||||||||||||||||||||||||||||||
Class B | ||||||||||||||||||||||||||||||||||||||||||||||||||||||||
Year ended 08/31/13 | 10.95 | 0.23 | (0.51 | ) | (0.28 | ) | (0.26 | ) | — | (0.26 | ) | 10.41 | (2.66 | ) | 15,876 | 1.48 | (d) | 1.74 | (d) | 2.11 | (d) | 252 | ||||||||||||||||||||||||||||||||||
Year ended 08/31/12 | 10.60 | 0.29 | 0.44 | 0.73 | (0.36 | ) | (0.02 | ) | (0.38 | ) | 10.95 | 7.06 | 22,465 | 1.49 | 1.76 | 2.69 | 297 | |||||||||||||||||||||||||||||||||||||||
Year ended 08/31/11 | 10.74 | 0.27 | (0.02 | ) | 0.25 | (0.24 | ) | (0.15 | ) | (0.39 | ) | 10.60 | 2.43 | 24,401 | 1.50 | 1.95 | 2.52 | 138 | ||||||||||||||||||||||||||||||||||||||
Year ended 08/31/10 | 10.29 | 0.29 | 0.64 | 0.93 | (0.41 | ) | (0.07 | ) | (0.48 | ) | 10.74 | 9.34 | 954 | 1.62 | 6.36 | 2.80 | 78 | |||||||||||||||||||||||||||||||||||||||
Year ended 08/31/09(e) | 10.00 | 0.07 | 0.27 | 0.34 | (0.05 | ) | — | (0.05 | ) | 10.29 | 3.39 | 205 | 1.59 | (f) | 13.64 | (f) | 2.72 | (f) | 43 | |||||||||||||||||||||||||||||||||||||
Class C | ||||||||||||||||||||||||||||||||||||||||||||||||||||||||
Year ended 08/31/13 | 10.94 | 0.23 | (0.50 | ) | (0.27 | ) | (0.26 | ) | — | (0.26 | ) | 10.41 | (2.56 | ) | 35,770 | 1.48 | (d) | 1.74 | (d) | 2.11 | (d) | 252 | ||||||||||||||||||||||||||||||||||
Year ended 08/31/12 | 10.60 | 0.29 | 0.44 | 0.73 | (0.37 | ) | (0.02 | ) | (0.39 | ) | 10.94 | 6.96 | 37,950 | 1.49 | 1.76 | 2.69 | 297 | |||||||||||||||||||||||||||||||||||||||
Year ended 08/31/11 | 10.74 | 0.27 | (0.02 | ) | 0.25 | (0.24 | ) | (0.15 | ) | (0.39 | ) | 10.60 | 2.43 | 33,476 | 1.50 | 1.95 | 2.52 | 138 | ||||||||||||||||||||||||||||||||||||||
Year ended 08/31/10 | 10.29 | 0.29 | 0.64 | 0.93 | (0.41 | ) | (0.07 | ) | (0.48 | ) | 10.74 | 9.34 | 844 | 1.62 | 6.36 | 2.80 | 78 | |||||||||||||||||||||||||||||||||||||||
Year ended 08/31/09(e) | 10.00 | 0.07 | 0.27 | 0.34 | (0.05 | ) | — | (0.05 | ) | 10.29 | 3.39 | 223 | 1.59 | (f) | 13.64 | (f) | 2.72 | (f) | 43 | |||||||||||||||||||||||||||||||||||||
Class R | ||||||||||||||||||||||||||||||||||||||||||||||||||||||||
Year ended 08/31/13 | 10.95 | 0.28 | (0.51 | ) | (0.23 | ) | (0.31 | ) | — | (0.31 | ) | 10.41 | (2.16 | ) | 2,820 | 0.98 | (d) | 1.24 | (d) | 2.61 | (d) | 252 | ||||||||||||||||||||||||||||||||||
Year ended 08/31/12 | 10.60 | 0.34 | 0.44 | 0.78 | (0.41 | ) | (0.02 | ) | (0.43 | ) | 10.95 | 7.59 | 3,313 | 0.99 | 1.26 | 3.19 | 297 | |||||||||||||||||||||||||||||||||||||||
Year ended 08/31/11 | 10.74 | 0.32 | (0.02 | ) | 0.30 | (0.29 | ) | (0.15 | ) | (0.44 | ) | 10.60 | 2.94 | 2,301 | 1.00 | 1.45 | 3.02 | 138 | ||||||||||||||||||||||||||||||||||||||
Year ended 08/31/10 | 10.29 | 0.34 | 0.64 | 0.98 | (0.46 | ) | (0.07 | ) | (0.53 | ) | 10.74 | 9.88 | 153 | 1.12 | 5.86 | 3.30 | 78 | |||||||||||||||||||||||||||||||||||||||
Year ended 08/31/09(e) | 10.00 | 0.08 | 0.27 | 0.35 | (0.06 | ) | — | (0.06 | ) | 10.29 | 3.51 | 105 | 1.09 | (f) | 13.14 | (f) | 3.22 | (f) | 43 | |||||||||||||||||||||||||||||||||||||
Class Y | ||||||||||||||||||||||||||||||||||||||||||||||||||||||||
Year ended 08/31/13 | 10.95 | 0.34 | (0.50 | ) | (0.16 | ) | (0.37 | ) | — | (0.37 | ) | 10.42 | (1.58 | ) | 1,456 | 0.48 | (d) | 0.74 | (d) | 3.11 | (d) | 252 | ||||||||||||||||||||||||||||||||||
Year ended 08/31/12 | 10.60 | 0.39 | 0.45 | 0.84 | (0.47 | ) | (0.02 | ) | (0.49 | ) | 10.95 | 8.12 | 5,753 | 0.49 | 0.76 | 3.69 | 297 | |||||||||||||||||||||||||||||||||||||||
Year ended 08/31/11 | 10.74 | 0.37 | (0.01 | ) | 0.36 | (0.35 | ) | (0.15 | ) | (0.50 | ) | 10.60 | 3.46 | 5,234 | 0.50 | 0.95 | 3.52 | 138 | ||||||||||||||||||||||||||||||||||||||
Year ended 08/31/10 | 10.29 | 0.40 | 0.63 | 1.03 | (0.51 | ) | (0.07 | ) | (0.58 | ) | 10.74 | 10.43 | 144 | 0.62 | 5.36 | 3.80 | 78 | |||||||||||||||||||||||||||||||||||||||
Year ended 08/31/09(e) | 10.00 | 0.09 | 0.27 | 0.36 | (0.07 | ) | — | (0.07 | ) | 10.29 | 3.64 | 126 | 0.59 | (f) | 12.64 | (f) | 3.72 | (f) | 43 | |||||||||||||||||||||||||||||||||||||
Class R5 | ||||||||||||||||||||||||||||||||||||||||||||||||||||||||
Year ended 08/31/13 | 10.94 | 0.34 | (0.51 | ) | (0.17 | ) | (0.37 | ) | — | (0.37 | ) | 10.40 | (1.68 | ) | 1,960 | 0.48 | (d) | 0.56 | (d) | 3.11 | (d) | 252 | ||||||||||||||||||||||||||||||||||
Year ended 08/31/12 | 10.60 | 0.39 | 0.44 | 0.83 | (0.47 | ) | (0.02 | ) | (0.49 | ) | 10.94 | 8.03 | 169,474 | 0.49 | 0.56 | 3.69 | 297 | |||||||||||||||||||||||||||||||||||||||
Year ended 08/31/11 | 10.74 | 0.37 | (0.01 | ) | 0.36 | (0.35 | ) | (0.15 | ) | (0.50 | ) | 10.60 | 3.46 | 166,656 | 0.50 | 0.66 | 3.52 | 138 | ||||||||||||||||||||||||||||||||||||||
Year ended 08/31/10 | 10.29 | 0.40 | 0.64 | 1.04 | (0.52 | ) | (0.07 | ) | (0.59 | ) | 10.74 | 10.43 | 115 | 0.62 | 5.29 | 3.80 | 78 | |||||||||||||||||||||||||||||||||||||||
Year ended 08/31/09(e) | 10.00 | 0.09 | 0.27 | 0.36 | (0.07 | ) | — | (0.07 | ) | 10.29 | 3.64 | 104 | 0.59 | (f) | 12.68 | (f) | 3.72 | (f) | 43 | |||||||||||||||||||||||||||||||||||||
Class R6 | ||||||||||||||||||||||||||||||||||||||||||||||||||||||||
Year ended 08/31/13(e) | 10.97 | 0.32 | (0.54 | ) | (0.22 | ) | (0.34 | ) | — | (0.34 | ) | 10.41 | (2.07 | ) | 185,513 | 0.48 | (d)(f) | 0.54 | (d)(f) | 3.11 | (d)(f) | 252 | ||||||||||||||||||||||||||||||||||
| (a) | Calculated using average shares outstanding. |
| (b) | Includes adjustments in accordance with accounting principles generally accepted in the United States of America and as such, the net asset value for financial reporting purposes and the returns based upon those net asset values may differ from the net asset value and returns for shareholder transactions. Does not include sales charges and is not annualized for periods less than one year, if applicable. |
| (c) | Portfolio turnover is calculated at the fund level and is not annualized for periods less than one year, if applicable. For the period ended August 31, 2011, the portfolio turnover calculation excludes the value of securities purchased of $390,261,951 and sold of $29,803,473 in the effort to realign the Fund’s portfolio holdings after the reorganizations of Invesco Core Bond Fund and Invesco Van Kampen Core Plus Fixed Income Fund into the Fund. |
| (d) | Ratios are based on average daily net assets (000’s omitted) of $330,097, $20,415, $40,416, $3,325, $4,135, $13,934 and $177,470 for Class A, Class B, Class C, Class R, Class Y, Class R5 and Class R6 shares, respectively. |
| (e) | Commencement date of June 3, 2009 for Class A, Class B, Class C, Class R, Class Y and Class R5 shares and September 24, 2012 for Class R6 shares. |
| (f) | Annualized. |
40 Invesco Core Plus Bond Fund
Report of Independent Registered Public Accounting Firm
To the Board of Trustees of AIM Counselor Series Trust (Invesco Counselor Series Trust)
and Shareholders of Invesco Core Plus Bond Fund:
In our opinion, the accompanying statement of assets and liabilities, including the schedule of investments, and the related statements of operations and of changes in net assets and the financial highlights present fairly, in all material respects, the financial position of Invesco Core Plus Bond Fund (one of the funds constituting AIM Counselor Series Trust (Invesco Counselor Series Trust), hereafter referred to as the “Fund”) at August 31, 2013, the results of its operations for the year then ended, the changes in its net assets for each of the two years in the period then ended and the financial highlights for each of the periods indicated, in conformity with accounting principles generally accepted in the United States of America. These financial statements and financial highlights (hereafter referred to as “financial statements”) are the responsibility of the Fund’s management; our responsibility is to express an opinion on these financial statements based on our audits. We conducted our audits of these financial statements in accordance with the standards of the Public Company Accounting Oversight Board (United States). Those standards require that we plan and perform the audit to obtain reasonable assurance about whether the financial statements are free of material misstatement. An audit includes examining, on a test basis, evidence supporting the amounts and disclosures in the financial statements, assessing the accounting principles used and significant estimates made by management, and evaluating the overall financial statement presentation. We believe that our audits, which included confirmation of securities at August 31, 2013 by correspondence with the custodian and brokers, provide a reasonable basis for our opinion.
PRICEWATERHOUSECOOPERS LLP
October 25, 2013
Houston, Texas
41 Invesco Core Plus Bond Fund
Calculating your ongoing Fund expenses
Example
As a shareholder of the Fund, you incur two types of costs: (1) transaction costs, which may include sales charges (loads) on purchase payments or contingent deferred sales charges on redemptions, if any; and (2) ongoing costs, including management fees, distribution and/or service (12b-1) fees, and other Fund expenses. This example is intended to help you understand your ongoing costs (in dollars) of investing in the Fund and to compare these costs with ongoing costs of investing in other mutual funds. The example is based on an investment of $1,000 invested at the beginning of the period and held for the entire period March 1, 2013 through August 31, 2013.
Actual expenses
The table below provides information about actual account values and actual expenses. You may use the information in this table, together with the amount you invested, to estimate the expenses that you paid over the period. Simply divide your account value by $1,000 (for example, an $8,600 account value divided by $1,000 = 8.6), then multiply the result by the number in the table under the heading entitled “Actual Expenses Paid During Period” to estimate the expenses you paid on your account during this period.
Hypothetical example for comparison purposes
The table below also provides information about hypothetical account values and hypothetical expenses based on the Fund’s actual expense ratio and an assumed rate of return of 5% per year before expenses, which is not the Fund’s actual return.
The hypothetical account values and expenses may not be used to estimate the actual ending account balance or expenses you paid for the period. You may use this information to compare the ongoing costs of investing in the Fund and other funds. To do so, compare this 5% hypothetical example with the 5% hypothetical examples that appear in the shareholder reports of the other funds.
Please note that the expenses shown in the table are meant to highlight your ongoing costs only and do not reflect any transaction costs, such as sales charges (loads) on purchase payments or contingent deferred sales charges on redemptions, if any. Therefore, the hypothetical information is useful in comparing ongoing costs only, and will not help you determine the relative total costs of owning different funds. In addition, if these transaction costs were included, your costs would have been higher.
| Class | Beginning Account Value (03/01/13) | ACTUAL | HYPOTHETICAL (5% annual return before expenses) | Annualized Expense Ratio | ||||||||||||||||||||
| Ending Account Value (08/31/13)1 | Expenses Paid During Period2 | Ending Account Value (08/31/13) | Expenses Paid During Period2 | |||||||||||||||||||||
Class A | $ | 1,000.00 | $ | 966.50 | $ | 3.62 | $ | 1,021.53 | $ | 3.72 | 0.73 | % | ||||||||||||
Class B | 1,000.00 | 962.80 | 7.32 | 1,017.74 | 7.53 | 1.48 | ||||||||||||||||||
Class C | 1,000.00 | 962.80 | 7.32 | 1,017.74 | 7.53 | 1.48 | ||||||||||||||||||
Class R | 1,000.00 | 965.30 | 4.85 | 1,020.27 | 4.99 | 0.98 | ||||||||||||||||||
Class Y | 1,000.00 | 968.60 | 2.38 | 1,022.79 | 2.45 | 0.48 | ||||||||||||||||||
Class R5 | 1,000.00 | 968.60 | 2.38 | 1,022.79 | 2.45 | 0.48 | ||||||||||||||||||
Class R6 | 1,000.00 | 968.60 | 2.38 | 1,022.79 | 2.45 | 0.48 | ||||||||||||||||||
| 1 | The actual ending account value is based on the actual total return of the Fund for the period March 1, 2013 through August 31, 2013, after actual expenses and will differ from the hypothetical ending account value which is based on the Fund’s expense ratio and a hypothetical annual return of 5% before expenses. |
| 2 | Expenses are equal to the Fund’s annualized expense ratio as indicated above multiplied by the average account value over the period, multiplied by 184/365 to reflect the most recent fiscal half year. |
42 Invesco Core Plus Bond Fund
Approval of Investment Advisory and Sub-Advisory Contracts
The Board of Trustees (the Board) of AIM Counselor Series Trust (Invesco Counselor Series Trust) is required under the Investment Company Act of 1940, as amended, to approve annually the renewal of Invesco Core Plus Bond Fund’s (the Fund) investment advisory agreement with Invesco Advisers, Inc. (Invesco Advisers) and the Master Intergroup Sub-Advisory Contract for Mutual Funds (the sub-advisory contracts) with Invesco Asset Management Deutschland GmbH, Invesco Asset Management Limited, Invesco Asset Management (Japan) Limited, Invesco Australia Limited, Invesco Hong Kong Limited, Invesco Senior Secured Management, Inc. and Invesco Canada Ltd. (collectively, the Affiliated Sub-Advisers). During contract renewal meetings held on June 17-19, 2013, the Board as a whole, and the disinterested or “independent” Trustees, who comprise over 75% of the Board, voting separately, approved the continuance of the Fund’s investment advisory agreement and the sub-advisory contracts for another year, effective July 1, 2013. The Board determined that continuation of the Fund’s investment advisory agreement and the sub-advisory contracts are in the best interests of the Fund and its shareholders and the compensation payable to Invesco Advisers and the Affiliated Sub-Advisers under the agreements is fair and reasonable.
The Board’s Fund Evaluation Process
The Board’s Investments Committee has established three Sub-Committees, each of which is primarily responsible for overseeing the management of a number of the funds advised by Invesco Advisers (the Invesco Funds). The Sub-Committees meet throughout the year to review the performance of their assigned Invesco Funds, including reviewing materials prepared under the direction of the independent Senior Officer, an officer of the Invesco Funds who reports directly to the independent Trustees. Over the course of each year, the Sub-Committees meet with portfolio managers for their assigned Invesco Funds and other members of management to review the performance, investment objective(s), policies, strategies, limitations and investment risks of these funds. The Sub-Committees meet regularly and at designated contract renewal meetings each year to conduct a review of the performance, fees, expenses and other matters related to their assigned Invesco Funds. Each Sub-Committee recommends to the Investments Committee, which in turn recommends to the full Board, whether and on what terms to approve the continuance of each Invesco Fund’s investment advisory agreement and sub-advisory contracts for another year.
During the contract renewal process, the Trustees receive comparative performance and fee data regarding the Invesco Funds prepared
by Invesco Advisers and Lipper Inc. (Lipper), an independent provider of investment company data. The Trustees also receive an independent written evaluation from the Senior Officer. The Senior Officer’s evaluation is prepared as part of his responsibility to manage the process by which the Invesco Funds’ proposed management fees are negotiated during the annual contract renewal process to ensure they are negotiated in a manner that is at arms’ length and reasonable. The independent Trustees are assisted in their annual evaluation of the Fund’s investment advisory agreement by the Senior Officer and by independent legal counsel. In addition to meetings with Invesco Advisers and fund counsel, the independent Trustees also discuss the continuance of the investment advisory agreement and sub-advisory contracts in separate sessions with the Senior Officer and with independent legal counsel.
In evaluating the fairness and reasonableness of compensation under the Fund’s investment advisory agreement and sub-advisory contracts, the Board considered, among other things, the factors discussed below. The Trustees recognized that the advisory fee rates for the Invesco Funds are, in many cases, the result of years of review and negotiation between the Trustees and Invesco Advisers as well as advisory fees previously approved by different predecessor boards. The Trustees’ deliberations and conclusions in a particular year may be based in part on their deliberations and conclusions regarding these same arrangements throughout the year and in prior years. The Trustees’ review and conclusions are based on the comprehensive consideration of all information presented to them and are not the result of any single determinative factor. Moreover, one Trustee may have weighed a particular piece of information or factor differently than another Trustee.
The discussion below serves as the Senior Officer’s independent written evaluation with respect to the Fund’s investment advisory agreement as well as a discussion of the material factors and related conclusions that formed the basis for the Board’s approval of the Fund’s investment advisory agreement and sub-advisory contracts. Unless otherwise stated, this information is current as of June 19, 2013, and may not reflect consideration of factors that became known to the Board after that date, including, for example, changes to the Fund’s performance, advisory fees, expense limitations and/or fee waivers.
Factors and Conclusions and Summary of Independent Written Fee Evaluation
| A. | Nature, Extent and Quality of Services Provided by Invesco Advisers and the Affiliated Sub-Advisers |
The Board reviewed the advisory services provided to the Fund by Invesco Advisers under
the Fund’s investment advisory agreement, the performance of Invesco Advisers in providing these services, and the credentials and experience of the officers and employees of Invesco Advisers who provide these services, including the Fund’s portfolio manager or managers, with whom the Sub-Committees met during the year. The Board’s review of the qualifications of Invesco Advisers to provide advisory services included the Board’s consideration of Invesco Advisers’ investment process oversight, independent credit analysis and investment risk management.
In determining whether to continue the Fund’s investment advisory agreement, the Board considered the benefits of reapproving an existing relationship and the greater uncertainty that may be associated with entering into a new relationship. The Board also considered non-advisory services that Invesco Advisers and its affiliates provide to the Invesco Funds such as various back office support functions, equity and fixed income trading operations, internal audit, distribution and legal and compliance. The Board concluded that the nature, extent and quality of the services provided to the Fund by Invesco Advisers are appropriate and satisfactory and consistent with the terms of the Fund’s investment advisory agreement.
The Board reviewed the services that may be provided by the Affiliated Sub-Advisers under the sub-advisory contracts and the credentials and experience of the officers and employees of the Affiliated Sub-Advisers who provide these services. The Board noted that the Affiliated Sub-Advisers have offices and personnel that are located in financial centers around the world. As a result, the Affiliated Sub-Advisers can provide research and investment analysis on the markets and economies of various countries in which the Fund may invest, make recommendations regarding securities and assist with security trades. The Board concluded that the sub-advisory contracts benefit the Fund and its shareholders by permitting Invesco Advisers to use the resources and talents of the Affiliated Sub-Advisers in managing the Fund. The Board concluded that the nature, extent and quality of the services that may be provided by the Affiliated Sub-Advisers are appropriate and satisfactory and consistent with the terms of the Fund’s sub-advisory contracts.
| B. | Fund Performance |
The Board considered Fund performance as a relevant factor in considering whether to approve the investment advisory agreement. The Board did not view Fund performance as a relevant factor in considering whether to approve the sub-advisory contracts for the Fund, as no Affiliated Sub-Adviser currently manages assets of the Fund.
The Board noted that only three calendar years of comparative performance data was
43 Invesco Core Plus Bond Fund
available for the Fund. The Board compared the Fund’s performance during the past one and three calendar years to the performance of funds in the Lipper performance universe and against the Lipper Intermediate Investment Grade Debt Funds Index. The Board noted that performance of Class A shares of the Fund was in the second quintile of its performance universe for the one year period and the fourth quintile for the three year period (the first quintile being the best performing funds and the fifth quintile being the worst performing funds). The Board noted that performance of Class A shares of the Fund was above the performance of the Index for the one year period and below the Index for the three year period. The Trustees also reviewed more recent Fund performance and this review did not change their conclusions.
| C. | Advisory and Sub-Advisory Fees |
The Board compared the Fund’s contractual management fee rate to the contractual management fee rates of funds in the Fund’s Lipper expense group at a common asset level. The Board noted that the contractual management fee rate for Class A shares of the Fund was below the median contractual management fee rate of funds in its expense group. The Board noted that the term “contractual management fee” may include both advisory and certain administrative services fees and that Invesco Advisers does not charge the Invesco Funds for the administrative services included in the term as defined by Lipper. The Board also reviewed the methodology used by Lipper in providing expense group information, which includes using each fund’s contractual management fee schedule (including any applicable breakpoints) as reported in the most recent prospectus or statement of additional information for each fund in the expense group.
The Board noted that Invesco Advisers and the Affiliated Sub-Advisers do not manage other mutual funds in a manner substantially similar to the management of the Fund.
The Board also considered the fees charged by Invesco Advisers and the Affiliated Sub-Advisers to other client accounts with investment strategies comparable to those of the Fund. The Board noted that Invesco Advisers or the Affiliated Sub-Advisers may charge lower fees to large institutional clients. Invesco Advisers reviewed with the Board the significantly greater scope of services it provides to the Invesco Funds relative to certain other client accounts. These additional services include provision of administrative services, officers and office space, oversight of service providers, preparation of annual registration statement updates and financial information and regulatory compliance under the Investment Company Act of 1940, as amended. Invesco Advisers also reviewed generally the higher frequency of shareholder purchases and redemptions in the Invesco Funds relative to the
flow of assets for other client accounts. Invesco Advisers advised the Board that advance notice of redemptions is often provided to Invesco Advisers by institutional clients. The Board did note that sub-advisory fee rates charged by the Affiliated Sub-Advisers to manage the Invesco Funds and to manage other client accounts tended to be more comparable, reflecting a more comparable scope of services. The Board concluded that the aggregate services provided to the Invesco Funds were sufficiently different from those provided to institutional clients, and the Board did not place significant weight on these fee comparisons.
The Board noted that Invesco Advisers has contractually agreed to limit expenses of the Fund through at least December 31, 2013 in an amount necessary to limit total annual operating expenses to a specified percentage of average daily net assets for each class of the Fund.
The Board also considered the services that may be provided by the Affiliated Sub-Advisers pursuant to the sub-advisory contracts, as well as the fees payable by Invesco Advisers to the Affiliated Sub-Advisers pursuant to the sub-advisory contracts. The Board also noted that the sub-advisory fees are not paid directly by the Fund, but rather, are payable by Invesco Advisers to the Affiliated Sub-Advisers.
Based upon the information and considerations described above, the Board concluded that the compensation payable to Invesco Advisers and the Affiliated Sub-Advisers is fair and reasonable.
| D. | Economies of Scale and Breakpoints |
The Board considered the extent to which there are economies of scale in the provision of advisory services to the Fund. The Board also considered whether the Fund benefits from economies of scale through contractual breakpoints in the Fund’s advisory fee schedule and was assisted in this review by a report from the Senior Officer. The Board also noted that the Fund shares directly in economies of scale through lower fees charged by third party service providers based on the combined size of the Invesco Funds and other clients advised by Invesco Advisers.
| E. | Profitability and Financial Resources |
The Board reviewed information from Invesco Advisers concerning the costs of the advisory and other services that Invesco Advisers and its affiliates provide to the Fund and the profitability of Invesco Advisers and its affiliates in providing these services for the year ended December 31, 2012. The Board received information from Invesco Advisers about the methodology used to prepare the profitability information. The Board considered the profitability of Invesco Advisers in managing the Fund and the Invesco Funds. The Board noted that Invesco Advisers continues to operate at a net profit from services Invesco Advisers and its subsidiaries provide to the Invesco Funds and the Fund. The Board did not deem the level of profits realized by Invesco Advisers and its
affiliates from providing services to the Fund to be excessive given the nature, quality and extent of the services provided to the Invesco Funds. The Board received and accepted information from Invesco Advisers demonstrating that Invesco Advisers and each Affiliated Sub-Adviser are financially sound and have the resources necessary to perform their obligations under the investment advisory agreement and sub-advisory contracts.
| F. | Collateral Benefits to Invesco Advisers and its Affiliates |
The Board considered various other benefits received by Invesco Advisers and its affiliates from the relationship with the Fund, including the fees received for their provision of transfer agency and distribution services to the Fund. The Board considered comparative information regarding fees charged for these services, including information provided by Lipper and other independent sources. The Board considered the performance of Invesco Advisers and its affiliates in providing these services and the organizational structure employed to provide these services. The Board also considered that these services are provided to the Fund pursuant to written contracts that are reviewed and approved on an annual basis by the Board; that the services are required for the operation of the Fund; that Invesco Advisers and its affiliates can provide services, the nature and quality of which are at least equal to those provided by others offering the same or similar services; and that the fees for such services are fair and reasonable in light of the usual and customary charges by others for services of the same nature and quality.
The Board considered the benefits realized by Invesco Advisers and the Affiliated Sub-Advisers as a result of portfolio brokerage transactions executed through “soft dollar” arrangements. Invesco Advisers noted that the Fund does not execute brokerage transactions through “soft dollar” arrangements to any significant degree.
The Board considered that the Fund’s uninvested cash and cash collateral from any securities lending arrangements may be invested in money market funds advised by Invesco Advisers pursuant to procedures approved by the Board. The Board noted that Invesco Advisers receives advisory fees from these affiliated money market funds attributable to such investments, although Invesco Advisers has contractually agreed to waive through varying periods the advisory fees payable by the Invesco Funds. The waiver is in an amount equal to 100% of the net advisory fee Invesco Advisers receives from the affiliated money market funds with respect to the Fund’s investment in the affiliated money market funds of uninvested cash, but not cash collateral. The Board concluded that the Fund’s investment of uninvested cash and cash collateral from any securities lending arrangements in the affiliated money market funds is in the best interests of the Fund and its shareholders.
44 Invesco Core Plus Bond Fund
Tax Information
Form 1099-DIV, Form 1042-S and other year–end tax information provide shareholders with actual calendar year amounts that should be included in their tax returns. Shareholders should consult their tax advisors.
The following distribution information is being provided as required by the Internal Revenue Code or to meet a specific state’s requirement.
The Fund designates the following amounts or, if subsequently determined to be different, the maximum amount allowable for its fiscal year ended August 31, 2013:
Federal and State Income Tax | ||||
Qualified Dividend Income* | 1.31 | % | ||
Corporate Dividends Received Deduction* | 1.42 | % | ||
U.S. Treasury Obligations* | 6.50 | % | ||
| * | The above percentages are based on ordinary income dividends paid to shareholders during the Fund’s fiscal year. |
45 Invesco Core Plus Bond Fund
Trustees and Officers
The address of each trustee and officer is AIM Counselor Series Trust (Invesco Counselor Series Trust) (the “Trust”), 11 Greenway Plaza, Suite 1000, Houston, Texas 77046-1173. The trustees serve for the life of the Trust, subject to their earlier death, incapacitation, resignation, retirement or removal as more specifically provided in the Trust’s organizational documents. Each officer serves for a one year term or until their successors are elected and qualified. Column two below includes length of time served with predecessor entities, if any.
Name, Year of Birth and Position(s) Held with the Trust | Trustee and/ or Officer Since | Principal Occupation(s) During Past 5 Years | Number of Funds in Fund Complex Overseen by Trustee | Other Directorship(s) Held by Trustee During Past 5 Years | ||||
| Interested Persons | ||||||||
| Martin L. Flanagan1 — 1960 Trustee | 2007 | Executive Director, Chief Executive Officer and President, Invesco Ltd. (ultimate parent of Invesco and a global investment management firm); Advisor to the Board, Invesco Advisers, Inc. (formerly known as Invesco Institutional (N.A.), Inc.); Trustee, The Invesco Funds; Vice Chair, Investment Company Institute; and Member of Executive Board, SMU Cox School of Business
Formerly: Chairman and Chief Executive Officer, Invesco Advisers, Inc. (registered investment adviser); Director, Chairman, Chief Executive Officer and President, IVZ Inc. (holding company), INVESCO Group Services, Inc. (service provider) and Invesco North American Holdings, Inc. (holding company); Director, Chief Executive Officer and President, Invesco Holding Company Limited (parent of Invesco and a global investment management firm); Director, Invesco Ltd.; Chairman, Investment Company Institute and President, Co-Chief Executive Officer, Co-President, Chief Operating Officer and Chief Financial Officer, Franklin Resources, Inc. (global investment management organization) | 117 | None | ||||
| Philip A. Taylor2 — 1954 Trustee, President and Principal Executive Officer | 2006 | Head of North American Retail and Senior Managing Director, Invesco Ltd.; Director, Co-Chairman, Co-President and Co-Chief Executive Officer, Invesco Advisers, Inc. (formerly known as Invesco Institutional (N.A.), Inc.) (registered investment adviser); Director, Chairman, Chief Executive Officer and President, Invesco Management Group, Inc. (formerly known as Invesco Aim Management Group, Inc.) (financial services holding company); Director and President, INVESCO Funds Group, Inc. (registered investment adviser and registered transfer agent); Director and Chairman, Invesco Investment Services, Inc. (formerly known as Invesco Aim Investment Services, Inc.) (registered transfer agent) and IVZ Distributors, Inc. (formerly known as INVESCO Distributors, Inc.) (registered broker dealer); Director, President and Chairman, Invesco Inc. (holding company) and Invesco Canada Holdings Inc. (holding company); Chief Executive Officer, Invesco Corporate Class Inc. (corporate mutual fund company) and Invesco Canada Fund Inc. (corporate mutual fund company); Director, Chairman and Chief Executive Officer, Invesco Canada Ltd. (formerly known as Invesco Trimark Ltd./Invesco Trimark Ltèe) (registered investment adviser and registered transfer agent); Trustee, President and Principal Executive Officer, The Invesco Funds (other than AIM Treasurer’s Series Trust (Invesco Treasurer’s Series Trust) and Short-Term Investments Trust); Trustee and Executive Vice President, The Invesco Funds (AIM Treasurer’s Series Trust (Invesco Treasurer’s Series Trust) and Short-Term Investments Trust only); Director, Invesco Investment Advisers LLC (formerly known as Van Kampen Asset Management); Director, Chief Executive Officer and President, Van Kampen Exchange Corp.
Formerly: Director and Chairman, Van Kampen Investor Services Inc.: Director, Chief Executive Officer and President, 1371 Preferred Inc. (holding company); and Van Kampen Investments Inc.; Director and President, AIM GP Canada Inc. (general partner for limited partnerships); and Van Kampen Advisors, Inc.; Director and Chief Executive Officer, Invesco Trimark Dealer Inc. (registered broker dealer); Director, Invesco Distributors, Inc. (formerly known as Invesco Aim Distributors, Inc.) (registered broker dealer); Manager, Invesco PowerShares Capital Management LLC; Director, Chief Executive Officer and President, Invesco Advisers, Inc.; Director, Chairman, Chief Executive Officer and President, Invesco Aim Capital Management, Inc.; President, Invesco Trimark Dealer Inc. and Invesco Trimark Ltd./Invesco Trimark Ltèe; Director and President, AIM Trimark Corporate Class Inc. and AIM Trimark Canada Fund Inc.; Senior Managing Director, Invesco Holding Company Limited; Trustee and Executive Vice President, Tax-Free Investments Trust; Director and Chairman, Fund Management Company (former registered broker dealer); President and Principal Executive Officer, The Invesco Funds (AIM Treasurer’s Series Trust (Invesco Treasurer’s Series Trust), Short-Term Investments Trust and Tax-Free Investments Trust only); President, AIM Trimark Global Fund Inc. and AIM Trimark Canada Fund Inc. | 117 | None | ||||
Wayne W. Whalen3 — 1939 Trustee | 2010 | Of Counsel, and prior to 2010, partner in the law firm of Skadden, Arps, Slate, Meagher & Flom LLP, legal counsel to certain funds in the Fund Complex
| 130 | Director of the Mutual Fund Directors Forum, a nonprofit membership organization for investment directors; Chairman and Director of the Abraham Lincoln Presidential Library Foundation; and Director of the Stevenson Center for Democracy |
| 1 | Mr. Flanagan is considered an interested person of the Trust because he is an officer of the adviser to the Trust, and an officer and a director of Invesco Ltd., ultimate parent of the adviser to the Trust. |
| 2 | Mr. Taylor is considered an interested person of the Trust because he is an officer and a director of the adviser to, and a director of the principal underwriter of, the Trust. |
| 3 | Mr. Whalen is considered an “interested person” (within the meaning of Section 2(a)(19) of the 1940 Act) of certain Funds in the Invesco Fund Complex because he and his firm currently provide legal services as legal counsel to such Funds. |
T-1 Invesco Core Plus Bond Fund
Trustees and Officers—(continued)
Name, Year of Birth and Position(s) Held with the Trust | Trustee and/ or Officer Since | Principal Occupation(s) During Past 5 Years | Number of Funds in Fund Complex Overseen by Trustee | Other Directorship(s) Held by Trustee During Past 5 Years | ||||
| Independent Trustees | ||||||||
Bruce L. Crockett — 1944 Trustee and Chair | 2003 | Chairman, Crockett Technologies Associates (technology consulting company)
Formerly: Director, Captaris (unified messaging provider); Director, President and Chief Executive Officer COMSAT Corporation; and Chairman, Board of Governors of INTELSAT (international communications company) | 117 | ACE Limited (insurance company); Investment Company Institute | ||||
David C. Arch — 1945 Trustee | 2010 | Chairman and Chief Executive Officer of Blistex Inc., (consumer health care products manufacturer)
Formerly: Member of the Heartland Alliance Advisory Board, a nonprofit organization serving human needs based in Chicago | 130 | Board member of the Illinois Manufacturers’ Association; Member of the Board of Visitors, Institute for the Humanities, University of Michigan | ||||
Frank S. Bayley — 1939 Trustee | 2003 | Retired
Formerly: Director, Badgley Funds, Inc. (registered investment company) (2 portfolios) and General Partner and Of Counsel, law firm of Baker & McKenzie, LLP | 117 | Director and Chairman, C.D. Stimson Company (a real estate investment company); Trustee and Overseer, The Curtis Institute of Music | ||||
James T. Bunch — 1942 Trustee | 2000 | Managing Member, Grumman Hill Group LLC (family office private equity management)
Formerly: Founder, Green, Manning & Bunch Ltd. (investment banking firm)(1988-2010); Executive Committee, United States Golf Association; and Director, Policy Studies, Inc. and Van Gilder Insurance Corporation | 117 | Chairman, Board of Governors, Western Golf Association; Chairman-elect, Evans Scholars Foundation; and Director, Denver Film Society | ||||
Rodney F. Dammeyer — 1940 Trustee | 2010 | Chairman of CAC, LLC, (private company offering capital investment and management advisory services)
Formerly: Prior to 2001, Managing Partner at Equity Group Corporate Investments; Prior to 1995, Chief Executive Officer of Itel Corporation (formerly Anixter International); Prior to 1985, experience includes Senior Vice President and Chief Financial Officer of Household International, Inc., Executive Vice President and Chief Financial Officer of Northwest Industries, Inc. and Partner of Arthur Andersen & Co.; From 1987 to 2010, Director/Trustee of investment companies in the Van Kampen Funds complex | 117 | Director of Quidel Corporation and Stericycle, Inc.; Prior to May 2008, Trustee of The Scripps Research Institute; Prior to February 2008, Director of Ventana Medical Systems, Inc. | ||||
Albert R. Dowden — 1941 Trustee | 2003 | Director of a number of public and private business corporations, including the Boss Group, Ltd. (private investment and management); Reich & Tang Funds (5 portfolios) (registered investment company); and Homeowners of America Holding Corporation/ Homeowners of America Insurance Company (property casualty company)
Formerly: Director, Continental Energy Services, LLC (oil and gas pipeline service); Director, CompuDyne Corporation (provider of product and services to the public security market) and Director, Annuity and Life Re (Holdings), Ltd. (reinsurance company); Director, President and Chief Executive Officer, Volvo Group North America, Inc.; Senior Vice President, AB Volvo; Director of various public and private corporations; Chairman, DHJ Media, Inc.; Director Magellan Insurance Company; and Director, The Hertz Corporation, Genmar Corporation (boat manufacturer), National Media Corporation; Advisory Board of Rotary Power International (designer, manufacturer, and seller of rotary power engines); and Chairman, Cortland Trust, Inc. (registered investment company) | 117 | Director of Nature’s Sunshine Products, Inc. | ||||
Jack M. Fields — 1952 Trustee | 2003 | Chief Executive Officer, Twenty First Century Group, Inc. (government affairs company); Owner and Chief Executive Officer, Dos Angeles Ranch, L.P. (cattle, hunting, corporate entertainment); and Discovery Global Education Fund (non-profit)
Formerly: Chief Executive Officer, Texana Timber LP (sustainable forestry company); Director of Cross Timbers Quail Research Ranch (non-profit); and member of the U.S. House of Representatives | 117 | Insperity, Inc. (formerly known as Administaff) | ||||
Prema Mathai-Davis — 1950 Trustee | 2003 | Retired
Formerly: Chief Executive Officer, YWCA of the U.S.A. | 117 | None | ||||
Larry Soll — 1942 Trustee | 1997 | Retired
Formerly: Chairman, Chief Executive Officer and President, Synergen Corp. (a biotechnology company) | 117 | None | ||||
Hugo F. Sonnenschein — 1940 Trustee | 2010 | Distinguished Service Professor and President Emeritus of the University of Chicago and the Adam Smith Distinguished Service Professor in the Department of Economics at the University of Chicago
Formerly: President of the University of Chicago | 130 | Trustee of the University of Rochester and a member of its investment committee. Member of the National Academy of Sciences, the American Philosophical Society and a fellow of the American Academy of Arts and Sciences |
T-2 Invesco Core Plus Bond Fund
Trustees and Officers—(continued)
Name, Year of Birth and Position(s) Held with the Trust | Trustee and/ or Officer Since | Principal Occupation(s) During Past 5 Years | Number of Funds in Fund Complex Overseen by Trustee | Other Directorship(s) Held by Trustee During Past 5 Years | ||||
| Independent Trustees—(continued) | ||||||||
Raymond Stickel, Jr. — 1944 Trustee | 2005 | Retired
Formerly: Director, Mainstay VP Series Funds, Inc. (25 portfolios) and Partner, Deloitte & Touche | 117 | None | ||||
| Other Officers | ||||||||
| Russell C. Burk — 1958 Senior Vice President and Senior Officer | 2005 | Senior Vice President and Senior Officer, The Invesco Funds | N/A | N/A | ||||
| John M. Zerr — 1962 Senior Vice President, Chief Legal Officer and Secretary | 2006 | Director, Senior Vice President, Secretary and General Counsel, Invesco Management Group, Inc. (formerly known as Invesco Aim Management Group, Inc.) and Van Kampen Exchange Corp.; Senior Vice President, Invesco Advisers, Inc. (formerly known as Invesco Institutional (N.A.), Inc.) (registered investment adviser); Senior Vice President and Secretary, Invesco Distributors, Inc. (formerly known as Invesco Aim Distributors, Inc.); Director, Vice President and Secretary, Invesco Investment Services, Inc. (formerly known as Invesco Aim Investment Services, Inc.) and IVZ Distributors, Inc. (formerly known as INVESCO Distributors, Inc.); Director and Vice President, INVESCO Funds Group, Inc.; Senior Vice President, Chief Legal Officer and Secretary, The Invesco Funds; Manager, Invesco PowerShares Capital Management LLC; Director, Secretary and General Counsel, Invesco Investment Advisers LLC (formerly known as Van Kampen Asset Management); Secretary and General Counsel, Invesco Capital Markets, Inc. (formerly known as Van Kampen Funds Inc.) and Chief Legal Officer, PowerShares Exchange-Traded Fund Trust, PowerShares Exchange-Traded Fund Trust II, PowerShares India Exchange-Traded Fund Trust and PowerShares Actively Managed Exchange-Traded Fund Trust
Formerly: Director and Vice President, Van Kampen Advisors Inc.; Director, Vice President, Secretary and General Counsel, Van Kampen Investor Services Inc.; Director, Invesco Distributors, Inc. (formerly known as Invesco Aim Distributors, Inc.); Director, Senior Vice President, General Counsel and Secretary, Invesco Aim Advisers, Inc. and Van Kampen Investments Inc.; Director, Vice President and Secretary, Fund Management Company; Director, Senior Vice President, Secretary, General Counsel and Vice President, Invesco Aim Capital Management, Inc.; Chief Operating Officer and General Counsel, Liberty Ridge Capital, Inc. (an investment adviser); Vice President and Secretary, PBHG Funds (an investment company) and PBHG Insurance Series Fund (an investment company); Chief Operating Officer, General Counsel and Secretary, Old Mutual Investment Partners (a broker-dealer); General Counsel and Secretary, Old Mutual Fund Services (an administrator) and Old Mutual Shareholder Services (a shareholder servicing center); Executive Vice President, General Counsel and Secretary, Old Mutual Capital, Inc. (an investment adviser); and Vice President and Secretary, Old Mutual Advisors Funds (an investment company) | N/A | N/A | ||||
| Karen Dunn Kelley — 1960 Vice President | 2003 | Head of Invesco’s World Wide Fixed Income and Cash Management Group; Director, Co-President, Co-Chief Executive Officer, and Co-Chairman, Invesco Advisers, Inc. (formerly known as Invesco Institutional (N.A.), Inc.) (registered investment adviser); Chairman, Invesco Senior Secured Management, Inc.; Senior Vice President, Invesco Management Group, Inc. (formerly known as Invesco Aim Management Group, Inc.); Executive Vice President, Invesco Distributors, Inc. (formerly known as Invesco Aim Distributors, Inc.); Director, Invesco Mortgage Capital Inc., and Invesco Management Company Limited; Director and President, INVESCO Asset Management (Bermuda) Ltd., Vice President, The Invesco Funds (other than AIM Treasurer’s Series Trust (Invesco Treasurer’s Series Trust) and Short-Term Investments Trust); and President and Principal Executive Officer, The Invesco Funds (AIM Treasurer’s Series Trust (Invesco Treasurer’s Series Trust) and Short-Term Investments Trust only)
Formerly: Director, INVESCO Global Asset Management Limited and INVESCO Management S.A.; Senior Vice President, Van Kampen Investments Inc. and Invesco Advisers, Inc. (formerly known as Invesco Institutional (N.A.), Inc.) (registered investment adviser); Vice President, Invesco Advisers, Inc. (formerly known as Invesco Institutional (N.A.), Inc.); Director of Cash Management and Senior Vice President, Invesco Advisers, Inc. and Invesco Aim Capital Management, Inc.; President and Principal Executive Officer, Tax-Free Investments Trust; Director and President, Fund Management Company; Chief Cash Management Officer, Director of Cash Management, Senior Vice President, and Managing Director, Invesco Aim Capital Management, Inc.; Director of Cash Management, Senior Vice President, and Vice President, Invesco Advisers, Inc. and The Invesco Funds (AIM Treasurer’s Series Trust (Invesco Treasurer’s Series Trust), Short-Term Investments Trust and Tax-Free Investments Trust only) | N/A | N/A | ||||
T-3 Invesco Core Plus Bond Fund
Trustees and Officers—(continued)
Name, Year of Birth and Position(s) Held with the Trust | Trustee and/ or Officer Since | Principal Occupation(s) During Past 5 Years | Number of Funds in Fund Complex Overseen by Trustee | Other Directorship(s) Held by Trustee During Past 5 Years | ||||
| Other Officers—(continued) | ||||||||
| Sheri Morris — 1964 Vice President, Treasurer and Principal Financial Officer | 2003 | Vice President, Treasurer and Principal Financial Officer, The Invesco Funds; Vice President, Invesco Advisers, Inc. (formerly known as Invesco Institutional (N.A.), Inc.) (registered investment adviser); and Vice President, PowerShares Exchange-Traded Fund Trust, PowerShares Exchange-Traded Fund Trust II, PowerShares India Exchange-Traded Fund Trust and PowerShares Actively Managed Exchange-Traded Fund Trust
Formerly: Vice President, Invesco Aim Advisers, Inc., Invesco Aim Capital Management, Inc. and Invesco Aim Private Asset Management, Inc.; Assistant Vice President and Assistant Treasurer, The Invesco Funds and Assistant Vice President, Invesco Advisers, Inc., Invesco Aim Capital Management, Inc. and Invesco Aim Private Asset Management, Inc.; and Treasurer, PowerShares Exchange-Traded Fund Trust, PowerShares Exchange-Traded Fund Trust II, PowerShares India Exchange-Traded Fund Trust and PowerShares Actively Managed Exchange-Traded Fund Trust | N/A | N/A | ||||
Crissie M. Wisdom — 1969 Anti-Money Laundering Compliance Officer | 2013 | Anti-Money Laundering Compliance Officer, Invesco Advisers, Inc. (formerly known as Invesco Institutional (N.A.), Inc.) (registered investment adviser), Invesco Capital Markets, Inc. (formerly known as Van Kampen Funds Inc.), Invesco Distributors, Inc., Invesco Investment Services, Inc., Invesco Management Group, Inc., Van Kampen Exchange Corp., The Invesco Funds, Invesco Funds (Chicago), and PowerShares Exchange-Traded Fund Trust, PowerShares Exchange-Traded Fund Trust II, PowerShares India Exchange-Traded Fund Trust, and PowerShares Actively Managed Exchange-Traded Fund Trust; and Fraud Prevention Manager and Controls and Risk Analysis Manager for Invesco Investment Services, Inc. | N/A | N/A | ||||
| Todd L. Spillane — 1958 Chief Compliance Officer | 2006 | Senior Vice President, Invesco Management Group, Inc. (formerly known as Invesco Aim Management Group, Inc.) and Van Kampen Exchange Corp.; Senior Vice President and Chief Compliance Officer, Invesco Advisers, Inc. (registered investment adviser) (formerly known as Invesco Institutional (N.A.), Inc.); Chief Compliance Officer, The Invesco Funds; Vice President, Invesco Distributors, Inc. (formerly known as Invesco Aim Distributors, Inc.) and Invesco Investment Services, Inc. (formerly known as Invesco Aim Investment Services, Inc.)
Formerly: Chief Compliance Officer, Invesco Funds (Chicago); Senior Vice President, Van Kampen Investments Inc.; Senior Vice President and Chief Compliance Officer, Invesco Aim Advisers, Inc. and Invesco Aim Capital Management, Inc.; Chief Compliance Officer, INVESCO Private Capital Investments, Inc. (holding company), Invesco Private Capital, Inc. (registered investment adviser), Invesco Global Asset Management (N.A.), Inc., Invesco Senior Secured Management, Inc. (registered investment adviser), Van Kampen Investor Services Inc., PowerShares Exchange-Traded Fund Trust, PowerShares Exchange-Traded Fund Trust II, PowerShares India Exchange-Traded Fund Trust and PowerShares Actively Managed Exchange-Traded Fund Trust; and Vice President, Invesco Aim Capital Management, Inc. and Fund Management Company | N/A | N/A |
The Statement of Additional Information of the Trust includes additional information about the Fund’s Trustees and is available upon request, without charge, by calling 1.800.959.4246. Please refer to the Fund’s prospectus for information on the Fund’s sub-advisers.
Office of the Fund 11 Greenway Plaza, Suite 1000 Houston, TX 77046-1173 | Investment Adviser Invesco Advisers, Inc. 1555 Peachtree Street, N.E. Atlanta, GA 30309 | Distributor Invesco Distributors, Inc. 11 Greenway Plaza, Suite 1000 Houston, TX 77046-1173 | Auditors PricewaterhouseCoopers LLP 1201 Louisiana Street, Suite 2900 Houston, TX 77002-5678 | |||
Counsel to the Fund Stradley Ronon Stevens & Young, LLP 2005 Market Street, Suite 2600 Philadelphia, PA 19103-7018 | Counsel to the Independent Trustees Goodwin Procter LLP 901 New York Avenue, N.W. Washington, D.C. 20001 | Transfer Agent Invesco Investment Services, Inc. 11 Greenway Plaza, Suite 1000 Houston, TX 77046-1173 | Custodian State Street Bank and Trust Company 225 Franklin Street Boston, MA 02110-2801 | |||
T-4 Invesco Core Plus Bond Fund

Invesco mailing information
Send general correspondence to Invesco Investment Services, Inc., P.O. Box 219078, Kansas City, MO 64121-9078.
Invesco privacy policy
You share personal and financial information with us that is necessary for your transactions and your account records. We take very seriously the obligation to keep that information confidential and private.
Invesco collects nonpublic personal information about you from account applications or other forms you complete and from your transactions with us or our affiliates. We do not disclose information about you or our former customers to service providers or other third parties except to the extent necessary to service your account and in other limited circumstances as permitted by law. For example, we use this information to facilitate the delivery of transaction confirmations, financial reports, prospectuses and tax forms.
Even within Invesco, only people involved in the servicing of your accounts and compliance monitoring have access to your information. To ensure the highest level of confidentiality and security, Invesco maintains physical, electronic and procedural safeguards that meet or exceed federal standards. Special measures, such as data encryption and authentication, apply to your communications with us on our website. More detail is available to you at invesco.com/privacy.
Important notice regarding delivery of security holder documents
To reduce Fund expenses, only one copy of most shareholder documents may be mailed to shareholders with multiple accounts at the same address (Householding). Mailing of your shareholder documents may be householded indefinitely unless you instruct us otherwise. If you do not want the mailing of these documents to be combined with those for other members of your household, please contact Invesco Investment Services, Inc. at 800 959 4246 or contact your financial institution. We will begin sending you individual copies for each account within 30 days after receiving your request.
Fund holdings and proxy voting information
The Fund provides a complete list of its holdings four times in each fiscal year, at the quarter ends. For the second and fourth quarters, the lists appear in the Fund’s semiannual and annual reports to shareholders. For the first and third quarters, the Fund files the lists with the Securities and Exchange Commission (SEC) on Form N-Q. The most recent list of portfolio holdings is available at invesco.com/completeqtrholdings. Shareholders can also look up the Fund’s Forms N-Q on the SEC website at sec.gov. Copies of the Fund’s Forms N-Q may be reviewed and copied at the SEC Public Reference Room in Washington, D.C. You can obtain information on the operation of the Public Reference Room, including information about duplicating fee charges, by calling 202 551 8090 or 800 732 0330, or by electronic request at the following email address: publicinfo@sec.gov. The SEC file numbers for the Fund are shown below.
A description of the policies and procedures that the Fund uses to determine how to vote proxies relating to portfolio securities is available without charge, upon request, from our Client Services department at 800 959 4246 or at invesco.com/proxyguidelines. The information is also available on the SEC website, sec.gov.
Information regarding how the Fund voted proxies related to its portfolio securities during the most recent 12-month period ended June 30 is available at invesco.com/proxysearch. The information is also available on the SEC website, sec.gov. Invesco Advisers, Inc. is an investment adviser; it provides investment advisory services to individual and institutional clients and does not sell securities. Invesco Distributors, Inc. is the US distributor for Invesco Ltd.’s retail mutual funds, exchange-traded funds and institutional money market funds. Both are wholly owned, indirect subsidiaries of Invesco Ltd. |  | ||||
| SEC file numbers: 811-09913 and 333-36074 CPB-AR-1 Invesco Distributors, Inc. | |||||

Letters to Shareholders
Philip Taylor | Dear Shareholders: Enclosed in this annual report, you’ll find information about your Fund and the factors that affected its performance during the reporting period. Inside, you’ll also find a discussion from your portfolio managers about how they managed your Fund, as well as performance data for your Fund, a complete list of your Fund’s investments as of the close of the reporting period and other important information. I hope you find this report of interest. During the reporting period covered by this report, major US equity indexes made multiyear or even all-time highs.1 Economic data were generally positive; housing and consumer spending data were particularly encouraging. Nonetheless, economic uncertainty and concern about continuing political and budget gridlock in Washington persisted. The US Federal Reserve’s deliberate vagueness about when, and to what degree, it might begin to curtail its extraordinarily accommodative monetary policies – together with uncertainty | |
about who will next lead the central bank – affected fixed income and equity markets alike. Most developed, non-US stock markets remained positive for the first half of 2013, despite a difficult second quarter. Periods of market volatility and economic uncertainty can weaken the will of even the most resolute investor. That’s why Invesco believes it’s often helpful to work with a skilled and trusted financial adviser who can emphasize the importance of adhering to an investment plan designed to achieve long-term goals rather than being sidetracked by short-term uncertainty that can result in inaction. A financial adviser who is familiar with your individual financial situation, investment goals and risk tolerance can be an invaluable partner as you work toward your financial goals. He or she can provide insight and perspective when markets are volatile; encouragement and reassurance when times are uncertain; and advice and guidance when your financial situation or investment goals change. Our website, invesco.com/us, is another source of timely insight and information for investors. On the website, you’ll find fund-specific as well as more general information from many of Invesco’s investment professionals. You’ll find in-depth articles, video clips and audio commentaries – and, of course, you also can access information about your Invesco account whenever it’s convenient for you. | ||

What we mean by Intentional Investing
At Invesco, all of our people and all of our resources are dedicated to helping investors achieve their financial objectives. It’s a philosophy we call Intentional Investing, and it guides the way we:
| n | Manage investments – Our dedicated investment professionals search the world for the best opportunities, and each investment team follows a clear, disciplined process to build portfolios and mitigate risk. |
| n | Provide choices – We offer multiple investment strategies, allowing you and your financial adviser to build a portfolio that’s purpose-built for your needs. |
| n | Connect with you – We’re committed to giving you the expert insights you need to make informed investing decisions, and we are well-equipped to provide high-quality support for investors and advisers. |
At Invesco, we believe in putting investors first. That’s why investment management is all we do. Our sole focus on managing your money allows you and your financial adviser to build a portfolio of Invesco funds appropriate for your investment needs and goals today and when your circumstances change.
Have questions?
For questions about your account, feel free to contact an Invesco client services representative at 800 959 4246. For Invesco-related questions or comments, please email me directly at phil@invesco.com.
All of us at Invesco look forward to serving your investment management needs for many years to come. Thank you for investing with us.
Sincerely,

Philip Taylor
Senior Managing Director, Invesco Ltd.
| 1 | Source: Reuters |
2 Invesco Equally-Weighted S&P 500 Fund
Bruce Crockett | Dear Fellow Shareholders: The Invesco Funds Board has worked on a variety of issues over the last several months, and I’d like to take this opportunity to discuss two that affect you and our fellow fund shareholders. The first issue on which your Board has been working is our annual review of the funds’ advisory and sub-advisory contracts with Invesco Advisers and its affiliates. This annual review, which is required by the Investment Company Act of 1940, focuses on the nature and quality of the services Invesco provides as adviser to the Invesco Funds and the reasonableness of the fees that it charges for those services. Each year, we spend months reviewing detailed information that we request from Invesco that allows us to evaluate its services and fees. We also use information from many independent sources, including materials provided by the independent Senior Officer of the Invesco Funds, who reports directly to the independent Trustees on the Board. Additionally, we meet with independent legal counsel and review | |||
| performance and fee data prepared by Lipper Inc., an independent, third-party firm widely recognized as a leader in its field. | ||||

I’m pleased to report that the Board determined in June that renewing the investment advisory agreement and the sub-advisory contracts with Invesco Advisers and its affiliates would serve the best interests of each fund and its shareholders.
The second area of focus to highlight is the Board’s efforts to ensure that we provide a lineup of funds that allow financial advisers to build portfolios that meet shareholders’ changing financial needs and goals. Today, more and more investors are reaching, or approaching, retirement. But interest rates remain low, making it difficult for many investors to generate the income they need, or will soon need, in their retirement years.
The members of your Board think about these things, too, and we’ve worked with Invesco Advisers to provide more income-generating options in the Invesco Funds lineup to help shareholders potentially meet their income needs. Your Board recently approved changes to three existing equity mutual funds, increasing their focus on generating income while also seeking to provide long-term growth of capital.
As a result of these changes, the funds and their respective management teams now have more flexibility to invest in the types of securities that could meet investors’ growing need for income generation, and in some cases, also help investors diversify their sources of income. These equity funds complement an array of fixed-income, asset allocation and alternative investment options in the Invesco Funds lineup designed to accommodate a variety of risk tolerances.
Be assured that your Board will continue working on behalf of fund shareholders, keeping your needs and interests uppermost in our minds.
As always, please contact me at bruce@brucecrockett.com with any questions or concerns you may have. On behalf of the Board, we look forward to continuing to represent your interests and serving your needs.
Sincerely,

Bruce L. Crockett
Independent Chair
Invesco Funds Board of Trustees
3 Invesco Equally-Weighted S&P 500 Fund
Management’s Discussion of Fund Performance
Performance summary For the fiscal year ended August 31, 2013, Invesco Equally-Weighted S&P 500 Fund, at net asset value, underperformed the S&P 500 Equal Weight Index but outperformed the Lipper Multi-Cap Core Funds Index. The Fund seeks to achieve a high level of total return on its assets through a combination of capital appreciation and current income. The consumer discretionary and financials sectors contributed the most to the Fund’s overall positive performance for the reporting period. Your Fund’s long-term performance appears later in this report.
| ||
Fund vs. Indexes Total returns, 8/31/12 to 8/31/13, at net asset value (NAV). Performance shown does not include applicable contingent deferred sales charges (CDSC) or front-end sales charges, which would have reduced performance.
| ||
| Class A Shares | 24.83% | |
| Class B Shares | 23.90 | |
| Class C Shares | 23.88 | |
| Class R Shares | 24.48 | |
| Class Y Shares | 25.16 | |
| Class R6 Shares* | 25.16 | |
| S&P 500 Index‚ (Broad Market Index) | 18.70 | |
| S&P 500 Equal Weight Index‚ (Style-Specific Index) | 25.58 | |
| Lipper Multi-Cap Core Funds Indexn (Peer Group Index) | 21.50 | |
Source(s): ‚Invesco, S&P-Dow Jones via FactSet Research Systems Inc.;nLipper Inc. * Share class incepted during the reporting period. See page 7 for a detailed explanation of Fund performance. | ||
How we invest
The Fund invests in a diversified portfolio of common stocks represented in the S&P 500 Index. The S&P 500 Index is a well-known stock market index that includes common stocks of 500 companies. The Fund generally invests in each stock included in the S&P 500 Index in approximately equal proportions. This approach differs from the S&P 500 Index because stocks in the S&P 500 Index are represented in proportion to their market value, or market capitalization. For example, the 50 largest companies in the S&P 500 Index represent approximately 50% of the S&P 500 Index’s value; however, these same 50 companies represent roughly 10% of the Fund’s value. The Fund may invest in foreign securities represented in the S&P 500 Index, including American Depositary Receipts. The sale
of a security by the Fund is a function of Standard & Poor’s either adding a stock to the S&P 500 Index or deleting a stock from the index. Securities that are added to or deleted from the Fund are driven by changes to the S&P 500 Index, not by a stock selection model.
Market conditions and your Fund
The fiscal year ended August 31, 2013, began with some downward volatility in US equity markets. Starting in the fall of 2012, markets began an upward trend that continued through much of the reporting period. In early fall, the European Central Bank implemented new measures to support member economies and the US Federal Reserve (the Fed) initiated a third round of quantitative easing (QE), or fiscal stimulus, which caused consumer sentiment to improve. Uncertainty
surrounding US election results, “fiscal cliff” negotiations and sequestration spending cuts in early 2013, however, made many businesses hesitant to spend during the first quarter of the year. However, for the first time in years, markets appeared willing to look past headline events.
From late May through June, the capital markets began a sell-off following Fed Chairman Ben Bernanke’s comments about reducing QE. Since December 2012, the Fed has purchased $85 billion1 of US Treasuries and mortgage-backed securities each month to increase liquidity and ensure low long-term interest rates in an effort to spur the housing and real estate markets. Few asset classes were immune from this broad sell-off, which caused bonds, stocks and commodities to decline. Precious metals were particularly hard hit, and fixed-income investors scrambled to sell bonds in anticipation of higher yields. The markets stabilized in mid-summer; however, August brought more selling in the equity and bond markets and yields continued to rise.
The Fund stayed true to its process by maintaining balanced exposure to all constituents of the S&P 500 Index. On an absolute basis, all sectors posted positive returns for the reporting period. Sectors that contributed most to overall Fund performance were the consumer discretionary, financials, health care, information technology (IT) and industrials sectors. The telecommunication services sector contributed the least to the Fund’s overall positive performance.
The consumer discretionary sector delivered the strongest performance during the fiscal year. Three of the top contributors to Fund performance, Netflix, GameStop and Best Buy, are in the consumer discretionary sector. During the fiscal year, Netflix and Time Warner’s Warner Bros. Television Group (not a
| Portfolio Composition | |||||
| By sector | |||||
| Consumer Discretionary | 17.0 | % | |||
| Financials | 15.6 | ||||
| Information Technology | 13.9 | ||||
| Industrials | 12.2 | ||||
| Health Care | 10.7 | ||||
| Energy | 8.6 | ||||
| Consumer Staples | 7.7 | ||||
| Materials | 6.0 | ||||
| Utilities | 6.0 | ||||
| Telecommunication Services | 1.1 | ||||
Money Market Funds Plus Other Assets Less Liabilities | 1.2 | ||||
| Top 10 Equity Holdings | |||||
1.Best Buy Co., Inc. | 0.3 | % | |||
2.Netflix Inc. | 0.3 | ||||
3.Goodyear Tire & Rubber Co. (The) | 0.3 | ||||
4.Salesforce.com, Inc. | 0.3 | ||||
5.GameStop Corp.-Class A | 0.3 | ||||
6.FLIR Systems, Inc. | 0.3 | ||||
7.Chesapeake Energy Corp. | 0.2 | ||||
8.Harman International Industries, Inc. | 0.2 | ||||
9.E*TRADE Financial Corp. | 0.2 | ||||
10.Electronic Arts Inc. | 0.2 | ||||
| Total Net Assets | $ | 1.7 billion | ||
| Total Number of Holdings* | 500 | |||
The Fund’s holdings are subject to change, and there is no assurance that the Fund will continue to hold any particular security.
*Excluding money market fund holdings.
4 Invesco Equally-Weighted S&P 500 Fund
Fund holding) announced a licensing agreement giving Netflix exclusive rights to stream eight shows’ 2012-2013 seasons just months after their original air dates – including Revolution, Fringe, The Following, Political Animals and Long-mire.2 Netflix also will be able to stream older episodes of Chuck, Fringe, The West Wing and 666 Park Avenue.
Also contributing to the Fund’s positive performance was financial security company Genworth Financial.
During the reporting period, several Fund holdings in the materials sector struggled. These included Cliffs Natural Resources and Newmont Mining.
The largest detractor from Fund performance for the reporting period was J.C. Penney. During the reporting period, the company’s chief executive was ousted after he failed in his attempt to turn around the struggling retailer.
During the reporting period, the Fund invested in S&P 500 futures contracts, a derivative instrument, to gain exposure to the equity market. These futures contracts added to the Fund’s performance.
We welcome new investors who joined the Fund during the fiscal year and thank all of our shareholders for your investment in Invesco Equally-Weighted S&P 500 Fund.
| 1 | Source: US Federal Reserve |
| 2 | Source: Wired |
The views and opinions expressed in management’s discussion of Fund performance are those of Invesco Advisers, Inc. These views and opinions are subject to change at any time based on factors such as market and economic conditions. These views and opinions may not be relied upon as investment advice or recommendations, or as an offer for a particular security. The information is not a complete analysis of every aspect of any market, country, industry, security or the Fund. Statements of fact are from sources considered reliable, but Invesco Advisers, Inc. makes no representation or warranty as to their completeness or accuracy. Although historical performance is no guarantee of future results, these insights may help you understand our investment management philosophy.
See important Fund and, if applicable, index disclosures later in this report.
| Anthony Munchak Chartered Financial Analyst, portfolio manager, is manager of Invesco Equally-Weighted S&P 500 Fund. | |
| He joined Invesco in 2000. Mr. Munchak earned a BS and an MS in finance from Boston College and an MBA from Bentley College. | ||

 | Glen Murphy Chartered Financial Analyst, portfolio manager, is manager of Invesco Equally-Weighted S&P 500 Fund. | |
| He joined Invesco in 1995. Mr. Murphy earned a BA in business administration from the University of Massachusetts Amherst and an MS in finance from Boston College. | ||
 | Francis Orlando Chartered Financial Analyst, portfolio manager, is manager of Invesco Equally-Weighted S&P 500 Fund. | |
| He joined Invesco in 1987. Mr. Orlando earned a BA in business administration from Merri-mack College and an MBA from Boston University. | ||
 | Daniel Tsai Chartered Financial Analyst, portfolio manager, is manager of Invesco Equally-Weighted S&P 500 Fund. | |
| He joined Invesco in 2000. Mr. Tsai earned a BS in mechanical engineering from National Taiwan University, an MS in mechanical engineering from the University of Michigan and an MS in computer science from Wayne State University. | ||
 | Anne Unflat Portfolio manager, is manager of Invesco Equally-Weighted S&P 500 Fund. She joined Invesco in 1988. | |
| Ms. Unflat earned a BA in economics from Queens College and an MBA in finance from St. John’s University. | ||
5 Invesco Equally-Weighted S&P 500 Fund
Your Fund’s Long-Term Performance
Results of a $10,000 Investment – Oldest Share Class(es)
Fund and index data from 8/31/03
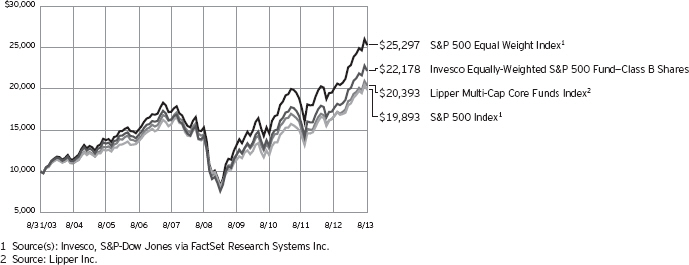
Past performance cannot guarantee comparable future results.
The data shown in the chart include reinvested distributions, applicable sales charges and Fund expenses including management fees. Results for Class B shares are calculated as if a hypothetical
shareholder had liquidated his entire investment in the Fund at the close of the reporting period and paid the contingent deferred sales charges, if applicable. Index results include reinvested dividends, but they do not reflect sales charges. Performance of the peer group,
if applicable, reflects fund expenses and management fees; performance of a market index does not. Performance shown in the chart and table(s) does not reflect deduction of taxes a shareholder would pay on Fund distributions or sale of Fund shares.
6 Invesco Equally-Weighted S&P 500 Fund
| Average Annual Total Returns | |||||
| As of 8/31/13, including maximum applicable sales charges | |||||
| Class A Shares | |||||
| Inception (7/28/97) | 7.50 | % | |||
10 Years | 8.33 | ||||
5 Years | 8.44 | ||||
1 Year | 17.98 | ||||
| Class B Shares | |||||
| Inception (12/1/87) | 10.92 | % | |||
10 Years | 8.29 | ||||
5 Years | 8.56 | ||||
1 Year | 18.90 | ||||
| Class C Shares | |||||
| Inception (7/28/97) | 7.08 | % | |||
10 Years | 8.14 | ||||
5 Years | 8.85 | ||||
1 Year | 22.88 | ||||
| Class R Shares | |||||
| Inception (3/31/08) | 8.58 | % | |||
5 Years | 9.40 | ||||
1 Year | 24.48 | ||||
| Class Y Shares | |||||
| Inception (7/28/97) | 8.14 | % | |||
10 Years | 9.22 | ||||
5 Years | 9.94 | ||||
1 Year | 25.16 | ||||
| Class R6 Shares | |||||
| 10 Years | 8.98 | % | |||
5 Years | 9.73 | ||||
1 Year | 25.16 | ||||
Effective June 1, 2010, Class A, Class B, Class C, Class R, Class W and Class I shares of the predecessor fund, Morgan Stanley Equally-Weighted S&P 500 Fund, advised by Morgan Stanley Investment Advisors Inc. were reorganized into Class A, Class B, Class C, Class R, Class A and Class Y shares, respectively, of Invesco Equally-Weighted S&P 500 Fund. Returns shown above for Class A, Class B, Class C, Class R and Class Y shares are blended returns of the predecessor fund and Invesco Equally-Weighted S&P 500 Fund. Share class returns will differ from the predecessor fund because of different expenses.
Class R6 shares incepted on September 24, 2012. Performance shown prior to that date is that of the Fund’s and the predecessor fund’s Class A shares and includes the 12b-1 fees applicable to Class A shares. Class A share performance reflects any applicable fee waivers or expense reimbursements.
| Average Annual Total Returns | |||||
| As of 6/30/13, the most recent calendar quarter end,including maximum applicable sales charges | |||||
| Class A Shares | |||||
| Inception (7/28/97) | 7.42 | % | |||
10 Years | 8.80 | ||||
5 Years | 8.43 | ||||
1 Year | 18.78 | ||||
| Class B Shares | |||||
| Inception (12/1/87) | 10.89 | % | |||
10 Years | 8.76 | ||||
5 Years | 8.56 | ||||
1 Year | 19.75 | ||||
| Class C Shares | |||||
| Inception (7/28/97) | 7.01 | % | |||
10 Years | 8.62 | ||||
5 Years | 8.84 | ||||
1 Year | 23.72 | ||||
| Class R Shares | |||||
| Inception (3/31/08) | 8.38 | % | |||
5 Years | 9.39 | ||||
1 Year | 25.36 | ||||
| Class Y Shares | |||||
| Inception (7/28/97) | 8.06 | % | |||
10 Years | 9.69 | ||||
5 Years | 9.93 | ||||
1 Year | 25.99 | ||||
| Class R6 Shares | |||||
| 10 Years | 9.45 | % | |||
5 Years | 9.72 | ||||
1 Year | 25.97 | ||||
The performance data quoted represent past performance and cannot guarantee comparable future results; current performance may be lower or higher. Please visit invesco.com/performance for the most recent month-end performance. Performance figures reflect reinvested distributions, changes in net asset value and the effect of the maximum sales charge unless otherwise stated. Investment return and principal value will fluctuate so that you may have a gain or loss when you sell shares.
The total annual Fund operating expense ratio set forth in the most recent Fund prospectus as of the date of this report for Class A, Class B, Class C, Class R, Class Y and Class R6 shares was 0.60%, 1.35%, 1.35%, 0.85%, 0.35% and 0.22%, respectively. The expense ratios presented above may vary from the expense ratios presented in other sections of this report that are based on expenses
incurred during the period covered by this report.
Class A share performance reflects the maximum 5.50% sales charge, and Class B and Class C share performance reflects the applicable contingent deferred sales charge (CDSC) for the period involved. The CDSC on Class B shares declines from 5% beginning at the time of purchase to 0% at the beginning of the seventh year. The CDSC on Class C shares is 1% for the first year after purchase. Class R, Class Y and Class R6 shares do not have a front-end sales charge or a CDSC; therefore, performance is at net asset value.
The performance of the Fund’s share classes will differ primarily due to different sales charge structures and class expenses.
7 Invesco Equally-Weighted S&P 500 Fund
Invesco Equally-Weighted S&P 500 Fund’s investment objective is to achieve a high level of total return on its assets through a combination of capital appreciation and current income.
| n | Unless otherwise stated, information presented in this report is as of August 31, 2013, and is based on total net assets. |
| n | Unless otherwise noted, all data provided by Invesco. |
| n | To access your Fund’s reports/prospectus, visit invesco.com/fundreports. |
About share classes
| n | Class B shares may not be purchased for new or additional investments. Please see the prospectus for more information. |
| n | Class R shares are generally available only to employer sponsored retirement and benefit plans. Please see the prospectus for more information. |
| n | Class Y shares are available only to certain investors. Please see the prospectus for more information. |
| n | Class R6 shares are primarily intended for employer sponsored retirement and benefit plans that meet certain standards and for institutional investors. |
Principal risks of investing in the Fund
| n | Common stocks risk. In general, common stock values fluctuate, and sometimes widely fluctuate, in response to activities specific to the company as well as general market, economic and political conditions. |
| n | Derivatives risk. The performance of derivative instruments is tied to the performance of an underlying currency, security, index or other instrument. In addition to risks relating to their underlying instruments, the use of derivatives may include other, possibly greater, risks. Derivatives involve costs, may be volatile, and may involve a small initial investment relative to the risk assumed. Risks associated with the use of derivatives include counterparty, leverage, correlation, liquidity, tax, market, interest rate and management risks. Derivatives may also be more difficult to purchase, sell or value than other investments. The Fund may lose more than the cash amount invested on investments in derivatives. |
Investors should bear in mind that, while the Fund intends to use derivative strategies, it is not obligated to actively
engage in these transactions, generally or in any particular kind of derivative, if the investment manager elects not to do so due to availability, cost, market conditions or other factors.
| n | Foreign securities risk. The Fund’s foreign investments may be affected by changes in a foreign country’s exchange rates, political and social instability, changes in economic or taxation policies, difficulties when enforcing obligations, decreased liquidity, and increased volatility. Foreign companies may be subject to less regulation resulting in less publicly available information about the companies. |
| n | Depositary receipts risk. Depositary receipts involve many of the same risks as those associated with direct investment in foreign securities. In addition, the underlying issuers of certain depositary receipts, particularly unsponsored or unregistered depositary receipts, are under no obligations to distribute shareholder communications to the holders of such receipts or to pass through to them any voting rights with respect to the deposited securities. |
| n | Management risk. The investment techniques and risk analysis used by the Fund’s portfolio managers may not produce the desired results. |
About indexes used in this report
| n | The S&P 500® Index is an unmanaged index considered representative of the US stock market. |
| n | The S&P 500® Equal Weight Index is the equally weighted version of the S&P 500 Index. |
| n | The Lipper Multi-Cap Core Funds Index is an unmanaged index considered representative of multicap core funds tracked by Lipper. |
| n | A direct investment cannot be made in an index. Unless otherwise indicated, index results include reinvested dividends, and they do not reflect sales charges. Performance of the peer |
group, if applicable, reflects fund expenses; performance of a market index does not. |
Other information
| n | The returns shown in management’s discussion of Fund performance are based on net asset values calculated for shareholder transactions. Generally accepted accounting principles require adjustments to be made to the net assets of the Fund at period end for financial reporting purposes, and as such, the net asset values for shareholder transactions and the returns based on those net asset values may differ from the net asset values and returns reported in the Financial Highlights. |
| n | Industry classifications used in this report are generally according to the Global Industry Classification Standard, which was developed by and is the exclusive property and a service mark of MSCI Inc. and Standard & Poor’s. |
This report must be accompanied or preceded by a currently effective Fund prospectus, which contains more complete information, including sales charges and expenses. Investors should read it carefully before investing. |
NOT FDIC INSURED | MAY LOSE VALUE | NO BANK GUARANTEE
| Fund Nasdaq Symbols | ||
| Class A Shares | VADAX | |
| Class B Shares | VADBX | |
| Class C Shares | VADCX | |
| Class R Shares | VADRX | |
| Class Y Shares | VADDX | |
| Class R6 Shares | VADFX |
8 Invesco Equally-Weighted S&P 500 Fund
Schedule of Investments(a)
August 31, 2013
| Shares | Value | |||||||
Common Stocks & Other Equity Interests–98.83% |
| |||||||
| Advertising–0.40% | ||||||||
Interpublic Group of Cos., Inc. (The) | 225,262 | $ | 3,541,119 | |||||
Omnicom Group Inc. | 52,080 | 3,158,652 | ||||||
| 6,699,771 | ||||||||
| Aerospace & Defense–2.27% | ||||||||
Boeing Co. (The) | 32,097 | 3,335,520 | ||||||
General Dynamics Corp. | 41,903 | 3,488,425 | ||||||
Honeywell International Inc. | 41,807 | 3,326,583 | ||||||
L-3 Communications Holdings, Inc. | 37,988 | 3,431,456 | ||||||
Lockheed Martin Corp. | 30,348 | 3,715,202 | ||||||
Northrop Grumman Corp. | 39,436 | 3,638,760 | ||||||
Precision Castparts Corp. | 14,861 | 3,139,238 | ||||||
Raytheon Co. | 48,486 | 3,656,329 | ||||||
Rockwell Collins, Inc. | 50,691 | 3,587,402 | ||||||
Textron Inc. | 123,341 | 3,322,807 | ||||||
United Technologies Corp. | 34,763 | 3,479,776 | ||||||
| 38,121,498 | ||||||||
| Agricultural Products–0.21% | ||||||||
Archer-Daniels-Midland Co. | 98,806 | 3,478,959 | ||||||
| Air Freight & Logistics–0.81% | ||||||||
C.H. Robinson Worldwide, Inc. | 57,850 | 3,289,929 | ||||||
Expeditors International of Washington, Inc. | 85,385 | 3,463,216 | ||||||
FedEx Corp. | 32,975 | 3,540,196 | ||||||
United Parcel Service, Inc.–Class B | 38,045 | 3,255,891 | ||||||
| 13,549,232 | ||||||||
| Airlines–0.18% | ||||||||
Southwest Airlines Co. | 235,656 | 3,018,753 | ||||||
| Aluminum–0.19% | ||||||||
Alcoa Inc. | 402,532 | 3,099,496 | ||||||
| Apparel Retail–1.16% | ||||||||
Abercrombie & Fitch Co.–Class A | 67,033 | 2,366,935 | ||||||
Gap, Inc. (The) | 78,798 | 3,186,591 | ||||||
L Brands, Inc. | 64,354 | 3,691,346 | ||||||
Ross Stores, Inc. | 50,394 | 3,389,500 | ||||||
TJX Cos., Inc. (The) | 64,826 | 3,417,627 | ||||||
Urban Outfitters, Inc.(b) | 79,954 | 3,352,471 | ||||||
| 19,404,470 | ||||||||
| Apparel, Accessories & Luxury Goods–0.98% | ||||||||
Coach, Inc. | 55,853 | 2,949,597 | ||||||
Fossil Group, Inc.(b) | 31,301 | 3,635,298 | ||||||
PVH Corp. | 26,512 | 3,413,420 | ||||||
Ralph Lauren Corp. | 18,876 | 3,122,279 | ||||||
VF Corp. | 17,465 | 3,269,623 | ||||||
| 16,390,217 | ||||||||
| Application Software–1.11% | ||||||||
Adobe Systems Inc.(b) | 76,296 | 3,490,542 | ||||||
Autodesk, Inc.(b) | 93,147 | 3,423,152 | ||||||
| Shares | Value | |||||||
| Application Software–(continued) | ||||||||
Citrix Systems, Inc. (b) | 53,381 | $ | 3,777,774 | |||||
Intuit Inc. | 56,844 | 3,611,299 | ||||||
Salesforce.com, Inc.(b) | 87,021 | 4,275,342 | ||||||
| 18,578,109 | ||||||||
| Asset Management & Custody Banks–1.72% | ||||||||
Ameriprise Financial, Inc. | 39,927 | 3,439,711 | ||||||
Bank of New York Mellon Corp. (The) | 112,205 | 3,336,977 | ||||||
BlackRock, Inc. | 12,117 | 3,154,297 | ||||||
Franklin Resources, Inc. | 66,646 | 3,076,379 | ||||||
Invesco Ltd.(c) | 97,509 | 2,960,373 | ||||||
Legg Mason, Inc. | 100,201 | 3,258,537 | ||||||
Northern Trust Corp. | 57,222 | 3,139,771 | ||||||
State Street Corp. | 49,477 | 3,301,106 | ||||||
T. Rowe Price Group Inc. | 44,529 | 3,123,264 | ||||||
| 28,790,415 | ||||||||
| Auto Parts & Equipment–0.64% | ||||||||
BorgWarner, Inc. | 38,662 | 3,733,976 | ||||||
Delphi Automotive PLC (United Kingdom) | 63,813 | 3,510,991 | ||||||
Johnson Controls, Inc. | 86,998 | 3,526,029 | ||||||
| 10,770,996 | ||||||||
| Automobile Manufacturers–0.40% | ||||||||
Ford Motor Co. | 212,658 | 3,442,933 | ||||||
General Motors Co.(b) | 95,320 | 3,248,506 | ||||||
| 6,691,439 | ||||||||
| Automotive Retail–0.81% | ||||||||
AutoNation, Inc.(b) | 74,167 | 3,466,566 | ||||||
AutoZone, Inc.(b) | 7,720 | 3,241,937 | ||||||
CarMax, Inc.(b) | 70,427 | 3,349,508 | ||||||
O’Reilly Automotive, Inc.(b) | 29,298 | 3,595,157 | ||||||
| 13,653,168 | ||||||||
| Biotechnology–1.30% | ||||||||
Alexion Pharmaceuticals, Inc.(b) | 35,442 | 3,819,230 | ||||||
Amgen Inc. | 33,550 | 3,654,937 | ||||||
Biogen Idec Inc.(b) | 15,418 | 3,284,342 | ||||||
Celgene Corp.(b) | 27,383 | 3,833,072 | ||||||
Gilead Sciences, Inc.(b) | 62,579 | 3,771,636 | ||||||
Regeneron Pharmaceuticals, Inc.(b) | 13,795 | 3,342,667 | ||||||
| 21,705,884 | ||||||||
| Brewers–0.19% | ||||||||
Molson Coors Brewing Co.–Class B | 65,911 | 3,215,798 | ||||||
| Broadcasting–0.62% | ||||||||
CBS Corp.–Class B | 68,494 | 3,500,043 | ||||||
Discovery Communications, Inc.– | 42,792 | 3,316,808 | ||||||
Scripps Networks Interactive Inc.–Class A | 49,113 | 3,611,279 | ||||||
| 10,428,130 | ||||||||
| Building Products–0.18% | ||||||||
Masco Corp. | 157,218 | 2,974,565 | ||||||
See accompanying Notes to Financial Statements which are an integral part of the financial statements.
9 Invesco Equally-Weighted S&P 500 Fund
| Shares | Value | |||||||
| Cable & Satellite–0.83% | ||||||||
Cablevision Systems Corp.–Class A | 222,653 | $ | 3,947,638 | |||||
Comcast Corp.–Class A | 82,206 | 3,460,051 | ||||||
DIRECTV(b) | 52,718 | 3,067,133 | ||||||
Time Warner Cable Inc. | 31,449 | 3,376,050 | ||||||
| 13,850,872 | ||||||||
| Casinos & Gaming–0.42% | ||||||||
International Game Technology | 189,481 | 3,579,296 | ||||||
Wynn Resorts Ltd. | 24,186 | 3,411,194 | ||||||
| 6,990,490 | ||||||||
| Coal & Consumable Fuels–0.39% | ||||||||
CONSOL Energy Inc. | 102,302 | 3,194,891 | ||||||
Peabody Energy Corp. | 194,788 | 3,350,354 | ||||||
| 6,545,245 | ||||||||
| Commodity Chemicals–0.20% | ||||||||
LyondellBasell Industries N.V.–Class A | 48,479 | 3,400,802 | ||||||
| Communications Equipment–1.40% | ||||||||
Cisco Systems, Inc. | 135,680 | 3,162,701 | ||||||
F5 Networks, Inc.(b) | 44,174 | 3,683,228 | ||||||
Harris Corp. | 65,607 | 3,715,325 | ||||||
JDS Uniphase Corp.(b) | 230,667 | 2,959,458 | ||||||
Juniper Networks, Inc.(b) | 171,577 | 3,242,805 | ||||||
Motorola Solutions, Inc. | 57,413 | 3,215,702 | ||||||
QUALCOMM, Inc. | 53,251 | 3,529,476 | ||||||
| 23,508,695 | ||||||||
| Computer & Electronics Retail–0.51% | ||||||||
Best Buy Co., Inc. | 121,643 | 4,379,148 | ||||||
GameStop Corp.–Class A | 83,787 | 4,206,945 | ||||||
| 8,586,093 | ||||||||
| Computer Hardware–0.60% | ||||||||
Apple Inc. | 7,600 | 3,701,580 | ||||||
Dell Inc. | 244,104 | 3,361,312 | ||||||
Hewlett-Packard Co. | 132,115 | 2,951,449 | ||||||
| 10,014,341 | ||||||||
| Computer Storage & Peripherals–0.96% | ||||||||
EMC Corp. | 132,009 | 3,403,192 | ||||||
NetApp, Inc. | 86,263 | 3,583,365 | ||||||
SanDisk Corp. | 55,578 | 3,066,794 | ||||||
Seagate Technology PLC | 74,760 | 2,864,803 | ||||||
Western Digital Corp. | 51,167 | 3,172,354 | ||||||
| 16,090,508 | ||||||||
| Construction & Engineering–0.60% | ||||||||
Fluor Corp. | 53,582 | 3,398,706 | ||||||
Jacobs Engineering Group, Inc.(b) | 58,544 | 3,411,945 | ||||||
Quanta Services, Inc.(b) | 124,421 | 3,252,365 | ||||||
| 10,063,016 | ||||||||
| Construction & Farm Machinery & Heavy Trucks–0.97% | ||||||||
Caterpillar Inc. | 38,971 | 3,216,666 | ||||||
Cummins Inc. | 28,145 | 3,467,464 | ||||||
Deere & Co. | 38,507 | 3,220,726 | ||||||
| Shares | Value | |||||||
| Construction & Farm Machinery & Heavy Trucks–(continued) | ||||||||
Joy Global Inc. | 61,834 | $ | 3,037,286 | |||||
PACCAR Inc. | 61,415 | 3,292,458 | ||||||
| 16,234,600 | ||||||||
| Construction Materials–0.17% | ||||||||
Vulcan Materials Co. | 60,878 | 2,909,968 | ||||||
| Consumer Electronics–0.48% | ||||||||
Garmin Ltd.(d) | 96,931 | 3,951,877 | ||||||
Harman International Industries, Inc. | 63,294 | 4,052,082 | ||||||
| 8,003,959 | ||||||||
| Consumer Finance–0.80% | ||||||||
American Express Co. | 44,792 | 3,220,993 | ||||||
Capital One Financial Corp. | 53,574 | 3,458,202 | ||||||
Discover Financial Services | 69,044 | 3,262,329 | ||||||
SLM Corp. | 142,234 | 3,412,193 | ||||||
| 13,353,717 | ||||||||
| Data Processing & Outsourced Services–1.87% | ||||||||
Automatic Data Processing, Inc. | 48,059 | 3,419,878 | ||||||
Computer Sciences Corp. | 72,861 | 3,653,979 | ||||||
Fidelity National Information Services, Inc. | 74,897 | 3,329,921 | ||||||
Fiserv, Inc.(b) | 37,577 | 3,617,538 | ||||||
MasterCard, Inc.–Class A | 5,722 | 3,467,990 | ||||||
Paychex, Inc. | 88,005 | 3,404,033 | ||||||
Total System Services, Inc. | 139,324 | 3,855,095 | ||||||
Visa Inc.–Class A | 18,064 | 3,150,723 | ||||||
Western Union Co. (The) | 192,041 | 3,366,479 | ||||||
| 31,265,636 | ||||||||
| Department Stores–0.70% | ||||||||
JC Penney Co., Inc.(b)(d) | 188,064 | 2,347,039 | ||||||
Kohl’s Corp. | 62,675 | 3,215,854 | ||||||
Macy’s, Inc. | 67,420 | 2,995,471 | ||||||
Nordstrom, Inc. | 55,455 | 3,090,507 | ||||||
| 11,648,871 | ||||||||
| Distillers & Vintners–0.58% | ||||||||
Beam Inc. | 50,015 | 3,133,440 | ||||||
Brown-Forman Corp.–Class B | 46,732 | 3,130,576 | ||||||
Constellation Brands, Inc.–Class A(b) | 62,832 | 3,408,636 | ||||||
| 9,672,652 | ||||||||
| Distributors–0.19% | ||||||||
Genuine Parts Co. | 41,562 | 3,200,690 | ||||||
| Diversified Banks–0.61% | ||||||||
Comerica Inc. | 87,511 | 3,573,949 | ||||||
U.S. Bancorp | 93,360 | 3,373,097 | ||||||
Wells Fargo & Co. | 81,387 | 3,343,378 | ||||||
| 10,290,424 | ||||||||
| Diversified Chemicals–1.04% | ||||||||
Dow Chemical Co. (The) | 96,105 | 3,594,327 | ||||||
E. I. du Pont de Nemours & Co. | 62,045 | 3,512,988 | ||||||
Eastman Chemical Co. | 46,022 | 3,497,672 | ||||||
FMC Corp. | 52,238 | 3,479,573 | ||||||
See accompanying Notes to Financial Statements which are an integral part of the financial statements.
10 Invesco Equally-Weighted S&P 500 Fund
| Shares | Value | |||||||
| Diversified Chemicals–(continued) | ||||||||
PPG Industries, Inc. | 21,247 | $ | 3,318,994 | |||||
| 17,403,554 | ||||||||
| Diversified Metals & Mining–0.20% | ||||||||
Freeport-McMoRan Copper & Gold Inc. | 110,536 | 3,340,398 | ||||||
| Diversified REIT’s–0.19% | ||||||||
Vornado Realty Trust | 39,450 | 3,207,285 | ||||||
| Diversified Support Services–0.38% | ||||||||
Cintas Corp. | 71,725 | 3,425,586 | ||||||
Iron Mountain Inc. | 112,981 | 2,914,910 | ||||||
| 6,340,496 | ||||||||
| Drug Retail–0.38% | ||||||||
CVS Caremark Corp. | 55,371 | 3,214,287 | ||||||
Walgreen Co. | 65,136 | 3,131,087 | ||||||
| 6,345,374 | ||||||||
| Electric Utilities–2.45% | ||||||||
American Electric Power Co., Inc. | 71,820 | 3,073,896 | ||||||
Duke Energy Corp. | 48,322 | 3,169,923 | ||||||
Edison International | 69,322 | 3,181,187 | ||||||
Entergy Corp. | 47,736 | 3,018,347 | ||||||
Exelon Corp. | 106,711 | 3,253,618 | ||||||
FirstEnergy Corp. | 85,273 | 3,195,179 | ||||||
NextEra Energy, Inc. | 40,994 | 3,294,278 | ||||||
Northeast Utilities | 77,582 | 3,178,535 | ||||||
Pepco Holdings, Inc. | 161,171 | 3,052,579 | ||||||
Pinnacle West Capital Corp. | 56,795 | 3,082,265 | ||||||
PPL Corp. | 112,205 | 3,444,693 | ||||||
Southern Co. (The) | 73,466 | 3,057,655 | ||||||
Xcel Energy, Inc. | 111,099 | 3,101,884 | ||||||
| 41,104,039 | ||||||||
| Electrical Components & Equipment–0.82% | ||||||||
Eaton Corp. PLC | 50,612 | 3,204,752 | ||||||
Emerson Electric Co. | 58,221 | 3,514,802 | ||||||
Rockwell Automation, Inc. | 37,703 | 3,665,862 | ||||||
Roper Industries, Inc. | 27,131 | 3,356,105 | ||||||
| 13,741,521 | ||||||||
| Electronic Components–0.38% | ||||||||
Amphenol Corp.–Class A | 42,893 | 3,250,002 | ||||||
Corning Inc. | 219,072 | 3,075,771 | ||||||
| 6,325,773 | ||||||||
| Electronic Equipment & Instruments–0.25% | ||||||||
FLIR Systems, Inc. | 133,737 | 4,183,293 | ||||||
| Electronic Manufacturing Services–0.63% | ||||||||
Jabil Circuit, Inc. | 168,308 | 3,840,789 | ||||||
Molex Inc. | 110,498 | 3,206,652 | ||||||
TE Connectivity Ltd. (Switzerland) | 71,962 | 3,526,138 | ||||||
| 10,573,579 | ||||||||
| Environmental & Facilities Services–0.59% | ||||||||
Republic Services, Inc. | 95,964 | 3,119,789 | ||||||
Stericycle, Inc.(b) | 30,716 | 3,457,393 | ||||||
| Shares | Value | |||||||
| Environmental & Facilities Services–(continued) | ||||||||
Waste Management, Inc. | 82,372 | $ | 3,331,124 | |||||
| 9,908,306 | ||||||||
| Fertilizers & Agricultural Chemicals–0.52% | ||||||||
CF Industries Holdings, Inc. | 17,709 | 3,370,731 | ||||||
Monsanto Co. | 30,942 | 3,028,912 | ||||||
Mosaic Co. (The) | 56,490 | 2,352,809 | ||||||
| 8,752,452 | ||||||||
| Food Distributors–0.18% | ||||||||
Sysco Corp. | 94,822 | 3,036,200 | ||||||
| Food Retail–0.61% | ||||||||
Kroger Co. (The) | 93,950 | 3,438,570 | ||||||
Safeway Inc.(d) | 134,176 | 3,475,159 | ||||||
Whole Foods Market, Inc. | 63,615 | 3,355,691 | ||||||
| 10,269,420 | ||||||||
| Footwear–0.20% | ||||||||
NIKE, Inc.–Class B | 52,812 | 3,317,650 | ||||||
| Gas Utilities–0.43% | ||||||||
AGL Resources Inc. | 76,048 | 3,342,310 | ||||||
ONEOK, Inc. | 73,715 | 3,791,899 | ||||||
| 7,134,209 | ||||||||
| General Merchandise Stores–0.81% | ||||||||
Dollar General Corp.(b) | 63,863 | 3,446,686 | ||||||
Dollar Tree, Inc.(b) | 66,542 | 3,506,763 | ||||||
Family Dollar Stores, Inc. | 51,693 | 3,680,025 | ||||||
Target Corp. | 47,348 | 2,997,602 | ||||||
| 13,631,076 | ||||||||
| Gold–0.19% | ||||||||
Newmont Mining Corp. | 98,479 | 3,128,678 | ||||||
| Health Care Distributors–0.82% | ||||||||
AmerisourceBergen Corp. | 59,504 | 3,386,968 | ||||||
Cardinal Health, Inc. | 68,336 | 3,435,934 | ||||||
McKesson Corp. | 28,598 | 3,472,083 | ||||||
Patterson Cos. Inc. | 84,327 | 3,362,961 | ||||||
| 13,657,946 | ||||||||
| Health Care Equipment–2.71% | ||||||||
Abbott Laboratories | 88,794 | 2,959,504 | ||||||
Baxter International Inc. | 46,296 | 3,220,350 | ||||||
Becton, Dickinson & Co. | 33,135 | 3,226,686 | ||||||
Boston Scientific Corp.(b) | 343,696 | 3,636,304 | ||||||
C.R. Bard, Inc. | 29,435 | 3,381,198 | ||||||
CareFusion Corp.(b) | 86,469 | 3,099,914 | ||||||
Covidien PLC | 54,509 | 3,237,835 | ||||||
Edwards Lifesciences Corp.(b) | 46,692 | 3,286,183 | ||||||
Intuitive Surgical, Inc.(b) | 6,559 | 2,535,185 | ||||||
Medtronic, Inc. | 61,764 | 3,196,287 | ||||||
St. Jude Medical, Inc. | 72,537 | 3,656,590 | ||||||
Stryker Corp. | 48,631 | 3,252,927 | ||||||
Varian Medical Systems, Inc.(b) | 47,452 | 3,342,993 | ||||||
See accompanying Notes to Financial Statements which are an integral part of the financial statements.
11 Invesco Equally-Weighted S&P 500 Fund
| Shares | Value | |||||||
| Health Care Equipment–(continued) | ||||||||
Zimmer Holdings, Inc. | 41,979 | $ | 3,320,119 | |||||
| 45,352,075 | ||||||||
| Health Care Facilities–0.16% | ||||||||
Tenet Healthcare Corp.(b) | 70,035 | 2,734,867 | ||||||
| Health Care Services–0.73% | ||||||||
DaVita HealthCare Partners Inc.(b) | 25,370 | 2,727,529 | ||||||
Express Scripts Holding Co.(b) | 52,769 | 3,370,884 | ||||||
Laboratory Corp. of America Holdings(b) | 32,685 | 3,128,608 | ||||||
Quest Diagnostics Inc. | 52,196 | 3,059,729 | ||||||
| 12,286,750 | ||||||||
| Health Care Supplies–0.20% | ||||||||
DENTSPLY International Inc. | 79,701 | 3,346,645 | ||||||
| Health Care Technology–0.18% | ||||||||
Cerner Corp.(b) | 66,555 | 3,065,523 | ||||||
| Home Entertainment Software–0.24% | ||||||||
Electronic Arts Inc.(b) | 149,864 | 3,992,377 | ||||||
| Home Furnishings–0.17% | ||||||||
Leggett & Platt, Inc. | 101,256 | 2,928,324 | ||||||
| Home Improvement Retail–0.41% | ||||||||
Home Depot, Inc. (The) | 42,675 | 3,178,861 | ||||||
Lowe’s Cos., Inc. | 79,410 | 3,638,566 | ||||||
| 6,817,427 | ||||||||
| Homebuilding–0.45% | ||||||||
D.R. Horton, Inc. | 136,816 | 2,442,165 | ||||||
Lennar Corp.–Class A | 83,744 | 2,663,897 | ||||||
PulteGroup Inc. | 156,690 | 2,411,459 | ||||||
| 7,517,521 | ||||||||
| Homefurnishing Retail–0.20% | ||||||||
Bed Bath & Beyond Inc.(b) | 45,989 | 3,391,229 | ||||||
| Hotels, Resorts & Cruise Lines–0.78% | ||||||||
Carnival Corp. | 96,587 | 3,485,825 | ||||||
Marriott International Inc.–Class A | 80,170 | 3,205,998 | ||||||
Starwood Hotels & Resorts Worldwide, Inc. | 49,254 | 3,149,301 | ||||||
Wyndham Worldwide Corp. | 55,597 | 3,300,238 | ||||||
| 13,141,362 | ||||||||
| Household Appliances–0.19% | ||||||||
Whirlpool Corp. | 25,290 | 3,253,558 | ||||||
| Household Products–0.76% | ||||||||
Clorox Co. (The) | 38,277 | 3,165,508 | ||||||
Colgate-Palmolive Co. | 55,568 | 3,210,163 | ||||||
Kimberly-Clark Corp. | 33,399 | 3,122,139 | ||||||
Procter & Gamble Co. (The) | 41,887 | 3,262,578 | ||||||
| 12,760,388 | ||||||||
| Housewares & Specialties–0.18% | ||||||||
Newell Rubbermaid Inc. | 120,300 | 3,043,590 | ||||||
| Human Resource & Employment Services–0.20% | ||||||||
Robert Half International, Inc. | 97,306 | 3,431,983 | ||||||
| Shares | Value | |||||||
| Hypermarkets & Super Centers–0.39% | ||||||||
Costco Wholesale Corp. | 29,445 | $ | 3,294,012 | |||||
Wal-Mart Stores, Inc. | 43,655 | 3,185,942 | ||||||
| 6,479,954 | ||||||||
| Independent Power Producers & Energy Traders–0.39% | ||||||||
AES Corp. (The) | 264,446 | 3,361,109 | ||||||
NRG Energy, Inc. | 121,057 | 3,177,746 | ||||||
| 6,538,855 | ||||||||
| Industrial Conglomerates–0.60% | ||||||||
3M Co. | 29,437 | 3,343,454 | ||||||
Danaher Corp. | 52,280 | 3,425,386 | ||||||
General Electric Co. | 138,968 | 3,215,720 | ||||||
| 9,984,560 | ||||||||
| Industrial Gases–0.61% | ||||||||
Air Products & Chemicals, Inc. | 33,923 | 3,464,895 | ||||||
Airgas, Inc. | 34,068 | 3,463,012 | ||||||
Praxair, Inc. | 27,720 | 3,254,328 | ||||||
| 10,182,235 | ||||||||
| Industrial Machinery–1.99% | ||||||||
Dover Corp. | 41,583 | 3,536,634 | ||||||
Flowserve Corp. | 59,195 | 3,302,489 | ||||||
Illinois Tool Works Inc. | 46,533 | 3,325,714 | ||||||
Ingersoll-Rand PLC | 57,922 | 3,425,507 | ||||||
Pall Corp. | 47,869 | 3,309,663 | ||||||
Parker Hannifin Corp. | 33,554 | 3,353,722 | ||||||
Pentair Ltd. | 54,731 | 3,289,881 | ||||||
Snap-on Inc. | 35,897 | 3,359,959 | ||||||
Stanley Black & Decker Inc. | 41,154 | 3,508,790 | ||||||
Xylem, Inc. | 120,521 | 2,986,510 | ||||||
| 33,398,869 | ||||||||
| Industrial REIT’s–0.18% | ||||||||
Prologis, Inc. | 84,941 | 2,993,321 | ||||||
| Insurance Brokers–0.40% | ||||||||
Aon PLC | 50,370 | 3,343,561 | ||||||
Marsh & McLennan Cos., Inc. | 81,815 | 3,373,232 | ||||||
| 6,716,793 | ||||||||
| Integrated Oil & Gas–1.00% | ||||||||
Chevron Corp. | 27,174 | 3,272,565 | ||||||
Exxon Mobil Corp. | 36,084 | 3,145,081 | ||||||
Hess Corp. | 49,545 | 3,708,443 | ||||||
Murphy Oil Corp. | 51,832 | 3,494,513 | ||||||
Occidental Petroleum Corp. | 35,569 | 3,137,542 | ||||||
| 16,758,144 | ||||||||
| Integrated Telecommunication Services–0.93% | ||||||||
AT&T Inc. | 91,020 | 3,079,207 | ||||||
CenturyLink Inc. | 90,691 | 3,003,686 | ||||||
Frontier Communications Corp.(d) | 772,710 | 3,345,834 | ||||||
Verizon Communications Inc. | 64,001 | 3,032,367 | ||||||
Windstream Corp.(d) | 393,328 | 3,174,157 | ||||||
| 15,635,251 | ||||||||
See accompanying Notes to Financial Statements which are an integral part of the financial statements.
12 Invesco Equally-Weighted S&P 500 Fund
| Shares | Value | |||||||
| Internet Retail–1.07% | ||||||||
Amazon.com, Inc.(b) | 11,929 | $ | 3,351,810 | |||||
Expedia, Inc. | 56,344 | 2,634,646 | ||||||
Netflix Inc.(b) | 15,276 | 4,337,009 | ||||||
Priceline.com Inc.(b) | 4,006 | 3,759,751 | ||||||
TripAdvisor Inc.(b) | 51,271 | 3,792,516 | ||||||
| 17,875,732 | ||||||||
| Internet Software & Services–1.00% | ||||||||
Akamai Technologies, Inc.(b) | 76,798 | 3,531,172 | ||||||
eBay Inc.(b) | 63,726 | 3,185,663 | ||||||
Google Inc.–Class A(b) | 3,735 | 3,163,171 | ||||||
VeriSign, Inc.(b) | 72,585 | 3,483,354 | ||||||
Yahoo! Inc.(b) | 124,374 | 3,373,023 | ||||||
| 16,736,383 | ||||||||
| Investment Banking & Brokerage–0.82% | ||||||||
Charles Schwab Corp. (The) | 165,832 | 3,462,572 | ||||||
E*TRADE Financial Corp.(b) | 285,713 | 4,011,411 | ||||||
Goldman Sachs Group, Inc. (The) | 20,061 | 3,051,880 | ||||||
Morgan Stanley | 126,540 | 3,259,670 | ||||||
| 13,785,533 | ||||||||
| IT Consulting & Other Services–1.00% | ||||||||
Accenture PLC–Class A | 40,577 | 2,931,688 | ||||||
Cognizant Technology Solutions Corp.–Class A(b) | 51,898 | 3,804,124 | ||||||
International Business Machines Corp. | 16,164 | 2,946,212 | ||||||
SAIC, Inc. | 239,630 | 3,611,224 | ||||||
Teradata Corp.(b) | 58,283 | 3,413,053 | ||||||
| 16,706,301 | ||||||||
| Leisure Products–0.38% | ||||||||
Hasbro, Inc.(d) | 74,133 | 3,378,982 | ||||||
Mattel, Inc. | 73,105 | 2,960,753 | ||||||
| 6,339,735 | ||||||||
| Life & Health Insurance–1.47% | ||||||||
Aflac, Inc. | 56,834 | 3,284,437 | ||||||
Lincoln National Corp. | 94,657 | 3,979,380 | ||||||
MetLife, Inc. | 74,335 | 3,433,534 | ||||||
Principal Financial Group, Inc. | 85,923 | 3,515,969 | ||||||
Prudential Financial, Inc. | 46,374 | 3,472,485 | ||||||
Torchmark Corp.(d) | 50,550 | 3,482,389 | ||||||
Unum Group | 117,743 | 3,476,951 | ||||||
| 24,645,145 | ||||||||
| Life Sciences Tools & Services–1.01% | ||||||||
Agilent Technologies, Inc. | 74,285 | 3,464,653 | ||||||
Life Technologies Corp.(b) | 44,073 | 3,279,472 | ||||||
PerkinElmer, Inc. | 98,926 | 3,558,368 | ||||||
Thermo Fisher Scientific, Inc. | 38,398 | 3,410,894 | ||||||
Waters Corp.(b) | 33,149 | 3,276,779 | ||||||
| 16,990,166 | ||||||||
| Managed Health Care–1.08% | ||||||||
Aetna Inc. | 53,999 | 3,422,997 | ||||||
Cigna Corp. | 47,953 | 3,773,422 | ||||||
| Shares | Value | |||||||
| Managed Health Care–(continued) | ||||||||
Humana Inc. | 40,386 | $ | 3,718,743 | |||||
UnitedHealth Group Inc. | 51,231 | 3,675,312 | ||||||
WellPoint, Inc. | 41,818 | 3,560,384 | ||||||
| 18,150,858 | ||||||||
| Metal & Glass Containers–0.40% | ||||||||
Ball Corp. | 75,416 | 3,349,979 | ||||||
Owens-Illinois, Inc.(b) | 117,700 | 3,341,503 | ||||||
| 6,691,482 | ||||||||
| Motorcycle Manufacturers–0.22% | ||||||||
Harley-Davidson, Inc. | 61,519 | 3,689,910 | ||||||
| Movies & Entertainment–0.85% | ||||||||
Time Warner Inc. | 56,874 | 3,442,583 | ||||||
Twenty-First Century Fox, Inc. | 118,345 | 3,707,749 | ||||||
Viacom Inc.–Class B | 48,951 | 3,894,541 | ||||||
Walt Disney Co. (The) | 51,231 | 3,116,382 | ||||||
| 14,161,255 | ||||||||
| Multi-Line Insurance–1.01% | ||||||||
American International Group, Inc. | 72,026 | 3,346,328 | ||||||
Assurant, Inc. | 64,646 | 3,428,824 | ||||||
Genworth Financial Inc.–Class A(b) | 297,141 | 3,506,264 | ||||||
Hartford Financial Services Group, Inc. (The) | 111,936 | 3,313,305 | ||||||
Loews Corp. | 73,318 | 3,259,718 | ||||||
| 16,854,439 | ||||||||
| Multi-Sector Holdings–0.18% | ||||||||
Leucadia National Corp. | 117,743 | 2,935,333 | ||||||
| Multi-Utilities–2.69% | ||||||||
Ameren Corp. | 95,851 | 3,240,722 | ||||||
CenterPoint Energy, Inc. | 137,855 | 3,161,015 | ||||||
CMS Energy Corp. | 119,290 | 3,164,764 | ||||||
Consolidated Edison, Inc. | 56,529 | 3,178,626 | ||||||
Dominion Resources, Inc. | 58,325 | 3,403,264 | ||||||
DTE Energy Co. | 48,878 | 3,268,472 | ||||||
Integrys Energy Group, Inc. | 56,854 | 3,179,276 | ||||||
NiSource Inc. | 112,283 | 3,285,400 | ||||||
PG&E Corp. | 72,360 | 2,992,810 | ||||||
Public Service Enterprise Group Inc. | 100,170 | 3,247,511 | ||||||
SCANA Corp. | 66,084 | 3,179,962 | ||||||
Sempra Energy | 40,678 | 3,434,037 | ||||||
TECO Energy, Inc. | 188,606 | 3,117,657 | ||||||
Wisconsin Energy Corp. | 79,372 | 3,257,427 | ||||||
| 45,110,943 | ||||||||
| Office Electronics–0.21% | ||||||||
Xerox Corp. | 359,182 | 3,584,636 | ||||||
| Office REIT’s–0.18% | ||||||||
Boston Properties, Inc. | 29,689 | 3,043,122 | ||||||
| Office Services & Supplies–0.22% | ||||||||
Pitney Bowes Inc.(d) | 224,027 | 3,656,121 | ||||||
See accompanying Notes to Financial Statements which are an integral part of the financial statements.
13 Invesco Equally-Weighted S&P 500 Fund
| Shares | Value | |||||||
| Oil & Gas Drilling–1.16% | ||||||||
Diamond Offshore Drilling, Inc.(d) | 48,667 | $ | 3,116,148 | |||||
Ensco PLC–Class A | 56,276 | 3,126,694 | ||||||
Helmerich & Payne, Inc. | 53,741 | 3,387,833 | ||||||
Nabors Industries Ltd. | 205,570 | 3,165,778 | ||||||
Noble Corp. | 87,044 | 3,238,037 | ||||||
Rowan Cos. PLC–Class A(b) | 97,743 | 3,462,057 | ||||||
| 19,496,547 | ||||||||
| Oil & Gas Equipment & Services–1.21% | ||||||||
Baker Hughes Inc. | 71,009 | 3,301,209 | ||||||
Cameron International Corp.(b) | 52,633 | 2,989,028 | ||||||
FMC Technologies, Inc.(b) | 58,765 | 3,151,567 | ||||||
Halliburton Co. | 76,136 | 3,654,528 | ||||||
National Oilwell Varco Inc. | 46,974 | 3,490,168 | ||||||
Schlumberger Ltd. | 45,649 | 3,694,830 | ||||||
| 20,281,330 | ||||||||
| Oil & Gas Exploration & Production–3.53% | ||||||||
Anadarko Petroleum Corp. | 37,957 | 3,470,029 | ||||||
Apache Corp. | 38,502 | 3,298,851 | ||||||
Cabot Oil & Gas Corp. | 94,004 | 3,678,377 | ||||||
Chesapeake Energy Corp. | 158,054 | 4,079,374 | ||||||
ConocoPhillips | 53,556 | 3,550,763 | ||||||
Denbury Resources Inc.(b) | 183,420 | 3,171,332 | ||||||
Devon Energy Corp. | 60,172 | 3,435,219 | ||||||
EOG Resources, Inc. | 24,810 | 3,896,410 | ||||||
EQT Corp. | 41,015 | 3,515,806 | ||||||
Marathon Oil Corp. | 95,070 | 3,273,260 | ||||||
Newfield Exploration Co.(b) | 145,268 | 3,460,284 | ||||||
Noble Energy, Inc. | 56,442 | 3,467,232 | ||||||
Pioneer Natural Resources Co. | 22,292 | 3,900,431 | ||||||
QEP Resources Inc. | 111,669 | 3,050,797 | ||||||
Range Resources Corp. | 44,548 | 3,340,209 | ||||||
Southwestern Energy Co.(b) | 89,450 | 3,416,990 | ||||||
WPX Energy Inc.(b) | 172,029 | 3,210,061 | ||||||
| 59,215,425 | ||||||||
| Oil & Gas Refining & Marketing–0.69% | ||||||||
Marathon Petroleum Corp. | 41,056 | 2,976,971 | ||||||
Phillips 66 | 51,223 | 2,924,833 | ||||||
Tesoro Corp. | 57,182 | 2,635,518 | ||||||
Valero Energy Corp. | 85,991 | 3,055,260 | ||||||
| 11,592,582 | ||||||||
| Oil & Gas Storage & Transportation–0.59% | ||||||||
Kinder Morgan Inc. | 85,073 | 3,226,819 | ||||||
Spectra Energy Corp. | 95,181 | 3,151,443 | ||||||
Williams Cos., Inc. (The) | 98,124 | 3,556,014 | ||||||
| 9,934,276 | ||||||||
| Other Diversified Financial Services–0.59% | ||||||||
Bank of America Corp. | 250,080 | 3,531,130 | ||||||
Citigroup Inc. | 66,406 | 3,209,402 | ||||||
JPMorgan Chase & Co. | 61,519 | 3,108,555 | ||||||
| 9,849,087 | ||||||||
| Shares | Value | |||||||
| Packaged Foods & Meats–2.33% | ||||||||
Campbell Soup Co. | 72,974 | $ | 3,151,017 | |||||
ConAgra Foods, Inc. | 95,879 | 3,242,628 | ||||||
General Mills, Inc. | 66,312 | 3,270,508 | ||||||
Hershey Co. (The) | 36,662 | 3,371,071 | ||||||
Hormel Foods Corp. | 81,448 | 3,374,391 | ||||||
JM Smucker Co. (The) | 31,729 | 3,367,716 | ||||||
Kellogg Co. | 50,880 | 3,088,925 | ||||||
Kraft Foods Group, Inc. | 58,702 | 3,039,002 | ||||||
McCormick & Co., Inc. | 45,238 | 3,060,351 | ||||||
Mead Johnson Nutrition Co. | 40,178 | 3,014,555 | ||||||
Mondelez International Inc.–Class A | 109,646 | 3,362,843 | ||||||
Tyson Foods, Inc.–Class A | 127,877 | 3,702,039 | ||||||
| 39,045,046 | ||||||||
| Paper Packaging–0.81% | ||||||||
Avery Dennison Corp. | 75,941 | 3,247,237 | ||||||
Bemis Co., Inc. | 82,894 | 3,298,352 | ||||||
MeadWestvaco Corp. | 91,504 | 3,280,419 | ||||||
Sealed Air Corp. | 136,873 | 3,887,193 | ||||||
| 13,713,201 | ||||||||
| Paper Products–0.20% | ||||||||
International Paper Co. | 72,073 | 3,402,566 | ||||||
| Personal Products–0.36% | ||||||||
Avon Products, Inc. | 142,981 | 2,826,734 | ||||||
Estee Lauder Cos. Inc. (The)–Class A | 47,778 | 3,122,770 | ||||||
| 5,949,504 | ||||||||
| Pharmaceuticals–2.53% | ||||||||
AbbVie Inc. | 75,643 | 3,223,148 | ||||||
Actavis Inc.(b) | 25,848 | 3,494,133 | ||||||
Allergan, Inc. | 32,316 | 2,856,088 | ||||||
Bristol-Myers Squibb Co. | 69,840 | 2,911,630 | ||||||
Eli Lilly & Co. | 62,796 | 3,227,714 | ||||||
Forest Laboratories, Inc.(b) | 79,565 | 3,383,900 | ||||||
Hospira, Inc.(b) | 90,191 | 3,520,155 | ||||||
Johnson & Johnson | 38,493 | 3,326,180 | ||||||
Merck & Co., Inc. | 68,165 | 3,223,523 | ||||||
Mylan Inc.(b) | 103,174 | 3,646,169 | ||||||
Perrigo Co. | 27,559 | 3,349,796 | ||||||
Pfizer Inc. | 112,360 | 3,169,676 | ||||||
Zoetis Inc. | 106,122 | 3,093,456 | ||||||
| 42,425,568 | ||||||||
| Property & Casualty Insurance–1.54% | ||||||||
ACE Ltd. | 36,911 | 3,237,833 | ||||||
Allstate Corp. (The) | 69,736 | 3,341,749 | ||||||
Berkshire Hathaway Inc.–Class B(b) | 28,630 | 3,184,229 | ||||||
Chubb Corp. (The) | 37,873 | 3,149,897 | ||||||
Cincinnati Financial Corp. | 70,778 | 3,233,139 | ||||||
Progressive Corp. (The) | 132,329 | 3,317,488 | ||||||
Travelers Cos., Inc. (The) | 39,786 | 3,178,901 | ||||||
XL Group PLC | 105,233 | 3,110,688 | ||||||
| 25,753,924 | ||||||||
See accompanying Notes to Financial Statements which are an integral part of the financial statements.
14 Invesco Equally-Weighted S&P 500 Fund
| Shares | Value | |||||||
| Publishing–0.58% | ||||||||
Gannett Co., Inc. | 130,794 | $ | 3,150,827 | |||||
News Corp.–Class A(b) | 179,835 | 2,823,410 | ||||||
Washington Post Co. (The)–Class B | 6,747 | 3,805,308 | ||||||
| 9,779,545 | ||||||||
| Railroads–0.75% | ||||||||
CSX Corp. | 131,056 | 3,225,288 | ||||||
Kansas City Southern | 29,552 | 3,115,372 | ||||||
Norfolk Southern Corp. | 42,910 | 3,096,386 | ||||||
Union Pacific Corp. | 20,815 | 3,195,935 | ||||||
| 12,632,981 | ||||||||
| Real Estate Services–0.19% | ||||||||
CBRE Group, Inc.–Class A(b) | 144,179 | 3,153,195 | ||||||
| Regional Banks–1.85% | ||||||||
BB&T Corp. | 99,711 | 3,386,186 | ||||||
Fifth Third Bancorp | 178,512 | 3,264,984 | ||||||
Huntington Bancshares Inc. | 434,071 | 3,576,745 | ||||||
KeyCorp | 313,982 | 3,664,170 | ||||||
M&T Bank Corp.(d) | 31,884 | 3,613,732 | ||||||
PNC Financial Services Group, Inc. | 46,035 | 3,326,949 | ||||||
Regions Financial Corp. | 363,982 | 3,421,431 | ||||||
SunTrust Banks, Inc. | 105,132 | 3,366,327 | ||||||
Zions Bancorp. | 121,237 | 3,390,999 | ||||||
| 31,011,523 | ||||||||
| Research & Consulting Services–0.57% | ||||||||
Dun & Bradstreet Corp. (The)(d) | 33,095 | 3,292,291 | ||||||
Equifax Inc. | 53,759 | 3,176,619 | ||||||
Nielsen Holdings N.V. | 89,940 | 3,102,930 | ||||||
| 9,571,840 | ||||||||
| Residential REIT’s–0.54% | ||||||||
Apartment Investment & Management Co.–Class A | 112,981 | 3,110,367 | ||||||
AvalonBay Communities, Inc. | 24,284 | 3,008,788 | ||||||
Equity Residential | 58,014 | 3,010,346 | ||||||
| 9,129,501 | ||||||||
| Restaurants–0.98% | ||||||||
Chipotle Mexican Grill, Inc.(b) | 8,878 | 3,623,733 | ||||||
Darden Restaurants, Inc. | 62,210 | 2,874,724 | ||||||
McDonald’s Corp. | 33,209 | 3,133,601 | ||||||
Starbucks Corp. | 49,824 | 3,513,589 | ||||||
Yum! Brands, Inc. | 45,964 | 3,218,399 | ||||||
| 16,364,046 | ||||||||
| Retail REIT’s–0.52% | ||||||||
Kimco Realty Corp. | 148,502 | 2,974,495 | ||||||
Macerich Co. (The) | 52,507 | 2,955,094 | ||||||
Simon Property Group, Inc. | 19,683 | 2,866,435 | ||||||
| 8,796,024 | ||||||||
| Security & Alarm Services–0.39% | ||||||||
ADT Corp. (The) | 82,936 | 3,303,341 | ||||||
Tyco International Ltd. | 98,124 | 3,242,017 | ||||||
| 6,545,358 | ||||||||
| Shares | Value | |||||||
| Semiconductor Equipment–0.75% | ||||||||
Applied Materials, Inc. | 212,106 | $ | 3,183,711 | |||||
KLA-Tencor Corp. | 58,681 | 3,236,257 | ||||||
Lam Research Corp.(b) | 69,425 | 3,240,065 | ||||||
Teradyne, Inc.(b)(d) | 188,497 | 2,893,429 | ||||||
| 12,553,462 | ||||||||
| Semiconductors–2.50% | ||||||||
Advanced Micro Devices, Inc.(b)(d) | 829,584 | 2,712,740 | ||||||
Altera Corp. | 101,225 | 3,560,083 | ||||||
Analog Devices, Inc. | 72,715 | 3,365,250 | ||||||
Broadcom Corp.–Class A | 96,730 | 2,443,400 | ||||||
First Solar, Inc.(b) | 73,105 | 2,684,416 | ||||||
Intel Corp.(e) | 131,161 | 2,882,919 | ||||||
Linear Technology Corp. | 89,819 | 3,442,762 | ||||||
LSI Corp. | 447,135 | 3,313,270 | ||||||
Microchip Technology Inc.(d) | 88,243 | 3,424,711 | ||||||
Micron Technology, Inc.(b) | 256,157 | 3,476,050 | ||||||
NVIDIA Corp. | 227,774 | 3,359,666 | ||||||
Texas Instruments Inc. | 92,123 | 3,519,099 | ||||||
Xilinx, Inc. | 84,067 | 3,650,189 | ||||||
| 41,834,555 | ||||||||
| Soft Drinks–0.95% | ||||||||
Coca-Cola Co. (The) | 81,024 | 3,093,496 | ||||||
Coca-Cola Enterprises, Inc. | 90,440 | 3,382,456 | ||||||
Dr. Pepper Snapple Group, Inc. | 69,647 | 3,117,400 | ||||||
Monster Beverage Corp.(b) | 55,156 | 3,165,403 | ||||||
PepsiCo, Inc. | 39,796 | 3,172,935 | ||||||
| 15,931,690 | ||||||||
| Specialized Consumer Services–0.19% | ||||||||
H&R Block, Inc. | 114,165 | 3,186,345 | ||||||
| Specialized Finance–1.18% | ||||||||
CME Group Inc. | 43,996 | 3,128,556 | ||||||
IntercontinentalExchange Inc.(b) | 18,876 | 3,392,961 | ||||||
McGraw Hill Financial, Inc. | 59,721 | 3,485,915 | ||||||
Moody’s Corp. | 52,549 | 3,340,014 | ||||||
NASDAQ OMX Group, Inc. (The) | 100,262 | 2,993,823 | ||||||
NYSE Euronext | 80,744 | 3,375,099 | ||||||
| 19,716,368 | ||||||||
| Specialized REIT’s–1.46% | ||||||||
American Tower Corp. | 42,266 | 2,937,064 | ||||||
HCP, Inc. | 71,132 | 2,897,206 | ||||||
Health Care REIT, Inc. | 48,515 | 2,980,762 | ||||||
Host Hotels & Resorts Inc. | 189,811 | 3,232,481 | ||||||
Plum Creek Timber Co., Inc. | 69,131 | 3,063,195 | ||||||
Public Storage | 21,531 | 3,287,138 | ||||||
Ventas, Inc. | 46,407 | 2,889,300 | ||||||
Weyerhaeuser Co. | 115,537 | 3,163,403 | ||||||
| 24,450,549 | ||||||||
| Specialty Chemicals–0.79% | ||||||||
Ecolab Inc. | 38,896 | 3,553,150 | ||||||
International Flavors & Fragrances Inc. | 41,652 | 3,290,924 | ||||||
See accompanying Notes to Financial Statements which are an integral part of the financial statements.
15 Invesco Equally-Weighted S&P 500 Fund
| Shares | Value | |||||||
| Specialty Chemicals–(continued) | ||||||||
Sherwin-Williams Co. (The) | 17,851 | $ | 3,077,512 | |||||
Sigma-Aldrich Corp. | 40,114 | 3,308,202 | ||||||
| 13,229,788 | ||||||||
| Specialty Stores–0.57% | ||||||||
PetSmart, Inc. | 47,212 | 3,325,141 | ||||||
Staples, Inc. | 203,775 | 2,834,511 | ||||||
Tiffany & Co. | 43,302 | 3,339,017 | ||||||
| 9,498,669 | ||||||||
| Steel–0.81% | ||||||||
Allegheny Technologies, Inc. | 118,211 | 3,157,416 | ||||||
Cliffs Natural Resources Inc.(d) | 184,247 | 3,845,235 | ||||||
Nucor Corp. | 73,121 | 3,326,274 | ||||||
United States Steel Corp.(d) | 182,702 | 3,270,366 | ||||||
| 13,599,291 | ||||||||
| Systems Software–1.21% | ||||||||
BMC Software, Inc.(b) | 72,457 | 3,333,022 | ||||||
CA, Inc. | 115,660 | 3,383,055 | ||||||
Microsoft Corp. | 95,015 | 3,173,501 | ||||||
Oracle Corp. | 96,788 | 3,083,666 | ||||||
Red Hat, Inc.(b) | 71,350 | 3,604,602 | ||||||
Symantec Corp. | 146,178 | 3,743,618 | ||||||
| 20,321,464 | ||||||||
| Thrifts & Mortgage Finance–0.42% | ||||||||
Hudson City Bancorp, Inc. | 394,277 | 3,623,405 | ||||||
People’s United Financial Inc. | 237,540 | 3,377,819 | ||||||
| 7,001,224 | ||||||||
| Tires & Rubber–0.26% | ||||||||
Goodyear Tire & Rubber Co. (The)(b) | 213,491 | 4,295,439 | ||||||
| Tobacco–0.74% | ||||||||
Altria Group, Inc. | 91,864 | 3,112,352 | ||||||
Lorillard, Inc. | 74,471 | 3,150,123 | ||||||
| Shares | Value | |||||||
| Tobacco–(continued) | ||||||||
Philip Morris International Inc. | 35,480 | $ | 2,960,451 | |||||
Reynolds American Inc. | 67,504 | 3,215,216 | ||||||
| 12,438,142 | ||||||||
| Trading Companies & Distributors–0.37% | ||||||||
Fastenal Co. | 68,537 | 3,014,942 | ||||||
W.W. Grainger, Inc. | 12,848 | 3,177,953 | ||||||
| 6,192,895 | ||||||||
| Trucking–0.17% | ||||||||
Ryder System, Inc. | 52,642 | 2,927,422 | ||||||
| Wireless Telecommunication Services–0.19% | ||||||||
Crown Castle International Corp.(b) | 46,467 | 3,225,739 | ||||||
Total Common Stocks & Other Equity Interests |
| 1,656,357,534 | ||||||
Money Market Funds–0.95% |
| |||||||
Liquid Assets Portfolio–Institutional Class(f) | 7,909,518 | 7,909,518 | ||||||
Premier Portfolio–Institutional Class(f) | 7,909,518 | 7,909,518 | ||||||
Total Money Market Funds |
| 15,819,036 | ||||||
TOTAL INVESTMENTS (excluding investments purchased with cash collateral from securities on loan)–99.78% (Cost $917,666,482) |
| 1,672,176,570 | ||||||
Investments Purchased with Cash Collateral from Securities on Loan |
| |||||||
Money Market Funds–2.13% |
| |||||||
Liquid Assets Portfolio–Institutional Class | 35,775,853 | 35,775,853 | ||||||
TOTAL INVESTMENTS–101.91% |
| 1,707,952,423 | ||||||
OTHER ASSETS LESS LIABILITIES–(1.91)% |
| (32,032,740 | ) | |||||
NET ASSETS–100.00% |
| $ | 1,675,919,683 | |||||
Investment Abbreviations:
| REIT | – Real Estate Investment Trust |
Notes to Schedule of Investments:
| (a) | Industry and/or sector classifications used in this report are generally according to the Global Industry Classification Standard, which was developed by and is the exclusive property and a service mark of MSCI Inc. and Standard & Poor’s. |
| (b) | Non-income producing security. |
| (c) | The Fund’s Adviser is a subsidiary of Invesco Ltd. and therefore, Invesco Ltd. is considered to be affiliated with the Fund. See Note 5. |
| (d) | All or a portion of this security was out on loan at August 31, 2013. |
| (e) | All or a portion of the value was pledged as collateral to cover margin requirements for open futures contracts. See Note 1J and Note 4. |
| (f) | The money market fund and the Fund are affiliated by having the same investment adviser. |
| (g) | The security has been segregated to satisfy the commitment to return the cash collateral received in securities lending transactions upon the borrower’s return of the securities loaned. See Note 1I. |
See accompanying Notes to Financial Statements which are an integral part of the financial statements.
16 Invesco Equally-Weighted S&P 500 Fund
Statement of Assets and Liabilities
August 31, 2013
Assets: |
| |||
Investments, at value (Cost $900,087,974)* | $ | 1,653,397,161 | ||
Investments in affiliates (Cost $53,354,361) | 54,555,262 | |||
Total investments, at value (Cost $953,442,335) | 1,707,952,423 | |||
Receivable for: | ||||
Fund shares sold | 4,503,124 | |||
Dividends | 2,912,299 | |||
Investment for trustee deferred compensation and retirement plans | 20,910 | |||
Other assets | 63,271 | |||
Total assets | 1,715,452,027 | |||
Liabilities: |
| |||
Payable for: | ||||
Fund shares reacquired | 2,053,069 | |||
Collateral upon return of securities loaned | 35,775,853 | |||
Variation margin | 57,162 | |||
Accrued fees to affiliates | 1,065,747 | |||
Accrued trustees’ and officers’ fees and benefits | 6,673 | |||
Accrued other operating expenses | 416,064 | |||
Trustee deferred compensation and retirement plans | 157,776 | |||
Total liabilities | 39,532,344 | |||
Net assets applicable to shares outstanding | $ | 1,675,919,683 | ||
Net assets consist of: |
| |||
Shares of beneficial interest | $ | 905,498,872 | ||
Undistributed net investment income | 12,133,943 | |||
Undistributed net realized gain | 3,959,571 | |||
Unrealized appreciation | 754,327,297 | |||
| $ | 1,675,919,683 | |||
Net Assets: |
| |||
Class A | $ | 999,729,543 | ||
Class B | $ | 22,925,067 | ||
Class C | $ | 141,985,524 | ||
Class R | $ | 29,320,354 | ||
Class Y | $ | 481,947,644 | ||
Class R6 | $ | 11,551 | ||
Shares outstanding, $0.01 par value per share, |
| |||
Class A | 24,950,478 | |||
Class B | 573,014 | |||
Class C | 3,663,836 | |||
Class R | 733,914 | |||
Class Y | 11,936,607 | |||
Class R6 | 286 | |||
Class A: | ||||
Net asset value per share | $ | 40.07 | ||
Maximum offering price per share | ||||
(Net asset value of $40.07 ¸ 94.50%) | $ | 42.40 | ||
Class B: | ||||
Net asset value and offering price per share | $ | 40.01 | ||
Class C: | ||||
Net asset value and offering price per share | $ | 38.75 | ||
Class R: | ||||
Net asset value and offering price per share | $ | 39.95 | ||
Class Y: | ||||
Net asset value and offering price per share | $ | 40.38 | ||
Class R6: | ||||
Net asset value and offering price per share | $ | 40.39 | ||
| * | At August 31, 2013, securities with an aggregate value of $34,911,554 were on loan to brokers. |
See accompanying Notes to Financial Statements which are an integral part of the financial statements.
17 Invesco Equally-Weighted S&P 500 Fund
Statement of Operations
For the year ended August 31, 2013
Investment income: |
| |||
Dividends (net of foreign withholding taxes of $22,753) | $ | 28,162,533 | ||
Dividends from affiliates (includes securities lending income of $282,124) | 376,811 | |||
Total investment income | 28,539,344 | |||
Expenses: | ||||
Advisory fees | 1,671,960 | |||
Administrative services fees | 345,144 | |||
Custodian fees | 70,040 | |||
Distribution fees: | ||||
Class A | 2,130,182 | |||
Class B | 322,824 | |||
Class C | 1,011,042 | |||
Class R | 89,896 | |||
Transfer agent fees — A,B,C,R, & Y | 1,647,447 | |||
Transfer agent fees — R6 | 8 | |||
Trustees’ and officers’ fees and benefits | 69,807 | |||
Other | 663,510 | |||
Total expenses | 8,021,860 | |||
Less: Fees waived and expense offset arrangement(s) | (26,440 | ) | ||
Net expenses | 7,995,420 | |||
Net investment income | 20,543,924 | |||
Realized and unrealized gain from: | ||||
Net realized gain from: | ||||
Investment securities | 38,566,055 | |||
Futures contracts | 2,623,651 | |||
| 41,189,706 | ||||
Change in net unrealized appreciation (depreciation) of: | ||||
Investment securities | 233,280,176 | |||
Futures contracts | (338,758 | ) | ||
| 232,941,418 | ||||
Net realized and unrealized gain | 274,131,124 | |||
Net increase in net assets resulting from operations | $ | 294,675,048 | ||
See accompanying Notes to Financial Statements which are an integral part of the financial statements.
18 Invesco Equally-Weighted S&P 500 Fund
Statement of Changes in Net Assets
For the years ended August 31, 2013 and 2012
| 2013 | 2012 | |||||||
Operations: |
| |||||||
Net investment income | $ | 20,543,924 | $ | 13,805,766 | ||||
Net realized gain | 41,189,706 | 51,147,573 | ||||||
Change in net unrealized appreciation | 232,941,418 | 71,326,622 | ||||||
Net increase in net assets resulting from operations | 294,675,048 | 136,279,961 | ||||||
Distributions to shareholders from net investment income: | ||||||||
Class A | (11,160,240 | ) | (11,216,679 | ) | ||||
Class B | (254,363 | ) | (345,338 | ) | ||||
Class C | (631,218 | ) | (365,417 | ) | ||||
Class R | (152,295 | ) | (19,599 | ) | ||||
Class Y | (5,410,532 | ) | (4,510,536 | ) | ||||
Class R6 | (170 | ) | — | |||||
Total distributions from net investment income | (17,608,818 | ) | (16,457,569 | ) | ||||
Distributions to shareholders from net realized gains: | ||||||||
Class A | (18,393,200 | ) | — | |||||
Class B | (869,049 | ) | — | |||||
Class C | (2,156,598 | ) | — | |||||
Class R | (301,636 | ) | — | |||||
Class Y | (7,685,801 | ) | — | |||||
Class R6 | (240 | ) | — | |||||
Total distributions from net realized gains | (29,406,524 | ) | — | |||||
Share transactions–net: | ||||||||
Class A | 115,974,489 | 15,259,422 | ||||||
Class B | (25,161,061 | ) | (42,838,095 | ) | ||||
Class C | 47,119,734 | 1,457,548 | ||||||
Class R | 17,285,208 | 7,253,744 | ||||||
Class Y | 103,991,172 | 103,884,907 | ||||||
Class R6 | 9,805 | — | ||||||
Net increase in net assets resulting from share transactions | 259,219,347 | 85,017,526 | ||||||
Net increase in net assets | 506,879,053 | 204,839,918 | ||||||
Net assets: | ||||||||
Beginning of year | 1,169,040,630 | 964,200,712 | ||||||
End of year (includes undistributed net investment income of $12,133,943 and $9,153,063, respectively) | $ | 1,675,919,683 | $ | 1,169,040,630 | ||||
Notes to Financial Statements
August 31, 2013
NOTE 1—Significant Accounting Policies
Invesco Equally-Weighted S&P 500 Fund (the “Fund”) is a series portfolio of AIM Counselor Series Trust (Invesco Counselor Series Trust) (the “Trust”). The Trust is a Delaware statutory trust registered under the Investment Company Act of 1940, as amended (the “1940 Act”), as an open-end series management investment company consisting of twelve separate portfolios, each authorized to issue an unlimited number of shares of beneficial interest. The assets, liabilities and operations of each portfolio are accounted for separately. Information presented in these financial statements pertains only to the Fund. Matters affecting each portfolio or class will be voted on exclusively by the shareholders of such portfolio or class.
The Fund’s investment objective is to achieve a high level of total return on its assets through a combination of capital appreciation and current income.
The Fund currently consists of six different classes of shares: Class A, Class B, Class C, Class R, Class Y and Class R6. On September 24, 2012, the Fund began offering Class R6 shares. Class A shares are sold with a front-end sales charge unless certain waiver criteria are met and under certain circumstances load waived shares may be subject to contingent deferred sales charges (“CDSC”). Class C shares are sold with a CDSC. Class R, Class Y and Class R6 shares are sold at net asset value. Effective November 30, 2010, new or additional investments in Class B shares are no longer permitted. Existing shareholders of Class B shares may continue to reinvest dividends and capital gains distributions in Class B shares until they
19 Invesco Equally-Weighted S&P 500 Fund
convert to Class A shares. Also, shareholders in Class B shares will be able to exchange those shares for Class B shares of other Invesco Funds offering such shares until they convert to Class A shares. Generally, Class B shares will automatically convert to Class A shares on or about the month-end, which is at least eight years after the date of purchase. Redemption of Class B shares prior to the conversion date will be subject to a CDSC.
The following is a summary of the significant accounting policies followed by the Fund in the preparation of its financial statements.
| A. | Security Valuations — Securities, including restricted securities, are valued according to the following policy. |
A security listed or traded on an exchange (except convertible bonds) is valued at its last sales price or official closing price as of the close of the customary trading session on the exchange where the security is principally traded, or lacking any sales or official closing price on a particular day, the security may be valued at the closing bid price on that day. Securities traded in the over-the-counter market are valued based on prices furnished by independent pricing services or market makers. When such securities are valued by an independent pricing service they may be considered fair valued. Futures contracts are valued at the final settlement price set by an exchange on which they are principally traded. Listed options are valued at the mean between the last bid and ask prices from the exchange on which they are principally traded. Options not listed on an exchange are valued by an independent source at the mean between the last bid and ask prices. For purposes of determining net asset value per share, futures and option contracts generally are valued 15 minutes after the close of the customary trading session of the New York Stock Exchange (“NYSE”).
Investments in open-end and closed-end registered investment companies that do not trade on an exchange are valued at the end of day net asset value per share. Investments in open-end and closed-end registered investment companies that trade on an exchange are valued at the last sales price or official closing price as of the close of the customary trading session on the exchange where the security is principally traded.
Debt obligations (including convertible bonds) and unlisted equities are fair valued using an evaluated quote provided by an independent pricing service. Evaluated quotes provided by the pricing service may be determined without exclusive reliance on quoted prices, and may reflect appropriate factors such as institution-size trading in similar groups of securities, developments related to specific securities, dividend rate (for unlisted equities), yield (for debt obligations), quality, type of issue, coupon rate (for debt obligations), maturity (for debt obligations), individual trading characteristics and other market data. Debt obligations are subject to interest rate and credit risks. In addition, all debt obligations involve some risk of default with respect to interest and/or principal payments.
Foreign securities’ (including foreign exchange contracts) prices are converted into U.S. dollar amounts using the applicable exchange rates as of the close of the NYSE. If market quotations are available and reliable for foreign exchange-traded equity securities, the securities will be valued at the market quotations. Because trading hours for certain foreign securities end before the close of the NYSE, closing market quotations may become unreliable. If between the time trading ends on a particular security and the close of the customary trading session on the NYSE, events occur that the Adviser determines are significant and make the closing price unreliable, the Fund may fair value the security. If the event is likely to have affected the closing price of the security, the security will be valued at fair value in good faith using procedures approved by the Board of Trustees. Adjustments to closing prices to reflect fair value may also be based on a screening process of an independent pricing service to indicate the degree of certainty, based on historical data, that the closing price in the principal market where a foreign security trades is not the current value as of the close of the NYSE. Foreign securities’ prices meeting the approved degree of certainty that the price is not reflective of current value will be priced at the indication of fair value from the independent pricing service. Multiple factors may be considered by the independent pricing service in determining adjustments to reflect fair value and may include information relating to sector indices, American Depositary Receipts and domestic and foreign index futures. Foreign securities may have additional risks including exchange rate changes, potential for sharply devalued currencies and high inflation, political and economic upheaval, the relative lack of issuer information, relatively low market liquidity and the potential lack of strict financial and accounting controls and standards.
Securities for which market prices are not provided by any of the above methods may be valued based upon quotes furnished by independent sources. The last bid price may be used to value equity securities. The mean between the last bid and asked prices is used to value debt obligations, including corporate loans.
Securities for which market quotations are not readily available or became unreliable are valued at fair value as determined in good faith by or under the supervision of the Trust’s officers following procedures approved by the Board of Trustees. Issuer specific events, market trends, bid/ask quotes of brokers and information providers and other market data may be reviewed in the course of making a good faith determination of a security’s fair value.
Valuations change in response to many factors including the historical and prospective earnings of the issuer, the value of the issuer’s assets, general economic conditions, interest rates, investor perceptions and market liquidity. Because of the inherent uncertainties of valuation, the values reflected in the financial statements may materially differ from the value received upon actual sale of those investments.
| B. | Securities Transactions and Investment Income — Securities transactions are accounted for on a trade date basis. Realized gains or losses on sales are computed on the basis of specific identification of the securities sold. Interest income is recorded on the accrual basis from settlement date. Dividend income (net of withholding tax, if any) is recorded on the ex-dividend date. |
The Fund may periodically participate in litigation related to Fund investments. As such, the Fund may receive proceeds from litigation settlements. Any proceeds received are included in the Statement of Operations as realized gain (loss) for investments no longer held and as unrealized gain (loss) for investments still held.
Brokerage commissions and mark ups are considered transaction costs and are recorded as an increase to the cost basis of securities purchased and/or a reduction of proceeds on a sale of securities. Such transaction costs are included in the determination of net realized and unrealized gain (loss) from investment securities reported in the Statement of Operations and the Statement of Changes in Net Assets and the net realized and unrealized gains (losses) on securities per share in the Financial Highlights. Transaction costs are included in the calculation of the Fund’s net asset value and, accordingly, they reduce the Fund’s total returns. These transaction costs are not considered operating expenses and are not reflected in net investment income reported in the Statement of Operations and Statement of Changes in Net Assets, or the net investment income per share and ratios of expenses and net investment income reported in the Financial Highlights, nor are they limited by any expense limitation arrangements between the Fund and the investment adviser.
The Fund allocates income and realized and unrealized capital gains and losses to a class based on the relative net assets of each class.
| C. | Country Determination — For the purposes of making investment selection decisions and presentation in the Schedule of Investments, the investment adviser may determine the country in which an issuer is located and/or credit risk exposure based on various factors. These factors |
20 Invesco Equally-Weighted S&P 500 Fund
| include the laws of the country under which the issuer is organized, where the issuer maintains a principal office, the country in which the issuer derives 50% or more of its total revenues and the country that has the primary market for the issuer’s securities, as well as other criteria. Among the other criteria that may be evaluated for making this determination are the country in which the issuer maintains 50% or more of its assets, the type of security, financial guarantees and enhancements, the nature of the collateral and the sponsor organization. Country of issuer and/or credit risk exposure has been determined to be the United States of America, unless otherwise noted. |
| D. | Distributions — Distributions from income and net realized capital gain, if any, are generally declared and paid annually and recorded on the ex-dividend date. The Fund may elect to treat a portion of the proceeds from redemptions as distributions for federal income tax purposes. |
| E. | Federal Income Taxes — The Fund intends to comply with the requirements of Subchapter M of the Internal Revenue Code of 1986, as amended (the “Internal Revenue Code”), necessary to qualify as a regulated investment company and to distribute substantially all of the Fund’s taxable earnings to shareholders. As such, the Fund will not be subject to federal income taxes on otherwise taxable income (including net realized capital gain) that is distributed to shareholders. Therefore, no provision for federal income taxes is recorded in the financial statements. |
The Fund files tax returns in the U.S. Federal jurisdiction and certain other jurisdictions. Generally, the Fund is subject to examinations by such taxing authorities for up to three years after the filing of the return for the tax period.
| F. | Expenses — Fees provided for under the Rule 12b-1 plan of a particular class of the Fund are charged to the operations of such class. Transfer agency fees and expenses and other shareholder recordkeeping fees and expenses attributable to Class R6 are charged to such class. Transfer agency fees and expenses and other shareholder recordkeeping fees and expenses relating to all other classes are allocated among those classes based on relative net assets. All other expenses are allocated among the classes based on relative net assets. |
| G. | Accounting Estimates — The preparation of financial statements in conformity with accounting principles generally accepted in the United States of America (“GAAP”) requires management to make estimates and assumptions that affect the reported amounts of assets and liabilities at the date of the financial statements and the reported amounts of revenues and expenses during the reporting period including estimates and assumptions related to taxation. Actual results could differ from those estimates by a significant amount. In addition, the Fund monitors for material events or transactions that may occur or become known after the period-end date and before the date the financial statements are released to print. |
| H. | Indemnifications — Under the Trust’s organizational documents, each Trustee, officer, employee or other agent of the Trust is indemnified against certain liabilities that may arise out of the performance of their duties to the Fund. Additionally, in the normal course of business, the Fund enters into contracts, including the Fund’s servicing agreements, that contain a variety of indemnification clauses. The Fund’s maximum exposure under these arrangements is unknown as this would involve future claims that may be made against the Fund that have not yet occurred. The risk of material loss as a result of such indemnification claims is considered remote. |
| I. | Securities Lending — The Fund may lend portfolio securities having a market value up to one-third of the Fund’s total assets. Such loans are secured by collateral equal to no less than the market value of the loaned securities determined daily by the securities lending provider. Such collateral will be cash or debt securities issued or guaranteed by the U.S. Government or any of its sponsored agencies. Cash collateral received in connection with these loans is invested in short-term money market instruments or affiliated money market funds and is shown as such on the Schedule of Investments. It is the Fund’s policy to obtain additional collateral from or return excess collateral to the borrower by the end of the next business day, following the valuation date of the securities loaned. Therefore, the value of the collateral held may be temporarily less than the value of the securities on loan. Lending securities entails a risk of loss to the Fund if and to the extent that the market value of the securities loaned were to increase and the borrower did not increase the collateral accordingly, and the borrower fails to return the securities. Upon the failure of the borrower to return the securities, collateral may be liquidated and the securities may be purchased on the open market to replace the loaned securities. The Fund could experience delays and costs in gaining access to the collateral. The Fund bears the risk of any deficiency in the amount of the collateral available for return to the borrower due to any loss on the collateral invested. Dividends received on cash collateral investments for securities lending transactions, which are net of compensation to counterparties, is included in Dividends from affiliated money market funds on the Statement of Operations. The aggregate value of securities out on loan is shown as a footnote on the Statement of Assets and Liabilities, if any. |
| J. | Futures Contracts — The Fund may enter into futures contracts to manage exposure to interest rate, equity and market price movements and/or currency risks. A futures contract is an agreement between two parties to purchase or sell a specified underlying security, currency or commodity (or delivery of a cash settlement price, in the case of an index future) for a fixed price at a future date. The Fund currently invests only in exchange-traded futures and they are standardized as to maturity date and underlying financial instrument. Initial margin deposits required upon entering into futures contracts are satisfied by the segregation of specific securities or cash as collateral at the futures commission merchant (broker). During the period the futures contracts are open, changes in the value of the contracts are recognized as unrealized gains or losses by recalculating the value of the contracts on a daily basis. Subsequent or variation margin payments are received or made depending upon whether unrealized gains or losses are incurred. These amounts are reflected as receivables or payables on the Statement of Assets and Liabilities. When the contracts are closed or expire, the Fund recognizes a realized gain or loss equal to the difference between the proceeds from, or cost of, the closing transaction and the Fund’s basis in the contract. The net realized gain (loss) and the change in unrealized gain (loss) on futures contracts held during the period is included on the Statement of Operations. The primary risks associated with futures contracts are market risk and the absence of a liquid secondary market. If the Fund were unable to liquidate a futures contract and/or enter into an offsetting closing transaction, the Fund would continue to be subject to market risk with respect to the value of the contracts and continue to be required to maintain the margin deposits on the futures contracts. Futures contracts have minimal counterparty risk since the exchange’s clearinghouse, as counterparty to all exchange-traded futures, guarantees the futures against default. Risks may exceed amounts recognized in the Statement of Assets and Liabilities. |
| K. | Collateral — To the extent the Fund has designated or segregated a security as collateral and that security is subsequently sold, it is the Fund’s practice to replace such collateral no later than the next business day. This practice does not apply to securities pledged as collateral for securities lending transactions. |
21 Invesco Equally-Weighted S&P 500 Fund
NOTE 2—Advisory Fees and Other Fees Paid to Affiliates
The Trust has entered into a master investment advisory agreement with Invesco Advisers, Inc. (the “Adviser” or “Invesco”). Under the terms of the investment advisory agreement, the Fund pays an advisory fee to the Adviser based on the annual rate of the Fund’s average daily net assets as follows:
| Average Daily Net Assets | Rate | |||
First $2 billion | 0.12% | |||
Over $2 billion | 0.10% | |||
Under the terms of a master sub-advisory agreement between the Adviser and each of Invesco Asset Management Deutschland GmbH, Invesco Asset Management Limited, Invesco Asset Management (Japan) Limited, Invesco Australia Limited, Invesco Hong Kong Limited, Invesco Senior Secured Management, Inc. and Invesco Canada Ltd. (collectively, the “Affiliated Sub-Advisers”) the Adviser, not the Fund, may pay 40% of the fees paid to the Adviser to any such Affiliated Sub-Adviser(s) that provide(s) discretionary investment management services to the Fund based on the percentage of assets allocated to such Sub-Adviser(s).
The Adviser has contractually agreed, through at least June 30, 2014, to waive advisory fees and/or reimburse expenses to the extent necessary to limit total annual fund operating expenses and/or reimbursement (excluding certain items discussed below) of Class A, Class B, Class C, Class R, Class Y and Class R6 shares to 2.00%, 2.75%, 2.75%, 2.25%, 1.75% and 1.75% of average daily net assets, respectively. In determining the Adviser’s obligation to waive advisory fees and/or reimburse expenses, the following expenses are not taken into account, and could cause the net annual fund operating expenses and/or reimbursement to exceed the numbers reflected above: (1) interest; (2) taxes; (3) dividend expense on short sales; (4) extraordinary or non-routine items, including litigation expenses; and (5) expenses that the Fund has incurred but did not actually pay because of an expense offset arrangement. Unless the Board of Trustees and Invesco mutually agree to amend or continue the fee waiver agreement, it will terminate on June 30, 2014. The Adviser did not waive fees and/or reimburse expenses during the period under this expense limitation.
Further, the Adviser has contractually agreed, through at least June 30, 2014, to waive the advisory fee payable by the Fund in an amount equal to 100% of the net advisory fees the Adviser receives from the affiliated money market funds on investments by the Fund of uninvested cash in such affiliated money market funds.
For the year ended August 31, 2013, the Adviser waived advisory fees of $25,711.
The Trust has entered into a master administrative services agreement with Invesco pursuant to which the Fund has agreed to pay Invesco for certain administrative costs incurred in providing accounting services to the Fund. For the year ended August 31, 2013, expenses incurred under the agreement are shown in the Statement of Operations as Administrative services fees.
The Trust has entered into a transfer agency and service agreement with Invesco Investment Services, Inc. (“IIS”) pursuant to which the Fund has agreed to pay IIS a fee for providing transfer agency and shareholder services to the Fund and reimburse IIS for certain expenses incurred by IIS in the course of providing such services. IIS may make payments to intermediaries that provide omnibus account services, sub-accounting services and/or networking services. All fees payable by IIS to intermediaries that provide omnibus account services or sub-accounting are charged back to the Fund, subject to certain limitations approved by the Trust’s Board of Trustees. For the year ended August 31, 2013, the expenses incurred under the agreement are shown in the Statement of Operations as Transfer agent fees.
Shares of the Fund are distributed by Invesco Distributors, Inc. (“IDI”), an affiliate of the Adviser. The Fund has adopted a Plan of Distribution (the “Plan”) pursuant to Rule 12b-1 under the 1940 Act. The Plan provides that the Fund will reimburse IDI for distribution related expenses that IDI incurs up to a maximum of the following annual rates: (1) Class A — up to 0.25% of the average daily net assets of Class A shares; (2) Class B — up to 1.00% of the average daily net assets of Class B shares; (3) Class C — up to 1.00% of the average daily net assets of Class C shares; and (4) Class R — up to 0.50% of the average daily net assets of Class R shares.
In the case of Class B shares, provided that the Plan continues in effect, any cumulative expenses incurred by IDI, but not yet reimbursed to IDI, may be recovered through the payment of future distribution fees from the Fund pursuant to the Plan and contingent deferred sales charges paid by investors upon redemption of Class B shares.
For the year ended August 31, 2013, expenses incurred under these agreements are shown in the Statement of Operations as Distribution fees.
Front-end sales commissions and CDSC (collectively, the “sales charges”) are not recorded as expenses of the Fund. Front-end sales commissions are deducted from proceeds from the sales of Fund shares prior to investment in Class A shares of the Fund. CDSC are deducted from redemption proceeds prior to remittance to the shareholder. During the year ended August 31, 2013, IDI advised the Fund that IDI retained $158,939 in front-end sales commissions from the sale of Class A shares and $165, $11,655 and $7,608 from Class A, Class B and Class C shares, respectively, for CDSC imposed on redemptions by shareholders.
Certain officers and trustees of the Trust are officers and directors of the Adviser, IIS and/or IDI.
NOTE 3—Additional Valuation Information
GAAP defines fair value as the price that would be received to sell an asset or paid to transfer a liability in an orderly transaction between market participants at the measurement date, under current market conditions. GAAP establishes a hierarchy that prioritizes the inputs to valuation methods, giving the highest priority to readily available unadjusted quoted prices in an active market for identical assets (Level 1) and the lowest priority to significant unobservable inputs (Level 3), generally when market prices are not readily available or are unreliable. Based on the valuation inputs, the securities or other investments are tiered into one of three levels. Changes in valuation methods may result in transfers in or out of an investment’s assigned level:
| Level 1 — | Prices are determined using quoted prices in an active market for identical assets. |
| Level 2 — | Prices are determined using other significant observable inputs. Observable inputs are inputs that other market participants may use in pricing a security. These may include quoted prices for similar securities, interest rates, prepayment speeds, credit risk, yield curves, loss severities, default rates, discount rates, volatilities and others. |
22 Invesco Equally-Weighted S&P 500 Fund
| Level 3 — | Prices are determined using significant unobservable inputs. In situations where quoted prices or observable inputs are unavailable (for example, when there is little or no market activity for an investment at the end of the period), unobservable inputs may be used. Unobservable inputs reflect the Fund’s own assumptions about the factors market participants would use in determining fair value of the securities or instruments and would be based on the best available information. |
The following is a summary of the tiered valuation input levels, as of August 31, 2013. The level assigned to the securities valuations may not be an indication of the risk or liquidity associated with investing in those securities. Because of the inherent uncertainties of valuation, the values reflected in the financial statements may materially differ from the value received upon actual sale of those investments.
| Level 1 | Level 2 | Level 3 | Total | |||||||||||||
Equity Securities | $ | 1,707,952,423 | $ | — | $ | — | $ | 1,707,952,423 | ||||||||
Futures* | (182,791 | ) | — | — | (182,791 | ) | ||||||||||
Total Investments | $ | 1,707,769,632 | $ | — | $ | — | $ | 1,707,769,632 | ||||||||
| * | Unrealized appreciation (depreciation). |
NOTE 4—Derivative Investments
Value of Derivative Investments at Period-End
The table below summarizes the value of the Fund’s derivative investments, detailed by primary risk exposure, held as of August 31, 2013:
| Value | ||||||||
| Risk Exposure/Derivative Type | Assets | Liabilities | ||||||
Market Risk | ||||||||
Futures contracts(a) | $ | — | $ | (182,791 | ) | |||
| (a) | Includes cumulative appreciation (depreciation) of futures contracts. Only current day’s variation margin receivable (payable) is reported within the Statement of Assets and Liabilities. |
Effect of Derivative Investments for the year ended August 31, 2013
The table below summarizes the gains (losses) on derivative investments, detailed by primary risk exposure, recognized in earnings during the period:
| Location of Gain (Loss) on Statement of Operations | ||||
| Futures* | ||||
Realized Gain | ||||
Equity risk | $ | 2,623,651 | ||
Change in Unrealized Appreciation (Depreciation) | ||||
Equity risk | $ | (338,758 | ) | |
Total | $ | 2,284,893 | ||
| * | The average notional value of futures contracts outstanding during the period was $17,233,268. |
| Open Futures Contracts | ||||||||||||||||
| Long Contracts | Number of Contracts | Expiration Month | Notional Value | Unrealized Appreciation (Depreciation) | ||||||||||||
E-Mini S&P 500 | 227 | September-2013 | $ | 18,515,255 | $ | (182,791 | ) | |||||||||
NOTE 5—Investments in Affiliates
The Fund’s Adviser is a subsidiary of Invesco Ltd. and therefore, Invesco Ltd. is considered to be affiliated with the Fund. The following is a summary of the transactions in and earnings from investments in Invesco Ltd. for the year ended August 31, 2013.
Value 08/31/12 | Purchases at Cost | Proceeds from Sales | Change in Unrealized Appreciation | Realized Gain | Value 08/31/13 | Dividend Income | ||||||||||||||||||||||
Invesco Ltd. | $ | 2,262,766 | $ | 503,603 | $ | (461,159 | ) | $ | 603,167 | $ | 51,996 | $ | 2,960,373 | $ | 77,526 | |||||||||||||
NOTE 6—Expense Offset Arrangement(s)
The expense offset arrangement is comprised of transfer agency credits which result from balances in Demand Deposit Accounts (DDA) used by the transfer agent for clearing shareholder transactions. For the year ended August 31, 2013, the Fund received credits from this arrangement, which resulted in the reduction of the Fund’s total expenses of $729.
23 Invesco Equally-Weighted S&P 500 Fund
NOTE 7—Trustees’ and Officers’ Fees and Benefits
“Trustees’ and Officers’ Fees and Benefits” include amounts accrued by the Fund to pay remuneration to certain Trustees and Officers of the Fund. Trustees have the option to defer compensation payable by the Fund, and “Trustees’ and Officers’ Fees and Benefits” also include amounts accrued by the Fund to fund such deferred compensation amounts. Those Trustees who defer compensation have the option to select various Invesco Funds in which their deferral accounts shall be deemed to be invested. Finally, certain current Trustees are eligible to participate in a retirement plan that provides for benefits to be paid upon retirement to Trustees over a period of time based on the number of years of service. The Fund may have certain former Trustees who also participate in a retirement plan and receive benefits under such plan. “Trustees’ and Officers’ Fees and Benefits” include amounts accrued by the Fund to fund such retirement benefits. Obligations under the deferred compensation and retirement plans represent unsecured claims against the general assets of the Fund.
NOTE 8—Cash Balances
The Fund is permitted to temporarily carry a negative or overdrawn balance in its account with State Street Bank and Trust Company, the custodian bank. Such balances, if any at period end, are shown in the Statement of Assets and Liabilities under the payable caption Amount due custodian. To compensate the custodian bank for such overdrafts, the overdrawn Fund may either (1) leave funds as a compensating balance in the account so the custodian bank can be compensated by earning the additional interest; or (2) compensate by paying the custodian bank at a rate agreed upon by the custodian bank and Invesco, not to exceed the contractually agreed upon rate.
NOTE 9—Distributions to Shareholders and Tax Components of Net Assets
Tax Character of Distributions to Shareholders Paid During the Years Ended August 31, 2013 and 2012:
| 2013 | 2012 | |||||||
Ordinary income | $ | 19,912,458 | $ | 16,457,569 | ||||
Long-term capital gain | 27,102,884 | — | ||||||
Total distributions | $ | 47,015,342 | $ | 16,457,569 | ||||
Tax Components of Net Assets at Period-End:
| 2013 | ||||
Undistributed ordinary income | $ | 24,128,031 | ||
Undistributed long-term gain | 24,099,712 | |||
Net unrealized appreciation — investments | 722,347,979 | |||
Temporary book/tax differences | (154,911 | ) | ||
Shares of beneficial interest | 905,498,872 | |||
Total net assets | $ | 1,675,919,683 | ||
The difference between book-basis and tax-basis unrealized appreciation (depreciation) is due to differences in the timing of recognition of gains and losses on investments for tax and book purposes. The Fund’s net unrealized appreciation difference is attributable primarily to wash sales.
The temporary book/tax differences are a result of timing differences between book and tax recognition of income and/or expenses. The Fund’s temporary book/tax differences are the result of the trustee deferral of compensation and retirement plan benefits.
Capital loss carryforward is calculated and reported as of a specific date. Results of transactions and other activity after that date may affect the amount of capital loss carryforward actually available for the Trust to utilize. The Regulated Investment Company Modernization Act of 2010 eliminated the eight-year carryover period for capital losses that arise in taxable years beginning after its enactment date of December 22, 2010. Consequently, these capital losses can be carried forward for an unlimited period. However, capital losses with an expiration period may not be used to offset capital gains until all net capital losses without an expiration date have been utilized. Additionally, post-enactment capital loss carryovers will retain their character as either short-term or long-term capital losses instead of as short-term capital losses as under prior law. The ability to utilize capital loss carryforward in the future may be limited under the Internal Revenue Code and related regulations based on the results of future transactions.
The Fund does not have a capital loss carryforward as of August 31, 2013.
NOTE 10—Investment Securities
The aggregate amount of investment securities (other than short-term securities, U.S. Treasury obligations and money market funds, if any) purchased and sold by the Fund during the year ended August 31, 2013 was $485,411,369 and $252,836,288, respectively. Cost of investments on a tax basis includes the adjustments for financial reporting purposes as of the most recently completed federal income tax reporting period-end.
| Unrealized Appreciation (Depreciation) of Investment Securities on a Tax Basis | ||||
Aggregate unrealized appreciation of investment securities | $ | 733,436,127 | ||
Aggregate unrealized (depreciation) of investment securities | (11,088,148 | ) | ||
Net unrealized appreciation of investment securities | $ | 722,347,979 | ||
Cost of investments for tax purposes is $985,604,444.
24 Invesco Equally-Weighted S&P 500 Fund
NOTE 11—Reclassification of Permanent Differences
Primarily as a result of differing book/tax treatment of real estate investment trusts distributions, on August 31, 2013, undistributed net investment income was increased by $45,774, undistributed net realized gain was decrease by $45,774. This reclassification had no effect on the net assets of the Fund.
NOTE 12—Share Information
| Summary of Share Activity | ||||||||||||||||
| Years ended August 31, | ||||||||||||||||
| 2013(a) | 2012 | |||||||||||||||
| Shares | Amount | Shares | Amount | |||||||||||||
Sold: | ||||||||||||||||
Class A | 6,938,918 | $ | 263,020,016 | 3,958,683 | $ | 123,974,664 | ||||||||||
Class B | 65,896 | 2,465,090 | 39,680 | 1,248,979 | ||||||||||||
Class C | 1,723,158 | 63,962,776 | 525,225 | 16,022,658 | ||||||||||||
Class R | 629,268 | 23,479,568 | 247,288 | 7,832,303 | ||||||||||||
Class Y | 4,878,656 | 185,994,372 | 4,809,146 | 151,977,766 | ||||||||||||
Class R6(b) | 286 | 9,805 | — | — | ||||||||||||
Issued as reinvestment of dividends: | ||||||||||||||||
Class A | 788,153 | 26,190,326 | 326,598 | 9,824,076 | ||||||||||||
Class B | 30,790 | 1,027,145 | 10,380 | 313,479 | ||||||||||||
Class C | 75,170 | 2,568,785 | 11,417 | 334,292 | ||||||||||||
Class R | 13,660 | 453,388 | 648 | 19,471 | ||||||||||||
Class Y | 353,324 | 11,808,079 | 133,786 | 4,047,035 | ||||||||||||
Automatic conversion of Class B shares to Class A shares: | ||||||||||||||||
Class A | 639,095 | 23,292,837 | 1,024,779 | 32,654,725 | ||||||||||||
Class B | (638,871 | ) | (23,292,837 | ) | (1,025,555 | ) | (32,654,725 | ) | ||||||||
Reacquired: | ||||||||||||||||
Class A | (5,290,801 | ) | (196,528,690 | ) | (4,830,637 | ) | (151,194,043 | ) | ||||||||
Class B | (148,389 | ) | (5,360,459 | ) | (376,796 | ) | (11,745,828 | ) | ||||||||
Class C | (537,590 | ) | (19,411,827 | ) | (486,834 | ) | (14,899,402 | ) | ||||||||
Class R | (176,971 | ) | (6,647,748 | ) | (19,491 | ) | (598,030 | ) | ||||||||
Class Y | (2,498,828 | ) | (93,811,279 | ) | (1,648,309 | ) | (52,139,894 | ) | ||||||||
Net increase in share activity | 6,844,924 | $ | 259,219,347 | 2,700,008 | $ | 85,017,526 | ||||||||||
| (a) | There are entities that are record owners of more than 5% of the outstanding shares of the Fund and in the aggregate own 54% of the outstanding shares of the Fund. IDI has an agreement with these entities to sell Fund shares. The Fund, Invesco and/or Invesco affiliates may make payments to these entities, which are considered to be related to the Fund, for providing services to the Fund, Invesco and/or Invesco affiliates including but not limited to services such as securities brokerage, distribution, third party record keeping and account servicing. The Fund has no knowledge as to whether all or any portion of the shares owned of record by these entities are also owned beneficially. |
| (b) | Commencement date of September 24, 2012. |
25 Invesco Equally-Weighted S&P 500 Fund
NOTE 13—Financial Highlights
The following schedule presents financial highlights for a share of the Fund outstanding throughout the periods indicated.
| Net asset value, beginning of period | Net investment income(a) | Net gains (losses) on securities (both realized and unrealized) | Total from investment operations | Dividends from net investment income | Distributions from net realized gains | Total distributions | Net asset value, end of period | Total return(b) | Net assets, end of period (000’s omitted) | Ratio of expenses to average net assets with fee waivers and/or expenses absorbed | Ratio of expenses to average net assets without fee waivers and/or expenses absorbed | Ratio of net investment income to average net assets | Portfolio turnover(c) | |||||||||||||||||||||||||||||||||||||||||||
Class A |
| |||||||||||||||||||||||||||||||||||||||||||||||||||||||
Year ended 08/31/13 | $ | 33.40 | $ | 0.55 | $ | 7.47 | $ | 8.02 | $ | (0.51 | ) | $ | (0.84 | ) | $ | (1.35 | ) | $ | 40.07 | 24.83 | % | $ | 999,730 | 0.57 | %(d) | 0.57 | %(d) | 1.48 | %(d) | 18 | % | |||||||||||||||||||||||||
Year ended 08/31/12 | 29.89 | 0.42 | 3.61 | 4.03 | (0.52 | ) | — | (0.52 | ) | 33.40 | 13.66 | 730,648 | 0.60 | 0.60 | 1.34 | 27 | ||||||||||||||||||||||||||||||||||||||||
Year ended 08/31/11 | 25.26 | 0.39 | 4.65 | 5.04 | (0.41 | ) | — | (0.41 | ) | 29.89 | 19.91 | 639,478 | 0.56 | 0.56 | 1.26 | 22 | ||||||||||||||||||||||||||||||||||||||||
Two months ended 08/31/10 | 24.74 | 0.08 | 0.44 | 0.52 | — | — | — | 25.26 | 2.10 | 556,910 | 0.65 | (e) | 0.65 | (e) | 1.81 | (e) | 0 | |||||||||||||||||||||||||||||||||||||||
Year ended 06/30/10 | 20.14 | 0.30 | 4.56 | 4.86 | (0.26 | ) | — | (0.26 | ) | 24.74 | 24.08 | 552,673 | 0.64 | 0.64 | 1.17 | 24 | ||||||||||||||||||||||||||||||||||||||||
Year ended 06/30/09 | 33.39 | 0.37 | (9.39 | ) | (9.02 | ) | (0.46 | ) | (3.77 | ) | (4.23 | ) | 20.14 | (24.61 | ) | 486,937 | 0.75 | (f) | 0.75 | (f) | 1.62 | (f) | 39 | |||||||||||||||||||||||||||||||||
Class B |
| |||||||||||||||||||||||||||||||||||||||||||||||||||||||
Year ended 08/31/13 | 33.34 | 0.27 | 7.49 | 7.76 | (0.25 | ) | (0.84 | ) | (1.09 | ) | 40.01 | 23.90 | 22,925 | 1.32 | (d) | 1.32 | (d) | 0.73 | (d) | 18 | ||||||||||||||||||||||||||||||||||||
Year ended 08/31/12 | 29.70 | 0.18 | 3.61 | 3.79 | (0.15 | ) | — | (0.15 | ) | 33.34 | 12.82 | 42,131 | 1.35 | 1.35 | 0.59 | 27 | ||||||||||||||||||||||||||||||||||||||||
Year ended 08/31/11 | 25.05 | 0.16 | 4.60 | 4.76 | (0.11 | ) | — | (0.11 | ) | 29.70 | 18.98 | 77,702 | 1.31 | 1.31 | 0.51 | 22 | ||||||||||||||||||||||||||||||||||||||||
Two months ended 08/31/10 | 24.56 | 0.05 | 0.44 | 0.49 | — | — | — | 25.05 | 2.00 | 110,367 | 1.40 | (e) | 1.40 | (e) | 1.06 | (e) | 0 | |||||||||||||||||||||||||||||||||||||||
Year ended 06/30/10 | 20.08 | 0.10 | 4.54 | 4.64 | (0.16 | ) | — | (0.16 | ) | 24.56 | 23.09 | 118,559 | 1.39 | 1.39 | 0.42 | 24 | ||||||||||||||||||||||||||||||||||||||||
Year ended 06/30/09 | 33.02 | 0.20 | (9.22 | ) | (9.02 | ) | (0.15 | ) | (3.77 | ) | (3.92 | ) | 20.08 | (25.14 | ) | 155,328 | 1.50 | (f) | 1.50 | (f) | 0.87 | (f) | 39 | |||||||||||||||||||||||||||||||||
Class C |
| |||||||||||||||||||||||||||||||||||||||||||||||||||||||
Year ended 08/31/13 | 32.33 | 0.26 | 7.24 | 7.50 | (0.24 | ) | (0.84 | ) | (1.08 | ) | 38.75 | 23.88 | 141,986 | 1.32 | (d) | 1.32 | (d) | 0.73 | (d) | 18 | ||||||||||||||||||||||||||||||||||||
Year ended 08/31/12 | 28.81 | 0.18 | 3.49 | 3.67 | (0.15 | ) | — | (0.15 | ) | 32.33 | 12.80 | 77,691 | 1.35 | 1.35 | 0.59 | 27 | ||||||||||||||||||||||||||||||||||||||||
Year ended 08/31/11 | 24.29 | 0.16 | 4.47 | 4.63 | (0.11 | ) | — | (0.11 | ) | 28.81 | 19.04 | 67,788 | 1.31 | 1.31 | 0.51 | 22 | ||||||||||||||||||||||||||||||||||||||||
Two months ended 08/31/10 | 23.82 | 0.04 | 0.43 | 0.47 | — | — | — | 24.29 | 1.97 | 55,797 | 1.40 | (e) | 1.40 | (e) | 1.06 | (e) | 0 | |||||||||||||||||||||||||||||||||||||||
Year ended 06/30/10 | 19.49 | 0.10 | 4.42 | 4.52 | (0.19 | ) | — | (0.19 | ) | 23.82 | 23.15 | 56,462 | 1.39 | 1.39 | 0.42 | 24 | ||||||||||||||||||||||||||||||||||||||||
Year ended 06/30/09 | 32.33 | 0.19 | (9.06 | ) | (8.87 | ) | (0.20 | ) | (3.77 | ) | (3.97 | ) | 19.49 | (25.17 | ) | 51,534 | 1.50 | (f) | 1.50 | (f) | 0.87 | (f) | 39 | |||||||||||||||||||||||||||||||||
Class R |
| |||||||||||||||||||||||||||||||||||||||||||||||||||||||
Year ended 08/31/13 | 33.31 | 0.46 | 7.44 | 7.90 | (0.42 | ) | (0.84 | ) | (1.26 | ) | 39.95 | 24.48 | 29,320 | 0.82 | (d) | 0.82 | (d) | 1.23 | (d) | 18 | ||||||||||||||||||||||||||||||||||||
Year ended 08/31/12 | 29.77 | 0.35 | 3.59 | 3.94 | (0.40 | ) | — | (0.40 | ) | 33.31 | 13.36 | 8,924 | 0.85 | 0.85 | 1.09 | 27 | ||||||||||||||||||||||||||||||||||||||||
Year ended 08/31/11 | 25.14 | 0.31 | 4.63 | 4.94 | (0.31 | ) | — | (0.31 | ) | 29.77 | 19.62 | 1,176 | 0.81 | 0.81 | 1.01 | 22 | ||||||||||||||||||||||||||||||||||||||||
Two months ended 08/31/10 | 24.63 | 0.07 | 0.44 | 0.51 | — | — | — | 25.14 | 2.07 | 205 | 0.90 | (e) | 0.90 | (e) | 1.56 | (e) | 0 | |||||||||||||||||||||||||||||||||||||||
Year ended 06/30/10 | 20.10 | 0.23 | 4.56 | 4.79 | (0.26 | ) | — | (0.26 | ) | 24.63 | 23.78 | 208 | 0.89 | 0.89 | 0.92 | 24 | ||||||||||||||||||||||||||||||||||||||||
Year ended 06/30/09 | 33.36 | 0.30 | (9.35 | ) | (9.05 | ) | (0.44 | ) | (3.77 | ) | (4.21 | ) | 20.10 | (24.78 | ) | 73 | 1.00 | (f) | 1.00 | (f) | 1.37 | (f) | 39 | |||||||||||||||||||||||||||||||||
Class Y |
| |||||||||||||||||||||||||||||||||||||||||||||||||||||||
Year ended 08/31/13 | 33.64 | 0.65 | 7.52 | 8.17 | (0.59 | ) | (0.84 | ) | (1.43 | ) | 40.38 | 25.16 | 481,948 | 0.32 | (d) | 0.32 | (d) | 1.73 | (d) | 18 | ||||||||||||||||||||||||||||||||||||
Year ended 08/31/12 | 30.13 | 0.50 | 3.63 | 4.13 | (0.62 | ) | — | (0.62 | ) | 33.64 | 13.94 | 309,645 | 0.35 | 0.35 | 1.59 | 27 | ||||||||||||||||||||||||||||||||||||||||
Year ended 08/31/11 | 25.47 | 0.47 | 4.68 | 5.15 | (0.49 | ) | — | (0.49 | ) | 30.13 | 20.19 | 178,056 | 0.31 | 0.31 | 1.51 | 22 | ||||||||||||||||||||||||||||||||||||||||
Two months ended 08/31/10 | 24.94 | 0.09 | 0.44 | 0.53 | — | — | — | 25.47 | 2.12 | 155,551 | 0.40 | (e) | 0.40 | (e) | 2.06 | (e) | 0 | |||||||||||||||||||||||||||||||||||||||
Year ended 06/30/10 | 20.27 | 0.36 | 4.59 | 4.95 | (0.28 | ) | — | (0.28 | ) | 24.94 | 24.39 | 151,901 | 0.39 | 0.39 | 1.42 | 24 | ||||||||||||||||||||||||||||||||||||||||
Year ended 06/30/09 | 33.62 | 0.43 | (9.46 | ) | (9.03 | ) | (0.55 | ) | (3.77 | ) | (4.32 | ) | 20.27 | (24.41 | ) | 148,051 | 0.50 | (f) | 0.50 | (f) | 1.87 | (f) | 39 | |||||||||||||||||||||||||||||||||
Class R6 |
| |||||||||||||||||||||||||||||||||||||||||||||||||||||||
Year ended 08/31/13(g) | 34.93 | 0.62 | 6.27 | 6.89 | (0.59 | ) | (0.84 | ) | (1.43 | ) | 40.39 | 20.58 | 12 | 0.27 | (d) | 0.27 | (d) | 1.78 | (d) | 18 | ||||||||||||||||||||||||||||||||||||
| (a) | Calculated using average shares outstanding. |
| (b) | Includes adjustments in accordance with accounting principles generally accepted in the United States of America and as such, the net asset value for financial reporting purposes and the returns based upon those net asset values may differ from the net asset value and returns for shareholder transactions. Total returns are not annualized for periods less than one year, if applicable. |
| (c) | Portfolio turnover is calculated at the fund level and is not annualized for periods less than one year, if applicable. |
| (d) | Ratios are annualized and based on average daily net assets (000’s omitted) of $856,715, $32,282, $101,104, $17,979, $385,209 and $11 for Class A, Class B, Class C, Class R, Class Y and Class R6 shares, respectively. |
| (e) | Annualized. |
| (f) | The ratios reflect the rebate of certain Fund expenses in connection with investments in a Morgan Stanley affiliate during the period. The effect of the rebate on the ratios is less than 0.005%. |
| (g) | Commencement date of September 24, 2012. |
26 Invesco Equally-Weighted S&P 500 Fund
Report of Independent Registered Public Accounting Firm
To the Board of Trustees of AIM Counselor Series Trust (Invesco Counselor Series Trust)
and Shareholders of Invesco Equally-Weighted S&P 500 Fund:
In our opinion, the accompanying statement of assets and liabilities, including the schedule of investments, and the related statements of operations and of changes in net assets and the financial highlights present fairly, in all material respects, the financial position of Invesco Equally-Weighted S&P 500 Fund (one of the funds constituting AIM Counselor Series Trust (Invesco Counselor Series Trust), hereafter referred to as the “Fund”) at August 31, 2013, the results of its operations for the year then ended, the changes in its net assets for each of the two years in the period then ended and the financial highlights for each of the three years in the period then ended, the two month period ended August 31, 2010, and the year ended June 30, 2010, in conformity with accounting principles generally accepted in the United States of America. These financial statements and financial highlights (hereafter referred to as “financial statements”) are the responsibility of the Fund’s management; our responsibility is to express an opinion on these financial statements based on our audits. We conducted our audits of these financial statements in accordance with the standards of the Public Company Accounting Oversight Board (United States). Those standards require that we plan and perform the audit to obtain reasonable assurance about whether the financial statements are free of material misstatement. An audit includes examining, on a test basis, evidence supporting the amounts and disclosures in the financial statements, assessing the accounting principles used and significant estimates made by management, and evaluating the overall financial statement presentation. We believe that our audits, which included confirmation of securities at August 31, 2013 by correspondence with the custodian and brokers, provide a reasonable basis for our opinion. The financial highlights of the Fund for the period ended June 30, 2009 was audited by another independent registered public accounting firm whose report dated August 24, 2009 expressed an unqualified opinion on such financial statement.
PRICEWATERHOUSECOOPERS LLP
October 25, 2013
Houston, Texas
27 Invesco Equally-Weighted S&P 500 Fund
Calculating your ongoing Fund expenses
Example
As a shareholder of the Fund, you incur two types of costs: (1) transaction costs, which may include sales charges (loads) on purchase payments or contingent deferred sales charges on redemptions, if any; and (2) ongoing costs, including management fees, distribution and/or service (12b-1) fees, and other Fund expenses. This example is intended to help you understand your ongoing costs (in dollars) of investing in the Fund and to compare these costs with ongoing costs of investing in other mutual funds. The example is based on an investment of $1,000 invested at the beginning of the period and held for the entire period March 1, 2013 through August 31, 2013.
Actual expenses
The table below provides information about actual account values and actual expenses. You may use the information in this table, together with the amount you invested, to estimate the expenses that you paid over the period. Simply divide your account value by $1,000 (for example, an $8,600 account value divided by $1,000 = 8.6), then multiply the result by the number in the table under the heading entitled “Actual Expenses Paid During Period” to estimate the expenses you paid on your account during this period.
Hypothetical example for comparison purposes
The table below also provides information about hypothetical account values and hypothetical expenses based on the Fund’s actual expense ratio and an assumed rate of return of 5% per year before expenses, which is not the Fund’s actual return.
The hypothetical account values and expenses may not be used to estimate the actual ending account balance or expenses you paid for the period. You may use this information to compare the ongoing costs of investing in the Fund and other funds. To do so, compare this 5% hypothetical example with the 5% hypothetical examples that appear in the shareholder reports of the other funds.
Please note that the expenses shown in the table are meant to highlight your ongoing costs only and do not reflect any transaction costs, such as sales charges (loads) on purchase payments or contingent deferred sales charges on redemptions, if any. Therefore, the hypothetical information is useful in comparing ongoing costs only, and will not help you determine the relative total costs of owning different funds. In addition, if these transaction costs were included, your costs would have been higher.
| Class | Beginning Account Value (03/01/13) | ACTUAL | HYPOTHETICAL (5% annual return before | Annualized Expense Ratio | ||||||||||||||||||||
| Ending Account Value (08/31/13)1 | Expenses Paid During Period2 | Ending Account Value (08/31/13) | Expenses Paid During Period 2 | |||||||||||||||||||||
| A | $ | 1,000.00 | $ | 1,102.00 | $ | 3.01 | $ | 1,022.27 | $ | 2.90 | 0.57 | % | ||||||||||||
| B | 1,000.00 | 1,098.00 | 6.96 | 1,018.50 | 6.70 | 1.32 | ||||||||||||||||||
| C | 1,000.00 | 1,097.70 | 6.96 | 1,018.50 | 6.70 | 1.32 | ||||||||||||||||||
| R | 1,000.00 | 1,100.50 | 4.33 | 1,021.01 | 4.17 | 0.82 | ||||||||||||||||||
| Y | 1,000.00 | 1,103.60 | 1.69 | 1,023.53 | 1.63 | 0.32 | ||||||||||||||||||
| R6 | 1,000.00 | 1,103.50 | 1.43 | 1,023.78 | 1.37 | 0.27 | ||||||||||||||||||
| 1 | The actual ending account value is based on the actual total return of the Fund for the period March 1, 2013 through August 31, 2013, after actual expenses and will differ from the hypothetical ending account value which is based on the Fund’s expense ratio and a hypothetical annual return of 5% before expenses. |
| 2 | Expenses are equal to the Fund’s annualized expense ratio as indicated above multiplied by the average account value over the period, multiplied by 184/365 to reflect the most recent fiscal half year. |
28 Invesco Equally-Weighted S&P 500 Fund
Approval of Investment Advisory and Sub-Advisory Contracts
The Board of Trustees (the Board) of AIM Counselor Series Trust (Invesco Counselor Series Trust) is required under the Investment Company Act of 1940, as amended, to approve annually the renewal of Invesco Equally-Weighted S&P 500 Fund’s (the Fund) investment advisory agreement with Invesco Advisers, Inc. (Invesco Advisers) and the Master Intergroup Sub-Advisory Contract for Mutual Funds (the sub-advisory contracts) with Invesco Asset Management Deutschland GmbH, Invesco Asset Management Limited, Invesco Asset Management (Japan) Limited, Invesco Australia Limited, Invesco Hong Kong Limited, Invesco Senior Secured Management, Inc. and Invesco Canada Ltd. (collectively, the Affiliated Sub-Advisers). During contract renewal meetings held on June 17-19, 2013, the Board as a whole, and the disinterested or “independent” Trustees, who comprise over 75% of the Board, voting separately, approved the continuance of the Fund’s investment advisory agreement and the sub-advisory contracts for another year, effective July 1, 2013. The Board determined that the continuation of the Fund’s investment advisory agreement and the sub-advisory contracts are in the best interests of the Fund and its shareholders and the compensation payable to Invesco Advisers and the Affiliated Sub-Advisers under the agreements is fair and reasonable.
The Board’s Fund Evaluation Process
The Board’s Investments Committee has established three Sub-Committees, each of which is primarily responsible for overseeing the management of a number of the funds advised by Invesco Advisers (the Invesco Funds). The Sub-Committees meet throughout the year to review the performance of their assigned Invesco Funds, including reviewing materials prepared under the direction of the independent Senior Officer, an officer of the Invesco Funds who reports directly to the independent Trustees. Over the course of each year, the Sub-Committees meet with portfolio managers for their assigned Invesco Funds and other members of management to review the performance, investment objective(s), policies, strategies, limitations and investment risks of these funds. The Sub-Committees meet regularly and at designated contract renewal meetings each year to conduct a review of the performance, fees, expenses and other matters related to their assigned Invesco Funds. Each Sub-Committee recommends to the Investments Committee, which in turn recommends to the full Board, whether and on what terms to approve the continuance of each Invesco Fund’s investment advisory agreement and sub-advisory contracts for another year.
During the contract renewal process, the Trustees receive comparative performance and fee data regarding the Invesco Funds prepared by Invesco Advisers and Lipper Inc. (Lipper), an independent provider of investment company
data. The Trustees also receive an independent written evaluation from the Senior Officer. The Senior Officer’s evaluation is prepared as part of his responsibility to manage the process by which the Invesco Funds’ proposed management fees are negotiated during the annual contract renewal process to ensure they are negotiated in a manner that is at arms’ length and reasonable. The independent Trustees are assisted in their annual evaluation of the Fund’s investment advisory agreement by the Senior Officer and by independent legal counsel. In addition to meetings with Invesco Advisers and fund counsel, the independent Trustees also discuss the continuance of the investment advisory agreement and sub-advisory contracts in separate sessions with the Senior Officer and with independent legal counsel.
In evaluating the fairness and reasonableness of compensation under the Fund’s investment advisory agreement and sub-advisory contracts, the Board considered, among other things, the factors discussed below. The Trustees recognized that the advisory fee rates for the Invesco Funds are, in many cases, the result of years of review and negotiation between the Trustees and Invesco Advisers as well as advisory fees previously approved by different predecessor boards. The Trustees’ deliberations and conclusions in a particular year may be based in part on their deliberations and conclusions regarding these same arrangements throughout the year and in prior years. The Trustees’ review and conclusions are based on the comprehensive consideration of all information presented to them and are not the result of any single determinative factor. Moreover, one Trustee may have weighed a particular piece of information or factor differently than another Trustee.
The discussion below serves as the Senior Officer’s independent written evaluation with respect to the Fund’s investment advisory agreement as well as a discussion of the material factors and related conclusions that formed the basis for the Board’s approval of the Fund’s investment advisory agreement and sub-advisory contracts. Unless otherwise stated, this information is current as of June 19, 2013, and may not reflect consideration of factors that became known to the Board after that date, including, for example, changes to the Fund’s performance, advisory fees, expense limitations and/or fee waivers.
Factors and Conclusions and Summary of Independent Written Fee Evaluation
| A. | Nature, Extent and Quality of Services Provided by Invesco Advisers and the Affiliated Sub-Advisers |
The Board reviewed the advisory services provided to the Fund by Invesco Advisers under the Fund’s investment advisory agreement, the performance of Invesco Advisers in providing
these services, and the credentials and experience of the officers and employees of Invesco Advisers who provide these services, including the Fund’s portfolio manager or managers, with whom the Sub-Committees met during the year. The Board’s review of the qualifications of Invesco Advisers to provide advisory services included the Board’s consideration of Invesco Advisers’ investment process oversight, independent credit analysis and investment risk management.
In determining whether to continue the Fund’s investment advisory agreement, the Board considered the benefits of reapproving an existing relationship and the greater uncertainty that may be associated with entering into a new relationship. The Board also considered non-advisory services that Invesco Advisers and its affiliates provide to the Invesco Funds such as various back office support functions, equity and fixed income trading operations, internal audit, distribution and legal and compliance. The Board concluded that the nature, extent and quality of the services provided to the Fund by Invesco Advisers are appropriate and satisfactory and consistent with the terms of the Fund’s investment advisory agreement.
The Board reviewed the services that may be provided by the Affiliated Sub-Advisers under the sub-advisory contracts and the credentials and experience of the officers and employees of the Affiliated Sub-Advisers who provide these services. The Board noted that the Affiliated Sub-Advisers have offices and personnel that are located in financial centers around the world. As a result, the Affiliated Sub-Advisers can provide research and investment analysis on the markets and economies of various countries in which the Fund may invest, make recommendations regarding securities and assist with security trades. The Board concluded that the sub-advisory contracts benefit the Fund and its shareholders by permitting Invesco Advisers to use the resources and talents of the Affiliated Sub-Advisers in managing the Fund. The Board concluded that the nature, extent and quality of the services that may be provided by the Affiliated Sub-Advisers are appropriate and satisfactory and consistent with the terms of the Fund’s sub-advisory contracts.
| B. | Fund Performance |
The Board considered Fund performance as a relevant factor in considering whether to approve the investment advisory agreement. The Board did not view Fund performance as a relevant factor in considering whether to approve the sub-advisory contracts for the Fund, as no Affiliated Sub-Adviser currently manages assets of the Fund.
The Board compared the Fund’s performance during the past one, three and five calendar years to the performance of funds in the Lipper performance universe and against the Lipper Multi-Cap Core Funds Index. The Board noted
29 Invesco Equally-Weighted S&P 500 Fund
that performance of Class A shares of the Fund was in the second quintile of the performance universe for the one year period and the first quintile for the three and five year periods (the first quintile being the best performing funds and the fifth quintile being the worst performing funds). The Board noted that performance of Class A shares of the Fund was above the performance of the Index for the one, three and five year periods. The Trustees also reviewed more recent Fund performance and this review did not change their conclusions.
| C. | Advisory and Sub-Advisory Fees |
The Board compared the Fund’s contractual management fee rate to the contractual management fee rates of funds in the Fund’s Lipper expense group at a common asset level. The Board noted that the contractual management fee rate for Class A shares of the Fund was below the median contractual management fee rate of funds in the expense group. The Board noted that the term “contractual management fee” may include both advisory and certain administrative services fees and that Invesco does not charge the Invesco Funds for the administrative services included in the term as defined by Lipper. The Board also reviewed the methodology used by Lipper in providing expense group information, which includes using each fund’s contractual management fee schedule (including any applicable breakpoints) as reported in the most recent prospectus or statement of additional information for each fund in the expense group.
The Board also compared the Fund’s effective advisory fee rate (the advisory fee rate after advisory fee waivers and before other expense limitations/waivers) to the effective advisory fee rates of other mutual funds advised by Invesco Advisers and its affiliates with investment strategies comparable to those of the Fund. The Board noted that the Fund’s effective advisory fee rate was the same as the effective advisory fee rate of one mutual fund with comparable investment strategies.
Other than the mutual fund described above, the Board noted that Invesco Advisers and its affiliates do not advise other funds or client accounts with investment strategies comparable to those of the Fund.
The Board also considered the services that may be provided by the Affiliated Sub-Advisers pursuant to the sub-advisory contracts, as well as the fees payable by Invesco Advisers to the Affiliated Sub-Advisers pursuant to the sub-advisory contracts. The Board also noted that the sub-advisory fees are not paid directly by the Fund, but rather, are payable by Invesco Advisers to the Affiliated Sub-Advisers.
Based upon the information and considerations described above, the Board concluded that the compensation payable to Invesco Advisers and the Affiliated Sub-Advisers is fair and reasonable.
| D. | Economies of Scale and Breakpoints |
The Board considered the extent to which there are economies of scale in the provision of
advisory services to the Fund. The Board also considered whether the Fund benefits from economies of scale through contractual breakpoints in the Fund’s advisory fee schedule and was assisted in this review by a report from the Senior Officer. The Board also noted that the Fund shares directly in economies of scale through lower fees charged by third party service providers based on the combined size of the Invesco Funds and other clients advised by Invesco Advisers.
| E. | Profitability and Financial Resources |
The Board reviewed information from Invesco Advisers concerning the costs of the advisory and other services that Invesco Advisers and its affiliates provide to the Fund and the profitability of Invesco Advisers and its affiliates in providing these services for the year ended December 31, 2012. The Board received information from Invesco Advisers about the methodology used to prepare the profitability information. The Board considered the profitability of Invesco Advisers in managing the Fund and the Invesco Funds. The Board noted that Invesco Advisers continues to operate at a net profit from services Invesco Advisers and its subsidiaries provide to the Invesco Funds. The Board noted that Invesco Advisers and its subsidiaries did not make a profit from managing the Fund as a result of expenses. The Board received and accepted information from Invesco Advisers demonstrating that Invesco Advisers and each Affiliated Sub-Adviser are financially sound and have the resources necessary to perform their obligations under the investment advisory agreement and sub-advisory contracts.
| F. | Collateral Benefits to Invesco Advisers and its Affiliates |
The Board considered various other benefits received by Invesco Advisers and its affiliates from the relationship with the Fund, including the fees received for their provision of transfer agency and distribution services to the Fund. The Board considered comparative information regarding fees charged for these services, including information provided by Lipper and other independent sources. The Board considered the performance of Invesco Advisers and its affiliates in providing these services and the organizational structure employed to provide these services. The Board also considered that these services are provided to the Fund pursuant to written contracts that are reviewed and approved on an annual basis by the Board; that the services are required for the operation of the Fund; that Invesco Advisers and its affiliates can provide services, the nature and quality of which are at least equal to those provided by others offering the same or similar services; and that the fees for such services are fair and reasonable in light of the usual and customary charges by others for services of the same nature and quality.
The Board considered the benefits realized by Invesco Advisers and the Affiliated Sub-Advisers as a result of portfolio brokerage transactions executed through “soft dollar” arrangements.
The Board noted that soft dollar arrangements shift the payment obligation for research services from Invesco Advisers and the Affiliated Sub-Advisers to the Invesco Funds and that the research received may be used with other clients of Invesco Advisers and may reduce Invesco Advisers’ and the Affiliated Sub-Advisers’ expenses. The Board also considered periodic reports from the Chief Compliance Officer of the Invesco Funds demonstrating that these arrangements are consistent with regulatory requirements. The Board did not deem the soft dollar arrangements to be inappropriate.
The Board considered that the Fund’s uninvested cash and cash collateral from any securities lending arrangements may be invested in money market funds advised by Invesco Advisers pursuant to procedures approved by the Board. The Board noted that Invesco Advisers receives advisory fees from these affiliated money market funds attributable to such investments, although Invesco Advisers has contractually agreed to waive through varying periods the advisory fees payable by the Invesco Funds. The waiver is in an amount equal to 100% of the net advisory fee Invesco Advisers receives from the affiliated money market funds with respect to the Fund’s investment in the affiliated money market funds of uninvested cash, but not cash collateral. The Board concluded that the Fund’s investment of uninvested cash and cash collateral from any securities lending arrangements in the affiliated money market funds is in the best interests of the Fund and its shareholders.
The Board also considered use of an affiliated broker to execute certain trades for the Fund to among other things, control information leakage, and were advised that such trades are executed in compliance with rules under the Investment Company Act of 1940, as amended.
30 Invesco Equally-Weighted S&P 500 Fund
Tax Information
Form 1099-DIV, Form 1042-S and other year-end tax information provide shareholders with actual calendar year amounts that should be included in their tax returns. Shareholders should consult their tax advisors.
The following distribution information is being provided as required by the Internal Revenue Code or to meet a specific state’s requirement.
The Fund designates the following amounts or, if subsequently determined to be different, the maximum amount allowable for its fiscal year ended August 31, 2013:
Federal and State Income Tax | ||||
Long-Term Capital Gain Distributions | $ | 27,102,884 | ||
Qualified Dividend Income* | 85.55 | % | ||
Corporate Dividends Received Deduction* | 83.75 | % | ||
| * | The above percentages are based on ordinary income dividends paid to shareholders during the Fund’s fiscal year. |
31 Invesco Equally-Weighted S&P 500 Fund
Trustees and Officers
The address of each trustee and officer is AIM Counselor Series Trust (Invesco Counselor Series Trust) (the “Trust”), 11 Greenway Plaza, Suite 1000, Houston, Texas 77046-1173. The trustees serve for the life of the Trust, subject to their earlier death, incapacitation, resignation, retirement or removal as more specifically provided in the Trust’s organizational documents. Each officer serves for a one year term or until their successors are elected and qualified. Column two below includes length of time served with predecessor entities, if any.
Name, Year of Birth and Position(s) Held with the Trust | Trustee and/ or Officer Since | Principal Occupation(s) During Past 5 Years | Number of Funds in Fund Complex Overseen by Trustee | Other Directorship(s) Held by Trustee During Past 5 Years | ||||
| Interested Persons | ||||||||
| Martin L. Flanagan1 — 1960 Trustee | 2007 | Executive Director, Chief Executive Officer and President, Invesco Ltd. (ultimate parent of Invesco and a global investment management firm); Advisor to the Board, Invesco Advisers, Inc. (formerly known as Invesco Institutional (N.A.), Inc.); Trustee, The Invesco Funds; Vice Chair, Investment Company Institute; and Member of Executive Board, SMU Cox School of Business
Formerly: Chairman and Chief Executive Officer, Invesco Advisers, Inc. (registered investment adviser); Director, Chairman, Chief Executive Officer and President, IVZ Inc. (holding company), INVESCO Group Services, Inc. (service provider) and Invesco North American Holdings, Inc. (holding company); Director, Chief Executive Officer and President, Invesco Holding Company Limited (parent of Invesco and a global investment management firm); Director, Invesco Ltd.; Chairman, Investment Company Institute and President, Co-Chief Executive Officer, Co-President, Chief Operating Officer and Chief Financial Officer, Franklin Resources, Inc. (global investment management organization) | 117 | None | ||||
| Philip A. Taylor2 — 1954 Trustee, President and Principal Executive Officer | 2006 | Head of North American Retail and Senior Managing Director, Invesco Ltd.; Director, Co-Chairman, Co-President and Co-Chief Executive Officer, Invesco Advisers, Inc. (formerly known as Invesco Institutional (N.A.), Inc.) (registered investment adviser); Director, Chairman, Chief Executive Officer and President, Invesco Management Group, Inc. (formerly known as Invesco Aim Management Group, Inc.) (financial services holding company); Director and President, INVESCO Funds Group, Inc. (registered investment adviser and registered transfer agent); Director and Chairman, Invesco Investment Services, Inc. (formerly known as Invesco Aim Investment Services, Inc.) (registered transfer agent) and IVZ Distributors, Inc. (formerly known as INVESCO Distributors, Inc.) (registered broker dealer); Director, President and Chairman, Invesco Inc. (holding company) and Invesco Canada Holdings Inc. (holding company); Chief Executive Officer, Invesco Corporate Class Inc. (corporate mutual fund company) and Invesco Canada Fund Inc. (corporate mutual fund company); Director, Chairman and Chief Executive Officer, Invesco Canada Ltd. (formerly known as Invesco Trimark Ltd./Invesco Trimark Ltèe) (registered investment adviser and registered transfer agent); Trustee, President and Principal Executive Officer, The Invesco Funds (other than AIM Treasurer’s Series Trust (Invesco Treasurer’s Series Trust) and Short-Term Investments Trust); Trustee and Executive Vice President, The Invesco Funds (AIM Treasurer’s Series Trust (Invesco Treasurer’s Series Trust) and Short-Term Investments Trust only); Director, Invesco Investment Advisers LLC (formerly known as Van Kampen Asset Management); Director, Chief Executive Officer and President, Van Kampen Exchange Corp.
Formerly: Director and Chairman, Van Kampen Investor Services Inc.: Director, Chief Executive Officer and President, 1371 Preferred Inc. (holding company); and Van Kampen Investments Inc.; Director and President, AIM GP Canada Inc. (general partner for limited partnerships); and Van Kampen Advisors, Inc.; Director and Chief Executive Officer, Invesco Trimark Dealer Inc. (registered broker dealer); Director, Invesco Distributors, Inc. (formerly known as Invesco Aim Distributors, Inc.) (registered broker dealer); Manager, Invesco PowerShares Capital Management LLC; Director, Chief Executive Officer and President, Invesco Advisers, Inc.; Director, Chairman, Chief Executive Officer and President, Invesco Aim Capital Management, Inc.; President, Invesco Trimark Dealer Inc. and Invesco Trimark Ltd./Invesco Trimark Ltèe; Director and President, AIM Trimark Corporate Class Inc. and AIM Trimark Canada Fund Inc.; Senior Managing Director, Invesco Holding Company Limited; Trustee and Executive Vice President, Tax-Free Investments Trust; Director and Chairman, Fund Management Company (former registered broker dealer); President and Principal Executive Officer, The Invesco Funds (AIM Treasurer’s Series Trust (Invesco Treasurer’s Series Trust), Short-Term Investments Trust and Tax-Free Investments Trust only); President, AIM Trimark Global Fund Inc. and AIM Trimark Canada Fund Inc. | 117 | None | ||||
Wayne W. Whalen3 — 1939 Trustee | 2010 | Of Counsel, and prior to 2010, partner in the law firm of Skadden, Arps, Slate, Meagher & Flom LLP, legal counsel to certain funds in the Fund Complex
| 130 | Director of the Mutual Fund Directors Forum, a nonprofit membership organization for investment directors; Chairman and Director of the Abraham Lincoln Presidential Library Foundation; and Director of the Stevenson Center for Democracy |
| 1 | Mr. Flanagan is considered an interested person of the Trust because he is an officer of the adviser to the Trust, and an officer and a director of Invesco Ltd., ultimate parent of the adviser to the Trust. |
| 2 | Mr. Taylor is considered an interested person of the Trust because he is an officer and a director of the adviser to, and a director of the principal underwriter of, the Trust. |
| 3 | Mr. Whalen is considered an “interested person” (within the meaning of Section 2(a)(19) of the 1940 Act) of certain Funds in the Invesco Fund Complex because he and his firm currently provide legal services as legal counsel to such Funds. |
T-1 Invesco Equally-Weighted S&P 500 Fund
Trustees and Officers—(continued)
Name, Year of Birth and Position(s) Held with the Trust | Trustee and/ or Officer Since | Principal Occupation(s) During Past 5 Years | Number of Funds in Fund Complex Overseen by Trustee | Other Directorship(s) Held by Trustee During Past 5 Years | ||||
| Independent Trustees | ||||||||
Bruce L. Crockett — 1944 Trustee and Chair | 2003 | Chairman, Crockett Technologies Associates (technology consulting company)
Formerly: Director, Captaris (unified messaging provider); Director, President and Chief Executive Officer COMSAT Corporation; and Chairman, Board of Governors of INTELSAT (international communications company) | 117 | ACE Limited (insurance company); Investment Company Institute | ||||
David C. Arch — 1945 Trustee | 2010 | Chairman and Chief Executive Officer of Blistex Inc., (consumer health care products manufacturer)
Formerly: Member of the Heartland Alliance Advisory Board, a nonprofit organization serving human needs based in Chicago | 130 | Board member of the Illinois Manufacturers’ Association; Member of the Board of Visitors, Institute for the Humanities, University of Michigan | ||||
Frank S. Bayley — 1939 Trustee | 2003 | Retired
Formerly: Director, Badgley Funds, Inc. (registered investment company) (2 portfolios) and General Partner and Of Counsel, law firm of Baker & McKenzie, LLP | 117 | Director and Chairman, C.D. Stimson Company (a real estate investment company); Trustee and Overseer, The Curtis Institute of Music | ||||
James T. Bunch — 1942 Trustee | 2000 | Managing Member, Grumman Hill Group LLC (family office private equity management)
Formerly: Founder, Green, Manning & Bunch Ltd. (investment banking firm)(1988-2010); Executive Committee, United States Golf Association; and Director, Policy Studies, Inc. and Van Gilder Insurance Corporation | 117 | Chairman, Board of Governors, Western Golf Association; Chairman-elect, Evans Scholars Foundation; and Director, Denver Film Society | ||||
Rodney F. Dammeyer — 1940 Trustee | 2010 | Chairman of CAC, LLC, (private company offering capital investment and management advisory services)
Formerly: Prior to 2001, Managing Partner at Equity Group Corporate Investments; Prior to 1995, Chief Executive Officer of Itel Corporation (formerly Anixter International); Prior to 1985, experience includes Senior Vice President and Chief Financial Officer of Household International, Inc., Executive Vice President and Chief Financial Officer of Northwest Industries, Inc. and Partner of Arthur Andersen & Co.; From 1987 to 2010, Director/Trustee of investment companies in the Van Kampen Funds complex | 117 | Director of Quidel Corporation and Stericycle, Inc.; Prior to May 2008, Trustee of The Scripps Research Institute; Prior to February 2008, Director of Ventana Medical Systems, Inc. | ||||
Albert R. Dowden — 1941 Trustee | 2003 | Director of a number of public and private business corporations, including the Boss Group, Ltd. (private investment and management); Reich & Tang Funds (5 portfolios) (registered investment company); and Homeowners of America Holding Corporation/ Homeowners of America Insurance Company (property casualty company)
Formerly: Director, Continental Energy Services, LLC (oil and gas pipeline service); Director, CompuDyne Corporation (provider of product and services to the public security market) and Director, Annuity and Life Re (Holdings), Ltd. (reinsurance company); Director, President and Chief Executive Officer, Volvo Group North America, Inc.; Senior Vice President, AB Volvo; Director of various public and private corporations; Chairman, DHJ Media, Inc.; Director Magellan Insurance Company; and Director, The Hertz Corporation, Genmar Corporation (boat manufacturer), National Media Corporation; Advisory Board of Rotary Power International (designer, manufacturer, and seller of rotary power engines); and Chairman, Cortland Trust, Inc. (registered investment company) | 117 | Director of Nature’s Sunshine Products, Inc. | ||||
Jack M. Fields — 1952 Trustee | 2003 | Chief Executive Officer, Twenty First Century Group, Inc. (government affairs company); Owner and Chief Executive Officer, Dos Angeles Ranch, L.P. (cattle, hunting, corporate entertainment); and Discovery Global Education Fund (non-profit)
Formerly: Chief Executive Officer, Texana Timber LP (sustainable forestry company); Director of Cross Timbers Quail Research Ranch (non-profit); and member of the U.S. House of Representatives | 117 | Insperity, Inc. (formerly known as Administaff) | ||||
Prema Mathai-Davis — 1950 Trustee | 2003 | Retired
Formerly: Chief Executive Officer, YWCA of the U.S.A. | 117 | None | ||||
Larry Soll — 1942 Trustee | 1997 | Retired
Formerly: Chairman, Chief Executive Officer and President, Synergen Corp. (a biotechnology company) | 117 | None | ||||
Hugo F. Sonnenschein — 1940 Trustee | 2010 | Distinguished Service Professor and President Emeritus of the University of Chicago and the Adam Smith Distinguished Service Professor in the Department of Economics at the University of Chicago
Formerly: President of the University of Chicago | 130 | Trustee of the University of Rochester and a member of its investment committee. Member of the National Academy of Sciences, the American Philosophical Society and a fellow of the American Academy of Arts and Sciences |
T-2 Invesco Equally-Weighted S&P 500 Fund
Trustees and Officers—(continued)
Name, Year of Birth and Position(s) Held with the Trust | Trustee and/ or Officer Since | Principal Occupation(s) During Past 5 Years | Number of Funds in Fund Complex Overseen by Trustee | Other Directorship(s) Held by Trustee During Past 5 Years | ||||
| Independent Trustees—(continued) | ||||||||
Raymond Stickel, Jr. — 1944 Trustee | 2005 | Retired
Formerly: Director, Mainstay VP Series Funds, Inc. (25 portfolios) and Partner, Deloitte & Touche | 117 | None | ||||
| Other Officers | ||||||||
| Russell C. Burk — 1958 Senior Vice President and Senior Officer | 2005 | Senior Vice President and Senior Officer, The Invesco Funds | N/A | N/A | ||||
| John M. Zerr — 1962 Senior Vice President, Chief Legal Officer and Secretary | 2006 | Director, Senior Vice President, Secretary and General Counsel, Invesco Management Group, Inc. (formerly known as Invesco Aim Management Group, Inc.) and Van Kampen Exchange Corp.; Senior Vice President, Invesco Advisers, Inc. (formerly known as Invesco Institutional (N.A.), Inc.) (registered investment adviser); Senior Vice President and Secretary, Invesco Distributors, Inc. (formerly known as Invesco Aim Distributors, Inc.); Director, Vice President and Secretary, Invesco Investment Services, Inc. (formerly known as Invesco Aim Investment Services, Inc.) and IVZ Distributors, Inc. (formerly known as INVESCO Distributors, Inc.); Director and Vice President, INVESCO Funds Group, Inc.; Senior Vice President, Chief Legal Officer and Secretary, The Invesco Funds; Manager, Invesco PowerShares Capital Management LLC; Director, Secretary and General Counsel, Invesco Investment Advisers LLC (formerly known as Van Kampen Asset Management); Secretary and General Counsel, Invesco Capital Markets, Inc. (formerly known as Van Kampen Funds Inc.) and Chief Legal Officer, PowerShares Exchange-Traded Fund Trust, PowerShares Exchange-Traded Fund Trust II, PowerShares India Exchange-Traded Fund Trust and PowerShares Actively Managed Exchange-Traded Fund Trust
Formerly: Director and Vice President, Van Kampen Advisors Inc.; Director, Vice President, Secretary and General Counsel, Van Kampen Investor Services Inc.; Director, Invesco Distributors, Inc. (formerly known as Invesco Aim Distributors, Inc.); Director, Senior Vice President, General Counsel and Secretary, Invesco Aim Advisers, Inc. and Van Kampen Investments Inc.; Director, Vice President and Secretary, Fund Management Company; Director, Senior Vice President, Secretary, General Counsel and Vice President, Invesco Aim Capital Management, Inc.; Chief Operating Officer and General Counsel, Liberty Ridge Capital, Inc. (an investment adviser); Vice President and Secretary, PBHG Funds (an investment company) and PBHG Insurance Series Fund (an investment company); Chief Operating Officer, General Counsel and Secretary, Old Mutual Investment Partners (a broker-dealer); General Counsel and Secretary, Old Mutual Fund Services (an administrator) and Old Mutual Shareholder Services (a shareholder servicing center); Executive Vice President, General Counsel and Secretary, Old Mutual Capital, Inc. (an investment adviser); and Vice President and Secretary, Old Mutual Advisors Funds (an investment company) | N/A | N/A | ||||
| Karen Dunn Kelley — 1960 Vice President | 2003 | Head of Invesco’s World Wide Fixed Income and Cash Management Group; Director, Co-President, Co-Chief Executive Officer, and Co-Chairman, Invesco Advisers, Inc. (formerly known as Invesco Institutional (N.A.), Inc.) (registered investment adviser); Chairman, Invesco Senior Secured Management, Inc.; Senior Vice President, Invesco Management Group, Inc. (formerly known as Invesco Aim Management Group, Inc.); Executive Vice President, Invesco Distributors, Inc. (formerly known as Invesco Aim Distributors, Inc.); Director, Invesco Mortgage Capital Inc., and Invesco Management Company Limited; Director and President, INVESCO Asset Management (Bermuda) Ltd., Vice President, The Invesco Funds (other than AIM Treasurer’s Series Trust (Invesco Treasurer’s Series Trust) and Short-Term Investments Trust); and President and Principal Executive Officer, The Invesco Funds (AIM Treasurer’s Series Trust (Invesco Treasurer’s Series Trust) and Short-Term Investments Trust only)
Formerly: Director, INVESCO Global Asset Management Limited and INVESCO Management S.A.; Senior Vice President, Van Kampen Investments Inc. and Invesco Advisers, Inc. (formerly known as Invesco Institutional (N.A.), Inc.) (registered investment adviser); Vice President, Invesco Advisers, Inc. (formerly known as Invesco Institutional (N.A.), Inc.); Director of Cash Management and Senior Vice President, Invesco Advisers, Inc. and Invesco Aim Capital Management, Inc.; President and Principal Executive Officer, Tax-Free Investments Trust; Director and President, Fund Management Company; Chief Cash Management Officer, Director of Cash Management, Senior Vice President, and Managing Director, Invesco Aim Capital Management, Inc.; Director of Cash Management, Senior Vice President, and Vice President, Invesco Advisers, Inc. and The Invesco Funds (AIM Treasurer’s Series Trust (Invesco Treasurer’s Series Trust), Short-Term Investments Trust and Tax-Free Investments Trust only) | N/A | N/A | ||||
T-3 Invesco Equally-Weighted S&P 500 Fund
Trustees and Officers—(continued)
Name, Year of Birth and Position(s) Held with the Trust | Trustee and/ or Officer Since | Principal Occupation(s) During Past 5 Years | Number of Funds in Fund Complex Overseen by Trustee | Other Directorship(s) Held by Trustee During Past 5 Years | ||||
| Other Officers—(continued) | ||||||||
| Sheri Morris — 1964 Vice President, Treasurer and Principal Financial Officer | 2003 | Vice President, Treasurer and Principal Financial Officer, The Invesco Funds; Vice President, Invesco Advisers, Inc. (formerly known as Invesco Institutional (N.A.), Inc.) (registered investment adviser); and Vice President, PowerShares Exchange-Traded Fund Trust, PowerShares Exchange-Traded Fund Trust II, PowerShares India Exchange-Traded Fund Trust and PowerShares Actively Managed Exchange-Traded Fund Trust
Formerly: Vice President, Invesco Aim Advisers, Inc., Invesco Aim Capital Management, Inc. and Invesco Aim Private Asset Management, Inc.; Assistant Vice President and Assistant Treasurer, The Invesco Funds and Assistant Vice President, Invesco Advisers, Inc., Invesco Aim Capital Management, Inc. and Invesco Aim Private Asset Management, Inc.; and Treasurer, PowerShares Exchange-Traded Fund Trust, PowerShares Exchange-Traded Fund Trust II, PowerShares India Exchange-Traded Fund Trust and PowerShares Actively Managed Exchange-Traded Fund Trust | N/A | N/A | ||||
Crissie M. Wisdom — 1969 Anti-Money Laundering Compliance Officer | 2013 | Anti-Money Laundering Compliance Officer, Invesco Advisers, Inc. (formerly known as Invesco Institutional (N.A.), Inc.) (registered investment adviser), Invesco Capital Markets, Inc. (formerly known as Van Kampen Funds Inc.), Invesco Distributors, Inc., Invesco Investment Services, Inc., Invesco Management Group, Inc., Van Kampen Exchange Corp., The Invesco Funds, Invesco Funds (Chicago), and PowerShares Exchange-Traded Fund Trust, PowerShares Exchange-Traded Fund Trust II, PowerShares India Exchange-Traded Fund Trust, and PowerShares Actively Managed Exchange-Traded Fund Trust; and Fraud Prevention Manager and Controls and Risk Analysis Manager for Invesco Investment Services, Inc. | N/A | N/A | ||||
| Todd L. Spillane — 1958 Chief Compliance Officer | 2006 | Senior Vice President, Invesco Management Group, Inc. (formerly known as Invesco Aim Management Group, Inc.) and Van Kampen Exchange Corp.; Senior Vice President and Chief Compliance Officer, Invesco Advisers, Inc. (registered investment adviser) (formerly known as Invesco Institutional (N.A.), Inc.); Chief Compliance Officer, The Invesco Funds; Vice President, Invesco Distributors, Inc. (formerly known as Invesco Aim Distributors, Inc.) and Invesco Investment Services, Inc. (formerly known as Invesco Aim Investment Services, Inc.)
Formerly: Chief Compliance Officer, Invesco Funds (Chicago); Senior Vice President, Van Kampen Investments Inc.; Senior Vice President and Chief Compliance Officer, Invesco Aim Advisers, Inc. and Invesco Aim Capital Management, Inc.; Chief Compliance Officer, INVESCO Private Capital Investments, Inc. (holding company), Invesco Private Capital, Inc. (registered investment adviser), Invesco Global Asset Management (N.A.), Inc., Invesco Senior Secured Management, Inc. (registered investment adviser), Van Kampen Investor Services Inc., PowerShares Exchange-Traded Fund Trust, PowerShares Exchange-Traded Fund Trust II, PowerShares India Exchange-Traded Fund Trust and PowerShares Actively Managed Exchange-Traded Fund Trust; and Vice President, Invesco Aim Capital Management, Inc. and Fund Management Company | N/A | N/A |
The Statement of Additional Information of the Trust includes additional information about the Fund’s Trustees and is available upon request, without charge, by calling 1.800.959.4246. Please refer to the Fund’s prospectus for information on the Fund’s sub-advisers.
Office of the Fund 11 Greenway Plaza, Suite 1000 Houston, TX 77046-1173 | Investment Adviser Invesco Advisers, Inc. 1555 Peachtree Street, N.E. Atlanta, GA 30309 | Distributor Invesco Distributors, Inc. 11 Greenway Plaza, Suite 1000 Houston, TX 77046-1173 | Auditors PricewaterhouseCoopers LLP 1201 Louisiana Street, Suite 2900 Houston, TX 77002-5678 | |||
Counsel to the Fund Stradley Ronon Stevens & Young, LLP 2005 Market Street, Suite 2600 Philadelphia, PA 19103-7018 | Counsel to the Independent Trustees Goodwin Procter LLP 901 New York Avenue, N.W. Washington, D.C. 20001 | Transfer Agent Invesco Investment Services, Inc. 11 Greenway Plaza, Suite 1000 Houston, TX 77046-1173 | Custodian State Street Bank and Trust Company 225 Franklin Street Boston, MA 02110-2801 | |||
T-4 Invesco Equally-Weighted S&P 500 Fund

Invesco mailing information
Send general correspondence to Invesco Investment Services, Inc., P.O. Box 219078, Kansas City, MO 64121-9078.
Invesco privacy policy
You share personal and financial information with us that is necessary for your transactions and your account records. We take very seriously the obligation to keep that information confidential and private.
Invesco collects nonpublic personal information about you from account applications or other forms you complete and from your transactions with us or our affiliates. We do not disclose information about you or our former customers to service providers or other third parties except to the extent necessary to service your account and in other limited circumstances as permitted by law. For example, we use this information to facilitate the delivery of transaction confirmations, financial reports, prospectuses and tax forms.
Even within Invesco, only people involved in the servicing of your accounts and compliance monitoring have access to your information. To ensure the highest level of confidentiality and security, Invesco maintains physical, electronic and procedural safeguards that meet or exceed federal standards. Special measures, such as data encryption and authentication, apply to your communications with us on our website. More detail is available to you at invesco.com/privacy.
Important notice regarding delivery of security holder documents
To reduce Fund expenses, only one copy of most shareholder documents may be mailed to shareholders with multiple accounts at the same address (Householding). Mailing of your shareholder documents may be householded indefinitely unless you instruct us otherwise. If you do not want the mailing of these documents to be combined with those for other members of your household, please contact Invesco Investment Services, Inc. at 800 959 4246 or contact your financial institution. We will begin sending you individual copies for each account within 30 days after receiving your request.
Fund holdings and proxy voting information
The Fund provides a complete list of its holdings four times in each fiscal year, at the quarter ends. For the second and fourth quarters, the lists appear in the Fund’s semiannual and annual reports to shareholders. For the first and third quarters, the Fund files the lists with the Securities and Exchange Commission (SEC) on Form N-Q. The most recent list of portfolio holdings is available at invesco.com/completeqtrholdings. Shareholders can also look up the Fund’s
Forms N-Q on the SEC website at sec.gov. Copies of the Fund’s Forms N-Q may be reviewed and copied at the SEC Public Reference Room in Washington, D.C. You can obtain information on the operation of the Public Reference Room, including information about duplicating fee charges, by calling 202 551 8090 or 800 732 0330, or by electronic request at the following email address: publicinfo@sec.gov. The SEC file numbers for the Fund are shown below.
A description of the policies and procedures that the Fund uses to determine how to vote proxies relating to portfolio securities is available without charge, upon request, from our Client Services department at 800 959 4246 or at invesco.com/proxyguidelines. The information is also available on the SEC website, sec.gov.
Information regarding how the Fund voted proxies related to its portfolio securities during the most recent 12-month period ended June 30 is available at invesco.com/proxysearch. The information is also available on the SEC website, sec.gov. |  | |
Invesco Advisers, Inc. is an investment adviser; it provides investment advisory services to individual and institutional clients and does not sell securities. Invesco Distributors, Inc. is the US distributor for Invesco Ltd.’s retail mutual funds, exchange-traded funds and institutional money market funds. Both are wholly owned, indirect subsidiaries of Invesco Ltd. |
| SEC file numbers: 811-09913 and 333-36074 MS-EWSP-AR-1 Invesco Distributors, Inc. | |||||
| ||||
 |
Annual Report to Shareholders
|
August 31, 2013
| ||
| ||||
Invesco Equity and Income Fund
Nasdaq: A: ACEIX n B: ACEQX n C: ACERX n R: ACESX n Y: ACETX n R5: ACEKX n R6: IEIFX | ||||

Letters to Shareholders
Philip Taylor | Dear Shareholders: Enclosed in this annual report, you’ll find information about your Fund and the factors that affected its performance during the reporting period. Inside, you’ll also find a discussion from your portfolio managers about how they managed your Fund, as well as performance data for your Fund, a complete list of your Fund’s investments as of the close of the reporting period and other important information. I hope you find this report of interest. During the reporting period covered by this report, major US equity indexes made multiyear or even all-time highs.1 Economic data were generally positive; housing and consumer spending data were particularly encouraging. Nonetheless, economic uncertainty and concern about continuing political and budget gridlock in Washington persisted. The US Federal Reserve’s deliberate vagueness about when, and to what degree, it might begin to curtail its | ||||||||

extraordinarily accommodative monetary policies – together with uncertainty about who will next lead the central bank – affected fixed income and equity markets alike. Most developed, non-US stock markets remained positive for the first half of 2013, despite a difficult second quarter.
Periods of market volatility and economic uncertainty can weaken the will of even the most resolute investor. That’s why Invesco believes it’s often helpful to work with a skilled and trusted financial adviser who can emphasize the importance of adhering to an investment plan designed to achieve long-term goals rather than being sidetracked by short-term uncertainty that can result in inaction. A financial adviser who is familiar with your individual financial situation, investment goals and risk tolerance can be an invaluable partner as you work toward your financial goals. He or she can provide insight and perspective when markets are volatile; encouragement and reassurance when times are uncertain; and advice and guidance when your financial situation or investment goals change.
Our website, invesco.com/us, is another source of timely insight and information for investors. On the website, you’ll find fund-specific as well as more general information from many of Invesco’s investment professionals. You’ll find in-depth articles, video clips and audio commentaries – and, of course, you also can access information about your Invesco account whenever it’s convenient for you.
What we mean by Intentional Investing
At Invesco, all of our people and all of our resources are dedicated to helping investors achieve their financial objectives. It’s a philosophy we call Intentional Investing, and it guides the way we:
| n | Manage investments – Our dedicated investment professionals search the world for the best opportunities, and each investment team follows a clear, disciplined process to build portfolios and mitigate risk. |
| n | Provide choices – We offer multiple investment strategies, allowing you and your financial adviser to build a portfolio that’s purpose-built for your needs. |
| n | Connect with you – We’re committed to giving you the expert insights you need to make informed investing decisions, and we are well-equipped to provide high-quality support for investors and advisers. |
At Invesco, we believe in putting investors first. That’s why investment management is all we do. Our sole focus on managing your money allows you and your financial adviser to build a portfolio of Invesco funds appropriate for your investment needs and goals today and when your circumstances change.
Have questions?
For questions about your account, feel free to contact an Invesco client services representative at 800 959 4246. For Invesco-related questions or comments, please email me directly at phil@invesco.com.
All of us at Invesco look forward to serving your investment management needs for many years to come. Thank you for investing with us.
Sincerely,

Philip Taylor
Senior Managing Director, Invesco Ltd.
1 Source: Reuters
2 Invesco Equity and Income Fund
Bruce Crockett | Dear Fellow Shareholders: The Invesco Funds Board has worked on a variety of issues over the last several months, and I’d like to take this opportunity to discuss two that affect you and our fellow fund shareholders. The first issue on which your Board has been working is our annual review of the funds’ advisory and sub-advisory contracts with Invesco Advisers and its affiliates. This annual review, which is required by the Investment Company Act of 1940, focuses on the nature and quality of the services Invesco provides as adviser to the Invesco Funds and the reasonableness of the fees that it charges for those services. Each year, we spend months reviewing detailed information that we request from Invesco that allows us to evaluate its services and fees. We also use information from many independent sources, including materials provided by the independent Senior Officer of the Invesco Funds, who reports directly to the independent | ||||||||

Trustees on the Board. Additionally, we meet with independent legal counsel and review performance and fee data prepared by Lipper Inc., an independent, third-party firm widely recognized as a leader in its field.
I’m pleased to report that the Board determined in June that renewing the investment advisory agreement and the sub-advisory contracts with Invesco Advisers and its affiliates would serve the best interests of each fund and its shareholders.
The second area of focus to highlight is the Board’s efforts to ensure that we provide a lineup of funds that allow financial advisers to build portfolios that meet shareholders’ changing financial needs and goals. Today, more and more investors are reaching, or approaching, retirement. But interest rates remain low, making it difficult for many investors to generate the income they need, or will soon need, in their retirement years.
The members of your Board think about these things, too, and we’ve worked with Invesco Advisers to provide more income-generating options in the Invesco Funds lineup to help shareholders potentially meet their income needs. Your Board recently approved changes to three existing equity mutual funds, increasing their focus on generating income while also seeking to provide long-term growth of capital.
As a result of these changes, the funds and their respective management teams now have more flexibility to invest in the types of securities that could meet investors’ growing need for income generation, and in some cases, also help investors diversify their sources of income. These equity funds complement an array of fixed-income, asset allocation and alternative investment options in the Invesco Funds lineup designed to accommodate a variety of risk tolerances.
Be assured that your Board will continue working on behalf of fund shareholders, keeping your needs and interests uppermost in our minds.
As always, please contact me at bruce@brucecrockett.com with any questions or concerns you may have. On behalf of the Board, we look forward to continuing to represent your interests and serving your needs.
Sincerely,

Bruce L. Crockett
Independent Chair
Invesco Funds Board of Trustees
3 Invesco Equity and Income Fund
Management’s Discussion of Fund Performance
Performance summary
For the fiscal year ended August 31, 2013, Invesco Equity and Income Fund under-performed the Russell 1000 Value Index, its broad market benchmark. As the Fund is a balanced fund, its allocation to fixed income was the primary detractor from performance versus a pure equity benchmark, in a strong equity market.
Your Fund’s long-term performance appears later in this report.
Fund vs. Indexes
Total returns, 8/31/12 to 8/31/13, at net asset value (NAV). Performance shown does not include applicable contingent deferred sales charges (CDSC) or front-end sales charges, which would have reduced performance.
| Class A Shares | 17.80 | % | |||
| Class B Shares | 16.90 | ||||
| Class C Shares | 16.95 | ||||
| Class R Shares | 17.57 | ||||
| Class Y Shares | 18.10 | ||||
| Class R5 Shares | 18.29 | ||||
| Class R6 Shares* | 18.17 | ||||
| Russell 1000 Value Index‚ (Broad Market Index) | 23.10 | ||||
| Barclays U.S. Government/Credit Indexn (Style-Specific Index) | -2.62 |
| Source(s): | ‚Invesco, Russell via FactSet Research Systems Inc.; nLipper Inc. |
| * | Share class incepted during the reporting period. See page 7 for a detailed explanation of Fund performance. |
How we invest
As a balanced fund, the Fund incorporates both stocks and bonds within the portfolio. We call our investment philosophy within stock investing “value with a catalyst.” We believe undervalued companies that are experiencing positive changes (i.e., “catalysts”) have the potential to generate long-term stock price growth for shareholders. We generally seek to identify companies that are undervalued, under earning, and out of favor with investors. For these companies, we attempt to identify catalysts that may improve the financial results and/or correct the undervaluation. Examples of catalysts typically include improved operational efficiency, changing industry dynamics and/or a change in management.
We initially identify potential investments through a series of quantitative screens, which look at valuation and rate of return metrics. We then conduct fundamental research on the most attractive opportunities. The research process
includes a thorough review of a company’s financial statements, an evaluation of its competitive position and stability, and meetings with its executives. During the research process, we also value the company under various scenarios to determine if the investment is an attractive opportunity relative to its risks. This is also where we typically identify the positive catalyst, a prerequisite for potential investment. Finally, we generally set a price target for a stock based on normalized earnings and historical valuation multiples.
In short, our objective is to exploit perceived market skepticism toward a company’s stock by analyzing the company’s operations in the context of a cyclical environment and identifying one or more catalysts that may improve the company’s financial performance. Improved financial performance, in turn, has the potential to drive the company’s stock price higher.
We typically sell an investment when it reaches our estimate of fair value or when we identify a more attractive investment opportunity.
Within bonds, the Fund invests in investment-grade corporate bonds, convertible securities and government-issued bonds. The fixed income portion of the Fund is there to help provide an income component and help mitigate volatility in an uncertain market environment.
Market conditions and your Fund
The fiscal year ended August 31, 2013, began with some downward volatility in US equity markets. Starting in the fall of 2012, markets began an upward trend that continued through much of the reporting period. In early fall, the European Central Bank implemented new measures to support member economies and the US Federal Reserve (the Fed) initiated a third round of quantitative easing (QE), or fiscal stimulus, which caused consumer sentiment to improve. Uncertainty surrounding “fiscal cliff” negotiations and sequestration spending cuts in early 2013, however, made many businesses hesitant to spend during the first quarter of the year. However, for the first time in years, markets appeared willing to look past headline events.
From late May through June, the capital markets began a sell-off following Fed Chairman Ben Bernanke’s comments about reducing QE. Since December 2012, the Fed has purchased $85 billion1 of US Treasuries and mortgage-backed securities each month to increase liquidity and ensure low long-term interest rates in an effort to spur the housing and real estate markets. Few asset classes were immune from this broad sell-off, which caused bonds, stocks and commodities to decline. The markets stabilized in midsummer; however, August brought more selling in the equity and bond markets and yields continued to rise.
Most US equity market indexes delivered double-digit gains and all sectors of the Russell 1000 Value Index posted positive returns, with the exception of the telecommunication services sector, which posted a slightly negative return.
| Portfolio Composition | |||||
By security type
| |||||
| Common Stocks & Other Equity Interests | 67.4 | % | |||
| Bonds and Notes | 19.9 | ||||
| US Treasury Securities | 6.6 | ||||
| Preferred Stocks | 1.5 | ||||
Security types each less than 1% of the portfolio | 1.1 | ||||
| Money Market Funds | |||||
| Plus Other Assets Less Liabilities | 3.5 | ||||
| Top 10 Equity Holdings* | |||||
| 1. JPMorgan Chase & Co. | 3.0 | % | |||
| 2. Citigroup Inc. | 2.4 | ||||
| 3. Viacom Inc.-Class B | 2.0 | ||||
| 4. General Electric Co. | 2.0 | ||||
| 5. Avon Products, Inc. | 1.7 | ||||
| 6. Microsoft Corp. | 1.5 | ||||
| 7. Marsh & McLennan Cos., Inc. | 1.5 | ||||
| 8. PNC Financial Services Group, Inc. | 1.5 | ||||
| 9. Morgan Stanley | 1.5 | ||||
| 10. Time Warner Cable Inc. | 1.4 | ||||
| Total Net Assets | $11.6 billion | ||||
| Total Number of Holdings* | 407 | ||||
The Fund’s holdings are subject to change, and there is no assurance that the Fund will continue to hold any particular security.
*Excluding money market fund holdings.
4 Invesco Equity and Income Fund
Stock selection and a material underweight position in the energy sector were large contributors to Fund performance. Chevron, an integrated energy company and Halliburton, an oil and gas services company, were among the top performing holdings for the Fund. One of the largest contributors to relative Fund performance was a material underweight to Exxon Mobil, as the stock returned low single-digit returns for the reporting period.
Strong stock selection in the financials sector also contributed to Fund performance. Lack of exposure to real estate was one of the largest drivers of Fund performance, as the real estate industry posted negative performance for the reporting period. Within the diversified financials industry, JPMorgan Chase and Citigroup were top performers.
Strong stock selection and an underweight position in the materials sector was another driver of relative Fund performance versus the Russell 1000 Value Index. Paint and glass company PPG Industries was a top contributor in this sector, as the company had improved earnings throughout the reporting period and acquired a coatings business investors viewed as favorable. Additionally, not owning holdings in the precious metals and minerals industry contributed to the Fund’s performance, as those stocks suffered due to a sell-off in gold and precious metals during much of 2013.
A material underweight position in the utilities sector also contributed to Fund performance, as it was the second worst-performing sector for the broad market benchmark.
Stock selection and an overweight position in the health care sector contributed to relative performance. Holdings like Cigna and Wellpoint were top performers. Also, a convertible bond issued by Gilead Sciences contributed on a relative and absolute basis.
Conversely, stock selection in the information technology sector detracted from relative performance. Specifically, non-benchmark holdings such as Microsoft and Western Union (no longer held in the Fund) underperformed the style-specific benchmark and sector. Having little exposure to hardware and equipment companies also hurt relative performance, as the industry generally performed well over the reporting period.
Even though we had an average cash position within our acceptable range during the reporting period, cash acted as a detractor in a strong equity market.
Stock selection in the consumer discretionary sector also hurt relative performance. Strong stock selection in media was offset by the negative effects of
stock selection and having little exposure to the automobiles industry, which performed well during the reporting period.
Stock selection and an underweight position in the industrials sector also detracted from relative performance versus the Russell 1000 Value Index. Select holdings within capital goods and commercial and professional services detracted the most from performance.
The allocation to investment grade corporate, government agency and US Treasury bonds was a valuable source of income, helping dampen overall portfolio volatility, but unfortunately still returned -1.41% for the reporting period.2 This detracted from relative performance versus the Russell 1000 Value benchmark, as bonds meaningfully underperformed equities during the reporting period. The allocation to convertible bonds provided positive absolute returns while detracting from relative performance, as convertible bonds underperformed the Russell 1000 Value benchmark.
We used currency forward contracts during the reporting period for the purpose of hedging currency exposure of non-US-based companies held in the Fund. Derivatives were used primarily for the purpose of hedging and not for speculative purposes or leverage. The use of currency forward contracts had a slight positive impact on the Fund’s performance relative to the Russell 1000 Value Index for the reporting period.
Equity markets, although providing investors strong absolute returns, experienced continued volatility during the reporting period. We believe that market volatility creates opportunities to invest in companies with attractive valuations and strong fundamentals. We believe that ultimately those valuations and fundamentals will be reflected in those companies’ stock prices.
Thank you for your investment in Invesco Equity and Income Fund.
1 Source: US Federal Reserve
2 Source: Barclays
The views and opinions expressed in management’s discussion of Fund performance are those of Invesco Advisers, Inc. These views and opinions are subject to change at any time based on factors such as market and economic conditions. These views and opinions may not be relied upon as investment advice or recommendations, or as an offer for a particular security. The information is not a complete analysis of every aspect of any market, country, industry, security or the Fund. Statements of fact are from sources considered reliable, but Invesco Advisers, Inc. makes no representation or warranty as to their completeness or accuracy. Although historical performance is no guarantee of future results, these insights may help you understand our investment management philosophy.
See important Fund and, if applicable, index disclosures later in this report.
 | Thomas Bastian Chartered Financial Analyst, portfolio manager, is lead manager of Invesco Equity and Income Fund. He joined | |
| Invesco in 2010. Mr. Bastian earned a BA in accounting from St. John’s University and an MBA in finance from University of Michigan. | ||
 | Chuck Burge Portfolio manager, is manager of Invesco Equity and Income Fund. He joined Invesco in 2002. | |
| Mr. Burge earned a BS in economics from Texas A&M University and an MBA in finance and accounting from Rice University. | ||
 | Mary Jane Maly Chartered Financial Analyst, portfolio manager, is manager of Invesco Equity and Income Fund. She joined Invesco in 2010. | |
| Ms. Maly earned a BA from the University of Pittsburgh and an MBA from the Thunderbird School of Global Management. | ||
 | Sergio Marcheli Portfolio manager, is manager of Invesco Equity and Income Fund. He joined Invesco in 2010. | |
| Mr. Marcheli earned a BBA from the University of Houston and an MBA from the University of St. Thomas. | ||
 | James Roeder Chartered Financial Analyst, portfolio manager, is manager of Invesco Equity and Income Fund. He joined Invesco in 2010. | |
| Mr. Roeder earned a BS in accounting from Clemson University and an MBA in economics and finance from the University of Chicago Booth School of Business. | ||
5 Invesco Equity and Income Fund
Your Fund’s Long-Term Performance
Results of a $10,000 Investment – Oldest Share Class(es)
Fund and index data from 8/31/03
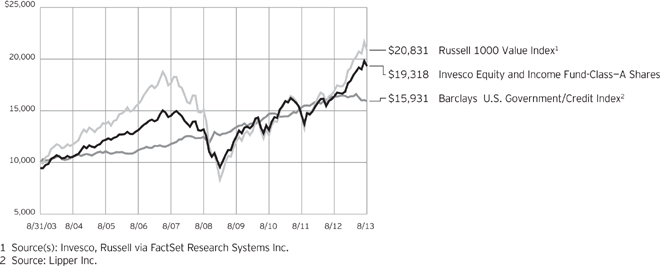
Past performance cannot guarantee comparable future results.
The data shown in the chart include reinvested distributions, applicable sales charges and Fund expenses including
management fees. Index results include reinvested dividends, but they do not reflect sales charges. Performance of the peer group, if applicable, reflects fund expenses and management fees;
performance of a market index does not. Performance shown in the chart and table(s) does not reflect deduction of taxes a shareholder would pay on Fund distributions or sale of Fund shares.
continued from page 8
| returns, even though it may not have received this income. Further, preferred securities may lose substantial value due to the omission or deferment of dividend payments. |
| n | Small- and mid-capitalization risk. The securities of small- and medium-sized companies may be subject to more abrupt or erratic market movements and may have lower trading volumes or more erratic trading than securities of larger companies or the market averages in general or with respect to a particular industry. Thus, to the extent the Fund invests in small- and medium-sized companies, it will be subject to greater risk than that assumed through investment in the securities of larger-sized companies. |
| n | Synthetic securities risk. Fluctuations in the values of synthetic securities may not correlate perfectly with the instruments they are designed to replicate. Synthetic securities may be subject to interest rate changes, market price fluctuations, counterparty risk and liquidity risk. |
About indexes used in this report
| n | The Russell 1000® Value Index is an unmanaged index considered representative of large-cap value stocks. The Russell 1000 Value Index is a trademark/service mark of the Frank Russell Co. Russell® is a trademark of the Frank Russell Co. |
| n | The Barclays U.S. Government/ Credit Index includes treasuries and agencies that represent the government portion of the index, and includes publically issued US corporate and foreign debentures and secured notes that meet specified maturity, liquidity and quality requirements. |
| n | The Fund is not managed to track the performance of any particular index, including the index(es) described here, and consequently, the performance of the Fund may deviate significantly from the performance of the index(es). |
| n | A direct investment cannot be made in an index. Unless otherwise indicated, index results include reinvested dividends, and they do not reflect sales |
| charges. Performance of the peer group, if applicable, reflects fund expenses; performance of a market index does not. |
Other information
| n | The returns shown in management’s discussion of Fund performance are based on net asset values calculated for shareholder transactions. Generally accepted accounting principles require adjustments to be made to the net assets of the Fund at period end for financial reporting purposes, and as such, the net asset values for shareholder transactions and the returns based on those net asset values may differ from the net asset values and returns reported in the Financial Highlights. |
| n | Industry classifications used in this report are generally according to the Global Industry Classification Standard, which was developed by and is the exclusive property and a service mark of MSCI Inc. and Standard & Poor’s. |
6 Invesco Equity and Income Fund
Average Annual Total Returns
As of 8/31/13, including maximum applicable sales charges
| Class A Shares | |||||
| Inception (8/3/60) | 10.22 | % | |||
| 10 Years | 6.81 | ||||
| 5 Years | 6.72 | ||||
| 1 Year | 11.28 | ||||
| Class B Shares | |||||
| Inception (5/1/92) | 9.57 | % | |||
| 10 Years | 7.06 | ||||
| 5 Years | 7.37 | ||||
| 1 Year | 11.90 | ||||
| Class C Shares | |||||
| Inception (7/6/93) | 8.83 | % | |||
| 10 Years | 6.61 | ||||
| 5 Years | 7.12 | ||||
| 1 Year | 15.95 | ||||
| Class R Shares | |||||
| Inception (10/1/02) | 7.96 | % | |||
| 10 Years | 7.14 | ||||
| 5 Years | 7.66 | ||||
| 1 Year | 17.57 | ||||
| Class Y Shares | |||||
| Inception (12/22/04) | 6.40 | % | |||
| 5 Years | 8.17 | ||||
| 1 Year | 18.10 | ||||
| Class R5 Shares | |||||
| 10 Years | 7.54 | % | |||
| 5 Years | 8.19 | ||||
| 1 Year | 18.29 | ||||
| Class R6 Shares | |||||
| 10 Years | 7.44 | % | |||
| 5 Years | 7.99 | ||||
| 1 Year | 18.17 | ||||
Effective June 1, 2010, Class A, Class B, Class C, Class I and Class R shares of the predecessor fund, Van Kampen Equity and Income Fund, advised by Van Kampen Asset Management were reorganized into Class A, Class B, Class C, Class Y and Class R shares, respectively, of Invesco Van Kampen Equity and Income Fund (renamed Invesco Equity and Income Fund). Returns shown above for Class A, Class B, Class C, Class R and Class Y shares are blended returns of the predecessor fund and Invesco Equity and Income Fund. Share class returns will differ from the predecessor fund because of different expenses.
Class R5 shares incepted on June 1, 2010. Performance shown prior to that date is that of the predecessor fund’s Class A shares and includes the 12b-1
Average Annual Total Returns
As of 6/30/13, the most recent calendar quarter end, including maximum applicable sales charges
| Class A Shares | |||||
| Inception (8/3/60) | 10.22 | % | |||
| 10 Years | 6.81 | ||||
| 5 Years | 6.49 | ||||
| 1 Year | 12.76 | ||||
| Class B Shares | |||||
| Inception (5/1/92) | 9.57 | % | |||
| 10 Years | 7.07 | ||||
| 5 Years | 7.18 | ||||
| 1 Year | 13.50 | ||||
| Class C Shares | |||||
| Inception (7/6/93) | 8.84 | % | |||
| 10 Years | 6.63 | ||||
| 5 Years | 6.94 | ||||
| 1 Year | 17.55 | ||||
| Class R Shares | |||||
| Inception (10/1/02) | 7.94 | % | |||
| 10 Years | 7.15 | ||||
| 5 Years | 7.44 | ||||
| 1 Year | 18.92 | ||||
| Class Y Shares | |||||
| Inception (12/22/04) | 6.33 | % | |||
| 5 Years | 7.97 | ||||
| 1 Year | 19.59 | ||||
| Class R5 Shares | |||||
| 10 Years | 7.54 | % | |||
| 5 Years | 7.94 | ||||
| 1 Year | 19.67 | ||||
| Class R6 Shares | |||||
| 10 Years | 7.45 | % | |||
| 5 Years | 7.77 | ||||
| 1 Year | 19.66 | ||||
fees applicable to Class A shares. Class A share performance reflects any applicable fee waivers or expense reimbursements.
Class R6 shares incepted on September 24, 2012. Performance shown prior to that date is that of the Fund’s and the predecessor fund’s Class A shares and includes the 12b-1 fees applicable to Class A shares. Class A share performance reflects any applicable fee waivers or expense reimbursements.
The performance data quoted represent past performance and cannot guarantee comparable future results; current performance may be lower or higher. Please visit invesco.com/performance for the most recent month-end performance. Performance figures reflect reinvested
distributions, changes in net asset value and the effect of the maximum sales charge unless otherwise stated. Investment return and principal value will fluctuate so that you may have a gain or loss when you sell shares.
The total annual Fund operating expense ratio set forth in the most recent Fund prospectus as of the date of this report for Class A, Class B, Class C, Class R, Class Y, Class R5 and Class R6 shares was 0.81%, 1.56%, 1.54%, 1.06%, 0.56%, 0.44% and 0.37%, respectively. The expense ratios presented above may vary from the expense ratios presented in other sections of this report that are based on expenses incurred during the period covered by this report.
Class A share performance reflects the maximum 5.50% sales charge, and Class B and Class C share performance reflects the applicable contingent deferred sales charge (CDSC) for the period involved. For shares purchased prior to June 1, 2010, the CDSC on Class B shares declines from 5% at the time of purchase to 0% at the beginning of the sixth year. For shares purchased on or after June 1, 2010, the CDSC on Class B shares declines from 5% at the time of purchase to 0% at the beginning of the seventh year. The CDSC on Class C shares is 1% for the first year after purchase. Class R, Class Y, Class R5 and Class R6 shares do not have a front-end sales charge or a CDSC; therefore, performance is at net asset value.
The performance of the Fund’s share classes will differ primarily due to different sales charge structures and class expenses.
Had the adviser not waived fees and/or reimbursed expenses on Class B shares in the past, performance would have been lower.
7 Invesco Equity and Income Fund
Invesco Equity and Income Fund’s investment objective is to seek the highest possible income consistent with safety of principal. Long-term growth of capital is an important secondary investment objective.
| n | Unless otherwise stated, information presented in this report is as of August 31, 2013, and is based on total net assets. |
| n | Unless otherwise noted, all data provided by Invesco. |
| n | To access your Fund’s reports/prospectus, visit invesco.com/fundreports. |
About share classes
| n | Class B shares may not be purchased for new or additional investments. Please see the prospectus for more information. |
| n | Class R shares are generally available only to employer sponsored retirement and benefit plans. Please see the prospectus for more information. |
| n | Class Y shares are available only to certain investors. Please see the prospectus for more information. |
| n | Class R5 shares and Class R6 shares are primarily intended for employer sponsored retirement and benefit plans that meet certain standards and for institutional investors. On September 24, 2012, Institutional Class shares were renamed Class R5 shares. Please see the prospectus for more information. |
Principal risks of investing in the Fund
| n | Management risk. The investment techniques and risk analysis used by the Fund’s portfolio managers may not produce the desired results. |
| n | Market risk. The prices of and the income generated by the Fund’s securities may decline in response to, among other things, investor sentiment, general economic and market conditions, regional or global instability, and currency and interest rate fluctuations. |
| n | Income risk. The ability of the Fund’s equity securities to generate income generally depends on the earnings and the continuing declaration of dividends by the issuers of such securities. The interest income on debt securities generally is affected by prevailing interest rates, which can vary widely over the short- and long-term. If dividends are reduced or discontinued or interest rates drop, distributions to shareholders from the Fund may drop as well. |
| n | Call risk. If interest rates fall, it is possible that issuers of callable securities held by the Fund will call or prepay their securities before their maturity dates. In this |
event, the proceeds from the called securities would most likely be reinvested by the Fund in securities bearing the new, lower interest rates, resulting in a possible decline in the Fund’s income and distributions to shareholders and termination of any conversion option on convertible securities. |
| n | Credit risk. Credit risk refers to an issuer’s ability to make timely payments of interest and principal. Because the Fund generally invests only in investment grade-quality debt securities, it is subject to a lower level of credit risk than a fund investing in lower-quality securities. |
| n | Convertible securities risk. The Fund may own convertible securities, the value of which may be affected by market interest rates, the risk that the issuer will default, the value of the underlying stock or the right of the issuer to buy back the convertible securities. |
| n | Foreign risk. The risks of investing in securities of foreign issuers can include fluctuations in foreign currencies, foreign currency exchange controls, political and economic instability, differences in financial reporting, differences in securities regulation and trading, and foreign taxation issues. The Fund may also invest in issuers in developing or emerging market countries, which are subject to greater risks than investments in securities of issuers in developed countries. |
| n | Investing in real estate investment trust (REITs) risk. Investing in REITs makes the Fund more susceptible to risks associated with the ownership of real estate and with the real estate industry in general and may involve duplication of management fees and certain other expenses. In addition, REITs depend upon specialized management skills, may be less diversified, may have lower trading volume, and may be subject to more abrupt or erratic price movements than the overall securities markets. |
| n | Value investing risk. The Fund emphasizes a value style of investing. The |
Fund’s investment style presents the risk that the valuations may never improve or that the returns on value securities may be less than the returns on other styles of investing or the overall stock market. Different types of stocks tend to shift in and out of favor depending on market and economic conditions. Thus, the value of the Fund’s investments will vary and at times may be lower or higher than that of other types of investments. |
| n | Derivatives risk. The performance of derivative instruments is tied to the performance of an underlying currency, security, index or other instrument. In addition to risks relating to their underlying instruments, the use of derivatives may include other, possibly greater, risks. Derivatives involve costs, may be volatile, and may involve a small initial investment relative to the risk assumed. Risks associated with the use of derivatives include counterparty, leverage, correlation, liquidity, tax, market, interest rate and management risks. Derivatives may also be more difficult to purchase, sell or value than other investments. The Fund may lose more than the cash amount invested on investments in derivatives. Investors should bear in mind that, while the Fund intends to use derivative strategies, it is not obligated to actively engage in these transactions, generally or in any particular kind of derivative, if the investment manager elects not to do so due to availability, cost, market conditions or other factors. |
| n | Preferred securities risk. There are special risks associated with investing in preferred securities. Preferred securities may include provisions that permit the issuer, in its discretion, to defer or omit distributions for a certain period of time. If the Fund owns a security that is deferring or omitting its distributions, the Fund may be required to report the distribution on its tax |
continued on page 6
This report must be accompanied or preceded by a currently effective Fund prospectus, which contains more complete information, including sales charges and expenses. Investors should read it carefully before investing.
NOT FDIC INSURED | MAY LOSE VALUE | NO BANK GUARANTEE
| Fund Nasdaq Symbols | |||||
| Class A Shares | ACEIX | ||||
| Class B Shares | ACEQX | ||||
| Class C Shares | ACERX | ||||
| Class R Shares | ACESX | ||||
| Class Y Shares | ACETX | ||||
| Class R5 Shares | ACEKX | ||||
| Class R6 Shares | IEIFX | ||||
8 Invesco Equity and Income Fund
Schedule of Investments(a)
August 31, 2013
| Shares | Value | |||||||
Common Stocks & Other Equity Interests–67.38% |
| |||||||
| Aerospace & Defense–0.46% | ||||||||
General Dynamics Corp. | 631,583 | $ | 52,579,285 | |||||
| Agricultural Products–0.93% | ||||||||
Archer-Daniels-Midland Co. | 3,051,220 | 107,433,456 | ||||||
| Application Software–1.09% | ||||||||
Adobe Systems Inc.(b) | 2,761,543 | 126,340,592 | ||||||
| Asset Management & Custody Banks–1.53% | ||||||||
Northern Trust Corp. | 1,364,620 | 74,876,700 | ||||||
State Street Corp. | 1,531,967 | 102,212,838 | ||||||
| 177,089,538 | ||||||||
| Automobile Manufacturers–0.87% | ||||||||
General Motors Co.(b) | 2,955,378 | 100,719,282 | ||||||
| Biotechnology–1.16% | ||||||||
Amgen Inc. | 1,230,528 | 134,053,720 | ||||||
| Cable & Satellite–2.74% | ||||||||
Comcast Corp.–Class A | 3,630,177 | 152,794,150 | ||||||
Time Warner Cable Inc. | 1,520,686 | 163,245,642 | ||||||
| 316,039,792 | ||||||||
| Diversified Banks–1.67% | ||||||||
Comerica Inc. | 1,995,130 | 81,481,109 | ||||||
Wells Fargo & Co. | 2,725,860 | 111,978,329 | ||||||
| 193,459,438 | ||||||||
| Diversified Chemicals–1.41% | ||||||||
Dow Chemical Co. (The) | 2,798,220 | 104,653,428 | ||||||
PPG Industries, Inc. | 373,315 | 58,315,536 | ||||||
| 162,968,964 | ||||||||
| Electric Utilities–1.20% | ||||||||
Edison International | 824,720 | 37,846,401 | ||||||
FirstEnergy Corp. | 727,264 | 27,250,582 | ||||||
Pinnacle West Capital Corp. | 1,361,241 | 73,874,549 | ||||||
| 138,971,532 | ||||||||
| Electronic Components–0.49% | ||||||||
Corning Inc. | 4,063,922 | 57,057,465 | ||||||
| Food Distributors–0.83% | ||||||||
Sysco Corp. | 3,006,941 | 96,282,251 | ||||||
| Health Care Equipment–1.06% | ||||||||
Medtronic, Inc. | 2,364,021 | 122,338,087 | ||||||
| Home Improvement Retail–0.49% | ||||||||
Home Depot, Inc. (The) | 758,689 | 56,514,744 | ||||||
| Hotels, Resorts & Cruise Lines–0.73% | ||||||||
Carnival Corp. | 2,327,789 | 84,009,905 | ||||||
| Shares | Value | |||||||
| Household Products–1.06% | ||||||||
Procter & Gamble Co. (The) | 1,575,705 | $ | 122,731,663 | |||||
| Industrial Conglomerates–1.95% | ||||||||
General Electric Co. | 9,732,615 | 225,212,711 | ||||||
| Industrial Machinery–0.73% | ||||||||
Ingersoll-Rand PLC | 1,421,031 | 84,039,773 | ||||||
| Insurance Brokers–2.66% | ||||||||
Aon PLC | 1,146,398 | 76,097,899 | ||||||
Marsh & McLennan Cos., Inc. | 4,261,836 | 175,715,499 | ||||||
Willis Group Holdings PLC | 1,338,626 | 55,258,481 | ||||||
| 307,071,879 | ||||||||
| Integrated Oil & Gas–2.51% | ||||||||
Chevron Corp. | 1,258,234 | 151,529,121 | ||||||
Exxon Mobil Corp. | 932,104 | 81,242,185 | ||||||
Occidental Petroleum Corp. | 649,317 | 57,276,252 | ||||||
| 290,047,558 | ||||||||
| Integrated Telecommunication Services–0.38% | ||||||||
Verizon Communications Inc. | 918,305 | 43,509,291 | ||||||
| Internet Software & Services–1.29% | ||||||||
eBay Inc.(b) | 2,990,390 | 149,489,596 | ||||||
| Investment Banking & Brokerage–3.05% | ||||||||
Charles Schwab Corp. (The) | 5,633,081 | 117,618,731 | ||||||
Goldman Sachs Group, Inc. (The) | 422,272 | 64,240,239 | ||||||
Morgan Stanley | 6,616,330 | 170,436,661 | ||||||
| 352,295,631 | ||||||||
| IT Consulting & Other Services–0.81% | ||||||||
Amdocs Ltd. | 2,541,784 | 93,690,158 | ||||||
| Managed Health Care–2.75% | ||||||||
Cigna Corp. | 1,106,306 | 87,055,219 | ||||||
UnitedHealth Group Inc. | 1,345,587 | 96,532,412 | ||||||
WellPoint, Inc. | 1,576,738 | 134,243,473 | ||||||
| 317,831,104 | ||||||||
| Movies & Entertainment–2.40% | ||||||||
Time Warner Inc. | 834,269 | 50,498,303 | ||||||
Viacom Inc.–Class B | 2,851,790 | 226,888,412 | ||||||
| 277,386,715 | ||||||||
| Oil & Gas Equipment & Services–1.26% | ||||||||
Baker Hughes Inc. | 1,623,342 | 75,469,170 | ||||||
Halliburton Co. | 1,469,903 | 70,555,344 | ||||||
| 146,024,514 | ||||||||
| Oil & Gas Exploration & Production–1.90% | ||||||||
Anadarko Petroleum Corp. | 1,354,634 | 123,840,640 | ||||||
Canadian Natural Resources Ltd. (Canada) | 3,136,396 | 95,702,808 | ||||||
| 219,543,448 | ||||||||
See accompanying Notes to Financial Statements which are an integral part of the financial statements.
9 Invesco Equity and Income Fund
| Shares | Value | |||||||
| Oil & Gas Storage & Transportation–0.50% | ||||||||
Williams Cos., Inc. (The) | 1,601,914 | $ | 58,053,363 | |||||
| Other Diversified Financial Services–6.24% | ||||||||
Bank of America Corp. | 4,452,563 | 62,870,189 | ||||||
Citigroup Inc. | 5,663,061 | 273,695,738 | ||||||
ING U.S. Inc. | 1,485,957 | 42,795,562 | ||||||
JPMorgan Chase & Co. | 6,766,241 | 341,898,158 | ||||||
| 721,259,647 | ||||||||
| Packaged Foods & Meats–1.58% | ||||||||
Mondelez International Inc.–Class A | 4,569,571 | 140,148,743 | ||||||
Unilever N.V.–New York Shares (Netherlands) | 1,131,394 | 42,574,356 | ||||||
| 182,723,099 | ||||||||
| Personal Products–1.68% | ||||||||
Avon Products, Inc. | 9,826,400 | 194,267,928 | ||||||
| Pharmaceuticals–5.03% | ||||||||
Bristol-Myers Squibb Co. | 1,837,231 | 76,594,161 | ||||||
Eli Lilly & Co. | 1,782,798 | 91,635,817 | ||||||
Merck & Co., Inc. | 3,084,856 | 145,882,840 | ||||||
Novartis AG (Switzerland) | 1,295,149 | 94,449,548 | ||||||
Novartis AG–ADR (Switzerland) | 123,639 | 9,023,174 | ||||||
Pfizer Inc. | 3,314,350 | 93,497,814 | ||||||
Teva Pharmaceutical Industries Ltd.–ADR (Israel) | 1,830,019 | 69,943,326 | ||||||
| 581,026,680 | ||||||||
| Property & Casualty Insurance–0.55% | ||||||||
Chubb Corp. (The) | 763,965 | 63,538,969 | ||||||
| Publishing–0.35% | ||||||||
Thomson Reuters Corp. (Canada) | 1,215,214 | 39,826,438 | ||||||
| Railroads–0.56% | ||||||||
CSX Corp. | 2,635,348 | 64,855,914 | ||||||
| Regional Banks–2.87% | ||||||||
BB&T Corp. | 2,499,917 | 84,897,181 | ||||||
Fifth Third Bancorp | 4,136,996 | 75,665,657 | ||||||
PNC Financial Services Group, Inc. (The) | 2,361,840 | 170,690,177 | ||||||
| 331,253,015 | ||||||||
| Security & Alarm Services–1.75% | ||||||||
ADT Corp. (The) | 1,970,797 | 78,496,845 | ||||||
Tyco International Ltd. | 3,750,487 | 123,916,090 | ||||||
| 202,412,935 | ||||||||
| Semiconductor Equipment–1.29% | ||||||||
Applied Materials, Inc. | 9,951,446 | 149,371,205 | ||||||
| Semiconductors–0.72% | ||||||||
Texas Instruments Inc. | 2,161,241 | 82,559,406 | ||||||
| Soft Drinks–0.64% | ||||||||
Coca-Cola Co. (The) | 1,938,601 | 74,015,786 | ||||||
| Shares | Value | |||||||
| Specialized Finance–0.56% | ||||||||
CME Group Inc.–Class A | 915,467 | $ | 65,098,858 | |||||
| Systems Software–2.45% | ||||||||
Microsoft Corp. | 5,308,333 | 177,298,322 | ||||||
Symantec Corp. | 4,150,210 | 106,286,878 | ||||||
| 283,585,200 | ||||||||
| Wireless Telecommunication Services–1.20% | ||||||||
Vodafone Group PLC–ADR (United Kingdom) | 4,300,211 | 139,111,826 | ||||||
Total Common Stocks & Other Equity Interests (Cost $6,025,090,564) |
| 7,787,692,361 | ||||||
| Principal Amount | ||||||||
Bonds and Notes–19.86% | ||||||||
| Advertising–0.06% | ||||||||
Interpublic Group of Cos. Inc. (The), Sr. Unsec. Global Notes, 2.25%, 11/15/17 | $ | 4,145,000 | 4,047,378 | |||||
WPP Finance (United Kingdom), Sr. Unsec. Gtd. Global Notes, 8.00%, 09/15/14 | 3,225,000 | 3,448,323 | ||||||
| 7,495,701 | ||||||||
| Aerospace & Defense–0.03% | ||||||||
Precision Castparts Corp., Sr. Unsec. Global Notes, 2.50%, 01/15/23 | 4,150,000 | 3,795,014 | ||||||
| Agricultural Products–0.04% | ||||||||
Ingredion Inc., Sr. Unsec. Notes, 6.63%, 04/15/37 | 3,940,000 | 4,485,917 | ||||||
| Air Freight & Logistics–0.03% | ||||||||
United Parcel Service Inc., Sr. Unsec. Global Notes, 2.45%, 10/01/22 | 3,320,000 | 3,075,903 | ||||||
| Airlines–0.11% | ||||||||
Continental Airlines Pass Through Trust, | ||||||||
Series 2010-1, Class A, Sec. Pass Through Ctfs., 4.75%, 01/12/21 | 4,322,200 | 4,562,622 | ||||||
Series 2012-1, Class A, Sec. Pass Through Ctfs., 4.15%, 04/11/24 | 5,750,000 | 5,681,719 | ||||||
Delta Air Lines Pass Through Trust, Series 2010-1, Class A, Sec. Pass Through Ctfs., 6.20%, 07/02/18 | 2,502,517 | 2,742,602 | ||||||
| 12,986,943 | ||||||||
| Airport Services–0.05% | ||||||||
Heathrow Funding Ltd. (United Kingdom), Sr. Sec. Notes, 2.50%, 06/25/15(c) | 6,220,000 | 6,302,147 | ||||||
| Asset Management & Custody Banks–0.12% | ||||||||
Bank of New York Mellon (The), Series D, Jr. Unsec. Sub. Global Notes, 4.50%(d) | 7,600,000 | 6,802,000 | ||||||
See accompanying Notes to Financial Statements which are an integral part of the financial statements.
10 Invesco Equity and Income Fund
| Principal Amount | Value | |||||||
| Asset Management & Custody Banks–(continued) | ||||||||
Blackstone Holdings Finance Co. LLC, Sr. Unsec. Gtd. Notes, 6.25%, 08/15/42(c) | $ | 1,970,000 | $ | 2,061,388 | ||||
Prospect Capital Corp., Sr. Unsec. Global Notes, 5.88%, 03/15/23 | 4,900,000 | 4,667,046 | ||||||
| 13,530,434 | ||||||||
| Automobile Manufacturers–0.19% | ||||||||
Daimler Finance North America LLC (Germany), Sr. Unsec. Gtd. Notes, | ||||||||
1.88%, 09/15/14(c) | 7,170,000 | 7,233,992 | ||||||
1.88%, 01/11/18(c) | 5,220,000 | 5,104,377 | ||||||
Ford Motor Co., Sr. Unsec. Global Notes, 4.75%, 01/15/43 | 11,500,000 | 10,170,016 | ||||||
| 22,508,385 | ||||||||
| Automotive Retail–0.16% | ||||||||
Advance Auto Parts, Inc., Sr. Unsec. Gtd. Notes, 5.75%, 05/01/20 | 9,195,000 | 9,647,812 | ||||||
AutoZone, Inc., Sr. Unsec. Global Notes, | ||||||||
2.88%, 01/15/23 | 3,260,000 | 2,951,225 | ||||||
6.50%, 01/15/14 | 5,400,000 | 5,510,822 | ||||||
| 18,109,859 | ||||||||
| Biotechnology–0.57% | ||||||||
Celgene Corp., Sr. Unsec. Global Notes, 4.00%, 08/15/23 | 4,735,000 | 4,668,555 | ||||||
Dendreon Corp., Sr. Unsec. Conv. Notes, 2.88%, 01/15/16 | 10,221,000 | 6,701,143 | ||||||
Gilead Sciences Inc., Series D, Sr. Unsec. Conv. Notes, 1.63%, 05/01/16 | 20,504,000 | 54,438,222 | ||||||
| 65,807,920 | ||||||||
| Brewers–0.15% | ||||||||
Anheuser-Busch InBev Worldwide, Inc. (Belgium), Sr. Unsec. Gtd. Global Notes, | ||||||||
0.80%, 07/15/15 | 3,745,000 | 3,754,339 | ||||||
3.63%, 04/15/15 | 6,145,000 | 6,439,027 | ||||||
FBG Financial Ltd. (Australia), Sr. Unsec. Gtd. Notes, 5.13%, 06/15/15(c) | 6,965,000 | 7,437,925 | ||||||
| 17,631,291 | ||||||||
| Broadcasting–0.13% | ||||||||
COX Communications Inc., | ||||||||
Sr. Unsec. Global Notes, | ||||||||
5.45%, 12/15/14 | 128,000 | 135,508 | ||||||
Sr. Unsec. Notes, | ||||||||
4.70%, 12/15/42(c) | 4,980,000 | 4,054,798 | ||||||
6.25%, 06/01/18(c) | 3,700,000 | 4,173,389 | ||||||
7.25%, 11/15/15 | 5,000,000 | 5,560,072 | ||||||
8.38%, 03/01/39(c) | 655,000 | 782,453 | ||||||
| 14,706,220 | ||||||||
| Principal Amount | Value | |||||||
| Cable & Satellite–0.54% | ||||||||
Comcast Corp., | ||||||||
Sr. Unsec. Gtd. Global Notes, | ||||||||
4.25%, 01/15/33 | $ | 8,165,000 | $ | 7,767,639 | ||||
5.70%, 05/15/18 | 4,735,000 | 5,488,670 | ||||||
Sr. Unsec. Gtd. Notes, | ||||||||
6.45%, 03/15/37 | 2,465,000 | 2,939,594 | ||||||
DIRECTV Holdings LLC/DIRECTV Financing Co., Inc., | ||||||||
Sr. Unsec. Gtd. Global Notes, | ||||||||
2.40%, 03/15/17 | 2,910,000 | 2,887,654 | ||||||
5.15%, 03/15/42 | 4,730,000 | 4,067,480 | ||||||
Sr. Unsec. Gtd. Notes, | ||||||||
1.75%, 01/15/18 | 4,215,000 | 4,022,853 | ||||||
NBC Universal Media LLC, Sr. Unsec. Gtd. Global Notes, | ||||||||
2.10%, 04/01/14 | 3,425,000 | 3,459,678 | ||||||
5.15%, 04/30/20 | 3,320,000 | 3,740,340 | ||||||
5.95%, 04/01/41 | 3,365,000 | 3,805,822 | ||||||
Time Warner Cable, Inc., Sr. Unsec. Gtd. Notes, 5.88%, 11/15/40 | 7,235,000 | 6,489,179 | ||||||
Virgin Media Secured Finance PLC (United Kingdom), Sr. Sec. Gtd. Global Notes, 6.50%, 01/15/18 | 17,130,000 | 18,011,684 | ||||||
| 62,680,593 | ||||||||
| Casinos & Gaming–0.84% | ||||||||
International Game Technology, Sr. Unsec. Conv. Notes, 3.25%, 05/01/14 | 20,000,000 | 22,262,500 | ||||||
MGM Resorts International, Sr. Unsec. Gtd. Conv. Notes, 4.25%, 04/15/15 | 63,088,000 | 75,153,580 | ||||||
| 97,416,080 | ||||||||
| Catalog Retail–0.07% | ||||||||
Liberty Interactive LLC, Sr. Unsec. Conv. Notes, | 7,303,000 | 7,951,141 | ||||||
| Communications Equipment–0.51% | ||||||||
Ciena Corp., Sr. Unsec. Conv. Notes, 4.00%, 12/15/20(c) | 29,353,000 | 38,892,725 | ||||||
JDS Uniphase Corp., Sr. Unsec. Conv. Notes, | 19,999,000 | 20,011,499 | ||||||
| 58,904,224 | ||||||||
| Computer Hardware–0.05% | ||||||||
Hewlett-Packard Co., Sr. Unsec. Global Notes, 2.63%, 12/09/14 | 5,620,000 | 5,737,337 | ||||||
| Computer Storage & Peripherals–0.76% | ||||||||
SanDisk Corp., Sr. Unsec. Conv. Notes, 1.50%, 08/15/17 | 69,333,000 | 87,879,577 | ||||||
| Construction & Farm Machinery & Heavy Trucks–0.16% | ||||||||
Deere & Co., Sr. Unsec. Notes, 2.60%, 06/08/22 | 14,645,000 | 13,706,941 | ||||||
Greenbrier Cos., Inc., Sr. Unsec. Conv. Notes, 3.50%, 04/01/18 | 4,213,000 | 4,394,685 | ||||||
| 18,101,626 | ||||||||
See accompanying Notes to Financial Statements which are an integral part of the financial statements.
11 Invesco Equity and Income Fund
| Principal Amount | Value | |||||||
| Construction Materials–0.61% | ||||||||
Cemex S.A.B. de C.V. (Mexico), Unsec. Sub. Conv. Notes, 4.88%, 03/15/15 | $ | 60,100,000 | $ | 70,993,125 | ||||
| Consumer Finance–0.14% | ||||||||
Capital One Financial Corp., Sr. Unsec. Notes, 6.75%, 09/15/17 | 220,000 | 256,032 | ||||||
Ford Motor Credit Co. LLC., Sr. Unsec. Global Notes, 2.50%, 01/15/16 | 4,970,000 | 5,022,271 | ||||||
SLM Corp., Sr. Unsec. Medium-Term Notes, 3.88%, 09/10/15 | 10,190,000 | 10,369,973 | ||||||
| 15,648,276 | ||||||||
| Data Processing & Outsourced Services–0.04% | ||||||||
Computer Sciences Corp., Sr. Unsec. Global Notes, 4.45%, 09/15/22 | 4,954,000 | 4,844,642 | ||||||
| Distillers & Vintners–0.03% | ||||||||
Brown-Forman Corp., Sr. Unsec. Notes, 2.25%, 01/15/23 | 3,480,000 | 3,121,407 | ||||||
| Diversified Banks–1.37% | ||||||||
Abbey National Treasury Services PLC (United Kingdom), | ||||||||
Sr. Unsec. Gtd. Global Notes, | ||||||||
2.88%, 04/25/14 | 2,560,000 | 2,580,637 | ||||||
Sr. Unsec. Gtd. Medium-Term Euro Notes, 3.88%, 11/10/14(c) | 9,000,000 | 9,222,330 | ||||||
Bank of Nova Scotia (Canada), Sr. Unsec. Global Notes, 2.38%, 12/17/13 | 6,110,000 | 6,147,487 | ||||||
Barclays Bank PLC (United Kingdom), | ||||||||
Sr. Unsec. Global Notes, | ||||||||
2.75%, 02/23/15 | 2,535,000 | 2,599,200 | ||||||
6.75%, 05/22/19 | 8,500,000 | 10,086,986 | ||||||
Unsec. Sub. Global Notes, | ||||||||
5.14%, 10/14/20 | 5,015,000 | 5,203,094 | ||||||
BPCE S.A. (France), Sr. Unsec. Notes, 2.38%, 10/04/13(c) | 7,025,000 | 7,031,277 | ||||||
Danske Bank A/S (Denmark), Sr. Unsec. Notes, | 9,435,000 | 9,920,080 | ||||||
HBOS PLC (United Kingdom), Unsec. Sub. Medium-Term Global Notes, 6.75%, 05/21/18(c) | 8,535,000 | 9,330,957 | ||||||
HSBC Bank PLC (United Kingdom), Sr. Unsec. Notes, | 8,540,000 | 8,878,587 | ||||||
HSBC Finance Corp., Unsec. Sub. Global Notes, 6.68%, 01/15/21 | 828,000 | 950,776 | ||||||
ING Bank N.V. (Netherlands), | ||||||||
Sr. Unsec. Notes, | ||||||||
2.00%, 10/18/13(c) | 4,500,000 | 4,506,819 | ||||||
3.75%, 03/07/17(c) | 9,590,000 | 9,940,111 | ||||||
Korea Development Bank (The) (South Korea), Sr. Unsec. Global Notes, 4.38%, 08/10/15 | 3,460,000 | 3,660,151 | ||||||
| Principal Amount | Value | |||||||
| Diversified Banks–(continued) | ||||||||
National Australia Bank Ltd. (Australia), Sr. Unsec. Bonds, 3.75%, 03/02/15(c) | $ | 3,390,000 | $ | 3,536,550 | ||||
Nordea Bank AB (Sweden), | ||||||||
Sr. Unsec. Notes, | ||||||||
4.88%, 01/27/20(c) | 4,495,000 | 4,839,159 | ||||||
Series 2, Sr. Unsec. Notes, | ||||||||
3.70%, 11/13/14(c) | 880,000 | 910,605 | ||||||
Rabobank Nederland N.V. (Netherlands), Sr. Unsec. Medium-Term Global Notes, 4.75%, 01/15/20(c) | 9,100,000 | 9,729,128 | ||||||
Santander U.S. Debt S.A. Unipersonal (Spain), Sr. Unsec. Gtd. Notes, 3.72%, 01/20/15(c) | 3,200,000 | 3,194,545 | ||||||
Societe Generale S.A. (France), Sr. Unsec. Notes, 2.50%, 01/15/14(c) | 11,940,000 | 11,974,117 | ||||||
Standard Chartered PLC (Hong Kong), Sr. Unsec. Notes, 3.85%, 04/27/15(c) | 4,190,000 | 4,366,721 | ||||||
5.50%, 11/18/14(c) | 1,140,000 | 1,199,045 | ||||||
U.S. Bank N.A., Unsec. Sub. Notes, 3.78%, 04/29/20 | 8,200,000 | 8,550,452 | ||||||
Wells Fargo & Co., | ||||||||
Sr. Unsec. Global Notes, | ||||||||
1.50%, 01/16/18 | 2,070,000 | 2,009,228 | ||||||
3.63%, 04/15/15 | 750,000 | 783,353 | ||||||
Sr. Unsec. Notes, | ||||||||
5.63%, 12/11/17 | 8,095,000 | 9,241,284 | ||||||
Unsec. Sub. Global Notes, | ||||||||
4.13%, 08/15/23 | 8,038,000 | 7,850,926 | ||||||
| 158,243,605 | ||||||||
| Diversified Capital Markets–0.22% | ||||||||
Credit Suisse AG (Switzerland), Unsec. Sub. Notes, 6.50%, 08/08/23(c) | 18,085,000 | 18,193,509 | ||||||
UBS AG (Switzerland), | ||||||||
Sr. Unsec. Global Bank Notes, | ||||||||
5.88%, 12/20/17 | 3,022,000 | 3,480,465 | ||||||
Sr. Unsec. Medium-Term Bank Notes, 3.88%, 01/15/15 | 834,000 | 868,644 | ||||||
Sr. Unsec. Medium-Term Global Bank Notes, 5.75%, 04/25/18 | 2,414,000 | 2,768,740 | ||||||
| 25,311,358 | ||||||||
| Diversified Chemicals–0.03% | ||||||||
Dow Chemical Co. (The), Sr. Unsec. Global Notes, 4.38%, 11/15/42 | 4,145,000 | 3,649,240 | ||||||
| Diversified Metals & Mining–0.32% | ||||||||
Anglo American Capital PLC (United Kingdom), Sr. Unsec. Gtd. Notes, 9.38%, 04/08/19(c) | 3,185,000 | 3,941,060 | ||||||
Freeport-McMoRan Copper & Gold Inc., Sr. Unsec. Global Notes, 1.40%, 02/13/15 | 5,940,000 | 5,946,324 | ||||||
See accompanying Notes to Financial Statements which are an integral part of the financial statements.
12 Invesco Equity and Income Fund
| Principal Amount | Value | |||||||
| Diversified Metals & Mining–(continued) | ||||||||
Rio Tinto Finance USA Ltd. (United Kingdom), Sr. Unsec. Gtd. Global Notes, | ||||||||
7.13%, 07/15/28 | $ | 2,175,000 | $ | 2,652,014 | ||||
9.00%, 05/01/19 | 5,240,000 | 6,721,487 | ||||||
Southern Copper Corp., Sr. Unsec. Global Notes, | ||||||||
5.25%, 11/08/42 | 7,260,000 | 5,649,061 | ||||||
5.38%, 04/16/20 | 1,170,000 | 1,228,394 | ||||||
6.75%, 04/16/40 | 1,695,000 | 1,583,580 | ||||||
Xstrata Finance Canada Ltd. (Canada), Sr. Unsec. Gtd. Notes, | ||||||||
2.05%, 10/23/15(c) | 4,700,000 | 4,678,973 | ||||||
2.70%, 10/25/17(c) | 4,700,000 | 4,580,772 | ||||||
| 36,981,665 | ||||||||
| Diversified REIT’s–0.12% | ||||||||
Dexus Diversified Trust/Dexus Office Trust (Australia), Sr. Unsec. Gtd. Notes, 5.60%, 03/15/21(c) | 12,535,000 | 13,409,956 | ||||||
Qatari Diar Finance Co. (Qatar), Sr. Unsec. Gtd. Notes, 5.00%, 07/21/20(c) | 440,000 | 476,480 | ||||||
| 13,886,436 | ||||||||
| Diversified Support Services–0.04% | ||||||||
Cintas Corp. No. 2, Sr. Unsec. Gtd. Notes, 2.85%, 06/01/16 | 4,605,000 | 4,791,287 | ||||||
| Drug Retail–0.09% | ||||||||
CVS Pass Through Trust, Sr. Sec. Global Pass Through Ctfs., 6.04%, 12/10/28 | 8,963,587 | 9,840,324 | ||||||
| Electric Utilities–0.16% | ||||||||
Baltimore Gas & Electric Co., Sr. Unsec. Notes, 3.35%, 07/01/23 | 6,220,000 | 6,020,121 | ||||||
Electricite de France S.A. (France), Sr. Unsec. Notes, 4.60%, 01/27/20(c) | 2,150,000 | 2,301,369 | ||||||
Enel Finance International N.V. (Italy), Sr. Unsec. Gtd. Notes, 3.88%, 10/07/14(c) | 600,000 | 615,253 | ||||||
Iberdrola Finance Ireland Ltd. (Spain), Sr. Unsec. Gtd. Notes, 3.80%, 09/11/14(c) | 2,175,000 | 2,226,394 | ||||||
Louisville Gas & Electric Co., Sr. Sec. First Mortgage Global Bonds, 1.63%, 11/15/15 | 5,525,000 | 5,631,841 | ||||||
Ohio Power Co., Series M, Sr. Unsec. Notes, 5.38%, 10/01/21 | 1,050,000 | 1,176,138 | ||||||
PPL Electric Utilities Corp., Sec. First Mortgage Bonds, 6.25%, 05/15/39 | 355,000 | 436,371 | ||||||
| 18,407,487 | ||||||||
| Electrical Components & Equipment–0.07% | ||||||||
Eaton Corp. PLC, Sr. Unsec. Gtd. Notes, 0.95%, 11/02/15(c) | 8,285,000 | 8,282,352 | ||||||
| Principal Amount | Value | |||||||
| Environmental & Facilities Services–0.05% | ||||||||
Waste Management, Inc., Sr. Unsec. Gtd. Notes, 5.00%, 03/15/14 | $ | 6,205,000 | $ | 6,349,097 | ||||
| Fertilizers & Agricultural Chemicals–0.03% | ||||||||
Monsanto Co., Sr. Unsec. Global Notes, 3.60%, 07/15/42 | 4,150,000 | 3,523,973 | ||||||
| General Merchandise Stores–0.08% | ||||||||
Target Corp., Sr. Unsec. Global Notes, 2.90%, 01/15/22 | 9,830,000 | 9,528,116 | ||||||
| Gold–0.23% | ||||||||
Barrick Gold Corp. (Canada), Sr. Unsec. Global Notes, 2.90%, 05/30/16 | 6,045,000 | 6,086,026 | ||||||
Barrick North America Finance LLC (Canada), Sr. Unsec. Gtd. Global Notes, 5.70%, 05/30/41 | 4,000,000 | 3,404,191 | ||||||
Gold Fields Orogen Holding BVI Ltd. (South Africa), Sr. Unsec. Gtd. Notes, 4.88%, 10/07/20(c) | 12,145,000 | 9,669,890 | ||||||
Newmont Mining Corp., Sr. Unsec. Gtd. Global Notes, 3.50%, 03/15/22 | 8,645,000 | 7,586,456 | ||||||
| 26,746,563 | ||||||||
| Health Care Equipment–0.44% | ||||||||
Medtronic Inc., Sr. Unsec. Global Notes, 4.00%, 04/01/43 | 5,720,000 | 5,156,999 | ||||||
NuVasive Inc., Sr. Unsec. Conv. Notes, 2.75%, 07/01/17 | 13,684,000 | 13,247,822 | ||||||
Volcano Corp., Sr. Unsec. Conv. Notes, 1.75%, 12/01/17 | 32,517,000 | 31,988,599 | ||||||
| 50,393,420 | ||||||||
| Health Care Facilities–0.66% | ||||||||
Brookdale Senior Living Inc., Sr. Unsec. Conv. Notes, 2.75%, 06/15/18 | 24,795,000 | 27,909,872 | ||||||
LifePoint Hospitals Inc., Sr. Unsec. Sub. Conv. Notes, 3.50%, 05/15/14 | 46,059,000 | 48,908,900 | ||||||
| 76,818,772 | ||||||||
| Health Care Services–0.57% | ||||||||
Express Scripts Holding Co., Sr. Unsec. Gtd. Notes, 3.13%, 05/15/16 | 3,800,000 | 3,962,380 | ||||||
Medco Health Solutions Inc., Sr. Unsec. Gtd. Notes, 2.75%, 09/15/15 | 3,535,000 | 3,650,568 | ||||||
Omnicare Inc., | ||||||||
Sr. Unsec. Gtd. Sub. Conv. Notes, | ||||||||
3.75%, 04/01/42 | 29,270,000 | 40,703,594 | ||||||
Series OCR, Sr. Unsec. Gtd. Conv. Deb., 3.25%, 12/15/15(e) | 16,126,000 | 17,406,001 | ||||||
| 65,722,543 | ||||||||
See accompanying Notes to Financial Statements which are an integral part of the financial statements.
13 Invesco Equity and Income Fund
| Principal Amount | Value | |||||||
| Homebuilding–0.08% | ||||||||
MDC Holdings Inc., Sr. Unsec. Gtd. Notes, 6.00%, 01/15/43 | $ | 10,130,000 | $ | 9,030,754 | ||||
| Hotels, Resorts & Cruise Lines–0.09% | ||||||||
Wyndham Worldwide Corp., | ||||||||
Sr. Unsec. Notes, | ||||||||
2.95%, 03/01/17 | 1,225,000 | 1,242,927 | ||||||
5.63%, 03/01/21 | 8,170,000 | 8,752,373 | ||||||
| 9,995,300 | ||||||||
| Housewares & Specialties–0.11% | ||||||||
Tupperware Brands Corp., Sr. Unsec. Gtd. Global Notes, 4.75%, 06/01/21 | 12,185,000 | 12,236,348 | ||||||
| Hypermarkets & Super Centers–0.01% | ||||||||
Wal-Mart Stores, Inc., Sr. Unsec. Global Notes, 6.50%, 08/15/37 | 730,000 | 915,412 | ||||||
| Industrial Conglomerates–0.04% | ||||||||
General Electric Co., Sr. Unsec. Global Notes, 5.25%, 12/06/17 | 4,445,000 | 5,025,347 | ||||||
| Industrial Machinery–0.07% | ||||||||
Pentair Finance S.A., Sr. Unsec. Gtd. Global Notes, 5.00%, 05/15/21 | 7,940,000 | 8,344,714 | ||||||
| Integrated Oil & Gas–0.14% | ||||||||
Chevron Corp., Sr. Unsec. Global Notes, 1.72%, 06/24/18 | 5,275,000 | 5,204,946 | ||||||
Husky Energy Inc. (Canada), Sr. Unsec. Global Notes, 3.95%, 04/15/22 | 3,630,000 | 3,634,248 | ||||||
Petrobras Global Finance B.V. (Brazil), Sr. Unsec. Gtd. Global Notes, 5.63%, 05/20/43 | 6,505,000 | 5,240,521 | ||||||
Shell International Finance B.V. (Netherlands), Sr. Unsec. Gtd. Global Notes, 3.10%, 06/28/15 | 1,965,000 | 2,054,394 | ||||||
| 16,134,109 | ||||||||
| Integrated Telecommunication Services–0.26% | ||||||||
AT&T Corp., Sr. Unsec. Gtd. Global Notes, 8.00%, 11/15/31 | 63,000 | 87,150 | ||||||
AT&T Inc., Sr. Unsec. Global Notes, | ||||||||
1.60%, 02/15/17 | 5,940,000 | 5,920,342 | ||||||
3.00%, 02/15/22 | 6,410,000 | 6,014,366 | ||||||
5.35%, 09/01/40 | 2,077,000 | 2,058,514 | ||||||
6.15%, 09/15/34 | 3,675,000 | 4,017,377 | ||||||
Deutsche Telekom International Finance B.V. (Germany), Sr. Unsec. Gtd. Global Bonds, 8.75%, 06/15/30 | 2,545,000 | 3,564,754 | ||||||
Verizon Communications, Inc., | ||||||||
Sr. Unsec. Global Notes, | ||||||||
3.00%, 04/01/16 | 3,575,000 | 3,722,655 | ||||||
6.40%, 02/15/38 | 3,500,000 | 3,913,919 | ||||||
Windstream Georgia Communications Corp., Sr. Unsec. Notes, 6.50%, 11/15/13 | 336,000 | 338,022 | ||||||
| 29,637,099 | ||||||||
| Principal Amount | Value | |||||||
| Internet Software & Services–0.06% | ||||||||
Baidu Inc. (China), Sr. Unsec. Global Notes, 3.25%, 08/06/18 | $ | 6,700,000 | $ | 6,652,126 | ||||
| Investment Banking & Brokerage–1.30% | ||||||||
Charles Schwab Corp. (The), Sr. Unsec. Notes, 4.45%, 07/22/20 | 7,880,000 | 8,493,150 | ||||||
Goldman Sachs Group, Inc. (The), | ||||||||
Sr. Unsec. Global Notes, | ||||||||
5.25%, 07/27/21 | 5,510,000 | 5,886,924 | ||||||
6.15%, 04/01/18 | 10,325,000 | 11,688,537 | ||||||
Sr. Unsec. Medium-Term Global Notes, 3.70%, 08/01/15 | 1,350,000 | 1,414,700 | ||||||
Unsec. Sub. Global Notes, | ||||||||
6.75%, 10/01/37 | 4,585,000 | 4,747,482 | ||||||
Series C, Exchangeable Basket-Linked Conv. Medium-Term Notes, 1.00%, 03/15/17(c)(f) | 61,461,000 | 67,890,435 | ||||||
Macquarie Bank Ltd. (Australia), Sr. Unsec. Notes, 5.00%, 02/22/17(c) | 6,100,000 | 6,570,878 | ||||||
Macquarie Group Ltd. (Australia), Sr. Unsec. Notes, 6.00%, 01/14/20(c) | 950,000 | 998,680 | ||||||
Morgan Stanley, Sr. Unsec. Global Notes, 3.80%, 04/29/16 | 5,560,000 | 5,824,160 | ||||||
6.38%, 07/24/42 | 8,140,000 | 9,065,928 | ||||||
Sr. Unsec. Medium-Term Global Notes, 4.00%, 07/24/15 | 12,875,000 | 13,463,901 | ||||||
Sr. Unsec. Notes, 3.45%, 11/02/15 | 9,855,000 | 10,222,875 | ||||||
5.75%, 01/25/21 | 3,135,000 | 3,457,237 | ||||||
| 149,724,887 | ||||||||
| IT Consulting & Other Services–0.00% | ||||||||
International Business Machines Corp., Sr. Unsec. Global Notes, 7.63%, 10/15/18 | 100,000 | 126,146 | ||||||
| Life & Health Insurance–0.27% | ||||||||
Aegon N.V. (Netherlands), Sr. Unsec. Global Bonds, 4.63%, 12/01/15 | 3,100,000 | 3,323,103 | ||||||
Lincoln National Corp., Sr. Unsec. Global Notes, 4.00%, 09/01/23 | 4,505,000 | 4,452,431 | ||||||
MetLife, Inc., Sr. Unsec. Global Notes, 4.75%, 02/08/21 | 3,565,000 | 3,865,382 | ||||||
Pacific LifeCorp., Sr. Unsec. Notes, 6.00%, 02/10/20(c) | 3,425,000 | 3,809,252 | ||||||
Prudential Financial, Inc., Sr. Unsec. Medium-Term Notes, | ||||||||
5.10%, 08/15/43 | 4,010,000 | 3,989,716 | ||||||
7.38%, 06/15/19 | 1,020,000 | 1,254,484 | ||||||
Series D, | 5,030,000 | 5,412,426 | ||||||
Sr. Unsec. Medium-Term Notes, 3.88%, 01/14/15 | 950,000 | 989,184 | ||||||
6.63%, 12/01/37 | 3,475,000 | 4,172,593 | ||||||
| 31,268,571 | ||||||||
See accompanying Notes to Financial Statements which are an integral part of the financial statements.
14 Invesco Equity and Income Fund
| Principal Amount | Value | |||||||
| Managed Health Care–0.58% | ||||||||
Aetna, Inc., Sr. Unsec. Global Notes, | ||||||||
3.95%, 09/01/20 | $ | 9,990,000 | $ | 10,327,074 | ||||
4.13%, 11/15/42 | 3,320,000 | 2,916,385 | ||||||
Humana Inc., Sr. Unsec. Global Notes, 4.63%, 12/01/42 | 3,940,000 | 3,507,556 | ||||||
UnitedHealth Group Inc., Sr. Unsec. Global Notes, 1.63%, 03/15/19 | 5,805,000 | 5,541,583 | ||||||
WellPoint Inc., Sr. Unsec. Conv. Notes, 2.75%, 10/15/42(c) | 34,762,000 | 44,712,622 | ||||||
| 67,005,220 | ||||||||
| Movies & Entertainment–0.03% | ||||||||
Time Warner, Inc., Sr. Unsec. Gtd. Notes, 5.88%, 11/15/16 | 2,655,000 | 3,006,988 | ||||||
| Office Electronics–0.01% | ||||||||
Xerox Corp., Sr. Unsec. Notes, 4.25%, 02/15/15 | 820,000 | 855,162 | ||||||
| Office REIT’s–0.05% | ||||||||
Digital Realty Trust L.P., Sr. Unsec. Gtd. Global Notes, 4.50%, 07/15/15 | 5,210,000 | 5,475,558 | ||||||
| Oil & Gas Drilling–0.01% | ||||||||
Noble Holding International Ltd., Sr. Unsec. Gtd. Global Notes, 2.50%, 03/15/17 | 1,150,000 | 1,151,832 | ||||||
| Oil & Gas Equipment & Services–0.13% | ||||||||
Helix Energy Solutions Group, Inc., Sr. Unsec. Conv. Notes, 3.25%, 03/15/18(e) | 11,911,000 | 15,618,299 | ||||||
| Oil & Gas Exploration & Production–0.78% | ||||||||
Cobalt International Energy Inc., Sr. Unsec. Conv. Notes, 2.63%, 12/01/19 | 41,457,000 | 42,856,174 | ||||||
Petrobras International Finance Co. (Brazil), Sr. Unsec. Gtd. Global Notes, 6.88%, 01/20/40 | 260,000 | 246,444 | ||||||
Petroleos Mexicanos (Mexico), Sr. Unsec. Gtd. Global Notes, | ||||||||
4.88%, 01/24/22 | 7,430,000 | 7,490,410 | ||||||
5.50%, 01/21/21 | 6,750,000 | 7,134,178 | ||||||
Southwestern Energy Co., Sr. Unsec. Gtd. Global Notes, 4.10%, 03/15/22 | 7,500,000 | 7,381,473 | ||||||
Stone Energy Corp., Sr. Unsec. Gtd. Conv. Notes, 1.75%, 03/01/17 | 24,746,000 | 25,148,122 | ||||||
XTO Energy, Inc., Sr. Unsec. Notes, 5.75%, 12/15/13 | 310,000 | 314,692 | ||||||
| 90,571,493 | ||||||||
| Oil & Gas Refining & Marketing–0.04% | ||||||||
Phillips 66, Sr. Unsec. Gtd. Global Notes, 1.95%, 03/05/15 | 4,760,000 | 4,836,812 | ||||||
| Principal Amount | Value | |||||||
| Oil & Gas Storage & Transportation–0.18% | ||||||||
Enterprise Products Operating LLC, | ||||||||
Sr. Unsec. Gtd. Global Notes, 5.25%, 01/31/20 | $ | 2,889,000 | $ | 3,201,977 | ||||
Sr. Unsec. Gtd. Notes, 6.45%, 09/01/40 | 555,000 | 644,915 | ||||||
Series N, Sr. Unsec. Gtd. Notes, 6.50%, 01/31/19 | 4,420,000 | 5,205,211 | ||||||
Plains All American Pipeline L.P./ PAA Finance Corp., Sr. Unsec. Global Notes, 3.65%, 06/01/22 | 4,275,000 | 4,210,819 | ||||||
Spectra Energy Capital LLC, Sr. Unsec. Gtd. Notes, 7.50%, 09/15/38 | 2,245,000 | 2,651,157 | ||||||
Texas Eastern Transmission L.P., Sr. Unsec. Notes, 7.00%, 07/15/32 | 3,835,000 | 4,609,696 | ||||||
| 20,523,775 | ||||||||
| Other Diversified Financial Services–1.08% | ||||||||
Bank of America Corp., Sr. Unsec. Global Notes, | ||||||||
4.10%, 07/24/23 | 2,450,000 | 2,403,727 | ||||||
5.75%, 12/01/17 | 2,825,000 | 3,163,681 | ||||||
Sr. Unsec. Medium-Term Notes, 1.25%, 01/11/16 | 6,465,000 | 6,430,614 | ||||||
Series L, | 10,675,000 | 11,917,705 | ||||||
Sr. Unsec. Medium-Term Notes, 7.38%, 05/15/14 | 315,000 | 329,604 | ||||||
Bear Stearns Cos., LLC (The), Sr. Unsec. Global Notes, 7.25%, 02/01/18 | 8,140,000 | 9,685,462 | ||||||
Citigroup Inc., | ||||||||
Sr. Unsec. Global Notes, 6.01%, 01/15/15 | 1,615,000 | 1,722,052 | ||||||
6.13%, 11/21/17 | 11,440,000 | 13,134,583 | ||||||
8.50%, 05/22/19 | 2,385,000 | 3,025,247 | ||||||
Sr. Unsec. Notes, | ||||||||
4.75%, 05/19/15 | 1,000,000 | 1,061,141 | ||||||
Unsec. Sub. Global Notes, 3.50%, 05/15/23 | 5,000,000 | 4,514,562 | ||||||
4.05%, 07/30/22 | 5,455,000 | 5,240,978 | ||||||
General Electric Capital Corp., Class C, Jr. Unsec. Sub. Global Notes, 5.25%,(d) | 9,400,000 | 8,709,100 | ||||||
Series G, Sr. Unsec. Medium-Term Global Notes, 6.00%, 08/07/19 | 8,500,000 | 9,779,808 | ||||||
ING US Inc., Sr. Unsec. Gtd. Global Notes, 5.50%, 07/15/22 | 9,455,000 | 10,091,788 | ||||||
JPMorgan Chase & Co., | ||||||||
Sr. Unsec. Global Notes, 4.40%, 07/22/20 | 5,700,000 | 5,989,234 | ||||||
Sr. Unsec. Notes, | ||||||||
6.00%, 01/15/18 | 7,395,000 | 8,472,946 | ||||||
Unsec. Sub. Global Notes, 5.13%, 09/15/14 | 1,530,000 | 1,598,242 | ||||||
Series Q, Jr. Unsec. Sub. Global Notes, 5.15%,(d) | 7,395,000 | 6,600,037 | ||||||
See accompanying Notes to Financial Statements which are an integral part of the financial statements.
15 Invesco Equity and Income Fund
| Principal Amount | Value | |||||||
| Other Diversified Financial Services–(continued) | ||||||||
Merrill Lynch & Co., Inc., Sr. Unsec. Medium-Term Notes, 6.88%, 04/25/18 | $ | 9,445,000 | $ | 10,989,961 | ||||
| 124,860,472 | ||||||||
| Packaged Foods & Meats–0.13% | ||||||||
Grupo Bimbo S.A.B. de C.V. (Mexico), Sr. Unsec. Gtd. Notes, 4.88%, 06/30/20(c) | 5,095,000 | 5,297,324 | ||||||
Mondelez International Inc., Sr. Unsec. Global Notes, | ||||||||
6.50%, 02/09/40 | 2,130,000 | 2,513,903 | ||||||
6.88%, 02/01/38 | 842,000 | 1,016,695 | ||||||
7.00%, 08/11/37 | 2,830,000 | 3,472,244 | ||||||
Sr. Unsec. Notes, | ||||||||
6.88%, 01/26/39 | 2,125,000 | 2,571,019 | ||||||
| 14,871,185 | ||||||||
| Paper Products–0.03% | ||||||||
International Paper Co., Sr. Unsec. Global Notes, 6.00%, 11/15/41 | 2,855,000 | 3,104,374 | ||||||
| Personal Products–0.01% | ||||||||
Avon Products Inc., Sr. Unsec. Global Notes, 2.38%, 03/15/16 | 1,610,000 | 1,625,983 | ||||||
| Pharmaceuticals–0.59% | ||||||||
AbbVie Inc., Sr. Unsec. Global Notes, 1.20%, 11/06/15 | 18,095,000 | 18,193,842 | ||||||
Mylan Inc., Sr. Unsec. Gtd. Notes, 6.00%, 11/15/18(c) | 10,574,000 | 11,380,267 | ||||||
Salix Pharmaceuticals Ltd., Sr. Unsec. Conv. Notes, 1.50%, 03/15/19 | 25,242,000 | 31,173,870 | ||||||
Teva Pharmaceutical Finance Co. B.V. (Israel), Sr. Unsec. Gtd. Global Notes, 2.95%, 12/18/22 | 3,900,000 | 3,586,714 | ||||||
Zoetis Inc., Sr. Unsec. Notes, 4.70%, 02/01/43(c) | 4,101,000 | 3,856,453 | ||||||
| 68,191,146 | ||||||||
| Property & Casualty Insurance–0.19% | ||||||||
CNA Financial Corp., | ||||||||
Sr. Unsec. Global Bonds, 5.88%, 08/15/20 | 4,915,000 | 5,571,254 | ||||||
Sr. Unsec. Notes, | ||||||||
7.35%, 11/15/19 | 425,000 | 516,330 | ||||||
Markel Corp., Sr. Unsec. Notes, 5.00%, 03/30/43 | 4,185,000 | 3,937,131 | ||||||
Travelers Cos., Inc. (The), Sr. Unsec. Global Notes, 4.60%, 08/01/43 | 6,455,000 | 6,389,457 | ||||||
WR Berkley Corp., Sr. Unsec. Global Notes, 4.63%, 03/15/22 | 5,040,000 | 5,172,727 | ||||||
| 21,586,899 | ||||||||
| Railroads–0.20% | ||||||||
Burlington Northern Santa Fe, LLC, Sr. Unsec. Notes, 5.15%, 09/01/43 | 19,380,000 | 19,637,795 | ||||||
| Principal Amount | Value | |||||||
| Railroads–(continued) | ||||||||
CSX Corp., | ||||||||
Sr. Unsec. Global Notes, 6.15%, 05/01/37 | $ | 1,750,000 | $ | 1,997,255 | ||||
Sr. Unsec. Notes, | ||||||||
5.50%, 04/15/41 | 1,660,000 | 1,769,713 | ||||||
| 23,404,763 | ||||||||
| Regional Banks–0.14% | ||||||||
Nationwide Building Society (United Kingdom), Sr. Unsec. Notes, 6.25%, 02/25/20(c) | 8,845,000 | 9,887,895 | ||||||
PNC Funding Corp., Sr. Unsec. Gtd. Global Notes, 5.13%, 02/08/20 | 5,305,000 | 5,886,751 | ||||||
| 15,774,646 | ||||||||
| Retail REIT’s–0.08% | ||||||||
Simon Property Group L.P., Sr. Unsec. Notes, 4.75%, 03/15/42 | 2,815,000 | 2,690,885 | ||||||
WEA Finance LLC (Australia), Sr. Unsec. Gtd. Notes, 7.13%, 04/15/18(c) | 5,290,000 | 6,293,436 | ||||||
| 8,984,321 | ||||||||
| Semiconductor Equipment–0.53% | ||||||||
Lam Research Corp., Series B, Sr. Unsec. Conv. Notes, 1.25%, 05/15/18 | 33,039,000 | 38,263,292 | ||||||
Novellus Systems Inc., Sr. Unsec. Gtd. Conv. Notes, 2.63%, 05/15/41 | 15,729,000 | 23,151,122 | ||||||
| 61,414,414 | ||||||||
| Semiconductors–0.99% | ||||||||
Linear Technology Corp., | ||||||||
Sr. Unsec. Conv. Notes, 3.00%, 05/01/14(c)(e) | 36,420,000 | 38,855,587 | ||||||
Series A, Sr. Unsec. Conv. Global Notes, 3.00%, 05/01/14(e) | 10,661,000 | 11,373,954 | ||||||
Micron Technology Inc., | ||||||||
Series A, Sr. Unsec. Conv. Notes, 1.50%, 08/01/18(e) | 2,977,000 | 4,346,420 | ||||||
Series E, Sr. Unsec. Conv. Notes, 1.63%, 02/15/18(c)(e) | 20,548,000 | 28,574,563 | ||||||
Xilinx Inc., Jr. Unsec. Sub. Conv. Notes, 3.13%, 03/15/37(c) | 20,622,000 | 31,036,110 | ||||||
| 114,186,634 | ||||||||
| Soft Drinks–0.03% | ||||||||
Fomento Economico Mexicano S.A.B. de C.V. (Mexico), Sr. Unsec. Global Notes, 4.38%, 05/10/43 | 3,925,000 | 3,358,234 | ||||||
| Sovereign Debt–0.18% | ||||||||
Brazilian Government International Bond (Brazil), Sr. Unsec. Global Bonds, 6.00%, 01/17/17 | 16,505,000 | 18,427,832 | ||||||
See accompanying Notes to Financial Statements which are an integral part of the financial statements.
16 Invesco Equity and Income Fund
| Principal Amount | Value | |||||||
| Sovereign Debt–(continued) | ||||||||
Peruvian Government International Bond (Peru), Sr. Unsec. Global Notes, 7.13%, 03/30/19 | $ | 1,650,000 | $ | 1,969,688 | ||||
Russian Foreign Bond (Russia), Sr. Unsec. Euro Notes, 3.63%, 04/29/15(c) | 800,000 | 834,000 | ||||||
| 21,231,520 | ||||||||
| Specialized Finance–0.11% | ||||||||
International Lease Finance Corp., Sr. Unsec. Global Notes, 5.88%, 08/15/22 | 3,315,000 | 3,234,197 | ||||||
Moody’s Corp., Sr. Unsec. Global Notes,, 4.50%, 09/01/22 | 6,835,000 | 6,843,289 | ||||||
National Rural Utilities Cooperative Finance Corp., Sr. Sec. Collateral Trust Bonds, 3.05%, 02/15/22 | 2,550,000 | 2,499,004 | ||||||
| 12,576,490 | ||||||||
| Specialized REIT’s–0.25% | ||||||||
American Tower Corp., Sr. Unsec. Global Notes, | ||||||||
3.40%, 02/15/19 | 7,235,000 | 7,238,787 | ||||||
4.63%, 04/01/15 | 2,425,000 | 2,537,843 | ||||||
Sr. Unsec. Notes, | ||||||||
4.50%, 01/15/18 | 4,620,000 | 4,876,144 | ||||||
Senior Housing Properties Trust, Sr. Unsec. Notes, 4.30%, 01/15/16 | 6,620,000 | 6,859,975 | ||||||
Ventas Realty L.P./Ventas Capital Corp., Sr. Unsec. Gtd. Notes, | ||||||||
2.70%, 04/01/20 | 4,710,000 | 4,452,292 | ||||||
4.25%, 03/01/22 | 2,635,000 | 2,634,357 | ||||||
| 28,599,398 | ||||||||
| Specialty Properties–0.03% | ||||||||
EPR Properties, Sr. Unsec. Gtd. Notes, 5.25%, 07/15/23 | 3,800,000 | 3,695,940 | ||||||
| Steel–0.46% | ||||||||
ArcelorMittal (Luxembourg), | ||||||||
Sr. Unsec. Global Bonds, 10.35%, 06/01/19 | 7,005,000 | 8,308,829 | ||||||
Sr. Unsec. Global Notes, 4.25%, 08/05/15 | 8,775,000 | 9,048,007 | ||||||
6.13%, 06/01/18 | 390,000 | 403,088 | ||||||
7.25%, 03/01/41 | 2,225,000 | 2,017,232 | ||||||
United States Steel Corp., Sr. Unsec. Conv. Notes, 2.75%, 04/01/19 | 24,343,000 | 25,225,434 | ||||||
Vale Overseas Ltd. (Brazil), Sr. Unsec. Gtd. Global Notes, | ||||||||
4.63%, 09/15/20 | 320,000 | 319,266 | ||||||
5.63%, 09/15/19 | 4,655,000 | 5,004,085 | ||||||
Vale S.A. (Brazil), Sr. Unsec. Global Notes, 5.63%, 09/11/42 | 4,075,000 | 3,413,903 | ||||||
| 53,739,844 | ||||||||
| Thrifts & Mortgage Finance–0.41% | ||||||||
MGIC Investment Corp., Sr. Unsec. Conv. Notes, | ||||||||
2.00%, 04/01/20 | 4,060,000 | 5,125,750 | ||||||
5.00%, 05/01/17 | 20,997,000 | 22,939,223 | ||||||
| Principal Amount | Value | |||||||
| Thrifts & Mortgage Finance–(continued) | ||||||||
Radian Group Inc., Sr. Unsec. Conv. Notes, | ||||||||
2.25%, 03/01/19 | $ | 4,063,000 | $ | 5,830,405 | ||||
3.00%, 11/15/17 | 10,019,000 | 13,920,148 | ||||||
| 47,815,526 | ||||||||
| Tobacco–0.01% | ||||||||
Altria Group, Inc., Sr. Unsec. Gtd. Global Notes, 4.13%, 09/11/15 | 715,000 | 759,721 | ||||||
| Trucking–0.10% | ||||||||
Penske Truck Leasing Co., L.P./PTL Finance Corp., Sr. Unsec. Notes, 2.50%, 03/15/16(c) | 7,435,000 | 7,564,810 | ||||||
Ryder System, Inc., Sr. Unsec. Medium-Term Notes, 3.15%, 03/02/15 | 4,030,000 | 4,152,802 | ||||||
| 11,717,612 | ||||||||
| Wireless Telecommunication Services–0.20% | ||||||||
America Movil S.A.B. de C.V. (Mexico), | ||||||||
Sr. Unsec. Global Notes, 4.38%, 07/16/42 | 6,610,000 | 5,202,630 | ||||||
Sr. Unsec. Gtd. Global Notes, 2.38%, 09/08/16 | 4,450,000 | 4,521,265 | ||||||
Crown Castle Towers LLC, Sr. Sec. Gtd. Notes, | ||||||||
3.21%, 08/15/15(c) | 5,095,000 | 5,246,855 | ||||||
6.11%, 01/15/20(c) | 2,565,000 | 2,917,688 | ||||||
Rogers Communications Inc. (Canada), Sr. Unsec. Gtd. Global Notes, 4.50%, 03/15/43 | 6,080,000 | 5,306,516 | ||||||
| 23,194,954 | ||||||||
Total Bonds and Notes |
| 2,295,020,028 | ||||||
U.S. Treasury Securities–6.56% |
| |||||||
| U.S. Treasury Bills–0.02% | ||||||||
0.09%, 05/01/14(g)(h) | 425,000 | 424,801 | ||||||
0.10%, 05/01/14(g)(h) | 200,000 | 199,907 | ||||||
0.11%, 05/01/14(g)(h) | 1,500,000 | 1,499,299 | ||||||
| 2,124,007 | ||||||||
| U.S. Treasury Bonds–0.61% | ||||||||
8.00%, 11/15/21 | 3,557,000 | 5,033,412 | ||||||
3.13%, 11/15/41 | 1,400,000 | 1,258,315 | ||||||
3.00%, 05/15/42 | 22,475,000 | 19,627,990 | ||||||
2.88%, 05/15/43 | 53,065,000 | 44,900,268 | ||||||
| 70,819,985 | ||||||||
| U.S. Treasury Notes–5.93% | ||||||||
1.50%, 12/31/13 | 28,000,000 | 28,131,706 | ||||||
1.75%, 03/31/14 | 12,000,000 | 12,112,847 | ||||||
2.63%, 07/31/14 | 95,125,000 | 97,254,839 | ||||||
2.38%, 10/31/14 | 206,415,000 | 211,652,032 | ||||||
2.13%, 11/30/14 | 77,385,000 | 79,227,768 | ||||||
See accompanying Notes to Financial Statements which are an integral part of the financial statements.
17 Invesco Equity and Income Fund
| Principal Amount | Value | |||||||
| U.S. Treasury Notes–(continued) | ||||||||
2.25%, 01/31/15 | $ | 19,650,000 | $ | 20,197,922 | ||||
2.50%, 03/31/15 | 495,000 | 511,978 | ||||||
2.13%, 05/31/15 | 4,445,000 | 4,581,521 | ||||||
2.00%, 04/30/16 | 17,445,000 | 18,065,510 | ||||||
1.75%, 05/31/16 | 950,000 | 977,114 | ||||||
0.88%, 04/30/17 | 2,000,000 | 1,982,454 | ||||||
0.63%, 05/31/17 | 4,410,000 | 4,323,086 | ||||||
1.38%, 07/31/18 | 44,421,000 | 43,947,276 | ||||||
1.25%, 01/31/19 | 23,000,000 | 22,381,189 | ||||||
3.63%, 08/15/19 | 58,350,000 | 63,938,322 | ||||||
3.38%, 11/15/19 | 20,000,000 | 21,653,041 | ||||||
2.63%, 11/15/20 | 6,500,000 | 6,653,432 | ||||||
2.50%, 08/15/23 | 49,265,000 | 48,090,059 | ||||||
| 685,682,096 | ||||||||
Total U.S. Treasury Securities |
| 758,626,088 | ||||||
| Shares | ||||||||
Preferred Stocks–1.51% |
| |||||||
| Diversified Banks–0.10% | ||||||||
Wells Fargo & Co., 5.85% Pfd. | 486,600 | 11,756,256 | ||||||
| Health Care Facilities–0.29% | ||||||||
HealthSouth Corp., Series A, $65.00 Conv. Pfd. | 27,000 | 33,588,000 | ||||||
| Health Care Services–0.21% | ||||||||
Omnicare Capital Trust II, Series B, $2.00 Jr. Unsec. Sub. Gtd. Conv. Pfd. | 356,855 | 24,144,809 | ||||||
| Oil & Gas Storage & Transportation–0.45% | ||||||||
El Paso Energy Capital Trust I, $2.38, Jr. Unsec. Sub. Gtd. Conv. Pfd. | 875,900 | 51,441,607 | ||||||
| Regional Banks–0.46% | ||||||||
KeyCorp, Series A, $7.75 Conv. Pfd. | 427,098 | 53,391,521 | ||||||
Total Preferred Stocks |
| 174,322,193 | ||||||
Principal Amount | ||||||||
U.S. Government Sponsored Agency Securities–1.07% |
| |||||||
| Federal Home Loan Mortgage Corp. (FHLMC)–0.63% | ||||||||
Sr. Unsec. Global Notes, 3.00%, 07/28/14 | $ | 23,700,000 | 24,301,574 | |||||
6.75%, 03/15/31 | 7,000,000 | 9,437,676 | ||||||
Unsec. Global Notes, 4.88%, 06/13/18 | 33,680,000 | 38,448,456 | ||||||
| 72,187,706 | ||||||||
| Principal Amount | Value | |||||||
| Federal National Mortgage Association (FNMA)–0.44% | ||||||||
Sr. Unsec. Global Bonds, 6.63%, 11/15/30 | $ | 6,315,000 | $ | 8,426,230 | ||||
Sr. Unsec. Global Notes, 2.88%, 12/11/13 | 600,000 | 604,456 | ||||||
4.38%, 10/15/15 | 38,850,000 | 42,018,868 | ||||||
| 51,049,554 | ||||||||
Total U.S. Government Sponsored Agency Securities (Cost $121,811,204) |
| 123,237,260 | ||||||
Municipal Obligations–0.10% |
| |||||||
Georgia (State of) Municipal Electric Authority (Plant Vogtle Units 3 & 4 Project J); | ||||||||
Series 2010 A, Taxable Build America RB, 6.64%, 04/01/57 | 2,600,000 | 2,719,158 | ||||||
Series 2010, Build America RB, 6.66%, 04/01/57 | 4,980,000 | 5,178,104 | ||||||
Texas (State of) Transportation Commission; Series 2010 B, Taxable First Tier Build America RB, 5.03%, 04/01/26 | 3,450,000 | 3,771,092 | ||||||
Total Municipal Obligations |
| 11,668,354 | ||||||
Asset-Backed Securities–0.00% |
| |||||||
Nomura Asset Acceptance Corp., Series 2005 AR1, Floating Rate Pass Through Ctfs., 0.46%, 02/25/35 (Cost $1,315)(i) | 1,315 | 1,319 | ||||||
U.S. Government Sponsored Mortgage-Backed Securities–0.00% |
| |||||||
| Federal Home Loan Mortgage Corp. (FHLMC)–0.00% | ||||||||
Pass Through Ctfs., 6.50%, 05/01/29 | 3 | 3 | ||||||
5.50%, 02/01/37 | 204 | 220 | ||||||
| 223 | ||||||||
| Federal National Mortgage Association (FNMA)–0.00% | ||||||||
Pass Through Ctfs., 7.00%, 07/01/18 to 07/01/32 | 87,724 | 97,520 | ||||||
5.50%, 03/01/21 | 192 | 209 | ||||||
8.00%, 08/01/21 | 4,720 | 5,161 | ||||||
| 102,890 | ||||||||
| Government National Mortgage Association (GNMA)–0.00% | ||||||||
Pass Through Ctfs., 8.00%, 04/15/26 to 01/20/31 | 39,608 | 43,294 | ||||||
7.50%, 12/20/30 | 2,879 | 3,472 | ||||||
| 46,766 | ||||||||
Total U.S. Government Sponsored Mortgage–Backed Securities (Cost $140,153) |
| 149,879 | ||||||
See accompanying Notes to Financial Statements which are an integral part of the financial statements.
18 Invesco Equity and Income Fund
| Shares | Value | |||||||
Money Market Funds–3.33% |
| |||||||
Liquid Assets Portfolio–Institutional Class(j) | 192,493,470 | $ | 192,493,470 | |||||
Premier Portfolio–Institutional Class(j) | 192,493,469 | 192,493,469 | ||||||
Total Money Market Funds |
| 384,986,939 | ||||||
TOTAL INVESTMENTS–99.81% |
| 11,535,704,421 | ||||||
OTHER ASSETS LESS LIABILITIES–0.19% |
| 21,606,965 | ||||||
NET ASSETS–100.00% | $ | 11,557,311,386 | ||||||
Investment Abbreviations:
| ADR | – American Depositary Receipt | |
| Conv. | – Convertible | |
| Ctfs. | – Certificates | |
| Deb. | – Debentures | |
| Gtd. | – Guaranteed | |
| Jr. | – Junior | |
| Pfd. | – Preferred | |
| RB | – Revenue Bonds | |
| REIT | – Real Estate Investment Trust | |
| Sec. | – Secured | |
| Sr. | – Senior | |
| Sub. | – Subordinated | |
| Unsec. | – Unsecured |
Notes to Schedule of Investments:
| (a) | Industry and/or sector classifications used in this report are generally according to the Global Industry Classification Standard, which was developed by and is the exclusive property and a service mark of MSCI Inc. and Standard & Poor’s. |
| (b) | Non-income producing security. |
| (c) | Security purchased or received in a transaction exempt from registration under the Securities Act of 1933, as amended (the “1933 Act”). The security may be resold pursuant to an exemption from registration under the 1933 Act, typically to qualified institutional buyers. The aggregate value of these securities at August 31, 2013 was $546,688,728, which represented 4.73% of the Fund’s Net Assets. |
| (d) | Perpetual bond with no specified maturity date. |
| (e) | Security has an irrevocable call by the issuer or mandatory put by the holder. Maturity date reflects such call or put. |
| (f) | Each unit represents one common share and one trust share. |
| (g) | Security traded on a discount basis. The interest rate shown represents the discount rate at the time of purchase by the Fund. |
| (h) | All or a portion of the value was pledged as collateral to cover margin requirements for open futures contracts. See Note 1K and Note 4. |
| (i) | Interest or dividend rate is redetermined periodically. Rate shown is the rate in effect on August 31, 2013. |
| (j) | The money market fund and the Fund are affiliated by having the same investment adviser. |
See accompanying Notes to Financial Statements which are an integral part of the financial statements.
19 Invesco Equity and Income Fund
Statement of Assets and Liabilities
August 31, 2013
Assets: |
| |||
Investments, at value (Cost $9,137,817,629) | $ | 11,150,717,482 | ||
Investments in affiliated money market funds, at value and cost | 384,986,939 | |||
Total investments, at value (Cost $9,522,804,568) | 11,535,704,421 | |||
Foreign currencies, at value (Cost $242,723) | 242,237 | |||
Receivable for: | ||||
Variation margin | 67,320 | |||
Fund shares sold | 16,652,292 | |||
Dividends and interest | 44,211,792 | |||
Foreign currency contracts outstanding | 1,610,577 | |||
Investment for trustee deferred compensation and retirement plans | 268,684 | |||
Other assets | 157,391 | |||
Total assets | 11,598,914,714 | |||
Liabilities: |
| |||
Payable for: | ||||
Investments purchased | 17,700,854 | |||
Fund shares reacquired | 13,404,121 | |||
Accrued fees to affiliates | 8,833,411 | |||
Accrued trustees’ and officers’ fees and benefits | 31,024 | |||
Accrued other operating expenses | 462,217 | |||
Trustee deferred compensation and retirement plans | 1,171,701 | |||
Total liabilities | 41,603,328 | |||
Net assets applicable to shares outstanding | $ | 11,557,311,386 | ||
Net assets consist of: |
| |||
Shares of beneficial interest | $ | 9,092,298,449 | ||
Undistributed net investment income | 55,604,360 | |||
Undistributed net realized gain | 395,029,546 | |||
Net unrealized appreciation | 2,014,379,031 | |||
| $ | 11,557,311,386 | |||
Net Assets: |
| |||
Class A | $ | 8,752,699,794 | ||
Class B | $ | 570,145,892 | ||
Class C | $ | 1,284,224,507 | ||
Class R | $ | 193,609,968 | ||
Class Y | $ | 477,206,912 | ||
Class R5 | $ | 241,539,947 | ||
Class R6 | $ | 37,884,366 | ||
Shares outstanding, $0.01 par value per share, |
| |||
Class A | 839,508,139 | |||
Class B | 55,786,627 | |||
Class C | 125,078,424 | |||
Class R | 18,497,544 | |||
Class Y | 45,755,096 | |||
Class R5 | 23,147,354 | |||
Class R6 | 3,631,883 | |||
Class A: | ||||
Net asset value per share | $ | 10.43 | ||
Maximum offering price per share | ||||
(Net asset value of $10.43 ¸ 94.50%) | $ | 11.04 | ||
Class B: | ||||
Net asset value and offering price per share | $ | 10.22 | ||
Class C: | ||||
Net asset value and offering price per share | $ | 10.27 | ||
Class R: | ||||
Net asset value and offering price per share | $ | 10.47 | ||
Class Y: | ||||
Net asset value and offering price per share | $ | 10.43 | ||
Class R5: | ||||
Net asset value and offering price per share | $ | 10.43 | ||
Class R6: | ||||
Net asset value and offering price per share | $ | 10.43 | ||
See accompanying Notes to Financial Statements which are an integral part of the financial statements.
20 Invesco Equity and Income Fund
Statement of Operations
For the year ended August 31, 2013
Investment income: |
| |||
Dividends (net of foreign withholding taxes of $1,092,251) | $ | 174,072,526 | ||
Dividends from affiliated money market funds | 406,892 | |||
Interest | 105,038,339 | |||
Total investment income | 279,517,757 | |||
Expenses: | ||||
Advisory fees | 39,080,641 | |||
Administrative services fees | 811,447 | |||
Custodian fees | 301,810 | |||
Distribution fees: | ||||
Class A | 20,729,091 | |||
Class B | 6,683,845 | |||
Class C | 12,030,658 | |||
Class R | 910,338 | |||
Transfer agent fees — A, B, C, R and Y | 17,356,933 | |||
Transfer agent fees — R5 | 224,915 | |||
Transfer agent fees — R6 | 2,191 | |||
Trustees’ and officers’ fees and benefits | 378,809 | |||
Other | 1,453,858 | |||
Total expenses | 99,964,536 | |||
Less: Fees waived and expense offset arrangement(s) | (585,944 | ) | ||
Net expenses | 99,378,592 | |||
Net investment income | 180,139,165 | |||
Realized and unrealized gain (loss) from: | ||||
Net realized gain (loss) from: | ||||
Investment securities (includes net gains from securities sold to affiliates of $495,804) | 607,472,419 | |||
Foreign currencies | 23,674 | |||
Foreign currency contracts | (2,438,507 | ) | ||
Futures contracts | 5,576,895 | |||
Option contracts written | 288,511 | |||
| 610,922,992 | ||||
Change in net unrealized appreciation (depreciation) of: | ||||
Investment securities | 980,332,001 | |||
Foreign currencies | (3,856 | ) | ||
Foreign currency contracts | 5,263,077 | |||
Futures contracts | 967,266 | |||
| 986,558,488 | ||||
Net realized and unrealized gain | 1,597,481,480 | |||
Net increase in net assets resulting from operations | $ | 1,777,620,645 | ||
See accompanying Notes to Financial Statements which are an integral part of the financial statements.
21 Invesco Equity and Income Fund
Statement of Changes in Net Assets
For the years ended August 31, 2013 and 2012
| 2013 | 2012 | |||||||
Operations: |
| |||||||
Net investment income | $ | 180,139,165 | $ | 209,123,341 | ||||
Net realized gain | 610,922,992 | 106,070,128 | ||||||
Change in net unrealized appreciation | 986,558,488 | 934,736,730 | ||||||
Net increase in net assets resulting from operations | 1,777,620,645 | 1,249,930,199 | ||||||
Distributions to shareholders from net investment income: | ||||||||
Class A | (177,192,280 | ) | (152,150,003 | ) | ||||
Class B | (9,850,781 | ) | (16,509,929 | ) | ||||
Class C | (16,986,784 | ) | (14,510,005 | ) | ||||
Class R | (3,445,076 | ) | (3,178,686 | ) | ||||
Class Y | (10,171,497 | ) | (8,610,039 | ) | ||||
Class R5 | (5,604,640 | ) | (4,674,921 | ) | ||||
Class R6 | (1,344,016 | ) | — | |||||
Total distributions from net investment income | (224,595,074 | ) | (199,633,583 | ) | ||||
Share transactions–net: | ||||||||
Class A | (291,238,977 | ) | (802,662,360 | ) | ||||
Class B | (266,029,232 | ) | (358,776,295 | ) | ||||
Class C | (40,820,681 | ) | (175,219,330 | ) | ||||
Class R | (8,690,407 | ) | (23,670,724 | ) | ||||
Class Y | 9,342,497 | (47,889,519 | ) | |||||
Class R5 | (29,202,753 | ) | 59,177,309 | |||||
Class R6 | 29,344,576 | — | ||||||
Net increase (decrease) in net assets resulting from share transactions | (597,294,977 | ) | (1,349,040,919 | ) | ||||
Net increase (decrease) in net assets | 955,730,594 | (298,744,303 | ) | |||||
Net assets: | ||||||||
Beginning of year | 10,601,580,792 | 10,900,325,095 | ||||||
End of year (includes undistributed net investment income of $55,604,360 and $53,000,204, respectively) | $ | 11,557,311,386 | $ | 10,601,580,792 | ||||
Notes to Financial Statements
August 31, 2013
NOTE 1—Significant Accounting Policies
Invesco Equity and Income Fund (the “Fund”) is a series portfolio of AIM Counselor Series Trust (Invesco Counselor Series Trust) (the “Trust”). The Trust is a Delaware statutory trust registered under the Investment Company Act of 1940, as amended (the “1940 Act”), as an open-end series management investment company consisting of twelve separate portfolios, each authorized to issue an unlimited number of shares of beneficial interest. The assets, liabilities and operations of each portfolio are accounted for separately. Information presented in these financial statements pertains only to the Fund. Matters affecting each portfolio or class will be voted on exclusively by the shareholders of such portfolio or class.
The Fund’s investment objective is to seek the highest possible income consistent with safety of principal. Long-term growth of capital is an important secondary investment objective.
The Fund currently consists of seven different classes of shares: Class A, Class B, Class C, Class R, Class Y, Class R5 and Class R6. On September 24, 2012, Institutional Class shares were renamed Class R5 shares and the Fund began offering Class R6 shares. Class A shares are sold with a front-end sales charge unless certain waiver criteria are met and under certain circumstances load waived shares may be subject to contingent deferred sales charges (“CDSC”). Class C shares are sold with a CDSC. Class R, Class Y, Class R5 and Class R6 shares are sold at net asset value. Effective November 30, 2010, new or additional investments in Class B shares are no longer permitted. Existing shareholders of Class B shares may continue to reinvest dividends and capital gains distributions in Class B shares until they convert to Class A shares. Also, shareholders in Class B shares will be able to exchange those shares for Class B shares of other Invesco Funds offering such shares until they convert to Class A shares. Generally, Class B shares will automatically convert to Class A shares on or about the month-end, which is at least eight years after the date of purchase. Redemption of Class B shares prior to the conversion date will be subject to a CDSC.
22 Invesco Equity and Income Fund
The following is a summary of the significant accounting policies followed by the Fund in the preparation of its financial statements.
| A. | Security Valuations — Securities, including restricted securities, are valued according to the following policy. |
Debt obligations (including convertible bonds) and unlisted equities are fair valued using an evaluated quote provided by an independent pricing service. Evaluated quotes provided by the pricing service may be determined without exclusive reliance on quoted prices, and may reflect appropriate factors such as institution-size trading in similar groups of securities, developments related to specific securities, dividend rate (for unlisted equities), yield (for debt obligations), quality, type of issue, coupon rate (for debt obligations), maturity (for debt obligations), individual trading characteristics and other market data. Debt obligations are subject to interest rate and credit risks. In addition, all debt obligations involve some risk of default with respect to interest and/or principal payments.
A security listed or traded on an exchange (except convertible bonds) is valued at its last sales price or official closing price as of the close of the customary trading session on the exchange where the security is principally traded, or lacking any sales or official closing price on a particular day, the security may be valued at the closing bid price on that day. Securities traded in the over-the-counter market are valued based on prices furnished by independent pricing services or market makers. When such securities are valued by an independent pricing service they may be considered fair valued. Futures contracts are valued at the final settlement price set by an exchange on which they are principally traded. Listed options are valued at the mean between the last bid and ask prices from the exchange on which they are principally traded. Options not listed on an exchange are valued by an independent source at the mean between the last bid and ask prices. For purposes of determining net asset value per share, futures and option contracts generally are valued 15 minutes after the close of the customary trading session of the New York Stock Exchange (“NYSE”).
Investments in open-end and closed-end registered investment companies that do not trade on an exchange are valued at the end of day net asset value per share. Investments in open-end and closed-end registered investment companies that trade on an exchange are valued at the last sales price or official closing price as of the close of the customary trading session on the exchange where the security is principally traded.
Foreign securities’ (including foreign exchange contracts) prices are converted into U.S. dollar amounts using the applicable exchange rates as of the close of the NYSE. If market quotations are available and reliable for foreign exchange-traded equity securities, the securities will be valued at the market quotations. Because trading hours for certain foreign securities end before the close of the NYSE, closing market quotations may become unreliable. If between the time trading ends on a particular security and the close of the customary trading session on the NYSE, events occur that the Adviser determines are significant and make the closing price unreliable, the Fund may fair value the security. If the event is likely to have affected the closing price of the security, the security will be valued at fair value in good faith using procedures approved by the Board of Trustees. Adjustments to closing prices to reflect fair value may also be based on a screening process of an independent pricing service to indicate the degree of certainty, based on historical data, that the closing price in the principal market where a foreign security trades is not the current value as of the close of the NYSE. Foreign securities’ prices meeting the approved degree of certainty that the price is not reflective of current value will be priced at the indication of fair value from the independent pricing service. Multiple factors may be considered by the independent pricing service in determining adjustments to reflect fair value and may include information relating to sector indices, American Depositary Receipts and domestic and foreign index futures. Foreign securities may have additional risks including exchange rate changes, potential for sharply devalued currencies and high inflation, political and economic upheaval, the relative lack of issuer information, relatively low market liquidity and the potential lack of strict financial and accounting controls and standards.
Securities for which market prices are not provided by any of the above methods may be valued based upon quotes furnished by independent sources. The last bid price may be used to value equity securities. The mean between the last bid and asked prices is used to value debt obligations, including corporate loans.
Securities for which market quotations are not readily available or became unreliable are valued at fair value as determined in good faith by or under the supervision of the Trust’s officers following procedures approved by the Board of Trustees. Issuer specific events, market trends, bid/ask quotes of brokers and information providers and other market data may be reviewed in the course of making a good faith determination of a security’s fair value.
Valuations change in response to many factors including the historical and prospective earnings of the issuer, the value of the issuer’s assets, general economic conditions, interest rates, investor perceptions and market liquidity. Because of the inherent uncertainties of valuation, the values reflected in the financial statements may materially differ from the value received upon actual sale of those investments.
| B. | Securities Transactions and Investment Income — Securities transactions are accounted for on a trade date basis. Realized gains or losses on sales are computed on the basis of specific identification of the securities sold. Interest income is recorded on the accrual basis from settlement date. Paydown gains and losses on mortgage and asset-backed securities are recorded as adjustments to interest income. Dividend income (net of withholding tax, if any) is recorded on the ex-dividend date. Bond premiums and discounts are amortized and/or accreted for financial reporting purposes. |
The Fund may periodically participate in litigation related to Fund investments. As such, the Fund may receive proceeds from litigation settlements. Any proceeds received are included in the Statement of Operations as realized gain (loss) for investments no longer held and as unrealized gain (loss) for investments still held.
Brokerage commissions and mark ups are considered transaction costs and are recorded as an increase to the cost basis of securities purchased and/or a reduction of proceeds on a sale of securities. Such transaction costs are included in the determination of net realized and unrealized gain (loss) from investment securities reported in the Statement of Operations and the Statement of Changes in Net Assets and the net realized and unrealized gains (losses) on securities per share in the Financial Highlights. Transaction costs are included in the calculation of the Fund’s net asset value and, accordingly, they reduce the Fund’s total returns. These transaction costs are not considered operating expenses and are not reflected in net investment income reported in the Statement of Operations and Statement of Changes in Net Assets, or the net investment income per share and ratios of expenses and net investment income reported in the Financial Highlights, nor are they limited by any expense limitation arrangements between the Fund and the investment adviser.
The Fund allocates income and realized and unrealized capital gains and losses to a class based on the relative net assets of each class.
| C. | Country Determination — For the purposes of making investment selection decisions and presentation in the Schedule of Investments, the investment adviser may determine the country in which an issuer is located and/or credit risk exposure based on various factors. These factors include the laws of the country under which the issuer is organized, where the issuer maintains a principal office, the country in which the issuer |
23 Invesco Equity and Income Fund
| derives 50% or more of its total revenues and the country that has the primary market for the issuer’s securities, as well as other criteria. Among the other criteria that may be evaluated for making this determination are the country in which the issuer maintains 50% or more of its assets, the type of security, financial guarantees and enhancements, the nature of the collateral and the sponsor organization. Country of issuer and/or credit risk exposure has been determined to be the United States of America, unless otherwise noted. |
| D. | Distributions — Distributions from income, if any, are declared and paid quarterly and are recorded on the ex-dividend date. Distributions from net realized capital gain, if any, are generally declared and paid annually and recorded on the ex-dividend date. The Fund may elect to treat a portion of the proceeds from redemptions as distributions for federal income tax purposes. |
| E. | Federal Income Taxes — The Fund intends to comply with the requirements of Subchapter M of the Internal Revenue Code of 1986, as amended (the “Internal Revenue Code”), necessary to qualify as a regulated investment company and to distribute substantially all of the Fund’s taxable earnings to shareholders. As such, the Fund will not be subject to federal income taxes on otherwise taxable income (including net realized capital gain) that is distributed to shareholders. Therefore, no provision for federal income taxes is recorded in the financial statements. |
The Fund files tax returns in the U.S. Federal jurisdiction and certain other jurisdictions. Generally, the Fund is subject to examinations by such taxing authorities for up to three years after the filing of the return for the tax period.
| F. | Expenses — Fees provided for under the Rule 12b-1 plan of a particular class of the Fund are charged to the operations of such class. Transfer agency fees and expenses and other shareholder recordkeeping fees and expenses attributable to Class R5 and Class R6 are allocated to each share class based on relative net assets. Sub-accounting fees attributable to Class R5 are charged to the operations of the class. Transfer agency fees and expenses and other shareholder recordkeeping fees and expenses relating to all other classes are allocated among those classes based on relative net assets. All other expenses are allocated among the classes based on relative net assets. Prior to June 1, 2010, incremental transfer agency fees which were unique to each class of shares were charged to the operations of such class. |
| G. | Accounting Estimates — The preparation of financial statements in conformity with accounting principles generally accepted in the United States of America (“GAAP”) requires management to make estimates and assumptions that affect the reported amounts of assets and liabilities at the date of the financial statements and the reported amounts of revenues and expenses during the reporting period including estimates and assumptions related to taxation. Actual results could differ from those estimates by a significant amount. In addition, the Fund monitors for material events or transactions that may occur or become known after the period-end date and before the date the financial statements are released to print. |
| H. | Indemnifications — Under the Trust’s organizational documents, each Trustee, officer, employee or other agent of the Trust is indemnified against certain liabilities that may arise out of the performance of their duties to the Fund. Additionally, in the normal course of business, the Fund enters into contracts, including the Fund’s servicing agreements, that contain a variety of indemnification clauses. The Fund’s maximum exposure under these arrangements is unknown as this would involve future claims that may be made against the Fund that have not yet occurred. The risk of material loss as a result of such indemnification claims is considered remote. |
| I. | Foreign Currency Translations — Foreign currency is valued at the close of the NYSE based on quotations posted by banks and major currency dealers. Portfolio securities and other assets and liabilities denominated in foreign currencies are translated into U.S. dollar amounts at date of valuation. Purchases and sales of portfolio securities (net of foreign taxes withheld on disposition) and income items denominated in foreign currencies are translated into U.S. dollar amounts on the respective dates of such transactions. The Fund does not separately account for the portion of the results of operations resulting from changes in foreign exchange rates on investments and the fluctuations arising from changes in market prices of securities held. The combined results of changes in foreign exchange rates and the fluctuation of market prices on investments (net of estimated foreign tax withholding) are included with the net realized and unrealized gain or loss from investments in the Statement of Operations. Reported net realized foreign currency gains or losses arise from (1) sales of foreign currencies, (2) currency gains or losses realized between the trade and settlement dates on securities transactions, and (3) the difference between the amounts of dividends, interest, and foreign withholding taxes recorded on the Fund’s books and the U.S. dollar equivalent of the amounts actually received or paid. Net unrealized foreign currency gains and losses arise from changes in the fair values of assets and liabilities, other than investments in securities at fiscal period end, resulting from changes in exchange rates. |
The Fund may invest in foreign securities which may be subject to foreign taxes on income, gains on investments or currency repatriation, a portion of which may be recoverable.
| J. | Foreign Currency Contracts — The Fund may enter into foreign currency contracts to manage or minimize currency or exchange rate risk. The Fund may also enter into foreign currency contracts for the purchase or sale of a security denominated in a foreign currency in order to “lock in” the U.S. dollar price of that security. A foreign currency contract is an obligation to purchase or sell a specific currency for an agreed-upon price at a future date. The use of foreign currency contracts does not eliminate fluctuations in the price of the underlying securities the Fund owns or intends to acquire but establishes a rate of exchange in advance. Fluctuations in the value of these contracts are measured by the difference in the contract date and reporting date exchange rates and are recorded as unrealized appreciation (depreciation) until the contracts are closed. When the contracts are closed, realized gains (losses) are recorded. Realized and unrealized gains (losses) on the contracts are included in the Statement of Operations. The primary risks associated with foreign currency contracts include failure of the counterparty to meet the terms of the contract and the value of the foreign currency changing unfavorably. These risks may be in excess of the amounts reflected in the Statement of Assets and Liabilities. |
| K. | Futures Contracts — The Fund may enter into futures contracts to manage exposure to interest rate, equity and market price movements and/or currency risks. A futures contract is an agreement between two parties to purchase or sell a specified underlying security, currency or commodity (or delivery of a cash settlement price, in the case of an index future) for a fixed price at a future date. The Fund currently invests only in exchange-traded futures and they are standardized as to maturity date and underlying financial instrument. Initial margin deposits required upon entering into futures contracts are satisfied by the segregation of specific securities or cash as collateral at the futures commission merchant (broker). During the period the futures contracts are open, changes in the value of the contracts are recognized as unrealized gains or losses by recalculating the value of the contracts on a daily basis. Subsequent or variation margin payments are received or made depending upon whether unrealized gains or losses are incurred. These amounts are reflected as receivables or payables on the Statement of Assets and Liabilities. When the contracts are closed or expire, the Fund recognizes a realized gain or loss equal to the difference between the proceeds from, or cost of, the closing transaction and the Fund’s basis in the contract. The net realized gain (loss) and the change in unrealized gain (loss) |
24 Invesco Equity and Income Fund
| on futures contracts held during the period is included on the Statement of Operations. The primary risks associated with futures contracts are market risk and the absence of a liquid secondary market. If the Fund were unable to liquidate a futures contract and/or enter into an offsetting closing transaction, the Fund would continue to be subject to market risk with respect to the value of the contracts and continue to be required to maintain the margin deposits on the futures contracts. Futures contracts have minimal counterparty risk since the exchange’s clearinghouse, as counterparty to all exchange-traded futures, guarantees the futures against default. Risks may exceed amounts recognized in the Statement of Assets and Liabilities. |
| L. | Call Options Written — The Fund may write covered call options. A covered call option gives the purchaser of such option the right to buy, and the writer (the Fund) the obligation to sell, the underlying security at the stated exercise price during the option period. Written call options are recorded as a liability in the Statement of Assets and Liabilities. The amount of the liability is subsequently “marked-to-market” to reflect the current market value of the option written. If a written covered call option expires on the stipulated expiration date, or if the Fund enters into a closing purchase transaction, the Fund realizes a gain (or a loss if the closing purchase transaction exceeds the premium received when the option was written) without regard to any unrealized gain or loss on the underlying security, and the liability related to such option is extinguished. If a written covered call option is exercised, the Fund realizes a gain or a loss from the sale of the underlying security and the proceeds of the sale are increased by the premium originally received. Realized gains and losses on these contracts are included in the Statement of Operations. A risk in writing a covered call option is that the Fund gives up the opportunity for profit if the market price of the security increases and the option is exercised. |
| M. | Collateral — To the extent the Fund has designated or segregated a security as collateral and that security is subsequently sold, it is the Fund’s practice to replace such collateral no later than the next business day. |
NOTE 2—Advisory Fees and Other Fees Paid to Affiliates
The Trust has entered into a master investment advisory agreement with Invesco Advisers, Inc. (the “Adviser” or “Invesco”). Under the terms of the investment advisory agreement, the Fund pays an advisory fee to the Adviser based on the annual rate of the Fund’s average daily net assets as follows:
| Average Daily Net Assets | Rate | |||
First $150 million | 0.50% | |||
Next $100 million | 0.45% | |||
Next $100 million | 0.40% | |||
Over $350 million | 0.35% | |||
Under the terms of a master sub-advisory agreement between the Adviser and each of Invesco Asset Management Deutschland GmbH, Invesco Asset Management Limited, Invesco Asset Management (Japan) Limited, Invesco Australia Limited, Invesco Hong Kong Limited, Invesco Senior Secured Management, Inc. and Invesco Canada Ltd. (collectively, the “Affiliated Sub-Advisers”) the Adviser, not the Fund, may pay 40% of the fees paid to the Adviser to any such Affiliated Sub-Adviser(s) that provide(s) discretionary investment management services to the Fund based on the percentage of assets allocated to such Sub-Adviser(s).
The Adviser has contractually agreed, through at least June 30, 2014, to waive advisory fees and/or reimburse expenses to the extent necessary to limit total annual fund operating expenses after fee waiver and/or expense reimbursement (excluding certain items discussed below) of Class A, Class B, Class C, Class R, Class Y, Class R5 and Class R6 shares to 1.50%, 2.25%, 2.25%, 1.75%, 1.25%, 1.25% and 1.25% of average daily net assets, respectively. In determining the Adviser’s obligation to waive advisory fees and/or reimburse expenses, the following expenses are not taken into account, and could cause total annual fund operating expenses after fee waiver and/or expense reimbursement to exceed the numbers reflected above: (1) interest; (2) taxes; (3) dividend expense on short sales; (4) extraordinary or non-routine items, including litigation expenses; and (5) expenses that the Fund has incurred but did not actually pay because of an expense offset arrangement. Unless the Board of Trustees and Invesco mutually agree to amend or continue the fee waiver agreement, it will terminate on June 30, 2014. The Adviser did not waive fees and/or reimburse expenses during the period under this limitation.
Further, the Adviser has contractually agreed, through at least June 30, 2014, to waive the advisory fee payable by the Fund in an amount equal to 100% of the net advisory fees the Adviser receives from the affiliated money market funds on investments by the Fund of uninvested cash in such affiliated money market funds.
For the year ended August 31, 2013, the Adviser waived advisory fees of $569,348.
The Trust has entered into a master administrative services agreement with Invesco pursuant to which the Fund has agreed to pay Invesco for certain administrative costs incurred in providing accounting services to the Fund. For the year ended August 31, 2013, expenses incurred under the agreement are shown in the Statement of Operations as Administrative services fees.
The Trust has entered into a transfer agency and service agreement with Invesco Investment Services, Inc. (“IIS”) pursuant to which the Fund has agreed to pay IIS a fee for providing transfer agency and shareholder services to the Fund and reimburse IIS for certain expenses incurred by IIS in the course of providing such services. IIS may make payments to intermediaries that provide omnibus account services, sub-accounting services and/or networking services. All fees payable by IIS to intermediaries that provide omnibus account services or sub-accounting are charged back to the Fund, subject to certain limitations approved by the Trust’s Board of Trustees. For the year ended August 31, 2013, expenses incurred under the agreement are shown in the Statement of Operations as Transfer agent fees.
Shares of the Fund are distributed by Invesco Distributors, Inc. (“IDI”). The Fund has adopted a distribution plan pursuant to Rule 12b-1 under the 1940 Act, and a service plan (collectively, the “Plans”) for Class A shares, Class B shares, Class C shares and Class R shares to compensate IDI for the sale, distribution, shareholder servicing and maintenance of shareholder accounts for these shares. Under the Plans, the Fund will incur annual fees of up to 0.25% of Class A average daily net assets, up to 1.00% each of Class B and Class C average daily net assets and up to 0.50% of Class R average daily net assets.
With respect to Class B and Class C shares, the Fund is authorized to reimburse in future years any distribution related expenses that exceed the maximum annual reimbursement rate for such class, so long as such reimbursement does not cause the Fund to exceed the Class B and Class C maximum annual reimbursement rate, respectively. With respect to Class A shares, distribution related expenses that exceed the maximum annual reimbursement rate for such class are not carried forward to future years and the Fund will not reimburse IDI for any such expenses.
25 Invesco Equity and Income Fund
For the year ended August 31, 2013, expenses incurred under these agreements are shown in the Statement of Operations as Distribution fees.
Front-end sales commissions and CDSC (collectively, the “sales charges”) are not recorded as expenses of the Fund. Front-end sales commissions are deducted from proceeds from the sales of Fund shares prior to investment in Class A shares of the Fund. CDSC are deducted from redemption proceeds prior to remittance to the shareholder. During the year ended August 31, 2013, IDI advised the Fund that IDI retained $1,843,457 in front-end sales commissions from the sale of Class A shares and $6,858, $376,011 and $22,214 from Class A, Class B and Class C shares, respectively, for CDSC imposed on redemptions by shareholders.
For the year ended August 31, 2013, the Fund incurred $43,912 in brokerage commissions with Invesco Capital Markets, Inc., an affiliate of the Adviser and IDI, for portfolio transactions executed on behalf of the Fund.
Certain officers and trustees of the Trust are officers and directors of the Adviser, IIS and/or IDI.
NOTE 3—Additional Valuation Information
GAAP defines fair value as the price that would be received to sell an asset or paid to transfer a liability in an orderly transaction between market participants at the measurement date, under current market conditions. GAAP establishes a hierarchy that prioritizes the inputs to valuation methods, giving the highest priority to readily available unadjusted quoted prices in an active market for identical assets (Level 1) and the lowest priority to significant unobservable inputs (Level 3), generally when market prices are not readily available or are unreliable. Based on the valuation inputs, the securities or other investments are tiered into one of three levels. Changes in valuation methods may result in transfers in or out of an investment’s assigned level:
| Level 1 — | Prices are determined using quoted prices in an active market for identical assets. |
| Level 2 — | Prices are determined using other significant observable inputs. Observable inputs are inputs that other market participants may use in pricing a security. These may include quoted prices for similar securities, interest rates, prepayment speeds, credit risk, yield curves, loss severities, default rates, discount rates, volatilities and others. |
| Level 3 — | Prices are determined using significant unobservable inputs. In situations where quoted prices or observable inputs are unavailable (for example, when there is little or no market activity for an investment at the end of the period), unobservable inputs may be used. Unobservable inputs reflect the Fund’s own assumptions about the factors market participants would use in determining fair value of the securities or instruments and would be based on the best available information. |
The following is a summary of the tiered valuation input levels, as of August 31, 2013. The level assigned to the securities valuations may not be an indication of the risk or liquidity associated with investing in those securities. Because of the inherent uncertainties of valuation, the values reflected in the financial statements may materially differ from the value received upon actual sale of those investments.
| Level 1 | Level 2 | Level 3 | Total | |||||||||||||
Equity Securities | $ | 8,313,413,493 | $ | 33,588,000 | $ | — | $ | 8,347,001,493 | ||||||||
U.S. Treasury Securities | — | 758,626,088 | — | 758,626,088 | ||||||||||||
Corporate Debt Securities | — | 2,273,788,508 | — | 2,273,788,508 | ||||||||||||
U.S. Government Sponsored Securities | — | 123,387,139 | — | 123,387,139 | ||||||||||||
Asset-Backed Securities | — | 1,319 | — | 1,319 | ||||||||||||
Municipal Obligations | — | 11,668,354 | — | 11,668,354 | ||||||||||||
Foreign Government Debt Securities | — | 21,231,520 | — | 21,231,520 | ||||||||||||
| $ | 8,313,413,493 | $ | 3,222,290,928 | $ | — | $ | 11,535,704,421 | |||||||||
Foreign Currency Contracts* | — | 1,610,577 | — | 1,610,577 | ||||||||||||
Futures* | (132,057 | ) | — | — | (132,057 | ) | ||||||||||
Total Investments | $ | 8,313,281,436 | $ | 3,223,901,505 | $ | — | $ | 11,537,182,941 | ||||||||
| * | Unrealized appreciation (depreciation). |
NOTE 4—Derivative Investments
Value of Derivative Investments at Period-End
The table below summarizes the value of the Fund’s derivative investments, detailed by primary risk exposure, held as of August 31, 2013:
| Value | ||||||||
| Risk Exposure/Derivative Type | Assets | Liabilities | ||||||
Currency risk | ||||||||
Foreign currency contracts(a) | $ | 2,044,332 | $ | (433,755 | ) | |||
Interest rate risk | ||||||||
Futures contracts(b) | — | (132,057 | ) | |||||
Total | $ | 2,044,332 | $ | (565,812 | ) | |||
| (a) | Values are disclosed on the Statement of Assets and Liabilities under the caption Foreign currency contracts outstanding. |
| (b) | Includes cumulative appreciation (depreciation) of futures contracts. Only current day’s variation margin receivable (payable) is reported within the Statement of Assets and Liabilities. |
26 Invesco Equity and Income Fund
Effect of Derivative Investments for the year ended August 31, 2013
The table below summarizes the gains (losses) on derivative investments, detailed by primary risk exposure, recognized in earnings during the period:
| Location of Gain (Loss) on Statement of Operations | ||||||||||||
| Futures* | Foreign Currency Contracts* | Options* | ||||||||||
Realized Gain (Loss) | ||||||||||||
Currency risk | $ | — | $ | (2,438,507 | ) | $ | — | |||||
Equity risk | — | — | 288,511 | |||||||||
Interest rate risk | 5,576,895 | — | — | |||||||||
Change in Unrealized Appreciation | ||||||||||||
Currency risk | — | 5,263,077 | — | |||||||||
Interest rate risk | 967,266 | — | — | |||||||||
Total | $ | 6,544,161 | $ | 2,824,570 | $ | 288,511 | ||||||
| * | The average notional value of futures contracts, foreign currency contracts and option contracts written outstanding during the period was $287,637,319, $297,293,467 and $8,138,650, respectively. |
| Open Foreign Currency Contracts | ||||||||||||||||||||||||||
Settlement | Counterparty | Contract to | Notional Value | Unrealized Appreciation (Depreciation) | ||||||||||||||||||||||
| Deliver | Receive | |||||||||||||||||||||||||
09/27/13 | State Street | CAD | 50,103,466 | USD | 47,647,250 | $ | 47,533,338 | $ | 113,912 | |||||||||||||||||
09/27/13 | Bank of New York | CAD | 55,378,357 | USD | 52,681,587 | 52,537,647 | 143,940 | |||||||||||||||||||
09/27/13 | Bank of New York | CHF | 33,689,820 | USD | 36,713,948 | 36,215,924 | 498,024 | |||||||||||||||||||
09/27/13 | State Street | CHF | 40,173,270 | USD | 43,751,961 | 43,185,511 | 566,450 | |||||||||||||||||||
09/27/13 | Bank of New York | EUR | 24,898,278 | USD | 33,331,698 | 32,909,677 | 422,021 | |||||||||||||||||||
09/27/13 | State Street | GBP | 62,034,224 | USD | 96,410,799 | 96,110,814 | 299,985 | |||||||||||||||||||
09/27/13 | State Street | ILS | 189,265,918 | USD | 51,789,826 | 52,223,581 | (433,755 | ) | ||||||||||||||||||
| $ | 1,610,577 | |||||||||||||||||||||||||
Currency Abbreviations:
| CAD | – Canadian Dollar | |
| CHF | – Swiss Franc |
| EUR | – Euro | |
| GBP | – British Pound Sterling |
| ILS | – Israeli Shekel | |
| USD | – U.S. Dollar |
| Open Futures Contracts | ||||||||||||||||
| Short Contracts | Number of Contracts | Expiration Month | Notional Value | Unrealized Appreciation (Depreciation) | ||||||||||||
U.S. Treasury 5 Year Notes | 841 | December-2013 | $ | (100,650,618 | ) | $ | (100,321 | ) | ||||||||
U.S. Treasury 10 Year Notes | 648 | December-2013 | (80,534,250 | ) | (31,736 | ) | ||||||||||
Total | $ | (132,057 | ) | |||||||||||||
| Transactions During the Period | ||||||||
| Call Option Contracts | ||||||||
| Number of Contracts | Premiums Received | |||||||
Beginning of period | — | $ | — | |||||
Written | 17,554 | 1,234,099 | ||||||
Closed | (2,814 | ) | (342,794 | ) | ||||
Expired | (14,740 | ) | (891,305 | ) | ||||
End of period | — | $ | — | |||||
NOTE 5—Security Transactions with Affiliated Funds
The Fund is permitted to purchase or sell securities from or to certain other Invesco Funds under specified conditions outlined in procedures adopted by the Board of Trustees of the Trust. The procedures have been designed to ensure that any purchase or sale of securities by the Fund from or to another fund or portfolio that is or could be considered an affiliate by virtue of having a common investment adviser (or affiliated investment advisers), common Trustees and/or common officers complies with Rule 17a-7 of the 1940 Act. Further, as defined under the procedures, each transaction is effected at the current market price. Pursuant to these procedures, for the year ended August 31, 2013, the Fund engaged in securities purchases of $8,058,423 and securities sales of $1,801,148, which resulted in net realized gains of $495,804.
27 Invesco Equity and Income Fund
NOTE 6—Expense Offset Arrangement(s)
The expense offset arrangements are comprised of (1) transfer agency credits which result from balances in Demand Deposit Accounts (DDA) used by the transfer agent for clearing shareholder transactions and (2) custodian credits which result from periodic overnight cash balances at the custodian. For the year ended August 31, 2013, the Fund received credits from these arrangements, which resulted in the reduction of the Fund’s total expenses of $16,596.
NOTE 7—Trustees’ and Officers’ Fees and Benefits
“Trustees’ and Officers’ Fees and Benefits” include amounts accrued by the Fund to pay remuneration to certain Trustees and Officers of the Fund. Trustees have the option to defer compensation payable by the Fund, and “Trustees’ and Officers’ Fees and Benefits” also include amounts accrued by the Fund to fund such deferred compensation amounts. Those Trustees who defer compensation have the option to select various Invesco Funds in which their deferral accounts shall be deemed to be invested. Finally, certain current Trustees are eligible to participate in a retirement plan that provides for benefits to be paid upon retirement to Trustees over a period of time based on the number of years of service. The Fund may have certain former Trustees who also participate in a retirement plan and receive benefits under such plan. “Trustees’ and Officers’ Fees and Benefits” include amounts accrued by the Fund to fund such retirement benefits. Obligations under the deferred compensation and retirement plans represent unsecured claims against the general assets of the Fund.
NOTE 8—Cash Balances
The Fund is permitted to temporarily carry a negative or overdrawn balance in its account with State Street Bank and Trust Company, the custodian bank. Such balances, if any at period end, are shown in the Statement of Assets and Liabilities under the payable caption Amount due custodian. To compensate the custodian bank for such overdrafts, the overdrawn Fund may either (1) leave funds as a compensating balance in the account so the custodian bank can be compensated by earning the additional interest; or (2) compensate by paying the custodian bank at a rate agreed upon by the custodian bank and Invesco, not to exceed the contractually agreed upon rate.
NOTE 9—Distributions to Shareholders and Tax Components of Net Assets
Tax Character of Distributions to Shareholders Paid During the Years Ended August 31, 2013 and 2012:
| 2013 | 2012 | |||||||
Ordinary income | $ | 224,595,074 | $ | 199,633,583 | ||||
Tax Components of Net Assets at Period-End:
| 2013 | ||||
Undistributed ordinary income | $ | 102,086,238 | ||
Undistributed long-term gain | 455,743,294 | |||
Net unrealized appreciation — investments | 1,965,221,779 | |||
Net unrealized appreciation — other investments | 658 | |||
Temporary book/tax differences | (7,039,123 | ) | ||
Capital loss carryforward | (50,999,909 | ) | ||
Shares of beneficial interest | 9,092,298,449 | |||
Total net assets | $ | 11,557,311,386 | ||
The difference between book-basis and tax-basis unrealized appreciation (depreciation) is due to differences in the timing of recognition of gains and losses on investments for tax and book purposes. The Fund’s net unrealized appreciation difference is attributable primarily to wash sales, book to tax accretion and amortization differences and contingent payment debt instruments.
The temporary book/tax differences are a result of timing differences between book and tax recognition of income and/or expenses. The Fund’s temporary book/tax differences are the result of the trustee deferral of compensation and retirement plan benefits and deferred straddle losses.
Capital loss carryforward is calculated and reported as of a specific date. Results of transactions and other activity after that date may affect the amount of capital loss carryforward actually available for the Fund to utilize. The Regulated Investment Company Modernization Act of 2010 eliminated the eight-year carryover period for capital losses that arise in taxable years beginning after its enactment date of December 22, 2010. Consequently, these capital losses can be carried forward for an unlimited period. However, capital losses with an expiration period may not be used to offset capital gains until all net capital losses without an expiration date have been utilized. Additionally, post-enactment capital loss carryovers will retain their character as either short-term or long-term capital losses instead of as short-term capital losses as under prior law. The ability to utilize capital loss carryforward in the future may be limited under the Internal Revenue Code and related regulations based on the results of future transactions.
28 Invesco Equity and Income Fund
The Fund utilized $47,193,704 of capital loss carryforward in the current period to offset net realized capital gain for federal income tax purposes. The Fund has a capital loss carryforward as of August 31, 2013, which expires as follows:
| Capital Loss Carryforward* | ||||||||||||
| Expiration | Short-Term | Long-Term | Total | |||||||||
August 31, 2016 | $ | 40,907,811 | $ | — | $ | 40,907,811 | ||||||
August 31, 2017 | 10,092,098 | — | 10,092,098 | |||||||||
| $ | 50,999,909 | $ | — | $ | 50,999,909 | |||||||
| * | Capital loss carryforward as of the date listed above is reduced for limitations, if any, to the extent required by the Internal Revenue Code. To the extent that unrealized gains as of May 23, 2011, the date of reorganization of Invesco Balanced Fund and Invesco Basic Balanced Fund into the Fund, are realized on securities held in each fund at such date of reorganization, the capital loss carryforward may be further limited for up to five years from the date of the reorganization. |
NOTE 10—Investment Securities
The aggregate amount of investment securities (other than short-term securities, U.S. Treasury obligations and money market funds, if any) purchased and sold by the Fund during the year ended August 31, 2013 was $2,600,016,031 and $3,016,172,227, respectively. During the same period, purchases and sales of U.S. Treasury obligations were $180,027,479 and $292,779,288, respectively. Cost of investments on a tax basis includes the adjustments for financial reporting purposes as of the most recently completed federal income tax reporting period-end.
| Unrealized Appreciation (Depreciation) of Investment Securities on a Tax Basis | ||||
Aggregate unrealized appreciation of investment securities | $ | 2,073,985,344 | ||
Aggregate unrealized (depreciation) of investment securities | (108,763,565 | ) | ||
Net unrealized appreciation of investment securities | $ | 1,965,221,779 | ||
Cost of investments for tax purposes is $9,570,482,642.
NOTE 11—Reclassification of Permanent Differences
Primarily as a result of differing book/tax treatment of bond premiums and contingent payment debt instruments, on August 31, 2013, undistributed net investment income was increased by $47,060,065, undistributed net realized gain was decreased by $46,777,314 and shares of beneficial interest was decreased by $282,751. This reclassification had no effect on the net assets of the Fund.
29 Invesco Equity and Income Fund
NOTE 12—Share Information
| Years ended August 31, | ||||||||||||||||
| 2013(a) | 2012 | |||||||||||||||
| Shares | Amount | Shares | Amount | |||||||||||||
Sold: | ||||||||||||||||
Class A | 87,700,842 | $ | 873,364,044 | 76,632,228 | $ | 653,647,850 | ||||||||||
Class B | 823,802 | 8,051,441 | 1,051,815 | 8,808,659 | ||||||||||||
Class C | 12,109,400 | 121,759,085 | 4,887,236 | 41,102,265 | ||||||||||||
Class R | 4,574,200 | 45,460,476 | 5,932,415 | 50,391,223 | ||||||||||||
Class Y | 16,892,433 | 170,702,836 | 14,695,711 | 126,331,806 | ||||||||||||
Class R5 | 6,739,690 | 64,982,296 | 12,294,259 | 102,222,163 | ||||||||||||
Class R6(b) | 10,147,759 | 98,261,438 | — | — | ||||||||||||
Issued as reinvestment of dividends: | ||||||||||||||||
Class A | 17,150,441 | 163,264,966 | 16,520,442 | 139,372,643 | ||||||||||||
Class B | 995,825 | 9,235,728 | 1,873,608 | 15,474,345 | ||||||||||||
Class C | 1,579,331 | 14,763,683 | 1,539,047 | 12,778,414 | ||||||||||||
Class R | 352,640 | 3,369,248 | 375,128 | 3,178,004 | ||||||||||||
Class Y | 997,253 | 9,485,943 | 968,129 | 8,164,860 | ||||||||||||
Class R5 | 540,105 | 5,162,156 | 552,439 | 4,674,451 | ||||||||||||
Class R6 | 138,720 | 1,344,016 | — | — | ||||||||||||
Automatic conversion of Class B shares to Class A shares: | ||||||||||||||||
Class A | 17,617,079 | 173,428,532 | 24,192,716 | 206,655,020 | ||||||||||||
Class B | (17,961,899 | ) | (173,428,532 | ) | (24,426,071 | ) | (206,655,020 | ) | ||||||||
Reacquired: | ||||||||||||||||
Class A | (154,007,991 | ) | (1,501,296,519 | ) | (211,560,965 | ) | (1,802,337,873 | ) | ||||||||
Class B | (11,491,060 | ) | (109,887,869 | ) | (21,248,100 | ) | (176,404,279 | ) | ||||||||
Class C | (18,523,803 | ) | (177,343,449 | ) | (27,306,094 | ) | (229,100,009 | ) | ||||||||
Class R | (5,914,742 | ) | (57,520,131 | ) | (8,960,324 | ) | (77,239,951 | ) | ||||||||
Class Y | (17,512,155 | ) | (170,846,282 | ) | (21,766,458 | ) | (182,386,185 | ) | ||||||||
Class R5 | (10,465,023 | ) | (99,347,205 | ) | (5,547,204 | ) | (47,719,305 | ) | ||||||||
Class R6 | (6,654,596 | ) | (70,260,878 | ) | — | — | ||||||||||
Net increase (decrease) in share activity | (64,171,749 | ) | $ | (597,294,977 | ) | (159,300,043 | ) | $ | (1,349,040,919 | ) | ||||||
| (a) | There are entities that are record owners of more than 5% of the outstanding shares of the Fund and in the aggregate own 30% of the outstanding shares of the Fund. IDI has an agreement with these entities to sell Fund shares. The Fund, Invesco and/or Invesco affiliates may make payments to these entities, which are considered to be related to the Fund, for providing services to the Fund, Invesco and/or Invesco affiliates including but not limited to services such as securities brokerage, distribution, third party record keeping and account servicing. The Fund has no knowledge as to whether all or any portion of the shares owned of record by these entities are also owned beneficially. |
| (b) | Commencement date of September 24, 2012. |
30 Invesco Equity and Income Fund
NOTE 13—Financial Highlights
The following schedule presents financial highlights for a share of the Fund outstanding throughout the periods indicated.
| Net asset value, beginning of period | Net investment income(a) | Net gains (losses) on securities (both realized and unrealized) | Total from investment operations | Dividends from net investment income | Distributions from net realized gains | Total distributions | Net asset value, end of period | Total return | Net assets, end of period (000’s omitted) | Ratio of expenses to average net assets with fee waivers and/or expenses absorbed | Ratio of expenses to average net assets without fee waivers and/or expenses absorbed | Ratio of net investment income to average net assets | Portfolio turnover(b) | |||||||||||||||||||||||||||||||||||||||||||
Class A |
| |||||||||||||||||||||||||||||||||||||||||||||||||||||||
Year ended 08/31/13 | $ | 9.05 | $ | 0.17 | $ | 1.42 | $ | 1.59 | $ | (0.21 | ) | $ | — | $ | (0.21 | ) | $ | 10.43 | 17.80 | %(c) | $ | 8,752,700 | 0.78 | %(d) | 0.79 | %(d) | 1.74 | %(d) | 26 | % | ||||||||||||||||||||||||||
Year ended 08/31/12 | 8.19 | 0.17 | 0.85 | 1.02 | (0.16 | ) | — | (0.16 | ) | 9.05 | 12.67 | (c) | 7,878,694 | 0.80 | 0.81 | 2.05 | 21 | |||||||||||||||||||||||||||||||||||||||
Year ended 08/31/11 | 7.53 | 0.15 | 0.66 | 0.81 | (0.15 | ) | — | (0.15 | ) | 8.19 | 10.78 | (c) | 7,908,623 | 0.81 | 0.81 | 1.74 | 22 | |||||||||||||||||||||||||||||||||||||||
Eight months ended 08/31/10 | 7.79 | 0.10 | (0.28 | ) | (0.18 | ) | (0.08 | ) | — | (0.08 | ) | 7.53 | (2.40 | )(c) | 7,560,462 | 0.78 | (e) | 0.78 | (e) | 1.89 | (e) | 24 | ||||||||||||||||||||||||||||||||||
Year ended 12/31/09 | 6.45 | 0.15 | 1.34 | 1.49 | (0.15 | ) | — | (0.15 | ) | 7.79 | 23.51 | (f) | 8,395,716 | 0.82 | 0.82 | 2.15 | 78 | |||||||||||||||||||||||||||||||||||||||
Year ended 12/31/08 | 8.84 | 0.20 | (2.36 | ) | (2.16 | ) | (0.22 | ) | (0.01 | ) | (0.23 | ) | 6.45 | (24.78 | )(f) | 8,214,093 | 0.79 | 0.79 | 2.59 | 56 | ||||||||||||||||||||||||||||||||||||
Class B |
| |||||||||||||||||||||||||||||||||||||||||||||||||||||||
Year ended 08/31/13 | 8.87 | 0.09 | 1.39 | 1.48 | (0.13 | ) | — | (0.13 | ) | 10.22 | 16.90 | (c) | 570,146 | 1.53 | (d) | 1.54 | (d) | 0.99 | (d) | 26 | ||||||||||||||||||||||||||||||||||||
Year ended 08/31/12 | 8.04 | 0.15 | 0.83 | 0.98 | (0.15 | ) | — | (0.15 | ) | 8.87 | 12.36 | (c) | 739,631 | 1.02 | 1.56 | 1.83 | 21 | |||||||||||||||||||||||||||||||||||||||
Year ended 08/31/11 | 7.39 | 0.14 | 0.65 | 0.79 | (0.14 | ) | — | (0.14 | ) | 8.04 | 10.69 | (c)(g) | 1,014,527 | 0.84 | (g) | 0.98 | (g) | 1.71 | (g) | 22 | ||||||||||||||||||||||||||||||||||||
Eight months ended 08/31/10 | 7.64 | 0.09 | (0.27 | ) | (0.18 | ) | (0.07 | ) | — | (0.07 | ) | 7.39 | (2.40 | )(c)(g) | 1,278,734 | 0.91 | (e)(g) | 0.91 | (e)(g) | 1.76 | (e)(g) | 24 | ||||||||||||||||||||||||||||||||||
Year ended 12/31/09 | 6.33 | 0.14 | 1.32 | 1.46 | (0.15 | ) | — | (0.15 | ) | 7.64 | 23.48 | (h)(i) | 1,594,135 | 0.82 | (i) | 0.82 | (i) | 2.16 | (i) | 78 | ||||||||||||||||||||||||||||||||||||
Year ended 12/31/08 | 8.68 | 0.20 | (2.32 | ) | (2.12 | ) | (0.22 | ) | (0.01 | ) | (0.23 | ) | 6.33 | (24.78 | )(h)(i) | 1,693,758 | 0.79 | (i) | 0.79 | (i) | 2.59 | (i) | 56 | |||||||||||||||||||||||||||||||||
Class C |
| |||||||||||||||||||||||||||||||||||||||||||||||||||||||
Year ended 08/31/13 | 8.91 | 0.10 | 1.40 | 1.50 | (0.14 | ) | — | (0.14 | ) | 10.27 | 16.95 | (c) | 1,284,225 | 1.53 | (d) | 1.54 | (d) | 0.99 | (d) | 26 | ||||||||||||||||||||||||||||||||||||
Year ended 08/31/12 | 8.07 | 0.11 | 0.83 | 0.94 | (0.10 | ) | — | (0.10 | ) | 8.91 | 11.77 | (c)(j) | 1,157,325 | 1.54 | (j) | 1.54 | (j) | 1.31 | (j) | 21 | ||||||||||||||||||||||||||||||||||||
Year ended 08/31/11 | 7.42 | 0.09 | 0.65 | 0.74 | (0.09 | ) | — | (0.09 | ) | 8.07 | 9.95 | (c)(j) | 1,216,936 | 1.54 | (j) | 1.54 | (j) | 1.01 | (j) | 22 | ||||||||||||||||||||||||||||||||||||
Eight months ended 08/31/10 | 7.68 | 0.06 | (0.27 | ) | (0.21 | ) | (0.05 | ) | — | (0.05 | ) | 7.42 | (2.81 | )(c)(j) | 1,211,089 | 1.52 | (e)(j) | 1.52 | (e)(j) | 1.15 | (e)(j) | 24 | ||||||||||||||||||||||||||||||||||
Year ended 12/31/09 | 6.36 | 0.09 | 1.33 | 1.42 | (0.10 | ) | — | (0.10 | ) | 7.68 | 22.63 | (i)(k) | 1,375,516 | 1.56 | (i) | 1.56 | (i) | 1.40 | (i) | 78 | ||||||||||||||||||||||||||||||||||||
Year ended 12/31/08 | 8.72 | 0.14 | (2.32 | ) | (2.18 | ) | (0.17 | ) | (0.01 | ) | (0.18 | ) | 6.36 | (25.33 | )(i)(k) | 1,340,367 | 1.50 | (i) | 1.50 | (i) | 1.88 | (i) | 56 | |||||||||||||||||||||||||||||||||
Class R |
| |||||||||||||||||||||||||||||||||||||||||||||||||||||||
Year ended 08/31/13 | 9.08 | 0.15 | 1.43 | 1.58 | (0.19 | ) | — | (0.19 | ) | 10.47 | 17.57 | (c) | 193,610 | 1.03 | (d) | 1.04 | (d) | 1.49 | (d) | 26 | ||||||||||||||||||||||||||||||||||||
Year ended 08/31/12 | 8.23 | 0.15 | 0.85 | 1.00 | (0.15 | ) | — | (0.15 | ) | 9.08 | 12.23 | (c) | 176,940 | 1.05 | 1.06 | 1.80 | 21 | |||||||||||||||||||||||||||||||||||||||
Year ended 08/31/11 | 7.57 | 0.13 | 0.66 | 0.79 | (0.13 | ) | — | (0.13 | ) | 8.23 | 10.45 | (c) | 182,135 | 1.06 | 1.06 | 1.49 | 22 | |||||||||||||||||||||||||||||||||||||||
Eight months ended 08/31/10 | 7.83 | 0.09 | (0.28 | ) | (0.19 | ) | (0.07 | ) | — | (0.07 | ) | 7.57 | (2.51 | )(c) | 172,143 | 1.03 | (e) | 1.03 | (e) | 1.64 | (e) | 24 | ||||||||||||||||||||||||||||||||||
Year ended 12/31/09 | 6.48 | 0.13 | 1.35 | 1.48 | (0.13 | ) | — | (0.13 | ) | 7.83 | 23.25 | (l) | 169,713 | 1.07 | 1.07 | 1.88 | 78 | |||||||||||||||||||||||||||||||||||||||
Year ended 12/31/08 | 8.87 | 0.18 | (2.36 | ) | (2.18 | ) | (0.20 | ) | (0.01 | ) | (0.21 | ) | 6.48 | (24.89 | )(l) | 148,399 | 1.04 | 1.04 | 2.35 | 56 | ||||||||||||||||||||||||||||||||||||
Class Y(m) |
| |||||||||||||||||||||||||||||||||||||||||||||||||||||||
Year ended 08/31/13 | 9.05 | 0.20 | 1.41 | 1.61 | (0.23 | ) | — | (0.23 | ) | 10.43 | 18.10 | (c) | 477,207 | 0.53 | (d) | 0.54 | (d) | 1.99 | (d) | 26 | ||||||||||||||||||||||||||||||||||||
Year ended 08/31/12 | 8.20 | 0.20 | 0.84 | 1.04 | (0.19 | ) | — | (0.19 | ) | 9.05 | 12.83 | (c) | 410,600 | 0.55 | 0.56 | 2.30 | 21 | |||||||||||||||||||||||||||||||||||||||
Year ended 08/31/11 | 7.54 | 0.17 | 0.67 | 0.84 | (0.18 | ) | — | (0.18 | ) | 8.20 | 11.04 | (c) | 422,009 | 0.56 | 0.56 | 1.99 | 22 | |||||||||||||||||||||||||||||||||||||||
Eight months ended 08/31/10 | 7.79 | 0.11 | (0.28 | ) | (0.17 | ) | (0.08 | ) | — | (0.08 | ) | 7.54 | (2.15 | )(c) | 414,203 | 0.53 | (e) | 0.53 | (e) | 2.15 | (e) | 24 | ||||||||||||||||||||||||||||||||||
Year ended 12/31/09 | 6.45 | 0.16 | 1.35 | 1.51 | (0.17 | ) | — | (0.17 | ) | 7.79 | 23.82 | (n) | 530,010 | 0.57 | 0.57 | 2.34 | 78 | |||||||||||||||||||||||||||||||||||||||
Year ended 12/31/08 | 8.84 | 0.22 | (2.36 | ) | (2.14 | ) | (0.24 | ) | (0.01 | ) | (0.25 | ) | 6.45 | (24.60 | )(n) | 358,154 | 0.54 | 0.54 | 2.85 | 56 | ||||||||||||||||||||||||||||||||||||
Class R5 |
| |||||||||||||||||||||||||||||||||||||||||||||||||||||||
Year ended 08/31/13 | 9.05 | 0.20 | 1.42 | 1.62 | (0.24 | ) | — | (0.24 | ) | 10.43 | 18.17 | (c) | 241,540 | 0.47 | (d) | 0.48 | (d) | 2.05 | (d) | 26 | ||||||||||||||||||||||||||||||||||||
Year ended 08/31/12 | 8.20 | 0.21 | 0.84 | 1.05 | (0.20 | ) | — | (0.20 | ) | 9.05 | 12.96 | (c) | 238,392 | 0.44 | 0.44 | 2.41 | 21 | |||||||||||||||||||||||||||||||||||||||
Year ended 08/31/11 | 7.54 | 0.19 | 0.65 | 0.84 | (0.18 | ) | — | (0.18 | ) | 8.20 | 11.16 | (c) | 156,096 | 0.39 | 0.39 | 2.16 | 22 | |||||||||||||||||||||||||||||||||||||||
Eight months ended 08/31/10(o) | 7.59 | 0.03 | (0.04 | ) | (0.01 | ) | (0.04 | ) | — | (0.04 | ) | 7.54 | (0.13 | )(c) | 63,598 | 0.45 | (e) | 0.45 | (e) | 1.79 | (e) | 24 | ||||||||||||||||||||||||||||||||||
Class R6 |
| |||||||||||||||||||||||||||||||||||||||||||||||||||||||
Year ended 08/31/13(o) | 9.27 | 0.21 | 1.14 | 1.35 | (0.19 | ) | — | (0.19 | ) | 10.43 | 14.81 | (c) | 37,884 | 0.37 | (d)(e) | 0.38 | (d)(e) | 2.15 | (d)(e) | 26 | ||||||||||||||||||||||||||||||||||||
| (a) | Calculated using average shares outstanding. |
| (b) | Portfolio turnover is calculated at the fund level and is not annualized for periods less than one year, if applicable. For the year ended August 31, 2011 the portfolio turnover calculation excludes the value of securities purchased of $602,192,170 and sold of $70,835,642 in the effort to realign the Fund’s portfolio holdings after the reorganization of Invesco Balanced Fund and Invesco Basic Balanced into the Fund. |
| (c) | Includes adjustments in accordance with accounting principles generally accepted in the United States of America and as such, the net asset value for financial reporting purposes and the returns based upon those net asset values may differ from the net asset value and returns for shareholder transactions. Does not include sales charges and is not annualized for periods less than one year, if applicable. |
| (d) | Ratios are based on average daily net assets (000’s omitted) of $8,298,275, $668,384, $1,203,066, $182,068, $424,384, $224,911 and $61,545 for Class A, Class B, Class C, Class R, Class Y, Class R5 and Class R6 shares, respectively. |
| (e) | Annualized. |
| (f) | Assumes reinvestment of all distributions for the period and does not include payment of the maximum sales charge of 5.75% or contingent deferred sales charge (CDSC). On purchases of $1 million or more, a CDSC of 1% may be imposed on certain redemptions made within eighteen months of purchase. If the sales charges were included, total returns would be lower. These returns include combined Rule 12b-1 fees and service fees of up to 0.25% and do not reflect the deduction of taxes that a shareholder would pay on Fund distributions or the redemption of Fund shares. |
| (g) | The total return, ratio of expenses to average net assets and ratio of net investment income to average net assets reflect actual 12b-1 fees of 0.28% and 0.38% for the year ended August 31, 2011 and eight months ended August 31, 2010, respectively. |
| (h) | Assumes reinvestment of all distributions for the period and does not include payment of the maximum CDSC of 5%, charged on certain redemptions made within one year of purchase and declining to 0% after the fifth year. If the sales charge was included, total returns would be lower. These returns include combined Rule 12b-1 fees and service fees of up to 1% and do not reflect the deduction of taxes that a shareholder would pay on Fund distributions or the redemption of Fund shares. |
| (i) | The total return, ratio of expenses to average net assets and ratio of net investment income to average net assets reflect actual 12b-1 fees of less than 1%. |
| (j) | The total return, ratio of expenses to average net assets and ratio of net investment income to average net assets reflect actual 12b-1 fees of 0.99%, 0.97% and 0.99% for the years ended August 31, 2012, August 31, 2011 and the eight months ended August 31, 2010, respectively. |
| (k) | Assumes reinvestment of all distributions for the period and does not include payment of the maximum CDSC of 1%, charged on certain redemptions made within one year of purchase. If the sales charge was included, total returns would be lower. These returns include combined Rule 12b-1 fees and service fees of up to 1% and do not reflect the deduction of taxes that a shareholder would pay on Fund distributions or the redemption of Fund shares. |
| (l) | Assumes reinvestment of all distributions for the period. These returns include combined Rule 12b-1 fees and service fees of up to 0.50% and do not reflect the deduction of taxes that a shareholder would pay on Fund distributions or the redemption on Fund shares. |
| (m) | On June 1, 2010, Class I shares of Van Kampen Equity and Income Fund were reorganized into Class Y shares. |
| (n) | Assumes reinvestment of all distributions for the period. These returns do not reflect the deduction of taxes that a shareholder would pay on Fund distributions or the redemption on Fund shares. |
| (o) | Commencement date of June 1, 2010 and September 24, 2012 for Class R5 and Class R6 shares, respectively. |
31 Invesco Equity and Income Fund
Report of Independent Registered Public Accounting Firm
To the Board of Trustees of AIM Counselor Series Trust (Invesco Counselor Series Trust)
and Shareholders of Invesco Equity and Income Fund:
In our opinion, the accompanying statement of assets and liabilities, including the schedule of investments, and the related statements of operations and of changes in net assets and the financial highlights present fairly, in all material respects, the financial position of Invesco Equity and Income Fund (one of the funds constituting AIM Counselor Series Trust (Invesco Counselor Series Trust), hereafter referred to as the “Fund”) at August 31, 2013, the results of its operations for the year then ended, the changes in its net assets for each of the two years in the period then ended and the financial highlights for each of the three years in the period then ended and the eight month period ended August 31, 2010, in conformity with accounting principles generally accepted in the United States of America. These financial statements and financial highlights (hereafter referred to as “financial statements”) are the responsibility of the Fund’s management; our responsibility is to express an opinion on these financial statements based on our audits. We conducted our audits of these financial statements in accordance with the standards of the Public Company Accounting Oversight Board (United States). Those standards require that we plan and perform the audit to obtain reasonable assurance about whether the financial statements are free of material misstatement. An audit includes examining, on a test basis, evidence supporting the amounts and disclosures in the financial statements, assessing the accounting principles used and significant estimates made by management, and evaluating the overall financial statement presentation. We believe that our audits, which included confirmation of securities at August 31, 2013 by correspondence with the custodian and brokers, provide a reasonable basis for our opinion. The financial highlights of the Fund for the periods ended December 31, 2009 and prior were audited by another independent registered public accounting firm whose report dated February 19, 2010 expressed an unqualified opinion on those financial statements.
PRICEWATERHOUSECOOPERS LLP
October 25, 2013
Houston, Texas
32 Invesco Equity and Income Fund
Calculating your ongoing Fund expenses
Example
As a shareholder of the Fund, you incur two types of costs: (1) transaction costs, which may include sales charges (loads) on purchase payments or contingent deferred sales charges on redemptions, if any; and (2) ongoing costs, including management fees, distribution and/or service (12b-1) fees, and other Fund expenses. This example is intended to help you understand your ongoing costs (in dollars) of investing in the Fund and to compare these costs with ongoing costs of investing in other mutual funds. The example is based on an investment of $1,000 invested at the beginning of the period and held for the entire period March 1, 2013 through August 31, 2013.
Actual expenses
The table below provides information about actual account values and actual expenses. You may use the information in this table, together with the amount you invested, to estimate the expenses that you paid over the period. Simply divide your account value by $1,000 (for example, an $8,600 account value divided by $1,000 = 8.6), then multiply the result by the number in the table under the heading entitled “Actual Expenses Paid During Period” to estimate the expenses you paid on your account during this period.
Hypothetical example for comparison purposes
The table below also provides information about hypothetical account values and hypothetical expenses based on the Fund’s actual expense ratio and an assumed rate of return of 5% per year before expenses, which is not the Fund’s actual return.
The hypothetical account values and expenses may not be used to estimate the actual ending account balance or expenses you paid for the period. You may use this information to compare the ongoing costs of investing in the Fund and other funds. To do so, compare this 5% hypothetical example with the 5% hypothetical examples that appear in the shareholder reports of the other funds.
Please note that the expenses shown in the table are meant to highlight your ongoing costs only and do not reflect any transaction costs, such as sales charges (loads) on purchase payments or contingent deferred sales charges on redemptions, if any. Therefore, the hypothetical information is useful in comparing ongoing costs only, and will not help you determine the relative total costs of owning different funds. In addition, if these transaction costs were included, your costs would have been higher.
| Class | Beginning Account Value (03/01/13) | ACTUAL | HYPOTHETICAL (5% annual return before expenses) | Annualized Expense Ratio | ||||||||||||||||||||
| Ending Account Value (08/31/13)1 | Expenses Paid During Period2 | Ending Account Value (08/31/13) | Expenses Paid During Period2 | |||||||||||||||||||||
| A | $ | 1,000.00 | $ | 1,078.30 | $ | 4.14 | $ | 1,021.22 | $ | 4.02 | 0.79 | % | ||||||||||||
| B | 1,000.00 | 1,073.50 | 8.05 | 1,017.44 | 7.83 | 1.54 | ||||||||||||||||||
| C | 1,000.00 | 1,074.30 | 8.05 | 1,017.44 | 7.83 | 1.54 | ||||||||||||||||||
| R | 1,000.00 | 1,076.60 | 5.44 | 1,019.96 | 5.30 | 1.04 | ||||||||||||||||||
| Y | 1,000.00 | 1,079.60 | 2.83 | 1,022.48 | 2.75 | 0.54 | ||||||||||||||||||
| R5 | 1,000.00 | 1,079.90 | 2.52 | 1,022.79 | 2.45 | 0.48 | ||||||||||||||||||
| R6 | 1,000.00 | 1,079.40 | 1.99 | 1,023.29 | 1.94 | 0.38 | ||||||||||||||||||
| 1 | The actual ending account value is based on the actual total return of the Fund for the period March 1, 2013 through August 31, 2013, after actual expenses and will differ from the hypothetical ending account value which is based on the Fund’s expense ratio and a hypothetical annual return of 5% before expenses. |
| 2 | Expenses are equal to the Fund’s annualized expense ratio as indicated above multiplied by the average account value over the period, multiplied by 184/365 to reflect the most recent fiscal half year. |
33 Invesco Equity and Income Fund
Approval of Investment Advisory and Sub-Advisory Contracts
The Board of Trustees (the Board) of AIM Counselor Series Trust (Invesco Counselor Series Trust) is required under the Investment Company Act of 1940, as amended, to approve annually the renewal of Invesco Equity and Income Fund’s (the Fund) investment advisory agreement with Invesco Advisers, Inc. (Invesco Advisers) and the Master Intergroup Sub-Advisory Contract for Mutual Funds (the sub-advisory contracts) with Invesco Asset Management Deutschland GmbH, Invesco Asset Management Limited, Invesco Asset Management (Japan) Limited, Invesco Australia Limited, Invesco Hong Kong Limited, Invesco Senior Secured Management, Inc. and Invesco Canada Ltd. (collectively, the Affiliated Sub-Advisers). During contract renewal meetings held on June 17-19, 2013, the Board as a whole, and the disinterested or “independent” Trustees, who comprise over 75% of the Board, voting separately, approved the continuance of the Fund’s investment advisory agreement and the sub-advisory contracts for another year, effective July 1, 2013. The Board determined that continuation of the Fund’s investment advisory agreement and the sub-advisory contracts are in the best interests of the Fund and its shareholders and the compensation payable to Invesco Advisers and the Affiliated Sub-Advisers under the agreements is fair and reasonable.
The Board’s Fund Evaluation Process
The Board’s Investments Committee has established three Sub-Committees, each of which is primarily responsible for overseeing the management of a number of the funds advised by Invesco Advisers (the Invesco Funds). The Sub-Committees meet throughout the year to review the performance of their assigned Invesco Funds, including reviewing materials prepared under the direction of the independent Senior Officer, an officer of the Invesco Funds who reports directly to the independent Trustees. Over the course of each year, the Sub-Committees meet with portfolio managers for their assigned Invesco Funds and other members of management to review the performance, investment objective(s), policies, strategies, limitations and investment risks of these funds. The Sub-Committees meet regularly and at designated contract renewal meetings each year to conduct a review of the performance, fees, expenses and other matters related to their assigned Invesco Funds. Each Sub-Committee recommends to the Investments Committee, which in turn recommends to the full Board, whether and on what terms to approve the continuance of each Invesco Fund’s investment advisory agreement and sub-advisory contracts for another year.
During the contract renewal process, the Trustees receive comparative performance and fee data regarding the Invesco Funds prepared by Invesco Advisers and Lipper Inc. (Lipper), an independent provider of investment company
data. The Trustees also receive an independent written evaluation from the Senior Officer. The Senior Officer’s evaluation is prepared as part of his responsibility to manage the process by which the Invesco Funds’ proposed management fees are negotiated during the annual contract renewal process to ensure they are negotiated in a manner that is at arms’ length and reasonable. The independent Trustees are assisted in their annual evaluation of the Fund’s investment advisory agreement by the Senior Officer and by independent legal counsel. In addition to meetings with Invesco Advisers and fund counsel, the independent Trustees also discuss the continuance of the investment advisory agreement and sub-advisory contracts in separate sessions with the Senior Officer and with independent legal counsel.
In evaluating the fairness and reasonableness of compensation under the Fund’s investment advisory agreement and sub-advisory contracts, the Board considered, among other things, the factors discussed below. The Trustees recognized that the advisory fee rates for the Invesco Funds are, in many cases, the result of years of review and negotiation between the Trustees and Invesco Advisers as well as advisory fees previously approved by different predecessor boards. The Trustees’ deliberations and conclusions in a particular year may be based in part on their deliberations and conclusions regarding these same arrangements throughout the year and in prior years. The Trustees’ review and conclusions are based on the comprehensive consideration of all information presented to them and are not the result of any single determinative factor. Moreover, one Trustee may have weighed a particular piece of information or factor differently than another Trustee.
The discussion below serves as the Senior Officer’s independent written evaluation with respect to the Fund’s investment advisory agreement as well as a discussion of the material factors and related conclusions that formed the basis for the Board’s approval of the Fund’s investment advisory agreement and sub-advisory contracts. Unless otherwise stated, this information is current as of June 19, 2013, and may not reflect consideration of factors that became known to the Board after that date, including, for example, changes to the Fund’s performance, advisory fees, expense limitations and/or fee waivers.
Factors and Conclusions and Summary of Independent Written Fee Evaluation
| A. | Nature, Extent and Quality of Services Provided by Invesco Advisers and the Affiliated Sub-Advisers |
The Board reviewed the advisory services provided to the Fund by Invesco Advisers under the Fund’s investment advisory agreement, the performance of Invesco Advisers in providing these services, and the credentials and
experience of the officers and employees of Invesco Advisers who provide these services, including the Fund’s portfolio manager or managers, with whom the Sub-Committees met during the year. The Board’s review of the qualifications of Invesco Advisers to provide advisory services included the Board’s consideration of Invesco Advisers’ investment process oversight, independent credit analysis and investment risk management.
In determining whether to continue the Fund’s investment advisory agreement, the Board considered the benefits of reapproving an existing relationship and the greater uncertainty that may be associated with entering into a new relationship. The Board also considered non-advisory services that Invesco Advisers and its affiliates provide to the Invesco Funds such as various back office support functions, equity and fixed income trading operations, internal audit, distribution and legal and compliance. The Board concluded that the nature, extent and quality of the services provided to the Fund by Invesco Advisers are appropriate and satisfactory and consistent with the terms of the Fund’s investment advisory agreement.
The Board reviewed the services that may be provided by the Affiliated Sub-Advisers under the sub-advisory contracts and the credentials and experience of the officers and employees of the Affiliated Sub-Advisers who provide these services. The Board noted that the Affiliated Sub-Advisers have offices and personnel that are located in financial centers around the world. As a result, the Affiliated Sub-Advisers can provide research and investment analysis on the markets and economies of various countries in which the Fund may invest, make recommendations regarding securities and assist with security trades. The Board concluded that the sub-advisory contracts benefit the Fund and its shareholders by permitting Invesco Advisers to use the resources and talents of the Affiliated Sub-Advisers in managing the Fund. The Board concluded that the nature, extent and quality of the services that may be provided by the Affiliated Sub-Advisers are appropriate and satisfactory and consistent with the terms of the Fund’s sub-advisory contracts.
| B. | Fund Performance |
The Board considered Fund performance as a relevant factor in considering whether to approve the investment advisory agreement. The Board did not view Fund performance as a relevant factor in considering whether to approve the sub-advisory contracts for the Fund, as no Affiliated Sub-Adviser currently manages assets of the Fund.
The Board compared the Fund’s performance during the past one, three and five calendar years to the performance of funds in the Lipper performance universe and against the Lipper Mixed-Asset Target Allocation Growth Funds Index. The Board noted that performance of
34 Invesco Equity and Income Fund
Class A shares of the Fund was in the third quintile of the performance universe for the one and three year periods and the first quintile for the five year period (the first quintile being the best performing funds and the fifth quintile being the worst performing funds). The Board noted that performance of Class A shares of the Fund was below the performance of the Index for the one and three year periods and above the performance of the Index for the five year period. The Trustees also reviewed more recent Fund performance and this review did not change their conclusions.
| C. | Advisory and Sub-Advisory Fees |
The Board compared the Fund’s contractual management fee rate to the contractual management fee rates of funds in the Fund’s Lipper expense group at a common asset level. The Board noted that the contractual management fee rate for Class A shares of the Fund was below the median contractual advisory fee rate of funds in the expense group. The Board noted that the term “contractual management fee” may include both advisory and certain administrative services fees and that Invesco Advisers does not charge the Invesco Funds for the administrative services included in the as defined by Lipper. The Board also reviewed the methodology used by Lipper in providing expense group information, which includes using each fund’s contractual management fee schedule (including any applicable breakpoints) as reported in the most recent prospectus or statement of additional information for each fund in the expense group.
The Board also compared the Fund’s effective advisory fee rate (the advisory fee rate after advisory fee waivers and before other expense limitations/waivers) to the effective advisory fee rates of other mutual funds advised by Invesco Advisers and its affiliates with investment strategies comparable to those of the Fund. The Board noted that the Fund’s effective advisory fee rate was below the effective advisory fee rate of one mutual fund advised by Invesco Advisers and below the total account level fee of two mutual funds sub-advised by Invesco Advisers with investment strategies comparable to those of the Fund.
Other than the mutual funds described above, the Board noted that Invesco Advisers and its affiliates do not advise other funds or client accounts with investment strategies comparable to those of the Fund.
The Board also considered the services that may be provided by the Affiliated Sub-Advisers pursuant to the sub-advisory contracts, as well as the fees payable by Invesco Advisers to the Affiliated Sub-Advisers pursuant to the sub-advisory contracts. The Board also noted that the sub-advisory fees are not paid directly by the Fund, but rather, are payable by Invesco Advisers to the Affiliated Sub-Advisers.
Based upon the information and considerations described above, the Board concluded that the compensation payable to Invesco Advisers and the Affiliated Sub-Advisers is fair and reasonable.
| D. | Economies of Scale and Breakpoints |
The Board considered the extent to which there are economies of scale in the provision of advisory services to the Fund. The Board also considered whether the Fund benefits from economies of scale through contractual breakpoints in the Fund’s advisory fee schedule and was assisted in this review by a report from the Senior Officer. The Board also noted that the Fund shares directly in economies of scale through lower fees charged by third party service providers based on the combined size of the Invesco Funds and other clients advised by Invesco Advisers.
| E. | Profitability and Financial Resources |
The Board reviewed information from Invesco Advisers concerning the costs of the advisory and other services that Invesco Advisers and its affiliates provide to the Fund and the profitability of Invesco Advisers and its affiliates in providing these services for the year ended December 31, 2012. The Board received information from Invesco Advisers about the methodology used to prepare the profitability information. The Board considered the profitability of Invesco Advisers in managing the Fund and the Invesco Funds. The Board noted that Invesco Advisers continues to operate at a net profit from services Invesco Advisers and its subsidiaries provide to the Invesco Funds and the Fund. The Board did not deem the level of profits realized by Invesco Advisers and its affiliates from providing services to the Fund to be excessive given the nature, quality and extent of the services provided to the Invesco Funds. The Board received and accepted information from Invesco Advisers demonstrating that Invesco Advisers and each Affiliated Sub-Adviser are financially sound and have the resources necessary to perform their obligations under the investment advisory agreement and sub-advisory contracts.
| F. | Collateral Benefits to Invesco Advisers and its Affiliates |
The Board considered various other benefits received by Invesco Advisers and its affiliates from the relationship with the Fund, including the fees received for their provision of transfer agency and distribution services to the Fund. The Board considered comparative information regarding fees charged for these services, including information provided by Lipper and other independent sources. The Board considered the performance of Invesco Advisers and its affiliates in providing these services and the organizational structure employed to provide these services. The Board also considered that these services are provided to the Fund pursuant to written contracts that are reviewed and approved on an annual basis by the Board; that the services are required for the operation of the Fund; that Invesco Advisers and its affiliates can provide services, the nature and quality of which are at least equal to those provided by others offering the same or similar services; and that the fees for such services are fair and reasonable in light of the
usual and customary charges by others for services of the same nature and quality.
The Board considered the benefits realized by Invesco Advisers and the Affiliated Sub-Advisers as a result of portfolio brokerage transactions executed through “soft dollar” arrangements. The Board noted that soft dollar arrangements shift the payment obligation for research services from Invesco Advisers and the Affiliated Sub-Advisers to the Invesco Funds and that the research received may be used with other clients of Invesco Advisers and may reduce Invesco Advisers’ and the Affiliated Sub-Advisers’ expenses. The Board also considered periodic reports from the Chief Compliance Officer of the Invesco Funds demonstrating that these arrangements are consistent with regulatory requirements. The Board did not deem the soft dollar arrangements to be inappropriate.
The Board considered that the Fund’s uninvested cash and cash collateral from any securities lending arrangements may be invested in money market funds advised by Invesco Advisers pursuant to procedures approved by the Board. The Board noted that Invesco Advisers receives advisory fees from these affiliated money market funds attributable to such investments, although Invesco Advisers has contractually agreed to waive through varying periods the advisory fees payable by the Invesco Funds. The waiver is in an amount equal to 100% of the net advisory fee Invesco Advisers receives from the affiliated money market funds with respect to the Fund’s investment in the affiliated money market funds of uninvested cash, but not cash collateral. The Board concluded that the Fund’s investment of uninvested cash and cash collateral from any securities lending arrangements in the affiliated money market funds is in the best interests of the Fund and its shareholders.
The Board also considered use of an affiliated broker to execute certain trades for the Fund to among other things, control information leakage, and were advised that such trades are executed in compliance with rules under the Investment Company Act of 1940, as amended.
35 Invesco Equity and Income Fund
Tax Information
Form 1099-DIV, Form 1042-S and other year–end tax information provide shareholders with actual calendar year amounts that should be included in their tax returns. Shareholders should consult their tax advisors.
The following distribution information is being provided as required by the Internal Revenue Code or to meet a specific state’s requirement.
The Fund designates the following amounts or, if subsequently determined to be different, the maximum amount allowable for its fiscal year ended August 31, 2013:
Federal and State Income Tax | ||||
Qualified Dividend Income* | 74.78 | % | ||
Corporate Dividends Received Deduction* | 67.86 | % | ||
U.S. Treasury Obligations* | 0.00 | % | ||
| * | The above percentages are based on ordinary income dividends paid to shareholders during the Fund’s fiscal year. |
36 Invesco Equity and Income Fund
Trustees and Officers
The address of each trustee and officer is AIM Counselor Series Trust (Invesco Counselor Series Trust) (the “Trust”), 11 Greenway Plaza, Suite 1000, Houston, Texas 77046-1173. The trustees serve for the life of the Trust, subject to their earlier death, incapacitation, resignation, retirement or removal as more specifically provided in the Trust’s organizational documents. Each officer serves for a one year term or until their successors are elected and qualified. Column two below includes length of time served with predecessor entities, if any.
Name, Year of Birth and Position(s) Held with the Trust | Trustee and/ or Officer Since | Principal Occupation(s) During Past 5 Years | Number of Funds in Fund Complex Overseen by Trustee | Other Directorship(s) Held by Trustee During Past 5 Years | ||||
| Interested Persons | ||||||||
| Martin L. Flanagan1 — 1960 Trustee | 2007 | Executive Director, Chief Executive Officer and President, Invesco Ltd. (ultimate parent of Invesco and a global investment management firm); Advisor to the Board, Invesco Advisers, Inc. (formerly known as Invesco Institutional (N.A.), Inc.); Trustee, The Invesco Funds; Vice Chair, Investment Company Institute; and Member of Executive Board, SMU Cox School of Business
Formerly: Chairman and Chief Executive Officer, Invesco Advisers, Inc. (registered investment adviser); Director, Chairman, Chief Executive Officer and President, IVZ Inc. (holding company), INVESCO Group Services, Inc. (service provider) and Invesco North American Holdings, Inc. (holding company); Director, Chief Executive Officer and President, Invesco Holding Company Limited (parent of Invesco and a global investment management firm); Director, Invesco Ltd.; Chairman, Investment Company Institute and President, Co-Chief Executive Officer, Co-President, Chief Operating Officer and Chief Financial Officer, Franklin Resources, Inc. (global investment management organization) | 117 | None | ||||
| Philip A. Taylor2 — 1954 Trustee, President and Principal Executive Officer | 2006 | Head of North American Retail and Senior Managing Director, Invesco Ltd.; Director, Co-Chairman, Co-President and Co-Chief Executive Officer, Invesco Advisers, Inc. (formerly known as Invesco Institutional (N.A.), Inc.) (registered investment adviser); Director, Chairman, Chief Executive Officer and President, Invesco Management Group, Inc. (formerly known as Invesco Aim Management Group, Inc.) (financial services holding company); Director and President, INVESCO Funds Group, Inc. (registered investment adviser and registered transfer agent); Director and Chairman, Invesco Investment Services, Inc. (formerly known as Invesco Aim Investment Services, Inc.) (registered transfer agent) and IVZ Distributors, Inc. (formerly known as INVESCO Distributors, Inc.) (registered broker dealer); Director, President and Chairman, Invesco Inc. (holding company) and Invesco Canada Holdings Inc. (holding company); Chief Executive Officer, Invesco Corporate Class Inc. (corporate mutual fund company) and Invesco Canada Fund Inc. (corporate mutual fund company); Director, Chairman and Chief Executive Officer, Invesco Canada Ltd. (formerly known as Invesco Trimark Ltd./Invesco Trimark Ltèe) (registered investment adviser and registered transfer agent); Trustee, President and Principal Executive Officer, The Invesco Funds (other than AIM Treasurer’s Series Trust (Invesco Treasurer’s Series Trust) and Short-Term Investments Trust); Trustee and Executive Vice President, The Invesco Funds (AIM Treasurer’s Series Trust (Invesco Treasurer’s Series Trust) and Short-Term Investments Trust only); Director, Invesco Investment Advisers LLC (formerly known as Van Kampen Asset Management); Director, Chief Executive Officer and President, Van Kampen Exchange Corp.
Formerly: Director and Chairman, Van Kampen Investor Services Inc.: Director, Chief Executive Officer and President, 1371 Preferred Inc. (holding company); and Van Kampen Investments Inc.; Director and President, AIM GP Canada Inc. (general partner for limited partnerships); and Van Kampen Advisors, Inc.; Director and Chief Executive Officer, Invesco Trimark Dealer Inc. (registered broker dealer); Director, Invesco Distributors, Inc. (formerly known as Invesco Aim Distributors, Inc.) (registered broker dealer); Manager, Invesco PowerShares Capital Management LLC; Director, Chief Executive Officer and President, Invesco Advisers, Inc.; Director, Chairman, Chief Executive Officer and President, Invesco Aim Capital Management, Inc.; President, Invesco Trimark Dealer Inc. and Invesco Trimark Ltd./Invesco Trimark Ltèe; Director and President, AIM Trimark Corporate Class Inc. and AIM Trimark Canada Fund Inc.; Senior Managing Director, Invesco Holding Company Limited; Trustee and Executive Vice President, Tax-Free Investments Trust; Director and Chairman, Fund Management Company (former registered broker dealer); President and Principal Executive Officer, The Invesco Funds (AIM Treasurer’s Series Trust (Invesco Treasurer’s Series Trust), Short-Term Investments Trust and Tax-Free Investments Trust only); President, AIM Trimark Global Fund Inc. and AIM Trimark Canada Fund Inc. | 117 | None | ||||
Wayne W. Whalen3 — 1939 Trustee | 2010 | Of Counsel, and prior to 2010, partner in the law firm of Skadden, Arps, Slate, Meagher & Flom LLP, legal counsel to certain funds in the Fund Complex
| 130 | Director of the Mutual Fund Directors Forum, a nonprofit membership organization for investment directors; Chairman and Director of the Abraham Lincoln Presidential Library Foundation; and Director of the Stevenson Center for Democracy |
| 1 | Mr. Flanagan is considered an interested person of the Trust because he is an officer of the adviser to the Trust, and an officer and a director of Invesco Ltd., ultimate parent of the adviser to the Trust. |
| 2 | Mr. Taylor is considered an interested person of the Trust because he is an officer and a director of the adviser to, and a director of the principal underwriter of, the Trust. |
| 3 | Mr. Whalen is considered an “interested person” (within the meaning of Section 2(a)(19) of the 1940 Act) of certain Funds in the Invesco Fund Complex because he and his firm currently provide legal services as legal counsel to such Funds. |
T-1 Invesco Equity and Income Fund
Trustees and Officers—(continued)
Name, Year of Birth and Position(s) Held with the Trust | Trustee and/ or Officer Since | Principal Occupation(s) During Past 5 Years | Number of Funds in Fund Complex Overseen by Trustee | Other Directorship(s) Held by Trustee During Past 5 Years | ||||
| Independent Trustees | ||||||||
Bruce L. Crockett — 1944 Trustee and Chair | 2003 | Chairman, Crockett Technologies Associates (technology consulting company)
Formerly: Director, Captaris (unified messaging provider); Director, President and Chief Executive Officer COMSAT Corporation; and Chairman, Board of Governors of INTELSAT (international communications company) | 117 | ACE Limited (insurance company); Investment Company Institute | ||||
David C. Arch — 1945 Trustee | 2010 | Chairman and Chief Executive Officer of Blistex Inc., (consumer health care products manufacturer)
Formerly: Member of the Heartland Alliance Advisory Board, a nonprofit organization serving human needs based in Chicago | 130 | Board member of the Illinois Manufacturers’ Association; Member of the Board of Visitors, Institute for the Humanities, University of Michigan | ||||
Frank S. Bayley — 1939 Trustee | 2003 | Retired
Formerly: Director, Badgley Funds, Inc. (registered investment company) (2 portfolios) and General Partner and Of Counsel, law firm of Baker & McKenzie, LLP | 117 | Director and Chairman, C.D. Stimson Company (a real estate investment company); Trustee and Overseer, The Curtis Institute of Music | ||||
James T. Bunch — 1942 Trustee | 2000 | Managing Member, Grumman Hill Group LLC (family office private equity management)
Formerly: Founder, Green, Manning & Bunch Ltd. (investment banking firm)(1988-2010); Executive Committee, United States Golf Association; and Director, Policy Studies, Inc. and Van Gilder Insurance Corporation | 117 | Chairman, Board of Governors, Western Golf Association; Chairman-elect, Evans Scholars Foundation; and Director, Denver Film Society | ||||
Rodney F. Dammeyer — 1940 Trustee | 2010 | Chairman of CAC, LLC, (private company offering capital investment and management advisory services)
Formerly: Prior to 2001, Managing Partner at Equity Group Corporate Investments; Prior to 1995, Chief Executive Officer of Itel Corporation (formerly Anixter International); Prior to 1985, experience includes Senior Vice President and Chief Financial Officer of Household International, Inc., Executive Vice President and Chief Financial Officer of Northwest Industries, Inc. and Partner of Arthur Andersen & Co.; From 1987 to 2010, Director/Trustee of investment companies in the Van Kampen Funds complex | 117 | Director of Quidel Corporation and Stericycle, Inc.; Prior to May 2008, Trustee of The Scripps Research Institute; Prior to February 2008, Director of Ventana Medical Systems, Inc. | ||||
Albert R. Dowden — 1941 Trustee | 2003 | Director of a number of public and private business corporations, including the Boss Group, Ltd. (private investment and management); Reich & Tang Funds (5 portfolios) (registered investment company); and Homeowners of America Holding Corporation/ Homeowners of America Insurance Company (property casualty company)
Formerly: Director, Continental Energy Services, LLC (oil and gas pipeline service); Director, CompuDyne Corporation (provider of product and services to the public security market) and Director, Annuity and Life Re (Holdings), Ltd. (reinsurance company); Director, President and Chief Executive Officer, Volvo Group North America, Inc.; Senior Vice President, AB Volvo; Director of various public and private corporations; Chairman, DHJ Media, Inc.; Director Magellan Insurance Company; and Director, The Hertz Corporation, Genmar Corporation (boat manufacturer), National Media Corporation; Advisory Board of Rotary Power International (designer, manufacturer, and seller of rotary power engines); and Chairman, Cortland Trust, Inc. (registered investment company) | 117 | Director of Nature’s Sunshine Products, Inc. | ||||
Jack M. Fields — 1952 Trustee | 2003 | Chief Executive Officer, Twenty First Century Group, Inc. (government affairs company); Owner and Chief Executive Officer, Dos Angeles Ranch, L.P. (cattle, hunting, corporate entertainment); and Discovery Global Education Fund (non-profit)
Formerly: Chief Executive Officer, Texana Timber LP (sustainable forestry company); Director of Cross Timbers Quail Research Ranch (non-profit); and member of the U.S. House of Representatives | 117 | Insperity, Inc. (formerly known as Administaff) | ||||
Prema Mathai-Davis — 1950 Trustee | 2003 | Retired
Formerly: Chief Executive Officer, YWCA of the U.S.A. | 117 | None | ||||
Larry Soll — 1942 Trustee | 1997 | Retired
Formerly: Chairman, Chief Executive Officer and President, Synergen Corp. (a biotechnology company) | 117 | None | ||||
Hugo F. Sonnenschein — 1940 Trustee | 2010 | Distinguished Service Professor and President Emeritus of the University of Chicago and the Adam Smith Distinguished Service Professor in the Department of Economics at the University of Chicago
Formerly: President of the University of Chicago | 130 | Trustee of the University of Rochester and a member of its investment committee. Member of the National Academy of Sciences, the American Philosophical Society and a fellow of the American Academy of Arts and Sciences |
T-2 Invesco Equity and Income Fund
Trustees and Officers—(continued)
Name, Year of Birth and Position(s) Held with the Trust | Trustee and/ or Officer Since | Principal Occupation(s) During Past 5 Years | Number of Funds in Fund Complex Overseen by Trustee | Other Directorship(s) Held by Trustee During Past 5 Years | ||||
| Independent Trustees—(continued) | ||||||||
Raymond Stickel, Jr. — 1944 Trustee | 2005 | Retired
Formerly: Director, Mainstay VP Series Funds, Inc. (25 portfolios) and Partner, Deloitte & Touche | 117 | None | ||||
| Other Officers | ||||||||
| Russell C. Burk — 1958 Senior Vice President and Senior Officer | 2005 | Senior Vice President and Senior Officer, The Invesco Funds | N/A | N/A | ||||
| John M. Zerr — 1962 Senior Vice President, Chief Legal Officer and Secretary | 2006 | Director, Senior Vice President, Secretary and General Counsel, Invesco Management Group, Inc. (formerly known as Invesco Aim Management Group, Inc.) and Van Kampen Exchange Corp.; Senior Vice President, Invesco Advisers, Inc. (formerly known as Invesco Institutional (N.A.), Inc.) (registered investment adviser); Senior Vice President and Secretary, Invesco Distributors, Inc. (formerly known as Invesco Aim Distributors, Inc.); Director, Vice President and Secretary, Invesco Investment Services, Inc. (formerly known as Invesco Aim Investment Services, Inc.) and IVZ Distributors, Inc. (formerly known as INVESCO Distributors, Inc.); Director and Vice President, INVESCO Funds Group, Inc.; Senior Vice President, Chief Legal Officer and Secretary, The Invesco Funds; Manager, Invesco PowerShares Capital Management LLC; Director, Secretary and General Counsel, Invesco Investment Advisers LLC (formerly known as Van Kampen Asset Management); Secretary and General Counsel, Invesco Capital Markets, Inc. (formerly known as Van Kampen Funds Inc.) and Chief Legal Officer, PowerShares Exchange-Traded Fund Trust, PowerShares Exchange-Traded Fund Trust II, PowerShares India Exchange-Traded Fund Trust and PowerShares Actively Managed Exchange-Traded Fund Trust
Formerly: Director and Vice President, Van Kampen Advisors Inc.; Director, Vice President, Secretary and General Counsel, Van Kampen Investor Services Inc.; Director, Invesco Distributors, Inc. (formerly known as Invesco Aim Distributors, Inc.); Director, Senior Vice President, General Counsel and Secretary, Invesco Aim Advisers, Inc. and Van Kampen Investments Inc.; Director, Vice President and Secretary, Fund Management Company; Director, Senior Vice President, Secretary, General Counsel and Vice President, Invesco Aim Capital Management, Inc.; Chief Operating Officer and General Counsel, Liberty Ridge Capital, Inc. (an investment adviser); Vice President and Secretary, PBHG Funds (an investment company) and PBHG Insurance Series Fund (an investment company); Chief Operating Officer, General Counsel and Secretary, Old Mutual Investment Partners (a broker-dealer); General Counsel and Secretary, Old Mutual Fund Services (an administrator) and Old Mutual Shareholder Services (a shareholder servicing center); Executive Vice President, General Counsel and Secretary, Old Mutual Capital, Inc. (an investment adviser); and Vice President and Secretary, Old Mutual Advisors Funds (an investment company) | N/A | N/A | ||||
| Karen Dunn Kelley — 1960 Vice President | 2003 | Head of Invesco’s World Wide Fixed Income and Cash Management Group; Director, Co-President, Co-Chief Executive Officer, and Co-Chairman, Invesco Advisers, Inc. (formerly known as Invesco Institutional (N.A.), Inc.) (registered investment adviser); Chairman, Invesco Senior Secured Management, Inc.; Senior Vice President, Invesco Management Group, Inc. (formerly known as Invesco Aim Management Group, Inc.); Executive Vice President, Invesco Distributors, Inc. (formerly known as Invesco Aim Distributors, Inc.); Director, Invesco Mortgage Capital Inc., and Invesco Management Company Limited; Director and President, INVESCO Asset Management (Bermuda) Ltd., Vice President, The Invesco Funds (other than AIM Treasurer’s Series Trust (Invesco Treasurer’s Series Trust) and Short-Term Investments Trust); and President and Principal Executive Officer, The Invesco Funds (AIM Treasurer’s Series Trust (Invesco Treasurer’s Series Trust) and Short-Term Investments Trust only)
Formerly: Director, INVESCO Global Asset Management Limited and INVESCO Management S.A.; Senior Vice President, Van Kampen Investments Inc. and Invesco Advisers, Inc. (formerly known as Invesco Institutional (N.A.), Inc.) (registered investment adviser); Vice President, Invesco Advisers, Inc. (formerly known as Invesco Institutional (N.A.), Inc.); Director of Cash Management and Senior Vice President, Invesco Advisers, Inc. and Invesco Aim Capital Management, Inc.; President and Principal Executive Officer, Tax-Free Investments Trust; Director and President, Fund Management Company; Chief Cash Management Officer, Director of Cash Management, Senior Vice President, and Managing Director, Invesco Aim Capital Management, Inc.; Director of Cash Management, Senior Vice President, and Vice President, Invesco Advisers, Inc. and The Invesco Funds (AIM Treasurer’s Series Trust (Invesco Treasurer’s Series Trust), Short-Term Investments Trust and Tax-Free Investments Trust only) | N/A | N/A | ||||
T-3 Invesco Equity and Income Fund
Trustees and Officers—(continued)
Name, Year of Birth and Position(s) Held with the Trust | Trustee and/ or Officer Since | Principal Occupation(s) During Past 5 Years | Number of Funds in Fund Complex Overseen by Trustee | Other Directorship(s) Held by Trustee During Past 5 Years | ||||
| Other Officers—(continued) | ||||||||
| Sheri Morris — 1964 Vice President, Treasurer and Principal Financial Officer | 2003 | Vice President, Treasurer and Principal Financial Officer, The Invesco Funds; Vice President, Invesco Advisers, Inc. (formerly known as Invesco Institutional (N.A.), Inc.) (registered investment adviser); and Vice President, PowerShares Exchange-Traded Fund Trust, PowerShares Exchange-Traded Fund Trust II, PowerShares India Exchange-Traded Fund Trust and PowerShares Actively Managed Exchange-Traded Fund Trust
Formerly: Vice President, Invesco Aim Advisers, Inc., Invesco Aim Capital Management, Inc. and Invesco Aim Private Asset Management, Inc.; Assistant Vice President and Assistant Treasurer, The Invesco Funds and Assistant Vice President, Invesco Advisers, Inc., Invesco Aim Capital Management, Inc. and Invesco Aim Private Asset Management, Inc.; and Treasurer, PowerShares Exchange-Traded Fund Trust, PowerShares Exchange-Traded Fund Trust II, PowerShares India Exchange-Traded Fund Trust and PowerShares Actively Managed Exchange-Traded Fund Trust | N/A | N/A | ||||
Crissie M. Wisdom — 1969 Anti-Money Laundering Compliance Officer | 2013 | Anti-Money Laundering Compliance Officer, Invesco Advisers, Inc. (formerly known as Invesco Institutional (N.A.), Inc.) (registered investment adviser), Invesco Capital Markets, Inc. (formerly known as Van Kampen Funds Inc.), Invesco Distributors, Inc., Invesco Investment Services, Inc., Invesco Management Group, Inc., Van Kampen Exchange Corp., The Invesco Funds, Invesco Funds (Chicago), and PowerShares Exchange-Traded Fund Trust, PowerShares Exchange-Traded Fund Trust II, PowerShares India Exchange-Traded Fund Trust, and PowerShares Actively Managed Exchange-Traded Fund Trust; and Fraud Prevention Manager and Controls and Risk Analysis Manager for Invesco Investment Services, Inc. | N/A | N/A | ||||
| Todd L. Spillane — 1958 Chief Compliance Officer | 2006 | Senior Vice President, Invesco Management Group, Inc. (formerly known as Invesco Aim Management Group, Inc.) and Van Kampen Exchange Corp.; Senior Vice President and Chief Compliance Officer, Invesco Advisers, Inc. (registered investment adviser) (formerly known as Invesco Institutional (N.A.), Inc.); Chief Compliance Officer, The Invesco Funds; Vice President, Invesco Distributors, Inc. (formerly known as Invesco Aim Distributors, Inc.) and Invesco Investment Services, Inc. (formerly known as Invesco Aim Investment Services, Inc.)
Formerly: Chief Compliance Officer, Invesco Funds (Chicago); Senior Vice President, Van Kampen Investments Inc.; Senior Vice President and Chief Compliance Officer, Invesco Aim Advisers, Inc. and Invesco Aim Capital Management, Inc.; Chief Compliance Officer, INVESCO Private Capital Investments, Inc. (holding company), Invesco Private Capital, Inc. (registered investment adviser), Invesco Global Asset Management (N.A.), Inc., Invesco Senior Secured Management, Inc. (registered investment adviser), Van Kampen Investor Services Inc., PowerShares Exchange-Traded Fund Trust, PowerShares Exchange-Traded Fund Trust II, PowerShares India Exchange-Traded Fund Trust and PowerShares Actively Managed Exchange-Traded Fund Trust; and Vice President, Invesco Aim Capital Management, Inc. and Fund Management Company | N/A | N/A |
The Statement of Additional Information of the Trust includes additional information about the Fund’s Trustees and is available upon request, without charge, by calling 1.800.959.4246. Please refer to the Fund’s prospectus for information on the Fund’s sub-advisers.
Office of the Fund 11 Greenway Plaza, Suite 1000 Houston, TX 77046-1173 | Investment Adviser Invesco Advisers, Inc. 1555 Peachtree Street, N.E. Atlanta, GA 30309 | Distributor Invesco Distributors, Inc. 11 Greenway Plaza, Suite 1000 Houston, TX 77046-1173 | Auditors PricewaterhouseCoopers LLP 1201 Louisiana Street, Suite 2900 Houston, TX 77002-5678 | |||
Counsel to the Fund Stradley Ronon Stevens & Young, LLP 2005 Market Street, Suite 2600 Philadelphia, PA 19103-7018 | Counsel to the Independent Trustees Goodwin Procter LLP 901 New York Avenue, N.W. Washington, D.C. 20001 | Transfer Agent Invesco Investment Services, Inc. 11 Greenway Plaza, Suite 1000 Houston, TX 77046-1173 | Custodian State Street Bank and Trust Company 225 Franklin Street Boston, MA 02110-2801 | |||
T-4 Invesco Equity and Income Fund

Invesco mailing information
Send general correspondence to Invesco Investment Services, Inc., P.O. Box 219078, Kansas City, MO 64121-9078.
Invesco privacy policy
You share personal and financial information with us that is necessary for your transactions and your account records. We take very seriously the obligation to keep that information confidential and private.
Invesco collects nonpublic personal information about you from account applications or other forms you complete and from your transactions with us or our affiliates. We do not disclose information about you or our former customers to service providers or other third parties except to the extent necessary to service your account and in other limited circumstances as permitted by law. For example, we use this information to facilitate the delivery of transaction confirmations, financial reports, prospectuses and tax forms.
Even within Invesco, only people involved in the servicing of your accounts and compliance monitoring have access to your information. To ensure the highest level of confidentiality and security, Invesco maintains physical, electronic and procedural safeguards that meet or exceed federal standards. Special measures, such as data encryption and authentication, apply to your communications with us on our website. More detail is available to you at invesco.com/privacy.
Important notice regarding delivery of security holder documents
To reduce Fund expenses, only one copy of most shareholder documents may be mailed to shareholders with multiple accounts at the same address (Householding). Mailing of your shareholder documents may be householded indefinitely unless you instruct us otherwise. If you do not want the mailing of these documents to be combined with those for other members of your household, please contact Invesco Investment Services, Inc. at 800 959 4246 or contact your financial institution. We will begin sending you individual copies for each account within 30 days after receiving your request.
Fund holdings and proxy voting information
The Fund provides a complete list of its holdings four times in each fiscal year, at the quarter ends. For the second and fourth quarters, the lists appear in the Fund’s semiannual and annual reports to shareholders. For the first and third quarters, the Fund files the lists with the Securities and Exchange Commission (SEC) on Form N-Q. The most recent list of portfolio holdings is available at invesco.com/completeqtrholdings. Shareholders can also look up the Fund’s Forms N-Q on the SEC website at sec.gov. Copies of the Fund’s Forms N-Q may be reviewed and copied at the SEC Public Reference Room in Washington, D.C. You can obtain information on the operation of the Public Reference Room, including information about duplicating fee charges, by calling 202 551 8090 or 800 732 0330, or by electronic request at the following email address: publicinfo@sec.gov. The SEC file numbers for the Fund are shown below.
A description of the policies and procedures that the Fund uses to determine how to vote proxies relating to portfolio securities is available without charge, upon request, from our Client Services department at 800 959 4246 or at invesco.com/proxyguidelines. The information is also available on the SEC website, sec.gov.
Information regarding how the Fund voted proxies related to its portfolio securities during the most recent 12-month period ended June 30 is available at invesco.com/proxysearch. The information is also available on the SEC website, sec.gov. Invesco Advisers, Inc. is an investment adviser; it provides investment advisory services to individual and institutional clients and does not sell securities. Invesco Distributors, Inc. is the US distributor for Invesco Ltd.’s retail mutual funds, exchange-traded funds and institutional money market funds. Both are wholly owned, indirect subsidiaries of Invesco Ltd. |  | |
| SEC file numbers: 811-09913 and 333-36074 VK-EQI-AR-1 Invesco Distributors, Inc. | ||
| ||||
 |
Annual Report to Shareholders
|
August 31, 2013
| ||
| ||||
Invesco Floating Rate Fund
Nasdaq: A: AFRAX n C: AFRCX n R: AFRRX n Y: AFRYX n R5: AFRIX n R6: AFRFX | ||||

Letters to Shareholders
Philip Taylor | Dear Shareholders: Enclosed in this annual report, you’ll find information about your Fund and the factors that affected its performance during the reporting period. Inside, you’ll also find a discussion from your portfolio managers about how they managed your Fund, as well as performance data for your Fund, a complete list of your Fund’s investments as of the close of the reporting period and other important information. I hope you find this report of interest. During the reporting period covered by this report, major US equity indexes made multiyear or even all-time highs.1 Economic data were generally positive; housing and consumer spending data were particularly encouraging. Nonetheless, economic uncertainty and concern about continuing political and budget gridlock in Washington persisted. The US Federal Reserve’s deliberate vagueness about when, and to what degree, it might begin to curtail | ||||||||

its extraordinarily accommodative monetary policies – together with uncertainty about who will next lead the central bank – affected fixed income and equity markets alike. Most developed, non-US stock markets remained positive for the first half of 2013, despite a difficult second quarter.
Periods of market volatility and economic uncertainty can weaken the will of even the most resolute investor. That’s why Invesco believes it’s often helpful to work with a skilled and trusted financial adviser who can emphasize the importance of adhering to an investment plan designed to achieve long-term goals rather than being sidetracked by short-term uncertainty that can result in inaction. A financial adviser who is familiar with your individual financial situation, investment goals and risk tolerance can be an invaluable partner as you work toward your financial goals. He or she can provide insight and perspective when markets are volatile; encouragement and reassurance when times are uncertain; and advice and guidance when your financial situation or investment goals change.
Our website, invesco.com/us, is another source of timely insight and information for investors. On the website, you’ll find fund-specific as well as more general information from many of Invesco’s investment professionals. You’ll find in-depth articles, video clips and audio commentaries – and, of course, you also can access information about your Invesco account whenever it’s convenient for you.
What we mean by Intentional Investing
At Invesco, all of our people and all of our resources are dedicated to helping investors achieve their financial objectives. It’s a philosophy we call Intentional Investing, and it guides the way we:
| n | Manage investments – Our dedicated investment professionals search the world for the best opportunities, and each investment team follows a clear, disciplined process to build portfolios and mitigate risk. |
| n | Provide choices – We offer multiple investment strategies, allowing you and your financial adviser to build a portfolio that’s purpose-built for your needs. |
| n | Connect with you – We’re committed to giving you the expert insights you need to make informed investing decisions, and we are well-equipped to provide high-quality support for investors and advisers. |
At Invesco, we believe in putting investors first. That’s why investment management is all we do. Our sole focus on managing your money allows you and your financial adviser to build a portfolio of Invesco funds appropriate for your investment needs and goals today and when your circumstances change.
Have questions?
For questions about your account, feel free to contact an Invesco client services representative at 800 959 4246. For Invesco-related questions or comments, please email me directly at phil@invesco.com.
All of us at Invesco look forward to serving your investment management needs for many years to come. Thank you for investing with us.
Sincerely,

Philip Taylor
Senior Managing Director, Invesco Ltd.
1 Source: Reuters
2 Invesco Floating Rate Fund
Bruce Crockett | Dear Fellow Shareholders: The Invesco Funds Board has worked on a variety of issues over the last several months, and I’d like to take this opportunity to discuss two that affect you and our fellow fund shareholders. The first issue on which your Board has been working is our annual review of the funds’ advisory and sub-advisory contracts with Invesco Advisers and its affiliates. This annual review, which is required by the Investment Company Act of 1940, focuses on the nature and quality of the services Invesco provides as adviser to the Invesco Funds and the reasonableness of the fees that it charges for those services. Each year, we spend months reviewing detailed information that we request from Invesco that allows us to evaluate its services and fees. We also use information from many independent sources, including materials provided by the independent Senior Officer of the Invesco Funds, who reports directly to the independent | ||||||||

Trustees on the Board. Additionally, we meet with independent legal counsel and review performance and fee data prepared by Lipper Inc., an independent, third-party firm widely recognized as a leader in its field.
I’m pleased to report that the Board determined in June that renewing the investment advisory agreement and the sub-advisory contracts with Invesco Advisers and its affiliates would serve the best interests of each fund and its shareholders.
The second area of focus to highlight is the Board’s efforts to ensure that we provide a lineup of funds that allow financial advisers to build portfolios that meet shareholders’ changing financial needs and goals. Today, more and more investors are reaching, or approaching, retirement. But interest rates remain low, making it difficult for many investors to generate the income they need, or will soon need, in their retirement years.
The members of your Board think about these things, too, and we’ve worked with Invesco Advisers to provide more income-generating options in the Invesco Funds lineup to help shareholders potentially meet their income needs. Your Board recently approved changes to three existing equity mutual funds, increasing their focus on generating income while also seeking to provide long-term growth of capital.
As a result of these changes, the funds and their respective management teams now have more flexibility to invest in the types of securities that could meet investors’ growing need for income generation, and in some cases, also help investors diversify their sources of income. These equity funds complement an array of fixed-income, asset allocation and alternative investment options in the Invesco Funds lineup designed to accommodate a variety of risk tolerances.
Be assured that your Board will continue working on behalf of fund shareholders, keeping your needs and interests uppermost in our minds.
As always, please contact me at bruce@brucecrockett.com with any questions or concerns you may have. On behalf of the Board, we look forward to continuing to represent your interests and serving your needs.
Sincerely,

Bruce L. Crockett
Independent Chair
Invesco Funds Board of Trustees
3 Invesco Floating Rate Fund
Management’s Discussion of Fund Performance
Performance summary
For the fiscal year ended August 31, 2013, Class A shares of Invesco Floating Rate Fund, at net asset value (NAV), returned 6.97%, outperforming the Fund’s style-specific benchmark, the Credit Suisse Leveraged Loan Index, which returned 6.66%. The Fund invests in lower rated fixed income instruments, primarily senior secured corporate loans.
Your Fund’s long-term performance appears later in this report.
Fund vs. Indexes
Total returns, 8/31/12 to 8/31/13, at net asset value (NAV). Performance shown does not include applicable contingent deferred sales charges (CDSC) or front-end sales charges, which would have reduced performance.
| Class A Shares | 6.97 | % | |||
| Class C Shares | 6.45 | ||||
| Class R Shares | 6.57 | ||||
| Class Y Shares | 7.10 | ||||
| Class R5 Shares | 7.26 | ||||
| Class R6 Shares* | 7.31 | ||||
| Barclays U.S. Aggregate Index ‚ (Broad Market Index) | -2.47 | ||||
| CS Leveraged Loan Index¡ (Style-Specific Index) | 6.66 | ||||
Lipper Loan Participation Funds Classification Average¨ (Peer Group) | 5.98 |
| Source(s): | ‚Invesco, Barclays via FactSet Research Systems Inc.; ¡Invesco, Bloomberg L.P.; |
| ¨Lipper Inc. |
| * | Share class incepted during the reporting period. See page 7 for a detailed explanation of Fund performance. |
How we invest
We seek total return, comprised of current income and capital appreciation, by investing primarily in senior secured floating rate loans made by banks and other lending institutions and in senior secured floating rate debt instruments. Our credit analysts review all holdings and prospective holdings. Key consideration is given to the following:
| n | Management. Factors include direct operating experience in managing a business, management depth and incentives and track record operating in a leveraged environment. |
| n | Industry position and dynamics. Factors include a company’s industry position, life cycle phase of the industry, barriers to entry and current industry capacity and utilization. |
| Portfolio Composition | |||||
By credit quality†
| |||||
| Baa2 | 0.5 | % | |||
| Baa3 | 2.4 | ||||
| Ba1 | 3.7 | ||||
| Ba2 | 11.2 | ||||
| Ba3 | 24.6 | ||||
| B1 | 30.7 | ||||
| B2 | 13.2 | ||||
| B3 | 3.3 | ||||
| Caa1 | 3.1 | ||||
| Caa2 | 0.5 | ||||
| Caa3 | 0.4 | ||||
| Not Rated | 6.0 | ||||
| Equity | 0.4 | ||||
| † | Source: Moody’s. A credit rating is an assessment provided by a nationally recognized statistical rating organization (NRSRO) of the creditworthi-ness of an issuer with respect to debt obligations, including specific securities, money market instruments or other debts. Ratings are measured on a scale that generally ranges from Aaa (highest) to C (lowest); ratings are subject to change without notice. “Not Rated” indicates the debtor was not rated, and should not be interpreted as indicating low quality. For more information on Moody’s rating methodology, please visit moodys.com and select “Rating Methodologies” under Research and Ratings on the homepage. |
| Top 10 Issuers* | |||||
| 1. Clear Channel Communications, Inc. | 1.9 | % | |||
| 2. Asurion LLC | 1.8 | ||||
| 3. Nuveen Investments, Inc. | 1.1 | ||||
| 4. Alpha Topco Ltd. | 1.1 | ||||
| 5. Weight Watchers International, Inc. | 1.1 | ||||
| 6. Calpine Corp. | 1.1 | ||||
| 7. H.J. Heinz Co. | 1.1 | ||||
| 8. Avaya, Inc. | 1.1 | ||||
| 9. Realogy Corp. | 1.0 | ||||
| 10. First Data Corp. | 1.0 | ||||
| Total Net Assets | $2.1 billion | ||||
| Total Number of Holdings* | 614 | ||||
The Fund’s holdings are subject to change, and there is no assurance that the Fund will continue to hold any particular security.
*Excluding money market fund holdings.
| n | Asset quality. Considerations may include valuations of hard and intangible assets, how easily those assets can be converted to cash and appropriateness to leverage those assets. |
| n | Divisibility. This factor focuses on operating and corporate structures, ability to divide easily and efficiently, examination of non-core assets and valuation of multiple brand names. |
| n | Sponsors. Considerations include a firm’s track record of quality transactions, access to additional capital and control or ownership of the sponsoring firm. |
| n | Cash flow. We examine a firm’s sales and earnings breakdown by product, divisions and subsidiaries. We look at the predictability of corporate earnings and the cash requirement of the business and conduct an examination of the business cycles, seasonality, international pressures and so forth. |
| n | Recovery and loan-to-value. These factors focus on further examination of the default probability and the rate of recovery associated with loans. |
We constantly monitor the holdings in the portfolio and conduct daily, weekly and monthly meetings with portfolio managers and analysts, as well as with firms and loan sponsors.
Utilizing our proprietary risk rating system, our analysts assign, continuously monitor and update probability of default and expected recovery ratings for every asset in the portfolio. Using the resulting risk-adjusted returns, analysts monitor positions relative to market levels to detect early sell signals in an attempt to minimize principal loss and maximize relative value.
Market conditions and your Fund
During the fiscal year covered by this report, the senior secured loan market was generally steady in terms of price volatility on both a relative and absolute level. Additionally, throughout the reporting period, prices generally rose until the preponderance of loans were trading at or near par, levels which the leveraged loan market had not seen since the first half of 2007. Furthermore, while the performance of loans continued to correlate with equities and other high risk assets, loans were meaningfully less volatile; this was particularly true during the months of May and June, when interest rates rose at the long end of the yield curve. Some of the decrease in loan volatility was a function of a generally benign credit environment and a low default rate.
4 Invesco Floating Rate Fund
Additionally, strong technical demand for loans dampened any downward price pressure. Demand for senior secured loans was driven chiefly by investors’ concerns about rising interest rates. This demand principally came from:
| n | Collateralized loan obligation issuance, which, during the reporting period, was the strongest since 2007, with total inflows of $81.8 billion from September of 2012 through August of 2013.1 |
| n | Retail inflows, which, during the same period, totaled $57.7 billion.1 |
| n | Institutional demand. |
Corporate issuers in the senior secured loan market have benefited from robust capital markets since 2009, and during that time, issuers have maintained generally good credit performance, strengthened their balance sheets, improved liquidity and addressed near-term maturities. The default rate rose slightly from the 2011 low, but at the close of the reporting period, loan defaults remained comfortably below historical averages.
We managed the Fund with a view toward taking advantage of what appeared to be an expanding (albeit slowly) economy, fewer corporate restructurings, and strong demand for floating rate assets from investors concerned about how rising interest rates would affect the market value of longer dated fixed income investments.
As part of the Fund’s investment strategy, we seek to take advantage of market opportunities by decreasing risk in the Fund when we believe loans are overbought and increasing risk when we believe loans are oversold. The Fund benefited from some of the newer primary deals which exhibited low volatility during the reporting period and were sold at prices that offered, in our opinion, above-market returns for the associated risk. On an industry basis, the Fund benefited from its housing and telecommunication services holdings, and our allocation to structured products also contributed positively to Fund performance.
At the close of the reporting period, we believed fundamentals remained favorable for bank loans, with corporate balance sheets generally healthy and default rates below 2%.2 We favored B-rated loans, but as secondary prices for B-rated loans rose, we rebalanced the portfolio by increasing our allocation to BB-rated loans.3 Additionally, we slightly reduced our holdings of high yield bonds in the portfolio to a level that we believed was below that of many of our peers. At the close of the reporting period, we believed
the portfolio incorporated an appropriate mix of caution and aggressiveness, given the current environment.
As always, we appreciate your continued participation in Invesco Floating Rate Fund.
| 1 | Source: Standard & Poor’s Financial Services LLC |
| 2 | Source: Credit Suisse |
| 3 | Source: Standard & Poor’s. A credit rating is an assessment provided by a nationally recognized statistical rating organization (NRSRO) of the creditworthiness of an issuer with respect to debt obligations, including specific securities, money market instruments or other debts. Ratings are measured on a scale that generally ranges from AAA (highest) to D (lowest); ratings are subject to change without notice. “Not Rated” indicates the debtor was not rated, and should not be interpreted as indicating low quality. For more information on Standard and Poor’s rating methodology, please visit standardandpoors.com and select “Understanding Ratings” under Rating Resources on the homepage. |
The views and opinions expressed in management’s discussion of Fund performance are those of Invesco Advisers, Inc. These views and opinions are subject to change at any time based on factors such as market and economic conditions. These views and opinions may not be relied upon as investment advice or recommendations, or as an offer for a particular security. The information is not a complete analysis of every aspect of any market, country, industry, security or the Fund. Statements of fact are from sources considered reliable, but Invesco Advisers, Inc. makes no representation or warranty as to their completeness or accuracy. Although historical performance is no guarantee of future results, these insights may help you understand our investment management philosophy.
See important Fund and, if applicable, index disclosures later in this report.
 | Tom Ewald Portfolio manager, is lead manager of Invesco Floating Rate Fund. He joined Invesco in 2000. Mr. Ewald earned a BA | |
| from Harvard College and an MBA from the University of Virginia Darden School of Business. | ||
 | Greg Stoeckle Portfolio manager and chief investment officer of Invesco’s global senior loan investments team, is manager of Invesco Floating | |
| Rate Fund. He joined Invesco in 1999. Mr. Stoeckle earned a BS in applied math and economics from Ursinus College and an MBA in finance from Saint Joseph’s University. | ||
5 Invesco Floating Rate Fund
Your Fund’s Long-Term Performance
Results of a $10,000 Investment – Oldest Share Class(es)
Fund and index data from 8/31/03
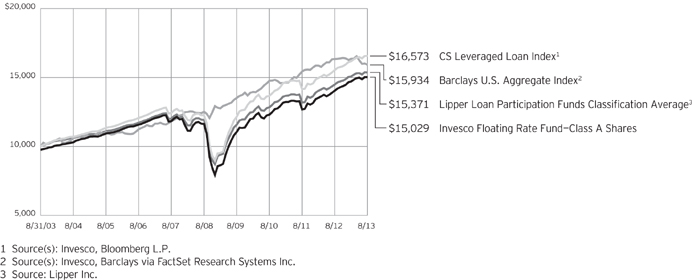
Past performance cannot guarantee comparable future results.
The data shown in the chart include reinvested distributions, applicable sales charges and Fund expenses including
management fees. Index results include reinvested dividends, but they do not reflect sales charges. Performance of the peer group, if applicable, reflects fund expenses and management fees; performance of a market index does not. Performance
shown in the chart and table(s) does not reflect deduction of taxes a shareholder would pay on Fund distributions or sale of Fund shares.
continued from page 8
| fall. Specific bonds differ in their sensitivity to changes in interest rates depending on their individual characteristics, including duration. |
| n | Leverage risk. Leverage exists when the Fund purchases or sells an instrument or enters into a transaction without investing cash in an amount equal to the full economic exposure of the instrument or transaction and the Fund could lose more than it invested. Leverage created from borrowing or certain types of transactions or instruments may impair the Fund’s liquidity, cause it to liquidate positions at an unfavorable time, increase volatility or otherwise not achieve its intended objective. |
| n | Liquidity risk. The majority of the Fund’s assets is likely to be invested in loans and securities that are less liquid than those traded on national exchanges. In the event the Fund voluntarily or involuntarily liquidates portfolio assets during periods of infrequent trading, it may not receive full value for those assets. |
| n | Management risk. The investment techniques and risk analysis used by the Fund’s portfolio managers may not produce the desired results. |
| n | Market risk. The prices of and the income generated by the Fund’s |
securities may decline in response to, among other things, investor sentiment, general economic and market conditions, regional or global instability, and currency and interest rate fluctuations. |
| n | Prepayment risk. An issuer’s ability to prepay principal on a loan or debt security prior to maturity can limit the Fund’s potential gains. Prepayments may require the Fund to replace the loan or debt security with a lower yielding security, adversely affecting the Fund’s yield. |
About indexes used in this report
| n | The Barclays U.S. Aggregate Index is an unmanaged index considered representative of the US investment-grade, fixed-rate bond market. |
| n | The CS Leveraged Loan Index represents tradable, senior-secured, US-dollar-denominated, noninvest-ment-grade loans. |
| n | The Lipper Loan Participation Funds Classification Average represents an average of all of the funds in the Lipper Loan Participation Funds classification. |
| n | The Fund is not managed to track the performance of any particular index, including the index(es) described here, and consequently, the performance of the Fund may deviate significantly from the performance of the index(es). |
| n | A direct investment cannot be made in an index. Unless otherwise indicated, index results include reinvested dividends, and they do not reflect sales charges. Performance of the peer group, if applicable, reflects fund expenses; performance of a market index does not. |
Other information
| n | The returns shown in management’s discussion of Fund performance are based on net asset values calculated for shareholder transactions. Generally accepted accounting principles require adjustments to be made to the net assets of the Fund at period end for financial reporting purposes, and as such, the net asset values for shareholder transactions and the returns based on those net asset values may differ from the net asset values and returns reported in the Financial Highlights. |
| n | Industry classifications used in this report are generally according to the Global Industry Classification Standard, which was developed by and is the exclusive property and a service mark of MSCI Inc. and Standard & Poor’s. |
6 Invesco Floating Rate Fund
Average Annual Total Returns
As of 8/31/13, including maximum applicable sales charges
| Class A Shares | |||||
| Inception (5/1/97) | 4.21 | % | |||
| 10 Years | 4.16 | ||||
| 5 Years | 4.73 | ||||
| 1 Year | 4.28 | ||||
| Class C Shares | |||||
| Inception (3/31/00) | 3.58 | % | |||
| 10 Years | 3.95 | ||||
| 5 Years | 4.67 | ||||
| 1 Year | 5.45 | ||||
| Class R Shares | |||||
| 10Years | 4.24 | % | |||
| 5 Years | 4.99 | ||||
| 1 Year | 6.57 | ||||
| Class Y Shares | |||||
| 10 Years | 4.51 | % | |||
| 5 Years | 5.44 | ||||
| 1 Year | 7.10 | ||||
| Class R5 Shares | |||||
| 10 Years | 4.67 | % | |||
| 5 Years | 5.59 | ||||
| 1 Year | 7.26 | ||||
| Class R6 Shares | |||||
| 10 Years | 4.45 | % | |||
| 5 Years | 5.31 | ||||
| 1 Year | 7.31 | ||||
On April 13, 2006, the Fund reorganized from a Closed-End Fund to an Open-End Fund. Performance shown for Class A shares prior to that date is that of the Closed-End Fund’s Class B shares and includes the management and 12b-1 fees applicable to B shares. The Closed-End Fund’s B-share performance reflects any applicable fee waivers or expense reimbursements.
On April 13, 2006, the Fund reorganized from a Closed-End Fund to an Open-End Fund. Performance shown for Class C shares prior to that date is that of the Closed-End Fund’s Class C shares and includes the management and 12b-1 fees applicable to C shares. The Closed-End Fund’s C-share performance reflects any applicable fee waivers or expense reimbursements.
Class R shares incepted on April 13, 2006. Performance shown prior to that date is that of Class A shares and includes the 12b-1 fees applicable to Class A shares. Class A share performance reflects any applicable fee waivers or expense reimbursements.
Average Annual Total Returns
As of 6/30/13, the most recent calendar quarter end, including maximum applicable sales charges
Class A Shares | |||||
| Inception (5/1/97) | 4.18 | % | |||
| 10 Years | 4.12 | ||||
| 5 Years | 4.24 | ||||
| 1 Year | 5.39 | ||||
| Class C Shares | |||||
| Inception (3/31/00) | 3.55 | % | |||
| 10 Years | 3.90 | ||||
| 5 Years | 4.19 | ||||
| 1 Year | 6.48 | ||||
| Class R Shares | |||||
| 10 Years | 4.22 | % | |||
| 5 Years | 4.54 | ||||
| 1 Year | 7.86 | ||||
| Class Y Shares | |||||
| 10 Years | 4.48 | % | |||
| 5 Years | 4.98 | ||||
| 1 Year | 8.41 | ||||
| Class R5 Shares | |||||
| 10 Years | 4.64 | % | |||
| 5 Years | 5.12 | ||||
| 1 Year | 8.57 | ||||
| Class R6 Shares | |||||
| 10 Years | 4.41 | % | |||
| 5 Years | 4.83 | ||||
| 1 Year | 8.42 | ||||
Class Y shares incepted on October 3, 2008. Performance shown prior to that date is that of Class A shares and includes the 12b-1 fees applicable to Class A shares. Class A share performance reflects any applicable fee waivers or expense reimbursements.
Class R5 shares incepted on April 13, 2006. Performance shown prior to that date is that of Class A shares and includes the 12b-1 fees applicable to Class A shares. Class A share performance reflects any applicable fee waivers or expense reimbursements.
Class R6 shares incepted on September 24, 2012. Performance shown prior to that date is that of Class A shares and includes the 12b-1 fees applicable to Class A shares. Class A share performance reflects any applicable fee waivers or expense reimbursements.
The performance data quoted represent past performance and cannot guarantee comparable future results; current performance may
be lower or higher. Please visit invesco.com/performance for the most recent month-end performance. Performance figures reflect reinvested distributions, changes in net asset value and the effect of the maximum sales charge unless otherwise stated. Investment return and principal value will fluctuate so that you may have a gain or loss when you sell shares.
The total annual Fund operating expense ratio set forth in the most recent Fund prospectus as of the date of this report for Class A, Class C, Class R, Class Y, Class R5 and Class R6 shares was 1.11%, 1.61%, 1.36%, 0.86%, 0.77% and 0.75%, respectively. The expense ratios presented above may vary from the expense ratios presented in other sections of this report that are based on expenses incurred during the period covered by this report.
Class A share performance reflects the maximum 2.50% sales charge and Class C share performance reflects the applicable contingent deferred sales charge (CDSC) for the period involved. The CDSC on Class C shares is 1% for the first year after purchase. Class R, Class Y, Class R5 and Class R6 shares do not have a front-end sales charge or a CDSC; therefore, performance is at net asset value.
The performance of the Fund’s share classes will differ primarily due to different sales charge structures and class expenses.
Had the adviser not waived fees and/ or reimbursed expenses in the past, performance would have been lower.
7 Invesco Floating Rate Fund
Invesco Floating Rate Fund’s investment objective is total return, comprised of current income and capital appreciation.
| n | Unless otherwise stated, information presented in this report is as of August 31, 2013, and is based on total net assets. |
| n | Unless otherwise noted, all data provided by Invesco. |
| n | To access your Fund’s reports/prospectus, visit invesco.com/fundreports. |
About share classes
| n | As of the close of business on April 13, 2006, Invesco Floating Rate Fund reorganized from a closed-end fund to an open-end fund. Information presented for Class A shares prior to the reorganization includes financial data for Class B shares of the closed-end fund. Information presented for Class C shares prior to the reorganization includes financial data for Class C shares of the closed-end fund. |
| n | Class R shares are generally available only to employer sponsored retirement and benefit plans. Please see the prospectus for more information. |
| n | Class Y shares are available only to certain investors. Please see the prospectus for more information. |
| n | Class R5 shares and Class R6 shares are primarily intended for employer sponsored retirement and benefit plans that meet certain standards and for institutional investors. On September 24, 2012, Institutional Class shares were renamed Class R5 shares. Please see the prospectus for more information. |
Principal risks of investing in the Fund
| n | Collateralized loan obligations risk. In addition to the normal interest rate, default and other risk of fixed income securities, collateralized loan obligations carry additional risks, including the possibility that distributions from collateral securities will not be adequate to make interest or other payments, the quality of the collateral may decline in value or default, the Fund may invest in collateralized loan obligations that are subordinate to other classes, values may be volatile, and disputes with the issuer may produce unexpected investment results. |
| n | Counterparty risk. Counterparty risk is the risk that the other party to the contract will not fulfill its contractual obligations, which may cause losses or additional costs to the Fund. |
| n | Credit linked notes risk. Risks of credit linked notes include those risks associated with the underlying reference obligation |
including but not limited to market risk, interest rate risk, credit risk, default risk and foreign currency risk. In the case of a credit linked note created with credit default swaps, the structure will be “funded” such that the par amount of the security will represent the maximum loss that could be incurred on the investment and no leverage is introduced. An investor in a credit linked note bears counterparty risk or the risk that the issuer of the credit linked note will default or become bankrupt and not make timely payment of principal and interest of the structured security. |
| n | Credit risk. The issuer of instruments in which the Fund invests may be unable to meet interest and/or principal payments, thereby causing its instruments to decrease in value and lowering the issuer’s credit rating. |
| n | Defaulted securities risk. Defaulted securities involve the substantial risk that principal will not be repaid. Defaulted securities and any securities received in an exchange for such securities may be subject to restrictions on resale. |
| n | Derivatives risk. The performance of derivative instruments is tied to the performance of an underlying currency, security, index, commodity or other instrument. In addition to risks relating to their underlying instruments, the use of derivatives may include other, possibly greater, risks. Derivatives involve costs, may be volatile, and may involve a small initial investment relative to the risk assumed. Risks associated with the use of derivatives may include counterparty, leverage, correlation, liquidity, tax, market, interest rate and management risks. Derivatives may also be more difficult to purchase, sell or value than other investments. The Fund may lose more than the cash amount invested on investments in derivatives. |
Investors should bear in mind that, while the Fund intends to use derivative strategies, it is not obligated to actively engage in these transactions, generally or in any particular kind of derivative, if the adviser elects not to do so due to availability, cost, market conditions or other factors.
| n | Floating rate risk. The Fund may invest in senior secured floating rate loans and debt securities that require collateral. There is a risk that the value of the collateral may not be sufficient to cover the amount owed, collateral securing a loan may be found invalid, and collateral may be used to pay other outstanding obligations of the borrower under applicable law or may be difficult to sell. There is also the risk that the collateral may be difficult to liquidate, or that a majority of the collateral may be illiquid. |
| n | Foreign securities risk. The Fund’s foreign investments may be affected by changes in a foreign country’s exchange rates, political and social instability, changes in economic or taxation policies, difficulties when enforcing obligations, decreased liquidity, and increased volatility. Foreign companies may be subject to less regulation resulting in less publicly available information about the companies. |
| n | High yield bond (junk bond) risk. Junk bonds involve a greater risk of default or price changes due to changes in the credit quality of the issuer. The values of junk bonds fluctuate more than those of high- quality bonds in response to company, political, regulatory or economic developments. Values of junk bonds can decline significantly over short periods of time. |
| n | Industry focus risk. To the extent a fund invests in securities issued or guaranteed by companies in the banking and financial services industries, the fund’s performance will depend on the overall condition of those industries, which may be affected by the following factors: the supply of short-term financing; changes in government regulation and interest rates; and overall economy. |
| n | Interest rate risk. Interest rate risk refers to the risk that bond prices generally fall as interest rates rise; conversely, bond prices generally rise as interest rates |
continued on page 6
This report must be accompanied or preceded by a currently effective Fund prospectus, which contains more complete information, including sales charges and expenses. Investors should read it carefully before investing.
NOT FDIC INSURED | MAY LOSE VALUE | NO BANK GUARANTEE
| Fund Nasdaq Symbols | |||||
| Class A Shares | AFRAX | ||||
| Class C Shares | AFRCX | ||||
| Class R Shares | AFRRX | ||||
| Class Y Shares | AFRYX | ||||
| Class R5 Shares | AFRIX | ||||
| Class R6 Shares | AFRFX | ||||
8 Invesco Floating Rate Fund
Schedule of Investments
August 31, 2013
| Interest Rate | Maturity Date | Principal Amount (000) | Value | |||||||||||||
Variable Rate Senior Loan Interests–90.80%(a)(b) |
| |||||||||||||||
| Aerospace & Defense–2.09% | ||||||||||||||||
Atlantic Aviation FBO Inc., Term Loan | 3.25 | % | 06/01/20 | $ | 2,118 | $ | 2,107,749 | |||||||||
Aveos Fleet Performance Inc. (Canada), PIK Second Lien Term Loan(c)(d)(e) | 0.00 | % | 03/12/15 | 667 | 260,029 | |||||||||||
Booz Allen Hamilton Inc., Term Loan B | 3.75 | % | 07/31/19 | 6,559 | 6,581,246 | |||||||||||
CAMP International Holding Company, First Lien Term Loan | 5.25 | % | 05/31/19 | 2,678 | 2,709,991 | |||||||||||
DAE Aviation Holdings, Inc., |
| |||||||||||||||
Term Loan B-1 | 6.25 | % | 10/29/18 | 3,200 | 3,240,068 | |||||||||||
Term Loan B-2 | 6.25 | % | 11/02/18 | 1,451 | 1,468,831 | |||||||||||
IAP Worldwide Services, First Lien Term Loan | 10.00 | % | 12/31/15 | 3,985 | 2,191,666 | |||||||||||
Landmark U.S. Holdings LLC, |
| |||||||||||||||
First Lien Term Loan | 5.75 | % | 10/25/19 | 2,255 | 2,274,780 | |||||||||||
Canadian Term Loan | 5.75 | % | 10/25/19 | 191 | 192,778 | |||||||||||
LMI Aerospace, Inc., Term Loan | 4.75 | % | 12/28/18 | 1,897 | 1,888,302 | |||||||||||
PRV Aerospace, LLC, Term Loan | 6.50 | % | 05/09/18 | 1,925 | 1,939,867 | |||||||||||
Sequa Corp., Term Loan | 5.25 | % | 06/19/17 | 2,859 | 2,880,228 | |||||||||||
Transdigm Inc., Term Loan C | 3.75 | % | 02/28/20 | 16,101 | 16,124,899 | |||||||||||
| 43,860,434 | ||||||||||||||||
| Air Transport–1.56% | ||||||||||||||||
American Airlines, Inc., Term Loan B | 4.75 | % | 06/27/19 | 8,742 | 8,659,868 | |||||||||||
Delta Air Lines, Inc., |
| |||||||||||||||
Revolver Loan(f) | — | 10/18/17 | 1,145 | 1,058,993 | ||||||||||||
Revolver Loan(g) | 0.00 | % | 04/20/16 | 7,785 | 7,395,779 | |||||||||||
Revolver Term Loan B-1 | 4.00 | % | 10/18/18 | 5,213 | 5,238,977 | |||||||||||
United Continental Holdings, Inc., Term Loan B | 4.00 | % | 04/01/19 | 1,846 | 1,853,436 | |||||||||||
US Airways, Inc., Term Loan B-2 | 3.50 | % | 11/23/16 | 8,698 | 8,696,360 | |||||||||||
| 32,903,413 | ||||||||||||||||
| Automotive–2.98% | ||||||||||||||||
Affinia Group Inc., Term Loan B-2 | 4.75 | % | 04/27/20 | 1,715 | 1,719,171 | |||||||||||
August U.S. Holding Company, Inc., |
| |||||||||||||||
First Lien Term Loan B-1 (Acquired 05/03/12-06/24/13; Cost $1,300,125) | 5.00 | % | 04/27/18 | 1,303 | 1,304,443 | |||||||||||
Second Lien Term Loan | 10.50 | % | 04/29/19 | 256 | 259,059 | |||||||||||
Second Lien Term Loan | 10.50 | % | 04/29/19 | 84 | 84,824 | |||||||||||
Term Loan B-1 (Acquired 05/03/12-06/24/13; Cost $1,642,845) | 5.00 | % | 04/27/18 | 1,644 | 1,645,847 | |||||||||||
Autoparts Holdings Ltd., First Lien Term Loan | 6.50 | % | 07/28/17 | 1,815 | 1,751,642 | |||||||||||
BBB Industries, LLC, Term Loan | 5.50 | % | 03/27/19 | 2,607 | 2,616,580 | |||||||||||
Federal-Mogul Corp., |
| |||||||||||||||
Term Loan B | 2.13 | % | 12/29/14 | 4,770 | 4,663,275 | |||||||||||
Term Loan C | 2.13 | % | 12/28/15 | 1,109 | 1,084,215 | |||||||||||
Goodyear Tire & Rubber Co., Second Lien Term Loan | 4.75 | % | 04/30/19 | 2,569 | 2,588,968 | |||||||||||
Hertz Corp. (The), |
| |||||||||||||||
LOC (Acquired 03/14/11; Cost $542,587) | 3.75 | % | 03/09/18 | 552 | 550,210 | |||||||||||
Term Loan B-1 | 3.75 | % | 03/12/18 | 908 | 911,037 | |||||||||||
Term Loan B-2 | 3.00 | % | 03/11/18 | 905 | 907,473 | |||||||||||
KAR Auction Services, Inc., Term Loan | 3.75 | % | 05/19/17 | 6,053 | 6,092,398 | |||||||||||
Key Safety Systems, Inc., Term Loan | 4.75 | % | 05/09/18 | 3,921 | 3,966,964 | |||||||||||
Keystone Automotive Operations, Inc., First Lien Term Loan | 7.00 | % | 08/15/19 | 2,225 | 2,235,706 | |||||||||||
Metaldyne, LLC, Term Loan | 5.00 | % | 12/18/18 | 3,059 | 3,088,341 | |||||||||||
Pinafore, LLC, Term Loan B-2 | 3.75 | % | 09/29/16 | 44 | 44,338 | |||||||||||
See accompanying Notes to Financial Statements which are an integral part of the financial statements.
9 Invesco Floating Rate Fund
| Interest Rate | Maturity Date | Principal Amount (000) | Value | |||||||||||||
| Automotive–(continued) | ||||||||||||||||
Schaeffler AG (Germany), Term Loan C | 4.25 | % | 01/27/17 | $ | 8,294 | $ | 8,330,380 | |||||||||
TI Group Automotive Systems, L.L.C., Term Loan | 5.50 | % | 03/27/19 | 7,823 | 7,862,566 | |||||||||||
Tower Automotive Holdings USA, LLC, Term Loan | 4.75 | % | 04/23/20 | 6,937 | 6,984,421 | |||||||||||
Transtar Holding Company, | ||||||||||||||||
First Lien Term Loan | 5.50 | % | 10/09/18 | 3,345 | 3,375,680 | |||||||||||
Second Lien Term Loan | 9.75 | % | 10/09/19 | 524 | 534,811 | |||||||||||
| 62,602,349 | ||||||||||||||||
| Beverage and Tobacco–0.26% | ||||||||||||||||
DS Waters of America, Inc., Term Loan B | 5.25 | % | 08/30/20 | 2,368 | 2,343,986 | |||||||||||
North American Breweries Holdings, LLC, Term Loan | 7.50 | % | 12/11/18 | 3,151 | 3,182,612 | |||||||||||
| 5,526,598 | ||||||||||||||||
| Building & Development–2.65% | ||||||||||||||||
ABC Supply Co., Inc., Term Loan B | 3.50 | % | 04/16/20 | 4,700 | 4,683,867 | |||||||||||
Building Materials Holding Corp., PIK Second Lien Term Loan(e) | 8.00 | % | 01/05/15 | 5,782 | 5,695,427 | |||||||||||
Capital Automotive L.P., | ||||||||||||||||
Second Lien Term Loan | 6.00 | % | 04/30/20 | 2,668 | 2,741,610 | |||||||||||
Term Loan B-1 | 4.00 | % | 04/10/19 | 7,190 | 7,238,037 | |||||||||||
CBRE Services, Inc., Term Loan B | 2.94 | % | 03/29/21 | 1,348 | 1,350,040 | |||||||||||
CPG International Inc., Term Loan | 5.75 | % | 09/18/19 | 436 | 440,573 | |||||||||||
Custom Building Products, Inc., Term Loan | 6.00 | % | 12/12/19 | 3,490 | 3,500,986 | |||||||||||
HD Supply Inc., Term Loan | 4.50 | % | 10/12/17 | 3,966 | 3,986,662 | |||||||||||
Lake at Las Vegas Joint Venture, LLC, | ||||||||||||||||
PIK Exit Revolver Loan (Acquired 08/09/12; Cost $10,794)(e)(g) | 0.00 | % | 02/28/17 | 11 | 4,524 | |||||||||||
PIK Exit Revolver Loan (Acquired 05/15/12,01/29/13; Cost $133,222)(e) | 4.64 | % | 02/28/17 | 138 | 55,838 | |||||||||||
Nortek, Inc., Term Loan | 5.25 | % | 04/26/17 | 456 | 458,678 | |||||||||||
Re/Max International, Inc., Term Loan | 5.25 | % | 07/31/20 | 4,185 | 4,187,718 | |||||||||||
Realogy Corp., | ||||||||||||||||
Synthetic LOC | 4.45 | % | 10/10/16 | 1 | 638 | |||||||||||
Term Loan B | 4.50 | % | 03/05/20 | 19,968 | 20,142,840 | |||||||||||
United Subcontractors, Inc., PIK Term Loan (Acquired 02/15/06-06/28/13; Cost $1,383,345)(e) | 4.28 | % | 06/30/15 | 127 | 123,415 | |||||||||||
WireCo WorldGroup Inc., Term Loan | 6.00 | % | 02/15/17 | 1,158 | 1,163,485 | |||||||||||
| 55,774,338 | ||||||||||||||||
| Business Equipment & Services–5.89% | ||||||||||||||||
Advantage Sales & Marketing Inc., | ||||||||||||||||
First Lien Term Loan | 4.25 | % | 12/18/17 | 1,448 | 1,457,667 | |||||||||||
Second Lien Term Loan | 8.25 | % | 06/18/18 | 273 | 277,832 | |||||||||||
Asurion Corp., | ||||||||||||||||
Incremental Term Loan B-1 | 4.50 | % | 05/24/19 | 15,201 | 15,059,356 | |||||||||||
Incremental Term Loan B-2 | 3.50 | % | 07/08/20 | 21,806 | 20,953,555 | |||||||||||
Audio Visual Services Group, Inc., First Lien Term Loan (Acquired 11/09/12-01/14/13; Cost $2,647,865) | 6.75 | % | 11/09/18 | 2,688 | 2,715,079 | |||||||||||
Brock Holdings III, Inc., First Lien Term Loan | 6.01 | % | 03/16/17 | 232 | 233,228 | |||||||||||
Ceridian Corp., Term Loan | 4.43 | % | 05/09/17 | 715 | 716,335 | |||||||||||
Crossmark Holdings, Inc., | ||||||||||||||||
First Lien Term Loan | 4.50 | % | 12/20/19 | 2,850 | 2,843,243 | |||||||||||
Second Lien Term Loan | 8.75 | % | 12/21/20 | 576 | 577,872 | |||||||||||
Duff & Phelps Corp., Term Loan | 4.50 | % | 04/23/20 | 2,179 | 2,184,682 | |||||||||||
DynCorp International Inc., Term Loan | 6.25 | % | 07/07/16 | 391 | 395,127 | |||||||||||
Emdeon Inc., Term Loan B-2 | 3.75 | % | 11/02/18 | 1,651 | 1,658,306 | |||||||||||
Epiq Systems, Inc., Term Loan | 4.75 | % | 08/27/20 | 4,039 | 4,035,573 | |||||||||||
Expert Global Solutions, Inc., First Lien Term Loan B | 8.50 | % | 04/03/18 | 5,617 | 5,736,066 | |||||||||||
See accompanying Notes to Financial Statements which are an integral part of the financial statements.
10 Invesco Floating Rate Fund
| Interest Rate | Maturity Date | Principal Amount (000) | Value | |||||||||||||
| Business Equipment & Services–(continued) | ||||||||||||||||
First Data Corp., | ||||||||||||||||
Term Loan | 4.18 | % | 03/24/17 | $ | 2,790 | $ | 2,771,405 | |||||||||
Term Loan | 4.18 | % | 03/23/18 | 13,356 | 13,256,464 | |||||||||||
Term Loan | 4.18 | % | 09/24/18 | 570 | 564,787 | |||||||||||
FS Funding A/S (Denmark), Term Loan B12 | 3.75 | % | 04/30/18 | 1,307 | 1,310,515 | |||||||||||
Garda World Security Corp., Term Loan B | 4.50 | % | 11/13/19 | 863 | 873,054 | |||||||||||
Genesys Telecom Holdings, U.S., Inc., Term Loan | 4.00 | % | 02/07/20 | 801 | 803,094 | |||||||||||
Helios Holding, Inc., First Lien Term Loan | 6.50 | % | 07/13/18 | 1,998 | 2,009,315 | |||||||||||
ION Trading Technologies S.a.r.l. (Luxembourg), First Lien Term Loan | 4.50 | % | 05/22/20 | 3,207 | 3,214,948 | |||||||||||
Koosharem LLC, | ||||||||||||||||
PIK First Lien Term Loan(e) | 10.25 | % | 06/30/14 | 741 | 677,584 | |||||||||||
PIK Second Lien Term Loan(c)(e) | 0.00 | % | 12/31/14 | 362 | 45,287 | |||||||||||
Kronos Inc., | ||||||||||||||||
First Lien Term Loan | 4.50 | % | 10/30/19 | 6,155 | 6,185,730 | |||||||||||
Second Lien Term Loan | 9.75 | % | 04/30/20 | 1,273 | 1,321,080 | |||||||||||
Lonestar Intermediate Super Holdings, LLC, Term Loan | 11.00 | % | 09/02/19 | 2,788 | 2,920,844 | |||||||||||
Nuance Communications, Inc., Term Loan C | 2.94 | % | 08/07/19 | 4,899 | 4,891,384 | |||||||||||
SourceHOV LLC, | ||||||||||||||||
First Lien Term Loan B | 5.25 | % | 04/30/18 | 1,494 | 1,506,861 | |||||||||||
Second Lien Term Loan | 8.75 | % | 04/30/19 | 355 | 360,173 | |||||||||||
SunGard Data Systems Inc., | ||||||||||||||||
Term Loan C | 3.94 | % | 02/28/17 | 843 | 846,854 | |||||||||||
Term Loan D | 4.50 | % | 01/31/20 | 1,068 | 1,080,273 | |||||||||||
Term Loan E | 4.00 | % | 03/09/20 | 9,297 | 9,383,938 | |||||||||||
Symphony IRI Group, Inc., Term Loan | 4.50 | % | 12/01/17 | 908 | 911,690 | |||||||||||
TNS Inc., | ||||||||||||||||
First Lien Term Loan | 5.00 | % | 02/14/20 | 1,275 | 1,287,438 | |||||||||||
Second Lien Term Loan | 9.00 | % | 08/14/20 | 98 | 98,973 | |||||||||||
Trans Union LLC, Term Loan | 4.25 | % | 02/10/19 | 756 | 762,801 | |||||||||||
Valleycrest Companies LLC, Term Loan | 5.50 | % | 06/13/19 | 1,310 | 1,312,354 | |||||||||||
VNU, Inc., Term Loan E | 2.94 | % | 05/02/16 | 3,378 | 3,398,013 | |||||||||||
Wash MultiFamily Laundry Systems, LLC, Term Loan | 5.25 | % | 02/21/19 | 1,601 | 1,609,043 | |||||||||||
West Corp., Revolver Loan(g) | 0.00 | % | 01/15/16 | 1,748 | 1,642,952 | |||||||||||
| 123,890,775 | ||||||||||||||||
| Cable & Satellite Television–4.52% | ||||||||||||||||
Atlantic Broadband Finance, LLC, Term Loan B | 3.25 | % | 12/02/19 | 971 | 964,826 | |||||||||||
Cequel Communications, LLC, Term Loan | 3.50 | % | 02/14/19 | 5,223 | 5,241,473 | |||||||||||
Charter Communications Operating LLC, Term Loan E | 3.00 | % | 07/01/20 | 3,414 | 3,386,161 | |||||||||||
CSC Holdings, LLC, Term Loan B | 2.68 | % | 04/17/20 | 14,851 | 14,705,084 | |||||||||||
Kabel Deutschland GmbH (Germany), Term Loan F1 | 3.25 | % | 02/01/19 | 4,674 | 4,678,489 | |||||||||||
MCC Iowa, | ||||||||||||||||
Term Loan D-1 | 1.90 | % | 01/30/15 | 1,940 | 1,940,588 | |||||||||||
Term Loan D-2 | 1.90 | % | 01/30/15 | 268 | 268,397 | |||||||||||
Term Loan G | 4.00 | % | 01/20/20 | 1,000 | 1,004,525 | |||||||||||
Term Loan H | 3.25 | % | 01/29/21 | 3,310 | 3,283,028 | |||||||||||
Media Holdco, LP, Term Loan | 7.25 | % | 07/24/18 | 2,339 | 2,350,242 | |||||||||||
Mediacom Illinois LLC, Term Loan E | 4.50 | % | 10/23/17 | 1,953 | 1,957,826 | |||||||||||
Quebecor Media Inc. (Canada), Term Loan B-1 | 3.25 | % | 08/17/20 | 5,540 | 5,543,295 | |||||||||||
Telecommunications Management, LLC, Term Loan | 5.00 | % | 04/30/20 | 2,697 | 2,702,794 | |||||||||||
See accompanying Notes to Financial Statements which are an integral part of the financial statements.
11 Invesco Floating Rate Fund
| Interest Rate | Maturity Date | Principal Amount (000) | Value | |||||||||||||
| Cable & Satellite Television–(continued) | ||||||||||||||||
UPC Financing Partnership, | ||||||||||||||||
Term Loan AF | 4.00 | % | 01/29/21 | $ | 2,004 | $ | 2,015,998 | |||||||||
Term Loan AH | 3.25 | % | 06/30/21 | 7,930 | 7,915,851 | |||||||||||
Virgin Media Investment Holdings Ltd. (United Kingdom), Term Loan B | 3.50 | % | 06/08/20 | 13,631 | 13,596,497 | |||||||||||
WaveDivision Holdings, LLC, Term Loan | 4.00 | % | 10/15/19 | 3,171 | 3,181,922 | |||||||||||
WideOpenWest Finance, LLC, | ||||||||||||||||
Term Loan B | 4.75 | % | 04/01/19 | 8,069 | 8,138,505 | |||||||||||
Term Loan B-1 | 4.25 | % | 07/17/17 | 4,871 | 4,903,898 | |||||||||||
Yankee Cable Acquisition, LLC, Term Loan | 5.25 | % | 03/02/20 | 7,166 | 7,199,956 | |||||||||||
| 94,979,355 | ||||||||||||||||
| Chemicals & Plastics–4.30% | ||||||||||||||||
AI Chem & Cy S.C.A., | ||||||||||||||||
Second Lien Term Loan | 8.25 | % | 04/03/20 | 338 | 348,600 | |||||||||||
Term Loan B-1 | 4.50 | % | 10/03/19 | 2,812 | 2,818,711 | |||||||||||
Term Loan B-2 | 4.50 | % | 10/03/19 | 1,459 | 1,462,494 | |||||||||||
Arysta LifeScience SPC, LLC, |
| |||||||||||||||
First Lien Term Loan | 4.50 | % | 05/29/20 | 9,014 | 9,032,377 | |||||||||||
Second Lien Term Loan | 8.25 | % | 11/30/20 | 1,038 | 1,039,858 | |||||||||||
Ascend Performance Materials Operations LLC, Term Loan B | 6.75 | % | 04/10/18 | 4,445 | 4,278,499 | |||||||||||
Aster Zweite Beteiligungs GMBH, (Germany) |
| |||||||||||||||
Term Loan B5 | 6.65 | % | 12/30/16 | 721 | 708,558 | |||||||||||
Term Loan C5 | 6.65 | % | 12/30/16 | 738 | 725,516 | |||||||||||
DuPont Performance Coatings, Inc., Term Loan B | 4.75 | % | 02/03/20 | 14,455 | 14,583,142 | |||||||||||
Emerald Performance Materials, LLC, First Lien Term Loan (Acquired 05/15/12; Cost $1,161,304) | 6.75 | % | 05/18/18 | 1,168 | 1,179,763 | |||||||||||
HII Holding Corp., First Lien Term Loan | 4.00 | % | 12/20/19 | 5,611 | 5,615,706 | |||||||||||
Huntsman International LLC, Term Loan | 2.71 | % | 04/19/17 | 1,307 | 1,310,093 | |||||||||||
Ineos Holdings Ltd., Term Loan | 4.00 | % | 05/04/18 | 17,306 | 17,199,272 | |||||||||||
MacDermid, Inc., |
| |||||||||||||||
First Lien Term Loan B | 4.00 | % | 06/08/20 | 2,897 | 2,906,437 | |||||||||||
Second Lien Term Loan B | 7.75 | % | 12/07/20 | 409 | 415,509 | |||||||||||
Nusil Technology LLC, Term Loan | 5.25 | % | 04/07/17 | 320 | 315,090 | |||||||||||
OMNOVA Solutions, Inc., Term Loan B-1 | 4.25 | % | 05/31/18 | 3,717 | 3,747,543 | |||||||||||
Oxea Finance LLC, |
| |||||||||||||||
First Lien Term Loan B-2 | 4.25 | % | 01/15/20 | 4,621 | 4,627,212 | |||||||||||
Second Lien Term Loan | 8.25 | % | 07/15/20 | 1,557 | 1,560,106 | |||||||||||
Phillips Plastics Corp., Term Loan | 4.75 | % | 02/13/17 | 739 | 740,860 | |||||||||||
PQ Corp., Term Loan | 4.50 | % | 08/07/17 | 7,896 | 7,952,390 | |||||||||||
Taminco Global Chemical Corp., Term Loan B-2 | 4.25 | % | 02/15/19 | 2,267 | 2,288,609 | |||||||||||
Tata Chemicals North America Inc., Term Loan | 3.75 | % | 08/07/20 | 1,639 | 1,641,592 | |||||||||||
Univar Inc., Term Loan B | 5.00 | % | 06/30/17 | 3,988 | 3,901,636 | |||||||||||
| 90,399,573 | ||||||||||||||||
| Clothing & Textiles–0.53% | ||||||||||||||||
Calceus Acquisition, Inc., Term Loan | 5.75 | % | 01/31/20 | 1,956 | 1,976,760 | |||||||||||
PVH Corp., Term Loan B | 3.25 | % | 02/13/20 | 8,530 | 8,575,093 | |||||||||||
Wolverine World Wide, Inc., Term Loan B | 4.16 | % | 07/31/19 | 627 | 632,119 | |||||||||||
| 11,183,972 | ||||||||||||||||
| Conglomerates–1.79% | ||||||||||||||||
CeramTec Acquisition Corp., Term Loan B-1(f) | — | 08/31/20 | 2,931 | 2,939,651 | ||||||||||||
See accompanying Notes to Financial Statements which are an integral part of the financial statements.
12 Invesco Floating Rate Fund
| Interest Rate | Maturity Date | Principal Amount (000) | Value | |||||||||||||
| Conglomerates–(continued) | ||||||||||||||||
Jarden Corp., |
| |||||||||||||||
Term Loan A1 | 2.18 | % | 03/31/16 | $ | 6,424 | $ | 6,464,042 | |||||||||
Term Loan B | 2.68 | % | 03/30/18 | 2,932 | 2,965,331 | |||||||||||
MX Holdings US, Inc., Term Loan B-1 | 3.68 | % | 08/16/20 | 3,385 | 3,404,106 | |||||||||||
Rexnord LLC/ RBS Global, Inc., Term Loan B | 4.00 | % | 08/20/20 | 10,446 | 10,354,151 | |||||||||||
RGIS Services, LLC, Term Loan C | 5.50 | % | 10/18/17 | 1,289 | 1,286,161 | |||||||||||
Spectrum Brands, Inc., |
| |||||||||||||||
Term Loan | 4.58 | % | 12/17/19 | 3,757 | 3,790,794 | |||||||||||
Term Loan A | 3.00 | % | 08/11/17 | 5,928 | 5,898,459 | |||||||||||
Term Loan C | 3.50 | % | 08/13/19 | 644 | 640,530 | |||||||||||
| 37,743,225 | ||||||||||||||||
| Containers & Glass Products–2.62% | ||||||||||||||||
Berlin Packaging, LLC, |
| |||||||||||||||
First Lien Term Loan | 4.75 | % | 04/02/19 | 4,343 | 4,359,544 | |||||||||||
Second Lien Term Loan | 8.75 | % | 04/02/20 | 845 | 851,285 | |||||||||||
Berry Plastics Group, Inc., Term Loan D | 3.50 | % | 02/07/20 | 14,746 | 14,659,179 | |||||||||||
BWAY Holding Company, Term Loan | 4.50 | % | 08/07/17 | 3,408 | 3,439,267 | |||||||||||
Caraustar Industries, Inc., Term Loan | 7.50 | % | 05/01/19 | 4,459 | 4,553,819 | |||||||||||
Consolidated Container Company LLC, Term Loan | 5.00 | % | 07/03/19 | 1,378 | 1,391,637 | |||||||||||
Exopack, LLC, Term Loan B | 5.00 | % | 05/31/17 | 2,775 | 2,805,944 | |||||||||||
Hoffmaster Group, Inc., First Lien Term Loan | 6.50 | % | 01/03/18 | 4,305 | 4,273,045 | |||||||||||
Pact Group (USA), Inc., Term Loan | 3.75 | % | 05/29/20 | 5,597 | 5,548,274 | |||||||||||
Pertus Sechzehnte GmbH, (Germany) | ||||||||||||||||
Term Loan B2A | 4.56 | % | 12/14/16 | 500 | 499,500 | |||||||||||
Term Loan C2A | 4.81 | % | 06/14/17 | 500 | 499,500 | |||||||||||
Ranpak Corp., | ||||||||||||||||
First Lien Term Loan | 4.50 | % | 04/23/19 | 578 | 581,133 | |||||||||||
Second Lien Term Loan (Acquired 04/10/13; Cost $643,639) | 8.50 | % | 04/23/20 | 650 | 667,727 | |||||||||||
Reynolds Group Holdings Inc., | ||||||||||||||||
Revolver Term Loan(g) | 0.00 | % | 11/05/14 | 3,987 | 3,982,165 | |||||||||||
Term Loan | 4.75 | % | 09/28/18 | 1,636 | 1,649,672 | |||||||||||
TricorBraun Inc., Term Loan | 4.00 | % | 05/03/18 | 1,997 | 2,002,354 | |||||||||||
WNA Holdings, Inc., | ||||||||||||||||
Second Lien Term Loan (Acquired 06/03/13; Cost $635,914) | 8.50 | % | 12/07/20 | 642 | 648,675 | |||||||||||
Term Loan | 4.50 | % | 06/05/20 | 956 | 961,222 | |||||||||||
Term Loan | 4.50 | % | 06/05/20 | 1,761 | 1,769,522 | |||||||||||
| 55,143,464 | ||||||||||||||||
| Cosmetics & Toiletries–0.49% | ||||||||||||||||
Nice-Pak Products, Inc., Term Loan | 7.26 | % | 06/18/14 | 534 | 520,842 | |||||||||||
Revlon Consumer Products Corp., | ||||||||||||||||
Term Loan | 4.00 | % | 11/20/17 | 3,297 | 3,308,169 | |||||||||||
Term Loan(f) | — | 08/19/19 | 6,433 | 6,442,912 | ||||||||||||
| 10,271,923 | ||||||||||||||||
| Drugs–1.61% | ||||||||||||||||
Grifols, Inc., Term Loan B | 4.25 | % | 06/01/17 | 4,288 | 4,324,487 | |||||||||||
Harlan Laboratories, Inc., Term Loan | 3.77 | % | 07/11/14 | 2,249 | 1,915,615 | |||||||||||
IMS Health Incorporated, Term Loan B-1 | 3.75 | % | 09/01/17 | 4,350 | 4,364,308 | |||||||||||
Medpace Intermediateco, Inc., Term Loan B (Acquired 06/21/11-04/12/13; Cost $2,494,070) | 5.25 | % | 06/16/17 | 2,526 | 2,532,181 | |||||||||||
Pharmaceutical Product Development, Inc., Term Loan | 4.25 | % | 12/05/18 | 661 | 662,819 | |||||||||||
See accompanying Notes to Financial Statements which are an integral part of the financial statements.
13 Invesco Floating Rate Fund
| Interest Rate | Maturity Date | Principal Amount (000) | Value | |||||||||||||
| Drugs–(continued) | ||||||||||||||||
Quintiles Transnational Corp., Term Loan B-2 | 4.00 | % | 06/08/18 | $ | 1,517 | $ | 1,525,596 | |||||||||
RPI Finance Trust, Term Loan | 3.50 | % | 05/09/18 | 688 | 693,120 | |||||||||||
Valeant Pharmaceuticals International, Inc., Term Loan C-1 | 4.38 | % | 12/11/19 | 11,201 | 11,258,830 | |||||||||||
Warner Chilcott Company, LLC, | ||||||||||||||||
Term Loan B-1 | 4.25 | % | 03/15/18 | 1,011 | 1,014,382 | |||||||||||
Term Loan B-1 | 4.25 | % | 03/15/18 | 2,321 | 2,330,176 | |||||||||||
Term Loan B-3 | 4.25 | % | 03/15/18 | 1,829 | 1,836,220 | |||||||||||
Term Loan B-4 | 3.18 | % | 08/20/17 | 1,156 | 1,158,655 | |||||||||||
Term Loan B-5 | 3.18 | % | 08/20/17 | 231 | 231,731 | |||||||||||
| 33,848,120 | ||||||||||||||||
| Ecological Services & Equipment–0.83% | ||||||||||||||||
ADS Waste Holdings, Inc., Term Loan B | 4.25 | % | 10/09/19 | 4,422 | 4,440,828 | |||||||||||
Sensus USA, Inc., First Lien Term Loan | 4.75 | % | 05/09/17 | 1,244 | 1,232,371 | |||||||||||
Servicemaster Company, The, | ||||||||||||||||
Synthetic LOC | 4.55 | % | 01/31/17 | 3,750 | 3,581,250 | |||||||||||
Term Loan B | 4.44 | % | 01/31/17 | 2,990 | 2,918,235 | |||||||||||
Term Loan C | 4.25 | % | 01/31/17 | 4,448 | 4,331,123 | |||||||||||
WCA Waste Corp., Term Loan | 4.00 | % | 03/23/18 | 948 | 950,368 | |||||||||||
| 17,454,175 | ||||||||||||||||
| Electronics & Electrical–4.37% | ||||||||||||||||
Aeroflex Incorporated, Term Loan B-1 | 4.50 | % | 11/11/19 | 5,996 | 6,054,088 | |||||||||||
Blackboard Inc., | ||||||||||||||||
Second Lien Term Loan | 11.50 | % | 04/04/19 | 1,095 | 1,114,446 | |||||||||||
Term Loan B-2 | 6.25 | % | 10/04/18 | 11,792 | 11,875,444 | |||||||||||
Blue Coat Systems, Inc., Term Loan | 4.50 | % | 05/31/19 | 1,949 | 1,955,404 | |||||||||||
Dealer Computer Services, Inc., Term Loan B | 2.18 | % | 04/21/16 | 779 | 783,929 | |||||||||||
DEI Sales, Inc., Term Loan | 5.75 | % | 07/13/17 | 2,141 | 2,139,174 | |||||||||||
Deltek, Inc., First Lien Term Loan | 5.00 | % | 10/10/18 | 9,530 | 9,558,527 | |||||||||||
DG FastChannel, Inc., Term Loan | 7.25 | % | 07/26/18 | 4,501 | 4,467,232 | |||||||||||
Freescale Semiconductor, Inc., Term Loan B-4 | 5.00 | % | 02/28/20 | 12,644 | 12,725,374 | |||||||||||
Infor (US), Inc., | ||||||||||||||||
Term Loan B-2 | 5.25 | % | 04/05/18 | 1,770 | 1,784,411 | |||||||||||
Term Loan B-3 | 3.75 | % | 06/03/20 | 8,370 | 8,330,264 | |||||||||||
Microsemi Corp., Term Loan | 3.75 | % | 02/19/20 | 856 | 861,373 | |||||||||||
Mirion Technologies, Inc., Term Loan | 5.75 | % | 03/30/18 | 2,781 | 2,780,757 | |||||||||||
Riverbed Technology, Inc., Term Loan | 4.00 | % | 12/18/19 | 1,767 | 1,785,145 | |||||||||||
RP Crown Parent, LLC, | ||||||||||||||||
First Lien Term Loan | 6.75 | % | 12/21/18 | 3,563 | 3,606,454 | |||||||||||
Second Lien Term Loan | 11.25 | % | 12/20/19 | 602 | 617,040 | |||||||||||
Ship Luxco 3 S.a.r.l., (Luxembourg) | ||||||||||||||||
Term Loan B2A-II | 5.25 | % | 11/29/19 | 986 | 992,697 | |||||||||||
Term Loan C2 | 4.75 | % | 11/29/19 | 2,915 | 2,932,528 | |||||||||||
Sophia, L.P., Term Loan B | 4.50 | % | 07/19/18 | 6,723 | 6,763,508 | |||||||||||
SS&C Technologies, Inc., | ||||||||||||||||
Term Loan B-1 | 3.50 | % | 06/07/19 | 3,409 | 3,412,989 | |||||||||||
Term Loan B-2 | 3.50 | % | 06/07/19 | 353 | 353,068 | |||||||||||
SSI Investments II Ltd., Term Loan | 5.00 | % | 05/26/17 | 3,425 | 3,463,671 | |||||||||||
StoneRiver Group, L.P., First Lien Term Loan | 4.50 | % | 11/29/19 | 771 | 771,667 | |||||||||||
Verint Systems Inc., Term Loan | 4.00 | % | 09/06/19 | 2,829 | 2,844,468 | |||||||||||
| 91,973,658 | ||||||||||||||||
See accompanying Notes to Financial Statements which are an integral part of the financial statements.
14 Invesco Floating Rate Fund
| Interest Rate | Maturity Date | Principal Amount (000) | Value | |||||||||||||
| Equipment Leasing–0.13% | ||||||||||||||||
Flying Fortress Inc., Term Loan | 3.50 | % | 06/30/17 | $ | 2,738 | $ | 2,745,031 | |||||||||
| Financial Intermediaries–2.31% | ||||||||||||||||
Bankruptcy Management Solutions, Inc., Term Loan B | 7.00 | % | 06/27/18 | 23 | 21,062 | |||||||||||
Blackstone Perpetual BidCo B.V. (Netherlands), Term Loan B22 | 4.76 | % | 02/07/20 | 1,340 | 1,334,619 | |||||||||||
GEO Group, Inc., Term Loan | 3.25 | % | 04/03/20 | 502 | 504,898 | |||||||||||
iPayment Inc., Term Loan | 6.75 | % | 05/08/17 | 3,978 | 3,878,445 | |||||||||||
LPL Holdings, Inc., Term Loan B | 3.25 | % | 03/29/19 | 1,468 | 1,462,467 | |||||||||||
MIP Delaware, LLC, Term Loan B-1 | 4.00 | % | 03/09/20 | 1,362 | 1,374,066 | |||||||||||
MoneyGram International, Inc., Term Loan | 4.25 | % | 03/27/20 | 8,137 | 8,185,507 | |||||||||||
Nuveen Investments, Inc., First Lien Term Loan B | 4.18 | % | 05/15/17 | 22,682 | 22,620,478 | |||||||||||
RJO Holdings Corp., Term Loan | 6.94 | % | 12/10/15 | 1,642 | 1,428,250 | |||||||||||
TransFirst Holdings, Inc., | ||||||||||||||||
First Lien Term Loan B-1 | 4.75 | % | 12/27/17 | 5,095 | 5,112,083 | |||||||||||
Second Lien Term Loan | 11.00 | % | 06/27/18 | 2,574 | 2,626,928 | |||||||||||
| 48,548,803 | ||||||||||||||||
| Food & Drug Retailers–0.88% | ||||||||||||||||
Pantry Inc., The, Term Loan | 4.75 | % | 08/02/19 | 2,273 | 2,305,357 | |||||||||||
Rite Aid Corp., | ||||||||||||||||
Second Lien Term Loan 1 | 5.75 | % | 08/21/20 | 1,353 | 1,391,968 | |||||||||||
Term Loan 6 | 4.00 | % | 02/21/20 | 4,154 | 4,169,465 | |||||||||||
Roundy’s Supermarkets, Inc., Term Loan B | 5.75 | % | 02/13/19 | 2,847 | 2,804,769 | |||||||||||
Sprouts Farmers Markets Holdings, LLC, Term Loan | 4.00 | % | 04/23/20 | 1,344 | 1,349,967 | |||||||||||
SuperValu Inc., Term Loan | 5.00 | % | 03/21/19 | 6,403 | 6,436,136 | |||||||||||
| 18,457,662 | ||||||||||||||||
| Food Products–3.50% | ||||||||||||||||
AdvancePierre Foods, Inc., | ||||||||||||||||
First Lien Term Loan | 5.75 | % | 07/10/17 | 5,924 | 5,992,458 | |||||||||||
Second Lien Term Loan | 9.50 | % | 10/10/17 | 524 | 534,813 | |||||||||||
Candy Intermediate Holdings, Inc., Term Loan | 7.50 | % | 06/18/18 | 2,846 | 2,735,771 | |||||||||||
CSM Bakery Supplies LLC, Term Loan | 4.75 | % | 07/03/20 | 5,881 | 5,844,200 | |||||||||||
Del Monte Corp., Term Loan | 4.00 | % | 03/08/18 | 6,320 | 6,331,641 | |||||||||||
Dole Food Company, Inc., Term Loan B | 3.75 | % | 04/01/20 | 13,490 | 13,497,187 | |||||||||||
H.J. Heinz Company, | ||||||||||||||||
Revolver Term Loan(f) | — | 06/07/18 | 10,581 | 10,558,223 | ||||||||||||
Term Loan B-2 | 3.50 | % | 06/05/20 | 10,721 | 10,803,085 | |||||||||||
JBS USA, LLC, Term Loan | 3.75 | % | 05/25/18 | 7,857 | 7,881,549 | |||||||||||
New HB Acquisition, LLC, Term Loan B | 6.75 | % | 04/09/20 | 2,412 | 2,477,849 | |||||||||||
Pinnacle Foods Finance LLC, Term Loan G | 3.25 | % | 04/29/20 | 6,922 | 6,871,100 | |||||||||||
QCE LLC, Term Loan | 9.00 | % | 01/24/17 | 11 | 4,210 | |||||||||||
| 73,532,086 | ||||||||||||||||
| Food Service–3.31% | ||||||||||||||||
Aramark Corp., | ||||||||||||||||
LOC 3 Term Loan | 3.68 | % | 07/26/16 | 82 | 82,598 | |||||||||||
Term Loan B | 3.78 | % | 07/26/16 | 2,379 | 2,391,396 | |||||||||||
Term Loan C | 3.78 | % | 07/26/16 | 8,724 | 8,770,666 | |||||||||||
Term Loan D | 4.00 | % | 09/09/19 | 5,414 | 5,444,148 | |||||||||||
Burger King Corp., Term Loan B | 3.75 | % | 09/27/19 | 3,516 | 3,543,453 | |||||||||||
Dunkin’ Brands, Inc., Term Loan B-3 | 3.75 | % | 02/14/20 | 692 | 693,389 | |||||||||||
See accompanying Notes to Financial Statements which are an integral part of the financial statements.
15 Invesco Floating Rate Fund
| Interest Rate | Maturity Date | Principal Amount (000) | Value | |||||||||||||
| Food Service–(continued) | ||||||||||||||||
Focus Brands Inc., First Lien Term Loan | 4.27 | % | 02/21/18 | $ | 2,761 | $ | 2,773,300 | |||||||||
Landry’s, Inc., Term Loan B | 4.75 | % | 04/24/18 | 5,912 | 5,964,104 | |||||||||||
OSI Restaurant Partners, LLC, Term Loan | 3.50 | % | 10/25/19 | 2,132 | 2,132,281 | |||||||||||
Restaurant Holding Company, LLC, Term Loan | 9.00 | % | 02/17/17 | 3,066 | 3,084,667 | |||||||||||
Seminole Hard Rock Entertainment, Inc., Term Loan | 3.50 | % | 05/14/20 | 1,177 | 1,177,591 | |||||||||||
US Foods, Inc., Term Loan | 4.50 | % | 03/29/19 | 10,434 | 10,464,589 | |||||||||||
Weight Watchers International, Inc., | ||||||||||||||||
Term Loan B-1 | 2.94 | % | 04/02/16 | 2,429 | 2,423,000 | |||||||||||
Term Loan B-2 | 3.75 | % | 04/02/20 | 19,654 | 19,387,011 | |||||||||||
Wendy’s International, Inc., Term Loan B | 3.25 | % | 05/15/19 | 1,365 | 1,364,554 | |||||||||||
| 69,696,747 | ||||||||||||||||
| Forest Products–0.17% | ||||||||||||||||
Xerium Technologies, Inc., Term Loan | 6.25 | % | 05/17/19 | 3,526 | 3,551,019 | |||||||||||
| Healthcare–6.56% | ||||||||||||||||
Alere Inc., | ||||||||||||||||
Incremental Term Loan B-1 | 4.25 | % | 06/30/17 | 1,139 | 1,149,211 | |||||||||||
Incremental Term Loan B-2 | 4.25 | % | 06/30/17 | 513 | 517,691 | |||||||||||
Term Loan B | 4.25 | % | 06/30/17 | 1,733 | 1,748,028 | |||||||||||
AMN Healthcare, Inc., Loan B | 3.75 | % | 04/05/18 | 858 | 864,215 | |||||||||||
Apria Healthcare Group Inc., Term Loan | 6.75 | % | 04/05/20 | 13,820 | 13,949,617 | |||||||||||
ATI Holdings, Inc., Term Loan | 5.75 | % | 12/20/19 | 1,445 | 1,461,655 | |||||||||||
Biomet, Inc., Term Loan B-1 | 3.96 | % | 07/25/17 | 9,877 | 9,920,362 | |||||||||||
Carestream Health, Inc., First Lien Term Loan | 5.00 | % | 06/07/19 | 12,484 | 12,609,092 | |||||||||||
Community Health Systems, Inc., Term Loan | 3.76 | % | 01/25/17 | 1,239 | 1,245,473 | |||||||||||
DaVita Inc., | ||||||||||||||||
Term Loan A-3 | 2.69 | % | 11/01/17 | 4,875 | 4,878,047 | |||||||||||
Term Loan B | 4.50 | % | 10/20/16 | 4,917 | 4,962,334 | |||||||||||
DJO Finance LLC, Term Loan B | 4.75 | % | 09/15/17 | 11,837 | 11,938,545 | |||||||||||
Drumm Investors LLC, Term Loan | 5.00 | % | 05/04/18 | 3,361 | 3,218,761 | |||||||||||
Fresenius US Finance I Inc., Term Loan B | 2.25 | % | 08/07/19 | 11,283 | 11,306,245 | |||||||||||
Genoa Healthcare Group, LLC, | ||||||||||||||||
First Lien Term Loan | 7.25 | % | 08/08/14 | 47 | 45,159 | |||||||||||
PIK Second Lien Term Loan(e) | 14.00 | % | 02/10/15 | 774 | 655,947 | |||||||||||
HCA, Inc., | ||||||||||||||||
Term Loan B-4 | 2.93 | % | 05/01/18 | 4,274 | 4,278,340 | |||||||||||
Term Loan B-5 | 3.03 | % | 03/31/17 | 10,083 | 10,096,530 | |||||||||||
HCR Healthcare, LLC, Term Loan | 5.00 | % | 04/06/18 | 547 | 539,861 | |||||||||||
Health Management Associates, Inc., Term Loan B | 3.50 | % | 11/16/18 | 3,659 | 3,670,059 | |||||||||||
Hologic, Inc., Term Loan B | 3.75 | % | 08/01/19 | 1,864 | 1,875,707 | |||||||||||
Kindred Healthcare, Inc., Term Loan B-1 | 4.25 | % | 06/01/18 | 9,419 | 9,410,595 | |||||||||||
Kinetic Concepts, Inc., Term Loan D-1 | 4.50 | % | 05/04/18 | 14,591 | 14,645,583 | |||||||||||
Sage Products Holdings III, LLC, First Lien Term Loan | 4.25 | % | 12/13/19 | 1,247 | 1,253,932 | |||||||||||
Surgical Care Affiliates, LLC, Term Loan C | 4.25 | % | 06/29/18 | 2,118 | 2,126,363 | |||||||||||
TriZetto Group, Inc., | ||||||||||||||||
Second Lien Term Loan | 8.50 | % | 03/28/19 | 1,968 | 1,800,882 | |||||||||||
Term Loan | 4.75 | % | 05/02/18 | 5,797 | 5,449,613 | |||||||||||
Universal Health Services, Inc., Term Loan B-1 | 2.43 | % | 11/15/16 | 500 | 503,125 | |||||||||||
Western Dental Services, Inc., Term Loan | 8.25 | % | 11/01/18 | 1,886 | 1,903,399 | |||||||||||
| 138,024,371 | ||||||||||||||||
See accompanying Notes to Financial Statements which are an integral part of the financial statements.
16 Invesco Floating Rate Fund
| Interest Rate | Maturity Date | Principal Amount (000) | Value | |||||||||||||
| Home Furnishings–0.50% | ||||||||||||||||
Serta Simmons Holdings, LLC, Term Loan | 5.00 | % | 10/01/19 | $ | 4,623 | $ | 4,647,943 | |||||||||
Tempur-Pedic International Inc., Term Loan B | 3.50 | % | 03/18/20 | 4,801 | 4,768,918 | |||||||||||
Yankee Candle Company, Inc., The, Term Loan | 5.25 | % | 04/02/19 | 1,016 | 1,026,118 | |||||||||||
| 10,442,979 | ||||||||||||||||
| Industrial Equipment–2.61% | ||||||||||||||||
Accudyne Industries LLC, Term Loan | 4.00 | % | 12/13/19 | 5,843 | 5,805,796 | |||||||||||
Alliance Laundry Systems LLC, Second Lien Term Loan | 9.50 | % | 12/10/19 | 535 | 541,055 | |||||||||||
Apex Tool Group, LLC, Term Loan | 4.50 | % | 01/31/20 | 5,773 | 5,801,910 | |||||||||||
Doncasters US Finance LLC, Term Loan B | 5.50 | % | 04/09/20 | 6,641 | 6,711,945 | |||||||||||
Gardner Denver, Inc., Term Loan | 4.25 | % | 07/30/20 | 5,056 | 5,038,440 | |||||||||||
Generac Power System, Inc., Term Loan B | 3.50 | % | 05/29/20 | 1,887 | 1,882,649 | |||||||||||
Grede LLC, Term Loan B | 4.50 | % | 05/02/18 | 3,117 | 3,128,268 | |||||||||||
Husky Injection Molding Systems Ltd., Term Loan | 4.25 | % | 06/29/18 | 5,293 | 5,309,916 | |||||||||||
Manitowoc Company, Inc., Term Loan B | 4.25 | % | 11/13/17 | 380 | 382,614 | |||||||||||
MEI, Inc., Term Loan | 5.00 | % | 08/21/20 | 2,826 | 2,832,912 | |||||||||||
Milacron LLC, Term Loan | 4.25 | % | 03/30/20 | 3,165 | 3,175,120 | |||||||||||
QS0001 Corp., First Lien Term Loan | 5.00 | % | 11/09/18 | 4,056 | 4,107,059 | |||||||||||
Tank Holding Corp., Term Loan | 4.25 | % | 07/09/19 | 2,805 | 2,798,382 | |||||||||||
Terex Corp., Term Loan | 4.50 | % | 04/28/17 | 1,463 | 1,484,044 | |||||||||||
Unifrax Holding Co., Term Loan | 4.25 | % | 11/28/18 | 543 | 545,844 | |||||||||||
Wesco Distribution, Inc., Term Loan B-1 | 4.50 | % | 12/12/19 | 5,329 | 5,372,759 | |||||||||||
| 54,918,713 | ||||||||||||||||
| Insurance–0.32% | ||||||||||||||||
Compass Investors Inc., Term Loan | 5.00 | % | 12/27/19 | 939 | 944,321 | |||||||||||
Cooper Gay Swett & Crawford Ltd., | ||||||||||||||||
First Lien Term Loan | 5.00 | % | 04/16/20 | 1,950 | 1,964,189 | |||||||||||
Second Lien Term Loan | 8.25 | % | 10/16/20 | 1,300 | 1,321,644 | |||||||||||
HUB International Holdings, Inc., Term Loan | 3.68 | % | 06/13/17 | 998 | 999,016 | |||||||||||
Sedgwick CMS Holdings, Inc., First Lien Term Loan B | 4.25 | % | 06/12/18 | 1,457 | 1,460,721 | |||||||||||
| 6,689,891 | ||||||||||||||||
| Leisure Goods, Activities & Movies–3.80% | ||||||||||||||||
24 Hour Fitness Worldwide, Inc., Term Loan B | 5.25 | % | 04/22/16 | 4,789 | 4,839,024 | |||||||||||
Alpha Topco Ltd. (United Kingdom), Term Loan B | 4.50 | % | 04/30/19 | 22,110 | 22,303,638 | |||||||||||
AMC Entertainment Inc., Term Loan | 3.50 | % | 04/30/20 | 2,943 | 2,948,167 | |||||||||||
Bright Horizons Family Solutions, Inc., Term Loan B | 4.00 | % | 01/30/20 | 3,569 | 3,581,057 | |||||||||||
Cedar Fair, L.P., Term Loan | 3.25 | % | 03/06/20 | 4,173 | 4,190,324 | |||||||||||
Equinox Holdings Inc., First Lien Term Loan | 4.50 | % | 01/31/20 | 2,088 | 2,100,919 | |||||||||||
Fender Musical Instruments Corp., Term Loan | 5.75 | % | 04/03/19 | 590 | 593,721 | |||||||||||
Great Wolf Resorts, Inc., Term Loan B | 4.50 | % | 08/06/20 | 5,627 | 5,631,061 | |||||||||||
IMG Worldwide, Inc., Term Loan B | 4.50 | % | 06/16/16 | 4,776 | 4,780,014 | |||||||||||
Kasima, LLC, Term Loan | 3.25 | % | 05/17/21 | 3,448 | 3,450,109 | |||||||||||
Live Nation Entertainment, Inc., Term Loan B-1 | 3.50 | % | 08/16/20 | 3,982 | 3,999,033 | |||||||||||
Otter Products, LLC, Term Loan | 5.25 | % | 04/29/19 | 1,149 | 1,155,047 | |||||||||||
Sabre Inc., | ||||||||||||||||
Term Loan B | 5.25 | % | 02/19/19 | 4,708 | 4,762,283 | |||||||||||
Term Loan C | 4.00 | % | 02/19/18 | 2,670 | 2,685,570 | |||||||||||
Seaworld Parks & Entertainment, Inc., Term Loan B-2 | 3.00 | % | 05/14/20 | 2,341 | 2,326,300 | |||||||||||
Six Flags Theme Parks Inc., Term Loan B | 4.00 | % | 12/20/18 | 585 | 591,908 | |||||||||||
See accompanying Notes to Financial Statements which are an integral part of the financial statements.
17 Invesco Floating Rate Fund
| Interest Rate | Maturity Date | Principal Amount (000) | Value | |||||||||||||
| Leisure Goods, Activities & Movies–(continued) | ||||||||||||||||
SRAM, LLC, First Lien Term Loan | 4.02 | % | 04/10/20 | $ | 1,230 | $ | 1,223,571 | |||||||||
Topps Company, Inc., (The), Term Loan | 2.94 | % | 10/13/14 | 1,542 | 1,534,415 | |||||||||||
US FinCo LLC, Term Loan B | 4.00 | % | 05/29/20 | 2,530 | 2,530,479 | |||||||||||
WMG Acquisition Corp., Term Loan B | 3.75 | % | 07/01/20 | 669 | 669,018 | |||||||||||
Zuffa, LLC, Term Loan | 4.50 | % | 02/25/20 | 4,013 | 4,027,749 | |||||||||||
| 79,923,407 | ||||||||||||||||
| Lodging & Casinos–3.90% | ||||||||||||||||
Bally Technologies, Inc., Term Loan B(f) | — | 08/31/20 | 10,446 | 10,448,840 | ||||||||||||
Boyd Acquisition Sub, LLC, Term Loan B | 4.25 | % | 11/20/17 | 155 | 155,654 | |||||||||||
Boyd Gaming Corp., Term Loan B | 4.00 | % | 08/14/20 | 3,493 | 3,506,660 | |||||||||||
Cannery Casino Resorts, LLC, | ||||||||||||||||
First Lien Term Loan | 6.00 | % | 10/02/18 | 2,716 | 2,718,325 | |||||||||||
Second Lien Term Loan | 10.00 | % | 10/02/19 | 515 | 483,689 | |||||||||||
Centaur Acquisition, LLC, First Lien Term Loan | 5.25 | % | 02/20/19 | 2,398 | 2,420,876 | |||||||||||
Four Seasons Holdings Inc., (Canada) | ||||||||||||||||
First Lien Term Loan | 4.25 | % | 06/27/20 | 3,299 | 3,332,343 | |||||||||||
Second Lien Term Loan | 6.25 | % | 12/28/20 | 2,066 | 2,107,004 | |||||||||||
Harrah’s Operating Company, Inc., | ||||||||||||||||
Term Loan B-5 | 4.43 | % | 01/26/18 | 7,113 | 6,288,349 | |||||||||||
Term Loan B-6 | 5.43 | % | 01/26/18 | 5,981 | 5,393,015 | |||||||||||
HLT Owned Mezz III-C LLC, Term Loan | 3.68 | % | 11/12/15 | 14,996 | 14,925,282 | |||||||||||
Las Vegas Sands, LLC/Venetian Casino Resort, LLC, Term Loan B | 2.69 | % | 11/23/16 | 1,337 | 1,337,042 | |||||||||||
MGM Resorts International, Term Loan B | 3.50 | % | 12/20/19 | 6,096 | 6,091,820 | |||||||||||
Pinnacle Entertainment, Inc., | ||||||||||||||||
Term Loan B-1 | 3.75 | % | 08/15/16 | 2,376 | 2,387,636 | |||||||||||
Term Loan B-2 | 3.75 | % | 08/13/20 | 3,725 | 3,746,022 | |||||||||||
Scientific Games Corp., Term Loan B-1 | 3.19 | % | 06/30/15 | 244 | 241,973 | |||||||||||
Seminole Tribe of Florida, Term Loan | 3.00 | % | 04/29/20 | 4,913 | 4,908,816 | |||||||||||
Station Casinos LLC, Term Loan B | 5.00 | % | 03/01/20 | 831 | 839,161 | |||||||||||
Tropicana Entertainment Inc., Term Loan | 7.50 | % | 03/16/18 | 1,635 | 1,654,973 | |||||||||||
Twin River Management Group, Inc., Term Loan | 5.25 | % | 11/09/18 | 6,583 | 6,656,705 | |||||||||||
Yonkers Racing Corp., | ||||||||||||||||
First Lien Term Loan | 4.25 | % | 08/20/19 | 2,077 | 2,069,709 | |||||||||||
Second Lien Term Loan | 8.75 | % | 08/20/20 | 392 | 390,002 | |||||||||||
| 82,103,896 | ||||||||||||||||
| Nonferrous Metals & Minerals–1.31% | ||||||||||||||||
Alpha Natural Resources, Inc., Term Loan B | 3.50 | % | 05/22/20 | 5,434 | 5,222,759 | |||||||||||
Arch Coal, Inc., Term Loan | 5.75 | % | 05/16/18 | 10,538 | 10,256,197 | |||||||||||
Noranda Aluminum Acquisition Corp., Term Loan B | 5.75 | % | 02/28/19 | 3,409 | 3,247,497 | |||||||||||
Novelis Inc., Term Loan | 3.75 | % | 03/10/17 | 3,101 | 3,107,198 | |||||||||||
Walter Energy, Inc., Term Loan B | 6.75 | % | 04/02/18 | 6,050 | 5,789,567 | |||||||||||
| 27,623,218 | ||||||||||||||||
| Oil & Gas–5.20% | ||||||||||||||||
Atlas Energy, L.P., Term Loan | 6.50 | % | 07/30/19 | 3,363 | 3,407,507 | |||||||||||
Bronco Midstream Funding, LLC, Term Loan | 5.00 | % | 08/17/20 | 5,237 | 5,236,989 | |||||||||||
Buffalo Gulf Coast Terminals LLC, Term Loan | 5.25 | % | 10/31/17 | 4,634 | 4,680,745 | |||||||||||
Chesapeake Energy Corp., Term Loan | 5.75 | % | 12/01/17 | 9,045 | 9,246,644 | |||||||||||
CITGO Petroleum Corp., Term Loan B | 8.00 | % | 06/24/15 | 735 | 743,158 | |||||||||||
Crestwood Holdings LLC, Term Loan B-1 | 7.00 | % | 06/19/19 | 1,304 | 1,327,168 | |||||||||||
See accompanying Notes to Financial Statements which are an integral part of the financial statements.
18 Invesco Floating Rate Fund
| Interest Rate | Maturity Date | Principal Amount (000) | Value | |||||||||||||
| Oil & Gas–(continued) | ||||||||||||||||
Drillships Financing Holding Inc., | ||||||||||||||||
Term Loan B-1 | 6.00 | % | 03/31/21 | $ | 12,825 | $ | 12,905,126 | |||||||||
Term Loan B-2 | 5.50 | % | 07/15/16 | 4,443 | 4,487,234 | |||||||||||
EMG Utica, LLC, Term Loan | 4.75 | % | 03/27/20 | 2,761 | 2,771,751 | |||||||||||
Energy Transfer Equity, L.P., Term Loan | 3.75 | % | 03/24/17 | 1,125 | 1,133,792 | |||||||||||
Exco Resources, Inc., Term Loan | 5.00 | % | 08/19/19 | 5,741 | 5,705,283 | |||||||||||
Glenn Pool Oil & Gas Trust I, Term Loan (Acquired 06/08/11; Cost $977,057) | 4.50 | % | 05/02/16 | 977 | 981,942 | |||||||||||
HGIM Corp., Term Loan B | 5.50 | % | 06/18/20 | 3,215 | 3,234,661 | |||||||||||
Kinder Morgan, Inc., Term Loan A | 4.19 | % | 05/24/15 | 18,062 | 18,231,631 | |||||||||||
NGPL PipeCo LLC, Term Loan | 6.75 | % | 09/15/17 | 6,434 | 6,095,888 | |||||||||||
Obsidian Natural Gas Trust (United Kingdom), Term Loan (Acquired 05/05/11; Cost $1,094,366) | 7.00 | % | 11/02/15 | 1,076 | 1,081,098 | |||||||||||
Pacific Drilling S.A. (Luxembourg), Term Loan | 4.50 | % | 06/04/18 | 3,583 | 3,607,466 | |||||||||||
Ruby Western Pipeline Holdings, LLC, Term Loan | 3.50 | % | 03/27/20 | 1,879 | 1,876,824 | |||||||||||
Samson Investment Company, Second Lien Term Loan | 6.00 | % | 09/25/18 | 5,262 | 5,301,151 | |||||||||||
Saxon Enterprises LLC, Term Loan | 5.50 | % | 02/15/19 | 2,435 | 2,443,702 | |||||||||||
Tallgrass Operations, LLC, Term Loan | 5.25 | % | 11/13/18 | 3,536 | 3,585,552 | |||||||||||
Tervita Corp. (Canada), Term Loan | 6.25 | % | 05/15/18 | 7,042 | 6,992,960 | |||||||||||
WildHorse Resources, LLC, Term Loan | 7.50 | % | 12/13/18 | 4,225 | 4,204,042 | |||||||||||
| 109,282,314 | ||||||||||||||||
| Publishing–2.66% | ||||||||||||||||
Affiliated Media, Inc., Term Loan | 8.50 | % | 03/19/14 | 470 | 469,903 | |||||||||||
Cenveo Corp., Term Loan B | 6.25 | % | 02/13/17 | 8,041 | 8,111,408 | |||||||||||
Endurance Business Media, Inc., Term Loan (Acquired 07/26/06; Cost $81,170) | 6.50 | % | 12/15/14 | 62 | 27,917 | |||||||||||
Getty Images, Inc., | ||||||||||||||||
Revolver Loan(f) | — | 10/18/17 | 1,478 | 1,380,638 | ||||||||||||
Term Loan | 4.75 | % | 10/18/19 | 7,513 | 7,253,323 | |||||||||||
Harland Clarke Holdings Corp., Term Loan B-2 | 5.43 | % | 06/30/17 | 370 | 365,035 | |||||||||||
Interactive Data Corp., Term Loan B | 3.75 | % | 02/11/18 | 898 | 897,709 | |||||||||||
Lamar Media Corp., Term Loan B | 4.00 | % | 12/30/16 | 9 | 9,039 | |||||||||||
Media General, Inc., | ||||||||||||||||
Term Loan B(g) | 0.00 | % | 07/31/20 | 4,759 | 4,776,466 | |||||||||||
Term Loan B(f) | — | 07/31/20 | 2,075 | 2,082,354 | ||||||||||||
MediMedia USA, Inc., First Lien Term Loan | 8.00 | % | 11/20/18 | 3,948 | 3,908,995 | |||||||||||
Merrill Communications LLC, Term Loan | 7.31 | % | 03/08/18 | 4,984 | 5,040,446 | |||||||||||
MTL Publishing LLC, Term Loan B-1 | 4.25 | % | 06/29/18 | 4,635 | 4,663,750 | |||||||||||
Multi Packaging Solutions, Inc., Term Loan | 4.25 | % | 08/21/20 | 2,268 | 2,267,921 | |||||||||||
Newsday, LLC, Term Loan | 3.68 | % | 10/12/16 | 4,819 | 4,825,418 | |||||||||||
ProQuest LLC, Term Loan | 6.00 | % | 04/13/18 | 1,792 | 1,807,071 | |||||||||||
Southern Graphics Inc., Term Loan | 5.00 | % | 10/17/19 | 3,353 | 3,369,427 | |||||||||||
Tribune Company, Term Loan B | 4.00 | % | 12/31/19 | 4,613 | 4,634,472 | |||||||||||
| 55,891,292 | ||||||||||||||||
| Radio & Television–3.90% | ||||||||||||||||
Barrington Broadcasting LLC, Term Loan 2 | 7.50 | % | 06/14/17 | 253 | 252,933 | |||||||||||
Clear Channel Communications, Inc., | ||||||||||||||||
Term Loan B | 3.83 | % | 01/29/16 | 7,031 | 6,579,260 | |||||||||||
Term Loan D | 6.93 | % | 01/30/19 | 35,133 | 32,338,878 | |||||||||||
Entravision Communications Corp., Term Loan B | 3.50 | % | 05/29/20 | 7,501 | 7,451,761 | |||||||||||
FoxCo Acquisition Sub, LLC, Term Loan | 5.50 | % | 07/14/17 | 2,578 | 2,594,494 | |||||||||||
Gray Television, Inc., Term Loan | 4.75 | % | 10/15/19 | 2,224 | 2,245,329 | |||||||||||
See accompanying Notes to Financial Statements which are an integral part of the financial statements.
19 Invesco Floating Rate Fund
| Interest Rate | Maturity Date | Principal Amount (000) | Value | |||||||||||||
| Radio & Television–(continued) | ||||||||||||||||
Lin Television Corp., Term Loan B | 4.00 | % | 12/21/18 | $ | 691 | $ | 695,706 | |||||||||
Local TV Finance, LLC, Term Loan B-2 | 4.19 | % | 05/07/15 | 1,172 | 1,175,069 | |||||||||||
Mission Broadcasting, Inc., Term Loan B | 4.25 | % | 12/03/19 | 138 | 139,194 | |||||||||||
NEP/NCP HoldCo, Inc., | ||||||||||||||||
First Lien Term Loan | 4.75 | % | 01/22/20 | 2,486 | 2,500,225 | |||||||||||
Second Lien Term Loan | 9.50 | % | 07/22/20 | 132 | 135,729 | |||||||||||
Nexstar Broadcasting, Inc., Term Loan B | 4.25 | % | 12/03/19 | 326 | 329,246 | |||||||||||
Nine Entertainment Corp., Term Loan B | 3.50 | % | 02/05/20 | 4,589 | 4,569,752 | |||||||||||
Raycom TV Broadcasting, LLC, Term Loan B | 4.25 | % | 05/31/17 | 2,092 | 2,107,252 | |||||||||||
Sinclair Television Group, Inc., Term Loan B | 3.00 | % | 04/09/20 | 2,041 | 2,042,456 | |||||||||||
TWCC Holding Corp., | ||||||||||||||||
Second Lien Term Loan | 7.00 | % | 06/26/20 | 2,023 | 2,083,554 | |||||||||||
Term Loan | 3.50 | % | 02/13/17 | 1,994 | 2,005,876 | |||||||||||
Univision Communications Inc., | ||||||||||||||||
First Lien Term Loan | 4.50 | % | 03/02/20 | 7,491 | 7,478,140 | |||||||||||
Term Loan | 4.00 | % | 03/02/20 | 2,048 | 2,034,212 | |||||||||||
Term Loan | 4.50 | % | 03/02/20 | 3,194 | 3,192,835 | |||||||||||
| 81,951,901 | ||||||||||||||||
| Retailers (except Food & Drug)–3.16% | ||||||||||||||||
Academy, Ltd., Term Loan | 4.50 | % | 08/03/18 | 2,276 | 2,291,593 | |||||||||||
CDW LLC, Term Loan | 3.50 | % | 04/29/20 | 14,581 | 14,450,075 | |||||||||||
Collective Brands, Inc., Term Loan | 7.25 | % | 10/09/19 | 4,092 | 4,170,824 | |||||||||||
David’s Bridal, Inc., | ||||||||||||||||
Term Loan(g) | 0.00 | % | 10/11/17 | 1,573 | 1,478,320 | |||||||||||
Term Loan | 5.00 | % | 10/11/19 | 1,223 | 1,233,520 | |||||||||||
Guitar Center, Inc., Term Loan | 6.28 | % | 04/10/17 | 5,364 | 5,290,396 | |||||||||||
Michaels Stores, Inc., Term Loan B | 3.75 | % | 01/28/20 | 9,245 | 9,292,268 | |||||||||||
National Vision, Inc., Term Loan | 7.00 | % | 08/02/18 | 2,760 | 2,781,198 | |||||||||||
Neiman Marcus Group, Inc., Term Loan | 4.00 | % | 05/16/18 | 1,871 | 1,873,440 | |||||||||||
OSP Group, Inc., First Lien Term Loan | 5.50 | % | 02/05/20 | 4,147 | 4,167,993 | |||||||||||
Pep Boys—Manny, Moe & Jack, Term Loan | 5.00 | % | 10/11/18 | 1,478 | 1,488,572 | |||||||||||
Savers Inc., Term Loan | 5.00 | % | 07/09/19 | 4,915 | 4,955,036 | |||||||||||
Spin Holdco Inc., First Lien Term Loan | 4.25 | % | 11/14/19 | 5,086 | 5,106,750 | |||||||||||
Toys ‘R’ US-Delaware, Inc., | ||||||||||||||||
Term Loan | 6.00 | % | 09/01/16 | 1,018 | 1,003,750 | |||||||||||
Term Loan | 6.00 | % | 08/21/19 | 4,511 | 4,465,970 | |||||||||||
Term Loan B-2(f) | — | 05/25/18 | 112 | 109,021 | ||||||||||||
Term Loan B-3 | 5.25 | % | 05/25/18 | 404 | 390,945 | |||||||||||
Wilton Brands LLC, Term Loan B | 7.50 | % | 08/30/18 | 1,976 | 1,963,798 | |||||||||||
| 66,513,469 | ||||||||||||||||
| Steel–0.63% | ||||||||||||||||
Ameriforge Group Inc., | ||||||||||||||||
First Lien Term Loan | 5.00 | % | 12/19/19 | 4,347 | 4,363,222 | |||||||||||
Second Lien Term Loan | 8.75 | % | 12/18/20 | 429 | 434,986 | |||||||||||
JFB Firth Rixson Inc., Term Loan | 4.25 | % | 06/30/17 | 670 | 671,266 | |||||||||||
JMC Steel Group Inc., Term Loan | 4.75 | % | 04/03/17 | 1,087 | 1,089,021 | |||||||||||
Tube City IMS Corp., Term Loan | 4.75 | % | 03/20/19 | 3,872 | 3,881,368 | |||||||||||
Waupaca Foundry, Inc., Term Loan | 4.50 | % | 06/29/17 | 2,856 | 2,860,565 | |||||||||||
| 13,300,428 | ||||||||||||||||
See accompanying Notes to Financial Statements which are an integral part of the financial statements.
20 Invesco Floating Rate Fund
| Interest Rate | Maturity Date | Principal Amount (000) | Value | |||||||||||||
| Surface Transport–0.95% | ||||||||||||||||
American Petroleum Tankers Parent LLC, Term Loan | 4.75 | % | 10/02/19 | $ | 2,258 | $ | 2,271,917 | |||||||||
Avis Budget Car Rental, LLC, Term Loan B | 3.00 | % | 03/15/19 | 609 | 609,860 | |||||||||||
Ceva Group PLC, (United Kingdom) | ||||||||||||||||
Term Loan B | 0.18 | % | 08/31/16 | 216 | 205,423 | |||||||||||
Term Loan B | 5.27 | % | 08/31/16 | 1,260 | 1,199,391 | |||||||||||
JHCI Acquisition, Inc., First Lien Term Loan | 7.00 | % | 07/11/19 | 2,868 | 2,851,047 | |||||||||||
Kenan Advantage Group, Inc., Term Loan | 3.75 | % | 06/10/16 | 781 | 787,601 | |||||||||||
Navios Partners Finance (US) Inc., Term Loan | 5.25 | % | 06/27/18 | 4,262 | 4,346,827 | |||||||||||
Swift Transportation Co., LLC, | ||||||||||||||||
Term Loan B-1 | 2.93 | % | 12/21/16 | 804 | 809,582 | |||||||||||
Term Loan B-2 | 4.00 | % | 12/21/17 | 1,075 | 1,083,137 | |||||||||||
U.S. Shipping Corp, Term Loan | 9.00 | % | 04/30/18 | 5,603 | 5,728,723 | |||||||||||
| 19,893,508 | ||||||||||||||||
| Telecommunications–5.95% | ||||||||||||||||
Arris Group, Inc., Term Loan B | 3.50 | % | 04/17/20 | 4,307 | 4,263,699 | |||||||||||
Avaya Inc., | ||||||||||||||||
Term Loan B-3 | 4.76 | % | 10/26/17 | 17,883 | 15,976,690 | |||||||||||
Term Loan B-5 | 8.00 | % | 03/30/18 | 5,484 | 5,201,299 | |||||||||||
Cellular South, Inc., Term Loan B | 3.25 | % | 05/22/20 | 2,593 | 2,594,499 | |||||||||||
Consolidated Communications, Inc., | ||||||||||||||||
Incremental Term Loan 3 | 5.25 | % | 12/31/18 | 7,146 | 7,239,051 | |||||||||||
Term Loan 2 | 4.19 | % | 12/31/17 | 995 | 1,003,969 | |||||||||||
Cricket Communications, Inc., | ||||||||||||||||
Term Loan | 4.75 | % | 10/10/19 | 2,581 | 2,591,807 | |||||||||||
Term Loan C | 4.75 | % | 03/09/20 | 5,184 | 5,213,193 | |||||||||||
Crown Castle Operating Co., Term Loan B | 3.25 | % | 01/31/19 | 11,959 | 11,875,168 | |||||||||||
Fairpoint Communications, Inc., Term Loan | 7.50 | % | 02/14/19 | 8,142 | 8,147,326 | |||||||||||
Global Tel*Link Corp., First Lien Term Loan | 5.00 | % | 05/22/20 | 3,725 | 3,664,403 | |||||||||||
Hargray Communications Group, Inc., Term Loan | 4.75 | % | 06/25/19 | 2,435 | 2,430,631 | |||||||||||
Intelsat Jackson Holdings S.A., Term Loan B-1 | 4.25 | % | 04/02/18 | 10,802 | 10,902,393 | |||||||||||
Level 3 Communications, Inc., | ||||||||||||||||
Term Loan B | 4.00 | % | 01/15/20 | 10,974 | 10,994,455 | |||||||||||
Term Loan B-II | 4.75 | % | 08/01/19 | 8,263 | 8,276,064 | |||||||||||
Term Loan B-III | 4.00 | % | 08/01/19 | 428 | 428,878 | |||||||||||
LTS Buyer LLC, | ||||||||||||||||
First Lien Term Loan B | 4.50 | % | 04/13/20 | 3,087 | 3,111,141 | |||||||||||
Second Lien Term Loan | 8.00 | % | 04/12/21 | 130 | 130,783 | |||||||||||
NTELOS Inc., Term Loan B | 5.75 | % | 11/08/19 | 4,370 | 4,364,200 | |||||||||||
Syniverse Holdings, Inc., | ||||||||||||||||
Term Loan | 4.00 | % | 04/23/19 | 6,111 | 6,151,294 | |||||||||||
Term Loan | 5.00 | % | 04/23/19 | 3,443 | 3,462,562 | |||||||||||
Telesat LLC, Term Loan B-2 | 3.50 | % | 03/28/19 | 1,279 | 1,283,141 | |||||||||||
Time Warner Telecom Holdings Inc., Term Loan B | 2.69 | % | 04/17/20 | 1,545 | 1,549,113 | |||||||||||
U.S. TelePacific Corp., Term Loan | 5.75 | % | 02/23/17 | 2,273 | 2,274,347 | |||||||||||
Windstream Corp., Term Loan B-4 | 3.50 | % | 01/23/20 | 2,080 | 2,084,798 | |||||||||||
| 125,214,904 | ||||||||||||||||
| Utilities–2.56% | ||||||||||||||||
AES Corp., The, Term Loan | 3.75 | % | 06/01/18 | 1,004 | 1,012,086 | |||||||||||
Calpine Construction Finance Company, L.P., | ||||||||||||||||
Term Loan B-1 | 3.00 | % | 05/04/20 | 7,145 | 7,081,286 | |||||||||||
Term Loan B-2 | 3.25 | % | 01/31/22 | 2,323 | 2,309,516 | |||||||||||
See accompanying Notes to Financial Statements which are an integral part of the financial statements.
21 Invesco Floating Rate Fund
| Interest Rate | Maturity Date | Principal Amount (000) | Value | |||||||||||||
| Utilities–(continued) | ||||||||||||||||
Calpine Corp., | ||||||||||||||||
Term Loan(f) | — | 04/02/18 | $ | 790 | $ | 793,223 | ||||||||||
Term Loan | 4.00 | % | 10/09/19 | 7,834 | 7,870,069 | |||||||||||
Dynegy Inc., Term Loan B-2 | 4.00 | % | 04/23/20 | 4,228 | 4,222,906 | |||||||||||
EquiPower Resources Holdings, LLC, | ||||||||||||||||
First Lien Term Loan B | 4.25 | % | 12/21/18 | 6,088 | 6,088,428 | |||||||||||
First Lien Term Loan C | 4.25 | % | 12/31/19 | 2,648 | 2,641,306 | |||||||||||
LSP Madison Funding, LLC, Term Loan | 5.50 | % | 06/28/19 | 965 | 973,990 | |||||||||||
NRG Energy Inc., Term Loan | 2.75 | % | 07/02/18 | 5,828 | 5,799,883 | |||||||||||
NSG Holdings LLC, Term Loan | 4.75 | % | 12/11/19 | 608 | 613,850 | |||||||||||
Sapphire Power Finance LLC, Term Loan B (Acquired 07/02/13; Cost $3,128,586) | 6.00 | % | 07/10/18 | 3,160 | 3,163,670 | |||||||||||
Texas Competitive Electric Holdings, | ||||||||||||||||
Term Loan | 3.71 | % | 10/10/14 | 8,006 | 5,468,641 | |||||||||||
Term Loan | 4.71 | % | 10/10/17 | 5,010 | 3,398,751 | |||||||||||
USIC Holding, Inc., First Lien Term Loan | 4.75 | % | 07/10/20 | 2,381 | 2,390,616 | |||||||||||
| 53,828,221 | ||||||||||||||||
Total Variable Rate Senior Loan Interests | 1,909,689,232 | |||||||||||||||
Bonds and Notes–3.49% |
| |||||||||||||||
| Air Transport–0.23% | ||||||||||||||||
Air Lease Corp. | 5.63 | % | 04/01/17 | 3,956 | 4,248,744 | |||||||||||
United Airlines, Inc.(h) | 6.75 | % | 09/15/15 | 460 | 478,400 | |||||||||||
| 4,727,144 | ||||||||||||||||
| Automotive–0.20% | ||||||||||||||||
Gestamp Funding Luxembourg S.A. (Luxembourg)(h) | 5.63 | % | 05/31/20 | 1,747 | 1,694,590 | |||||||||||
Goodyear Tire & Rubber Co. | 6.50 | % | 03/01/21 | 1,418 | 1,435,725 | |||||||||||
Schaeffler AG (Germany)(h) | 4.75 | % | 05/15/21 | 1,042 | 988,333 | |||||||||||
| 4,118,648 | ||||||||||||||||
| Business Equipment & Services–0.16% | ||||||||||||||||
First Data Corp.(h) | 6.75 | % | 11/01/20 | 3,207 | 3,279,158 | |||||||||||
| Cable & Satellite Television–0.07% | ||||||||||||||||
Lynx II Corp. (United Kingdom)(h) | 5.38 | % | 04/15/21 | 200 | 196,500 | |||||||||||
UPC Broadband Holdings, B.V. (Netherlands)(h) | 7.25 | % | 11/15/21 | 1,074 | 1,159,920 | |||||||||||
UPC Broadband Holdings, B.V. (Netherlands)(h) | 6.88 | % | 01/15/22 | 173 | 182,193 | |||||||||||
| 1,538,613 | ||||||||||||||||
| Chemicals & Plastics–0.29% | ||||||||||||||||
Hexion Specialty Chemicals, Inc.(h) | 6.63 | % | 04/15/20 | 5,355 | 5,314,838 | |||||||||||
Ineos Holdings Ltd.(h) | 6.13 | % | 08/15/18 | 200 | 194,000 | |||||||||||
Ineos Holdings Ltd.(h) | 8.38 | % | 02/15/19 | 241 | 265,100 | |||||||||||
Ineos Holdings Ltd.(h) | 7.50 | % | 05/01/20 | 157 | 167,990 | |||||||||||
Taminco Global Chemical Corp.(h) | 9.75 | % | 03/31/20 | 226 | 255,380 | |||||||||||
| 6,197,308 | ||||||||||||||||
| Containers & Glass Products–0.63% | ||||||||||||||||
Ardagh Glass Finance (Ireland)(h) | 7.00 | % | 11/15/20 | 858 | 836,550 | |||||||||||
Reynolds Group Holdings Inc. | 7.88 | % | 08/15/19 | 1,854 | 2,048,670 | |||||||||||
Reynolds Group Holdings Inc. | 9.88 | % | 08/15/19 | 1,879 | 2,005,832 | |||||||||||
Reynolds Group Holdings Inc. | 5.75 | % | 10/15/20 | 8,318 | 8,276,410 | |||||||||||
| 13,167,462 | ||||||||||||||||
See accompanying Notes to Financial Statements which are an integral part of the financial statements.
22 Invesco Floating Rate Fund
| Interest Rate | Maturity Date | Principal Amount (000) | Value | |||||||||||||
| Food Products–0.02% | ||||||||||||||||
Chiquita Brands LLC(h) | 7.88 | % | 02/01/21 | $ | 422 | $ | 444,155 | |||||||||
| Forest Products–0.08% | ||||||||||||||||
Verso Paper Holdings LLC | 11.75 | % | 01/15/19 | 1,626 | 1,670,715 | |||||||||||
| Healthcare–0.40% | ||||||||||||||||
Accellent Inc. | 8.38 | % | 02/01/17 | 2,878 | 2,985,925 | |||||||||||
Biomet, Inc. | 6.50 | % | 08/01/20 | 469 | 483,070 | |||||||||||
Community Health Systems, Inc. | 5.13 | % | 08/15/18 | 940 | 965,850 | |||||||||||
DJO Finance LLC | 8.75 | % | 03/15/18 | 1,386 | 1,507,275 | |||||||||||
Kindred Healthcare, Inc. | 8.25 | % | 06/01/19 | 542 | 571,810 | |||||||||||
Kinetic Concepts, Inc. | 10.50 | % | 11/01/18 | 1,764 | 1,947,015 | |||||||||||
| 8,460,945 | ||||||||||||||||
| Lodging & Casinos–0.05% | ||||||||||||||||
Harrah’s Operating Company, Inc. | 8.50 | % | 02/15/20 | 360 | 340,200 | |||||||||||
Harrah’s Operating Company, Inc. | 9.00 | % | 02/15/20 | 791 | 763,315 | |||||||||||
| 1,103,515 | ||||||||||||||||
| Nonferrous Metals & Minerals–0.05% | ||||||||||||||||
TiZir Ltd. (United Kingdom) | 9.00 | % | 09/28/17 | 1,000 | 1,028,750 | |||||||||||
| Oil & Gas–0.25% | ||||||||||||||||
NGPL PipeCo LLC(h) | 9.63 | % | 06/01/19 | 472 | 486,927 | |||||||||||
Pacific Drilling S.A. (Luxembourg)(h) | 5.38 | % | 06/01/20 | 2,798 | 2,702,698 | |||||||||||
Tervita Corp. (Canada)(h) | 8.00 | % | 11/15/18 | 1,949 | 1,953,872 | |||||||||||
Western Refining, Inc. | 6.25 | % | 04/01/21 | 190 | 188,100 | |||||||||||
| 5,331,597 | ||||||||||||||||
| Publishing–0.05% | ||||||||||||||||
Merrill Communications, LLC | 10.00 | % | 03/08/23 | 1,010 | 964,927 | |||||||||||
| Radio & Television–0.28% | ||||||||||||||||
Univision Communications Inc.(h) | 6.88 | % | 05/15/19 | 1,000 | 1,057,500 | |||||||||||
Univision Communications Inc.(h) | 6.75 | % | 09/15/22 | 4,645 | 4,854,025 | |||||||||||
| 5,911,525 | ||||||||||||||||
| Retailers (except Food & Drug)–0.06% | ||||||||||||||||
Claire’s Stores Inc.(h) | 9.00 | % | 03/15/19 | 1,202 | 1,334,220 | |||||||||||
| Telecommunications–0.40% | ||||||||||||||||
Goodman Networks Inc.(h) | 12.13 | % | 07/01/18 | 2,154 | 2,304,780 | |||||||||||
Goodman Networks Inc.(h) | 13.13 | % | 07/01/18 | 2,600 | 2,769,000 | |||||||||||
Wind Telecomunicazioni S.p.A. (Italy)(h) | 6.50 | % | 04/30/20 | 256 | 257,280 | |||||||||||
Wind Telecomunicazioni S.p.A. (Italy)(h) | 7.25 | % | 02/15/18 | 1,612 | 1,660,360 | |||||||||||
Windstream Corp. | 7.50 | % | 06/01/22 | 1,484 | 1,476,580 | |||||||||||
Windstream Corp. | 6.38 | % | 08/01/23 | 17 | 15,470 | |||||||||||
| 8,483,470 | ||||||||||||||||
| Utilities–0.27% | ||||||||||||||||
Calpine Corp.(h) | 7.88 | % | 01/15/23 | — | 277 | |||||||||||
Calpine Corp.(h) | 7.50 | % | 02/15/21 | 3,185 | 3,383,738 | |||||||||||
NRG Energy Inc. | 7.63 | % | 05/15/19 | 1,366 | 1,458,205 | |||||||||||
NRG Energy Inc. | 6.63 | % | 03/15/23 | 880 | 877,800 | |||||||||||
| 5,720,020 | ||||||||||||||||
Total Bonds and Notes | 73,482,172 | |||||||||||||||
See accompanying Notes to Financial Statements which are an integral part of the financial statements.
23 Invesco Floating Rate Fund
| Interest Rate | Maturity Date | Principal Amount (000) | Value | |||||||||||||
Structured Products–2.29% |
| |||||||||||||||
Apidos Cinco CDO (Cayman Islands)(h)(i) | 4.51 | % | 05/14/20 | $ | 345 | $ | 320,357 | |||||||||
Apidos CLO II (Cayman Islands)(h)(i) | 5.01 | % | 12/21/18 | 919 | 881,565 | |||||||||||
Apidos CLO IX (Cayman Islands)(h)(i) | 6.77 | % | 07/15/23 | 3,083 | 3,066,443 | |||||||||||
Apidos CLO X (Cayman Islands)(h)(i) | 6.52 | % | 10/30/22 | 1,367 | 1,336,338 | |||||||||||
Apidos CLO X (Cayman Islands)(i) | 6.52 | % | 10/30/22 | 1,750 | 1,710,748 | |||||||||||
Apidos CLO XI(h)(i) | 5.52 | % | 01/17/23 | 2,070 | 1,938,246 | |||||||||||
Apidos Quattro CDO (Cayman Islands)(h)(i) | 3.87 | % | 01/20/19 | 408 | 372,528 | |||||||||||
Ares XI CLO, Ltd.(h)(i) | 3.27 | % | 10/11/21 | 724 | 687,803 | |||||||||||
Atrium IV CDO Corp(h) | 9.18 | % | 06/08/19 | 205 | 208,040 | |||||||||||
Atrium X CDO(h)(i) | 4.78 | % | 07/16/25 | 3,742 | 3,333,354 | |||||||||||
Babson CLO Ltd.(i) | 3.52 | % | 01/18/21 | 1,034 | 924,010 | |||||||||||
Carlyle Global Market Strategies (Cayman Islands)(i) | 6.14 | % | 10/14/24 | 2,258 | 2,168,357 | |||||||||||
Columbus Nova CLO Ltd.(h)(i) | 3.86 | % | 05/16/19 | 429 | 382,899 | |||||||||||
Columbus Nova CLO Ltd.(h)(i) | 3.86 | % | 05/16/19 | 1,093 | 975,544 | |||||||||||
Flagship CLO VI(h)(i) | 5.02 | % | 06/10/21 | 3,254 | 3,057,438 | |||||||||||
Flagship CLO VI(h)(i) | 5.02 | % | 06/10/21 | 987 | 927,152 | |||||||||||
Four Corners CLO II, Ltd.(h)(i) | 2.11 | % | 01/26/20 | 310 | 288,576 | |||||||||||
Four Corners CLO II, Ltd.(h)(i) | 2.11 | % | 01/26/20 | 103 | 95,882 | |||||||||||
Gramercy Park CLO(h)(i) | 5.78 | % | 07/17/23 | 1,336 | 1,275,157 | |||||||||||
Halcyon Loan Investors CLO II, Ltd. (Cayman Islands)(h)(i) | 3.86 | % | 04/24/21 | 917 | 818,220 | |||||||||||
ING IM CLO 2012-3, Ltd.(h)(i) | 6.13 | % | 10/15/22 | 1,243 | 1,221,751 | |||||||||||
ING IM CLO 2012-4, Ltd.(h)(i) | 6.03 | % | 10/15/23 | 1,861 | 1,818,492 | |||||||||||
ING IM CLO 2013-1(h)(i) | 6.04 | % | 04/15/24 | 4,808 | 4,491,208 | |||||||||||
ING Investment Management CLO III, Ltd.(h)(i) | 3.77 | % | 12/13/20 | 1,188 | 1,068,711 | |||||||||||
ING Investment Management CLO IV, Ltd. (Cayman Islands)(h)(i) | 4.51 | % | 06/14/22 | 293 | 269,020 | |||||||||||
KKR Financial CLO 2012-1(h)(i) | 5.77 | % | 12/15/24 | 2,100 | 1,979,474 | |||||||||||
KKR Financial CLO 2013-1(i) | 4.75 | % | 07/15/25 | 2,461 | 2,217,107 | |||||||||||
Madison Park Funding IV Ltd.(h)(i) | 3.87 | % | 03/22/21 | 1,344 | 1,243,399 | |||||||||||
Octagon Investment Partners XVII Ltd. (Cayman Islands) | 4.87 | % | 10/25/25 | 980 | 880,152 | |||||||||||
Pacifica CDO VI, Ltd.(h)(i) | 4.01 | % | 08/15/21 | 565 | 502,309 | |||||||||||
Sierra CLO II Ltd.(i) | 3.77 | % | 01/22/21 | 733 | 629,287 | |||||||||||
Silverado CLO 2006-II Ltd.(h)(i) | 4.02 | % | 10/16/20 | 886 | 794,610 | |||||||||||
Slater Mill Loan Fund, LP(h)(i) | 5.76 | % | 08/17/22 | 1,108 | 1,058,009 | |||||||||||
Symphony CLO IX, Ltd.(h)(i) | 5.27 | % | 04/16/22 | 1,901 | 1,766,424 | |||||||||||
Symphony CLO VIII, Ltd.(h)(i) | 6.02 | % | 01/09/23 | 1,035 | 1,002,262 | |||||||||||
Symphony CLO XI(h)(i) | 5.52 | % | 01/17/25 | 2,640 | 2,471,977 | |||||||||||
Total Structured Products | 48,182,849 | |||||||||||||||
| Shares | ||||||||||||||||
Common Stocks & Other Equity Interests–0.36% |
| |||||||||||||||
| Aerospace & Defense–0.00% | ||||||||||||||||
ACTS Aero Technical Support & Services, Inc.(h)(j) | 122,977 | 1,230 | ||||||||||||||
| Automotive–0.01% | ||||||||||||||||
Dayco Products, LLC(h)(j) | 856 | 33,598 | ||||||||||||||
Dayco Products, LLC(h)(j) | 3,261 | 127,994 | ||||||||||||||
| 161,592 | ||||||||||||||||
| Building & Development–0.12% | ||||||||||||||||
Lake at Las Vegas Joint Venture, LLC, Class A (Acquired 04/28/10-07/15/10; Cost $664,569)(h)(j) | 518 | 0 | ||||||||||||||
Lake at Las Vegas Joint Venture, LLC, Class B (Acquired 06/30/10; Cost $3,408,940)(h)(j) | 4 | 0 | ||||||||||||||
See accompanying Notes to Financial Statements which are an integral part of the financial statements.
24 Invesco Floating Rate Fund
| Shares | Value | |||||||||||
| Building & Development–(continued) | ||||||||||||
Lake at Las Vegas Joint Venture, LLC, Class C, Wts. expiring 07/15/15, (Acquired 06/30/10; Cost $0)(h)(j) | 17 | $ | 0 | |||||||||
Lake at Las Vegas Joint Venture, LLC, Class D, Wts. expiring 07/15/15, (Acquired 06/30/10; Cost $0)(h)(j) | 24 | 0 | ||||||||||
Lake at Las Vegas Joint Venture, LLC, Class E, Wts. expiring 07/15/15, (Acquired 06/30/10; Cost $0)(h)(j) | 27 | 0 | ||||||||||
Lake at Las Vegas Joint Venture, LLC, Class F, Wts. expiring 07/15/15, (Acquired 06/30/10; Cost $0)(h)(j) | 30 | 0 | ||||||||||
Lake at Las Vegas Joint Venture, LLC, Class G, Wts. expiring 07/15/15, (Acquired 06/30/10; Cost $0)(h)(j) | 34 | 0 | ||||||||||
Stile Acquisition Corp. (Canada)(h)(j) | 53,093 | 2,601,557 | ||||||||||
United Subcontractors, Inc.(h)(j) | 4,840 | 4,840 | ||||||||||
| 2,606,397 | ||||||||||||
| Cable & Satellite Television–0.14% | ||||||||||||
Ion Media Networks, Inc.(h)(j) | 4,471 | 2,816,730 | ||||||||||
| Chemicals & Plastics–0.01% | ||||||||||||
Metokote Corp., Wts. expiring 11/22/23 (Acquired 12/05/11; Cost $0)(h)(j) | 61 | 106,598 | ||||||||||
| Financial Intermediaries–0.00% | ||||||||||||
Bankruptcy Management Solutions, Inc. (Acquired 06/27/13; Cost $15,075)(h)(k) | 335 | 15,079 | ||||||||||
Bankruptcy Management Solutions, Inc., Class A, Wts. expiring 06/27/18, (Acquired 06/27/13; Cost $0)(h)(k) | 19 | 0 | ||||||||||
Bankruptcy Management Solutions, Inc., Class B, Wts. expiring 06/27/18, (Acquired 06/27/13; Cost $0)(h)(k) | 21 | 0 | ||||||||||
Bankruptcy Management Solutions, Inc., Class C, Wts. expiring 06/27/18, (Acquired 06/27/13; Cost $0)(h)(k) | 31 | 0 | ||||||||||
| 15,079 | ||||||||||||
| Forest Products–0.00% | ||||||||||||
Xerium Technologies, Inc.(j) | 1,766 | 19,073 | ||||||||||
| Leisure Goods, Activities & Movies–0.00% | ||||||||||||
AMF Bowling Centers, Inc.(j) | 1,665 | 8,130 | ||||||||||
| Lodging & Casinos–0.02% | ||||||||||||
Twin River Worldwide Holdings, Inc., Class A(h)(j) | 18,663 | 443,246 | ||||||||||
| Publishing–0.04% | ||||||||||||
Endurance Business Media, Inc., Class A(h)(j) | 124 | 0 | ||||||||||
F&W Publications, Inc.(h)(k) | 288 | 36 | ||||||||||
F&W Publications, Inc., Wts. expiring 12/09/17(h)(k) | 559 | 70 | ||||||||||
Merrill Communications LLC, Class A(j) | 133,776 | 300,996 | ||||||||||
Tribune Co., Class A(k) | 9,050 | 539,380 | ||||||||||
| 840,482 | ||||||||||||
| Surface Transport–0.00% | ||||||||||||
U.S. Shipping Corp. (Acquired 09/28/07-09/30/09; Cost $87,805)(h)(j) | 87,805 | 43,929 | ||||||||||
U.S. Shipping Corp. (Acquired 09/07/28,09/30/09; Cost $0)(h)(j) | 6,189 | 0 | ||||||||||
| 43,929 | ||||||||||||
| Telecommunications–0.02% | ||||||||||||
FairPoint Communications, Inc.(j) | 44,928 | 419,628 | ||||||||||
| Utilities–0.00% | ||||||||||||
Bicent Power, LLC-Series A, Wts. expiring 08/21/22, (Acquired 08/21/12; Cost $0)(h)(j) | 101 | 0 | ||||||||||
Bicent Power, LLC-Series B, Wts. expiring 08/21/22, (Acquired 08/21/12; Cost $0)(h)(j) | 164 | 0 | ||||||||||
| 0 | ||||||||||||
Total Common Stocks & Other Equity Interests | 7,482,114 | |||||||||||
See accompanying Notes to Financial Statements which are an integral part of the financial statements.
25 Invesco Floating Rate Fund
| Shares | Value | |||||||||||
| Preferred Stock–0.00% | ||||||||||||
| Building & Development–0.00% | ||||||||||||
United Subcontractors, Inc.(k) | 5 | $ | 42,596 | |||||||||
Money Market Funds–10.54% |
| |||||||||||
Liquid Assets Portfolio–Institutional Class(l) | 110,798,271 | 110,798,271 | ||||||||||
Premier Portfolio–Institutional Class(l) | 110,798,271 | 110,798,271 | ||||||||||
Total Money Market Funds | 221,596,542 | |||||||||||
TOTAL INVESTMENTS–107.48% (Cost $2,263,846,252) |
| 2,260,475,505 | ||||||||||
OTHER ASSETS LESS LIABILITIES–(7.48)% |
| (157,261,079 | ) | |||||||||
NET ASSETS–100.00% |
| $ | 2,103,214,426 | |||||||||
Investment Abbreviations:
| CDO | – Collateralized Debt Obligation | |
| CLO | – Collateralized Loan Obligation | |
| LOC | – Letter of Credit | |
| PIK | – Payment in Kind | |
| Wts. | – Warrants |
Notes to Schedule of Investments:
| (a) | Variable rate senior loan interests are, at present, not readily marketable, not registered under the Securities Act of 1933, as amended (the “1933 Act”) and may be subject to contractual and legal restrictions on sale. Senior secured corporate loans and senior secured debt securities in the Fund’s portfolio generally have variable rates which adjust to a base, such as the London Inter-Bank Offered Rate (“LIBOR”), on set dates, typically every 30 days but not greater than one year; and/or have interest rates that float at a margin above a widely recognized base lending rate such as the Prime Rate of a designated U.S. bank. |
| (b) | Variable rate senior loan interests often require prepayments from excess cash flow or permit the borrower to repay at its election. The degree to which borrowers repay, whether as a contractual requirement or at their election, cannot be predicted with accuracy. As a result, the actual remaining maturity may be substantially less than the stated maturities shown. However, it is anticipated that the senior secured floating rate interests will have an expected average life of three to five years. |
| (c) | Defaulted security. Currently, the issuer is in default with respect to principal and interest payments. The aggregate value of these securities at August 31, 2013 was $305,316, which represented less than 1% of the Fund’s Net Assets. |
| (d) | The borrower has filed for protection in federal bankruptcy court. |
| (e) | All or a portion of this security is Payment-in-Kind. |
| (f) | This floating rate interest will settle after August 31, 2013, at which time the interest rate will be determined. |
| (g) | All or a portion of this holding is subject to unfunded loan commitments. Interest rate will be determined at the time of funding. See Note 1M and Note 7. |
| (h) | Security purchased or received in a transaction exempt from registration under the Securities Act of 1933, as amended (the “1933 Act”). The security may be resold pursuant to an exemption from registration under the 1933 Act, typically to qualified institutional buyers. The aggregate value of these securities at August 31, 2013 was $84,069,879, which represented 4.00% of the Fund’s Net Assets. |
| (i) | Interest or dividend rate is redetermined periodically. Rate shown is the rate in effect on August 31, 2013. |
| (j) | Non-income producing securities acquired through the restructuring of senior loans. |
| (k) | Non-income producing security acquired as part of a bankruptcy restructuring. |
| (l) | The money market fund and the Fund are affiliated by having the same investment adviser. |
See accompanying Notes to Financial Statements which are an integral part of the financial statements.
26 Invesco Floating Rate Fund
Statement of Assets and Liabilities
August 31, 2013
Assets: | ||||
Investments, at value (Cost $2,042,249,710) | $ | 2,038,878,963 | ||
Investments in affiliated money market funds, at value and cost | 221,596,542 | |||
Total investments, at value (Cost $2,263,846,252) | 2,260,475,505 | |||
Cash | 9,210,721 | |||
Receivable for: | ||||
Investments sold | 43,335,575 | |||
Interest and fees | 9,627,685 | |||
Fund shares sold | 26,083,567 | |||
Investments matured | 6,650 | |||
Investment for trustee deferred compensation and retirement plans | 42,348 | |||
Other assets | 208,677 | |||
Total assets | 2,348,990,728 | |||
Liabilities: |
| |||
Payable for: | ||||
Investments purchased | 239,447,186 | |||
Income distributions | 978,372 | |||
Fund shares repurchased | 4,008,796 | |||
Accrued fees to affiliates | 862,206 | |||
Accrued trustees’ and officers’ fees and benefits | 6,173 | |||
Accrued other operating expenses | 343,426 | |||
Trustee deferred compensation and retirement plans | 130,143 | |||
Total liabilities | 245,776,302 | |||
Net assets applicable to shares outstanding | $ | 2,103,214,426 | ||
Net assets consist of: |
| |||
Shares of beneficial interest | $ | 2,114,503,301 | ||
Undistributed net investment income | (321,456 | ) | ||
Undistributed net realized gain (loss) | (7,439,455 | ) | ||
Net unrealized appreciation (depreciation) | (3,527,964 | ) | ||
| $ | 2,103,214,426 | |||
Net Assets: | ||||
Class A | $ | 957,441,659 | ||
Class C | $ | 518,948,268 | ||
Class R | $ | 3,558,817 | ||
Class Y | $ | 550,973,711 | ||
Class R5 | $ | 9,259,915 | ||
Class R6 | $ | 63,032,056 | ||
Shares outstanding, $0.01 par value per share, |
| |||
Class A | 120,672,220 | |||
Class C | 65,700,530 | |||
Class R | 447,619 | |||
Class Y | 69,560,475 | |||
Class R5 | 1,166,454 | |||
Class R6 | 7,942,788 | |||
Class A: | ||||
Net asset value per share | $ | 7.93 | ||
Maximum offering price per share | ||||
(Net asset value of $7.93¸ 97.50%) | $ | 8.13 | ||
Class C | ||||
Net asset value and offering price per share | $ | 7.90 | ||
Class R | ||||
Net asset value and offering price per share | $ | 7.95 | ||
Class Y | ||||
Net asset value and offering price per share | $ | 7.92 | ||
Class R5 | ||||
Net asset value and offering price per share | $ | 7.94 | ||
Class R6 | ||||
Net asset value and offering price per share | $ | 7.94 | ||
See accompanying Notes to Financial Statements which are an integral part of the financial statements.
27 Invesco Floating Rate Fund
Statement of Operations
For the year ended August 31, 2013
Investment income: |
| |||
Interest | $ | 65,242,814 | ||
Dividends | 1,145,376 | |||
Dividends from affiliated money market funds | 112,485 | |||
Other income | 5,473,556 | |||
Total investment income | 71,974,231 | |||
Expenses: | ||||
Advisory fees | 8,189,146 | |||
Administrative services fees | 329,019 | |||
Custodian fees | 602,154 | |||
Distribution fees: | ||||
Class A | 1,565,144 | |||
Class C | 2,542,936 | |||
Class R | 12,120 | |||
Interest, facilities and maintenance fees | 240,310 | |||
Transfer agent fees — A, C, R & Y | 1,082,486 | |||
Transfer agent fees — R5 | 10,442 | |||
Transfer agent fees — R6 | 1,395 | |||
Trustees’ and officers’ fees and benefits | 58,097 | |||
Other | 525,585 | |||
Total expenses | 15,158,834 | |||
Less: Fees waived and expense offset arrangement(s) | (167,318 | ) | ||
Net expenses | 14,991,516 | |||
Net investment income | 56,982,715 | |||
Realized and unrealized gain: | ||||
Net realized gain from investment securities | 14,606,234 | |||
Change in net unrealized appreciation of investment securities | 3,528,753 | |||
Net realized and unrealized gain | 18,134,987 | |||
Net increase in net assets resulting from operations | $ | 75,117,702 | ||
See accompanying Notes to Financial Statements which are an integral part of the financial statements.
28 Invesco Floating Rate Fund
Statement of Changes in Net Assets
For the years ended August 31, 2013 and 2012
| 2013 | 2012 | |||||||
Operations: |
| |||||||
Net investment income | $ | 56,982,715 | $ | 40,368,760 | ||||
Net realized gain | 14,606,234 | 6,889,134 | ||||||
Change in net unrealized appreciation | 3,528,753 | 39,591,498 | ||||||
Net increase in net assets resulting from operations | 75,117,702 | 86,849,392 | ||||||
Distributions to shareholders from net investment income: | ||||||||
Class A | (27,865,428 | ) | (19,919,096 | ) | ||||
Class C | (13,389,847 | ) | (11,021,656 | ) | ||||
Class R | (102,164 | ) | (71,261 | ) | ||||
Class Y | (13,386,252 | ) | (6,619,187 | ) | ||||
Class R5 | (770,560 | ) | (2,766,115 | ) | ||||
Class R6 | (2,424,391 | ) | — | |||||
Total distributions to shareholders from net investment income | (57,938,642 | ) | (40,397,315 | ) | ||||
Share transactions–net: | ||||||||
Class A | 500,918,627 | (25,517,343 | ) | |||||
Class C | 255,350,771 | (23,017,848 | ) | |||||
Class R | 1,748,631 | 204,697 | ||||||
Class Y | 382,712,276 | 33,082,924 | ||||||
Class R5 | (49,516,697 | ) | 6,259,440 | |||||
Class R6 | 62,452,814 | — | ||||||
Net increase (decrease) in net assets resulting from share transactions | 1,153,666,422 | (8,988,130 | ) | |||||
Net increase in net assets | 1,170,845,482 | 37,463,947 | ||||||
Net assets: | ||||||||
Beginning of year | 932,368,944 | 894,904,997 | ||||||
End of year (includes undistributed net investment income of $(321,456) and $352,951, respectively) | $ | 2,103,214,426 | $ | 932,368,944 | ||||
See accompanying Notes to Financial Statements which are an integral part of the financial statements.
29 Invesco Floating Rate Fund
Statement of Cash Flows
For the year ended August 31, 2013
Cash provided by (used in) operating activities: | ||||
Net increase in net assets resulting from operations | $ | 75,117,702 | ||
Adjustments to reconcile net increase in net assets to net cash provided by (used in) operating activities: |
| |||
Purchases of investments | (2,153,716,155 | ) | ||
Proceeds from sales of investments | 1,212,736,287 | |||
Amortization of loan fees | 938,739 | |||
Increase in receivables and other assets | (4,243,081 | ) | ||
Accretion of discounts on investment securities | (5,596,860 | ) | ||
Increase in accrued expenses and other payables | 667,703 | |||
Net realized gain from investment securities | (14,606,234 | ) | ||
Net change in unrealized appreciation on investment securities | (3,528,753 | ) | ||
Net cash provided by (used in) operating activities | (892,230,652 | ) | ||
Cash provided by financing activities: | ||||
Dividends paid to shareholders | (14,564,292 | ) | ||
Decrease in payable for amount due custodian | (777,324 | ) | ||
Proceeds from shares of beneficial interest sold | 1,576,141,987 | |||
Disbursements from shares of beneficial interest reacquired | (484,662,092 | ) | ||
Net cash provided by financing activities | 1,076,138,279 | |||
Net increase in cash and cash equivalents | 183,907,627 | |||
Cash and cash equivalents at beginning of period | 46,899,636 | |||
Cash and cash equivalents at end of period | $ | 230,807,263 | ||
Non-cash financing activities: | ||||
Value of shares of beneficial interest issued in reinvestment of dividends paid to shareholders | $ | 43,000,737 | ||
Supplemental disclosure of cash flow information: | ||||
Cash paid during the period for interest, facilities and maintenance fees | $ | 341,621 | ||
Notes to Financial Statements
August 31, 2013
NOTE 1—Significant Accounting Policies
Invesco Floating Rate Fund (the “Fund”) is a series portfolio of AIM Counselor Series Trust (Invesco Counselor Series Trust) (the “Trust”). The Trust is a Delaware statutory trust registered under the Investment Company Act of 1940, as amended (the “1940 Act”), as an open-end series management investment company consisting of twelve separate portfolios, each authorized to issue an unlimited number of shares of beneficial interest. The assets, liabilities and operations of each portfolio are accounted for separately. Information presented in these financial statements pertains only to the Fund. Matters affecting each portfolio or class will be voted on exclusively by the shareholders of such portfolio or class.
The Fund’s investment objective is total return, comprised of current income and capital appreciation.
The Fund currently consists of six different classes of shares: Class A, Class C, Class R, Class Y, Class R5 and Class R6. On September 24, 2012, Institutional Class shares were renamed Class R5 shares and the Fund began offering Class R6 shares. Class A shares are sold with a front-end sales charge unless certain waiver criteria are met and under certain circumstances load waived shares may be subject to contingent deferred sales charges (“CDSC”). Class C shares are sold with a CDSC. Class R, Class Y, Class R5 and Class R6 shares are sold at net asset value.
The following is a summary of the significant accounting policies followed by the Fund in the preparation of its financial statements.
| A. | Security Valuations — Variable rate senior loan interests are fair valued using an evaluated quote provided by an independent pricing service. Evaluated quotes provided by the pricing service may reflect appropriate factors such as ratings, tranche type, industry, company performance, spread, individual trading characteristics, institution-size trading in similar groups of securities and other market data. |
Securities, including restricted securities, are valued according to the following policy. A security listed or traded on an exchange (except convertible bonds) is valued at its last sales price as of the close of the customary trading session on the exchange where the security is principally traded, or lacking any sales on a particular day, the security may be valued at the closing bid price on that day. Securities traded in the over-the-counter market (but not securities reported on the NASDAQ Stock Exchange) are valued based on the prices furnished by independent pricing services, in which case the securities may be considered fair valued, or by market makers. Each security reported on the NASDAQ Stock Exchange is valued at the NASDAQ Official Closing Price (“NOCP”) as of the close of the customary trading session on the valuation date or absent a NOCP, at the closing bid price.
30 Invesco Floating Rate Fund
Futures contracts are valued at the final settlement price set by an exchange on which they are principally traded. Listed options are valued at the mean between the last bid and the ask prices from the exchange on which they are principally traded. Options not listed on an exchange are valued by an independent source at the mean between the last bid and ask prices. For purposes of determining net asset value per share, futures and option contracts generally are valued 15 minutes after the close of the customary trading session of the New York Stock Exchange (“NYSE”).
Investments in open-end and closed-end registered investment companies that do not trade on an exchange are valued at the end of day net asset value per share. Investments in open-end and closed-end registered investment companies that trade on an exchange are valued at the last sales price or official closing price as of the close of the customary trading session on the exchange where the security is principally traded.
Debt obligations (including convertible bonds) and unlisted equities are fair valued using an evaluated quote provided by an independent pricing service. Evaluated quotes provided by the pricing service may be determined without exclusive reliance on quoted prices, and may reflect appropriate factors such as institution-size trading in similar groups of securities, developments related to specific securities, dividend rate (for unlisted equities), yield (for debt obligations), quality, type of issue, coupon rate (for debt obligations), maturity (for debt obligations), individual trading characteristics and other market data. Debt obligations are subject to interest rate and credit risks. In addition, all debt obligations involve some risk of default with respect to interest and/or principal payments.
Swap agreements are fair valued using an evaluated quote provided by an independent pricing service. Evaluated quotes provided by the pricing service are valued based on a model which may include end of day net present values, spreads, ratings, industry, and company performance.
Foreign securities’ (including foreign exchange contracts) prices are converted into U.S. dollar amounts using the applicable exchange rates as of the close of the NYSE. If market quotations are available and reliable for foreign exchange-traded equity securities, the securities will be valued at the market quotations. Because trading hours for certain foreign securities end before the close of the NYSE, closing market quotations may become unreliable. If between the time trading ends on a particular security and the close of the customary trading session on the NYSE, events occur that the Adviser determines are significant and make the closing price unreliable, the Fund may fair value the security. If the event is likely to have affected the closing price of the security, the security will be valued at fair value in good faith using procedures approved by the Board of Trustees. Adjustments to closing prices to reflect fair value may also be based on a screening process of an independent pricing service to indicate the degree of certainty, based on historical data, that the closing price in the principal market where a foreign security trades is not the current value as of the close of the NYSE. Foreign securities’ prices meeting the approved degree of certainty that the price is not reflective of current value will be priced at the indication of fair value from the independent pricing service. Multiple factors may be considered by the independent pricing service in determining adjustments to reflect fair value and may include information relating to sector indices, American Depositary Receipts and domestic and foreign index futures. Foreign securities may have additional risks including exchange rate changes, potential for sharply devalued currencies and high inflation, political and economic upheaval, the relative lack of issuer information, relatively low market liquidity and the potential lack of strict financial and accounting controls and standards.
Securities for which market prices are not provided by any of the above methods may be valued based upon quotes furnished by independent sources. The last bid price may be used to value equity securities. The mean between the last bid and asked prices is used to value debt obligations, including corporate loans.
Securities for which market quotations are not readily available or became unreliable are valued at fair value as determined in good faith by or under the supervision of the Trust’s officers following procedures approved by the Board of Trustees. Issuer specific events, market trends, bid/ask quotes of brokers and information providers and other market data may be reviewed in the course of making a good faith determination of a security’s fair value.
Valuations change in response to many factors including the historical and prospective earnings of the issuer, the value of the issuer’s assets, general economic conditions, interest rates, investor perceptions and market liquidity. Because of the inherent uncertainties of valuation, the values reflected in the financial statements may materially differ from the value received upon actual sale of those investments.
| B. | Securities Transactions and Investment Income — Securities transactions are accounted for on a trade date basis. Realized gains or losses on sales are computed on the basis of specific identification of the securities sold. Interest income is recorded on the accrual basis from the settlement date. Facility fees received may be amortized over the life of the loan. Paydown gains and losses on mortgage and asset-backed securities are recorded as adjustments to interest income. Dividend income (net of withholding tax, if any) is recorded on the ex-dividend date. Bond premiums and discounts are amortized and/or accreted for financial reporting purposes. |
The Fund may periodically participate in litigation related to Fund investments. As such, the Fund may receive proceeds from litigation settlements. Any proceeds received are included in the Statement of Operations as realized gain (loss) for investments no longer held and as unrealized gain (loss) for investments still held.
Brokerage commissions and mark ups are considered transaction costs and are recorded as an increase to the cost basis of securities purchased and/or a reduction of proceeds on a sale of securities. Such transaction costs are included in the determination of net realized and unrealized gain (loss) from investment securities reported in the Statement of Operations and the Statement of Changes in Net Assets and the net realized and unrealized gains (losses) on securities per share in the Financial Highlights. Transaction costs are included in the calculation of the Fund’s net asset value and, accordingly, they reduce the Fund’s total returns. These transaction costs are not considered operating expenses and are not reflected in net investment income reported in the Statement of Operations and Statement of Changes in Net Assets, or the net investment income per share and ratios of expenses and net investment income reported in the Financial Highlights, nor are they limited by any expense limitation arrangements between the Fund and the investment adviser.
The Fund allocates realized and unrealized capital gains and losses to a class based on the relative net assets of each class. The Fund allocates income to a class based on the relative value of the settled shares of each class.
| C. | Country Determination — For the purposes of making investment selection decisions and presentation in the Schedule of Investments, the investment adviser may determine the country in which an issuer is located and/or credit risk exposure based on various factors. These factors include the laws of the country under which the issuer is organized, where the issuer maintains a principal office, the country in which the issuer derives 50% or more of its total revenues and the country that has the primary market for the issuer’s securities, as well as other criteria. Among the other criteria that may be evaluated for making this determination are the country in which the issuer maintains 50% or more of its assets, the type of security, financial guarantees and enhancements, the nature of the collateral and the sponsor organization. Country of issuer and/or credit risk exposure has been determined to be the United States of America, unless otherwise noted. |
31 Invesco Floating Rate Fund
| D. | Distributions — Distributions from income are declared daily and paid monthly. Distributions from net realized capital gain, if any, are generally declared and paid annually and recorded on the ex-dividend date. The Fund may elect to treat a portion of the proceeds from redemptions as distributions for federal income tax purposes. |
| E. | Federal Income Taxes — The Fund intends to comply with the requirements of Subchapter M of the Internal Revenue Code of 1986, as amended (the “Internal Revenue Code”), necessary to qualify as a regulated investment company and to distribute substantially all of the Fund’s taxable earnings to shareholders. As such, the Fund will not be subject to federal income taxes on otherwise taxable income (including net realized capital gain) that is distributed to shareholders. Therefore, no provision for federal income taxes is recorded in the financial statements. |
The Fund files tax returns in the U.S. Federal jurisdiction and certain other jurisdictions. Generally, the Fund is subject to examinations by such taxing authorities for up to three years after the filing of the return for the tax period.
| F. | Expenses — Fees provided for under the Rule 12b-1 plan of a particular class of the Fund are charged to the operations of such class. Transfer agency fees and expenses and other shareholder recordkeeping fees and expenses attributable to Class R5 and Class R6 are allocated to each share class based on relative net assets. Sub-accounting fees attributable to Class R5 are charged to the operations of the class. Transfer agency fees and expenses and other shareholder recordkeeping fees and expenses relating to all other classes are allocated among those classes based on relative net assets. All other expenses are allocated among the classes based on relative net assets. |
| G. | Interest, Facilities and Maintenance Fees — Interest, Facilities and Maintenance Fees include interest and related borrowing costs such as commitment fees and other expenses associated with lines of credit and interest and administrative expenses related to establishing and maintaining floating rate note obligations, if any. |
| H. | Accounting Estimates — The preparation of financial statements in conformity with accounting principles generally accepted in the United States of America (“GAAP”) requires management to make estimates and assumptions that affect the reported amounts of assets and liabilities at the date of the financial statements and the reported amounts of revenues and expenses during the reporting period including estimates and assumptions related to taxation. Actual results could differ from those estimates by a significant amount. In addition, the Fund monitors for material events or transactions that may occur or become known after the period-end date and before the date the financial statements are released to print. |
| I. | Indemnifications — Under the Trust’s organizational documents, each Trustee, officer, employee or other agent of the Trust is indemnified against certain liabilities that may arise out of the performance of their duties to the Fund. Additionally, in the normal course of business, the Fund enters into contracts, including the Fund’s servicing agreements, that contain a variety of indemnification clauses. The Fund’s maximum exposure under these arrangements is unknown as this would involve future claims that may be made against the Fund that have not yet occurred. The risk of material loss as a result of such indemnification claims is considered remote. |
| J. | Other Risks — The Fund may invest all or substantially of its assets in senior secured floating rate loans, senior secured debt securities or other securities rated below investment grade. These securities are generally considered to have speculative characteristics and are subject to greater risk of loss of principal and interest than higher rated securities. The value of lower quality debt securities and floating rate loans can be more volatile due to increased sensitivity to adverse issuer, political, regulatory, market or economic developments. |
The Fund invests in Corporate Loans from U.S. or non-U.S. companies (the “Borrowers”). The investment of the Fund in a Corporate Loan may take the form of participation interests or assignments. If the Fund purchases a participation interest from a syndicate of lenders (“Lenders”) or one of the participants in the syndicate (“Participant”), one or more of which administers the loan on behalf of all the Lenders (the “Agent Bank”), the Fund would be required to rely on the Lender that sold the participation interest not only for the enforcement of the Fund’s rights against the Borrower but also for the receipt and processing of payments due to the Fund under the Corporate Loans. As such, the Fund is subject to the credit risk of the Borrower and the Participant. Lenders and Participants interposed between the Fund and a Borrower, together with Agent Banks, are referred to as “Intermediate Participants”.
| K. | Bank Loan Risk Disclosures — Although the resale, or secondary market for floating rate loans has grown substantially over the past decade, both in overall size and number of market participants, there is no organized exchange or board of trade on which floating rate loans are traded. Instead, the secondary market for floating rate loans is a private, unregulated interdealer or interbank resale market. Such a market may therefore be subject to irregular trading activity, wide bid/ask spreads, and extended trade settlement periods. Similar to other asset classes, bank loan funds may be exposed to counterparty credit risk, or the risk than an entity with which the Fund has unsettled or open transactions may fail to or be unable to perform on its commitments. The Fund manages counterparty credit risk by entering into transactions only with counterparties that they believe have the financial resources to honor their obligations and by monitoring the financial stability of those counterparties. |
| L. | Cash and Cash Equivalents — For the purposes of the Statement of Cash Flows the Fund defines Cash and Cash Equivalents as cash (including foreign currency), money market funds and other investments held in lieu of cash and excludes investments made with cash collateral received. |
| M. | Securities Purchased on a When-Issued and Delayed Delivery Basis — The Fund may purchase and sell interests in Corporate Loans and Corporate Debt Securities and other portfolio securities on a when-issued and delayed delivery basis, with payment and delivery scheduled for a future date. No income accrues to the Fund on such interests or securities in connection with such transactions prior to the date the Fund actually takes delivery of such interests or securities. These transactions are subject to market fluctuations and are subject to the risk that the value at delivery may be more or less than the trade date purchase price. Although the Fund will generally purchase these securities with the intention of acquiring such securities, they may sell such securities prior to the settlement date. |
32 Invesco Floating Rate Fund
NOTE 2—Advisory Fees and Other Fees Paid to Affiliates
The Trust has entered into a master investment advisory agreement with Invesco Advisers, Inc. (the “Adviser” or “Invesco”). Under the terms of the investment advisory agreement, the Fund pays an advisory fee to the Adviser based on the annual rate of the Fund’s average daily net assets as follows:
| Average Daily Net Assets | Rate | |||||
| First $500 million | 0 | .65% | ||||
| Next $4.5 billion | 0 | .60% | ||||
| Next $5 billion | 0 | .575%�� | ||||
Over $10 billion | 0 | .55% | ||||
Under the terms of a master sub-advisory agreement between the Adviser and each of Invesco Asset Management Deutschland GmbH, Invesco Asset Management Limited, Invesco Asset Management (Japan) Limited, Invesco Australia Limited, Invesco Hong Kong Limited, Invesco Senior Secured Management, Inc. and Invesco Canada Ltd. (collectively, the “Affiliated Sub-Advisers”) the Adviser, not the Fund, may pay 40% of the fees paid to the Adviser to any such Affiliated Sub-Adviser(s) that provide(s) discretionary investment management services to the Fund based on the percentage of assets allocated to such Sub-Adviser(s).
The Adviser has contractually agreed, through at least June 30, 2014, to waive advisory fees and/or reimburse expenses of all shares to the extent necessary to limit total annual fund operating expenses after fee waiver and/or reimbursement (excluding certain items discussed below) of Class A, Class C, Class R, Class Y, Class R5 and Class R6 shares to 1.50%, 2.00%, 1.75%, 1.25%, 1.25% and 1.25% of average daily net assets. In determining the Adviser’s obligation to waive advisory fees and/or reimburse expenses, the following expenses are not taken into account, and could cause the total annual fund operating expenses after fee waiver and/or reimbursement to exceed the numbers reflected above: (1) interest, facilities and maintenance fees; (2) taxes; (3) dividend expense on short sales; (4) extraordinary or non-routine items, including litigation expenses; and (5) expenses that the Fund has incurred but did not actually pay because of an expense offset arrangement. Unless the Board of Trustees and Invesco mutually agree to amend or continue the fee waiver agreement, it will terminate on June 30, 2014. The Adviser did not waive fees and/or reimburse expenses during the period under this expense limitation.
Further, the Adviser has contractually agreed, through at least June 30, 2014, to waive the advisory fee payable by the Fund in an amount equal to 100% of the net advisory fees the Adviser receives from the affiliated money market funds on investments by the Fund of uninvested cash in such affiliated money market funds.
For the year ended August 31, 2013, the Adviser waived advisory fees of $166,666.
The Trust has entered into a master administrative services agreement with Invesco pursuant to which the Fund has agreed to pay Invesco for certain administrative costs incurred in providing accounting services to the Fund. For the year ended August 31, 2013, expenses incurred under the agreement are shown in the Statement of Operations as Administrative services fees.
Also, Invesco has entered into service agreements whereby State Street Bank and Trust Company (“SSB”) serves as the custodian, fund accountant and provides certain administrative services to the Fund.
The Trust has entered into a transfer agency and service agreement with Invesco Investment Services, Inc. (“IIS”) pursuant to which the Fund has agreed to pay IIS a fee for providing transfer agency and shareholder services to the Fund and reimburse IIS for certain expenses incurred by IIS in the course of providing such services. IIS may make payments to intermediaries that provide omnibus account services, sub-accounting services and/or networking services. All fees payable by IIS to intermediaries that provide omnibus account services or sub-accounting are charged back to the Fund, subject to certain limitations approved by the Trust’s Board of Trustees. For the year ended August 31, 2013, expenses incurred under the agreement are shown in the Statement of Operations as Transfer agent fees.
The Trust has entered into master distribution agreements with Invesco Distributors, Inc. (“IDI”) to serve as the distributor for the Class A, Class C, Class R, Class Y, Class R5and Class R6 shares of the Fund. The Trust has adopted plans pursuant to Rule 12b-1 under the 1940 Act with respect to the Fund’s Class A, Class C and Class R shares (collectively, the “Plans”). The Fund, pursuant to the Plans, pays IDI compensation at the annual rate of 0.25% of the Fund’s average daily net assets of Class A shares, 0.75% of the average daily net assets of Class C shares and 0.50% of the average daily net assets of Class R shares. Of the Plan payments, up to 0.25% of the average daily net assets of each class of shares may be paid to furnish continuing personal shareholder services to customers who purchase and own shares of such classes. Any amounts not paid as a service fee under the Plans would constitute an asset-based sales charge. Rules of the Financial Industry Regulatory Authority (“FINRA”) impose a cap on the total sales charges, including asset-based sales charges, that may be paid by any class of shares of the Fund. For the year ended August 31, 2013, expenses incurred under the Plans are shown in the Statement of Operations as Distribution fees.
Front-end sales commissions and CDSC (collectively, the “sales charges”) are not recorded as expenses of the Fund. Front-end sales commissions are deducted from proceeds from the sales of Fund shares prior to investment in Class A shares of the Fund. CDSC are deducted from redemption proceeds prior to remittance to the shareholder. During the year ended August 31, 2013, IDI advised the Fund that IDI retained $454,497 in front-end sales commissions from the sale of Class A shares and $49,406 and $34,955 from Class A and Class C shares, respectively, for CDSC imposed upon redemptions by shareholders.
Certain officers and trustees of the Trust are officers and directors of the Adviser, IIS and/or IDI.
NOTE 3—Additional Valuation Information
GAAP defines fair value as the price that would be received to sell an asset or paid to transfer a liability in an orderly transaction between market participants at the measurement date, under current market conditions. GAAP establishes a hierarchy that prioritizes the inputs to valuation methods, giving the highest priority to readily available unadjusted quoted prices in an active market for identical assets (Level 1) and the lowest priority to significant unobservable inputs (Level 3), generally when market prices are not readily available or are unreliable. Based on the valuation inputs, the
33 Invesco Floating Rate Fund
securities or other investments are tiered into one of three levels. Changes in valuation methods may result in transfers in or out of an investment’s assigned level:
| Level 1 — | Prices are determined using quoted prices in an active market for identical assets. |
| Level 2 — | Prices are determined using other significant observable inputs. Observable inputs are inputs that other market participants may use in pricing a security. These may include quoted prices for similar securities, interest rates, prepayment speeds, credit risk, yield curves, loss severities, default rates, discount rates, volatilities and others. |
| Level 3 — | Prices are determined using significant unobservable inputs. In situations where quoted prices or observable inputs are unavailable (for example, when there is little or no market activity for an investment at the end of the period), unobservable inputs may be used. Unobservable inputs reflect the Fund’s own assumptions about the factors market participants would use in determining fair value of the securities or instruments and would be based on the best available information. |
The following is a summary of the tiered valuation input levels, as of August 31, 2013. The level assigned to the securities valuations may not be an indication of the risk or liquidity associated with investing in those securities. Because of the inherent uncertainties of valuation, the values reflected in the financial statements may materially differ from the value received upon actual sale of those investments.
| Level 1 | Level 2 | Level 3 | Total | |||||||||||||
Equity Securities | $ | 225,184,345 | $ | 3,728,709 | $ | 208,198 | $ | 229,121,252 | ||||||||
Variable Rate Senior Loan Interests | — | 1,851,818,947 | 57,870,285 | 1,909,689,232 | ||||||||||||
Bonds and Notes | — | 73,482,172 | — | 73,482,172 | ||||||||||||
Structured Products | — | 48,182,849 | — | 48,182,849 | ||||||||||||
Total Investments | $ | 225,184,345 | $ | 1,977,212,677 | $ | 58,078,483 | $ | 2,260,475,505 | ||||||||
A reconciliation of Level 3 investments is presented when the Fund had a significant amount of Level 3 investments at the beginning and/or end of the reporting period in relation to net assets.
The following is a reconciliation of the fair valuations using significant unobservable inputs (Level 3) during the year ended August 31, 2013:
| Beginning Balance, as of August 31, 2012 | Purchases | Sales | Accrued discounts/ premiums | Net realized gain | Net change in unrealized appreciation | Transfers into Level 3 | Transfers out of Level 3 | Ending Balance, as of August 31, 2013 | ||||||||||||||||||||||||||||
Variable Rate Senior Loan Interests | $ | — | $ | 48,433,729 | $ | (4,228,759 | ) | $ | 62,752 | $ | 23,027 | $ | 577,056 | $ | 13,002,480 | $ | — | $ | 57,870,285 | |||||||||||||||||
Equity | 102,506 | 15,075 | — | — | — | 89,382 | 1,235 | — | 208,198 | |||||||||||||||||||||||||||
Total | $ | 102,506 | $ | 48,448,804 | $ | (4,228,759 | ) | $ | 62,752 | $ | 23,027 | $ | 666,438 | $ | 13,003,715 | $ | — | $ | 58,078,483 | |||||||||||||||||
The Variable Rate Senior Loan Interests determined to be level 3 at the end of the reporting period were valued utilizing quotes from a third-party vendor pricing service. Investments in Variable Rate Senior Loan Interests were transferred from Level 2 to Level 3 due to third-party vendor quotations utilizing single market quotes and was assumed to have occurred at the end of the reporting period. A significant change in third-party pricing information could result in a significantly lower or higher value in Level 3 investments.
NOTE 4—Expense Offset Arrangement(s)
The expense offset arrangement is comprised of transfer agency credits which result from balances in Demand Deposit Accounts (DDA) used by the transfer agent for clearing shareholder transactions. For the year ended August 31, 2013, the Fund received credits from this arrangement, which resulted in the reduction of the Fund’s total expenses of $652.
NOTE 5—Trustees’ and Officers’ Fees and Benefits
“Trustees’ and Officers’ Fees and Benefits” include amounts accrued by the Fund to pay remuneration to certain Trustees and Officers of the Fund. Trustees have the option to defer compensation payable by the Fund, and “Trustees’ and Officers’ Fees and Benefits” also include amounts accrued by the Fund to fund such deferred compensation amounts. Those Trustees who defer compensation have the option to select various Invesco Funds in which their deferral accounts shall be deemed to be invested. Finally, certain current Trustees are eligible to participate in a retirement plan that provides for benefits to be paid upon retirement to Trustees over a period of time based on the number of years of service. The Fund may have certain former Trustees who also participate in a retirement plan and receive benefits under such plan. “Trustees’ and Officers’ Fees and Benefits” include amounts accrued by the Fund to fund such retirement benefits. Obligations under the deferred compensation and retirement plans represent unsecured claims against the general assets of the Fund.
NOTE 6—Borrowings
Effective July 24, 2013, the Board of Trustees of the Fund approved a revolving line of credit agreement with SSB in which the Fund may borrow up to the lesser of (1) $300,000,000 or (2) the limits set by its prospectus for borrowings. This agreement has been renewed and will expire on July 24, 2014. Prior to July 24, 2013, the revolving line of credit was $150,000,000.
Additionally, the Fund is permitted to temporarily carry a negative or overdrawn balance in its account with State Street Bank and Trust Company, the custodian bank. Such balances, if any at period end, are shown in the Statement of Assets and Liabilities under the payable caption Amount due custodian. To compensate the custodian bank for such overdrafts, the overdrawn Fund may either (1) leave funds as a compensating balance in the account so the custodian bank can be compensated by earning the additional interest; or (2) compensate by paying the custodian bank at a rate agreed upon by the custodian bank and Invesco, not to exceed the contractually agreed upon rate.
34 Invesco Floating Rate Fund
NOTE 7—Unfunded Loan Commitments
The Fund invests in participations, assignments, or acts as a party to the primary lending syndicate of a Senior Loan interest to corporations, partnerships, and other entities. When the Fund purchases a participation of a Senior Loan interest, the Fund typically enters into a contractual agreement with the lender or other third party selling the participation, but not with the borrower directly. As such, the Fund assumes the credit risk of the borrower, selling participant or other persons interpositioned between the Fund and the borrower.
At the year ended August 31, 2013, the following sets forth the selling participants with respect to interest in Senior Loans purchased by the Fund on a participation basis.
| Selling Participant | Principal Amount | Value | ||||||
Goldman Sachs Lending Partners LLC | $ | 1,572,681 | $ | 1,478,320 | ||||
As of August 31, 2013, the Fund had unfunded loan commitments, which could be extended at the option of the borrower, pursuant to the following loan agreements with the following borrowers:
| Borrower | Principal Amount | Value | ||||||||
David’s Bridal, Inc. | Revolver Loan | $ | 1,572,681 | $ | 1,478,320 | |||||
Delta Air Lines, Inc. | Revolver Loan | 7,785,030 | 7,395,779 | |||||||
Lake at Las Vegas Joint Venture, LLC | Revolver Loan | 10,794 | 4,524 | |||||||
Media General, Inc. | Term Loan | 4,758,668 | 4,776,466 | |||||||
Reynolds Group Holdings, Inc. | Revolver Loan | 3,986,510 | 3,982,165 | |||||||
West Corp. | Revolver Loan | 1,747,822 | 1,642,952 | |||||||
| $ | 19,861,505 | $ | 19,280,206 | |||||||
NOTE 8—Distributions to Shareholders and Tax Components of Net Assets
Tax Character of Distributions to Shareholders Paid During the Years Ended August 31, 2013 and 2012:
| 2013 | 2012 | |||||||
Ordinary income | $ | 57,938,642 | $ | 40,397,315 | ||||
Tax Components of Net Assets at Period-End:
| 2013 | ||||
Undistributed ordinary income | $ | 740,864 | ||
Net unrealized appreciation (depreciation) — investments | (5,708,604 | ) | ||
Net unrealized appreciation (depreciation) — investments matured | (157,217 | ) | ||
Temporary book/tax differences | (124,364 | ) | ||
Capital loss carryforward | (6,039,554 | ) | ||
Shares of beneficial interest | 2,114,503,301 | |||
Total net assets | $ | 2,103,214,426 | ||
The difference between book-basis and tax-basis unrealized appreciation (depreciation) is due to differences in the timing of recognition of gains and losses on investments for tax and book purposes. The Fund’s net unrealized appreciation (depreciation) difference is attributable primarily to wash sales, book to tax accretion and amortization differences.
The temporary book/tax differences are a result of timing differences between book and tax recognition of income and/or expenses. The Fund’s temporary book/tax differences are the result of the trustee deferral of compensation and retirement plan benefits.
Capital loss carryforward is calculated and reported as of a specific date. Results of transactions and other activity after that date may affect the amount of capital loss carryforward actually available for the Fund to utilize. The Regulated Investment Company Modernization Act of 2010 eliminated the eight-year carryover period for capital losses that arise in taxable years beginning after its enactment date of December 22, 2010. Consequently, these capital losses can be carried forward for an unlimited period. However, capital losses with an expiration period may not be used to offset capital gains until all net capital losses without an expiration date have been utilized. Additionally, post-enactment capital loss carryovers will retain their character as either short-term or long-term capital losses instead of as short-term capital losses as under prior law. The ability to utilize capital loss carryforward in the future may be limited under the Internal Revenue Code and related regulations based on the results of future transactions.
35 Invesco Floating Rate Fund
The Fund utilized $13,715,292 of capital loss carryforward in the current period to offset net realized capital gain for federal income tax purposes. The Fund has a capital loss carryforward as of August 31, 2013, which expires as follows:
| Capital Loss Carryforward* | ||||||||||||
| Expiration | Short-Term | Long-Term | Total | |||||||||
August 31, 2017 | $ | 6,039,554 | $ | — | $ | 6,039,554 | ||||||
| * | Capital loss carryforward as of the date listed above is reduced for limitations, if any, to the extent required by the Internal Revenue Code. |
NOTE 9—Investment Securities
The aggregate amount of investment securities (other than short-term securities, U.S. Treasury obligations and money market funds, if any) purchased and sold by the Fund during the year ended August 31, 2013 was $2,346,963,715 and $1,241,340,398, respectively. Cost of investments on a tax basis includes the adjustments for financial reporting purposes as of the most recently completed federal income tax reporting period-end.
| Unrealized Appreciation (Depreciation) of Investment Securities on a Tax Basis | ||||
Aggregate unrealized appreciation of investment securities | $ | 17,045,761 | ||
Aggregate unrealized (depreciation) of investment securities | (22,754,365 | ) | ||
Net unrealized appreciation (depreciation) of investment securities | $ | (5,708,604 | ) | |
Cost of investments for tax purposes is $2,266,184,109. | ||||
NOTE 10—Reclassification of Permanent Differences
Primarily as a result of differing book/tax treatment of the sale of bonds with amortization, on August 31, 2013, undistributed net investment income was increased by $281,520 and undistributed net realized gain (loss) was decreased by $281,520. This reclassification had no effect on the net assets of the Fund.
NOTE 11—Share Information
| Summary of Share Activity | ||||||||||||||||
| Years ended August 31, | ||||||||||||||||
| 2013(a) | 2012 | |||||||||||||||
| Shares | Amount | Shares | Amount | |||||||||||||
Sold: | ||||||||||||||||
Class A | 85,809,233 | $ | 681,689,852 | 22,275,912 | $ | 170,426,665 | ||||||||||
Class C | 39,732,283 | 314,470,469 | 5,871,052 | 44,618,527 | ||||||||||||
Class R | 282,129 | 2,247,568 | 86,374 | 660,015 | ||||||||||||
Class Y | 65,890,315 | 522,776,943 | 12,131,084 | 92,783,961 | ||||||||||||
Class R5 | 1,652,090 | 13,075,361 | 1,687,281 | 12,812,506 | ||||||||||||
Class R6(b) | 7,948,789 | 62,499,889 | — | — | ||||||||||||
Issued as reinvestment of dividends: | ||||||||||||||||
Class A | 2,577,561 | 20,453,288 | 1,902,814 | 14,507,416 | ||||||||||||
Class C | 1,263,362 | 9,972,285 | 1,032,010 | 7,833,248 | ||||||||||||
Class R | 12,477 | 99,053 | 8,616 | 65,877 | ||||||||||||
Class Y | 1,196,684 | 9,480,543 | 509,053 | 3,887,695 | ||||||||||||
Class R5 | 72,079 | 571,177 | 357,609 | 2,728,198 | ||||||||||||
Class R6 | 305,796 | 2,424,391 | — | — | ||||||||||||
Reacquired:(c) | ||||||||||||||||
Class A | (25,392,869 | ) | (201,224,513 | ) | (27,781,004 | ) | (210,451,424 | ) | ||||||||
Class C | (8,754,185 | ) | (69,091,983 | ) | (10,015,718 | ) | (75,469,623 | ) | ||||||||
Class R | (75,449 | ) | (597,990 | ) | (68,852 | ) | (521,195 | ) | ||||||||
Class Y | (18,876,729 | ) | (149,545,210 | ) | (8,435,063 | ) | (63,588,732 | ) | ||||||||
Class R5 | (8,025,950 | ) | (63,163,235 | ) | (1,232,413 | ) | (9,281,264 | ) | ||||||||
Class R6 | (311,797 | ) | (2,471,466 | ) | — | — | ||||||||||
Net increase (decrease) in share activity | 145,305,819 | $ | 1,153,666,422 | (1,671,245 | ) | $ | (8,988,130 | ) | ||||||||
| (a) | There are entities that are record owners of more than 5% of the outstanding shares of the Fund and in the aggregate own 69% of the outstanding shares of the Fund. IDI has an agreement with these entities to sell Fund shares. The Fund, Invesco and/or Invesco affiliates may make payments to these entities, which are considered to be related to the Fund, for providing services to the Fund, Invesco and/or Invesco affiliates including but not limited to services such as securities brokerage, distribution, third party record keeping and account servicing. The Fund has no knowledge as to whether all or any portion of the shares owned of record by these entities are also owned beneficially. |
| (b) | Commencement date of September 24, 2012. |
| (c) | Net of redemption fees of $21,733 allocated among the classes based on relative net assets of each class for the year ended August 31, 2012. |
36 Invesco Floating Rate Fund
NOTE 12—Financial Highlights
The following schedule presents financial highlights for a share of the Fund outstanding throughout the periods indicated.
| Net asset value, beginning of period | Net investment income(a) | Net gains (losses) on securities (both realized and unrealized) | Total from investment operations | Dividends from net investment income | Net asset value, end of period(b) | Total return(c) | Net assets, end of period (000’s omitted) | Ratio of expenses to average net assets with fee waivers and/or expenses absorbed | Ratio of expenses to average net assets without fee waivers and/or expenses absorbed | Ratio of net investment income to average net assets | Portfolio turnover(d) | |||||||||||||||||||||||||||||||||||||
Class A | ||||||||||||||||||||||||||||||||||||||||||||||||
Year ended 08/31/13 | $ | 7.77 | $ | 0.35 | $ | 0.17 | $ | 0.52 | $ | (0.36 | ) | $ | 7.93 | 6.83 | % | $ | 957,442 | 1.08 | %(e)(f) | 1.09 | %(e)(f) | 4.36 | %(e) | 97 | % | |||||||||||||||||||||||
Year ended 08/31/12 | 7.36 | 0.37 | 0.41 | 0.78 | (0.37 | ) | 7.77 | 10.75 | 448,142 | 1.11 | (f) | 1.11 | (f) | 4.80 | 82 | |||||||||||||||||||||||||||||||||
Year ended 08/31/11 | 7.47 | 0.35 | (0.11 | ) | 0.24 | (0.35 | ) | 7.36 | 3.07 | 450,750 | 0.99 | (f) | 1.00 | (f) | 4.53 | 152 | ||||||||||||||||||||||||||||||||
Year ended 08/31/10 | 7.09 | 0.40 | 0.39 | (g) | 0.79 | (0.41 | ) | 7.47 | 11.28 | (g) | 359,476 | 1.12 | (f) | 1.14 | (f) | 5.34 | 106 | |||||||||||||||||||||||||||||||
Year ended 08/31/09 | 7.99 | 0.41 | (0.89 | ) | (0.48 | ) | (0.42 | ) | 7.09 | (4.97 | ) | 218,448 | 1.24 | (f) | 1.25 | (f) | 6.50 | 52 | ||||||||||||||||||||||||||||||
Class C | ||||||||||||||||||||||||||||||||||||||||||||||||
Year ended 08/31/13 | 7.73 | 0.31 | 0.18 | 0.49 | (0.32 | ) | 7.90 | 6.45 | 518,948 | 1.58 | (e)(f) | 1.59 | (e)(f) | 3.86 | (e) | 97 | ||||||||||||||||||||||||||||||||
Year ended 08/31/12 | 7.32 | 0.33 | 0.41 | 0.74 | (0.33 | ) | 7.73 | 10.24 | 258,800 | 1.61 | (f) | 1.61 | (f) | 4.30 | 82 | |||||||||||||||||||||||||||||||||
Year ended 08/31/11 | 7.44 | 0.31 | (0.12 | ) | 0.19 | (0.31 | ) | 7.32 | 2.41 | 267,796 | 1.49 | (f) | 1.50 | (f) | 4.03 | 152 | ||||||||||||||||||||||||||||||||
Year ended 08/31/10 | 7.06 | 0.36 | 0.39 | (g) | 0.75 | (0.37 | ) | 7.44 | 10.75 | (g) | 189,966 | 1.62 | (f) | 1.64 | (f) | 4.84 | 106 | |||||||||||||||||||||||||||||||
Year ended 08/31/09 | 7.97 | 0.38 | (0.90 | ) | (0.52 | ) | (0.39 | ) | 7.06 | (5.61 | ) | 103,975 | 1.74 | (f) | 1.75 | (f) | 6.00 | 52 | ||||||||||||||||||||||||||||||
Class R | ||||||||||||||||||||||||||||||||||||||||||||||||
Year ended 08/31/13 | 7.79 | 0.33 | 0.17 | 0.50 | (0.34 | ) | 7.95 | 6.57 | 3,559 | 1.33 | (e)(f) | 1.34 | (e)(f) | 4.11 | (e) | 97 | ||||||||||||||||||||||||||||||||
Year ended 08/31/12 | 7.37 | 0.35 | 0.42 | 0.77 | (0.35 | ) | 7.79 | 10.61 | 1,779 | 1.36 | (f) | 1.36 | (f) | 4.55 | 82 | |||||||||||||||||||||||||||||||||
Year ended 08/31/11 | 7.49 | 0.33 | (0.12 | ) | 0.21 | (0.33 | ) | 7.37 | 2.68 | 1,491 | 1.24 | (f) | 1.25 | (f) | 4.28 | 152 | ||||||||||||||||||||||||||||||||
Year ended 08/31/10 | 7.10 | 0.39 | 0.39 | (g) | 0.78 | (0.39 | ) | 7.49 | 11.15 | (g) | 1,080 | 1.37 | (f) | 1.39 | (f) | 5.09 | 106 | |||||||||||||||||||||||||||||||
Year ended 08/31/09 | 8.00 | 0.40 | (0.89 | ) | (0.49 | ) | (0.41 | ) | 7.10 | (5.19 | ) | 427 | 1.49 | (f) | 1.50 | (f) | 6.25 | 52 | ||||||||||||||||||||||||||||||
Class Y | ||||||||||||||||||||||||||||||||||||||||||||||||
Year ended 08/31/13 | 7.76 | 0.37 | 0.17 | 0.54 | (0.38 | ) | 7.92 | 7.10 | 550,974 | 0.83 | (e)(f) | 0.84 | (e)(f) | 4.61 | (e) | 97 | ||||||||||||||||||||||||||||||||
Year ended 08/31/12 | 7.34 | 0.38 | 0.42 | 0.80 | (0.38 | ) | 7.76 | 11.19 | 165,609 | 0.86 | (f) | 0.86 | (f) | 5.05 | 82 | |||||||||||||||||||||||||||||||||
Year ended 08/31/11 | 7.46 | 0.37 | (0.12 | ) | 0.25 | (0.37 | ) | 7.34 | 3.19 | 125,900 | 0.74 | (f) | 0.75 | (f) | 4.78 | 152 | ||||||||||||||||||||||||||||||||
Year ended 08/31/10 | 7.07 | 0.42 | 0.39 | (g) | 0.81 | (0.42 | ) | 7.46 | 11.72 | (g) | 93,479 | 0.87 | (f) | 0.89 | (f) | 5.59 | 106 | |||||||||||||||||||||||||||||||
Year ended 08/31/09(h) | 7.29 | 0.41 | (0.24 | ) | 0.17 | (0.39 | ) | 7.07 | 3.48 | 20,176 | 1.00 | (f)(i) | 1.00 | (f)(i) | 6.74 | (i) | 52 | |||||||||||||||||||||||||||||||
Class R5 | ||||||||||||||||||||||||||||||||||||||||||||||||
Year ended 08/31/13 | 7.77 | 0.37 | 0.18 | 0.55 | (0.38 | ) | 7.94 | 7.26 | 9,260 | 0.81 | (e)(f) | 0.82 | (e)(f) | 4.63 | e) | 97 | ||||||||||||||||||||||||||||||||
Year ended 08/31/12 | 7.36 | 0.39 | 0.41 | 0.80 | (0.39 | ) | 7.77 | 11.13 | 58,039 | 0.77 | (f) | 0.77 | (f) | 5.14 | 82 | |||||||||||||||||||||||||||||||||
Year ended 08/31/11 | 7.47 | 0.38 | (0.12 | ) | 0.26 | (0.37 | ) | 7.36 | 3.40 | 48,967 | 0.68 | (f) | 0.69 | (f) | 4.84 | 152 | ||||||||||||||||||||||||||||||||
Year ended 08/31/10 | 7.09 | 0.42 | 0.39 | (g) | 0.81 | (0.43 | ) | 7.47 | 11.65 | (g) | 37,580 | 0.79 | (f) | 0.81 | (f) | 5.67 | 106 | |||||||||||||||||||||||||||||||
Year ended 08/31/09 | 7.99 | 0.44 | (0.89 | ) | (0.45 | ) | (0.45 | ) | 7.09 | (4.62 | ) | 38,720 | 0.88 | (f) | 0.89 | (f) | 6.86 | 52 | ||||||||||||||||||||||||||||||
Class R6 | ||||||||||||||||||||||||||||||||||||||||||||||||
Year ended 08/31/13(h) | 7.84 | 0.35 | 0.11 | 0.46 | (0.36 | ) | 7.94 | 6.01 | 63,032 | 0.76 | (e)(f)(i) | 0.77 | (e)(f)(i) | 4.68 | (e)(i) | 97 | ||||||||||||||||||||||||||||||||
| (a) | Calculated using average shares outstanding. |
| (b) | For the fiscal years ended August 31, 2012 and prior, amounts include redemption fees added to shares of beneficial interest which were less than $0.005 per share. |
| (c) | Includes adjustments in accordance with accounting principles generally accepted in the United States of America and as such, the net asset value for financial reporting purposes and the returns based upon those net asset values may differ from the net asset value and returns for shareholder transactions. Does not include sales charges and is not annualized for periods less than one year, if applicable. |
| (d) | Portfolio turnover is calculated at the fund level and is not annualized for periods less than one year, if applicable. |
| (e) | Ratios are based on average daily net assets (000’s omitted) of $626,058, $339,058, $2,424, $290,403, $15,404 and $53,196 for Class A, Class C, Class R, Class Y, Class R5 and Class R6 shares, respectively. |
| (f) | Ratio includes line of credit expense of 0.02%, 0.03%, 0.01%, 0.02% and 0.02% for the years ended August 31, 2013, August 31, 2012, August 31, 2011, August 31, 2010, and August 31, 2009, respectively. |
| (g) | Includes the impact of the valuation policy on Corporate Loans effective January 1, 2010. Had the policy change not occurred, Net gains on securities (both realized and unrealized) per share would have been $0.33, $0.33, $0.33, $0.33 and $0.33 for Class A, Class C, Class R, Class Y and Class R5 shares, respectively, and total returns would have been lower. |
| (h) | Commencement date of October 3, 2008 and September 24, 2012 for Class Y and Class R6, respectively. |
| (i) | Annualized. |
37 Invesco Floating Rate Fund
Report of Independent Registered Public Accounting Firm
To the Board of Trustees of AIM Counselor Series Trust (Invesco Counselor Series Trust)
and Shareholders of Invesco Floating Rate Fund:
In our opinion, the accompanying statement of assets and liabilities, including the schedule of investments, and the related statements of operations, of changes in net assets, of cash flows and the financial highlights present fairly, in all material respects, the financial position of Invesco Floating Rate Fund (one of the funds constituting AIM Counselor Series Trust (Invesco Counselor Series Trust), hereafter referred to as the “Fund”) at August 31, 2013, the results of its operations for the year then ended, the changes in its net assets for each of the two years in the period then ended, its cash flows for the year then ended and the financial highlights for each of the five years in the period then ended, in conformity with accounting principles generally accepted in the United States of America. These financial statements and financial highlights (hereafter referred to as “financial statements”) are the responsibility of the Fund’s management; our responsibility is to express an opinion on these financial statements based on our audits. We conducted our audits of these financial statements in accordance with the standards of the Public Company Accounting Oversight Board (United States). Those standards require that we plan and perform the audit to obtain reasonable assurance about whether the financial statements are free of material misstatement. An audit includes examining, on a test basis, evidence supporting the amounts and disclosures in the financial statements, assessing the accounting principles used and significant estimates made by management, and evaluating the overall financial statement presentation. We believe that our audits, which included confirmation of securities at August 31, 2013 by correspondence with the custodian and brokers, provide a reasonable basis for our opinion.
PRICEWATERHOUSECOOPERS LLP
October 29, 2013
Houston, Texas
38 Invesco Floating Rate Fund
Calculating your ongoing Fund expenses
Example
As a shareholder of the Fund, you incur two types of costs: (1) transaction costs, which may include sales charges (loads) on purchase payments or contingent deferred sales charges on redemptions, if any; and (2) ongoing costs, including management fees, distribution and/or service (12b-1) fees, and other Fund expenses. This example is intended to help you understand your ongoing costs (in dollars) of investing in the Fund and to compare these costs with ongoing costs of investing in other mutual funds. The example is based on an investment of $1,000 invested at the beginning of the period and held for the entire period March 1, 2013 through August 31, 2013.
Actual expenses
The table below provides information about actual account values and actual expenses. You may use the information in this table, together with the amount you invested, to estimate the expenses that you paid over the period. Simply divide your account value by $1,000 (for example, an $8,600 account value divided by $1,000 = 8.6), then multiply the result by the number in the table under the heading entitled “Actual Expenses Paid During Period” to estimate the expenses you paid on your account during this period.
Hypothetical example for comparison purposes
The table below also provides information about hypothetical account values and hypothetical expenses based on the Fund’s actual expense ratio and an assumed rate of return of 5% per year before expenses, which is not the Fund’s actual return.
The hypothetical account values and expenses may not be used to estimate the actual ending account balance or expenses you paid for the period. You may use this information to compare the ongoing costs of investing in the Fund and other funds. To do so, compare this 5% hypothetical example with the 5% hypothetical examples that appear in the shareholder reports of the other funds.
Please note that the expenses shown in the table are meant to highlight your ongoing costs only and do not reflect any transaction costs, such as sales charges (loads) on purchase payments or contingent deferred sales charges on redemptions, if any. Therefore, the hypothetical information is useful in comparing ongoing costs only, and will not help you determine the relative total costs of owning different funds. In addition, if these transaction costs were included, your costs would have been higher.
| Class | Beginning Account Value (03/01/13) | ACTUAL | HYPOTHETICAL (5% annual return before expenses) | Annualized Expense Ratio | ||||||||||||||||||||
| Ending Account Value (08/31/13)1 | Expenses Paid During Period2 | Ending Account Value (08/31/13) | Expenses Paid During Period 2 | |||||||||||||||||||||
| A | $ | 1,000.00 | $ | 1,021.40 | $ | 5.45 | $ | 1,019.81 | $ | 5.45 | 1.07 | % | ||||||||||||
| C | 1,000.00 | 1,018.80 | 7.99 | 1,017.29 | 7.98 | 1.57 | ||||||||||||||||||
| R | 1,000.00 | 1,020.10 | 6.72 | 1,018.55 | 6.72 | 1.32 | ||||||||||||||||||
| Y | 1,000.00 | 1,022.70 | 4.18 | 1,021.07 | 4.18 | 0.82 | ||||||||||||||||||
| R5 | 1,000.00 | 1,022.70 | 4.28 | 1,020.97 | 4.28 | 0.84 | ||||||||||||||||||
| R6 | 1,000.00 | 1,023.10 | 3.77 | 1,021.48 | 3.77 | 0.74 | ||||||||||||||||||
| 1 | The actual ending account value is based on the actual total return of the Fund for the period March 1, 2013 through August 31, 2013, after actual expenses and will differ from the hypothetical ending account value which is based on the Fund’s expense ratio and a hypothetical annual return of 5% before expenses. |
| 2 | Expenses are equal to the Fund’s annualized expense ratio as indicated above multiplied by the average account value over the period, multiplied by 184/365 to reflect the most recent fiscal half year. |
39 Invesco Floating Rate Fund
Approval of Investment Advisory and Sub-Advisory Contracts
The Board of Trustees (the Board) of AIM Counselor Series Trust (Invesco Counselor Series Trust) is required under the Investment Company Act of 1940, as amended, to approve annually the renewal of Invesco Floating Rate Fund’s (the Fund) investment advisory agreement with Invesco Advisers, Inc. (Invesco Advisers) and the Master Intergroup Sub-Advisory Contract for Mutual Funds (the sub-advisory contracts) with Invesco Asset Management Deutschland GmbH, Invesco Asset Management Limited, Invesco Asset Management (Japan) Limited, Invesco Australia Limited, Invesco Hong Kong Limited, Invesco Senior Secured Management, Inc. and Invesco Canada Ltd. (collectively, the Affiliated Sub-Advisers). During contract renewal meetings held on June 17-19, 2013, the Board as a whole, and the disinterested or “independent” Trustees, who comprise over 75% of the Board, voting separately, approved the continuance of the Fund’s investment advisory agreement and the sub-advisory contracts for another year, effective July 1, 2013. The Board determined that continuation of the Fund’s investment advisory agreement and the sub-advisory contracts are in the best interests of the Fund and its shareholders and the compensation payable to Invesco Advisers and the Affiliated Sub-Advisers under the agreements is fair and reasonable.
The Board’s Fund Evaluation Process
The Board’s Investments Committee has established three Sub-Committees, each of which is primarily responsible for overseeing the management of a number of the funds advised by Invesco Advisers (the Invesco Funds). The Sub-Committees meet throughout the year to review the performance of their assigned Invesco Funds, including reviewing materials prepared under the direction of the independent Senior Officer, an officer of the Invesco Funds who reports directly to the independent Trustees. Over the course of each year, the Sub-Committees meet with portfolio managers for their assigned Invesco Funds and other members of management to review the performance, investment objective(s), policies, strategies, limitations and investment risks of these funds. The Sub-Committees meet regularly and at designated contract renewal meetings each year to conduct a review of the performance, fees, expenses and other matters related to their assigned Invesco Funds. Each Sub-Committee recommends to the Investments Committee, which in turn recommends to the full Board, whether and on what terms to approve the continuance of each Invesco Fund’s investment advisory agreement and sub-advisory contracts for another year.
During the contract renewal process, the Trustees receive comparative performance and fee data regarding the Invesco Funds prepared by Invesco Advisers and Lipper Inc. (Lipper), an independent provider of investment company
data. The Trustees also receive an independent written evaluation from the Senior Officer. The Senior Officer’s evaluation is prepared as part of his responsibility to manage the process by which the Invesco Funds’ proposed management fees are negotiated during the annual contract renewal process to ensure they are negotiated in a manner that is at arms’ length and reasonable. The independent Trustees are assisted in their annual evaluation of the Fund’s investment advisory agreement by the Senior Officer and by independent legal counsel. In addition to meetings with Invesco Advisers and fund counsel, the independent Trustees also discuss the continuance of the investment advisory agreement and sub-advisory contracts in separate sessions with the Senior Officer and with independent legal counsel.
In evaluating the fairness and reasonableness of compensation under the Fund’s investment advisory agreement and sub-advisory contracts, the Board considered, among other things, the factors discussed below. The Trustees recognized that the advisory fee rates for the Invesco Funds are, in many cases, the result of years of review and negotiation between the Trustees and Invesco Advisers as well as advisory fees previously approved by different predecessor boards. The Trustees’ deliberations and conclusions in a particular year may be based in part on their deliberations and conclusions regarding these same arrangements throughout the year and in prior years. The Trustees’ review and conclusions are based on the comprehensive consideration of all information presented to them and are not the result of any single determinative factor. Moreover, one Trustee may have weighed a particular piece of information or factor differently than another Trustee.
The discussion below serves as the Senior Officer’s independent written evaluation with respect to the Fund’s investment advisory agreement as well as a discussion of the material factors and related conclusions that formed the basis for the Board’s approval of the Fund’s investment advisory agreement and sub-advisory contracts. Unless otherwise stated, this information is current as of June 19, 2013, and may not reflect consideration of factors that became known to the Board after that date, including, for example, changes to the Fund’s performance, advisory fees, expense limitations and/or fee waivers.
Factors and Conclusions and Summary of Independent Written Fee Evaluation
| A. | Nature, Extent and Quality of Services Provided by Invesco Advisers and the Affiliated Sub-Advisers |
The Board reviewed the advisory services provided to the Fund by Invesco Advisers under the Fund’s investment advisory agreement, the performance of Invesco Advisers in providing these services, and the credentials and
experience of the officers and employees of Invesco Advisers who provide these services, including the Fund’s portfolio manager or managers, with whom the Sub-Committees met during the year. The Board’s review of the qualifications of Invesco Advisers to provide advisory services included the Board’s consideration of Invesco Advisers’ investment process oversight, independent credit analysis and investment risk management.
In determining whether to continue the Fund’s investment advisory agreement, the Board considered the benefits of reapproving an existing relationship and the greater uncertainty that may be associated with entering into a new relationship. The Board also considered non-advisory services that Invesco Advisers and its affiliates provide to the Invesco Funds such as various back office support functions, equity and fixed income trading operations, internal audit, distribution and legal and compliance. The Board concluded that the nature, extent and quality of the services provided to the Fund by Invesco Advisers are appropriate and satisfactory and consistent with the terms of the Fund’s investment advisory agreement.
The Board reviewed the services provided by the Affiliated Sub-Advisers under the sub-advisory contracts and the credentials and experience of the officers and employees of the Affiliated Sub-Advisers who provide these services. The Board noted that the Affiliated Sub-Advisers have offices and personnel that are located in financial centers around the world. As a result, the Affiliated Sub-Advisers can provide research and investment analysis on the markets and economies of various countries in which the Fund may invest, make recommendations regarding securities and assist with security trades. The Board concluded that the sub-advisory contracts benefit the Fund and its shareholders by permitting Invesco Advisers to use the resources and talents of the Affiliated Sub-Advisers in managing the Fund. The Board concluded that the nature, extent and quality of the services provided by the Affiliated Sub-Advisers are appropriate and satisfactory and consistent with the terms of the Fund’s sub-advisory contracts.
| B. | Fund Performance |
The Board considered Fund performance as a relevant factor in considering whether to approve the investment advisory agreement as well as the sub-advisory contracts for the Fund, as Invesco Senior Secured Management, Inc. currently manages assets of the Fund.
The Board compared the Fund’s performance during the past one, three and five calendar years to the performance of funds in the Lipper performance universe and against the Lipper Loan Participation Funds Index. The Board noted that performance of Class A shares of the Fund was in the second quintile of its performance universe for the one year period, the first
40 Invesco Floating Rate Fund
quintile for the three year period and the fourth quintile for the five year period (the first quintile being the best performing funds and the fifth quintile being the worst performing funds). The Board noted that performance of Class A shares of the Fund was above the performance of the Index for the one, three and five year periods. The Trustees also reviewed more recent Fund performance and this review did not change their conclusions.
| C. | Advisory and Sub-Advisory Fees |
The Board compared the Fund’s contractual management fee rate to the contractual management fee rates of funds in the Fund’s Lipper expense group at a common asset level. The Board noted that the contractual management fee rate for Class A shares of the Fund was below the median contractual management fee rate of funds in its expense group. The Board noted that the term “contractual management fee” may include both advisory and certain administrative services fees and that Invesco Advisers does not charge the Invesco Funds for the administrative services included in the term as defined by Lipper. The Board also reviewed the methodology used by Lipper in providing expense group information, which includes using each fund’s contractual management fee schedule (including any applicable breakpoints) as reported in the most recent prospectus or statement of additional information for each fund in the expense group.
The Board also compared the Fund’s effective advisory fee rate (the advisory fee rate after advisory fee waivers and before other expense limitations/waivers) to the effective advisory fee rates of other funds advised by Invesco Advisers and its affiliates with investment strategies comparable to those of the Fund. The Board noted that Invesco Advisers advises or sub-advises one closed-end fund and three off-shore funds with comparable investment strategies, two of which had higher effective advisory fee rates than the Fund.
The Board also considered the fees charged by Invesco Advisers and the Affiliated Sub-Advisers to other client accounts with investment strategies comparable to those of the Fund. The Board noted that Invesco Advisers or the Affiliated Sub-Advisers may charge lower fees to large institutional clients. Invesco Advisers reviewed with the Board the significantly greater scope of services it provides to the Invesco Funds relative to certain other client accounts. These additional services include provision of administrative services, officers and office space, oversight of service providers, preparation of annual registration statement updates and financial information and regulatory compliance under the Investment Company Act of 1940, as amended. Invesco Advisers also reviewed generally the higher frequency of shareholder purchases and redemptions in the Invesco Funds relative to the flow of assets for other client accounts. Invesco Advisers advised the Board that advance notice of redemptions is often provided to Invesco
Advisers by institutional clients. The Board did note that sub-advisory fee rates charged by the Affiliated Sub-Advisers to manage the Invesco Funds and to manage other client accounts tended to be more comparable, reflecting a more comparable scope of services. The Board concluded that the aggregate services provided to the Invesco Funds were sufficiently different from those provided to institutional clients, and the Board did not place significant weight on these fee comparisons.
The Board also considered the services provided by the Affiliated Sub-Advisers pursuant to the sub-advisory contracts, as well as the fees payable by Invesco Advisers to the Affiliated Sub-Advisers pursuant to the sub-advisory contracts. The Board noted that Invesco Advisers retains overall responsibility for, and provides services to, sub-advised Invesco Funds, including oversight of the Affiliated Sub-Advisers as well as the additional services described herein other than day-to-day portfolio management. The Board also noted that the sub-advisory fees are not paid directly by the Fund, but rather, are payable by Invesco Advisers to the Affiliated Sub-Advisers.
Based upon the information and considerations described above, the Board concluded that the compensation payable to Invesco Advisers and the Affiliated Sub-Advisers is fair and reasonable.
| D. | Economies of Scale and Breakpoints |
The Board considered the extent to which there are economies of scale in the provision of advisory services to the Fund. The Board also considered whether the Fund benefits from economies of scale through contractual breakpoints in the Fund’s advisory fee schedule and was assisted in this review by a report from the Senior Officer. The Board also noted that the Fund shares directly in economies of scale through lower fees charged by third party service providers based on the combined size of the Invesco Funds and other clients advised by Invesco Advisers.
| E. | Profitability and Financial Resources |
The Board reviewed information from Invesco Advisers concerning the costs of the advisory and other services that Invesco Advisers and its affiliates provide to the Fund and the profitability of Invesco Advisers and its affiliates in providing these services for the year ended December 31, 2012. The Board received information from Invesco Advisers about the methodology used to prepare the profitability information. The Board considered the profitability of Invesco Advisers in managing the Fund and the Invesco Funds. The Board noted that Invesco Advisers continues to operate at a net profit from services Invesco Advisers and its subsidiaries provide to the Invesco Funds and the Fund. The Board did not deem the level of profits realized by Invesco Advisers and its affiliates from providing services to the Fund to be excessive given the nature, quality and extent of the services provided to the Invesco Funds. The Board received and accepted information from Invesco Advisers
demonstrating that Invesco Advisers and each Affiliated Sub-Adviser are financially sound and have the resources necessary to perform their obligations under the investment advisory agreement and sub-advisory contracts.
| F. | Collateral Benefits to Invesco Advisers and its Affiliates |
The Board considered various other benefits received by Invesco Advisers and its affiliates from the relationship with the Fund, including the fees received for their provision of transfer agency and distribution services to the Fund. The Board considered comparative information regarding fees charged for these services, including information provided by Lipper and other independent sources. The Board considered the performance of Invesco Advisers and its affiliates in providing these services and the organizational structure employed to provide these services. The Board also considered that these services are provided to the Fund pursuant to written contracts that are reviewed and approved on an annual basis by the Board; that the services are required for the operation of the Fund; that Invesco Advisers and its affiliates can provide services, the nature and quality of which are at least equal to those provided by others offering the same or similar services; and that the fees for such services are fair and reasonable in light of the usual and customary charges by others for services of the same nature and quality.
The Board considered the benefits realized by Invesco Advisers and the Affiliated Sub-Advisers as a result of portfolio brokerage transactions executed through “soft dollar” arrangements. Invesco Advisers noted that the Fund does not execute brokerage transactions through “soft dollar” arrangements to any significant degree.
The Board considered that the Fund’s uninvested cash and cash collateral from any securities lending arrangements may be invested in money market funds advised by Invesco Advisers pursuant to procedures approved by the Board. The Board noted that Invesco Advisers receives advisory fees from these affiliated money market funds attributable to such investments, although Invesco Advisers has contractually agreed to waive through varying periods the advisory fees payable by the Invesco Funds. The waiver is in an amount equal to 100% of the net advisory fee Invesco Advisers receives from the affiliated money market funds with respect to the Fund’s investment in the affiliated money market funds of uninvested cash, but not cash collateral. The Board concluded that the Fund’s investment of uninvested cash and cash collateral from any securities lending arrangements in the affiliated money market funds is in the best interests of the Fund and its shareholders.
41 Invesco Floating Rate Fund
Tax Information
Form 1099-DIV, Form 1042-S and other year–end tax information provide shareholders with actual calendar year amounts that should be included in their tax returns. Shareholders should consult their tax advisors.
The following distribution information is being provided as required by the Internal Revenue Code or to meet a specific state’s requirement.
The Fund designates the following amounts or, if subsequently determined to be different, the maximum amount allowable for its fiscal year ended August 31, 2013:
Federal and State Income Tax | ||||
Qualified Dividend Income* | 1.96 | % | ||
Corporate Dividends Received Deduction* | 1.95 | % | ||
| * | The above percentages are based on ordinary income dividends paid to shareholders during the Fund’s fiscal year. |
42 Invesco Floating Rate Fund
Trustees and Officers
The address of each trustee and officer is AIM Counselor Series Trust (Invesco Counselor Series Trust) (the “Trust”), 11 Greenway Plaza, Suite 1000, Houston, Texas 77046-1173. The trustees serve for the life of the Trust, subject to their earlier death, incapacitation, resignation, retirement or removal as more specifically provided in the Trust’s organizational documents. Each officer serves for a one year term or until their successors are elected and qualified. Column two below includes length of time served with predecessor entities, if any.
Name, Year of Birth and Position(s) Held with the Trust | Trustee and/ or Officer Since | Principal Occupation(s) During Past 5 Years | Number of Funds in Fund Complex Overseen by Trustee | Other Directorship(s) Held by Trustee During Past 5 Years | ||||
| Interested Persons | ||||||||
| Martin L. Flanagan1 — 1960 Trustee | 2007 | Executive Director, Chief Executive Officer and President, Invesco Ltd. (ultimate parent of Invesco and a global investment management firm); Advisor to the Board, Invesco Advisers, Inc. (formerly known as Invesco Institutional (N.A.), Inc.); Trustee, The Invesco Funds; Vice Chair, Investment Company Institute; and Member of Executive Board, SMU Cox School of Business
Formerly: Chairman and Chief Executive Officer, Invesco Advisers, Inc. (registered investment adviser); Director, Chairman, Chief Executive Officer and President, IVZ Inc. (holding company), INVESCO Group Services, Inc. (service provider) and Invesco North American Holdings, Inc. (holding company); Director, Chief Executive Officer and President, Invesco Holding Company Limited (parent of Invesco and a global investment management firm); Director, Invesco Ltd.; Chairman, Investment Company Institute and President, Co-Chief Executive Officer, Co-President, Chief Operating Officer and Chief Financial Officer, Franklin Resources, Inc. (global investment management organization) | 117 | None | ||||
| Philip A. Taylor2 — 1954 Trustee, President and Principal Executive Officer | 2006 | Head of North American Retail and Senior Managing Director, Invesco Ltd.; Director, Co-Chairman, Co-President and Co-Chief Executive Officer, Invesco Advisers, Inc. (formerly known as Invesco Institutional (N.A.), Inc.) (registered investment adviser); Director, Chairman, Chief Executive Officer and President, Invesco Management Group, Inc. (formerly known as Invesco Aim Management Group, Inc.) (financial services holding company); Director and President, INVESCO Funds Group, Inc. (registered investment adviser and registered transfer agent); Director and Chairman, Invesco Investment Services, Inc. (formerly known as Invesco Aim Investment Services, Inc.) (registered transfer agent) and IVZ Distributors, Inc. (formerly known as INVESCO Distributors, Inc.) (registered broker dealer); Director, President and Chairman, Invesco Inc. (holding company) and Invesco Canada Holdings Inc. (holding company); Chief Executive Officer, Invesco Corporate Class Inc. (corporate mutual fund company) and Invesco Canada Fund Inc. (corporate mutual fund company); Director, Chairman and Chief Executive Officer, Invesco Canada Ltd. (formerly known as Invesco Trimark Ltd./Invesco Trimark Ltèe) (registered investment adviser and registered transfer agent); Trustee, President and Principal Executive Officer, The Invesco Funds (other than AIM Treasurer’s Series Trust (Invesco Treasurer’s Series Trust) and Short-Term Investments Trust); Trustee and Executive Vice President, The Invesco Funds (AIM Treasurer’s Series Trust (Invesco Treasurer’s Series Trust) and Short-Term Investments Trust only); Director, Invesco Investment Advisers LLC (formerly known as Van Kampen Asset Management); Director, Chief Executive Officer and President, Van Kampen Exchange Corp.
Formerly: Director and Chairman, Van Kampen Investor Services Inc.: Director, Chief Executive Officer and President, 1371 Preferred Inc. (holding company); and Van Kampen Investments Inc.; Director and President, AIM GP Canada Inc. (general partner for limited partnerships); and Van Kampen Advisors, Inc.; Director and Chief Executive Officer, Invesco Trimark Dealer Inc. (registered broker dealer); Director, Invesco Distributors, Inc. (formerly known as Invesco Aim Distributors, Inc.) (registered broker dealer); Manager, Invesco PowerShares Capital Management LLC; Director, Chief Executive Officer and President, Invesco Advisers, Inc.; Director, Chairman, Chief Executive Officer and President, Invesco Aim Capital Management, Inc.; President, Invesco Trimark Dealer Inc. and Invesco Trimark Ltd./Invesco Trimark Ltèe; Director and President, AIM Trimark Corporate Class Inc. and AIM Trimark Canada Fund Inc.; Senior Managing Director, Invesco Holding Company Limited; Trustee and Executive Vice President, Tax-Free Investments Trust; Director and Chairman, Fund Management Company (former registered broker dealer); President and Principal Executive Officer, The Invesco Funds (AIM Treasurer’s Series Trust (Invesco Treasurer’s Series Trust), Short-Term Investments Trust and Tax-Free Investments Trust only); President, AIM Trimark Global Fund Inc. and AIM Trimark Canada Fund Inc. | 117 | None | ||||
Wayne W. Whalen3 — 1939 Trustee | 2010 | Of Counsel, and prior to 2010, partner in the law firm of Skadden, Arps, Slate, Meagher & Flom LLP, legal counsel to certain funds in the Fund Complex
| 130 | Director of the Mutual Fund Directors Forum, a nonprofit membership organization for investment directors; Chairman and Director of the Abraham Lincoln Presidential Library Foundation; and Director of the Stevenson Center for Democracy |
| 1 | Mr. Flanagan is considered an interested person of the Trust because he is an officer of the adviser to the Trust, and an officer and a director of Invesco Ltd., ultimate parent of the adviser to the Trust. |
| 2 | Mr. Taylor is considered an interested person of the Trust because he is an officer and a director of the adviser to, and a director of the principal underwriter of, the Trust. |
| 3 | Mr. Whalen is considered an “interested person” (within the meaning of Section 2(a)(19) of the 1940 Act) of certain Funds in the Invesco Fund Complex because he and his firm currently provide legal services as legal counsel to such Funds. |
T-1 Invesco Floating Rate Fund
Trustees and Officers—(continued)
Name, Year of Birth and Position(s) Held with the Trust | Trustee and/ or Officer Since | Principal Occupation(s) During Past 5 Years | Number of Funds in Fund Complex Overseen by Trustee | Other Directorship(s) Held by Trustee During Past 5 Years | ||||
| Independent Trustees | ||||||||
Bruce L. Crockett — 1944 Trustee and Chair | 2003 | Chairman, Crockett Technologies Associates (technology consulting company)
Formerly: Director, Captaris (unified messaging provider); Director, President and Chief Executive Officer COMSAT Corporation; and Chairman, Board of Governors of INTELSAT (international communications company) | 117 | ACE Limited (insurance company); Investment Company Institute | ||||
David C. Arch — 1945 Trustee | 2010 | Chairman and Chief Executive Officer of Blistex Inc., (consumer health care products manufacturer)
Formerly: Member of the Heartland Alliance Advisory Board, a nonprofit organization serving human needs based in Chicago | 130 | Board member of the Illinois Manufacturers’ Association; Member of the Board of Visitors, Institute for the Humanities, University of Michigan | ||||
Frank S. Bayley — 1939 Trustee | 2003 | Retired
Formerly: Director, Badgley Funds, Inc. (registered investment company) (2 portfolios) and General Partner and Of Counsel, law firm of Baker & McKenzie, LLP | 117 | Director and Chairman, C.D. Stimson Company (a real estate investment company); Trustee and Overseer, The Curtis Institute of Music | ||||
James T. Bunch — 1942 Trustee | 2000 | Managing Member, Grumman Hill Group LLC (family office private equity management)
Formerly: Founder, Green, Manning & Bunch Ltd. (investment banking firm)(1988-2010); Executive Committee, United States Golf Association; and Director, Policy Studies, Inc. and Van Gilder Insurance Corporation | 117 | Chairman, Board of Governors, Western Golf Association; Chairman-elect, Evans Scholars Foundation; and Director, Denver Film Society | ||||
Rodney F. Dammeyer — 1940 Trustee | 2010 | Chairman of CAC, LLC, (private company offering capital investment and management advisory services)
Formerly: Prior to 2001, Managing Partner at Equity Group Corporate Investments; Prior to 1995, Chief Executive Officer of Itel Corporation (formerly Anixter International); Prior to 1985, experience includes Senior Vice President and Chief Financial Officer of Household International, Inc., Executive Vice President and Chief Financial Officer of Northwest Industries, Inc. and Partner of Arthur Andersen & Co.; From 1987 to 2010, Director/Trustee of investment companies in the Van Kampen Funds complex | 117 | Director of Quidel Corporation and Stericycle, Inc.; Prior to May 2008, Trustee of The Scripps Research Institute; Prior to February 2008, Director of Ventana Medical Systems, Inc. | ||||
Albert R. Dowden — 1941 Trustee | 2003 | Director of a number of public and private business corporations, including the Boss Group, Ltd. (private investment and management); Reich & Tang Funds (5 portfolios) (registered investment company); and Homeowners of America Holding Corporation/ Homeowners of America Insurance Company (property casualty company)
Formerly: Director, Continental Energy Services, LLC (oil and gas pipeline service); Director, CompuDyne Corporation (provider of product and services to the public security market) and Director, Annuity and Life Re (Holdings), Ltd. (reinsurance company); Director, President and Chief Executive Officer, Volvo Group North America, Inc.; Senior Vice President, AB Volvo; Director of various public and private corporations; Chairman, DHJ Media, Inc.; Director Magellan Insurance Company; and Director, The Hertz Corporation, Genmar Corporation (boat manufacturer), National Media Corporation; Advisory Board of Rotary Power International (designer, manufacturer, and seller of rotary power engines); and Chairman, Cortland Trust, Inc. (registered investment company) | 117 | Director of Nature’s Sunshine Products, Inc. | ||||
Jack M. Fields — 1952 Trustee | 2003 | Chief Executive Officer, Twenty First Century Group, Inc. (government affairs company); Owner and Chief Executive Officer, Dos Angeles Ranch, L.P. (cattle, hunting, corporate entertainment); and Discovery Global Education Fund (non-profit)
Formerly: Chief Executive Officer, Texana Timber LP (sustainable forestry company); Director of Cross Timbers Quail Research Ranch (non-profit); and member of the U.S. House of Representatives | 117 | Insperity, Inc. (formerly known as Administaff) | ||||
Prema Mathai-Davis — 1950 Trustee | 2003 | Retired
Formerly: Chief Executive Officer, YWCA of the U.S.A. | 117 | None | ||||
Larry Soll — 1942 Trustee | 1997 | Retired
Formerly: Chairman, Chief Executive Officer and President, Synergen Corp. (a biotechnology company) | 117 | None | ||||
Hugo F. Sonnenschein — 1940 Trustee | 2010 | Distinguished Service Professor and President Emeritus of the University of Chicago and the Adam Smith Distinguished Service Professor in the Department of Economics at the University of Chicago
Formerly: President of the University of Chicago | 130 | Trustee of the University of Rochester and a member of its investment committee. Member of the National Academy of Sciences, the American Philosophical Society and a fellow of the American Academy of Arts and Sciences |
T-2 Invesco Floating Rate Fund
Trustees and Officers—(continued)
Name, Year of Birth and Position(s) Held with the Trust | Trustee and/ or Officer Since | Principal Occupation(s) During Past 5 Years | Number of Funds in Fund Complex Overseen by Trustee | Other Directorship(s) Held by Trustee During Past 5 Years | ||||
| Independent Trustees—(continued) | ||||||||
Raymond Stickel, Jr. — 1944 Trustee | 2005 | Retired
Formerly: Director, Mainstay VP Series Funds, Inc. (25 portfolios) and Partner, Deloitte & Touche | 117 | None | ||||
| Other Officers | ||||||||
| Russell C. Burk — 1958 Senior Vice President and Senior Officer | 2005 | Senior Vice President and Senior Officer, The Invesco Funds | N/A | N/A | ||||
| John M. Zerr — 1962 Senior Vice President, Chief Legal Officer and Secretary | 2006 | Director, Senior Vice President, Secretary and General Counsel, Invesco Management Group, Inc. (formerly known as Invesco Aim Management Group, Inc.) and Van Kampen Exchange Corp.; Senior Vice President, Invesco Advisers, Inc. (formerly known as Invesco Institutional (N.A.), Inc.) (registered investment adviser); Senior Vice President and Secretary, Invesco Distributors, Inc. (formerly known as Invesco Aim Distributors, Inc.); Director, Vice President and Secretary, Invesco Investment Services, Inc. (formerly known as Invesco Aim Investment Services, Inc.) and IVZ Distributors, Inc. (formerly known as INVESCO Distributors, Inc.); Director and Vice President, INVESCO Funds Group, Inc.; Senior Vice President, Chief Legal Officer and Secretary, The Invesco Funds; Manager, Invesco PowerShares Capital Management LLC; Director, Secretary and General Counsel, Invesco Investment Advisers LLC (formerly known as Van Kampen Asset Management); Secretary and General Counsel, Invesco Capital Markets, Inc. (formerly known as Van Kampen Funds Inc.) and Chief Legal Officer, PowerShares Exchange-Traded Fund Trust, PowerShares Exchange-Traded Fund Trust II, PowerShares India Exchange-Traded Fund Trust and PowerShares Actively Managed Exchange-Traded Fund Trust
Formerly: Director and Vice President, Van Kampen Advisors Inc.; Director, Vice President, Secretary and General Counsel, Van Kampen Investor Services Inc.; Director, Invesco Distributors, Inc. (formerly known as Invesco Aim Distributors, Inc.); Director, Senior Vice President, General Counsel and Secretary, Invesco Aim Advisers, Inc. and Van Kampen Investments Inc.; Director, Vice President and Secretary, Fund Management Company; Director, Senior Vice President, Secretary, General Counsel and Vice President, Invesco Aim Capital Management, Inc.; Chief Operating Officer and General Counsel, Liberty Ridge Capital, Inc. (an investment adviser); Vice President and Secretary, PBHG Funds (an investment company) and PBHG Insurance Series Fund (an investment company); Chief Operating Officer, General Counsel and Secretary, Old Mutual Investment Partners (a broker-dealer); General Counsel and Secretary, Old Mutual Fund Services (an administrator) and Old Mutual Shareholder Services (a shareholder servicing center); Executive Vice President, General Counsel and Secretary, Old Mutual Capital, Inc. (an investment adviser); and Vice President and Secretary, Old Mutual Advisors Funds (an investment company) | N/A | N/A | ||||
| Karen Dunn Kelley — 1960 Vice President | 2003 | Head of Invesco’s World Wide Fixed Income and Cash Management Group; Director, Co-President, Co-Chief Executive Officer, and Co-Chairman, Invesco Advisers, Inc. (formerly known as Invesco Institutional (N.A.), Inc.) (registered investment adviser); Chairman, Invesco Senior Secured Management, Inc.; Senior Vice President, Invesco Management Group, Inc. (formerly known as Invesco Aim Management Group, Inc.); Executive Vice President, Invesco Distributors, Inc. (formerly known as Invesco Aim Distributors, Inc.); Director, Invesco Mortgage Capital Inc., and Invesco Management Company Limited; Director and President, INVESCO Asset Management (Bermuda) Ltd., Vice President, The Invesco Funds (other than AIM Treasurer’s Series Trust (Invesco Treasurer’s Series Trust) and Short-Term Investments Trust); and President and Principal Executive Officer, The Invesco Funds (AIM Treasurer’s Series Trust (Invesco Treasurer’s Series Trust) and Short-Term Investments Trust only)
Formerly: Director, INVESCO Global Asset Management Limited and INVESCO Management S.A.; Senior Vice President, Van Kampen Investments Inc. and Invesco Advisers, Inc. (formerly known as Invesco Institutional (N.A.), Inc.) (registered investment adviser); Vice President, Invesco Advisers, Inc. (formerly known as Invesco Institutional (N.A.), Inc.); Director of Cash Management and Senior Vice President, Invesco Advisers, Inc. and Invesco Aim Capital Management, Inc.; President and Principal Executive Officer, Tax-Free Investments Trust; Director and President, Fund Management Company; Chief Cash Management Officer, Director of Cash Management, Senior Vice President, and Managing Director, Invesco Aim Capital Management, Inc.; Director of Cash Management, Senior Vice President, and Vice President, Invesco Advisers, Inc. and The Invesco Funds (AIM Treasurer’s Series Trust (Invesco Treasurer’s Series Trust), Short-Term Investments Trust and Tax-Free Investments Trust only) | N/A | N/A | ||||
T-3 Invesco Floating Rate Fund
Trustees and Officers—(continued)
Name, Year of Birth and Position(s) Held with the Trust | Trustee and/ or Officer Since | Principal Occupation(s) During Past 5 Years | Number of Funds in Fund Complex Overseen by Trustee | Other Directorship(s) Held by Trustee During Past 5 Years | ||||
| Other Officers—(continued) | ||||||||
| Sheri Morris — 1964 Vice President, Treasurer and Principal Financial Officer | 2003 | Vice President, Treasurer and Principal Financial Officer, The Invesco Funds; Vice President, Invesco Advisers, Inc. (formerly known as Invesco Institutional (N.A.), Inc.) (registered investment adviser); and Vice President, PowerShares Exchange-Traded Fund Trust, PowerShares Exchange-Traded Fund Trust II, PowerShares India Exchange-Traded Fund Trust and PowerShares Actively Managed Exchange-Traded Fund Trust
Formerly: Vice President, Invesco Aim Advisers, Inc., Invesco Aim Capital Management, Inc. and Invesco Aim Private Asset Management, Inc.; Assistant Vice President and Assistant Treasurer, The Invesco Funds and Assistant Vice President, Invesco Advisers, Inc., Invesco Aim Capital Management, Inc. and Invesco Aim Private Asset Management, Inc.; and Treasurer, PowerShares Exchange-Traded Fund Trust, PowerShares Exchange-Traded Fund Trust II, PowerShares India Exchange-Traded Fund Trust and PowerShares Actively Managed Exchange-Traded Fund Trust | N/A | N/A | ||||
Crissie M. Wisdom — 1969 Anti-Money Laundering Compliance Officer | 2013 | Anti-Money Laundering Compliance Officer, Invesco Advisers, Inc. (formerly known as Invesco Institutional (N.A.), Inc.) (registered investment adviser), Invesco Capital Markets, Inc. (formerly known as Van Kampen Funds Inc.), Invesco Distributors, Inc., Invesco Investment Services, Inc., Invesco Management Group, Inc., Van Kampen Exchange Corp., The Invesco Funds, Invesco Funds (Chicago), and PowerShares Exchange-Traded Fund Trust, PowerShares Exchange-Traded Fund Trust II, PowerShares India Exchange-Traded Fund Trust, and PowerShares Actively Managed Exchange-Traded Fund Trust; and Fraud Prevention Manager and Controls and Risk Analysis Manager for Invesco Investment Services, Inc. | N/A | N/A | ||||
| Todd L. Spillane — 1958 Chief Compliance Officer | 2006 | Senior Vice President, Invesco Management Group, Inc. (formerly known as Invesco Aim Management Group, Inc.) and Van Kampen Exchange Corp.; Senior Vice President and Chief Compliance Officer, Invesco Advisers, Inc. (registered investment adviser) (formerly known as Invesco Institutional (N.A.), Inc.); Chief Compliance Officer, The Invesco Funds; Vice President, Invesco Distributors, Inc. (formerly known as Invesco Aim Distributors, Inc.) and Invesco Investment Services, Inc. (formerly known as Invesco Aim Investment Services, Inc.)
Formerly: Chief Compliance Officer, Invesco Funds (Chicago); Senior Vice President, Van Kampen Investments Inc.; Senior Vice President and Chief Compliance Officer, Invesco Aim Advisers, Inc. and Invesco Aim Capital Management, Inc.; Chief Compliance Officer, INVESCO Private Capital Investments, Inc. (holding company), Invesco Private Capital, Inc. (registered investment adviser), Invesco Global Asset Management (N.A.), Inc., Invesco Senior Secured Management, Inc. (registered investment adviser), Van Kampen Investor Services Inc., PowerShares Exchange-Traded Fund Trust, PowerShares Exchange-Traded Fund Trust II, PowerShares India Exchange-Traded Fund Trust and PowerShares Actively Managed Exchange-Traded Fund Trust; and Vice President, Invesco Aim Capital Management, Inc. and Fund Management Company | N/A | N/A |
The Statement of Additional Information of the Trust includes additional information about the Fund’s Trustees and is available upon request, without charge, by calling 1.800.959.4246. Please refer to the Fund’s prospectus for information on the Fund’s sub-advisers.
Office of the Fund 11 Greenway Plaza, Suite 1000 Houston, TX 77046-1173 | Investment Adviser Invesco Advisers, Inc. 1555 Peachtree Street, N.E. Atlanta, GA 30309 | Distributor Invesco Distributors, Inc. 11 Greenway Plaza, Suite 1000 Houston, TX 77046-1173 | Auditors PricewaterhouseCoopers LLP 1201 Louisiana Street, Suite 2900 Houston, TX 77002-5678 | |||
Counsel to the Fund Stradley Ronon Stevens & Young, LLP 2005 Market Street, Suite 2600 Philadelphia, PA 19103-7018 | Counsel to the Independent Trustees Goodwin Procter LLP 901 New York Avenue, N.W. Washington, D.C. 20001 | Transfer Agent Invesco Investment Services, Inc. 11 Greenway Plaza, Suite 1000 Houston, TX 77046-1173 | Custodian State Street Bank and Trust Company 225 Franklin Street Boston, MA 02110-2801 | |||
T-4 Invesco Floating Rate Fund

Invesco mailing information
Send general correspondence to Invesco Investment Services, Inc., P.O. Box 219078, Kansas City, MO 64121-9078.
Invesco privacy policy
You share personal and financial information with us that is necessary for your transactions and your account records. We take very seriously the obligation to keep that information confidential and private.
Invesco collects nonpublic personal information about you from account applications or other forms you complete and from your transactions with us or our affiliates. We do not disclose information about you or our former customers to service providers or other third parties except to the extent necessary to service your account and in other limited circumstances as permitted by law. For example, we use this information to facilitate the delivery of transaction confirmations, financial reports, prospectuses and tax forms.
Even within Invesco, only people involved in the servicing of your accounts and compliance monitoring have access to your information. To ensure the highest level of confidentiality and security, Invesco maintains physical, electronic and procedural safeguards that meet or exceed federal standards. Special measures, such as data encryption and authentication, apply to your communications with us on our website. More detail is available to you at invesco.com/privacy.
Important notice regarding delivery of security holder documents
To reduce Fund expenses, only one copy of most shareholder documents may be mailed to shareholders with multiple accounts at the same address (Householding). Mailing of your shareholder documents may be householded indefinitely unless you instruct us otherwise. If you do not want the mailing of these documents to be combined with those for other members of your household, please contact Invesco Investment Services, Inc. at 800 959 4246 or contact your financial institution. We will begin sending you individual copies for each account within 30 days after receiving your request.
Fund holdings and proxy voting information
The Fund provides a complete list of its holdings four times in each fiscal year, at the quarter ends. For the second and fourth quarters, the lists appear in the Fund’s semiannual and annual reports to shareholders. For the first and third quarters, the Fund files the lists with the Securities and Exchange Commission (SEC) on Form N-Q. The most recent list of portfolio holdings is available at invesco.com/completeqtrholdings. Shareholders can also look up the Fund’s Forms N-Q on the SEC website at sec.gov. Copies of the Fund’s Forms N-Q may be reviewed and copied at the SEC Public Reference Room in Washington, D.C. You can obtain information on the operation of the Public Reference Room, including information about duplicating fee charges, by calling 202 551 8090 or 800 732 0330, or by electronic request at the following email address: publicinfo@sec.gov. The SEC file numbers for the Fund are shown below.
A description of the policies and procedures that the Fund uses to determine how to vote proxies relating to portfolio securities is available without charge, upon request, from our Client Services department at 800 959 4246 or at invesco.com/proxyguidelines. The information is also available on the SEC website, sec.gov.
Information regarding how the Fund voted proxies related to its portfolio securities during the most recent 12-month period ended June 30 is available at invesco.com/proxysearch. The information is also available on the SEC website, sec.gov. Invesco Advisers, Inc. is an investment adviser; it provides investment advisory services to individual and institutional clients and does not sell securities. Invesco Distributors, Inc. is the US distributor for Invesco Ltd.’s retail mutual funds, exchange-traded funds and institutional money market funds. Both are wholly owned, indirect subsidiaries of Invesco Ltd. |  | |
| SEC file numbers: 811-09913 and 333-36074 FLR-AR-1 Invesco Distributors, Inc. | ||
|
| |||
| Annual Report to Shareholders | August 31, 2013 | |||
| ||||
| Invesco Global Real Estate Income Fund | ||||
Nasdaq: A: ASRAX ¡ B: SARBX ¡ C: ASRCX ¡ Y: ASRYX ¡ R5: ASRIX ¡ R6: ASRFX | ||||


Letters to Shareholders
Phillip Taylor | Dear Shareholders: Enclosed in this annual report, you’ll find information about your Fund and the factors that affected its performance during the reporting period. Inside, you’ll also find a discussion from your portfolio managers about how they managed your Fund, as well as performance data for your Fund, a complete list of your Fund’s investments as of the close of the reporting period and other important information. I hope you find this report of interest. During the reporting period covered by this report, major US equity indexes made multiyear or even all-time highs.1 Economic data were generally positive; housing and consumer spending data were particularly encouraging. Nonetheless, economic uncertainty and concern about continuing political and budget gridlock in Washington persisted. The US | ||||||||

Federal Reserve’s deliberate vagueness about when, and to what degree, it might begin to curtail its extraordinarily accommodative monetary policies – together with uncertainty about who will next lead the central bank – affected fixed income and equity markets alike. Most developed, non-US stock markets remained positive for the first half of 2013, despite a difficult second quarter.
Periods of market volatility and economic uncertainty can weaken the will of even the most resolute investor. That’s why Invesco believes it’s often helpful to work with a skilled and trusted financial adviser who can emphasize the importance of adhering to an investment plan designed to achieve long-term goals rather than being sidetracked by short-term uncertainty that can result in inaction. A financial adviser who is familiar with your individual financial situation, investment goals and risk tolerance can be an invaluable partner as you work toward your financial goals. He or she can provide insight and perspective when markets are volatile; encouragement and reassurance when times are uncertain; and advice and guidance when your financial situation or investment goals change.
Our website, invesco.com/us, is another source of timely insight and information for investors. On the website, you’ll find fund-specific as well as more general information from many of Invesco’s investment professionals. You’ll find in-depth articles, video clips and audio commentaries – and, of course, you also can access information about your Invesco account whenever it’s convenient for you.
What we mean by Intentional Investing
At Invesco, all of our people and all of our resources are dedicated to helping investors achieve their financial objectives. It’s a philosophy we call Intentional Investing, and it guides the way we:
| n | Manage investments – Our dedicated investment professionals search the world for the best opportunities, and each investment team follows a clear, disciplined process to build portfolios and mitigate risk. |
| n | Provide choices – We offer multiple investment strategies, allowing you and your financial adviser to build a portfolio that’s purpose-built for your needs. |
| n | Connect with you – We’re committed to giving you the expert insights you need to make informed investing decisions, and we are well-equipped to provide high-quality support for investors and advisers. |
At Invesco, we believe in putting investors first. That’s why investment management is all we do. Our sole focus on managing your money allows you and your financial adviser to build a portfolio of Invesco funds appropriate for your investment needs and goals today and when your circumstances change.
Have questions?
For questions about your account, feel free to contact an Invesco client services representative at 800 959 4246. For Invesco-related questions or comments, please email me directly at phil@invesco.com.
All of us at Invesco look forward to serving your investment management needs for many years to come. Thank you for investing with us.
Sincerely,

Philip Taylor
Senior Managing Director, Invesco Ltd.
| 1 | Source: Reuters |
2 Invesco Global Real Estate Income Fund
Bruce Crockett | Dear Fellow Shareholders: The Invesco Funds Board has worked on a variety of issues over the last several months, and I’d like to take this opportunity to discuss two that affect you and our fellow fund shareholders. The first issue on which your Board has been working is our annual review of the funds’ advisory and sub-advisory contracts with Invesco Advisers and its affiliates. This annual review, which is required by the Investment Company Act of 1940, focuses on the nature and quality of the services Invesco provides as adviser to the Invesco Funds and the reasonableness of the fees that it charges for those services. Each year, we spend months reviewing detailed information that we request from Invesco that allows us to evaluate its services and fees. We also use information from many independent sources, including materials provided by the independent Senior Officer of the Invesco Funds, who reports directly to the independent Trustees on the Board. Additionally, we meet with independent legal counsel and | ||||||||

review performance and fee data prepared by Lipper Inc., an independent, third-party firm widely recognized as a leader in its field.
I’m pleased to report that the Board determined in June that renewing the investment advisory agreement and the sub-advisory contracts with Invesco Advisers and its affiliates would serve the best interests of each fund and its shareholders.
The second area of focus to highlight is the Board’s efforts to ensure that we provide a lineup of funds that allow financial advisers to build portfolios that meet shareholders’ changing financial needs and goals. Today, more and more investors are reaching, or approaching, retirement. But interest rates remain low, making it difficult for many investors to generate the income they need, or will soon need, in their retirement years.
The members of your Board think about these things, too, and we’ve worked with Invesco Advisers to provide more income-generating options in the Invesco Funds lineup to help shareholders potentially meet their income needs. Your Board recently approved changes to three existing equity mutual funds, increasing their focus on generating income while also seeking to provide long-term growth of capital.
As a result of these changes, the funds and their respective management teams now have more flexibility to invest in the types of securities that could meet investors’ growing need for income generation, and in some cases, also help investors diversify their sources of income. These equity funds complement an array of fixed-income, asset allocation and alternative investment options in the Invesco Funds lineup designed to accommodate a variety of risk tolerances.
Be assured that your Board will continue working on behalf of fund shareholders, keeping your needs and interests uppermost in our minds.
As always, please contact me at bruce@brucecrockett.com with any questions or concerns you may have. On behalf of the Board, we look forward to continuing to represent your interests and serving your needs.
Sincerely,

Bruce L. Crockett
Independent Chair
Invesco Funds Board of Trustees
3 Invesco Global Real Estate Income Fund
Management’s Discussion of Fund Performance
Performance summary
After generating favorable performance for much of the reporting period, prices of publicly traded real estate securities retreated following a rise in interest rates during the fiscal year ended August 31, 2013. As a result, Fund performance at net asset value was flat for the fiscal year. Additionally, Fund performance lagged relative to both its style-specific benchmark and peer group, the FTSE EPRA/NAREIT Developed Real Estate Index–Gross Return and the Lipper Global Real Estate Funds Classification Average, respectively.
Your Fund’s long-term performance appears later in this report.
Fund vs. Indexes
Total returns, 8/31/12 to 8/31/13, at net asset value (NAV). Performance shown does not include applicable contingent deferred sales charges (CDSC) or front-end sales charges, which would have reduced performance.
| Class A Shares | 0.43 | % | |||
| Class B Shares | -0.23 | ||||
| Class C Shares | -0.34 | ||||
| Class Y Shares | 0.68 | ||||
| Class R5 Shares | 0.85 | ||||
| Class R6 Shares* | 0.97 | ||||
| MSCI World Index ND‚ (Broad Market Index) | 17.63 | ||||
FTSE EPRA/NAREIT Developed Real Estate Index-Gross Returnn (Style-Specific Index)** | 6.61 | ||||
| Custom Global Real Estate Income Index¿ (Former Style-Specific Index)** | 1.98 | ||||
| Lipper Global Real Estate Funds Classification Averagep (Peer Group) | 5.74 |
Source(s): ‚ Invesco, MSCI via FactSet Research Systems Inc.; nInvesco, Bloomberg L.P.;
¿Invesco, Lipper Inc.; pLipper Inc.
| * | Share class incepted during the reporting period. See page 7 for detailed explanation of Fund |
| performance. |
| ** | During the reporting period, the Fund has elected to use the FTSE EPRA/NAREIT Developed Real Estate Index-Gross Return as its style-specific index rather than the Custom Global Real Estate Income index because the FTSE EPRA/NAREIT Developed Real Estate Index-Gross Return more closely reflects the performance of the types of securities in which the Fund invests. |
How we invest
The Fund invests, under normal circumstances, at least 80% of its net assets (plus any borrowings for investment purposes) in securities of issuers principally engaged in the real estate industry and other real estate-related investments. Our goal is to create a global fund that will provide current income, with capital appreciation as a secondary objective. We use a fundamentals-driven investment process, including property market cycle analysis, property evaluation, and management and structure review, to identify securities with:
| n | Attractive relative yields. |
| n | Favorable property market outlooks. |
| n | Reasonable valuations relative to peer investment alternatives. |
We attempt to manage risk by allocating assets between property-related common stocks and fixed income securities, as well as diversifying by property types and geographic location, and limiting the size of any one holding.
We will consider selling a holding when:
| n | Relative yields and/or valuations fall below desired levels. |
| n | Risk-return relationships change significantly. |
| n | Company fundamentals change (property type, geography or management changes). |
| n | A more attractive investment opportunity is identified. |
Market conditions and your Fund
In the fiscal year ended August 31, 2013, the global macroeconomic environment continued to show progress. However, regional or country-level exceptions clearly still existed, particularly in Europe and parts of developing Asia. The effects of measures and balance sheet repair in many developed economies resulted in below-long-term-average gross domestic product growth, while uncertainties surrounding long- and short-term management of debt burdens and government spending deficits continued. The world benefited from the willingness of financial authorities to undertake unprecedented amounts of market intervention. However, a true economic recovery may occur when such abnormal levels of stimulus have been removed. The path ahead will not be without challenges.
As developed world economies have staged a recovery, growth among the world’s emerging economies weakened somewhat. However, the long-term health of emerging economies remained highly dependent on overall global trends in trade and consumption, and they continued to benefit from long-term urbanization trends.
In most markets across the globe, supply of newly developed real estate was low for the past six years, and absolute levels of vacancies remained well below historical highs. The lack of new construction created more orderly real estate rental markets that offered better rental growth prospects when combined with trade, employment or consumption growth.
Performance of the real estate asset class was affected by US Federal Reserve (the Fed) Chairman Ben Bernanke’s May 2013 disclosure that the Fed plans to
| Portfolio Composition | |||||
By country | |||||
United States | 58.8 | % | |||
| Japan | 7.6 | ||||
| United Kingdom | 6.9 | ||||
| Australia | 5.9 | ||||
| Canada | 4.7 | ||||
| Singapore | 3.9 | ||||
| France | 2.4 | ||||
| Countries each less than 2.0% of portfolio | 6.7 | ||||
Money Market Funds Plus Other Assets Less Liabilities | 3.1 | ||||
| Top 10 Equity Holdings* | |||||
1. AvalonBay Communities, Inc. | 2.5 | % | |||
2. Essex Property Trust, Inc. | 2.0 | ||||
3. Health Care REIT, Inc., Series I Pfd. | 1.4 | ||||
4. Simon Property Group, Inc. | 1.2 | ||||
5. Boston Properties, Inc. | 1.2 | ||||
6. Unibail-Rodamco S.E. | 1.2 | ||||
7. Land Securities Group PLC | 1.1 | ||||
8. British Land Co. PLC | 1.1 | ||||
9. Retail Opportunity Investments Corp. | 1.1 | ||||
10. Stockland | 1.1 | ||||
| Total Net Assets | $1.0 billion | ||||
| Total Number of Holdings* | 222 | ||||
The Fund’s holdings are subject to change, and there is no assurance that the Fund will continue to hold any particular security.
*Excluding money market fund holdings.
4 Invesco Global Real Estate Income Fund
begin reducing quantitative easing. (Quantitative easing is the purchase of US Treasuries and mortgage-backed securities to increase liquidity and ensure low long-term interest rates.) As a result, 10-year Treasury yields have increased over 100 basis points since the beginning of May 2013.1 (A basis point is one one-hundredth of a percentage point.) Real estate securities came under pressure as investors sought to sell assets associated with yield in the new rising-rate environment.
On an absolute basis, each component of the capital structure, including real estate investment trust (REIT) common stock, REIT corporate debt and commercial mortgage-backed securities (CMBS), contributed to Fund performance during the fiscal year, with the exception of the Fund’s preferred securities. CMBS – mortgage-backed fixed income securities secured by the loan on commercial properties – contributed the most to Fund performance, followed by real estate common stock.
Among individual equity REITs, lodging/resorts, healthcare and industrial REITs made the greatest contribution to Fund performance. Conversely, residential, retail and specialty REITs were laggards, producing losses for the Fund. From a country standpoint, the US, Japan and the UK were strong contributors, while Canada and South Africa were the largest detractors from performance.
In light of increased interest rates and a shift in investor focus from yield to growth, we increased the Fund’s exposure to real estate common stock during the reporting period. We emphasized companies that we believed would be able to grow their underlying cash flows and increase their dividends. Additionally, we shortened the duration of the fixed income portion of the Fund, as we believed interest rates would continue to rise. For our preferred securities allocation, we remained focused on higher paying coupons with shorter dated call schedules, which we believed may be less volatile than those that have lower coupons and longer dated call schedules.
The Fund has the flexibility to invest across equities and fixed income securities on a global basis, in an effort to take advantage of market dislocations driven by capital market influences rather than underlying commercial real estate fundamentals. We remain committed to owning quality real estate companies that we believe may benefit from relatively better sector trends. We continue to manage risk by holding a portfolio that is diversified by property type and geographic
location. We also continue to favor lower-leveraged companies with above-average levels of dividend coverage in the portfolio.
We thank you for your continued investment in Invesco Global Real Estate Income Fund.
| 1 | Source: US Department of the Treasury |
The views and opinions expressed in management’s discussion of Fund performance are those of Invesco Advisers, Inc. These views and opinions are subject to change at any time based on factors such as market and economic conditions. These views and opinions may not be relied upon as investment advice or recommendations, or as an offer for a particular security. The information is not a complete analysis of every aspect of any market, country, industry, security or the Fund. Statements of fact are from sources considered reliable, but Invesco Advisers, Inc. makes no representation or warranty as to their completeness or accuracy. Although historical performance is no guarantee of future results, these insights may help you understand our investment management philosophy.
See important Fund and, if applicable, index disclosures later in this report.
 | Joe Rodriguez Jr. Portfolio manager, is lead manager of Invesco Global Real Estate Income Fund. He joined Invesco in | |
| 1990. Mr. Rodriguez earned a BBA in economics and finance and an MBA in finance from Baylor University. | ||
 | Mark Blackburn Chartered Financial Analyst, portfolio manager, is manager of Invesco Global Real Estate Income Fund. | |
| He joined Invesco in 1998. Mr. Blackburn earned a BS in accounting from Louisiana State University and an MBA from Southern Methodist University. | ||
 | James Cowen Portfolio manager, is manager of Invesco Global Real Estate Income Fund. He joined Invesco in 2001. | |
| Mr. Cowen earned a Master of Town and Country Planning degree from the University of Manchester and a Master of Philosophy degree in land economy from Cambridge University. | ||
 | Paul Curbo Chartered Financial Analyst, portfolio manager, is manager of Invesco Global Real Estate Income Fund. | |
| He joined Invesco in 1998. Mr. Curbo earned a BBA in finance from The University of Texas at Austin. | ||
 | Darin Turner Portfolio manager, is manager of Invesco Global Real Estate Income Fund. He joined Invesco in 2005. | |
| Mr. Turner earned a BBA in finance from Baylor University, an MS in real estate from The University of Texas at Arlington and an MBA specializing in investments from Southern Methodist University. | ||
 | Ping Ying Wang Chartered Financial Analyst, portfolio manager, is manager of Invesco Global Real Estate Income Fund. | |
| She joined Invesco in 1998. Ms. Wang earned a BS in international finance from the People’s University of China and a PhD in finance from The University of Texas at Dallas. | ||
5 Invesco Global Real Estate Income Fund
Your Fund’s Long-Term Performance
Results of a $10,000 Investment – Oldest Share Class(es)
Fund and index data from 8/31/03
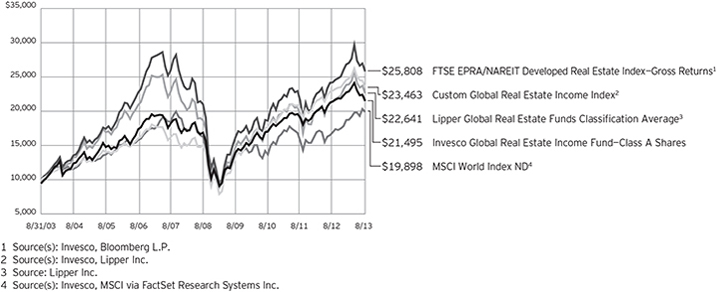
Past performance cannot guarantee comparable future results.
During the reporting period, the Fund has elected to use FTSE EPRA/NAREIT Developed Real Estate Index-Gross Return as its style-specific index rather than the Custom Global Real Estate Income Index because the FTSE EPRA/ NAREIT Developed Real Estate Index-Gross Return more closely reflects the
performance of the types of securities in which the Fund invests. Because this is the first reporting period since we have adopted the new index, SEC guidelines require that we compare performance to both the old and new indexes.
The data shown in the chart include reinvested distributions, applicable sales charges and Fund expenses including management fees. Index results include
reinvested dividends, but they do not reflect sales charges. Performance of the peer group, if applicable, reflects fund expenses and management fees; performance of a market index does not. Performance shown in the chart and table(s) does not reflect deduction of taxes a shareholder would pay on Fund distributions or sale of Fund shares.
6 Invesco Global Real Estate Income Fund
| Average Annual Total Returns | |||||
As of 8/31/13, including maximum applicable sales charges
|
| ||||
Class A Shares | |||||
| Inception (5/31/02) | 8.65 | % | |||
| 10 Years | 7.95 | ||||
| 5 Years | 3.78 | ||||
| 1 Year | -5.07 | ||||
| Class B Shares | |||||
| 10 Years | 7.62 | % | |||
| 5 Years | 3.88 | ||||
| 1 Year | -4.98 | ||||
| Class C Shares | |||||
| 10 Years | 7.61 | % | |||
| 5 Years | 4.18 | ||||
| 1 Year | -1.29 | ||||
| Class Y Shares | |||||
| 10 Years | 8.67 | % | |||
| 5 Years | 5.16 | ||||
| 1 Year | 0.68 | ||||
| Class R5 Shares | |||||
| 10 Years | 8.84 | % | |||
| 5 Years | 5.45 | ||||
| 1 Year | 0.85 | ||||
| Class R6 Shares | |||||
| 10 Years | 8.62 | % | |||
| 5 Years | 5.08 | ||||
| 1 Year | 0.97 | ||||
On March 12, 2007, the Fund reorganized from a Closed-End Fund to an Open-End Fund. Performance shown prior to that date is that of the Closed-End Fund’s Common shares and includes the fees applicable to Common shares. The Closed-End Fund’s Common shares performance reflects any applicable fee waivers or expense reimbursements.
Class B shares incepted on March 9, 2007. Performance shown prior to that date is that of Class A shares, restated to reflect the higher 12b-1 fees applicable to Class B shares. Class A share performance reflects any applicable fee waivers or expense reimbursements.
Class C shares incepted on March 9, 2007. Performance shown prior to that date is that of Class A shares, restated to reflect the higher 12b-1 fees applicable to Class C shares. Class A share performance reflects any applicable fee waivers or expense reimbursements.
Class Y shares incepted on October 3, 2008. Performance shown prior to that date is that of Class A shares and includes the 12b-1 fees applicable to Class A shares. Class A share
| Average Annual Total Returns | |||||
| As of 6/30/13, the most recent calendar quarter end, including maximum applicable sales charges | |||||
Class A Shares | |||||
| Inception (5/31/02) | 9.15 | % | |||
| 10 Years | 8.83 | ||||
| 5 Years | 4.38 | ||||
| 1 Year | 1.93 | ||||
| Class B Shares | |||||
| 10 Years | 8.49 | % | |||
| 5 Years | 4.49 | ||||
| 1 Year | 1.99 | ||||
| Class C Shares | |||||
| 10 Years | 8.49 | % | |||
| 5 Years | 4.82 | ||||
| 1 Year | 6.11 | ||||
| Class Y Shares | |||||
| 10 Years | 9.55 | % | |||
| 5 Years | 5.77 | ||||
| 1 Year | 8.09 | ||||
| Class R5 Shares | |||||
| 10 Years | 9.71 | % | |||
| 5 Years | 6.03 | ||||
| 1 Year | 8.14 | ||||
| Class R6 Shares | |||||
| 10 Years | 9.49 | % | |||
| 5 Years | 5.65 | ||||
| 1 Year | 8.27 | ||||
performance reflects any applicable fee waivers or expense reimbursements.
Class R5 shares incepted on March 9, 2007. Performance shown prior to that date is that of Class A shares and includes the 12b-1 fees applicable to Class A shares. Class A share performance reflects any applicable fee waivers or expense reimbursements.
Class R6 shares incepted on September 24, 2012. Performance shown prior to that date is that of Class A shares and includes the 12b-1 fees applicable to Class A shares. Class A share performance reflects any applicable fee waivers or expense reimbursements.
The performance data quoted represent past performance and cannot guarantee comparable future results; current performance may be lower or higher. Please visit invesco.com/performance for the most recent month-end performance. Performance figures reflect reinvested distributions (reinvested at net asset value, except for periods prior to March 12, 2007 where reinvestments were made at the lower of the Closed-End
Fund’s net asset value or market price), changes in net asset value and the effect of the maximum sales charge unless otherwise stated. Investment return and principal value will fluctuate so that you may have a gain or loss when you sell shares.
The total annual Fund operating expense ratio set forth in the most recent Fund prospectus as of the date of this report for Class A, Class B, Class C, Class Y, Class R5 and Class R6 shares was 1.32%, 2.07%, 2.07%, 1.07%, 0.99% and 0.91%, respectively. The expense ratios presented above may vary from the expense ratios presented in other sections of this report that are based on expenses incurred during the period covered by this report.
Class A share performance reflects the maximum 5.50% sales charge, and Class B and Class C share performance reflects the applicable contingent deferred sales charge (CDSC) for the period involved. The CDSC on Class B shares declines from 5% beginning at the time of purchase to 0% at the beginning of the seventh year. The CDSC on Class C shares is 1% for the first year after purchase. Class Y, Class R5 and Class R6 shares do not have a front-end sales charge or a CDSC; therefore, performance is at net asset value.
The performance of the Fund’s share classes will differ primarily due to different sales charge structures and class expenses.
Fund performance was positively impacted by a temporary 2% fee on redemptions that was in effect from March 12, 2007 to March 12, 2008. Without income from this temporary fee, returns would have been lower.
Had the adviser not waived fees and/ or reimbursed expenses in the past, performance would have been lower.
7 Invesco Global Real Estate Income Fund
Invesco Global Real Estate Income Fund’s investment objective is current income and, secondarily, capital appreciation.
| n | Unless otherwise stated, information presented in this report is as of August 31, 2013, and is based on total net assets. |
| n | Unless otherwise noted, all data provided by Invesco. |
| n | To access your Fund’s reports/prospectus, visit invesco.com/fundreports. |
About share classes
| n | On March 12, 2007, Invesco Global Real Estate Income Fund was reorganized from a Closed-End Fund to an Open-End Fund. Information presented for Class A shares prior to the reorganization included financial data for the Closed-End Fund’s Common Shares. |
| n | Class B shares may not be purchased for new or additional investments. Please see the prospectus for more information. |
| n | Class Y shares are available only to certain investors. Please see the prospectus for more information. |
| n | Class R5 shares and Class R6 shares are primarily intended for employer sponsored retirement and benefit plans that meet certain standards and for institutional investors. On September 24, 2012, Institutional Class shares were renamed Class R5 shares. Please see the prospectus for more information. |
Principal risks of investing in the Fund
| n | Concentration risk. To the extent the Fund invests a greater amount in any one sector or industry, the Fund’s performance will depend to a greater extent on the overall condition of the sector or industry, and there is increased risk to the Fund if conditions adversely affect that sector or industry. |
| n | Credit risk. The issuer of instruments in which the Fund invests may be unable to meet interest and/or principal payments, thereby causing its instruments to decrease in value and lowering the issuer’s credit rating. |
| n | Currency/exchange rate risk. The dollar value of the Fund’s foreign investments will be affected by changes in the exchange rates between the dollar and the currencies in which those investments are traded. |
| n | Debt securities risk. The Fund may invest in debt securities that are affected by changing interest rates and changes in their effective maturities and credit quality. |
| n | Developing/emerging markets securities risk. Securities issued by foreign companies and governments located in developing/emerging countries may be affected more negatively by inflation, |
devaluation of their currencies, higher transaction costs, delays in settlement, adverse political developments, the introduction of capital controls, withholding taxes, nationalization of private assets, expropriation, social unrest, war or lack of timely information than those in developed countries. |
| n | Foreign securities risk. The Fund’s foreign investments may be affected by changes in a foreign country’s exchange rates; political and social instability; changes in economic or taxation policies; difficulties when enforcing obligations; decreased liquidity; and increased volatility. Foreign companies may be subject to less regulation resulting in less publicly available information about the companies. |
| n | High yield bond (junk bond) risk. Junk bonds involve a greater risk of default or price changes due to changes in the credit quality of the issuer. The values of junk bonds fluctuate more than those of high-quality bonds in response to company, political, regulatory or economic developments. Values of junk bonds can decline significantly over short periods of time. |
| n | Interest rate risk. Interest rate risk refers to the risk that bond prices generally fall as interest rates rise; conversely, bond prices generally rise as interest rates fall. Specific bonds differ in their sensitivity to changes in interest rates depending on their individual characteristics, including duration. |
| n | Liquidity risk. The Fund may hold illiquid securities that it is unable to sell at the preferred time or price and could lose its entire investment in such securities. |
| n | Management risk. The investment techniques and risk analysis used by the Fund’s portfolio managers may not produce the desired results. |
| n | Market risk. The prices of and the income generated by the Fund’s securities may decline in response to, among other things, investor sentiment; general economic and market conditions; regional or global instability; and currency and interest rate fluctuations. |
| n | Mortgage- and asset-backed securities risk. The Fund may invest in mortgage- |
and asset-backed securities that are subject to prepayment or call risk, which is the risk that the borrower’s payments may be received earlier or later than expected due to changes in prepayment rates on underlying loans. Faster prepayments often happen when interest rates are falling. As a result, the Fund may reinvest these early payments at lower interest rates, thereby reducing the Fund’s income. Conversely, when interest rates rise, prepayments may happen more slowly, causing the security to lengthen in duration. Longer duration securities tend to be more volatile. Securities may be prepaid at a price less than the original purchase value. An unexpectedly high rate of defaults on the mortgages held by a mortgage pool may adversely affect the value of mortgage-backed securities and could result in losses to the Fund. The risk of such defaults is generally higher in the case of mortgage pools that include subprime mortgages. Subprime mortgages refer to loans made to borrowers with weakened credit histories or with lower capacity to make timely payments on their mortgages. |
| n | REIT risk/real estate risk. Investments in real estate-related instruments may be affected by economic, legal, cultural, environmental or technological factors that affect property values, rents or occupancies of real estate related to the Fund’s holdings. Real estate companies, including REITs or similar structures, tend to be small- and mid-cap companies, and their shares may be more volatile and less liquid. The value of investments in real estate-related companies may be affected by the quality of management, the ability to repay loans, the utilization of leverage and financial covenants related thereto, whether the company carries adequate insurance and environmental factors. If a real estate-related company defaults, the Fund may own real estate directly, which involves the following additional risks: environmental liabilities; difficulty in valuing and selling the real estate; and economic or regulatory changes. |
| n | Short sales risk. Short sales may cause the Fund to repurchase a security at a |
8 Invesco Global Real Estate Income Fund
higher price, thereby causing a loss. As there is no limit on how much the price of the security can increase, the Fund’s exposure is unlimited.
| n | Small- and mid-capitalization risk. Stocks of small and mid-sized companies tend to be more vulnerable to adverse developments in the above factors and may have little or no operating history or track record of success, and limited product lines, markets, management and financial resources. The securities of small and mid-sized companies may be more volatile due to less market interest and less publicly available information about the issuer. They also may be illiquid or restricted as to resale, or may trade less frequently and in smaller volumes, all of which may cause difficulty when establishing or closing a position at a desirable price. |
| n | Synthetic securities risk. Fluctuations in the values of synthetic securities may not correlate perfectly with the instruments they are designed to replicate. Synthetic securities may be subject to interest rate changes, market price fluctuations, counterparty risk and liquidity risk. |
About indexes used in this report
| n | The MSCI World Index ND is an unmanaged index considered representative of stocks of developed countries. The index is computed using the net return, which withholds applicable taxes for non-resident investors. |
| n | The FTSE EPRA/NAREIT Developed Real Estate Index-Gross Return is an unmanaged index considered representative of global real estate companies and REITs. The index is computed using the gross return which does not withhold taxes for non-resident investors. |
| n | The Custom Global Real Estate Income Index is created by Invesco to serve as a benchmark for Invesco Global Real Estate Income Fund, comprises the following indexes: FTSE |
EPRA/NAREIT Developed Real Estate Index-Gross Return (50%) and Wachovia Hybrid and Preferred Securities REIT (50%).
| n | The Lipper Global Real Estate Funds Classification Average represents an average of all funds in the Lipper Global Real Estate Funds classification. |
| n | The Wachovia Hybrid and Preferred Securities REIT Index is designed to track the performance of preferred securities issued in the US market by Real Estate Investment Trusts and is composed exclusively of preferred shares and depositary shares. |
| n | The Fund is not managed to track the performance of any particular index, including the index(es) described here, and consequently, the performance of the Fund may deviate significantly from the performance of the index(es). |
| n | A direct investment cannot be made in an index. Unless otherwise indicated, index results include reinvested dividends, and they do not reflect sales charges. Performance of the peer group, if applicable, reflects fund expenses; performance of a market index does not. |
Other information
| n | The returns shown in management’s discussion of Fund performance are based on net asset values calculated for shareholder transactions. Generally accepted accounting principles require adjustments to be made to the net assets of the Fund at period end for financial reporting purposes, and as such, the net asset values for shareholder transactions and the returns based on those net asset values may differ from the net asset values and returns reported in the Financial Highlights. |
This report must be accompanied or preceded by a currently effective Fund prospectus, which contains more complete information, including sales charges and expenses. Investors should read it carefully before investing. |
NOT FDIC INSURED | MAY LOSE VALUE | NO BANK GUARANTEE
Fund Nasdaq Symbols
| |||||
| Class A Shares | ASRAX | ||||
| Class B Shares | SARBX | ||||
| Class C Shares | ASRCX | ||||
| Class Y Shares | ASRYX | ||||
| Class R5 Shares | ASRIX | ||||
| Class R6 Shares | ASRFX | ||||
9 Invesco Global Real Estate Income Fund
Schedule of Investments
August 31, 2013
| Shares | Value | |||||||
Common Stocks & Other Equity Interests–57.62% |
| |||||||
| Australia–5.34% | ||||||||
CFS Retail Property Trust | 2,499,503 | $ | 4,477,250 | |||||
Dexus Property Group | 8,165,043 | 7,437,735 | ||||||
Federation Centres Ltd. | 3,888,116 | 7,842,421 | ||||||
Goodman Group | 1,784,769 | 7,300,887 | ||||||
GPT Group | 1,108,313 | 3,485,194 | ||||||
Stockland | 3,292,356 | 10,870,835 | ||||||
Westfield Group | 821,433 | 8,063,995 | ||||||
Westfield Retail Trust | 1,918,478 | 4,960,414 | ||||||
| 54,438,731 | ||||||||
| Canada–4.64% | ||||||||
Allied Properties REIT | 277,500 | 8,235,688 | ||||||
Artis REIT | 455,800 | 5,863,562 | ||||||
Calloway REIT | 201,100 | 4,648,994 | ||||||
Canadian Apartment Properties REIT | 343,700 | 6,721,940 | ||||||
Canadian REIT | 179,800 | 6,966,332 | ||||||
Chartwell Retirement Residences | 326,200 | 2,982,347 | ||||||
Cominar REIT | 283,800 | 5,025,036 | ||||||
Dundee REIT–Class A | 163,500 | 4,532,612 | ||||||
H&R REIT | 65,443 | 1,274,315 | ||||||
RioCan REIT | 47,600 | 1,064,255 | ||||||
| 47,315,081 | ||||||||
| China–0.57% | ||||||||
Shimao Property Holdings Ltd. | 1,253,500 | 3,177,734 | ||||||
SOHO China Ltd. | 3,071,000 | 2,603,786 | ||||||
| 5,781,520 | ||||||||
| France–2.43% | ||||||||
Gecina S.A. | 26,017 | 3,094,910 | ||||||
ICADE | 37,435 | 3,254,782 | ||||||
Mercialys S.A. | 331,068 | 6,388,076 | ||||||
Unibail-Rodamco S.E. | 53,574 | 12,020,871 | ||||||
| 24,758,639 | ||||||||
| Germany–0.69% | ||||||||
Alstria Office REIT–AG | 100,000 | 1,181,510 | ||||||
Deutsche Euroshop AG | 110,208 | 4,502,069 | ||||||
GSW Immobilien AG | 32,313 | 1,407,766 | ||||||
| 7,091,345 | ||||||||
| Hong Kong–1.73% | ||||||||
Fortune REIT | 3,243,000 | �� | 2,643,114 | |||||
Kerry Properties Ltd. | 827,500 | 3,337,421 | ||||||
Link REIT (The) | 497,500 | 2,270,679 | ||||||
Sino Land Co. Ltd. | 1,883,000 | 2,518,807 | ||||||
Wharf Holdings Ltd. (The) | 843,000 | 6,900,675 | ||||||
| 17,670,696 | ||||||||
| Shares | Value | |||||||
| Japan–7.55% | ||||||||
Activia Properties, Inc. | 922 | $ | 6,334,686 | |||||
Advance Residence Investment Corp. | 2,164 | 4,389,674 | ||||||
Frontier Real Estate Investment Corp. | 573 | 4,848,012 | ||||||
GLP J–REIT(a) | 533 | 521,271 | ||||||
GLP J–REIT | 5,578 | 5,455,257 | ||||||
Hulic Co., Ltd. | 227,900 | 2,794,330 | ||||||
Industrial & Infrastructure Fund Investment Corp.(a) | 46 | 404,516 | ||||||
Industrial & Infrastructure Fund Investment Corp. | 898 | 7,896,853 | ||||||
Japan Prime Realty Investment Corp. | 1,996 | 5,719,771 | ||||||
Japan Retail Fund Investment Corp. | 2,952 | 5,431,247 | ||||||
Kenedix Realty Investment Corp. | 1,316 | 4,953,437 | ||||||
Mitsui Fudosan Co., Ltd. | 247,000 | 7,739,043 | ||||||
Nippon Accommodations Fund Inc. | 235 | 1,533,299 | ||||||
Nippon Prologis REIT Inc. | 451 | 3,943,073 | ||||||
Nomura Real Estate Office Fund, Inc. | 1,290 | 5,516,590 | ||||||
Nomura Real Estate Residential Fund, Inc. | 532 | 2,488,827 | ||||||
ORIX JREIT Inc. | 1,841 | 1,943,506 | ||||||
Sumitomo Realty & Development Co., Ltd. | 118,000 | 5,158,646 | ||||||
| 77,072,038 | ||||||||
| New Zealand–0.22% | ||||||||
Precinct Properties New Zealand Ltd. | 2,730,018 | 2,215,532 | ||||||
| Singapore–3.90% | ||||||||
Ascendas REIT | 3,273,000 | 5,522,605 | ||||||
Ascott Residence Trust | 2,382,000 | 2,226,956 | ||||||
CapitaCommercial Trust | 2,167,000 | 2,276,743 | ||||||
CapitaMall Trust | 2,342,000 | 3,389,411 | ||||||
Frasers Centrepoint Trust | 3,812,000 | 5,333,504 | ||||||
Global Logistic Properties Ltd. | 1,628,000 | 3,432,362 | ||||||
Mapletree Commercial Trust | 3,280,000 | 2,868,174 | ||||||
Mapletree Industrial Trust | 2,007,000 | 2,007,996 | ||||||
Mapletree Logistics Trust | 6,633,000 | 5,430,709 | ||||||
Starhill Global REIT | 4,019,000 | 2,403,452 | ||||||
Suntec REIT | 4,189,000 | 4,942,246 | ||||||
| 39,834,158 | ||||||||
| South Africa–0.96% | ||||||||
Capital Property Fund | 1,170,506 | 1,114,989 | ||||||
Fountainhead Property Trust | 1,911,557 | 1,398,324 | ||||||
Growthpoint Properties Ltd. | 1,441,541 | 3,330,376 | ||||||
Hyprop Investments Ltd. | 278,329 | 1,922,292 | ||||||
SA Corporate Real Estate Fund | 5,438,402 | 2,025,628 | ||||||
| 9,791,609 | ||||||||
| Sweden–0.20% | ||||||||
Fabege AB | 200,050 | 2,082,597 | ||||||
See accompanying Notes to Financial Statements which are an integral part of the financial statements.
10 Invesco Global Real Estate Income Fund
| Shares | Value | |||||||
| United Kingdom–4.27% | ||||||||
Big Yellow Group PLC | 1,089,476 | $ | 6,837,862 | |||||
British Land Co. PLC | 1,281,788 | 11,084,039 | ||||||
Hammerson PLC | 582,030 | 4,361,034 | ||||||
Hansteen Holdings PLC | 1,587,763 | 2,418,727 | ||||||
Intu Properties PLC | 716,947 | 3,398,710 | ||||||
Land Securities Group PLC | 827,106 | 11,317,995 | ||||||
Shaftesbury PLC | 452,894 | 4,165,479 | ||||||
| 43,583,846 | ||||||||
| United States–25.12% | ||||||||
Acadia Realty Trust | 309,500 | 7,220,635 | ||||||
AvalonBay Communities, Inc. | 206,126 | 25,539,011 | ||||||
BioMed Realty Trust, Inc. | 276,500 | 5,090,365 | ||||||
Boston Properties, Inc. | 118,000 | 12,095,000 | ||||||
Brookfield Office Properties, Inc. | 497,334 | 7,956,022 | ||||||
CBL & Associates Properties, Inc. | 508,400 | 9,761,280 | ||||||
Cohen & Steers Quality Income Realty Fund, Inc. | 357,173 | 3,468,150 | ||||||
Corrections Corp. of America | 226,777 | 7,470,034 | ||||||
Cousins Properties, Inc. | 154,700 | 1,536,171 | ||||||
DCT Industrial Trust Inc. | 725,900 | 4,856,271 | ||||||
Digital Realty Trust, Inc. | 93,900 | 5,220,840 | ||||||
EastGroup Properties, Inc. | 91,100 | 5,119,820 | ||||||
Essex Property Trust, Inc. | 144,600 | 20,722,626 | ||||||
Extra Space Storage Inc. | 99,700 | 4,110,631 | ||||||
Geo Group Inc. (The) | 117,900 | 3,679,659 | ||||||
Government Properties Income Trust | 255,250 | 5,967,745 | ||||||
Health Care REIT, Inc. | 70,800 | 4,349,952 | ||||||
Healthcare Realty Trust, Inc. | 246,400 | 5,541,536 | ||||||
Hersha Hospitality Trust | 670,100 | 3,511,324 | ||||||
Highwoods Properties, Inc. | 131,700 | 4,448,826 | ||||||
Hospitality Properties Trust | 289,900 | 7,833,098 | ||||||
Host Hotels & Resorts Inc. | 157,200 | 2,677,116 | ||||||
Kimco Realty Corp. | 120,000 | 2,403,600 | ||||||
Liberty Property Trust | 176,100 | 6,093,060 | ||||||
LTC Properties, Inc. | 115,800 | 4,102,794 | ||||||
Mid-America Apartment Communities, Inc. | 152,800 | 9,421,648 | ||||||
Pebblebrook Hotel Trust | 101,600 | 2,600,960 | ||||||
Piedmont Office Realty Trust Inc.– Class A | 590,200 | 10,139,636 | ||||||
Public Storage | 60,577 | 9,248,291 | ||||||
Retail Opportunity Investments Corp. | 854,800 | 11,061,112 | ||||||
RLJ Lodging Trust | 182,100 | 4,184,658 | ||||||
Saul Centers, Inc. | 81,400 | 3,533,574 | ||||||
Senior Housing Properties Trust | 444,950 | 10,122,613 | ||||||
Simon Property Group, Inc. | 83,300 | 12,130,979 | ||||||
Sovran Self Storage, Inc. | 80,300 | 5,321,481 | ||||||
Tanger Factory Outlet Centers, Inc. | 107,500 | 3,316,375 | ||||||
Urstadt Biddle Properties Inc.–Class A | 99,400 | 1,941,282 | ||||||
Vornado Realty Trust | 31,300 | 2,544,690 | ||||||
| 256,342,865 | ||||||||
Total Common Stocks & Other Equity Interests (Cost $618,462,000) |
| 587,978,657 | ||||||
| Shares | Value | |||||||
Preferred Stocks–20.61% |
| |||||||
| Australia–0.52% | ||||||||
Goodman PLUS Trust, 6.95% Unsec. Sub. Gtd. Floating Rate PLUS(b) | 60,179 | $ | 5,291,065 | |||||
| United States–20.09% | ||||||||
Alexandria Real Estate Equities Inc., Series D, $1.75 Conv. Pfd. | 425,000 | 10,757,813 | ||||||
Brandywine Realty Trust, Series E, 6.90% Pfd. | 57,454 | 1,404,750 | ||||||
CBL & Associates Properties, Inc., Series D, 7.38% Pfd. | 199,700 | 4,938,581 | ||||||
CBL & Associates Properties, Inc., Series E, 6.63% Pfd. | 408,000 | 9,343,200 | ||||||
Chesapeake Lodging Trust, Series A, 7.75% Pfd. | 90,000 | 2,250,000 | ||||||
Coresite Realty Corp., Series A, 7.25% Pfd. | 238,185 | 5,775,986 | ||||||
Corporate Office Properties Trust, Series L, 7.38% Pfd. | 335,500 | 8,145,940 | ||||||
CubeSmart, Series A, 7.75% Pfd. | 16,700 | 423,846 | ||||||
Digital Realty Trust, Inc., Series F, 6.63% Pfd. | 183,907 | 4,191,241 | ||||||
Digital Realty Trust, Inc., Series G, 5.88% Pfd. | 238,700 | 4,862,319 | ||||||
Duke Realty Corp., Series J, 6.63% Pfd. | 163,849 | 3,948,761 | ||||||
Duke Realty Corp., Series L, 6.60% Pfd. | 122,500 | 2,868,950 | ||||||
DuPont Fabros Technology, Inc., Series A, 7.88% Pfd. | 159,400 | 3,921,240 | ||||||
DuPont Fabros Technology, Inc., Series B, 7.63% Pfd. | 205,400 | 4,985,058 | ||||||
Eagle Hospitality Properties Trust Inc., Series A, 8.25% Pfd. | 195,800 | 14,196 | ||||||
EPR Properties, Series E, $2.25 Conv. Pfd. | 111,000 | 3,214,560 | ||||||
EPR Properties, Series F, 6.63% Pfd. | 78,000 | 1,716,000 | ||||||
Essex Property Trust, Inc., Series H, 7.13% Pfd. | 201,907 | 5,205,162 | ||||||
Health Care REIT, Inc., Series I, $3.25 Conv. Pfd. | 252,200 | 14,468,714 | ||||||
Health Care REIT, Inc., Series J, 6.50% Pfd. | 186,678 | 4,433,603 | ||||||
Hersha Hospitality Trust, Series B, 8.00% Pfd. | 176,500 | 4,474,275 | ||||||
Hersha Hospitality Trust, Series C, 6.88% Pfd. | 57,907 | 1,325,491 | ||||||
Hudson Pacific Properties Inc., Series B, 8.38% Pfd. | 177,816 | 4,536,086 | ||||||
Inland Real Estate Corp., Series A, 8.13% Pfd. | 96,947 | 2,486,691 | ||||||
Kilroy Realty Corp., Series G, 6.88% Pfd. | 274,000 | 6,439,000 | ||||||
Kilroy Realty Corp., Series H, 6.38% Pfd. | 332,500 | 7,205,275 | ||||||
Kimco Realty Corp., Series K, 5.63% Pfd. | 77,607 | 1,632,075 | ||||||
LaSalle Hotel Properties, Series G, 7.25% Pfd. | 33,834 | 824,196 | ||||||
See accompanying Notes to Financial Statements which are an integral part of the financial statements.
11 Invesco Global Real Estate Income Fund
| Shares | Value | |||||||
| United States–(continued) | ||||||||
LaSalle Hotel Properties, Series H, 7.50% Pfd. | 153,900 | $ | 3,845,961 | |||||
LaSalle Hotel Properties, Series I, 6.38% Pfd. | 199,000 | 4,179,000 | ||||||
National Retail Properties Inc., Series D, 6.63% Pfd. | 136,000 | 3,151,120 | ||||||
Pebblebrook Hotel Trust, Series A, 7.88% Pfd. | 238,700 | 5,988,983 | ||||||
Pebblebrook Hotel Trust, Series B, 8.00% Pfd. | 139,200 | 3,535,680 | ||||||
Pebblebrook Hotel Trust, Series C, 6.50% Pfd. | 177,286 | 3,864,835 | ||||||
PS Business Parks, Inc., Series S, 6.45% Pfd. | 120,000 | 2,792,400 | ||||||
PS Business Parks, Inc., Series U, 5.75% Pfd. | 49,579 | 1,038,184 | ||||||
Public Storage, Series S, 5.90% Pfd. | 40,000 | 913,200 | ||||||
Public Storage, Series T, 5.75% Pfd. | 80,000 | 1,772,800 | ||||||
Regency Centers Corp., Series 6, 6.63% Pfd. | 176,801 | 4,137,143 | ||||||
Regency Centers Corp., Series 7, 6.00% Pfd. | 48,500 | 1,043,720 | ||||||
Saul Centers, Inc., Series C, 6.88% Pfd. | 155,000 | 3,661,100 | ||||||
Senior Housing Properties Trust 5.63% Sr. Unsec. Pfd. | 51,569 | 1,085,527 | ||||||
SL Green Realty Corp., Series I, 6.50% Pfd. | 336,000 | 7,775,040 | ||||||
Summit Hotel Properties, Inc., Series B, 7.88% Pfd. | 160,371 | 3,990,030 | ||||||
Sun Communities, Inc., Series A, 7.13% Pfd. | 9,470 | 231,542 | ||||||
Taubman Centers, Inc., Series J, 6.50% Pfd. | 179,429 | 4,114,307 | ||||||
Taubman Centers, Inc., Series K, 6.25% Pfd. | 316,000 | 6,917,240 | ||||||
Terreno Realty Corp., Series A, 7.75% Pfd. | 71,631 | 1,808,683 | ||||||
Ventas Realty L.P./Ventas Capital Corp., 5.45% Sr. Unsec. Gtd. Pfd. | 40,000 | 852,000 | ||||||
Vornado Realty Trust, Series G, 6.63% Pfd. | 22,000 | 532,180 | ||||||
Vornado Realty Trust, Series I, 6.63% Pfd. | 279,203 | 6,793,009 | ||||||
Weyerhaeuser Co., Series A, $3.19 Conv. Pfd. | 97,000 | 5,158,460 | ||||||
| 204,975,153 | ||||||||
Total Preferred Stocks |
| 210,266,218 | ||||||
| Principal Amount | Value | |||||||
Mortgage-Backed Securities–16.48% |
| |||||||
| Ireland–0.44% | ||||||||
DECO MHILL Ltd., Series 2012-MHLA, Class C, Floating Rate Pass Through Ctfs., 2.79%, 07/28/21(a)(b)(c) | GBP | 1,166,667 | $ | 1,813,487 | ||||
Series 2012-MHLX, Class C, Floating Rate Pass Through Ctfs., 2.78%, 07/28/21(b)(c) | GBP | 1,000,000 | 1,554,411 | |||||
Epic More London PLC, Series MLDN, Class E, Floating Rate Pass Through Ctfs., 1.36%, 07/15/17(b)(c) | GBP | 750,000 | 1,075,764 | |||||
| 4,443,662 | ||||||||
| United Kingdom–2.59% | ||||||||
Hercules (Eclipse) PLC., Series 2006-4, Class A, Floating Rate Pass Through Ctfs., 0.75%, 10/25/18(b)(c) | GBP | 1,888,246 | 2,714,064 | |||||
Series 2006-4, Class B, Floating Rate Pass Through Ctfs., 0.86%, 10/25/18(b)(c) | GBP | 3,842,446 | 5,057,031 | |||||
LCP Proudreed PLC, Series 1, Class A, Floating Rate Pass Through Ctfs., 0.77%, 08/25/16(b)(c) | GBP | 6,540,484 | 9,926,456 | |||||
Triton European Loan Conduit PLC, Series 26X, Class C, Floating Rate Pass Through Ctfs., 0.75%, 10/25/19(b)(c) | GBP | 144,136 | 222,251 | |||||
Series 26X, Class F, Floating Rate Pass Through Ctfs., 1.01%, 10/25/19(b)(c) | GBP | 64,997 | 99,374 | |||||
Windermere XI CMBS PLC, Series X, Class A, Floating Rate Pass Through Ctfs., 0.76%, 04/24/17(b)(c) | GBP | 5,528,093 | 8,374,130 | |||||
| 26,393,306 | ||||||||
| United States–13.45% | ||||||||
Bear Stearns Commercial Mortgage Securities Trust, Series 2004-PWR6, Class B, Pass Through Ctfs., 4.95%, 11/11/41(a) | $ | 50,000 | 52,905 | |||||
Series 2005-PWR8, Class C, Pass Through Ctfs., 4.86%, 06/11/41 | 4,900,000 | 4,808,017 | ||||||
Series 2005-PWR8, Class D, Pass Through Ctfs., 4.90%, 06/11/41 | 11,305,000 | 10,240,244 | ||||||
Citigroup/Deutsche Commercial Mortgage Trust, Series 2005-CD1, Class E, Variable Rate Pass Through Ctfs., 5.39%, 07/15/44(b) | 7,219,000 | 7,055,410 | ||||||
See accompanying Notes to Financial Statements which are an integral part of the financial statements.
12 Invesco Global Real Estate Income Fund
| Principal Amount | Value | |||||||
| United States–(continued) | ||||||||
Credit Suisse First Boston Mortgage Securities Corp., Series 2003-C3, Class G, Pass Through Ctfs., 4.62%, 05/15/38(a) | $ | 25,000 | $ | 25,048 | ||||
Series 2003-C5, Class G, Variable Rate Pass Through Ctfs., 5.75%, 12/15/36(a)(b) | 2,350,000 | 2,322,814 | ||||||
Series 2005-C3, Class B, Pass Through Ctfs., 4.88%, 07/15/37 | 9,950,000 | 9,235,441 | ||||||
Credit Suisse First Boston Mortgage Securities Corp., Series 2005-C4, Class D, Variable Rate Pass Through Ctfs., 5.38%, 08/15/38(b) | 2,950,000 | 2,893,466 | ||||||
Series 2005-C5, Class C, Pass Through Ctfs., 5.10%, 08/15/38 | 4,975,000 | 5,110,611 | ||||||
DLJ Commercial Mortgage Corp., Series 1998-CG1, Class B4, Variable Rate Pass Through Ctfs., 7.40%, 06/10/31(a)(b) | 25,693 | 25,727 | ||||||
FREMF Mortgage Trust, Series 2012-K705, Class C, Variable Rate Pass Through Ctfs., 4.31%, 09/25/44(a)(b) | 5,000,000 | 4,754,605 | ||||||
Series 2012-KF01, Class C, Floating Rate Pass Through Ctfs., 4.44%, 10/25/44(a)(b) | 1,278,000 | 1,323,582 | ||||||
GS Mortgage Securities Corp. II, Series 2013-KING, Class E, Variable Rate Pass Through Ctfs., 3.55%, 12/10/27(a)(b) | 1,000,000 | 874,394 | ||||||
GS Mortgage Securities Corp. Trust, Series 2013-NYC5, Class G, Variable Rate Pass Through Ctfs., 3.77%, 01/10/30(a)(b) | 4,000,000 | 3,721,556 | ||||||
JP Morgan Chase Commercial Mortgage Securities Corp., Series 2004-C3, Class F, Variable Rate Pass Through Ctfs., 5.25%, 01/15/42(a)(b) | 7,950,000 | 7,336,439 | ||||||
Series 2012-PHH, Class D, Floating Rate Pass Through Ctfs., 3.45%, 10/15/25(a)(b) | 3,250,000 | 3,280,906 | ||||||
Series 2012-PHH, Class E, Floating Rate Pass Through Ctfs., 3.45%, 10/15/25(a)(b) | 1,250,000 | 1,243,648 | ||||||
JP Morgan Chase Commercial Mortgage Securities Trust, Series 2011-C4, Class TAC1, Pass Through Ctfs., 7.99%, 07/15/46(a) | 1,927,389 | 2,018,263 | ||||||
LB-UBS Commercial Mortgage Trust, Series 2005-C1, Class C, Pass Through Ctfs., 4.84%, 02/15/40 | 170,000 | 175,211 | ||||||
Series 2006-C4, Class AJ, Pass Through Ctfs., 6.08%, 06/15/38 | 4,260,000 | 4,365,776 | ||||||
| Principal Amount | Value | |||||||
| United States–(continued) | ||||||||
Merrill Lynch Mortgage Trust, Series 2003-KEY1, Class F, Variable Rate Pass Through Ctfs., 5.85%, 11/12/35(a)(b) | $ | 937,000 | $ | 909,663 | ||||
Series 2004-MKB1, Class B, Variable Rate Pass Through Ctfs., 5.28%, 02/12/42(b) | 25,000 | 25,604 | ||||||
Series 2005-MCP1, Class E, Variable Rate Pass Through Ctfs., 5.13%, 06/12/43(a)(b) | 4,500,000 | 4,380,064 | ||||||
Morgan Stanley Bank of America Merrill Lynch Trust, Series 2012-CKSV, Class CK, Pass Through Ctfs., 4.30%, 10/15/30(a) | 3,900,000 | 3,228,030 | ||||||
Morgan Stanley Capital I Trust, Series 2005-HQ7, Class AJ, Pass Through Ctfs., 5.38%, 11/14/42 | 5,360,000 | 5,592,640 | ||||||
Series 2005-IQ10, Class B, Variable Rate Pass Through Ctfs., 5.44%, 09/15/42(b) | 6,475,000 | 6,585,551 | ||||||
Series 2006-HQ8, Class C, Variable Rate Pass Through Ctfs., 5.68%, 03/12/44(b) | 7,819,000 | 7,365,099 | ||||||
Series 2006-HQ8, Class D, Variable Rate Pass Through Ctfs., 5.68%, 03/12/44(b) | 7,400,000 | 6,779,688 | ||||||
Series 2006-HQ9, Class D, Pass Through Ctfs., 5.86%, 07/12/44 | 8,859,000 | 8,634,367 | ||||||
Series 2006-IQ11, Class B, Variable Rate Pass Through Ctfs., 5.86%, 10/15/42(b) | 270,000 | 249,261 | ||||||
Series 2007-TOP27, Class AJ, Variable Rate Pass Through Ctfs., 5.82%, 06/11/42(b) | 7,400,000 | 7,780,216 | ||||||
Series 2007-TOP27, Class AM, Variable Rate Pass Through Ctfs., 5.82%, 06/11/42(b) | 25,000 | 27,211 | ||||||
Wachovia Bank Commercial Mortgage Trust, Series 2004-C15, Class 175B, Pass Through Ctfs., 6.04%, 10/15/41(a) | 2,700,000 | 2,689,130 | ||||||
Series 2004-C15, Class 175C, Pass Through Ctfs., 6.04%, 10/15/41(a) | 396,000 | 392,500 | ||||||
Series 2005-C16, Class TO, Variable Rate Pass Through Ctfs., 5.62%, 10/15/41(a)(b) | 430,298 | 431,374 | ||||||
Series 2005-C17, Class G, Variable Rate Pass Through Ctfs., 5.59%, 03/15/42(a)(b) | 2,100,000 | 1,855,625 | ||||||
Series 2005-C19, Class F, Variable Rate Pass Through Ctfs., 5.61%, 05/15/44(a)(b) | 900,000 | 912,997 | ||||||
Series 2005-C19, Class G, Variable Rate Pass Through Ctfs., 5.62%, 05/15/44(a)(b) | 5,000,000 | 5,015,598 | ||||||
Series 2005-C21, Class D, Variable Rate Pass Through Ctfs., 5.41%, 10/15/44(b) | 3,450,000 | 3,550,940 | ||||||
| 137,269,621 | ||||||||
Total Mortgage-Backed Securities (Cost $165,432,826) |
| 168,106,589 | ||||||
See accompanying Notes to Financial Statements which are an integral part of the financial statements.
13 Invesco Global Real Estate Income Fund
| Principal Amount | Value | |||||||
U.S. Dollar Denominated Bonds & Notes–1.95% |
| |||||||
| Brazil–0.59% | ||||||||
BR Properties S.A., Sr. Unsec. Gtd. Notes, 9.00%(a)(d) | $ | 6,200,000 | $ | 6,020,426 | ||||
| China–1.27% | ||||||||
Agile Property Holdings Ltd., Sr. Unsec. Gtd. Euro Notes, 9.88%, 03/20/17 | 2,500,000 | 2,687,500 | ||||||
Country Garden Holdings Co. Ltd., Sr. Unsec. Gtd. Notes, 11.13%, 02/23/18(a) | 2,500,000 | 2,800,552 | ||||||
11.75%, 09/10/14(a) | 1,000,000 | 1,086,187 | ||||||
Franshion Development Ltd., Sr. Unsec. Gtd. Notes, 6.75%, 04/15/21(a) | 1,000,000 | 1,011,356 | ||||||
KWG Property Holdings Ltd., Sr. Unsec. Gtd. Euro Notes, 13.25%, 03/22/17 | 2,500,000 | 2,859,630 | ||||||
Sr. Unsec. Gtd. Notes, 12.50%, 08/18/17(a) | 2,300,000 | 2,547,250 | ||||||
| 12,992,475 | ||||||||
| United States–0.09% | ||||||||
Senior Housing Properties Trust, Sr. Unsec. Notes, 4.30%, 01/15/16 | 900,000 | 932,625 | ||||||
Total U.S. Dollar Denominated Bonds & Notes (Cost $19,882,949) |
| 19,945,526 | ||||||
| Principal Amount | Value | |||||||
Non U.S. Dollar Denominated Bonds & Notes–0.28%(c) |
| |||||||
| Australia–0.28% | ||||||||
General Property Trust, Sr. Unsec. Gtd. Medium-Term Notes, 6.75%, 01/24/19 (Cost $3,248,471) | AUD 2,980,000 | $ | 2,849,005 | |||||
| Shares | ||||||||
Money Market Funds–2.22% |
| |||||||
Liquid Assets Portfolio–Institutional Class(e) | 11,339,632 | 11,339,632 | ||||||
Premier Portfolio–Institutional Class(e) | 11,339,632 | 11,339,632 | ||||||
Total Money Market Funds |
| 22,679,264 | ||||||
TOTAL INVESTMENTS–99.16% |
| 1,011,825,259 | ||||||
OTHER ASSETS LESS LIABILITIES–0.84% |
| 8,571,801 | ||||||
NET ASSETS–100.00% |
| $ | 1,020,397,060 | |||||
Investment Abbreviations:
| AUD | – Australian Dollar | |
| Conv. | – Convertible | |
| Ctfs. | – Certificates | |
| GBP | – British Pound | |
| Gtd. | – Guaranteed | |
| Pfd. | – Preferred | |
| REIT | – Real Estate Investment Trust | |
| PLUS | – Perpetual Listed Unsecured Securities | |
| Sr. | – Senior | |
| Sub. | – Subordinated | |
| Unsec. | – Unsecured |
Notes to Schedule of Investments:
| (a) | Security purchased or received in a transaction exempt from registration under the Securities Act of 1933, as amended (the “1933 Act”). The security may be resold pursuant to an exemption from registration under the 1933 Act, typically to qualified institutional buyers. The aggregate value of these securities at August 31, 2013 was $62,999,913, which represented 6.17% of the Fund's Net Assets. |
| (b) | Interest or dividend rate is redetermined periodically. Rate shown is the rate in effect on August 31, 2013. |
| (c) | Foreign denominated security. Principal amount is denominated in currency indicated. |
| (d) | Perpetual bond with no specified maturity date. |
| (e) | The money market fund and the Fund are affiliated by having the same investment adviser. |
See accompanying Notes to Financial Statements which are an integral part of the financial statements.
14 Invesco Global Real Estate Income Fund
Statement of Assets and Liabilities
August 31, 2013
Assets: |
| |||
Investments, at value (Cost $1,034,262,593) | $ | 989,145,995 | ||
Investments in affiliated money market funds, at value and cost | 22,679,264 | |||
Total investments, at value (Cost $1,056,941,857) | 1,011,825,259 | |||
Foreign currencies, at value (Cost $3,390,278) | 3,380,679 | |||
Receivable for: | ||||
Investments sold | 197,954 | |||
Fund shares sold | 5,167,244 | |||
Dividends and interest | 2,769,797 | |||
Principal paydowns | 312,722 | |||
Investment for trustee deferred compensation and retirement plans | 39,062 | |||
Other assets | 92,654 | |||
Total assets | 1,023,785,371 | |||
Liabilities: |
| |||
Payable for: | ||||
Fund shares reacquired | 2,524,030 | |||
Accrued fees to affiliates | 642,967 | |||
Accrued trustees’ and officers’ fees and benefits | 5,152 | |||
Accrued other operating expenses | 100,923 | |||
Trustee deferred compensation and retirement plans | 115,239 | |||
Total liabilities | 3,388,311 | |||
Net assets applicable to shares outstanding | $ | 1,020,397,060 | ||
Net assets consist of: |
| |||
Shares of beneficial interest | $ | 1,050,423,809 | ||
Undistributed net investment income | 3,702,802 | |||
Undistributed net realized gain | 11,402,399 | |||
Net unrealized appreciation (depreciation) | (45,131,950 | ) | ||
| $ | 1,020,397,060 | |||
Net Assets: |
| |||
Class A | $ | 615,875,691 | ||
Class B | $ | 1,822,166 | ||
Class C | $ | 108,877,733 | ||
Class Y | $ | 270,195,883 | ||
Class R5 | $ | 23,565,461 | ||
Class R6 | $ | 60,126 | ||
Shares outstanding, $0.01 par value per share, |
| |||
Class A | 72,245,435 | |||
Class B | 214,198 | |||
Class C | 12,800,612 | |||
Class Y | 31,782,645 | |||
Class R5 | 2,767,119 | |||
Class R6 | 7,054 | |||
Class A: | ||||
Net asset value per share | $ | 8.52 | ||
Maximum offering price per share | ||||
(Net asset value of $8.52 ¸ 94.50%) | $ | 9.02 | ||
Class B: | ||||
Net asset value and offering price per share | $ | 8.51 | ||
Class C: | ||||
Net asset value and offering price per share | $ | 8.51 | ||
Class Y: | ||||
Net asset value and offering price per share | $ | 8.50 | ||
Class R5: | ||||
Net asset value and offering price per share | $ | 8.52 | ||
Class R6: | ||||
Net asset value and offering price per share | $ | 8.52 | ||
See accompanying Notes to Financial Statements which are an integral part of the financial statements.
15 Invesco Global Real Estate Income Fund
Statement of Operations
For the year ended August 31, 2013
Investment income: |
| |||
Dividends (net of foreign withholding taxes of $1,928,407) | $ | 35,962,663 | ||
Dividends from affiliated money market funds | 38,709 | |||
Interest (net of foreign withholding taxes of $ 14,800) | 9,209,460 | |||
Total investment income | 45,210,832 | |||
Expenses: | ||||
Advisory fees | 6,353,758 | |||
Administrative services fees | 222,509 | |||
Custodian fees | 178,571 | |||
Distribution fees: | ||||
Class A | 1,303,587 | |||
Class B | 18,790 | |||
Class C | 811,110 | |||
Transfer Agent Fees — A, B, C and Y | 1,399,254 | |||
Transfer agent fees — R5 | 27,353 | |||
Transfer agent fees – R6 | 680 | |||
Trustees’ and officers’ fees and benefits | 46,322 | |||
Other | 531,176 | |||
Total expenses | 10,893,110 | |||
Less: Fees waived and expense offset arrangement(s) | (58,380 | ) | ||
Net expenses | 10,834,730 | |||
Net investment income | 34,376,102 | |||
Realized and unrealized gain (loss) from: | ||||
Net realized gain from: | ||||
Investment securities | 20,306,651 | |||
Foreign currencies | 114,176 | |||
| 20,420,827 | ||||
Change in net unrealized appreciation (depreciation) of: | ||||
Investment securities | (78,715,545 | ) | ||
Foreign currencies | (34,886 | ) | ||
Foreign currency contracts | (86 | ) | ||
| (78,750,517 | ) | |||
Net realized and unrealized gain (loss) | (58,329,690 | ) | ||
Net increase (decrease) in net assets resulting from operations | $ | (23,953,588 | ) | |
See accompanying Notes to Financial Statements which are an integral part of the financial statements.
16 Invesco Global Real Estate Income Fund
Statement of Changes in Net Assets
For the years ended August 31, 2013 and 2012
| 2013 | 2012 | |||||||
Operations: |
| |||||||
Net investment income | $ | 34,376,102 | $ | 17,796,301 | ||||
Net realized gain | 20,420,827 | 5,140,914 | ||||||
Change in net unrealized appreciation (depreciation) | (78,750,517 | ) | 23,779,964 | |||||
Net increase (decrease) in net assets resulting from operations | (23,953,588 | ) | 46,717,179 | |||||
Distributions to shareholders from net investment income: | ||||||||
Class A | (25,666,681 | ) | (10,974,958 | ) | ||||
Class B | (85,901 | ) | (66,882 | ) | ||||
Class C | (3,226,317 | ) | (1,252,416 | ) | ||||
Class Y | (11,045,614 | ) | (2,665,994 | ) | ||||
Class R5 | (1,588,351 | ) | (1,805,834 | ) | ||||
Class R6 | (305,539 | ) | — | |||||
Total distributions from net investment income | (41,918,403 | ) | (16,766,084 | ) | ||||
Share transactions–net: | ||||||||
Class A | 336,455,070 | 96,606,755 | ||||||
Class B | 313,925 | (276,855 | ) | |||||
Class C | 72,059,586 | 15,641,770 | ||||||
Class Y | 173,687,611 | 82,201,168 | ||||||
Class R5 | (5,198,420 | ) | (7,962,465 | ) | ||||
Class R6 | (509,175 | ) | — | |||||
Net increase in net assets resulting from share transactions | 576,808,597 | 186,210,373 | ||||||
Net increase in net assets | 510,936,606 | 216,161,468 | ||||||
Net assets: | ||||||||
Beginning of year | 509,460,454 | 293,298,986 | ||||||
End of year (includes undistributed net investment income of $3,702,802 and $3,560,721, respectively) | $ | 1,020,397,060 | $ | 509,460,454 | ||||
Notes to Financial Statements
August 31, 2013
NOTE 1—Significant Accounting Policies
Invesco Global Real Estate Income Fund (the “Fund”) is a series portfolio of AIM Counselor Series Trust (Invesco Counselor Series Trust) (the “Trust”). The Trust is a Delaware statutory trust registered under the Investment Company Act of 1940, as amended (the “1940 Act”), as an open-end series management investment company consisting of twelve separate portfolios, each authorized to issue an unlimited number of shares of beneficial interest. The assets, liabilities and operations of each portfolio are accounted for separately. Information presented in these financial statements pertains only to the Fund. Matters affecting each portfolio or class will be voted on exclusively by the shareholders of such portfolio or class.
The Fund’s investment objective is current income and, secondarily, capital appreciation.
The Fund currently consists of six different classes of shares: Class A, Class B, Class C, Class Y, Class R5 and Class R6. On September 24, 2012, Institutional Class shares were renamed Class R5 shares and the Fund began offering Class R6 shares. Class A shares are sold with a front-end sales charge unless certain waiver criteria are met and under certain circumstances load waived shares may be subject to contingent deferred sales charges (“CDSC”). Class C shares are sold with a CDSC. Class Y, Class R5 and Class R6 shares are sold at net asset value. Effective November 30, 2010, new or additional investments in Class B shares are no longer permitted. Existing shareholders of Class B shares may continue to reinvest dividends and capital gains distributions in Class B shares until they convert to Class A shares. Also, shareholders in Class B shares will be able to exchange those shares for Class B shares of other Invesco Funds offering such shares until they convert to Class A shares. Generally, Class B shares will automatically convert to Class A shares on or about the month-end, which is at least eight years after the date of purchase. Redemption of Class B shares prior to the conversion date will be subject to a CDSC.
The following is a summary of the significant accounting policies followed by the Fund in the preparation of its financial statements.
| A. | Security Valuations — Securities, including restricted securities, are valued according to the following policy. |
A security listed or traded on an exchange (except convertible bonds) is valued at its last sales price or official closing price as of the close of the customary trading session on the exchange where the security is principally traded, or lacking any sales or official closing price on a particular day, the security may be valued at the closing bid price on that day. Securities traded in the over-the-counter market are valued based on prices furnished by independent pricing services or market makers. When such securities are valued by an independent pricing service they may be considered fair valued. Futures contracts are valued at the final settlement price set by an exchange on which they are principally traded. Listed options are valued at the mean between the last bid and ask prices from the exchange on which they are principally traded. Options not listed on
17 Invesco Global Real Estate Income Fund
an exchange are valued by an independent source at the mean between the last bid and ask prices. For purposes of determining net asset value per share, futures and option contracts generally are valued 15 minutes after the close of the customary trading session of the New York Stock Exchange (“NYSE”).
Investments in open-end and closed-end registered investment companies that do not trade on an exchange are valued at the end of day net asset value per share. Investments in open-end and closed-end registered investment companies that trade on an exchange are valued at the last sales price or official closing price as of the close of the customary trading session on the exchange where the security is principally traded.
Debt obligations (including convertible bonds) and unlisted equities are fair valued using an evaluated quote provided by an independent pricing service. Evaluated quotes provided by the pricing service may be determined without exclusive reliance on quoted prices, and may reflect appropriate factors such as institution-size trading in similar groups of securities, developments related to specific securities, dividend rate (for unlisted equities), yield (for debt obligations), quality, type of issue, coupon rate (for debt obligations), maturity (for debt obligations), individual trading characteristics and other market data. Debt obligations are subject to interest rate and credit risks. In addition, all debt obligations involve some risk of default with respect to interest and/or principal payments.
Foreign securities’ (including foreign exchange contracts) prices are converted into U.S. dollar amounts using the applicable exchange rates as of the close of the NYSE. If market quotations are available and reliable for foreign exchange-traded equity securities, the securities will be valued at the market quotations. Because trading hours for certain foreign securities end before the close of the NYSE, closing market quotations may become unreliable. If between the time trading ends on a particular security and the close of the customary trading session on the NYSE, events occur that the Adviser determines are significant and make the closing price unreliable, the Fund may fair value the security. If the event is likely to have affected the closing price of the security, the security will be valued at fair value in good faith using procedures approved by the Board of Trustees. Adjustments to closing prices to reflect fair value may also be based on a screening process of an independent pricing service to indicate the degree of certainty, based on historical data, that the closing price in the principal market where a foreign security trades is not the current value as of the close of the NYSE. Foreign securities’ prices meeting the approved degree of certainty that the price is not reflective of current value will be priced at the indication of fair value from the independent pricing service. Multiple factors may be considered by the independent pricing service in determining adjustments to reflect fair value and may include information relating to sector indices, American Depositary Receipts and domestic and foreign index futures. Foreign securities may have additional risks including exchange rate changes, potential for sharply devalued currencies and high inflation, political and economic upheaval, the relative lack of issuer information, relatively low market liquidity and the potential lack of strict financial and accounting controls and standards.
Securities for which market prices are not provided by any of the above methods may be valued based upon quotes furnished by independent sources. The last bid price may be used to value equity securities. The mean between the last bid and asked prices will be used to value debt obligations and corporate loans.
Securities for which market quotations are not readily available or became unreliable are valued at fair value as determined in good faith by or under the supervision of the Trust’s officers following procedures approved by the Board of Trustees. Issuer specific events, market trends, bid/ask quotes of brokers and information providers and other market data may be reviewed in the course of making a good faith determination of a security’s fair value.
Valuations change in response to many factors including the historical and prospective earnings of the issuer, the value of the issuer’s assets, general economic conditions, interest rates, investor perceptions and market liquidity. Because of the inherent uncertainties of valuation, the values reflected in the financial statements may materially differ from the value received upon actual sale of those investments.
| B. | Securities Transactions and Investment Income — Securities transactions are accounted for on a trade date basis. Realized gains or losses on sales are computed on the basis of specific identification of the securities sold. Interest income is recorded on the accrual basis from settlement date. Paydown gains and losses on mortgage and asset-backed securities are recorded as adjustments to interest income. Dividend income (net of withholding tax, if any) is recorded on the ex-dividend date. Bond premiums and discounts are amortized and/or accreted for financial reporting purposes. |
The Fund may periodically participate in litigation related to Fund investments. As such, the Fund may receive proceeds from litigation settlements. Any proceeds received are included in the Statement of Operations as realized gain (loss) for investments no longer held and as unrealized gain (loss) for investments still held.
Brokerage commissions and mark ups are considered transaction costs and are recorded as an increase to the cost basis of securities purchased and/or a reduction of proceeds on a sale of securities. Such transaction costs are included in the determination of net realized and unrealized gain (loss) from investment securities reported in the Statement of Operations and the Statement of Changes in Net Assets and the net realized and unrealized gains (losses) on securities per share in the Financial Highlights. Transaction costs are included in the calculation of the Fund’s net asset value and, accordingly, they reduce the Fund’s total returns. These transaction costs are not considered operating expenses and are not reflected in net investment income reported in the Statement of Operations and Statement of Changes in Net Assets, or the net investment income per share and ratios of expenses and net investment income reported in the Financial Highlights, nor are they limited by any expense limitation arrangements between the Fund and the investment adviser.
The Fund recharacterizes distributions received from REIT investments based on information provided by the REIT into the following categories: ordinary income, long-term and short-term capital gains, and return of capital. If information is not available timely from the REIT, the recharacterization will be based on available information which may include the previous year’s allocation. If new or additional information becomes available from the REIT at a later date, a recharacterization will be made in the following year. The Fund records as dividend income the amount recharacterized as ordinary income and as realized gain the amount recharacterized as capital gain in the Statement of Operations, and the amount recharacterized as return of capital in the Statement of Changes in Net Assets. These recharacterizations are reflected in the accompanying financial statements.
| C. | Country Determination — For the purposes of making investment selection decisions and presentation in the Schedule of Investments, the investment adviser may determine the country in which an issuer is located and/or credit risk exposure based on various factors. These factors include the laws of the country under which the issuer is organized, where the issuer maintains a principal office, the country in which the issuer derives 50% or more of its total revenues and the country that has the primary market for the issuer’s securities, as well as other criteria. Among the other criteria that may be evaluated for making this determination are the country in which the issuer maintains 50% or more of its assets, |
18 Invesco Global Real Estate Income Fund
| the type of security, financial guarantees and enhancements, the nature of the collateral and the sponsor organization. Country of issuer and/or credit risk exposure has been determined to be the United States of America, unless otherwise noted. |
| D. | Distributions — Distributions from income, if any, are declared and paid quarterly and are recorded on the ex-dividend date. Distributions from net realized capital gain, if any, are generally declared and paid annually and recorded on the ex-dividend date. The Fund may elect to treat a portion of the proceeds from redemptions as distributions for federal income tax purposes. |
| E. | Federal Income Taxes — The Fund intends to comply with the requirements of Subchapter M of the Internal Revenue Code of 1986, as amended (the “Internal Revenue Code”), necessary to qualify as a regulated investment company and to distribute substantially all of the Fund’s taxable earnings to shareholders. As such, the Fund will not be subject to federal income taxes on otherwise taxable income (including net realized capital gain) that is distributed to shareholders. Therefore, no provision for federal income taxes is recorded in the financial statements. |
The Fund files tax returns in the U.S. Federal jurisdiction and certain other jurisdictions. Generally, the Fund is subject to examinations by such taxing authorities for up to three years after the filing of the return for the tax period.
| F. | Expenses — Fees provided for under the Rule 12b-1 plan of a particular class of the Fund are charged to the operations of such class. Transfer agency fees and expenses and other shareholder recordkeeping fees and expenses attributable to Class R5 and Class R6 are allocated to each share class based on relative net assets. Sub-accounting fees attributable to Class R5 are charged to the operations of the class. Transfer agency fees and expenses and other shareholder recordkeeping fees and expenses relating to all other classes are allocated among those classes based on relative net assets. All other expenses are allocated among the classes based on relative net assets. |
| G. | Accounting Estimates — The preparation of financial statements in conformity with accounting principles generally accepted in the United States of America (“GAAP”) requires management to make estimates and assumptions that affect the reported amounts of assets and liabilities at the date of the financial statements and the reported amounts of revenues and expenses during the reporting period including estimates and assumptions related to taxation. Actual results could differ from those estimates by a significant amount. In addition, the Fund monitors for material events or transactions that may occur or become known after the period-end date and before the date the financial statements are released to print. |
| H. | Indemnifications — Under the Trust’s organizational documents, each Trustee, officer, employee or other agent of the Trust is indemnified against certain liabilities that may arise out of the performance of their duties to the Fund. Additionally, in the normal course of business, the Fund enters into contracts, including the Fund’s servicing agreements, that contain a variety of indemnification clauses. The Fund’s maximum exposure under these arrangements is unknown as this would involve future claims that may be made against the Fund that have not yet occurred. The risk of material loss as a result of such indemnification claims is considered remote. |
| I. | Foreign Currency Translations — Foreign currency is valued at the close of the NYSE based on quotations posted by banks and major currency dealers. Portfolio securities and other assets and liabilities denominated in foreign currencies are translated into U.S. dollar amounts at date of valuation. Purchases and sales of portfolio securities (net of foreign taxes withheld on disposition) and income items denominated in foreign currencies are translated into U.S. dollar amounts on the respective dates of such transactions. The Fund does not separately account for the portion of the results of operations resulting from changes in foreign exchange rates on investments and the fluctuations arising from changes in market prices of securities held. The combined results of changes in foreign exchange rates and the fluctuation of market prices on investments (net of estimated foreign tax withholding) are included with the net realized and unrealized gain or loss from investments in the Statement of Operations. Reported net realized foreign currency gains or losses arise from (1) sales of foreign currencies, (2) currency gains or losses realized between the trade and settlement dates on securities transactions, and (3) the difference between the amounts of dividends, interest, and foreign withholding taxes recorded on the Fund’s books and the U.S. dollar equivalent of the amounts actually received or paid. Net unrealized foreign currency gains and losses arise from changes in the fair values of assets and liabilities, other than investments in securities at fiscal period end, resulting from changes in exchange rates. |
The Fund may invest in foreign securities which may be subject to foreign taxes on income, gains on investments or currency repatriation, a portion of which may be recoverable.
| J. | Foreign Currency Contracts — The Fund may enter into foreign currency contracts to manage or minimize currency or exchange rate risk. The Fund may also enter into foreign currency contracts for the purchase or sale of a security denominated in a foreign currency in order to “lock in” the U.S. dollar price of that security. A foreign currency contract is an obligation to purchase or sell a specific currency for an agreed-upon price at a future date. The use of foreign currency contracts does not eliminate fluctuations in the price of the underlying securities the Fund owns or intends to acquire but establishes a rate of exchange in advance. Fluctuations in the value of these contracts are measured by the difference in the contract date and reporting date exchange rates and are recorded as unrealized appreciation (depreciation) until the contracts are closed. When the contracts are closed, realized gains (losses) are recorded. Realized and unrealized gains (losses) on the contracts are included in the Statement of Operations. The primary risks associated with foreign currency contracts include failure of the counterparty to meet the terms of the contract and the value of the foreign currency changing unfavorably. These risks may be in excess of the amounts reflected in the Statement of Assets and Liabilities. |
| K. | Other Risks — The Fund’s investments are concentrated in a comparatively narrow segment of the economy. Consequently, the Fund may tend to be more volatile than other mutual funds, and the value of the Fund’s investments may tend to rise and fall more rapidly. |
Because, the Fund concentrates its assets in the real estate industry, an investment in the Fund will be closely linked to the performance of the real estate markets. Property values may fall due to increasing vacancies or declining rents resulting from economic, legal, cultural or technological developments.
19 Invesco Global Real Estate Income Fund
NOTE 2—Advisory Fees and Other Fees Paid to Affiliates
The Trust has entered into a master investment advisory agreement with Invesco Advisers, Inc. (the “Adviser” or “Invesco”). Under the terms of the investment advisory agreement, the Fund pays an advisory fee to the Adviser based on the annual rate of the Fund’s average daily net assets as follows:
| Average Daily Net Assets | Rate | |||
First $250 million | 0.75% | |||
Next $250 million | 0.74% | |||
Next $500 million | 0.73% | |||
Next $1.5 billion | 0.72% | |||
Next $2.5 billion | 0.71% | |||
Next $2.5 billion | 0.70% | |||
Next $2.5 billion | 0.69% | |||
Over $10 billion | 0.68% | |||
Under the terms of a master sub-advisory agreement between the Adviser and each of Invesco Asset Management Deutschland GmbH, Invesco Asset Management Limited, Invesco Asset Management (Japan) Limited, Invesco Australia Limited, Invesco Hong Kong Limited, Invesco Senior Secured Management, Inc. and Invesco Canada Ltd. (collectively, the “Affiliated Sub-Advisers”) the Adviser, not the Fund, may pay 40% of the fees paid to the Adviser to any such Affiliated Sub-Adviser(s) that provide(s) discretionary investment management services to the Fund based on the percentage of assets allocated to such Sub-Adviser(s).
The Adviser has contractually agreed, through at least June 30, 2014, to waive advisory fees and/or reimburse expenses of all shares to the extent necessary to limit total annual fund operating expenses after fee waiver and/or expense reimbursemnt (excluding certain items discussed below) of Class A, Class B, Class C, Class Y, Class R5 and Class R6 shares to 2.00%, 2.75%, 2.75%, 1.75%, 1.75% and 1.75% of average daily net assets. In determining the Adviser's obligation to waive advisory fees and/or reimburse expenses, the following expenses are not taken into account, and could cause the total annual fund operating expenses after fee waiver and/or expense reimbursemnt to exceed the numbers reflected above: (1) interest; (2) taxes; (3) dividend expense on short sales; (4) extraordinary or non-routine items, including litigation expenses; and (5) expenses that the Fund has incurred but did not actually pay because of an expense offset arrangement. Unless the Board of Trustees and Invesco mutually agree to amend or continue the fee waiver agreement, it will terminate on June 30, 2014. The Adviser did not waive fees and/or reimburse expenses during the period under this expense limitation.
Further, the Adviser has contractually agreed, through at least June 30, 2014, to waive the advisory fee payable by the Fund in an amount equal to 100% of the net advisory fees the Adviser receives from the affiliated money market funds on investments by the Fund of uninvested cash in such affiliated money market funds.
For the year ended August 31, 2013, the Adviser waived advisory fees of $57,127.
The Trust has entered into a master administrative services agreement with Invesco pursuant to which the Fund has agreed to pay Invesco for certain administrative costs incurred in providing accounting services to the Fund. For the year ended August 31, 2013, expenses incurred under the agreement are shown in the Statement of Operations as Administrative services fees.
The Trust has entered into a transfer agency and service agreement with Invesco Investment Services, Inc. (“IIS”) pursuant to which the Fund has agreed to pay IIS a fee for providing transfer agency and shareholder services to the Fund and reimburse IIS for certain expenses incurred by IIS in the course of providing such services. IIS may make payments to intermediaries that provide omnibus account services, sub-accounting services and/or networking services. All fees payable by IIS to intermediaries that provide omnibus account services or sub-accounting are charged back to the Fund, subject to certain limitations approved by the Trust's Board of Trustees. For the year ended August 31, 2013, expenses incurred under the agreement are shown in the Statement of Operations as Transfer agent fees.
The Trust has entered into master distribution agreements with Invesco Distributors, Inc. (“IDI”) to serve as the distributor for the Class A, Class B, Class C, Class Y, Class R5 and Class R6 shares of the Fund. The Trust has adopted plans pursuant to Rule 12b-1 under the 1940 Act with respect to the Fund’s Class A, Class B and Class C shares (collectively, the “Plans”). The Fund, pursuant to the Plans, pays IDI compensation at the annual rate of 0.25% of the Fund’s average daily net assets of Class A shares and 1.00% of the average daily net assets of Class B and Class C shares. Of the Plan payments, up to 0.25% of the average daily net assets of each class of shares may be paid to furnish continuing personal shareholder services to customers who purchase and own shares of such classes. Any amounts not paid as a service fee under the Plans would constitute an asset-based sales charge. Rules of the Financial Industry Regulatory Authority (“FINRA”) impose a cap on the total sales charges, including asset-based sales charges, that may be paid by any class of shares of the Fund. For the year ended August 31, 2013, expenses incurred under the Plans are shown in the Statement of Operations as Distribution fees.
Front-end sales commissions and CDSC (collectively, the “sales charges”) are not recorded as expenses of the Fund. Front-end sales commissions are deducted from proceeds from the sales of Fund shares prior to investment in Class A shares of the Fund. CDSC are deducted from redemption proceeds prior to remittance to the shareholder. During the year ended August 31, 2013, IDI advised the Fund that IDI retained $602,366 in front-end sales commissions from the sale of Class A shares and $85, $1,635 and $13,921 from Class A, Class B and Class C shares, respectively, for CDSC imposed on redemptions by shareholders.
Certain officers and trustees of the Trust are officers and directors of the Adviser, IIS and/or IDI.
NOTE 3—Additional Valuation Information
GAAP defines fair value as the price that would be received to sell an asset or paid to transfer a liability in an orderly transaction between market participants at the measurement date, under current market conditions. GAAP establishes a hierarchy that prioritizes the inputs to valuation methods, giving the highest priority to readily available unadjusted quoted prices in an active market for identical assets (Level 1) and the lowest priority to significant unobservable inputs (Level 3), generally when market prices are not readily available or are unreliable. Based on the valuation inputs, the
20 Invesco Global Real Estate Income Fund
securities or other investments are tiered into one of three levels. Changes in valuation methods may result in transfers in or out of an investment’s assigned level:
| Level 1 — | Prices are determined using quoted prices in an active market for identical assets. |
| Level 2 — | Prices are determined using other significant observable inputs. Observable inputs are inputs that other market participants may use in pricing a security. These may include quoted prices for similar securities, interest rates, prepayment speeds, credit risk, yield curves, loss severities, default rates, discount rates, volatilities and others. |
| Level 3 — | Prices are determined using significant unobservable inputs. In situations where quoted prices or observable inputs are unavailable (for example, when there is little or no market activity for an investment at the end of the period), unobservable inputs may be used. Unobservable inputs reflect the Fund’s own assumptions about the factors market participants would use in determining fair value of the securities or instruments and would be based on the best available information. |
The following is a summary of the tiered valuation input levels, as of August 31, 2013. The level assigned to the securities valuations may not be an indication of the risk or liquidity associated with investing in those securities. Because of the inherent uncertainties of valuation, the values reflected in the financial statements may materially differ from the value received upon actual sale of those investments.
During the year ended August 31, 2013, there were transfers from Level 1 to Level 2 of $47,431,739 and from Level 2 to Level 1 of $28,692,392, due to foreign fair value adjustments, additionally, there were transfers from Level 2 to Level 1 of $4,137,143, due to securities trading on an exchange.
| Level 1 | Level 2 | Level 3 | Total | |||||||||||||
Australia | $ | 5,291,065 | $ | 57,287,736 | $ | — | $ | 62,578,801 | ||||||||
Brazil | — | 6,020,426 | — | 6,020,426 | ||||||||||||
Canada | 47,315,081 | — | — | 47,315,081 | ||||||||||||
China | — | 18,773,995 | — | 18,773,995 | ||||||||||||
France | 9,482,986 | 15,275,653 | — | 24,758,639 | ||||||||||||
Germany | 7,091,345 | — | — | 7,091,345 | ||||||||||||
Hong Kong | 2,643,114 | 15,027,582 | — | 17,670,696 | ||||||||||||
Ireland | — | 4,443,662 | — | 4,443,662 | ||||||||||||
Japan | 11,407,775 | 65,664,263 | — | 77,072,038 | ||||||||||||
New Zealand | 2,215,532 | — | — | 2,215,532 | ||||||||||||
Singapore | — | 39,834,158 | — | 39,834,158 | ||||||||||||
South Africa | 6,650,992 | 3,140,617 | — | 9,791,609 | ||||||||||||
Sweden | 2,082,597 | — | — | 2,082,597 | ||||||||||||
United Kingdom | 43,583,846 | 26,393,306 | — | 69,977,152 | ||||||||||||
United States | 473,225,273 | 148,974,255 | — | 622,199,528 | ||||||||||||
Total Investments | $ | 610,989,606 | $ | 400,835,653 | $ | — | $ | 1,011,825,259 | ||||||||
NOTE 4—Derivative Investments
Effect of Derivative Investments for the year ended August 31, 2013
The table below summarizes the gains (losses) on derivative investments, detailed by primary risk exposure, recognized in earnings during the period:
| Location of Gain (Loss) on Statement of Operations | ||||
| Foreign Currency Contracts | ||||
Change in Unrealized Appreciation (Depreciation) | ||||
Currency risk | $ | (86 | ) | |
NOTE 5—Expense Offset Arrangement(s)
The expense offset arrangements are comprised of (1) transfer agency credits which result from balances in Demand Deposit Accounts (DDA) used by the transfer agent for clearing shareholder transactions and (2) custodian credits which result from periodic overnight cash balances at the custodian. For the year ended August 31, 2013, the Fund received credits from these arrangements, which resulted in the reduction of the Fund’s total expenses of $1,253.
NOTE 6—Trustees’ and Officers’ Fees and Benefits
“Trustees’ and Officers’ Fees and Benefits” include amounts accrued by the Fund to pay remuneration to certain Trustees and Officers of the Fund. Trustees have the option to defer compensation payable by the Fund, and “Trustees’ and Officers’ Fees and Benefits” also include amounts accrued by the Fund to fund such deferred compensation amounts. Those Trustees who defer compensation have the option to select various Invesco Funds in which their deferral accounts shall be deemed to be invested. Finally, certain current Trustees are eligible to participate in a retirement plan that provides for benefits to be paid upon retirement to Trustees over a period of time based on the number of years of service. The Fund may have certain former Trustees who also participate in a retirement plan and receive benefits under such plan. “Trustees’ and Officers’ Fees and Benefits” include amounts accrued by the Fund to fund such retirement benefits. Obligations under the deferred compensation and retirement plans represent unsecured claims against the general assets of the Fund.
21 Invesco Global Real Estate Income Fund
NOTE 7—Cash Balances
The Fund is permitted to temporarily carry a negative or overdrawn balance in its account with State Street Bank and Trust Company, the custodian bank. Such balances, if any at period end, are shown in the Statement of Assets and Liabilities under the payable caption Amount due custodian. To compensate the custodian bank for such overdrafts, the overdrawn Fund may either (1) leave funds as a compensating balance in the account so the custodian bank can be compensated by earning the additional interest; or (2) compensate by paying the custodian bank at a rate agreed upon by the custodian bank and Invesco, not to exceed the contractually agreed upon rate.
NOTE 8—Distributions to Shareholders and Tax Components of Net Assets
Tax Character of Distributions to Shareholders Paid During the Years Ended August 31, 2013 and 2012:
| 2013 | 2012 | |||||||
Ordinary income | $ | 41,918,403 | $ | 16,766,084 | ||||
Tax Components of Net Assets at Period-End:
| 2013 | ||||
Undistributed ordinary income | $ | 11,020,876 | ||
Undistributed long-term gain | 11,976,125 | |||
Net unrealized appreciation (depreciation) — investments | (52,898,488 | ) | ||
Net unrealized appreciation (depreciation) — other investments | (15,352 | ) | ||
Temporary book/tax differences | (109,910 | ) | ||
Shares of beneficial interest | 1,050,423,809 | |||
Total net assets | $ | 1,020,397,060 | ||
The difference between book-basis and tax-basis unrealized appreciation (depreciation) is due to differences in the timing of recognition of gains and losses on investments for tax and book purposes. The Fund’s net unrealized appreciation (depreciation) difference is attributable primarily to wash sales and passive foreign investments.
The temporary book/tax differences are a result of timing differences between book and tax recognition of income and/or expenses. The Fund’s temporary book/tax differences are the result of the trustee deferral of compensation and retirement plan benefits.
Capital loss carryforward is calculated and reported as of a specific date. Results of transactions and other activity after that date may affect the amount of capital loss carryforward actually available for the Fund to utilize. The Regulated Investment Company Modernization Act of 2010 eliminated the eight-year carryover period for capital losses that arise in taxable years beginning after its enactment date of December 22, 2010. Consequently, these capital losses can be carried forward for an unlimited period. However, capital losses with an expiration period may not be used to offset capital gains until all net capital losses without an expiration date have been utilized. Additionally, post-enactment capital loss carryovers will retain their character as either short-term or long-term capital losses instead of as short-term capital losses as under prior law. The ability to utilize capital loss carryforward in the future may be limited under the Internal Revenue Code and related regulations based on the results of future transactions.
The Fund utilized $180,408 of capital loss carryforward in the current period to offset net realized capital gain for federal income tax purposes. The Fund does not have a capital loss carryforward as of August 31, 2013.
NOTE 9—Investment Securities
The aggregate amount of investment securities (other than short-term securities, U.S. Treasury obligations and money market funds, if any) purchased and sold by the Fund during the year ended August 31, 2013 was $1,073,933,225 and $511,351,215, respectively. Cost of investments on a tax basis includes the adjustments for financial reporting purposes as of the most recently completed federal income tax reporting period-end.
| Unrealized Appreciation (Depreciation) of Investment Securities on a Tax Basis | ||||
Aggregate unrealized appreciation of investment securities | $ | 21,920,282 | ||
Aggregate unrealized (depreciation) of investment securities | (74,818,770 | ) | ||
Net unrealized appreciation (depreciation) of investment securities | $ | (52,898,488 | ) | |
Cost of investments for tax purposes is $1,064,723,747.
NOTE 10—Reclassification of Permanent Differences
Primarily as a result of differing book/tax treatment of foreign currency transactions and passive foreign investment companies, on August 31, 2013, undistributed net investment income was increased by $7,684,382, undistributed net realized gain was decreased by $7,575,089 and shares of beneficial interest was decreased by $109,293. This reclassification had no effect on the net assets of the Fund.
22 Invesco Global Real Estate Income Fund
NOTE 11—Share Information
| Summary of Share Activity | ||||||||||||||||
| Years ended August 31, | ||||||||||||||||
| 2013(a) | 2012 | |||||||||||||||
| Shares | Amount | Shares | Amount | |||||||||||||
Sold: | ||||||||||||||||
Class A | 51,782,661 | $ | 473,071,246 | 18,683,381 | $ | 159,199,288 | ||||||||||
Class B | 92,521 | 840,179 | 46,872 | 393,823 | ||||||||||||
Class C | 9,354,648 | 86,167,442 | 2,369,846 | 20,158,359 | ||||||||||||
Class Y | 28,585,952 | 260,842,380 | 11,969,982 | 101,722,029 | ||||||||||||
Class R5 | 1,792,319 | 16,207,911 | 2,439,672 | 20,294,421 | ||||||||||||
Class R6(b) | 1,058,633 | 9,542,340 | — | — | ||||||||||||
Issued as reinvestment of dividends: | ||||||||||||||||
Class A | 2,262,975 | 20,143,201 | 943,687 | 7,809,770 | ||||||||||||
Class B | 8,184 | 72,954 | 6,776 | 55,840 | ||||||||||||
Class C | 310,380 | 2,758,916 | 123,735 | 1,024,338 | ||||||||||||
Class Y | 1,013,301 | 9,002,041 | 246,272 | 2,050,366 | ||||||||||||
Class R5 | 165,684 | 1,478,806 | 198,667 | 1,639,410 | ||||||||||||
Class R6 | 34,061 | 305,436 | — | — | ||||||||||||
Automatic conversion of Class B shares to Class A shares: | ||||||||||||||||
Class A | 34,937 | 321,041 | 34,166 | 290,854 | ||||||||||||
Class B | (34,993 | ) | (321,041 | ) | (34,221 | ) | (290,854 | ) | ||||||||
Reacquired: | ||||||||||||||||
Class A | (17,336,317 | ) | (157,080,418 | ) | (8,381,414 | ) | (70,693,157 | ) | ||||||||
Class B | (30,996 | ) | (278,167 | ) | (51,839 | ) | (435,664 | ) | ||||||||
Class C | (1,869,410 | ) | (16,866,772 | ) | (658,315 | ) | (5,540,927 | ) | ||||||||
Class Y | (10,617,706 | ) | (96,156,810 | ) | (2,540,668 | ) | (21,571,227 | ) | ||||||||
Class R5 | (2,548,470 | ) | (22,885,137 | ) | (3,552,032 | ) | (29,896,296 | ) | ||||||||
Class R6 | (1,085,640 | ) | (10,356,951 | ) | — | — | ||||||||||
Net increase in share activity | 62,972,724 | $ | 576,808,597 | 21,844,567 | $ | 186,210,373 | ||||||||||
| (a) | There are entities that are record owners of more than 5% of the outstanding shares of the Fund and in the aggregate own 63% of the outstanding shares of the Fund. IDI has an agreement with these entities to sell Fund shares. The Fund, Invesco and/or Invesco affiliates may make payments to these entities, which are considered to be related to the Fund, for providing services to the Fund, Invesco and/or Invesco affiliates including but not limited to services such as securities brokerage, distribution, third party record keeping and account servicing. The Fund has no knowledge as to whether all or any portion of the shares owned of record by these entities are also owned beneficially. |
| (b) | Commencement date of September 24, 2012. |
23 Invesco Global Real Estate Income Fund
NOTE 12—Financial Highlights
The following schedule presents financial highlights for a share of the Fund outstanding throughout the periods indicated.
| Net asset value, beginning of period | Net investment income(a) | Net gains (losses) on securities (both realized and unrealized) | Total from investment operations | Dividends from net investment income | Net asset value, end of period | Total return(b) | Net assets, end of period (000’s omitted) | Ratio of expenses to average net assets with fee waivers and/or expenses absorbed | Ratio of expenses to average net assets without fee waivers and/or expenses absorbed | Ratio of net investment income to average net assets | Portfolio turnover(c) | |||||||||||||||||||||||||||||||||||||
Class A | ||||||||||||||||||||||||||||||||||||||||||||||||
Year ended 08/31/13 | $ | 8.97 | $ | 0.36 | $ | (0.31 | ) | $ | 0.05 | $ | (0.50 | ) | $ | 8.52 | 0.43 | % | $ | 615,876 | 1.26 | %(d) | 1.27 | %(d) | 4.00 | %(d) | 63 | % | ||||||||||||||||||||||
Year ended 08/31/12 | 8.39 | 0.41 | 0.57 | 0.98 | (0.40 | ) | 8.97 | (e) | 12.19 | 318,464 | 1.31 | 1.31 | 4.82 | 49 | ||||||||||||||||||||||||||||||||||
Year ended 08/31/11 | 7.77 | 0.32 | 0.61 | 0.93 | (0.31 | ) | 8.39 | 12.11 | 203,100 | 1.30 | 1.30 | 3.83 | 101 | |||||||||||||||||||||||||||||||||||
Year ended 08/31/10 | 6.62 | 0.28 | 1.14 | 1.42 | (0.27 | ) | 7.77 | 21.85 | 147,568 | 1.37 | 1.38 | 3.93 | 77 | |||||||||||||||||||||||||||||||||||
Year ended 08/31/09 | 8.38 | 0.27 | (1.75 | ) | (1.48 | ) | (0.28 | ) | 6.62 | (17.12 | ) | 94,979 | 1.73 | 1.74 | 4.83 | 59 | ||||||||||||||||||||||||||||||||
Class B | ||||||||||||||||||||||||||||||||||||||||||||||||
Year ended 08/31/13 | 8.95 | 0.29 | (0.30 | ) | (0.01 | ) | (0.43 | ) | 8.51 | (0.23 | ) | 1,822 | 2.01 | (d) | 2.02 | (d) | 3.25 | (d) | 63 | |||||||||||||||||||||||||||||
Year ended 08/31/12 | 8.36 | 0.34 | 0.59 | 0.93 | (0.34 | ) | 8.95 | (e) | 11.49 | 1,606 | 2.06 | 2.06 | 4.07 | 49 | ||||||||||||||||||||||||||||||||||
Year ended 08/31/11 | 7.75 | 0.26 | 0.59 | 0.85 | (0.24 | ) | 8.36 | 11.15 | 1,772 | 2.05 | 2.05 | 3.08 | 101 | |||||||||||||||||||||||||||||||||||
Year ended 08/31/10 | 6.60 | 0.23 | 1.14 | 1.37 | (0.22 | ) | 7.75 | 21.02 | 1,676 | 2.12 | 2.13 | 3.18 | 77 | |||||||||||||||||||||||||||||||||||
Year ended 08/31/09 | 8.37 | 0.23 | (1.77 | ) | (1.54 | ) | (0.23 | ) | 6.60 | (17.91 | ) | 680 | 2.48 | 2.49 | 4.08 | 59 | ||||||||||||||||||||||||||||||||
Class C | ||||||||||||||||||||||||||||||||||||||||||||||||
Year ended 08/31/13 | 8.95 | 0.29 | (0.30 | ) | (0.01 | ) | (0.43 | ) | 8.51 | (0.23 | ) | 108,878 | 2.01 | (d) | 2.02 | (d) | 3.25 | (d) | 63 | |||||||||||||||||||||||||||||
Year ended 08/31/12 | 8.36 | 0.34 | 0.59 | 0.93 | (0.34 | ) | 8.95 | (e) | 11.49 | 44,790 | 2.06 | 2.06 | 4.07 | 49 | ||||||||||||||||||||||||||||||||||
Year ended 08/31/11 | 7.75 | 0.26 | 0.59 | 0.85 | (0.24 | ) | 8.36 | 11.15 | 26,511 | 2.05 | 2.05 | 3.08 | 101 | |||||||||||||||||||||||||||||||||||
Year ended 08/31/10 | 6.60 | 0.23 | 1.14 | 1.37 | (0.22 | ) | 7.75 | 21.02 | 16,692 | 2.12 | 2.13 | 3.18 | 77 | |||||||||||||||||||||||||||||||||||
Year ended 08/31/09 | 8.38 | 0.23 | (1.78 | ) | (1.55 | ) | (0.23 | ) | 6.60 | (18.00 | ) | 4,296 | 2.48 | 2.49 | 4.08 | 59 | ||||||||||||||||||||||||||||||||
Class Y | ||||||||||||||||||||||||||||||||||||||||||||||||
Year ended 08/31/13 | 8.95 | 0.39 | (0.32 | ) | 0.07 | (0.52 | ) | 8.50 | 0.68 | 270,196 | 1.01 | (d) | 1.02 | (d) | 4.25 | (d) | 63 | |||||||||||||||||||||||||||||||
Year ended 08/31/12 | 8.36 | 0.43 | 0.58 | 1.01 | (0.42 | ) | 8.95 | (e) | 12.62 | 114,525 | 1.06 | 1.06 | 5.07 | 49 | ||||||||||||||||||||||||||||||||||
Year ended 08/31/11 | 7.75 | 0.34 | 0.60 | 0.94 | (0.33 | ) | 8.36 | 12.28 | 26,139 | 1.05 | 1.05 | 4.08 | 101 | |||||||||||||||||||||||||||||||||||
Year ended 08/31/10 | 6.60 | 0.31 | 1.13 | 1.44 | (0.29 | ) | 7.75 | 22.21 | 22,047 | 1.12 | 1.13 | 4.18 | 77 | |||||||||||||||||||||||||||||||||||
Year ended 08/31/09(f) | 7.15 | 0.26 | (0.63 | ) | (0.37 | ) | (0.18 | ) | 6.60 | (4.23 | ) | 2,755 | 1.53 | (g) | 1.53 | (g) | 5.03 | (g) | 59 | |||||||||||||||||||||||||||||
Class R5 | ||||||||||||||||||||||||||||||||||||||||||||||||
Year ended 08/31/13 | 8.96 | 0.39 | (0.30 | ) | 0.09 | (0.53 | ) | 8.52 | 0.85 | 23,565 | 0.94 | (d) | 0.95 | (d) | 4.32 | (d) | 63 | |||||||||||||||||||||||||||||||
Year ended 08/31/12 | 8.38 | 0.44 | 0.57 | 1.01 | (0.43 | ) | 8.96 | (e) | 12.63 | 30,076 | 0.98 | 0.98 | 5.15 | 49 | ||||||||||||||||||||||||||||||||||
Year ended 08/31/11 | 7.76 | 0.35 | 0.61 | 0.96 | (0.34 | ) | 8.38 | 12.52 | 35,777 | 0.96 | 0.96 | 4.17 | 101 | |||||||||||||||||||||||||||||||||||
Year ended 08/31/10 | 6.62 | 0.32 | 1.13 | 1.45 | (0.31 | ) | 7.76 | 22.27 | 37,711 | 0.92 | 0.93 | 4.38 | 77 | |||||||||||||||||||||||||||||||||||
Year ended 08/31/09 | 8.39 | 0.31 | (1.77 | ) | (1.46 | ) | (0.31 | ) | 6.62 | (16.75 | ) | 33,753 | 1.11 | 1.12 | 5.45 | 59 | ||||||||||||||||||||||||||||||||
Class R6 | ||||||||||||||||||||||||||||||||||||||||||||||||
Year ended 08/31/13(f) | 8.98 | 0.38 | (0.41 | ) | (0.03 | ) | (0.43 | ) | 8.52 | (0.49 | ) | 60 | 0.86 | (d)(g) | 0.87 | (d)(g) | 4.40 | (d)(g) | 63 | |||||||||||||||||||||||||||||
| (a) | Calculated using average shares outstanding. |
| (b) | Includes adjustments in accordance with accounting principles generally accepted in the United States of America and as such, the net asset value for financial reporting purposes and the returns based upon those net asset values may differ from the net asset value and returns for shareholder transactions. Does not include sales charges and is not annualized for periods less than one year, if applicable. |
| (c) | Portfolio turnover is calculated at the fund level and is not annualized for periods less than one year, if applicable. |
| (d) | Ratios are based on average daily net assets (000’s omitted) of $521,435, $1,879, $81,111, $223,189, $27,348 and $5,488 for Class A, Class B, Class C, Class Y, Class R5 and Class R6 shares, respectively. |
| (e) | Includes redemption fees added to shares of beneficial interest which were less than $0.005 per share. |
| (f) | Commencement date of October 3, 2008 for Class Y shares and September 24, 2012 for Class R6 shares. |
| (g) | Annualized. |
24 Invesco Global Real Estate Income Fund
Report of Independent Registered Public Accounting Firm
To the Board of Trustees of AIM Counselor Series Trust (Invesco Counselor Series Trust) and Shareholders of Invesco Global Real Estate Income Fund:
In our opinion, the accompanying statement of assets and liabilities, including the schedule of investments, and the related statements of operations and of changes in net assets and the financial highlights present fairly, in all material respects, the financial position of Invesco Global Real Estate Income Fund (one of the funds constituting AIM Counselor Series Trust (Invesco Counselor Series Trust) hereafter referred to as the “Fund”) at August 31, 2013 the results of its operations for the year then ended, the changes in its net assets for each of the two years in the period then ended and the financial highlights for each of the five years in the period then ended, in conformity with accounting principles generally accepted in the United States of America. These financial statements and financial highlights (hereafter referred to as “financial statements”) are the responsibility of the Fund’s management; our responsibility is to express an opinion on these financial statements based on our audits. We conducted our audits of these financial statements in accordance with the standards of the Public Company Accounting Oversight Board (United States). Those standards require that we plan and perform the audit to obtain reasonable assurance about whether the financial statements are free of material misstatement. An audit includes examining, on a test basis, evidence supporting the amounts and disclosures in the financial statements, assessing the accounting principles used and significant estimates made by management, and evaluating the overall financial statement presentation. We believe that our audits, which included confirmation of securities at August 31, 2013 by correspondence with the custodian and brokers, provide a reasonable basis for our opinion.
PRICEWATERHOUSECOOPERS LLP
October 25, 2013
Houston, Texas
25 Invesco Global Real Estate Income Fund
Calculating your ongoing Fund expenses
Example
As a shareholder of the Fund, you incur two types of costs: (1) transaction costs, which may include sales charges (loads) on purchase payments or contingent deferred sales charges on redemptions, if any; and (2) ongoing costs, including management fees, distribution and/or service (12b-1) fees, and other Fund expenses. This example is intended to help you understand your ongoing costs (in dollars) of investing in the Fund and to compare these costs with ongoing costs of investing in other mutual funds. The example is based on an investment of $1,000 invested at the beginning of the period and held for the entire period March 1, 2013 through August 31, 2013.
Actual expenses
The table below provides information about actual account values and actual expenses. You may use the information in this table, together with the amount you invested, to estimate the expenses that you paid over the period. Simply divide your account value by $1,000 (for example, an $8,600 account value divided by $1,000 = 8.6), then multiply the result by the number in the table under the heading entitled “Actual Expenses Paid During Period” to estimate the expenses you paid on your account during this period.
Hypothetical example for comparison purposes
The table below also provides information about hypothetical account values and hypothetical expenses based on the Fund’s actual expense ratio and an assumed rate of return of 5% per year before expenses, which is not the Fund’s actual return.
The hypothetical account values and expenses may not be used to estimate the actual ending account balance or expenses you paid for the period. You may use this information to compare the ongoing costs of investing in the Fund and other funds. To do so, compare this 5% hypothetical example with the 5% hypothetical examples that appear in the shareholder reports of the other funds.
Please note that the expenses shown in the table are meant to highlight your ongoing costs only and do not reflect any transaction costs, such as sales charges (loads) on purchase payments or contingent deferred sales charges on redemptions, if any. Therefore, the hypothetical information is useful in comparing ongoing costs only, and will not help you determine the relative total costs of owning different funds. In addition, if these transaction costs were included, your costs would have been higher.
| Class | Beginning Account Value (03/01/13) | ACTUAL | HYPOTHETICAL (5% annual return before expenses) | Annualized Expense Ratio | ||||||||||||||||||||
| Ending Account Value (08/31/13)1 | Expenses Paid During Period2 | Ending Account Value (08/31/13) | Expenses Paid During Period2 | |||||||||||||||||||||
| A | $ | 1,000.00 | $ | 940.10 | $ | 6.16 | $ | 1,018.85 | $ | 6.41 | 1.26 | % | ||||||||||||
| B | 1,000.00 | 937.40 | 9.82 | 1,015.07 | 10.21 | 2.01 | ||||||||||||||||||
| C | 1,000.00 | 936.30 | 9.81 | 1,015.07 | 10.21 | 2.01 | ||||||||||||||||||
| Y | 1,000.00 | 941.10 | 4.94 | 1,020.11 | 5.14 | 1.01 | ||||||||||||||||||
| R5 | 1,000.00 | 942.70 | 4.55 | 1,020.52 | 4.74 | 0.93 | ||||||||||||||||||
| R6 | 1,000.00 | 943.10 | 4.07 | 1,021.02 | 4.23 | 0.83 | ||||||||||||||||||
| 1 | The actual ending account value is based on the actual total return of the Fund for the period March 1, 2013 through August 31, 2013, after actual expenses and will differ from the hypothetical ending account value which is based on the Fund’s expense ratio and a hypothetical annual return of 5% before expenses. |
| 2 | Expenses are equal to the Fund’s annualized expense ratio as indicated above multiplied by the average account value over the period, multiplied by 184/365 to reflect the most recent fiscal half year. |
26 Invesco Global Real Estate Income Fund
Approval of Investment Advisory and Sub-Advisory Contracts
The Board of Trustees (the Board) of AIM Counselor Series Trust (Invesco Counselor Series Trust) is required under the Investment Company Act of 1940, as amended, to approve annually the renewal of Invesco Global Real Estate Income Fund’s (the Fund) investment advisory agreement with Invesco Advisers, Inc. (Invesco Advisers) and the Master Intergroup Sub-Advisory Contract for Mutual Funds (the sub-advisory contracts) with Invesco Asset Management Deutschland GmbH, Invesco Asset Management Limited, Invesco Asset Management (Japan) Limited, Invesco Australia Limited, Invesco Hong Kong Limited, Invesco Senior Secured Management, Inc. and Invesco Canada Ltd. (collectively, the Affiliated Sub-Advisers). During contract renewal meetings held on June 17-19, 2013, the Board as a whole, and the disinterested or “independent” Trustees, who comprise over 75% of the Board, voting separately, approved the continuance of the Fund’s investment advisory agreement and the sub-advisory contracts for another year, effective July 1, 2013. The Board determined that continuation of the Fund’s investment advisory agreement and the sub-advisory contracts are in the best interests of the Fund and its shareholders and the compensation payable to Invesco Advisers and the Affiliated Sub-Advisers under the agreements is fair and reasonable.
The Board’s Fund Evaluation Process
The Board’s Investments Committee has established three Sub-Committees, each of which is primarily responsible for overseeing the management of a number of the funds advised by Invesco Advisers (the Invesco Funds). The Sub-Committees meet throughout the year to review the performance of their assigned Invesco Funds, including reviewing materials prepared under the direction of the independent Senior Officer, an officer of the Invesco Funds who reports directly to the independent Trustees. Over the course of each year, the Sub-Committees meet with portfolio managers for their assigned Invesco Funds and other members of management to review the performance, investment objective(s), policies, strategies, limitations and investment risks of these funds. The Sub-Committees meet regularly and at designated contract renewal meetings each year to conduct a review of the performance, fees, expenses and other matters related to their assigned Invesco Funds. Each Sub-Committee recommends to the Investments Committee, which in turn recommends to the full Board, whether and on what terms to approve the continuance of each Invesco Fund’s investment advisory agreement and sub-advisory contracts for another year.
During the contract renewal process, the Trustees receive comparative performance and fee data regarding the Invesco Funds prepared by Invesco Advisers and Lipper Inc. (Lipper), an independent provider of investment company
data. The Trustees also receive an independent written evaluation from the Senior Officer. The Senior Officer’s evaluation is prepared as part of his responsibility to manage the process by which the Invesco Funds’ proposed management fees are negotiated during the annual contract renewal process to ensure they are negotiated in a manner that is at arms’ length and reasonable. The independent Trustees are assisted in their annual evaluation of the Fund’s investment advisory agreement by the Senior Officer and by independent legal counsel. In addition to meetings with Invesco Advisers and fund counsel, the independent Trustees also discuss the continuance of the investment advisory agreement and sub-advisory contracts in separate sessions with the Senior Officer and with independent legal counsel.
In evaluating the fairness and reasonableness of compensation under the Fund’s investment advisory agreement and sub-advisory contracts, the Board considered, among other things, the factors discussed below. The Trustees recognized that the advisory fee rates for the Invesco Funds are, in many cases, the result of years of review and negotiation between the Trustees and Invesco Advisers as well as advisory fees previously approved by different predecessor boards. The Trustees’ deliberations and conclusions in a particular year may be based in part on their deliberations and conclusions regarding these same arrangements throughout the year and in prior years. The Trustees’ review and conclusions are based on the comprehensive consideration of all information presented to them and are not the result of any single determinative factor. Moreover, one Trustee may have weighed a particular piece of information or factor differently than another Trustee.
The discussion below serves as the Senior Officer’s independent written evaluation with respect to the Fund’s investment advisory agreement as well as a discussion of the material factors and related conclusions that formed the basis for the Board’s approval of the Fund’s investment advisory agreement and sub-advisory contracts. Unless otherwise stated, this information is current as of June 19, 2013, and may not reflect consideration of factors that became known to the Board after that date, including, for example, changes to the Fund’s performance, advisory fees, expense limitations and/or fee waivers.
Factors and Conclusions and Summary of Independent Written Fee Evaluation
| A. | Nature, Extent and Quality of Services Provided by Invesco Advisers and the Affiliated Sub-Advisers |
The Board reviewed the advisory services provided to the Fund by Invesco Advisers under the Fund’s investment advisory agreement, the performance of Invesco Advisers in providing
these services, and the credentials and experience of the officers and employees of Invesco Advisers who provide these services, including the Fund’s portfolio manager or managers, with whom the Sub-Committees met during the year. The Board’s review of the qualifications of Invesco Advisers to provide advisory services included the Board’s consideration of Invesco Advisers’ investment process oversight, independent credit analysis and investment risk management.
In determining whether to continue the Fund’s investment advisory agreement, the Board considered the benefits of reapproving an existing relationship and the greater uncertainty that may be associated with entering into a new relationship. The Board also considered non-advisory services that Invesco Advisers and its affiliates provide to the Invesco Funds such as various back office support functions, equity and fixed income trading operations, internal audit, distribution and legal and compliance. The Board concluded that the nature, extent and quality of the services provided to the Fund by Invesco Advisers are appropriate and satisfactory and consistent with the terms of the Fund’s investment advisory agreement.
The Board reviewed the services that may be provided by the Affiliated Sub-Advisers under the sub-advisory contracts and the credentials and experience of the officers and employees of the Affiliated Sub-Advisers who provide these services. The Board noted that the Affiliated Sub-Advisers have offices and personnel that are located in financial centers around the world. As a result, the Affiliated Sub-Advisers can provide research and investment analysis on the markets and economies of various countries in which the Fund may invest, make recommendations regarding securities and assist with security trades. The Board concluded that the sub-advisory contracts benefit the Fund and its shareholders by permitting Invesco Advisers to use the resources and talents of the Affiliated Sub-Advisers in managing the Fund. The Board concluded that the nature, extent and quality of the services that may be provided by the Affiliated Sub-Advisers are appropriate and satisfactory and consistent with the terms of the Fund’s sub-advisory contracts.
| B. | Fund Performance |
The Board considered Fund performance as a relevant factor in considering whether to approve the investment advisory agreement. The Board did not view Fund performance as a relevant factor in considering whether to approve the sub-advisory contracts for the Fund, as no Affiliated Sub-Adviser currently manages assets of the Fund.
The Board compared the Fund’s performance during the past one, three and five calendar years to the performance of funds in the Lipper performance universe and against the Lipper Global Real Estate Funds Index. The Board noted
27 Invesco Global Real Estate Income Fund
that performance of Class A shares of the Fund was in the fifth quintile of the Lipper performance universe for the one year period and the first quintile for the three and five year periods (the first quintile being the best performing funds and the fifth quintile being the worst performing funds). The Board noted that performance of Class A shares of the Fund was below the performance of the Index for the one year period and above the performance of the Index for the three and five year periods. The Trustees also reviewed more recent Fund performance and this review did not change their conclusions.
| C. | Advisory and Sub-Advisory Fees |
The Board compared the Fund’s contractual management fee rate to the contractual management fee rates of funds in the Fund’s Lipper expense group at a common asset level. The Board noted that the contractual management fee rate for Class A shares of the Fund was below the median contractual management fee rate of funds in the expense group. The Board noted that the term “contractual management fee” may include both advisory and certain administrative services fees and that Invesco Advisers does not charge the Invesco Funds for the administrative services included in the term as defined by Lipper. The Board also reviewed the methodology used by Lipper in providing expense group information, which includes using each fund’s contractual management fee schedule (including any applicable breakpoints) as reported in the most recent prospectus or statement of additional information for each fund in the expense group.
The Board also compared the Fund’s effective advisory rate (the advisory fee after advisory fee waivers and before expense limitations/waivers) to the advisory fee rates of other mutual funds advised by Invesco Advisers and its affiliates with investment strategies comparable to those of the Fund. The Board noted that the Fund’s effective advisory fee rate was below the rate of one fund sub-advised by Invesco Advisers with investment strategies comparable to those of the Fund.
Other than the fund noted above, the Board noted that Invesco Advisers and its affiliates do not advise other funds or client accounts with investment strategies comparable to those of the Fund.
The Board also considered the services that may be provided by the Affiliated Sub-Advisers pursuant to the sub-advisory contracts, as well as the fees payable by Invesco Advisers to the Affiliated Sub-Advisers pursuant to the sub-advisory contracts. The Board also noted that the sub-advisory fees are not paid directly by the Fund, but rather, are payable by Invesco Advisers to the Affiliated Sub-Advisers.
Based upon the information and considerations described above, the Board concluded that the compensation payable to Invesco Advisers and the Affiliated Sub-Advisers is fair and reasonable.
| D. | Economies of Scale and Breakpoints |
The Board considered the extent to which there are economies of scale in the provision of advisory services to the Fund. The Board also considered whether the Fund benefits from economies of scale through contractual breakpoints in the Fund’s advisory fee schedule and was assisted in this review by a report from the Senior Officer. The Board also noted that the Fund shares directly in economies of scale through lower fees charged by third party service providers based on the combined size of the Invesco Funds and other clients advised by Invesco Advisers.
| E. | Profitability and Financial Resources |
The Board reviewed information from Invesco Advisers concerning the costs of the advisory and other services that Invesco Advisers and its affiliates provide to the Fund and the profitability of Invesco Advisers and its affiliates in providing these services for the year ended December 31, 2012. The Board received information from Invesco Advisers about the methodology used to prepare the profitability information. The Board considered the profitability of Invesco Advisers in managing the Fund and the Invesco Funds. The Board noted that Invesco Advisers continues to operate at a net profit from services Invesco Advisers and its subsidiaries provide to the Invesco Funds and the Fund. The Board did not deem the level of profits realized by Invesco Advisers and its affiliates from providing services to the Fund to be excessive given the nature, quality and extent of the services provided to the Invesco Funds. The Board received and accepted information from Invesco Advisers demonstrating that Invesco Advisers and each Affiliated Sub-Adviser are financially sound and have the resources necessary to perform their obligations under the investment advisory agreement and sub-advisory contracts.
| F. | Collateral Benefits to Invesco Advisers and its Affiliates |
The Board considered various other benefits received by Invesco Advisers and its affiliates from the relationship with the Fund, including the fees received for their provision of transfer agency and distribution services to the Fund. The Board considered comparative information regarding fees charged for these services, including information provided by Lipper and other independent sources. The Board considered the performance of Invesco Advisers and its affiliates in providing these services and the organizational structure employed to provide these services. The Board also considered that these services are provided to the Fund pursuant to written contracts that are reviewed and approved on an annual basis by the Board; that the services are required for the operation of the Fund; that Invesco Advisers and its affiliates can provide services, the nature and quality of which are at least equal to those provided by others offering the same or similar services; and that the fees for such services are fair and reasonable in light of the
usual and customary charges by others for services of the same nature and quality.
The Board considered the benefits realized by Invesco Advisers and the Affiliated Sub-Advisers as a result of portfolio brokerage transactions executed through “soft dollar” arrangements. The Board noted that soft dollar arrangements shift the payment obligation for research services from Invesco Advisers and the Affiliated Sub-Advisers to the Invesco Funds and that the research received may be used with other clients of Invesco Advisers and may reduce Invesco Advisers’ and the Affiliated Sub-Advisers’ expenses. The Board also considered periodic reports from the Chief Compliance Officer of the Invesco Funds demonstrating that these arrangements are consistent with regulatory requirements. The Board did not deem the soft dollar arrangements to be inappropriate.
The Board considered that the Fund’s uninvested cash and cash collateral from any securities lending arrangements may be invested in money market funds advised by Invesco Advisers pursuant to procedures approved by the Board. The Board noted that Invesco Advisers receives advisory fees from these affiliated money market funds attributable to such investments, although Invesco Advisers has contractually agreed to waive through at varying periods the advisory fees payable by the Invesco Funds. The waiver is in an amount equal to 100% of the net advisory fee Invesco Advisers receives from the affiliated money market funds with respect to the Fund’s investment in the affiliated money market funds of uninvested cash, but not cash collateral. The Board concluded that the Fund’s investment of uninvested cash and cash collateral from any securities lending arrangements in the affiliated money market funds is in the best interests of the Fund and its shareholders.
The Board also considered use of an affiliated broker to execute certain trades for the Fund to among other things, control information leakage, and were advised that such trades are executed in compliance with rules under the Investment Company Act of 1940, as amended.
28 Invesco Global Real Estate Income Fund
Tax Information
Form 1099-DIV, Form 1042-S and other year–end tax information provide shareholders with actual calendar year amounts that should be included in their tax returns. Shareholders should consult their tax advisors.
The following distribution information is being provided as required by the Internal Revenue Code or to meet a specific state’s requirement.
The Fund designates the following amounts or, if subsequently determined to be different, the maximum amount allowable for its fiscal year ended August 31, 2013:
Federal and State Income Tax | ||||
Qualified Dividend Income* | 0.25 | % | ||
Corporate Dividends Received Deduction* | 0.00 | % | ||
| * | The above percentages are based on ordinary income dividends paid to shareholders during the Fund’s fiscal year. |
29 Invesco Global Real Estate Income Fund
Trustees and Officers
The address of each trustee and officer is AIM Counselor Series Trust (Invesco Counselor Series Trust) (the “Trust”), 11 Greenway Plaza, Suite 1000, Houston, Texas 77046-1173. The trustees serve for the life of the Trust, subject to their earlier death, incapacitation, resignation, retirement or removal as more specifically provided in the Trust’s organizational documents. Each officer serves for a one year term or until their successors are elected and qualified. Column two below includes length of time served with predecessor entities, if any.
Name, Year of Birth and Position(s) Held with the Trust | Trustee and/ or Officer Since | Principal Occupation(s) During Past 5 Years | Number of Funds in Fund Complex Overseen by Trustee | Other Directorship(s) Held by Trustee During Past 5 Years | ||||
| Interested Persons | ||||||||
| Martin L. Flanagan1 — 1960 Trustee | 2007 | Executive Director, Chief Executive Officer and President, Invesco Ltd. (ultimate parent of Invesco and a global investment management firm); Advisor to the Board, Invesco Advisers, Inc. (formerly known as Invesco Institutional (N.A.), Inc.); Trustee, The Invesco Funds; Vice Chair, Investment Company Institute; and Member of Executive Board, SMU Cox School of Business
Formerly: Chairman and Chief Executive Officer, Invesco Advisers, Inc. (registered investment adviser); Director, Chairman, Chief Executive Officer and President, IVZ Inc. (holding company), INVESCO Group Services, Inc. (service provider) and Invesco North American Holdings, Inc. (holding company); Director, Chief Executive Officer and President, Invesco Holding Company Limited (parent of Invesco and a global investment management firm); Director, Invesco Ltd.; Chairman, Investment Company Institute and President, Co-Chief Executive Officer, Co-President, Chief Operating Officer and Chief Financial Officer, Franklin Resources, Inc. (global investment management organization) | 117 | None | ||||
| Philip A. Taylor2 — 1954 Trustee, President and Principal Executive Officer | 2006 | Head of North American Retail and Senior Managing Director, Invesco Ltd.; Director, Co-Chairman, Co-President and Co-Chief Executive Officer, Invesco Advisers, Inc. (formerly known as Invesco Institutional (N.A.), Inc.) (registered investment adviser); Director, Chairman, Chief Executive Officer and President, Invesco Management Group, Inc. (formerly known as Invesco Aim Management Group, Inc.) (financial services holding company); Director and President, INVESCO Funds Group, Inc. (registered investment adviser and registered transfer agent); Director and Chairman, Invesco Investment Services, Inc. (formerly known as Invesco Aim Investment Services, Inc.) (registered transfer agent) and IVZ Distributors, Inc. (formerly known as INVESCO Distributors, Inc.) (registered broker dealer); Director, President and Chairman, Invesco Inc. (holding company) and Invesco Canada Holdings Inc. (holding company); Chief Executive Officer, Invesco Corporate Class Inc. (corporate mutual fund company) and Invesco Canada Fund Inc. (corporate mutual fund company); Director, Chairman and Chief Executive Officer, Invesco Canada Ltd. (formerly known as Invesco Trimark Ltd./Invesco Trimark Ltèe) (registered investment adviser and registered transfer agent); Trustee, President and Principal Executive Officer, The Invesco Funds (other than AIM Treasurer’s Series Trust (Invesco Treasurer’s Series Trust) and Short-Term Investments Trust); Trustee and Executive Vice President, The Invesco Funds (AIM Treasurer’s Series Trust (Invesco Treasurer’s Series Trust) and Short-Term Investments Trust only); Director, Invesco Investment Advisers LLC (formerly known as Van Kampen Asset Management); Director, Chief Executive Officer and President, Van Kampen Exchange Corp.
Formerly: Director and Chairman, Van Kampen Investor Services Inc.: Director, Chief Executive Officer and President, 1371 Preferred Inc. (holding company); and Van Kampen Investments Inc.; Director and President, AIM GP Canada Inc. (general partner for limited partnerships); and Van Kampen Advisors, Inc.; Director and Chief Executive Officer, Invesco Trimark Dealer Inc. (registered broker dealer); Director, Invesco Distributors, Inc. (formerly known as Invesco Aim Distributors, Inc.) (registered broker dealer); Manager, Invesco PowerShares Capital Management LLC; Director, Chief Executive Officer and President, Invesco Advisers, Inc.; Director, Chairman, Chief Executive Officer and President, Invesco Aim Capital Management, Inc.; President, Invesco Trimark Dealer Inc. and Invesco Trimark Ltd./Invesco Trimark Ltèe; Director and President, AIM Trimark Corporate Class Inc. and AIM Trimark Canada Fund Inc.; Senior Managing Director, Invesco Holding Company Limited; Trustee and Executive Vice President, Tax-Free Investments Trust; Director and Chairman, Fund Management Company (former registered broker dealer); President and Principal Executive Officer, The Invesco Funds (AIM Treasurer’s Series Trust (Invesco Treasurer’s Series Trust), Short-Term Investments Trust and Tax-Free Investments Trust only); President, AIM Trimark Global Fund Inc. and AIM Trimark Canada Fund Inc. | 117 | None | ||||
Wayne W. Whalen3 — 1939 Trustee | 2010 | Of Counsel, and prior to 2010, partner in the law firm of Skadden, Arps, Slate, Meagher & Flom LLP, legal counsel to certain funds in the Fund Complex
| 130 | Director of the Mutual Fund Directors Forum, a nonprofit membership organization for investment directors; Chairman and Director of the Abraham Lincoln Presidential Library Foundation; and Director of the Stevenson Center for Democracy |
| 1 | Mr. Flanagan is considered an interested person of the Trust because he is an officer of the adviser to the Trust, and an officer and a director of Invesco Ltd., ultimate parent of the adviser to the Trust. |
| 2 | Mr. Taylor is considered an interested person of the Trust because he is an officer and a director of the adviser to, and a director of the principal underwriter of, the Trust. |
| 3 | Mr. Whalen is considered an “interested person” (within the meaning of Section 2(a)(19) of the 1940 Act) of certain Funds in the Invesco Fund Complex because he and his firm currently provide legal services as legal counsel to such Funds. |
T-1 Invesco Global Real Estate Income Fund
Trustees and Officers—(continued)
Name, Year of Birth and Position(s) Held with the Trust | Trustee and/ or Officer Since | Principal Occupation(s) During Past 5 Years | Number of Funds in Fund Complex Overseen by Trustee | Other Directorship(s) Held by Trustee During Past 5 Years | ||||
| Independent Trustees | ||||||||
Bruce L. Crockett — 1944 Trustee and Chair | 2003 | Chairman, Crockett Technologies Associates (technology consulting company)
Formerly: Director, Captaris (unified messaging provider); Director, President and Chief Executive Officer COMSAT Corporation; and Chairman, Board of Governors of INTELSAT (international communications company) | 117 | ACE Limited (insurance company); Investment Company Institute | ||||
David C. Arch — 1945 Trustee | 2010 | Chairman and Chief Executive Officer of Blistex Inc., (consumer health care products manufacturer)
Formerly: Member of the Heartland Alliance Advisory Board, a nonprofit organization serving human needs based in Chicago | 130 | Board member of the Illinois Manufacturers’ Association; Member of the Board of Visitors, Institute for the Humanities, University of Michigan | ||||
Frank S. Bayley — 1939 Trustee | 2003 | Retired
Formerly: Director, Badgley Funds, Inc. (registered investment company) (2 portfolios) and General Partner and Of Counsel, law firm of Baker & McKenzie, LLP | 117 | Director and Chairman, C.D. Stimson Company (a real estate investment company); Trustee and Overseer, The Curtis Institute of Music | ||||
James T. Bunch — 1942 Trustee | 2000 | Managing Member, Grumman Hill Group LLC (family office private equity management)
Formerly: Founder, Green, Manning & Bunch Ltd. (investment banking firm)(1988-2010); Executive Committee, United States Golf Association; and Director, Policy Studies, Inc. and Van Gilder Insurance Corporation | 117 | Chairman, Board of Governors, Western Golf Association; Chairman-elect, Evans Scholars Foundation; and Director, Denver Film Society | ||||
Rodney F. Dammeyer — 1940 Trustee | 2010 | Chairman of CAC, LLC, (private company offering capital investment and management advisory services)
Formerly: Prior to 2001, Managing Partner at Equity Group Corporate Investments; Prior to 1995, Chief Executive Officer of Itel Corporation (formerly Anixter International); Prior to 1985, experience includes Senior Vice President and Chief Financial Officer of Household International, Inc., Executive Vice President and Chief Financial Officer of Northwest Industries, Inc. and Partner of Arthur Andersen & Co.; From 1987 to 2010, Director/Trustee of investment companies in the Van Kampen Funds complex | 117 | Director of Quidel Corporation and Stericycle, Inc.; Prior to May 2008, Trustee of The Scripps Research Institute; Prior to February 2008, Director of Ventana Medical Systems, Inc. | ||||
Albert R. Dowden — 1941 Trustee | 2003 | Director of a number of public and private business corporations, including the Boss Group, Ltd. (private investment and management); Reich & Tang Funds (5 portfolios) (registered investment company); and Homeowners of America Holding Corporation/ Homeowners of America Insurance Company (property casualty company)
Formerly: Director, Continental Energy Services, LLC (oil and gas pipeline service); Director, CompuDyne Corporation (provider of product and services to the public security market) and Director, Annuity and Life Re (Holdings), Ltd. (reinsurance company); Director, President and Chief Executive Officer, Volvo Group North America, Inc.; Senior Vice President, AB Volvo; Director of various public and private corporations; Chairman, DHJ Media, Inc.; Director Magellan Insurance Company; and Director, The Hertz Corporation, Genmar Corporation (boat manufacturer), National Media Corporation; Advisory Board of Rotary Power International (designer, manufacturer, and seller of rotary power engines); and Chairman, Cortland Trust, Inc. (registered investment company) | 117 | Director of Nature’s Sunshine Products, Inc. | ||||
Jack M. Fields — 1952 Trustee | 2003 | Chief Executive Officer, Twenty First Century Group, Inc. (government affairs company); Owner and Chief Executive Officer, Dos Angeles Ranch, L.P. (cattle, hunting, corporate entertainment); and Discovery Global Education Fund (non-profit)
Formerly: Chief Executive Officer, Texana Timber LP (sustainable forestry company); Director of Cross Timbers Quail Research Ranch (non-profit); and member of the U.S. House of Representatives | 117 | Insperity, Inc. (formerly known as Administaff) | ||||
Prema Mathai-Davis — 1950 Trustee | 2003 | Retired
Formerly: Chief Executive Officer, YWCA of the U.S.A. | 117 | None | ||||
Larry Soll — 1942 Trustee | 1997 | Retired
Formerly: Chairman, Chief Executive Officer and President, Synergen Corp. (a biotechnology company) | 117 | None | ||||
Hugo F. Sonnenschein — 1940 Trustee | 2010 | Distinguished Service Professor and President Emeritus of the University of Chicago and the Adam Smith Distinguished Service Professor in the Department of Economics at the University of Chicago
Formerly: President of the University of Chicago | 130 | Trustee of the University of Rochester and a member of its investment committee. Member of the National Academy of Sciences, the American Philosophical Society and a fellow of the American Academy of Arts and Sciences |
T-2 Invesco Global Real Estate Income Fund
Trustees and Officers—(continued)
Name, Year of Birth and Position(s) Held with the Trust | Trustee and/ or Officer Since | Principal Occupation(s) During Past 5 Years | Number of Funds in Fund Complex Overseen by Trustee | Other Directorship(s) Held by Trustee During Past 5 Years | ||||
| Independent Trustees—(continued) | ||||||||
Raymond Stickel, Jr. — 1944 Trustee | 2005 | Retired
Formerly: Director, Mainstay VP Series Funds, Inc. (25 portfolios) and Partner, Deloitte & Touche | 117 | None | ||||
| Other Officers | ||||||||
| Russell C. Burk — 1958 Senior Vice President and Senior Officer | 2005 | Senior Vice President and Senior Officer, The Invesco Funds | N/A | N/A | ||||
| John M. Zerr — 1962 Senior Vice President, Chief Legal Officer and Secretary | 2006 | Director, Senior Vice President, Secretary and General Counsel, Invesco Management Group, Inc. (formerly known as Invesco Aim Management Group, Inc.) and Van Kampen Exchange Corp.; Senior Vice President, Invesco Advisers, Inc. (formerly known as Invesco Institutional (N.A.), Inc.) (registered investment adviser); Senior Vice President and Secretary, Invesco Distributors, Inc. (formerly known as Invesco Aim Distributors, Inc.); Director, Vice President and Secretary, Invesco Investment Services, Inc. (formerly known as Invesco Aim Investment Services, Inc.) and IVZ Distributors, Inc. (formerly known as INVESCO Distributors, Inc.); Director and Vice President, INVESCO Funds Group, Inc.; Senior Vice President, Chief Legal Officer and Secretary, The Invesco Funds; Manager, Invesco PowerShares Capital Management LLC; Director, Secretary and General Counsel, Invesco Investment Advisers LLC (formerly known as Van Kampen Asset Management); Secretary and General Counsel, Invesco Capital Markets, Inc. (formerly known as Van Kampen Funds Inc.) and Chief Legal Officer, PowerShares Exchange-Traded Fund Trust, PowerShares Exchange-Traded Fund Trust II, PowerShares India Exchange-Traded Fund Trust and PowerShares Actively Managed Exchange-Traded Fund Trust
Formerly: Director and Vice President, Van Kampen Advisors Inc.; Director, Vice President, Secretary and General Counsel, Van Kampen Investor Services Inc.; Director, Invesco Distributors, Inc. (formerly known as Invesco Aim Distributors, Inc.); Director, Senior Vice President, General Counsel and Secretary, Invesco Aim Advisers, Inc. and Van Kampen Investments Inc.; Director, Vice President and Secretary, Fund Management Company; Director, Senior Vice President, Secretary, General Counsel and Vice President, Invesco Aim Capital Management, Inc.; Chief Operating Officer and General Counsel, Liberty Ridge Capital, Inc. (an investment adviser); Vice President and Secretary, PBHG Funds (an investment company) and PBHG Insurance Series Fund (an investment company); Chief Operating Officer, General Counsel and Secretary, Old Mutual Investment Partners (a broker-dealer); General Counsel and Secretary, Old Mutual Fund Services (an administrator) and Old Mutual Shareholder Services (a shareholder servicing center); Executive Vice President, General Counsel and Secretary, Old Mutual Capital, Inc. (an investment adviser); and Vice President and Secretary, Old Mutual Advisors Funds (an investment company) | N/A | N/A | ||||
| Karen Dunn Kelley — 1960 Vice President | 2003 | Head of Invesco’s World Wide Fixed Income and Cash Management Group; Director, Co-President, Co-Chief Executive Officer, and Co-Chairman, Invesco Advisers, Inc. (formerly known as Invesco Institutional (N.A.), Inc.) (registered investment adviser); Chairman, Invesco Senior Secured Management, Inc.; Senior Vice President, Invesco Management Group, Inc. (formerly known as Invesco Aim Management Group, Inc.); Executive Vice President, Invesco Distributors, Inc. (formerly known as Invesco Aim Distributors, Inc.); Director, Invesco Mortgage Capital Inc., and Invesco Management Company Limited; Director and President, INVESCO Asset Management (Bermuda) Ltd., Vice President, The Invesco Funds (other than AIM Treasurer’s Series Trust (Invesco Treasurer’s Series Trust) and Short-Term Investments Trust); and President and Principal Executive Officer, The Invesco Funds (AIM Treasurer’s Series Trust (Invesco Treasurer’s Series Trust) and Short-Term Investments Trust only)
Formerly: Director, INVESCO Global Asset Management Limited and INVESCO Management S.A.; Senior Vice President, Van Kampen Investments Inc. and Invesco Advisers, Inc. (formerly known as Invesco Institutional (N.A.), Inc.) (registered investment adviser); Vice President, Invesco Advisers, Inc. (formerly known as Invesco Institutional (N.A.), Inc.); Director of Cash Management and Senior Vice President, Invesco Advisers, Inc. and Invesco Aim Capital Management, Inc.; President and Principal Executive Officer, Tax-Free Investments Trust; Director and President, Fund Management Company; Chief Cash Management Officer, Director of Cash Management, Senior Vice President, and Managing Director, Invesco Aim Capital Management, Inc.; Director of Cash Management, Senior Vice President, and Vice President, Invesco Advisers, Inc. and The Invesco Funds (AIM Treasurer’s Series Trust (Invesco Treasurer’s Series Trust), Short-Term Investments Trust and Tax-Free Investments Trust only) | N/A | N/A | ||||
T-3 Invesco Global Real Estate Income Fund
Trustees and Officers—(continued)
Name, Year of Birth and Position(s) Held with the Trust | Trustee and/ or Officer Since | Principal Occupation(s) During Past 5 Years | Number of Funds in Fund Complex Overseen by Trustee | Other Directorship(s) Held by Trustee During Past 5 Years | ||||
| Other Officers—(continued) | ||||||||
| Sheri Morris — 1964 Vice President, Treasurer and Principal Financial Officer | 2003 | Vice President, Treasurer and Principal Financial Officer, The Invesco Funds; Vice President, Invesco Advisers, Inc. (formerly known as Invesco Institutional (N.A.), Inc.) (registered investment adviser); and Vice President, PowerShares Exchange-Traded Fund Trust, PowerShares Exchange-Traded Fund Trust II, PowerShares India Exchange-Traded Fund Trust and PowerShares Actively Managed Exchange-Traded Fund Trust
Formerly: Vice President, Invesco Aim Advisers, Inc., Invesco Aim Capital Management, Inc. and Invesco Aim Private Asset Management, Inc.; Assistant Vice President and Assistant Treasurer, The Invesco Funds and Assistant Vice President, Invesco Advisers, Inc., Invesco Aim Capital Management, Inc. and Invesco Aim Private Asset Management, Inc.; and Treasurer, PowerShares Exchange-Traded Fund Trust, PowerShares Exchange-Traded Fund Trust II, PowerShares India Exchange-Traded Fund Trust and PowerShares Actively Managed Exchange-Traded Fund Trust | N/A | N/A | ||||
Crissie M. Wisdom — 1969 Anti-Money Laundering Compliance Officer | 2013 | Anti-Money Laundering Compliance Officer, Invesco Advisers, Inc. (formerly known as Invesco Institutional (N.A.), Inc.) (registered investment adviser), Invesco Capital Markets, Inc. (formerly known as Van Kampen Funds Inc.), Invesco Distributors, Inc., Invesco Investment Services, Inc., Invesco Management Group, Inc., Van Kampen Exchange Corp., The Invesco Funds, Invesco Funds (Chicago), and PowerShares Exchange-Traded Fund Trust, PowerShares Exchange-Traded Fund Trust II, PowerShares India Exchange-Traded Fund Trust, and PowerShares Actively Managed Exchange-Traded Fund Trust; and Fraud Prevention Manager and Controls and Risk Analysis Manager for Invesco Investment Services, Inc. | N/A | N/A | ||||
| Todd L. Spillane — 1958 Chief Compliance Officer | 2006 | Senior Vice President, Invesco Management Group, Inc. (formerly known as Invesco Aim Management Group, Inc.) and Van Kampen Exchange Corp.; Senior Vice President and Chief Compliance Officer, Invesco Advisers, Inc. (registered investment adviser) (formerly known as Invesco Institutional (N.A.), Inc.); Chief Compliance Officer, The Invesco Funds; Vice President, Invesco Distributors, Inc. (formerly known as Invesco Aim Distributors, Inc.) and Invesco Investment Services, Inc. (formerly known as Invesco Aim Investment Services, Inc.)
Formerly: Chief Compliance Officer, Invesco Funds (Chicago); Senior Vice President, Van Kampen Investments Inc.; Senior Vice President and Chief Compliance Officer, Invesco Aim Advisers, Inc. and Invesco Aim Capital Management, Inc.; Chief Compliance Officer, INVESCO Private Capital Investments, Inc. (holding company), Invesco Private Capital, Inc. (registered investment adviser), Invesco Global Asset Management (N.A.), Inc., Invesco Senior Secured Management, Inc. (registered investment adviser), Van Kampen Investor Services Inc., PowerShares Exchange-Traded Fund Trust, PowerShares Exchange-Traded Fund Trust II, PowerShares India Exchange-Traded Fund Trust and PowerShares Actively Managed Exchange-Traded Fund Trust; and Vice President, Invesco Aim Capital Management, Inc. and Fund Management Company | N/A | N/A |
The Statement of Additional Information of the Trust includes additional information about the Fund’s Trustees and is available upon request, without charge, by calling 1.800.959.4246. Please refer to the Fund’s prospectus for information on the Fund’s sub-advisers.
Office of the Fund 11 Greenway Plaza, Suite 1000 Houston, TX 77046-1173 | Investment Adviser Invesco Advisers, Inc. 1555 Peachtree Street, N.E. Atlanta, GA 30309 | Distributor Invesco Distributors, Inc. 11 Greenway Plaza, Suite 1000 Houston, TX 77046-1173 | Auditors PricewaterhouseCoopers LLP 1201 Louisiana Street, Suite 2900 Houston, TX 77002-5678 | |||
Counsel to the Fund Stradley Ronon Stevens & Young, LLP 2005 Market Street, Suite 2600 Philadelphia, PA 19103-7018 | Counsel to the Independent Trustees Goodwin Procter LLP 901 New York Avenue, N.W. Washington, D.C. 20001 | Transfer Agent Invesco Investment Services, Inc. 11 Greenway Plaza, Suite 1000 Houston, TX 77046-1173 | Custodian State Street Bank and Trust Company 225 Franklin Street Boston, MA 02110-2801 | |||
T-4 Invesco Global Real Estate Income Fund

Invesco mailing information
Send general correspondence to Invesco Investment Services, Inc., P.O. Box 219078, Kansas City, MO 64121-9078.
Invesco privacy policy
You share personal and financial information with us that is necessary for your transactions and your account records. We take very seriously the obligation to keep that information confidential and private.
Invesco collects nonpublic personal information about you from account applications or other forms you complete and from your transactions with us or our affiliates. We do not disclose information about you or our former customers to service providers or other third parties except to the extent necessary to service your account and in other limited circumstances as permitted by law. For example, we use this information to facilitate the delivery of transaction confirmations, financial reports, prospectuses and tax forms.
Even within Invesco, only people involved in the servicing of your accounts and compliance monitoring have access to your information. To ensure the highest level of confidentiality and security, Invesco maintains physical, electronic and procedural safeguards that meet or exceed federal standards. Special measures, such as data encryption and authentication, apply to your communications with us on our website. More detail is available to you at invesco.com/privacy.
Important notice regarding delivery of security holder documents
To reduce Fund expenses, only one copy of most shareholder documents may be mailed to shareholders with multiple accounts at the same address (Householding). Mailing of your shareholder documents may be householded indefinitely unless you instruct us otherwise. If you do not want the mailing of these documents to be combined with those for other members of your household, please contact Invesco Investment Services, Inc. at 800 959 4246 or contact your financial institution. We will begin sending you individual copies for each account within 30 days after receiving your request.
Fund holdings and proxy voting information
The Fund provides a complete list of its holdings four times in each fiscal year, at the quarter ends. For the second and fourth quarters, the lists appear in the Fund’s semiannual and annual reports to shareholders. For the first and third quarters, the Fund files the lists with the Securities and Exchange Commission (SEC) on Form N-Q. The most recent list of portfolio holdings is available at invesco.com/completeqtrholdings. Shareholders can also look up the Fund’s Forms N-Q on the SEC website at sec.gov. Copies of the Fund’s Forms N-Q may be reviewed and copied at the SEC Public Reference Room in Washington, D.C. You can obtain information on the operation of the Public Reference Room, including information about duplicating fee charges, by calling 202 551 8090 or 800 732 0330, or by electronic request at the following email address: publicinfo@sec.gov. The SEC file numbers for the Fund are shown below.
A description of the policies and procedures that the Fund uses to determine how to vote proxies relating to portfolio securities is available without charge, upon request, from our Client Services department at 800 959 4246 or at invesco.com/proxyguidelines. The information is also available on the SEC website, sec.gov. Information regarding how the Fund voted proxies related to its portfolio securities during the most recent 12-month period ended June 30 is available at invesco.com/proxysearch. The information is also available on the SEC website, sec.gov. Invesco Advisers, Inc. is an investment adviser; it provides investment advisory services to individual and institutional clients and does not sell securities. Invesco Distributors, Inc. is the US distributor for Invesco Ltd.’s retail mutual funds, exchange-traded funds and institutional money market funds. Both are wholly owned, indirect subsidiaries of Invesco Ltd. |
| |
SEC file numbers: 811-09913 and 333-36074 GREI-AR-1 Invesco Distributors, Inc. | ||

Letters to Shareholders
| Dear Shareholders: Enclosed in this annual report, you’ll find information about your Fund and the factors that affected its performance during the reporting period. Inside, you’ll also find a discussion from your portfolio managers about how they managed your Fund, as well as performance data for your Fund, a complete list of your Fund’s investments as of the close of the reporting period and other important information. I hope you find this report of interest. During the reporting period covered by this report, major US equity indexes made multiyear or even all-time highs.1 Economic data were generally positive; housing and consumer spending data were particularly encouraging. Nonetheless, economic uncertainty and concern about continuing political and budget gridlock in Washington persisted. The US Federal Reserve’s deliberate vagueness about when, and to what degree, it might begin to curtail its extraordinarily accommodative monetary policies – together with uncertainty about | |
who will next lead the central bank – affected fixed income and equity markets alike. Most developed, non-US stock markets remained positive for the first half of 2013, despite a difficult second quarter. Periods of market volatility and economic uncertainty can weaken the will of even the most resolute investor. That’s why Invesco believes it’s often helpful to work with a skilled and trusted financial adviser who can emphasize the importance of adhering to an investment plan designed to achieve long-term goals rather than being sidetracked by short-term uncertainty that can result in inaction. A financial adviser who is familiar with your individual financial situation, investment goals and risk tolerance can be an invaluable partner as you work toward your financial goals. He or she can provide insight and perspective when markets are volatile; encouragement and reassurance when times are uncertain; and advice and guidance when your financial situation or investment goals change. Our website, invesco.com/us, is another source of timely insight and information for investors. On the website, you’ll find fund-specific as well as more general information from many of Invesco’s investment professionals. You’ll find in-depth articles, video clips and audio commentaries – and, of course, you also can access information about your Invesco account whenever it’s convenient for you. | ||

What we mean by Intentional Investing
At Invesco, all of our people and all of our resources are dedicated to helping investors achieve their financial objectives. It’s a philosophy we call Intentional Investing, and it guides the way we:
| n | Manage investments – Our dedicated investment professionals search the world for the best opportunities, and each investment team follows a clear, disciplined process to build portfolios and mitigate risk. |
| n | Provide choices – We offer multiple investment strategies, allowing you and your financial adviser to build a portfolio that’s purpose-built for your needs. |
| n | Connect with you – We’re committed to giving you the expert insights you need to make informed investing decisions, and we are well-equipped to provide high-quality support for investors and advisers. |
At Invesco, we believe in putting investors first. That’s why investment management is all we do. Our sole focus on managing your money allows you and your financial adviser to build a portfolio of Invesco funds appropriate for your investment needs and goals today and when your circumstances change.
Have questions?
For questions about your account, feel free to contact an Invesco client services representative at 800 959 4246. For Invesco-related questions or comments, please email me directly at phil@invesco.com.
All of us at Invesco look forward to serving your investment management needs for many years to come. Thank you for investing with us.
Sincerely,

Philip Taylor
Senior Managing Director, Invesco Ltd.
| 1 | Source: Reuters |
| 2 | Invesco Growth and Income Fund |
 | Dear Fellow Shareholders: The Invesco Funds Board has worked on a variety of issues over the last several months, and I’d like to take this opportunity to discuss two that affect you and our fellow fund shareholders. The first issue on which your Board has been working is our annual review of the funds’ advisory and sub-advisory contracts with Invesco Advisers and its affiliates. This annual review, which is required by the Investment Company Act of 1940, focuses on the nature and quality of the services Invesco provides as adviser to the Invesco Funds and the reasonableness of the fees that it charges for those services. Each year, we spend months reviewing detailed information that we request from Invesco that allows us to evaluate its services and fees. We also use information from many independent sources, including materials provided by the independent Senior Officer of the Invesco Funds, who reports directly to the independent Trustees on the Board. Additionally, we meet with independent | |
| legal counsel and review performance and fee data prepared by Lipper Inc., an independent, third-party firm widely recognized as a leader in its field. | ||
I’m pleased to report that the Board determined in June that renewing the investment advisory agreement and the sub-advisory contracts with Invesco Advisers and its affiliates would serve the best interests of each fund and its shareholders.
The second area of focus to highlight is the Board’s efforts to ensure that we provide a lineup of funds that allow financial advisers to build portfolios that meet shareholders’ changing financial needs and goals. Today, more and more investors are reaching, or approaching, retirement. But interest rates remain low, making it difficult for many investors to generate the income they need, or will soon need, in their retirement years.
The members of your Board think about these things, too, and we’ve worked with Invesco Advisers to provide more income-generating options in the Invesco Funds lineup to help shareholders potentially meet their income needs. Your Board recently approved changes to three existing equity mutual funds, increasing their focus on generating income while also seeking to provide long-term growth of capital.
As a result of these changes, the funds and their respective management teams now have more flexibility to invest in the types of securities that could meet investors’ growing need for income generation, and in some cases, also help investors diversify their sources of income. These equity funds complement an array of fixed-income, asset allocation and alternative investment options in the Invesco Funds lineup designed to accommodate a variety of risk tolerances.
Be assured that your Board will continue working on behalf of fund shareholders, keeping your needs and interests uppermost in our minds.
As always, please contact me at bruce@brucecrockett.com with any questions or concerns you may have. On behalf of the Board, we look forward to continuing to represent your interests and serving your needs.
Sincerely,

Bruce L. Crockett
Independent Chair
Invesco Funds Board of Trustees
| 3 | Invesco Growth and Income Fund |
Management’s Discussion of Fund Performance
Performance summary
For the fiscal year ended August 31, 2013, Class A shares of Invesco Growth and Income Fund, at net asset value (NAV), outperformed the Russell 1000 Value Index, the Fund’s style-specific benchmark. Both sector allocation and stock selection positively impacted overall performance.
Your Fund’s long-term performance appears later in this report.
Fund vs. Indexes
Total returns, 8/31/12 to 8/31/13, at net asset value (NAV). Performance shown does not include applicable contingent deferred sales charges (CDSC) or front-end sales charges, which would have reduced performance.
| Class A Shares | 23.57 | % | ||
| Class B Shares | 23.57 | |||
| Class C Shares | 22.63 | |||
| Class R Shares | 23.26 | |||
| Class Y Shares | 23.86 | |||
| Class R5 Shares | 23.96 | |||
| Class R6 Shares* | 24.05 | |||
| S&P 500 Index‚ (Broad Market Index) | 18.70 | |||
| Russell 1000 Value Indexn(Style-Specific Index) | 23.10 | |||
| Lipper Large-Cap Value Funds Index¨(Peer Group Index) | 23.03 |
Source(s): ‚Invesco, S&P-Dow Jones via FactSet Research Systems Inc.;
n Invesco, Russell via FactSet Research Systems Inc.; ¨Lipper Inc.
| * | Share class incepted during the reporting period. See page 7 for a detailed explanation of Fund performance. |
How we invest
We call our investment philosophy within stock investing “value with a catalyst.” We believe undervalued companies that are experiencing positive changes (i.e., “catalysts”) have the potential to generate long-term stock price growth for shareholders. We generally seek to identify companies that are undervalued, under-earning relative to their potential and out of favor with investors. For these companies, we attempt to identify catalysts that may improve the financial results and/or correct the under-valuation. Examples of catalysts typically include improved operational efficiency, changing industry dynamics and/or a change in management.
We initially identify potential investments through a series of quantitative screens, which look at valuation and rate of return metrics. We then conduct fundamental
research on the most attractive opportunities. The research process includes a thorough review of a company’s financial statements, an evaluation of its competitive position and stability, and meetings with its executives. During the research process, we also value the company under various scenarios to determine if the investment is an attractive opportunity relative to its risks. This is also where we typically identify the positive catalyst, a prerequisite for potential investment. Finally, we generally set a price target for a stock based on normalized earnings and historical valuation multiples.
In short, our objective is to exploit perceived market skepticism toward a company’s stock by analyzing the company’s operations in the context of a cyclical environment and identifying one or more catalysts that may improve the company’s financial performance. Improved
financial performance, in turn, has the potential to drive the company’s stock price higher.
We typically sell an investment when it reaches our estimate of fair value or when we identify a more attractive investment opportunity.
Market conditions and your Fund
The fiscal year ended August 31, 2013, began with some downward volatility in US equity markets. Starting in the fall of 2012, markets began an upward trend that continued through much of the reporting period. In early fall, the European Central Bank implemented new measures to support member economies and the US Federal Reserve (the Fed) initiated a third round of quantitative easing (QE), or fiscal stimulus, which caused consumer sentiment to improve. Uncertainty surrounding US election results, “fiscal cliff” negotiations and sequestration spending cuts in early 2013, however, made many businesses hesitant to spend during the first quarter of the year. However, for the first time in years, markets appeared willing to look past headline events.
From late May through June, the capital markets began a sell-off following Fed Chairman Ben Bernanke’s comments about reducing QE. Since December 2012, the Fed has purchased $85 billion1 of US Treasuries and mortgage-backed securities each month to increase liquidity and ensure low long-term interest rates in an effort to spur the housing and real estate markets. Few asset classes were immune from this broad sell-off, which caused bonds, stocks and commodities to decline. Precious metals were particularly hard hit, and fixed-income investors scrambled to sell bonds in anticipation of higher yields. The markets stabilized in mid-summer; however, August brought more selling in the equity and bond markets and yields continued to rise.
Most US equity market indexes delivered double-digit gains and all sectors of
| Portfolio Composition | ||||
| By sector | ||||
| Financials | 27.6 | % | ||
| Health Care | 14.3 | |||
| Information Technology | 11.7 | |||
| Consumer Discretionary | 10.9 | |||
| Consumer Staples | 9.8 | |||
| Energy | 8.9 | |||
| Industrials | 7.9 | |||
| Telecommunication Services | 2.2 | |||
| Materials | 2.0 | |||
| Utilities | 1.7 | |||
| Money Market Funds | ||||
| Plus Other Assets Less Liabilities | 3.0 | |||
| Top 10 Equity Holdings* | ||||||
1. | JPMorganChase & Co. | 4.2 | % | |||
2. | CitigroupInc. | 3.5 | ||||
3. | ViacomInc.-Class B | 2.9 | ||||
4. | GeneralElectric Co. | 2.9 | ||||
5. | AvonProducts, Inc. | 2.4 | ||||
6. | MicrosoftCorp. | 2.2 | ||||
7. | Marsh& McLennan Cos., Inc. | 2.2 | ||||
8. | MorganStanley | 2.2 | ||||
9. | PNC Financial Services Group, Inc. | 2.2 | ||||
10. | TimeWarner Cable Inc. | 2.0 | ||||
| Total Net Assets | $ | 8.2 billion | ||
| Total Number of Holdings* | 75 | |||
The Fund’s holdings are subject to change, and there is no assurance that the Fund will continue to hold any particular security.
| * | Excluding money market fund holdings. |
| 5 | Invesco Growth and Income Fund |
the Russell 1000 Value Index posted positive returns, with the exception of the telecommunication services sector, which posted a slightly negative return.
Strong stock selection within the financials sector was a large contributor to relative Fund performance versus the style-specific benchmark. Notably, the lack of exposure to real estate was also a large driver of Fund performance, as the real estate industry posted negative performance for the reporting period. Within the diversified financials industry, JPMorgan Chase and Citigroup were top performers on a relative and absolute basis.
Stock selection and a material underweight position in the energy sector were also large contributors to Fund performance for the reporting period. Chevron, an integrated energy company, and Halliburton, an oil and gas services company, were among the top performing holdings for the Fund. One of the largest contributors to relative Fund performance was a material underweight position in Exxon Mobil versus the Russell 1000 Value Index, as the stock delivered low single-digit returns for the reporting period, underperforming both the energy sector and the style-specific benchmark.
Strong stock selection and an underweight position in the materials sector was another driver of relative Fund performance versus the style-specific benchmark. Notably, paint and glass company PPG Industries was a top contributor in this sector, as the company had improved earnings throughout the reporting period and acquired a coatings business that investors viewed as favorable. Additionally, not owning precious metals and minerals stocks contributed to the Fund’s performance versus the style-specific benchmark, as those stocks suffered due to a sell-off in gold and precious metals during much of 2013.
Stock selection and an underweight position in the telecommunication services sector versus the style-specific benchmark also helped the Fund’s relative performance. Not owning AT&T was the largest driver of relative performance, as the stock posted negative returns for the reporting period.
A material underweight position in the utilities sector was also a contributor to relative Fund performance, as it was the second-worst performing sector for the style-specific benchmark.
Stock selection and an overweight position in the health care sector also contributed to relative performance. Health care equipment and services companies like Cigna and Wellpoint were top performers for the Fund.
On the opposite side of the spectrum, stock selection within the information technology sector detracted from relative performance. Specifically, within the software and services industry, non-benchmark holdings such as Microsoft and Western Union (no longer held by the Fund) underperformed the style-specific benchmark and sector. Having little exposure to technology hardware and equipment companies hurt relative performance, as the industry generally performed well over the reporting period.
The Fund attempts to remain fully invested, targeting cash below 5% under normal market environments. Even though we had an average cash position within our acceptable range during the reporting period, cash detracted from Fund performance in a strong equity market.
Stock selection and an underweight position in the industrials sector also detracted from relative Fund performance versus the style-specific benchmark. More specifically, select holdings within capital goods and commercial and professional services detracted the most from performance.
Stock selection in the consumer discretionary sector also hurt relative performance. Strong stock selection within the media industry was offset by the negative effects of stock selection and having little exposure to the automobiles industry, which performed well during the reporting period.
We used currency forward contracts during the reporting period for the purpose of hedging currency exposure of non-US-based companies held in the Fund. Derivatives were used primarily for the purpose of hedging and not for speculative purposes or leverage. The use of currency forward contracts had a slight positive impact on the Fund’s performance relative to the Russell 1000 Value Index for the reporting period.
Equity markets, although providing investors strong absolute returns, experienced continued volatility during the reporting period. We believe that market volatility creates opportunities to invest in companies with attractive valuations and strong fundamentals. We believe that ultimately those valuations and fundamentals will be reflected in those companies’ stock prices.
Thank you for your investment in Invesco Growth and Income Fund and for sharing our long-term investment horizon.
| 1 | Source: US Federal Reserve |
The views and opinions expressed in management’s discussion of Fund performance are those of Invesco Advisers, Inc. These views and opinions are subject to change at any time based on factors such as market and economic conditions. These views and opinions may not be relied upon as investment advice or recommendations, or as an offer for a particular security. The information is not a complete analysis of every aspect of any market, country, industry, security or the Fund. Statements of fact are from sources considered reliable, but Invesco Advisers, Inc. makes no representation or warranty as to their completeness or accuracy. Although historical performance is no guarantee of future results, these insights may help you understand our investment management philosophy.
See important Fund and, if applicable, index disclosures later in this report.
 | Thomas Bastian Chartered Financial Analyst, portfolio manager, is lead manager of Invesco Growth and Income Fund. He joined Invesco in 2010. | |
| Mr. Bastian earned a BA in accounting from St. John’s University and an MBA in finance from University of Michigan. | ||
 | Mary Jane Maly Chartered Financial Analyst, portfolio manager, is manager of Invesco Growth and Income Fund. She joined Invesco in 2010. | |
| Ms. Maly earned a BA from the University of Pittsburgh and an MBA from the Thunderbird School of Global Management. | ||
 | Sergio Marcheli Portfolio manager, is manager of Invesco Growth and Income Fund. He joined Invesco in 2010. Mr. Marcheli earned a | |
| BBA from the University of Houston and an MBA from the University of St. Thomas. | ||
 | James Roeder Chartered Financial Analyst, portfolio manager, is manager of Invesco Growth and Income Fund. He joined Invesco in 2010. | |
| Mr. Roeder earned a BS in accounting from Clemson University and an MBA in economics and finance from the University of Chicago Booth School of Business. | ||
| 5 | Invesco Growth and Income Fund |
Your Fund’s Long-Term Performance
Results of a $10,000 Investment — Oldest Share Class(es)
Fund and index data from 8/31/03
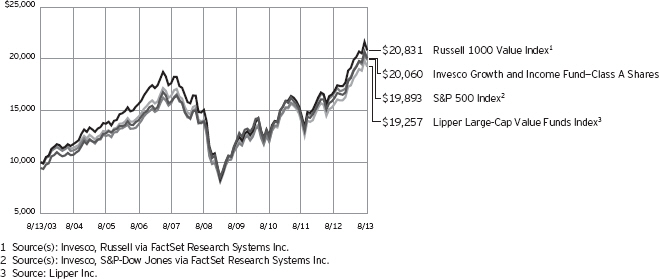
Past performance cannot guarantee comparable future results.
The data shown in the chart include reinvested distributions, applicable sales charges and Fund expenses including
management fees. Index results include reinvested dividends, but they do not reflect sales charges. Performance of the peer group, if applicable, reflects fund expenses and management fees;
performance of a market index does not. Performance shown in the chart and table(s) does not reflect deduction of taxes a shareholder would pay on Fund distributions or sale of Fund shares.
continued from page 8
Other information
| n | The returns shown in management’s discussion of Fund performance are based on net asset values calculated for shareholder transactions. Generally accepted accounting principles require adjustments to be made to the net assets of the Fund at period end for financial reporting purposes, and as such, the net asset values for shareholder transactions and the returns based on those net asset values may differ from the net asset values and returns reported in the Financial Highlights. |
| n | Industry classifications used in this report are generally according to the Global Industry Classification Standard, which was developed by and is the exclusive property and a service mark of MSCI Inc. and Standard & Poor’s. |
| 6 | Invesco Growth and Income Fund |
| Average Annual Total Returns | |||||
As of 8/31/13, including maximum applicable sales charges |
| ||||
| Class A Shares | |||||
| Inception (8/1/46) | 9.40 | % | |||
| 10 Years | 7.21 | ||||
| 5 Years | 6.32 | ||||
| 1 Year | 16.79 | ||||
| Class B Shares | |||||
| Inception (8/2/93) | 9.42 | % | |||
| 10 Years | 7.60 | ||||
| 5 Years | 7.22 | ||||
| 1 Year | 18.57 | ||||
| Class C Shares | |||||
| Inception (8/2/93) | 8.94 | % | |||
| 10 Years | 7.02 | ||||
| 5 Years | 6.74 | ||||
| 1 Year | 21.63 | ||||
| Class R Shares | |||||
| Inception (10/1/02) | 8.64 | % | |||
| 10 Years | 7.54 | ||||
| 5 Years | 7.26 | ||||
| 1 Year | 23.26 | ||||
| Class Y Shares | |||||
| Inception (10/19/04) | 7.46 | % | |||
| 5 Years | 7.79 | ||||
| 1 Year | 23.86 | ||||
| Class R5 Shares | |||||
| 10 Years | 7.95 | % | |||
| 5 Years | 7.81 | ||||
| 1 Year | 23.96 | ||||
| Class R6 Shares | |||||
| 10 Years | 7.86 | % | |||
| 5 Years | 7.62 | ||||
| 1 Year | 24.05 | ||||
Effective June 1, 2010, Class A, Class B, Class C, Class R and Class I shares of the predecessor fund, Van Kampen Growth and Income Fund, advised by Van Kampen Asset Management were reorganized into Class A, Class B, Class C, Class R and Class Y shares, respectively, of Invesco Van Kampen Growth and Income Fund (renamed Invesco Growth and Income Fund). Returns shown above for Class A, Class B, Class C, Class R and Class Y shares are blended returns of the predecessor fund and Invesco Growth and Income Fund. Share class returns will differ from the predecessor fund because of different expenses.
Class R5 shares incepted on June 1, 2010. Performance shown prior to that date is that of the predecessor fund’s Class A shares and includes the 12b-1
| Average Annual Total Returns | ||||
| As of 6/30/13, the most recent calendar quarter end, including maximum applicable sales charges | ||||
| Class A Shares | ||||
| Inception (8/1/46) | 9.40 | % | ||
| 10 Years | 7.37 | |||
| 5 Years | 6.20 | |||
| 1 Year | 18.40 | |||
| Class B Shares | ||||
| Inception (8/2/93) | 9.40 | % | ||
| 10 Years | 7.75 | |||
| 5 Years | 7.08 | |||
| 1 Year | 20.22 | |||
| Class C Shares | ||||
| Inception (8/2/93) | 8.93 | % | ||
| 10 Years | 7.19 | |||
| 5 Years | 6.63 | |||
| 1 Year | 23.34 | |||
| Class R Shares | ||||
| Inception (10/1/02) | 8.60 | % | ||
| 10 Years | 7.70 | |||
| 5 Years | 7.15 | |||
| 1 Year | 24.93 | |||
| Class Y Shares | ||||
| Inception (10/19/04) | 7.37 | % | ||
| 5 Years | 7.67 | |||
| 1 Year | 25.57 | |||
| Class R5 Shares | ||||
| 10 Years | 8.10 | % | ||
| 5 Years | 7.67 | |||
| 1 Year | 25.68 | |||
| Class R6 Shares | ||||
| 10 Years | 8.01 | % | ||
| 5 Years | 7.49 | |||
| 1 Year | 25.70 | |||
fees applicable to Class A shares. Class A share performance reflects any applicable fee waivers or expense reimbursements.
Class R6 shares incepted on September 24, 2012. Performance shown prior to that date is that of the Fund’s and the predecessor fund’s Class A shares and includes the 12b-1 fees applicable to Class A shares. Class A share performance reflects any applicable fee waivers or expense reimbursements.
The performance data quoted represent past performance and cannot guarantee comparable future results; current performance may be lower or higher. Please visit invesco.com/performance for the most recent month-end performance. Performance figures reflect reinvested
distributions, changes in net asset value and the effect of the maximum sales charge unless otherwise stated. Investment return and principal value will fluctuate so that you may have a gain or loss when you sell shares.
The total annual Fund operating expense ratio set forth in the most recent Fund prospectus as of the date of this report for Class A, Class B, Class C, Class R, Class Y, Class R5 and Class R6 shares was 0.84%, 0.84%, 1.56%, 1.09%, 0.59%, 0.47% and 0.39%, respectively. The expense ratios presented above may vary from the expense ratios presented in other sections of this report that are based on expenses incurred during the period covered by this report.
Class A share performance reflects the maximum 5.50% sales charge, and Class B and Class C share performance reflects the applicable contingent deferred sales charge (CDSC) for the period involved. For shares purchased prior to June 1, 2010, the CDSC on Class B shares declines from 5% at the time of purchase to 0% at the beginning of the sixth year. For shares purchased on or after June 1, 2010, the CDSC on Class B shares declines from 5% at the time of purchase to 0% at the beginning of the seventh year. The CDSC on Class C shares is 1% for the first year after purchase. Class R, Class Y, Class R5 and Class R6 shares do not have a front-end sales charge or a CDSC; therefore, performance is at net asset value.
The performance of the Fund’s share classes will differ primarily due to different sales charge structures and class expenses.
| 7 | Invesco Growth and Income Fund |
Invesco Growth and Income Fund’s investment objective is to seek income and long-term growth of capital.
| n | Unless otherwise stated, information presented in this report is as of August 31, 2013, and is based on total net assets. |
| n | Unless otherwise noted, all data provided by Invesco. |
| n | To access your Fund’s reports/prospectus, visit invesco.com/fundreports. |
About share classes
| n | Class B shares may not be purchased for new or additional investments. Please see the prospectus for more information. |
| n | Class R shares are generally available only to employer sponsored retirement and benefit plans. Please see the prospectus for more information. |
| n | Class Y shares are available only to certain investors. Please see the prospectus for more information. |
| n | Class R5 shares and Class R6 shares are primarily intended for employer sponsored retirement and benefit plans that meet certain standards and for institutional investors. On September 24, 2012, Institutional Class shares were renamed Class R5 shares. Please see the prospectus for more information. |
Principal risks of investing in the Fund
| n | Management risk. The investment techniques and risk analysis used by the Fund’s portfolio managers may not produce the desired results. |
| n | Market risk. The prices of and the income generated by the Fund’s securities may decline in response to, among other things, investor sentiment, general economic and market conditions, regional or global instability, and currency and interest rate fluctuations. |
| n | Foreign risk. The risks of investing in securities of foreign issuers, including emerging markets issuers, can include fluctuations in foreign currencies, foreign currency exchange controls, political and economic instability, differences in financial reporting, differences in securities regulation and trading, and foreign taxation issues. |
| n | Investing in real estate investment trust (REITs) risk. Investing in REITs makes the Fund more susceptible to risks associated with the ownership of real estate and with the real estate industry in general and may involve duplication of |
management fees and certain other expenses. In addition, REITs depend upon specialized management skills, may be less diversified, may have lower trading volume, and may be subject to more abrupt or erratic price movements than the overall securities markets. |
| n | Small- and mid-capitalization risk. Stocks of small and mid-sized companies tend to be more vulnerable to adverse developments in the above factors and may have little or no operating history or track record of success, and limited product lines, markets, management and financial resources. The securities of small and mid-sized companies may be more volatile due to less market interest and less publicly available information about the issuer. They also may be illiquid or restricted as to resale, or may trade less frequently and in smaller volumes, all of which may cause difficulty when establishing or closing a position at a desirable price. |
| n | Derivatives risk. The performance of derivative instruments is tied to the performance of an underlying currency, security, index or other instrument. In addition to risks relating to their underlying instruments, the use of derivatives may include other, possibly greater, risks. Derivatives involve costs, may be volatile, and may involve a small initial investment relative to the risk assumed. Risks associated with the use of derivatives include counterparty, leverage, correlation, liquidity, tax, market, interest rate and management risks. Derivatives may also be more difficult to purchase, sell or value than other investments. The Fund may lose more than the cash amount invested on investments in derivatives. Investors should bear in mind that, while the Fund intends to use derivative strategies, it is not obligated to actively engage in these transactions, generally or in any particular kind of derivative, if the investment manager elects not to do so due to availability, cost, market conditions or other factors. |
| n | Value investing style risk. The Fund emphasizes a value style of investing, which focuses on undervalued companies with characteristics for improved valuations. This style of investing is subject to the risk that the valuations never improve or that the returns on value equity securities are less than returns on other styles of investing or the overall stock market. Value stocks also may decline in price, even though in theory they are already underpriced. |
About indexes used in this report
| n | The S&P 500® Index is an unmanaged index considered representative of the US stock market. |
| n | The Russell 1000® Value Index is an unmanaged index considered representative of large-cap value stocks. The Russell 1000 Value Index is a trademark/service mark of the Frank Russell Co. Russell® is a trademark of the Frank Russell Co. |
| n | The Lipper Large-Cap Value Funds Index is an unmanaged index considered representative of large-cap value funds tracked by Lipper. |
| n | The Fund is not managed to track the performance of any particular index, including the index(es) described here, and consequently, the performance of the Fund may deviate significantly from the performance of the index(es). |
| n | A direct investment cannot be made in an index. Unless otherwise indicated, index results include reinvested dividends, and they do not reflect sales charges. Performance of the peer group, if applicable, reflects fund expenses; performance of a market index does not. |
continued on page 6
This report must be accompanied or preceded by a currently effective Fund prospectus, which contains more complete information, including sales charges and expenses. Investors should read it carefully before investing.
NOT FDIC INSURED | MAY LOSE VALUE | NO BANK GUARANTEE
| Fund Nasdaq Symbols | ||||
Class A Shares | ACGIX | |||
Class B Shares | ACGJX | |||
Class C Shares | ACGKX | |||
Class R Shares | ACGLX | |||
Class Y Shares | ACGMX | |||
Class R5 Shares | ACGQX | |||
Class R6 Shares | GIFFX | |||
| 8 | Invesco Growth and Income Fund |
Schedule of Investments(a)
August 31, 2013
| Shares | Value | |||||||
Common Stocks & Other Equity Interests–97.03% |
| |||||||
| Aerospace & Defense–0.65% | ||||||||
General Dynamics Corp. | 639,407 | $ | 53,230,633 | |||||
| Agricultural Products–1.36% | ||||||||
Archer-Daniels-Midland Co. | 3,163,128 | 111,373,737 | ||||||
| Application Software–1.56% | ||||||||
Adobe Systems Inc.(b) | 2,804,304 | 128,296,908 | ||||||
| Asset Management & Custody Banks–2.23% | ||||||||
Northern Trust Corp. | 1,413,080 | 77,535,700 | ||||||
State Street Corp. | 1,586,368 | 105,842,473 | ||||||
| 183,378,173 | ||||||||
| Automobile Manufacturers–1.24% | ||||||||
General Motors Co.(b) | 2,996,457 | 102,119,255 | ||||||
| Biotechnology–1.68% | ||||||||
Amgen Inc. | 1,263,481 | 137,643,620 | ||||||
| Cable & Satellite–3.96% | ||||||||
Comcast Corp.–Class A | 3,776,736 | 158,962,818 | ||||||
Time Warner Cable Inc. | 1,544,604 | 165,813,240 | ||||||
| 324,776,058 | ||||||||
| Diversified Banks–2.42% | ||||||||
Comerica Inc. | 2,065,976 | 84,374,460 | ||||||
Wells Fargo & Co. | 2,775,106 | 114,001,354 | ||||||
| 198,375,814 | ||||||||
| Diversified Chemicals–2.02% | ||||||||
Dow Chemical Co. (The) | 2,842,563 | 106,311,856 | ||||||
PPG Industries, Inc. | 379,036 | 59,209,214 | ||||||
| 165,521,070 | ||||||||
| Electric Utilities–1.74% | ||||||||
Edison International | 856,789 | 39,318,047 | ||||||
FirstEnergy Corp. | 745,343 | 27,928,002 | ||||||
Pinnacle West Capital Corp. | 1,398,696 | 75,907,232 | ||||||
| 143,153,281 | ||||||||
| Electronic Components–0.71% | ||||||||
Corning Inc. | 4,125,033 | 57,915,463 | ||||||
| Food Distributors–1.22% | ||||||||
Sysco Corp. | 3,128,744 | 100,182,383 | ||||||
| Health Care Equipment–1.50% | ||||||||
Medtronic, Inc. | 2,382,055 | 123,271,346 | ||||||
| Home Improvement Retail–0.72% | ||||||||
Home Depot, Inc. (The) | 790,542 | 58,887,474 | ||||||
| Hotels, Resorts & Cruise Lines–1.04% | ||||||||
Carnival Corp. | 2,355,098 | 84,995,487 | ||||||
| Shares | Value | |||||||
| Household Products–1.51% | ||||||||
Procter & Gamble Co. (The) | 1,595,225 | $ | 124,252,075 | |||||
| Industrial Conglomerates–2.85% | ||||||||
General Electric Co. | 10,095,151 | 233,601,794 | ||||||
| Industrial Machinery–1.06% | ||||||||
Ingersoll-Rand PLC | 1,475,477 | 87,259,710 | ||||||
| Insurance Brokers–3.81% | ||||||||
Aon PLC | 1,178,969 | 78,259,962 | ||||||
Marsh & McLennan Cos., Inc. | 4,305,329 | 177,508,715 | ||||||
Willis Group Holdings PLC | 1,373,230 | 56,686,934 | ||||||
| 312,455,611 | ||||||||
| Integrated Oil & Gas–3.58% | ||||||||
Chevron Corp. | 1,270,997 | 153,066,169 | ||||||
Exxon Mobil Corp. | 955,468 | 83,278,591 | ||||||
Occidental Petroleum Corp. | 653,841 | 57,675,314 | ||||||
| 294,020,074 | ||||||||
| Integrated Telecommunication Services–0.53% | ||||||||
Verizon Communications Inc. | 925,492 | 43,849,811 | ||||||
| Internet Software & Services–1.89% | ||||||||
eBay Inc.(b) | 3,104,938 | 155,215,851 | ||||||
| Investment Banking & Brokerage–4.44% | ||||||||
Charles Schwab Corp. (The) | 5,833,112 | 121,795,378 | ||||||
Goldman Sachs Group, Inc. (The) | 433,953 | 66,017,270 | ||||||
Morgan Stanley | 6,862,092 | 176,767,490 | ||||||
| 364,580,138 | ||||||||
| IT Consulting & Other Services–1.09% | ||||||||
Amdocs Ltd. | 2,434,385 | 89,731,431 | ||||||
| Managed Health Care–3.96% | ||||||||
Cigna Corp. | 1,119,189 | 88,068,982 | ||||||
UnitedHealth Group Inc. | 1,379,016 | 98,930,608 | ||||||
WellPoint, Inc. | 1,618,963 | 137,838,510 | ||||||
| 324,838,100 | ||||||||
| Movies & Entertainment–3.50% | ||||||||
Time Warner Inc. | 840,798 | 50,893,503 | ||||||
Viacom Inc.–Class B | 2,966,924 | 236,048,473 | ||||||
| 286,941,976 | ||||||||
| Oil & Gas Equipment & Services–1.82% | ||||||||
Baker Hughes Inc. | 1,659,698 | 77,159,360 | ||||||
Halliburton Co. | 1,503,910 | 72,187,680 | ||||||
| 149,347,040 | ||||||||
| Oil & Gas Exploration & Production–2.72% | ||||||||
Anadarko Petroleum Corp. | 1,365,103 | 124,797,716 | ||||||
Canadian Natural Resources Ltd. (Canada) | 3,241,428 | 98,907,715 | ||||||
| 223,705,431 | ||||||||
See accompanying Notes to Financial Statements which are an integral part of the financial statements.
9 Invesco Growth and Income Fund
| Shares | Value | |||||||
| Oil & Gas Storage & Transportation–0.73% | ||||||||
Williams Cos., Inc. (The) | 1,660,545 | $ | 60,178,151 | |||||
| Other Diversified Financial Services–8.92% | ||||||||
Bank of America Corp. | 4,632,925 | 65,416,901 | ||||||
Citigroup Inc. | 5,876,224 | 283,997,906 | ||||||
ING U.S. Inc. | 1,304,267 | 37,562,890 | ||||||
JPMorgan Chase & Co. | 6,835,291 | 345,387,254 | ||||||
| 732,364,951 | ||||||||
| Packaged Foods & Meats–2.30% | ||||||||
Mondelez International Inc.–Class A | 4,744,110 | 145,501,854 | ||||||
Unilever N.V.–New York Shares (Netherlands) | 1,148,927 | 43,234,123 | ||||||
| 188,735,977 | ||||||||
| Personal Products–2.44% | ||||||||
Avon Products, Inc. | 10,142,582 | 200,518,846 | ||||||
| Pharmaceuticals–7.18% | ||||||||
Bristol-Myers Squibb Co. | 1,866,345 | 77,807,923 | ||||||
Eli Lilly & Co. | 1,811,050 | 93,087,970 | ||||||
Merck & Co., Inc. | 3,133,741 | 148,194,612 | ||||||
Novartis AG (Switzerland) | 1,315,673 | 95,946,274 | ||||||
Novartis AG–ADR (Switzerland) | 119,384 | 8,712,644 | ||||||
Pfizer Inc. | 3,366,872 | 94,979,459 | ||||||
Teva Pharmaceutical Industries Ltd.– ADR (Israel) | 1,857,913 | 71,009,435 | ||||||
| 589,738,317 | ||||||||
| Property & Casualty Insurance–0.79% | ||||||||
Chubb Corp. (The) | 777,703 | 64,681,558 | ||||||
| Publishing–0.50% | ||||||||
Thomson Reuters Corp. (Canada) | 1,264,444 | 41,439,862 | ||||||
| Railroads–0.81% | ||||||||
CSX Corp. | 2,697,464 | 66,384,589 | ||||||
| Regional Banks–4.18% | ||||||||
BB&T Corp. | 2,588,691 | 87,911,946 | ||||||
Fifth Third Bancorp | 4,273,634 | 78,164,766 | ||||||
| Shares | Value | |||||||
| Regional Banks–(continued) | ||||||||
PNC Financial Services Group, Inc. | 2,445,707 | $ | 176,751,245 | |||||
| 342,827,957 | ||||||||
| Security & Alarm Services–2.53% | ||||||||
ADT Corp. (The) | 1,996,135 | 79,506,057 | ||||||
Tyco International Ltd. | 3,883,770 | 128,319,761 | ||||||
| 207,825,818 | ||||||||
| Semiconductor Equipment–1.87% | ||||||||
Applied Materials, Inc. | 10,222,963 | 153,446,675 | ||||||
| Semiconductors–1.02% | ||||||||
Texas Instruments Inc. | 2,194,732 | 83,838,762 | ||||||
| Soft Drinks–0.92% | ||||||||
Coca-Cola Co. (The) | 1,989,010 | 75,940,402 | ||||||
| Specialized Finance–0.81% | ||||||||
CME Group Inc.–Class A | 938,216 | 66,716,540 | ||||||
| Systems Software–3.51% | ||||||||
Microsoft Corp. | 5,348,829 | 178,650,888 | ||||||
Symantec Corp. | 4,279,226 | 109,590,978 | ||||||
| 288,241,866 | ||||||||
| Wireless Telecommunication Services–1.71% | ||||||||
Vodafone Group PLC–ADR (United Kingdom) | 4,333,866 | 140,200,565 | ||||||
Total Common Stocks & Other Equity Interests |
| 7,966,000,580 | ||||||
Money Market Funds–2.99% |
| |||||||
Liquid Assets Portfolio–Institutional Class(c) | 122,624,468 | 122,624,468 | ||||||
Premier Portfolio–Institutional Class(c) | 122,624,467 | 122,624,467 | ||||||
Total Money Market Funds |
| 245,248,935 | ||||||
TOTAL INVESTMENTS–100.02% |
| 8,211,249,515 | ||||||
OTHER ASSETS LESS LIABILITIES–(0.02)% |
| (1,506,614 | ) | |||||
NET ASSETS–100.00% |
| $ | 8,209,742,901 | |||||
Investment Abbreviations:
| ADR | – American Depositary Receipt |
Notes to Schedule of Investments:
| (a) | Industry and/or sector classifications used in this report are generally according to the Global Industry Classification Standard, which was developed by and is the exclusive property and a service mark of MSCI Inc. and Standard & Poor’s. |
| (b) | Non-income producing security. |
| (c) | The money market fund and the Fund are affiliated by having the same investment adviser. |
See accompanying Notes to Financial Statements which are an integral part of the financial statements.
10 Invesco Growth and Income Fund
Statement of Assets and Liabilities
August 31, 2013
Assets: |
| |||
Investments, at value (Cost $6,025,353,935) | $ | 7,966,000,580 | ||
Investments in affiliated money market funds, at value and cost | 245,248,935 | |||
Total investments, at value (Cost $6,270,602,870) | 8,211,249,515 | |||
Foreign currencies, at value (Cost $22) | 22 | |||
Receivable for: | ||||
Fund shares sold | 8,509,250 | |||
Dividends | 16,452,239 | |||
Fund expenses absorbed | 6,102 | |||
Foreign currency contracts outstanding | 1,634,238 | |||
Investment for trustee deferred compensation and retirement plans | 74,554 | |||
Other assets | 77,311 | |||
Total assets | 8,238,003,231 | |||
Liabilities: |
| |||
Payable for: | ||||
Investments purchased | 12,725,451 | |||
Fund shares reacquired | 9,281,860 | |||
Accrued fees to affiliates | 5,577,198 | |||
Accrued trustees’ and officers’ fees and benefits | 18,898 | |||
Accrued other operating expenses | 134,466 | |||
Trustee deferred compensation and retirement plans | 522,457 | |||
Total liabilities | 28,260,330 | |||
Net assets applicable to shares outstanding | $ | 8,209,742,901 | ||
Net assets consist of: |
| |||
Shares of beneficial interest | $ | 6,167,962,323 | ||
Undistributed net investment income | 32,190,683 | |||
Undistributed net realized gain | 67,307,874 | |||
Unrealized appreciation | 1,942,282,021 | |||
| $ | 8,209,742,901 | |||
Net Assets: |
| |||
Class A | $ | 4,766,859,776 | ||
Class B | $ | 101,722,935 | ||
Class C | $ | 289,458,048 | ||
Class R | $ | 170,691,045 | ||
Class Y | $ | 1,826,645,769 | ||
Class R5 | $ | 718,816,358 | ||
Class R6 | $ | 335,548,970 | ||
Shares outstanding, $0.01 par value per share, |
| |||
Class A | 191,259,834 | |||
Class B | 4,109,924 | |||
Class C | 11,727,418 | |||
Class R | 6,846,755 | |||
Class Y | 73,229,759 | |||
Class R5 | 28,792,024 | |||
Class R6 | 13,435,696 | |||
Class A: | ||||
Net asset value per share | $ | 24.92 | ||
Maximum offering price per share | ||||
(Net asset value of $24.92 ¸ 94.50%) | $ | 26.37 | ||
Class B: | ||||
Net asset value and offering price per share | $ | 24.75 | ||
Class C: | ||||
Net asset value and offering price per share | $ | 24.68 | ||
Class R: | ||||
Net asset value and offering price per share | $ | 24.93 | ||
Class Y: | ||||
Net asset value and offering price per share | $ | 24.94 | ||
Class R5: | ||||
Net asset value and offering price per share | $ | 24.97 | ||
Class R6: | ||||
Net asset value and offering price per share | $ | 24.97 | ||
See accompanying Notes to Financial Statements which are an integral part of the financial statements.
11 Invesco Growth and Income Fund
Statement of Operations
For the year ended August 31, 2013
Investment income: |
| |||
Dividends (net of foreign withholding taxes of $1,098,948) | $ | 164,653,401 | ||
Dividends from affiliated money market funds | 469,510 | |||
Total investment income | 165,122,911 | |||
Expenses: | ||||
Advisory fees | 26,869,282 | |||
Administrative services fees | 706,779 | |||
Custodian fees | 199,607 | |||
Distribution fees: | ||||
Class A | 11,277,889 | |||
Class B | 287,654 | |||
Class C | 2,714,672 | |||
Class R | 800,153 | |||
Transfer agent fees — A, B, C, R and Y | 12,588,307 | |||
Transfer agent fees — R5 | 659,947 | |||
Transfer agent fees — R6 | 6,827 | |||
Trustees’ and officers’ fees and benefits | 259,817 | |||
Other | 970,469 | |||
Total expenses | 57,341,403 | |||
Less: Fees waived and expense offset arrangement(s) | (661,539 | ) | ||
Net expenses | 56,679,864 | |||
Net investment income | 108,443,047 | |||
Realized and unrealized gain (loss) from: | ||||
Net realized gain (loss) from: | ||||
Investment securities (includes net gains from securities sold to affiliates of $555,165 and net gains from a redemption-in-kind of $32,433,272) | 350,816,899 | |||
Foreign currencies | (1,997 | ) | ||
Foreign currency contracts | (2,410,724 | ) | ||
Option contracts written | 1,183,509 | |||
| 349,587,687 | ||||
Change in net unrealized appreciation of: | ||||
Investment securities | 1,107,519,556 | |||
Foreign currencies | 1,138 | |||
Foreign currency contracts | 5,255,384 | |||
| 1,112,776,078 | ||||
Net realized and unrealized gain | 1,462,363,765 | |||
Net increase in net assets resulting from operations | $ | 1,570,806,812 | ||
See accompanying Notes to Financial Statements which are an integral part of the financial statements.
12 Invesco Growth and Income Fund
Statement of Changes in Net Assets
For the years ended August 31, 2013 and 2012
| 2013 | 2012 | |||||||
Operations: | ||||||||
Net investment income | $ | 108,443,047 | $ | 118,111,860 | ||||
Net realized gain | 349,587,687 | 118,506,049 | ||||||
Change in net unrealized appreciation | 1,112,776,078 | 759,000,887 | ||||||
Net increase in net assets resulting from operations | 1,570,806,812 | 995,618,796 | ||||||
Distributions to shareholders from net investment income: | ||||||||
Class A | (67,443,335 | ) | (59,605,705 | ) | ||||
Class B | (1,795,917 | ) | (2,152,331 | ) | ||||
Class C | (2,104,718 | ) | (1,777,886 | ) | ||||
Class R | (1,994,383 | ) | (1,802,136 | ) | ||||
Class Y | (28,763,044 | ) | (25,675,865 | ) | ||||
Class R5 | (11,863,944 | ) | (8,285,467 | ) | ||||
Class R6 | (2,246,832 | ) | — | |||||
Total distributions from net investment income | (116,212,173 | ) | (99,299,390 | ) | ||||
Share transactions–net: | ||||||||
Class A | (374,596,526 | ) | (444,348,164 | ) | ||||
Class B | (45,861,702 | ) | (67,147,189 | ) | ||||
Class C | (17,556,960 | ) | (36,595,581 | ) | ||||
Class R | (7,843,983 | ) | (19,883,547 | ) | ||||
Class Y | (1,106,001 | ) | (243,908,937 | ) | ||||
Class R5 | (101,402,342 | ) | 329,867,182 | |||||
Class R6 | 308,180,509 | — | ||||||
Net increase (decrease) in net assets resulting from share transactions | (240,187,005 | ) | (482,016,236 | ) | ||||
Net increase in net assets | 1,214,407,634 | 414,303,170 | ||||||
Net assets: | ||||||||
Beginning of year | 6,995,335,267 | 6,581,032,097 | ||||||
End of year (includes undistributed net investment income of $32,190,683 and $39,825,760, respectively) | $ | 8,209,742,901 | $ | 6,995,335,267 | ||||
Notes to Financial Statements
August 31, 2013
NOTE 1—Significant Accounting Policies
Invesco Growth and Income Fund (the “Fund”) is a series portfolio of AIM Counselor Series Trust (Invesco Counselor Series Trust) (the “Trust”). The Trust is a Delaware statutory trust registered under the Investment Company Act of 1940, as amended (the “1940 Act”), as an open-end series management investment company consisting of twelve separate portfolios, each authorized to issue an unlimited number of shares of beneficial interest. The assets, liabilities and operations of each portfolio are accounted for separately. Information presented in these financial statements pertains only to the Fund. Matters affecting each portfolio or class will be voted on exclusively by the shareholders of such portfolio or class.
The Fund’s investment objective is to seek income and long-term growth of capital.
The Fund currently consists of seven different classes of shares: Class A, Class B, Class C, Class R, Class Y, Class R5 and Class R6. On September 24, 2012, Institutional Class shares were renamed Class R5 shares and the Fund began offering Class R6 shares. Class A shares are sold with a front-end sales charge unless certain waiver criteria are met and under certain circumstances load waived shares may be subject to contingent deferred sales charges (“CDSC”). Class C shares are sold with a CDSC. Class R, Class Y, Class R5 and Class R6 shares are sold at net asset value. Effective November 30, 2010, new or additional investments in Class B shares are no longer permitted. Existing shareholders of Class B shares may continue to reinvest dividends and capital gains distributions in Class B shares until they convert to Class A shares. Also, shareholders in Class B shares will be able to exchange those shares for Class B shares of other Invesco Funds offering such shares until they convert to Class A shares. Generally, Class B shares will automatically convert to Class A shares on or about the month-end, which is at least eight years after the date of purchase. Redemption of Class B shares prior to the conversion date will be subject to a CDSC.
The following is a summary of the significant accounting policies followed by the Fund in the preparation of its financial statements.
| A. | Security Valuations — Securities, including restricted securities, are valued according to the following policy. |
A security listed or traded on an exchange (except convertible bonds) is valued at its last sales price or official closing price as of the close of the customary trading session on the exchange where the security is principally traded, or lacking any sales or official closing price on a particular day, the security may be valued at the closing bid price on that day. Securities traded in the over-the-counter market are valued based on prices
13 Invesco Growth and Income Fund
furnished by independent pricing services or market makers. When such securities are valued by an independent pricing service they may be considered fair valued. Futures contracts are valued at the final settlement price set by an exchange on which they are principally traded. Listed options are valued at the mean between the last bid and ask prices from the exchange on which they are principally traded. Options not listed on an exchange are valued by an independent source at the mean between the last bid and ask prices. For purposes of determining net asset value per share, futures and option contracts generally are valued 15 minutes after the close of the customary trading session of the New York Stock Exchange (“NYSE”).
Investments in open-end and closed-end registered investment companies that do not trade on an exchange are valued at the end of day net asset value per share. Investments in open-end and closed-end registered investment companies that trade on an exchange are valued at the last sales price or official closing price as of the close of the customary trading session on the exchange where the security is principally traded.
Debt obligations (including convertible bonds) and unlisted equities are fair valued using an evaluated quote provided by an independent pricing service. Evaluated quotes provided by the pricing service may be determined without exclusive reliance on quoted prices, and may reflect appropriate factors such as institution-size trading in similar groups of securities, developments related to specific securities, dividend rate (for unlisted equities), yield (for debt obligations), quality, type of issue, coupon rate (for debt obligations), maturity (for debt obligations), individual trading characteristics and other market data. Debt obligations are subject to interest rate and credit risks. In addition, all debt obligations involve some risk of default with respect to interest and/or principal payments.
Foreign securities’ (including foreign exchange contracts) prices are converted into U.S. dollar amounts using the applicable exchange rates as of the close of the NYSE. If market quotations are available and reliable for foreign exchange-traded equity securities, the securities will be valued at the market quotations. Because trading hours for certain foreign securities end before the close of the NYSE, closing market quotations may become unreliable. If between the time trading ends on a particular security and the close of the customary trading session on the NYSE, events occur that the Adviser determines are significant and make the closing price unreliable, the Fund may fair value the security. If the event is likely to have affected the closing price of the security, the security will be valued at fair value in good faith using procedures approved by the Board of Trustees. Adjustments to closing prices to reflect fair value may also be based on a screening process of an independent pricing service to indicate the degree of certainty, based on historical data, that the closing price in the principal market where a foreign security trades is not the current value as of the close of the NYSE. Foreign securities’ prices meeting the approved degree of certainty that the price is not reflective of current value will be priced at the indication of fair value from the independent pricing service. Multiple factors may be considered by the independent pricing service in determining adjustments to reflect fair value and may include information relating to sector indices, American Depositary Receipts and domestic and foreign index futures. Foreign securities may have additional risks including exchange rate changes, potential for sharply devalued currencies and high inflation, political and economic upheaval, the relative lack of issuer information, relatively low market liquidity and the potential lack of strict financial and accounting controls and standards.
Securities for which market prices are not provided by any of the above methods may be valued based upon quotes furnished by independent sources. The last bid price may be used to value equity securities. The mean between the last bid and asked prices is used to value debt obligations, including corporate loans.
Securities for which market quotations are not readily available or became unreliable are valued at fair value as determined in good faith by or under the supervision of the Trust’s officers following procedures approved by the Board of Trustees. Issuer specific events, market trends, bid/ask quotes of brokers and information providers and other market data may be reviewed in the course of making a good faith determination of a security’s fair value.
Valuations change in response to many factors including the historical and prospective earnings of the issuer, the value of the issuer’s assets, general economic conditions, interest rates, investor perceptions and market liquidity. Because of the inherent uncertainties of valuation, the values reflected in the financial statements may materially differ from the value received upon actual sale of those investments.
| B. | Securities Transactions and Investment Income — Securities transactions are accounted for on a trade date basis. Realized gains or losses on sales are computed on the basis of specific identification of the securities sold. Interest income is recorded on the accrual basis from settlement date. Dividend income (net of withholding tax, if any) is recorded on the ex-dividend date. |
The Fund may periodically participate in litigation related to Fund investments. As such, the Fund may receive proceeds from litigation settlements. Any proceeds received are included in the Statement of Operations as realized gain (loss) for investments no longer held and as unrealized gain (loss) for investments still held.
Brokerage commissions and mark ups are considered transaction costs and are recorded as an increase to the cost basis of securities purchased and/or a reduction of proceeds on a sale of securities. Such transaction costs are included in the determination of net realized and unrealized gain (loss) from investment securities reported in the Statement of Operations and the Statement of Changes in Net Assets and the net realized and unrealized gains (losses) on securities per share in the Financial Highlights. Transaction costs are included in the calculation of the Fund’s net asset value and, accordingly, they reduce the Fund’s total returns. These transaction costs are not considered operating expenses and are not reflected in net investment income reported in the Statement of Operations and Statement of Changes in Net Assets, or the net investment income per share and ratios of expenses and net investment income reported in the Financial Highlights, nor are they limited by any expense limitation arrangements between the Fund and the investment adviser.
The Fund allocates income and realized and unrealized capital gains and losses to a class based on the relative net assets of each class.
| C. | Country Determination — For the purposes of making investment selection decisions and presentation in the Schedule of Investments, the investment adviser may determine the country in which an issuer is located and/or credit risk exposure based on various factors. These factors include the laws of the country under which the issuer is organized, where the issuer maintains a principal office, the country in which the issuer derives 50% or more of its total revenues and the country that has the primary market for the issuer’s securities, as well as other criteria. Among the other criteria that may be evaluated for making this determination are the country in which the issuer maintains 50% or more of its assets, the type of security, financial guarantees and enhancements, the nature of the collateral and the sponsor organization. Country of issuer and/or credit risk exposure has been determined to be the United States of America, unless otherwise noted. |
| D. | Distributions — Distributions from income, if any, are declared and paid quarterly and are recorded on the ex-dividend date. Distributions from net realized capital gain, if any, are generally declared and paid annually and recorded on the ex-dividend date. The Fund may elect to treat a portion of the proceeds from redemptions as distributions for federal income tax purposes. |
14 Invesco Growth and Income Fund
| E. | Federal Income Taxes — The Fund intends to comply with the requirements of Subchapter M of the Internal Revenue Code of 1986, as amended (the “Internal Revenue Code”), necessary to qualify as a regulated investment company and to distribute substantially all of the Fund’s taxable earnings to shareholders. As such, the Fund will not be subject to federal income taxes on otherwise taxable income (including net realized capital gain) that is distributed to shareholders. Therefore, no provision for federal income taxes is recorded in the financial statements. |
The Fund files tax returns in the U.S. Federal jurisdiction and certain other jurisdictions. Generally, the Fund is subject to examinations by such taxing authorities for up to three years after the filing of the return for the tax period.
| F. | Expenses — Fees provided for under the Rule 12b-1 plan of a particular class of the Fund are charged to the operations of such class. Transfer agency fees and expenses and other shareholder recordkeeping fees and expenses attributable to Class R5 and Class R6 are allocated to each share class based on relative net assets. Sub-accounting fees attributable to Class R5 are charged to the operations of the class. Transfer agency fees and expenses and other shareholder recordkeeping fees and expenses relating to all other classes are allocated among those classes based on relative net assets. All other expenses are allocated among the classes based on relative net assets. Prior to June 1, 2010, incremental transfer agency fees which were unique to each class of shares were charged to the operations of such class. |
| G. | Accounting Estimates — The preparation of financial statements in conformity with accounting principles generally accepted in the United States of America (“GAAP”) requires management to make estimates and assumptions that affect the reported amounts of assets and liabilities at the date of the financial statements and the reported amounts of revenues and expenses during the reporting period including estimates and assumptions related to taxation. Actual results could differ from those estimates by a significant amount. In addition, the Fund monitors for material events or transactions that may occur or become known after the period-end date and before the date the financial statements are released to print. |
| H. | Indemnifications — Under the Trust’s organizational documents, each Trustee, officer, employee or other agent of the Trust is indemnified against certain liabilities that may arise out of the performance of their duties to the Fund. Additionally, in the normal course of business, the Fund enters into contracts, including the Fund’s servicing agreements, that contain a variety of indemnification clauses. The Fund’s maximum exposure under these arrangements is unknown as this would involve future claims that may be made against the Fund that have not yet occurred. The risk of material loss as a result of such indemnification claims is considered remote. |
| I. | Foreign Currency Translations — Foreign currency is valued at the close of the NYSE based on quotations posted by banks and major currency dealers. Portfolio securities and other assets and liabilities denominated in foreign currencies are translated into U.S. dollar amounts at date of valuation. Purchases and sales of portfolio securities (net of foreign taxes withheld on disposition) and income items denominated in foreign currencies are translated into U.S. dollar amounts on the respective dates of such transactions. The Fund does not separately account for the portion of the results of operations resulting from changes in foreign exchange rates on investments and the fluctuations arising from changes in market prices of securities held. The combined results of changes in foreign exchange rates and the fluctuation of market prices on investments (net of estimated foreign tax withholding) are included with the net realized and unrealized gain or loss from investments in the Statement of Operations. Reported net realized foreign currency gains or losses arise from (1) sales of foreign currencies, (2) currency gains or losses realized between the trade and settlement dates on securities transactions, and (3) the difference between the amounts of dividends, interest, and foreign withholding taxes recorded on the Fund’s books and the U.S. dollar equivalent of the amounts actually received or paid. Net unrealized foreign currency gains and losses arise from changes in the fair values of assets and liabilities, other than investments in securities at fiscal period end, resulting from changes in exchange rates. |
The Fund may invest in foreign securities which may be subject to foreign taxes on income, gains on investments or currency repatriation, a portion of which may be recoverable.
| J. | Foreign Currency Contracts — The Fund may enter into foreign currency contracts to manage or minimize currency or exchange rate risk. The Fund may also enter into foreign currency contracts for the purchase or sale of a security denominated in a foreign currency in order to “lock in” the U.S. dollar price of that security. A foreign currency contract is an obligation to purchase or sell a specific currency for an agreed-upon price at a future date. The use of foreign currency contracts does not eliminate fluctuations in the price of the underlying securities the Fund owns or intends to acquire but establishes a rate of exchange in advance. Fluctuations in the value of these contracts are measured by the difference in the contract date and reporting date exchange rates and are recorded as unrealized appreciation (depreciation) until the contracts are closed. When the contracts are closed, realized gains (losses) are recorded. Realized and unrealized gains (losses) on the contracts are included in the Statement of Operations. The primary risks associated with foreign currency contracts include failure of the counterparty to meet the terms of the contract and the value of the foreign currency changing unfavorably. These risks may be in excess of the amounts reflected in the Statement of Assets and Liabilities. |
| K. | Call Options Written — The Fund may write covered call options. A covered call option gives the purchaser of such option the right to buy, and the writer (the Fund) the obligation to sell, the underlying security at the stated exercise price during the option period. Written call options are recorded as a liability in the Statement of Assets and Liabilities. The amount of the liability is subsequently “marked-to-market” to reflect the current market value of the option written. If a written covered call option expires on the stipulated expiration date, or if the Fund enters into a closing purchase transaction, the Fund realizes a gain (or a loss if the closing purchase transaction exceeds the premium received when the option was written) without regard to any unrealized gain or loss on the underlying security, and the liability related to such option is extinguished. If a written covered call option is exercised, the Fund realizes a gain or a loss from the sale of the underlying security and the proceeds of the sale are increased by the premium originally received. Realized gains and losses on these contracts are included in the Statement of Operations. A risk in writing a covered call option is that the Fund gives up the opportunity for profit if the market price of the security increases and the option is exercised. |
15 Invesco Growth and Income Fund
NOTE 2—Advisory Fees and Other Fees Paid to Affiliates
The Trust has entered into a master investment advisory agreement with Invesco Advisers, Inc. (the “Adviser” or “Invesco”). Under the terms of the investment advisory agreement, the Fund pays an advisory fee to the Adviser based on the annual rate of the Fund’s average daily net assets as follows:
| Average Daily Net Assets | Rate | |||
First $150 million | 0.50% | |||
Next $100 million | 0.45% | |||
Next $100 million | 0.40% | |||
Over $350 million | 0.35% | |||
Under the terms of a master sub-advisory agreement between the Adviser and each of Invesco Asset Management Deutschland GmbH, Invesco Asset Management Limited, Invesco Asset Management (Japan) Limited, Invesco Australia Limited, Invesco Hong Kong Limited, Invesco Senior Secured Management, Inc. and Invesco Canada Ltd. (collectively, the “Affiliated Sub-Advisers”) the Adviser, not the Fund, may pay 40% of the fees paid to the Adviser to any such Affiliated Sub-Adviser(s) that provide(s) discretionary investment management services to the Fund based on the percentage of assets allocated to such Sub-Adviser(s).
The Adviser has contractually agreed, through at least June 30, 2014, to waive advisory fees and/or reimburse expenses to the extent necessary to limit total annual fund operating expenses after fee waiver and/or expense reimbursement (excluding certain items discussed below) of Class A, Class B, Class C, Class R, Class Y, Class R5 and Class R6 shares to 2.00%, 2.75%, 2.75%, 2.25%, 1.75%, 1.75% and 1.75% of average daily net assets, respectively. In determining the Adviser’s obligation to waive advisory fees and/or reimburse expenses, the following expenses are not taken into account, and could cause total annual fund operating expenses after fee waiver and/or expense reimbursement to exceed the numbers reflected above: (1) interest; (2) taxes; (3) dividend expense on short sales; (4) extraordinary or non-routine items, including litigation expenses; and (5) expenses that the Fund has incurred but did not actually pay because of an expense offset arrangement. Unless the Board of Trustees and Invesco mutually agree to amend or continue the fee waiver agreement, it will terminate on June 30, 2014. The Adviser did not waive fees and/or reimburse expenses under this expense limitation.
Further, the Adviser has contractually agreed, through at least June 30, 2014, to waive the advisory fee payable by the Fund in an amount equal to 100% of the net advisory fees the Adviser receives from the affiliated money market funds on investments by the Fund of uninvested cash in such affiliated money market funds.
For the year ended August 31, 2013, the Adviser waived advisory fees of $656,070.
The Trust has entered into a master administrative services agreement with Invesco pursuant to which the Fund has agreed to pay Invesco for certain administrative costs incurred in providing accounting services to the Fund. For the year ended August 31, 2013, expenses incurred under the agreement are shown in the Statement of Operations as Administrative services fees.
The Trust has entered into a transfer agency and service agreement with Invesco Investment Services, Inc. (“IIS”) pursuant to which the Fund has agreed to pay IIS a fee for providing transfer agency and shareholder services to the Fund and reimburse IIS for certain expenses incurred by IIS in the course of providing such services. IIS may make payments to intermediaries that provide omnibus account services, sub-accounting services and/or networking services. All fees payable by IIS to intermediaries that provide omnibus account services or sub-accounting are charged back to the Fund, subject to certain limitations approved by the Trust’s Board of Trustees. For the year ended August 31, 2013, expenses incurred under the agreement are shown in the Statement of Operations as Transfer agent fees.
Shares of the Fund are distributed by Invesco Distributors, Inc. (“IDI”). The Fund has adopted a distribution plan pursuant to Rule 12b-1 under the 1940 Act, and a service plan (collectively, the “Plans”) for Class A, Class B, Class C and Class R shares to compensate IDI for the sale, distribution, shareholder servicing and maintenance of shareholder accounts for these shares. Under the Plans, the Fund will incur annual fees of up to 0.25% of Class A average daily net assets, up to 1.00% each of Class B and Class C average daily net assets and up to 0.50% of Class R average daily net assets.
With respect to Class B and Class C shares, the Fund is authorized to reimburse in future years any distribution related expenses that exceed the maximum annual reimbursement rate for such class, so long as such reimbursement does not cause the Fund to exceed the Class B and Class C maximum annual reimbursement rate, respectively. With respect to Class A shares, distribution related expenses that exceed the maximum annual reimbursement rate for such class are not carried forward to future years and the Fund will not reimburse IDI for any such expenses.
For the year ended August 31, 2013, expenses incurred under these agreements are shown in the Statement of Operations as Distribution fees.
Front-end sales commissions and CDSC (collectively, the “sales charges”) are not recorded as expenses of the Fund. Front-end sales commissions are deducted from proceeds from the sales of Fund shares prior to investment in Class A shares of the Fund. CDSC are deducted from redemption proceeds prior to remittance to the shareholder. During the year ended August 31, 2013, IDI advised the Fund that IDI retained $434,308 in front-end sales commissions from the sale of Class A shares and $440, $76,537 and $4,805 from Class A, Class B and Class C shares, respectively, for CDSC imposed on redemptions by shareholders.
For the year ended August 31, 2013, the Fund incurred $43,120 in brokerage commissions with Invesco Capital Markets, Inc., an affiliate of the Adviser and IDI, for portfolio transactions executed on behalf of the Fund.
Certain officers and trustees of the Trust are officers and directors of the Adviser, IIS and/or IDI.
NOTE 3—Additional Valuation Information
GAAP defines fair value as the price that would be received to sell an asset or paid to transfer a liability in an orderly transaction between market participants at the measurement date, under current market conditions. GAAP establishes a hierarchy that prioritizes the inputs to valuation methods, giving the highest priority to readily available unadjusted quoted prices in an active market for identical assets (Level 1) and the lowest priority to significant unobservable inputs (Level 3), generally when market prices are not readily available or are unreliable. Based on the valuation inputs, the
16 Invesco Growth and Income Fund
securities or other investments are tiered into one of three levels. Changes in valuation methods may result in transfers in or out of an investment’s assigned level:
| Level 1 — | Prices are determined using quoted prices in an active market for identical assets. |
| Level 2 — | Prices are determined using other significant observable inputs. Observable inputs are inputs that other market participants may use in pricing a security. These may include quoted prices for similar securities, interest rates, prepayment speeds, credit risk, yield curves, loss severities, default rates, discount rates, volatilities and others. |
| Level 3 — | Prices are determined using significant unobservable inputs. In situations where quoted prices or observable inputs are unavailable (for example, when there is little or no market activity for an investment at the end of the period), unobservable inputs may be used. Unobservable inputs reflect the Fund’s own assumptions about the factors market participants would use in determining fair value of the securities or instruments and would be based on the best available information. |
The following is a summary of the tiered valuation input levels, as of August 31, 2013. The level assigned to the securities valuations may not be an indication of the risk or liquidity associated with investing in those securities. Because of the inherent uncertainties of valuation, the values reflected in the financial statements may materially differ from the value received upon actual sale of those investments.
| Level 1 | Level 2 | Level 3 | Total | |||||||||||||
Equity Securities | $ | 8,211,249,515 | $ | — | $ | — | $ | 8,211,249,515 | ||||||||
Foreign Currency Contracts* | — | 1,634,238 | — | 1,634,238 | ||||||||||||
Total Investments | $ | 8,211,249,515 | $ | 1,634,238 | $ | — | $ | 8,212,883,753 | ||||||||
| * | Unrealized appreciation. |
NOTE 4—Derivative Investments
Value of Derivative Investments at Period-End
The table below summarizes the value of the Fund’s derivative investments, detailed by primary risk exposure, held as of August 31, 2013:
| Value | ||||||||
| Risk Exposure/Derivative Type | Assets | Liabilities | ||||||
Currency Risk | ||||||||
Foreign Currency Contracts(a) | $ | 2,074,605 | $ | (440,367 | ) | |||
| (a) | Values are disclosed on the Statement of Assets and Liabilities under the caption Foreign currency contracts outstanding. |
Effect of Derivative Investments for the year ended August 31, 2013
The table below summarizes the gains (losses) on derivative investments, detailed by primary risk exposure, recognized in earnings during the period:
| Location of Gain (Loss) on Statement of Operations | ||||||||
| Foreign Currency Contracts* | Options* | |||||||
Realized Gain (Loss) | ||||||||
Currency risk | $ | (2,410,724 | ) | $ | — | |||
Equity risk | — | 1,183,509 | ||||||
Change in Unrealized Appreciation | ||||||||
Currency risk | 5,255,384 | — | ||||||
Total | $ | 2,844,660 | $ | 1,183,509 | ||||
| * | The average notional value of foreign currency contracts and option contracts outstanding during the period was $300,125,315 and $13,889,917, respectively. |
| Open Foreign Currency Contracts at Period End | ||||||||||||||||||||||||||
Settlement
| Counterparty | Contract to | Notional Value | Unrealized Appreciation (Depreciation) | ||||||||||||||||||||||
| Deliver | Receive | |||||||||||||||||||||||||
09/27/13 | Bank of New York Mellon (The) | CAD | 57,351,805 | USD | 54,558,933 | $ | 54,409,863 | $ | 149,070 | |||||||||||||||||
09/27/13 | State Street Bank & Trust Co. | CAD | 51,888,940 | USD | 49,345,195 | 49,227,224 | 117,971 | |||||||||||||||||||
09/27/13 | Bank of New York Mellon (The) | CHF | 34,075,828 | USD | 37,134,605 | 36,630,875 | 503,730 | |||||||||||||||||||
09/27/13 | State Street Bank & Trust Co. | CHF | 40,633,541 | USD | 44,253,234 | 43,680,294 | 572,940 | |||||||||||||||||||
09/27/13 | Bank of New York Mellon (The) | EUR | 25,284,122 | USD | 33,848,233 | 33,419,672 | 428,561 | |||||||||||||||||||
09/27/13 | State Street Bank & Trust Co. | GBP | 62,519,726 | USD | 97,165,345 | 96,863,012 | 302,333 | |||||||||||||||||||
09/27/13 | State Street Bank & Trust Co. | ILS | 192,150,799 | USD | 52,579,230 | 53,019,597 | (440,367 | ) | ||||||||||||||||||
Total open foreign currency contracts | $ | 1,634,238 | ||||||||||||||||||||||||
Currency Abbreviations:
| CAD | – Canadian Dollar | |
| EUR | – Euro | |
| ILS | – Israeli Shekel |
| CHF | – Swiss Franc | |
| GBP | – British Pound Sterling | |
| USD | – U.S. Dollar |
17 Invesco Growth and Income Fund
| Transactions During the Period | ||||||||
| Call Option Contracts | ||||||||
| Number of Contracts | Premiums Received | |||||||
Beginning of period | — | $ | — | |||||
Written | 17,545 | 1,239,739 | ||||||
Closed | (2,915 | ) | (355,097 | ) | ||||
Expired | (14,630 | ) | (884,642 | ) | ||||
End of period | — | $ | — | |||||
NOTE 5—Security Transactions with Affiliated Funds
The Fund is permitted to purchase or sell securities from or to certain other Invesco Funds under specified conditions outlined in procedures adopted by the Board of Trustees of the Trust. The procedures have been designed to ensure that any purchase or sale of securities by the Fund from or to another fund or portfolio that is or could be considered an affiliate by virtue of having a common investment adviser (or affiliated investment advisers), common Trustees and/or common officers complies with Rule 17a-7 of the 1940 Act. Further, as defined under the procedures, each transaction is effected at the current market price. Pursuant to these procedures, for the year ended August 31, 2013, the Fund engaged in securities purchases of $9,267,000 and securities sales of $1,830,371, which resulted in net realized gains of $555,165.
NOTE 6—Expense Offset Arrangement(s)
The expense offset arrangement is comprised of transfer agency credits which result from balances in Demand Deposit Accounts (DDA) used by the transfer agent for clearing shareholder transactions. For the year ended August 31, 2013, the Fund received credits from this arrangement, which resulted in the reduction of the Fund’s total expenses of $5,469.
NOTE 7—Trustees’ and Officers’ Fees and Benefits
“Trustees’ and Officers’ Fees and Benefits” include amounts accrued by the Fund to pay remuneration to certain Trustees and Officers of the Fund. Trustees have the option to defer compensation payable by the Fund, and “Trustees’ and Officers’ Fees and Benefits” also include amounts accrued by the Fund to fund such deferred compensation amounts. Those Trustees who defer compensation have the option to select various Invesco Funds in which their deferral accounts shall be deemed to be invested. Finally, certain current Trustees are eligible to participate in a retirement plan that provides for benefits to be paid upon retirement to Trustees over a period of time based on the number of years of service. The Fund may have certain former Trustees who also participate in a retirement plan and receive benefits under such plan. “Trustees’ and Officers’ Fees and Benefits” include amounts accrued by the Fund to fund such retirement benefits. Obligations under the deferred compensation and retirement plans represent unsecured claims against the general assets of the Fund.
NOTE 8—Cash Balances
The Fund is permitted to temporarily carry a negative or overdrawn balance in its account with State Street Bank and Trust Company, the custodian bank. Such balances, if any at period end, are shown in the Statement of Assets and Liabilities under the payable caption Amount due custodian. To compensate the custodian bank for such overdrafts, the overdrawn Fund may either (1) leave funds as a compensating balance in the account so the custodian bank can be compensated by earning the additional interest; or (2) compensate by paying the custodian bank at a rate agreed upon by the custodian bank and Invesco, not to exceed the contractually agreed upon rate.
NOTE 9—Distributions to Shareholders and Tax Components of Net Assets
Tax Character of Distributions to Shareholders Paid During the Years Ended August 31, 2013 and 2012:
| 2013 | 2012 | |||||||
Ordinary income | $ | 116,212,173 | $ | 99,299,390 | ||||
Tax Components of Net Assets at Period-End:
| 2013 | ||||
Undistributed ordinary income | $ | 32,702,969 | ||
Undistributed long-term gain | 78,191,768 | |||
Net unrealized appreciation — investments | 1,934,942,936 | |||
Net unrealized appreciation — other investments | 1,139 | |||
Temporary book/tax differences | (512,286 | ) | ||
Capital loss carryforward | (3,545,948 | ) | ||
Shares of beneficial interest | 6,167,962,323 | |||
Total net assets | $ | 8,209,742,901 | ||
18 Invesco Growth and Income Fund
The difference between book-basis and tax-basis unrealized appreciation (depreciation) is due to differences in the timing of recognition of gains and losses on investments for tax and book purposes. The Fund’s net unrealized appreciation difference is attributable primarily to wash sales.
The temporary book/tax differences are a result of timing differences between book and tax recognition of income and/or expenses. The Fund’s temporary book/tax differences are the result of the trustee deferral of compensation and retirement plan benefits.
Capital loss carryforward is calculated and reported as of a specific date. Results of transactions and other activity after that date may affect the amount of capital loss carryforward actually available for the Fund to utilize. The Regulated Investment Company Modernization Act of 2010 eliminated the eight-year carryover period for capital losses that arise in taxable years beginning after its enactment date of December 22, 2010. Consequently, these capital losses can be carried forward for an unlimited period. However, capital losses with an expiration period may not be used to offset capital gains until all net capital losses without an expiration date have been utilized. Additionally, post-enactment capital loss carryovers will retain their character as either short-term or long-term capital losses instead of as short-term capital losses as under prior law. The ability to utilize capital loss carryforward in the future may be limited under the Internal Revenue Code and related regulations based on the results of future transactions.
The Fund utilized $198,421,128 of capital loss carryforward in the current period to offset net realized capital gain for federal income tax purposes. The Fund has a capital loss carryforward as of August 31, 2013, which expires as follows:
| Capital Loss Carryforward* | ||||||||||||
| Expiration | Short-Term | Long-Term | Total | |||||||||
August 31, 2016 | $ | 3,545,948 | $ | — | $ | 3,545,948 | ||||||
| * | Capital loss carryforward as of the date listed above is reduced for limitations, if any, to the extent required by the Internal Revenue Code. To the extent that unrealized gains as of May 23, 2011, the date of reorganization of Invesco Fundamental Value Fund and Invesco Large Cap Relative Value Fund into the Fund, are realized on securities held in each fund at such date of reorganization, the capital loss carryforward may be further limited for up to five years from the date of the reorganization. |
On November 30, 2012, 6,703,303 Class R5 shares, valued at $139,629,805, were redeemed by a significant shareholder and settled through a redemption-in-kind transaction, which resulted in a realized gain of $32,433,272 to the Fund for book purposes. From a Federal income tax perspective, the realized gains were not recognized.
NOTE 10—Investment Securities
The aggregate amount of investment securities (other than short-term securities, U.S. Treasury obligations and money market funds, if any) purchased and sold by the Fund during the year ended August 31, 2013 was $2,215,967,458 and $2,085,623,055, respectively. Cost of investments on a tax basis includes the adjustments for financial reporting purposes as of the most recently completed federal income tax reporting period-end.
| Unrealized Appreciation (Depreciation) of Investment Securities on a Tax Basis | ||||
Aggregate unrealized appreciation of investment securities | $ | 1,977,300,793 | ||
Aggregate unrealized (depreciation) of investment securities | (42,357,857 | ) | ||
Net unrealized appreciation of investment securities | $ | 1,934,942,936 | ||
Cost of investments for tax purposes is $6,276,306,579.
NOTE 11—Reclassification of Permanent Differences
Primarily as a result of differing book/tax treatment of a redemption-in-kind transaction, on August 31, 2013, undistributed net investment income was increased by $134,049, undistributed net realized gain was decreased by $32,496,968 and shares of beneficial interest was increased by $32,362,919. This reclassification had no effect on the net assets of the Fund.
19 Invesco Growth and Income Fund
NOTE 12—Share Information
| Summary of Share Activity | ||||||||||||||||
| Years ended August 31, | ||||||||||||||||
| 2013(a) | 2012 | |||||||||||||||
| Shares | Amount | Shares | Amount | |||||||||||||
Sold: | ||||||||||||||||
Class A | 21,889,645 | $ | 507,265,364 | 39,465,171 | $ | 726,104,891 | ||||||||||
Class B | 80,985 | 1,873,907 | 85,550 | 1,608,658 | ||||||||||||
Class C | 893,335 | 20,882,198 | 780,206 | 14,906,715 | ||||||||||||
Class R | 1,604,065 | 37,088,413 | 2,320,089 | 43,705,629 | ||||||||||||
Class Y | 16,183,091 | 373,292,940 | 23,801,882 | 455,243,761 | ||||||||||||
Class R5 | 11,429,384 | 261,754,743 | 21,780,068 | 422,884,733 | ||||||||||||
Class R6(b) | 14,418,821 | 332,177,637 | — | — | ||||||||||||
Issued as reinvestment of dividends: | ||||||||||||||||
Class A | 2,888,899 | 63,304,665 | 2,974,507 | 56,098,194 | ||||||||||||
Class B | 78,113 | 1,692,792 | 107,992 | 2,014,736 | ||||||||||||
Class C | 87,511 | 1,872,237 | 85,105 | 1,588,011 | ||||||||||||
Class R | 91,211 | 1,994,223 | 95,400 | 1,800,651 | ||||||||||||
Class Y | 1,250,788 | 27,518,735 | 1,308,768 | 24,683,678 | ||||||||||||
Class R5 | 539,320 | 11,863,653 | 432,771 | 8,285,259 | ||||||||||||
Class R6 | 97,673 | 2,246,832 | — | — | ||||||||||||
Automatic conversion of Class B shares to Class A shares: | ||||||||||||||||
Class A | 1,358,676 | 30,970,994 | 2,221,123 | 41,945,772 | ||||||||||||
Class B | (1,368,129 | ) | (30,970,994 | ) | (2,219,631 | ) | (41,945,772 | ) | ||||||||
Reacquired: | ||||||||||||||||
Class A | (43,134,152 | ) | (976,137,549 | ) | (66,777,435 | ) | (1,268,497,021 | ) | ||||||||
Class B | (822,250 | ) | (18,457,407 | ) | (1,513,340 | ) | (28,824,811 | ) | ||||||||
Class C | (1,805,148 | ) | (40,311,395 | ) | (2,806,866 | ) | (53,090,307 | ) | ||||||||
Class R | (2,054,646 | ) | (46,926,619 | ) | (3,393,141 | ) | (65,389,827 | ) | ||||||||
Class Y | (17,592,305 | ) | (401,917,676 | ) | (37,428,967 | ) | (723,836,376 | ) | ||||||||
Class R5 | (17,151,492 | ) | (375,020,738 | ) | (5,265,183 | ) | (101,302,810 | ) | ||||||||
Class R6 | (1,080,798 | ) | (26,243,960 | ) | — | — | ||||||||||
Net increase (decrease) in share activity | (12,117,403 | ) | $ | (240,187,005 | ) | (23,945,931 | ) | $ | (482,016,236 | ) | ||||||
| (a) | There are entities that are record owners of more than 5% of the outstanding shares of the Fund and in the aggregate own 32% of the outstanding shares of the Fund. IDI has an agreement with these entities to sell Fund shares. The Fund, Invesco and/or Invesco affiliates may make payments to these entities, which are considered to be related to the Fund, for providing services to the Fund, Invesco and/or Invesco affiliates including but not limited to services such as, securities brokerage, distribution, third party record keeping and account servicing. The Fund has no knowledge as to whether all or any portion of the shares owned of record by these entities are also owned beneficially. |
| (b) | Commencement date of September 24, 2012. |
20 Invesco Growth and Income Fund
NOTE 13—Financial Highlights
The following schedule presents financial highlights for a share of the Fund outstanding throughout the periods indicated.
| Net asset value, beginning of period | Net investment income(a) | Net gains (losses) on securities (both realized and unrealized) | Total from investment operations | Dividends from net investment income | Distributions from net realized gains | Total distributions | Net asset value, end of period | Total return | Net assets, end of period (000’s omitted) | Ratio of expenses to average net assets with fee waivers and/or expenses absorbed | Ratio of expenses to average net assets without fee waivers and/or expenses absorbed | Ratio of net investment income to average net assets | Portfolio turnover(b) | |||||||||||||||||||||||||||||||||||||||||||
Class A |
| |||||||||||||||||||||||||||||||||||||||||||||||||||||||
Year ended 08/31/13 | $ | 20.48 | $ | 0.31 | $ | 4.47 | $ | 4.78 | $ | (0.34 | ) | $ | — | $ | (0.34 | ) | $ | 24.92 | 23.57 | %(c) | $ | 4,766,860 | 0.81 | %(d) | 0.82 | %(d) | 1.37 | %(d) | 29 | % | ||||||||||||||||||||||||||
Year ended 08/31/12 | 18.01 | 0.32 | 2.42 | 2.74 | (0.27 | ) | — | (0.27 | ) | 20.48 | 15.33 | (c) | 4,266,135 | 0.83 | 0.84 | 1.66 | 25 | |||||||||||||||||||||||||||||||||||||||
Year ended 08/31/11 | 16.06 | 0.24 | 1.91 | 2.15 | (0.20 | ) | — | (0.20 | ) | 18.01 | 13.37 | (c) | 4,149,537 | 0.83 | 0.84 | 1.23 | 23 | |||||||||||||||||||||||||||||||||||||||
Nine months ended 08/31/10 | 17.19 | 0.18 | (1.13 | ) | (0.95 | ) | (0.18 | ) | — | (0.18 | ) | 16.06 | (5.60 | )(c) | 4,122,779 | 0.74 | (e) | 0.74 | (e) | 1.36 | (e) | 23 | ||||||||||||||||||||||||||||||||||
Year ended 11/30/09 | 13.87 | 0.23 | 3.34 | 3.57 | (0.25 | ) | — | (0.25 | ) | 17.19 | 26.24 | (f) | 4,496,159 | 0.88 | 0.88 | 1.58 | 51 | |||||||||||||||||||||||||||||||||||||||
Year ended 11/30/08 | 22.72 | 0.33 | (7.86 | ) | (7.53 | ) | (0.37 | ) | (0.95 | ) | (1.32 | ) | 13.87 | (35.05 | )(f) | 4,416,052 | 0.79 | 0.79 | 1.78 | 42 | ||||||||||||||||||||||||||||||||||||
Class B |
| |||||||||||||||||||||||||||||||||||||||||||||||||||||||
Year ended 08/31/13 | 20.34 | 0.31 | 4.44 | 4.75 | (0.34 | ) | — | (0.34 | ) | 24.75 | 23.57 | (c)(g) | 101,723 | 0.81 | (d)(g) | 0.82 | (d)(g) | 1.37 | (d)(g) | 29 | ||||||||||||||||||||||||||||||||||||
Year ended 08/31/12 | 17.88 | 0.31 | 2.41 | 2.72 | (0.26 | ) | — | (0.26 | ) | 20.34 | 15.37 | (c)(g) | 124,930 | 0.81 | (g) | 0.82 | (g) | 1.68 | (g) | 25 | ||||||||||||||||||||||||||||||||||||
Year ended 08/31/11 | 15.93 | 0.23 | 1.90 | 2.13 | (0.18 | ) | — | (0.18 | ) | 17.88 | 13.36 | (c)(g) | 173,129 | 0.83 | (g) | 0.84 | (g) | 1.23 | (g) | 23 | ||||||||||||||||||||||||||||||||||||
Nine months ended 08/31/10 | 17.05 | 0.16 | (1.12 | ) | (0.96 | ) | (0.16 | ) | — | (0.16 | ) | 15.93 | (5.69 | )(c)(g) | 231,193 | 0.89 | (e)(g) | 0.89 | (e)(g) | 1.21 | (e)(g) | 23 | ||||||||||||||||||||||||||||||||||
Year ended 11/30/09 | 13.76 | 0.22 | 3.32 | 3.54 | (0.25 | ) | — | (0.25 | ) | 17.05 | 26.32 | (h)(i) | 320,577 | 0.89 | (i) | 0.89 | (i) | 1.59 | (i) | 51 | ||||||||||||||||||||||||||||||||||||
Year ended 11/30/08 | 22.57 | 0.32 | (7.81 | ) | (7.49 | ) | (0.37 | ) | (0.95 | ) | (1.32 | ) | 13.76 | (35.09 | )(h)(i) | 365,277 | 0.84 | (i) | 0.84 | (i) | 1.72 | (i) | 42 | |||||||||||||||||||||||||||||||||
Class C |
| |||||||||||||||||||||||||||||||||||||||||||||||||||||||
Year ended 08/31/13 | 20.29 | 0.14 | 4.42 | 4.56 | (0.17 | ) | — | (0.17 | ) | 24.68 | 22.63 | (c) | 289,458 | 1.56 | (d) | 1.57 | (d) | 0.62 | (d) | 29 | ||||||||||||||||||||||||||||||||||||
Year ended 08/31/12 | 17.84 | 0.18 | 2.40 | 2.58 | (0.13 | ) | — | (0.13 | ) | 20.29 | 14.53 | (c)(j) | 254,679 | 1.55 | (j) | 1.56 | (j) | 0.94 | (j) | 25 | ||||||||||||||||||||||||||||||||||||
Year ended 08/31/11 | 15.91 | 0.09 | 1.90 | 1.99 | (0.06 | ) | — | (0.06 | ) | 17.84 | 12.52 | (c)(j) | 258,606 | 1.57 | (j) | 1.58 | (j) | 0.49 | (j) | 23 | ||||||||||||||||||||||||||||||||||||
Nine months ended 08/31/10 | 17.03 | 0.08 | (1.12 | ) | (1.04 | ) | (0.08 | ) | — | (0.08 | ) | 15.91 | (6.13 | )(c) | 269,051 | 1.49 | (e) | 1.49 | (e) | 0.61 | (e) | 23 | ||||||||||||||||||||||||||||||||||
Year ended 11/30/09 | 13.74 | 0.12 | 3.32 | 3.44 | (0.15 | ) | — | (0.15 | ) | 17.03 | 25.36 | (i)(k) | 316,283 | 1.62 | (i) | 1.62 | (i) | 0.84 | (i) | 51 | ||||||||||||||||||||||||||||||||||||
Year ended 11/30/08 | 22.53 | 0.20 | (7.81 | ) | (7.61 | ) | (0.23 | ) | (0.95 | ) | (1.18 | ) | 13.74 | (35.54 | )(i)(k) | 301,306 | 1.51 | (i) | 1.51 | (i) | 1.06 | (i) | 42 | |||||||||||||||||||||||||||||||||
Class R |
| |||||||||||||||||||||||||||||||||||||||||||||||||||||||
Year ended 08/31/13 | 20.49 | 0.25 | 4.47 | 4.72 | (0.28 | ) | — | (0.28 | ) | 24.93 | 23.26 | (c) | 170,691 | 1.06 | (d) | 1.07 | (d) | 1.12 | (d) | 29 | ||||||||||||||||||||||||||||||||||||
Year ended 08/31/12 | 18.02 | 0.27 | 2.42 | 2.69 | (0.22 | ) | — | (0.22 | ) | 20.49 | 15.03 | (c) | 147,659 | 1.08 | 1.09 | 1.41 | 25 | |||||||||||||||||||||||||||||||||||||||
Year ended 08/31/11 | 16.07 | 0.19 | 1.92 | 2.11 | (0.16 | ) | — | (0.16 | ) | 18.02 | 13.08 | (c) | 147,453 | 1.08 | 1.09 | 0.98 | 23 | |||||||||||||||||||||||||||||||||||||||
Nine months ended 08/31/10 | 17.19 | 0.14 | (1.11 | ) | (0.97 | ) | (0.15 | ) | — | (0.15 | ) | 16.07 | (5.72 | )(c) | 122,188 | 0.99 | (e) | 0.99 | (e) | 1.11 | (e) | 23 | ||||||||||||||||||||||||||||||||||
Year ended 11/30/09 | 13.87 | 0.18 | 3.35 | 3.53 | (0.21 | ) | — | (0.21 | ) | 17.19 | 26.00 | (l) | 107,371 | 1.13 | 1.13 | 1.29 | 51 | |||||||||||||||||||||||||||||||||||||||
Year ended 11/30/08 | 22.73 | 0.29 | (7.88 | ) | (7.59 | ) | (0.32 | ) | (0.95 | ) | (1.27 | ) | 13.87 | (35.25 | )(l) | 78,522 | 1.04 | 1.04 | 1.53 | 42 | ||||||||||||||||||||||||||||||||||||
Class Y |
| |||||||||||||||||||||||||||||||||||||||||||||||||||||||
Year ended 08/31/13 | 20.50 | 0.37 | 4.47 | 4.84 | (0.40 | ) | — | (0.40 | ) | 24.94 | 23.86 | (c) | 1,826,646 | 0.56 | (d) | 0.57 | (d) | 1.62 | (d) | 29 | ||||||||||||||||||||||||||||||||||||
Year ended 08/31/12 | 18.03 | 0.36 | 2.42 | 2.78 | (0.31 | ) | — | (0.31 | ) | 20.50 | 15.60 | (c) | 1,504,586 | 0.58 | 0.59 | 1.91 | 25 | |||||||||||||||||||||||||||||||||||||||
Year ended 08/31/11 | 16.08 | 0.28 | 1.92 | 2.20 | (0.25 | ) | — | (0.25 | ) | 18.03 | 13.64 | (c) | 1,544,968 | 0.58 | 0.59 | 1.48 | 23 | |||||||||||||||||||||||||||||||||||||||
Nine months ended 08/31/10 | 17.21 | 0.21 | (1.13 | ) | (0.92 | ) | (0.21 | ) | — | (0.21 | ) | 16.08 | (5.41 | )(c) | 1,206,652 | 0.49 | (e) | 0.49 | (e) | 1.61 | (e) | 23 | ||||||||||||||||||||||||||||||||||
Year ended 11/30/09 | 13.88 | 0.26 | 3.35 | 3.61 | (0.28 | ) | — | (0.28 | ) | 17.21 | 26.60 | (m) | 1,095,692 | 0.63 | 0.63 | 1.81 | 51 | |||||||||||||||||||||||||||||||||||||||
Year ended 11/30/08 | 22.74 | 0.38 | (7.87 | ) | (7.49 | ) | (0.42 | ) | (0.95 | ) | (1.37 | ) | 13.88 | (34.90 | )(m) | 844,058 | 0.54 | 0.54 | 2.04 | 42 | ||||||||||||||||||||||||||||||||||||
Class R5 |
| |||||||||||||||||||||||||||||||||||||||||||||||||||||||
Year ended 08/31/13 | 20.53 | 0.39 | 4.47 | 4.86 | (0.42 | ) | — | (0.42 | ) | 24.97 | 23.96 | (c) | 718,816 | 0.47 | (d) | 0.48 | (d) | 1.71 | (d) | 29 | ||||||||||||||||||||||||||||||||||||
Year ended 08/31/12 | 18.05 | 0.39 | 2.43 | 2.82 | (0.34 | ) | — | (0.34 | ) | 20.53 | 15.80 | (c) | 697,346 | 0.46 | 0.47 | 2.03 | 25 | |||||||||||||||||||||||||||||||||||||||
Year ended 08/31/11 | 16.08 | 0.32 | 1.92 | 2.24 | (0.27 | ) | — | (0.27 | ) | 18.05 | 13.87 | (c) | 307,338 | 0.39 | 0.40 | 1.67 | 23 | |||||||||||||||||||||||||||||||||||||||
Nine months ended 08/31/10(n) | 16.48 | 0.05 | (0.39 | ) | (0.34 | ) | (0.06 | ) | — | (0.06 | ) | 16.08 | (2.05 | )(c) | 41,861 | 0.45 | (e) | 0.45 | (e) | 1.31 | (e) | 23 | ||||||||||||||||||||||||||||||||||
Class R6 |
| |||||||||||||||||||||||||||||||||||||||||||||||||||||||
Year ended 08/31/13(n) | 21.23 | 0.43 | 3.66 | 4.09 | (0.35 | ) | — | (0.35 | ) | 24.97 | 19.45 | (c) | 335,549 | 0.38 | (d)(e) | 0.39 | (d)(e) | 1.80 | (d)(e) | 29 | ||||||||||||||||||||||||||||||||||||
| (a) | Calculated using average shares outstanding. |
| (b) | Portfolio turnover is calculated at the fund level and is not annualized for periods less than one year, if applicable. For the year ended August 31, 2011, the portfolio calculation excludes the value of securities purchased of $138,016,999 and sold of $13,000,923 in the effort to realign the Fund’s portfolio holdings after the reorganization of Invesco Fundamental Value Fund & Invesco Large Cap Relative Value Fund into the Fund. |
| (c) | Includes adjustments in accordance with accounting principles generally accepted in the United States of America and as such, the net asset value for financial reporting purposes and the returns based upon those net asset values may differ from the net asset value and returns for shareholder transactions. Does not include sales charges and is not annualized for periods less than one year, if applicable. |
| (d) | Ratios are based on average daily net assets (000’s omitted) of $4,514,767, $115,062, $271,467, $160,031, $1,672,014, $660,133 and $188,180 for Class A, Class B, Class C, Class R, Class Y, Class R5 and Class R6 shares, respectively. |
| (e) | Annualized. |
| (f) | Assumes reinvestment of all distributions for the period and does not include payment of the maximum sales charge of 5.75% or contingent deferred sales charge (CDSC). On purchases of $1 million or more, a CDSC of 1% may be imposed on certain redemptions made within eighteen months of purchase. If the sales charges were included, total returns would be lower. These returns include combined Rule 12b-1 fees and service fees of up to 0.25% and do not reflect the deduction of taxes that a shareholder would pay on Fund distributions or the redemption of Fund shares. |
| (g) | The total return, ratio of expenses to average net assets and ratio of net investment income to average net assets reflect actual 12b-1 fees of 0.25%, 0.23%, 0.25% and 0.40% for the years ended August 31, 2013, 2012 and 2011 and the nine months ended August 31, 2010, respectively. |
| (h) | Assumes reinvestment of all distributions for the period and does not include payment of the maximum CDSC of 5%, charged on certain redemptions made within one year of purchase and declining to 0% after the fifth year. If the sales charge was included, total returns would be lower. These returns include combined Rule 12b-1 fees and service fees of up to 1% and do not reflect the deduction of taxes that a shareholder would pay on Fund distributions or the redemption of Fund shares. |
| (i) | The total return, ratio of expenses to average net assets and ratio of net investment income to average net assets reflect actual 12b-1 fees of less than 1%. |
| (j) | The total return, ratio of expenses to average net assets and ratio of net investment income to average net assets reflect actual 12b-1 fees of 0.97% and 0.99% for the years ended August 31, 2012 and 2011, respectively. |
| (k) | Assumes reinvestment of all distributions for the period and does not include payment of the maximum CDSC of 1%, charged on certain redemptions made within one year of purchase. If the sales charge was included, total returns would be lower. These returns include combined Rule 12b-1 fees and service fees of up to 1% and do not reflect the deduction of taxes that a shareholder would pay on Fund distributions or the redemption of Fund shares. |
| (l) | Assumes reinvestment of all distributions for the period. These returns include combined Rule 12b-1 fees and service fees of up to 0.50% and do not reflect the deduction of taxes that a shareholder would pay on Fund distributions or the redemption on Fund shares. |
| (m) | Assumes reinvestment of all distributions for the period. These returns do not reflect the deduction of taxes that a shareholder would pay on Fund distributions or the redemption on Fund shares. |
| (n) | Commencement date of June 1, 2010 and September 24, 2012 for Class R5 and Class R6 shares, respectively. |
21 Invesco Growth and Income Fund
Report of Independent Registered Public Accounting Firm
To the Board of Trustees of AIM Counselor Series Trust (Invesco Counselor Series Trust)
and Shareholders of Invesco Growth and Income Fund:
In our opinion, the accompanying statement of assets and liabilities, including the schedule of investments, and the related statements of operations and of changes in net assets and the financial highlights present fairly, in all material respects, the financial position of Invesco Growth and Income Fund (one of the funds constituting AIM Counselor Series Trust (Invesco Counselor Series Trust), hereafter referred to as the “Fund”) at August 31, 2013, the results of its operations for the year then ended, the changes in its net assets for each of the two years in the period then ended and the financial highlights for each of the three years in the period then ended and the nine month period ended August 31, 2010, in conformity with accounting principles generally accepted in the United States of America. These financial statements and financial highlights (hereafter referred to as “financial statements”) are the responsibility of the Fund’s management; our responsibility is to express an opinion on these financial statements based on our audits. We conducted our audits of these financial statements in accordance with the standards of the Public Company Accounting Oversight Board (United States). Those standards require that we plan and perform the audit to obtain reasonable assurance about whether the financial statements are free of material misstatement. An audit includes examining, on a test basis, evidence supporting the amounts and disclosures in the financial statements, assessing the accounting principles used and significant estimates made by management, and evaluating the overall financial statement presentation. We believe that our audits, which included confirmation of securities at August 31, 2013 by correspondence with the custodian and brokers, provide a reasonable basis for our opinion. The financial highlights of the Fund for the periods ended November 30, 2009 and prior were audited by another independent registered public accounting firm whose report dated January 22, 2010 expressed an unqualified opinion on those financial statements.
PRICEWATERHOUSECOOPERS LLP
October 25, 2013
Houston, Texas
22 Invesco Growth and Income Fund
Calculating your ongoing Fund expenses
Example
As a shareholder of the Fund, you incur two types of costs: (1) transaction costs, which may include sales charges (loads) on purchase payments or contingent deferred sales charges on redemptions, if any; and (2) ongoing costs, including management fees, distribution and/or service (12b-1) fees, and other Fund expenses. This example is intended to help you understand your ongoing costs (in dollars) of investing in the Fund and to compare these costs with ongoing costs of investing in other mutual funds. The example is based on an investment of $1,000 invested at the beginning of the period and held for the entire period March 1, 2013 through August 31, 2013.
Actual expenses
The table below provides information about actual account values and actual expenses. You may use the information in this table, together with the amount you invested, to estimate the expenses that you paid over the period. Simply divide your account value by $1,000 (for example, an $8,600 account value divided by $1,000 = 8.6), then multiply the result by the number in the table under the heading entitled “Actual Expenses Paid During Period” to estimate the expenses you paid on your account during this period.
Hypothetical example for comparison purposes
The table below also provides information about hypothetical account values and hypothetical expenses based on the Fund’s actual expense ratio and an assumed rate of return of 5% per year before expenses, which is not the Fund’s actual return.
The hypothetical account values and expenses may not be used to estimate the actual ending account balance or expenses you paid for the period. You may use this information to compare the ongoing costs of investing in the Fund and other funds. To do so, compare this 5% hypothetical example with the 5% hypothetical examples that appear in the shareholder reports of the other funds.
Please note that the expenses shown in the table are meant to highlight your ongoing costs only and do not reflect any transaction costs, such as sales charges (loads) on purchase payments or contingent deferred sales charges on redemptions, if any. Therefore, the hypothetical information is useful in comparing ongoing costs only, and will not help you determine the relative total costs of owning different funds. In addition, if these transaction costs were included, your costs would have been higher.
| Class | Beginning Account Value (03/01/13) | ACTUAL | HYPOTHETICAL (5% annual return before expenses) | Annualized Expense Ratio | ||||||||||||||||||||
| Ending Account Value (08/31/13)1 | Expenses Paid During Period2 | Ending Account Value (08/31/13) | Expenses Paid During Period2 | |||||||||||||||||||||
| A | $ | 1,000.00 | $ | 1,104.60 | $ | 4.19 | $ | 1,021.22 | $ | 4.02 | 0.79 | % | ||||||||||||
| B | 1,000.00 | 1,104.90 | 4.19 | 1,021.22 | 4.02 | 0.79 | ||||||||||||||||||
| C | 1,000.00 | 1,100.60 | 8.15 | 1,017.44 | 7.83 | 1.54 | ||||||||||||||||||
| R | 1,000.00 | 1,103.70 | 5.51 | 1,019.96 | 5.30 | 1.04 | ||||||||||||||||||
| Y | 1,000.00 | 1,105.90 | 2.87 | 1,022.48 | 2.75 | 0.54 | ||||||||||||||||||
| R5 | 1,000.00 | 1,106.70 | 2.44 | 1,022.89 | 2.35 | 0.46 | ||||||||||||||||||
| R6 | 1,000.00 | 1,106.70 | 1.96 | 1,023.34 | 1.89 | 0.37 | ||||||||||||||||||
| 1 | The actual ending account value is based on the actual total return of the Fund for the period March 1, 2013 through August 31, 2013, after actual expenses and will differ from the hypothetical ending account value which is based on the Fund’s expense ratio and a hypothetical annual return of 5% before expenses. |
| 2 | Expenses are equal to the Fund’s annualized expense ratio as indicated above multiplied by the average account value over the period, multiplied by 184/365 to reflect the most recent fiscal half year. |
23 Invesco Growth and Income Fund
Approval of Investment Advisory and Sub-Advisory Contracts
The Board of Trustees (the Board) of AIM Counselor Series Trust (Invesco Counselor Series Trust) is required under the Investment Company Act of 1940, as amended, to approve annually the renewal of Invesco Growth and Income Fund’s (the Fund) investment advisory agreement with Invesco Advisers, Inc. (Invesco Advisers) and the Master Intergroup Sub-Advisory Contract for Mutual Funds (the sub-advisory contracts) with Invesco Asset Management Deutschland GmbH, Invesco Asset Management Limited, Invesco Asset Management (Japan) Limited, Invesco Australia Limited, Invesco Hong Kong Limited, Invesco Senior Secured Management, Inc. and Invesco Canada Ltd. (collectively, the Affiliated Sub-Advisers). During contract renewal meetings held on June 17-19, 2013, the Board as a whole, and the disinterested or “independent” Trustees, who comprise over 75% of the Board, voting separately, approved the continuance of the Fund’s investment advisory agreement and the sub-advisory contracts for another year, effective July 1, 2013. The Board determined that continuation of the Fund’s investment advisory agreement and the sub-advisory contracts are in the best interests of the Fund and its shareholders and the compensation payable to Invesco Advisers and the Affiliated Sub-Advisers under the agreements is fair and reasonable.
The Board’s Fund Evaluation Process
The Board’s Investments Committee has established three Sub-Committees, each of which is primarily responsible for overseeing the management of a number of the funds advised by Invesco Advisers (the Invesco Funds). The Sub-Committees meet throughout the year to review the performance of their assigned Invesco Funds, including reviewing materials prepared under the direction of the independent Senior Officer, an officer of the Invesco Funds who reports directly to the independent Trustees. Over the course of each year, the Sub-Committees meet with portfolio managers for their assigned Invesco Funds and other members of management to review the performance, investment objective(s), policies, strategies, limitations and investment risks of these funds. The Sub-Committees meet regularly and at designated contract renewal meetings each year to conduct a review of the performance, fees, expenses and other matters related to their assigned Invesco Funds. Each Sub-Committee recommends to the Investments Committee, which in turn recommends to the full Board, whether and on what terms to approve the continuance of each Invesco Fund’s investment advisory agreement and sub-advisory contracts for another year.
During the contract renewal process, the Trustees receive comparative performance and fee data regarding the Invesco Funds prepared by Invesco Advisers and Lipper Inc. (Lipper), an independent provider of investment company data. The Trustees also receive an independent
written evaluation from the Senior Officer. The Senior Officer’s evaluation is prepared as part of his responsibility to manage the process by which the Invesco Funds’ proposed management fees are negotiated during the annual contract renewal process to ensure they are negotiated in a manner that is at arms’ length and reasonable. The independent Trustees are assisted in their annual evaluation of the Fund’s investment advisory agreement by the Senior Officer and by independent legal counsel. In addition to meetings with Invesco Advisers and fund counsel, the independent Trustees also discuss the continuance of the investment advisory agreement and sub-advisory contracts in separate sessions with the Senior Officer and with independent legal counsel.
In evaluating the fairness and reasonableness of compensation under the Fund’s investment advisory agreement and sub-advisory contracts, the Board considered, among other things, the factors discussed below. The Trustees recognized that the advisory fee rates for the Invesco Funds are, in many cases, the result of years of review and negotiation between the Trustees and Invesco Advisers as well as advisory fees previously approved by different predecessor boards. The Trustees’ deliberations and conclusions in a particular year may be based in part on their deliberations and conclusions regarding these same arrangements throughout the year and in prior years. The Trustees’ review and conclusions are based on the comprehensive consideration of all information presented to them and are not the result of any single determinative factor. Moreover, one Trustee may have weighed a particular piece of information or factor differently than another Trustee.
The discussion below serves as the Senior Officer’s independent written evaluation with respect to the Fund’s investment advisory agreement as well as a discussion of the material factors and related conclusions that formed the basis for the Board’s approval of the Fund’s investment advisory agreement and sub-advisory contracts. Unless otherwise stated, this information is current as of June 19, 2013, and may not reflect consideration of factors that became known to the Board after that date, including, for example, changes to the Fund’s performance, advisory fees, expense limitations and/or fee waivers.
Factors and Conclusions and Summary of Independent Written Fee Evaluation
| A. | Nature, Extent and Quality of Services Provided by Invesco Advisers and the Affiliated Sub-Advisers |
The Board reviewed the advisory services provided to the Fund by Invesco Advisers under the Fund’s investment advisory agreement, the performance of Invesco Advisers in providing these services, and the credentials and experience of the officers and employees of Invesco Advisers who provide these services,
including the Fund’s portfolio manager or managers, with whom the Sub-Committees met during the year. The Board’s review of the qualifications of Invesco Advisers to provide advisory services included the Board’s consideration of Invesco Advisers’ investment process oversight, independent credit analysis and investment risk management.
In determining whether to continue the Fund’s investment advisory agreement, the Board considered the benefits of reapproving an existing relationship and the greater uncertainty that may be associated with entering into a new relationship. The Board also considered non-advisory services that Invesco Advisers and its affiliates provide to the Invesco Funds such as various back office support functions, equity and fixed income trading operations, internal audit, distribution and legal and compliance. The Board concluded that the nature, extent and quality of the services provided to the Fund by Invesco Advisers are appropriate and satisfactory and consistent with the terms of the Fund’s investment advisory agreement.
The Board reviewed the services that may be provided by the Affiliated Sub-Advisers under the sub-advisory contracts and the credentials and experience of the officers and employees of the Affiliated Sub-Advisers who provide these services. The Board noted that the Affiliated Sub-Advisers have offices and personnel that are located in financial centers around the world. As a result, the Affiliated Sub-Advisers can provide research and investment analysis on the markets and economies of various countries in which the Fund may invest, make recommendations regarding securities and assist with security trades. The Board concluded that the sub-advisory contracts benefit the Fund and its shareholders by permitting Invesco Advisers to use the resources and talents of the Affiliated Sub-Advisers in managing the Fund. The Board concluded that the nature, extent and quality of the services that may be provided by the Affiliated Sub-Advisers are appropriate and satisfactory and consistent with the terms of the Fund’s sub-advisory contracts.
| B. | Fund Performance |
The Board considered Fund performance as a relevant factor in considering whether to approve the investment advisory agreement. The Board did not view Fund performance as a relevant factor in considering whether to approve the sub-advisory contracts for the Fund, as no Affiliated Sub-Adviser currently manages assets of the Fund.
The Board compared the Fund’s performance during the past one, three and five calendar years to the performance of funds in the Lipper performance universe and against the Lipper Large-Cap Value Funds Index. The Board noted that performance of Class A shares of the Fund was in the fourth quintile of the performance universe for the one year period, the third quintile for the three year period and the second quintile
24 Invesco Growth and Income Fund
for the five year period (the first quintile being the best performing funds and the fifth quintile being the worst performing funds). The Board noted that performance of Class A shares of the Fund was below the performance of the Index for the one and three year periods and above the performance of the Index for the five year period. The Trustees also reviewed more recent Fund performance and this review did not change their conclusions.
| C. | Advisory and Sub-Advisory Fees |
The Board compared the Fund’s contractual management fee rate to the contractual management fee rates of funds in the Fund’s Lipper expense group at a common asset level. The Board noted that the contractual management fee rate for Class A shares of the Fund was below the median contractual management fee rate of funds in the expense group. The Board noted that the term “contractual management fee” may include both advisory and certain administrative services fees and that Invesco Advisers does not charge the Invesco Funds for the administrative services included in the term as defined by Lipper. The Board also reviewed the methodology used by Lipper in providing expense group information, which includes using each fund’s contractual management fee schedule (including any applicable breakpoints) as reported in the most recent prospectus or statement of additional information for each fund in the expense group.
The Board also compared the Fund’s effective advisory fee rate (the advisory fee rate after advisory fee waivers and before other expense limitations/waivers) to the effective advisory fee rates of other mutual funds advised by Invesco Advisers and its affiliates with investment strategies comparable to those of the Fund. The Board noted that the Fund’s effective advisory fee rate was below the rate of one mutual fund advised by Invesco Advisers and below the total account level fee of two mutual funds sub-advised by Invesco Advisers with investment strategies comparable to those of the Fund.
The Board also considered the fees charged by Invesco Advisers and the Affiliated Sub-Advisers to a client account with investment strategies comparable to those of the Fund. The Board noted that Invesco Advisers or the Affiliated Sub-Advisers may charge lower fees to large institutional clients. Invesco Advisers reviewed with the Board the significantly greater scope of services it provides to the Invesco Funds relative to certain other client accounts. These additional services include provision of administrative services, officers and office space, oversight of service providers, preparation of annual registration statement updates and financial information and regulatory compliance under the Investment Company Act of 1940, as amended. Invesco Advisers also reviewed generally the higher frequency of shareholder purchases and redemptions in the Invesco Funds relative to the flow of assets for other client accounts. Invesco Advisers advised the Board that advance notice of redemptions is often provided to Invesco Advisers by institutional clients. The Board did note that
sub-advisory fee rates charged by the Affiliated Sub-Advisers to manage the Invesco Funds and to manage other client accounts tended to be more comparable, reflecting a more comparable scope of services. The Board concluded that the aggregate services provided to the Invesco Funds were sufficiently different from those provided to institutional clients, and the Board did not place significant weight on these fee comparisons.
The Board also considered the services that may be provided by the Affiliated Sub-Advisers pursuant to the sub-advisory contracts, as well as the fees payable by Invesco Advisers to the Affiliated Sub-Advisers pursuant to the sub-advisory contracts. The Board also noted that the sub-advisory fees are not paid directly by the Fund, but rather, are payable by Invesco Advisers to the Affiliated Sub-Advisers.
Based upon the information and considerations described above, the Board concluded that the compensation payable to Invesco Advisers and the Affiliated Sub-Advisers is fair and reasonable.
| D. | Economies of Scale and Breakpoints |
The Board considered the extent to which there are economies of scale in the provision of advisory services to the Fund. The Board also considered whether the Fund benefits from economies of scale through contractual breakpoints in the Fund’s advisory fee schedule and was assisted in this review by a report from the Senior Officer. The Board also noted that the Fund shares directly in economies of scale through lower fees charged by third party service providers based on the combined size of the Invesco Funds and other clients advised by Invesco Advisers.
| E. | Profitability and Financial Resources |
The Board reviewed information from Invesco Advisers concerning the costs of the advisory and other services that Invesco Advisers and its affiliates provide to the Fund and the profitability of Invesco Advisers and its affiliates in providing these services for the year ended December 31, 2012. The Board received information from Invesco Advisers about the methodology used to prepare the profitability information. The Board considered the profitability of Invesco Advisers in managing the Fund and the Invesco Funds. The Board noted that Invesco Advisers continues to operate at a net profit from services Invesco Advisers and its subsidiaries provide to the Invesco Funds and the Fund. The Board did not deem the level of profits realized by Invesco Advisers and its affiliates from providing services to the Fund to be excessive given the nature, quality and extent of the services provided to the Invesco Funds. The Board received and accepted information from Invesco Advisers demonstrating that Invesco Advisers and each Affiliated Sub-Adviser are financially sound and have the resources necessary to perform their obligations under the investment advisory agreement and sub-advisory contracts.
| F. | Collateral Benefits to Invesco Advisers and its Affiliates |
The Board considered various other benefits received by Invesco Advisers and its affiliates from the relationship with the Fund, including the
fees received for their provision of transfer agency and distribution services to the Fund. The Board considered comparative information regarding fees charged for these services, including information provided by Lipper and other independent sources. The Board considered the performance of Invesco Advisers and its affiliates in providing these services and the organizational structure employed to provide these services. The Board also considered that these services are provided to the Fund pursuant to written contracts that are reviewed and approved on an annual basis by the Board; that the services are required for the operation of the Fund; that Invesco Advisers and its affiliates can provide services, the nature and quality of which are at least equal to those provided by others offering the same or similar services; and that the fees for such services are fair and reasonable in light of the usual and customary charges by others for services of the same nature and quality.
The Board considered the benefits realized by Invesco Advisers and the Affiliated Sub-Advisers as a result of portfolio brokerage transactions executed through “soft dollar” arrangements. The Board noted that soft dollar arrangements shift the payment obligation for research services from Invesco Advisers and the Affiliated Sub-Advisers to the Invesco Funds and that the research received may be used with other clients of Invesco Advisers and may reduce Invesco Advisers’ and the Affiliated Sub-Advisers’ expenses. The Board also considered periodic reports from the Chief Compliance Officer of the Invesco Funds demonstrating that these arrangements are consistent with regulatory requirements. The Board did not deem the soft dollar arrangements to be inappropriate.
The Board considered that the Fund’s uninvested cash and cash collateral from any securities lending arrangements may be invested in money market funds advised by Invesco Advisers pursuant to procedures approved by the Board. The Board noted that Invesco Advisers receives advisory fees from these affiliated money market funds attributable to such investments, although Invesco Advisers has contractually agreed to waive through varying periods the advisory fees payable by the Invesco Funds. The waiver is in an amount equal to 100% of the net advisory fee Invesco Advisers receives from the affiliated money market funds with respect to the Fund’s investment in the affiliated money market funds of uninvested cash, but not cash collateral. The Board concluded that the Fund’s investment of uninvested cash and cash collateral from any securities lending arrangements in the affiliated money market funds is in the best interests of the Fund and its shareholders.
The Board also considered use of an affiliated broker to execute certain trades for the Fund to among other things, control information leakage, and were advised that such trades are executed in compliance with rules under the Investment Company Act of 1940, as amended.
25 Invesco Growth and Income Fund
Tax Information
Form 1099-DIV, Form 1042-S and other year–end tax information provide shareholders with actual calendar year amounts that should be included in their tax returns. Shareholders should consult their tax advisors.
The following distribution information is being provided as required by the Internal Revenue Code or to meet a specific state’s requirement.
The Fund designates the following amounts or, if subsequently determined to be different, the maximum amount allowable for its fiscal year ended August 31, 2013:
Federal and State Income Tax | ||||
Qualified Dividend Income* | 100 | % | ||
Corporate Dividends Received Deduction* | 100 | % | ||
| * | The above percentages are based on ordinary income dividends paid to shareholders during the Fund’s fiscal year. |
26 Invesco Growth and Income Fund
Trustees and Officers
The address of each trustee and officer is AIM Counselor Series Trust (Invesco Counselor Series Trust) (the “Trust”), 11 Greenway Plaza, Suite 1000, Houston, Texas 77046-1173. The trustees serve for the life of the Trust, subject to their earlier death, incapacitation, resignation, retirement or removal as more specifically provided in the Trust’s organizational documents. Each officer serves for a one year term or until their successors are elected and qualified. Column two below includes length of time served with predecessor entities, if any.
Name, Year of Birth and Position(s) Held with the Trust | Trustee and/ or Officer Since | Principal Occupation(s) During Past 5 Years | Number of Funds in Fund Complex Overseen by Trustee | Other Directorship(s) Held by Trustee During Past 5 Years | ||||
| Interested Persons | ||||||||
| Martin L. Flanagan1 — 1960 Trustee | 2007 | Executive Director, Chief Executive Officer and President, Invesco Ltd. (ultimate parent of Invesco and a global investment management firm); Advisor to the Board, Invesco Advisers, Inc. (formerly known as Invesco Institutional (N.A.), Inc.); Trustee, The Invesco Funds; Vice Chair, Investment Company Institute; and Member of Executive Board, SMU Cox School of Business
Formerly: Chairman and Chief Executive Officer, Invesco Advisers, Inc. (registered investment adviser); Director, Chairman, Chief Executive Officer and President, IVZ Inc. (holding company), INVESCO Group Services, Inc. (service provider) and Invesco North American Holdings, Inc. (holding company); Director, Chief Executive Officer and President, Invesco Holding Company Limited (parent of Invesco and a global investment management firm); Director, Invesco Ltd.; Chairman, Investment Company Institute and President, Co-Chief Executive Officer, Co-President, Chief Operating Officer and Chief Financial Officer, Franklin Resources, Inc. (global investment management organization) | 117 | None | ||||
| Philip A. Taylor2 — 1954 Trustee, President and Principal Executive Officer | 2006 | Head of North American Retail and Senior Managing Director, Invesco Ltd.; Director, Co-Chairman, Co-President and Co-Chief Executive Officer, Invesco Advisers, Inc. (formerly known as Invesco Institutional (N.A.), Inc.) (registered investment adviser); Director, Chairman, Chief Executive Officer and President, Invesco Management Group, Inc. (formerly known as Invesco Aim Management Group, Inc.) (financial services holding company); Director and President, INVESCO Funds Group, Inc. (registered investment adviser and registered transfer agent); Director and Chairman, Invesco Investment Services, Inc. (formerly known as Invesco Aim Investment Services, Inc.) (registered transfer agent) and IVZ Distributors, Inc. (formerly known as INVESCO Distributors, Inc.) (registered broker dealer); Director, President and Chairman, Invesco Inc. (holding company) and Invesco Canada Holdings Inc. (holding company); Chief Executive Officer, Invesco Corporate Class Inc. (corporate mutual fund company) and Invesco Canada Fund Inc. (corporate mutual fund company); Director, Chairman and Chief Executive Officer, Invesco Canada Ltd. (formerly known as Invesco Trimark Ltd./Invesco Trimark Ltèe) (registered investment adviser and registered transfer agent); Trustee, President and Principal Executive Officer, The Invesco Funds (other than AIM Treasurer’s Series Trust (Invesco Treasurer’s Series Trust) and Short-Term Investments Trust); Trustee and Executive Vice President, The Invesco Funds (AIM Treasurer’s Series Trust (Invesco Treasurer’s Series Trust) and Short-Term Investments Trust only); Director, Invesco Investment Advisers LLC (formerly known as Van Kampen Asset Management); Director, Chief Executive Officer and President, Van Kampen Exchange Corp.
Formerly: Director and Chairman, Van Kampen Investor Services Inc.: Director, Chief Executive Officer and President, 1371 Preferred Inc. (holding company); and Van Kampen Investments Inc.; Director and President, AIM GP Canada Inc. (general partner for limited partnerships); and Van Kampen Advisors, Inc.; Director and Chief Executive Officer, Invesco Trimark Dealer Inc. (registered broker dealer); Director, Invesco Distributors, Inc. (formerly known as Invesco Aim Distributors, Inc.) (registered broker dealer); Manager, Invesco PowerShares Capital Management LLC; Director, Chief Executive Officer and President, Invesco Advisers, Inc.; Director, Chairman, Chief Executive Officer and President, Invesco Aim Capital Management, Inc.; President, Invesco Trimark Dealer Inc. and Invesco Trimark Ltd./Invesco Trimark Ltèe; Director and President, AIM Trimark Corporate Class Inc. and AIM Trimark Canada Fund Inc.; Senior Managing Director, Invesco Holding Company Limited; Trustee and Executive Vice President, Tax-Free Investments Trust; Director and Chairman, Fund Management Company (former registered broker dealer); President and Principal Executive Officer, The Invesco Funds (AIM Treasurer’s Series Trust (Invesco Treasurer’s Series Trust), Short-Term Investments Trust and Tax-Free Investments Trust only); President, AIM Trimark Global Fund Inc. and AIM Trimark Canada Fund Inc. | 117 | None | ||||
Wayne W. Whalen3 — 1939 Trustee | 2010 | Of Counsel, and prior to 2010, partner in the law firm of Skadden, Arps, Slate, Meagher & Flom LLP, legal counsel to certain funds in the Fund Complex
| 130 | Director of the Mutual Fund Directors Forum, a nonprofit membership organization for investment directors; Chairman and Director of the Abraham Lincoln Presidential Library Foundation; and Director of the Stevenson Center for Democracy |
| 1 | Mr. Flanagan is considered an interested person of the Trust because he is an officer of the adviser to the Trust, and an officer and a director of Invesco Ltd., ultimate parent of the adviser to the Trust. |
| 2 | Mr. Taylor is considered an interested person of the Trust because he is an officer and a director of the adviser to, and a director of the principal underwriter of, the Trust. |
| 3 | Mr. Whalen is considered an “interested person” (within the meaning of Section 2(a)(19) of the 1940 Act) of certain Funds in the Invesco Fund Complex because he and his firm currently provide legal services as legal counsel to such Funds. |
T-1 Invesco Growth and Income Fund
Trustees and Officers—(continued)
Name, Year of Birth and Position(s) Held with the Trust | Trustee and/ or Officer Since | Principal Occupation(s) During Past 5 Years | Number of Funds in Fund Complex Overseen by Trustee | Other Directorship(s) Held by Trustee During Past 5 Years | ||||
| Independent Trustees | ||||||||
Bruce L. Crockett — 1944 Trustee and Chair | 2003 | Chairman, Crockett Technologies Associates (technology consulting company)
Formerly: Director, Captaris (unified messaging provider); Director, President and Chief Executive Officer COMSAT Corporation; and Chairman, Board of Governors of INTELSAT (international communications company) | 117 | ACE Limited (insurance company); Investment Company Institute | ||||
David C. Arch — 1945 Trustee | 2010 | Chairman and Chief Executive Officer of Blistex Inc., (consumer health care products manufacturer)
Formerly: Member of the Heartland Alliance Advisory Board, a nonprofit organization serving human needs based in Chicago | 130 | Board member of the Illinois Manufacturers’ Association; Member of the Board of Visitors, Institute for the Humanities, University of Michigan | ||||
Frank S. Bayley — 1939 Trustee | 2003 | Retired
Formerly: Director, Badgley Funds, Inc. (registered investment company) (2 portfolios) and General Partner and Of Counsel, law firm of Baker & McKenzie, LLP | 117 | Director and Chairman, C.D. Stimson Company (a real estate investment company); Trustee and Overseer, The Curtis Institute of Music | ||||
James T. Bunch — 1942 Trustee | 2000 | Managing Member, Grumman Hill Group LLC (family office private equity management)
Formerly: Founder, Green, Manning & Bunch Ltd. (investment banking firm)(1988-2010); Executive Committee, United States Golf Association; and Director, Policy Studies, Inc. and Van Gilder Insurance Corporation | 117 | Chairman, Board of Governors, Western Golf Association; Chairman-elect, Evans Scholars Foundation; and Director, Denver Film Society | ||||
Rodney F. Dammeyer — 1940 Trustee | 2010 | Chairman of CAC, LLC, (private company offering capital investment and management advisory services)
Formerly: Prior to 2001, Managing Partner at Equity Group Corporate Investments; Prior to 1995, Chief Executive Officer of Itel Corporation (formerly Anixter International); Prior to 1985, experience includes Senior Vice President and Chief Financial Officer of Household International, Inc., Executive Vice President and Chief Financial Officer of Northwest Industries, Inc. and Partner of Arthur Andersen & Co.; From 1987 to 2010, Director/Trustee of investment companies in the Van Kampen Funds complex | 117 | Director of Quidel Corporation and Stericycle, Inc.; Prior to May 2008, Trustee of The Scripps Research Institute; Prior to February 2008, Director of Ventana Medical Systems, Inc. | ||||
Albert R. Dowden — 1941 Trustee | 2003 | Director of a number of public and private business corporations, including the Boss Group, Ltd. (private investment and management); Reich & Tang Funds (5 portfolios) (registered investment company); and Homeowners of America Holding Corporation/ Homeowners of America Insurance Company (property casualty company)
Formerly: Director, Continental Energy Services, LLC (oil and gas pipeline service); Director, CompuDyne Corporation (provider of product and services to the public security market) and Director, Annuity and Life Re (Holdings), Ltd. (reinsurance company); Director, President and Chief Executive Officer, Volvo Group North America, Inc.; Senior Vice President, AB Volvo; Director of various public and private corporations; Chairman, DHJ Media, Inc.; Director Magellan Insurance Company; and Director, The Hertz Corporation, Genmar Corporation (boat manufacturer), National Media Corporation; Advisory Board of Rotary Power International (designer, manufacturer, and seller of rotary power engines); and Chairman, Cortland Trust, Inc. (registered investment company) | 117 | Director of Nature’s Sunshine Products, Inc. | ||||
Jack M. Fields — 1952 Trustee | 2003 | Chief Executive Officer, Twenty First Century Group, Inc. (government affairs company); Owner and Chief Executive Officer, Dos Angeles Ranch, L.P. (cattle, hunting, corporate entertainment); and Discovery Global Education Fund (non-profit)
Formerly: Chief Executive Officer, Texana Timber LP (sustainable forestry company); Director of Cross Timbers Quail Research Ranch (non-profit); and member of the U.S. House of Representatives | 117 | Insperity, Inc. (formerly known as Administaff) | ||||
Prema Mathai-Davis — 1950 Trustee | 2003 | Retired
Formerly: Chief Executive Officer, YWCA of the U.S.A. | 117 | None | ||||
Larry Soll — 1942 Trustee | 1997 | Retired
Formerly: Chairman, Chief Executive Officer and President, Synergen Corp. (a biotechnology company) | 117 | None | ||||
Hugo F. Sonnenschein — 1940 Trustee | 2010 | Distinguished Service Professor and President Emeritus of the University of Chicago and the Adam Smith Distinguished Service Professor in the Department of Economics at the University of Chicago
Formerly: President of the University of Chicago | 130 | Trustee of the University of Rochester and a member of its investment committee. Member of the National Academy of Sciences, the American Philosophical Society and a fellow of the American Academy of Arts and Sciences |
T-2 Invesco Growth and Income Fund
Trustees and Officers—(continued)
Name, Year of Birth and Position(s) Held with the Trust | Trustee and/ or Officer Since | Principal Occupation(s) During Past 5 Years | Number of Funds in Fund Complex Overseen by Trustee | Other Directorship(s) Held by Trustee During Past 5 Years | ||||
| Independent Trustees—(continued) | ||||||||
Raymond Stickel, Jr. — 1944 Trustee | 2005 | Retired
Formerly: Director, Mainstay VP Series Funds, Inc. (25 portfolios) and Partner, Deloitte & Touche | 117 | None | ||||
| Other Officers | ||||||||
| Russell C. Burk — 1958 Senior Vice President and Senior Officer | 2005 | Senior Vice President and Senior Officer, The Invesco Funds | N/A | N/A | ||||
| John M. Zerr — 1962 Senior Vice President, Chief Legal Officer and Secretary | 2006 | Director, Senior Vice President, Secretary and General Counsel, Invesco Management Group, Inc. (formerly known as Invesco Aim Management Group, Inc.) and Van Kampen Exchange Corp.; Senior Vice President, Invesco Advisers, Inc. (formerly known as Invesco Institutional (N.A.), Inc.) (registered investment adviser); Senior Vice President and Secretary, Invesco Distributors, Inc. (formerly known as Invesco Aim Distributors, Inc.); Director, Vice President and Secretary, Invesco Investment Services, Inc. (formerly known as Invesco Aim Investment Services, Inc.) and IVZ Distributors, Inc. (formerly known as INVESCO Distributors, Inc.); Director and Vice President, INVESCO Funds Group, Inc.; Senior Vice President, Chief Legal Officer and Secretary, The Invesco Funds; Manager, Invesco PowerShares Capital Management LLC; Director, Secretary and General Counsel, Invesco Investment Advisers LLC (formerly known as Van Kampen Asset Management); Secretary and General Counsel, Invesco Capital Markets, Inc. (formerly known as Van Kampen Funds Inc.) and Chief Legal Officer, PowerShares Exchange-Traded Fund Trust, PowerShares Exchange-Traded Fund Trust II, PowerShares India Exchange-Traded Fund Trust and PowerShares Actively Managed Exchange-Traded Fund Trust
Formerly: Director and Vice President, Van Kampen Advisors Inc.; Director, Vice President, Secretary and General Counsel, Van Kampen Investor Services Inc.; Director, Invesco Distributors, Inc. (formerly known as Invesco Aim Distributors, Inc.); Director, Senior Vice President, General Counsel and Secretary, Invesco Aim Advisers, Inc. and Van Kampen Investments Inc.; Director, Vice President and Secretary, Fund Management Company; Director, Senior Vice President, Secretary, General Counsel and Vice President, Invesco Aim Capital Management, Inc.; Chief Operating Officer and General Counsel, Liberty Ridge Capital, Inc. (an investment adviser); Vice President and Secretary, PBHG Funds (an investment company) and PBHG Insurance Series Fund (an investment company); Chief Operating Officer, General Counsel and Secretary, Old Mutual Investment Partners (a broker-dealer); General Counsel and Secretary, Old Mutual Fund Services (an administrator) and Old Mutual Shareholder Services (a shareholder servicing center); Executive Vice President, General Counsel and Secretary, Old Mutual Capital, Inc. (an investment adviser); and Vice President and Secretary, Old Mutual Advisors Funds (an investment company) | N/A | N/A | ||||
| Karen Dunn Kelley — 1960 Vice President | 2003 | Head of Invesco’s World Wide Fixed Income and Cash Management Group; Director, Co-President, Co-Chief Executive Officer, and Co-Chairman, Invesco Advisers, Inc. (formerly known as Invesco Institutional (N.A.), Inc.) (registered investment adviser); Chairman, Invesco Senior Secured Management, Inc.; Senior Vice President, Invesco Management Group, Inc. (formerly known as Invesco Aim Management Group, Inc.); Executive Vice President, Invesco Distributors, Inc. (formerly known as Invesco Aim Distributors, Inc.); Director, Invesco Mortgage Capital Inc., and Invesco Management Company Limited; Director and President, INVESCO Asset Management (Bermuda) Ltd., Vice President, The Invesco Funds (other than AIM Treasurer’s Series Trust (Invesco Treasurer’s Series Trust) and Short-Term Investments Trust); and President and Principal Executive Officer, The Invesco Funds (AIM Treasurer’s Series Trust (Invesco Treasurer’s Series Trust) and Short-Term Investments Trust only)
Formerly: Director, INVESCO Global Asset Management Limited and INVESCO Management S.A.; Senior Vice President, Van Kampen Investments Inc. and Invesco Advisers, Inc. (formerly known as Invesco Institutional (N.A.), Inc.) (registered investment adviser); Vice President, Invesco Advisers, Inc. (formerly known as Invesco Institutional (N.A.), Inc.); Director of Cash Management and Senior Vice President, Invesco Advisers, Inc. and Invesco Aim Capital Management, Inc.; President and Principal Executive Officer, Tax-Free Investments Trust; Director and President, Fund Management Company; Chief Cash Management Officer, Director of Cash Management, Senior Vice President, and Managing Director, Invesco Aim Capital Management, Inc.; Director of Cash Management, Senior Vice President, and Vice President, Invesco Advisers, Inc. and The Invesco Funds (AIM Treasurer’s Series Trust (Invesco Treasurer’s Series Trust), Short-Term Investments Trust and Tax-Free Investments Trust only) | N/A | N/A | ||||
T-3 Invesco Growth and Income Fund
Trustees and Officers—(continued)
Name, Year of Birth and Position(s) Held with the Trust | Trustee and/ or Officer Since | Principal Occupation(s) During Past 5 Years | Number of Funds in Fund Complex Overseen by Trustee | Other Directorship(s) Held by Trustee During Past 5 Years | ||||
| Other Officers—(continued) | ||||||||
| Sheri Morris — 1964 Vice President, Treasurer and Principal Financial Officer | 2003 | Vice President, Treasurer and Principal Financial Officer, The Invesco Funds; Vice President, Invesco Advisers, Inc. (formerly known as Invesco Institutional (N.A.), Inc.) (registered investment adviser); and Vice President, PowerShares Exchange-Traded Fund Trust, PowerShares Exchange-Traded Fund Trust II, PowerShares India Exchange-Traded Fund Trust and PowerShares Actively Managed Exchange-Traded Fund Trust
Formerly: Vice President, Invesco Aim Advisers, Inc., Invesco Aim Capital Management, Inc. and Invesco Aim Private Asset Management, Inc.; Assistant Vice President and Assistant Treasurer, The Invesco Funds and Assistant Vice President, Invesco Advisers, Inc., Invesco Aim Capital Management, Inc. and Invesco Aim Private Asset Management, Inc.; and Treasurer, PowerShares Exchange-Traded Fund Trust, PowerShares Exchange-Traded Fund Trust II, PowerShares India Exchange-Traded Fund Trust and PowerShares Actively Managed Exchange-Traded Fund Trust | N/A | N/A | ||||
Crissie M. Wisdom — 1969 Anti-Money Laundering Compliance Officer | 2013 | Anti-Money Laundering Compliance Officer, Invesco Advisers, Inc. (formerly known as Invesco Institutional (N.A.), Inc.) (registered investment adviser), Invesco Capital Markets, Inc. (formerly known as Van Kampen Funds Inc.), Invesco Distributors, Inc., Invesco Investment Services, Inc., Invesco Management Group, Inc., Van Kampen Exchange Corp., The Invesco Funds, Invesco Funds (Chicago), and PowerShares Exchange-Traded Fund Trust, PowerShares Exchange-Traded Fund Trust II, PowerShares India Exchange-Traded Fund Trust, and PowerShares Actively Managed Exchange-Traded Fund Trust; and Fraud Prevention Manager and Controls and Risk Analysis Manager for Invesco Investment Services, Inc. | N/A | N/A | ||||
| Todd L. Spillane — 1958 Chief Compliance Officer | 2006 | Senior Vice President, Invesco Management Group, Inc. (formerly known as Invesco Aim Management Group, Inc.) and Van Kampen Exchange Corp.; Senior Vice President and Chief Compliance Officer, Invesco Advisers, Inc. (registered investment adviser) (formerly known as Invesco Institutional (N.A.), Inc.); Chief Compliance Officer, The Invesco Funds; Vice President, Invesco Distributors, Inc. (formerly known as Invesco Aim Distributors, Inc.) and Invesco Investment Services, Inc. (formerly known as Invesco Aim Investment Services, Inc.)
Formerly: Chief Compliance Officer, Invesco Funds (Chicago); Senior Vice President, Van Kampen Investments Inc.; Senior Vice President and Chief Compliance Officer, Invesco Aim Advisers, Inc. and Invesco Aim Capital Management, Inc.; Chief Compliance Officer, INVESCO Private Capital Investments, Inc. (holding company), Invesco Private Capital, Inc. (registered investment adviser), Invesco Global Asset Management (N.A.), Inc., Invesco Senior Secured Management, Inc. (registered investment adviser), Van Kampen Investor Services Inc., PowerShares Exchange-Traded Fund Trust, PowerShares Exchange-Traded Fund Trust II, PowerShares India Exchange-Traded Fund Trust and PowerShares Actively Managed Exchange-Traded Fund Trust; and Vice President, Invesco Aim Capital Management, Inc. and Fund Management Company | N/A | N/A |
The Statement of Additional Information of the Trust includes additional information about the Fund’s Trustees and is available upon request, without charge, by calling 1.800.959.4246. Please refer to the Fund’s prospectus for information on the Fund’s sub-advisers.
Office of the Fund 11 Greenway Plaza, Suite 1000 Houston, TX 77046-1173 | Investment Adviser Invesco Advisers, Inc. 1555 Peachtree Street, N.E. Atlanta, GA 30309 | Distributor Invesco Distributors, Inc. 11 Greenway Plaza, Suite 1000 Houston, TX 77046-1173 | Auditors PricewaterhouseCoopers LLP 1201 Louisiana Street, Suite 2900 Houston, TX 77002-5678 | |||
Counsel to the Fund Stradley Ronon Stevens & Young, LLP 2005 Market Street, Suite 2600 Philadelphia, PA 19103-7018 | Counsel to the Independent Trustees Goodwin Procter LLP 901 New York Avenue, N.W. Washington, D.C. 20001 | Transfer Agent Invesco Investment Services, Inc. 11 Greenway Plaza, Suite 1000 Houston, TX 77046-1173 | Custodian State Street Bank and Trust Company 225 Franklin Street Boston, MA 02110-2801 | |||
T-4 Invesco Growth and Income Fund

Invesco mailing information
Send general correspondence to Invesco Investment Services, Inc., P.O. Box 219078, Kansas City, MO 64121-9078.
Invesco privacy policy
You share personal and financial information with us that is necessary for your transactions and your account records. We take very seriously the obligation to keep that information confidential and private.
Invesco collects nonpublic personal information about you from account applications or other forms you complete and from your transactions with us or our affiliates. We do not disclose information about you or our former customers to service providers or other third parties except to the extent necessary to service your account and in other limited circumstances as permitted by law. For example, we use this information to facilitate the delivery of transaction confirmations, financial reports, prospectuses and tax forms.
Even within Invesco, only people involved in the servicing of your accounts and compliance monitoring have access to your information. To ensure the highest level of confidentiality and security, Invesco maintains physical, electronic and procedural safeguards that meet or exceed federal standards. Special measures, such as data encryption and authentication, apply to your communications with us on our website. More detail is available to you at invesco.com/privacy.
Important notice regarding delivery of security holder documents
To reduce Fund expenses, only one copy of most shareholder documents may be mailed to shareholders with multiple accounts at the same address (Householding). Mailing of your shareholder documents may be householded indefinitely unless you instruct us otherwise. If you do not want the mailing of these documents to be combined with those for other members of your household, please contact Invesco Investment Services, Inc. at 800 959 4246 or contact your financial institution. We will begin sending you individual copies for each account within 30 days after receiving your request.
Fund holdings and proxy voting information
The Fund provides a complete list of its holdings four times in each fiscal year, at the quarter ends. For the second and fourth quarters, the lists appear in the Fund’s semiannual and annual reports to shareholders. For the first and third quarters, the Fund files the lists with the Securities and Exchange Commission (SEC) on Form N-Q. The most recent list of portfolio holdings is available at invesco.com/completeqtrholdings. Shareholders can also look up the Fund’s Forms N-Q on the SEC website at sec.gov. Copies of the Fund’s Forms N-Q may be reviewed and copied at the SEC Public Reference Room in Washington, D.C. You can obtain information on the operation of the Public Reference Room, including information about duplicating fee charges, by calling 202 551 8090 or 800 732 0330, or by electronic request at the following email address: publicinfo@sec.gov. The SEC file numbers for the Fund are shown below.
A description of the policies and procedures that the Fund uses to determine how to vote proxies relating to portfolio securities is available without charge, upon request, from our Client Services department at 800 959 4246 or at invesco.com/proxyguidelines. The information is also available on the SEC website, sec.gov.
Information regarding how the Fund voted proxies related to its portfolio securities during the most recent 12-month period ended June 30 is available at invesco.com/proxysearch. The information is also available on the SEC website, sec.gov. Invesco Advisers, Inc. is an investment adviser; it provides investment advisory services to individual and institutional clients and does not sell securities. Invesco Distributors, Inc. is the US distributor for Invesco Ltd.’s retail mutual funds, exchange-traded funds and institutional money market funds. Both are wholly owned, indirect subsidiaries of Invesco Ltd. |  |
SEC file numbers: 811-09913 and 333-36074 VK-GRI-AR-1 Invesco Distributors, Inc.
| ||||
 |
Annual Report to Shareholders
|
August 31, 2013
| ||
| ||||
Invesco Low Volatility Equity Yield Fund Effective July 31, 2013, Invesco U.S. Quantitative Core Fund was renamed Invesco Low Volatility Equity Yield Fund.
Nasdaq: A: SCAUX n B: SBCUX n C: SCCUX n R: SCRUX n Y: SCAYX Investor: SCNUX n R5: SCIUX | ||||

Letters to Shareholders
Philip Taylor | Dear Shareholders: Enclosed in this annual report, you’ll find information about your Fund and the factors that affected its performance during the reporting period. Inside, you’ll also find a discussion from your portfolio managers about how they managed your Fund, as well as performance data for your Fund, a complete list of your Fund’s investments as of the close of the reporting period and other important information. I hope you find this report of interest. During the reporting period covered by this report, major US equity indexes made multiyear or even all-time highs.1 Economic data were generally positive; housing and consumer spending data were particularly encouraging. Nonetheless, economic uncertainty and concern about continuing political and budget gridlock in Washington persisted. The US Federal Reserve’s deliberate vagueness about when, and to what degree, it might begin to curtail its | ||||||||

extraordinarily accommodative monetary policies – together with uncertainty about who will next lead the central bank – affected fixed income and equity markets alike. Most developed, non-US stock markets remained positive for the first half of 2013, despite a difficult second quarter.
Periods of market volatility and economic uncertainty can weaken the will of even the most resolute investor. That’s why Invesco believes it’s often helpful to work with a skilled and trusted financial adviser who can emphasize the importance of adhering to an investment plan designed to achieve long-term goals rather than being sidetracked by short-term uncertainty that can result in inaction. A financial adviser who is familiar with your individual financial situation, investment goals and risk tolerance can be an invaluable partner as you work toward your financial goals. He or she can provide insight and perspective when markets are volatile; encouragement and reassurance when times are uncertain; and advice and guidance when your financial situation or investment goals change.
Our website, invesco.com/us, is another source of timely insight and information for investors. On the website, you’ll find fund-specific as well as more general information from many of Invesco’s investment professionals. You’ll find in-depth articles, video clips and audio commentaries – and, of course, you also can access information about your Invesco account whenever it’s convenient for you.
What we mean by Intentional Investing
At Invesco, all of our people and all of our resources are dedicated to helping investors achieve their financial objectives. It’s a philosophy we call Intentional Investing, and it guides the way we:
| n | Manage investments – Our dedicated investment professionals search the world for the best opportunities, and each investment team follows a clear, disciplined process to build portfolios and mitigate risk. |
| n | Provide choices – We offer multiple investment strategies, allowing you and your financial adviser to build a portfolio that’s purpose-built for your needs. |
| n | Connect with you – We’re committed to giving you the expert insights you need to make informed investing decisions, and we are well-equipped to provide high-quality support for investors and advisers. |
At Invesco, we believe in putting investors first. That’s why investment management is all we do. Our sole focus on managing your money allows you and your financial adviser to build a portfolio of Invesco funds appropriate for your investment needs and goals today and when your circumstances change.
Have questions?
For questions about your account, feel free to contact an Invesco client services representative at 800 959 4246. For Invesco-related questions or comments, please email me directly at phil@invesco.com.
All of us at Invesco look forward to serving your investment management needs for many years to come. Thank you for investing with us.
Sincerely,

Philip Taylor
Senior Managing Director, Invesco Ltd.
1 Source: Reuters
2 Invesco Low Volatility Equity Yield Fund
Bruce Crockett | Dear Fellow Shareholders: The Invesco Funds Board has worked on a variety of issues over the last several months, and I’d like to take this opportunity to discuss two that affect you and our fellow fund shareholders. The first issue on which your Board has been working is our annual review of the funds’ advisory and sub-advisory contracts with Invesco Advisers and its affiliates. This annual review, which is required by the Investment Company Act of 1940, focuses on the nature and quality of the services Invesco provides as adviser to the Invesco Funds and the reasonableness of the fees that it charges for those services. Each year, we spend months reviewing detailed information that we request from Invesco that allows us to evaluate its services and fees. We also use information from many independent sources, including materials provided by the independent Senior Officer of the Invesco Funds, who reports directly to the independent | ||||||||

Trustees on the Board. Additionally, we meet with independent legal counsel and review performance and fee data prepared by Lipper Inc., an independent, third-party firm widely recognized as a leader in its field.
I’m pleased to report that the Board determined in June that renewing the investment advisory agreement and the sub-advisory contracts with Invesco Advisers and its affiliates would serve the best interests of each fund and its shareholders.
The second area of focus to highlight is the Board’s efforts to ensure that we provide a lineup of funds that allow financial advisers to build portfolios that meet shareholders’ changing financial needs and goals. Today, more and more investors are reaching, or approaching, retirement. But interest rates remain low, making it difficult for many investors to generate the income they need, or will soon need, in their retirement years.
The members of your Board think about these things, too, and we’ve worked with Invesco Advisers to provide more income-generating options in the Invesco Funds lineup to help shareholders potentially meet their income needs. Your Board recently approved changes to three existing equity mutual funds, increasing their focus on generating income while also seeking to provide long-term growth of capital.
As a result of these changes, the funds and their respective management teams now have more flexibility to invest in the types of securities that could meet investors’ growing need for income generation, and in some cases, also help investors diversify their sources of income. These equity funds complement an array of fixed-income, asset allocation and alternative investment options in the Invesco Funds lineup designed to accommodate a variety of risk tolerances.
Be assured that your Board will continue working on behalf of fund shareholders, keeping your needs and interests uppermost in our minds.
As always, please contact me at bruce@brucecrockett.com with any questions or concerns you may have. On behalf of the Board, we look forward to continuing to represent your interests and serving your needs.
Sincerely,

Bruce L. Crockett
Independent Chair
Invesco Funds Board of Trustees
3 Invesco Low Volatility Equity Yield Fund
Management’s Discussion of Fund Performance
Performance summary
For the fiscal year ended August 31, 2013, Invesco Low Volatility Equity Yield Fund underperformed the S&P 500 Index and the Lipper Large-Cap Core Funds Index, the Fund’s benchmarks that were used for the majority of the reporting period. The Fund seeks to provide income and long-term growth of capital by investing, typically, at least 80% of its assets in a diversified portfolio of securities of large-cap companies. The consumer discretionary, financials and telecommunication services sectors contributed the most to the Fund’s positive performance. The energy, health care and materials sectors detracted from overall Fund performance. During the reporting period, the Fund changed its name, benchmark, investment objectives and investment strategy. This conversion occurred on July 31, 2013.
Your Fund’s long-term performance appears later in this report.
Fund vs. Indexes
Total returns, 8/31/12 to 8/31/13, at net asset value (NAV). Performance shown does not include applicable contingent deferred sales charges (CDSC) or front-end sales charges, which would have reduced performance.
| Class A Shares | 16.71 | % | |||
| Class B Shares | 15.72 | ||||
| Class C Shares | 15.75 | ||||
| Class R Shares | 16.37 | ||||
| Class Y Shares | 16.90 | ||||
| Investor Class Shares | 16.65 | ||||
| Class R5 Shares | 17.12 | ||||
| S&P 500 Index‚ (Broad Market Index, Former Style-Specific Index)* | 18.70 | ||||
| Russell 1000 Indexn (Style-Specific Index)* | 19.84 | ||||
| Lipper Equity Income Index¿ (Peer Group Index)** | 18.23 | ||||
| Lipper Large-Cap Core Funds Index¿ (Former Peer Group Index)** | 19.98 |
| Source(s): | ‚Invesco, S&P-Dow Jones via FactSet Research Systems Inc.; |
| nInvesco, Russell via FactSet Research Systems Inc.; ¿Lipper Inc. |
| * | During the reporting period, the Fund has elected to use the Russell 1000 Index as its style-specific index rather than the S&P 500 Index because it more appropriately reflects the Fund’s investable universe. |
| ** | During the reporting period, the Fund has elected to use the Lipper Equity Income Index as its peer group index rather than the Lipper Large-Cap Core Funds Index because it more appropriately reflects the performance of the types of securities in which the Fund invests. |
How we invest
From September 1, 2012, to July 31, 2013, we managed your Fund to provide exposure to large-cap core equity stocks. The portfolio strived to outperform the S&P 500 Index while minimizing the amount of additional risk relative to the style-specific benchmark.
During this 10-month period, each stock in the universe was evaluated on four concepts: company earnings momentum, price trend, management action and relative valuation. The scores
from these four concepts were combined to arrive at an overall alpha score (excess return forecast) for each stock. Each alpha score was relative to other securities in the same industry. Stocks were also evaluated on a number of other factors to develop a stock-specific risk forecast and transaction cost forecast.
We continually monitored the portfolio, and the overall investment process was repeated on a monthly basis to determine which companies should be bought or sold in the portfolio.
Beginning July 31, 2013, the investment team began utilizing a comprehensive, “total return” approach seeking the benefits of integrating the desired outcomes of price appreciation, high income and low volatility. This is achieved by using a bottom-up, disciplined investment process in which returns are driven by a successful, long-standing stock selection model based on four investment concepts:
| n | Earnings momentum (are earnings improving or deteriorating?) |
| n | Price trend (what is the price action telling us?) |
| n | Management action (what is management doing?) |
| n | Relative value (are valuations attractive?) |
The team employed a low volatility approach to construct the portfolio by relaxing the benchmark-relative constraints, creating a wider opportunity set with the freedom to seek the highest level of return and generate income (dividend yield) for a lower level of total risk.
Market conditions and your Fund
The fiscal year ended August 31, 2013, began with some downward volatility in US equity markets. Starting in the fall of 2012, markets began an upward trend that continued through much of the reporting period. In early fall, the European Central Bank implemented new measures to support member economies and the US Federal Reserve (the Fed) initiated a third round of quantitative easing (QE), or fiscal stimulus, which caused consumer sentiment to improve. Uncertainty surrounding US election results, “fiscal cliff” negotiations and sequestration spending cuts in early 2013, however, made many businesses hesitant to spend during the first quarter of the year. However, for the first time in years, markets appeared willing to look past headline events.
| Portfolio Composition | |||||
| By sector | |||||
| Information Technology | 16.6 | % | |||
| Financials | 16.4 | ||||
| Consumer Staples | 13.2 | ||||
| Utilities | 11.1 | ||||
| Health Care | 10.7 | ||||
| Energy | 10.1 | ||||
| Consumer Discretionary | 9.0 | ||||
| Telecommunication Services | 6.3 | ||||
| Industrials | 4.2 | ||||
| U. S. Treasury Bills, Plus Money Market Funds, Plus Other Assets Less Liabilities | 2.4 | ||||
| Top 10 Equity Holdings* | |||||
| 1. GameStop Corp.-Class A | 2.2 | % | |||
| 2. Microsoft Corp. | 2.1 | ||||
| 3. Merck & Co., Inc. | 2.0 | ||||
| 4. Amgen Inc. | 2.0 | ||||
| 5. Eli Lilly & Co. | 2.0 | ||||
| 6. Chevron Corp. | 2.0 | ||||
| 7. AT&T Inc. | 2.0 | ||||
| 8. CVS Caremark Corp. | 1.9 | ||||
| 9. Pfizer Inc. | 1.9 | ||||
| 10. Wal-Mart Stores, Inc. | 1.9 | ||||
| Total Net Assets | $332.0 million | ||||
| Total Number of Holdings* | 118 | ||||
The Fund’s holdings are subject to change, and there is no assurance that the Fund will continue to hold any particular security.
*Excluding money market fund holdings.
4 Invesco Low Volatility Equity Yield Fund
From late May through June, the capital markets began a sell-off following Fed Chairman Ben Bernanke’s comments about reducing QE. Since December 2012, the Fed has purchased $85 billion1 of US Treasuries and mortgage-backed securities each month to increase liquidity and ensure low long-term interest rates in an effort to spur the housing and real estate markets. Few asset classes were immune from this broad sell-off, which caused bonds, stocks and commodities to decline. Precious metals were particularly hard hit, and fixed-income investors scrambled to sell bonds in anticipation of higher yields. The markets stabilized in mid-summer; however, August brought more selling in the equity and bond markets and yields continued to rise.
All sectors in the Fund’s broad market index posted positive returns for the reporting period. All market capitalization-based investment styles posted positive returns, with mid- and small-cap stocks generally outperforming large-cap stocks for the reporting period.
All sectors in the Fund, except for utilities, generated positive returns for the fiscal year. Stock selection in the consumer discretionary and financials sectors was particularly strong. Stock selection in the industrial sector was positive, but the underweight position caused a negative net total effect. Stock selection in the energy, health care and materials sectors was a drag on overall performance.
In the consumer discretionary sector, GameStop and PulteGroup were two of the Fund’s largest contributors to performance. PulteGroup, one of the nation’s leading homebuilders, was helped during the fiscal year by a slow recovery in the housing market as well as record low mortgage rates. We sold our holdings in PulteGroup before the end of the reporting period.
Within the financials sector, Lincoln National and Citigroup led the way and added to the Fund’s overall positive performance. We sold our holdings in Lincoln National and Citigroup before the end of the reporting period.
While the information technology sector generated positive performance overall, several key holdings struggled during the reporting period. These included Apple, Intel and Marvell. During the reporting period, it was reported that Marvell infringed on two patents held by Carnegie Mellon University. The chipmaker was ordered to pay $1.17 billion in damages.2 We sold our holdings in Apple and Intel before the end of the reporting period.
Also detracting from Fund performance were Apollo Group and American Eagle Outfitters. We sold our holdings in Apollo Group before the end of the reporting period.
When looking at the stock selection model, relative value was the strongest driver of returns over the reporting period. Investors sought attractive valuation given both its upside potential and downside protection. Management action was mostly positive. Investors generally favored managements that protected their interests by buying back stock, reducing debt and paying out dividends. Momentum was the weakest concept. Generally, given the low-to-negative correlation of our momentum concepts with management action and relative value, we expect these concepts are not adding value simultaneously. During the fiscal year, price trend and momentum were not rewarded by investors mostly due to the two concepts’ higher risk profile. Price trend struggled in the first half of the reporting period but modestly improved in the second half. Earnings momentum had limited predictive ability as investors were unwilling to rely on earnings as a predictor of future returns. Despite the market’s strength, risk management was a key to successful Fund performance.
During the reporting period, the Fund invested in S&P 500 futures contracts, a derivative instrument, to gain exposure to the equity market. These futures contracts generated a positive return and contributed to Fund performance.
We welcome new investors who joined the Fund during the fiscal year and thank all of our shareholders for your investment in Invesco Low Volatility Equity Yield Fund.
| 1 | Source: US Federal Reserve |
| 2 | Source: Reuters |
The views and opinions expressed in management’s discussion of Fund performance are those of Invesco Advisers, Inc. These views and opinions are subject to change at any time based on factors such as market and economic conditions. These views and opinions may not be relied upon as investment advice or recommendations, or as an offer for a particular security. The information is not a complete analysis of every aspect of any market, country, industry, security or the Fund. Statements of fact are from sources considered reliable, but Invesco Advisers, Inc. makes no representation or warranty as to their completeness or accuracy. Although historical performance is no guarantee of future results, these insights may help you understand our investment management philosophy.
See important Fund and, if applicable, index disclosures later in this report.
 | Michael Abata Chartered Financial Analyst, portfolio manager, is manager of Invesco Low Volatility Equity Yield | |
| Fund. He joined Invesco in 2011. Mr. Abata earned a BA in economics from Binghamton University. | ||
 | Charles Ko Chartered Financial Analyst, portfolio manager, is manager of Invesco Low Volatility Equity Yield | |
| Fund. He joined Invesco in 2012. Mr. Ko earned a BS from MIT and an MBA from Yale University. | ||
 | Anthony Munchak Chartered Financial Analyst, portfolio manager, is manager of Invesco Low Volatility Equity Yield | |
| Fund. He joined Invesco in 2000. Mr. Munchak earned a BS and an MS in finance from Boston College and an MBA from Bentley College. | ||
 | Glen Murphy Chartered Financial Analyst, portfolio manager, is manager of Invesco Low Volatility Equity Yield | |
| Fund. He joined Invesco in 1995. Mr. Murphy earned a BA in business administration from the University of Massachusetts Amherst and an MS in finance from Boston College. | ||
 | Frances Orlando Chartered Financial Analyst, portfolio manager, is manager of Invesco Low Volatility Equity Yield | |
| Fund. He joined Invesco in 1987. Mr. Orlando earned a BA in business administration from Merrimack College and an MBA from Boston University. | ||
 | Andrew Waisburd Portfolio manager, is manager of Invesco Low Volatility Equity Yield Fund. He joined Invesco in 2008. | |
| Mr. Waisburd earned a BS in statistics from Cornell University and an MS and a PhD in finance from Indiana University. | ||
5 Invesco Low Volatility Equity Yield Fund
Your Fund’s Long-Term Performance
Results of a $10,000 Investment – Oldest Share Class(es) since Inception
Fund and index data from 3/31/06
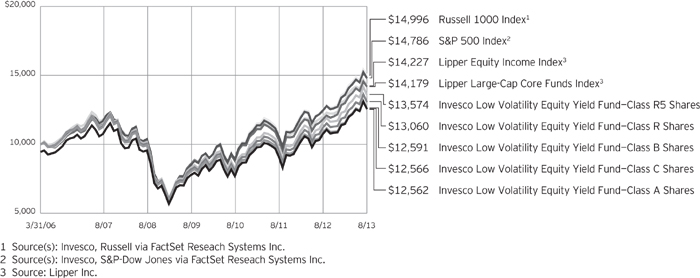
Past performance cannot guarantee comparable future results.
During the reporting period, the Fund has elected to use the Russell 1000 Index as its style-specific index rather than the S&P 500 Index because it more appropriately reflects the Fund’s investable universe. Because this is the first reporting period since we have adopted the new index, SEC guidelines require that we compare performance to both the old and new indexes.
During the reporting period, the Fund has elected to use the Lipper Equity Income Index as its peer group index rather than the Lipper Large-Cap Core Funds Index because it more appropriately reflects the performance of the types of securities in which the Fund invests. Because this is the first reporting period since we have adopted the new index, SEC guidelines require that we
compare performance to both the old and new indexes.
The data shown in the chart include reinvested distributions, applicable sales charges and Fund expenses including management fees. Results for Class B shares are calculated as if a hypothetical shareholder had liquidated his entire investment in the Fund at the close of the reporting period and paid the contingent deferred sales charges, if applicable. Index results include reinvested dividends, but they do not reflect sales charges. Performance of the peer group, if applicable, reflects fund expenses and management fees; performance of a market index does not. Performance shown in the chart and table(s) does not reflect deduction of taxes a shareholder would pay on Fund distributions or sale of Fund shares.
6 Invesco Low Volatility Equity Yield Fund
Average Annual Total Returns As of 8/31/13, including maximum applicable sales charges
|
| ||||
| Class A Shares | |||||
| Inception (3/31/06) | 3.12 | % | |||
| 5 Years | 4.41 | ||||
| 1 Year | 10.34 | ||||
| Class B Shares | |||||
| Inception (3/31/06) | 3.15 | % | |||
| 5 Years | 4.52 | ||||
| 1 Year | 10.72 | ||||
| Class C Shares | |||||
| Inception (3/31/06) | 3.13 | % | |||
| 5 Years | 4.81 | ||||
| 1 Year | 14.75 | ||||
| Class R Shares | |||||
| Inception (3/31/06) | 3.66 | % | |||
| 5 Years | 5.38 | ||||
| 1 Year | 16.37 | ||||
| Class Y Shares | |||||
| Inception | 4.10 | % | |||
| 5 Years | 5.90 | ||||
| 1 Year | 16.90 | ||||
| Investor Class Shares | |||||
| Inception | 3.93 | % | |||
| 5 Years | 5.63 | ||||
| 1 Year | 16.65 | ||||
| Class R5 Shares | |||||
| Inception (3/31/06) | 4.20 | % | |||
| 5 Years | 5.93 | ||||
| 1 Year | 17.12 | ||||
Average Annual Total Returns As of 6/30/13, the most recent calendar quarter end, including maximum applicable sales charges
|
| ||||
| Class A Shares | |||||
| Inception (3/31/06) | 3.02 | % | |||
| 5 Years | 4.06 | ||||
| 1 Year | 14.51 | ||||
| Class B Shares | |||||
| Inception (3/31/06) | 3.08 | % | |||
| 5 Years | 4.16 | ||||
| 1 Year | 15.32 | ||||
| Class C Shares | |||||
| Inception (3/31/06) | 3.06 | % | |||
| 5 Years | 4.45 | ||||
| 1 Year | 19.37 | ||||
| Class R Shares | |||||
| Inception (3/31/06) | 3.59 | % | |||
| 5 Years | 5.02 | ||||
| 1 Year | 20.98 | ||||
| Class Y Shares | |||||
| Inception | 4.03 | % | |||
| 5 Years | 5.53 | ||||
| 1 Year | 21.50 | ||||
| Investor Class Shares | |||||
| Inception | 3.85 | % | |||
| 5 Years | 5.27 | ||||
| 1 Year | 21.25 | ||||
| Class R5 Shares | |||||
| Inception (3/31/06) | 4.13 | % | |||
| 5 Years | 5.57 | ||||
| 1 Year | 21.87 | ||||
Class Y shares incepted on October 3, 2008. Performance shown prior to that date is that of Class A shares and includes the 12b-1 fees applicable to Class A shares. Class A share performance reflects any applicable fee waivers or expense reimbursements.
Investor Class shares incepted on April 25, 2008. Performance shown prior to that date is that of Class A shares and includes the 12b-1 fees applicable to Class A shares. Class A share performance reflects any applicable fee waivers or expense reimbursements.
The performance data quoted represent past performance and cannot guarantee comparable future results; current performance may be lower or higher. Please visit invesco.com/performance for the most recent month-end performance. Performance figures reflect reinvested distributions, changes in net asset value and the effect of the maximum
sales charge unless otherwise stated. Investment return and principal value will fluctuate so that you may have a gain or loss when you sell shares.
The total annual Fund operating expense ratio set forth in the most recent Fund prospectus as of the date of this report for Class A, Class B, Class C, Class R, Class Y, Investor Class and Class R5 shares was 1.23%, 1.98%, 1.98%, 1.48%, 0.98%, 1.23% and 0.77%, respectively. The expense ratios presented above may vary from the expense ratios presented in other sections of this report that are based on expenses incurred during the period covered by this report.
Class A share performance reflects the maximum 5.50% sales charge, and Class B and Class C share performance reflects the applicable contingent deferred sales charge (CDSC) for the period involved. The CDSC on Class B shares declines from 5% beginning at the time of purchase to 0% at the
beginning of the seventh year. The CDSC on Class C shares is 1% for the first year after purchase. Class R, Class Y, Investor Class and Class R5 shares do not have a front-end sales charge or a CDSC; therefore, performance is at net asset value.
The performance of the Fund’s share classes will differ primarily due to different sales charge structures and class expenses.
Had the adviser not waived fees and/or reimbursed expenses in the past, performance would have been lower.
7 Invesco Low Volatility Equity Yield Fund
Invesco Low Volatility Equity Yield Fund’s investment objective is income and long-term growth of capital.
| n | Unless otherwise stated, information presented in this report is as of August 31, 2013, and is based on total net assets. |
| n | Unless otherwise noted, all data provided by Invesco. |
| n | To access your Fund’s reports/prospectus, visit invesco.com/fundreports. |
About share classes
| n | Class B shares may not be purchased for new or additional investments. Please see the prospectus for more information. |
| n | Class R shares are generally available only to employer sponsored retirement and benefit plans. Please see the prospectus for more information. |
| n | Class Y shares are available only to certain investors. Please see the prospectus for more information. |
| n | Investor Class shares are closed to new investors. Contact your financial adviser about purchasing our other share classes. Please see the prospectus for more information. |
| n | Class R5 shares are primarily intended for employer sponsored retirement and benefit plans that meet certain standards and for institutional investors. On September 24, 2012, Institutional Class shares were renamed Class R5 shares. Please see the prospectus for more information. |
Principal risks of investing in the Fund
| n | Active trading risk. The Fund engages in frequent trading of portfolio securities. Active trading results in added expenses and may result in a lower return and increased tax liability. |
| n | Depositary receipts risk. Depositary receipts involve many of the same risks as those associated with direct investment in foreign securities. In addition, the underlying issuers of certain depositary receipts, particularly unsponsored or unregistered depositary receipts, are under no obligation to distribute shareholder communications to the holders of such receipts or to pass through to them any voting rights with respect to the deposited securities. |
| n | Derivatives risk. The performance of derivative instruments is tied to the performance of an underlying currency, security, index, commodity or other instrument. In addition to risks relating |
to their underlying instruments, the use of derivatives may include other, possibly greater, risks. Derivatives involve costs, may be volatile, and may involve a small initial investment relative to the risk assumed. Risks associated with the use of derivatives may include counterparty, leverage, correlation, liquidity, tax, market, interest rate and management risks. Derivatives may also be more difficult to purchase, sell or value than other investments. The Fund may lose more than the cash amount invested on investments in derivatives.
Investors should bear in mind that, while the Fund intends to use derivative strategies, it is not obligated to actively engage in these transactions, generally or in any particular kind of derivative, if the adviser elects not to do so due to availability, cost, market conditions or other factors.
| n | Foreign securities risk. The Fund’s foreign investments may be affected by changes in a foreign country’s exchange rates, political and social instability, changes in economic or taxation policies, difficulties when enforcing obligations, decreased liquidity, and increased volatility. Foreign companies may be subject to less regulation resulting in less publicly available information about the companies. |
| n | Management risk. The investment techniques and risk analysis used by the Fund’s portfolio managers may not produce the desired results. |
| n | Market risk. The prices of and the income generated by the Fund’s securities may decline in response to, among other things, investor sentiment, general economic and market conditions, regional or global instability, and currency and interest rate fluctuations. |
About indexes used in this report
| n | The S&P 500® Index is an unmanaged index considered representative of the US stock market. |
| n | The Russell 1000® Index is an unmanaged index considered representative of large-cap stocks. The Russell 1000 Index is a trademark/service mark of the Frank Russell Co. Russell® is a trademark of the Frank Russell Co. |
| n | The Lipper Equity Income Index is an unmanaged Index considered representative of equity income funds tracked by Lipper. |
| n | The Lipper Large-Cap Core Funds Index is an unmanaged index considered representative of large-cap core funds tracked by Lipper. |
| n | The Fund is not managed to track the performance of any particular index, including the index(es) described here, and consequently, the performance of the Fund may deviate significantly from the performance of the index(es). |
| n | A direct investment cannot be made in an index. Unless otherwise indicated, index results include reinvested dividends, and they do not reflect sales charges. Performance of the peer group, if applicable, reflects fund expenses; performance of a market index does not. |
Other information
| n | The returns shown in management’s discussion of Fund performance are based on net asset values calculated for shareholder transactions. Generally accepted accounting principles require adjustments to be made to the net assets of the Fund at period end for financial reporting purposes, and as such, the net asset values for shareholder transactions and the returns based on those net asset values may differ from the net asset values and returns reported in the Financial Highlights. |
| n | Industry classifications used in this report are generally according to the Global Industry Classification Standard, which was developed by and is the exclusive property and a service mark of MSCI Inc. and Standard & Poor’s. |
This report must be accompanied or preceded by a currently effective Fund prospectus, which contains more complete information, including sales charges and expenses. Investors should read it carefully before investing.
NOT FDIC INSURED | MAY LOSE VALUE | NO BANK GUARANTEE
| Fund Nasdaq Symbols | |||||
| Class A Shares | SCAUX | ||||
| Class B Shares | SBCUX | ||||
| Class C Shares | SCCUX | ||||
| Class R Shares | SCRUX | ||||
| Class Y Shares | SCAYX | ||||
| Investor Class Shares | SCNUX | ||||
| Class R5 Shares | SCIUX | ||||
8 Invesco Low Volatility Equity Yield Fund
Schedule of Investments(a)
August 31, 2013
| Shares | Value | |||||||
Common Stocks & Other Equity Interests–97.60% |
| |||||||
| Aerospace & Defense–3.11% | ||||||||
Lockheed Martin Corp. | 23,000 | $ | 2,815,660 | |||||
Northrop Grumman Corp. | 23,000 | 2,122,210 | ||||||
Raytheon Co. | 71,300 | 5,376,733 | ||||||
| 10,314,603 | ||||||||
| Agricultural Products–0.64% | ||||||||
Archer-Daniels-Midland Co. | 60,600 | 2,133,726 | ||||||
| Apparel Retail–1.80% | ||||||||
American Eagle Outfitters, Inc. | 55,800 | 807,426 | ||||||
Gap, Inc. (The) | 127,500 | 5,156,100 | ||||||
| 5,963,526 | ||||||||
| Asset Management & Custody Banks–0.32% | ||||||||
State Street Corp. | 15,900 | 1,060,848 | ||||||
| Automotive Retail–0.14% | ||||||||
CST Brands, Inc.(b) | 15,500 | 457,250 | ||||||
| Biotechnology–2.58% | ||||||||
Amgen Inc. | 60,800 | 6,623,552 | ||||||
PDL BioPharma Inc. | 171,800 | 1,364,092 | ||||||
United Therapeutics Corp.(b) | 8,100 | 574,371 | ||||||
| 8,562,015 | ||||||||
| Broadcasting–0.15% | ||||||||
CTC Media, Inc. | 48,200 | 516,704 | ||||||
| Cable & Satellite–0.19% | ||||||||
Starz–Liberty Capital–Class A(b) | 25,000 | 624,000 | ||||||
| Casinos & Gaming–0.27% | ||||||||
Wynn Resorts Ltd. | 6,400 | 902,656 | ||||||
| Commercial Printing–0.56% | ||||||||
R. R. Donnelley & Sons Co. | 110,800 | 1,848,144 | ||||||
| Communications Equipment–1.85% | ||||||||
Cisco Systems, Inc. | 263,700 | 6,146,847 | ||||||
| Computer & Electronics Retail–2.18% | ||||||||
GameStop Corp.–Class A | 144,300 | 7,245,303 | ||||||
| Computer Hardware–1.52% | ||||||||
Hewlett-Packard Co. | 225,400 | 5,035,436 | ||||||
| Computer Storage & Peripherals–2.98% | ||||||||
Lexmark International, Inc.–Class A | 74,100 | 2,531,256 | ||||||
Seagate Technology PLC | 123,100 | 4,717,192 | ||||||
Western Digital Corp. | 42,600 | 2,641,200 | ||||||
| 9,889,648 | ||||||||
| Consumer Electronics–0.19% | ||||||||
Garmin Ltd. | 15,200 | 619,704 | ||||||
| Shares | Value | |||||||
| Data Processing & Outsourced Services–0.75% | ||||||||
Computer Sciences Corp. | 15,100 | $ | 757,265 | |||||
Western Union Co. (The) | 98,900 | 1,733,717 | ||||||
| 2,490,982 | ||||||||
| Department Stores–0.76% | ||||||||
Macy’s, Inc. | 56,600 | 2,514,738 | ||||||
| Diversified Banks–0.09% | ||||||||
Wells Fargo & Co. | 7,100 | 291,668 | ||||||
| Diversified Commercial & Professional Services–0.51% | ||||||||
Geo Group Inc. (The) | 54,600 | 1,704,066 | ||||||
| Diversified REIT’s–0.08% | ||||||||
Lexington Realty Trust | 22,300 | 261,356 | ||||||
| Drug Retail–1.94% | ||||||||
CVS Caremark Corp. | 111,000 | 6,443,550 | ||||||
| Electric Utilities–8.25% | ||||||||
American Electric Power Co., Inc. | 109,100 | 4,669,480 | ||||||
Edison International | 28,900 | 1,326,221 | ||||||
Entergy Corp. | 73,000 | 4,615,790 | ||||||
FirstEnergy Corp. | 59,600 | 2,233,212 | ||||||
Generac Holdings, Inc. | 82,600 | 3,270,134 | ||||||
Pepco Holdings, Inc. | 32,700 | 619,338 | ||||||
PPL Corp. | 160,000 | 4,912,000 | ||||||
Southern Co. (The) | 111,800 | 4,653,116 | ||||||
Xcel Energy, Inc. | 39,000 | 1,088,880 | ||||||
| 27,388,171 | ||||||||
| Gas Utilities–0.05% | ||||||||
WGL Holdings Inc. | 3,700 | 154,438 | ||||||
| Health Care Distributors–0.82% | ||||||||
AmerisourceBergen Corp. | 47,800 | 2,720,776 | ||||||
| Home Entertainment Software–1.17% | ||||||||
Activision Blizzard, Inc. | 238,600 | 3,893,952 | ||||||
| Home Improvement Retail–0.89% | ||||||||
Home Depot, Inc. (The) | 39,700 | 2,957,253 | ||||||
| Household Products–2.57% | ||||||||
Kimberly-Clark Corp. | 36,600 | 3,421,368 | ||||||
Procter & Gamble Co. (The) | 65,700 | 5,117,373 | ||||||
| 8,538,741 | ||||||||
| Hypermarkets & Super Centers–1.91% | ||||||||
Wal-Mart Stores, Inc. | 86,900 | 6,341,962 | ||||||
| Integrated Oil & Gas–3.84% | ||||||||
Chevron Corp. | 53,800 | 6,479,134 | ||||||
Exxon Mobil Corp. | 72,100 | 6,284,236 | ||||||
| 12,763,370 | ||||||||
See accompanying Notes to Financial Statements which are an integral part of the financial statements.
9 Invesco Low Volatility Equity Yield Fund
| Shares | Value | |||||||
| Integrated Telecommunication Services–6.27% | ||||||||
AT&T Inc. | 191,100 | $ | 6,464,913 | |||||
CenturyLink Inc. | 142,100 | 4,706,352 | ||||||
Verizon Communications Inc. | 100,700 | 4,771,166 | ||||||
Windstream Corp. | 606,000 | 4,890,420 | ||||||
| 20,832,851 | ||||||||
| Internet Software & Services–0.73% | ||||||||
AOL Inc.(b) | 73,400 | 2,417,062 | ||||||
| IT Consulting & Other Services–0.15% | ||||||||
SAIC, Inc. | 32,100 | 483,747 | ||||||
| Leisure Facilities–0.35% | ||||||||
Six Flags Entertainment Corp. | 35,600 | 1,175,156 | ||||||
| Leisure Products–0.29% | ||||||||
Hasbro, Inc. | 21,300 | 970,854 | ||||||
| Life & Health Insurance–0.07% | ||||||||
StanCorp Financial Group, Inc. | 4,500 | 235,440 | ||||||
| Mortgage REIT’s–4.90% | ||||||||
Annaly Capital Management Inc. | 422,900 | 4,935,243 | ||||||
MFA Financial, Inc. | 364,800 | 2,626,560 | ||||||
Starwood Property Trust, Inc. | 160,800 | 4,008,744 | ||||||
Two Harbors Investment Corp. | 495,500 | 4,712,205 | ||||||
| 16,282,752 | ||||||||
| Movies & Entertainment–0.16% | ||||||||
Regal Entertainment Group–Class A | 29,300 | 524,177 | ||||||
| Multi-Line Insurance–0.19% | ||||||||
Assurant, Inc. | 11,900 | 631,176 | ||||||
| Multi-Utilities–2.84% | ||||||||
Ameren Corp. | 53,800 | 1,818,978 | ||||||
Consolidated Edison, Inc. | 24,800 | 1,394,504 | ||||||
Integrys Energy Group, Inc. | 4,200 | 234,864 | ||||||
Public Service Enterprise Group Inc. | 148,300 | 4,807,886 | ||||||
TECO Energy, Inc. | 62,900 | 1,039,737 | ||||||
Vectren Corp. | 4,600 | 149,960 | ||||||
| 9,445,929 | ||||||||
| Oil & Gas Drilling–2.43% | ||||||||
Diamond Offshore Drilling, Inc. | 38,700 | 2,477,961 | ||||||
Seadrill Ltd. (Norway) | 120,800 | 5,588,208 | ||||||
| 8,066,169 | ||||||||
| Oil & Gas Exploration & Production–1.56% | ||||||||
ConocoPhillips | 78,300 | 5,191,290 | ||||||
| Oil & Gas Refining & Marketing–2.29% | ||||||||
CVR Energy, Inc. | 66,900 | 2,864,658 | ||||||
HollyFrontier Corp. | 13,100 | 582,688 | ||||||
Phillips 66 | 43,300 | 2,472,430 | ||||||
Valero Energy Corp. | 21,800 | 774,554 | ||||||
Western Refining, Inc. | 31,000 | 909,230 | ||||||
| 7,603,560 | ||||||||
| Shares | Value | |||||||
| Other Diversified Financial Services–1.86% | ||||||||
JPMorgan Chase & Co. | 122,300 | $ | 6,179,819 | |||||
| Packaged Foods & Meats–1.45% | ||||||||
General Mills, Inc. | 97,900 | 4,828,428 | ||||||
| Pharmaceuticals–7.33% | ||||||||
Eli Lilly & Co. | 127,000 | 6,527,800 | ||||||
Johnson & Johnson | 54,500 | 4,709,345 | ||||||
Merck & Co., Inc. | 140,800 | 6,658,432 | ||||||
Pfizer Inc. | 228,100 | 6,434,701 | ||||||
| 24,330,278 | ||||||||
| Property & Casualty Insurance–3.06% | ||||||||
Allstate Corp. (The) | 93,500 | 4,480,520 | ||||||
Chubb Corp. (The) | 7,900 | 657,043 | ||||||
Mercury General Corp. | 3,900 | 171,132 | ||||||
Old Republic International Corp. | 18,200 | 258,440 | ||||||
Travelers Cos., Inc. (The) | 29,800 | 2,381,020 | ||||||
XL Group PLC | 74,700 | 2,208,132 | ||||||
| 10,156,287 | ||||||||
| Publishing–0.21% | ||||||||
News Corp.–Class A(b) | 31,800 | 499,260 | ||||||
Washington Post Co. (The)–Class B | 360 | 203,040 | ||||||
| 702,300 | ||||||||
| Real Estate–0.24% | ||||||||
Potlatch Corp | 20,400 | 786,624 | ||||||
| Regional Banks–1.74% | ||||||||
Fifth Third Bancorp | 211,500 | 3,868,335 | ||||||
KeyCorp | 83,300 | 972,111 | ||||||
Valley National Bancorp | 92,400 | 932,316 | ||||||
| 5,772,762 | ||||||||
| Reinsurance–0.82% | ||||||||
Everest Re Group, Ltd. | 5,600 | 766,920 | ||||||
PartnerRe Ltd. | 16,400 | 1,429,260 | ||||||
Validus Holdings, Ltd. (Bermuda) | 15,200 | 526,072 | ||||||
| 2,722,252 | ||||||||
| Residential REIT’s–0.14% | ||||||||
Camden Property Trust | 7,300 | 451,067 | ||||||
| Restaurants–0.08% | ||||||||
Cracker Barrel Old Country Store, Inc. | 2,700 | 265,734 | ||||||
| Retail REIT’s–0.32% | ||||||||
Retail Properties of America, Inc.-Class A | 80,100 | 1,068,534 | ||||||
| Semiconductors–3.02% | ||||||||
Marvell Technology Group Ltd. | 307,400 | 3,722,614 | ||||||
Microchip Technology Inc. | 28,200 | 1,094,442 | ||||||
NVIDIA Corp. | 352,400 | 5,197,900 | ||||||
| 10,014,956 | ||||||||
See accompanying Notes to Financial Statements which are an integral part of the financial statements.
10 Invesco Low Volatility Equity Yield Fund
| Shares | Value | |||||||
| Specialized Consumer Services–1.35% | ||||||||
H&R Block, Inc. | 160,500 | $ | 4,479,555 | |||||
| Specialized REIT’s–0.74% | ||||||||
National Health Investors, Inc. | 2,800 | 153,720 | ||||||
Plum Creek Timber Co., Inc. | 9,800 | 434,238 | ||||||
Senior Housing Properties Trust | 81,800 | 1,860,950 | ||||||
| 2,448,908 | ||||||||
| Specialty Properties–0.31% | ||||||||
Omega Healthcare Investors, Inc. | 36,200 | 1,028,080 | ||||||
| Systems Software–4.40% | ||||||||
CA, Inc. | 45,600 | 1,333,800 | ||||||
Microsoft Corp. | 212,500 | 7,097,500 | ||||||
Symantec Corp. | 241,900 | 6,195,059 | ||||||
| 14,626,359 | ||||||||
| Thrifts & Mortgage Finance–1.53% | ||||||||
New York Community Bancorp, Inc. | 286,300 | 4,194,295 | ||||||
People’s United Financial Inc. | 61,400 | 873,108 | ||||||
| 5,067,403 | ||||||||
| Tobacco–4.66% | ||||||||
Altria Group, Inc. | 142,800 | 4,838,064 | ||||||
Lorillard, Inc. | 117,500 | 4,970,250 | ||||||
| Shares | Value | |||||||
| Tobacco–(continued) | ||||||||
Philip Morris International Inc. | 9,500 | $ | 792,680 | |||||
Reynolds American Inc. | 102,500 | 4,882,075 | ||||||
| 15,483,069 | ||||||||
Total Common Stocks & Other Equity Interests |
| 324,058,011 | ||||||
| Principal Amount | ||||||||
U.S. Treasury Bills–0.23% |
| |||||||
0.11%, 09/12/13 | $ | 750,000 | 750,000 | |||||
| Shares | ||||||||
Money Market Funds–2.06% |
| |||||||
Liquid Assets Portfolio–Institutional Class(e) | 3,426,824 | 3,426,824 | ||||||
Premier Portfolio–Institutional | 3,426,825 | 3,426,825 | ||||||
Total Money Market Funds |
| 6,853,649 | ||||||
TOTAL INVESTMENTS–99.89% |
| 331,661,660 | ||||||
OTHER ASSETS LESS LIABILITIES–0.11% |
| 356,273 | ||||||
NET ASSETS–100.00% |
| $ | 332,017,933 | |||||
Investment Abbreviations:
| REIT | – Real Estate Investment Trust |
Notes to Schedule of Investments:
| (a) | Industry and/or sector classifications used in this report are generally according to the Global Industry Classification Standard, which was developed by and is the exclusive property and a service mark of MSCI Inc. and Standard & Poor’s. |
| (b) | Non-income producing security. |
| (c) | All or a portion of the value was pledged as collateral to cover margin requirements for open futures contracts. See Note 1I and Note 4. |
| (d) | Security traded on a discount basis. The interest rate shown represents the discount rate at the time of purchase by the Fund. |
| (e) | The money market fund and the Fund are affiliated by having the same investment adviser. |
See accompanying Notes to Financial Statements which are an integral part of the financial statements.
11 Invesco Low Volatility Equity Yield Fund
Statement of Assets and Liabilities
August 31, 2013
Assets: |
| |||
Investments, at value (Cost $294,585,457) | $ | 324,808,011 | ||
Investments in affiliated money market funds, at value and cost | 6,853,649 | |||
Total investments, at value (Cost $301,439,106) | 331,661,660 | |||
Receivable for: | ||||
Investments sold | 9,873 | |||
Fund shares sold | 144,564 | |||
Dividends | 1,108,169 | |||
Investment for trustee deferred compensation and retirement plans | 137,630 | |||
Other assets | 39,469 | |||
Total assets | 333,101,365 | |||
Liabilities: |
| |||
Payable for: | ||||
Fund shares reacquired | 454,393 | |||
Variation margin | 23,502 | |||
Accrued fees to affiliates | 265,053 | |||
Accrued trustees’ and officers’ fees and benefits | 3,942 | |||
Accrued other operating expenses | 94,585 | |||
Trustee deferred compensation and retirement plans | 241,957 | |||
Total liabilities | 1,083,432 | |||
Net assets applicable to shares outstanding | $ | 332,017,933 | ||
Net assets consist of: |
| |||
Shares of beneficial interest | $ | 361,222,949 | ||
Undistributed net investment income | 3,558,026 | |||
Undistributed net realized gain (loss) | (62,827,840 | ) | ||
Net unrealized appreciation | 30,064,798 | |||
| $ | 332,017,933 | |||
Net Assets: |
| |||
Class A | $ | 199,635,586 | ||
Class B | $ | 13,288,003 | ||
Class C | $ | 37,335,489 | ||
Class R | $ | 199,932 | ||
Class Y | $ | 4,189,440 | ||
Investor Class | $ | 64,369,353 | ||
Class R5 | $ | 13,000,130 | ||
Shares outstanding, $0.01 par value per share, |
| |||
Class A | 20,005,001 | |||
Class B | 1,349,794 | |||
Class C | 3,800,590 | |||
Class R | 20,132 | |||
Class Y | 418,070 | |||
Investor Class | 6,430,977 | |||
Class R5 | 1,295,635 | |||
Class A: | ||||
Net asset value per share | $ | 9.98 | ||
Maximum offering price per share | ||||
(Net asset value of $9.98 ¸ 94.50%) | $ | 10.56 | ||
Class B: | ||||
Net asset value and offering price per share | $ | 9.84 | ||
Class C: | ||||
Net asset value and offering price per share | $ | 9.82 | ||
Class R: | ||||
Net asset value and offering price per share | $ | 9.93 | ||
Class Y: | ||||
Net asset value and offering price per share | $ | 10.02 | ||
Investor Class: | ||||
Net asset value and offering price per share | $ | 10.01 | ||
Class R5: | ||||
Net asset value and offering price per share | $ | 10.03 | ||
See accompanying Notes to Financial Statements which are an integral part of the financial statements.
12 Invesco Low Volatility Equity Yield Fund
Statement of Operations
For the year ended August 31, 2013
Investment income: |
| |||
Dividends (net of foreign withholding taxes of $7,489) | $ | 8,351,648 | ||
Dividends from affiliated money market funds | 6,162 | |||
Total investment income | 8,357,810 | |||
Expenses: | ||||
Advisory fees | 1,991,383 | |||
Administrative services fees | 107,155 | |||
Custodian fees | 11,423 | |||
Distribution fees: | ||||
Class A | 499,131 | |||
Class B | 151,915 | |||
Class C | 390,540 | |||
Class R | 2,517 | |||
Investor Class | 162,030 | |||
Transfer agent fees — A, B, C, R, Y and Investor | 746,403 | |||
Transfer agent fees — R5 | 6,825 | |||
Trustees’ and officers’ fees and benefits | 33,978 | |||
Other | 201,870 | |||
Total expenses | 4,305,170 | |||
Less: Fees waived and expense offset arrangement(s) | (11,086 | ) | ||
Net expenses | 4,294,084 | |||
Net investment income | 4,063,726 | |||
Realized and unrealized gain from: | ||||
Net realized gain from: | ||||
Investment securities | 78,767,869 | |||
Futures contracts | 1,330,149 | |||
| 80,098,018 | ||||
Change in net unrealized appreciation (depreciation) of: | ||||
Investment securities | (32,699,060 | ) | ||
Futures contracts | (643,052 | ) | ||
| (33,342,112 | ) | |||
Net realized and unrealized gain | 46,755,906 | |||
Net increase in net assets resulting from operations | $ | 50,819,632 | ||
See accompanying Notes to Financial Statements which are an integral part of the financial statements.
13 Invesco Low Volatility Equity Yield Fund
Statement of Changes in Net Assets
For the years ended August 31, 2013 and 2012
| 2013 | 2012 | |||||||
Operations: |
| |||||||
Net investment income | $ | 4,063,726 | $ | 3,268,668 | ||||
Net realized gain | 80,098,018 | 3,600,280 | ||||||
Change in net unrealized appreciation (depreciation) | (33,342,112 | ) | 49,879,997 | |||||
Net increase in net assets resulting from operations | 50,819,632 | 56,748,945 | ||||||
Distributions to shareholders from net investment income: | ||||||||
Class A | (2,404,575 | ) | (930,525 | ) | ||||
Class B | (47,545 | ) | (41,450 | ) | ||||
Class C | (119,396 | ) | (95,868 | ) | ||||
Class R | (8,911 | ) | (5,087 | ) | ||||
Class Y | (68,486 | ) | (21,355 | ) | ||||
Investor Class | (773,952 | ) | (288,346 | ) | ||||
Class R5 | (185,733 | ) | (71,711 | ) | ||||
Total distributions from net investment income | (3,608,598 | ) | (1,454,342 | ) | ||||
Share transactions–net: | ||||||||
Class A | (27,233,949 | ) | (37,945,442 | ) | ||||
Class B | (5,795,678 | ) | (6,796,360 | ) | ||||
Class C | (9,320,625 | ) | (14,199,052 | ) | ||||
Class R | (905,829 | ) | (405,549 | ) | ||||
Class Y | (690,831 | ) | (216,655 | ) | ||||
Investor Class | (8,125,971 | ) | (10,855,010 | ) | ||||
Class R5 | (33,993 | ) | (2,297,972 | ) | ||||
Net increase (decrease) in net assets resulting from share transactions | (52,106,876 | ) | (72,716,040 | ) | ||||
Net increase (decrease) in net assets | (4,895,842 | ) | (17,421,437 | ) | ||||
Net assets: | ||||||||
Beginning of year | 336,913,775 | 354,335,212 | ||||||
End of year (includes undistributed net investment income of $3,558,026 and $3,055,760, respectively) | $ | 332,017,933 | $ | 336,913,775 | ||||
Notes to Financial Statements
August 31, 2013
NOTE 1—Significant Accounting Policies
Invesco Low Volatility Equity Yield Fund, formerly Invesco U.S. Quantitative Core Fund, (the “Fund”) is a series portfolio of AIM Counselor Series Trust (Invesco Counselor Series Trust) (the “Trust”). The Trust is a Delaware statutory trust registered under the Investment Company Act of 1940, as amended (the “1940 Act”), as an open-end series management investment company consisting of twelve separate portfolios, each authorized to issue an unlimited number of shares of beneficial interest. The assets, liabilities and operations of each portfolio are accounted for separately. Information presented in these financial statements pertains only to the Fund. Matters affecting each portfolio or class will be voted on exclusively by the shareholders of such portfolio or class.
The Fund’s investment objective is income and long-term growth of capital.
The Fund currently consists of seven different classes of shares: Class A, Class B, Class C, Class R, Class Y, Investor Class and Class R5. On September 24, 2012, Institutional Class shares were renamed Class R5 shares. Investor Class shares of the Fund are offered only to certain grandfathered investors. Class A shares are sold with a front-end sales charge unless certain waiver criteria are met and under certain circumstances load waived shares may be subject to contingent deferred sales charges (“CDSC”). Class C shares are sold with a CDSC. Class R, Class Y, Investor Class and Class R5 shares are sold at net asset value. Existing shareholders of Class B shares may continue to reinvest dividends and capital gains distributions in Class B shares until they convert to Class A shares. Also, shareholders in Class B shares will be able to exchange those shares for Class B shares of other Invesco Funds offering such shares until they convert to Class A shares. Generally, Class B shares will automatically convert to Class A shares on or about the month-end, which is at least eight years after the date of purchase. Redemption of Class B shares prior to the conversion date will be subject to a CDSC.
The following is a summary of the significant accounting policies followed by the Fund in the preparation of its financial statements.
| A. | Security Valuations — Securities, including restricted securities, are valued according to the following policy. |
A security listed or traded on an exchange (except convertible bonds) is valued at its last sales price or official closing price as of the close of the customary trading session on the exchange where the security is principally traded, or lacking any sales or official closing price on a particular
14 Invesco Low Volatility Equity Yield Fund
day, the security may be valued at the closing bid price on that day. Securities traded in the over-the-counter market are valued based on prices furnished by independent pricing services or market makers. When such securities are valued by an independent pricing service they may be considered fair valued. Futures contracts are valued at the final settlement price set by an exchange on which they are principally traded. Listed options are valued at the mean between the last bid and ask prices from the exchange on which they are principally traded. Options not listed on an exchange are valued by an independent source at the mean between the last bid and ask prices. For purposes of determining net asset value per share, futures and option contracts generally are valued 15 minutes after the close of the customary trading session of the New York Stock Exchange (“NYSE”).
Investments in open-end and closed-end registered investment companies that do not trade on an exchange are valued at the end of day net asset value per share. Investments in open-end and closed-end registered investment companies that trade on an exchange are valued at the last sales price or official closing price as of the close of the customary trading session on the exchange where the security is principally traded.
Debt obligations (including convertible bonds) and unlisted equities are fair valued using an evaluated quote provided by an independent pricing service. Evaluated quotes provided by the pricing service may be determined without exclusive reliance on quoted prices, and may reflect appropriate factors such as institution-size trading in similar groups of securities, developments related to specific securities, dividend rate (for unlisted equities), yield (for debt obligations), quality, type of issue, coupon rate (for debt obligations), maturity (for debt obligations), individual trading characteristics and other market data. Debt obligations are subject to interest rate and credit risks. In addition, all debt obligations involve some risk of default with respect to interest and/or principal payments.
Foreign securities’ (including foreign exchange contracts) prices are converted into U.S. dollar amounts using the applicable exchange rates as of the close of the NYSE. If market quotations are available and reliable for foreign exchange-traded equity securities, the securities will be valued at the market quotations. Because trading hours for certain foreign securities end before the close of the NYSE, closing market quotations may become unreliable. If between the time trading ends on a particular security and the close of the customary trading session on the NYSE, events occur that the Adviser determines are significant and make the closing price unreliable, the Fund may fair value the security. If the event is likely to have affected the closing price of the security, the security will be valued at fair value in good faith using procedures approved by the Board of Trustees. Adjustments to closing prices to reflect fair value may also be based on a screening process of an independent pricing service to indicate the degree of certainty, based on historical data, that the closing price in the principal market where a foreign security trades is not the current value as of the close of the NYSE. Foreign securities’ prices meeting the approved degree of certainty that the price is not reflective of current value will be priced at the indication of fair value from the independent pricing service. Multiple factors may be considered by the independent pricing service in determining adjustments to reflect fair value and may include information relating to sector indices, American Depositary Receipts and domestic and foreign index futures. Foreign securities may have additional risks including exchange rate changes, potential for sharply devalued currencies and high inflation, political and economic upheaval, the relative lack of issuer information, relatively low market liquidity and the potential lack of strict financial and accounting controls and standards.
Securities for which market prices are not provided by any of the above methods may be valued based upon quotes furnished by independent sources. The last bid price may be used to value equity securities. The mean between the last bid and asked prices is used to value debt obligations, including corporate loans.
Securities for which market quotations are not readily available or became unreliable are valued at fair value as determined in good faith by or under the supervision of the Trust’s officers following procedures approved by the Board of Trustees. Issuer specific events, market trends, bid/ask quotes of brokers and information providers and other market data may be reviewed in the course of making a good faith determination of a security’s fair value.
Valuations change in response to many factors including the historical and prospective earnings of the issuer, the value of the issuer’s assets, general economic conditions, interest rates, investor perceptions and market liquidity. Because of the inherent uncertainties of valuation, the values reflected in the financial statements may materially differ from the value received upon actual sale of those investments.
| B. | Securities Transactions and Investment Income — Securities transactions are accounted for on a trade date basis. Realized gains or losses on sales are computed on the basis of specific identification of the securities sold. Interest income is recorded on the accrual basis from settlement date. Dividend income (net of withholding tax, if any) is recorded on the ex-dividend date. Bond premiums and discounts are amortized and/or accreted for financial reporting purposes. |
The Fund may periodically participate in litigation related to Fund investments. As such, the Fund may receive proceeds from litigation settlements. Any proceeds received are included in the Statement of Operations as realized gain (loss) for investments no longer held and as unrealized gain (loss) for investments still held.
Brokerage commissions and mark ups are considered transaction costs and are recorded as an increase to the cost basis of securities purchased and/or a reduction of proceeds on a sale of securities. Such transaction costs are included in the determination of net realized and unrealized gain (loss) from investment securities reported in the Statement of Operations and the Statement of Changes in Net Assets and the net realized and unrealized gains (losses) on securities per share in the Financial Highlights. Transaction costs are included in the calculation of the Fund’s net asset value and, accordingly, they reduce the Fund’s total returns. These transaction costs are not considered operating expenses and are not reflected in net investment income reported in the Statement of Operations and Statement of Changes in Net Assets, or the net investment income per share and ratios of expenses and net investment income reported in the Financial Highlights, nor are they limited by any expense limitation arrangements between the Fund and the investment adviser.
The Fund allocates income and realized and unrealized capital gains and losses to a class based on the relative net assets of each class.
| C. | Country Determination — For the purposes of making investment selection decisions and presentation in the Schedule of Investments, the investment adviser may determine the country in which an issuer is located and/or credit risk exposure based on various factors. These factors include the laws of the country under which the issuer is organized, where the issuer maintains a principal office, the country in which the issuer derives 50% or more of its total revenues and the country that has the primary market for the issuer’s securities, as well as other criteria. Among the other criteria that may be evaluated for making this determination are the country in which the issuer maintains 50% or more of its assets, the type of security, financial guarantees and enhancements, the nature of the collateral and the sponsor organization. Country of issuer and/or credit risk exposure has been determined to be the United States of America, unless otherwise noted. |
15 Invesco Low Volatility Equity Yield Fund
| D. | Distributions — Distributions from income and net realized capital gain, if any, are generally declared and paid annually and recorded on the ex-dividend date. The Fund may elect to treat a portion of the proceeds from redemptions as distributions for federal income tax purposes. |
| E. | Federal Income Taxes — The Fund intends to comply with the requirements of Subchapter M of the Internal Revenue Code of 1986, as amended (the “Internal Revenue Code”), necessary to qualify as a regulated investment company and to distribute substantially all of the Fund’s taxable earnings to shareholders. As such, the Fund will not be subject to federal income taxes on otherwise taxable income (including net realized capital gain) that is distributed to shareholders. Therefore, no provision for federal income taxes is recorded in the financial statements. |
The Fund files tax returns in the U.S. Federal jurisdiction and certain other jurisdictions. Generally, the Fund is subject to examinations by such taxing authorities for up to three years after the filing of the return for the tax period.
| F. | Expenses — Fees provided for under the Rule 12b-1 plan of a particular class of the Fund are charged to the operations of such class. Transfer agency fees and expenses and other shareholder recordkeeping fees and expenses attributable to Class R5 are charged to such class. Transfer agency fees and expenses and other shareholder recordkeeping fees and expenses relating to all other classes are allocated among those classes based on relative net assets. All other expenses are allocated among the classes based on relative net assets. |
| G. | Accounting Estimates — The preparation of financial statements in conformity with accounting principles generally accepted in the United States of America (“GAAP”) requires management to make estimates and assumptions that affect the reported amounts of assets and liabilities at the date of the financial statements and the reported amounts of revenues and expenses during the reporting period including estimates and assumptions related to taxation. Actual results could differ from those estimates by a significant amount. In addition, the Fund monitors for material events or transactions that may occur or become known after the period-end date and before the date the financial statements are released to print. |
| H. | Indemnifications — Under the Trust’s organizational documents, each Trustee, officer, employee or other agent of the Trust is indemnified against certain liabilities that may arise out of the performance of their duties to the Fund. Additionally, in the normal course of business, the Fund enters into contracts, including the Fund’s servicing agreements, that contain a variety of indemnification clauses. The Fund’s maximum exposure under these arrangements is unknown as this would involve future claims that may be made against the Fund that have not yet occurred. The risk of material loss as a result of such indemnification claims is considered remote. |
| I. | Futures Contracts — The Fund may enter into futures contracts to manage exposure to interest rate, equity and market price movements and/or currency risks. A futures contract is an agreement between two parties to purchase or sell a specified underlying security, currency or commodity (or delivery of a cash settlement price, in the case of an index future) for a fixed price at a future date. The Fund currently invests only in exchange-traded futures and they are standardized as to maturity date and underlying financial instrument. Initial margin deposits required upon entering into futures contracts are satisfied by the segregation of specific securities or cash as collateral at the futures commission merchant (broker). During the period the futures contracts are open, changes in the value of the contracts are recognized as unrealized gains or losses by recalculating the value of the contracts on a daily basis. Subsequent or variation margin payments are received or made depending upon whether unrealized gains or losses are incurred. These amounts are reflected as receivables or payables on the Statement of Assets and Liabilities. When the contracts are closed or expire, the Fund recognizes a realized gain or loss equal to the difference between the proceeds from, or cost of, the closing transaction and the Fund’s basis in the contract. The net realized gain (loss) and the change in unrealized gain (loss) on futures contracts held during the period is included on the Statement of Operations. The primary risks associated with futures contracts are market risk and the absence of a liquid secondary market. If the Fund were unable to liquidate a futures contract and/or enter into an offsetting closing transaction, the Fund would continue to be subject to market risk with respect to the value of the contracts and continue to be required to maintain the margin deposits on the futures contracts. Futures contracts have minimal counterparty risk since the exchange’s clearinghouse, as counterparty to all exchange-traded futures, guarantees the futures against default. Risks may exceed amounts recognized in the Statement of Assets and Liabilities. |
| J. | Collateral — To the extent the Fund has designated or segregated a security as collateral and that security is subsequently sold, it is the Fund’s practice to replace such collateral no later than the next business day. |
NOTE 2—Advisory Fees and Other Fees Paid to Affiliates
The Trust has entered into a master investment advisory agreement with Invesco Advisers, Inc. (the “Adviser” or “Invesco”). Under the terms of the investment advisory agreement, the Fund pays an advisory fee to the Adviser based on the annual rate of the Fund’s average daily net assets as follows:
| Average Daily Net Assets | Rate | |||||
First $250 million | 0 | .60% | ||||
Next $250 million | 0 | .575% | ||||
Next $500 million | 0 | .55% | ||||
Next $1.5 billion | 0 | .525% | ||||
Next $2.5 billion | 0 | .50% | ||||
Next $2.5 billion | 0 | .475% | ||||
Next $2.5 billion | 0 | .45% | ||||
Over $10 billion | 0 | .425% | ||||
Under the terms of a master sub-advisory agreement between the Adviser and each of Invesco Asset Management Deutschland GmbH, Invesco Asset Management Limited, Invesco Asset Management (Japan) Limited, Invesco Australia Limited, Invesco Hong Kong Limited, Invesco Senior Secured Management, Inc. and Invesco Canada Ltd. (collectively, the “Affiliated Sub-Advisers”) the Adviser, not the Fund, may pay 40% of the fees paid to the Adviser to any such Affiliated Sub-Adviser(s) that provide(s) discretionary investment management services to the Fund based on the percentage of assets allocated to such Sub-Adviser(s).
The Adviser has contractually agreed, through at least June 30, 2014, to waive advisory fees and/or reimburse expenses to the extent necessary to limit total annual fund operating expenses after fee waiver and/or reimbursement (excluding certain items discussed below) of Class A, Class B,
16 Invesco Low Volatility Equity Yield Fund
Class C, Class R, Class Y, Investor Class and Class R5 shares to 2.00%, 2.75%, 2.75%, 2.25%, 1.75%, 2.00% and 1.75% of average daily net assets, respectively. In determining the Adviser’s obligation to waive advisory fees and/or reimburse expenses, the following expenses are not taken into account, and could cause the total annual fund operating expenses after fee waiver and/or reimbursement to exceed the numbers reflected above: (1) interest; (2) taxes; (3) dividend expense on short sales; (4) extraordinary or non-routine items, including litigation expenses; and (5) expenses that the Fund has incurred but did not actually pay because of an expense offset arrangement. Unless the Board of Trustees and Invesco mutually agree to amend or continue the fee waiver agreement, it will terminate on June 30, 2014. The Adviser did not waive fees and/or reimburse expenses during the period under this expense limitation.
Further, the Adviser has contractually agreed, through at least June 30, 2014, to waive the advisory fee payable by the Fund in an amount equal to 100% of the net advisory fees the Adviser receives from the affiliated money market funds on investments by the Fund of uninvested cash in such affiliated money market funds.
For the year ended August 31, 2013, the Adviser waived advisory fees of $8,740.
The Trust has entered into a master administrative services agreement with Invesco pursuant to which the Fund has agreed to pay Invesco for certain administrative costs incurred in providing accounting services to the Fund. For the year ended August 31, 2013, expenses incurred under the agreement are shown in the Statement of Operations as Administrative services fees.
The Trust has entered into a transfer agency and service agreement with Invesco Investment Services, Inc. (“IIS”) pursuant to which the Fund has agreed to pay IIS a fee for providing transfer agency and shareholder services to the Fund and reimburse IIS for certain expenses incurred by IIS in the course of providing such services. IIS may make payments to intermediaries that provide omnibus account services, sub-accounting services and/or networking services. All fees payable by IIS to intermediaries that provide omnibus account services or sub-accounting are charged back to the Fund, subject to certain limitations approved by the Trust’s Board of Trustees. For the year ended August 31, 2013, expenses incurred under the agreement are shown in the Statement of Operations as Transfer agent fees.
The Trust has entered into master distribution agreements with Invesco Distributors, Inc. (“IDI”) to serve as the distributor for the Class A, Class B, Class C, Class R, Class Y, Investor Class and Class R5 shares of the Fund. The Trust has adopted plans pursuant to Rule 12b-1 under the 1940 Act with respect to the Fund’s Class A, Class B, Class C, Class R and Investor Class shares (collectively, the “Plans”). The Fund, pursuant to the Plans, pays IDI compensation at the annual rate of 0.25% of the Fund’s average daily net assets of Class A shares, 1.00% of the average daily net assets of Class B and Class C shares, 0.50% of the average daily net assets of Class R shares and 0.25% of the average daily net assets of Investor Class shares. Of the Plan payments, up to 0.25% of the average daily net assets of each class of shares may be paid to furnish continuing personal shareholder services to customers who purchase and own shares of such classes. Any amounts not paid as a service fee under the Plans would constitute an asset-based sales charge. Rules of the Financial Industry Regulatory Authority (“FINRA”) impose a cap on the total sales charges, including asset-based sales charges, that may be paid by any class of shares of the Fund. For the year ended August 31, 2013, expenses incurred under the Plans are shown in the Statement of Operations as Distribution fees.
Front-end sales commissions and CDSC (collectively, the “sales charges”) are not recorded as expenses of the Fund. Front-end sales commissions are deducted from proceeds from the sales of Fund shares prior to investment in Class A shares of the Fund. CDSC are deducted from redemption proceeds prior to remittance to the shareholder. During the year ended August 31, 2013, IDI advised the Fund that IDI retained $11,188 in front-end sales commissions from the sale of Class A shares and $16,443 and $607 from Class B and Class C shares, respectively, for CDSC imposed on redemptions by shareholders.
Certain officers and trustees of the Trust are officers and directors of the Adviser, IIS and/or IDI.
NOTE 3—Additional Valuation Information
GAAP defines fair value as the price that would be received to sell an asset or paid to transfer a liability in an orderly transaction between market participants at the measurement date, under current market conditions. GAAP establishes a hierarchy that prioritizes the inputs to valuation methods, giving the highest priority to readily available unadjusted quoted prices in an active market for identical assets (Level 1) and the lowest priority to significant unobservable inputs (Level 3), generally when market prices are not readily available or are unreliable. Based on the valuation inputs, the securities or other investments are tiered into one of three levels. Changes in valuation methods may result in transfers in or out of an investment’s assigned level:
| Level 1 — | Prices are determined using quoted prices in an active market for identical assets. |
| Level 2 — | Prices are determined using other significant observable inputs. Observable inputs are inputs that other market participants may use in pricing a security. These may include quoted prices for similar securities, interest rates, prepayment speeds, credit risk, yield curves, loss severities, default rates, discount rates, volatilities and others. |
| Level 3 — | Prices are determined using significant unobservable inputs. In situations where quoted prices or observable inputs are unavailable (for example, when there is little or no market activity for an investment at the end of the period), unobservable inputs may be used. Unobservable inputs reflect the Fund’s own assumptions about the factors market participants would use in determining fair value of the securities or instruments and would be based on the best available information. |
The following is a summary of the tiered valuation input levels, as of August 31, 2013. The level assigned to the securities valuations may not be an indication of the risk or liquidity associated with investing in those securities. Because of the inherent uncertainties of valuation, the values reflected in the financial statements may materially differ from the value received upon actual sale of those investments.
| Level 1 | Level 2 | Level 3 | Total | |||||||||||||
Equity Securities | $ | 330,911,660 | $ | — | $ | — | $ | 330,911,660 | ||||||||
U.S. Treasury Securities | — | 750,000 | — | 750,000 | ||||||||||||
| $ | 330,911,660 | $ | 750,000 | $ | — | $ | 331,661,660 | |||||||||
Futures* | (157,756 | ) | — | — | (157,756 | ) | ||||||||||
Total Investments | $ | 330,753,904 | $ | 750,000 | $ | — | $ | 331,503,904 | ||||||||
| * | Unrealized appreciation (depreciation). |
17 Invesco Low Volatility Equity Yield Fund
NOTE 4—Derivative Investments
Value of Derivative Investments at Period-End
The table below summarizes the value of the Fund’s derivative investments, detailed by primary risk exposure, held as of August 31, 2013:
| Value | ||||||||
| Risk Exposure/Derivative Type | Assets | Liabilities | ||||||
Market risk | ||||||||
Futures contracts(a) | $ | — | $ | (157,756 | ) | |||
| (a) | Includes cumulative appreciation (depreciation) of futures contracts. Only current day’s variation margin receivable (payable) is reported within the Statement of Assets and Liabilities. |
Effect of Derivative Investments for the year ended August 31, 2013
The table below summarizes the gains (losses) on derivative investments, detailed by primary risk exposure, recognized in earnings during the period:
| Location of Gain (Loss) on Statement of Operations | ||||
| Futures* | ||||
Realized Gain | ||||
Market risk | $ | 1,330,149 | ||
Change in Unrealized Appreciation (Depreciation) | ||||
Market risk | (643,052 | ) | ||
Total | $ | 687,097 | ||
| * | The average notional value of futures contracts outstanding during the period was $7,357,005. |
| Open Futures Contracts | ||||||||||||||||
| Long Contracts | Number of Contracts | Expiration Month | Notional Value | Unrealized Appreciation (Depreciation) | ||||||||||||
E- Mini S&P 500 Index | 88 | September-2013 | $ | 7,177,720 | $ | (157,756 | ) | |||||||||
NOTE 5—Expense Offset Arrangement(s)
The expense offset arrangement is comprised of transfer agency credits which result from balances in Demand Deposit Accounts (DDA) used by the transfer agent for clearing shareholder transactions. For the year ended August 31, 2013, the Fund received credits from this arrangement, which resulted in the reduction of the Fund’s total expenses of $2,346.
NOTE 6—Trustees’ and Officers’ Fees and Benefits
“Trustees’ and Officers’ Fees and Benefits” include amounts accrued by the Fund to pay remuneration to certain Trustees and Officers of the Fund. Trustees have the option to defer compensation payable by the Fund, and “Trustees’ and Officers’ Fees and Benefits” also include amounts accrued by the Fund to fund such deferred compensation amounts. Those Trustees who defer compensation have the option to select various Invesco Funds in which their deferral accounts shall be deemed to be invested. Finally, certain current Trustees are eligible to participate in a retirement plan that provides for benefits to be paid upon retirement to Trustees over a period of time based on the number of years of service. The Fund may have certain former Trustees who also participate in a retirement plan and receive benefits under such plan. “Trustees’ and Officers’ Fees and Benefits” include amounts accrued by the Fund to fund such retirement benefits. Obligations under the deferred compensation and retirement plans represent unsecured claims against the general assets of the Fund.
NOTE 7—Cash Balances
The Fund is permitted to temporarily carry a negative or overdrawn balance in its account with State Street Bank and Trust Company, the custodian bank. Such balances, if any at period end, are shown in the Statement of Assets and Liabilities under the payable caption Amount due custodian. To compensate the custodian bank for such overdrafts, the overdrawn Fund may either (1) leave funds as a compensating balance in the account so the custodian bank can be compensated by earning the additional interest; or (2) compensate by paying the custodian bank at a rate agreed upon by the custodian bank and Invesco, not to exceed the contractually agreed upon rate.
18 Invesco Low Volatility Equity Yield Fund
NOTE 8—Distributions to Shareholders and Tax Components of Net Assets
Tax Character of Distributions to Shareholders Paid During the Years Ended August 31, 2013 and 2012:
| 2013 | 2012 | |||||||
Ordinary income | $ | 3,608,598 | $ | 1,454,342 | ||||
Tax Components of Net Assets at Period-End:
| 2013 | ||||
Undistributed ordinary income | $ | 3,781,176 | ||
Undistributed long-term gain | 5,332,154 | |||
Net unrealized appreciation — investments | 29,316,432 | |||
Temporary book/tax differences | (223,170 | ) | ||
Capital loss carryforward | (67,411,608 | ) | ||
Shares of beneficial interest | 361,222,949 | |||
Total net assets | $ | 332,017,933 | ||
The difference between book-basis and tax-basis unrealized appreciation (depreciation) is due to differences in the timing of recognition of gains and losses on investments for tax and book purposes. The Fund’s net unrealized appreciation difference is attributable primarily to wash sales.
The temporary book/tax differences are a result of timing differences between book and tax recognition of income and/or expenses. The Fund’s temporary book/tax differences are the result of the trustee deferral of compensation and retirement plan benefits.
Capital loss carryforward is calculated and reported as of a specific date. Results of transactions and other activity after that date may affect the amount of capital loss carryforward actually available for the Fund to utilize. The Regulated Investment Company Modernization Act of 2010 eliminated the eight-year carryover period for capital losses that arise in taxable years beginning after its enactment date of December 22, 2010. Consequently, these capital losses can be carried forward for an unlimited period. However, capital losses with an expiration period may not be used to offset capital gains until all net capital losses without an expiration date have been utilized. Additionally, post-enactment capital loss carryovers will retain their character as either short-term or long-term capital losses instead of as short-term capital losses as under prior law. The ability to utilize capital loss carryforward in the future may be limited under the Internal Revenue Code and related regulations based on the results of future transactions.
The Fund utilized $70,759,225 of capital loss carryforward in the current period to offset net realized capital gain for federal income tax purposes. The Fund has a capital loss carryforward as of August 31, 2013, which expires as follows:
| Capital Loss Carryforward* | ||||||||||||
| Expiration | Short-Term | Long-Term | Total | |||||||||
August 31, 2016 | $ | 33,513,732 | $ | — | $ | 33,513,732 | ||||||
August 31, 2018 | 33,897,876 | — | 33,897,876 | |||||||||
| $ | 67,411,608 | $ | — | $ | 67,411,608 | |||||||
| * | Capital loss carryforward as of the date listed above is reduced for limitations, if any, to the extent required by the Internal Revenue Code. To the extent that unrealized gains as of May 23, 2011, the date of reorganization of Invesco Select Equity Fund and Invesco Van Kampen Premium Income Fund into the Fund, are realized on securities held in each fund at such date of reorganization, the capital loss carryforward may be further limited for up to five years from the date of the reorganization. |
NOTE 9—Investment Securities
The aggregate amount of investment securities (other than short-term securities, U.S. Treasury obligations and money market funds, if any) purchased and sold by the Fund during the year ended August 31, 2013 was $347,904,198 and $399,668,058, respectively. Cost of investments on a tax basis includes the adjustments for financial reporting purposes as of the most recently completed federal income tax reporting period-end.
| Unrealized Appreciation (Depreciation) of Investment Securities on a Tax Basis | ||||
Aggregate unrealized appreciation of investment securities | $ | 37,726,922 | ||
Aggregate unrealized (depreciation) of investment securities | (8,410,490 | ) | ||
Net unrealized appreciation of investment securities | $ | 29,316,432 | ||
Cost of investments for tax purposes is $302,345,228.
NOTE 10—Reclassification of Permanent Differences
Primarily as a result of differing book/tax treatment of litigation and capital loss carryforward, on August 31, 2013, undistributed net investment income was increased by $47,138, undistributed net realized gain (loss) was increased by $952,330 and shares of beneficial interest was decreased by $999,468. This reclassification had no effect on the net assets of the Fund.
19 Invesco Low Volatility Equity Yield Fund
NOTE 11—Share Information
| Summary of Share Activity | ||||||||||||||||
| Years ended August 31, | ||||||||||||||||
| 2013(a) | 2012 | |||||||||||||||
| Shares | Amount | Shares | Amount | |||||||||||||
Sold: | ||||||||||||||||
Class A | 791,263 | $ | 7,509,498 | 1,233,552 | $ | 9,581,190 | ||||||||||
Class B | 27,394 | 256,786 | 52,399 | 404,485 | ||||||||||||
Class C | 224,308 | 2,102,551 | 262,766 | 2,049,034 | ||||||||||||
Class R | 47,129 | 407,001 | 10,411 | 82,193 | ||||||||||||
Class Y | 124,611 | 1,160,536 | 105,238 | 852,079 | ||||||||||||
Investor Class | 598,412 | 5,620,041 | 887,672 | 7,116,364 | ||||||||||||
Class R5 | 251,033 | 2,499,070 | 126,149 | 971,236 | ||||||||||||
Issued as reinvestment of dividends: | ||||||||||||||||
Class A | 248,581 | 2,142,768 | 110,291 | 819,460 | ||||||||||||
Class B | 4,655 | 39,806 | 4,705 | 34,581 | ||||||||||||
Class C | 10,631 | 90,790 | 9,743 | 71,514 | ||||||||||||
Class R | 1,023 | 8,795 | 494 | 3,648 | ||||||||||||
Class Y | 6,167 | 53,284 | 2,083 | 15,520 | ||||||||||||
Investor Class | 87,128 | 753,658 | 37,687 | 280,770 | ||||||||||||
Class R5 | 21,468 | 185,483 | 9,615 | 71,634 | ||||||||||||
Automatic conversion of Class B shares to Class A shares: | ||||||||||||||||
Class A | 218,167 | 2,029,866 | 344,576 | 2,719,115 | ||||||||||||
Class B | (220,775 | ) | (2,029,866 | ) | (348,922 | ) | (2,719,115 | ) | ||||||||
Reacquired: | ||||||||||||||||
Class A | (4,206,505 | ) | (38,916,081 | ) | (6,568,951 | ) | (51,065,207 | ) | ||||||||
Class B | (444,734 | ) | (4,062,404 | ) | (582,251 | ) | (4,516,311 | ) | ||||||||
Class C | (1,269,208 | ) | (11,513,966 | ) | (2,142,291 | ) | (16,319,600 | ) | ||||||||
Class R | (151,067 | ) | (1,321,625 | ) | (65,832 | ) | (491,390 | ) | ||||||||
Class Y | (203,050 | ) | (1,904,651 | ) | (138,938 | ) | (1,084,254 | ) | ||||||||
Investor Class | (1,540,011 | ) | (14,499,670 | ) | (2,317,894 | ) | (18,252,144 | ) | ||||||||
Class R5 | (285,481 | ) | (2,718,546 | ) | (407,522 | ) | (3,340,842 | ) | ||||||||
Net increase (decrease) in share activity | (5,658,861 | ) | $ | (52,106,876 | ) | (9,375,220 | ) | $ | (72,716,040 | ) | ||||||
| (a) | There are entities that are record owners of more than 5% of the outstanding shares of the Fund and in the aggregate own 18% of the outstanding shares of the Fund. IDI has an agreement with these entities to sell Fund shares. The Fund, Invesco and/or Invesco affiliates may make payments to these entities, which are considered to be related to the Fund, for providing services to the Fund, Invesco and/or Invesco affiliates including but not limited to services such as securities brokerage, distribution, third party record keeping and account servicing. The Fund has no knowledge as to whether all or any portion of the shares owned of record by these entities are also owned beneficially. |
20 Invesco Low Volatility Equity Yield Fund
NOTE 12—Financial Highlights
The following schedule presents financial highlights for a share of the Fund outstanding throughout the periods indicated.
| Net asset value, beginning of period | Net investment income(a) | Net gains (losses) on securities (both realized and unrealized) | Total from investment operations | Dividends from net investment income | Distributions from net realized gains | Total distributions | Net asset value, end of period | Total return(b) | Net assets, end of period (000’s omitted) | Ratio of expenses to average net assets with fee waivers and/or expenses absorbed | Ratio of expenses to average net assets without fee waivers and/or expenses absorbed | Ratio of net investment income to average net assets | Portfolio turnover(c) | |||||||||||||||||||||||||||||||||||||||||||
Class A | ||||||||||||||||||||||||||||||||||||||||||||||||||||||||
Year ended 08/31/13 | $ | 8.66 | $ | 0.12 | $ | 1.31 | $ | 1.43 | $ | (0.11 | ) | $ | — | $ | (0.11 | ) | $ | 9.98 | 16.71 | % | $ | 199,636 | 1.18 | %(d) | 1.18 | %(d) | 1.31 | %(d) | 107 | % | ||||||||||||||||||||||||||
Year ended 08/31/12 | 7.34 | 0.09 | 1.27 | 1.36 | (0.04 | ) | — | (0.04 | ) | 8.66 | 18.54 | 198,831 | 1.03 | 1.23 | 1.10 | 45 | ||||||||||||||||||||||||||||||||||||||||
Year ended 08/31/11 | 6.29 | 0.07 | 1.06 | 1.13 | (0.08 | ) | — | (0.08 | ) | 7.34 | 18.00 | 204,311 | 1.00 | 1.22 | 0.90 | 125 | ||||||||||||||||||||||||||||||||||||||||
Year ended 08/31/10 | 6.47 | 0.06 | (0.12 | ) | (0.06 | ) | (0.12 | ) | — | (0.12 | ) | 6.29 | (1.07 | ) | 1,265 | 1.00 | 1.31 | 0.93 | 71 | |||||||||||||||||||||||||||||||||||||
Year ended 08/31/09 | 9.89 | 0.11 | (2.16 | ) | (2.05 | ) | (0.07 | ) | (1.30 | ) | (1.37 | ) | 6.47 | (18.66 | ) | 1,618 | 0.66 | 1.29 | 1.85 | 77 | ||||||||||||||||||||||||||||||||||||
Class B | ||||||||||||||||||||||||||||||||||||||||||||||||||||||||
Year ended 08/31/13 | 8.53 | 0.05 | 1.29 | 1.34 | (0.03 | ) | — | (0.03 | ) | 9.84 | 15.72 | 13,288 | 1.93 | (d) | 1.93 | (d) | 0.56 | (d) | 107 | |||||||||||||||||||||||||||||||||||||
Year ended 08/31/12 | 7.26 | 0.03 | 1.26 | 1.29 | (0.02 | ) | — | (0.02 | ) | 8.53 | 17.75 | 16,913 | 1.78 | 1.98 | 0.35 | 45 | ||||||||||||||||||||||||||||||||||||||||
Year ended 08/31/11 | 6.22 | 0.01 | 1.06 | 1.07 | (0.03 | ) | — | (0.03 | ) | 7.26 | 17.15 | 20,750 | 1.75 | 1.97 | 0.15 | 125 | ||||||||||||||||||||||||||||||||||||||||
Year ended 08/31/10 | 6.37 | 0.01 | (0.13 | ) | (0.12 | ) | (0.03 | ) | — | (0.03 | ) | 6.22 | (1.85 | ) | 173 | 1.75 | 2.06 | 0.18 | 71 | |||||||||||||||||||||||||||||||||||||
Year ended 08/31/09 | 9.79 | 0.06 | (2.13 | ) | (2.07 | ) | (0.05 | ) | (1.30 | ) | (1.35 | ) | 6.37 | (19.10 | ) | 211 | 1.41 | 2.04 | 1.10 | 77 | ||||||||||||||||||||||||||||||||||||
Class C | ||||||||||||||||||||||||||||||||||||||||||||||||||||||||
Year ended 08/31/13 | 8.51 | 0.05 | 1.29 | 1.34 | (0.03 | ) | — | (0.03 | ) | 9.82 | 15.75 | 37,335 | 1.93 | (d) | 1.93 | (d) | 0.56 | (d) | 107 | |||||||||||||||||||||||||||||||||||||
Year ended 08/31/12 | 7.25 | 0.03 | 1.25 | 1.28 | (0.02 | ) | — | (0.02 | ) | 8.51 | 17.64 | 41,148 | 1.78 | 1.98 | 0.35 | 45 | ||||||||||||||||||||||||||||||||||||||||
Year ended 08/31/11 | 6.22 | 0.01 | 1.05 | 1.06 | (0.03 | ) | — | (0.03 | ) | 7.25 | 16.99 | 48,592 | 1.75 | 1.97 | 0.15 | 125 | ||||||||||||||||||||||||||||||||||||||||
Year ended 08/31/10 | 6.37 | 0.01 | (0.13 | ) | (0.12 | ) | (0.03 | ) | — | (0.03 | ) | 6.22 | (1.85 | ) | 219 | 1.75 | 2.06 | 0.18 | 71 | |||||||||||||||||||||||||||||||||||||
Year ended 08/31/09 | 9.79 | 0.06 | (2.13 | ) | (2.07 | ) | (0.05 | ) | (1.30 | ) | (1.35 | ) | 6.37 | (19.10 | ) | 254 | 1.41 | 2.04 | 1.10 | 77 | ||||||||||||||||||||||||||||||||||||
Class R | ||||||||||||||||||||||||||||||||||||||||||||||||||||||||
Year ended 08/31/13 | 8.61 | 0.10 | 1.30 | 1.40 | (0.08 | ) | — | (0.08 | ) | 9.93 | 16.37 | 200 | 1.43 | (d) | 1.43 | (d) | 1.06 | (d) | 107 | |||||||||||||||||||||||||||||||||||||
Year ended 08/31/12 | 7.31 | 0.07 | 1.26 | 1.33 | (0.03 | ) | — | (0.03 | ) | 8.61 | 18.24 | 1,059 | 1.28 | 1.48 | 0.85 | 45 | ||||||||||||||||||||||||||||||||||||||||
Year ended 08/31/11 | 6.27 | 0.05 | 1.06 | 1.11 | (0.07 | ) | — | (0.07 | ) | 7.31 | 17.68 | 1,300 | 1.25 | 1.47 | 0.65 | 125 | ||||||||||||||||||||||||||||||||||||||||
Year ended 08/31/10 | 6.45 | 0.05 | (0.12 | ) | (0.07 | ) | (0.11 | ) | — | (0.11 | ) | 6.27 | (1.30 | ) | 1,335 | 1.25 | 1.56 | 0.68 | 71 | |||||||||||||||||||||||||||||||||||||
Year ended 08/31/09 | 9.86 | 0.10 | (2.15 | ) | (2.05 | ) | (0.06 | ) | (1.30 | ) | (1.36 | ) | 6.45 | (18.70 | ) | 77 | 0.91 | 1.54 | 1.60 | 77 | ||||||||||||||||||||||||||||||||||||
Class Y | ||||||||||||||||||||||||||||||||||||||||||||||||||||||||
Year ended 08/31/13 | 8.71 | 0.15 | 1.30 | 1.45 | (0.14 | ) | — | (0.14 | ) | 10.02 | 16.90 | 4,189 | 0.93 | (d) | 0.93 | (d) | 1.56 | (d) | 107 | |||||||||||||||||||||||||||||||||||||
Year ended 08/31/12 | 7.37 | 0.11 | 1.27 | 1.38 | (0.04 | ) | — | (0.04 | ) | 8.71 | 18.89 | 4,269 | 0.78 | 0.98 | 1.35 | 45 | ||||||||||||||||||||||||||||||||||||||||
Year ended 08/31/11 | 6.32 | 0.09 | 1.06 | 1.15 | (0.10 | ) | — | (0.10 | ) | 7.37 | 18.24 | 3,846 | 0.75 | 0.97 | 1.15 | 125 | ||||||||||||||||||||||||||||||||||||||||
Year ended 08/31/10 | 6.50 | 0.08 | (0.13 | ) | (0.05 | ) | (0.13 | ) | — | (0.13 | ) | 6.32 | (0.85 | ) | 142 | 0.75 | 1.06 | 1.18 | 71 | |||||||||||||||||||||||||||||||||||||
Year ended 08/31/09(e) | 8.29 | 0.12 | (0.54 | ) | (0.42 | ) | (0.07 | ) | (1.30 | ) | (1.37 | ) | 6.50 | (2.50 | ) | 211 | 0.43 | (f) | 1.07 | (f) | 2.08 | (f) | 77 | |||||||||||||||||||||||||||||||||
Investor Class | ||||||||||||||||||||||||||||||||||||||||||||||||||||||||
Year ended 08/31/13 | 8.69 | 0.12 | 1.31 | 1.43 | (0.11 | ) | — | (0.11 | ) | 10.01 | 16.65 | 64,369 | 1.18 | (d) | 1.18 | (d) | 1.31 | (d) | 107 | |||||||||||||||||||||||||||||||||||||
Year ended 08/31/12 | 7.36 | 0.09 | 1.28 | 1.37 | (0.04 | ) | — | (0.04 | ) | 8.69 | 18.63 | 63,296 | 1.03 | 1.23 | 1.10 | 45 | ||||||||||||||||||||||||||||||||||||||||
Year ended 08/31/11 | 6.32 | 0.07 | 1.05 | 1.12 | (0.08 | ) | — | (0.08 | ) | 7.36 | 17.76 | 63,890 | 1.00 | 1.22 | 0.90 | 125 | ||||||||||||||||||||||||||||||||||||||||
Year ended 08/31/10 | 6.50 | 0.06 | (0.12 | ) | (0.06 | ) | (0.12 | ) | — | (0.12 | ) | 6.32 | (1.07 | ) | 69,635 | 1.00 | 1.31 | 0.93 | 71 | |||||||||||||||||||||||||||||||||||||
Year ended 08/31/09 | 9.90 | 0.12 | (2.15 | ) | (2.03 | ) | (0.07 | ) | (1.30 | ) | (1.37 | ) | 6.50 | (18.43 | ) | 88,674 | 0.66 | 1.29 | 1.85 | 77 | ||||||||||||||||||||||||||||||||||||
Class R5 | ||||||||||||||||||||||||||||||||||||||||||||||||||||||||
Year ended 08/31/13 | 8.71 | 0.16 | 1.31 | 1.47 | (0.15 | ) | — | (0.15 | ) | 10.03 | 17.12 | 13,000 | 0.76 | (d) | 0.76 | (d) | 1.73 | (d) | 107 | |||||||||||||||||||||||||||||||||||||
Year ended 08/31/12 | 7.37 | 0.11 | 1.28 | 1.39 | (0.05 | ) | — | (0.05 | ) | 8.71 | 18.90 | 11,397 | 0.76 | 0.77 | 1.37 | 45 | ||||||||||||||||||||||||||||||||||||||||
Year ended 08/31/11 | 6.32 | 0.09 | 1.06 | 1.15 | (0.10 | ) | — | (0.10 | ) | 7.37 | 18.24 | 11,645 | 0.74 | 0.77 | 1.18 | 125 | ||||||||||||||||||||||||||||||||||||||||
Year ended 08/31/10 | 6.50 | 0.08 | (0.12 | ) | (0.04 | ) | (0.14 | ) | — | (0.14 | ) | 6.32 | (0.83 | ) | 11,793 | 0.75 | 0.91 | 1.18 | 71 | |||||||||||||||||||||||||||||||||||||
Year ended 08/31/09 | 9.91 | 0.13 | (2.16 | ) | (2.03 | ) | (0.08 | ) | (1.30 | ) | (1.38 | ) | 6.50 | (18.32 | ) | 22,128 | 0.41 | 0.89 | 2.10 | 77 | ||||||||||||||||||||||||||||||||||||
| (a) | Calculated using average shares outstanding. |
| (b) | Includes adjustments in accordance with accounting principles generally accepted in the United States of America and as such, the net asset value for financial reporting purposes and the returns based upon those net asset values may differ from the net asset value and returns for shareholder transactions. Does not include sales charges and is not annualized for periods less than one year, if applicable. |
| (c) | Portfolio turnover is calculated at the fund level and is not annualized for periods less than one year, if applicable. For the period ended August 31, 2011, the portfolio turnover calculation excludes the value of securities purchased of $286,080,448 and sold of $155,521,831 in the effort to realign the Fund’s portfolio holdings after the reorganization of Invesco Select Equity Fund and Invesco Van Kampen Equity Premium Income Fund into the Fund. |
| (d) | Ratios are based on average daily net assets (000’s omitted) of $199,653, $15,192, $39,054, $503, $4,329, $64,812 and $11,915 for Class A, Class B, Class C, Class R, Class Y, Investor Class, and Class R5 shares, respectively. |
| (e) | Commencement date of October 03, 2008 for Class Y shares. |
| (f) | Annualized. |
21 �� Invesco Low Volatility Equity Yield Fund
Report of Independent Registered Public Accounting Firm
To the Board of Trustees of AIM Counselor Series Trust (Invesco Counselor Series Trust)
and Shareholders of Invesco Low Volatility Equity Yield Fund:
In our opinion, the accompanying statement of assets and liabilities, including the schedule of investments, and the related statements of operations and of changes in net assets and the financial highlights present fairly, in all material respects, the financial position of Invesco Low Volatility Equity Yield Fund (formerly known as Invesco U.S. Quantitative Core Fund; one of the funds constituting AIM Counselor Series Trust (Invesco Counselor Series Trust), hereafter referred to as the “Fund”) at August 31, 2013, the results of its operations for the year then ended, the changes in its net assets for each of the two years in the period then ended and the financial highlights for each of the five years in the period then ended, in conformity with accounting principles generally accepted in the United States of America. These financial statements and financial highlights (hereafter referred to as “financial statements”) are the responsibility of the Fund’s management; our responsibility is to express an opinion on these financial statements based on our audits. We conducted our audits of these financial statements in accordance with the standards of the Public Company Accounting Oversight Board (United States). Those standards require that we plan and perform the audit to obtain reasonable assurance about whether the financial statements are free of material misstatement. An audit includes examining, on a test basis, evidence supporting the amounts and disclosures in the financial statements, assessing the accounting principles used and significant estimates made by management, and evaluating the overall financial statement presentation. We believe that our audits, which included confirmation of securities at August 31, 2013 by correspondence with the custodian and brokers, provide a reasonable basis for our opinion.
PRICEWATERHOUSECOOPERS LLP
October 25, 2013
Houston, Texas
22 Invesco Low Volatility Equity Yield Fund
Calculating your ongoing Fund expenses
Example
As a shareholder of the Fund, you incur two types of costs: (1) transaction costs, which may include sales charges (loads) on purchase payments or contingent deferred sales charges on redemptions, if any; and (2) ongoing costs, including management fees, distribution and/or service (12b-1) fees, and other Fund expenses. This example is intended to help you understand your ongoing costs (in dollars) of investing in the Fund and to compare these costs with ongoing costs of investing in other mutual funds. The example is based on an investment of $1,000 invested at the beginning of the period and held for the entire period March 1, 2013 through August 31, 2013.
Actual expenses
The table below provides information about actual account values and actual expenses. You may use the information in this table, together with the amount you invested, to estimate the expenses that you paid over the period. Simply divide your account value by $1,000 (for example, an $8,600 account value divided by $1,000 = 8.6), then multiply the result by the number in the table under the heading entitled “Actual Expenses Paid During Period” to estimate the expenses you paid on your account during this period.
Hypothetical example for comparison purposes
The table below also provides information about hypothetical account values and hypothetical expenses based on the Fund’s actual expense ratio and an assumed rate of return of 5% per year before expenses, which is not the Fund’s actual return.
The hypothetical account values and expenses may not be used to estimate the actual ending account balance or expenses you paid for the period. You may use this information to compare the ongoing costs of investing in the Fund and other funds. To do so, compare this 5% hypothetical example with the 5% hypothetical examples that appear in the shareholder reports of the other funds.
Please note that the expenses shown in the table are meant to highlight your ongoing costs only and do not reflect any transaction costs, such as sales charges (loads) on purchase payments or contingent deferred sales charges on redemptions, if any. Therefore, the hypothetical information is useful in comparing ongoing costs only, and will not help you determine the relative total costs of owning different funds. In addition, if these transaction costs were included, your costs would have been higher.
| Class | Beginning Account Value (03/01/13) | ACTUAL | HYPOTHETICAL (5% annual return before expenses) | Annualized Expense Ratio | ||||||||||||||||||||
| Ending Account Value (08/31/13)1 | Expenses Paid During Period2 | Ending Account Value (08/31/13) | Expenses Paid During Period2 | |||||||||||||||||||||
| A | $ | 1,000.00 | $ | 1,094.30 | $ | 6.18 | $ | 1,019.31 | $ | 5.96 | 1.17 | % | ||||||||||||
| B | 1,000.00 | 1,089.70 | 10.11 | 1,015.53 | 9.75 | 1.92 | ||||||||||||||||||
| C | 1,000.00 | 1,088.70 | 10.11 | 1,015.53 | 9.75 | 1.92 | ||||||||||||||||||
| R | 1,000.00 | 1,092.40 | 7.49 | 1,018.05 | 7.22 | 1.42 | ||||||||||||||||||
| Y | 1,000.00 | 1,095.10 | 4.86 | 1,020.57 | 4.69 | 0.92 | ||||||||||||||||||
| Investor | 1,000.00 | 1,094.00 | 6.18 | 1,019.31 | 5.96 | 1.17 | ||||||||||||||||||
| R5 | 1,000.00 | 1,096.20 | 4.02 | 1,021.37 | 3.87 | 0.76 | ||||||||||||||||||
| 1 | The actual ending account value is based on the actual total return of the Fund for the period March 1, 2013 through August 31, 2013, after actual expenses and will differ from the hypothetical ending account value which is based on the Fund’s expense ratio and a hypothetical annual return of 5% before expenses. |
| 2 | Expenses are equal to the Fund’s annualized expense ratio as indicated above multiplied by the average account value over the period, multiplied by 184/365 to reflect the most recent fiscal half year. |
23 Invesco Low Volatility Equity Yield Fund
Approval of Investment Advisory and Sub-Advisory Contracts
The Board of Trustees (the Board) of AIM Counselor Series Trust (Invesco Counselor Series Trust) is required under the Investment Company Act of 1940, as amended, to approve annually the renewal of Invesco Low Volatility Equity Yield Fund’s (the Fund) investment advisory agreement with Invesco Advisers, Inc. (Invesco Advisers) and the Master Intergroup Sub-Advisory Contract for Mutual Funds (the sub-advisory contracts) with Invesco Asset Management Deutschland GmbH, Invesco Asset Management Limited, Invesco Asset Management (Japan) Limited, Invesco Australia Limited, Invesco Hong Kong Limited, Invesco Senior Secured Management, Inc. and Invesco Canada Ltd. (collectively, the Affiliated Sub-Advisers). During contract renewal meetings held on June 17-19, 2013, the Board as a whole, and the disinterested or “independent” Trustees, who comprise over 75% of the Board, voting separately, approved the continuance of the Fund’s investment advisory agreement and the sub-advisory contracts for another year, effective July 1, 2013. The Board determined that the continuation of the Fund’s investment advisory agreement and the sub-advisory contracts are in the best interests of the Fund and its shareholders and the compensation payable to Invesco Advisers and the Affiliated Sub-Advisers under the agreements is fair and reasonable.
The Board’s Fund Evaluation Process
The Board’s Investments Committee has established three Sub-Committees, each of which is primarily responsible for overseeing the management of a number of the funds advised by Invesco Advisers (the Invesco Funds). The Sub-Committees meet throughout the year to review the performance of their assigned Invesco Funds, including reviewing materials prepared under the direction of the independent Senior Officer, an officer of the Invesco Funds who reports directly to the independent Trustees. Over the course of each year, the Sub-Committees meet with portfolio managers for their assigned Invesco Funds and other members of management to review the performance, investment objective(s), policies, strategies, limitations and investment risks of these funds. The Sub-Committees meet regularly and at designated contract renewal meetings each year to conduct a review of the performance, fees, expenses and other matters related to their assigned Invesco Funds. Each Sub-Committee recommends to the Investments Committee, which in turn recommends to the full Board, whether and on what terms to approve the continuance of each Invesco Fund’s investment advisory agreement and sub-advisory contracts for another year.
During the contract renewal process, the Trustees receive comparative performance and fee data regarding the Invesco Funds prepared by Invesco Advisers and Lipper Inc. (Lipper), an independent provider of investment company
data. The Trustees also receive an independent written evaluation from the Senior Officer. The Senior Officer’s evaluation is prepared as part of his responsibility to manage the process by which the Invesco Funds’ proposed management fees are negotiated during the annual contract renewal process to ensure they are negotiated in a manner that is at arms’ length and reasonable. The independent Trustees are assisted in their annual evaluation of the Fund’s investment advisory agreement by the Senior Officer and by independent legal counsel. In addition to meetings with Invesco Advisers and fund counsel, the independent Trustees also discuss the continuance of the investment advisory agreement and sub-advisory contracts in separate sessions with the Senior Officer and with independent legal counsel.
In evaluating the fairness and reasonableness of compensation under the Fund’s investment advisory agreement and sub-advisory contracts, the Board considered, among other things, the factors discussed below. The Trustees recognized that the advisory fee rates for the Invesco Funds are, in many cases, the result of years of review and negotiation between the Trustees and Invesco Advisers as well as advisory fees previously approved by different predecessor boards. The Trustees’ deliberations and conclusions in a particular year may be based in part on their deliberations and conclusions regarding these same arrangements throughout the year and in prior years. The Trustees’ review and conclusions are based on the comprehensive consideration of all information presented to them and are not the result of any single determinative factor. Moreover, one Trustee may have weighed a particular piece of information or factor differently than another Trustee.
The discussion below serves as the Senior Officer’s independent written evaluation with respect to the Fund’s investment advisory agreement as well as a discussion of the material factors and related conclusions that formed the basis for the Board’s approval of the Fund’s investment advisory agreement and sub-advisory contracts. Unless otherwise stated, this information is current as of June 19, 2013, and may not reflect consideration of factors that became known to the Board after that date, including, for example, changes to the Fund’s performance, advisory fees, expense limitations and/or fee waivers.
Factors and Conclusions and Summary of Independent Written Fee Evaluation
| A. | Nature, Extent and Quality of Services Provided by Invesco Advisers and the Affiliated Sub-Advisers |
The Board reviewed the advisory services provided to the Fund by Invesco Advisers under the Fund’s investment advisory agreement, the performance of Invesco Advisers in providing
these services, and the credentials and experience of the officers and employees of Invesco Advisers who provide these services, including the Fund’s portfolio manager or managers, with whom the Sub-Committees met during the year. The Board’s review of the qualifications of Invesco Advisers to provide advisory services included the Board’s consideration of Invesco Advisers’ investment process oversight, independent credit analysis and investment risk management.
In determining whether to continue the Fund’s investment advisory agreement, the Board considered the benefits of reapproving an existing relationship and the greater uncertainty that may be associated with entering into a new relationship. The Board also considered non-advisory services that Invesco Advisers and its affiliates provide to the Invesco Funds such as various back office support functions, equity and fixed income trading operations, internal audit, distribution and legal and compliance. The Board concluded that the nature, extent and quality of the services provided to the Fund by Invesco Advisers are appropriate and satisfactory and consistent with the terms of the Fund’s investment advisory agreement.
The Board reviewed the services that may be provided by the Affiliated Sub-Advisers under the sub-advisory contracts and the credentials and experience of the officers and employees of the Affiliated Sub-Advisers who provide these services. The Board noted that the Affiliated Sub-Advisers have offices and personnel that are located in financial centers around the world. As a result, the Affiliated Sub-Advisers can provide research and investment analysis on the markets and economies of various countries in which the Fund may invest, make recommendations regarding securities and assist with security trades. The Board concluded that the sub-advisory contracts benefit the Fund and its shareholders by permitting Invesco Advisers to use the resources and talents of the Affiliated Sub-Advisers in managing the Fund. The Board concluded that the nature, extent and quality of the services that may be provided by the Affiliated Sub-Advisers are appropriate and satisfactory and consistent with the terms of the Fund’s sub-advisory contracts.
| B. | Fund Performance |
The Board considered Fund performance as a relevant factor in considering whether to approve the investment advisory agreement. The Board did not view Fund performance as a relevant factor in considering whether to approve the sub-advisory contracts for the Fund, as no Affiliated Sub-Adviser currently manages assets of the Fund.
The Board compared the Fund’s performance during the past one, three and five calendar years to the performance of funds in the Lipper performance universe and against the Lipper Large-Cap Core Funds Index. The Board noted
24 Invesco Low Volatility Equity Yield Fund
that performance of Class A shares of the Fund was in the second quintile of the performance universe for the one year period, the third quintile for the three year period and the fourth quintile for the five year period (the first quintile being the best performing funds and the fifth quintile being the worst performing funds). The Board noted that performance of Class A shares of the Fund was above the performance of the Index for the one year period and below the performance of the Index for the three and five year periods. The Trustees noted that they had approved changes to the investment objectives and strategies of the Fund in April. The Trustees also reviewed more recent Fund performance and this review did not change their conclusions.
| C. | Advisory and Sub-Advisory Fees |
The Board compared the Fund’s contractual management fee rate to the contractual management fee rates of funds in the Fund’s Lipper expense group at a common asset level. The Board noted that the contractual management fee rate for Class A shares of the Fund was below the median contractual management fee rate of funds in the expense group. The Board noted that the term “contractual management fee” may include both advisory and certain administrative services fees and that Invesco does not charge the Invesco Funds for the administrative services included in the term as defined by Lipper. The Board also reviewed the methodology used by Lipper in providing expense group information, which includes using each fund’s contractual management fee schedule (including any applicable breakpoints) as reported in the most recent prospectus or statement of additional information for each fund in the expense group.
The Board noted that Invesco Advisers and its affiliates do not advise other funds or client accounts with investment strategies comparable to those of the Fund.
The Board also considered the services that may be provided by the Affiliated Sub-Advisers pursuant to the sub-advisory contracts, as well as the fees payable by Invesco Advisers to the Affiliated Sub-Advisers pursuant to the sub-advisory contracts. The Board also noted that the sub-advisory fees are not paid directly by the Fund, but rather, are payable by Invesco Advisers to the Affiliated Sub-Advisers.
Based upon the information and considerations described above, the Board concluded that the compensation payable to Invesco Advisers and the Affiliated Sub-Advisers is fair and reasonable.
| D. | Economies of Scale and Breakpoints |
The Board considered the extent to which there are economies of scale in the provision of advisory services to the Fund. The Board also considered whether the Fund benefits from economies of scale through contractual breakpoints in the Fund’s advisory fee schedule and was assisted in this review by a report from the Senior Officer. The Board also noted that the Fund shares directly in economies of scale
through lower fees charged by third party service providers based on the combined size of the Invesco Funds and other clients advised by Invesco Advisers.
| E. | Profitability and Financial Resources |
The Board reviewed information from Invesco Advisers concerning the costs of the advisory and other services that Invesco Advisers and its affiliates provide to the Fund and the profitability of Invesco Advisers and its affiliates in providing these services for the year ended December 31, 2012. The Board received information from Invesco Advisers about the methodology used to prepare the profitability information. The Board considered the profitability of Invesco Advisers in managing the Fund and the Invesco Funds. The Board noted that Invesco Advisers continues to operate at a net profit from services Invesco Advisers and its subsidiaries provide to the Invesco Funds and the Fund. The Board did not deem the level of profits realized by Invesco Advisers and its affiliates from providing services to the Fund to be excessive given the nature, quality and extent of the services provided to the Invesco Funds. The Board received and accepted information from Invesco Advisers demonstrating that Invesco Advisers and each Affiliated Sub-Adviser are financially sound and have the resources necessary to perform their obligations under the investment advisory agreement and sub-advisory contracts.
| F. | Collateral Benefits to Invesco Advisers and its Affiliates |
The Board considered various other benefits received by Invesco Advisers and its affiliates from the relationship with the Fund, including the fees received for their provision of transfer agency and distribution services to the Fund. The Board considered comparative information regarding fees charged for these services, including information provided by Lipper and other independent sources. The Board considered the performance of Invesco Advisers and its affiliates in providing these services and the organizational structure employed to provide these services. The Board also considered that these services are provided to the Fund pursuant to written contracts that are reviewed and approved on an annual basis by the Board; that the services are required for the operation of the Fund; that Invesco Advisers and its affiliates can provide services, the nature and quality of which are at least equal to those provided by others offering the same or similar services; and that the fees for such services are fair and reasonable in light of the usual and customary charges by others for services of the same nature and quality.
The Board considered the benefits realized by Invesco Advisers and the Affiliated Sub-Advisers as a result of portfolio brokerage transactions executed through “soft dollar” arrangements. The Board noted that soft dollar arrangements shift the payment obligation for research services from Invesco Advisers and the Affiliated Sub-Advisers to the Invesco Funds and that the research received may be used with
other clients of Invesco Advisers and may reduce Invesco Advisers’ and the Affiliated Sub-Advisers’ expenses. The Board also considered periodic reports from the Chief Compliance Officer of the Invesco Funds demonstrating that these arrangements are consistent with regulatory requirements. The Board did not deem the soft dollar arrangements to be inappropriate.
The Board considered that the Fund’s uninvested cash and cash collateral from any securities lending arrangements may be invested in money market funds advised by Invesco Advisers pursuant to procedures approved by the Board. The Board noted that Invesco Advisers receives advisory fees from these affiliated money market funds attributable to such investments, although Invesco Advisers has contractually agreed to waive through varying periods the advisory fees payable by the Invesco Funds. The waiver is in an amount equal to 100% of the net advisory fee Invesco Advisers receives from the affiliated money market funds with respect to the Fund’s investment in the affiliated money market funds of uninvested cash, but not cash collateral. The Board concluded that the Fund’s investment of uninvested cash and cash collateral from any securities lending arrangements in the affiliated money market funds is in the best interests of the Fund and its shareholders.
The Board also considered use of an affiliated broker to execute certain trades for the Fund to among other things, control information leakage, and were advised that such trades are executed in compliance with rules under the Investment Company Act of 1940, as amended.
25 Invesco Low Volatility Equity Yield Fund
Tax Information
Form 1099-DIV, Form 1042-S and other year-end tax information provide shareholders with actual calendar year amounts that should be included in their tax returns. Shareholders should consult their tax advisors.
The following distribution information is being provided as required by the Internal Revenue Code or to meet a specific state’s requirement.
The Fund designates the following amounts or, if subsequently determined to be different, the maximum amount allowable for its fiscal year ended August 31, 2013:
Federal and State Income Tax | ||||
Qualified Dividend Income* | 100 | % | ||
Corporate Dividends Received Deduction* | 100 | % | ||
U.S. Treasury Obligations* | 0 | % | ||
| * | The above percentages are based on ordinary income dividends paid to shareholders during the Fund’s fiscal year. |
26 Invesco Low Volatility Equity Yield Fund
Trustees and Officers
The address of each trustee and officer is AIM Counselor Series Trust (Invesco Counselor Series Trust) (the “Trust”), 11 Greenway Plaza, Suite 1000, Houston, Texas 77046-1173. The trustees serve for the life of the Trust, subject to their earlier death, incapacitation, resignation, retirement or removal as more specifically provided in the Trust’s organizational documents. Each officer serves for a one year term or until their successors are elected and qualified. Column two below includes length of time served with predecessor entities, if any.
Name, Year of Birth and Position(s) Held with the Trust | Trustee and/ or Officer Since | Principal Occupation(s) During Past 5 Years | Number of Funds in Fund Complex Overseen by Trustee | Other Directorship(s) Held by Trustee During Past 5 Years | ||||
| Interested Persons | ||||||||
| Martin L. Flanagan1 — 1960 Trustee | 2007 | Executive Director, Chief Executive Officer and President, Invesco Ltd. (ultimate parent of Invesco and a global investment management firm); Advisor to the Board, Invesco Advisers, Inc. (formerly known as Invesco Institutional (N.A.), Inc.); Trustee, The Invesco Funds; Vice Chair, Investment Company Institute; and Member of Executive Board, SMU Cox School of Business
Formerly: Chairman and Chief Executive Officer, Invesco Advisers, Inc. (registered investment adviser); Director, Chairman, Chief Executive Officer and President, IVZ Inc. (holding company), INVESCO Group Services, Inc. (service provider) and Invesco North American Holdings, Inc. (holding company); Director, Chief Executive Officer and President, Invesco Holding Company Limited (parent of Invesco and a global investment management firm); Director, Invesco Ltd.; Chairman, Investment Company Institute and President, Co-Chief Executive Officer, Co-President, Chief Operating Officer and Chief Financial Officer, Franklin Resources, Inc. (global investment management organization) | 117 | None | ||||
| Philip A. Taylor2 — 1954 Trustee, President and Principal Executive Officer | 2006 | Head of North American Retail and Senior Managing Director, Invesco Ltd.; Director, Co-Chairman, Co-President and Co-Chief Executive Officer, Invesco Advisers, Inc. (formerly known as Invesco Institutional (N.A.), Inc.) (registered investment adviser); Director, Chairman, Chief Executive Officer and President, Invesco Management Group, Inc. (formerly known as Invesco Aim Management Group, Inc.) (financial services holding company); Director and President, INVESCO Funds Group, Inc. (registered investment adviser and registered transfer agent); Director and Chairman, Invesco Investment Services, Inc. (formerly known as Invesco Aim Investment Services, Inc.) (registered transfer agent) and IVZ Distributors, Inc. (formerly known as INVESCO Distributors, Inc.) (registered broker dealer); Director, President and Chairman, Invesco Inc. (holding company) and Invesco Canada Holdings Inc. (holding company); Chief Executive Officer, Invesco Corporate Class Inc. (corporate mutual fund company) and Invesco Canada Fund Inc. (corporate mutual fund company); Director, Chairman and Chief Executive Officer, Invesco Canada Ltd. (formerly known as Invesco Trimark Ltd./Invesco Trimark Ltèe) (registered investment adviser and registered transfer agent); Trustee, President and Principal Executive Officer, The Invesco Funds (other than AIM Treasurer’s Series Trust (Invesco Treasurer’s Series Trust) and Short-Term Investments Trust); Trustee and Executive Vice President, The Invesco Funds (AIM Treasurer’s Series Trust (Invesco Treasurer’s Series Trust) and Short-Term Investments Trust only); Director, Invesco Investment Advisers LLC (formerly known as Van Kampen Asset Management); Director, Chief Executive Officer and President, Van Kampen Exchange Corp.
Formerly: Director and Chairman, Van Kampen Investor Services Inc.: Director, Chief Executive Officer and President, 1371 Preferred Inc. (holding company); and Van Kampen Investments Inc.; Director and President, AIM GP Canada Inc. (general partner for limited partnerships); and Van Kampen Advisors, Inc.; Director and Chief Executive Officer, Invesco Trimark Dealer Inc. (registered broker dealer); Director, Invesco Distributors, Inc. (formerly known as Invesco Aim Distributors, Inc.) (registered broker dealer); Manager, Invesco PowerShares Capital Management LLC; Director, Chief Executive Officer and President, Invesco Advisers, Inc.; Director, Chairman, Chief Executive Officer and President, Invesco Aim Capital Management, Inc.; President, Invesco Trimark Dealer Inc. and Invesco Trimark Ltd./Invesco Trimark Ltèe; Director and President, AIM Trimark Corporate Class Inc. and AIM Trimark Canada Fund Inc.; Senior Managing Director, Invesco Holding Company Limited; Trustee and Executive Vice President, Tax-Free Investments Trust; Director and Chairman, Fund Management Company (former registered broker dealer); President and Principal Executive Officer, The Invesco Funds (AIM Treasurer’s Series Trust (Invesco Treasurer’s Series Trust), Short-Term Investments Trust and Tax-Free Investments Trust only); President, AIM Trimark Global Fund Inc. and AIM Trimark Canada Fund Inc. | 117 | None | ||||
Wayne W. Whalen3 — 1939 Trustee | 2010 | Of Counsel, and prior to 2010, partner in the law firm of Skadden, Arps, Slate, Meagher & Flom LLP, legal counsel to certain funds in the Fund Complex
| 130 | Director of the Mutual Fund Directors Forum, a nonprofit membership organization for investment directors; Chairman and Director of the Abraham Lincoln Presidential Library Foundation; and Director of the Stevenson Center for Democracy |
| 1 | Mr. Flanagan is considered an interested person of the Trust because he is an officer of the adviser to the Trust, and an officer and a director of Invesco Ltd., ultimate parent of the adviser to the Trust. |
| 2 | Mr. Taylor is considered an interested person of the Trust because he is an officer and a director of the adviser to, and a director of the principal underwriter of, the Trust. |
| 3 | Mr. Whalen is considered an “interested person” (within the meaning of Section 2(a)(19) of the 1940 Act) of certain Funds in the Invesco Fund Complex because he and his firm currently provide legal services as legal counsel to such Funds. |
T-1 Invesco Low Volatility Equity Yield Fund
Trustees and Officers—(continued)
Name, Year of Birth and Position(s) Held with the Trust | Trustee and/ or Officer Since | Principal Occupation(s) During Past 5 Years | Number of Funds in Fund Complex Overseen by Trustee | Other Directorship(s) Held by Trustee During Past 5 Years | ||||
| Independent Trustees | ||||||||
Bruce L. Crockett — 1944 Trustee and Chair | 2003 | Chairman, Crockett Technologies Associates (technology consulting company)
Formerly: Director, Captaris (unified messaging provider); Director, President and Chief Executive Officer COMSAT Corporation; and Chairman, Board of Governors of INTELSAT (international communications company) | 117 | ACE Limited (insurance company); Investment Company Institute | ||||
David C. Arch — 1945 Trustee | 2010 | Chairman and Chief Executive Officer of Blistex Inc., (consumer health care products manufacturer)
Formerly: Member of the Heartland Alliance Advisory Board, a nonprofit organization serving human needs based in Chicago | 130 | Board member of the Illinois Manufacturers’ Association; Member of the Board of Visitors, Institute for the Humanities, University of Michigan | ||||
Frank S. Bayley — 1939 Trustee | 2003 | Retired
Formerly: Director, Badgley Funds, Inc. (registered investment company) (2 portfolios) and General Partner and Of Counsel, law firm of Baker & McKenzie, LLP | 117 | Director and Chairman, C.D. Stimson Company (a real estate investment company); Trustee and Overseer, The Curtis Institute of Music | ||||
James T. Bunch — 1942 Trustee | 2000 | Managing Member, Grumman Hill Group LLC (family office private equity management)
Formerly: Founder, Green, Manning & Bunch Ltd. (investment banking firm)(1988-2010); Executive Committee, United States Golf Association; and Director, Policy Studies, Inc. and Van Gilder Insurance Corporation | 117 | Chairman, Board of Governors, Western Golf Association; Chairman-elect, Evans Scholars Foundation; and Director, Denver Film Society | ||||
Rodney F. Dammeyer — 1940 Trustee | 2010 | Chairman of CAC, LLC, (private company offering capital investment and management advisory services)
Formerly: Prior to 2001, Managing Partner at Equity Group Corporate Investments; Prior to 1995, Chief Executive Officer of Itel Corporation (formerly Anixter International); Prior to 1985, experience includes Senior Vice President and Chief Financial Officer of Household International, Inc., Executive Vice President and Chief Financial Officer of Northwest Industries, Inc. and Partner of Arthur Andersen & Co.; From 1987 to 2010, Director/Trustee of investment companies in the Van Kampen Funds complex | 117 | Director of Quidel Corporation and Stericycle, Inc.; Prior to May 2008, Trustee of The Scripps Research Institute; Prior to February 2008, Director of Ventana Medical Systems, Inc. | ||||
Albert R. Dowden — 1941 Trustee | 2003 | Director of a number of public and private business corporations, including the Boss Group, Ltd. (private investment and management); Reich & Tang Funds (5 portfolios) (registered investment company); and Homeowners of America Holding Corporation/ Homeowners of America Insurance Company (property casualty company)
Formerly: Director, Continental Energy Services, LLC (oil and gas pipeline service); Director, CompuDyne Corporation (provider of product and services to the public security market) and Director, Annuity and Life Re (Holdings), Ltd. (reinsurance company); Director, President and Chief Executive Officer, Volvo Group North America, Inc.; Senior Vice President, AB Volvo; Director of various public and private corporations; Chairman, DHJ Media, Inc.; Director Magellan Insurance Company; and Director, The Hertz Corporation, Genmar Corporation (boat manufacturer), National Media Corporation; Advisory Board of Rotary Power International (designer, manufacturer, and seller of rotary power engines); and Chairman, Cortland Trust, Inc. (registered investment company) | 117 | Director of Nature’s Sunshine Products, Inc. | ||||
Jack M. Fields — 1952 Trustee | 2003 | Chief Executive Officer, Twenty First Century Group, Inc. (government affairs company); Owner and Chief Executive Officer, Dos Angeles Ranch, L.P. (cattle, hunting, corporate entertainment); and Discovery Global Education Fund (non-profit)
Formerly: Chief Executive Officer, Texana Timber LP (sustainable forestry company); Director of Cross Timbers Quail Research Ranch (non-profit); and member of the U.S. House of Representatives | 117 | Insperity, Inc. (formerly known as Administaff) | ||||
Prema Mathai-Davis — 1950 Trustee | 2003 | Retired
Formerly: Chief Executive Officer, YWCA of the U.S.A. | 117 | None | ||||
Larry Soll — 1942 Trustee | 1997 | Retired
Formerly: Chairman, Chief Executive Officer and President, Synergen Corp. (a biotechnology company) | 117 | None | ||||
Hugo F. Sonnenschein — 1940 Trustee | 2010 | Distinguished Service Professor and President Emeritus of the University of Chicago and the Adam Smith Distinguished Service Professor in the Department of Economics at the University of Chicago
Formerly: President of the University of Chicago | 130 | Trustee of the University of Rochester and a member of its investment committee. Member of the National Academy of Sciences, the American Philosophical Society and a fellow of the American Academy of Arts and Sciences |
T-2 Invesco Low Volatility Equity Yield Fund
Trustees and Officers—(continued)
Name, Year of Birth and Position(s) Held with the Trust | Trustee and/ or Officer Since | Principal Occupation(s) During Past 5 Years | Number of Funds in Fund Complex Overseen by Trustee | Other Directorship(s) Held by Trustee During Past 5 Years | ||||
| Independent Trustees—(continued) | ||||||||
Raymond Stickel, Jr. — 1944 Trustee | 2005 | Retired
Formerly: Director, Mainstay VP Series Funds, Inc. (25 portfolios) and Partner, Deloitte & Touche | 117 | None | ||||
| Other Officers | ||||||||
| Russell C. Burk — 1958 Senior Vice President and Senior Officer | 2005 | Senior Vice President and Senior Officer, The Invesco Funds | N/A | N/A | ||||
| John M. Zerr — 1962 Senior Vice President, Chief Legal Officer and Secretary | 2006 | Director, Senior Vice President, Secretary and General Counsel, Invesco Management Group, Inc. (formerly known as Invesco Aim Management Group, Inc.) and Van Kampen Exchange Corp.; Senior Vice President, Invesco Advisers, Inc. (formerly known as Invesco Institutional (N.A.), Inc.) (registered investment adviser); Senior Vice President and Secretary, Invesco Distributors, Inc. (formerly known as Invesco Aim Distributors, Inc.); Director, Vice President and Secretary, Invesco Investment Services, Inc. (formerly known as Invesco Aim Investment Services, Inc.) and IVZ Distributors, Inc. (formerly known as INVESCO Distributors, Inc.); Director and Vice President, INVESCO Funds Group, Inc.; Senior Vice President, Chief Legal Officer and Secretary, The Invesco Funds; Manager, Invesco PowerShares Capital Management LLC; Director, Secretary and General Counsel, Invesco Investment Advisers LLC (formerly known as Van Kampen Asset Management); Secretary and General Counsel, Invesco Capital Markets, Inc. (formerly known as Van Kampen Funds Inc.) and Chief Legal Officer, PowerShares Exchange-Traded Fund Trust, PowerShares Exchange-Traded Fund Trust II, PowerShares India Exchange-Traded Fund Trust and PowerShares Actively Managed Exchange-Traded Fund Trust
Formerly: Director and Vice President, Van Kampen Advisors Inc.; Director, Vice President, Secretary and General Counsel, Van Kampen Investor Services Inc.; Director, Invesco Distributors, Inc. (formerly known as Invesco Aim Distributors, Inc.); Director, Senior Vice President, General Counsel and Secretary, Invesco Aim Advisers, Inc. and Van Kampen Investments Inc.; Director, Vice President and Secretary, Fund Management Company; Director, Senior Vice President, Secretary, General Counsel and Vice President, Invesco Aim Capital Management, Inc.; Chief Operating Officer and General Counsel, Liberty Ridge Capital, Inc. (an investment adviser); Vice President and Secretary, PBHG Funds (an investment company) and PBHG Insurance Series Fund (an investment company); Chief Operating Officer, General Counsel and Secretary, Old Mutual Investment Partners (a broker-dealer); General Counsel and Secretary, Old Mutual Fund Services (an administrator) and Old Mutual Shareholder Services (a shareholder servicing center); Executive Vice President, General Counsel and Secretary, Old Mutual Capital, Inc. (an investment adviser); and Vice President and Secretary, Old Mutual Advisors Funds (an investment company) | N/A | N/A | ||||
| Karen Dunn Kelley — 1960 Vice President | 2003 | Head of Invesco’s World Wide Fixed Income and Cash Management Group; Director, Co-President, Co-Chief Executive Officer, and Co-Chairman, Invesco Advisers, Inc. (formerly known as Invesco Institutional (N.A.), Inc.) (registered investment adviser); Chairman, Invesco Senior Secured Management, Inc.; Senior Vice President, Invesco Management Group, Inc. (formerly known as Invesco Aim Management Group, Inc.); Executive Vice President, Invesco Distributors, Inc. (formerly known as Invesco Aim Distributors, Inc.); Director, Invesco Mortgage Capital Inc., and Invesco Management Company Limited; Director and President, INVESCO Asset Management (Bermuda) Ltd., Vice President, The Invesco Funds (other than AIM Treasurer’s Series Trust (Invesco Treasurer’s Series Trust) and Short-Term Investments Trust); and President and Principal Executive Officer, The Invesco Funds (AIM Treasurer’s Series Trust (Invesco Treasurer’s Series Trust) and Short-Term Investments Trust only)
Formerly: Director, INVESCO Global Asset Management Limited and INVESCO Management S.A.; Senior Vice President, Van Kampen Investments Inc. and Invesco Advisers, Inc. (formerly known as Invesco Institutional (N.A.), Inc.) (registered investment adviser); Vice President, Invesco Advisers, Inc. (formerly known as Invesco Institutional (N.A.), Inc.); Director of Cash Management and Senior Vice President, Invesco Advisers, Inc. and Invesco Aim Capital Management, Inc.; President and Principal Executive Officer, Tax-Free Investments Trust; Director and President, Fund Management Company; Chief Cash Management Officer, Director of Cash Management, Senior Vice President, and Managing Director, Invesco Aim Capital Management, Inc.; Director of Cash Management, Senior Vice President, and Vice President, Invesco Advisers, Inc. and The Invesco Funds (AIM Treasurer’s Series Trust (Invesco Treasurer’s Series Trust), Short-Term Investments Trust and Tax-Free Investments Trust only) | N/A | N/A | ||||
T-3 Invesco Low Volatility Equity Yield Fund
Trustees and Officers—(continued)
Name, Year of Birth and Position(s) Held with the Trust | Trustee and/ or Officer Since | Principal Occupation(s) During Past 5 Years | Number of Funds in Fund Complex Overseen by Trustee | Other Directorship(s) Held by Trustee During Past 5 Years | ||||
| Other Officers—(continued) | ||||||||
| Sheri Morris — 1964 Vice President, Treasurer and Principal Financial Officer | 2003 | Vice President, Treasurer and Principal Financial Officer, The Invesco Funds; Vice President, Invesco Advisers, Inc. (formerly known as Invesco Institutional (N.A.), Inc.) (registered investment adviser); and Vice President, PowerShares Exchange-Traded Fund Trust, PowerShares Exchange-Traded Fund Trust II, PowerShares India Exchange-Traded Fund Trust and PowerShares Actively Managed Exchange-Traded Fund Trust
Formerly: Vice President, Invesco Aim Advisers, Inc., Invesco Aim Capital Management, Inc. and Invesco Aim Private Asset Management, Inc.; Assistant Vice President and Assistant Treasurer, The Invesco Funds and Assistant Vice President, Invesco Advisers, Inc., Invesco Aim Capital Management, Inc. and Invesco Aim Private Asset Management, Inc.; and Treasurer, PowerShares Exchange-Traded Fund Trust, PowerShares Exchange-Traded Fund Trust II, PowerShares India Exchange-Traded Fund Trust and PowerShares Actively Managed Exchange-Traded Fund Trust | N/A | N/A | ||||
Crissie M. Wisdom — 1969 Anti-Money Laundering Compliance Officer | 2013 | Anti-Money Laundering Compliance Officer, Invesco Advisers, Inc. (formerly known as Invesco Institutional (N.A.), Inc.) (registered investment adviser), Invesco Capital Markets, Inc. (formerly known as Van Kampen Funds Inc.), Invesco Distributors, Inc., Invesco Investment Services, Inc., Invesco Management Group, Inc., Van Kampen Exchange Corp., The Invesco Funds, Invesco Funds (Chicago), and PowerShares Exchange-Traded Fund Trust, PowerShares Exchange-Traded Fund Trust II, PowerShares India Exchange-Traded Fund Trust, and PowerShares Actively Managed Exchange-Traded Fund Trust; and Fraud Prevention Manager and Controls and Risk Analysis Manager for Invesco Investment Services, Inc. | N/A | N/A | ||||
| Todd L. Spillane — 1958 Chief Compliance Officer | 2006 | Senior Vice President, Invesco Management Group, Inc. (formerly known as Invesco Aim Management Group, Inc.) and Van Kampen Exchange Corp.; Senior Vice President and Chief Compliance Officer, Invesco Advisers, Inc. (registered investment adviser) (formerly known as Invesco Institutional (N.A.), Inc.); Chief Compliance Officer, The Invesco Funds; Vice President, Invesco Distributors, Inc. (formerly known as Invesco Aim Distributors, Inc.) and Invesco Investment Services, Inc. (formerly known as Invesco Aim Investment Services, Inc.)
Formerly: Chief Compliance Officer, Invesco Funds (Chicago); Senior Vice President, Van Kampen Investments Inc.; Senior Vice President and Chief Compliance Officer, Invesco Aim Advisers, Inc. and Invesco Aim Capital Management, Inc.; Chief Compliance Officer, INVESCO Private Capital Investments, Inc. (holding company), Invesco Private Capital, Inc. (registered investment adviser), Invesco Global Asset Management (N.A.), Inc., Invesco Senior Secured Management, Inc. (registered investment adviser), Van Kampen Investor Services Inc., PowerShares Exchange-Traded Fund Trust, PowerShares Exchange-Traded Fund Trust II, PowerShares India Exchange-Traded Fund Trust and PowerShares Actively Managed Exchange-Traded Fund Trust; and Vice President, Invesco Aim Capital Management, Inc. and Fund Management Company | N/A | N/A |
The Statement of Additional Information of the Trust includes additional information about the Fund’s Trustees and is available upon request, without charge, by calling 1.800.959.4246. Please refer to the Fund’s prospectus for information on the Fund’s sub-advisers.
Office of the Fund 11 Greenway Plaza, Suite 1000 Houston, TX 77046-1173 | Investment Adviser Invesco Advisers, Inc. 1555 Peachtree Street, N.E. Atlanta, GA 30309 | Distributor Invesco Distributors, Inc. 11 Greenway Plaza, Suite 1000 Houston, TX 77046-1173 | Auditors PricewaterhouseCoopers LLP 1201 Louisiana Street, Suite 2900 Houston, TX 77002-5678 | |||
Counsel to the Fund Stradley Ronon Stevens & Young, LLP 2005 Market Street, Suite 2600 Philadelphia, PA 19103-7018 | Counsel to the Independent Trustees Goodwin Procter LLP 901 New York Avenue, N.W. Washington, D.C. 20001 | Transfer Agent Invesco Investment Services, Inc. 11 Greenway Plaza, Suite 1000 Houston, TX 77046-1173 | Custodian State Street Bank and Trust Company 225 Franklin Street Boston, MA 02110-2801 | |||
T-4 Invesco Low Volatility Equity Yield Fund

Invesco mailing information
Send general correspondence to Invesco Investment Services, Inc., P.O. Box 219078, Kansas City, MO 64121-9078.
Invesco privacy policy
You share personal and financial information with us that is necessary for your transactions and your account records. We take very seriously the obligation to keep that information confidential and private.
Invesco collects nonpublic personal information about you from account applications or other forms you complete and from your transactions with us or our affiliates. We do not disclose information about you or our former customers to service providers or other third parties except to the extent necessary to service your account and in other limited circumstances as permitted by law. For example, we use this information to facilitate the delivery of transaction confirmations, financial reports, prospectuses and tax forms.
Even within Invesco, only people involved in the servicing of your accounts and compliance monitoring have access to your information. To ensure the highest level of confidentiality and security, Invesco maintains physical, electronic and procedural safeguards that meet or exceed federal standards. Special measures, such as data encryption and authentication, apply to your communications with us on our website. More detail is available to you at invesco.com/privacy.
Important notice regarding delivery of security holder documents
To reduce Fund expenses, only one copy of most shareholder documents may be mailed to shareholders with multiple accounts at the same address (Householding). Mailing of your shareholder documents may be householded indefinitely unless you instruct us otherwise. If you do not want the mailing of these documents to be combined with those for other members of your household, please contact Invesco Investment Services, Inc. at 800 959 4246 or contact your financial institution. We will begin sending you individual copies for each account within 30 days after receiving your request.
Fund holdings and proxy voting information
The Fund provides a complete list of its holdings four times in each fiscal year, at the quarter ends. For the second and fourth quarters, the lists appear in the Fund’s semiannual and annual reports to shareholders. For the first and third quarters, the Fund files the lists with the Securities and Exchange Commission (SEC) on Form N-Q. The most recent list of portfolio holdings is available at invesco.com/completeqtrholdings. Shareholders can also look up the Fund’s Forms N-Q on the SEC website at sec.gov. Copies of the Fund’s Forms N-Q may be reviewed and copied at the SEC Public Reference Room in Washington, D.C. You can obtain information on the operation of the Public Reference Room, including information about duplicating fee charges, by calling 202 551 8090 or 800 732 0330, or by electronic request at the following email address: publicinfo@sec.gov. The SEC file numbers for the Fund are shown below.
A description of the policies and procedures that the Fund uses to determine how to vote proxies relating to portfolio securities is available without charge, upon request, from our Client Services department at 800 959 4246 or at invesco.com/proxyguidelines. The information is also available on the SEC website, sec.gov.
Information regarding how the Fund voted proxies related to its portfolio securities during the most recent 12-month period ended June 30 is available at invesco.com/proxysearch. The information is also available on the SEC website, sec.gov. Invesco Advisers, Inc. is an investment adviser; it provides investment advisory services to individual and institutional clients and does not sell securities. Invesco Distributors, Inc. is the US distributor for Invesco Ltd.’s retail mutual funds, exchange-traded funds and institutional money market funds. Both are wholly owned, indirect subsidiaries of Invesco Ltd. |  | |
| SEC file numbers: 811-09913 and 333-36074 LVEY-AR-1 Invesco Distributors, Inc. | ||

Letters to Shareholders
| Dear Shareholders: Enclosed in this annual report, you’ll find information about your Fund and the factors that affected its performance during the reporting period. Inside, you’ll also find a discussion from your portfolio managers about how they managed your Fund, as well as performance data for your Fund, a complete list of your Fund’s investments as of the close of the reporting period and other important information. I hope you find this report of interest. During the reporting period covered by this report, major US equity indexes made multiyear or even all-time highs.1 Economic data were generally positive; housing and consumer spending data were particularly encouraging. Nonetheless, economic uncertainty and concern about continuing political and budget gridlock in Washington persisted. The US Federal Reserve’s deliberate vagueness about when, and to what degree, it might begin to curtail its extraordinarily accommodative monetary policies – together with uncertainty about who will | ||||||||
next lead the central bank – affected fixed income and equity markets alike. Most developed, non-US stock markets remained positive for the first half of 2013, despite a difficult second quarter. Periods of market volatility and economic uncertainty can weaken the will of even the most resolute investor. That’s why Invesco believes it’s often helpful to work with a skilled and trusted financial adviser who can emphasize the importance of adhering to an investment plan designed to achieve long-term goals rather than being sidetracked by short-term uncertainty that can result in inaction. A financial adviser who is familiar with your individual financial situation, investment goals and risk tolerance can be an invaluable partner as you work toward your financial goals. He or she can provide insight and perspective when markets are volatile; encouragement and reassurance when times are uncertain; and advice and guidance when your financial situation or investment goals change. Our website, invesco.com/us, is another source of timely insight and information for investors. On the website, you’ll find fund-specific as well as more general information from many of Invesco’s investment professionals. You’ll find in-depth articles, video clips and audio commentaries – and, of course, you also can access information about your Invesco account whenever it’s convenient for you. | |||||||||

What we mean by Intentional Investing
At Invesco, all of our people and all of our resources are dedicated to helping investors achieve their financial objectives. It’s a philosophy we call Intentional Investing, and it guides the way we:
| ¢ | Manage investments – Our dedicated investment professionals search the world for the best opportunities, and each investment team follows a clear, disciplined process to build portfolios and mitigate risk. |
| ¢ | Provide choices – We offer multiple investment strategies, allowing you and your financial adviser to build a portfolio that’s purpose-built for your needs. |
| ¢ | Connect with you – We’re committed to giving you the expert insights you need to make informed investing decisions, and we are well-equipped to provide high-quality support for investors and advisers. |
At Invesco, we believe in putting investors first. That’s why investment management is all we do. Our sole focus on managing your money allows you and your financial adviser to build a portfolio of Invesco funds appropriate for your investment needs and goals today and when your circumstances change.
Have questions?
For questions about your account, feel free to contact an Invesco client services representative at 800 959 4246. For Invesco-related questions or comments, please email me directly at phil@invesco.com.
All of us at Invesco look forward to serving your investment management needs for many years to come. Thank you for investing with us.
Sincerely,

Philip Taylor
Senior Managing Director, Invesco Ltd.
| 1 | Source: Reuters |
2 Invesco Pennsylvania Tax Free Income Fund
 | Dear Fellow Shareholders: The Invesco Funds Board has worked on a variety of issues over the last several months, and I’d like to take this opportunity to discuss two that affect you and our fellow fund shareholders. The first issue on which your Board has been working is our annual review of the funds’ advisory and sub-advisory contracts with Invesco Advisers and its affiliates. This annual review, which is required by the Investment Company Act of 1940, focuses on the nature and quality of the services Invesco provides as adviser to the Invesco Funds and the reasonableness of the fees that it charges for those services. Each year, we spend months reviewing detailed information that we request from Invesco that allows us to evaluate its services and fees. We also use information from many independent sources, including materials provided by the independent Senior Officer of the Invesco Funds, who reports directly to the independent Trustees on the Board. Additionally, we meet with independent legal counsel and review | ||||||||
| performance and fee data prepared by Lipper Inc., an independent, third-party firm widely recognized as a leader in its field. | |||||||||
I’m pleased to report that the Board determined in June that renewing the investment advisory agreement and the sub-advisory contracts with Invesco Advisers and its affiliates would serve the best interests of each fund and its shareholders.
The second area of focus to highlight is the Board’s efforts to ensure that we provide a lineup of funds that allow financial advisers to build portfolios that meet shareholders’ changing financial needs and goals. Today, more and more investors are reaching, or approaching, retirement. But interest rates remain low, making it difficult for many investors to generate the income they need, or will soon need, in their retirement years.
The members of your Board think about these things, too, and we’ve worked with Invesco Advisers to provide more income-generating options in the Invesco Funds lineup to help shareholders potentially meet their income needs. Your Board recently approved changes to three existing equity mutual funds, increasing their focus on generating income while also seeking to provide long-term growth of capital.
As a result of these changes, the funds and their respective management teams now have more flexibility to invest in the types of securities that could meet investors’ growing need for income generation, and in some cases, also help investors diversify their sources of income. These equity funds complement an array of fixed-income, asset allocation and alternative investment options in the Invesco Funds lineup designed to accommodate a variety of risk tolerances.
Be assured that your Board will continue working on behalf of fund shareholders, keeping your needs and interests uppermost in our minds.
As always, please contact me at bruce@brucecrockett.com with any questions or concerns you may have. On behalf of the Board, we look forward to continuing to represent your interests and serving your needs.
Sincerely,

Bruce L. Crockett
Independent Chair
Invesco Funds Board of Trustees
3 Invesco Pennsylvania Tax Free Income Fund
Management’s Discussion of Fund Performance
Performance summary
Invesco Pennsylvania Tax Free Income Fund posted negative returns for the fiscal year ended August 31, 2013. The Fund underperformed its broad market benchmark, the Barclays Municipal Bond Index, and its style-specific benchmark, the Barclays Pennsylvania Municipal Index. The Fund’s overweight allocation to, and security selection in, the long end of the municipal yield curve were the main contributors to its relative performance versus its style-specific benchmark for the reporting period.
Your Fund’s long-term performance appears later in this report.
Fund vs. Indexes
Total returns, 8/31/12 to 8/31/13, at net asset value (NAV). Performance shown does not include applicable contingent deferred sales charges (CDSC) or front-end sales charges, which would have reduced performance.
| Class A Shares | -6.24 | % | |||
| Class B Shares | -6.28 | ||||
| Class C Shares | -7.00 | ||||
| Class Y Shares | -6.06 | ||||
| Barclays Municipal Bond Index‚ (Broad Market Index) | -3.70 | ||||
| Barclays Pennsylvania Municipal Indexn (Style-Specific Index) | -3.21 | ||||
Source(s): ‚Lipper Inc.; nBarclays via FactSet Research Systems Inc. |
How we invest
Our investment objective is to provide only Pennsylvania investors with a high level of current income exempt from federal and Pennsylvania state income taxes and, where possible under local law, local income and personal property taxes, through investment in a varied portfolio of medium and lower grade municipal securities.
We invest primarily in medium grade and lower grade securities. However, at times, conditions in the Pennsylvania municipal market may be such that we elect to invest in higher grade securities. Generally, and depending on market conditions, higher grade municipal securities may better protect net asset value (NAV) against declines, but may produce lower yields than lower rated municipal securities, since yields on higher grade securities are usually lower than yields on medium grade or lower grade securities.
As a result, we may not invest in the highest-yielding Pennsylvania municipal securities permitted by our investment policies if we determine that they may subject the Fund to undue risk.
The Fund’s investment in medium grade and lower grade securities involves special risks as compared to investing in higher grade securities. We do not purchase securities that are in default or rated in categories lower than B- by Standard & Poor’s or B3 by Moody’s Investors Service, Inc. (Moody’s) at the time of purchase or unrated securities of comparable quality.† Under normal market conditions, the Fund may invest up to 20% of its total assets in municipal securities that are subject to the federal alternative minimum tax.
We actively manage the Fund’s portfolio and adjust its average maturity based on our expectations about the direction of interest rates and other economic factors.
| Portfolio Composition | |||||
By credit sector, based on total investments
| |||||
| Revenue Bonds | 88.7 | % | |||
| General Obligation Bonds | 6.0 | ||||
| Other | 3.3 | ||||
| Pre-refunded Bonds | 2.0 | ||||
| Total Net Assets | $134.1 million | ||||
| Total Number of Holdings | 139 | ||||
The Fund’s holdings are subject to change, and there is no assurance that the Fund will continue to hold any particular security.
Top Five Fixed Income Holdings
| ||||||||
| 1. | Pennsylvania (State of) Higher Educational Facilities Authority (Trustees of the University of Pennsylvania); Series 2005 C | 3.5 | % | |||||
| 2. | Delaware Valley Regional Financial Authority; Series 2002 | 3.0 | ||||||
| 3. | Philadelphia (City of) Industrial Development Authority; Series 1990 | 1.9 | ||||||
| 4. | Westmoreland (County of) Industrial Development Authority (Redstone Presbyterian Senior Care Obligated Group); Series 2005 A | 1.8 | ||||||
| 5. | Dauphin (County of) General Authority (Pinnacle Health System); Series 2009 A | 1.7 | ||||||
We select securities that we believe offer higher yields with reasonable credit risk considered in relation to the investment policies of the Fund. In selecting securities for investment, we use our research capabilities to assess potential investments and consider a number of factors, including general market and economic conditions and credit, interest rate and prepayment risks.
Market conditions and your Fund
Pennsylvania has improved governance with two consecutive years of timely budgets while reducing its reliance on nonrecurring revenue sources. The commonwealth has a diverse economic base and moderate debt levels. Pennsylvania depends on income, sales, fuel and other taxes to derive over 50% of revenues, with federal aid and grants comprising 40% of receipts.1 The commonwealth’s resources are used largely for school aid and public welfare, which account for more than three-fourths of the commonwealth’s General Fund expenditures.1 The commonwealth’s economic performance is largely dependent on job growth. During the most recent recession, job losses in Pennsylvania were less than the national average. During the recovery, the commonwealth has seen gains across all sectors, with the lone exception being government employment. The service sector accounts for nearly half of non-farm employment, followed by trade (15%), government (13%), manufacturing (11%), and finance (7%).1 A potential boom for Pennsylvania exists with the Marcellus Shale natural gas reserve field, which is estimated as the second largest in the country, and is projected to provide 200,000 jobs and add more than $18 billion to gross state product by 2020.2
Throughout the Fund’s reporting period, fundamentals for municipal debt issuers improved on the whole. Quarterly state tax collections increased year-over-year for 15 consecutive quarters through the second quarter of 2013 (the most recent results available).3 Rising home prices and expanding new housing starts, which drive property tax receipts, were also supportive for municipal issuers.
Performance for the asset class, however, can be divided into distinct time periods. From September 2012 through April 2013, performance generally followed the improving credit trends in the municipal market. Positive returns were further bolstered by limited new issuance and continued inflows into the asset class. Municipal
4 Invesco Pennsylvania Tax Free Income Fund
bond funds recorded $50 billion of net inflows in 2012 and an additional $9 billion during the first quarter of 2013.4 In fact, the quarter ending March 31, 2013, marked the ninth consecutive5 quarter of positive performance for the broad municipal bond market. April was also a strong month for the market.
Beginning in May, market sentiment began to shift and technical market forces drove performance to diverge from issuer fundamentals. As the economy gradually improved, the market became increasingly wary over the specter of rising interest rates. In late June, fixed income investors’ concerns were further inflamed when the US Federal Reserve made public comments on the timing for tapering its government and mortgage bond buying program. Relatively modest outflows from municipal bond funds of more than $750 million in May turned into a deluge of redemptions in excess of $16 billion in June.4
While nearly all fixed income asset classes sold off in June, municipal bonds were particularly hard hit. Retail investors who saw their funds’ NAVs drop sold shares, prompting fund managers to raise cash to meet redemptions by selling bonds. Bond selling in the unidirectional market put further pressure on NAVs, causing more investors to exit the municipal bond asset class.
Additional concerns crept into the market in July, when the city of Detroit filed the largest municipal bankruptcy on record6 and Moody’s downgraded Chicago’s general obligation debt three notches. These idiosyncratic events were largely anticipated by professional investors. Nonetheless, municipal bond funds experienced additional volatility from the reintroduction of headline risk, notwithstanding broad-based credit improvement across the municipal bond asset class. In July and August, municipal bond funds experienced net outflows of approximately $10 billion and $11.5 billion, respectively.4 For the reporting period, net outflows totaled approximately $20 billion.4
We recognize this summer’s sell-off was painful for investors. The current environment, however, may present opportunities for long-term investors. As of the end of the fiscal year, municipal bonds were priced attractively relative to Treasuries. The muni-to-Treasury yield ratio of 121% compares to a 10-year historical average of 100%.7 A higher ratio indicates relative cheapness. Additionally, higher rates have limited, and may continue to limit, the supply of municipal refinancing deals coming to market.
While redemptions remain elevated, the pace of net outflows has decreased since June. Finally, more and higher taxes, including the 3.8% Medicare tax on investment income,8 from which munis are exempt, make municipal bond yields more attractive on an after-tax basis for tax-affected investors.
For the reporting period, rising rates during the summer sell-off had the largest negative impact on both the Fund and its style-specific index. Longer duration, interest-rate-sensitive bonds were most affected and were the largest negative contributor to absolute performance. The Fund’s longer duration bonds and overweight position in the long end of the yield curve were also the largest sources of underperformance relative to its style-specific index. Security selection in the middle of the yield curve partially offset underperformance.
The Fund held an off-index position in Puerto Rican revenue bonds which also contributed to underperformance. Following the Detroit bankruptcy filing and Chicago downgrades this summer, investors moved out of more volatile names like Puerto Rico. Puerto Rican debt is held in single-state municipal funds because of its triple tax exempt status. While Puerto Rico negatively impacted returns from revenue bonds, security selection in general obligation bonds made a positive contribution to relative performance.
During the reporting period, leverage had a negative contribution to the performance of the Fund. The Fund achieved a leveraged position through the use of inverse floating rate securities. The Fund uses leverage because we believe that, over time, leveraging provides opportunities for additional income and total return for shareholders. However, use of leverage also can expose shareholders to additional volatility. For more information about the Fund’s use of leverage, see the Notes to Financial Statements later in this report.
Thank you for investing in Invesco Pennsylvania Tax Free Income Fund and for sharing our long-term investment horizon.
| † | A credit rating is an assessment provided by a nationally recognized statistical rating organization (NRSRO) of the creditworthiness of an issuer with respect to debt obligations, including specific securities, money market instruments or other debts. Ratings are measured on a scale that generally ranges from AAA (highest) to D (lowest); ratings are subject to change without notice. For more information on rating methodologies, please visit the following NRSRO websites: standardandpoors.com and select “Understanding Ratings” under Rating Resources on the homepage; or moodys.com and select “Rating Methodologies” under Research and Ratings on the homepage. |
| 1 | Source: Pennsylvania Office of the Budget |
| 2 | Source: The Pennsylvania Independent Oil and Gas Association |
| 3 | Source: US Census Bureau |
| 4 | Source: Morningstar |
| 5 | Source: Barclays |
| 6 | Source: Moody’s |
| 7 | Source: Thomson Municipal Market Data |
| 8 | Source: Internal Revenue Service |
The views and opinions expressed in management’s discussion of Fund performance are those of Invesco Advisers, Inc. These views and opinions are subject to change at any time based on factors such as market and economic conditions. These views and opinions may not be relied upon as investment advice or recommendations, or as an offer for a particular security. The information is not a complete analysis of every aspect of any market, country, industry, security or the Fund. Statements of fact are from sources considered reliable, but Invesco Advisers, Inc. makes no representation or warranty as to their completeness or accuracy. Although historical performance is no guarantee of future results, these insights may help you understand our investment management philosophy.
See important Fund and, if applicable, index disclosures later in this report.
 | Thomas Byron Portfolio manager, is manager of Invesco Pennsylvania Tax Free Income Fund. He joined Invesco in 2010. |
Mr. Byron earned a BS in finance from Marquette University and an MBA in finance from DePaul University.
 | Robert Stryker Chartered Financial Analyst, portfolio manager, is manager of Invesco Pennsylvania Tax Free Income Fund. |
He joined Invesco in 2010. Mr. Stryker earned a BS in finance from the University of Illinois at Chicago.
 | Julius Williams Portfolio manager, is manager of Invesco Pennsylvania Tax Free Income Fund. He joined Invesco in 2010. |
Mr. Williams earned a BA in economics and sociology and a Master of Education degree in educational psychology from the University of Virginia.
 | Robert Wimmel Portfolio manager, is manager of Invesco Pennsylvania Tax Free Income Fund. He joined Invesco in 2010. |
Mr. Wimmel earned a BA in anthropology from the University of Cincinnati and an MA in economics from the University of Illinois at Chicago.
5 Invesco Pennsylvania Tax Free Income Fund
Your Fund’s Long-Term Performance
Results of a $10,000 Investment – Oldest Share Class(es)
Fund and index data from 8/31/03
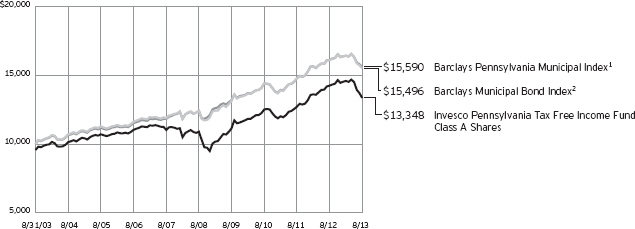
| 1 | Source(s): Barclays via FactSet Research Systems Inc. |
| 2 | Source: Lipper Inc. |
Past performance cannot guarantee comparable future results.
The data shown in the chart include reinvested distributions, applicable sales charges and Fund expenses including management fees. Index results include
reinvested dividends, but they do not reflect sales charges. Performance of the peer group, if applicable, reflects fund expenses and management fees; performance of a market index does not. Performance shown in the chart above and
before tax table(s) does not reflect deduction of taxes a shareholder would pay on Fund distributions or sale of Fund shares.
continued from page 8
About indexes used in this report
| n | The Barclays Municipal Bond Index is an unmanaged index considered representative of the tax-exempt bond market. |
| n | The Barclays Pennsylvania Municipal Index is an unmanaged index considered representative of Pennsylvania investment-grade municipal bonds. |
| n | The Fund is not managed to track the performance of any particular index, including the index(es) described here, and consequently, the performance of the Fund may deviate significantly from the performance of the index(es). |
| n | A direct investment cannot be made in an index. Unless otherwise indicated, index results include reinvested dividends, and they do not reflect sales |
charges. Performance of the peer group, if applicable, reflects fund expenses; performance of a market index does not. |
Other information
| n | The returns shown in management’s discussion of Fund performance are based on net asset values calculated for shareholder transactions. Generally accepted accounting principles require adjustments to be made to the net assets of the Fund at period end for financial reporting purposes, and as such, the net asset values for shareholder transactions and the returns based on those net asset values may differ from the net asset values and returns reported in the Financial Highlights. |
6 Invesco Pennsylvania Tax Free Income Fund
| Average Annual Total Returns | |||||||||||||||
As of 8/31/13, including maximum applicable sales charges
| |||||||||||||||
Before Taxes | After Taxes on Distributions | After Taxes on Distributions and Sale of Fund Shares | |||||||||||||
| Class A Shares | |||||||||||||||
| Inception (5/1/87) | 5.54 | % | 5.52 | % | 5.57 | % | |||||||||
10 Years | 2.93 | 2.91 | 3.21 | ||||||||||||
5 Years | 3.26 | 3.26 | 3.54 | ||||||||||||
1 Year | -10.24 | -10.24 | -4.22 | ||||||||||||
| Class B Shares | |||||||||||||||
| Inception (5/3/93) | 3.92 | % | 3.91 | % | 4.04 | % | |||||||||
10 Years | 2.94 | 2.92 | 3.14 | ||||||||||||
5 Years | 3.69 | 3.69 | 3.86 | ||||||||||||
1 Year | -10.80 | -10.80 | -4.46 | ||||||||||||
| Class C Shares | |||||||||||||||
| Inception (8/13/93) | 3.33 | % | 3.32 | % | 3.47 | % | |||||||||
10 Years | 2.62 | 2.60 | 2.83 | ||||||||||||
5 Years | 3.37 | 3.37 | 3.47 | ||||||||||||
1 Year | -7.90 | -7.90 | -3.15 | ||||||||||||
| Class Y Shares | |||||||||||||||
10 Years | 3.47 | % | 3.45 | % | 3.68 | % | |||||||||
5 Years | 4.33 | 4.33 | 4.44 | ||||||||||||
1 Year | -6.06 | -6.06 | -1.67 | ||||||||||||
| Average Annual Total Returns | |||||||||||||||
| As of 6/30/13, the most recent calendar quarter end, including maximum applicable sales charges | |||||||||||||||
Before Taxes | After Taxes on Distributions | After Taxes on Distributions and Sale of Fund Shares | |||||||||||||
| Class A Shares | |||||||||||||||
| Inception (5/1/87) | 5.75 | % | 5.74 | % | 5.73 | % | |||||||||
10 Years | 3.15 | 3.13 | 3.35 | ||||||||||||
5 Years | 4.17 | 4.17 | 4.22 | ||||||||||||
1 Year | -4.34 | -4.34 | -0.82 | ||||||||||||
| Class B Shares | |||||||||||||||
| Inception (5/3/93) | 4.17 | % | 4.16 | % | 4.23 | % | |||||||||
10 Years | 3.14 | 3.12 | 3.26 | ||||||||||||
5 Years | 4.63 | 4.63 | 4.56 | ||||||||||||
1 Year | -4.82 | -4.82 | -1.02 | ||||||||||||
| Class C Shares | |||||||||||||||
| Inception (8/13/93) | 3.59 | % | 3.58 | % | 3.66 | % | |||||||||
10 Years | 2.83 | 2.81 | 2.97 | ||||||||||||
5 Years | 4.31 | 4.31 | 4.17 | ||||||||||||
1 Year | -1.71 | -1.71 | 0.39 | ||||||||||||
| Class Y Shares | |||||||||||||||
10 Years | 3.69 | % | 3.67 | % | 3.82 | % | |||||||||
5 Years | 5.27 | 5.27 | 5.13 | ||||||||||||
1 Year | 0.24 | 0.24 | 1.96 | ||||||||||||
Effective June 1, 2010, Class A, Class B and Class C shares of the predecessor fund, Van Kampen Pennsylvania Tax Free Income Fund, advised by Van Kampen Asset Management were reorganized into Class A, Class B and Class C shares, respectively, of Invesco Van Kampen Pennsylvania Tax Free Income Fund (renamed Invesco Pennsylvania Tax Free Income Fund). Returns shown above for Class A, Class B and Class C shares are blended returns of the predecessor fund and Invesco Pennsylvania Tax Free Income Fund. Share class returns will differ from the predecessor fund because of different expenses.
Class Y shares incepted on June 1, 2010. Performance shown prior to that date is that of the predecessor fund’s Class A shares and includes the 12b-1 fees applicable to Class A shares. Class A shares performance reflects any applicable fee waivers or expense reimbursements.
The performance data quoted represent past performance and cannot guarantee comparable future results; current performance may be lower or higher. Please visit invesco.com/performance for the most recent month-end performance. Performance figures reflect reinvested
distributions, changes in net asset value and the effect of the maximum sales charge unless otherwise stated. Investment return and principal value will fluctuate so that you may have a gain or loss when you sell shares.
The total annual Fund operating expense ratio set forth in the most recent Fund prospectus as of the date of this report for Class A, Class B, Class C and Class Y shares was 1.03%, 1.03%, 1.78% and 0.78%, respectively. The expense ratios presented above may vary from the expense ratios presented in other sections of this report that are based on expenses incurred during the period covered by this report.
Class A share performance reflects the maximum 4.25% sales charge, and Class B and Class C share performance reflects the applicable contingent deferred sales charge (CDSC) for the period involved. For shares purchased prior to June 1, 2010, the CDSC on Class B shares declines from 4% at the time of purchase to 0% at the beginning of the seventh year. For shares purchased on or after June 1, 2010, the CDSC on Class B shares declines from 5% at the time of purchase to 0% at the beginning of the seventh year.
The CDSC on Class C shares is 1% for the first year after purchase. Class Y shares do not have a front-end sales charge or a CDSC; therefore, performance is at net asset value.
The performance of the Fund’s share classes will differ primarily due to different sales charge structures and class expenses.
After-tax returns are calculated using the historical highest individual federal marginal income tax rate. They do not reflect the effect of state and local taxes. Actual after-tax returns depend on the investor’s tax situation and may differ from those shown. After-tax returns shown are not relevant to investors who hold their shares in tax-deferred accounts such as 401(k)s or IRAs. The Fund’s past performance, before and after taxes, is not necessarily an indication of how the Fund will perform in the future.
7 Invesco Pennsylvania Tax Free Income Fund
Invesco Pennsylvania Tax Free Income Fund’s investment objective is to provide only Pennsylvania investors with a high level of current income exempt from federal and Pennsylvania state income taxes and, where possible under local law, local income and personal property taxes, through investment in a varied portfolio of medium- and lower-grade municipal securities.
| n | Unless otherwise stated, information presented in this report is as of August 31, 2013, and is based on total net assets. |
| n | Unless otherwise noted, all data provided by Invesco. |
| n | To access your Fund’s reports/prospectus, visit invesco.com/fundreports. |
About share classes
| n | Class B shares may not be purchased for new or additional investments. Please see the prospectus for more information. |
| n | Class Y shares are available to only certain investors. Please see the prospectus for more information. |
Principal risks of investing in the Fund
| n | Market risk. The prices of and the income generated by the Fund’s securities may decline in response to, among other things, investor sentiment, general economic and market conditions, regional or global instability, and currency and interest rate fluctuations. |
| n | Credit risk. Credit risk refers to an issuer’s ability to make timely payments of interest and principal. The credit quality of noninvestment-grade securities is considered speculative by recognized rating agencies with respect to the issuer’s continuing ability to pay interest and principal. Lower-grade securities (also sometimes known as junk bonds) may have less liquidity and a higher incident of default than higher-grade securities. The Fund may incur higher expenses to protect the Fund’s interest in such securities. The credit risks and market prices of medium- and lower-grade securities, especially those with longer maturities or those that do not make regular interest payment, generally are more sensitive to negative issuer developments or adverse economic conditions and may be more volatile than are higher-grade securities. |
| n | Income risk. The income you receive from the Fund is based primarily on prevailing interest rates, which can vary widely over the short and long term. If interest rates drop, your income from the Fund may drop as well. To the extent that the adviser invests in higher-grade securities at |
times, the amount of current income from such securities may be lower than the income from medium- and lower- grade securities. |
| n | Call risk. If interest rates fall, it is possible that issuers of debt securities with high interest rates will prepay or call their securities before their maturity dates. In this event, the proceeds from the called securities would likely be reinvested by the Fund in securities bearing the new, lower interest rates, resulting in a possible decline in the Fund’s income and distributions to shareholders. |
| n | Municipal securities risk. Under normal market conditions, the Fund invests primarily in municipal securities. The yields of municipal securities may move differently and adversely compared to the yields of the overall debt securities markets. There could be changes in applicable tax laws or tax treatments that adversely affect the current federal or state tax status of municipal securities. |
| n | State-specific risk. The Fund is more susceptible to political, economic, regulatory or other factors affecting issuers of Pennsylvania municipal securities than a fund that does not limit its investments to such issuers. |
| n | Derivatives risk. The performance of derivative instruments is tied to the performance of an underlying currency, security, index or other instrument. In addition to risks relating to their underlying instruments, the use of derivatives may include other, possibly greater, risks. Derivatives involve costs, may be volatile, and may involve a small initial investment relative to the risk assumed. Risks associated with the use of derivatives include counterparty, leverage, correlation, liquidity, tax, market, interest rate and management risks. Derivatives may also be more difficult to purchase, sell or value than other investments. The Fund may lose more than the cash |
amount invested on investments in derivatives. Investors should bear in mind that, while the Fund intends to use derivative strategies, it is not obligated to actively engage in these transactions, generally or in any particular kind of derivative, if the investment manager elects not to do so due to availability, cost, market conditions or other factors. |
| n | Inverse floating rate municipal obligations risk. The inverse floating rate municipal obligations in which the Fund may invest include derivative instruments such as residual interest bonds (RIBs) or tender option bonds (TOBs). Such instruments are typically created by a special purpose trust that holds long-term fixed rate bonds and sells two classes of beneficial interests: short- term floating rate interests, which are sold to third party investors, and inverse floating residual interests, which are purchased by the Fund. The short-term floating rate interests have first priority on the cash flow from the bond held by the special purpose trust and the Fund is paid the residual cash flow from the bond held by the special purpose trust. The interest rates on these obligations generally move in the reverse direction of market interest rates. If market interest rates fall, the interest rate on the obligations will increase and if market interest rates increase, the interest rate on the obligations will fall. |
| n | Synthetic securities risk. Fluctuations in the values of synthetic securities may not correlate perfectly with the instruments they are designed to replicate. Synthetic securities may be subject to interest rate changes, market price fluctuations, counterparty risk and liquidity risk. |
| n | Alternative minimum tax risk. A portion of the Fund’s otherwise tax-exempt income may be taxable to those shareholders subject to the federal alternative minimum tax. |
This report must be accompanied or preceded by a currently effective Fund prospectus, which contains more complete information, including sales charges and expenses. Investors should read it carefully before investing.
NOT FDIC INSURED | MAY LOSE VALUE | NO BANK GUARANTEE
continued on page 6
Fund Nasdaq Symbols
| |||||
| Class A Shares | VKMPX | ||||
| Class B Shares | VKPAX | ||||
| Class C Shares | VKPCX | ||||
| Class Y Shares | VKPYX | ||||
8 Invesco Pennsylvania Tax Free Income Fund
Schedule of Investments
August 31, 2013
Interest Rate | Maturity Date | Principal Amount (000) | Value | |||||||||||||
Municipal Obligations–102.67% | ||||||||||||||||
| Pennsylvania–93.16% | ||||||||||||||||
Allegheny (County of) Higher Education Building Authority (Chatham University); Series 2012 A, University RB | 5.00 | % | 09/01/35 | $ | 1,000 | $ | 930,610 | |||||||||
Allegheny (County of) Higher Education Building Authority (Duquesne University); | ||||||||||||||||
Series 1998, Ref. University RB (INS–AMBAC)(a) | 5.50 | % | 03/01/20 | 1,750 | 2,027,655 | |||||||||||
Series 2011 A, University RB | 5.50 | % | 03/01/31 | 550 | 579,326 | |||||||||||
Allegheny (County of) Higher Education Building Authority (Robert Morris University); Series 2008 A, University RB | 6.00 | % | 10/15/38 | 1,000 | 1,000,790 | |||||||||||
Allegheny (County of) Hospital Development Authority (Ohio Valley General Hospital); Series 2005 A, RB | 5.00 | % | 04/01/25 | 1,600 | 1,392,464 | |||||||||||
Allegheny (County of) Hospital Development Authority (University of Pittsburgh Medical Center); Series 2009, RB | 5.63 | % | 08/15/39 | 1,250 | 1,298,075 | |||||||||||
Allegheny (County of) Industrial Development Authority (Residential Resources, Inc.); Series 2006, Lease RB | 5.10 | % | 09/01/26 | 980 | 907,411 | |||||||||||
Allegheny (County of) Redevelopment Authority (Pittsburgh Mills); Series 2004, Tax Allocation RB | 5.60 | % | 07/01/23 | 1,220 | 1,169,175 | |||||||||||
Allegheny (County of) Residential Finance Authority; Series 2006 TT, Single Family Mortgage RB (CEP–GNMA)(b) | 5.00 | % | 05/01/35 | 905 | 896,665 | |||||||||||
Allegheny (County of); Series 2008 C 61, Unlimited Tax GO Bonds (INS–AGC)(a) | 5.00 | % | 12/01/33 | 500 | 503,635 | |||||||||||
Allegheny Valley Joint School District; Series 2004 A, Unlimited Tax GO Bonds (INS–NATL)(a) | 5.00 | % | 11/01/28 | 1,500 | 1,543,830 | |||||||||||
Beaver (County of) Industrial Development Authority (FirstEnergy Generation); Series 2008 A, Ref. RB | 2.15 | % | 03/01/17 | 700 | 681,380 | |||||||||||
Beaver (County of) Industrial Development Authority; Series 2008 A, Ref. PCR(c) | 2.70 | % | 04/02/18 | 230 | 223,972 | |||||||||||
Beaver (County of); Series 2009, Unlimited Tax GO Notes (INS–AGM)(a) | 5.55 | % | 11/15/31 | 1,390 | 1,505,898 | |||||||||||
Berks (County of) Industrial Development Authority (One Douglassville); Series 2007 A, Ref. RB(b) | 6.13 | % | 11/01/34 | 460 | 399,910 | |||||||||||
Berks (County of) Municipal Authority (Albright College); Series 2004, RB | 5.50 | % | 10/01/18 | 1,895 | 1,898,847 | |||||||||||
Berks (County of) Municipal Authority (Reading Hospital Medical Center); Series 2012 A, RB | 5.00 | % | 11/01/40 | 1,000 | 945,990 | |||||||||||
Bethlehem Area School District; Series 2010, Unlimited Tax GO Bonds (INS–AGM)(a) | 5.25 | % | 01/15/26 | 1,000 | 1,055,680 | |||||||||||
Bucks (County of) Industrial Development Authority (Lutheran Community Telford Center); Series 2007, RB | 5.75 | % | 01/01/37 | 2,000 | 1,812,020 | |||||||||||
Central Bradford Progress Authority (Guthrie Healthcare System); Series 2011, RB | 5.38 | % | 12/01/41 | 1,100 | 1,099,109 | |||||||||||
Centre (County of) Hospital Authority (Mt. Nittany Medical Center); | ||||||||||||||||
Series 2009, RB(c)(d) | 6.13 | % | 11/15/14 | 1,000 | 1,071,090 | |||||||||||
Series 2011, RB | 6.25 | % | 11/15/41 | 500 | 519,600 | |||||||||||
Chartiers Valley Industrial & Commercial Development Authority (Asbury Health Center); | ||||||||||||||||
Series 2006, Ref. First Mortgage RB | 5.25 | % | 12/01/15 | 500 | 511,625 | |||||||||||
Series 2006, Ref. First Mortgage RB | 5.75 | % | 12/01/22 | 900 | 907,866 | |||||||||||
Chester (County of) Industrial Development Authority (University Student Housing, LLC at West Chester University of Pennsylvania); Series 2013, Student Housing RB | 5.00 | % | 08/01/45 | 250 | 210,610 | |||||||||||
Clairton (City of) Municipal Authority; Series 2012 B, RB | 5.00 | % | 12/01/42 | 1,000 | 902,140 | |||||||||||
Cumberland (County of) Municipal Authority (Asbury Pennsylvania Obligated Group); Series 2010, RB | 6.00 | % | 01/01/40 | 870 | 873,550 | |||||||||||
Cumberland (County of) Municipal Authority (Association of Independent Colleges & Universities of Pennsylvania Financing Program-Dickinson College); Series 2009, RB | 5.00 | % | 11/01/39 | 750 | 758,677 | |||||||||||
Cumberland (County of) Municipal Authority (Diakon Lutheran Ministries); Series 2007, RB | 5.00 | % | 01/01/36 | 1,000 | 947,140 | |||||||||||
Cumberland (County of) Municipal Authority (Messiah Village); Series 2008 A, RB | 5.63 | % | 07/01/28 | 1,000 | 1,025,620 | |||||||||||
Dauphin (County of) General Authority (Pinnacle Health System); Series 2009 A, Health System RB | 6.00 | % | 06/01/36 | 2,215 | 2,318,153 | |||||||||||
Dauphin (County of) General Authority (Riverfront Office); Series 1998, Office & Parking RB | 6.00 | % | 01/01/25 | 1,055 | 1,055,538 | |||||||||||
Delaware (County of) Authority (Cabrini College); Series 1999, College RB (INS–Radian)(a) | 5.75 | % | 07/01/23 | 220 | 220,136 | |||||||||||
Delaware (County of) Authority (Neumann College); Series 2008, College RB | 6.25 | % | 10/01/38 | 175 | 168,667 | |||||||||||
Delaware (County of) Industrial Development Authority (Aqua Pennsylvania, Inc.); Series 2005 A, Water Facilities RB (INS–NATL)(a)(b) | 5.00 | % | 11/01/38 | 1,500 | 1,462,155 | |||||||||||
Delaware River Port Authority (Port District); | ||||||||||||||||
Series 2012, Ref. RB | 5.00 | % | 01/01/25 | 540 | 547,204 | |||||||||||
Series 2012, Ref. RB | 5.00 | % | 01/01/27 | 535 | 524,760 | |||||||||||
See accompanying Notes to Financial Statements which are an integral part of the financial statements.
9 Invesco Pennsylvania Tax Free Income Fund
Interest Rate | Maturity Date | Principal Amount (000) | Value | |||||||||||||
| Pennsylvania–(continued) | ||||||||||||||||
Delaware River Port Authority; Series 2010 D, RB | 5.00 | % | 01/01/40 | $ | 1,000 | $ | 1,009,120 | |||||||||
Delaware Valley Regional Financial Authority; | ||||||||||||||||
Series 2002, RB | 5.75 | % | 07/01/17 | 3,535 | 3,958,246 | |||||||||||
Series 2002, RB | 5.75 | % | 07/01/32 | 1,000 | 1,003,340 | |||||||||||
Doylestown (City of) Hospital Authority; Series 2013 A, RB (INS–AGM)(a) | 5.00 | % | 07/01/24 | 1,000 | 1,031,310 | |||||||||||
East Hempfield (Township of) Industrial Development Authority (Student Services Inc. Student Housing); | ||||||||||||||||
Series 2013, RB | 5.00 | % | 07/01/35 | 500 | 462,430 | |||||||||||
Series 2013, RB | 5.00 | % | 07/01/45 | 750 | 667,215 | |||||||||||
Erie (City of) Higher Education Building Authority (Mercyhurst College); | ||||||||||||||||
Series 2004 B, Ref. College RB | 5.00 | % | 03/15/23 | 1,000 | 1,004,870 | |||||||||||
Series 2008, College RB | 5.50 | % | 03/15/38 | 500 | 499,985 | |||||||||||
Franklin (County of) Industrial Development Authority (Chambersburg Hospital); Series 2010, RB | 5.38 | % | 07/01/42 | 1,000 | 975,590 | |||||||||||
Geisinger Authority (Geisinger Health System Foundation); | ||||||||||||||||
Series 2011 A1, Health System RB | 5.13 | % | 06/01/41 | 500 | 498,855 | |||||||||||
Series 2011 B, VRD RB(e) | 0.03 | % | 06/01/41 | 2,290 | 2,290,000 | |||||||||||
Series 2011 C, VRD Health System RB(e) | 0.03 | % | 06/01/41 | 1,500 | 1,500,000 | |||||||||||
Lancaster (County of) Hospital Authority (Brethren Village); Series 2008 A, RB | 6.50 | % | 07/01/40 | 350 | 350,196 | |||||||||||
Lancaster (County of) Hospital Authority (Lancaster General Hospital); Series 2012, Health System RB | 5.00 | % | 07/01/42 | 1,000 | 967,320 | |||||||||||
Lancaster (County of) Hospital Authority (Masonic Homes); Series 2008 D, VRD RB (LOC–JPMorgan Chase Bank, N.A.)(e)(f) | 0.06 | % | 07/01/34 | 700 | 700,000 | |||||||||||
Lehigh (County of) (Lehigh Valley Health Network); Series 2012, General Purpose Hospital RB | 4.00 | % | 07/01/43 | 1,000 | 753,400 | |||||||||||
Lehigh (County of) Authority; Series 2013 A, Water & Sewer RB | 5.00 | % | 12/01/38 | 930 | 900,128 | |||||||||||
Lehigh (County of) General Purpose Authority (Bible Fellowship Church Homes, Inc.); Series 2013, RB | 5.25 | % | 07/01/42 | 825 | 666,410 | |||||||||||
Lehigh (County of) General Purpose Authority (KidsPeace Obligated Group); Series 1998, RB(g) | 6.00 | % | 11/01/23 | 1,760 | 673,200 | |||||||||||
Lycoming (County of) Authority (Pennsylvania College of Technology); Series 2011, RB | 5.00 | % | 07/01/30 | 750 | 753,810 | |||||||||||
Lycoming (County of) Authority (Susquehanna Health System); Series 2009 A, Heath System RB | 5.75 | % | 07/01/39 | 1,250 | 1,263,137 | |||||||||||
Monroe (County of) Hospital Authority (Pocono Medical Center); | ||||||||||||||||
Series 2003, RB(c)(d) | 6.00 | % | 01/01/14 | 1,000 | 1,019,420 | |||||||||||
Series 2007, RB | 5.13 | % | 01/01/37 | 1,500 | 1,427,385 | |||||||||||
Montgomery (County of) Higher Education & Health Authority (Abington Memorial Hospital Obligated Group); Series 2012, RB | 5.00 | % | 06/01/31 | 1,400 | 1,401,372 | |||||||||||
Montgomery (County of) Industrial Development Authority (ACTS Retirement-Life Communities, Inc.); | ||||||||||||||||
Series 2009 A-1, RB | 6.25 | % | 11/15/29 | 1,000 | 1,041,830 | |||||||||||
Series 2012, Ref. RB | 5.00 | % | 11/15/28 | 900 | 848,205 | |||||||||||
Montgomery (County of) Industrial Development Authority (Philadelphia Presbytery Homes, Inc.); Series 2010, RB | 6.63 | % | 12/01/30 | 1,500 | 1,596,765 | |||||||||||
Montgomery (County of) Industrial Development Authority (Whitemarsh Community); Series 2008, Mortgage RB | 7.00 | % | 02/01/36 | 500 | 507,520 | |||||||||||
Montgomery (County of) Industrial Development Authority (Whitemarsh Continuing Care); Series 2005, Mortgage RB | 6.13 | % | 02/01/28 | 1,100 | 1,074,755 | |||||||||||
Northampton (County of) General Purpose Authority (Lehigh University); Series 2009, Higher Education��RB | 5.50 | % | 11/15/33 | 1,000 | 1,048,240 | |||||||||||
Northampton (County of) General Purpose Authority (St. Luke’s Hospital); | ||||||||||||||||
Series 2008 A, Hospital RB | 5.50 | % | 08/15/35 | 1,000 | 988,050 | |||||||||||
Series 2010 C, Hospital RB(c) | 4.50 | % | 08/15/16 | 1,000 | 1,072,250 | |||||||||||
Northampton (County of) Industrial Development Authority (Morningstar Senior Living, Inc.); Series 2012, RB | 5.00 | % | 07/01/32 | 535 | 487,444 | |||||||||||
Pennsylvania (State of) Economic Development Financing Agency (Forum Place); Series 2012, Governmental Lease RB | 5.00 | % | 03/01/34 | 500 | 497,460 | |||||||||||
Pennsylvania (State of) Economic Development Financing Authority (Allegheny Energy Supply Co.); Series 2009, RB | 7.00 | % | 07/15/39 | 1,830 | 1,849,215 | |||||||||||
Pennsylvania (State of) Economic Development Financing Authority (Amtrak); Series 2012 A, Ref. Exempt Facilities RB(b) | 5.00 | % | 11/01/41 | 1,200 | 1,120,980 | |||||||||||
Pennsylvania (State of) Economic Development Financing Authority (Philadelphia Biosolids Facility); Series 2009, Sewage Sludge Disposal RB | 6.25 | % | 01/01/32 | 1,000 | 998,270 | |||||||||||
See accompanying Notes to Financial Statements which are an integral part of the financial statements.
10 Invesco Pennsylvania Tax Free Income Fund
Interest Rate | Maturity Date | Principal Amount (000) | Value | |||||||||||||
| Pennsylvania–(continued) | ||||||||||||||||
Pennsylvania (State of) Economic Development Financing Authority (Shippingport); Series 2006 A, Exempt Facilities RB(c) | 2.55 | % | 12/03/18 | $ | 1,500 | $ | 1,463,430 | |||||||||
Pennsylvania (State of) Economic Development Financing Authority (Waste Management, Inc.); Series 2005 A, Solid Waste Disposal RB(b) | 5.10 | % | 10/01/27 | 1,300 | 1,283,243 | |||||||||||
Pennsylvania (State of) Higher Educational Facilities Authority (AICUP Financing Program-Del Valley College); Series 2012, RB | 5.00 | % | 11/01/42 | 535 | 463,658 | |||||||||||
Pennsylvania (State of) Higher Educational Facilities Authority (Edinboro University Foundation); | ||||||||||||||||
Series 2008, RB | 5.88 | % | 07/01/38 | 750 | 712,875 | |||||||||||
Series 2010, RB | 6.00 | % | 07/01/43 | 500 | 478,585 | |||||||||||
Pennsylvania (State of) Higher Educational Facilities Authority (La Salle University); Series 2012, RB | 5.00 | % | 05/01/42 | 1,180 | 1,056,289 | |||||||||||
Pennsylvania (State of) Higher Educational Facilities Authority (Shippensburg University Student Services); Series 2012, RB | 5.00 | % | 10/01/35 | 1,300 | 1,172,847 | |||||||||||
Pennsylvania (State of) Higher Educational Facilities Authority (St. Joseph’s University); | ||||||||||||||||
Series 2010 A, RB | 5.00 | % | 11/01/34 | 500 | 489,735 | |||||||||||
Series 2010 A, RB | 5.00 | % | 11/01/40 | 500 | 480,580 | |||||||||||
Pennsylvania (State of) Higher Educational Facilities Authority (Temple University); First Series 2012, RB | 5.00 | % | 04/01/42 | 1,170 | 1,168,175 | |||||||||||
Pennsylvania (State of) Higher Educational Facilities Authority (Trustees of the University of Pennsylvania); Series 2005 C, RB(h) | 5.00 | % | 07/15/38 | 4,700 | 4,710,998 | |||||||||||
Pennsylvania (State of) Higher Educational Facilities Authority (University Properties, Inc.); Series 2010, Student Housing RB | 5.00 | % | 07/01/42 | 1,000 | 888,510 | |||||||||||
Pennsylvania (State of) Turnpike Commission; | ||||||||||||||||
Series 2008 B-1, Sub. RB | 5.50 | % | 06/01/33 | 1,000 | 1,026,750 | |||||||||||
Series 2009 C, Sub. Conv. CAB RB (INS–AGM)(a)(i) | 6.25 | % | 06/01/33 | 2,000 | 1,868,780 | |||||||||||
Series 2009 E, Sub. Conv. CAB RB(i) | 6.38 | % | 12/01/38 | 1,435 | 1,244,403 | |||||||||||
Series 2010 A 1, Motor License Fund Special RB | 5.00 | % | 12/01/38 | 500 | 496,415 | |||||||||||
Series 2010 A-2, Motor License Fund Special Conv. CAB RB(i) | 5.50 | % | 12/01/34 | 1,000 | 903,330 | |||||||||||
Series 2010 B 2, Conv. CAB RB(i) | 5.00 | % | 12/01/30 | 625 | 545,263 | |||||||||||
Series 2010 B 2, Conv. CAB RB(i) | 5.13 | % | 12/01/35 | 500 | 423,170 | |||||||||||
Philadelphia (City of) Hospitals & Higher Education Facilities Authority (Children’s Hospital of Philadelphia); Series 2011, RB | 5.00 | % | 07/01/41 | 570 | 558,212 | |||||||||||
Philadelphia (City of) Hospitals & Higher Education Facilities Authority (Jefferson Health System); Series 2010 B, RB | 5.00 | % | 05/15/40 | 1,500 | 1,440,105 | |||||||||||
Philadelphia (City of) Industrial Development Authority (Architecture & Design Charter High School); Series 2013, RB | 6.13 | % | 03/15/43 | 585 | 498,420 | |||||||||||
Philadelphia (City of) Industrial Development Authority (Discovery Charter School); Series 2012, RB | 6.25 | % | 04/01/42 | 1,000 | 1,006,150 | |||||||||||
Philadelphia (City of) Industrial Development Authority (Independence Charter School); Series 2007 A, RB | 5.50 | % | 09/15/37 | 1,235 | 1,105,029 | |||||||||||
Philadelphia (City of) Industrial Development Authority (MaST Charter School); Series 2010, RB | 6.00 | % | 08/01/35 | 700 | 715,036 | |||||||||||
Philadelphia (City of) Industrial Development Authority (New Foundations Charter School); Series 2012, RB | 6.63 | % | 12/15/41 | 750 | 753,382 | |||||||||||
Philadelphia (City of) Industrial Development Authority (Performing Arts Charter School); Series 2013, RB(j) | 6.50 | % | 06/15/33 | 945 | 921,290 | |||||||||||
Philadelphia (City of) Industrial Development Authority (Please Touch Museum); Series 2006, RB | 5.25 | % | 09/01/31 | 1,250 | 1,014,862 | |||||||||||
Philadelphia (City of) Industrial Development Authority; Series 1990, Commercial Development RB(b) | 7.75 | % | 12/01/17 | 2,505 | 2,506,378 | |||||||||||
Philadelphia (City of); | ||||||||||||||||
Ninth Series 2010, Gas Works RB | 5.25 | % | 08/01/40 | 1,500 | 1,417,425 | |||||||||||
Series 2005 A, Airport RB (INS–NATL)(a)(b) | 5.00 | % | 06/15/25 | 1,000 | 1,035,300 | |||||||||||
Series 2009 A, Ref. Unlimited Tax GO Bonds (INS–AGC)(a) | 5.50 | % | 08/01/24 | 1,000 | 1,075,700 | |||||||||||
Series 2010 C, Water & Wastewater RB (INS–AGM)(a) | 5.00 | % | 08/01/35 | 1,250 | 1,258,662 | |||||||||||
Series 2011, Unlimited Tax GO Bonds | 6.00 | % | 08/01/36 | 500 | 531,020 | |||||||||||
Philadelphia School District; Series 2008 E, Limited Tax GO Bonds (INS–BHAC)(a) | 5.13 | % | 09/01/23 | 1,500 | 1,662,345 | |||||||||||
Pittsburgh (City of) & Allegheny (County of) Sports & Exhibition Authority (Regional Asset District); Series 2010, Ref. Sales Tax RB (INS–AGM)(a) | 5.00 | % | 02/01/31 | 1,000 | 1,016,330 | |||||||||||
Radnor Township School District; | ||||||||||||||||
Series 2005 B, Unlimited Tax GO Bonds(c)(d) | 5.00 | % | 08/15/15 | 130 | 141,567 | |||||||||||
Series 2005 B, Unlimited Tax GO Bonds(c)(d) | 5.00 | % | 08/15/15 | 435 | 473,706 | |||||||||||
Series 2005 B, Unlimited Tax GO Bonds (INS–AGM)(a) | 5.00 | % | 02/15/35 | 435 | 437,480 | |||||||||||
See accompanying Notes to Financial Statements which are an integral part of the financial statements.
11 Invesco Pennsylvania Tax Free Income Fund
Interest Rate | Maturity Date | Principal Amount (000) | Value | |||||||||||||
| Pennsylvania–(continued) | ||||||||||||||||
State Public School Building Authority (Harrisburg School District); Series 2009 A, RB (INS–AGC)(a) | 5.00 | % | 11/15/33 | $ | 1,000 | $ | 1,004,850 | |||||||||
Susquehanna Area Regional Airport Authority; Series 2012 A, Airport System RB(b) | 5.00 | % | 01/01/27 | 750 | 750,503 | |||||||||||
Union (County of) Hospital Authority (Evangelical Community Hospital); Series 2011, Ref. & Improvement RB | 7.00 | % | 08/01/41 | 1,000 | 1,104,310 | |||||||||||
Washington (County of) Industrial Development Authority (Washington Jefferson College); Series 2010, College RB | 5.25 | % | 11/01/30 | 500 | 510,105 | |||||||||||
Washington (County of) Redevelopment Authority (Victory Centre Tanger Outlet Development); Series 2006 A, Tax Allocation RB(c) | 5.45 | % | 07/01/17 | 1,425 | 1,326,903 | |||||||||||
Westmoreland (County of) Industrial Development Authority (Redstone Presbyterian Senior Care Obligated Group); | ||||||||||||||||
Series 2005 A, Retirement Community RB | 5.75 | % | 01/01/26 | 2,500 | 2,474,775 | |||||||||||
Series 2005 A, Retirement Community RB | 5.88 | % | 01/01/32 | 900 | 864,801 | |||||||||||
Westmoreland (County of) Municipal Authority; Series 2013, RB | 5.00 | % | 08/15/31 | 750 | 752,318 | |||||||||||
Wilkes-Barre (City of) Finance Authority (University of Scranton); Series 2010, RB | 5.00 | % | 11/01/40 | 850 | 848,682 | |||||||||||
| 124,887,378 | ||||||||||||||||
| Puerto Rico–5.66% | ||||||||||||||||
Puerto Rico (Commonwealth of) Electric Power Authority; | ||||||||||||||||
Series 2008 WW, RB | 5.50 | % | 07/01/21 | 1,000 | 915,140 | |||||||||||
Series 2008 WW, RB | 5.25 | % | 07/01/33 | 1,500 | 1,097,730 | |||||||||||
Series 2010 XX, RB | 5.75 | % | 07/01/36 | 1,000 | 768,940 | |||||||||||
Puerto Rico (Commonwealth of) Industrial Tourist Educational, Medical & Environmental Control Facilities Financing Authority (Ana G. Mendez University System); Series 2012, Ref. RB | 5.13 | % | 04/01/32 | 500 | 381,930 | |||||||||||
Puerto Rico (Commonwealth of) Infrastructure Financing Authority; Series 2005 C, Ref. Special Tax RB (INS–AMBAC)(a) | 5.50 | % | 07/01/27 | 600 | 480,696 | |||||||||||
Puerto Rico Sales Tax Financing Corp.; | ||||||||||||||||
First Subseries 2010, Conv. CAB RB(i) | 6.25 | % | 08/01/33 | 1,065 | 686,265 | |||||||||||
First Subseries 2010 A, CAB RB(k) | 0.00 | % | 08/01/34 | 3,500 | 790,545 | |||||||||||
First Subseries 2010 A, CAB RB(k) | 0.00 | % | 08/01/35 | 5,000 | 1,042,950 | |||||||||||
First Subseries 2010 A, RB | 5.38 | % | 08/01/39 | 470 | 381,109 | |||||||||||
Series 2011 C, RB | 5.00 | % | 08/01/40 | 1,250 | 1,043,387 | |||||||||||
| 7,588,692 | ||||||||||||||||
| Guam–2.88% | ||||||||||||||||
Guam (Territory of) (Section 30); Series 2009 A, Limited Obligation RB | 5.75 | % | 12/01/34 | 1,250 | 1,278,163 | |||||||||||
Guam (Territory of) Power Authority; | ||||||||||||||||
Series 2010 A, RB | 5.50 | % | 10/01/40 | 410 | 397,630 | |||||||||||
Series 2012 A, Ref. RB | 5.00 | % | 10/01/34 | 520 | 489,616 | |||||||||||
Guam (Territory of) Waterworks Authority; Series 2010, Water & Wastewater System RB | 5.63 | % | 07/01/40 | 1,000 | 943,850 | |||||||||||
Guam (Territory of); Series 2011 A, Business Privilege Tax RB | 5.13 | % | 01/01/42 | 785 | 747,242 | |||||||||||
| 3,856,501 | ||||||||||||||||
| Virgin Islands–0.97% | ||||||||||||||||
Virgin Islands (Government of) Public Finance Authority (Matching Fund Loan Note—Diageo); Series 2009 A, Sub. RB | 6.63 | % | 10/01/29 | 750 | 816,308 | |||||||||||
Virgin Islands (Government of) Public Finance Authority (Matching Fund Loan Note); Series 2010 A, Sr. Lien RB | 5.00 | % | 10/01/29 | 500 | 483,350 | |||||||||||
| 1,299,658 | ||||||||||||||||
TOTAL INVESTMENTS(l)–102.67% (Cost $141,293,916) | 137,632,229 | |||||||||||||||
FLOATING RATE NOTE OBLIGATIONS–(2.34%) | ||||||||||||||||
Note with an interest and fee rate of 0.59% at 08/31/13 and contractual maturity of collateral of 07/15/38 (See Note 1K)(m) | (3,135,000 | ) | ||||||||||||||
OTHER ASSETS LESS LIABILITIES–(0.33%) | (443,476 | ) | ||||||||||||||
NET ASSETS–100.00% | $ | 134,053,753 | ||||||||||||||
See accompanying Notes to Financial Statements which are an integral part of the financial statements.
12 Invesco Pennsylvania Tax Free Income Fund
Investment Abbreviations:
| AGC | – Assured Guaranty Corp. | |
| AGM | – Assured Guaranty Municipal Corp. | |
| AMBAC | – American Municipal Bond Assurance Corp. | |
| BHAC | – Berkshire Hathaway Assurance Corp. | |
| CAB | – Capital Appreciation Bonds | |
| CEP | – Credit Enhancement Provider | |
| Conv. | – Convertible | |
| GNMA | – Government National Mortgage Association | |
| GO | – General Obligation | |
| INS | – Insurer | |
| LOC | – Letter of Credit | |
| NATL | – National Public Finance Guarantee Corp. | |
| PCR | – Pollution Control Revenue Bonds | |
| Radian | – Radian Asset Assurance, Inc. | |
| RB | – Revenue Bonds | |
| Ref. | – Refunding | |
| Sr. | – Senior | |
| Sub. | – Subordinated | |
| VRD | – Variable Rate Demand |
Notes to Schedule of Investments:
| (a) | Principal and/or interest payments are secured by the bond insurance company listed. |
| (b) | Security subject to the alternative minimum tax. |
| (c) | Security has an irrevocable call by the issuer or mandatory put by the holder. Maturity date reflects such call or put. |
| (d) | Advance refunded; secured by an escrow fund of U.S. Government obligations or other highly rated collateral. |
| (e) | Demand security payable upon demand by the Fund at specified time intervals no greater than thirteen months. Interest rate is redetermined periodically. Rate shown is the rate in effect on August 31, 2013. |
| (f) | Principal and interest payments are fully enhanced by a letter of credit from the bank listed or a predecessor bank, branch or subsidiary. |
| (g) | Defaulted security. Currently, the issuer is partially or fully in default with respect to interest payments. The value of this security at August 31, 2013 represented less than 1% of the Fund’s Net Assets. |
| (h) | Underlying security related to Dealer Trusts entered into by the Fund. See Note 1K. |
| (i) | Convertible CAB. The interest rate shown represents the coupon rate at which the bond will accrue at a specified future date. |
| (j) | Security purchased or received in transaction exempt from registration under the Securities Act of 1933, as amended (“the 1933 Act”). The security may be resold pursuant to an exemption from registration under the 1933 Act, typically to qualified institutional buyers. The value of this security at August 31, 2013 represented less than 1% of the Fund’s Net Assets. |
| (k) | Zero coupon bond issued at a discount. |
| (l) | This table provides a listing of those entities that have either issued, guaranteed, backed or otherwise enhanced the credit quality of more than 5% of the securities held in the portfolio. In instances where the entity has guaranteed, backed or otherwise enhanced the credit quality of a security, it is not primarily responsible for the issuer’s obligations but may be called upon to satisfy the issuer’s obligations. |
| Entity | Percentage | |||
Assured Guaranty Municipal Corp. | 5.9 | % | ||
| (m) | Floating rate note obligations related to securities held. The interest rates shown reflect the rates in effect at August 31, 2013. At August 31, 2013, the Fund’s investments with a value of $4,710,998 are held by Dealer Trusts and serve as collateral for the $3,135,000 in the floating rate note obligations outstanding at that date. |
See accompanying Notes to Financial Statements which are an integral part of the financial statements.
13 Invesco Pennsylvania Tax Free Income Fund
Statement of Assets and Liabilities
August 31, 2013
Assets: | ||||
Investments, at value (Cost $141,293,916) | $ | 137,632,229 | ||
Receivable for: | ||||
Fund shares sold | 7,642 | |||
Interest | 1,635,650 | |||
Investment for trustee deferred compensation and retirement plans | 13,677 | |||
Other assets | 723 | |||
Total assets | 139,289,921 | |||
Liabilities: | ||||
Floating rate note obligations | 3,135,000 | |||
Payable for: | ||||
Fund shares reacquired | 402,094 | |||
Amount due custodian | 1,401,589 | |||
Dividends | 178,651 | |||
Accrued fees to affiliates | 46,023 | |||
Accrued trustees’ and officers’ fees and benefits | 3,408 | |||
Accrued other operating expenses | 45,763 | |||
Trustee deferred compensation and retirement plans | 23,640 | |||
Total liabilities | 5,236,168 | |||
Net assets applicable to shares outstanding | $ | 134,053,753 | ||
Net assets consist of: | ||||
Shares of beneficial interest | $ | 144,599,973 | ||
Undistributed net investment income | 275,396 | |||
Undistributed net realized gain (loss) | (7,159,929 | ) | ||
Net unrealized appreciation (depreciation) | (3,661,687 | ) | ||
| $ | 134,053,753 | |||
Net Assets: | ||||
Class A | $ | 118,936,070 | ||
Class B | $ | 1,717,449 | ||
Class C | $ | 10,838,169 | ||
Class Y | $ | 2,562,065 | ||
Shares outstanding, $0.01 par value per share, |
| |||
Class A | 7,729,809 | |||
Class B | 111,383 | |||
Class C | 703,268 | |||
Class Y | 166,374 | |||
Class A: | ||||
Net asset value per share | $ | 15.39 | ||
Maximum offering price per share | ||||
(Net asset value of $15.39 ¸ 95.75%) | $ | 16.07 | ||
Class B: | ||||
Net asset value and offering price per share | $ | 15.42 | ||
Class C: | ||||
Net asset value and offering price per share | $ | 15.41 | ||
Class Y: | ||||
Net asset value and offering price per share | $ | 15.40 | ||
See accompanying Notes to Financial Statements which are an integral part of the financial statements.
14 Invesco Pennsylvania Tax Free Income Fund
Statement of Operations
For the year ended August 31, 2013
Investment income: |
| |||
Interest | $ | 7,144,010 | ||
Expenses: | ||||
Advisory fees | 901,954 | |||
Administrative services fees | 50,000 | |||
Custodian fees | 4,971 | |||
Distribution fees: | ||||
Class A | 334,190 | |||
Class B | 5,459 | |||
Class C | 120,251 | |||
Interest, facilities and maintenance fees | 25,984 | |||
Transfer agent fees | 66,782 | |||
Trustees’ and officers’ fees and benefits | 28,167 | |||
Other | 94,067 | |||
Total expenses | 1,631,825 | |||
Less: Expense offset arrangement(s) | (194 | ) | ||
Net expenses | 1,631,631 | |||
Net investment income | 5,512,379 | |||
Realized and unrealized gain (loss) from: | ||||
Net realized gain (loss) from investment securities | (50,752 | ) | ||
Change in net unrealized appreciation (depreciation) of investment securities | (14,712,745 | ) | ||
Net realized and unrealized gain (loss) | (14,763,497 | ) | ||
Net increase (decrease) in net assets resulting from operations | $ | (9,251,118 | ) | |
See accompanying Notes to Financial Statements which are an integral part of the financial statements.
15 Invesco Pennsylvania Tax Free Income Fund
Statement of Changes in Net Assets
For the years ended August 31, 2013 and 2012
| 2013 | 2012 | |||||||
Operations: | ||||||||
Net investment income | $ | 5,512,379 | $ | 6,008,281 | ||||
Net realized gain (loss) | (50,752 | ) | 165,985 | |||||
Change in net unrealized appreciation (depreciation) | (14,712,745 | ) | 10,524,187 | |||||
Net increase (decrease) in net assets resulting from operations | (9,251,118 | ) | 16,698,453 | |||||
Distributions to shareholders from net investment income: | ||||||||
Class A | (5,070,822 | ) | (5,457,376 | ) | ||||
Class B | (82,884 | ) | (112,050 | ) | ||||
Class C | (363,194 | ) | (345,706 | ) | ||||
Class Y | (89,080 | ) | (22,316 | ) | ||||
Total distributions from net investment income | (5,605,980 | ) | (5,937,448 | ) | ||||
Share transactions–net: | ||||||||
Class A | (5,082,518 | ) | (2,966,173 | ) | ||||
Class B | (517,802 | ) | (836,452 | ) | ||||
Class C | 1,080,821 | 593,058 | ||||||
Class Y | 1,535,814 | 1,088,270 | ||||||
Net increase (decrease) in net assets resulting from share transactions | (2,983,685 | ) | (2,121,297 | ) | ||||
Net increase (decrease) in net assets | (17,840,783 | ) | 8,639,708 | |||||
Net assets: | ||||||||
Beginning of year | 151,894,536 | 143,254,828 | ||||||
End of year (includes undistributed net investment income of $275,396 and $368,687, respectively) | $ | 134,053,753 | $ | 151,894,536 | ||||
Notes to Financial Statements
August 31, 2013
NOTE 1—Significant Accounting Policies
Invesco Pennsylvania Tax Free Income Fund (the “Fund”) is a series portfolio of AIM Counselor Series Trust (Invesco Counselor Series Trust) (the “Trust”). The Trust is a Delaware statutory trust registered under the Investment Company Act of 1940, as amended (the “1940 Act”), as an open-end series management investment company consisting of twelve separate portfolios, each authorized to issue an unlimited number of shares of beneficial interest. The assets, liabilities and operations of each portfolio are accounted for separately. Information presented in these financial statements pertains only to the Fund. Matters affecting each portfolio or class will be voted on exclusively by the shareholders of such portfolio or class.
The Fund’s investment objective is to provide only Pennsylvania investors with a high level of current income exempt from federal and Pennsylvania state income taxes and, where possible under local law, local income and personal property taxes, through investment in a varied portfolio of medium- and lower-grade municipal securities.
The Fund currently consists of four different classes of shares: Class A, Class B, Class C and Class Y. Class A shares are sold with a front-end sales charge unless certain waiver criteria are met and under certain circumstances load waived shares may be subject to contingent deferred sales charges (“CDSC”). Class C shares are sold with a CDSC. Class Y shares are sold at net asset value. Effective November 30, 2010, new or additional investments in Class B shares are no longer permitted. Existing shareholders of Class B shares may continue to reinvest dividends and capital gains distributions in Class B shares until they convert to Class A shares. Also, shareholders in Class B shares will be able to exchange those shares for Class B shares of other Invesco Funds offering such shares until they convert to Class A shares. Generally, Class B shares will automatically convert to Class A shares on or about the month-end, which is at least eight years after the date of purchase. Redemption of Class B shares prior to conversion date will be subject to a CDSC.
The following is a summary of the significant accounting policies followed by the Fund in the preparation of its financial statements.
| A. | Security Valuations — Securities, including restricted securities, are valued according to the following policy. |
Securities are fair valued using an evaluated quote provided by an independent pricing service approved by the Board of Trustees. Evaluated quotes provided by the pricing service may be determined without exclusive reliance on quoted prices, and may reflect appropriate factors such as institution-size trading in similar groups of securities, developments related to specific securities, dividend rate (for unlisted equities), yield (for debt obligations), quality, type of issue, coupon rate (for debt obligations), maturity (for debt obligations), individual trading characteristics and other market data. Debt obligations are subject to interest rate and credit risks. In addition, all debt obligations involve some risk of default with respect to interest and/or principal payments.
Securities for which market quotations either are not readily available or became unreliable are valued at fair value as determined in good faith by or under the supervision of the Trust’s officers following procedures approved by the Board of Trustees. Some of the factors which may be
16 Invesco Pennsylvania Tax Free Income Fund
considered in determining fair value are fundamental analytical data relating to the investment; the nature and duration of any restrictions on transferability or disposition; trading in similar securities by the same issuer or comparable companies; relevant political, economic or issuer specific news; and other relevant factors under the circumstances.
Valuations change in response to many factors including the historical and prospective earnings of the issuer, the value of the issuer’s assets, general economic conditions, interest rates, investor perceptions and market liquidity. Because of the inherent uncertainties of valuation, the values reflected in the financial statements may materially differ from the value received upon actual sale of those investments.
| B. | Securities Transactions and Investment Income — Securities transactions are accounted for on a trade date basis. Realized gains or losses on sales are computed on the basis of specific identification of the securities sold. Interest income is recorded on the accrual basis from settlement date. Dividend income (net of withholding tax, if any) is recorded on the ex-dividend date. Bond premiums and discounts are amortized and/or accreted for financial reporting purposes. |
The Fund may periodically participate in litigation related to Fund investments. As such, the Fund may receive proceeds from litigation settlements. Any proceeds received are included in the Statement of Operations as realized gain (loss) for investments no longer held and as unrealized gain (loss) for investments still held.
Brokerage commissions and mark ups are considered transaction costs and are recorded as an increase to the cost basis of securities purchased and/or a reduction of proceeds on a sale of securities. Such transaction costs are included in the determination of net realized and unrealized gain (loss) from investment securities reported in the Statement of Operations and the Statement of Changes in Net Assets and the net realized and unrealized gains (losses) on securities per share in the Financial Highlights. Transaction costs are included in the calculation of the Fund’s net asset value and, accordingly, they reduce the Fund’s total returns. These transaction costs are not considered operating expenses and are not reflected in net investment income reported in the Statement of Operations and Statement of Changes in Net Assets, or the net investment income per share and ratios of expenses and net investment income reported in the Financial Highlights, nor are they limited by any expense limitation arrangements between the Fund and the investment adviser.
The Fund allocates realized and unrealized capital gains and losses to a class based on the relative net assets of each class. The Fund allocates income to a class based on the relative value of the settled shares of each class.
| C. | Country Determination — For the purposes of making investment selection decisions and presentation in the Schedule of Investments, the investment adviser may determine the country in which an issuer is located and/or credit risk exposure based on various factors. These factors include the laws of the country under which the issuer is organized, where the issuer maintains a principal office, the country in which the issuer derives 50% or more of its total revenues and the country that has the primary market for the issuer’s securities, as well as other criteria. Among the other criteria that may be evaluated for making this determination are the country in which the issuer maintains 50% or more of its assets, the type of security, financial guarantees and enhancements, the nature of the collateral and the sponsor organization. Country of issuer and/or credit risk exposure has been determined to be the United States of America, unless otherwise noted. |
| D. | Distributions — Distributions from income are declared daily and paid monthly. Distributions from net realized capital gain, if any, are generally declared and paid annually and recorded on the ex-dividend date. The Fund may elect to treat a portion of the proceeds from redemptions as distributions for federal income tax purposes. |
| E. | Federal Income Taxes — The Fund intends to comply with the requirements of Subchapter M of the Internal Revenue Code of 1986, as amended (the “Internal Revenue Code”), necessary to qualify as a regulated investment company and to distribute substantially all of the Fund’s taxable and tax-exempt earnings to shareholders. As such, the Fund will not be subject to federal income taxes on otherwise taxable income (including net realized capital gain) that is distributed to shareholders. Therefore, no provision for federal income taxes is recorded in the financial statements. |
In addition, the Fund intends to invest in such municipal securities to allow it to qualify to pay shareholders “exempt-interest dividends”, as defined in the Internal Revenue Code.
The Fund files tax returns in the U.S. Federal jurisdiction and certain other jurisdictions. Generally, the Fund is subject to examinations by such taxing authorities for up to three years after the filing of the return for the tax period.
| F. | Expenses — Fees provided for under the Rule 12b-1 plan of a particular class of the Fund and which are directly attributable to that class are charged to the operations of such class. All other expenses are allocated among the classes based on relative net assets. Prior to June 1, 2010, incremental transfer agency fees which were unique to each class of shares were charged to the operations of such class. |
| G. | Interest, Facilities and Maintenance Fees — Interest, Facilities and Maintenance Fees include interest and related borrowing costs such as commitment fees and other expenses associated with lines of credit and interest and administrative expenses related to establishing and maintaining floating rate note obligations, if any. |
| H. | Accounting Estimates — The preparation of financial statements in conformity with accounting principles generally accepted in the United States of America (“GAAP”) requires management to make estimates and assumptions that affect the reported amounts of assets and liabilities at the date of the financial statements and the reported amounts of revenues and expenses during the reporting period including estimates and assumptions related to taxation. Actual results could differ from those estimates by a significant amount. In addition, the Fund monitors for material events or transactions that may occur or become known after the period-end date and before the date the financial statements are released to print. |
| I. | Indemnifications — Under the Trust’s organizational documents, each Trustee, officer, employee or other agent of the Trust is indemnified against certain liabilities that may arise out of the performance of their duties to the Fund. Additionally, in the normal course of business, the Fund enters into contracts, including the Fund’s servicing agreements, that contain a variety of indemnification clauses. The Fund’s maximum exposure under these arrangements is unknown as this would involve future claims that may be made against the Fund that have not yet occurred. The risk of material loss as a result of such indemnification claims is considered remote. |
| J. | Other Risks — The value of, payment of interest on, repayment of principal for and the ability to sell a municipal security may be affected by constitutional amendments, legislative enactments, executive orders, administrative regulations, voter initiatives and the economics of the regions in which the issuers are located. |
Since many municipal securities are issued to finance similar projects, especially those relating to education, health care, transportation and utilities, conditions in those sectors can affect the overall municipal securities market and a Fund’s investments in municipal securities.
There is some risk that a portion or all of the interest received from certain tax-free municipal securities could become taxable as a result of determinations by the Internal Revenue Service.
17 Invesco Pennsylvania Tax Free Income Fund
| K. | Floating Rate Note Obligations — The Fund invests in inverse floating rate securities, such as Residual Interest Bonds (“RIBs”) or Tender Option Bonds (“TOBs”) for investment purposes and to enhance the yield of the Fund. Inverse floating rate investments tend to underperform the market for fixed rate bonds in a rising interest rate environment, but tend to outperform the market for fixed rate bonds when interest rates decline or remain relatively stable. Such transactions may be purchased in the secondary market without first owning the underlying bond or by the sale of fixed rate bonds by the Fund to special purpose trusts established by a broker dealer (“Dealer Trusts”) in exchange for cash and residual interests in the Dealer Trusts’ assets and cash flows, which are in the form of inverse floating rate securities. The Dealer Trusts finance the purchases of the fixed rate bonds by issuing floating rate notes to third parties and allowing the Fund to retain residual interests in the bonds. The floating rate notes issued by the Dealer Trusts have interest rates that reset weekly and the floating rate note holders have the option to tender their notes to the Dealer Trusts for redemption at par at each reset date. The residual interests held by the Fund (inverse floating rate investments) include the right of the Fund (1) to cause the holders of the floating rate notes to tender their notes at par at the next interest rate reset date, and (2) to transfer the municipal bond from the Dealer Trusts to the Fund, thereby collapsing the Dealer Trusts. |
TOBs are presently classified as private placement securities. Private placement securities are subject to restrictions on resale because they have not been registered under the Securities Act of 1933, as amended (the “1933 Act”), or are otherwise not readily marketable. As a result of the absence of a public trading market for these securities, they may be less liquid than publicly traded securities. Although these securities may be resold in privately negotiated transactions, the prices realized from these sales could be less than those originally paid by the Fund or less than what may be considered the fair value of such securities.
The Fund accounts for the transfer of bonds to the Dealer Trusts as secured borrowings, with the securities transferred remaining in the Fund’s investment assets, and the related floating rate notes reflected as Fund liabilities under the caption Floating rate note obligations on the Statement of Assets and Liabilities. The Fund records the interest income from the fixed rate bonds under the caption Interest and records the expenses related to floating rate obligations and any administrative expenses of the Dealer Trusts as a component of Interest, facilities and maintenance fees on the Statement of Operations.
The Fund generally invests in inverse floating rate securities that include embedded leverage, thus exposing the Fund to greater risks and increased costs. The primary risks associated with inverse floating rate securities are varying degrees of liquidity and the changes in the value of such securities in response to changes in market rates of interest to a greater extent than the value of an equal principal amount of a fixed rate security having similar credit quality, redemption provisions and maturity which may cause the Fund’s net asset value to be more volatile than if it had not invested in inverse floating rate securities. In certain instances, the short-term floating rate interests created by the special purpose trust may not be able to be sold to third parties or, in the case of holders tendering (or putting) such interests for repayment of principal, may not be able to be remarketed to third parties. In such cases, the special purpose trust holding the long-term fixed rate bonds may be collapsed. In the case of RIBs or TOBs created by the contribution of long-term fixed income bonds by the Fund, the Fund will then be required to repay the principal amount of the tendered securities. During times of market volatility, illiquidity or uncertainty, the Fund could be required to sell other portfolio holdings at a disadvantageous time to raise cash to meet that obligation.
NOTE 2—Advisory Fees and Other Fees Paid to Affiliates
The Trust has entered into a master investment advisory agreement with Invesco Advisers, Inc. (the “Adviser” or “Invesco”). Under the terms of the investment advisory agreement, the Fund pays an advisory fee to the Adviser based on the annual rate of the Fund’s average daily net assets as follows:
| Average Daily Net Assets | Rate | |||
First $500 million | 0.60% | |||
Over $500 million | 0.50% | |||
Under the terms of a master sub-advisory agreement between the Adviser and each of Invesco Asset Management Deutschland GmbH, Invesco Asset Management Limited, Invesco Asset Management (Japan) Limited, Invesco Australia Limited, Invesco Hong Kong Limited, Invesco Senior Secured Management, Inc. and Invesco Canada Ltd. (collectively, the “Affiliated Sub-Advisers”) the Adviser, not the Fund, may pay 40% of the fees paid to the Adviser to any such Affiliated Sub-Adviser(s) that provide(s) discretionary investment management services to the Fund based on the percentage of assets allocated to such Sub-Adviser(s).
The Adviser has contractually agreed, through at least June 30, 2014, to waive advisory fees and/or reimburse expenses to the extent necessary to limit total annual fund operating expenses after fee waiver and/or expense reimbursement (excluding certain items discussed below) of Class A, Class B, Class C and Class Y shares to 1.50%, 2.25%, 2.25% and 1.25% of average daily net assets, respectively. In determining the Adviser’s obligation to waive advisory fees and/or reimburse expenses, the following expenses are not taken into account, and could cause total annual fund operating expenses after fee waiver and/or reimbursement to exceed the numbers reflected above: (1) interest, facilities and maintenance fees; (2) taxes; (3) dividend expense on short sales; (4) extraordinary or non-routine items, including litigation expenses; and (5) expenses that the Fund has incurred but did not actually pay because of an expense offset arrangement. Unless the Board of Trustees and Invesco mutually agree to amend or continue the fee waiver agreement, it will terminate on June 30, 2014. The Adviser did not waive fees and/or reimburse expenses during the period under this expense limitation.
The Trust has entered into a master administrative services agreement with Invesco pursuant to which the Fund has agreed to pay Invesco for certain administrative costs incurred in providing accounting services to the Fund. For the year ended August 31, 2013, expenses incurred under the agreement are shown in the Statement of Operations as Administrative services fees.
The Trust has entered into a transfer agency and service agreement with Invesco Investment Services, Inc. (“IIS”) pursuant to which the Fund has agreed to pay IIS a fee for providing transfer agency and shareholder services to the Fund and reimburse IIS for certain expenses incurred by IIS in the course of providing such services. IIS may make payments to intermediaries that provide omnibus account services, sub-accounting services and/or networking services. All fees payable by IIS to intermediaries that provide omnibus account services or sub-accounting are charged back to the Fund, subject to certain limitations approved by the Trust’s Board of Trustees. For the year ended August 31, 2013, the expenses incurred under the agreement are shown in the Statement of Operations as Transfer agent fees.
18 Invesco Pennsylvania Tax Free Income Fund
Shares of the Fund are distributed by Invesco Distributors, Inc. (“IDI”). The Fund has adopted a distribution plan pursuant to Rule 12b-1 under the 1940 Act, and a service plan (collectively, the “Plans”) for Class A shares, Class B shares and Class C shares to compensate IDI for the sale, distribution, shareholder servicing and maintenance of shareholder accounts for these shares. Under the Plans, the Fund will incur annual fees of up to 0.25% of Class A average daily net assets and up to 1.00% each of Class B and Class C average daily net assets.
With respect to Class B and Class C shares, the Fund is authorized to reimburse in future years any distribution related expenses that exceed the maximum annual reimbursement rate for such class, so long as such reimbursement does not cause the Fund to exceed the Class B and Class C maximum annual reimbursement rate, respectively. With respect to Class A shares, distribution related expenses that exceed the maximum annual reimbursement rate for such class are not carried forward to future years and the Fund will not reimburse IDI for any such expenses.
For the year ended August 31, 2013, expenses incurred under these agreements are shown in the Statement of Operations as Distribution fees.
Front-end sales commissions and CDSC (collectively, the “sales charges”) are not recorded as expenses of the Fund. Front-end sales commissions are deducted from proceeds from the sales of Fund shares prior to investment in Class A shares of the Fund. CDSC are deducted from redemption proceeds prior to remittance to the shareholder. During the year ended August 31, 2013, IDI advised the Fund that IDI retained $13,864 in front-end sales commissions from the sale of Class A shares and $1,466 and $82 from Class B and Class C shares, respectively, for CDSC imposed on redemptions by shareholders.
Certain officers and trustees of the Trust are officers and directors of the Adviser, IIS and/or IDI.
NOTE 3—Additional Valuation Information
GAAP defines fair value as the price that would be received to sell an asset or paid to transfer a liability in an orderly transaction between market participants at the measurement date, under current market conditions. GAAP establishes a hierarchy that prioritizes the inputs to valuation methods, giving the highest priority to readily available unadjusted quoted prices in an active market for identical assets (Level 1) and the lowest priority to significant unobservable inputs (Level 3), generally when market prices are not readily available or are unreliable. Based on the valuation inputs, the securities or other investments are tiered into one of three levels. Changes in valuation methods may result in transfers in or out of an investment’s assigned level:
| Level 1 — | Prices are determined using quoted prices in an active market for identical assets. |
| Level 2 — | Prices are determined using other significant observable inputs. Observable inputs are inputs that other market participants may use in pricing a security. These may include quoted prices for similar securities, interest rates, prepayment speeds, credit risk, yield curves, loss severities, default rates, discount rates, volatilities and others. |
| Level 3 — | Prices are determined using significant unobservable inputs. In situations where quoted prices or observable inputs are unavailable (for example, when there is little or no market activity for an investment at the end of the period), unobservable inputs may be used. Unobservable inputs reflect the Fund’s own assumptions about the factors market participants would use in determining fair value of the securities or instruments and would be based on the best available information. |
As of August 31, 2013, all of the securities in this Fund were valued based on Level 2 inputs (see the Schedule of Investments for security categories). The level assigned to the securities valuations may not be an indication of the risk or liquidity associated with investing in those securities. Because of the inherent uncertainties of valuation, the values reflected in the financial statements may materially differ from the value received upon actual sale of those investments.
NOTE 4—Expense Offset Arrangement(s)
The expense offset arrangement is comprised of transfer agency credits which result from balances in Demand Deposit Accounts (DDA) used by the transfer agent for clearing shareholder transactions. For the year ended August 31, 2013, the Fund received credits from this arrangement, which resulted in the reduction of the Fund’s total expenses of $194.
NOTE 5—Trustees’ and Officers’ Fees and Benefits
“Trustees’ and Officers’ Fees and Benefits” include amounts accrued by the Fund to pay remuneration to certain Trustees and Officers of the Fund. Trustees have the option to defer compensation payable by the Fund, and “Trustees’ and Officers’ Fees and Benefits” also include amounts accrued by the Fund to fund such deferred compensation amounts. Those Trustees who defer compensation have the option to select various Invesco Funds in which their deferral accounts shall be deemed to be invested. Finally, certain current Trustees are eligible to participate in a retirement plan that provides for benefits to be paid upon retirement to Trustees over a period of time based on the number of years of service. The Fund may have certain former Trustees who also participate in a retirement plan and receive benefits under such plan. “Trustees’ and Officers’ Fees and Benefits” include amounts accrued by the Fund to fund such retirement benefits. Obligations under the deferred compensation and retirement plans represent unsecured claims against the general assets of the Fund.
NOTE 6—Cash Balances and Borrowings
The Fund is permitted to temporarily carry a negative or overdrawn balance in its account with State Street Bank and Trust Company (“SSB”), the custodian bank. Such balances, if any at period end, are shown in the Statement of Assets and Liabilities under the payable caption Amount due custodian. To compensate the custodian bank for such overdrafts, the overdrawn Fund may either (1) leave funds as a compensating balance in the account so the custodian bank can be compensated by earning the additional interest; or (2) compensate by paying the custodian bank at a rate agreed upon by the custodian bank and Invesco, not to exceed the contractually agreed upon rate.
Inverse floating rate obligations resulting from the transfer of bonds to Dealer Trusts are accounted for as secured borrowings. The average floating rate notes outstanding and average annual interest and fee rate related to inverse floating rate note obligations during the year ended August 31, 2013 were $3,135,000 and 0.83%, respectively.
19 Invesco Pennsylvania Tax Free Income Fund
NOTE 7—Distributions to Shareholders and Tax Components of Net Assets
Tax Character of Distributions to Shareholders Paid During the Years Ended August 31, 2013 and 2012:
| 2013 | 2012 | |||||||
Tax-exempt income | $ | 5,605,980 | $ | 5,937,448 | ||||
Tax Components of Net Assets at Period-End:
| 2013 | ||||
Undistributed ordinary income | $ | 37,491 | ||
Net unrealized appreciation (depreciation) — investments | (3,472,231 | ) | ||
Temporary book/tax differences | (21,774 | ) | ||
Post-October deferrals | (439,674 | ) | ||
Capital loss carryforward | (6,650,032 | ) | ||
Shares of beneficial interest | 144,599,973 | |||
Total net assets | $ | 134,053,753 | ||
The difference between book-basis and tax-basis unrealized appreciation (depreciation) is due to differences in the timing of recognition of gains and losses on investments for tax and book purposes. The Fund’s net unrealized appreciation (depreciation) difference is attributable primarily to TOBs and book to tax accretion and amortization differences.
The temporary book/tax differences are a result of timing differences between book and tax recognition of income and/or expenses. The Fund’s temporary book/tax differences are the result of the trustee deferral of compensation and retirement plan benefits.
Capital loss carryforward is calculated and reported as of a specific date. Results of transactions and other activity after that date may affect the amount of capital loss carryforward actually available for the Fund to utilize. The Regulated Investment Company Modernization Act of 2010 eliminated the eight-year carryover period for capital losses that arise in taxable years beginning after its enactment date of December 22, 2010. Consequently, these capital losses can be carried forward for an unlimited period. However, capital losses with an expiration period may not be used to offset capital gains until all net capital losses without an expiration date have been utilized. Additionally, post-enactment capital loss carryovers will retain their character as either short-term or long-term capital losses instead of as short-term capital losses as under prior law. The ability to utilize capital loss carryforward in the future may be limited under the Internal Revenue Code and related regulations based on the results of future transactions.
The Fund utilized $388,920 of capital loss carryforward in the current period to offset net realized capital gain for federal income tax purposes. The Fund has a capital loss carryforward as of August 31, 2013, which expires as follows:
| Capital Loss Carryforward* | ||||||||||||
| Expiration | Short-Term | Long-Term | Total | |||||||||
August 31, 2017 | $ | 5,564,499 | $ | — | $ | 5,564,499 | ||||||
August 31, 2018 | 1,085,533 | — | 1,085,533 | |||||||||
| $ | 6,650,032 | $ | — | $ | 6,650,032 | |||||||
| * | Capital loss carryforward as of the date listed above is reduced for limitations, if any, to the extent required by the Internal Revenue Code. |
NOTE 8—Investment Securities
The aggregate amount of investment securities (other than short-term securities, U.S. Treasury obligations and money market funds, if any) purchased and sold by the Fund during the year ended August 31, 2013 was $25,528,486 and $29,429,290, respectively. Cost of investments on a tax basis includes the adjustments for financial reporting purposes as of the most recently completed federal income tax reporting period-end.
| Unrealized Appreciation (Depreciation) of Investment Securities on a Tax Basis | ||||
Aggregate unrealized appreciation of investment securities | $ | 3,579,626 | ||
Aggregate unrealized (depreciation) of investment securities | (7,051,857 | ) | ||
Net unrealized appreciation (depreciation) of investment securities | $ | (3,472,231 | ) | |
Cost of investments for tax purposes is $141,104,460.
NOTE 9—Reclassification of Permanent Differences
Primarily as a result of differing book/tax treatment of taxable income, on August 31, 2013, undistributed net investment income was increased by $310 and shares of beneficial interest was decreased by $310. This reclassification had no effect on the net assets of the Fund.
20 Invesco Pennsylvania Tax Free Income Fund
NOTE 10—Share Information
| Summary of Share Activity | ||||||||||||||||
| Years ended August 31, | ||||||||||||||||
| 2013(a) | 2012 | |||||||||||||||
| Shares | Amount | Shares | Amount | |||||||||||||
Sold: | ||||||||||||||||
Class A | 450,184 | $ | 7,639,044 | 367,448 | $ | 6,090,660 | ||||||||||
Class B | 5,503 | 93,969 | 4,343 | 70,764 | ||||||||||||
Class C | 184,917 | 3,140,149 | 56,273 | 928,944 | ||||||||||||
Class Y | 101,607 | 1,723,234 | 64,277 | 1,080,787 | ||||||||||||
Issued as reinvestment of dividends: | ||||||||||||||||
Class A | 180,058 | 3,021,259 | 199,465 | 3,302,287 | ||||||||||||
Class B | 2,552 | 43,042 | 3,625 | 60,091 | ||||||||||||
Class C | 14,232 | 238,987 | 13,417 | 222,487 | ||||||||||||
Class Y | 2,657 | 44,358 | 733 | 12,371 | ||||||||||||
Automatic conversion of Class B shares to Class A shares: | ||||||||||||||||
Class A | 22,964 | 390,112 | 31,384 | 516,897 | ||||||||||||
Class B | (22,918 | ) | (390,112 | ) | (32,316 | ) | (516,897 | ) | ||||||||
Reacquired: | ||||||||||||||||
Class A | (964,811 | ) | (16,132,933 | ) | (779,352 | ) | (12,876,017 | ) | ||||||||
Class B | (15,957 | ) | (264,701 | ) | (26,501 | ) | (450,410 | ) | ||||||||
Class C | (141,067 | ) | (2,298,315 | ) | (33,582 | ) | (558,373 | ) | ||||||||
Class Y | (13,921 | ) | (231,778 | ) | (289 | ) | (4,888 | ) | ||||||||
Net increase (decrease) in share activity | (194,000 | ) | $ | (2,983,685 | ) | (131,075 | ) | $ | (2,121,297 | ) | ||||||
| (a) | There are entities that are record owners of more than 5% of the outstanding shares of the Fund and in the aggregate own 45% of the outstanding shares of the Fund. IDI has an agreement with these entities to sell Fund shares. The Fund, Invesco and/or Invesco affiliates may make payments to these entities, which are considered to be related to the Fund, for providing services to the Fund, Invesco and/or Invesco affiliates including but not limited to services such as securities brokerage, distribution, third party record keeping and account servicing. The Fund has no knowledge as to whether all or any portion of the shares owned of record by these entities are also owned beneficially. |
21 Invesco Pennsylvania Tax Free Income Fund
NOTE 11—Financial Highlights
The following schedule presents financial highlights for a share of the Fund outstanding throughout the periods indicated.
| Net asset value, beginning of period | Net investment income(a) | Net gains (losses) on securities (both realized and unrealized) | Total from investment operations | Dividends from net investment income | Distributions from net realized gains | Total distributions | Net asset value, end of period | Total return | Net assets, end of period (000’s omitted) | Ratio of expenses to average net assets with fee waivers and/or expenses absorbed | Supplemental ratio: Ratio of expenses to average net assets (excluding interest, facilities and maintenance fees)(b) | Ratio of net investment income to average net assets | Portfolio turnover(c) | |||||||||||||||||||||||||||||||||||||||||||
Class A |
| |||||||||||||||||||||||||||||||||||||||||||||||||||||||
Year ended 08/31/13 | $ | 17.05 | $ | 0.63 | $ | (1.65 | ) | $ | (1.02 | ) | $ | (0.64 | ) | $ | — | $ | (0.64 | ) | $ | 15.39 | (6.24 | )%(d) | $ | 118,936 | 1.03 | %(e) | 1.01 | %(e) | 3.72 | %(e) | 17 | % | ||||||||||||||||||||||||
Year ended 08/31/12 | 15.85 | 0.68 | 1.19 | 1.87 | (0.67 | ) | — | (0.67 | ) | 17.05 | 12.04 | (d) | 137,146 | 1.03 | 1.01 | 4.13 | 11 | |||||||||||||||||||||||||||||||||||||||
Year ended 08/31/11 | 16.29 | 0.70 | (0.47 | ) | 0.23 | (0.67 | ) | — | (0.67 | ) | 15.85 | 1.58 | (d) | 130,344 | 1.02 | 1.00 | 4.47 | 13 | ||||||||||||||||||||||||||||||||||||||
Period ended 08/31/10 | 15.93 | 0.66 | 0.38 | 1.04 | (0.68 | ) | — | (0.68 | ) | 16.29 | 6.74 | (d) | 141,406 | 1.14 | (f) | 1.10 | (f) | 4.54 | (f) | 15 | ||||||||||||||||||||||||||||||||||||
Year ended 09/30/09 | 14.76 | 0.73 | 1.18 | 1.91 | (0.74 | ) | — | (0.74 | ) | 15.93 | 13.60 | (g) | 141,191 | 1.21 | 1.13 | 5.05 | 17 | |||||||||||||||||||||||||||||||||||||||
Year ended 09/30/08 | 16.84 | 0.72 | (2.03 | ) | (1.31 | ) | (0.73 | ) | (0.04 | ) | (0.77 | ) | 14.76 | (8.02 | )(g) | 137,435 | 1.32 | 1.06 | 4.43 | 25 | ||||||||||||||||||||||||||||||||||||
Class B | ||||||||||||||||||||||||||||||||||||||||||||||||||||||||
Year ended 08/31/13 | 17.09 | 0.63 | (1.66 | ) | (1.03 | ) | (0.64 | ) | — | (0.64 | ) | 15.42 | (6.28 | )(d)(h) | 1,717 | 1.03 | (e)(h) | 1.01 | (e)(h) | 3.72 | (e)(h) | 17 | ||||||||||||||||||||||||||||||||||
Year ended 08/31/12 | 15.86 | 0.71 | 1.19 | 1.90 | (0.67 | ) | — | (0.67 | ) | 17.09 | 12.22 | (d) | 2,430 | 0.86 | 0.84 | 4.30 | 11 | |||||||||||||||||||||||||||||||||||||||
Year ended 08/31/11 | 16.23 | 0.70 | (0.45 | ) | 0.25 | (0.62 | ) | — | (0.62 | ) | 15.86 | 1.68 | (d)(h) | 3,062 | 1.02 | (h) | 1.00 | (h) | 4.47 | (h) | 13 | |||||||||||||||||||||||||||||||||||
Period ended 08/31/10 | 15.89 | 0.59 | 0.38 | 0.97 | (0.63 | ) | — | (0.63 | ) | 16.23 | 6.27 | (d)(h) | 4,682 | 1.64 | (f)(h) | 1.60 | (f)(h) | 4.05 | (f)(h) | 15 | ||||||||||||||||||||||||||||||||||||
Year ended 09/30/09 | 14.72 | 0.68 | 1.18 | 1.86 | (0.69 | ) | — | (0.69 | ) | 15.89 | 13.21 | (i)(j) | 5,364 | 1.57 | (j) | 1.49 | (j) | 4.70 | (j) | 17 | ||||||||||||||||||||||||||||||||||||
Year ended 09/30/08 | 16.78 | 0.63 | (2.01 | ) | (1.38 | ) | (0.64 | ) | (0.04 | ) | (0.68 | ) | 14.72 | (8.46 | )(i)(j) | 6,161 | 1.81 | (j) | 1.55 | (j) | 3.94 | (j) | 25 | |||||||||||||||||||||||||||||||||
Class C | ||||||||||||||||||||||||||||||||||||||||||||||||||||||||
Year ended 08/31/13 | 17.08 | 0.50 | (1.66 | ) | (1.16 | ) | (0.51 | ) | — | (0.51 | ) | 15.41 | (7.00 | )(d) | 10,838 | 1.78 | (e) | 1.76 | (e) | 2.97 | (e) | 17 | ||||||||||||||||||||||||||||||||||
Year ended 08/31/12 | 15.88 | 0.56 | 1.19 | 1.75 | (0.55 | ) | — | (0.55 | ) | 17.08 | 11.19 | (d) | 11,020 | 1.78 | 1.76 | 3.38 | 11 | |||||||||||||||||||||||||||||||||||||||
Year ended 08/31/11 | 16.31 | 0.58 | (0.45 | ) | 0.13 | (0.56 | ) | — | (0.56 | ) | 15.88 | 0.89 | (d) | 9,670 | 1.77 | 1.75 | 3.72 | 13 | ||||||||||||||||||||||||||||||||||||||
Period ended 08/31/10 | 15.95 | 0.55 | 0.38 | 0.93 | (0.57 | ) | — | (0.57 | ) | 16.31 | 6.01 | (d) | 11,083 | 1.89 | (f) | 1.85 | (f) | 3.79 | (f) | 15 | ||||||||||||||||||||||||||||||||||||
Year ended 09/30/09 | 14.78 | 0.62 | 1.18 | 1.80 | (0.63 | ) | — | (0.63 | ) | 15.95 | 12.74 | (k) | 6,776 | 1.96 | 1.89 | 4.28 | 17 | |||||||||||||||||||||||||||||||||||||||
Year ended 09/30/08 | 16.86 | 0.59 | (2.02 | ) | (1.43 | ) | (0.61 | ) | (0.04 | ) | (0.65 | ) | 14.78 | (8.71 | )(k) | 4,546 | 2.07 | 1.81 | 3.68 | 25 | ||||||||||||||||||||||||||||||||||||
Class Y | ||||||||||||||||||||||||||||||||||||||||||||||||||||||||
Year ended 08/31/13 | 17.06 | 0.67 | (1.65 | ) | (0.98 | ) | (0.68 | ) | — | (0.68 | ) | 15.40 | (6.00 | )(d) | 2,562 | 0.78 | (e) | 0.76 | (e) | 3.97 | (e) | 17 | ||||||||||||||||||||||||||||||||||
Year ended 08/31/12 | 15.86 | 0.73 | 1.18 | 1.91 | (0.71 | ) | — | (0.71 | ) | 17.06 | 12.31 | (d) | 1,298 | 0.78 | 0.76 | 4.38 | 11 | |||||||||||||||||||||||||||||||||||||||
Year ended 08/31/11 | 16.30 | 0.74 | (0.47 | ) | 0.27 | (0.71 | ) | — | (0.71 | ) | 15.86 | 1.84 | (d) | 179 | 0.77 | 0.75 | 4.72 | 13 | ||||||||||||||||||||||||||||||||||||||
Period ended 08/31/10(l) | 15.94 | 0.19 | 0.36 | 0.55 | (0.19 | ) | — | (0.19 | ) | 16.30 | 3.49 | (d) | 167 | 0.85 | (f) | 0.81 | (f) | 4.75 | (f) | 15 | ||||||||||||||||||||||||||||||||||||
| (a) | Calculated using average shares outstanding. |
| (b) | For the years ended September 30, 2010 and prior, ratio does not exclude facilities and maintenance fees. |
| (c) | Portfolio turnover is calculated at the fund level and is not annualized for periods less than one year, if applicable. |
| (d) | Includes adjustments in accordance with accounting principles generally accepted in the United States of America and as such, the net asset value for financial reporting purposes and the returns based upon those net asset values may differ from the net asset value and returns for shareholder transactions. Does not include sales charges and is not annualized for periods less than one year, if applicable. |
| (e) | Ratios are based on average daily net assets (000’s omitted) of $133,890, $2,184, $12,025 and $2,227 for Class A, Class B, Class C and Class Y shares, respectively. |
| (f) | Annualized. |
| (g) | Assumes reinvestment of all distributions for the period and does not include payment of the maximum sales charge of 4.75% or contingent deferred sales charge (CDSC). On purchases of $1 million or more, a CDSC of 1% may be imposed on certain redemptions made within eighteen months of purchase. If the sales charges were included, total returns would be lower. These returns include combined Rule 12b-1 fees and service fees of up to 0.25% and do not reflect the deduction of taxes that a shareholder would pay on Fund distributions or the redemption of Fund shares. |
| (h) | The total return, ratio of expenses to average net assets and ratio of net investment income (loss) to average net assets reflect actual 12b-1 fees of 0.25%, 0.25% and 0.74% for the years ended August 31, 2013 and August 31, 2011 and the period ended August 31, 2010, respectively. |
| (i) | Assumes reinvestment of all distributions for the period and does not include payment of the maximum CDSC of 5%, charged on certain redemptions made within one year of purchase and declining to 0% after the fifth year. If the sales charge was included, total returns would be lower. These returns include combined Rule 12b-1 fees and service fees of up to 1% and do not reflect the deduction of taxes that a shareholder would pay on Fund distributions or the redemption of Fund shares. |
| (j) | The Total return, Ratio of expenses to average net assets and Ratio of net investment income (loss) to average net assets reflect actual 12b-1 fees of less than 1%. |
| (k) | Assumes reinvestment of all distributions for the period and does not include payment of the maximum CDSC of 1%, charged on certain redemptions made within one year of purchase. If the sales charge was included, total returns would be lower. These returns include combined Rule 12b-1 fees and service fees of up to 1% and do not reflect the deduction of taxes that a shareholder would pay on Fund distributions or the redemption of Fund shares. |
| (l) | Commencement date of June 1, 2010. |
22 Invesco Pennsylvania Tax Free Income Fund
Report of Independent Registered Public Accounting Firm
To the Board of Trustees of AIM Counselor Series Trust (Invesco Counselor Series Trust)
and Shareholders of Invesco Pennsylvania Tax Free Income Fund:
In our opinion, the accompanying statement of assets and liabilities, including the schedule of investments, and the related statements of operations and of changes in net assets and the financial highlights present fairly, in all material respects, the financial position of Invesco Pennsylvania Tax Free Income Fund (one of the funds constituting AIM Counselor Series Trust (Invesco Counselor Series Trust), hereafter referred to as the “Fund”) at August 31, 2013, the results of its operations for the year then ended, the changes in its net assets for each of the two years in the period then ended and the financial highlights for each of the three years in the period then ended and the eleven month period ended August 31, 2010, in conformity with accounting principles generally accepted in the United States of America. These financial statements and financial highlights (hereafter referred to as “financial statements”) are the responsibility of the Fund’s management; our responsibility is to express an opinion on these financial statements based on our audits. We conducted our audits of these financial statements in accordance with the standards of the Public Company Accounting Oversight Board (United States). Those standards require that we plan and perform the audit to obtain reasonable assurance about whether the financial statements are free of material misstatement. An audit includes examining, on a test basis, evidence supporting the amounts and disclosures in the financial statements, assessing the accounting principles used and significant estimates made by management, and evaluating the overall financial statement presentation. We believe that our audits, which included confirmation of securities at August 31, 2013 by correspondence with the custodian and brokers, provide a reasonable basis for our opinion. The financial highlights of the Fund for the periods ended September 30, 2009 and prior were audited by another independent registered public accounting firm whose report dated November 20, 2009 expressed an unqualified opinion on those financial statements.
PRICEWATERHOUSECOOPERS LLP
October 25, 2013
Houston, Texas
23 Invesco Pennsylvania Tax Free Income Fund
Calculating your ongoing Fund expenses
Example
As a shareholder of the Fund, you incur two types of costs: (1) transaction costs, which may include sales charges (loads) on purchase payments or contingent deferred sales charges on redemptions, if any; and (2) ongoing costs, including management fees, distribution and/or service (12b-1) fees, and other Fund expenses. This example is intended to help you understand your ongoing costs (in dollars) of investing in the Fund and to compare these costs with ongoing costs of investing in other mutual funds. The example is based on an investment of $1,000 invested at the beginning of the period and held for the entire period March 1, 2013 through August 31, 2013.
Actual expenses
The table below provides information about actual account values and actual expenses. You may use the information in this table, together with the amount you invested, to estimate the expenses that you paid over the period. Simply divide your account value by $1,000 (for example, an $8,600 account value divided by $1,000 = 8.6), then multiply the result by the number in the table under the heading entitled “Actual Expenses Paid During Period” to estimate the expenses you paid on your account during this period.
Hypothetical example for comparison purposes
The table below also provides information about hypothetical account values and hypothetical expenses based on the Fund’s actual expense ratio and an assumed rate of return of 5% per year before expenses, which is not the Fund’s actual return.
The hypothetical account values and expenses may not be used to estimate the actual ending account balance or expenses you paid for the period. You may use this information to compare the ongoing costs of investing in the Fund and other funds. To do so, compare this 5% hypothetical example with the 5% hypothetical examples that appear in the shareholder reports of the other funds.
Please note that the expenses shown in the table are meant to highlight your ongoing costs only and do not reflect any transaction costs, such as sales charges (loads) on purchase payments or contingent deferred sales charges on redemptions, if any. Therefore, the hypothetical information is useful in comparing ongoing costs only, and will not help you determine the relative total costs of owning different funds. In addition, if these transaction costs were included, your costs would have been higher.
| Class | Beginning Account Value (03/01/13) | ACTUAL | HYPOTHETICAL (5% annual return before | Annualized Expense Ratio | ||||||||||||||||||||
| Ending Account Value (08/31/13)1 | Expenses Paid During Period2 | Ending Account Value (08/31/13) | Expenses Paid During Period2 | |||||||||||||||||||||
| A | $ | 1,000.00 | $ | 915.60 | $ | 5.02 | $ | 1,019.96 | $ | 5.30 | 1.04 | % | ||||||||||||
| B | 1,000.00 | 915.80 | 5.02 | 1,019.96 | 5.30 | 1.04 | ||||||||||||||||||
| C | 1,000.00 | 912.20 | 8.63 | 1,016.18 | 9.10 | 1.79 | ||||||||||||||||||
| Y | 1,000.00 | 916.80 | 3.82 | 1,021.22 | 4.02 | 0.79 | ||||||||||||||||||
| 1 | The actual ending account value is based on the actual total return of the Fund for the period March 1, 2013 through August 31, 2013, after actual expenses and will differ from the hypothetical ending account value which is based on the Fund’s expense ratio and a hypothetical annual return of 5% before expenses. |
| 2 | Expenses are equal to the Fund’s annualized expense ratio as indicated above multiplied by the average account value over the period, multiplied by 184/365 to reflect the most recent fiscal half year. |
24 Invesco Pennsylvania Tax Free Income Fund
Approval of Investment Advisory and Sub-Advisory Contracts
The Board of Trustees (the Board) of AIM Counselor Series Trust (Invesco Counselor Series Trust) is required under the Investment Company Act of 1940, as amended, to approve annually the renewal of Invesco Pennsylvania Tax Free Income Fund’s (the Fund) investment advisory agreement with Invesco Advisers, Inc. (Invesco Advisers) and the Master Intergroup Sub-Advisory Contract for Mutual Funds (the sub-advisory contracts) with Invesco Asset Management Deutschland GmbH, Invesco Asset Management Limited, Invesco Asset Management (Japan) Limited, Invesco Australia Limited, Invesco Hong Kong Limited, Invesco Senior Secured Management, Inc. and Invesco Canada Ltd. (collectively, the Affiliated Sub-Advisers). During contract renewal meetings held on June 17-19, 2013, the Board as a whole, and the disinterested or “independent” Trustees, who comprise over 75% of the Board, voting separately, approved the continuance of the Fund’s investment advisory agreement and the sub-advisory contracts for another year, effective July 1, 2013. The Board determined that continuation of the Fund’s investment advisory agreement and the sub-advisory contracts are in the best interests of the Fund and its shareholders and the compensation payable to Invesco Advisers and the Affiliated Sub-Advisers under the agreements is fair and reasonable.
The Board’s Fund Evaluation Process
The Board’s Investments Committee has established three Sub-Committees, each of which is primarily responsible for overseeing the management of a number of the funds advised by Invesco Advisers (the Invesco Funds). The Sub-Committees meet throughout the year to review the performance of their assigned Invesco Funds, including reviewing materials prepared under the direction of the independent Senior Officer, an officer of the Invesco Funds who reports directly to the independent Trustees. Over the course of each year, the Sub-Committees meet with portfolio managers for their assigned Invesco Funds and other members of management to review the performance, investment objective(s), policies, strategies, limitations and investment risks of these funds. The Sub-Committees meet regularly and at designated contract renewal meetings each year to conduct a review of the performance, fees, expenses and other matters related to their assigned Invesco Funds. Each Sub-Committee recommends to the Investments Committee, which in turn recommends to the full Board, whether and on what terms to approve the continuance of each Invesco Fund’s investment advisory agreement and sub-advisory contracts for another year.
During the contract renewal process, the Trustees receive comparative performance and fee data regarding the Invesco Funds prepared by Invesco Advisers and Lipper Inc. (Lipper), an independent provider of investment company
data. The Trustees also receive an independent written evaluation from the Senior Officer. The Senior Officer’s evaluation is prepared as part of his responsibility to manage the process by which the Invesco Funds’ proposed management fees are negotiated during the annual contract renewal process to ensure they are negotiated in a manner that is at arms’ length and reasonable. The independent Trustees are assisted in their annual evaluation of the Fund’s investment advisory agreement by the Senior Officer and by independent legal counsel. In addition to meetings with Invesco Advisers and fund counsel, the independent Trustees also discuss the continuance of the investment advisory agreement and sub-advisory contracts in separate sessions with the Senior Officer and with independent legal counsel.
In evaluating the fairness and reasonableness of compensation under the Fund’s investment advisory agreement and sub-advisory contracts, the Board considered, among other things, the factors discussed below. The Trustees recognized that the advisory fee rates for the Invesco Funds are, in many cases, the result of years of review and negotiation between the Trustees and Invesco Advisers as well as advisory fees previously approved by different predecessor boards. The Trustees’ deliberations and conclusions in a particular year may be based in part on their deliberations and conclusions regarding these same arrangements throughout the year and in prior years. The Trustees’ review and conclusions are based on the comprehensive consideration of all information presented to them and are not the result of any single determinative factor. Moreover, one Trustee may have weighed a particular piece of information or factor differently than another Trustee.
The discussion below serves as the Senior Officer’s independent written evaluation with respect to the Fund’s investment advisory agreement as well as a discussion of the material factors and related conclusions that formed the basis for the Board’s approval of the Fund’s investment advisory agreement and sub-advisory contracts. Unless otherwise stated, this information is current as of June 19, 2013, and may not reflect consideration of factors that became known to the Board after that date, including, for example, changes to the Fund’s performance, advisory fees, expense limitations and/or fee waivers.
Factors and Conclusions and Summary of Independent Written Fee Evaluation
| A. | Nature, Extent and Quality of Services Provided by Invesco Advisers and the Affiliated Sub-Advisers |
The Board reviewed the advisory services provided to the Fund by Invesco Advisers under the Fund’s investment advisory agreement, the performance of Invesco Advisers in providing
these services, and the credentials and experience of the officers and employees of Invesco Advisers who provide these services, including the Fund’s portfolio manager or managers, with whom the Sub-Committees met during the year. The Board’s review of the qualifications of Invesco Advisers to provide advisory services included the Board’s consideration of Invesco Advisers’ investment process oversight, independent credit analysis and investment risk management.
In determining whether to continue the Fund’s investment advisory agreement, the Board considered the benefits of reapproving an existing relationship and the greater uncertainty that may be associated with entering into a new relationship. The Board also considered non-advisory services that Invesco Advisers and its affiliates provide to the Invesco Funds such as various back office support functions, equity and fixed income trading operations, internal audit, distribution and legal and compliance. The Board concluded that the nature, extent and quality of the services provided to the Fund by Invesco Advisers are appropriate and satisfactory and consistent with the terms of the Fund’s investment advisory agreement.
The Board reviewed the services that may be provided by the Affiliated Sub-Advisers under the sub-advisory contracts and the credentials and experience of the officers and employees of the Affiliated Sub-Advisers who provide these services. The Board concluded that the sub-advisory contracts benefit the Fund and its shareholders by permitting Invesco Advisers to use the resources and talents of the Affiliated Sub-Advisers in managing the Fund. The Board concluded that the nature, extent and quality of the services that may be provided by the Affiliated Sub-Advisers are appropriate and satisfactory and consistent with the terms of the Fund’s sub-advisory contracts.
| B. | Fund Performance |
The Board considered Fund performance as a relevant factor in considering whether to approve the investment advisory agreement. The Board did not view Fund performance as a relevant factor in considering whether to approve the sub-advisory contracts for the Fund, as no Affiliated Sub-Adviser currently manages assets of the Fund.
The Board compared the Fund’s performance during the past one, three and five calendar years to the performance of funds in the Lipper performance universe and against the Lipper Pennsylvania Municipal Debt Funds Index. The Board noted that performance of Class A shares of the Fund was in the first quintile of its performance universe for the one and three year periods and the second quintile for five year period (the first quintile being the best performing funds and the fifth quintile being the worst performing funds). The Board noted that performance of Class A shares of the Fund was
25 Invesco Pennsylvania Tax Free Income Fund
above the performance of the Index for the one, three and five year periods. The Trustees also reviewed more recent Fund performance and this review did not change their conclusions.
| C. | Advisory and Sub-Advisory Fees |
The Board compared the Fund’s contractual management fee rate to the contractual management fee rates of funds in the Fund’s Lipper expense group at a common asset level. The Board noted that the contractual management fee rate for Class A shares of the Fund was above the median contractual management fee rate of funds in its expense group. The Board noted that the term “contractual management fee” may include both advisory and certain administrative services fees and that Invesco Advisers does not charge the Invesco Funds for the administrative services included in the term as defined by Lipper. The Board also reviewed the methodology used by Lipper in providing expense group information, which includes using each fund’s contractual management fee schedule (including any applicable breakpoints) as reported in the most recent prospectus or statement of additional information for each fund in the expense group.
The Board noted that Invesco Advisers and the Affiliated Sub-Advisers do not manage other mutual funds or client accounts in a manner substantially similar to the management of the Fund.
The Board also considered the services that may be provided by the Affiliated Sub-Advisers pursuant to the sub-advisory contracts, as well as the fees payable by Invesco Advisers to the Affiliated Sub-Advisers pursuant to the sub-advisory contracts. The Board also noted that the sub-advisory fees are not paid directly by the Fund, but rather, are payable by Invesco Advisers to the Affiliated Sub-Advisers.
Based upon the information and considerations described above, the Board concluded that the compensation payable to Invesco Advisers and the Affiliated Sub-Advisers is fair and reasonable.
| D. | Economies of Scale and Breakpoints |
The Board considered the extent to which there are economies of scale in the provision of advisory services to the Fund. The Board also considered whether the Fund benefits from economies of scale through contractual breakpoints in the Fund’s advisory fee schedule and was assisted in this review by a report from the Senior Officer. The Board also noted that the Fund shares directly in economies of scale through lower fees charged by third party service providers based on the combined size of the Invesco Funds and other clients advised by Invesco Advisers.
| E. | Profitability and Financial Resources |
The Board reviewed information from Invesco Advisers concerning the costs of the advisory and other services that Invesco Advisers and its affiliates provide to the Fund and the profitability of Invesco Advisers and its affiliates in providing these services for the year ended December 31, 2012. The Board received
information from Invesco Advisers about the methodology used to prepare the profitability information. The Board considered the profitability of Invesco Advisers in managing the Fund and the Invesco Funds. The Board noted that Invesco Advisers continues to operate at a net profit from services Invesco Advisers and its subsidiaries provide to the Invesco Funds and the Fund. The Board did not deem the level of profits realized by Invesco Advisers and its affiliates from providing services to the Fund to be excessive given the nature, quality and extent of the services provided to the Invesco Funds. The Board received and accepted information from Invesco Advisers demonstrating that Invesco Advisers and each Affiliated Sub-Adviser are financially sound and have the resources necessary to perform their obligations under the investment advisory agreement and sub-advisory contracts.
| F. | Collateral Benefits to Invesco Advisers and its Affiliates |
The Board considered various other benefits received by Invesco Advisers and its affiliates from the relationship with the Fund, including the fees received for their provision of, transfer agency and distribution services to the Fund. The Board considered comparative information regarding fees charged for these services, including information provided by Lipper and other independent sources. The Board considered the performance of Invesco Advisers and its affiliates in providing these services and the organizational structure employed to provide these services. The Board also considered that these services are provided to the Fund pursuant to written contracts that are reviewed and approved on an annual basis by the Board; that the services are required for the operation of the Fund; that Invesco Advisers and its affiliates can provide services, the nature and quality of which are at least equal to those provided by others offering the same or similar services; and that the fees for such services are fair and reasonable in light of the usual and customary charges by others for services of the same nature and quality.
The Board considered the benefits realized by Invesco Advisers and the Affiliated Sub-Advisers as a result of portfolio brokerage transactions executed through “soft dollar” arrangements. The Board noted that Invesco Advisers proposes sharing economies of scale in administration expenses by lowering per class administrative fees.
The Board considered that the Fund’s uninvested cash and cash collateral from any securities lending arrangements may be invested in money market funds advised by Invesco Advisers pursuant to procedures approved by the Board. The Board noted that Invesco Advisers receives advisory fees from these affiliated money market funds attributable to such investments, although Invesco Advisers has contractually agreed to waive through varying periods the advisory fees payable by the Invesco Funds. The waiver is in an amount equal to 100% of the net advisory
fee Invesco Advisers receives from the affiliated money market funds with respect to the Fund’s investment in the affiliated money market funds of uninvested cash, but not cash collateral. The Board concluded that the Fund’s investment of uninvested cash and cash collateral from any securities lending arrangements in the affiliated money market funds is in the best interests of the Fund and its shareholders.
26 Invesco Pennsylvania Tax Free Income Fund
Tax Information
Form 1099-DIV, Form 1042-S and other year–end tax information provide shareholders with actual calendar year amounts that should be included in their tax returns. Shareholders should consult their tax advisors.
The following distribution information is being provided as required by the Internal Revenue Code or to meet a specific state’s requirement.
The Fund designates the following amounts or, if subsequently determined to be different, the maximum amount allowable for its fiscal year ended August 31, 2013:
Federal and State Income Tax | ||||
Qualified Dividend Income* | 0 | % | ||
Corporate Dividends Received Deduction* | 0 | % | ||
Tax-Exempt Interest Dividends* | 100 | % | ||
| * | The above percentages are based on ordinary income dividends paid to shareholders during the Fund’s fiscal year. |
27 Invesco Pennsylvania Tax Free Income Fund
Trustees and Officers
The address of each trustee and officer is AIM Counselor Series Trust (Invesco Counselor Series Trust) (the “Trust”), 11 Greenway Plaza, Suite 1000, Houston, Texas 77046-1173. The trustees serve for the life of the Trust, subject to their earlier death, incapacitation, resignation, retirement or removal as more specifically provided in the Trust’s organizational documents. Each officer serves for a one year term or until their successors are elected and qualified. Column two below includes length of time served with predecessor entities, if any.
Name, Year of Birth and Position(s) Held with the Trust | Trustee and/ or Officer Since | Principal Occupation(s) During Past 5 Years | Number of Funds in Fund Complex Overseen by Trustee | Other Directorship(s) Held by Trustee During Past 5 Years | ||||
| Interested Persons | ||||||||
| Martin L. Flanagan1 — 1960 Trustee | 2007 | Executive Director, Chief Executive Officer and President, Invesco Ltd. (ultimate parent of Invesco and a global investment management firm); Advisor to the Board, Invesco Advisers, Inc. (formerly known as Invesco Institutional (N.A.), Inc.); Trustee, The Invesco Funds; Vice Chair, Investment Company Institute; and Member of Executive Board, SMU Cox School of Business
Formerly: Chairman and Chief Executive Officer, Invesco Advisers, Inc. (registered investment adviser); Director, Chairman, Chief Executive Officer and President, IVZ Inc. (holding company), INVESCO Group Services, Inc. (service provider) and Invesco North American Holdings, Inc. (holding company); Director, Chief Executive Officer and President, Invesco Holding Company Limited (parent of Invesco and a global investment management firm); Director, Invesco Ltd.; Chairman, Investment Company Institute and President, Co-Chief Executive Officer, Co-President, Chief Operating Officer and Chief Financial Officer, Franklin Resources, Inc. (global investment management organization) | 117 | None | ||||
| Philip A. Taylor2 — 1954 Trustee, President and Principal Executive Officer | 2006 | Head of North American Retail and Senior Managing Director, Invesco Ltd.; Director, Co-Chairman, Co-President and Co-Chief Executive Officer, Invesco Advisers, Inc. (formerly known as Invesco Institutional (N.A.), Inc.) (registered investment adviser); Director, Chairman, Chief Executive Officer and President, Invesco Management Group, Inc. (formerly known as Invesco Aim Management Group, Inc.) (financial services holding company); Director and President, INVESCO Funds Group, Inc. (registered investment adviser and registered transfer agent); Director and Chairman, Invesco Investment Services, Inc. (formerly known as Invesco Aim Investment Services, Inc.) (registered transfer agent) and IVZ Distributors, Inc. (formerly known as INVESCO Distributors, Inc.) (registered broker dealer); Director, President and Chairman, Invesco Inc. (holding company) and Invesco Canada Holdings Inc. (holding company); Chief Executive Officer, Invesco Corporate Class Inc. (corporate mutual fund company) and Invesco Canada Fund Inc. (corporate mutual fund company); Director, Chairman and Chief Executive Officer, Invesco Canada Ltd. (formerly known as Invesco Trimark Ltd./Invesco Trimark Ltèe) (registered investment adviser and registered transfer agent); Trustee, President and Principal Executive Officer, The Invesco Funds (other than AIM Treasurer’s Series Trust (Invesco Treasurer’s Series Trust) and Short-Term Investments Trust); Trustee and Executive Vice President, The Invesco Funds (AIM Treasurer’s Series Trust (Invesco Treasurer’s Series Trust) and Short-Term Investments Trust only); Director, Invesco Investment Advisers LLC (formerly known as Van Kampen Asset Management); Director, Chief Executive Officer and President, Van Kampen Exchange Corp.
Formerly: Director and Chairman, Van Kampen Investor Services Inc.: Director, Chief Executive Officer and President, 1371 Preferred Inc. (holding company); and Van Kampen Investments Inc.; Director and President, AIM GP Canada Inc. (general partner for limited partnerships); and Van Kampen Advisors, Inc.; Director and Chief Executive Officer, Invesco Trimark Dealer Inc. (registered broker dealer); Director, Invesco Distributors, Inc. (formerly known as Invesco Aim Distributors, Inc.) (registered broker dealer); Manager, Invesco PowerShares Capital Management LLC; Director, Chief Executive Officer and President, Invesco Advisers, Inc.; Director, Chairman, Chief Executive Officer and President, Invesco Aim Capital Management, Inc.; President, Invesco Trimark Dealer Inc. and Invesco Trimark Ltd./Invesco Trimark Ltèe; Director and President, AIM Trimark Corporate Class Inc. and AIM Trimark Canada Fund Inc.; Senior Managing Director, Invesco Holding Company Limited; Trustee and Executive Vice President, Tax-Free Investments Trust; Director and Chairman, Fund Management Company (former registered broker dealer); President and Principal Executive Officer, The Invesco Funds (AIM Treasurer’s Series Trust (Invesco Treasurer’s Series Trust), Short-Term Investments Trust and Tax-Free Investments Trust only); President, AIM Trimark Global Fund Inc. and AIM Trimark Canada Fund Inc. | 117 | None | ||||
Wayne W. Whalen3 — 1939 Trustee | 2010 | Of Counsel, and prior to 2010, partner in the law firm of Skadden, Arps, Slate, Meagher & Flom LLP, legal counsel to certain funds in the Fund Complex
| 130 | Director of the Mutual Fund Directors Forum, a nonprofit membership organization for investment directors; Chairman and Director of the Abraham Lincoln Presidential Library Foundation; and Director of the Stevenson Center for Democracy |
| 1 | Mr. Flanagan is considered an interested person of the Trust because he is an officer of the adviser to the Trust, and an officer and a director of Invesco Ltd., ultimate parent of the adviser to the Trust. |
| 2 | Mr. Taylor is considered an interested person of the Trust because he is an officer and a director of the adviser to, and a director of the principal underwriter of, the Trust. |
| 3 | Mr. Whalen is considered an “interested person” (within the meaning of Section 2(a)(19) of the 1940 Act) of certain Funds in the Invesco Fund Complex because he and his firm currently provide legal services as legal counsel to such Funds. |
T-1 Invesco Pennsylvania Tax Free Income Fund
Trustees and Officers—(continued)
Name, Year of Birth and Position(s) Held with the Trust | Trustee and/ or Officer Since | Principal Occupation(s) During Past 5 Years | Number of Funds in Fund Complex Overseen by Trustee | Other Directorship(s) Held by Trustee During Past 5 Years | ||||
| Independent Trustees | ||||||||
Bruce L. Crockett — 1944 Trustee and Chair | 2003 | Chairman, Crockett Technologies Associates (technology consulting company)
Formerly: Director, Captaris (unified messaging provider); Director, President and Chief Executive Officer COMSAT Corporation; and Chairman, Board of Governors of INTELSAT (international communications company) | 117 | ACE Limited (insurance company); Investment Company Institute | ||||
David C. Arch — 1945 Trustee | 2010 | Chairman and Chief Executive Officer of Blistex Inc., (consumer health care products manufacturer)
Formerly: Member of the Heartland Alliance Advisory Board, a nonprofit organization serving human needs based in Chicago | 130 | Board member of the Illinois Manufacturers’ Association; Member of the Board of Visitors, Institute for the Humanities, University of Michigan | ||||
Frank S. Bayley — 1939 Trustee | 2003 | Retired
Formerly: Director, Badgley Funds, Inc. (registered investment company) (2 portfolios) and General Partner and Of Counsel, law firm of Baker & McKenzie, LLP | 117 | Director and Chairman, C.D. Stimson Company (a real estate investment company); Trustee and Overseer, The Curtis Institute of Music | ||||
James T. Bunch — 1942 Trustee | 2000 | Managing Member, Grumman Hill Group LLC (family office private equity management)
Formerly: Founder, Green, Manning & Bunch Ltd. (investment banking firm)(1988-2010); Executive Committee, United States Golf Association; and Director, Policy Studies, Inc. and Van Gilder Insurance Corporation | 117 | Chairman, Board of Governors, Western Golf Association; Chairman-elect, Evans Scholars Foundation; and Director, Denver Film Society | ||||
Rodney F. Dammeyer — 1940 Trustee | 2010 | Chairman of CAC, LLC, (private company offering capital investment and management advisory services)
Formerly: Prior to 2001, Managing Partner at Equity Group Corporate Investments; Prior to 1995, Chief Executive Officer of Itel Corporation (formerly Anixter International); Prior to 1985, experience includes Senior Vice President and Chief Financial Officer of Household International, Inc., Executive Vice President and Chief Financial Officer of Northwest Industries, Inc. and Partner of Arthur Andersen & Co.; From 1987 to 2010, Director/Trustee of investment companies in the Van Kampen Funds complex | 117 | Director of Quidel Corporation and Stericycle, Inc.; Prior to May 2008, Trustee of The Scripps Research Institute; Prior to February 2008, Director of Ventana Medical Systems, Inc. | ||||
Albert R. Dowden — 1941 Trustee | 2003 | Director of a number of public and private business corporations, including the Boss Group, Ltd. (private investment and management); Reich & Tang Funds (5 portfolios) (registered investment company); and Homeowners of America Holding Corporation/ Homeowners of America Insurance Company (property casualty company)
Formerly: Director, Continental Energy Services, LLC (oil and gas pipeline service); Director, CompuDyne Corporation (provider of product and services to the public security market) and Director, Annuity and Life Re (Holdings), Ltd. (reinsurance company); Director, President and Chief Executive Officer, Volvo Group North America, Inc.; Senior Vice President, AB Volvo; Director of various public and private corporations; Chairman, DHJ Media, Inc.; Director Magellan Insurance Company; and Director, The Hertz Corporation, Genmar Corporation (boat manufacturer), National Media Corporation; Advisory Board of Rotary Power International (designer, manufacturer, and seller of rotary power engines); and Chairman, Cortland Trust, Inc. (registered investment company) | 117 | Director of Nature’s Sunshine Products, Inc. | ||||
Jack M. Fields — 1952 Trustee | 2003 | Chief Executive Officer, Twenty First Century Group, Inc. (government affairs company); Owner and Chief Executive Officer, Dos Angeles Ranch, L.P. (cattle, hunting, corporate entertainment); and Discovery Global Education Fund (non-profit)
Formerly: Chief Executive Officer, Texana Timber LP (sustainable forestry company); Director of Cross Timbers Quail Research Ranch (non-profit); and member of the U.S. House of Representatives | 117 | Insperity, Inc. (formerly known as Administaff) | ||||
Prema Mathai-Davis — 1950 Trustee | 2003 | Retired
Formerly: Chief Executive Officer, YWCA of the U.S.A. | 117 | None | ||||
Larry Soll — 1942 Trustee | 1997 | Retired
Formerly: Chairman, Chief Executive Officer and President, Synergen Corp. (a biotechnology company) | 117 | None | ||||
Hugo F. Sonnenschein — 1940 Trustee | 2010 | Distinguished Service Professor and President Emeritus of the University of Chicago and the Adam Smith Distinguished Service Professor in the Department of Economics at the University of Chicago
Formerly: President of the University of Chicago | 130 | Trustee of the University of Rochester and a member of its investment committee. Member of the National Academy of Sciences, the American Philosophical Society and a fellow of the American Academy of Arts and Sciences |
T-2 Invesco Pennsylvania Tax Free Income Fund
Trustees and Officers—(continued)
Name, Year of Birth and Position(s) Held with the Trust | Trustee and/ or Officer Since | Principal Occupation(s) During Past 5 Years | Number of Funds in Fund Complex Overseen by Trustee | Other Directorship(s) Held by Trustee During Past 5 Years | ||||
| Independent Trustees—(continued) | ||||||||
Raymond Stickel, Jr. — 1944 Trustee | 2005 | Retired
Formerly: Director, Mainstay VP Series Funds, Inc. (25 portfolios) and Partner, Deloitte & Touche | 117 | None | ||||
| Other Officers | ||||||||
| Russell C. Burk — 1958 Senior Vice President and Senior Officer | 2005 | Senior Vice President and Senior Officer, The Invesco Funds | N/A | N/A | ||||
| John M. Zerr — 1962 Senior Vice President, Chief Legal Officer and Secretary | 2006 | Director, Senior Vice President, Secretary and General Counsel, Invesco Management Group, Inc. (formerly known as Invesco Aim Management Group, Inc.) and Van Kampen Exchange Corp.; Senior Vice President, Invesco Advisers, Inc. (formerly known as Invesco Institutional (N.A.), Inc.) (registered investment adviser); Senior Vice President and Secretary, Invesco Distributors, Inc. (formerly known as Invesco Aim Distributors, Inc.); Director, Vice President and Secretary, Invesco Investment Services, Inc. (formerly known as Invesco Aim Investment Services, Inc.) and IVZ Distributors, Inc. (formerly known as INVESCO Distributors, Inc.); Director and Vice President, INVESCO Funds Group, Inc.; Senior Vice President, Chief Legal Officer and Secretary, The Invesco Funds; Manager, Invesco PowerShares Capital Management LLC; Director, Secretary and General Counsel, Invesco Investment Advisers LLC (formerly known as Van Kampen Asset Management); Secretary and General Counsel, Invesco Capital Markets, Inc. (formerly known as Van Kampen Funds Inc.) and Chief Legal Officer, PowerShares Exchange-Traded Fund Trust, PowerShares Exchange-Traded Fund Trust II, PowerShares India Exchange-Traded Fund Trust and PowerShares Actively Managed Exchange-Traded Fund Trust
Formerly: Director and Vice President, Van Kampen Advisors Inc.; Director, Vice President, Secretary and General Counsel, Van Kampen Investor Services Inc.; Director, Invesco Distributors, Inc. (formerly known as Invesco Aim Distributors, Inc.); Director, Senior Vice President, General Counsel and Secretary, Invesco Aim Advisers, Inc. and Van Kampen Investments Inc.; Director, Vice President and Secretary, Fund Management Company; Director, Senior Vice President, Secretary, General Counsel and Vice President, Invesco Aim Capital Management, Inc.; Chief Operating Officer and General Counsel, Liberty Ridge Capital, Inc. (an investment adviser); Vice President and Secretary, PBHG Funds (an investment company) and PBHG Insurance Series Fund (an investment company); Chief Operating Officer, General Counsel and Secretary, Old Mutual Investment Partners (a broker-dealer); General Counsel and Secretary, Old Mutual Fund Services (an administrator) and Old Mutual Shareholder Services (a shareholder servicing center); Executive Vice President, General Counsel and Secretary, Old Mutual Capital, Inc. (an investment adviser); and Vice President and Secretary, Old Mutual Advisors Funds (an investment company) | N/A | N/A | ||||
| Karen Dunn Kelley — 1960 Vice President | 2003 | Head of Invesco’s World Wide Fixed Income and Cash Management Group; Director, Co-President, Co-Chief Executive Officer, and Co-Chairman, Invesco Advisers, Inc. (formerly known as Invesco Institutional (N.A.), Inc.) (registered investment adviser); Chairman, Invesco Senior Secured Management, Inc.; Senior Vice President, Invesco Management Group, Inc. (formerly known as Invesco Aim Management Group, Inc.); Executive Vice President, Invesco Distributors, Inc. (formerly known as Invesco Aim Distributors, Inc.); Director, Invesco Mortgage Capital Inc., and Invesco Management Company Limited; Director and President, INVESCO Asset Management (Bermuda) Ltd., Vice President, The Invesco Funds (other than AIM Treasurer’s Series Trust (Invesco Treasurer’s Series Trust) and Short-Term Investments Trust); and President and Principal Executive Officer, The Invesco Funds (AIM Treasurer’s Series Trust (Invesco Treasurer’s Series Trust) and Short-Term Investments Trust only)
Formerly: Director, INVESCO Global Asset Management Limited and INVESCO Management S.A.; Senior Vice President, Van Kampen Investments Inc. and Invesco Advisers, Inc. (formerly known as Invesco Institutional (N.A.), Inc.) (registered investment adviser); Vice President, Invesco Advisers, Inc. (formerly known as Invesco Institutional (N.A.), Inc.); Director of Cash Management and Senior Vice President, Invesco Advisers, Inc. and Invesco Aim Capital Management, Inc.; President and Principal Executive Officer, Tax-Free Investments Trust; Director and President, Fund Management Company; Chief Cash Management Officer, Director of Cash Management, Senior Vice President, and Managing Director, Invesco Aim Capital Management, Inc.; Director of Cash Management, Senior Vice President, and Vice President, Invesco Advisers, Inc. and The Invesco Funds (AIM Treasurer’s Series Trust (Invesco Treasurer’s Series Trust), Short-Term Investments Trust and Tax-Free Investments Trust only) | N/A | N/A | ||||
T-3 Invesco Pennsylvania Tax Free Income Fund
Trustees and Officers—(continued)
Name, Year of Birth and Position(s) Held with the Trust | Trustee and/ or Officer Since | Principal Occupation(s) During Past 5 Years | Number of Funds in Fund Complex Overseen by Trustee | Other Directorship(s) Held by Trustee During Past 5 Years | ||||
| Other Officers—(continued) | ||||||||
| Sheri Morris — 1964 Vice President, Treasurer and Principal Financial Officer | 2003 | Vice President, Treasurer and Principal Financial Officer, The Invesco Funds; Vice President, Invesco Advisers, Inc. (formerly known as Invesco Institutional (N.A.), Inc.) (registered investment adviser); and Vice President, PowerShares Exchange-Traded Fund Trust, PowerShares Exchange-Traded Fund Trust II, PowerShares India Exchange-Traded Fund Trust and PowerShares Actively Managed Exchange-Traded Fund Trust
Formerly: Vice President, Invesco Aim Advisers, Inc., Invesco Aim Capital Management, Inc. and Invesco Aim Private Asset Management, Inc.; Assistant Vice President and Assistant Treasurer, The Invesco Funds and Assistant Vice President, Invesco Advisers, Inc., Invesco Aim Capital Management, Inc. and Invesco Aim Private Asset Management, Inc.; and Treasurer, PowerShares Exchange-Traded Fund Trust, PowerShares Exchange-Traded Fund Trust II, PowerShares India Exchange-Traded Fund Trust and PowerShares Actively Managed Exchange-Traded Fund Trust | N/A | N/A | ||||
Crissie M. Wisdom — 1969 Anti-Money Laundering Compliance Officer | 2013 | Anti-Money Laundering Compliance Officer, Invesco Advisers, Inc. (formerly known as Invesco Institutional (N.A.), Inc.) (registered investment adviser), Invesco Capital Markets, Inc. (formerly known as Van Kampen Funds Inc.), Invesco Distributors, Inc., Invesco Investment Services, Inc., Invesco Management Group, Inc., Van Kampen Exchange Corp., The Invesco Funds, Invesco Funds (Chicago), and PowerShares Exchange-Traded Fund Trust, PowerShares Exchange-Traded Fund Trust II, PowerShares India Exchange-Traded Fund Trust, and PowerShares Actively Managed Exchange-Traded Fund Trust; and Fraud Prevention Manager and Controls and Risk Analysis Manager for Invesco Investment Services, Inc. | N/A | N/A | ||||
| Todd L. Spillane — 1958 Chief Compliance Officer | 2006 | Senior Vice President, Invesco Management Group, Inc. (formerly known as Invesco Aim Management Group, Inc.) and Van Kampen Exchange Corp.; Senior Vice President and Chief Compliance Officer, Invesco Advisers, Inc. (registered investment adviser) (formerly known as Invesco Institutional (N.A.), Inc.); Chief Compliance Officer, The Invesco Funds; Vice President, Invesco Distributors, Inc. (formerly known as Invesco Aim Distributors, Inc.) and Invesco Investment Services, Inc. (formerly known as Invesco Aim Investment Services, Inc.)
Formerly: Chief Compliance Officer, Invesco Funds (Chicago); Senior Vice President, Van Kampen Investments Inc.; Senior Vice President and Chief Compliance Officer, Invesco Aim Advisers, Inc. and Invesco Aim Capital Management, Inc.; Chief Compliance Officer, INVESCO Private Capital Investments, Inc. (holding company), Invesco Private Capital, Inc. (registered investment adviser), Invesco Global Asset Management (N.A.), Inc., Invesco Senior Secured Management, Inc. (registered investment adviser), Van Kampen Investor Services Inc., PowerShares Exchange-Traded Fund Trust, PowerShares Exchange-Traded Fund Trust II, PowerShares India Exchange-Traded Fund Trust and PowerShares Actively Managed Exchange-Traded Fund Trust; and Vice President, Invesco Aim Capital Management, Inc. and Fund Management Company | N/A | N/A |
The Statement of Additional Information of the Trust includes additional information about the Fund’s Trustees and is available upon request, without charge, by calling 1.800.959.4246. Please refer to the Fund’s prospectus for information on the Fund’s sub-advisers.
Office of the Fund 11 Greenway Plaza, Suite 1000 Houston, TX 77046-1173 | Investment Adviser Invesco Advisers, Inc. 1555 Peachtree Street, N.E. Atlanta, GA 30309 | Distributor Invesco Distributors, Inc. 11 Greenway Plaza, Suite 1000 Houston, TX 77046-1173 | Auditors PricewaterhouseCoopers LLP 1201 Louisiana Street, Suite 2900 Houston, TX 77002-5678 | |||
Counsel to the Fund Stradley Ronon Stevens & Young, LLP 2005 Market Street, Suite 2600 Philadelphia, PA 19103-7018 | Counsel to the Independent Trustees Goodwin Procter LLP 901 New York Avenue, N.W. Washington, D.C. 20001 | Transfer Agent Invesco Investment Services, Inc. 11 Greenway Plaza, Suite 1000 Houston, TX 77046-1173 | Custodian State Street Bank and Trust Company 225 Franklin Street Boston, MA 02110-2801 | |||
T-4 Invesco Pennsylvania Tax Free Income Fund

Invesco mailing information
Send general correspondence to Invesco Investment Services, Inc., P.O. Box 219078, Kansas City, MO 64121-9078.
Invesco privacy policy
You share personal and financial information with us that is necessary for your transactions and your account records. We take very seriously the obligation to keep that information confidential and private.
Invesco collects nonpublic personal information about you from account applications or other forms you complete and from your transactions with us or our affiliates. We do not disclose information about you or our former customers to service providers or other third parties except to the extent necessary to service your account and in other limited circumstances as permitted by law. For example, we use this information to facilitate the delivery of transaction confirmations, financial reports, prospectuses and tax forms.
Even within Invesco, only people involved in the servicing of your accounts and compliance monitoring have access to your information. To ensure the highest level of confidentiality and security, Invesco maintains physical, electronic and procedural safeguards that meet or exceed federal standards. Special measures, such as data encryption and authentication, apply to your communications with us on our website. More detail is available to you at invesco.com/privacy.
Important notice regarding delivery of security holder documents
To reduce Fund expenses, only one copy of most shareholder documents may be mailed to shareholders with multiple accounts at the same address (Householding). Mailing of your shareholder documents may be householded indefinitely unless you instruct us otherwise. If you do not want the mailing of these documents to be combined with those for other members of your household, please contact Invesco Investment Services, Inc. at 800 959 4246 or contact your financial institution. We will begin sending you individual copies for each account within 30 days after receiving your request.
Fund holdings and proxy voting information
The Fund provides a complete list of its holdings four times in each fiscal year, at the quarter ends. For the second and fourth quarters, the lists appear in the Fund’s semiannual and annual reports to shareholders. For the first and third quarters, the Fund files the lists with the Securities and Exchange Commission (SEC) on Form N-Q. The most recent list of portfolio holdings is available at invesco.com/completeqtrholdings. Shareholders can also look up the Fund’s Forms N-Q on the SEC website at sec.gov. Copies of the Fund’s Forms N-Q may be reviewed and copied at the SEC Public Reference Room in Washington, D.C. You can obtain information on the operation of the Public Reference Room, including information about duplicating fee charges, by calling 202 551 8090 or 800 732 0330, or by electronic request at the following email address: publicinfo@sec.gov. The SEC file numbers for the Fund are shown below.
A description of the policies and procedures that the Fund uses to determine how to vote proxies relating to portfolio securities is available without charge, upon request, from our Client Services department at 800 959 4246 or at invesco.com/proxyguidelines. The information is also available on the SEC website, sec.gov.
Information regarding how the Fund voted proxies related to its portfolio securities during the most recent 12-month period ended June 30 is available at invesco.com/proxysearch. The information is also available on the SEC website, sec.gov. Invesco Advisers, Inc. is an investment adviser; it provides investment advisory services to individual and institutional clients and does not sell securities. Invesco Distributors, Inc. is the US distributor for Invesco Ltd.’s retail mutual funds, exchange-traded funds and institutional money market funds. Both are wholly owned, indirect subsidiaries of Invesco Ltd. |  | |
| SEC file numbers: 811-09913 and 333-36074 VK-PTFI-AR-1 Invesco Distributors, Inc. | ||
Letters to Shareholders
Philip Taylor | Dear Shareholders: Enclosed in this annual report, you’ll find information about your Fund and the factors that affected its performance during the reporting period. Inside, you’ll also find a discussion from your portfolio managers about how they managed your Fund, as well as performance data for your Fund, a complete list of your Fund’s investments as of the close of the reporting period and other important information. I hope you find this report of interest. During the reporting period covered by this report, major US equity indexes made multiyear or even all-time highs.1 Economic data were generally positive; housing and consumer spending data were particularly encouraging. Nonetheless, economic uncertainty and concern about continuing political and budget gridlock in Washington persisted. The US Federal Reserve’s deliberate vagueness about when, and to what degree, it might begin to curtail its extraordinarily | ||||||||

accommodative monetary policies – together with uncertainty about who will next lead the central bank – affected fixed income and equity markets alike. Most developed, non-US stock markets remained positive for the first half of 2013, despite a difficult second quarter.
Periods of market volatility and economic uncertainty can weaken the will of even the most resolute investor. That’s why Invesco believes it’s often helpful to work with a skilled and trusted financial adviser who can emphasize the importance of adhering to an investment plan designed to achieve long-term goals rather than being sidetracked by short-term uncertainty that can result in inaction. A financial adviser who is familiar with your individual financial situation, investment goals and risk tolerance can be an invaluable partner as you work toward your financial goals. He or she can provide insight and perspective when markets are volatile; encouragement and reassurance when times are uncertain; and advice and guidance when your financial situation or investment goals change.
Our website, invesco.com/us, is another source of timely insight and information for investors. On the website, you’ll find fund-specific as well as more general information from many of Invesco’s investment professionals. You’ll find in-depth articles, video clips and audio commentaries – and, of course, you also can access information about your Invesco account whenever it’s convenient for you.
What we mean by Intentional Investing
At Invesco, all of our people and all of our resources are dedicated to helping investors achieve their financial objectives. It’s a philosophy we call Intentional Investing, and it guides the way we:
| n | Manage investments – Our dedicated investment professionals search the world for the best opportunities, and each investment team follows a clear, disciplined process to build portfolios and mitigate risk. |
| n | Provide choices – We offer multiple investment strategies, allowing you and your financial adviser to build a portfolio that’s purpose-built for your needs. |
| n | Connect with you – We’re committed to giving you the expert insights you need to make informed investing decisions, and we are well-equipped to provide high-quality support for investors and advisers. |
At Invesco, we believe in putting investors first. That’s why investment management is all we do. Our sole focus on managing your money allows you and your financial adviser to build a portfolio of Invesco funds appropriate for your investment needs and goals today and when your circumstances change.
Have questions?
For questions about your account, feel free to contact an Invesco client services representative at 800 959 4246. For Invesco-related questions or comments, please email me directly at phil@invesco.com.
All of us at Invesco look forward to serving your investment management needs for many years to come. Thank you for investing with us.
Sincerely,

Philip Taylor
Senior Managing Director, Invesco Ltd.
| 1 | Source: Reuters |
2 Invesco S&P 500 Index Fund
Bruce Crockett | Dear Fellow Shareholders: The Invesco Funds Board has worked on a variety of issues over the last several months, and I’d like to take this opportunity to discuss two that affect you and our fellow fund shareholders. The first issue on which your Board has been working is our annual review of the funds’ advisory and sub-advisory contracts with Invesco Advisers and its affiliates. This annual review, which is required by the Investment Company Act of 1940, focuses on the nature and quality of the services Invesco provides as adviser to the Invesco Funds and the reasonableness of the fees that it charges for those services. Each year, we spend months reviewing detailed information that we request from Invesco that allows us to evaluate its services and fees. We also use information from many independent sources, including materials provided by the independent Senior Officer of the Invesco Funds, who reports directly to the independent Trustees on the Board. Additionally, | ||||||||

we meet with independent legal counsel and review performance and fee data prepared by Lipper Inc., an independent, third-party firm widely recognized as a leader in its field.
I’m pleased to report that the Board determined in June that renewing the investment advisory agreement and the sub-advisory contracts with Invesco Advisers and its affiliates would serve the best interests of each fund and its shareholders.
The second area of focus to highlight is the Board’s efforts to ensure that we provide a lineup of funds that allow financial advisers to build portfolios that meet shareholders’ changing financial needs and goals. Today, more and more investors are reaching, or approaching, retirement. But interest rates remain low, making it difficult for many investors to generate the income they need, or will soon need, in their retirement years.
The members of your Board think about these things, too, and we’ve worked with Invesco Advisers to provide more income-generating options in the Invesco Funds lineup to help shareholders potentially meet their income needs. Your Board recently approved changes to three existing equity mutual funds, increasing their focus on generating income while also seeking to provide long-term growth of capital.
As a result of these changes, the funds and their respective management teams now have more flexibility to invest in the types of securities that could meet investors’ growing need for income generation, and in some cases, also help investors diversify their sources of income. These equity funds complement an array of fixed-income, asset allocation and alternative investment options in the Invesco Funds lineup designed to accommodate a variety of risk tolerances.
Be assured that your Board will continue working on behalf of fund shareholders, keeping your needs and interests uppermost in our minds.
As always, please contact me at bruce@brucecrockett.com with any questions or concerns you may have. On behalf of the Board, we look forward to continuing to represent your interests and serving your needs.
Sincerely,

Bruce L. Crockett
Independent Chair
Invesco Funds Board of Trustees
3 Invesco S&P 500 Index Fund
Management’s Discussion of Fund Performance
Performance summary
For the fiscal year ended August 31, 2013, Invesco S&P 500 Index Fund sought to provide investment results that, before expenses, corresponded to the total return of the S&P 500 Index.
The consumer discretionary, financials, health care and industrials sectors contributed the most to the Fund’s overall positive performance for the reporting period. Your Fund’s long-term performance appears later in this report.
Fund vs. Indexes
Total returns, 8/31/12 to 8/31/13, at net asset value (NAV). Performance shown does not include applicable contingent deferred sales charges (CDSC) or front-end sales charges, which would have reduced performance.
| Class A Shares | 18.04 | % | |||
| Class B Shares | 17.14 | ||||
| Class C Shares | 17.14 | ||||
| Class Y Shares | 18.33 | ||||
| S&P 500 Index‚ (Broad Market/Style-Specific Index) | 18.70 | ||||
| Lipper S&P 500 Objective Funds Indexn (Peer Group Index) | 18.39 |
Source(s): ‚Invesco, S&P-Dow Jones via FactSet Research Systems Inc.; nLipper Inc.
How we invest
The Fund normally invests at least 80% of its assets in common stocks of companies included in the S&P 500 Index. The Fund’s assets are managed by investing in stocks in approximately the same proportion as they are represented in the S&P 500 Index. For example, if the common stock of a specific company represents 5% of the S&P 500 Index, the Fund typically invests 5% of its assets in that stock. The S&P 500 Index is a well-known stock market index that includes common stocks of 500 companies representing a significant portion of the market value of all common stocks publicly traded in the US. The Fund may invest in foreign companies, including those in emerging market countries, which are included in the S&P 500 Index. Buy and sell decisions for the Fund are a function of changes in the S&P 500 Index rather than independent decisions made by the investment team.
Market conditions and your Fund
The fiscal year ended August 31, 2013, began with some downward volatility in US equity markets. Starting in the fall of 2012, markets began an upward trend that continued through much of the reporting period. In early fall, the European Central Bank implemented new measures to support member economies and the US Federal Reserve (the Fed) initiated a third round of quantitative easing (QE), or fiscal stimulus, which caused consumer sentiment to improve. Uncertainty surrounding US election results, “fiscal cliff” negotiations and sequestration spending cuts in early 2013, however, made many businesses hesitant to spend during the first quarter of the year. However, for the first time in years, markets appeared willing to look past headline events.
From late May through June, the capital markets began a sell-off following Fed Chairman Ben Bernanke’s comments about reducing QE. Since December 2012, the Fed has purchased $85 billion1
of US Treasuries and mortgage-backed securities each month to increase liquidity and ensure low long-term interest rates in an effort to spur the housing and real estate markets. Few asset classes were immune from this broad sell-off, which caused bonds, stocks and commodities to decline. Precious metals were particularly hard hit, and fixed-income investors scrambled to sell bonds in anticipation of higher yields. The markets stabilized in mid-summer; however, August brought more selling in the equity and bond markets and yields continued to rise.
The Fund stayed true to its process by maintaining the same exposure to all constituents of the S&P 500 Index as the index itself. On an absolute basis, all sectors in the Fund posted positive returns for the fiscal year. Sectors that contributed the most to overall Fund performance were the consumer discretionary, financials, health care, industrials, consumer staples and energy sectors. The telecommunication services, information technology, materials and utilities sectors contributed the least to Fund performance.
During the reporting period, financial holdings were some of the largest contributors to the Fund’s performance. These holdings included Bank of America, JP Morgan Chase, Citigroup and Berkshire Hathaway. In July, Fund holding H.J. Heinz was acquired by an investment consortium composed of Berkshire Hathaway and 3G Capital (not a Fund holding).
Many Fund holdings in the health care sector were also strong performers during the fiscal year. A top contributor in this sector included Johnson & Johnson. During the fiscal year, Johnson & Johnson announced it had completed the acquisition of Flexible Stenting Solutions (not a Fund holding), a developer of flexible peripheral arterial, venous and biliary stents.
| Portfolio Composition | |||||
| By sector | |||||
| Information Technology | 17.9 | % | |||
| Financials | 16.1 | ||||
| Health Care | 12.8 | ||||
| Consumer Discretionary | 12.3 | ||||
| Energy | 10.5 | ||||
| Consumer Staples | 10.1 | ||||
| Industrials | 10.1 | ||||
| Materials | 3.4 | ||||
| Utilities | 3.2 | ||||
| Telecommunication Services | 2.5 | ||||
Money Market Funds Plus Other Assets Less Liabilities | 1.1 | ||||
| Top 10 Equity Holdings* | |||||
1. Apple Inc. | 3.1 | % | |||
2. Exxon Mobil Corp. | 2.6 | ||||
3. Microsoft Corp. | 1.7 | ||||
4. Johnson & Johnson | 1.7 | ||||
5. General Electric Co. | 1.6 | ||||
6. Chevron Corp. | 1.6 | ||||
7. Google Inc.-Class A | 1.6 | ||||
8. Procter & Gamble Co. (The) | 1.5 | ||||
9. Berkshire Hathaway Inc.-Class B | 1.4 | ||||
10. Wells Fargo & Co. | 1.4 | ||||
| Total Net Assets | $592.6 million | ||||
| Total Number of Holdings* | 500 | ||||
The Fund’s holdings are subject to change, and there is no assurance that the Fund will continue to hold any particular security.
| * | Excluding money market fund holdings. |
4 Invesco S&P 500 Index Fund
Several Fund holdings in the information technology sector struggled during the reporting period. Those holdings included mega-capitalization names such as International Business Machines, Intel and Apple.
Detracting from Fund performance were several telecommunication services companies, including AT&T.
During the reporting period, the Fund invested in S&P 500 futures contracts, a derivative instrument, to gain exposure to the equity market. These futures contracts contributed to the Fund’s performance.
We welcome new investors who joined the Fund during the fiscal year and thank all of our shareholders for your investment in Invesco S&P 500 Index Fund.
| 1 | Source: US Federal Reserve |
The views and opinions expressed in management’s discussion of Fund performance are those of Invesco Advisers, Inc. These views and opinions are subject to change at any time based on factors such as market and economic conditions. These views and opinions may not be relied upon as investment advice or recommendations, or as an offer for a particular security. The information is not a complete analysis of every aspect of any market, country, industry, security or the Fund. Statements of fact are from sources considered reliable, but Invesco Advisers, Inc. makes no representation or warranty as to their completeness or accuracy. Although historical performance is no guarantee of future results, these insights may help you understand our investment management philosophy.
See important Fund and, if applicable, index disclosures later in this report.
 | Anthony Munchak Chartered Financial Analyst, portfolio manager, is manager of Invesco S&P 500 Index Fund. He joined Invesco | |
in 2000. Mr. Munchak earned a BS and an MS in finance from Boston College and an MBA from Bentley College.
| ||
 | Glen Murphy Chartered Financial Analyst, portfolio manager, is manager of Invesco S&P 500 Index Fund. He joined Invesco | |
in 1995. Mr. Murphy earned a BA in business administration from the University of Massachusetts Amherst and an MS in finance from Boston College.
| ||
| Francis Orlando Chartered Financial Analyst, portfolio manager, is manager of Invesco S&P 500 Index Fund. He joined Invesco | |
in 1987. Mr. Orlando earned a BA in business administration from Merrimack College and an MBA from Boston University.
| ||
| Daniel Tsai Chartered Financial Analyst, portfolio manager, is manager of Invesco S&P 500 Index Fund. He joined Invesco | |
in 2000. Mr. Tsai earned a BS in mechanical engineering from National Taiwan University, an MS in mechanical engineering from the University of Michigan and an MS in computer science from Wayne State University.
| ||
| Anne Unflat Portfolio manager, is manager of Invesco S&P 500 Index Fund. She joined Invesco in 1988. Ms. Unflat earned a BA | |
in economics from Queens College and an MBA in finance from St. John’s University. | ||


5 Invesco S&P 500 Index Fund
Your Fund’s Long-Term Performance
Results of a $10,000 Investment – Oldest Share Class(es)
Fund and index data from 8/31/03
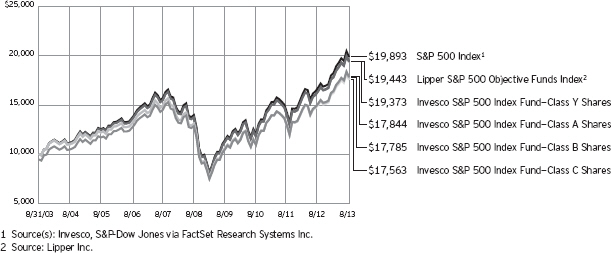
Past performance cannot guarantee comparable future results.
The data shown in the chart include reinvested distributions, applicable sales charges and Fund expenses including management fees. Results for Class B shares are calculated as if a hypothetical
shareholder had liquidated his entire investment in the Fund at the close of the reporting period and paid the contingent deferred sales charges, if applicable. Index results include reinvested dividends, but they do not reflect sales charges. Performance of the peer group, if applicable,
reflects fund expenses and management fees; performance of a market index does not. Performance shown in the chart and table(s) does not reflect deduction of taxes a shareholder would pay on Fund distributions or sale of Fund shares.
continued from page 8
Other information
| n | The returns shown in management’s discussion of Fund performance are based on net asset values calculated for shareholder transactions. Generally accepted accounting principles require adjustments to be made to the net |
assets of the Fund at period end for financial reporting purposes, and as such, the net asset values for shareholder transactions and the returns based on those net asset values may differ from the net asset values and returns reported in the Financial Highlights. |
| n | Industry classifications used in this report are generally according to the Global Industry Classification Standard, which was developed by and is the exclusive property and a service mark of MSCI Inc. and Standard & Poor’s. |
6 Invesco S&P 500 Index Fund
Average Annual Total Returns |
| ||||
As of 8/31/13, including maximum applicable sales charges
|
| ||||
| Class A Shares | |||||
| Inception (9/26/97) | 4.42 | % | |||
| 10 Years | 5.96 | ||||
| 5 Years | 5.62 | ||||
| 1 Year | 11.54 | ||||
| Class B Shares | |||||
| Inception (9/26/97) | 4.39 | % | |||
| 10 Years | 5.93 | ||||
| 5 Years | 5.71 | ||||
| 1 Year | 12.14 | ||||
| Class C Shares | |||||
| Inception (9/26/97) | 4.01 | % | |||
| 10 Years | 5.79 | ||||
| 5 Years | 6.05 | ||||
| 1 Year | 16.14 | ||||
| Class Y Shares | |||||
| Inception (9/26/97) | 5.04 | % | |||
| 10 Years | 6.84 | ||||
| 5 Years | 7.10 | ||||
| 1 Year | 18.33 | ||||
Average Annual Total Returns |
| ||||
| As of 6/30/13, the most recent calendar quarter end, including maximum applicable sales charges | |||||
| Class A Shares | |||||
| Inception (9/26/97) | 4.34 | % | |||
| 10 Years | 6.14 | ||||
| 5 Years | 5.35 | ||||
| 1 Year | 13.32 | ||||
| Class B Shares | |||||
| Inception (9/26/97) | 4.31 | % | |||
| 10 Years | 6.10 | ||||
| 5 Years | 5.45 | ||||
| 1 Year | 14.02 | ||||
| Class C Shares | |||||
| Inception (9/26/97) | 3.93 | % | |||
| 10 Years | 5.96 | ||||
| 5 Years | 5.78 | ||||
| 1 Year | 18.11 | ||||
| Class Y Shares | |||||
| Inception (9/;26/97) | 4.96 | % | |||
| 10 Years | 7.01 | ||||
| 5 Years | 6.84 | ||||
| 1 Year | 20.22 | ||||
Effective June 1, 2010, Class A, Class B, Class C and Class I shares of the predecessor fund, Morgan Stanley S&P 500 Index Fund, advised by Morgan Stanley Investment Advisors Inc. were reorganized into Class A, Class B, Class C and Class Y shares, respectively, of Invesco S&P 500 Index Fund. Returns shown above for Class A, Class B, Class C and Class Y shares are blended returns of the predecessor fund and Invesco S&P 500 Index Fund. Share class returns will differ from the predecessor fund because of different expenses.
The performance data quoted represent past performance and cannot guarantee comparable future results; current performance may be lower or higher. Please visit invesco.com/performance for the most recent month-end performance. Performance figures reflect reinvested distributions, changes in net asset value and the effect of the maximum sales charge unless otherwise stated. Investment return and principal value will fluctuate so that you may have a gain or loss when you sell shares.
The total annual Fund operating expense ratio set forth in the most recent Fund prospectus as of the date of this report for Class A, Class B, Class C and Class Y shares was 0.67%, 1.42%, 1.42% and 0.42%, respectively.
The expense ratios presented above may vary from the expense ratios presented in other sections of this report that are based on expenses incurred during the period covered by this report.
Class A share performance reflects the maximum 5.50% sales charge, and Class B and Class C share performance reflects the applicable contingent deferred sales charge (CDSC) for the period involved. The CDSC on Class B shares declines from 5% beginning at the time of purchase to 0% at the beginning of the seventh year. The CDSC on Class C shares is 1% for the first year after purchase. Class Y shares do not have a front-end sales charge or a CDSC; therefore, performance is at net asset value.
The performance of the Fund’s share classes will differ primarily due to different sales charge structures and class expenses.
7 Invesco S&P 500 Index Fund
Invesco S&P 500 Index Fund’s investment objective is to provide investment results that, before expenses, correspond to the total return (i.e., the combination of capital changes and income) of the Standard & Poor’s 500 Composite Stock Price Index (S&P 500 Index).
| n | Unless otherwise stated, information presented in this report is as of August 31, 2013, and is based on total net assets. |
| n | Unless otherwise noted, all data provided by Invesco. |
| n | To access your Fund’s reports/prospectus, visit invesco.com/fundreports. |
About share classes
| n | Class B shares may not be purchased for new or additional investments. Please see the prospectus for more information. |
| n | Class Y shares are available to only certain investors. Please see the prospectus for more information. |
Principal risks of investing in the Fund
| n | Equity risk. A principal risk of investing in the Fund is associated with its common stock investments. In general, stock values fluctuate in response to activities specific to the company as well as general market, economic and political conditions. Stock prices can fluctuate widely in response to these factors. |
| n | Index risk. The Fund is operated as a passively managed index fund. As such, the adverse performance of a particular stock ordinarily will not result in the elimination of the stock from the Fund’s portfolio. The Fund will remain invested in common stocks even when stock prices are generally falling. Ordinarily, the adviser will not sell the Fund’s portfolio securities except to reflect additions or deletions of the stocks that comprise the S&P 500 Index, or as may be necessary to raise cash to pay Fund shareholders who sell Fund shares. |
The Fund’s ability to correlate its performance, before expenses, with the S&P 500 Index may be affected by, among other things, changes in securities markets, the manner in which the S&P 500 Index is calculated and the timing of purchases and sales, and also depends to some extent on the size of the Fund’s portfolio, the size of cash flows into and out of the Fund and differences between how and when the Fund and the Index are valued.
| n | Management risk. The investment techniques and risk analysis used by the Fund’s portfolio managers may not produce the desired results. |
| n | Foreign securities risk. The Fund’s foreign investments may be affected by changes in a foreign country’s exchange rates, political and social instability, changes in economic or taxation policies, difficulties when enforcing obligations, decreased liquidity, and increased volatility. Foreign companies may be subject to less regulation resulting in less publicly available information about the companies. |
The foreign securities in which the Fund may invest may be issued by issuers located in emerging market or developing countries. Compared to the United States and other developed countries, emerging market or developing countries may have relatively unstable governments, economies based on only a few industries and securities markets that trade a small number of securities. Securities issued by companies located in these countries tend to be especially volatile and may be less liquid than securities traded in developed countries. In the past, securities in these countries may have been characterized by greater potential loss than securities of companies located in developed countries.
| n | Derivatives risk. The performance of derivative instruments is tied to the performance of an underlying currency, security, index or other instrument. In addition to risks relating to their underlying instruments, the use of derivatives may include other, possibly greater, risks. Derivatives involve costs, may be volatile, and may involve a small initial investment relative to the risk assumed. Risks associated with the use of derivatives include |
counterparty, leverage, correlation, liquidity, tax, market, interest rate and management risks. Derivatives may also be more difficult to purchase, sell or value than other investments. The Fund may lose more than the cash amount invested on investments in derivatives. |
Investors should bear in mind that, while the Fund intends to use derivative strategies, it is not obligated to actively engage in these transactions, generally or in any particular kind of derivative, if the investment manager elects not to do so due to availability, cost, market conditions or other factors.
| n | Synthetic securities risk. Fluctuations in the values of synthetic securities may not correlate perfectly with the instruments they are designed to replicate. Synthetic securities may be subject to interest rate changes, market price fluctuations, counterparty risk and liquidity risk. |
About indexes used in this report
| n | The S&P 500 Index® is an unmanaged index considered representative of the US stock market. |
| n | The Lipper S&P 500 Objective Funds Index is an unmanaged index considered representative of S&P 500 funds tracked by Lipper. |
| n | A direct investment cannot be made in an index. Unless otherwise indicated, index results include reinvested dividends, and they do not reflect sales charges. Performance of the peer group, if applicable, reflects fund expenses; performance of a market index does not. |
continued on page 6
This report must be accompanied or preceded by a currently effective Fund prospectus, which contains more complete information, including sales charges and expenses. Investors should read it carefully before investing.
NOT FDIC INSURED | MAY LOSE VALUE | NO BANK GUARANTEE
| Fund Nasdaq Symbols | |||||
| Class A Shares | SPIAX | ||||
| Class B Shares | SPIBX | ||||
| Class C Shares | SPICX | ||||
| Class Y Shares | SPIDX | ||||
8 Invesco S&P 500 Index Fund
Schedule of Investments(a)
August 31, 2013
| Shares | Value | |||||||
Common Stocks & Other Equity Interests–98.91% |
| |||||||
| Advertising–0.15% | ||||||||
Interpublic Group of Cos., Inc. (The) | 17,286 | $ | 271,736 | |||||
Omnicom Group Inc. | 10,431 | 632,640 | ||||||
| 904,376 | ||||||||
| Aerospace & Defense–2.59% | ||||||||
Boeing Co. (The) | 27,552 | 2,863,204 | ||||||
General Dynamics Corp. | 13,395 | 1,115,134 | ||||||
Honeywell International Inc. | 31,746 | 2,526,029 | ||||||
L-3 Communications Holdings, Inc. | 3,595 | 324,736 | ||||||
Lockheed Martin Corp. | 10,730 | 1,313,567 | ||||||
Northrop Grumman Corp. | 9,444 | 871,398 | ||||||
Precision Castparts Corp. | 5,904 | 1,247,161 | ||||||
Raytheon Co. | 13,098 | 987,720 | ||||||
Rockwell Collins, Inc. | 5,454 | 385,979 | ||||||
Textron Inc. | 11,211 | 302,024 | ||||||
United Technologies Corp. | 34,126 | 3,416,013 | ||||||
| 15,352,965 | ||||||||
| Agricultural Products–0.16% | ||||||||
Archer-Daniels-Midland Co. | 26,591 | 936,269 | ||||||
| Air Freight & Logistics–0.75% | ||||||||
C.H. Robinson Worldwide, Inc. | 6,453 | 366,982 | ||||||
Expeditors International of Washington, Inc. | 8,298 | 336,567 | ||||||
FedEx Corp. | 11,890 | 1,276,510 | ||||||
United Parcel Service, Inc.–Class B | 28,669 | 2,453,493 | ||||||
| 4,433,552 | ||||||||
| Airlines–0.06% | ||||||||
Southwest Airlines Co. | 29,145 | 373,348 | ||||||
| Aluminum–0.06% | ||||||||
Alcoa Inc. | 43,151 | 332,263 | ||||||
| Apparel Retail–0.58% | ||||||||
Abercrombie & Fitch Co.–Class A | 3,189 | 112,604 | ||||||
Gap, Inc. (The) | 11,699 | 473,107 | ||||||
L Brands, Inc. | 9,691 | 555,876 | ||||||
Ross Stores, Inc. | 8,844 | 594,847 | ||||||
TJX Cos., Inc. (The) | 29,043 | 1,531,147 | ||||||
Urban Outfitters, Inc.(b) | 4,486 | 188,098 | ||||||
| 3,455,679 | ||||||||
| Apparel, Accessories & Luxury Goods–0.40% | ||||||||
Coach, Inc. | 11,320 | 597,809 | ||||||
Fossil Group, Inc.(b) | 2,141 | 248,656 | ||||||
PVH Corp. | 3,304 | 425,390 | ||||||
Ralph Lauren Corp. | 2,450 | 405,255 | ||||||
VF Corp. | 3,550 | 664,595 | ||||||
| 2,341,705 | ||||||||
| Shares | Value | |||||||
| Application Software–0.60% | ||||||||
Adobe Systems Inc.(b) | 20,252 | $ | 926,529 | |||||
Autodesk, Inc.(b) | 9,038 | 332,147 | ||||||
Citrix Systems, Inc.(b) | 7,581 | 536,507 | ||||||
Intuit Inc. | 11,231 | 713,505 | ||||||
Salesforce.com, Inc.(b) | 21,900 | 1,075,947 | ||||||
| 3,584,635 | ||||||||
| Asset Management & Custody Banks–1.23% | ||||||||
Ameriprise Financial, Inc. | 8,175 | 704,276 | ||||||
Bank of New York Mellon Corp. (The) | 46,832 | 1,392,784 | ||||||
BlackRock, Inc. | 5,036 | 1,310,972 | ||||||
Franklin Resources, Inc. | 16,728 | 772,165 | ||||||
Invesco Ltd.(c) | 17,941 | 544,689 | ||||||
Legg Mason, Inc. | 4,545 | 147,803 | ||||||
Northern Trust Corp. | 8,751 | 480,167 | ||||||
State Street Corp. | 18,402 | 1,227,781 | ||||||
T. Rowe Price Group Inc. | 10,434 | 731,841 | ||||||
| 7,312,478 | ||||||||
| Auto Parts & Equipment–0.37% | ||||||||
BorgWarner, Inc. | 4,619 | 446,103 | ||||||
Delphi Automotive PLC (United Kingdom) | 11,726 | 645,165 | ||||||
Johnson Controls, Inc. | 27,640 | 1,120,249 | ||||||
| 2,211,517 | ||||||||
| Automobile Manufacturers–0.61% | ||||||||
Ford Motor Co. | 158,628 | 2,568,187 | ||||||
General Motors Co.(b) | 31,062 | 1,058,593 | ||||||
| 3,626,780 | ||||||||
| Automotive Retail–0.28% | ||||||||
AutoNation, Inc.(b) | 1,564 | 73,101 | ||||||
AutoZone, Inc.(b) | 1,456 | 611,433 | ||||||
CarMax, Inc.(b) | 9,057 | 430,751 | ||||||
O’Reilly Automotive, Inc.(b) | 4,426 | 543,114 | ||||||
| 1,658,399 | ||||||||
| Biotechnology–2.19% | ||||||||
Alexion Pharmaceuticals, Inc.(b) | 7,839 | 844,731 | ||||||
Amgen Inc. | 30,261 | 3,296,633 | ||||||
Biogen Idec Inc.(b) | 9,577 | 2,040,093 | ||||||
Celgene Corp.(b) | 16,831 | 2,356,003 | ||||||
Gilead Sciences, Inc.(b) | 61,549 | 3,709,558 | ||||||
Regeneron Pharmaceuticals, Inc.(b) | 3,057 | 740,742 | ||||||
| 12,987,760 | ||||||||
| Brewers–0.05% | ||||||||
Molson Coors Brewing Co.–Class B | 6,336 | 309,133 | ||||||
| Broadcasting–0.37% | ||||||||
CBS Corp.–Class B | 23,025 | 1,176,578 | ||||||
Discovery Communications, Inc.– | 9,873 | 765,256 | ||||||
Scripps Networks Interactive Inc.–Class A | 3,438 | 252,796 | ||||||
| 2,194,630 | ||||||||
See accompanying Notes to Financial Statements which are an integral part of the financial statements.
9 Invesco S&P 500 Index Fund
| Shares | Value | |||||||
| Building Products–0.05% | ||||||||
Masco Corp. | 14,399 | $ | 272,429 | |||||
| Cable & Satellite–1.21% | ||||||||
Cablevision Systems Corp.–Class A | 8,724 | 154,677 | ||||||
Comcast Corp.–Class A | 106,260 | 4,472,483 | ||||||
DIRECTV(b) | 22,538 | 1,311,261 | ||||||
Time Warner Cable Inc. | 11,740 | 1,260,289 | ||||||
| 7,198,710 | ||||||||
| Casinos & Gaming–0.11% | ||||||||
International Game Technology | 10,506 | 198,458 | ||||||
Wynn Resorts Ltd. | 3,219 | 454,008 | ||||||
| 652,466 | ||||||||
| Coal & Consumable Fuels–0.08% | ||||||||
CONSOL Energy Inc. | 9,178 | 286,629 | ||||||
Peabody Energy Corp. | 10,866 | 186,895 | ||||||
| 473,524 | ||||||||
| Commodity Chemicals–0.18% | ||||||||
LyondellBasell Industries N.V.–Class A | 15,325 | 1,075,049 | ||||||
| Communications Equipment–1.90% | ||||||||
Cisco Systems, Inc. | 215,649 | 5,026,778 | ||||||
F5 Networks, Inc.(b) | 3,138 | 261,646 | ||||||
Harris Corp. | 4,468 | 253,023 | ||||||
JDS Uniphase Corp.(b) | 9,543 | 122,437 | ||||||
Juniper Networks, Inc.(b) | 20,427 | 386,070 | ||||||
Motorola Solutions, Inc. | 10,961 | 613,926 | ||||||
QUALCOMM, Inc. | 69,720 | 4,621,042 | ||||||
| 11,284,922 | ||||||||
| Computer & Electronics Retail–0.11% | ||||||||
Best Buy Co., Inc. | 10,833 | 389,988 | ||||||
GameStop Corp.–Class A | 4,752 | 238,598 | ||||||
| 628,586 | ||||||||
| Computer Hardware–3.54% | ||||||||
Apple Inc. | 37,875 | 18,447,019 | ||||||
Dell Inc. | 59,221 | 815,473 | ||||||
Hewlett-Packard Co. | 77,818 | 1,738,454 | ||||||
| 21,000,946 | ||||||||
| Computer Storage & Peripherals–0.74% | ||||||||
EMC Corp. | 84,770 | 2,185,371 | ||||||
NetApp, Inc. | 14,543 | 604,116 | ||||||
SanDisk Corp. | 9,817 | 541,702 | ||||||
Seagate Technology PLC | 12,876 | 493,408 | ||||||
Western Digital Corp. | 8,575 | 531,650 | ||||||
| 4,356,247 | ||||||||
| Construction & Engineering–0.16% | ||||||||
Fluor Corp. | 6,609 | 419,209 | ||||||
Jacobs Engineering Group, Inc.(b) | 5,301 | 308,942 | ||||||
Quanta Services, Inc.(b) | 8,572 | 224,072 | ||||||
| 952,223 | ||||||||
| Shares | Value | |||||||
| Construction & Farm Machinery & Heavy Trucks–0.90% | ||||||||
Caterpillar Inc. | 26,529 | $ | 2,189,704 | |||||
Cummins Inc. | 7,080 | 872,256 | ||||||
Deere & Co. | 15,657 | 1,309,552 | ||||||
Joy Global Inc. | 4,337 | 213,033 | ||||||
PACCAR Inc. | 14,272 | 765,122 | ||||||
| 5,349,667 | ||||||||
| Construction Materials–0.04% | ||||||||
Vulcan Materials Co. | 5,199 | 248,512 | ||||||
| Consumer Electronics–0.06% | ||||||||
Garmin Ltd. | 4,428 | 180,530 | ||||||
Harman International Industries, Inc. | 2,750 | 176,055 | ||||||
| 356,585 | ||||||||
| Consumer Finance–0.96% | ||||||||
American Express Co. | 38,568 | 2,773,425 | ||||||
Capital One Financial Corp. | 23,571 | 1,521,508 | ||||||
Discover Financial Services | 19,788 | 934,983 | ||||||
SLM Corp. | 17,924 | 429,997 | ||||||
| 5,659,913 | ||||||||
| Data Processing & Outsourced Services–1.68% | ||||||||
Automatic Data Processing, Inc. | 19,578 | 1,393,170 | ||||||
Computer Sciences Corp. | 6,025 | 302,154 | ||||||
Fidelity National Information Services, Inc. | 11,824 | 525,695 | ||||||
Fiserv, Inc.(b) | 5,380 | 517,933 | ||||||
MasterCard, Inc.–Class A | 4,217 | 2,555,839 | ||||||
Paychex, Inc. | 13,065 | 505,354 | ||||||
Total System Services, Inc. | 6,534 | 180,796 | ||||||
Visa Inc.–Class A | 20,449 | 3,566,715 | ||||||
Western Union Co. (The) | 22,479 | 394,057 | ||||||
| 9,941,713 | ||||||||
| Department Stores–0.26% | ||||||||
J. C. Penney Co., Inc.(b) | 7,733 | 96,508 | ||||||
Kohl’s Corp. | 8,208 | 421,153 | ||||||
Macy’s, Inc. | 15,479 | 687,732 | ||||||
Nordstrom, Inc. | 5,988 | 333,711 | ||||||
| 1,539,104 | ||||||||
| Distillers & Vintners–0.19% | ||||||||
Beam Inc. | 6,520 | 408,478 | ||||||
Brown-Forman Corp.–Class B | 6,102 | 408,773 | ||||||
Constellation Brands, Inc.–Class A(b) | 6,206 | 336,675 | ||||||
| 1,153,926 | ||||||||
| Distributors–0.08% | ||||||||
Genuine Parts Co. | 6,298 | 485,009 | ||||||
| Diversified Banks–1.88% | ||||||||
Comerica Inc. | 7,530 | 307,525 | ||||||
U.S. Bancorp | 74,634 | 2,696,527 | ||||||
Wells Fargo & Co. | 198,755 | 8,164,855 | ||||||
| 11,168,907 | ||||||||
See accompanying Notes to Financial Statements which are an integral part of the financial statements.
10 Invesco S&P 500 Index Fund
| Shares | Value | |||||||
| Diversified Chemicals–0.96% | ||||||||
Dow Chemical Co. (The) | 48,808 | $ | 1,825,419 | |||||
E. I. du Pont de Nemours & Co. | 37,140 | 2,102,867 | ||||||
Eastman Chemical Co. | 6,254 | 475,304 | ||||||
FMC Corp. | 5,532 | 368,486 | ||||||
PPG Industries, Inc. | 5,755 | 898,989 | ||||||
| 5,671,065 | ||||||||
| Diversified Metals & Mining–0.21% | ||||||||
Freeport-McMoRan Copper & Gold Inc. | 41,892 | 1,265,976 | ||||||
| Diversified REIT’s–0.09% | ||||||||
Vornado Realty Trust | 6,825 | 554,873 | ||||||
| Diversified Support Services–0.06% | ||||||||
Cintas Corp. | 4,220 | 201,547 | ||||||
Iron Mountain Inc. | 6,734 | 173,737 | ||||||
| 375,284 | ||||||||
| Drug Retail–0.77% | ||||||||
CVS Caremark Corp. | 49,405 | 2,867,960 | ||||||
Walgreen Co. | 34,790 | 1,672,356 | ||||||
| 4,540,316 | ||||||||
| Electric Utilities–1.79% | ||||||||
American Electric Power Co., Inc. | 19,611 | 839,351 | ||||||
Duke Energy Corp. | 28,477 | 1,868,091 | ||||||
Edison International | 13,146 | 603,270 | ||||||
Entergy Corp. | 7,162 | 452,853 | ||||||
Exelon Corp. | 34,534 | 1,052,942 | ||||||
FirstEnergy Corp. | 16,875 | 632,306 | ||||||
NextEra Energy, Inc. | 17,134 | 1,376,888 | ||||||
Northeast Utilities | 12,684 | 519,664 | ||||||
Pepco Holdings, Inc. | 10,029 | 189,949 | ||||||
Pinnacle West Capital Corp. | 4,386 | 238,028 | ||||||
PPL Corp. | 25,516 | 783,341 | ||||||
Southern Co. (The) | 35,120 | 1,461,695 | ||||||
Xcel Energy, Inc. | 20,063 | 560,159 | ||||||
| 10,578,537 | ||||||||
| Electrical Components & Equipment–0.68% | ||||||||
Eaton Corp. PLC | 19,089 | 1,208,715 | ||||||
Emerson Electric Co. | 29,006 | 1,751,092 | ||||||
Rockwell Automation, Inc. | 5,633 | 547,697 | ||||||
Roper Industries, Inc. | 4,036 | 499,253 | ||||||
| 4,006,757 | ||||||||
| Electronic Components–0.22% | ||||||||
Amphenol Corp.–Class A | 6,494 | 492,050 | ||||||
Corning Inc. | 59,521 | 835,675 | ||||||
| 1,327,725 | ||||||||
| Electronic Equipment & Instruments–0.03% | ||||||||
FLIR Systems, Inc. | 5,685 | 177,827 | ||||||
| Electronic Manufacturing Services–0.20% | ||||||||
Jabil Circuit, Inc. | 7,481 | 170,716 | ||||||
| Shares | Value | |||||||
| Electronic Manufacturing Services–(continued) | ||||||||
Molex Inc. | 5,639 | $ | 163,644 | |||||
TE Connectivity Ltd. (Switzerland) | 16,762 | 821,338 | ||||||
| 1,155,698 | ||||||||
| Environmental & Facilities Services–0.25% | ||||||||
Republic Services, Inc. | 11,974 | 389,275 | ||||||
Stericycle, Inc.(b) | 3,507 | 394,748 | ||||||
Waste Management, Inc. | 17,714 | 716,354 | ||||||
| 1,500,377 | ||||||||
| Fertilizers & Agricultural Chemicals–0.51% | ||||||||
CF Industries Holdings, Inc. | 2,367 | 450,535 | ||||||
Monsanto Co. | 21,541 | 2,108,649 | ||||||
Mosaic Co. (The) | 11,153 | 464,522 | ||||||
| 3,023,706 | ||||||||
| Food Distributors–0.13% | ||||||||
Sysco Corp. | 23,947 | 766,783 | ||||||
| Food Retail–0.30% | ||||||||
Kroger Co. (The) | 20,984 | 768,014 | ||||||
Safeway Inc. | 9,727 | 251,929 | ||||||
Whole Foods Market, Inc. | 13,917 | 734,122 | ||||||
| 1,754,065 | ||||||||
| Footwear–0.31% | ||||||||
NIKE, Inc.–Class B | 29,206 | 1,834,721 | ||||||
| Gas Utilities–0.11% | ||||||||
AGL Resources Inc. | 4,812 | 211,487 | ||||||
ONEOK, Inc. | 8,316 | 427,775 | ||||||
| 639,262 | ||||||||
| General Merchandise Stores–0.51% | ||||||||
Dollar General Corp.(b) | 12,153 | 655,897 | ||||||
Dollar Tree, Inc.(b) | 9,027 | 475,723 | ||||||
Family Dollar Stores, Inc. | 3,872 | 275,648 | ||||||
Target Corp. | 25,892 | 1,639,223 | ||||||
| 3,046,491 | ||||||||
| Gold–0.11% | ||||||||
Newmont Mining Corp. | 20,062 | 637,370 | ||||||
| Health Care Distributors–0.42% | ||||||||
AmerisourceBergen Corp. | 9,316 | 530,267 | ||||||
Cardinal Health, Inc. | 13,792 | 693,462 | ||||||
McKesson Corp. | 9,140 | 1,109,687 | ||||||
Patterson Cos. Inc. | 3,363 | 134,116 | ||||||
| 2,467,532 | ||||||||
| Health Care Equipment–2.02% | ||||||||
Abbott Laboratories | 62,901 | 2,096,490 | ||||||
Baxter International Inc. | 21,868 | 1,521,138 | ||||||
Becton, Dickinson & Co. | 7,788 | 758,395 | ||||||
Boston Scientific Corp.(b) | 54,437 | 575,944 | ||||||
C.R. Bard, Inc. | 2,992 | 343,691 | ||||||
See accompanying Notes to Financial Statements which are an integral part of the financial statements.
11 Invesco S&P 500 Index Fund
| Shares | Value | |||||||
| Health Care Equipment–(continued) | ||||||||
CareFusion Corp.(b) | 8,852 | $ | 317,344 | |||||
Covidien PLC | 18,983 | 1,127,590 | ||||||
Edwards Lifesciences Corp.(b) | 4,566 | 321,355 | ||||||
Intuitive Surgical, Inc.(b) | 1,614 | 623,843 | ||||||
Medtronic, Inc. | 40,808 | 2,111,814 | ||||||
St. Jude Medical, Inc. | 11,404 | 574,876 | ||||||
Stryker Corp. | 11,593 | 775,456 | ||||||
Varian Medical Systems, Inc.(b) | 4,379 | 308,501 | ||||||
Zimmer Holdings, Inc. | 6,787 | 536,784 | ||||||
| 11,993,221 | ||||||||
| Health Care Facilities–0.03% | ||||||||
Tenet Healthcare Corp.(b) | 4,170 | 162,839 | ||||||
| Health Care Services–0.54% | ||||||||
DaVita HealthCare Partners Inc.(b) | 3,375 | 362,846 | ||||||
Express Scripts Holding Co.(b) | 32,939 | 2,104,143 | ||||||
Laboratory Corp. of America Holdings(b) | 3,744 | 358,376 | ||||||
Quest Diagnostics Inc. | 6,334 | 371,299 | ||||||
| 3,196,664 | ||||||||
| Health Care Supplies–0.04% | ||||||||
DENTSPLY International Inc. | 5,809 | 243,920 | ||||||
| Health Care Technology–0.09% | ||||||||
Cerner Corp.(b) | 11,790 | 543,047 | ||||||
| Home Entertainment Software–0.05% | ||||||||
Electronic Arts Inc.(b) | 12,211 | 325,301 | ||||||
| Home Furnishings–0.03% | ||||||||
Leggett & Platt, Inc. | 5,757 | 166,492 | ||||||
| Home Improvement Retail–1.08% | ||||||||
Home Depot, Inc. (The) | 58,943 | 4,390,664 | ||||||
Lowe’s Cos., Inc. | 43,273 | 1,982,769 | ||||||
| 6,373,433 | ||||||||
| Homebuilding–0.11% | ||||||||
D.R. Horton, Inc. | 11,312 | 201,919 | ||||||
Lennar Corp.–Class A | 6,626 | 210,773 | ||||||
PulteGroup Inc. | 13,759 | 211,751 | ||||||
| 624,443 | ||||||||
| Homefurnishing Retail–0.11% | ||||||||
Bed Bath & Beyond Inc.(b) | 8,813 | 649,871 | ||||||
| Hotels, Resorts & Cruise Lines–0.31% | ||||||||
Carnival Corp. | 17,915 | 646,553 | ||||||
Marriott International Inc.–Class A | 9,665 | 386,503 | ||||||
Starwood Hotels & Resorts Worldwide, Inc. | 7,850 | 501,929 | ||||||
Wyndham Worldwide Corp. | 5,464 | 324,343 | ||||||
| 1,859,328 | ||||||||
| Household Appliances–0.07% | ||||||||
Whirlpool Corp. | 3,162 | 406,791 | ||||||
| Shares | Value | |||||||
| Household Products–2.12% | ||||||||
Clorox Co. (The) | 5,325 | $ | 440,377 | |||||
Colgate-Palmolive Co. | 35,378 | 2,043,787 | ||||||
Kimberly-Clark Corp. | 15,518 | 1,450,623 | ||||||
Procter & Gamble Co. (The) | 110,592 | 8,614,011 | ||||||
| 12,548,798 | ||||||||
| Housewares & Specialties–0.05% | ||||||||
Newell Rubbermaid Inc. | 11,641 | 294,517 | ||||||
| Human Resource & Employment Services–0.03% | ||||||||
Robert Half International, Inc. | 5,584 | 196,948 | ||||||
| Hypermarkets & Super Centers–1.15% | ||||||||
Costco Wholesale Corp. | 17,620 | 1,971,149 | ||||||
Wal-Mart Stores, Inc. | 66,108 | 4,824,562 | ||||||
| 6,795,711 | ||||||||
| Independent Power Producers & Energy Traders–0.11% | ||||||||
AES Corp. (The) | 25,002 | 317,775 | ||||||
NRG Energy, Inc. | 13,012 | 341,565 | ||||||
| 659,340 | ||||||||
| Industrial Conglomerates–2.38% | ||||||||
3M Co. | 25,621 | 2,910,033 | ||||||
Danaher Corp. | 23,478 | 1,538,279 | ||||||
General Electric Co.(d) | 417,234 | 9,654,795 | ||||||
| 14,103,107 | ||||||||
| Industrial Gases–0.43% | ||||||||
Air Products & Chemicals, Inc. | 8,405 | 858,487 | ||||||
Airgas, Inc. | 2,653 | 269,677 | ||||||
Praxair, Inc. | 11,933 | 1,400,934 | ||||||
| 2,529,098 | ||||||||
| Industrial Machinery–0.87% | ||||||||
Dover Corp. | 6,877 | 584,889 | ||||||
Flowserve Corp. | 5,772 | 322,020 | ||||||
Illinois Tool Works Inc. | 16,721 | 1,195,050 | ||||||
Ingersoll-Rand PLC | 11,216 | 663,314 | ||||||
Pall Corp. | 4,479 | 309,678 | ||||||
Parker Hannifin Corp. | 5,985 | 598,201 | ||||||
Pentair Ltd. | 8,283 | 497,891 | ||||||
Snap-on Inc. | 2,325 | 217,620 | ||||||
Stanley Black & Decker Inc. | 6,518 | 555,725 | ||||||
Xylem, Inc. | 7,471 | 185,131 | ||||||
| 5,129,519 | ||||||||
| Industrial REIT’s–0.12% | ||||||||
Prologis, Inc. | 20,103 | 708,430 | ||||||
| Insurance Brokers–0.29% | ||||||||
Aon PLC | 12,472 | 827,892 | ||||||
Marsh & McLennan Cos., Inc. | 22,210 | 915,718 | ||||||
| 1,743,610 | ||||||||
| Integrated Oil & Gas–4.95% | ||||||||
Chevron Corp. | 78,239 | 9,422,323 | ||||||
See accompanying Notes to Financial Statements which are an integral part of the financial statements.
12 Invesco S&P 500 Index Fund
| Shares | Value | |||||||
| Integrated Oil & Gas–(continued) | ||||||||
Exxon Mobil Corp. | 179,415 | $ | 15,637,811 | |||||
Hess Corp. | 12,051 | 902,017 | ||||||
Murphy Oil Corp. | 7,366 | 496,616 | ||||||
Occidental Petroleum Corp. | 32,508 | 2,867,531 | ||||||
| 29,326,298 | ||||||||
| Integrated Telecommunication Services–2.36% | ||||||||
AT&T Inc. | 217,088 | 7,344,087 | ||||||
CenturyLink Inc. | 24,575 | 813,924 | ||||||
Frontier Communications Corp. | 40,259 | 174,322 | ||||||
Verizon Communications Inc. | 115,448 | 5,469,926 | ||||||
Windstream Corp. | 23,918 | 193,018 | ||||||
| 13,995,277 | ||||||||
| Internet Retail–1.22% | ||||||||
Amazon.com, Inc.(b) | 14,694 | 4,128,720 | ||||||
Expedia, Inc. | 3,798 | 177,595 | ||||||
Netflix Inc.(b) | 2,276 | 646,179 | ||||||
Priceline.com Inc.(b) | 2,080 | 1,952,143 | ||||||
TripAdvisor Inc.(b) | 4,488 | 331,977 | ||||||
| 7,236,614 | ||||||||
| Internet Software & Services–2.23% | ||||||||
Akamai Technologies, Inc.(b) | 7,134 | 328,021 | ||||||
eBay Inc.(b) | 47,129 | 2,355,979 | ||||||
Google Inc.–Class A(b) | 10,843 | 9,182,937 | ||||||
VeriSign, Inc.(b) | 6,104 | 292,931 | ||||||
Yahoo! Inc.(b) | 38,289 | 1,038,397 | ||||||
| 13,198,265 | ||||||||
| Investment Banking & Brokerage–0.87% | ||||||||
Charles Schwab Corp. (The) | 44,417 | 927,427 | ||||||
E*TRADE Financial Corp.(b) | 11,573 | 162,485 | ||||||
Goldman Sachs Group, Inc. (The) | 17,390 | 2,645,541 | ||||||
Morgan Stanley | 55,364 | 1,426,176 | ||||||
| 5,161,629 | ||||||||
| IT Consulting & Other Services–1.86% | ||||||||
Accenture PLC–Class A | 26,230 | 1,895,117 | ||||||
Cognizant Technology Solutions Corp.–Class A(b) | 12,170 | 892,061 | ||||||
International Business Machines Corp. | 42,055 | 7,665,365 | ||||||
SAIC, Inc. | 11,471 | 172,868 | ||||||
Teradata Corp.(b) | 6,642 | 388,956 | ||||||
| 11,014,367 | ||||||||
| Leisure Products–0.13% | ||||||||
Hasbro, Inc. | 4,629 | 210,990 | ||||||
Mattel, Inc. | 13,936 | 564,408 | ||||||
| 775,398 | ||||||||
| Life & Health Insurance–1.02% | ||||||||
Aflac, Inc. | 18,812 | 1,087,145 | ||||||
Lincoln National Corp. | 10,832 | 455,377 | ||||||
MetLife, Inc. | 44,184 | 2,040,859 | ||||||
| Shares | Value | |||||||
| Life & Health Insurance–(continued) | ||||||||
Principal Financial Group, Inc. | 11,117 | $ | 454,908 | |||||
Prudential Financial, Inc. | 18,803 | 1,407,969 | ||||||
Torchmark Corp. | 3,708 | 255,444 | ||||||
Unum Group | 10,770 | 318,038 | ||||||
| 6,019,740 | ||||||||
| Life Sciences Tools & Services–0.50% | ||||||||
Agilent Technologies, Inc. | 13,899 | 648,249 | ||||||
Life Technologies Corp.(b) | 6,907 | 513,950 | ||||||
PerkinElmer, Inc. | 4,532 | 163,016 | ||||||
Thermo Fisher Scientific, Inc. | 14,482 | 1,286,436 | ||||||
Waters Corp.(b) | 3,450 | 341,033 | ||||||
| 2,952,684 | ||||||||
| Managed Health Care–1.09% | ||||||||
Aetna Inc. | 15,261 | 967,395 | ||||||
Cigna Corp. | 11,512 | 905,879 | ||||||
Humana Inc. | 6,379 | 587,378 | ||||||
UnitedHealth Group Inc. | 41,157 | 2,952,603 | ||||||
WellPoint, Inc. | 12,119 | 1,031,812 | ||||||
| 6,445,067 | ||||||||
| Metal & Glass Containers–0.08% | ||||||||
Ball Corp. | 5,977 | 265,498 | ||||||
Owens-Illinois, Inc.(b) | 6,672 | 189,418 | ||||||
| 454,916 | ||||||||
| Motorcycle Manufacturers–0.09% | ||||||||
Harley-Davidson, Inc. | 8,995 | 539,520 | ||||||
| Movies & Entertainment–1.80% | ||||||||
Time Warner Inc. | 37,614 | 2,276,775 | ||||||
Twenty-First Century Fox, Inc. | 80,318 | 2,516,363 | ||||||
Viacom Inc.–Class B | 18,001 | 1,432,160 | ||||||
Walt Disney Co. (The) | 72,669 | 4,420,455 | ||||||
| 10,645,753 | ||||||||
| Multi-Line Insurance–0.72% | ||||||||
American International Group, Inc.(b) | 59,572 | 2,767,715 | ||||||
Assurant, Inc. | 3,073 | 162,992 | ||||||
Genworth Financial Inc.–Class A(b) | 19,896 | 234,773 | ||||||
Hartford Financial Services Group, | 18,395 | 544,492 | ||||||
Loews Corp. | 12,391 | 550,904 | ||||||
| 4,260,876 | ||||||||
| Multi-Sector Holdings–0.05% | ||||||||
Leucadia National Corp. | 11,905 | 296,792 | ||||||
| Multi-Utilities–1.18% | ||||||||
Ameren Corp. | 9,768 | 330,256 | ||||||
CenterPoint Energy, Inc. | 17,291 | 396,483 | ||||||
CMS Energy Corp. | 10,721 | 284,428 | ||||||
Consolidated Edison, Inc. | 11,811 | 664,133 | ||||||
Dominion Resources, Inc. | 23,309 | 1,360,080 | ||||||
DTE Energy Co. | 7,018 | 469,294 | ||||||
See accompanying Notes to Financial Statements which are an integral part of the financial statements.
13 Invesco S&P 500 Index Fund
| Shares | Value | |||||||
| Multi-Utilities–(continued) | ||||||||
Integrys Energy Group, Inc. | 3,236 | $ | 180,957 | |||||
NiSource Inc. | 12,590 | 368,383 | ||||||
PG&E Corp. | 17,841 | 737,904 | ||||||
Public Service Enterprise Group Inc. | 20,415 | 661,854 | ||||||
SCANA Corp. | 5,587 | 268,846 | ||||||
Sempra Energy | 9,094 | 767,715 | ||||||
TECO Energy, Inc. | 8,217 | 135,827 | ||||||
Wisconsin Energy Corp. | 9,213 | 378,102 | ||||||
| 7,004,262 | ||||||||
| Office Electronics–0.08% | ||||||||
Xerox Corp. | 49,547 | 494,479 | ||||||
| Office REIT’s–0.11% | ||||||||
Boston Properties, Inc. | 6,078 | 622,995 | ||||||
| Office Services & Supplies–0.02% | ||||||||
Pitney Bowes Inc. | 8,104 | 132,257 | ||||||
| Oil & Gas Drilling–0.29% | ||||||||
Diamond Offshore Drilling, Inc. | 2,757 | 176,531 | ||||||
Ensco PLC–Class A | 9,353 | 519,653 | ||||||
Helmerich & Payne, Inc. | 4,267 | 268,992 | ||||||
Nabors Industries Ltd. | 11,887 | 183,060 | ||||||
Noble Corp. | 10,178 | 378,621 | ||||||
Rowan Cos. PLC–Class A(b) | 5,006 | 177,312 | ||||||
| 1,704,169 | ||||||||
| Oil & Gas Equipment & Services–1.55% | ||||||||
Baker Hughes Inc. | 17,827 | 828,777 | ||||||
Cameron International Corp.(b) | 9,980 | 566,764 | ||||||
FMC Technologies, Inc.(b) | 9,568 | 513,132 | ||||||
Halliburton Co. | 34,864 | 1,673,472 | ||||||
National Oilwell Varco Inc. | 17,241 | 1,281,006 | ||||||
Schlumberger Ltd. | 53,644 | 4,341,946 | ||||||
| 9,205,097 | ||||||||
| Oil & Gas Exploration & Production–2.60% | ||||||||
Anadarko Petroleum Corp. | 20,234 | 1,849,792 | ||||||
Apache Corp. | 15,810 | 1,354,601 | ||||||
Cabot Oil & Gas Corp. | 17,007 | 665,484 | ||||||
Chesapeake Energy Corp. | 20,938 | 540,410 | ||||||
ConocoPhillips | 49,335 | 3,270,910 | ||||||
Denbury Resources Inc.(b) | 15,056 | 260,318 | ||||||
Devon Energy Corp. | 15,234 | 869,709 | ||||||
EOG Resources, Inc. | 10,978 | 1,724,095 | ||||||
EQT Corp. | 6,026 | 516,549 | ||||||
Marathon Oil Corp. | 28,601 | 984,732 | ||||||
Newfield Exploration Co.(b) | 5,436 | 129,485 | ||||||
Noble Energy, Inc. | 14,491 | 890,182 | ||||||
Pioneer Natural Resources Co. | 5,511 | 964,260 | ||||||
QEP Resources Inc. | 7,280 | 198,890 | ||||||
Range Resources Corp. | 6,560 | 491,869 | ||||||
| Shares | Value | |||||||
| Oil & Gas Exploration & Production–(continued) | ||||||||
Southwestern Energy Co.(b) | 14,183 | $ | 541,791 | |||||
WPX Energy Inc.(b) | 8,042 | 150,064 | ||||||
| 15,403,141 | ||||||||
| Oil & Gas Refining & Marketing–0.58% | ||||||||
Marathon Petroleum Corp. | 13,105 | 950,243 | ||||||
Phillips 66 | 24,986 | 1,426,701 | ||||||
Tesoro Corp. | 5,496 | 253,311 | ||||||
Valero Energy Corp. | 22,006 | 781,873 | ||||||
| 3,412,128 | ||||||||
| Oil & Gas Storage & Transportation–0.48% | ||||||||
Kinder Morgan Inc. | 25,493 | 966,950 | ||||||
Spectra Energy Corp. | 27,002 | 894,036 | ||||||
Williams Cos., Inc. (The) | 27,547 | 998,303 | ||||||
| 2,859,289 | ||||||||
| Other Diversified Financial Services–3.34% | ||||||||
Bank of America Corp. | 435,000 | 6,142,200 | ||||||
Citigroup Inc. | 122,782 | 5,934,054 | ||||||
JPMorgan Chase & Co. | 152,513 | 7,706,482 | ||||||
| 19,782,736 | ||||||||
| Packaged Foods & Meats–1.48% | ||||||||
Campbell Soup Co. | 7,188 | 310,378 | ||||||
ConAgra Foods, Inc. | 16,818 | 568,785 | ||||||
General Mills, Inc. | 26,011 | 1,282,862 | ||||||
Hershey Co. (The) | 6,005 | 552,160 | ||||||
Hormel Foods Corp. | 5,427 | 224,841 | ||||||
JM Smucker Co. (The) | 4,361 | 462,876 | ||||||
Kellogg Co. | 10,238 | 621,549 | ||||||
Kraft Foods Group, Inc. | 23,987 | 1,241,807 | ||||||
McCormick & Co., Inc. | 5,307 | 359,019 | ||||||
Mead Johnson Nutrition Co. | 8,145 | 611,119 | ||||||
Mondelez International Inc.–Class A | 72,004 | 2,208,363 | ||||||
Tyson Foods, Inc.–Class A | 11,435 | 331,043 | ||||||
| 8,774,802 | ||||||||
| Paper Packaging–0.14% | ||||||||
Avery Dennison Corp. | 4,048 | 173,093 | ||||||
Bemis Co., Inc. | 4,156 | 165,367 | ||||||
MeadWestvaco Corp. | 7,140 | 255,969 | ||||||
Sealed Air Corp. | 7,901 | 224,389 | ||||||
| 818,818 | ||||||||
| Paper Products–0.14% | ||||||||
International Paper Co. | 17,949 | 847,372 | ||||||
| Personal Products–0.17% | ||||||||
Avon Products, Inc. | 17,476 | 345,500 | ||||||
Estee Lauder Cos. Inc. (The)–Class A | 9,702 | 634,123 | ||||||
| 979,623 | ||||||||
| Pharmaceuticals–5.85% | ||||||||
AbbVie Inc. | 63,904 | 2,722,949 | ||||||
Actavis Inc.(b) | 5,198 | 702,666 | ||||||
See accompanying Notes to Financial Statements which are an integral part of the financial statements.
14 Invesco S&P 500 Index Fund
| Shares | Value | |||||||
| Pharmaceuticals–(continued) | ||||||||
Allergan, Inc. | 11,959 | $ | 1,056,936 | |||||
Bristol-Myers Squibb Co. | 66,278 | 2,763,130 | ||||||
Eli Lilly & Co. | 40,002 | 2,056,103 | ||||||
Forest Laboratories, Inc.(b) | 9,430 | 401,058 | ||||||
Hospira, Inc.(b) | 6,662 | 260,018 | ||||||
Johnson & Johnson | 113,341 | 9,793,796 | ||||||
Merck & Co., Inc. | 121,844 | 5,762,003 | ||||||
Mylan Inc.(b) | 15,376 | 543,388 | ||||||
Perrigo Co. | 3,599 | 437,458 | ||||||
Pfizer Inc. | 269,271 | 7,596,135 | ||||||
Zoetis Inc. | 20,174 | 588,072 | ||||||
| 34,683,712 | ||||||||
| Property & Casualty Insurance–2.29% | ||||||||
ACE Ltd. | 13,725 | 1,203,957 | ||||||
Allstate Corp. (The) | 18,909 | 906,119 | ||||||
Berkshire Hathaway Inc.–Class B(b) | 73,610 | 8,186,904 | ||||||
Chubb Corp. (The) | 10,456 | 869,626 | ||||||
Cincinnati Financial Corp. | 5,890 | 269,055 | ||||||
Progressive Corp. (The) | 22,362 | 560,616 | ||||||
Travelers Cos., Inc. (The) | 15,188 | 1,213,521 | ||||||
XL Group PLC | 11,689 | 345,527 | ||||||
| 13,555,325 | ||||||||
| Publishing–0.11% | ||||||||
Gannett Co., Inc. | 9,235 | 222,471 | ||||||
News Corp.–Class A(b) | 20,079 | 315,240 | ||||||
Washington Post Co. (The)–Class B | 174 | 98,136 | ||||||
| 635,847 | ||||||||
| Railroads–0.89% | ||||||||
CSX Corp. | 41,236 | 1,014,818 | ||||||
Kansas City Southern | 4,480 | 472,282 | ||||||
Norfolk Southern Corp. | 12,713 | 917,370 | ||||||
Union Pacific Corp. | 18,834 | 2,891,772 | ||||||
| 5,296,242 | ||||||||
| Real Estate Services–0.05% | ||||||||
CBRE Group, Inc.–Class A(b) | 12,253 | 267,973 | ||||||
| Regional Banks–0.99% | ||||||||
BB&T Corp. | 28,313 | 961,509 | ||||||
Fifth Third Bancorp | 35,292 | 645,491 | ||||||
Huntington Bancshares Inc. | 33,844 | 278,875 | ||||||
KeyCorp | 37,142 | 433,447 | ||||||
M&T Bank Corp. | 4,928 | 558,540 | ||||||
PNC Financial Services Group, Inc. | 21,361 | 1,543,759 | ||||||
Regions Financial Corp. | 57,030 | 536,082 | ||||||
SunTrust Banks, Inc. | 21,747 | 696,339 | ||||||
Zions Bancorp. | 7,390 | 206,698 | ||||||
| 5,860,740 | ||||||||
| Research & Consulting Services–0.12% | ||||||||
Dun & Bradstreet Corp. (The) | 1,634 | 162,550 | ||||||
Equifax Inc. | 4,855 | 286,882 | ||||||
| Shares | Value | |||||||
| Research & Consulting Services–(continued) | ||||||||
Nielsen Holdings N. V. | 8,438 | $ | 291,111 | |||||
| 740,543 | ||||||||
| Residential REIT’s–0.24% | ||||||||
Apartment Investment & Management Co.–Class A | 5,860 | 161,326 | ||||||
AvalonBay Communities, Inc. | 4,906 | 607,853 | ||||||
Equity Residential | 12,928 | 670,834 | ||||||
| 1,440,013 | ||||||||
| Restaurants–1.34% | ||||||||
Chipotle Mexican Grill, Inc.(b) | 1,241 | 506,539 | ||||||
Darden Restaurants, Inc. | 5,264 | 243,250 | ||||||
McDonald’s Corp. | 40,453 | 3,817,145 | ||||||
Starbucks Corp. | 30,210 | 2,130,409 | ||||||
Yum! Brands, Inc. | 18,151 | 1,270,933 | ||||||
| 7,968,276 | ||||||||
| Retail REIT’s–0.42% | ||||||||
Kimco Realty Corp. | 16,493 | 330,355 | ||||||
Macerich Co. (The) | 5,585 | 314,324 | ||||||
Simon Property Group, Inc. | 12,542 | 1,826,491 | ||||||
| 2,471,170 | ||||||||
| Security & Alarm Services–0.16% | ||||||||
ADT Corp. (The) | 8,821 | 351,340 | ||||||
Tyco International Ltd. | 18,722 | 618,575 | ||||||
| 969,915 | ||||||||
| Semiconductor Equipment–0.26% | ||||||||
Applied Materials, Inc. | 48,485 | 727,760 | ||||||
KLA-Tencor Corp. | 6,657 | 367,134 | ||||||
Lam Research Corp.(b) | 6,602 | 308,115 | ||||||
Teradyne, Inc.(b) | 7,740 | 118,809 | ||||||
| 1,521,818 | ||||||||
| Semiconductors–1.70% | ||||||||
Advanced Micro Devices, Inc.(b) | 24,505 | 80,131 | ||||||
Altera Corp. | 12,905 | 453,869 | ||||||
Analog Devices, Inc. | 12,434 | 575,446 | ||||||
Broadcom Corp.–Class A | 21,196 | 535,411 | ||||||
First Solar, Inc.(b) | 2,709 | 99,474 | ||||||
Intel Corp. | 200,585 | 4,408,858 | ||||||
Linear Technology Corp. | 9,411 | 360,724 | ||||||
LSI Corp. | 22,175 | 164,317 | ||||||
Microchip Technology Inc. | 7,954 | 308,695 | ||||||
Micron Technology, Inc.(b) | 41,565 | 564,037 | ||||||
NVIDIA Corp. | 23,319 | 343,955 | ||||||
Texas Instruments Inc. | 44,755 | 1,709,641 | ||||||
Xilinx, Inc. | 10,646 | 462,249 | ||||||
| 10,066,807 | ||||||||
| Soft Drinks–2.02% | ||||||||
Coca-Cola Co. (The) | 154,553 | 5,900,834 | ||||||
Coca-Cola Enterprises, Inc. | 10,393 | 388,698 | ||||||
See accompanying Notes to Financial Statements which are an integral part of the financial statements.
15 Invesco S&P 500 Index Fund
| Shares | Value | |||||||
| Soft Drinks–(continued) | ||||||||
Dr Pepper Snapple Group, Inc. | 8,281 | $ | 370,658 | |||||
Monster Beverage Corp.(b) | 5,860 | 336,305 | ||||||
PepsiCo, Inc. | 62,399 | 4,975,072 | ||||||
| 11,971,567 | ||||||||
| Specialized Consumer Services–0.05% | ||||||||
H&R Block, Inc. | 10,988 | 306,675 | ||||||
| Specialized Finance–0.52% | ||||||||
CME Group Inc.–Class A | 12,382 | 880,484 | ||||||
IntercontinentalExchange Inc.(b) | 2,926 | 525,949 | ||||||
McGraw Hill Financial, Inc. | 11,060 | 645,572 | ||||||
Moody’s Corp. | 7,780 | 494,497 | ||||||
NASDAQ OMX Group, Inc. (The) | 4,715 | 140,790 | ||||||
NYSE Euronext | 9,783 | 408,929 | ||||||
| 3,096,221 | ||||||||
| Specialized REIT’s–0.95% | ||||||||
American Tower Corp. | 15,957 | 1,108,852 | ||||||
HCP, Inc. | 18,338 | 746,907 | ||||||
Health Care REIT, Inc. | 11,477 | 705,147 | ||||||
Host Hotels & Resorts Inc. | 30,049 | 511,734 | ||||||
Plum Creek Timber Co., Inc. | 6,615 | 293,111 | ||||||
Public Storage | 5,816 | 887,929 | ||||||
Ventas, Inc. | 11,829 | 736,473 | ||||||
Weyerhaeuser Co. | 23,268 | 637,078 | ||||||
| 5,627,231 | ||||||||
| Specialty Chemicals–0.38% | ||||||||
Ecolab Inc. | 10,749 | 981,921 | ||||||
International Flavors & Fragrances Inc. | 3,247 | 256,545 | ||||||
Sherwin-Williams Co. (The) | 3,440 | 593,056 | ||||||
Sigma-Aldrich Corp. | 4,848 | 399,815 | ||||||
| 2,231,337 | ||||||||
| Specialty Stores–0.18% | ||||||||
PetSmart, Inc. | 4,212 | 296,651 | ||||||
Staples, Inc. | 26,788 | 372,621 | ||||||
Tiffany & Co. | 4,875 | 375,911 | ||||||
| 1,045,183 | ||||||||
| Steel–0.16% | ||||||||
Allegheny Technologies, Inc. | 4,403 | 117,604 | ||||||
Cliffs Natural Resources Inc. | 6,161 | 128,580 | ||||||
Nucor Corp. | 12,820 | 583,182 | ||||||
United States Steel Corp. | 5,808 | 103,963 | ||||||
| 933,329 | ||||||||
| Shares | Value | |||||||
| Systems Software–2.80% | ||||||||
BMC Software, Inc.(b) | 5,343 | $ | 245,778 | |||||
CA, Inc. | 13,364 | 390,897 | ||||||
Microsoft Corp. | 303,278 | 10,129,485 | ||||||
Oracle Corp. | 148,262 | 4,723,627 | ||||||
Red Hat, Inc.(b) | 7,631 | 385,518 | ||||||
Symantec Corp. | 28,109 | 719,872 | ||||||
| 16,595,177 | ||||||||
| Thrifts & Mortgage Finance–0.06% | ||||||||
Hudson City Bancorp, Inc. | 19,181 | 176,273 | ||||||
People’s United Financial Inc. | 12,822 | 182,329 | ||||||
| 358,602 | ||||||||
| Tires & Rubber–0.03% | ||||||||
Goodyear Tire & Rubber Co. (The)(b) | 9,880 | 198,786 | ||||||
| Tobacco–1.60% | ||||||||
Altria Group, Inc. | 81,051 | 2,746,008 | ||||||
Lorillard, Inc. | 15,241 | 644,694 | ||||||
Philip Morris International Inc. | 65,994 | 5,506,540 | ||||||
Reynolds American Inc. | 12,845 | 611,807 | ||||||
| 9,509,049 | ||||||||
| Trading Companies & Distributors–0.18% | ||||||||
Fastenal Co. | 10,878 | 478,523 | ||||||
W.W. Grainger, Inc. | 2,430 | 601,061 | ||||||
| 1,079,584 | ||||||||
| Trucking–0.02% | ||||||||
Ryder System, Inc. | 2,089 | 116,169 | ||||||
| Wireless Telecommunication Services–0.14% | ||||||||
Crown Castle International Corp.(b) | 11,823 | 820,753 | ||||||
Total Common Stocks & Other Equity Interests |
| 586,125,128 | ||||||
Money Market Funds–1.00% |
| |||||||
Liquid Assets Portfolio– | 2,974,767 | 2,974,767 | ||||||
Premier Portfolio–Institutional Class(e) | 2,974,766 | 2,974,766 | ||||||
Total Money Market Funds |
| 5,949,533 | ||||||
TOTAL INVESTMENTS–99.91% |
| 592,074,661 | ||||||
OTHER ASSETS LESS LIABILITIES–0.09% |
| 511,270 | ||||||
NET ASSETS–100.00% |
| $ | 592,585,931 | |||||
Investment Abbreviations:
| REIT | – Real Estate Investment Trust |
Notes to Schedule of Investments:
| (a) | Industry and/or sector classifications used in this report are generally according to the Global Industry Classification Standard, which was developed by and is the exclusive property and a service mark of MSCI Inc. and Standard & Poor’s. |
| (b) | Non-income producing security. |
| (c) | The Fund’s Adviser is a subsidiary of Invesco Ltd. and therefore, Invesco Ltd. is considered to be affiliated with the Fund. See Note 4. |
| (d) | All or a portion of the value was pledged as collateral to cover margin requirements for open futures contracts. See Note 1I and Note 5. |
| (e) | The money market fund and the Fund are affiliated by having the same investment adviser. |
See accompanying Notes to Financial Statements which are an integral part of the financial statements.
16 Invesco S&P 500 Index Fund
Statement of Assets and Liabilities
August 31, 2013
Assets: | ||||
Investments, at value (Cost $331,393,066) | $ | 585,580,439 | ||
Investments in affiliates, at value (Cost $6,366,609) | 6,494,222 | |||
Total investments, at value (Cost $337,759,675) | 592,074,661 | |||
Receivable for: | ||||
Fund shares sold | 670,703 | |||
Dividends | 1,346,534 | |||
Investment for trustee deferred compensation and retirement plans | 15,883 | |||
Other assets | 26,360 | |||
Total assets | 594,134,141 | |||
Liabilities: |
| |||
Payable for: | ||||
Fund shares reacquired | 734,986 | |||
Variation margin | 23,760 | |||
Accrued fees to affiliates | 538,919 | |||
Accrued trustees’ and officers’ fees and benefits | 4,239 | |||
Accrued other operating expenses | 195,559 | |||
Trustee deferred compensation and retirement plans | 50,747 | |||
Total liabilities | 1,548,210 | |||
Net assets applicable to shares outstanding | $ | 592,585,931 | ||
Net assets consist of: |
| |||
Shares of beneficial interest | $ | 416,447,103 | ||
Undistributed net investment income | 5,590,262 | |||
Undistributed net realized gain (loss) | (83,684,563 | ) | ||
Unrealized appreciation | 254,233,129 | |||
| $ | 592,585,931 | |||
Net Assets: | ||||
Class A | $ | 467,233,651 | ||
Class B | $ | 11,045,050 | ||
Class C | $ | 91,761,107 | ||
Class Y | $ | 22,546,123 | ||
Shares outstanding, $0.01 par value per share, |
| |||
Class A | 26,435,213 | |||
Class B | 637,839 | |||
Class C | 5,359,296 | |||
Class Y | 1,261,722 | |||
Class A: | ||||
Net asset value per share | $ | 17.67 | ||
Maximum offering price per share | ||||
(Net asset value of $17.67 ¸ 94.50%) | $ | 18.70 | ||
Class B: | ||||
Net asset value and offering price per share | $ | 17.32 | ||
Class C: | ||||
Net asset value and offering price per share | $ | 17.12 | ||
Class Y: | ||||
Net asset value and offering price per share | $ | 17.87 | ||
See accompanying Notes to Financial Statements which are an integral part of the financial statements.
17 Invesco S&P 500 Index Fund
Statement of Operations
For the year ended August 31, 2013
Investment income: |
| |||
Dividends (net of foreign withholding taxes of $7,359) | $ | 12,622,220 | ||
Dividends from affiliates | 18,508 | |||
Total investment income | 12,640,728 | |||
Expenses: | ||||
Advisory fees | 672,470 | |||
Administrative services fees | 143,890 | |||
Custodian fees | 31,555 | |||
Distribution fees: | ||||
Class A | 1,094,363 | |||
Class B | 152,384 | |||
Class C | 847,338 | |||
Transfer agent fees | 824,922 | |||
Trustees’ and officers’ fees and benefits | 40,582 | |||
Other | 352,223 | |||
Total expenses | 4,159,727 | |||
Less: Fees waived and expense offset arrangement(s) | (7,185 | ) | ||
Net expenses | 4,152,542 | |||
Net investment income | 8,488,186 | |||
Realized and unrealized gain from: | ||||
Net realized gain from: | ||||
Investment securities | 1,594,690 | |||
Futures contracts | 1,430,315 | |||
| 3,025,005 | ||||
Change in net unrealized appreciation (depreciation) of: | ||||
Investment securities | 79,781,728 | |||
Futures contracts | (216,585 | ) | ||
| 79,565,143 | ||||
Net realized and unrealized gain | 82,590,148 | |||
Net increase in net assets resulting from operations | $ | 91,078,334 | ||
See accompanying Notes to Financial Statements which are an integral part of the financial statements.
18 Invesco S&P 500 Index Fund
Statement of Changes in Net Assets
For the years ended August 31, 2013 and 2012
| 2013 | 2012 | |||||||
Operations: |
| |||||||
Net investment income | $ | 8,488,186 | $ | 7,062,081 | ||||
Net realized gain | 3,025,005 | (39,568 | ) | |||||
Change in net unrealized appreciation | 79,565,143 | 71,983,694 | ||||||
Net increase in net assets resulting from operations | 91,078,334 | 79,006,207 | ||||||
Distributions to shareholders from net investment income: | ||||||||
Class A | (7,761,631 | ) | (6,590,989 | ) | ||||
Class B | (194,940 | ) | (193,068 | ) | ||||
Class C | (920,398 | ) | (511,460 | ) | ||||
Class Y | (330,633 | ) | (356,716 | ) | ||||
Total distributions from net investment income | (9,207,602 | ) | (7,652,233 | ) | ||||
Share transactions–net: | ||||||||
Class A | (8,062,305 | ) | (13,332,452 | ) | ||||
Class B | (11,116,271 | ) | (22,284,272 | ) | ||||
Class C | 611,425 | (331,841 | ) | |||||
Class Y | 5,284,880 | (4,421,941 | ) | |||||
Net increase (decrease) in net assets resulting from share transactions | (13,282,271 | ) | (40,370,506 | ) | ||||
Net increase in net assets | 68,588,461 | 30,983,468 | ||||||
Net assets: | ||||||||
Beginning of year | 523,997,470 | 493,014,002 | ||||||
End of year (includes undistributed net investment income of $5,590,262 and $6,283,512, respectively) | $ | 592,585,931 | $ | 523,997,470 | ||||
Notes to Financial Statements
August 31, 2013
NOTE 1—Significant Accounting Policies
Invesco S&P 500 Index Fund (the “Fund”) is a series portfolio of AIM Counselor Series Trust (Invesco Counselor Series Trust) (the “Trust”). The Trust is a Delaware statutory trust registered under the Investment Company Act of 1940, as amended (the “1940 Act”), as an open-end series management investment company consisting of twelve separate portfolios, each authorized to issue an unlimited number of shares of beneficial interest. The assets, liabilities and operations of each portfolio are accounted for separately. Information presented in these financial statements pertains only to the Fund. Matters affecting each portfolio or class will be voted on exclusively by the shareholders of such portfolio or class.
The Fund’s investment objective is to provide investment results that, before expenses, correspond to the total return (i.e., the combination of capital changes and income) of the Standard & Poor’s® 500 Composite Stock Price Index (S&P 500 Index).
The Fund currently consists of four different classes of shares: Class A, Class B, Class C and Class Y. Class A shares are sold with a front-end sales charge unless certain waiver criteria are met and under certain circumstances load waived shares may be subject to contingent deferred sales charges (“CDSC”). Class C shares are sold with a CDSC. Class Y shares are sold at net asset value. Effective November 30, 2010, new or additional investments in Class B shares are no longer permitted. Existing shareholders of Class B shares may continue to reinvest dividends and capital gains distributions in Class B shares until they convert to Class A shares. Also, shareholders in Class B shares will be able to exchange those shares for Class B shares of other Invesco Funds offering such shares until they convert to Class A shares. Generally, Class B shares will automatically convert to Class A shares on or about the month-end, which is at least eight years after the date of purchase. Redemption of Class B shares prior to conversion date will be subject to a CDSC.
The following is a summary of the significant accounting policies followed by the Fund in the preparation of its financial statements.
| A. | Security Valuations — Securities, including restricted securities, are valued according to the following policy. |
A security listed or traded on an exchange (except convertible bonds) is valued at its last sales price or official closing price as of the close of the customary trading session on the exchange where the security is principally traded, or lacking any sales or official closing price on a particular day, the security may be valued at the closing bid price on that day. Securities traded in the over-the-counter market are valued based on prices furnished by independent pricing services or market makers. When such securities are valued by an independent pricing service they may be considered fair valued. Futures contracts are valued at the final settlement price set by an exchange on which they are principally traded. Listed options are valued at the mean between the last bid and ask prices from the exchange on which they are principally traded. Options not listed on an exchange are valued by an independent source at the mean between the last bid and ask prices. For purposes of determining net asset value per share, futures and option contracts generally are valued 15 minutes after the close of the customary trading session of the New York Stock Exchange (“NYSE”).
19 Invesco S&P 500 Index Fund
Investments in open-end and closed-end registered investment companies that do not trade on an exchange are valued at the end of day net asset value per share. Investments in open-end and closed-end registered investment companies that trade on an exchange are valued at the last sales price or official closing price as of the close of the customary trading session on the exchange where the security is principally traded.
Debt obligations (including convertible bonds) and unlisted equities are fair valued using an evaluated quote provided by an independent pricing service. Evaluated quotes provided by the pricing service may be determined without exclusive reliance on quoted prices, and may reflect appropriate factors such as institution-size trading in similar groups of securities, developments related to specific securities, dividend rate (for unlisted equities), yield (for debt obligations), quality, type of issue, coupon rate (for debt obligations), maturity (for debt obligations), individual trading characteristics and other market data. Debt obligations are subject to interest rate and credit risks. In addition, all debt obligations involve some risk of default with respect to interest and/or principal payments.
Foreign securities’ (including foreign exchange contracts) prices are converted into U.S. dollar amounts using the applicable exchange rates as of the close of the NYSE. If market quotations are available and reliable for foreign exchange-traded equity securities, the securities will be valued at the market quotations. Because trading hours for certain foreign securities end before the close of the NYSE, closing market quotations may become unreliable. If between the time trading ends on a particular security and the close of the customary trading session on the NYSE, events occur that the Adviser determines are significant and make the closing price unreliable, the Fund may fair value the security. If the event is likely to have affected the closing price of the security, the security will be valued at fair value in good faith using procedures approved by the Board of Trustees. Adjustments to closing prices to reflect fair value may also be based on a screening process of an independent pricing service to indicate the degree of certainty, based on historical data, that the closing price in the principal market where a foreign security trades is not the current value as of the close of the NYSE. Foreign securities’ prices meeting the approved degree of certainty that the price is not reflective of current value will be priced at the indication of fair value from the independent pricing service. Multiple factors may be considered by the independent pricing service in determining adjustments to reflect fair value and may include information relating to sector indices, American Depositary Receipts and domestic and foreign index futures. Foreign securities may have additional risks including exchange rate changes, potential for sharply devalued currencies and high inflation, political and economic upheaval, the relative lack of issuer information, relatively low market liquidity and the potential lack of strict financial and accounting controls and standards.
Securities for which market prices are not provided by any of the above methods may be valued based upon quotes furnished by independent sources. The last bid price may be used to value equity securities. The mean between the last bid and asked prices is used to value debt obligations, including corporate loans.
Securities for which market quotations are not readily available or became unreliable are valued at fair value as determined in good faith by or under the supervision of the Trust’s officers following procedures approved by the Board of Trustees. Issuer specific events, market trends, bid/ask quotes of brokers and information providers and other market data may be reviewed in the course of making a good faith determination of a security’s fair value.
Valuations change in response to many factors including the historical and prospective earnings of the issuer, the value of the issuer’s assets, general economic conditions, interest rates, investor perceptions and market liquidity. Because of the inherent uncertainties of valuation, the values reflected in the financial statements may materially differ from the value received upon actual sale of those investments.
| B. | Securities Transactions and Investment Income — Securities transactions are accounted for on a trade date basis. Realized gains or losses on sales are computed on the basis of specific identification of the securities sold. Interest income is recorded on the accrual basis from settlement date. Dividend income (net of withholding tax, if any) is recorded on the ex-dividend date. |
The Fund may periodically participate in litigation related to Fund investments. As such, the Fund may receive proceeds from litigation settlements. Any proceeds received are included in the Statement of Operations as realized gain (loss) for investments no longer held and as unrealized gain (loss) for investments still held.
Brokerage commissions and mark ups are considered transaction costs and are recorded as an increase to the cost basis of securities purchased and/or a reduction of proceeds on a sale of securities. Such transaction costs are included in the determination of net realized and unrealized gain (loss) from investment securities reported in the Statement of Operations and the Statement of Changes in Net Assets and the net realized and unrealized gains (losses) on securities per share in the Financial Highlights. Transaction costs are included in the calculation of the Fund’s net asset value and, accordingly, they reduce the Fund’s total returns. These transaction costs are not considered operating expenses and are not reflected in net investment income reported in the Statement of Operations and Statement of Changes in Net Assets, or the net investment income per share and ratios of expenses and net investment income reported in the Financial Highlights, nor are they limited by any expense limitation arrangements between the Fund and the investment adviser.
The Fund allocates income and realized and unrealized capital gains and losses to a class based on the relative net assets of each class.
| C. | Country Determination — For the purposes of making investment selection decisions and presentation in the Schedule of Investments, the investment adviser may determine the country in which an issuer is located and/or credit risk exposure based on various factors. These factors include the laws of the country under which the issuer is organized, where the issuer maintains a principal office, the country in which the issuer derives 50% or more of its total revenues and the country that has the primary market for the issuer’s securities, as well as other criteria. Among the other criteria that may be evaluated for making this determination are the country in which the issuer maintains 50% or more of its assets, the type of security, financial guarantees and enhancements, the nature of the collateral and the sponsor organization. Country of issuer and/or credit risk exposure has been determined to be the United States of America, unless otherwise noted. |
| D. | Distributions — Distributions from income and net realized capital gain, if any, are generally declared and paid annually and recorded on the ex-dividend date. The Fund may elect to treat a portion of the proceeds from redemptions as distributions for federal income tax purposes. |
| E. | Federal Income Taxes — The Fund intends to comply with the requirements of Subchapter M of the Internal Revenue Code of 1986, as amended (the “Internal Revenue Code”), necessary to qualify as a regulated investment company and to distribute substantially all of the Fund’s taxable earnings to shareholders. As such, the Fund will not be subject to federal income taxes on otherwise taxable income (including net realized capital gain) that is distributed to shareholders. Therefore, no provision for federal income taxes is recorded in the financial statements. |
The Fund files tax returns in the U.S. Federal jurisdiction and certain other jurisdictions. Generally, the Fund is subject to examinations by such taxing authorities for up to three years after the filing of the return for the tax period.
20 Invesco S&P 500 Index Fund
| F. | Expenses — Fees provided for under the Rule 12b-1 plan of a particular class of the Fund and which are directly attributable to that class are charged to the operations of such class. All other expenses are allocated among the classes based on relative net assets. |
| G. | Accounting Estimates — The preparation of financial statements in conformity with accounting principles generally accepted in the United States of America (“GAAP”) requires management to make estimates and assumptions that affect the reported amounts of assets and liabilities at the date of the financial statements and the reported amounts of revenues and expenses during the reporting period including estimates and assumptions related to taxation. Actual results could differ from those estimates by a significant amount. In addition, the Fund monitors for material events or transactions that may occur or become known after the period-end date and before the date the financial statements are released to print. |
| H. | Indemnifications — Under the Trust’s organizational documents, each Trustee, officer, employee or other agent of the Trust is indemnified against certain liabilities that may arise out of the performance of their duties to the Fund. Additionally, in the normal course of business, the Fund enters into contracts, including the Fund’s servicing agreements, that contain a variety of indemnification clauses. The Fund’s maximum exposure under these arrangements is unknown as this would involve future claims that may be made against the Fund that have not yet occurred. The risk of material loss as a result of such indemnification claims is considered remote. |
| I. | Futures Contracts — The Fund may enter into futures contracts to manage exposure to interest rate, equity and market price movements and/or currency risks. A futures contract is an agreement between two parties to purchase or sell a specified underlying security, currency or commodity (or delivery of a cash settlement price, in the case of an index future) for a fixed price at a future date. The Fund currently invests only in exchange-traded futures and they are standardized as to maturity date and underlying financial instrument. Initial margin deposits required upon entering into futures contracts are satisfied by the segregation of specific securities or cash as collateral at the futures commission merchant (broker). During the period the futures contracts are open, changes in the value of the contracts are recognized as unrealized gains or losses by recalculating the value of the contracts on a daily basis. Subsequent or variation margin payments are received or made depending upon whether unrealized gains or losses are incurred. These amounts are reflected as receivables or payables on the Statement of Assets and Liabilities. When the contracts are closed or expire, the Fund recognizes a realized gain or loss equal to the difference between the proceeds from, or cost of, the closing transaction and the Fund’s basis in the contract. The net realized gain (loss) and the change in unrealized gain (loss) on futures contracts held during the period is included on the Statement of Operations. The primary risks associated with futures contracts are market risk and the absence of a liquid secondary market. If the Fund were unable to liquidate a futures contract and/or enter into an offsetting closing transaction, the Fund would continue to be subject to market risk with respect to the value of the contracts and continue to be required to maintain the margin deposits on the futures contracts. Futures contracts have minimal counterparty risk since the exchange’s clearinghouse, as counterparty to all exchange-traded futures, guarantees the futures against default. Risks may exceed amounts recognized in the Statement of Assets and Liabilities. |
| J. | Collateral — To the extent the Fund has designated or segregated a security as collateral and that security is subsequently sold, it is the Fund’s practice to replace such collateral no later than the next business day. |
NOTE 2—Advisory Fees and Other Fees Paid to Affiliates
The Trust has entered into a master investment advisory agreement with Invesco Advisers, Inc. (the “Adviser” or “Invesco”). Under the terms of the investment advisory agreement, the Fund pays an advisory fee to the Adviser based on the annual rate of the Fund’s average daily net assets as follows:
| Average Daily Net Assets | Rate | |||
First $2 billion | 0.12% | |||
Over $2 billion | 0.10% | |||
Under the terms of a master sub-advisory agreement between the Adviser and each of Invesco Asset Management Deutschland GmbH, Invesco Asset Management Limited, Invesco Asset Management (Japan) Limited, Invesco Australia Limited, Invesco Hong Kong Limited, Invesco Senior Secured Management, Inc. and Invesco Canada Ltd. (collectively, the “Affiliated Sub-Advisers”) the Adviser, not the Fund, may pay 40% of the fees paid to the Adviser to any such Affiliated Sub-Adviser(s) that provide(s) discretionary investment management services to the Fund based on the percentage of assets allocated to such Sub-Adviser(s).
The Adviser has contractually agreed, through at least June 30, 2014, to waive advisory fees and/or reimburse expenses to the extent necessary to limit total annual fund operating expenses and/or reimbursement (excluding certain items discussed below) of Class A, Class B, Class C and Class Y shares to 2.00%, 2.75%, 2.75% and 1.75% of average daily net assets, respectively. In determining the Adviser’s obligation to waive advisory fees and/or reimburse expenses, the following expenses are not taken into account, and could cause the net annual fund operating expenses and/or reimbursement to exceed the numbers reflected above: (1) interest; (2) taxes; (3) dividend expense on short sales; (4) extraordinary or non-routine items, including litigation expenses; and (5) expenses that the Fund has incurred but did not actually pay because of an expense offset arrangement. Unless the Board of the Trustees and Invesco mutually agree to amend or continue the fee waiver agreement, it will terminate on June 30, 2014. The Adviser did not waive fees and/or reimburse expenses during the period under this expense limitation.
Further, the Adviser has contractually agreed, through at least June 30, 2014, to waive the advisory fee payable by the Fund in an amount equal to 100% of the net advisory fees the Adviser receives from the affiliated money market funds on investments by the Fund of uninvested cash in such affiliated money market funds.
For the year ended August 31, 2013, the Adviser waived advisory fees of $6,724.
The Trust has entered into a master administrative services agreement with Invesco pursuant to which the Fund has agreed to pay Invesco for certain administrative costs incurred in providing accounting services to the Fund. For the year ended August 31, 2013, expenses incurred under the agreement are shown in the Statement of Operations as Administrative services fees.
The Trust has entered into a transfer agency and service agreement with Invesco Investment Services, Inc. (“IIS”) pursuant to which the Fund has agreed to pay IIS a fee for providing transfer agency and shareholder services to the Fund and reimburse IIS for certain expenses incurred by IIS in the course of providing such services. IIS may make payments to intermediaries that provide omnibus account services, sub-accounting services and/or
21 Invesco S&P 500 Index Fund
networking services. All fees payable by IIS to intermediaries that provide omnibus account services or sub-accounting are charged back to the Fund, subject to certain limitations approved by the Trust’s Board of Trustees. For the year ended August 31, 2013, the expenses incurred under the agreement are shown in the Statement of Operations as Transfer agent fees.
Shares of the Fund are distributed by Invesco Distributors, Inc. (“IDI”), an affiliate of the Adviser. The Fund has adopted a Plan of Distribution (the “Plan”) pursuant to Rule 12b-1 under the 1940 Act. The Plan provides that the Fund will reimburse IDI for distribution related expenses that IDI incurs up to a maximum of the following annual rates: (1) Class A — up to 0.25% of the average daily net assets of Class A shares; (2) Class B — up to 1.00% of the average daily net assets of Class B shares; and (3) Class C — up to 1.00% of the average daily net assets of Class C shares.
In the case of Class B shares, provided that the Plan continues in effect, any cumulative expenses incurred by IDI, but not yet reimbursed to IDI, may be recovered through the payment of future distribution fees from the Fund pursuant to the Plan and contingent deferred sales charges paid by investors upon redemption of Class B shares.
For the year ended August 31, 2013, expenses incurred under these agreements are shown in the Statement of Operations as Distribution fees.
Front-end sales commissions and CDSC (collectively, the “sales charges”) are not recorded as expenses of the Fund. Front-end sales commissions are deducted from proceeds from the sales of Fund shares prior to investment in Class A shares of the Fund. CDSC are deducted from redemption proceeds prior to remittance to the shareholder. During the year ended August 31, 2013, IDI advised the Fund that IDI retained $40,188 in front-end sales commissions from the sale of Class A shares and $19, $6,018 and $4,651 from Class A, Class B and Class C shares, respectively, for CDSC imposed on redemptions by shareholders.
Certain officers and trustees of the Trust are officers and directors of the Adviser, IIS and/or IDI.
NOTE 3—Additional Valuation Information
GAAP defines fair value as the price that would be received to sell an asset or paid to transfer a liability in an orderly transaction between market participants at the measurement date, under current market conditions. GAAP establishes a hierarchy that prioritizes the inputs to valuation methods, giving the highest priority to readily available unadjusted quoted prices in an active market for identical assets (Level 1) and the lowest priority to significant unobservable inputs (Level 3), generally when market prices are not readily available or are unreliable. Based on the valuation inputs, the securities or other investments are tiered into one of three levels. Changes in valuation methods may result in transfers in or out of an investment’s assigned level:
| Level 1 — | Prices are determined using quoted prices in an active market for identical assets. |
| Level 2 — | Prices are determined using other significant observable inputs. Observable inputs are inputs that other market participants may use in pricing a security. These may include quoted prices for similar securities, interest rates, prepayment speeds, credit risk, yield curves, loss severities, default rates, discount rates, volatilities and others. |
| Level 3 — | Prices are determined using significant unobservable inputs. In situations where quoted prices or observable inputs are unavailable (for example, when there is little or no market activity for an investment at the end of the period), unobservable inputs may be used. Unobservable inputs reflect the Fund’s own assumptions about the factors market participants would use in determining fair value of the securities or instruments and would be based on the best available information. |
The following is a summary of the tiered valuation input levels, as of August 31, 2013. The level assigned to the securities valuations may not be an indication of the risk or liquidity associated with investing in those securities. Because of the inherent uncertainties of valuation, the values reflected in the financial statements may materially differ from the value received upon actual sale of those investments.
| Level 1 | Level 2 | Level 3 | Total | |||||||||||||
Equity Securities | $ | 592,074,661 | $ | — | $ | — | $ | 592,074,661 | ||||||||
Futures* | (81,857 | ) | — | (81,857 | ) | |||||||||||
Total Investments | $ | 591,992,804 | $ | — | $ | — | $ | 591,992,804 | ||||||||
| * | Unrealized appreciation (depreciation). |
NOTE 4—Investments in Affiliates
The Fund’s Adviser is a subsidiary of Invesco Ltd. and therefore, Invesco Ltd. is considered to be affiliated with the Fund. The following is a summary of the transactions in and earnings from investments in Invesco Ltd. for the year ended August 31, 2013.
Value 08/31/12 | Purchases at Cost | Proceeds from Sales | Change in Unrealized Appreciation (Depreciation) | Realized Gain (Loss) | Value 08/31/13 | Dividend Income | ||||||||||||||||||||||
Invesco Ltd. | $ | 432,184 | $ | 18,842 | $ | (25,561 | ) | $ | 119,443 | $ | (219 | ) | $ | 544,689 | $ | 14,320 | ||||||||||||
NOTE 5—Derivative Investments
Value of Derivative Investments at Period-End
The table below summarizes the value of the Fund’s derivative investments, detailed by primary risk exposure, held as of August 31, 2013:
| Value | ||||||||
| Risk Exposure/Derivative Type | Assets | Liabilities | ||||||
Equity risk | ||||||||
Futures contracts(a) | $ | — | $ | (81,857 | ) | |||
| (a) | Includes cumulative appreciation (depreciation) of futures contracts. Only current day’s variation margin receivable (payable) is reported within the Statement of Assets and Liabilities. |
22 Invesco S&P 500 Index Fund
Effect of Derivative Investments for the year ended August 31, 2013
The table below summarizes the gains (losses) on derivative investments, detailed by primary risk exposure, recognized in earnings during the period:
| Location of Gain (Loss) on Statement of Operations | ||||
| Futures* | ||||
Realized Gain | ||||
Equity risk | $ | 1,430,315 | ||
Change in Unrealized Appreciation (Depreciation) | ||||
Equity risk | $ | (216,585 | ) | |
Total | $ | 1,213,730 | ||
| * | The average notional value of futures contracts outstanding was $5,995,280. |
| Open Futures Contracts | ||||||||||||||||
| Long Contracts | Number of Contracts | Expiration Month | Notional Value | Unrealized Appreciation (Depreciation) | ||||||||||||
E-Mini S&P 500 | 88 | September-2013 | $ | 7,177,720 | $ | (81,857 | ) | |||||||||
NOTE 6—Expense Offset Arrangement(s)
The expense offset arrangement is comprised of transfer agency credits which result from balances in Demand Deposit Accounts (DDA) used by the transfer agent for clearing shareholder transactions. For the year ended August 31, 2013, the Fund received credits from this arrangement, which resulted in the reduction of the Fund’s total expenses of $461.
NOTE 7—Trustees’ and Officers’ Fees and Benefits
“Trustees’ and Officers’ Fees and Benefits” include amounts accrued by the Fund to pay remuneration to certain Trustees and Officers of the Fund. Trustees have the option to defer compensation payable by the Fund, and “Trustees’ and Officers’ Fees and Benefits” also include amounts accrued by the Fund to fund such deferred compensation amounts. Those Trustees who defer compensation have the option to select various Invesco Funds in which their deferral accounts shall be deemed to be invested. Finally, certain current Trustees are eligible to participate in a retirement plan that provides for benefits to be paid upon retirement to Trustees over a period of time based on the number of years of service. The Fund may have certain former Trustees who also participate in a retirement plan and receive benefits under such plan. “Trustees’ and Officers’ Fees and Benefits” include amounts accrued by the Fund to fund such retirement benefits. Obligations under the deferred compensation and retirement plans represent unsecured claims against the general assets of the Fund.
NOTE 8—Cash Balances
The Fund is permitted to temporarily carry a negative or overdrawn balance in its account with State Street Bank and Trust Company, the custodian bank. Such balances, if any at period end, are shown in the Statement of Assets and Liabilities under the payable caption Amount due custodian. To compensate the custodian bank for such overdrafts, the overdrawn Fund may either (1) leave funds as a compensating balance in the account so the custodian bank can be compensated by earning the additional interest; or (2) compensate by paying the custodian bank at a rate agreed upon by the custodian bank and Invesco, not to exceed the contractually agreed upon rate.
NOTE 9—Distributions to Shareholders and Tax Components of Net Assets
Tax Character of Distributions to Shareholders Paid During the Years Ended August 31, 2013 and 2012:
| 2013 | 2012 | |||||||
Ordinary income | $ | 9,207,602 | $ | 7,652,233 | ||||
Tax Components of Net Assets at Period-End:
| 2013 | ||||
Undistributed ordinary income | $ | 5,611,751 | ||
Net unrealized appreciation — investments | 226,634,414 | |||
Temporary book/tax differences | (48,580 | ) | ||
Capital loss carryforward | (56,058,757 | ) | ||
Shares of beneficial interest | 416,447,103 | |||
Total net assets | $ | 592,585,931 | ||
The difference between book-basis and tax-basis unrealized appreciation (depreciation) is due to differences in the timing of recognition of gains and losses on investments for tax and book purposes. The Fund’s net unrealized appreciation difference is attributable primarily to wash sales.
The temporary book/tax differences are a result of timing differences between book and tax recognition of income and/or expenses. The Fund’s temporary book/tax differences are the result of the trustee deferral of compensation and retirement plan benefits.
23 Invesco S&P 500 Index Fund
Capital loss carryforward is calculated and reported as of a specific date. Results of transactions and other activity after that date may affect the amount of capital loss carryforward actually available for the Fund to utilize. The Regulated Investment Company Modernization Act of 2010 eliminated the eight-year carryover period for capital losses that arise in taxable years beginning after its enactment date of December 22, 2010. Consequently, these capital losses can be carried forward for an unlimited period. However, capital losses with an expiration period may not be used to offset capital gains until all net capital losses without an expiration date have been utilized. Additionally, post-enactment capital loss carryovers will retain their character as either short-term or long-term capital losses instead of as short-term capital losses as under prior law. The ability to utilize capital loss carryforward in the future may be limited under the Internal Revenue Code and related regulations based on the results of future transactions.
The Fund utilized $4,003,442 of capital loss carryforward in the current period to offset net realized capital gain for federal income tax purposes. The Fund has a capital loss carryforward as of August 31, 2013, which expires as follows:
| Capital Loss Carryforward* | ||||||||||||
| Expiration | Short-Term | Long-Term | Total | |||||||||
August 31, 2017 | $ | 12,322,416 | $ | — | $ | 12,322,416 | ||||||
August 31, 2018 | 19,847,353 | — | 19,847,353 | |||||||||
August 31, 2019 | 10,267,726 | — | 10,267,726 | |||||||||
Not subject to expiration | — | 13,621,262 | 13,621,262 | |||||||||
| $ | 42,437,495 | $ | 13,621,262 | $ | 56,058,757 | |||||||
| * | Capital loss carryforward as of the date listed above is reduced for limitations, if any, to the extent required by the Internal Revenue Code. |
NOTE 10—Investment Securities
The aggregate amount of investment securities (other than short-term securities, U.S. Treasury obligations and money market funds, if any) purchased and sold by the Fund during the year ended August 31, 2013 was $30,071,307 and $42,930,463, respectively. Cost of investments on a tax basis includes the adjustments for financial reporting purposes as of the most recently completed federal income tax reporting period-end.
| Unrealized Appreciation (Depreciation) of Investment Securities on a Tax Basis | ||||
Aggregate unrealized appreciation of investment securities | $ | 240,608,903 | ||
Aggregate unrealized (depreciation) of investment securities | (13,974,489 | ) | ||
Net unrealized appreciation of investment securities | $ | 226,634,414 | ||
Cost of investments for tax purposes is $365,440,247.
NOTE 11—Reclassification of Permanent Differences
Primarily as a result of differing book/tax treatment of fair funds settlements and REIT distributions, on August 31, 2013, undistributed net investment income was increased by $26,166, undistributed net realized gain (loss) was decreased by $24,704 and shares of beneficial interest was decreased by $1,462. This reclassification had no effect on the net assets of the Fund.
24 Invesco S&P 500 Index Fund
NOTE 12—Share Information
| Summary of Share Activity | ||||||||||||||||
| For the years ended August 31, | ||||||||||||||||
| 2013(a) | 2012 | |||||||||||||||
| Shares | Amount | Shares | Amount | |||||||||||||
Sold: | ||||||||||||||||
Class A | 3,609,161 | $ | 59,967,499 | 2,763,738 | $ | 39,469,371 | ||||||||||
Class B | 48,627 | 807,977 | 72,106 | 1,005,514 | ||||||||||||
Class C | 879,159 | 14,382,285 | 750,901 | 10,524,251 | ||||||||||||
Class Y | 745,535 | 12,266,779 | 636,341 | 9,308,878 | ||||||||||||
Issued as reinvestment of dividends: | ||||||||||||||||
Class A | 466,707 | 7,079,950 | 445,622 | 5,998,079 | ||||||||||||
Class B | 11,362 | 169,870 | 12,814 | 169,909 | ||||||||||||
Class C | 56,433 | 834,081 | 34,865 | 457,088 | ||||||||||||
Class Y | 20,998 | 321,482 | 26,089 | 354,294 | ||||||||||||
Automatic conversion of Class B shares to Class A shares: | ||||||||||||||||
Class A | 604,257 | 9,883,567 | 1,243,061 | 17,748,051 | ||||||||||||
Class B | (615,612 | ) | (9,883,567 | ) | (1,267,736 | ) | (17,748,051 | ) | ||||||||
Reacquired: | ||||||||||||||||
Class A | (5,154,351 | ) | (84,993,321 | ) | (5,446,685 | ) | (76,547,953 | ) | ||||||||
Class B | (137,855 | ) | (2,210,551 | ) | (415,442 | ) | (5,711,644 | ) | ||||||||
Class C | (904,350 | ) | (14,604,941 | ) | (831,615 | ) | (11,313,180 | ) | ||||||||
Class Y | (445,668 | ) | (7,303,381 | ) | (977,353 | ) | (14,085,113 | ) | ||||||||
Net increase (decrease) in share activity | (815,597 | ) | $ | (13,282,271 | ) | (2,953,294 | ) | $ | (40,370,506 | ) | ||||||
| (a) | There are entities that are record owners of more than 5% of the outstanding shares of the Fund and in the aggregate own 65% of the outstanding shares of the Fund. IDI has an agreement with these entities to sell Fund shares. The Fund, Invesco and/or Invesco affiliates may make payments to these entities, which are considered to be related to the Fund, for providing services to the Fund, Invesco and/or Invesco affiliates including but not limited to services such as securities brokerage, distribution, third party record keeping and account servicing. The Trust has no knowledge as to whether all or any portion of the shares owned of record by these entities are also owned beneficially. |
25 Invesco S&P 500 Index Fund
NOTE 13—Financial Highlights
The following schedule presents financial highlights for a share of the Fund outstanding throughout the periods indicated.
| Net asset value, beginning of period | Net investment income(a) | Net gains (losses) on securities (both realized and unrealized) | Total from investment operations | Dividends from net investment income | Net asset value, end of period | Total return(b) | Net assets, end of period (000’s omitted)(c) | Ratio of expenses to average net assets with fee waivers and/or expenses absorbed(d) | Ratio of expenses to average net assets without fee waivers and/or expenses absorbed(d) | Ratio of net investment income to average net assets(d) | Portfolio turnover(e) | |||||||||||||||||||||||||||||||||||||
Class A | ||||||||||||||||||||||||||||||||||||||||||||||||
Year ended 08/31/13 | $ | 15.26 | $ | 0.27 | $ | 2.43 | $ | 2.70 | $ | (0.29 | ) | $ | 17.67 | 18.04 | % | $ | 467,234 | 0.62 | %(f) | 0.62 | %(f) | 1.64 | %(f) | 6 | % | |||||||||||||||||||||||
Year ended 08/31/12 | 13.25 | 0.22 | 2.03 | 2.25 | (0.24 | ) | 15.26 | 17.26 | 410,772 | 0.65 | 0.67 | 1.55 | 3 | |||||||||||||||||||||||||||||||||||
Year ended 08/31/11 | 11.36 | 0.19 | 1.85 | 2.04 | (0.15 | ) | 13.25 | 17.94 | 369,597 | 0.61 | 0.61 | 1.42 | 4 | |||||||||||||||||||||||||||||||||||
Year ended 08/31/10 | 11.09 | 0.18 | 0.33 | 0.51 | (0.24 | ) | 11.36 | 4.44 | 335,583 | 0.60 | 0.69 | 1.47 | 7 | |||||||||||||||||||||||||||||||||||
Year ended 08/31/09 | 13.94 | 0.21 | (2.83 | ) | (2.62 | ) | (0.23 | ) | 11.09 | (18.43 | ) | 349 | 0.59 | 0.74 | 2.11 | (g) | 7 | |||||||||||||||||||||||||||||||
Class B | ||||||||||||||||||||||||||||||||||||||||||||||||
Year ended 08/31/13 | 14.96 | 0.14 | 2.40 | 2.54 | (0.18 | ) | 17.32 | 17.14 | 11,045 | 1.37 | (f) | 1.37 | (f) | 0.89 | (f) | 6 | ||||||||||||||||||||||||||||||||
Year ended 08/31/12 | 12.92 | 0.11 | 2.01 | 2.12 | (0.08 | ) | 14.96 | 16.47 | 19,912 | 1.40 | 1.42 | 0.80 | 3 | |||||||||||||||||||||||||||||||||||
Year ended 08/31/11 | 11.10 | 0.09 | 1.80 | 1.89 | (0.07 | ) | 12.92 | 17.02 | 37,840 | 1.36 | 1.36 | 0.67 | 4 | |||||||||||||||||||||||||||||||||||
Year ended 08/31/10 | 10.83 | 0.08 | 0.33 | 0.41 | (0.14 | ) | 11.10 | 3.68 | 64,102 | 1.35 | 1.44 | 0.72 | 7 | |||||||||||||||||||||||||||||||||||
Year ended 08/31/09 | 13.54 | 0.13 | (2.73 | ) | (2.60 | ) | (0.11 | ) | 10.83 | (19.06 | ) | 110 | 1.34 | 1.49 | 1.36 | (h) | 7 | |||||||||||||||||||||||||||||||
Class C | ||||||||||||||||||||||||||||||||||||||||||||||||
Year ended 08/31/13 | 14.79 | 0.14 | 2.37 | 2.51 | (0.18 | ) | 17.12 | 17.14 | (i) | 91,761 | 1.36 | (f)(i) | 1.36 | (f)(i) | 0.90 | (f)(i) | 6 | |||||||||||||||||||||||||||||||
Year ended 08/31/12 | 12.79 | 0.11 | 1.99 | 2.10 | (0.10 | ) | 14.79 | 16.50 | 78,797 | 1.40 | 1.42 | 0.80 | 3 | |||||||||||||||||||||||||||||||||||
Year ended 08/31/11 | 10.99 | 0.10 | 1.77 | 1.87 | (0.07 | ) | 12.79 | 17.01 | (i) | 68,753 | 1.27 | (i) | 1.27 | (i) | 0.76 | (i) | 4 | |||||||||||||||||||||||||||||||
Year ended 08/31/10 | 10.74 | 0.08 | 0.33 | 0.41 | (0.16 | ) | 10.99 | 3.71 | 66,933 | 1.35 | 1.44 | 0.72 | 7 | |||||||||||||||||||||||||||||||||||
Year ended 08/31/09 | 13.46 | 0.13 | (2.72 | ) | (2.59 | ) | (0.13 | ) | 10.74 | (19.01 | ) | 74 | 1.34 | 1.49 | 1.36 | (j) | 7 | |||||||||||||||||||||||||||||||
Class Y | ||||||||||||||||||||||||||||||||||||||||||||||||
Year ended 08/31/13 | 15.43 | 0.32 | 2.45 | 2.77 | (0.33 | ) | 17.87 | 18.33 | 22,546 | 0.37 | (f) | 0.37 | (f) | 1.89 | (f) | 6 | ||||||||||||||||||||||||||||||||
Year ended 08/31/12 | 13.40 | 0.26 | 2.06 | 2.32 | (0.29 | ) | 15.43 | 17.64 | 14,518 | 0.40 | 0.42 | 1.80 | 3 | |||||||||||||||||||||||||||||||||||
Year ended 08/31/11 | 11.48 | 0.23 | 1.86 | 2.09 | (0.17 | ) | 13.40 | 18.21 | 16,824 | 0.36 | 0.36 | 1.67 | 4 | |||||||||||||||||||||||||||||||||||
Year ended 08/31/10 | 11.20 | 0.21 | 0.33 | 0.54 | (0.26 | ) | 11.48 | 4.72 | 23,168 | 0.35 | 0.44 | 1.72 | 7 | |||||||||||||||||||||||||||||||||||
Year ended 08/31/09 | 14.09 | 0.25 | (2.87 | ) | (2.62 | ) | (0.27 | ) | 11.20 | (18.22 | ) | 23 | 0.34 | 0.49 | 2.36 | (k) | 7 | |||||||||||||||||||||||||||||||
| (a) | Calculated using average shares outstanding. |
| (b) | Includes adjustments in accordance with accounting principles generally accepted in the United States of America and as such, the net asset value for financial reporting purposes and the returns based upon those net asset values may differ from the net asset value and returns for shareholder transactions. Not annualized for periods less than one year, if applicable. |
| (c) | Net assets, end of period, for the year ended August 31, 2009 are stated in millions. |
| (d) | The ratios reflect the rebate of certain Fund expenses in connection with investments in a Morgan Stanley affiliate during the period. The effect of the rebate on the ratios was 0.00% for the year ended 2009. The rebate was less than 0.005% for the year ended 2009. |
| (e) | Portfolio turnover is calculated at the fund level and is not annualized for periods less than one year, if applicable. |
| (f) | Ratios are based on average daily net assets (000’s) of $441,785, 15,238, 85,050 and 18,318 for Class A, Class B, Class C and Class Y shares, respectively. |
| (g) | Ratio of net investment income (loss) to average net assets without fee waivers and/or expense reimbursements was 1.96% for the year ended August 31, 2009. |
| (h) | Ratio of net investment income (loss) to average net assets without fee waivers and/or expense reimbursements was 1.21% for the year ended August 31, 2009. |
| (i) | The total return, ratio of expenses to average net assets and ratio of net investment income to average net assets reflect actual 12b-1 fees of 0.99% and 0.91% for the years ended August 31, 2013 and August 31, 2012, respectively. |
| (j) | Ratio of net investment income (loss) to average net assets without fee waivers and/or expense reimbursements was 1.21% for the year ended August 31, 2009. |
| (k) | Ratio of net investment income (loss) to average net assets without fee waivers and/or expense reimbursements was 2.21% for the year ended August 31, 2009. |
26 Invesco S&P 500 Index Fund
Report of Independent Registered Public Accounting Firm
To the Board of Trustees of AIM Counselor Series Trust (Invesco Counselor Series Trust)
and Shareholders of Invesco S&P 500 Index Fund:
In our opinion, the accompanying statement of assets and liabilities, including the schedule of investments, and the related statements of operations and of changes in net assets and the financial highlights present fairly, in all material respects, the financial position of Invesco S&P 500 Index Fund (one of the funds constituting AIM Counselor Series Trust (Invesco Counselor Series Trust), hereafter referred to as the “Fund”) at August 31, 2013, the results of its operations for the year then ended, the changes in its net assets for each of the two years in the period then ended and the financial highlights for each of the four years in the period then ended, in conformity with accounting principles generally accepted in the United States of America. These financial statements and financial highlights (hereafter referred to as “financial statements”) are the responsibility of the Fund’s management; our responsibility is to express an opinion on these financial statements based on our audits. We conducted our audits of these financial statements in accordance with the standards of the Public Company Accounting Oversight Board (United States). Those standards require that we plan and perform the audit to obtain reasonable assurance about whether the financial statements are free of material misstatement. An audit includes examining, on a test basis, evidence supporting the amounts and disclosures in the financial statements, assessing the accounting principles used and significant estimates made by management, and evaluating the overall financial statement presentation. We believe that our audits, which included confirmation of securities at August 31, 2013 by correspondence with the custodian and brokers, provide a reasonable basis for our opinion. The financial highlights of the Fund for the period ended August 31, 2009 were audited by another independent registered public accounting firm whose report dated October 27, 2009 expressed an unqualified opinion on such financial statement.
PRICEWATERHOUSECOOPERS LLP
October 25, 2013
Houston, Texas
27 Invesco S&P 500 Index Fund
Calculating your ongoing Fund expenses
Example
As a shareholder of the Fund, you incur two types of costs: (1) transaction costs, which may include sales charges (loads) on purchase payments or contingent deferred sales charges on redemptions, if any; and (2) ongoing costs, including management fees, distribution and/or service (12b-1) fees, and other Fund expenses. This example is intended to help you understand your ongoing costs (in dollars) of investing in the Fund and to compare these costs with ongoing costs of investing in other mutual funds. The example is based on an investment of $1,000 invested at the beginning of the period and held for the entire period March 1, 2013 through August 31, 2013.
Actual expenses
The table below provides information about actual account values and actual expenses. You may use the information in this table, together with the amount you invested, to estimate the expenses that you paid over the period. Simply divide your account value by $1,000 (for example, an $8,600 account value divided by $1,000 = 8.6), then multiply the result by the number in the table under the heading entitled “Actual Expenses Paid During Period” to estimate the expenses you paid on your account during this period.
Hypothetical example for comparison purposes
The table below also provides information about hypothetical account values and hypothetical expenses based on the Fund’s actual expense ratio and an assumed rate of return of 5% per year before expenses, which is not the Fund’s actual return.
The hypothetical account values and expenses may not be used to estimate the actual ending account balance or expenses you paid for the period. You may use this information to compare the ongoing costs of investing in the Fund and other funds. To do so, compare this 5% hypothetical example with the 5% hypothetical examples that appear in the shareholder reports of the other funds.
Please note that the expenses shown in the table are meant to highlight your ongoing costs only and do not reflect any transaction costs, such as sales charges (loads) on purchase payments or contingent deferred sales charges on redemptions, if any. Therefore, the hypothetical information is useful in comparing ongoing costs only, and will not help you determine the relative total costs of owning different funds. In addition, if these transaction costs were included, your costs would have been higher.
| Class | Beginning Account Value (03/01/13) | ACTUAL | HYPOTHETICAL (5% annual return before | Annualized Expense Ratio | ||||||||||||||||||||
| Ending Account Value (08/31/13)1 | Expenses Paid During Period2 | Ending Account Value (08/31/13) | Expenses Paid During Period2 | |||||||||||||||||||||
A | $ | 1,000.00 | $ | 1,086.10 | $ | 3.15 | $ | 1,022.18 | $ | 3.06 | 0.60 | % | ||||||||||||
B | 1,000.00 | 1,082.50 | 7.09 | 1,018.40 | 6.87 | 1.35 | ||||||||||||||||||
C | 1,000.00 | 1,082.20 | 7.09 | 1,018.40 | 6.87 | 1.35 | ||||||||||||||||||
Y | 1,000.00 | 1,087.60 | 1.84 | 1,023.44 | 1.79 | 0.35 | ||||||||||||||||||
| 1 | The actual ending account value is based on the actual total return of the Fund for the period March 1, 2013 through August 31, 2013, after actual expenses and will differ from the hypothetical ending account value which is based on the Fund’s expense ratio and a hypothetical annual return of 5% before expenses. |
| 2 | Expenses are equal to the Fund’s annualized expense ratio as indicated above multiplied by the average account value over the period, multiplied by 184/365 to reflect the most recent fiscal half year. |
28 Invesco S&P 500 Index Fund
Approval of Investment Advisory and Sub-Advisory Contracts
The Board of Trustees (the Board) of AIM Counselor Series Trust (Invesco Counselor Series Trust) is required under the Investment Company Act of 1940, as amended, to approve annually the renewal of Invesco S&P 500 Index Fund’s (the Fund) investment advisory agreement with Invesco Advisers, Inc. (Invesco Advisers) and the Master Intergroup Sub-Advisory Contract for Mutual Funds (the sub-advisory contracts) with Invesco Asset Management Deutschland GmbH, Invesco Asset Management Limited, Invesco Asset Management (Japan) Limited, Invesco Australia Limited, Invesco Hong Kong Limited, Invesco Senior Secured Management, Inc. and Invesco Canada Ltd. (collectively, the Affiliated Sub-Advisers). During contract renewal meetings held on June 17-19, 2013, the Board as a whole, and the disinterested or “independent” Trustees, who comprise over 75% of the Board, voting separately, approved the continuance of the Fund’s investment advisory agreement and the sub-advisory contracts for another year, effective July 1, 2013. The Board determined that the continuation of the Fund’s investment advisory agreement and the sub-advisory contracts are in the best interests of the Fund and its shareholders and the compensation payable to Invesco Advisers and the Affiliated Sub-Advisers under the agreements is fair and reasonable.
The Board’s Fund Evaluation Process
The Board’s Investments Committee has established three Sub-Committees, each of which is primarily responsible for overseeing the management of a number of the funds advised by Invesco Advisers (the Invesco Funds). The Sub-Committees meet throughout the year to review the performance of their assigned Invesco Funds, including reviewing materials prepared under the direction of the independent Senior Officer, an officer of the Invesco Funds who reports directly to the independent Trustees. Over the course of each year, the Sub-Committees meet with portfolio managers for their assigned Invesco Funds and other members of management to review the performance, investment objective(s), policies, strategies, limitations and investment risks of these funds. The Sub-Committees meet regularly and at designated contract renewal meetings each year to conduct a review of the performance, fees, expenses and other matters related to their assigned Invesco Funds. Each Sub-Committee recommends to the Investments Committee, which in turn recommends to the full Board, whether and on what terms to approve the continuance of each Invesco Fund’s investment advisory agreement and sub-advisory contracts for another year.
During the contract renewal process, the Trustees receive comparative performance and fee data regarding the Invesco Funds prepared by Invesco Advisers and Lipper Inc. (Lipper), an independent provider of investment company
data. The Trustees also receive an independent written evaluation from the Senior Officer. The Senior Officer’s evaluation is prepared as part of his responsibility to manage the process by which the Invesco Funds’ proposed management fees are negotiated during the annual contract renewal process to ensure they are negotiated in a manner that is at arms’ length and reasonable. The independent Trustees are assisted in their annual evaluation of the Fund’s investment advisory agreement by the Senior Officer and by independent legal counsel. In addition to meetings with Invesco Advisers and fund counsel, the independent Trustees also discuss the continuance of the investment advisory agreement and sub-advisory contracts in separate sessions with the Senior Officer and with independent legal counsel.
In evaluating the fairness and reasonableness of compensation under the Fund’s investment advisory agreement and sub-advisory contracts, the Board considered, among other things, the factors discussed below. The Trustees recognized that the advisory fee rates for the Invesco Funds are, in many cases, the result of years of review and negotiation between the Trustees and Invesco Advisers as well as advisory fees previously approved by different predecessor boards. The Trustees’ deliberations and conclusions in a particular year may be based in part on their deliberations and conclusions regarding these same arrangements throughout the year and in prior years. The Trustees’ review and conclusions are based on the comprehensive consideration of all information presented to them and are not the result of any single determinative factor. Moreover, one Trustee may have weighed a particular piece of information or factor differently than another Trustee.
The discussion below serves as the Senior Officer’s independent written evaluation with respect to the Fund’s investment advisory agreement as well as a discussion of the material factors and related conclusions that formed the basis for the Board’s approval of the Fund’s investment advisory agreement and sub-advisory contracts. Unless otherwise stated, this information is current as of June 19, 2013, and may not reflect consideration of factors that became known to the Board after that date, including, for example, changes to the Fund’s performance, advisory fees, expense limitations and/or fee waivers.
Factors and Conclusions and Summary of Independent Written Fee Evaluation
| A. | Nature, Extent and Quality of Services Provided by Invesco Advisers and the Affiliated Sub-Advisers |
The Board reviewed the advisory services provided to the Fund by Invesco Advisers under the Fund’s investment advisory agreement, the performance of Invesco Advisers in providing these services, and the credentials and
experience of the officers and employees of Invesco Advisers who provide these services, including the Fund’s portfolio manager or managers, with whom the Sub-Committees met during the year. The Board’s review of the qualifications of Invesco Advisers to provide advisory services included the Board’s consideration of Invesco Advisers’ investment process oversight, independent credit analysis and investment risk management.
In determining whether to continue the Fund’s investment advisory agreement, the Board considered the benefits of reapproving an existing relationship and the greater uncertainty that may be associated with entering into a new relationship. The Board also considered non-advisory services that Invesco Advisers and its affiliates provide to the Invesco Funds such as various back office support functions, equity and fixed income trading operations, internal audit, distribution and legal and compliance. The Board concluded that the nature, extent and quality of the services provided to the Fund by Invesco Advisers are appropriate and satisfactory and consistent with the terms of the Fund’s investment advisory agreement.
The Board reviewed the services that may be provided by the Affiliated Sub-Advisers under the sub-advisory contracts and the credentials and experience of the officers and employees of the Affiliated Sub-Advisers who provide these services. The Board noted that the Affiliated Sub-Advisers have offices and personnel that are located in financial centers around the world. As a result, the Affiliated Sub-Advisers can provide research and investment analysis on the markets and economies of various countries in which the Fund may invest, make recommendations regarding securities and assist with security trades. The Board concluded that the sub-advisory contracts benefit the Fund and its shareholders by permitting Invesco Advisers to use the resources and talents of the Affiliated Sub-Advisers in managing the Fund. The Board concluded that the nature, extent and quality of the services that may be provided by the Affiliated Sub-Advisers are appropriate and satisfactory and consistent with the terms of the Fund’s sub-advisory contracts.
| B. | Fund Performance |
The Board considered Fund performance as a relevant factor in considering whether to approve the investment advisory agreement. The Board did not view Fund performance as a relevant factor in considering whether to approve the sub-advisory contracts for the Fund, as no Affiliated Sub-Adviser currently manages assets of the Fund.
The Board compared the Fund’s performance during the past one, three and five calendar years to the performance of funds in the Lipper performance universe and against the Lipper S&P 500 Funds Index. The Board noted that performance of Class A shares of the Fund was
29 Invesco S&P 500 Index Fund
in the fourth quintile of the performance universe for the one year period and the third quintile for the three and five year periods (the first quintile being the best performing funds and the fifth quintile being the worst performing funds). The Board noted that performance of Class A shares of the Fund was below the performance of the Index for the one, three and five year periods. The Trustees also reviewed more recent Fund performance and this review did not change their conclusions.
| C. | Advisory and Sub-Advisory Fees |
The Board compared the Fund’s contractual management fee rate to the contractual management fee rates of funds in the Fund’s Lipper expense group at a common asset level. The Board noted that the contractual management fee rate for Class A shares of the Fund was below the median contractual management fee rate of funds in the expense group. The Board noted that the term “contractual management fee” may include both advisory and certain administrative services fees and that Invesco does not charge the Invesco Funds for the administrative services included in the term as defined by Lipper. The Board also reviewed the methodology used by Lipper in providing expense group information, which includes using each fund’s contractual management fee schedule (including any applicable breakpoints) as reported in the most recent prospectus or statement of additional information for each fund in the expense group.
The Board also compared the Fund’s effective advisory fee rate (the advisory fee rate after advisory fee waivers and before other expense limitations/waivers) to the effective advisory fee rates of other mutual funds advised by Invesco Advisers and its affiliates with investment strategies comparable to those of the Fund. The Board noted that the Fund’s effective advisory fee rate was the same as the effective advisory fee rate of the other mutual Fund managed by Invesco Advisers in a manner comparable to the Fund.
Other than the mutual fund described above, the Board noted that Invesco Advisers and its affiliates do not advise other funds or client accounts with investment strategies comparable to those of the Fund.
The Board also considered the services that may be provided by the Affiliated Sub-Advisers pursuant to the sub-advisory contracts, as well as the fees payable by Invesco Advisers to the Affiliated Sub-Advisers pursuant to the sub-advisory contracts. The Board also noted that the sub-advisory fees are not paid directly by the Fund, but rather, are payable by Invesco Advisers to the Affiliated Sub-Advisers.
Based upon the information and considerations described above, the Board concluded that the compensation payable to Invesco Advisers and the Affiliated Sub-Advisers is fair and reasonable.
| D. | Economies of Scale and Breakpoints |
The Board considered the extent to which there are economies of scale in the provision of
advisory services to the Fund. The Board also considered whether the Fund benefits from economies of scale through contractual breakpoints in the Fund’s advisory fee schedule and was assisted in this review by a report from the Senior Officer. The Board also noted that the Fund shares directly in economies of scale through lower fees charged by third party service providers based on the combined size of the Invesco Funds and other clients advised by Invesco Advisers.
| E. | Profitability and Financial Resources |
The Board reviewed information from Invesco Advisers concerning the costs of the advisory and other services that Invesco Advisers and its affiliates provide to the Fund and the profitability of Invesco Advisers and its affiliates in providing these services for the year ended December 31, 2012. The Board received information from Invesco Advisers about the methodology used to prepare the profitability information. The Board considered the profitability of Invesco Advisers in managing the Fund and the Invesco Funds. The Board noted that Invesco Advisers continues to operate at a net profit from services Invesco Advisers and its subsidiaries provide to the Invesco Funds. The Board noted that Invesco Advisers and its subsidiaries did not make a profit from managing the Fund as a result of expenses. The Board received and accepted information from Invesco Advisers demonstrating that Invesco Advisers and each Affiliated Sub-Adviser are financially sound and have the resources necessary to perform their obligations under the investment advisory agreement and sub-advisory contracts.
| F. | Collateral Benefits to Invesco Advisers and its Affiliates |
The Board considered various other benefits received by Invesco Advisers and its affiliates from the relationship with the Fund, including the fees received for their provision of transfer agency and distribution services to the Fund. The Board considered comparative information regarding fees charged for these services, including information provided by Lipper and other independent sources. The Board considered the performance of Invesco Advisers and its affiliates in providing these services and the organizational structure employed to provide these services. The Board also considered that these services are provided to the Fund pursuant to written contracts that are reviewed and approved on an annual basis by the Board; that the services are required for the operation of the Fund; that Invesco Advisers and its affiliates can provide services, the nature and quality of which are at least equal to those provided by others offering the same or similar services; and that the fees for such services are fair and reasonable in light of the usual and customary charges by others for services of the same nature and quality.
The Board considered the benefits realized by Invesco Advisers and the Affiliated Sub-Advisers as a result of portfolio brokerage transactions executed through “soft dollar” arrangements.
The Board noted that soft dollar arrangements shift the payment obligation for research services from Invesco Advisers and the Affiliated Sub-Advisers to the Invesco Funds and that the research received may be used with other clients of Invesco Advisers and may reduce Invesco Advisers’ and the Affiliated Sub-Advisers’ expenses. The Board also considered periodic reports from the Chief Compliance Officer of the Invesco Funds demonstrating that these arrangements are consistent with regulatory requirements. The Board did not deem the soft dollar arrangements to be inappropriate.
The Board considered that the Fund’s uninvested cash and cash collateral from any securities lending arrangements may be invested in money market funds advised by Invesco Advisers pursuant to procedures approved by the Board. The Board noted that Invesco Advisers receives advisory fees from these affiliated money market funds attributable to such investments, although Invesco Advisers has contractually agreed to waive through varying periods the advisory fees payable by the Invesco Funds. The waiver is in an amount equal to 100% of the net advisory fee Invesco Advisers receives from the affiliated money market funds with respect to the Fund’s investment in the affiliated money market funds of uninvested cash, but not cash collateral. The Board concluded that the Fund’s investment of uninvested cash and cash collateral from any securities lending arrangements in the affiliated money market funds is in the best interests of the Fund and its shareholders.
The Board also considered use of an affiliated broker to execute certain trades for the Fund to among other things, control information leakage, and were advised that such trades are executed in compliance with rules under the Investment Company Act of 1940, as amended.
30 Invesco S&P 500 Index Fund
Tax Information
Form 1099-DIV, Form 1042-S and other year–end tax information provide shareholders with actual calendar year amounts that should be included in their tax returns. Shareholders should consult their tax advisors.
The following distribution information is being provided as required by the Internal Revenue Code or to meet a specific state’s requirement.
The Fund designates the following amounts or, if subsequently determined to be different, the maximum amount allowable for its fiscal year ended August 31, 2013:
Federal and State Income Tax | ||||
Qualified Dividend Income* | 100 | % | ||
Corporate Dividends Received Deduction* | 100 | % | ||
| * | The above percentages are based on ordinary income dividends paid to shareholders during the Fund’s fiscal year. |
31 Invesco S&P 500 Index Fund
Trustees and Officers
The address of each trustee and officer is AIM Counselor Series Trust (Invesco Counselor Series Trust) (the “Trust”), 11 Greenway Plaza, Suite 1000, Houston, Texas 77046-1173. The trustees serve for the life of the Trust, subject to their earlier death, incapacitation, resignation, retirement or removal as more specifically provided in the Trust’s organizational documents. Each officer serves for a one year term or until their successors are elected and qualified. Column two below includes length of time served with predecessor entities, if any.
Name, Year of Birth and Position(s) Held with the Trust | Trustee and/ or Officer Since | Principal Occupation(s) During Past 5 Years | Number of Funds in Fund Complex Overseen by Trustee | Other Directorship(s) Held by Trustee During Past 5 Years | ||||
| Interested Persons | ||||||||
| Martin L. Flanagan1 — 1960 Trustee | 2007 | Executive Director, Chief Executive Officer and President, Invesco Ltd. (ultimate parent of Invesco and a global investment management firm); Advisor to the Board, Invesco Advisers, Inc. (formerly known as Invesco Institutional (N.A.), Inc.); Trustee, The Invesco Funds; Vice Chair, Investment Company Institute; and Member of Executive Board, SMU Cox School of Business
Formerly: Chairman and Chief Executive Officer, Invesco Advisers, Inc. (registered investment adviser); Director, Chairman, Chief Executive Officer and President, IVZ Inc. (holding company), INVESCO Group Services, Inc. (service provider) and Invesco North American Holdings, Inc. (holding company); Director, Chief Executive Officer and President, Invesco Holding Company Limited (parent of Invesco and a global investment management firm); Director, Invesco Ltd.; Chairman, Investment Company Institute and President, Co-Chief Executive Officer, Co-President, Chief Operating Officer and Chief Financial Officer, Franklin Resources, Inc. (global investment management organization) | 117 | None | ||||
| Philip A. Taylor2 — 1954 Trustee, President and Principal Executive Officer | 2006 | Head of North American Retail and Senior Managing Director, Invesco Ltd.; Director, Co-Chairman, Co-President and Co-Chief Executive Officer, Invesco Advisers, Inc. (formerly known as Invesco Institutional (N.A.), Inc.) (registered investment adviser); Director, Chairman, Chief Executive Officer and President, Invesco Management Group, Inc. (formerly known as Invesco Aim Management Group, Inc.) (financial services holding company); Director and President, INVESCO Funds Group, Inc. (registered investment adviser and registered transfer agent); Director and Chairman, Invesco Investment Services, Inc. (formerly known as Invesco Aim Investment Services, Inc.) (registered transfer agent) and IVZ Distributors, Inc. (formerly known as INVESCO Distributors, Inc.) (registered broker dealer); Director, President and Chairman, Invesco Inc. (holding company) and Invesco Canada Holdings Inc. (holding company); Chief Executive Officer, Invesco Corporate Class Inc. (corporate mutual fund company) and Invesco Canada Fund Inc. (corporate mutual fund company); Director, Chairman and Chief Executive Officer, Invesco Canada Ltd. (formerly known as Invesco Trimark Ltd./Invesco Trimark Ltèe) (registered investment adviser and registered transfer agent); Trustee, President and Principal Executive Officer, The Invesco Funds (other than AIM Treasurer’s Series Trust (Invesco Treasurer’s Series Trust) and Short-Term Investments Trust); Trustee and Executive Vice President, The Invesco Funds (AIM Treasurer’s Series Trust (Invesco Treasurer’s Series Trust) and Short-Term Investments Trust only); Director, Invesco Investment Advisers LLC (formerly known as Van Kampen Asset Management); Director, Chief Executive Officer and President, Van Kampen Exchange Corp.
Formerly: Director and Chairman, Van Kampen Investor Services Inc.: Director, Chief Executive Officer and President, 1371 Preferred Inc. (holding company); and Van Kampen Investments Inc.; Director and President, AIM GP Canada Inc. (general partner for limited partnerships); and Van Kampen Advisors, Inc.; Director and Chief Executive Officer, Invesco Trimark Dealer Inc. (registered broker dealer); Director, Invesco Distributors, Inc. (formerly known as Invesco Aim Distributors, Inc.) (registered broker dealer); Manager, Invesco PowerShares Capital Management LLC; Director, Chief Executive Officer and President, Invesco Advisers, Inc.; Director, Chairman, Chief Executive Officer and President, Invesco Aim Capital Management, Inc.; President, Invesco Trimark Dealer Inc. and Invesco Trimark Ltd./Invesco Trimark Ltèe; Director and President, AIM Trimark Corporate Class Inc. and AIM Trimark Canada Fund Inc.; Senior Managing Director, Invesco Holding Company Limited; Trustee and Executive Vice President, Tax-Free Investments Trust; Director and Chairman, Fund Management Company (former registered broker dealer); President and Principal Executive Officer, The Invesco Funds (AIM Treasurer’s Series Trust (Invesco Treasurer’s Series Trust), Short-Term Investments Trust and Tax-Free Investments Trust only); President, AIM Trimark Global Fund Inc. and AIM Trimark Canada Fund Inc. | 117 | None | ||||
Wayne W. Whalen3 — 1939 Trustee | 2010 | Of Counsel, and prior to 2010, partner in the law firm of Skadden, Arps, Slate, Meagher & Flom LLP, legal counsel to certain funds in the Fund Complex
| 130 | Director of the Mutual Fund Directors Forum, a nonprofit membership organization for investment directors; Chairman and Director of the Abraham Lincoln Presidential Library Foundation; and Director of the Stevenson Center for Democracy |
| 1 | Mr. Flanagan is considered an interested person of the Trust because he is an officer of the adviser to the Trust, and an officer and a director of Invesco Ltd., ultimate parent of the adviser to the Trust. |
| 2 | Mr. Taylor is considered an interested person of the Trust because he is an officer and a director of the adviser to, and a director of the principal underwriter of, the Trust. |
| 3 | Mr. Whalen is considered an “interested person” (within the meaning of Section 2(a)(19) of the 1940 Act) of certain Funds in the Invesco Fund Complex because he and his firm currently provide legal services as legal counsel to such Funds. |
T-1 Invesco S&P 500 Index Fund
Trustees and Officers—(continued)
Name, Year of Birth and Position(s) Held with the Trust | Trustee and/ or Officer Since | Principal Occupation(s) During Past 5 Years | Number of Funds in Fund Complex Overseen by Trustee | Other Directorship(s) Held by Trustee During Past 5 Years | ||||
| Independent Trustees | ||||||||
Bruce L. Crockett — 1944 Trustee and Chair | 2003 | Chairman, Crockett Technologies Associates (technology consulting company)
Formerly: Director, Captaris (unified messaging provider); Director, President and Chief Executive Officer COMSAT Corporation; and Chairman, Board of Governors of INTELSAT (international communications company) | 117 | ACE Limited (insurance company); Investment Company Institute | ||||
David C. Arch — 1945 Trustee | 2010 | Chairman and Chief Executive Officer of Blistex Inc., (consumer health care products manufacturer)
Formerly: Member of the Heartland Alliance Advisory Board, a nonprofit organization serving human needs based in Chicago | 130 | Board member of the Illinois Manufacturers’ Association; Member of the Board of Visitors, Institute for the Humanities, University of Michigan | ||||
Frank S. Bayley — 1939 Trustee | 2003 | Retired
Formerly: Director, Badgley Funds, Inc. (registered investment company) (2 portfolios) and General Partner and Of Counsel, law firm of Baker & McKenzie, LLP | 117 | Director and Chairman, C.D. Stimson Company (a real estate investment company); Trustee and Overseer, The Curtis Institute of Music | ||||
James T. Bunch — 1942 Trustee | 2000 | Managing Member, Grumman Hill Group LLC (family office private equity management)
Formerly: Founder, Green, Manning & Bunch Ltd. (investment banking firm)(1988-2010); Executive Committee, United States Golf Association; and Director, Policy Studies, Inc. and Van Gilder Insurance Corporation | 117 | Chairman, Board of Governors, Western Golf Association; Chairman-elect, Evans Scholars Foundation; and Director, Denver Film Society | ||||
Rodney F. Dammeyer — 1940 Trustee | 2010 | Chairman of CAC, LLC, (private company offering capital investment and management advisory services)
Formerly: Prior to 2001, Managing Partner at Equity Group Corporate Investments; Prior to 1995, Chief Executive Officer of Itel Corporation (formerly Anixter International); Prior to 1985, experience includes Senior Vice President and Chief Financial Officer of Household International, Inc., Executive Vice President and Chief Financial Officer of Northwest Industries, Inc. and Partner of Arthur Andersen & Co.; From 1987 to 2010, Director/Trustee of investment companies in the Van Kampen Funds complex | 117 | Director of Quidel Corporation and Stericycle, Inc.; Prior to May 2008, Trustee of The Scripps Research Institute; Prior to February 2008, Director of Ventana Medical Systems, Inc. | ||||
Albert R. Dowden — 1941 Trustee | 2003 | Director of a number of public and private business corporations, including the Boss Group, Ltd. (private investment and management); Reich & Tang Funds (5 portfolios) (registered investment company); and Homeowners of America Holding Corporation/ Homeowners of America Insurance Company (property casualty company)
Formerly: Director, Continental Energy Services, LLC (oil and gas pipeline service); Director, CompuDyne Corporation (provider of product and services to the public security market) and Director, Annuity and Life Re (Holdings), Ltd. (reinsurance company); Director, President and Chief Executive Officer, Volvo Group North America, Inc.; Senior Vice President, AB Volvo; Director of various public and private corporations; Chairman, DHJ Media, Inc.; Director Magellan Insurance Company; and Director, The Hertz Corporation, Genmar Corporation (boat manufacturer), National Media Corporation; Advisory Board of Rotary Power International (designer, manufacturer, and seller of rotary power engines); and Chairman, Cortland Trust, Inc. (registered investment company) | 117 | Director of Nature’s Sunshine Products, Inc. | ||||
Jack M. Fields — 1952 Trustee | 2003 | Chief Executive Officer, Twenty First Century Group, Inc. (government affairs company); Owner and Chief Executive Officer, Dos Angeles Ranch, L.P. (cattle, hunting, corporate entertainment); and Discovery Global Education Fund (non-profit)
Formerly: Chief Executive Officer, Texana Timber LP (sustainable forestry company); Director of Cross Timbers Quail Research Ranch (non-profit); and member of the U.S. House of Representatives | 117 | Insperity, Inc. (formerly known as Administaff) | ||||
Prema Mathai-Davis — 1950 Trustee | 2003 | Retired
Formerly: Chief Executive Officer, YWCA of the U.S.A. | 117 | None | ||||
Larry Soll — 1942 Trustee | 1997 | Retired
Formerly: Chairman, Chief Executive Officer and President, Synergen Corp. (a biotechnology company) | 117 | None | ||||
Hugo F. Sonnenschein — 1940 Trustee | 2010 | Distinguished Service Professor and President Emeritus of the University of Chicago and the Adam Smith Distinguished Service Professor in the Department of Economics at the University of Chicago
Formerly: President of the University of Chicago | 130 | Trustee of the University of Rochester and a member of its investment committee. Member of the National Academy of Sciences, the American Philosophical Society and a fellow of the American Academy of Arts and Sciences |
T-2 Invesco S&P 500 Index Fund
Trustees and Officers—(continued)
Name, Year of Birth and Position(s) Held with the Trust | Trustee and/ or Officer Since | Principal Occupation(s) During Past 5 Years | Number of Funds in Fund Complex Overseen by Trustee | Other Directorship(s) Held by Trustee During Past 5 Years | ||||
| Independent Trustees—(continued) | ||||||||
Raymond Stickel, Jr. — 1944 Trustee | 2005 | Retired
Formerly: Director, Mainstay VP Series Funds, Inc. (25 portfolios) and Partner, Deloitte & Touche | 117 | None | ||||
| Other Officers | ||||||||
| Russell C. Burk — 1958 Senior Vice President and Senior Officer | 2005 | Senior Vice President and Senior Officer, The Invesco Funds | N/A | N/A | ||||
| John M. Zerr — 1962 Senior Vice President, Chief Legal Officer and Secretary | 2006 | Director, Senior Vice President, Secretary and General Counsel, Invesco Management Group, Inc. (formerly known as Invesco Aim Management Group, Inc.) and Van Kampen Exchange Corp.; Senior Vice President, Invesco Advisers, Inc. (formerly known as Invesco Institutional (N.A.), Inc.) (registered investment adviser); Senior Vice President and Secretary, Invesco Distributors, Inc. (formerly known as Invesco Aim Distributors, Inc.); Director, Vice President and Secretary, Invesco Investment Services, Inc. (formerly known as Invesco Aim Investment Services, Inc.) and IVZ Distributors, Inc. (formerly known as INVESCO Distributors, Inc.); Director and Vice President, INVESCO Funds Group, Inc.; Senior Vice President, Chief Legal Officer and Secretary, The Invesco Funds; Manager, Invesco PowerShares Capital Management LLC; Director, Secretary and General Counsel, Invesco Investment Advisers LLC (formerly known as Van Kampen Asset Management); Secretary and General Counsel, Invesco Capital Markets, Inc. (formerly known as Van Kampen Funds Inc.) and Chief Legal Officer, PowerShares Exchange-Traded Fund Trust, PowerShares Exchange-Traded Fund Trust II, PowerShares India Exchange-Traded Fund Trust and PowerShares Actively Managed Exchange-Traded Fund Trust
Formerly: Director and Vice President, Van Kampen Advisors Inc.; Director, Vice President, Secretary and General Counsel, Van Kampen Investor Services Inc.; Director, Invesco Distributors, Inc. (formerly known as Invesco Aim Distributors, Inc.); Director, Senior Vice President, General Counsel and Secretary, Invesco Aim Advisers, Inc. and Van Kampen Investments Inc.; Director, Vice President and Secretary, Fund Management Company; Director, Senior Vice President, Secretary, General Counsel and Vice President, Invesco Aim Capital Management, Inc.; Chief Operating Officer and General Counsel, Liberty Ridge Capital, Inc. (an investment adviser); Vice President and Secretary, PBHG Funds (an investment company) and PBHG Insurance Series Fund (an investment company); Chief Operating Officer, General Counsel and Secretary, Old Mutual Investment Partners (a broker-dealer); General Counsel and Secretary, Old Mutual Fund Services (an administrator) and Old Mutual Shareholder Services (a shareholder servicing center); Executive Vice President, General Counsel and Secretary, Old Mutual Capital, Inc. (an investment adviser); and Vice President and Secretary, Old Mutual Advisors Funds (an investment company) | N/A | N/A | ||||
| Karen Dunn Kelley — 1960 Vice President | 2003 | Head of Invesco’s World Wide Fixed Income and Cash Management Group; Director, Co-President, Co-Chief Executive Officer, and Co-Chairman, Invesco Advisers, Inc. (formerly known as Invesco Institutional (N.A.), Inc.) (registered investment adviser); Chairman, Invesco Senior Secured Management, Inc.; Senior Vice President, Invesco Management Group, Inc. (formerly known as Invesco Aim Management Group, Inc.); Executive Vice President, Invesco Distributors, Inc. (formerly known as Invesco Aim Distributors, Inc.); Director, Invesco Mortgage Capital Inc., and Invesco Management Company Limited; Director and President, INVESCO Asset Management (Bermuda) Ltd., Vice President, The Invesco Funds (other than AIM Treasurer’s Series Trust (Invesco Treasurer’s Series Trust) and Short-Term Investments Trust); and President and Principal Executive Officer, The Invesco Funds (AIM Treasurer’s Series Trust (Invesco Treasurer’s Series Trust) and Short-Term Investments Trust only)
Formerly: Director, INVESCO Global Asset Management Limited and INVESCO Management S.A.; Senior Vice President, Van Kampen Investments Inc. and Invesco Advisers, Inc. (formerly known as Invesco Institutional (N.A.), Inc.) (registered investment adviser); Vice President, Invesco Advisers, Inc. (formerly known as Invesco Institutional (N.A.), Inc.); Director of Cash Management and Senior Vice President, Invesco Advisers, Inc. and Invesco Aim Capital Management, Inc.; President and Principal Executive Officer, Tax-Free Investments Trust; Director and President, Fund Management Company; Chief Cash Management Officer, Director of Cash Management, Senior Vice President, and Managing Director, Invesco Aim Capital Management, Inc.; Director of Cash Management, Senior Vice President, and Vice President, Invesco Advisers, Inc. and The Invesco Funds (AIM Treasurer’s Series Trust (Invesco Treasurer’s Series Trust), Short-Term Investments Trust and Tax-Free Investments Trust only) | N/A | N/A | ||||
T-3 Invesco S&P 500 Index Fund
Trustees and Officers—(continued)
Name, Year of Birth and Position(s) Held with the Trust | Trustee and/ or Officer Since | Principal Occupation(s) During Past 5 Years | Number of Funds in Fund Complex Overseen by Trustee | Other Directorship(s) Held by Trustee During Past 5 Years | ||||
| Other Officers—(continued) | ||||||||
| Sheri Morris — 1964 Vice President, Treasurer and Principal Financial Officer | 2003 | Vice President, Treasurer and Principal Financial Officer, The Invesco Funds; Vice President, Invesco Advisers, Inc. (formerly known as Invesco Institutional (N.A.), Inc.) (registered investment adviser); and Vice President, PowerShares Exchange-Traded Fund Trust, PowerShares Exchange-Traded Fund Trust II, PowerShares India Exchange-Traded Fund Trust and PowerShares Actively Managed Exchange-Traded Fund Trust
Formerly: Vice President, Invesco Aim Advisers, Inc., Invesco Aim Capital Management, Inc. and Invesco Aim Private Asset Management, Inc.; Assistant Vice President and Assistant Treasurer, The Invesco Funds and Assistant Vice President, Invesco Advisers, Inc., Invesco Aim Capital Management, Inc. and Invesco Aim Private Asset Management, Inc.; and Treasurer, PowerShares Exchange-Traded Fund Trust, PowerShares Exchange-Traded Fund Trust II, PowerShares India Exchange-Traded Fund Trust and PowerShares Actively Managed Exchange-Traded Fund Trust | N/A | N/A | ||||
Crissie M. Wisdom — 1969 Anti-Money Laundering Compliance Officer | 2013 | Anti-Money Laundering Compliance Officer, Invesco Advisers, Inc. (formerly known as Invesco Institutional (N.A.), Inc.) (registered investment adviser), Invesco Capital Markets, Inc. (formerly known as Van Kampen Funds Inc.), Invesco Distributors, Inc., Invesco Investment Services, Inc., Invesco Management Group, Inc., Van Kampen Exchange Corp., The Invesco Funds, Invesco Funds (Chicago), and PowerShares Exchange-Traded Fund Trust, PowerShares Exchange-Traded Fund Trust II, PowerShares India Exchange-Traded Fund Trust, and PowerShares Actively Managed Exchange-Traded Fund Trust; and Fraud Prevention Manager and Controls and Risk Analysis Manager for Invesco Investment Services, Inc. | N/A | N/A | ||||
| Todd L. Spillane — 1958 Chief Compliance Officer | 2006 | Senior Vice President, Invesco Management Group, Inc. (formerly known as Invesco Aim Management Group, Inc.) and Van Kampen Exchange Corp.; Senior Vice President and Chief Compliance Officer, Invesco Advisers, Inc. (registered investment adviser) (formerly known as Invesco Institutional (N.A.), Inc.); Chief Compliance Officer, The Invesco Funds; Vice President, Invesco Distributors, Inc. (formerly known as Invesco Aim Distributors, Inc.) and Invesco Investment Services, Inc. (formerly known as Invesco Aim Investment Services, Inc.)
Formerly: Chief Compliance Officer, Invesco Funds (Chicago); Senior Vice President, Van Kampen Investments Inc.; Senior Vice President and Chief Compliance Officer, Invesco Aim Advisers, Inc. and Invesco Aim Capital Management, Inc.; Chief Compliance Officer, INVESCO Private Capital Investments, Inc. (holding company), Invesco Private Capital, Inc. (registered investment adviser), Invesco Global Asset Management (N.A.), Inc., Invesco Senior Secured Management, Inc. (registered investment adviser), Van Kampen Investor Services Inc., PowerShares Exchange-Traded Fund Trust, PowerShares Exchange-Traded Fund Trust II, PowerShares India Exchange-Traded Fund Trust and PowerShares Actively Managed Exchange-Traded Fund Trust; and Vice President, Invesco Aim Capital Management, Inc. and Fund Management Company | N/A | N/A |
The Statement of Additional Information of the Trust includes additional information about the Fund’s Trustees and is available upon request, without charge, by calling 1.800.959.4246. Please refer to the Fund’s prospectus for information on the Fund’s sub-advisers.
Office of the Fund 11 Greenway Plaza, Suite 1000 Houston, TX 77046-1173 | Investment Adviser Invesco Advisers, Inc. 1555 Peachtree Street, N.E. Atlanta, GA 30309 | Distributor Invesco Distributors, Inc. 11 Greenway Plaza, Suite 1000 Houston, TX 77046-1173 | Auditors PricewaterhouseCoopers LLP 1201 Louisiana Street, Suite 2900 Houston, TX 77002-5678 | |||
Counsel to the Fund Stradley Ronon Stevens & Young, LLP 2005 Market Street, Suite 2600 Philadelphia, PA 19103-7018 | Counsel to the Independent Trustees Goodwin Procter LLP 901 New York Avenue, N.W. Washington, D.C. 20001 | Transfer Agent Invesco Investment Services, Inc. 11 Greenway Plaza, Suite 1000 Houston, TX 77046-1173 | Custodian State Street Bank and Trust Company 225 Franklin Street Boston, MA 02110-2801 | |||
T-4 Invesco S&P 500 Index Fund

Invesco mailing information
Send general correspondence to Invesco Investment Services, Inc., P.O. Box 219078, Kansas City, MO 64121-9078.
Invesco privacy policy
You share personal and financial information with us that is necessary for your transactions and your account records. We take very seriously the obligation to keep that information confidential and private.
Invesco collects nonpublic personal information about you from account applications or other forms you complete and from your transactions with us or our affiliates. We do not disclose information about you or our former customers to service providers or other third parties except to the extent necessary to service your account and in other limited circumstances as permitted by law. For example, we use this information to facilitate the delivery of transaction confirmations, financial reports, prospectuses and tax forms.
Even within Invesco, only people involved in the servicing of your accounts and compliance monitoring have access to your information. To ensure the highest level of confidentiality and security, Invesco maintains physical, electronic and procedural safeguards that meet or exceed federal standards. Special measures, such as data encryption and authentication, apply to your communications with us on our website. More detail is available to you at invesco.com/privacy.
Important notice regarding delivery of security holder documents
To reduce Fund expenses, only one copy of most shareholder documents may be mailed to shareholders with multiple accounts at the same address (Householding). Mailing of your shareholder documents may be householded indefinitely unless you instruct us otherwise. If you do not want the mailing of these documents to be combined with those for other members of your household, please contact Invesco Investment Services, Inc. at 800 959 4246 or contact your financial institution. We will begin sending you individual copies for each account within 30 days after receiving your request.
Fund holdings and proxy voting information
The Fund provides a complete list of its holdings four times in each fiscal year, at the quarter ends. For the second and fourth quarters, the lists appear in the Fund’s semiannual and annual reports to shareholders. For the first and third quarters, the Fund files the lists with the Securities and Exchange Commission (SEC) on Form N-Q. The most recent list of portfolio holdings is available at invesco.com/completeqtrholdings. Shareholders can also look up the Fund’s Forms N-Q on the SEC website at sec.gov. Copies of the Fund’s Forms N-Q may be reviewed and copied at the SEC Public Reference Room in Washington, D.C. You can obtain information on the operation of the Public Reference Room, including information about duplicating fee charges, by calling 202 551 8090 or 800 732 0330, or by electronic request at the following email address: publicinfo@sec.gov. The SEC file numbers for the Fund are shown below.
A description of the policies and procedures that the Fund uses to determine how to vote proxies relating to portfolio securities is available without charge, upon request, from our Client Services department at 800 959 4246 or at invesco.com/proxyguidelines. The information is also available on the SEC website, sec.gov.
Information regarding how the Fund voted proxies related to its portfolio securities during the most recent 12-month period ended June 30 is available at invesco.com/proxysearch. The information is also available on the SEC website, sec.gov. Invesco Advisers, Inc. is an investment adviser; it provides investment advisory services to individual and institutional clients and does not sell securities. Invesco Distributors, Inc. is the US distributor for Invesco Ltd.’s retail mutual funds, exchange-traded funds and institutional money market funds. Both are wholly owned, indirect subsidiaries of Invesco Ltd. |  | |
SEC file numbers: 811-09913 and 333-36074 MS-SPI-AR-1 Invesco Distributors, Inc. |
| ||||
 |
Annual Report to Shareholders
|
August 31, 2013
| ||
| ||||
Invesco Small Cap Discovery Fund
Nasdaq: A: VASCX n B: VBSCX n C: VCSCX n Y: VISCX n R5: VESCX n R6: VFSCX | ||||

Letters to Shareholders
Philip Taylor | Dear Shareholders: Enclosed in this annual report, you’ll find information about your Fund and the factors that affected its performance during the reporting period. Inside, you’ll also find a discussion from your portfolio managers about how they managed your Fund, as well as performance data for your Fund, a complete list of your Fund’s investments as of the close of the reporting period and other important information. I hope you find this report of interest. During the reporting period covered by this report, major US equity indexes made multiyear or even all-time highs.1 Economic data were generally positive; housing and consumer spending data were particularly encouraging. Nonetheless, economic uncertainty and concern about continuing political and budget gridlock in Washington persisted. The US Federal Reserve’s deliberate vagueness about when, and to what degree, it might begin to curtail its | ||||||||

extraordinarily accommodative monetary policies – together with uncertainty about who will next lead the central bank – affected fixed income and equity markets alike. Most developed, non-US stock markets remained positive for the first half of 2013, despite a difficult second quarter.
Periods of market volatility and economic uncertainty can weaken the will of even the most resolute investor. That’s why Invesco believes it’s often helpful to work with a skilled and trusted financial adviser who can emphasize the importance of adhering to an investment plan designed to achieve long-term goals rather than being sidetracked by short-term uncertainty that can result in inaction. A financial adviser who is familiar with your individual financial situation, investment goals and risk tolerance can be an invaluable partner as you work toward your financial goals. He or she can provide insight and perspective when markets are volatile; encouragement and reassurance when times are uncertain; and advice and guidance when your financial situation or investment goals change.
Our website, invesco.com/us, is another source of timely insight and information for investors. On the website, you’ll find fund-specific as well as more general information from many of Invesco’s investment professionals. You’ll find in-depth articles, video clips and audio commentaries – and, of course, you also can access information about your Invesco account whenever it’s convenient for you.
What we mean by Intentional Investing
At Invesco, all of our people and all of our resources are dedicated to helping investors achieve their financial objectives. It’s a philosophy we call Intentional Investing, and it guides the way we:
| n | Manage investments - Our dedicated investment professionals search the world for the best opportunities, and each investment team follows a clear, disciplined process to build portfolios and mitigate risk. |
| n | Provide choices - We offer multiple investment strategies, allowing you and your financial adviser to build a portfolio that’s purpose-built for your needs. |
| n | Connect with you - We’re committed to giving you the expert insights you need to make informed investing decisions, and we are well-equipped to provide high-quality support for investors and advisers. |
At Invesco, we believe in putting investors first. That’s why investment management is all we do. Our sole focus on managing your money allows you and your financial adviser to build a portfolio of Invesco funds appropriate for your investment needs and goals today and when your circumstances change.
Have questions?
For questions about your account, feel free to contact an Invesco client services representative at 800 959 4246. For Invesco-related questions or comments, please email me directly at phil@invesco.com.
All of us at Invesco look forward to serving your investment management needs for many years to come. Thank you for investing with us.
Sincerely,

Philip Taylor
Senior Managing Director, Invesco Ltd.
1 Source: Reuters
2 Invesco Small Cap Discovery Fund
Bruce Crockett | Dear Fellow Shareholders: The Invesco Funds Board has worked on a variety of issues over the last several months, and I’d like to take this opportunity to discuss two that affect you and our fellow fund shareholders. The first issue on which your Board has been working is our annual review of the funds’ advisory and sub-advisory contracts with Invesco Advisers and its affiliates. This annual review, which is required by the Investment Company Act of 1940, focuses on the nature and quality of the services Invesco provides as adviser to the Invesco Funds and the reasonableness of the fees that it charges for those services. Each year, we spend months reviewing detailed information that we request from Invesco that allows us to evaluate its services and fees. We also use information from many independent sources, including materials provided by the independent Senior Officer of the Invesco Funds, who reports directly to the independent Trustees on the Board. Additionally, we meet with independent legal counsel and review | ||||||||

performance and fee data prepared by Lipper Inc., an independent, third-party firm widely recognized as a leader in its field.
I’m pleased to report that the Board determined in June that renewing the investment advisory agreement and the sub-advisory contracts with Invesco Advisers and its affiliates would serve the best interests of each fund and its shareholders.
The second area of focus to highlight is the Board’s efforts to ensure that we provide a lineup of funds that allow financial advisers to build portfolios that meet shareholders’ changing financial needs and goals. Today, more and more investors are reaching, or approaching, retirement. But interest rates remain low, making it difficult for many investors to generate the income they need, or will soon need, in their retirement years.
The members of your Board think about these things, too, and we’ve worked with Invesco Advisers to provide more income-generating options in the Invesco Funds lineup to help shareholders potentially meet their income needs. Your Board recently approved changes to three existing equity mutual funds, increasing their focus on generating income while also seeking to provide long-term growth of capital.
As a result of these changes, the funds and their respective management teams now have more flexibility to invest in the types of securities that could meet investors’ growing need for income generation, and in some cases, also help investors diversify their sources of income. These equity funds complement an array of fixed-income, asset allocation and alternative investment options in the Invesco Funds lineup designed to accommodate a variety of risk tolerances.
Be assured that your Board will continue working on behalf of fund shareholders, keeping your needs and interests uppermost in our minds.
As always, please contact me at bruce@brucecrockett.com with any questions or concerns you may have. On behalf of the Board, we look forward to continuing to represent your interests and serving your needs.
Sincerely,

Bruce L. Crockett
Independent Chair
Invesco Funds Board of Trustees
3 Invesco Small Cap Discovery Fund
Management’s Discussion of Fund Performance
Performance summary
For the reporting period ended August 31, 2013, Invesco Small Cap Discovery Fund had positive returns, but underperformed its style-specific benchmark, the Russell 2000 Growth Index. Underperformance was driven primarily by stock selection in several sectors.
Your Fund’s long-term performance appears later in this report.
Fund vs. Indexes
Total returns, 8/31/12 to 8/31/13, at net asset value (NAV). Performance shown does not include applicable contingent deferred sales charges (CDSC) or front-end sales charges, which would have reduced performance.
| Class A Shares | 25.31 | % | |||
| Class B Shares | 25.34 | ||||
| Class C Shares | 24.43 | ||||
| Class Y Shares | 25.67 | ||||
| Class R5 Shares* | 25.84 | ||||
| Class R6 Shares* | 25.84 | ||||
| S&P 500 Index‚ (Broad Market Index) | 18.70 | ||||
| Russell 2000 Growth Indexn (Style-Specific Index) | 28.14 | ||||
| Lipper Small-Cap Growth Funds Index¿ (Peer Group Index) | 26.36 |
| Source(s): | ‚Invesco, S&P-Dow Jones via FactSet Research Systems Inc.; |
| nInvesco, Russell via FactSet Research Systems Inc.; ¿Lipper Inc. |
| * | Share class incepted during the reporting period. See page 7 for a detailed explanation of Fund performance. |
How we invest
We believe a growth investment strategy is an essential component of a diversified portfolio. Our investment process seeks to identify small-cap companies with growth rates that are higher and/or more sustainable than what is implied by current valuations and market expectations.
We begin with a quantitative model that ranks all stock candidates based on a set of variables we believe are leading indicators of change and are common in those companies that have the potential for sustainable growth, competitive advantage and ability to execute. This proprietary model provides an objective approach to identifying new investment opportunities. The highest ranked stocks become the primary focus of our research efforts.
Our stock selection process includes the development and analysis of a fully integrated financial model, which allows us to build a more complete understanding of the financial health of each investment candidate. The second step in our security research involves due diligence of the company, which includes in-depth discussions with members of company management teams. We also leverage Porter’s Five Forces Analysis, a theoretical tool that carefully examines a company by five dimensions (supplier power, threat of substitutes, barriers to entry, buying power and degree of rivalry). This tool is used to further measure and define the sustainability of a company’s earnings growth and whether there is upside to expectations already embedded in the security.
Risk management plays an important role in portfolio construction, as our target portfolio attempts to maximize the relationship between risk and return.
We consider selling a stock for any of the following reasons:
| n | Investment thesis plays out or is no longer valid. |
| n | Fundamentals deteriorate. |
| n | Macroeconomic conditions change. |
| n | Risk/reward becomes unfavorable or a higher conviction investment idea arises with better risk/reward. |
Market conditions and your Fund
The fiscal year ended August 31, 2013, began with some downward volatility in US equity markets. Starting in the fall of 2012, markets began an upward trend that continued through much of the reporting period. In early fall, the European Central Bank implemented new measures to support member economies and the US Federal Reserve (the Fed) initiated a third round of quantitative easing (QE), or fiscal stimulus, which caused consumer sentiment to improve. Uncertainty surrounding US election results, “fiscal cliff” negotiations and sequestration spending cuts in early 2013, however, made many businesses hesitant to spend during the first quarter of the year. However, for the first time in years, markets appeared willing to look past headline events.
From late May through June, the capital markets began a sell-off following Fed Chairman Ben Bernanke’s comments about reducing QE. Since December 2012, the Fed has purchased $85 billion1 of US Treasuries and mortgage-backed securities each month to increase liquidity and ensure low long-term interest rates in an effort to spur the housing and real estate markets. Few asset classes were immune from this broad sell-off, which
| Portfolio Composition | |||||
| By sector | |||||
Health Care | 20.6 | % | |||
| Industrials | 19.9 | ||||
| Information Technology | 18.4 | ||||
| Consumer Discretionary | 16.5 | ||||
| Financials | 6.4 | ||||
| Materials | 5.3 | ||||
| Energy | 4.7 | ||||
| Consumer Staples | 3.4 | ||||
| Telecommunication Services | 0.8 | ||||
| Money Market Funds | |||||
| Plus Other Assets Less Liabilities | 4.0 | ||||
| Top 10 Equity Holdings | |||||
1. Acadia Healthcare Co., Inc. | 1.4 | % | |||
| 2. Aspen Technology, Inc. | 1.2 | ||||
| 3. NPS Pharmaceuticals, Inc. | 1.2 | ||||
| 4. Methanex Corp. | 1.1 | ||||
| 5. Group 1 Automotive, Inc. | 1.1 | ||||
| 6. Manitowoc Co., Inc. (The) | 1.1 | ||||
| 7. Centene Corp. | 1.1 | ||||
| 8. Carlisle Cos. Inc. | 1.1 | ||||
| 9. Cinemark Holdings, Inc. | 1.1 | ||||
| 10. Lennox International Inc. | 1.1 | ||||
| Total Net Assets | $882.6 million | ||||
| Total Number of Holdings* | 131 | ||||
The Fund’s holdings are subject to change, and there is no assurance that the Fund will continue to hold any particular security.
*Excluding money market fund holdings.
4 Invesco Small Cap Discovery Fund
caused bonds, stocks and commodities to decline. Precious metals were particularly hard hit, and fixed-income investors scrambled to sell bonds in anticipation of higher yields. The markets stabilized in mid-summer; however, August brought more selling in the equity and bond markets and yields continued to rise.
The Fund had solid positive absolute returns, but underperformed the Russell 2000 Growth Index during the reporting period. The Fund underperformed the style-specific index by the widest margins in the information technology (IT), consumer staples and telecommunication services sectors. Underperformance in each of these sectors was driven predominately by stock selection. A modest cash position also detracted from relative performance since the small-cap market was up significantly during the reporting period. Some of this underperformance was offset by outperformance in other sectors, especially the health care and consumer discretionary sectors, driven by strong stock selection.
The Fund underperformed its style-specific index in the IT sector due to negative stock selection. Cirrus Logic, a semiconductor manufacturer, negatively affected Fund performance largely due to its exposure as a supplier of components to Apple, (not a Fund holding), which had a slowdown in production during the reporting period. Cirrus Logic’s stock fell when management provided lower-than-expected revenue guidance and we subsequently sold the position.
Microstrategy, a provider of enterprise software platforms for businesses, also detracted from performance. The company’s products require a fairly large investment from a corporation’s IT department and the spending environment was exceedingly weak for large-sized deals which led us to sell our position during the reporting period. Another detractor from Fund performance was Procera Networks, which provides intelligent technology that enables mobile and broadband network operators to manage their networks more efficiently. This small company began competing for bigger clients, but the increased costs of doing so hurt its profitability and stock price.
The Fund was underweight relative to the style-specific index in the consumer staples sector, as stock valuations were generally high compared to their expected growth rates. However, not owning several of the stronger performing consumer staples names held by the Russell 2000
Growth Index, including Boston Beer Company, detracted from relative results. The Fund owned consumer goods company Elizabeth Arden; however, it was a large detractor within the sector as the company’s first quarter 2013 results were poor and negatively affected the company’s stock performance. Elizabeth Arden was no longer held at the end of the reporting period.
Some of this underperformance was offset by solid outperformance in the health care and consumer discretionary sectors. The strongest contributor to Fund performance during the reporting period was biotechnology company NPS Pharmaceuticals, which gained approval for and subsequently launched a new drug faster than market expectations. The stock rose further as the drug was adopted over older treatments at a higher rate than initially projected. Acadia Healthcare and Onyx Pharmaceuticals were also solid contributors in the health care sector. Hanesbrands was the strongest contributor within the consumer discretionary sector as management executed on its plan to reduce debt and improve profitability through expense management and higher profit products.
As we’ve discussed, the stock market experienced volatile performance during the reporting period. We would like to caution investors against making investment decisions based on short-term performance.
We thank you for your commitment to Invesco Small Cap Discovery Fund.
| 1 | Source: US Federal Reserve |
The views and opinions expressed in management’s discussion of Fund performance are those of Invesco Advisers, Inc. These views and opinions are subject to change at any time based on factors such as market and economic conditions. These views and opinions may not be relied upon as investment advice or recommendations, or as an offer for a particular security. The information is not a complete analysis of every aspect of any market, country, industry, security or the Fund. Statements of fact are from sources considered reliable, but Invesco Advisers, Inc. makes no representation or warranty as to their completeness or accuracy. Although historical performance is no guarantee of future results, these insights may help you understand our investment management philosophy.
See important Fund and, if applicable, index disclosures later in this report.
 | Matthew Hart Chartered Financial Analyst, portfolio manager, is lead manager of Invesco Small Cap Discovery | |
| Fund. He joined Invesco in 2010. Mr. Hart earned a BBA from Southern Methodist University. | ||
 | Justin Speer Portfolio manager, is manager of Invesco Small Cap Discovery Fund. He joined Invesco in 2010. | |
| Mr. Speer earned a BS with an emphasis in finance and accounting from Texas Christian University. | ||
5 Invesco Small Cap Discovery Fund
Your Fund’s Long-Term Performance
Results of a $10,000 Investment – Oldest Share Class(es)
Fund and index data from 8/31/03
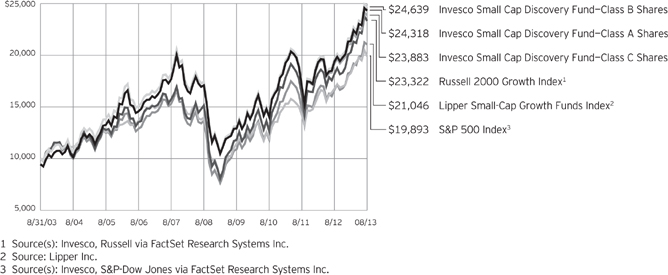
Past performance cannot guarantee comparable future results.
The data shown in the chart include reinvested distributions, applicable sales charges and Fund expenses including management fees. Results for Class B shares are calculated as if a hypothetical
shareholder had liquidated his entire investment in the Fund at the close of the reporting period and paid the contingent deferred sales charges, if applicable. Index results include reinvested dividends, but they do not reflect sales charges. Performance of the peer group,
if applicable, reflects fund expenses and management fees; performance of a market index does not. Performance shown in the chart and table(s) does not reflect deduction of taxes a shareholder would pay on Fund distributions or sale of Fund shares.
continued from page 8
| holder transactions and the returns based on those net asset values may differ from the net asset values and returns reported in the Financial Highlights. |
| n | Industry classifications used in this report are generally according to the Global Industry Classification Standard, which was developed by and is the exclusive property and a service mark of MSCI Inc. and Standard & Poor’s. |
6 Invesco Small Cap Discovery Fund
| Average Annual Total Returns | |||||
As of 8/31/13, including maximum applicable sales charges
|
| ||||
| Class A Shares | |||||
| Inception (11/27/00) | 3.33 | % | |||
| 10 Years | 9.29 | ||||
| 5 Years | 6.08 | ||||
| 1 Year | 18.43 | ||||
| Class B Shares | |||||
| Inception (11/27/00) | 3.32 | % | |||
| 10 Years | 9.44 | ||||
| 5 Years | 6.89 | ||||
| 1 Year | 20.34 | ||||
| Class C Shares | |||||
| Inception (11/27/00) | 3.03 | % | |||
| 10 Years | 9.10 | ||||
| 5 Years | 6.53 | ||||
| 1 Year | 23.43 | ||||
| Class Y Shares | |||||
| Inception (2/2/06) | 6.75 | % | |||
| 5 Years | 7.59 | ||||
| 1 Year | 25.67 | ||||
| Class R5 Shares | |||||
| 10 Years | 9.95 | % | |||
| 5 Years | 7.38 | ||||
| 1 Year | 25.84 | ||||
| Class R6 Shares | |||||
| 10 Years | 9.95 | % | |||
| 5 Years | 7.38 | ||||
| 1 Year | 25.84 | ||||
Effective June 1, 2010, Class A, Class B, Class C and Class I shares of the predecessor fund, Van Kampen Small Cap Growth Fund, advised by Van Kampen Asset Management were reorganized into Class A, Class B, Class C and Class Y shares, respectively, of Invesco Van Kampen Small Cap Growth Fund (renamed Invesco Small Cap Discovery Fund). Returns shown above for Class A, Class B, Class C and Class Y shares are blended returns of the predecessor fund and Invesco Small Cap Discovery Fund. Share class returns will differ from the predecessor fund because of different expenses.
Class R5 shares incepted on September 24, 2012. Performance shown prior to that date is that of the Fund’s and the predecessor fund’s Class A shares and includes the 12b-1 fees applicable to Class A shares. Class A share performance reflects any applicable fee waivers or expense reimbursements.
| Average Annual Total Returns | |||||
| As of 6/30/13, the most recent calendar quarter end, including maximum applicable sales charges | |||||
| Class A Shares | |||||
| Inception (11/27/00) | 2.89 | % | |||
| 10 Years | 9.79 | ||||
| 5 Years | 4.60 | ||||
| 1 Year | 17.37 | ||||
| Class B Shares | |||||
| Inception (11/27/00) | 2.88 | % | |||
| 10 Years | 9.95 | ||||
| 5 Years | 5.33 | ||||
| 1 Year | 19.27 | ||||
| Class C Shares | |||||
| Inception (11/27/00) | 2.59 | % | |||
| 10 Years | 9.62 | ||||
| 5 Years | 5.03 | ||||
| 1 Year | 22.33 | ||||
| Class Y Shares | |||||
| Inception (2/2/06) | 6.04 | % | |||
| 5 Years | 6.08 | ||||
| 1 Year | 24.64 | ||||
| Class R5 Shares | |||||
| 10 Years | 10.46 | % | |||
| 5 Years | 5.88 | ||||
| 1 Year | 24.71 | ||||
| Class R6 Shares | |||||
| 10 Years | 10.46 | % | |||
| 5 Years | 5.88 | ||||
| 1 Year | 24.71 | ||||
Class R6 shares incepted on September 24, 2012. Performance shown prior to that date is that of the Fund’s and the predecessor fund’s Class A shares and includes the 12b-1 fees applicable to Class A shares. Class A share performance reflects any applicable fee waivers or expense reimbursements.
The performance data quoted represent past performance and cannot guarantee comparable future results; current performance may be lower or higher. Please visit invesco.com/performance for the most recent month-end performance. Performance figures reflect reinvested distributions, changes in net asset value and the effect of the maximum sales charge unless otherwise stated. Investment return and principal value will fluctuate so that you may have a gain or loss when you sell shares.
The total annual Fund operating expense ratio set forth in the most recent Fund prospectus as of the date of this report for Class A, Class B, Class C, Class Y, Class R5 and Class R6 shares was 1.43%, 1.43%, 2.18%, 1.18%, 0.90% and 0.86%, respectively. The expense ratios presented above may vary from the expense ratios presented in other sections of this report that are based on expenses incurred during the period covered by this report.
Class A share performance reflects the maximum 5.50% sales charge, and Class B and Class C share performance reflects the applicable contingent deferred sales charge (CDSC) for the period involved. For shares purchased prior to June 1, 2010, the CDSC on Class B shares declines from 5% at the time of purchase to 0% at the beginning of the sixth year. For shares purchased on or after June 1, 2010, the CDSC on Class B shares declines from 5% at the time of purchase to 0% at the beginning of the seventh year. The CDSC on Class C shares is 1% for the first year after purchase. Class Y, Class R5 and Class R6 shares do not have a front-end sales charge or a CDSC; therefore, performance is at net asset value.
The performance of the Fund’s share classes will differ primarily due to different sales charge structures and class expenses.
7 Invesco Small Cap Discovery Fund
Invesco Small Cap Discovery Fund’s investment objective is to seek capital appreciation.
| n | Unless otherwise stated, information presented in this report is as of August 31, 2013, and is based on total net assets. |
| n | Unless otherwise noted, all data provided by Invesco. |
| n | To access your Fund’s reports/prospectus, visit invesco.com/fundreports. |
About share classes
| n | Class B shares may not be purchased for new or additional investments. Please see the prospectus for more information. |
| n | Class Y shares are available only to certain investors. Please see the prospectus for more information. |
| n | Class R5 shares and Class R6 shares are primarily intended for employer sponsored retirement and benefit plans that meet certain standards and for institutional investors. Class R5 and Class R6 shares incepted on September 24, 2012. Please see the prospectus for more information. |
Principal risks of investing in the Fund
| n | Market risk. The prices of and the income generated by the Fund’s securities may decline in response to, among other things, investor sentiment, general economic and market conditions, regional or global instability, and currency and interest rate fluctuations. |
| n | Management risk. The investment techniques and risk analysis used by the Fund’s portfolio managers may not produce the desired results. |
| n | Small capitalization companies risk. Small capitalization companies often have less predictable earnings, more limited product lines, markets, distribution channels or financial resources and the management of such companies may be dependent upon one or few key people. The market movements of equity securities of small capitalization companies may be more abrupt and volatile than the market movements of equity securities of larger, more established companies or the stock market in general and are generally less liquid than the equity securities of larger companies. |
| n | Growth investing risk. Investments in growth-oriented equity securities may have above-average volatility of price movement. The returns on growth |
securities may or may not move in tandem with the returns on other styles of investing or the overall stock markets. |
| n | Foreign risk. The risks of investing in securities of foreign issuers can include fluctuations in foreign currencies, foreign currency exchange. |
| n | Investing in real estate investment trusts (REITs) risk. Investing in REITs makes the Fund more susceptible to risks associated with the ownership of real estate and with the real estate industry in general and may involve duplication of management fees and certain other expenses. In addition, REITs depend upon specialized management skills, may not be diversified, may have less trading volume, and may be subject to more abrupt or erratic price movements than the overall securities markets. |
| n | Exchange-traded funds risk. An investment by the Fund in exchange-traded funds generally presents the same primary risk as an investment in a mutual fund. In addition, an exchange-traded fund may be subject to the following: (1) a discount of the exchange-traded fund’s shares to its net asset value; (2) failure to develop an active trading market for the exchange-traded fund’s shares; (3) the listing exchange halting trading of the exchange-traded fund’s shares; (4) failure of the exchange-traded fund’s shares to track the referenced index; and (5) holding troubled securities in the referenced index. Exchange-traded funds may involve duplication of management fees and certain other expenses, as the Fund indirectly bears its proportionate share of any expenses paid by the exchange-traded funds in which it invests. Further, certain of the exchange-traded funds in which the Fund may invest are leveraged. The more the Fund invests in such leveraged exchange-traded funds, the more this leverage will magnify any losses on those investments. |
| n | Synthetic securities risk. Fluctuations in the values of synthetic securities may not correlate perfectly with the instruments they are designed to replicate. Synthetic securities may be subject to interest rate changes, market price fluctuations, counterparty risk and liquidity risk. |
About indexes used in this report
| n | The S&P 500® Index is an unmanaged index considered representative of the US stock market. |
| n | The Russell 2000® Growth Index is an unmanaged index considered representative of small-cap growth stocks. The Russell 2000 Growth Index is a trademark/service mark of the Frank Russell Co. Russell® is a trademark of the Frank Russell Co. |
| n | The Lipper Small-Cap Growth Funds Index is an unmanaged index considered representative of small-cap growth funds tracked by Lipper. |
| n | The Fund is not managed to track the performance of any particular index, including the index(es) described here, and consequently, the performance of the Fund may deviate significantly from the performance of the index(es). |
| n | A direct investment cannot be made in an index. Unless otherwise indicated, index results include reinvested dividends, and they do not reflect sales charges. Performance of the peer group, if applicable, reflects fund expenses; performance of a market index does not. |
Other information
| n | The returns shown in management’s discussion of Fund performance are based on net asset values calculated for shareholder transactions. Generally accepted accounting principles require adjustments to be made to the net assets of the Fund at period end for financial reporting purposes, and as such, the net asset values for share |
continued on page 6
This report must be accompanied or preceded by a currently effective Fund prospectus, which contains more complete information, including sales charges and expenses. Investors should read it carefully before investing.
NOT FDIC INSURED | MAY LOSE VALUE | NO BANK GUARANTEE
| Fund Nasdaq Symbols | |||||
| Class A Shares | VASCX | ||||
| Class B Shares | VBSCX | ||||
| Class C Shares | VCSCX | ||||
| Class Y Shares | VISCX | ||||
| Class R5 Shares | VESCX | ||||
| Class R6 Shares | VFSCX | ||||
8 Invesco Small Cap Discovery Fund
Schedule of Investments(a)
August 31, 2013
| Shares | Value | |||||||
Common Stocks–95.95% |
| |||||||
| Aerospace & Defense–1.22% | ||||||||
Hexcel Corp.(b) | 122,997 | $ | 4,375,003 | |||||
Triumph Group, Inc. | 89,334 | 6,429,368 | ||||||
| 10,804,371 | ||||||||
| Air Freight & Logistics–0.50% | ||||||||
UTi Worldwide, Inc. | 266,029 | 4,392,139 | ||||||
| Airlines–1.00% | ||||||||
Alaska Air Group, Inc. | 156,578 | 8,865,446 | ||||||
| Alternative Carriers–0.51% | ||||||||
tw telecom inc.(b) | 156,388 | 4,475,825 | ||||||
| Apparel Retail–1.68% | ||||||||
DSW Inc.–Class A | 74,128 | 6,381,680 | ||||||
Genesco Inc.(b) | 82,036 | 5,059,980 | ||||||
Stage Stores, Inc. | 181,556 | 3,382,388 | ||||||
| 14,824,048 | ||||||||
| Apparel, Accessories & Luxury Goods–2.30% | ||||||||
Hanesbrands, Inc. | 139,239 | 8,281,936 | ||||||
Tumi Holdings Inc.(b) | 235,661 | 4,845,190 | ||||||
Under Armour, Inc.–Class A(b)(c) | 98,436 | 7,150,391 | ||||||
| 20,277,517 | ||||||||
| Application Software–5.06% | ||||||||
Aspen Technology, Inc.(b) | 324,614 | 10,851,846 | ||||||
Bottomline Technologies (de), Inc.(b) | 148,886 | 4,052,677 | ||||||
Cadence Design Systems, Inc.(b) | 650,224 | 8,758,517 | ||||||
Guidewire Software Inc.(b) | 165,441 | 7,603,668 | ||||||
Manhattan Associates, Inc.(b) | 82,139 | 7,187,163 | ||||||
QLIK Technologies Inc.(b) | 189,998 | 6,230,034 | ||||||
| 44,683,905 | ||||||||
| Asset Management & Custody Banks–0.88% | ||||||||
Affiliated Managers Group, Inc.(b) | 44,437 | 7,746,258 | ||||||
| Auto Parts & Equipment–2.74% | ||||||||
Allison Transmission Holdings, Inc. | 340,882 | 7,673,254 | ||||||
Tenneco Inc.(b) | 194,772 | 8,984,832 | ||||||
TRW Automotive Holdings Corp.(b) | 108,826 | 7,516,612 | ||||||
| 24,174,698 | ||||||||
| Automotive Retail–1.12% | ||||||||
Group 1 Automotive, Inc. | 129,172 | 9,911,368 | ||||||
| Biotechnology–5.39% | ||||||||
ARIAD Pharmaceuticals, Inc.(b) | 227,057 | 4,223,260 | ||||||
BioMarin Pharmaceutical Inc.(b) | 124,641 | 8,160,246 | ||||||
Cubist Pharmaceuticals, Inc.(b) | 137,815 | 8,731,958 | ||||||
Medivation Inc.(b) | 78,157 | 4,418,215 | ||||||
NPS Pharmaceuticals, Inc.(b) | 407,736 | 10,234,174 | ||||||
| Shares | Value | |||||||
| Biotechnology–(continued) | ||||||||
Onyx Pharmaceuticals, Inc.(b) | 68,977 | $ | 8,524,178 | |||||
TESARO, Inc.(b) | 95,620 | 3,306,540 | ||||||
| 47,598,571 | ||||||||
| Broadcasting–0.50% | ||||||||
Nexstar Broadcasting Group, Inc.–Class A | 132,031 | 4,432,281 | ||||||
| Building Products–2.87% | ||||||||
A.O. Smith Corp. | 142,018 | 5,971,857 | ||||||
Fortune Brands Home & Security Inc. | 75,848 | 2,794,240 | ||||||
Lennox International Inc. | 137,626 | 9,448,025 | ||||||
Trex Co., Inc.(b) | 160,846 | 7,120,653 | ||||||
| 25,334,775 | ||||||||
| Commodity Chemicals–1.51% | ||||||||
Koppers Holdings, Inc. | 88,669 | 3,437,697 | ||||||
Methanex Corp. (Canada) | 213,810 | 9,940,027 | ||||||
| 13,377,724 | ||||||||
| Communications Equipment–1.44% | ||||||||
Ciena Corp.(b) | 267,590 | 5,330,393 | ||||||
JDS Uniphase Corp.(b) | 332,310 | 4,263,537 | ||||||
Procera Networks, Inc.(b) | 238,105 | 3,083,460 | ||||||
| 12,677,390 | ||||||||
| Construction & Engineering–0.30% | ||||||||
Primoris Services Corp. | 118,354 | 2,660,598 | ||||||
| Construction & Farm Machinery & Heavy Trucks–1.11% | ||||||||
Manitowoc Co., Inc. (The) | 491,775 | 9,825,664 | ||||||
| Consumer Electronics–0.81% | ||||||||
Harman International Industries, Inc. | 111,756 | 7,154,619 | ||||||
| Data Processing & Outsourced Services–2.58% | ||||||||
Cardtronics, Inc.(b) | 256,411 | 8,894,897 | ||||||
Jack Henry & Associates, Inc. | 114,582 | 5,717,642 | ||||||
MAXIMUS, Inc. | 218,308 | 8,188,733 | ||||||
| 22,801,272 | ||||||||
| Electrical Components & Equipment–0.89% | ||||||||
Belden Inc. | 138,256 | 7,841,880 | ||||||
| Electronic Equipment & Instruments–0.87% | ||||||||
Cognex Corp. | 134,840 | 7,683,183 | ||||||
| Electronic Manufacturing Services–0.57% | ||||||||
IPG Photonics Corp.(c) | 93,454 | 5,024,087 | ||||||
| Environmental & Facilities Services–1.58% | ||||||||
Clean Harbors, Inc.(b) | 141,475 | 8,040,024 | ||||||
Waste Connections, Inc. | 139,592 | 5,913,117 | ||||||
| 13,953,141 | ||||||||
See accompanying Notes to Financial Statements which are an integral part of the financial statements.
9 Invesco Small Cap Discovery Fund
| Shares | Value | |||||||
| Footwear–0.90% | ||||||||
Steven Madden, Ltd.(b) | 146,509 | $ | 7,911,486 | |||||
| Health Care Equipment–3.24% | ||||||||
DexCom Inc.(b) | 189,065 | 5,114,208 | ||||||
Insulet Corp.(b) | 227,041 | 7,569,547 | ||||||
Sirona Dental Systems, Inc.(b) | 112,617 | 7,294,203 | ||||||
Thoratec Corp.(b) | 240,248 | 8,584,061 | ||||||
| 28,562,019 | ||||||||
| Health Care Facilities–2.35% | ||||||||
Acadia Healthcare Co., Inc.(b) | 326,663 | 12,520,993 | ||||||
Health Management Associates Inc.–Class A(b) | 303,392 | 3,901,621 | ||||||
Tenet Healthcare Corp.(b) | 109,944 | 4,293,313 | ||||||
| 20,715,927 | ||||||||
| Health Care Services–1.72% | ||||||||
MEDNAX, Inc.(b) | 79,539 | 7,744,713 | ||||||
Team Health Holdings, Inc.(b) | 193,982 | 7,454,728 | ||||||
| 15,199,441 | ||||||||
| Health Care Supplies–2.48% | ||||||||
Align Technology, Inc.(b) | 192,618 | 8,388,514 | ||||||
Endologix, Inc.(b) | 563,419 | 8,913,289 | ||||||
TearLab Corp.(b)(c) | 347,016 | 4,559,790 | ||||||
| 21,861,593 | ||||||||
| Health Care Technology–1.14% | ||||||||
HMS Holdings Corp.(b) | 104,929 | 2,622,176 | ||||||
MedAssets, Inc.(b) | 332,237 | 7,448,753 | ||||||
| 10,070,929 | ||||||||
| Home Furnishings–0.52% | ||||||||
La-Z-Boy Inc. | 214,573 | 4,561,822 | ||||||
| Homebuilding–0.42% | ||||||||
Taylor Morrison Home Corp.–Class A(b) | 181,756 | 3,745,991 | ||||||
| Housewares & Specialties–0.54% | ||||||||
Jarden Corp.(b) | 110,484 | 4,745,288 | ||||||
| Human Resource & Employment Services–0.91% | ||||||||
TrueBlue, Inc.(b) | 329,788 | 8,020,444 | ||||||
| Industrial Conglomerates–1.09% | ||||||||
Carlisle Cos. Inc. | 144,056 | 9,594,130 | ||||||
| Industrial Machinery–2.77% | ||||||||
Actuant Corp.–Class A | 124,807 | 4,458,106 | ||||||
EnPro Industries, Inc.(b) | 140,352 | 7,997,257 | ||||||
Thermon Group Holdings Inc.(b) | 140,016 | 2,898,331 | ||||||
TriMas Corp.(b) | 138,887 | 4,880,489 | ||||||
Woodward Inc. | 109,763 | 4,232,462 | ||||||
| 24,466,645 | ||||||||
| Internet Software & Services–3.01% | ||||||||
CoStar Group Inc.(b) | 37,811 | 5,615,312 | ||||||
Dealertrack Technologies Inc.(b) | 200,229 | 7,927,066 | ||||||
| Shares | Value | |||||||
| Internet Software & Services–(continued) | ||||||||
j2 Global, Inc.(c) | 141,896 | $ | 6,986,959 | |||||
Web.com Group Inc.(b) | 215,736 | 6,088,070 | ||||||
| 26,617,407 | ||||||||
| Investment Banking & Brokerage–1.85% | ||||||||
Evercore Partners Inc.–Class A | 191,706 | 8,548,170 | ||||||
Stifel Financial Corp.(b) | 194,578 | 7,787,012 | ||||||
| 16,335,182 | ||||||||
| IT Consulting & Other Services–0.93% | ||||||||
InterXion Holding N.V. (Netherlands)(b) | 342,787 | 8,202,893 | ||||||
| Leisure Products–0.69% | ||||||||
Brunswick Corp. | 166,772 | 6,063,830 | ||||||
| Life Sciences Tools & Services–3.15% | ||||||||
Bruker Corp.(b) | 401,292 | 8,041,892 | ||||||
Fluidigm Corp.(b) | 339,977 | 6,955,929 | ||||||
PAREXEL International Corp.(b) | 124,474 | 5,779,328 | ||||||
Techne Corp. | 90,471 | 7,012,407 | ||||||
| 27,789,556 | ||||||||
| Managed Health Care–1.09% | ||||||||
Centene Corp.(b) | 168,977 | 9,657,036 | ||||||
| Marine–0.63% | ||||||||
Kirby Corp.(b) | 69,255 | 5,570,180 | ||||||
| Metal & Glass Containers–0.48% | ||||||||
Greif Inc.–Class A | 78,340 | 4,220,176 | ||||||
| Movies & Entertainment–1.80% | ||||||||
Cinemark Holdings, Inc. | 325,532 | 9,593,428 | ||||||
Lions Gate Entertainment Corp.(b)(c) | 180,888 | 6,332,889 | ||||||
| 15,926,317 | ||||||||
| Office Services & Supplies–1.54% | ||||||||
Herman Miller, Inc. | 206,064 | 5,248,450 | ||||||
Steelcase Inc.–Class A | 572,261 | 8,309,230 | ||||||
| 13,557,680 | ||||||||
| Oil & Gas Drilling–0.51% | ||||||||
Atwood Oceanics, Inc.(b) | 80,644 | 4,490,258 | ||||||
| Oil & Gas Equipment & Services–0.90% | ||||||||
Dresser-Rand Group, Inc.(b) | 129,615 | 7,898,738 | ||||||
| Oil & Gas Exploration & Production–3.30% | ||||||||
Athlon Energy Inc.(b) | 119,325 | 3,317,235 | ||||||
Gulfport Energy Corp.(b) | 158,377 | 9,344,243 | ||||||
Kodiak Oil & Gas Corp.(b) | 792,442 | 7,916,496 | ||||||
Oasis Petroleum Inc.(b) | 219,001 | 8,584,839 | ||||||
| 29,162,813 | ||||||||
| Packaged Foods & Meats–3.35% | ||||||||
Annie’s, Inc.(b)(c) | 130,836 | 6,009,297 | ||||||
B&G Foods Inc. | 222,888 | 7,549,216 | ||||||
Hain Celestial Group, Inc. (The)(b) | 30,492 | 2,493,636 | ||||||
See accompanying Notes to Financial Statements which are an integral part of the financial statements.
10 Invesco Small Cap Discovery Fund
| Shares | Value | |||||||
| Packaged Foods & Meats–(continued) | ||||||||
TreeHouse Foods, Inc.(b) | 85,259 | $ | 5,544,393 | |||||
WhiteWave Foods Co.–Class A(b)(c) | 417,839 | 7,989,082 | ||||||
| 29,585,624 | ||||||||
| Regional Banks–2.64% | ||||||||
East West Bancorp, Inc. | 292,848 | 8,559,947 | ||||||
Signature Bank(b) | 84,670 | 7,427,253 | ||||||
SVB Financial Group(b) | 88,188 | 7,301,966 | ||||||
| 23,289,166 | ||||||||
| Restaurants–1.38% | ||||||||
BJ’s Restaurants Inc.(b) | 144,974 | 4,528,988 | ||||||
Noodles & Co.(b)(c) | 21,885 | 999,269 | ||||||
Papa John’s International, Inc. | 97,589 | 6,648,738 | ||||||
| 12,176,995 | ||||||||
| Semiconductor Equipment–0.88% | ||||||||
Teradyne, Inc.(b)(c) | 503,226 | 7,724,519 | ||||||
| Semiconductors–2.69% | ||||||||
Cavium Inc.(b) | 124,120 | 4,712,836 | ||||||
Lattice Semiconductor Corp.(b) | 571,867 | 2,722,087 | ||||||
Microsemi Corp.(b) | 363,802 | 9,364,264 | ||||||
Semtech Corp.(b) | 232,628 | 6,913,704 | ||||||
| 23,712,891 | ||||||||
| Specialty Chemicals–2.47% | ||||||||
Cytec Industries Inc. | 93,714 | 7,007,933 | ||||||
PolyOne Corp. | 271,330 | 7,331,337 | ||||||
Rockwood Holdings Inc. | 116,591 | 7,445,501 | ||||||
| 21,784,771 | ||||||||
| Specialty Stores–1.13% | ||||||||
Tractor Supply Co. | 65,054 | 7,960,658 | ||||||
Vitamin Shoppe, Inc.(b) | 46,842 | 1,972,985 | ||||||
| 9,933,643 | ||||||||
| Steel–0.86% | ||||||||
Commercial Metals Co. | 510,685 | 7,598,993 | ||||||
| Shares | Value | |||||||
| Systems Software–1.98% | ||||||||
CommVault Systems, Inc.(b) | 86,452 | $ | 7,247,271 | |||||
Fortinet Inc.(b) | 290,912 | 5,760,058 | ||||||
MICROS Systems, Inc.(b)(c) | 91,365 | 4,467,748 | ||||||
| 17,475,077 | ||||||||
| Trading Companies & Distributors–1.30% | ||||||||
MRC Global Inc.(b) | 200,227 | 5,255,959 | ||||||
WESCO International, Inc.(b)(c) | 84,811 | 6,256,507 | ||||||
| 11,512,466 | ||||||||
| Trucking–1.55% | ||||||||
Avis Budget Group, Inc.(b) | 97,600 | 2,612,752 | ||||||
Knight Transportation, Inc. | 256,724 | 4,179,467 | ||||||
Werner Enterprises, Inc. | 300,156 | 6,915,594 | ||||||
| 13,707,813 | ||||||||
| Wireless Telecommunication Services–0.33% | ||||||||
NII Holdings Inc.(b)(c) | 491,933 | 2,941,759 | ||||||
Total Common Stocks |
| 846,912,258 | ||||||
Money Market Funds–3.57% | ||||||||
Liquid Assets Portfolio–Institutional Class(d) | 15,742,237 | 15,742,237 | ||||||
Premier Portfolio–Institutional Class(d) | 15,742,237 | 15,742,237 | ||||||
Total Money Market Funds |
| 31,484,474 | ||||||
TOTAL INVESTMENTS (excluding investments purchased with cash collateral from securities on loan)–99.52% (Cost $657,711,710) |
| 878,396,732 | ||||||
Investments Purchased with Cash Collateral from Securities on Loan |
| |||||||
Money Market Funds–4.27% |
| |||||||
Liquid Assets Portfolio–Institutional Class | 37,699,845 | 37,699,845 | ||||||
TOTAL INVESTMENTS–103.79% |
| 916,096,577 | ||||||
OTHER ASSETS LESS LIABILITIES–(3.79)% |
| (33,471,020 | ) | |||||
NET ASSETS–100.00% |
| $ | 882,625,557 | |||||
Notes to Schedule of Investments:
| (a) | Industry and/or sector classifications used in this report are generally according to the Global Industry Classification Standard, which was developed by and is the exclusive property and a service mark of MSCI Inc. and Standard & Poor’s. |
| (b) | Non-income producing security. |
| (c) | All or a portion of this security was out on loan at August 31, 2013. |
| (d) | The money market fund and the Fund are affiliated by having the same investment adviser. |
| (e) | The security has been segregated to satisfy the commitment to return the cash collateral received in securities lending transactions upon the borrower’s return of the securities loaned. See Note 1I. |
See accompanying Notes to Financial Statements which are an integral part of the financial statements.
11 Invesco Small Cap Discovery Fund
Statement of Assets and Liabilities
August 31, 2013
Assets: | ||||
Investments, at value (Cost $626,227,236)* | $ | 846,912,258 | ||
Investments in affiliated money market funds, at value and cost | 69,184,319 | |||
Total investments, at value (Cost $695,411,555) | 916,096,577 | |||
Receivable for: | ||||
Investments sold | 4,821,702 | |||
Fund shares sold | 1,364,053 | |||
Dividends | 350,168 | |||
Investment for trustee deferred compensation and retirement plans | 22,154 | |||
Other assets | 17,663 | |||
Total assets | 922,672,317 | |||
Liabilities: | ||||
Payable for: | ||||
Fund shares reacquired | 1,473,364 | |||
Collateral upon return of securities loaned | 37,699,845 | |||
Accrued fees to affiliates | 684,065 | |||
Accrued trustees’ and officers’ fees and benefits | 5,816 | |||
Accrued other operating expenses | 92,074 | |||
Trustee deferred compensation and retirement plans | 91,596 | |||
Total liabilities | 40,046,760 | |||
Net assets applicable to shares outstanding | $ | 882,625,557 | ||
Net assets consist of: | ||||
Shares of beneficial interest | $ | 566,639,639 | ||
Undistributed net investment income (loss) | (5,110,520 | ) | ||
Undistributed net realized gain | 100,411,416 | |||
Net unrealized appreciation | 220,685,022 | |||
| $ | 882,625,557 | |||
Net Assets: | ||||
Class A | $ | 540,978,589 | ||
Class B | $ | 12,553,738 | ||
Class C | $ | 53,559,805 | ||
Class Y | $ | 163,072,122 | ||
Class R5 | $ | 44,036,552 | ||
Class R6 | $ | 68,424,751 | ||
Shares outstanding, $0.01 par value per share, |
| |||
Class A | 44,326,140 | |||
Class B | 1,116,018 | |||
Class C | 4,945,739 | |||
Class Y | 13,040,958 | |||
Class R5 | 3,516,837 | |||
Class R6 | 5,463,491 | |||
Class A: | ||||
Net asset value per share | $ | 12.20 | ||
Maximum offering price per share | ||||
(Net asset value of $12.20 ¸ 94.50%) | $ | 12.91 | ||
Class B: | ||||
Net asset value and offering price per share | $ | 11.25 | ||
Class C: | ||||
Net asset value and offering price per share | $ | 10.83 | ||
Class Y: | ||||
Net asset value and offering price per share | $ | 12.50 | ||
Class R5: | ||||
Net asset value and offering price per share | $ | 12.52 | ||
Class R6: | ||||
Net asset value and offering price per share | $ | 12.52 | ||
| * | At August 31, 2013, securities with an aggregate value of $36,592,762 were on loan to brokers. |
See accompanying Notes to Financial Statements which are an integral part of the financial statements.
12 Invesco Small Cap Discovery Fund
Statement of Operations
For the year ended August 31, 2013
Investment income: |
| |||
Dividends (net of foreign withholding taxes of $46,694) | $ | 4,861,833 | ||
Dividends from affiliated money market funds (includes securities lending income of $124,927) | 183,310 | |||
Total investment income | 5,045,143 | |||
Expenses: | ||||
Advisory fees | 6,592,670 | |||
Administrative services fees | 218,879 | |||
Custodian fees | 30,488 | |||
Distribution fees: | ||||
Class A | 1,411,002 | |||
Class B | 32,345 | |||
Class C | 497,251 | |||
Transfer agent fees — A, B, C and Y | 1,881,616 | |||
Transfer agent fees — R5 | 6,212 | |||
Transfer agent fees — R6 | 363 | |||
Trustees’ and officers’ fees and benefits | 50,952 | |||
Other | 288,501 | |||
Total expenses | 11,010,279 | |||
Less: Fees waived and expense offset arrangement(s) | (81,826 | ) | ||
Net expenses | 10,928,453 | |||
Net investment income (loss) | (5,883,310 | ) | ||
Realized and unrealized gain from: | ||||
Net realized gain from investment securities | 129,642,296 | |||
Change in net unrealized appreciation of investment securities | 67,156,020 | |||
Net realized and unrealized gain | 196,798,316 | |||
Net increase in net assets resulting from operations | $ | 190,915,006 | ||
See accompanying Notes to Financial Statements which are an integral part of the financial statements.
13 Invesco Small Cap Discovery Fund
Statement of Changes in Net Assets
For the years ended August 31, 2013 and 2012
| 2013 | 2012 | |||||||
Operations: | ||||||||
Net investment income (loss) | $ | (5,883,310 | ) | $ | (7,991,062 | ) | ||
Net realized gain | 129,642,296 | 69,161,444 | ||||||
Change in net unrealized appreciation | 67,156,020 | 87,063,026 | ||||||
Net increase in net assets resulting from operations | 190,915,006 | 148,233,408 | ||||||
Distributions to shareholders from net realized gains: | ||||||||
Class A | (58,971,398 | ) | (81,968,055 | ) | ||||
Class B | (1,402,434 | ) | (1,718,916 | ) | ||||
Class C | (5,257,156 | ) | (5,413,962 | ) | ||||
Class Y | (19,373,899 | ) | (21,572,101 | ) | ||||
Class R5 | (981 | ) | — | |||||
Class R6 | (981 | ) | — | |||||
Total distributions from net realized gains | (85,006,849 | ) | (110,673,034 | ) | ||||
Share transactions–net: | ||||||||
Class A | (135,546,440 | ) | (242,910,836 | ) | ||||
Class B | (2,685,853 | ) | (3,476,255 | ) | ||||
Class C | (469,868 | ) | (3,443,087 | ) | ||||
Class Y | (68,806,533 | ) | (34,627,450 | ) | ||||
Class R5 | 43,871,511 | — | ||||||
Class R6 | 64,674,752 | — | ||||||
Net increase (decrease) in net assets resulting from share transactions | (98,962,431 | ) | (284,457,628 | ) | ||||
Net increase in net assets | 6,945,726 | (246,897,254 | ) | |||||
Net assets: | ||||||||
Beginning of year | 875,679,831 | 1,122,577,085 | ||||||
End of year (includes undistributed net investment income (loss) of $(5,110,520) and $(5,015,678), respectively) | $ | 882,625,557 | $ | 875,679,831 | ||||
Notes to Financial Statements
August 31, 2013
NOTE 1—Significant Accounting Policies
Invesco Small Cap Discovery Fund (the “Fund”) is a series portfolio of AIM Counselor Series Trust (Invesco Counselor Series Trust) (the “Trust”). The Trust is a Delaware statutory trust registered under the Investment Company Act of 1940, as amended (the “1940 Act”), as an open-end series management investment company consisting of twelve separate portfolios, each authorized to issue an unlimited number of shares of beneficial interest. The assets, liabilities and operations of each portfolio are accounted for separately. Information presented in these financial statements pertains only to the Fund. Matters affecting each portfolio or class will be voted on exclusively by the shareholders of such portfolio or class.
The Fund’s investment objective is to seek capital appreciation.
The Fund currently consists of six different classes of shares: Class A, Class B, Class C, Class Y, Class R5 and Class R6. Class A shares are sold with a front-end sales charge unless certain waiver criteria are met and under certain circumstances load waived shares may be subject to contingent deferred sales charges (“CDSC”). Class C shares are sold with a CDSC. Class Y, Class R5 and Class R6 shares are sold at net asset value. Effective November 30, 2010, new or additional investments in Class B shares are no longer permitted. Existing shareholders of Class B shares may continue to reinvest dividends and capital gains distributions in Class B shares until they convert to Class A shares. Also, shareholders in Class B shares will be able to exchange those shares for Class B shares of other Invesco Funds offering such shares until they convert to Class A shares. Generally, Class B shares will automatically convert to Class A shares on or about the month-end, which is at least eight years after the date of purchase. Redemption of Class B shares prior to the conversion date will be subject to a CDSC.
The following is a summary of the significant accounting policies followed by the Fund in the preparation of its financial statements.
| A. | Security Valuations — Securities, including restricted securities, are valued according to the following policy. |
A security listed or traded on an exchange (except convertible bonds) is valued at its last sales price or official closing price as of the close of the customary trading session on the exchange where the security is principally traded, or lacking any sales or official closing price on a particular day, the security may be valued at the closing bid price on that day. Securities traded in the over-the-counter market are valued based on prices furnished by independent pricing services or market makers. When such securities are valued by an independent pricing service they may be considered fair valued. Futures contracts are valued at the final settlement price set by an exchange on which they are principally traded. Listed options are valued at the mean between the last bid and ask prices from the exchange on which they are principally traded. Options not listed on
14 Invesco Small Cap Discovery Fund
an exchange are valued by an independent source at the mean between the last bid and ask prices. For purposes of determining net asset value per share, futures and option contracts generally are valued 15 minutes after the close of the customary trading session of the New York Stock Exchange (“NYSE”).
Investments in open-end and closed-end registered investment companies that do not trade on an exchange are valued at the end of day net asset value per share. Investments in open-end and closed-end registered investment companies that trade on an exchange are valued at the last sales price or official closing price as of the close of the customary trading session on the exchange where the security is principally traded.
Debt obligations (including convertible bonds) and unlisted equities are fair valued using an evaluated quote provided by an independent pricing service. Evaluated quotes provided by the pricing service may be determined without exclusive reliance on quoted prices, and may reflect appropriate factors such as institution-size trading in similar groups of securities, developments related to specific securities, dividend rate (for unlisted equities), yield (for debt obligations), quality, type of issue, coupon rate (for debt obligations), maturity (for debt obligations), individual trading characteristics and other market data. Debt obligations are subject to interest rate and credit risks. In addition, all debt obligations involve some risk of default with respect to interest and/or principal payments.
Foreign securities’ (including foreign exchange contracts) prices are converted into U.S. dollar amounts using the applicable exchange rates as of the close of the NYSE. If market quotations are available and reliable for foreign exchange-traded equity securities, the securities will be valued at the market quotations. Because trading hours for certain foreign securities end before the close of the NYSE, closing market quotations may become unreliable. If between the time trading ends on a particular security and the close of the customary trading session on the NYSE, events occur that the Adviser determines are significant and make the closing price unreliable, the Fund may fair value the security. If the event is likely to have affected the closing price of the security, the security will be valued at fair value in good faith using procedures approved by the Board of Trustees. Adjustments to closing prices to reflect fair value may also be based on a screening process of an independent pricing service to indicate the degree of certainty, based on historical data, that the closing price in the principal market where a foreign security trades is not the current value as of the close of the NYSE. Foreign securities’ prices meeting the approved degree of certainty that the price is not reflective of current value will be priced at the indication of fair value from the independent pricing service. Multiple factors may be considered by the independent pricing service in determining adjustments to reflect fair value and may include information relating to sector indices, American Depositary Receipts and domestic and foreign index futures. Foreign securities may have additional risks including exchange rate changes, potential for sharply devalued currencies and high inflation, political and economic upheaval, the relative lack of issuer information, relatively low market liquidity and the potential lack of strict financial and accounting controls and standards.
Securities for which market prices are not provided by any of the above methods may be valued based upon quotes furnished by independent sources. The last bid price may be used to value equity securities. The mean between the last bid and asked prices is used to value debt obligations, including corporate loans.
Securities for which market quotations are not readily available or became unreliable are valued at fair value as determined in good faith by or under the supervision of the Trust’s officers following procedures approved by the Board of Trustees. Issuer specific events, market trends, bid/ask quotes of brokers and information providers and other market data may be reviewed in the course of making a good faith determination of a security’s fair value.
Valuations change in response to many factors including the historical and prospective earnings of the issuer, the value of the issuer’s assets, general economic conditions, interest rates, investor perceptions and market liquidity. Because of the inherent uncertainties of valuation, the values reflected in the financial statements may materially differ from the value received upon actual sale of those investments.
| B. | Securities Transactions and Investment Income — Securities transactions are accounted for on a trade date basis. Realized gains or losses on sales are computed on the basis of specific identification of the securities sold. Interest income is recorded on the accrual basis from settlement date. Dividend income (net of withholding tax, if any) is recorded on the ex-dividend date. |
The Fund may periodically participate in litigation related to Fund investments. As such, the Fund may receive proceeds from litigation settlements. Any proceeds received are included in the Statement of Operations as realized gain (loss) for investments no longer held and as unrealized gain (loss) for investments still held.
Brokerage commissions and mark ups are considered transaction costs and are recorded as an increase to the cost basis of securities purchased and/or a reduction of proceeds on a sale of securities. Such transaction costs are included in the determination of net realized and unrealized gain (loss) from investment securities reported in the Statement of Operations and the Statement of Changes in Net Assets and the net realized and unrealized gains (losses) on securities per share in the Financial Highlights. Transaction costs are included in the calculation of the Fund’s net asset value and, accordingly, they reduce the Fund’s total returns. These transaction costs are not considered operating expenses and are not reflected in net investment income reported in the Statement of Operations and Statement of Changes in Net Assets, or the net investment income per share and ratios of expenses and net investment income reported in the Financial Highlights, nor are they limited by any expense limitation arrangements between the Fund and the investment adviser.
The Fund allocates income and realized and unrealized capital gains and losses to a class based on the relative net assets of each class.
| C. | Country Determination — For the purposes of making investment selection decisions and presentation in the Schedule of Investments, the investment adviser may determine the country in which an issuer is located and/or credit risk exposure based on various factors. These factors include the laws of the country under which the issuer is organized, where the issuer maintains a principal office, the country in which the issuer derives 50% or more of its total revenues and the country that has the primary market for the issuer’s securities, as well as other criteria. Among the other criteria that may be evaluated for making this determination are the country in which the issuer maintains 50% or more of its assets, the type of security, financial guarantees and enhancements, the nature of the collateral and the sponsor organization. Country of issuer and/or credit risk exposure has been determined to be the United States of America, unless otherwise noted. |
| D. | Distributions — Distributions from income and net realized capital gain, if any, are generally declared and paid annually and recorded on the ex-dividend date. The Fund may elect to treat a portion of the proceeds from redemptions as distributions for federal income tax purposes. |
| E. | Federal Income Taxes — The Fund intends to comply with the requirements of Subchapter M of the Internal Revenue Code of 1986, as amended (the “Internal Revenue Code”), necessary to qualify as a regulated investment company and to distribute substantially all of the Fund’s taxable earnings to shareholders. As such, the Fund will not be subject to federal income taxes on otherwise taxable income (including net realized capital gain) that is distributed to shareholders. Therefore, no provision for federal income taxes is recorded in the financial statements. |
15 Invesco Small Cap Discovery Fund
The Fund files tax returns in the U.S. Federal jurisdiction and certain other jurisdictions. Generally, the Fund is subject to examinations by such taxing authorities for up to three years after the filing of the return for the tax period.
| F. | Expenses — Fees provided for under the Rule 12b-1 plan of a particular class of the Fund are charged to the operations of such class. Transfer agency fees and expenses and other shareholder recordkeeping fees and expenses attributable to Class R5 and Class R6 are allocated to each share class based on relative net assets. Sub-accounting fees attributable to Class R5 are charged to the operations of the class. Transfer agency fees and expenses and other shareholder recordkeeping fees and expenses relating to all other classes are allocated among those classes based on relative net assets. All other expenses are allocated among the classes based on relative net assets. Prior to June 1, 2010, incremental transfer agency fees which were unique to each class of shares were charged to the operations of such class. |
| G. | Accounting Estimates — The preparation of financial statements in conformity with accounting principles generally accepted in the United States of America (“GAAP”) requires management to make estimates and assumptions that affect the reported amounts of assets and liabilities at the date of the financial statements and the reported amounts of revenues and expenses during the reporting period including estimates and assumptions related to taxation. Actual results could differ from those estimates by a significant amount. In addition, the Fund monitors for material events or transactions that may occur or become known after the period-end date and before the date the financial statements are released to print. |
| H. | Indemnifications — Under the Trust’s organizational documents, each Trustee, officer, employee or other agent of the Trust is indemnified against certain liabilities that may arise out of the performance of their duties to the Fund. Additionally, in the normal course of business, the Fund enters into contracts, including the Fund’s servicing agreements, that contain a variety of indemnification clauses. The Fund’s maximum exposure under these arrangements is unknown as this would involve future claims that may be made against the Fund that have not yet occurred. The risk of material loss as a result of such indemnification claims is considered remote. |
| I. | Securities Lending — The Fund may lend portfolio securities having a market value up to one-third of the Fund’s total assets. Such loans are secured by collateral equal to no less than the market value of the loaned securities determined daily by the securities lending provider. Such collateral will be cash or debt securities issued or guaranteed by the U.S. Government or any of its sponsored agencies. Cash collateral received in connection with these loans is invested in short-term money market instruments or affiliated money market funds and is shown as such on the Schedule of Investments. It is the Fund’s policy to obtain additional collateral from or return excess collateral to the borrower by the end of the next business day, following the valuation date of the securities loaned. Therefore, the value of the collateral held may be temporarily less than the value of the securities on loan. Lending securities entails a risk of loss to the Fund if and to the extent that the market value of the securities loaned were to increase and the borrower did not increase the collateral accordingly, and the borrower fails to return the securities. Upon the failure of the borrower to return the securities, collateral may be liquidated and the securities may be purchased on the open market to replace the loaned securities. The Fund could experience delays and costs in gaining access to the collateral. The Fund bears the risk of any deficiency in the amount of the collateral available for return to the borrower due to any loss on the collateral invested. Dividends received on cash collateral investments for securities lending transactions, which are net of compensation to counterparties, is included in Dividends from affiliated money market funds on the Statement of Operations. The aggregate value of securities out on loan is shown as a footnote on the Statement of Assets and Liabilities, if any. |
NOTE 2—Advisory Fees and Other Fees Paid to Affiliates
The Trust has entered into a master investment advisory agreement with Invesco Advisers, Inc. (the “Adviser” or “Invesco”). Under the terms of the investment advisory agreement, the Fund pays an advisory fee to the Adviser based on the annual rate of the Fund’s average daily net assets as follows:
| Average Daily Net Assets | Rate | |||
First $500 million | 0.80% | |||
Next $500 million | 0.75% | |||
Over $1.0 billion | 0.70% | |||
Under the terms of a master sub-advisory agreement between the Adviser and each of Invesco Asset Management Deutschland GmbH, Invesco Asset Management Limited, Invesco Asset Management (Japan) Limited, Invesco Australia Limited, Invesco Hong Kong Limited, Invesco Senior Secured Management, Inc. and Invesco Canada Ltd. (collectively, the “Affiliated Sub-Advisers”) the Adviser, not the Fund, may pay 40% of the fees paid to the Adviser to any such Affiliated Sub-Adviser(s) that provide(s) discretionary investment management services to the Fund based on the percentage of assets allocated to such Sub-Adviser(s).
The Adviser has contractually agreed, through June 30, 2014, to waive advisory fees and/or reimburse expenses to the extent necessary to limit total annual fund operating expenses after fee waiver and/or expense reimbursement (excluding certain items discussed below) of Class A, Class B, Class C, Class Y, Class R5 and Class R6 shares to 2.00%, 2.75%, 2.75%, 1.75%, 1.75% and 1.75% of average daily net assets, respectively. In determining the Adviser’s obligation to waive advisory fees and/or reimburse expenses, the following expenses are not taken into account, and could cause total annual fund operating expenses after fee waiver and/or reimbursement to exceed the numbers reflected above: (1) interest; (2) taxes; (3) dividend expense on short sales; (4) extraordinary or non-routine items, including litigation expenses; and (5) expenses that the Fund has incurred but did not actually pay because of an expense offset arrangement. Unless the Board of the Trustees and Invesco mutually agree to amend or continue the fee waiver agreement, it will terminate on June 30, 2014. The Advisor did not waive fees and/or reimburse expenses during the period under this expense limitation.
The Adviser has contractually agreed, through at least June 30, 2014, to waive the advisory fee payable by the Fund in an amount equal to 100% of the net advisory fees the Adviser receives from the affiliated money market funds on investments by the Fund of uninvested cash (excluding investments of cash collateral from securities lending) in such affiliated money market funds.
For the year ended August 31, 2013, the Adviser waived advisory fees of $80,663.
The Trust has entered into a master administrative services agreement with Invesco pursuant to which the Fund has agreed to pay Invesco for certain administrative costs incurred in providing accounting services to the Fund. For the year ended August 31, 2013, expenses incurred under the agreement are shown in the Statement of Operations as Administrative services fees.
16 Invesco Small Cap Discovery Fund
The Trust has entered into a transfer agency and service agreement with Invesco Investment Services, Inc. (“IIS”) pursuant to which the Fund has agreed to pay IIS a fee for providing transfer agency and shareholder services to the Fund and reimburse IIS for certain expenses incurred by IIS in the course of providing such services. IIS may make payments to intermediaries that provide omnibus account services, sub-accounting services and/or networking services. All fees payable by IIS to intermediaries that provide omnibus account services or sub-accounting are charged back to the Fund, subject to certain limitations approved by the Trust’s Board of Trustees. For the year ended August 31, 2013, the expenses incurred under the agreement are shown in the Statement of Operations as Transfer agent fees.
Shares of the Fund are distributed by Invesco Distributors, Inc. (“IDI”). The Fund has adopted a distribution plan pursuant to Rule 12b-1 under the 1940 Act, and a service plan (collectively, the “Plans”) for Class A shares, Class B shares and Class C shares to compensate IDI for the sale, distribution, shareholder servicing and maintenance of shareholder accounts for these shares. Under the Plans, the Fund will incur annual fees of up to 0.25% of Class A average daily net assets and up to 1.00% each of Class B and Class C average daily net assets.
With respect to Class B and Class C shares, the Fund is authorized to reimburse in future years any distribution related expenses that exceed the maximum annual reimbursement rate for such class, so long as such reimbursement does not cause the Fund to exceed the Class B and Class C maximum annual reimbursement rate, respectively. With respect to Class A shares, distribution related expenses that exceed the maximum annual reimbursement rate for such class are not carried forward to future years and the Fund will not reimburse IDI for any such expenses.
For the year ended August 31, 2013, expenses incurred under these agreements are shown in the Statement of Operations as Distribution fees.
Front-end sales commissions and CDSC (collectively, the “sales charges”) are not recorded as expenses of the Fund. Front-end sales commissions are deducted from proceeds from the sales of Fund shares prior to investment in Class A shares of the Fund. CDSC are deducted from redemption proceeds prior to remittance to the shareholder. During the year ended August 31, 2013, IDI advised the Fund that IDI retained $82,871 in front-end sales commissions from the sale of Class A shares and $2,060, $12,339 and $1,540 from Class A, Class B and Class C shares, respectively, for CDSC imposed on redemptions by shareholders.
For the year ended August 31, 2013, the Fund incurred $28,430 in brokerage commissions with Invesco Capital Markets, Inc., an affiliate of the Adviser and IDI, for portfolio transactions executed on behalf of the Fund.
Certain officers and trustees of the Trust are officers and directors of the Adviser, IIS and/or IDI.
NOTE 3—Additional Valuation Information
GAAP defines fair value as the price that would be received to sell an asset or paid to transfer a liability in an orderly transaction between market participants at the measurement date, under current market conditions. GAAP establishes a hierarchy that prioritizes the inputs to valuation methods, giving the highest priority to readily available unadjusted quoted prices in an active market for identical assets (Level 1) and the lowest priority to significant unobservable inputs (Level 3), generally when market prices are not readily available or are unreliable. Based on the valuation inputs, the securities or other investments are tiered into one of three levels. Changes in valuation methods may result in transfers in or out of an investment’s assigned level:
| Level 1 — | Prices are determined using quoted prices in an active market for identical assets. |
| Level 2 — | Prices are determined using other significant observable inputs. Observable inputs are inputs that other market participants may use in pricing a security. These may include quoted prices for similar securities, interest rates, prepayment speeds, credit risk, yield curves, loss severities, default rates, discount rates, volatilities and others. |
| Level 3 — | Prices are determined using significant unobservable inputs. In situations where quoted prices or observable inputs are unavailable (for example, when there is little or no market activity for an investment at the end of the period), unobservable inputs may be used. Unobservable inputs reflect the Fund’s own assumptions about the factors market participants would use in determining fair value of the securities or instruments and would be based on the best available information. |
As of August 31, 2013, all of the securities in this Fund were valued based on Level 1 inputs (see the Schedule of Investments for security categories). The level assigned to the securities valuations may not be an indication of the risk or liquidity associated with investing in those securities. Because of the inherent uncertainties of valuation, the values reflected in the financial statements may materially differ from the value received upon actual sale of those investments.
NOTE 4—Security Transactions with Affiliated Funds
The Fund is permitted to purchase or sell securities from or to certain other Invesco Funds under specified conditions outlined in procedures adopted by the Board of Trustees of the Trust. The procedures have been designed to ensure that any purchase or sale of securities by the Fund from or to another fund or portfolio that is or could be considered an affiliate by virtue of having a common investment adviser (or affiliated investment advisers), common Trustees and/or common officers complies with Rule 17a-7 of the 1940 Act. Further, as defined under the procedures, each transaction is effected at the current market price. Pursuant to these procedures, for the year ended August 31, 2013, the Fund engaged in securities purchases of $1,866,077.
NOTE 5—Expense Offset Arrangement(s)
The expense offset arrangement is comprised of transfer agency credits which result from balances in Demand Deposit Accounts (DDA) used by the transfer agent for clearing shareholder transactions. For the year ended August 31, 2013, the Fund received credits from this arrangement, which resulted in the reduction of the Fund’s total expenses of $1,163.
17 Invesco Small Cap Discovery Fund
NOTE 6—Trustees’ and Officers’ Fees and Benefits
“Trustees’ and Officers’ Fees and Benefits” include amounts accrued by the Fund to pay remuneration to certain Trustees and Officers of the Fund. Trustees have the option to defer compensation payable by the Fund, and “Trustees’ and Officers’ Fees and Benefits” also include amounts accrued by the Fund to fund such deferred compensation amounts. Those Trustees who defer compensation have the option to select various Invesco Funds in which their deferral accounts shall be deemed to be invested. Finally, certain current Trustees are eligible to participate in a retirement plan that provides for benefits to be paid upon retirement to Trustees over a period of time based on the number of years of service. The Fund may have certain former Trustees who also participate in a retirement plan and receive benefits under such plan. “Trustees’ and Officers’ Fees and Benefits” include amounts accrued by the Fund to fund such retirement benefits. Obligations under the deferred compensation and retirement plans represent unsecured claims against the general assets of the Fund.
NOTE 7—Cash Balances
The Fund is permitted to temporarily carry a negative or overdrawn balance in its account with State Street Bank and Trust Company, the custodian bank. Such balances, if any at period end, are shown in the Statement of Assets and Liabilities under the payable caption Amount due custodian. To compensate the custodian bank for such overdrafts, the overdrawn Fund may either (1) leave funds as a compensating balance in the account so the custodian bank can be compensated by earning the additional interest; or (2) compensate by paying the custodian bank at a rate agreed upon by the custodian bank and Invesco, not to exceed the contractually agreed upon rate.
NOTE 8—Distributions to Shareholders and Tax Components of Net Assets
Tax Character of Distributions to Shareholders Paid During the Years Ended August 31, 2013 and 2012:
| 2013 | 2012 | |||||||
Ordinary income | $ | — | $ | 38,183,752 | ||||
Long-term capital gain | 85,006,849 | 72,489,282 | ||||||
Total distributions | $ | 85,006,849 | $ | 110,673,034 | ||||
Tax Components of Net Assets at Period-End:
| 2013 | ||||
Undistributed ordinary income | $ | 26,321,532 | ||
Undistributed long-term gain | 76,763,091 | |||
Net unrealized appreciation — investments | 218,011,813 | |||
Temporary book/tax differences | (88,574 | ) | ||
Late-Year ordinary loss deferral | (5,021,944 | ) | ||
Shares of beneficial interest | 566,639,639 | |||
Total net assets | $ | 882,625,557 | ||
The difference between book-basis and tax-basis unrealized appreciation (depreciation) is due to differences in the timing of recognition of gains and losses on investments for tax and book purposes. The Fund’s net unrealized appreciation difference is attributable primarily to wash sales.
The temporary book/tax differences are a result of timing differences between book and tax recognition of income and/or expenses. The Fund’s temporary book/tax differences are the result of the trustee deferral of compensation and retirement plan benefits.
Capital loss carryforward is calculated and reported as of a specific date. Results of transactions and other activity after that date may affect the amount of capital loss carryforward actually available for the Trust to utilize. The Regulated Investment Company Modernization Act of 2010 eliminated the eight-year carryover period for capital losses that arise in taxable years beginning after its enactment date of December 22, 2010. Consequently, these capital losses can be carried forward for an unlimited period. However, capital losses with an expiration period may not be used to offset capital gains until all net capital losses without an expiration date have been utilized. Additionally, post-enactment capital loss carryovers will retain their character as either short-term or long-term capital losses instead of as short-term capital losses as under prior law. The ability to utilize capital loss carryforward in the future may be limited under the Internal Revenue Code and related regulations based on the results of future transactions.
The Fund does not have a capital loss carryforward as of August 31, 2013.
NOTE 9—Investment Securities
The aggregate amount of investment securities (other than short-term securities, U.S. Treasury obligations and money market funds, if any) purchased and sold by the Fund during the year ended August 31, 2013 was $555,020,841 and $724,789,704, respectively. Cost of investments on a tax basis includes the adjustments for financial reporting purposes as of the most recently completed federal income tax reporting period-end.
| Unrealized Appreciation (Depreciation) of Investment Securities on a Tax Basis | ||||
Aggregate unrealized appreciation of investment securities | $ | 228,600,335 | ||
Aggregate unrealized (depreciation) of investment securities | (10,588,522 | ) | ||
Net unrealized appreciation of investment securities | $ | 218,011,813 | ||
Cost of investments for tax purposes is $698,084,764.
18 Invesco Small Cap Discovery Fund
NOTE 10—Reclassification of Permanent Differences
Primarily as a result of differing book/tax treatment of net operating losses, on August 31, 2013, undistributed net investment income (loss) was increased by $5,788,468, undistributed net realized gain was decreased by $5,788,087 and shares of beneficial interest was decreased by $381. This reclassification had no effect on the net assets of the Fund.
NOTE 11—Share Information
| Summary of Share Activity | ||||||||||||||||
| Years ended August 31, | ||||||||||||||||
| 2013(a) | 2012 | |||||||||||||||
| Shares | Amount | Shares | Amount | |||||||||||||
Sold: | ||||||||||||||||
Class A | 10,723,043 | $ | 120,331,339 | 16,280,879 | $ | 168,906,300 | ||||||||||
Class B | 30,854 | 327,642 | 46,729 | 457,333 | ||||||||||||
Class C | 681,254 | 6,809,246 | 430,727 | 4,106,013 | ||||||||||||
Class Y | 4,691,321 | 53,193,049 | 3,911,388 | 41,480,313 | ||||||||||||
Class R5(b) | 3,527,315 | 44,000,899 | — | — | ||||||||||||
Class R6(b) | 5,622,923 | 66,633,393 | — | — | ||||||||||||
Issued as reinvestment of dividends: | ||||||||||||||||
Class A | 5,757,455 | 56,653,360 | 8,188,781 | 79,758,723 | ||||||||||||
Class B | 145,907 | 1,323,375 | 175,506 | 1,588,333 | ||||||||||||
Class C | 566,705 | 4,975,669 | 584,164 | 5,175,695 | ||||||||||||
Class Y | 1,902,498 | 19,139,132 | 2,008,021 | 19,899,485 | ||||||||||||
Class R5 | — | — | — | — | ||||||||||||
Class R6 | — | — | — | — | ||||||||||||
Automatic conversion of Class B shares to Class A shares: | ||||||||||||||||
Class A | 203,114 | 2,258,894 | 244,402 | 2,557,325 | ||||||||||||
Class B | (219,824 | ) | (2,258,894 | ) | (258,474 | ) | (2,557,325 | ) | ||||||||
Reacquired:(b) | ||||||||||||||||
Class A | (28,300,197 | ) | (314,790,033 | ) | (46,520,534 | ) | (494,133,184 | ) | ||||||||
Class B | (204,268 | ) | (2,077,976 | ) | (309,907 | ) | (2,964,596 | ) | ||||||||
Class C | (1,238,776 | ) | (12,254,783 | ) | (1,344,251 | ) | (12,724,795 | ) | ||||||||
Class Y | (12,205,730 | ) | (141,138,714 | ) | (9,048,357 | ) | (96,007,248 | ) | ||||||||
Class R5 | (10,478 | ) | (129,388 | ) | — | — | ||||||||||
Class R6 | (159,432 | ) | (1,958,641 | ) | — | — | ||||||||||
Net increase (decrease) in share activity | (8,486,316 | ) | $ | (98,962,431 | ) | (25,610,926 | ) | $ | (284,457,628 | ) | ||||||
| (a) | There are entities that are record owners of more than 5% of the outstanding shares of the Fund and in the aggregate own 36% of the outstanding shares of the Fund. IDI has an agreement with these entities to sell Fund shares. The Fund, Invesco and/or Invesco affiliates may make payments to these entities, which are considered to be related to the Fund, for providing services to the Fund, Invesco and/or Invesco affiliates including but not limited to services such as securities brokerage, distribution, third party record keeping and account servicing. The Fund has no knowledge as to whether all or any portion of the shares owned of record by these entities are also owned beneficially. |
| (b) | Commencement date of September 24, 2012. |
| (c) | Net of redemption fees of $12,135 for the year ended August 31, 2012. |
19 Invesco Small Cap Discovery Fund
NOTE 12—Financial Highlights
The following schedule presents financial highlights for a share of the Fund outstanding throughout the periods indicated.
| Net asset value, beginning of period | Net investment income (loss)(a) | Net gains (losses) on securities (both realized and unrealized) | Total from investment operations | Distributions from net realized gains | Net asset value, end of period | Total return | Net assets, end of period (000’s omitted) | Ratio of with fee waivers | Ratio of expenses to average net assets without fee waivers and/or expenses absorbed | Ratio of net investment income (loss) to average net assets | Portfolio turnover(b) | |||||||||||||||||||||||||||||||||||||
Class A | ||||||||||||||||||||||||||||||||||||||||||||||||
Year ended 08/31/13 | $ | 10.85 | $ | (0.08 | ) | $ | 2.56 | $ | 2.48 | $ | (1.13 | ) | $ | 12.20 | 25.31 | %(c) | $ | 540,979 | 1.32 | %(d) | 1.33 | %(d) | (0.72 | )%(d) | 70 | % | ||||||||||||||||||||||
Year ended 08/31/12 | 10.56 | (0.08 | ) | 1.47 | 1.39 | (1.10 | ) | 10.85 | (e) | 14.33 | (c) | 607,073 | 1.38 | 1.43 | (0.80 | ) | 78 | |||||||||||||||||||||||||||||||
Year ended 08/31/11 | 8.74 | (0.11 | ) | 1.93 | 1.82 | — | 10.56 | (e) | 20.82 | (c) | 820,988 | 1.38 | 1.42 | (1.01 | ) | 114 | ||||||||||||||||||||||||||||||||
Five months ended 08/31/10 | 9.62 | (0.04 | ) | (0.84 | ) | (0.88 | ) | — | 8.74 | (e) | (9.15 | )(c) | 691,456 | 1.34 | (f) | 1.34 | (f) | (1.04 | )(f) | 63 | ||||||||||||||||||||||||||||
Year ended 03/31/10 | 6.93 | (0.09 | ) | 2.78 | 2.69 | — | 9.62 | (e) | 38.82 | (g) | 748,998 | 1.39 | 1.39 | (1.04 | ) | 234 | ||||||||||||||||||||||||||||||||
Year ended 03/31/09 | 10.15 | (0.09 | ) | (3.13 | ) | (3.22 | ) | — | 6.93 | (e) | (31.72 | )(g) | 402,611 | 1.40 | 1.40 | (1.00 | ) | 219 | ||||||||||||||||||||||||||||||
Class B | ||||||||||||||||||||||||||||||||||||||||||||||||
Year ended 08/31/13 | 10.09 | (0.07 | ) | 2.36 | 2.29 | (1.13 | ) | 11.25 | 25.34 | (c)(h) | 12,554 | 1.32 | (d)(h) | 1.33 | (d)(h) | (0.72 | )(d)(h) | 70 | ||||||||||||||||||||||||||||||
Year ended 08/31/12 | 9.89 | (0.08 | ) | 1.38 | 1.30 | (1.10 | ) | 10.09 | (e) | 14.40 | (c)(h) | 13,754 | 1.38 | (h) | 1.43 | (h) | (0.80 | )(h) | 78 | |||||||||||||||||||||||||||||
Year ended 08/31/11 | 8.18 | (0.11 | ) | 1.82 | 1.71 | — | 9.89 | (e) | 20.90 | (c)(h) | 16,910 | 1.40 | (h) | 1.44 | (h) | (1.03 | )(h) | 114 | ||||||||||||||||||||||||||||||
Five months ended 08/31/10 | 9.03 | (0.05 | ) | (0.80 | ) | (0.85 | ) | — | 8.18 | (e) | (9.41 | )(c)(h) | 19,249 | 1.63 | (f)(h) | 1.63 | (f)(h) | (1.33 | )(f)(h) | 63 | ||||||||||||||||||||||||||||
Year ended 03/31/10 | 6.51 | (0.09 | ) | 2.61 | 2.52 | — | 9.03 | (e) | 38.71 | (i)(j) | 23,169 | 1.53 | (j) | 1.53 | (j) | (1.19 | )(j) | 234 | ||||||||||||||||||||||||||||||
Year ended 03/31/09 | 9.59 | (0.14 | ) | (2.94 | ) | (3.08 | ) | — | 6.51 | (e) | (32.12 | )(i)(j) | 22,044 | 2.04 | (j) | 2.04 | (j) | (1.65 | )(j) | 219 | ||||||||||||||||||||||||||||
Class C | ||||||||||||||||||||||||||||||||||||||||||||||||
Year ended 08/31/13 | 9.82 | (0.15 | ) | 2.29 | 2.14 | (1.13 | ) | 10.83 | 24.43 | (c) | 53,560 | 2.07 | (d) | 2.08 | (d) | (1.47 | )(d) | 70 | ||||||||||||||||||||||||||||||
Year ended 08/31/12 | 9.73 | (0.15 | ) | 1.34 | 1.19 | (1.10 | ) | 9.82 | (e) | 13.43 | (c) | 48,486 | 2.13 | 2.18 | (1.55 | ) | 78 | |||||||||||||||||||||||||||||||
Year ended 08/31/11 | 8.10 | (0.17 | ) | 1.80 | 1.63 | — | 9.73 | (e) | 20.12 | (c)(k) | 51,212 | 2.06 | (k) | 2.10 | (k) | (1.69 | )(k) | 114 | ||||||||||||||||||||||||||||||
Five months ended 08/31/10 | 8.95 | (0.07 | ) | (0.78 | ) | (0.85 | ) | — | 8.10 | (e) | (9.50 | )(c) | 53,673 | 2.09 | (f) | 2.09 | (f) | (1.79 | )(f) | 63 | ||||||||||||||||||||||||||||
Year ended 03/31/10 | 6.50 | (0.14 | ) | 2.59 | 2.45 | — | 8.95 | (e) | 37.69 | (l) | 62,523 | 2.14 | 2.14 | (1.79 | ) | 234 | ||||||||||||||||||||||||||||||||
Year ended 03/31/09 | 9.58 | (0.14 | ) | (2.94 | ) | (3.08 | ) | — | 6.50 | (e) | (32.15 | )(l) | 39,064 | 2.14 | 2.14 | (1.75 | ) | 219 | ||||||||||||||||||||||||||||||
Class Y(m) | ||||||||||||||||||||||||||||||||||||||||||||||||
Year ended 08/31/13 | 11.06 | (0.05 | ) | 2.62 | 2.57 | (1.13 | ) | 12.50 | 25.67 | (c) | 163,072 | 1.07 | (d) | 1.08 | (d) | (0.47 | )(d) | 70 | ||||||||||||||||||||||||||||||
Year ended 08/31/12 | 10.72 | (0.06 | ) | 1.50 | 1.44 | (1.10 | ) | 11.06 | (e) | 14.60 | (c) | 206,367 | 1.13 | 1.18 | (0.55 | ) | 78 | |||||||||||||||||||||||||||||||
Year ended 08/31/11 | 8.84 | (0.09 | ) | 1.97 | 1.88 | — | 10.72 | (e) | 21.27 | (c) | 233,467 | 1.13 | 1.17 | (0.76 | ) | 114 | ||||||||||||||||||||||||||||||||
Five months ended 08/31/10 | 9.73 | (0.03 | ) | (0.86 | ) | (0.89 | ) | — | 8.84 | (e) | (9.15 | )(c) | 199,603 | 1.09 | (f) | 1.09 | (f) | (0.80 | )(f) | 63 | ||||||||||||||||||||||||||||
Year ended 03/31/10 | 6.99 | (0.06 | ) | 2.80 | 2.74 | — | 9.73 | (e) | 39.20 | (n) | 267,593 | 1.14 | 1.14 | (0.76 | ) | 234 | ||||||||||||||||||||||||||||||||
Year ended 03/31/09 | 10.20 | (0.07 | ) | (3.14 | ) | (3.21 | ) | — | 6.99 | (e) | (31.47 | )(n) | 91,594 | 1.15 | 1.15 | (0.75 | ) | 219 | ||||||||||||||||||||||||||||||
Class R5 | ||||||||||||||||||||||||||||||||||||||||||||||||
Year ended 08/31/13(o) | 11.48 | (0.04 | ) | 2.21 | 2.17 | (1.13 | ) | 12.52 | 21.25 | (c) | 44,037 | 0.93 | (d)(f) | 0.94 | (d)(f) | (0.33 | )(d)(f) | 70 | ||||||||||||||||||||||||||||||
Class R6 | ||||||||||||||||||||||||||||||||||||||||||||||||
Year ended 08/31/13(o) | 11.48 | (0.03 | ) | 2.20 | 2.17 | (1.13 | ) | 12.52 | 21.25 | (c) | 68,425 | 0.83 | (d)(f) | 0.84 | (d)(f) | (0.23 | )(d)(f) | 70 | ||||||||||||||||||||||||||||||
| (a) | Calculated using average shares outstanding. |
| (b) | Portfolio turnover is calculated at the fund level and is not annualized for periods less than one year, if applicable. |
| (c) | Includes adjustments in accordance with accounting principles generally accepted in the United States of America and as such, the net asset value for financial reporting purposes and the returns based upon those net asset values may differ from the net asset value and returns for shareholder transactions. Does not include sales charges and is not annualized for periods less than one year, if applicable. |
| (d) | Ratios are based on average daily net assets (000’s) of $564,401, $12,938, $49,725, $195,926, $6,623 and $17,604 for Class A, Class B, Class C, Class Y, Class R5 and Class R6, respectively. |
| (e) | Includes redemption fees added to shares of beneficial interest which were less than $0.005 per share. |
| (f) | Annualized. |
| (g) | Assumes reinvestment of all distributions for the period and does not include payment of the maximum sales charge of 5.75% or contingent deferred sales charge (CDSC). On purchases of $1 million or more, a CDSC of 1% may be imposed on certain redemptions made within eighteen months of purchase. If the sales charges were included, total returns would be lower. These returns include combined Rule 12b-1 fees and service fees of up to 0.25% and do not reflect the deduction of taxes that a shareholder would pay on Fund distributions or the redemption of Fund shares. |
| (h) | The total return, ratio of expenses to average net assets and ratio of net investment income (loss) to average net assets reflect actual 12b-1 fees of 0.25%, 0.25%, 0.27% and 0.54% for the years ended August 31, 2013, August 31, 2012, August 31, 2011 and the five months ended August 31, 2010, respectively. |
| (i) | Assumes reinvestment of all distributions for the period and does not include payment of the maximum CDSC of 5%, charged on certain redemptions made within one year of purchase and declining to 0% after the fifth year. If the sales charge was included, total returns would be lower. These returns include combined Rule 12b-1 fees and service fees of up to 1% and do not reflect the deduction of taxes that a shareholder would pay on Fund distributions or the redemption of Fund shares. |
| (j) | The total return, ratio of expenses to average net assets and ratio of net investment income (loss) to average net assets reflect actual 12b-1 fees of less than 1%. |
| (k) | The total return, ratio of expenses to average net assets and ratio of net investment income (loss) to average net assets reflect actual 12b-1 fees of 0.93% for the year ended August 31, 2011. |
| (l) | Assumes reinvestment of all distributions for the period and does not include payment of the maximum CDSC of 1%, charged on certain redemptions made within one year of purchase. If the sales charge was included, total returns would be lower. These returns include combined Rule 12b-1 fees and service fees of up to 1% and do not reflect the deduction of taxes that a shareholder would pay on Fund distributions or the redemption of Fund shares. |
| (m) | On June 1, 2010, the Fund’s former Class I shares were reorganized into Class Y shares. |
| (n) | Assumes reinvestment of all distributions for the period. These returns do not reflect the deduction of taxes that a shareholder would pay on Fund distributions or the redemption on Fund shares. |
| (o) | Commencement date of September 24, 2012 for Class R5 and Class R6 shares. |
20 Invesco Small Cap Discovery Fund
Report of Independent Registered Public Accounting Firm
To the Board of Trustees of AIM Counselor Series Trust (Invesco Counselor Series Trust)
and Shareholders of Invesco Small Cap Discovery Fund:
In our opinion, the accompanying statement of assets and liabilities, including the schedule of investments, and the related statements of operations and of changes in net assets and the financial highlights present fairly, in all material respects, the financial position of Invesco Small Cap Discovery Fund (one of the funds constituting AIM Counselor Series Trust (Invesco Counselor Series Trust), hereafter referred to as the “Fund”) at August 31, 2013, the results of its operations for the year then ended, the changes in its net assets for each of the two years in the period then ended and the financial highlights for each of the three years in the period then ended and the five month period ended August 31, 2010, in conformity with accounting principles generally accepted in the United States of America. These financial statements and financial highlights (hereafter referred to as “financial statements”) are the responsibility of the Fund’s management; our responsibility is to express an opinion on these financial statements based on our audits. We conducted our audits of these financial statements in accordance with the standards of the Public Company Accounting Oversight Board (United States). Those standards require that we plan and perform the audit to obtain reasonable assurance about whether the financial statements are free of material misstatement. An audit includes examining, on a test basis, evidence supporting the amounts and disclosures in the financial statements, assessing the accounting principles used and significant estimates made by management, and evaluating the overall financial statement presentation. We believe that our audits, which included confirmation of securities at August 31, 2013 by correspondence with the custodian and brokers, provide a reasonable basis for our opinion. The financial highlights of the Fund for the periods ended March 31, 2010 and prior were audited by another independent registered public accounting firm whose report dated May 18, 2010 expressed an unqualified opinion on those financial statements.
PRICEWATERHOUSECOOPERS LLP
October 29, 2013
Houston, Texas
21 Invesco Small Cap Discovery Fund
Calculating your ongoing Fund expenses
Example
As a shareholder of the Fund, you incur two types of costs: (1) transaction costs, which may include sales charges (loads) on purchase payments or contingent deferred sales charges on redemptions, if any; and (2) ongoing costs, including management fees, distribution and/or service (12b-1) fees, and other Fund expenses. This example is intended to help you understand your ongoing costs (in dollars) of investing in the Fund and to compare these costs with ongoing costs of investing in other mutual funds. The example is based on an investment of $1,000 invested at the beginning of the period and held for the entire period March 1, 2013 through August 31, 2013.
Actual expenses
The table below provides information about actual account values and actual expenses. You may use the information in this table, together with the amount you invested, to estimate the expenses that you paid over the period. Simply divide your account value by $1,000 (for example, an $8,600 account value divided by $1,000 = 8.6), then multiply the result by the number in the table under the heading entitled “Actual Expenses Paid During Period” to estimate the expenses you paid on your account during this period.
Hypothetical example for comparison purposes
The table below also provides information about hypothetical account values and hypothetical expenses based on the Fund’s actual expense ratio and an assumed rate of return of 5% per year before expenses, which is not the Fund’s actual return.
The hypothetical account values and expenses may not be used to estimate the actual ending account balance or expenses you paid for the period. You may use this information to compare the ongoing costs of investing in the Fund and other funds. To do so, compare this 5% hypothetical example with the 5% hypothetical examples that appear in the shareholder reports of the other funds.
Please note that the expenses shown in the table are meant to highlight your ongoing costs only and do not reflect any transaction costs, such as sales charges (loads) on purchase payments or contingent deferred sales charges on redemptions, if any. Therefore, the hypothetical information is useful in comparing ongoing costs only, and will not help you determine the relative total costs of owning different funds. In addition, if these transaction costs were included, your costs would have been higher.
Class | Beginning | ACTUAL | HYPOTHETICAL (5% annual return before | Annualized Expense Ratio | ||||||||||||||||||||
| Ending Account Value (08/31/13)1 | Expenses Paid During Period2 | Ending Account Value (08/31/13) | Expenses Paid During Period2 | |||||||||||||||||||||
A | $ | 1,000.00 | $ | 1,137.00 | $ | 6.84 | $ | 1,018.80 | $ | 6.46 | 1.27 | % | ||||||||||||
B | 1,000.00 | 1,137.50 | 6.84 | 1,018.80 | 6.46 | 1.27 | ||||||||||||||||||
C | 1,000.00 | 1,132.90 | 10.86 | 1,015.02 | 10.26 | 2.02 | ||||||||||||||||||
Y | 1,000.00 | 1,138.40 | 5.50 | 1,020.06 | 5.19 | 1.02 | ||||||||||||||||||
R5 | 1,000.00 | 1,132.90 | 5.00 | 1,020.52 | 4.74 | 0.93 | ||||||||||||||||||
R6 | 1,000.00 | 1,139.20 | 4.48 | 1,021.02 | 4.23 | 0.83 | ||||||||||||||||||
| 1 | The actual ending account value is based on the actual total return of the Fund for the period March 1, 2013 through August 31, 2013, after actual expenses and will differ from the hypothetical ending account value which is based on the Fund’s expense ratio and a hypothetical annual return of 5% before expenses. |
| 2 | Expenses are equal to the Fund’s annualized expense ratio as indicated above multiplied by the average account value over the period, multiplied by 184/365 to reflect the most recent fiscal half year. |
22 Invesco Small Cap Discovery Fund
Approval of Investment Advisory and Sub-Advisory Contracts
The Board of Trustees (the Board) of AIM Counselor Series Trust (Invesco Counselor Series Trust) is required under the Investment Company Act of 1940, as amended, to approve annually the renewal of Invesco Small Cap Discovery Fund’s (the Fund) investment advisory agreement with Invesco Advisers, Inc. (Invesco Advisers) and the Master Intergroup Sub-Advisory Contract for Mutual Funds (the sub-advisory contracts) with Invesco Asset Management Deutschland GmbH, Invesco Asset Management Limited, Invesco Asset Management (Japan) Limited, Invesco Australia Limited, Invesco Hong Kong Limited, Invesco Senior Secured Management, Inc. and Invesco Canada Ltd. (collectively, the Affiliated Sub-Advisers). During contract renewal meetings held on June 17-19, 2013, the Board as a whole, and the disinterested or “independent” Trustees, who comprise over 75% of the Board, voting separately, approved the continuance of the Fund’s investment advisory agreement and the sub-advisory contracts for another year, effective July 1, 2013. The Board determined that the continuation of the Fund’s investment advisory agreement and the sub-advisory contracts are in the best interests of the Fund and its shareholders and the compensation payable to Invesco Advisers and the Affiliated Sub-Advisers under the agreements is fair and reasonable.
The Board’s Fund Evaluation Process
The Board’s Investments Committee has established three Sub-Committees, each of which is primarily responsible for overseeing the management of a number of the funds advised by Invesco Advisers (the Invesco Funds). The Sub-Committees meet throughout the year to review the performance of their assigned Invesco Funds, including reviewing materials prepared under the direction of the independent Senior Officer, an officer of the Invesco Funds who reports directly to the independent Trustees. Over the course of each year, the Sub-Committees meet with portfolio managers for their assigned Invesco Funds and other members of management to review the performance, investment objective(s), policies, strategies, limitations and investment risks of these funds. The Sub-Committees meet regularly and at designated contract renewal meetings each year to conduct a review of the performance, fees, expenses and other matters related to their assigned Invesco Funds. Each Sub-Committee recommends to the Investments Committee, which in turn recommends to the full Board, whether and on what terms to approve the continuance of each Invesco Fund’s investment advisory agreement and sub-advisory contracts for another year.
During the contract renewal process, the Trustees receive comparative performance and fee data regarding the Invesco Funds prepared by Invesco Advisers and Lipper Inc. (Lipper), and independent provider of investment company
data. The Trustees also receive an independent written evaluation from the Senior Officer. The Senior Officer’s evaluation is prepared as part of his responsibility to manage the process by which the Invesco Funds’ proposed management fees are negotiated during the annual contract renewal process to ensure they are negotiated in a manner that is at arms’ length and reasonable. The independent Trustees are assisted in their annual evaluation of the Fund’s investment advisory agreement by the Senior Officer and by independent legal counsel. In addition to meetings with Invesco Advisers and fund counsel, the independent Trustees also discuss the continuance of the investment advisory agreement and sub-advisory contracts in separate sessions with the Senior Officer and with independent legal counsel.
In evaluating the fairness and reasonableness of compensation under the Fund’s investment advisory agreement and sub-advisory contracts, the Board considered, among other things, the factors discussed below. The Trustees recognized that the advisory fee rates for the Invesco Funds are, in many cases, the result of years of review and negotiation between the Trustees and Invesco Advisers as well as advisory fees previously approved by different predecessor boards. The Trustees’ deliberations and conclusions in a particular year may be based in part on their deliberations and conclusions regarding these same arrangements throughout the year and in prior years. The Trustees’ review and conclusions are based on the comprehensive consideration of all information presented to them and are not the result of any single determinative factor. Moreover, one Trustee may have weighed a particular piece of information or factor differently than another Trustee.
The discussion below serves as the Senior Officer’s independent written evaluation with respect to the Fund’s investment advisory agreement as well as a discussion of the material factors and related conclusions that formed the basis for the Board’s approval of the Fund’s investment advisory agreement and sub-advisory contracts. Unless otherwise stated, this information is current as of June 19, 2013, and may not reflect consideration of factors that became known to the Board after that date, including, for example, changes to the Fund’s performance, advisory fees, expense limitations and/or fee waivers.
Factors and Conclusions and Summary of Independent Written Fee Evaluation
| A. | Nature, Extent and Quality of Services Provided by Invesco Advisers and the Affiliated Sub-Advisers |
The Board reviewed the advisory services provided to the Fund by Invesco Advisers under the Fund’s investment advisory agreement, the performance of Invesco Advisers in providing these services, and the credentials and
experience of the officers and employees of Invesco Advisers who provide these services, including the Fund’s portfolio manager or managers, with whom the Sub-Committees met during the year. The Board’s review of the qualifications of Invesco Advisers to provide advisory services included the Board’s consideration of Invesco Advisers’ investment process oversight, independent credit analysis and investment risk management.
In determining whether to continue the Fund’s investment advisory agreement, the Board considered the benefits of reapproving an existing relationship and the greater uncertainty that may be associated with entering into a new relationship. The Board also considered non-advisory services that Invesco Advisers and its affiliates provide to the Invesco Funds such as various back office support functions, equity and fixed income trading operations, internal audit, distribution and legal and compliance. The Board concluded that the nature, extent and quality of the services provided to the Fund by Invesco Advisers are appropriate and satisfactory and consistent with the terms of the Fund’s investment advisory agreement.
The Board reviewed the services that may be provided by the Affiliated Sub-Advisers under the sub-advisory contracts and the credentials and experience of the officers and employees of the Affiliated Sub-Advisers who provide these services. The Board noted that the Affiliated Sub-Advisers have offices and personnel that are located in financial centers around the world. As a result, the Affiliated Sub-Advisers can provide research and investment analysis on the markets and economies of various countries in which the Fund may invest, make recommendations regarding securities and assist with security trades. The Board concluded that the sub-advisory contracts benefit the Fund and its shareholders by permitting Invesco Advisers to use the resources and talents of the Affiliated Sub-Advisers in managing the Fund. The Board concluded that the nature, extent and quality of the services that may be provided by the Affiliated Sub-Advisers are appropriate and satisfactory and consistent with the terms of the Fund’s sub-advisory contracts.
| B. | Fund Performance |
The Board considered Fund performance as a relevant factor in considering whether to approve the investment advisory agreement. The Board did not view Fund performance as a relevant factor in considering whether to approve the sub-advisory contracts for the Fund, as no Affiliated Sub-Adviser currently manages assets of the Fund.
The Board compared the Fund’s performance during the past one, three and five calendar years to the performance of funds in the Lipper performance universe and against the Lipper Small-Cap Growth Funds Index. The Board noted that performance of Class A shares of the Fund
23 Invesco Small Cap Discovery Fund
was in the first quintile of the performance universe for the one year period, the third quintile for the three year period, and the fourth quintile for the five year period (the first quintile being the best performing funds and the fifth quintile being the worst performing funds). The Board noted that performance of Class A shares of the Fund was above the performance of the Index for the one year period and below the performance of the Index for the three and five year period. The Trustees also reviewed more recent Fund performance and this review did not change their conclusions.
| C. | Advisory and Sub-Advisory Fees |
The Board compared the Fund’s contractual management fee rate to the contractual management fee rates of funds in the Fund’s Lipper expense group at a common asset level. The Board noted that the contractual management fee rate for Class A shares of the Fund was below the median contractual management fee rate of funds in the expense group. The Board noted that the term “contractual management fee” may include both advisory and certain administrative services fees and that Invesco does not charge the Invesco Funds for the administrative services included in the term as defined by Lipper. The Board also reviewed the methodology used by Lipper in providing expense group information, which includes using each fund’s contractual management fee schedule (including any applicable breakpoints) as reported in the most recent prospectus or statement of additional information for each fund in the expense group.
The Board also compared the Fund’s effective advisory fee rate (the advisory fee rate after advisory fee waivers and before other expense limitations/waivers) to the effective advisory fee rates of other mutual funds advised by Invesco Advisers and its affiliates with investment strategies comparable to those of the Fund. The Board noted that Invesco Advisers sub-advises one mutual fund with investment strategies comparable to those of the Fund and that the sub-advisory effective fee rate is below the effective advisory fee rate of the Fund.
Other than the mutual fund described above, the Board noted that Invesco Advisers and the Affiliated Sub-Advisers do not advise other client accounts with investment strategies comparable to those of the Fund.
The Board also considered the services that may be provided by the Affiliated Sub-Advisers pursuant to the sub-advisory contracts, as well as the fees payable by Invesco Advisers to the Affiliated Sub-Advisers pursuant to the sub-advisory contracts. The Board also noted that the sub-advisory fees are not paid directly by the Fund, but rather, are payable by Invesco Advisers to the Affiliated Sub-Advisers.
Based upon the information and considerations described above, the Board concluded that the compensation payable to Invesco Advisers and the Affiliated Sub-Advisers is fair and reasonable.
| D. | Economies of Scale and Breakpoints |
The Board considered the extent to which there are economies of scale in the provision of advisory services to the Fund. The Board also considered whether the Fund benefits from economies of scale through contractual breakpoints in the Fund’s advisory fee schedule and was assisted in this review by a report from the Senior Officer. The Board also noted that the Fund shares directly in economies of scale through lower fees charged by third party service providers based on the combined size of the Invesco Funds and other clients advised by Invesco Advisers.
| E. | Profitability and Financial Resources |
The Board reviewed information from Invesco Advisers concerning the costs of the advisory and other services that Invesco Advisers and its affiliates provide to the Fund and the profitability of Invesco Advisers and its affiliates in providing these services for the year ended December 31, 2012. The Board received information from Invesco Advisers about the methodology used to prepare the profitability information. The Board considered the profitability of Invesco Advisers in managing the Fund and the Invesco Funds. The Board noted that Invesco Advisers continues to operate at a net profit from services Invesco Advisers and its subsidiaries provide to the Invesco Funds and the Fund. The Board did not deem the level of profits realized by Invesco Advisers and its affiliates from providing services to the Fund to be excessive given the nature, quality and extent of the services provided to the Invesco Funds. The Board received and accepted information from Invesco Advisers demonstrating that Invesco Advisers and each Affiliated Sub-Adviser are financially sound and have the resources necessary to perform their obligations under the investment advisory agreement and sub-advisory contracts.
| F. | Collateral Benefits to Invesco Advisers and its Affiliates |
The Board considered various other benefits received by Invesco Advisers and its affiliates from the relationship with the Fund, including the fees received for their provision of transfer agency and distribution services to the Fund. The Board considered comparative information regarding fees charged for these services, including information provided by Lipper and other independent sources. The Board considered the performance of Invesco Advisers and its affiliates in providing these services and the organizational structure employed to provide these services. The Board also considered that these services are provided to the Fund pursuant to written contracts that are reviewed and approved on an annual basis by the Board; that the services are required for the operation of the Fund; that Invesco Advisers and its affiliates can provide services, the nature and quality of which are at least equal to those provided by others offering the same or similar services; and that the fees for such services are fair and reasonable in light of the
usual and customary charges by others for services of the same nature and quality.
The Board considered the benefits realized by Invesco Advisers and the Affiliated Sub-Advisers as a result of portfolio brokerage transactions executed through “soft dollar” arrangements. The Board noted that soft dollar arrangements shift the payment obligation for research services from Invesco Advisers and the Affiliated Sub-Advisers to the Invesco Funds and that the research received may be used with other clients of Invesco Advisers and may reduce Invesco Advisers’ and the Affiliated Sub-Advisers’ expenses. The Board also considered periodic reports from the Chief Compliance Officer of the Invesco Funds demonstrating that these arrangements are consistent with regulatory requirements. The Board did not deem the soft dollar arrangements to be inappropriate.
The Board considered that the Fund’s uninvested cash and cash collateral from any securities lending arrangements may be invested in money market funds advised by Invesco Advisers pursuant to procedures approved by the Board. The Board noted that Invesco Advisers receives advisory fees from these affiliated money market funds attributable to such investments, although Invesco Advisers has contractually agreed to waive through varying periods the advisory fees payable by the Invesco Funds. The waiver is in an amount equal to 100% of the net advisory fee Invesco Advisers receives from the affiliated money market funds with respect to the Fund’s investment in the affiliated money market funds of uninvested cash, but not cash collateral. The Board concluded that the Fund’s investment of uninvested cash and cash collateral from any securities lending arrangements in the affiliated money market funds is in the best interests of the Fund and its shareholders.
The Board also considered use of an affiliated broker to execute certain trades for the Fund to among other things, control information leakage, and were advised that such trades are executed in compliance with rules under the Investment Company Act of 1940, as amended.
24 Invesco Small Cap Discovery Fund
Tax Information
Form 1099-DIV, Form 1042-S and other year–end tax information provide shareholders with actual calendar year amounts that should be included in their tax returns. Shareholders should consult their tax advisors.
The following distribution information is being provided as required by the Internal Revenue Code or to meet a specific state’s requirement.
The Fund designates the following amounts or, if subsequently determined to be different, the maximum amount allowable for its fiscal year ended August 31, 2013:
Federal and State Income Tax | ||||
Long-Term Capital Gain Distributions | $ | 85,006,849 | ||
Qualified Dividend Income* | 0.00 | % | ||
Corporate Dividends Received Deduction* | 0.00 | % | ||
| * | The above percentages are based on ordinary income dividends paid to shareholders during the Fund’s fiscal year. |
25 Invesco Small Cap Discovery Fund
Trustees and Officers
The address of each trustee and officer is AIM Counselor Series Trust (Invesco Counselor Series Trust) (the “Trust”), 11 Greenway Plaza, Suite 1000, Houston, Texas 77046-1173. The trustees serve for the life of the Trust, subject to their earlier death, incapacitation, resignation, retirement or removal as more specifically provided in the Trust’s organizational documents. Each officer serves for a one year term or until their successors are elected and qualified. Column two below includes length of time served with predecessor entities, if any.
Name, Year of Birth and Position(s) Held with the Trust | Trustee and/ or Officer Since | Principal Occupation(s) During Past 5 Years | Number of Funds in Fund Complex Overseen by Trustee | Other Directorship(s) Held by Trustee During Past 5 Years | ||||
| Interested Persons | ||||||||
| Martin L. Flanagan1 — 1960 Trustee | 2007 | Executive Director, Chief Executive Officer and President, Invesco Ltd. (ultimate parent of Invesco and a global investment management firm); Advisor to the Board, Invesco Advisers, Inc. (formerly known as Invesco Institutional (N.A.), Inc.); Trustee, The Invesco Funds; Vice Chair, Investment Company Institute; and Member of Executive Board, SMU Cox School of Business
Formerly: Chairman and Chief Executive Officer, Invesco Advisers, Inc. (registered investment adviser); Director, Chairman, Chief Executive Officer and President, IVZ Inc. (holding company), INVESCO Group Services, Inc. (service provider) and Invesco North American Holdings, Inc. (holding company); Director, Chief Executive Officer and President, Invesco Holding Company Limited (parent of Invesco and a global investment management firm); Director, Invesco Ltd.; Chairman, Investment Company Institute and President, Co-Chief Executive Officer, Co-President, Chief Operating Officer and Chief Financial Officer, Franklin Resources, Inc. (global investment management organization) | 117 | None | ||||
| Philip A. Taylor2 — 1954 Trustee, President and Principal Executive Officer | 2006 | Head of North American Retail and Senior Managing Director, Invesco Ltd.; Director, Co-Chairman, Co-President and Co-Chief Executive Officer, Invesco Advisers, Inc. (formerly known as Invesco Institutional (N.A.), Inc.) (registered investment adviser); Director, Chairman, Chief Executive Officer and President, Invesco Management Group, Inc. (formerly known as Invesco Aim Management Group, Inc.) (financial services holding company); Director and President, INVESCO Funds Group, Inc. (registered investment adviser and registered transfer agent); Director and Chairman, Invesco Investment Services, Inc. (formerly known as Invesco Aim Investment Services, Inc.) (registered transfer agent) and IVZ Distributors, Inc. (formerly known as INVESCO Distributors, Inc.) (registered broker dealer); Director, President and Chairman, Invesco Inc. (holding company) and Invesco Canada Holdings Inc. (holding company); Chief Executive Officer, Invesco Corporate Class Inc. (corporate mutual fund company) and Invesco Canada Fund Inc. (corporate mutual fund company); Director, Chairman and Chief Executive Officer, Invesco Canada Ltd. (formerly known as Invesco Trimark Ltd./Invesco Trimark Ltèe) (registered investment adviser and registered transfer agent); Trustee, President and Principal Executive Officer, The Invesco Funds (other than AIM Treasurer’s Series Trust (Invesco Treasurer’s Series Trust) and Short-Term Investments Trust); Trustee and Executive Vice President, The Invesco Funds (AIM Treasurer’s Series Trust (Invesco Treasurer’s Series Trust) and Short-Term Investments Trust only); Director, Invesco Investment Advisers LLC (formerly known as Van Kampen Asset Management); Director, Chief Executive Officer and President, Van Kampen Exchange Corp.
Formerly: Director and Chairman, Van Kampen Investor Services Inc.: Director, Chief Executive Officer and President, 1371 Preferred Inc. (holding company); and Van Kampen Investments Inc.; Director and President, AIM GP Canada Inc. (general partner for limited partnerships); and Van Kampen Advisors, Inc.; Director and Chief Executive Officer, Invesco Trimark Dealer Inc. (registered broker dealer); Director, Invesco Distributors, Inc. (formerly known as Invesco Aim Distributors, Inc.) (registered broker dealer); Manager, Invesco PowerShares Capital Management LLC; Director, Chief Executive Officer and President, Invesco Advisers, Inc.; Director, Chairman, Chief Executive Officer and President, Invesco Aim Capital Management, Inc.; President, Invesco Trimark Dealer Inc. and Invesco Trimark Ltd./Invesco Trimark Ltèe; Director and President, AIM Trimark Corporate Class Inc. and AIM Trimark Canada Fund Inc.; Senior Managing Director, Invesco Holding Company Limited; Trustee and Executive Vice President, Tax-Free Investments Trust; Director and Chairman, Fund Management Company (former registered broker dealer); President and Principal Executive Officer, The Invesco Funds (AIM Treasurer’s Series Trust (Invesco Treasurer’s Series Trust), Short-Term Investments Trust and Tax-Free Investments Trust only); President, AIM Trimark Global Fund Inc. and AIM Trimark Canada Fund Inc. | 117 | None | ||||
Wayne W. Whalen3 — 1939 Trustee | 2010 | Of Counsel, and prior to 2010, partner in the law firm of Skadden, Arps, Slate, Meagher & Flom LLP, legal counsel to certain funds in the Fund Complex
| 130 | Director of the Mutual Fund Directors Forum, a nonprofit membership organization for investment directors; Chairman and Director of the Abraham Lincoln Presidential Library Foundation; and Director of the Stevenson Center for Democracy |
| 1 | Mr. Flanagan is considered an interested person of the Trust because he is an officer of the adviser to the Trust, and an officer and a director of Invesco Ltd., ultimate parent of the adviser to the Trust. |
| 2 | Mr. Taylor is considered an interested person of the Trust because he is an officer and a director of the adviser to, and a director of the principal underwriter of, the Trust. |
| 3 | Mr. Whalen is considered an “interested person” (within the meaning of Section 2(a)(19) of the 1940 Act) of certain Funds in the Invesco Fund Complex because he and his firm currently provide legal services as legal counsel to such Funds. |
T-1 Invesco Small Cap Discovery Fund
Trustees and Officers—(continued)
Name, Year of Birth and Position(s) Held with the Trust | Trustee and/ or Officer Since | Principal Occupation(s) During Past 5 Years | Number of Funds in Fund Complex Overseen by Trustee | Other Directorship(s) Held by Trustee During Past 5 Years | ||||
| Independent Trustees | ||||||||
Bruce L. Crockett — 1944 Trustee and Chair | 2003 | Chairman, Crockett Technologies Associates (technology consulting company)
Formerly: Director, Captaris (unified messaging provider); Director, President and Chief Executive Officer COMSAT Corporation; and Chairman, Board of Governors of INTELSAT (international communications company) | 117 | ACE Limited (insurance company); Investment Company Institute | ||||
David C. Arch — 1945 Trustee | 2010 | Chairman and Chief Executive Officer of Blistex Inc., (consumer health care products manufacturer)
Formerly: Member of the Heartland Alliance Advisory Board, a nonprofit organization serving human needs based in Chicago | 130 | Board member of the Illinois Manufacturers’ Association; Member of the Board of Visitors, Institute for the Humanities, University of Michigan | ||||
Frank S. Bayley — 1939 Trustee | 2003 | Retired
Formerly: Director, Badgley Funds, Inc. (registered investment company) (2 portfolios) and General Partner and Of Counsel, law firm of Baker & McKenzie, LLP | 117 | Director and Chairman, C.D. Stimson Company (a real estate investment company); Trustee and Overseer, The Curtis Institute of Music | ||||
James T. Bunch — 1942 Trustee | 2000 | Managing Member, Grumman Hill Group LLC (family office private equity management)
Formerly: Founder, Green, Manning & Bunch Ltd. (investment banking firm)(1988-2010); Executive Committee, United States Golf Association; and Director, Policy Studies, Inc. and Van Gilder Insurance Corporation | 117 | Chairman, Board of Governors, Western Golf Association; Chairman-elect, Evans Scholars Foundation; and Director, Denver Film Society | ||||
Rodney F. Dammeyer — 1940 Trustee | 2010 | Chairman of CAC, LLC, (private company offering capital investment and management advisory services)
Formerly: Prior to 2001, Managing Partner at Equity Group Corporate Investments; Prior to 1995, Chief Executive Officer of Itel Corporation (formerly Anixter International); Prior to 1985, experience includes Senior Vice President and Chief Financial Officer of Household International, Inc., Executive Vice President and Chief Financial Officer of Northwest Industries, Inc. and Partner of Arthur Andersen & Co.; From 1987 to 2010, Director/Trustee of investment companies in the Van Kampen Funds complex | 117 | Director of Quidel Corporation and Stericycle, Inc.; Prior to May 2008, Trustee of The Scripps Research Institute; Prior to February 2008, Director of Ventana Medical Systems, Inc. | ||||
Albert R. Dowden — 1941 Trustee | 2003 | Director of a number of public and private business corporations, including the Boss Group, Ltd. (private investment and management); Reich & Tang Funds (5 portfolios) (registered investment company); and Homeowners of America Holding Corporation/ Homeowners of America Insurance Company (property casualty company)
Formerly: Director, Continental Energy Services, LLC (oil and gas pipeline service); Director, CompuDyne Corporation (provider of product and services to the public security market) and Director, Annuity and Life Re (Holdings), Ltd. (reinsurance company); Director, President and Chief Executive Officer, Volvo Group North America, Inc.; Senior Vice President, AB Volvo; Director of various public and private corporations; Chairman, DHJ Media, Inc.; Director Magellan Insurance Company; and Director, The Hertz Corporation, Genmar Corporation (boat manufacturer), National Media Corporation; Advisory Board of Rotary Power International (designer, manufacturer, and seller of rotary power engines); and Chairman, Cortland Trust, Inc. (registered investment company) | 117 | Director of Nature’s Sunshine Products, Inc. | ||||
Jack M. Fields — 1952 Trustee | 2003 | Chief Executive Officer, Twenty First Century Group, Inc. (government affairs company); Owner and Chief Executive Officer, Dos Angeles Ranch, L.P. (cattle, hunting, corporate entertainment); and Discovery Global Education Fund (non-profit)
Formerly: Chief Executive Officer, Texana Timber LP (sustainable forestry company); Director of Cross Timbers Quail Research Ranch (non-profit); and member of the U.S. House of Representatives | 117 | Insperity, Inc. (formerly known as Administaff) | ||||
Prema Mathai-Davis — 1950 Trustee | 2003 | Retired
Formerly: Chief Executive Officer, YWCA of the U.S.A. | 117 | None | ||||
Larry Soll — 1942 Trustee | 1997 | Retired
Formerly: Chairman, Chief Executive Officer and President, Synergen Corp. (a biotechnology company) | 117 | None | ||||
Hugo F. Sonnenschein — 1940 Trustee | 2010 | Distinguished Service Professor and President Emeritus of the University of Chicago and the Adam Smith Distinguished Service Professor in the Department of Economics at the University of Chicago
Formerly: President of the University of Chicago | 130 | Trustee of the University of Rochester and a member of its investment committee. Member of the National Academy of Sciences, the American Philosophical Society and a fellow of the American Academy of Arts and Sciences |
T-2 Invesco Small Cap Discovery Fund
Trustees and Officers—(continued)
Name, Year of Birth and Position(s) Held with the Trust | Trustee and/ or Officer Since | Principal Occupation(s) During Past 5 Years | Number of Funds in Fund Complex Overseen by Trustee | Other Directorship(s) Held by Trustee During Past 5 Years | ||||
| Independent Trustees—(continued) | ||||||||
Raymond Stickel, Jr. — 1944 Trustee | 2005 | Retired
Formerly: Director, Mainstay VP Series Funds, Inc. (25 portfolios) and Partner, Deloitte & Touche | 117 | None | ||||
| Other Officers | ||||||||
| Russell C. Burk — 1958 Senior Vice President and Senior Officer | 2005 | Senior Vice President and Senior Officer, The Invesco Funds | N/A | N/A | ||||
| John M. Zerr — 1962 Senior Vice President, Chief Legal Officer and Secretary | 2006 | Director, Senior Vice President, Secretary and General Counsel, Invesco Management Group, Inc. (formerly known as Invesco Aim Management Group, Inc.) and Van Kampen Exchange Corp.; Senior Vice President, Invesco Advisers, Inc. (formerly known as Invesco Institutional (N.A.), Inc.) (registered investment adviser); Senior Vice President and Secretary, Invesco Distributors, Inc. (formerly known as Invesco Aim Distributors, Inc.); Director, Vice President and Secretary, Invesco Investment Services, Inc. (formerly known as Invesco Aim Investment Services, Inc.) and IVZ Distributors, Inc. (formerly known as INVESCO Distributors, Inc.); Director and Vice President, INVESCO Funds Group, Inc.; Senior Vice President, Chief Legal Officer and Secretary, The Invesco Funds; Manager, Invesco PowerShares Capital Management LLC; Director, Secretary and General Counsel, Invesco Investment Advisers LLC (formerly known as Van Kampen Asset Management); Secretary and General Counsel, Invesco Capital Markets, Inc. (formerly known as Van Kampen Funds Inc.) and Chief Legal Officer, PowerShares Exchange-Traded Fund Trust, PowerShares Exchange-Traded Fund Trust II, PowerShares India Exchange-Traded Fund Trust and PowerShares Actively Managed Exchange-Traded Fund Trust
Formerly: Director and Vice President, Van Kampen Advisors Inc.; Director, Vice President, Secretary and General Counsel, Van Kampen Investor Services Inc.; Director, Invesco Distributors, Inc. (formerly known as Invesco Aim Distributors, Inc.); Director, Senior Vice President, General Counsel and Secretary, Invesco Aim Advisers, Inc. and Van Kampen Investments Inc.; Director, Vice President and Secretary, Fund Management Company; Director, Senior Vice President, Secretary, General Counsel and Vice President, Invesco Aim Capital Management, Inc.; Chief Operating Officer and General Counsel, Liberty Ridge Capital, Inc. (an investment adviser); Vice President and Secretary, PBHG Funds (an investment company) and PBHG Insurance Series Fund (an investment company); Chief Operating Officer, General Counsel and Secretary, Old Mutual Investment Partners (a broker-dealer); General Counsel and Secretary, Old Mutual Fund Services (an administrator) and Old Mutual Shareholder Services (a shareholder servicing center); Executive Vice President, General Counsel and Secretary, Old Mutual Capital, Inc. (an investment adviser); and Vice President and Secretary, Old Mutual Advisors Funds (an investment company) | N/A | N/A | ||||
| Karen Dunn Kelley — 1960 Vice President | 2003 | Head of Invesco’s World Wide Fixed Income and Cash Management Group; Director, Co-President, Co-Chief Executive Officer, and Co-Chairman, Invesco Advisers, Inc. (formerly known as Invesco Institutional (N.A.), Inc.) (registered investment adviser); Chairman, Invesco Senior Secured Management, Inc.; Senior Vice President, Invesco Management Group, Inc. (formerly known as Invesco Aim Management Group, Inc.); Executive Vice President, Invesco Distributors, Inc. (formerly known as Invesco Aim Distributors, Inc.); Director, Invesco Mortgage Capital Inc., and Invesco Management Company Limited; Director and President, INVESCO Asset Management (Bermuda) Ltd., Vice President, The Invesco Funds (other than AIM Treasurer’s Series Trust (Invesco Treasurer’s Series Trust) and Short-Term Investments Trust); and President and Principal Executive Officer, The Invesco Funds (AIM Treasurer’s Series Trust (Invesco Treasurer’s Series Trust) and Short-Term Investments Trust only)
Formerly: Director, INVESCO Global Asset Management Limited and INVESCO Management S.A.; Senior Vice President, Van Kampen Investments Inc. and Invesco Advisers, Inc. (formerly known as Invesco Institutional (N.A.), Inc.) (registered investment adviser); Vice President, Invesco Advisers, Inc. (formerly known as Invesco Institutional (N.A.), Inc.); Director of Cash Management and Senior Vice President, Invesco Advisers, Inc. and Invesco Aim Capital Management, Inc.; President and Principal Executive Officer, Tax-Free Investments Trust; Director and President, Fund Management Company; Chief Cash Management Officer, Director of Cash Management, Senior Vice President, and Managing Director, Invesco Aim Capital Management, Inc.; Director of Cash Management, Senior Vice President, and Vice President, Invesco Advisers, Inc. and The Invesco Funds (AIM Treasurer’s Series Trust (Invesco Treasurer’s Series Trust), Short-Term Investments Trust and Tax-Free Investments Trust only) | N/A | N/A | ||||
T-3 Invesco Small Cap Discovery Fund
Trustees and Officers—(continued)
Name, Year of Birth and Position(s) Held with the Trust | Trustee and/ or Officer Since | Principal Occupation(s) During Past 5 Years | Number of Funds in Fund Complex Overseen by Trustee | Other Directorship(s) Held by Trustee During Past 5 Years | ||||
| Other Officers—(continued) | ||||||||
| Sheri Morris — 1964 Vice President, Treasurer and Principal Financial Officer | 2003 | Vice President, Treasurer and Principal Financial Officer, The Invesco Funds; Vice President, Invesco Advisers, Inc. (formerly known as Invesco Institutional (N.A.), Inc.) (registered investment adviser); and Vice President, PowerShares Exchange-Traded Fund Trust, PowerShares Exchange-Traded Fund Trust II, PowerShares India Exchange-Traded Fund Trust and PowerShares Actively Managed Exchange-Traded Fund Trust
Formerly: Vice President, Invesco Aim Advisers, Inc., Invesco Aim Capital Management, Inc. and Invesco Aim Private Asset Management, Inc.; Assistant Vice President and Assistant Treasurer, The Invesco Funds and Assistant Vice President, Invesco Advisers, Inc., Invesco Aim Capital Management, Inc. and Invesco Aim Private Asset Management, Inc.; and Treasurer, PowerShares Exchange-Traded Fund Trust, PowerShares Exchange-Traded Fund Trust II, PowerShares India Exchange-Traded Fund Trust and PowerShares Actively Managed Exchange-Traded Fund Trust | N/A | N/A | ||||
Crissie M. Wisdom — 1969 Anti-Money Laundering Compliance Officer | 2013 | Anti-Money Laundering Compliance Officer, Invesco Advisers, Inc. (formerly known as Invesco Institutional (N.A.), Inc.) (registered investment adviser), Invesco Capital Markets, Inc. (formerly known as Van Kampen Funds Inc.), Invesco Distributors, Inc., Invesco Investment Services, Inc., Invesco Management Group, Inc., Van Kampen Exchange Corp., The Invesco Funds, Invesco Funds (Chicago), and PowerShares Exchange-Traded Fund Trust, PowerShares Exchange-Traded Fund Trust II, PowerShares India Exchange-Traded Fund Trust, and PowerShares Actively Managed Exchange-Traded Fund Trust; and Fraud Prevention Manager and Controls and Risk Analysis Manager for Invesco Investment Services, Inc. | N/A | N/A | ||||
| Todd L. Spillane — 1958 Chief Compliance Officer | 2006 | Senior Vice President, Invesco Management Group, Inc. (formerly known as Invesco Aim Management Group, Inc.) and Van Kampen Exchange Corp.; Senior Vice President and Chief Compliance Officer, Invesco Advisers, Inc. (registered investment adviser) (formerly known as Invesco Institutional (N.A.), Inc.); Chief Compliance Officer, The Invesco Funds; Vice President, Invesco Distributors, Inc. (formerly known as Invesco Aim Distributors, Inc.) and Invesco Investment Services, Inc. (formerly known as Invesco Aim Investment Services, Inc.)
Formerly: Chief Compliance Officer, Invesco Funds (Chicago); Senior Vice President, Van Kampen Investments Inc.; Senior Vice President and Chief Compliance Officer, Invesco Aim Advisers, Inc. and Invesco Aim Capital Management, Inc.; Chief Compliance Officer, INVESCO Private Capital Investments, Inc. (holding company), Invesco Private Capital, Inc. (registered investment adviser), Invesco Global Asset Management (N.A.), Inc., Invesco Senior Secured Management, Inc. (registered investment adviser), Van Kampen Investor Services Inc., PowerShares Exchange-Traded Fund Trust, PowerShares Exchange-Traded Fund Trust II, PowerShares India Exchange-Traded Fund Trust and PowerShares Actively Managed Exchange-Traded Fund Trust; and Vice President, Invesco Aim Capital Management, Inc. and Fund Management Company | N/A | N/A |
The Statement of Additional Information of the Trust includes additional information about the Fund’s Trustees and is available upon request, without charge, by calling 1.800.959.4246. Please refer to the Fund’s prospectus for information on the Fund’s sub-advisers.
Office of the Fund 11 Greenway Plaza, Suite 1000 Houston, TX 77046-1173 | Investment Adviser Invesco Advisers, Inc. 1555 Peachtree Street, N.E. Atlanta, GA 30309 | Distributor Invesco Distributors, Inc. 11 Greenway Plaza, Suite 1000 Houston, TX 77046-1173 | Auditors PricewaterhouseCoopers LLP 1201 Louisiana Street, Suite 2900 Houston, TX 77002-5678 | |||
Counsel to the Fund Stradley Ronon Stevens & Young, LLP 2005 Market Street, Suite 2600 Philadelphia, PA 19103-7018 | Counsel to the Independent Trustees Goodwin Procter LLP 901 New York Avenue, N.W. Washington, D.C. 20001 | Transfer Agent Invesco Investment Services, Inc. 11 Greenway Plaza, Suite 1000 Houston, TX 77046-1173 | Custodian State Street Bank and Trust Company 225 Franklin Street Boston, MA 02110-2801 | |||
T-4 Invesco Small Cap Discovery Fund

Invesco mailing information
Send general correspondence to Invesco Investment Services, Inc., P.O. Box 219078, Kansas City, MO 64121-9078.
Invesco privacy policy
You share personal and financial information with us that is necessary for your transactions and your account records. We take very seriously the obligation to keep that information confidential and private.
Invesco collects nonpublic personal information about you from account applications or other forms you complete and from your transactions with us or our affiliates. We do not disclose information about you or our former customers to service providers or other third parties except to the extent necessary to service your account and in other limited circumstances as permitted by law. For example, we use this information to facilitate the delivery of transaction confirmations, financial reports, prospectuses and tax forms.
Even within Invesco, only people involved in the servicing of your accounts and compliance monitoring have access to your information. To ensure the highest level of confidentiality and security, Invesco maintains physical, electronic and procedural safeguards that meet or exceed federal standards. Special measures, such as data encryption and authentication, apply to your communications with us on our website. More detail is available to you at invesco.com/privacy.
Important notice regarding delivery of security holder documents
To reduce Fund expenses, only one copy of most shareholder documents may be mailed to shareholders with multiple accounts at the same address (Householding). Mailing of your shareholder documents may be householded indefinitely unless you instruct us otherwise. If you do not want the mailing of these documents to be combined with those for other members of your household, please contact Invesco Investment Services, Inc. at 800 959 4246 or contact your financial institution. We will begin sending you individual copies for each account within 30 days after receiving your request.
Fund holdings and proxy voting information
The Fund provides a complete list of its holdings four times in each fiscal year, at the quarter ends. For the second and fourth quarters, the lists appear in the Fund’s semiannual and annual reports to shareholders. For the first and third quarters, the Fund files the lists with the Securities and Exchange Commission (SEC) on Form N-Q. The most recent list of portfolio holdings is available at invesco.com/completeqtrholdings. Shareholders can also look up the Fund’s Forms N-Q on the SEC website at sec.gov. Copies of the Fund’s Forms N-Q may be reviewed and copied at the SEC Public Reference Room in Washington, D.C. You can obtain information on the operation of the Public Reference Room, including information about duplicating fee charges, by calling 202 551 8090 or 800 732 0330, or by electronic request at the following email address: publicinfo@sec.gov. The SEC file numbers for the Fund are shown below.
A description of the policies and procedures that the Fund uses to determine how to vote proxies relating to portfolio securities is available without charge, upon request, from our Client Services department at 800 959 4246 or at invesco.com/proxyguidelines. The information is also available on the SEC website, sec.gov.
Information regarding how the Fund voted proxies related to its portfolio securities during the most recent 12-month period ended June 30 is available at invesco.com/proxysearch. The information is also available on the SEC website, sec.gov. Invesco Advisers, Inc. is an investment adviser; it provides investment advisory services to individual and institutional clients and does not sell securities. Invesco Distributors, Inc. is the US distributor for Invesco Ltd.’s retail mutual funds, exchange-traded funds and institutional money market funds. Both are wholly owned, indirect subsidiaries of Invesco Ltd. |  | |
| SEC file numbers: 811-09913 and 333-36074 VK-SCD-AR-1 Invesco Distributors, Inc. | ||
| ITEM 2. | CODE OF ETHICS. |
There were no amendments to the Code of Ethics (the “Code”) that applies to the Registrant’s Principal Executive Officer (“PEO”) and Principal Financial Officer (“PFO”) during the period covered by the report. The Registrant did not grant any waivers, including implicit waivers, from any provisions of the Code to the PEO or PFO during the period covered by this report.
| ITEM 3. | AUDIT COMMITTEE FINANCIAL EXPERT. |
The Board of Trustees has determined that the Registrant has at least one audit committee financial expert serving on its Audit Committee. The Audit Committee financial expert is Raymond Stickel, Jr. Mr. Stickel is “independent” within the meaning of that term as used in Form N-CSR.
| ITEM 4. | PRINCIPAL ACCOUNTANT FEES AND SERVICES. |
(a) to (d)
Fees Billed by PWC Related to the Registrant
PWC billed the Registrant aggregate fees for services rendered to the Registrant for the last two fiscal years as follows:
| Fees Billed for Services Rendered to the Registrant for fiscal year end 2013 | (e)(2) Percentage of Fees Billed Applicable to Non-Audit Services Provided for fiscal year end 2013 Pursuant to Waiver of Pre-Approval Requirement(1) | Fees Billed for Services Rendered to the Registrant for fiscal year end 2012 | (e)(2) Percentage of Fees Billed Applicable to Non-Audit Services Provided for fiscal year end 2012 Pursuant to Waiver of Pre-Approval Requirement(1) | |||||||||||||
Audit Fees | $ | 470,602 | N/A | $ | 404,100 | N/A | ||||||||||
Audit-Related Fees | $ | 0 | 0 | % | $ | 0 | 0 | % | ||||||||
Tax Fees(2) | $ | 124,450 | 0 | % | $ | 104,700 | 0 | % | ||||||||
All Other Fees | $ | 0 | 0 | % | $ | 0 | 0 | % | ||||||||
|
|
|
| |||||||||||||
Total Fees | $ | 595,052 | 0 | % | $ | 508,800 | 0 | % | ||||||||
(g) PWC billed the Registrant aggregate non-audit fees of $124,450 for the fiscal year ended 2013, and $104,700 for the fiscal year ended 2012, for non-audit services rendered to the Registrant.
| (1) | With respect to the provision of non-audit services, the pre-approval requirement is waived pursuant to a de minimis exception if (i) such services were not recognized as non-audit services by the Registrant at the time of engagement, (ii) the aggregate amount of all such services provided is no more than 5% of the aggregate audit and non-audit fees paid by the Registrant to PWC during a fiscal year; and (iii) such services are promptly brought to the attention of the Registrant’s Audit Committee and approved by the Registrant’s Audit Committee prior to the completion of the audit. |
| (2) | Tax fees for the fiscal year end 2013 include fees billed for reviewing tax returns and fund mergers. Tax fees for the fiscal year end 2012 includes fees billed for reviewing tax returns and consultation services. |
Fees Billed by PWC Related to Invesco and Invesco Affiliates
PWC billed Invesco Advisers, Inc. (“Invesco”), the Registrant’s adviser, and any entity controlling, controlled by or under common control with Invesco that provides ongoing services to the Registrant (“Invesco Affiliates”) aggregate fees for pre-approved non-audit services rendered to Invesco and Invesco Affiliates for the last two fiscal years as follows:
| Fees Billed for Non- Audit Services Rendered to Invesco and Invesco Affiliates for fiscal year end 2013 That Were Required to be Pre-Approved by the Registrant’s Audit Committee | (e)(2) Percentage of Fees Billed Applicable to Non-Audit Services Provided for fiscal year end 2013 Pursuant to Waiver of Pre- Approval Requirement(1) | Fees Billed for Non- Audit Services Rendered to Invesco and Invesco Affiliates for fiscal year end 2012 That Were Required to be Pre-Approved by the Registrant’s Audit Committee | (e)(2) Percentage of Fees Billed Applicable to Non-Audit Services Provided for fiscal year end 2012 Pursuant to Waiver of Pre- Approval Requirement(1) | |||||||||||||
Audit-Related Fees | $ | 0 | 0 | % | $ | 0 | 0 | % | ||||||||
Tax Fees | $ | 0 | 0 | % | $ | 0 | 0 | % | ||||||||
All Other Fees | $ | 0 | 0 | % | $ | 0 | 0 | % | ||||||||
|
|
|
| |||||||||||||
Total Fees(2) | $ | 0 | 0 | % | $ | 0 | 0 | % | ||||||||
| (1) | With respect to the provision of non-audit services, the pre-approval requirement is waived pursuant to a de minimis exception if (i) such services were not recognized as non-audit services by the Registrant at the time of engagement, (ii) the aggregate amount of all such services provided is no more than 5% of the aggregate audit and non-audit fees paid by the Registrant, Invesco and Invesco Affiliates to PWC during a fiscal year; and (iii) such services are promptly brought to the attention of the Registrant’s Audit Committee and approved by the Registrant’s Audit Committee prior to the completion of the audit. |
| (2) | (g) Including the fees for services not required to be pre-approved by the registrant’s audit committee, PWC billed Invesco and Invesco Affiliates aggregate non-audit fees of $7,055 for the fiscal year ended 2013, and $0 for the fiscal year ended 2012, for non-audit services rendered to Invesco and Invesco Affiliates. |
(h) The Audit Committee also has considered whether the provision of non-audit services that were rendered to Invesco and Invesco Affiliates that were not required to be pre-approved pursuant to SEC regulations, if any, is compatible with maintaining PWC’s independence. To the extent that such services were provided, the Audit Committee determined that the provision of such services is compatible with PWC maintaining independence with respect to the Registrant.
(f) Not applicable.
(e)(1)
PRE-APPROVAL OF AUDIT AND NON-AUDIT SERVICES
POLICIES AND PROCEDURES
As adopted by the Audit Committees of
the Invesco Funds (the “Funds”)
Last Amended May 4, 2010
Statement of Principles
Under the Sarbanes-Oxley Act of 2002 and rules adopted by the Securities and Exchange Commission (“SEC”) (“Rules”), the Audit Committees of the Funds’ (the “Audit Committees”) Board of Trustees (the “Board”) are responsible for the appointment, compensation and oversight of the work of independent accountants (an “Auditor”). As part of this responsibility and to assure that the Auditor’s independence is not impaired, the Audit Committees pre-approve the audit and non-audit services provided to the Funds by each Auditor, as well as all non-audit services provided by the Auditor to the Funds’ investment adviser and to affiliates of the adviser that provide ongoing services to the Funds (“Service Affiliates”) if the services directly impact the Funds’ operations or financial reporting. The SEC Rules also specify the types of services that an Auditor may not provide to its audit client. The following policies and procedures comply with the requirements for pre-approval and provide a mechanism by which management of the Funds may request and secure pre-approval of audit and non-audit services in an orderly manner with minimal disruption to normal business operations.
Proposed services either may be pre-approved without consideration of specific case-by-case services by the Audit Committees (“general pre-approval”) or require the specific pre-approval of the Audit Committees (“specific pre-approval”). As set forth in these policies and procedures, unless a type of service has received general pre-approval, it will require specific pre-approval by the Audit Committees. Additionally, any fees exceeding 110% of estimated pre-approved fee levels provided at the time the service was pre-approved will also require specific approval by the Audit Committees before payment is made. The Audit Committees will also consider the impact of additional fees on the Auditor’s independence when determining whether to approve any additional fees for previously pre-approved services.
The Audit Committees will annually review and generally pre-approve the services that may be provided by each Auditor without obtaining specific pre-approval from the Audit Committee generally on an annual basis. The term of any general pre-approval runs from the date of such pre-approval through September 30th of the following year, unless the Audit Committees consider a different period and state otherwise. The Audit Committees will add to or subtract from the list of general pre-approved services from time to time, based on subsequent determinations.
The purpose of these policies and procedures is to set forth the guidelines to assist the Audit Committees in fulfilling their responsibilities.
Delegation
The Audit Committees may from time to time delegate pre-approval authority to one or more of its members who are Independent Trustees. All decisions to pre-approve a service by a delegated member shall be reported to the Audit Committees at the next quarterly meeting.
Audit Services
The annual audit services engagement terms will be subject to specific pre-approval of the Audit Committees. Audit services include the annual financial statement audit and other procedures such as tax provision work that is required to be performed by the independent auditor to be able to form an opinion on the Funds’ financial statements. The Audit Committees will obtain, review and consider sufficient information concerning the proposed Auditor to make a reasonable evaluation of the Auditor’s qualifications and independence.
In addition to the annual Audit services engagement, the Audit Committees may grant either general or specific pre-approval of other audit services, which are those services that only the independent auditor reasonably can provide. Other Audit services may include services such as issuing consents for the inclusion of audited financial statements with SEC registration statements, periodic reports and other documents filed with the SEC or other documents issued in connection with securities offerings.
Non-Audit Services
The Audit Committees may provide either general or specific pre-approval of any non-audit services to the Funds and its Service Affiliates if the Audit Committees believe that the provision of the service will not impair the independence of the Auditor, is consistent with the SEC’s Rules on auditor independence, and otherwise conforms to the Audit Committees’ general principles and policies as set forth herein.
Audit-Related Services
“Audit-related services” are assurance and related services that are reasonably related to the performance of the audit or review of the Fund’s financial statements or that are traditionally performed by the independent auditor. Audit-related services include, among others, accounting consultations related to accounting, financial reporting or disclosure matters not classified as “Audit services”; assistance with understanding and implementing new accounting and financial reporting guidance from rulemaking authorities; and agreed-upon procedures related to mergers, compliance with ratings agency requirements and interfund lending activities.
Tax Services
“Tax services” include, but are not limited to, the review and signing of the Funds’ federal tax returns, the review of required distributions by the Funds and consultations regarding tax matters such as the tax treatment of new investments or the impact of new regulations. The Audit Committees will scrutinize carefully the retention of the Auditor in connection with a transaction initially recommended by the Auditor, the major business purpose of which may be tax avoidance or the tax treatment of which may not be supported in the Internal Revenue Code and related regulations. The Audit Committees will consult with the Funds’ Treasurer (or his or her designee) and may consult with outside counsel or advisors as necessary to ensure the consistency of Tax services rendered by the Auditor with the foregoing policy.
No Auditor shall represent any Fund or any Service Affiliate before a tax court, district court or federal court of claims.
Under rules adopted by the Public Company Accounting Oversight Board and approved by the SEC, in connection with seeking Audit Committees’ pre-approval of permissible Tax services, the Auditor shall:
| 1. | Describe in writing to the Audit Committees, which writing may be in the form of the proposed engagement letter: |
| a. | The scope of the service, the fee structure for the engagement, and any side letter or amendment to the engagement letter, or any other agreement between the Auditor and the Fund, relating to the service; and |
| b. | Any compensation arrangement or other agreement, such as a referral agreement, a referral fee or fee-sharing arrangement, between the Auditor and any person (other than the Fund) with respect to the promoting, marketing, or recommending of a transaction covered by the service; |
| 2. | Discuss with the Audit Committees the potential effects of the services on the independence of the Auditor; and |
| 3. | Document the substance of its discussion with the Audit Committees. |
All Other Auditor Services
The Audit Committees may pre-approve non-audit services classified as “All other services” that are not categorically prohibited by the SEC, as listed in Exhibit 1 to this policy.
Pre-Approval Fee Levels or Established Amounts
Pre-approval of estimated fees or established amounts for services to be provided by the Auditor under general or specific pre-approval policies will be set periodically by the Audit Committees. Any proposed fees exceeding 110% of the maximum estimated pre-approved fees or established amounts for pre-approved audit and non-audit services will be reported to the Audit Committees at the quarterly Audit Committees meeting and will require specific approval by the Audit Committees before payment is made. The Audit Committees will always factor in the overall relationship of fees for audit and non-audit services in determining whether to pre-approve any such services and in determining whether to approve any additional fees exceeding 110% of the maximum pre-approved fees or established amounts for previously pre-approved services.
Procedures
Generally on an annual basis, Invesco Advisers, Inc. (“Invesco”) will submit to the Audit Committees for general pre-approval, a list of non-audit services that the Funds or Service Affiliates of the Funds may request from the Auditor. The list will describe the non-audit services in reasonable detail and will include an estimated range of fees and such other information as the Audit Committee may request.
Each request for services to be provided by the Auditor under the general pre-approval of the Audit Committees will be submitted to the Funds’ Treasurer (or his or her designee) and must include a detailed description of the services to be rendered. The Treasurer or his or her designee will ensure that such services are included within the list of services that have received the general pre-approval of the Audit Committees. The Audit Committees will be informed at the next quarterly scheduled Audit Committees meeting of any such services for which the Auditor rendered an invoice and whether such services and fees had been pre-approved and if so, by what means.
Each request to provide services that require specific approval by the Audit Committees shall be submitted to the Audit Committees jointly by the Fund’s Treasurer or his or her designee and the Auditor, and must include a joint statement that, in their view, such request is consistent with the policies and procedures and the SEC Rules.
Each request to provide tax services under either the general or specific pre-approval of the Audit Committees will describe in writing: (i) the scope of the service, the fee structure for the engagement, and any side letter or amendment to the engagement letter, or any other agreement between the Auditor and the audit client, relating to the service; and (ii) any compensation arrangement or other agreement between the Auditor and any person (other than the audit client) with respect to the promoting, marketing, or recommending of a transaction covered by the service. The Auditor will discuss with the Audit Committees the potential effects of the services on the Auditor’s independence and will document the substance of the discussion.
Non-audit services pursuant to the de minimis exception provided by the SEC Rules will be promptly brought to the attention of the Audit Committees for approval, including documentation that each of the conditions for this exception, as set forth in the SEC Rules, has been satisfied.
On at least an annual basis, the Auditor will prepare a summary of all the services provided to any entity in the investment company complex as defined in section 2-01(f)(14) of Regulation S-X in sufficient detail as to the nature of the engagement and the fees associated with those services.
The Audit Committees have designated the Funds’ Treasurer to monitor the performance of all services provided by the Auditor and to ensure such services are in compliance with these policies and procedures. The Funds’ Treasurer will report to the Audit Committees on a periodic basis as to the results of such monitoring. Both the Funds’ Treasurer and management of Invesco will immediately report to the chairman of the Audit Committees any breach of these policies and procedures that comes to the attention of the Funds’ Treasurer or senior management of Invesco.
Exhibit 1 to Pre-Approval of Audit and Non-Audit Services Policies and Procedures
Conditionally Prohibited Non-Audit Services (not prohibited if the Fund can reasonably conclude that the results of the service would not be subject to audit procedures in connection with the audit of the Fund’s financial statements)
| • | Bookkeeping or other services related to the accounting records or financial statements of the audit client |
| • | Financial information systems design and implementation |
| • | Appraisal or valuation services, fairness opinions, or contribution-in-kind reports |
| • | Actuarial services |
| • | Internal audit outsourcing services |
Categorically Prohibited Non-Audit Services
| • | Management functions |
| • | Human resources |
| • | Broker-dealer, investment adviser, or investment banking services |
| • | Legal services |
| • | Expert services unrelated to the audit |
| • | Any service or product provided for a contingent fee or a commission |
| • | Services related to marketing, planning, or opining in favor of the tax treatment of confidential transactions or aggressive tax position transactions, a significant purpose of which is tax avoidance |
| • | Tax services for persons in financial reporting oversight roles at the Fund |
| • | Any other service that the Public Company Oversight Board determines by regulation is impermissible. |
| ITEM 5. | AUDIT COMMITTEE OF LISTED REGISTRANTS. |
Not applicable.
| ITEM 6. | SCHEDULE OF INVESTMENTS. |
Investments in securities of unaffiliated issuers is included as part of the reports to stockholders filed under Item 1 of this Form.
| ITEM 7. | DISCLOSURE OF PROXY VOTING POLICIES AND PROCEDURES FOR CLOSED-END MANAGEMENT INVESTMENT COMPANIES. |
Not applicable.
| ITEM 8. | PORTFOLIO MANAGERS OF CLOSED-END MANAGEMENT COMPANIES. |
Not applicable.
| ITEM 9. | PURCHASES OF EQUITY SECURITIES BY CLOSED-END MANAGEMENT INVESTMENT COMPANY AND AFFILIATED PURCHASERS. |
Not applicable.
| ITEM 10. | SUBMISSION OF MATTERS TO A VOTE OF SECURITY HOLDERS. |
None
| ITEM 11. | CONTROLS AND PROCEDURES. |
| (a) | As of August 13, 2013, an evaluation was performed under the supervision and with the participation of the officers of the Registrant, including the PEO and PFO, to assess the effectiveness of the Registrant’s disclosure controls and procedures, as that term is defined in Rule 30a-3(c) under the Investment Company Act of 1940 (the “Act”), as amended. Based on that evaluation, the Registrant’s officers, including the PEO and PFO, concluded that, as of August 13, 2013, the Registrant’s disclosure controls and procedures were reasonably designed to ensure: (1) that information required to be disclosed by the Registrant on Form N-CSR is recorded, processed, summarized and reported within the time periods specified by the rules and forms of the Securities and Exchange Commission; and (2) that material information relating to the Registrant is made known to the PEO and PFO as appropriate to allow timely decisions regarding required disclosure. |
| (b) | There have been no changes in the Registrant’s internal control over financial reporting (as defined in Rule 30a-3(d) under the Act) that occurred during the second fiscal quarter of the period covered by this report that have materially affected, or are reasonably likely to materially affect, the Registrant’s internal control over financial reporting. |
| ITEM 12. | EXHIBITS. |
| 12(a) (1) | Code of Ethics. | |
| 12(a) (2) | Certifications of principal executive officer and principal financial officer as required by Rule 30a-2(a) under the Investment Company Act of 1940. | |
| 12(a) (3) | Not applicable. | |
| 12(b) | Certifications of principal executive officer and principal financial officer as required by Rule 30a-2(b) under the Investment Company Act of 1940. | |
SIGNATURES
Pursuant to the requirements of the Securities Exchange Act of 1934 and the Investment Company Act of 1940, the Registrant has duly caused this report to be signed on its behalf by the undersigned, thereunto duly authorized.
Registrant: AIM Counselor Series Trust (Invesco Counselor Series Trust)
| By: | /s/ Philip A. Taylor | |
| Philip A. Taylor | ||
| Principal Executive Officer | ||
| Date: | November 8, 2013 | |
Pursuant to the requirements of the Securities and Exchange Act of 1934 and the Investment Company Act of 1940, this report has been signed below by the following persons on behalf of the Registrant and in the capacities and on the dates indicated.
| By: | /s/ Philip A. Taylor | |
| Philip A. Taylor | ||
| Principal Executive Officer | ||
| Date: | November 8, 2013 | |
| By: | /s/ Sheri Morris | |
| Sheri Morris | ||
| Principal Financial Officer | ||
| Date: | November 8, 2013 | |
EXHIBIT INDEX
| 12(a) (1) | Code of Ethics. | |
| 12(a) (2) | Certifications of principal executive officer and principal financial officer as required by Rule 30a-2(a) under the Investment Company Act of 1940. | |
| 12(a) (3) | Not applicable. | |
| 12(b) | Certifications of principal executive officer and principal financial officer as required by Rule 30a-2(b) under the Investment Company Act of 1940. | |