OMB APPROVAL | ||||
| OMB Number: | 3235-0570 | |||
| Expires: | January 31, 2017 | |||
| Estimated average burden | ||||
| hours per response: | 20.6 | |||
UNITED STATES
SECURITIES AND EXCHANGE COMMISSION
Washington, D.C. 20549
FORM N-CSR
CERTIFIED SHAREHOLDER REPORT OF REGISTERED
MANAGEMENT INVESTMENT COMPANIES
Investment Company Act file number 811-09913
AIM Counselor Series Trust (Invesco Counselor Series Trust)
(Exact name of registrant as specified in charter)
11 Greenway Plaza, Suite 1000 Houston, Texas 77046
(Address of principal executive offices) (Zip code)
Philip A. Taylor 11 Greenway Plaza, Suite 1000 Houston, Texas 77046
(Name and address of agent for service)
Registrant’s telephone number, including area code: (713) 626-1919
Date of fiscal year end: 8/31
Date of reporting period: 8/31/15
Item 1. Report to Stockholders.
|
| |||
Annual Report to Shareholders
| August 31, 2015 | |||
Invesco American Franchise Fund | ||||
Nasdaq: A: VAFAX ¡ B: VAFBX ¡ C: VAFCX ¡ R: VAFRX ¡ Y: VAFIX ¡ R5: VAFNX ¡ R6: VAFFX | ||||


Letters to Shareholders
Philip Taylor | Dear Shareholders: This annual report includes information about your Fund, including performance data and a complete list of its investments as of the close of the reporting period. Inside is a discussion of how your Fund was managed and the factors that affected its performance during the reporting period. I hope you find this report of interest. The US economy expanded and unemployment declined throughout the reporting period. The sharp drop in oil prices that began in mid-2014 continued to benefit consumers, but a strong US dollar crimped corporate profits. The US Federal Reserve signaled that it was increasingly likely to raise interest rates, based on generally positive economic data, but uncertainty remained about when it would act. Overseas, the story was much different. Low energy prices hurt the economies of some oil-producing nations, such as Brazil and Russia. During the reporting period, the European Central Bank as well as central banks in China | |
| and Japan – among other countries – either instituted or maintained extraordinarily accommodative monetary policies in response to economic weakness. | ||

Investor uncertainty, such as we saw for much of the reporting period – and market volatility, such as we saw at the end of the reporting period – are unfortunate facts of life when it comes to investing. Some investors use these things as excuses to delay saving and investing for their long-term financial goals. That’s why Invesco encourages investors to work with a professional financial adviser who can stress the importance of starting to save and invest early and the importance of adhering to a disciplined investment plan – when times are good and when they’re uncertain. A financial adviser who knows your unique financial situation, investment goals and risk tolerance can be an invaluable partner as you seek to achieve your financial goals. He or she can offer a long-term perspective when markets are volatile and time-tested advice and guidance when your financial situation or investment goals change.
Timely information when and where you want it
Invesco’s efforts to help investors achieve their financial objectives include providing individual investors and financial professionals with timely information about the markets, the economy and investing – whenever and wherever they want it.
Our website, invesco.com/us, offers a wide range of market insights and investment perspectives. On the website, you’ll find detailed information about our funds, including prices, performance, holdings and portfolio manager commentaries. You can access information about your account by completing a simple, secure online registration. Click on the “Need to register” link in the “Account Access” box on our homepage to get started.
Invesco’s mobile apps for iPhone® and iPad® (both available free from the App StoreSM) allow you to obtain the same detailed information, monitor your account and create customizable watch lists. Also, they allow you to access investment insights from our investment leaders, market strategists, economists and retirement experts. You can sign up to be alerted when new commentary is added, and you can watch portfolio manager videos and have instant access to Invesco news and updates wherever you may be.
In addition to the resources accessible on our website and through our mobile app, you can obtain timely updates to help you stay informed about the markets, the economy and investing by connecting with Invesco on Twitter, LinkedIn or Facebook. You can access our blog at blog.invesco.us.com. Our goal is to provide you the information you want, when and where you want it.
Have questions?
For questions about your account, feel free to contact an Invesco client services representative at 800 959 4246. For Invesco-related questions or comments, please email me directly at phil@invesco.com.
All of us at Invesco look forward to serving your investment management needs for many years to come. Thank you for investing with us.
Sincerely,

Philip Taylor
Senior Managing Director, Invesco Ltd.
iPhone and iPad are trademarks of Apple Inc., registered in the US and other countries. App Store is a service mark of Apple Inc. Invesco Distributors, Inc. is not affiliated with Apple Inc.
2 Invesco American Franchise Fund
Bruce Crockett | Dear Fellow Shareholders: Among the many important lessons I’ve learned in more than 40 years in a variety of business endeavors is the value of a trusted advocate. As independent chair of the Invesco Funds Board, I can assure you that the members of the Board are strong advocates for the interests of investors in Invesco’s mutual funds. We work hard to represent your interests through oversight of the quality of the investment management services your funds receive and other matters important to your investment, including but not limited to: n Ensuring that Invesco offers a diverse lineup of mutual funds that your financial adviser can use to strive to meet your financial needs as your investment goals change over time. n Monitoring how the portfolio management teams of the Invesco funds are performing in light of changing economic and market conditions. |

n Assessing each portfolio management team’s investment performance within the context of the investment strategy described in the fund’s prospectus.
n Monitoring for potential conflicts of interests that may impact the nature of the services that your funds receive.
We believe one of the most important services we provide our fund shareholders is the annual review of the funds’ advisory and sub-advisory contracts with Invesco Advisers and its affiliates. This review is required by the Investment Company Act of 1940 and focuses on the nature and quality of the services Invesco provides as the adviser to the Invesco funds and the reasonableness of the fees that it charges for those services. Each year, we spend months carefully reviewing information received from Invesco and a variety of independent sources, such as performance and fee data prepared by Lipper Inc., an independent, third-party firm widely recognized as a leader in its field. We also meet with our independent legal counsel and other independent advisers to review and help us assess the information that we have received. Our goal is to assure that you receive quality investment management services for a reasonable fee.
I trust the measures outlined above provide assurance that you have a worthy advocate when it comes to choosing the Invesco Funds.
As always, please contact me at bruce@brucecrockett.com with any questions or concerns you may have. On behalf of the Board, we look forward to continuing to represent your interests and serving your needs.
Sincerely,

Bruce L. Crockett
Independent Chair
Invesco Funds Board of Trustees
3 Invesco American Franchise Fund
Management’s Discussion of Fund Performance
Performance summary |
For the fiscal year ended August 31, 2015, Class A shares of Invesco American Franchise Fund (the Fund), at net asset value (NAV), produced a modest positive return but underperformed the Fund’s style-specific benchmark, the Russell 1000 Growth Index.
Your Fund’s long-term performance appears later in this report.
Fund vs. Indexes
Total returns, 8/31/14 to 8/31/15, at net asset value (NAV). Performance shown does not include applicable contingent deferred sales charges (CDSC) or front-end sales charges, which would have reduced performance.
Class A Shares | 0.27 | % | ||
Class B Shares | 0.27 | |||
Class C Shares | -0.46 | |||
Class R Shares | 0.03 | |||
Class Y Shares | 0.56 | |||
Class R5 Shares | 0.62 | |||
Class R6 Shares | 0.73 | |||
S&P 500 Indexq (Broad Market Index) | 0.48 | |||
Russell 1000 Growth Indexq (Style-Specific Index) | 4.26 | |||
Lipper Large-Cap Growth Funds Indexn (Peer Group Index) | 3.77 |
Source(s): qFactSet Research Systems Inc.; nLipper Inc.
Market conditions and your Fund
The US economy improved slowly, but somewhat steadily, during the fiscal year ended August 31, 2015 –although the performance of the underlying sectors of the economy varied dramatically. The headline story was the massive slowdown in energy markets, as oil prices plummeted when too much supply overwhelmed slowing global demand. However the more subtle story, which drove the economy forward during the year, was the improved position of the US consumer.
As the reporting period began, economic growth appeared to be stronger in the US than in the rest of the world. In mid-2014, when the price of oil began its sharp and prolonged decline, US equities fell as well. However, while global growth weakened and commodity-based economies and currencies underperformed those of the US, continued strengthening
of the US consumer led US equity markets higher through the spring. Continued low interest rates, the increasing availability of credit from lenders and an improving employment picture all contributed to higher consumer confidence. This strength also helped the market overcome summer fears that Greece and the eurozone would fail to reach agreement on a financial bailout plan. In the final weeks of the fiscal year, however, US equity markets moved sharply lower. A significant downturn in China’s financial markets, weak global economic growth and the uncertain timing of a potential US interest rate increase were negatives for jittery US markets. While stocks were up slightly for the fiscal year, they ended the reporting period on a negative note.
During the fiscal year, the Fund’s Class A shares at NAV produced a modest positive return that underperformed the
Fund’s style-specific benchmark, with holdings in some sectors, such as consumer staples and financials outperforming, while holdings in other sectors, such as energy, health care and industrials, underperformed the index.
The Fund outperformed its style-specific index by the widest margin in the consumer staples sector due to strong stock selection. One strong performer within the sector was CVS Health, which exited the tobacco business and also executed some key acquisitions and partnerships to strengthen its pharmacy business. Monster Beverage and Constellation Brands were other solid performers in this sector during the year.
In the financials sector, Morgan Stanley contributed to the Fund’s performance. The company benefited from better expense controls and a robust environment for mergers and acquisitions. Aon performed well, but we sold it when it reached our price target during the year. We purchased CME Group during the year, and it also contributed to Fund performance in the sector.
Several stocks in the consumer discretionary sector were among the top contributors to Fund performance, although the Fund modestly underperformed its style-specific benchmark in this sector during the year. Lowe’s benefited from the unfolding rebound in housing activity and strengthening consumer spending. Carnival and Amazon.com also were among the Fund’s top performing stocks.
Energy represented the worst performing sector of the market, and energy was also the area of greatest challenge for the Fund. Fund holding Whiting Petroleum was a significant detractor from Fund performance as oil prices plummeted due to an imbalance of supply and demand during the year. Oilfield services company Halliburton was another detractor, which we sold during the year.
Portfolio Composition |
By sector
Information Technology | 31.9 | % | ||
Consumer Discretionary | 21.4 | |||
Health Care | 21.0 | |||
Financials | 6.5 | |||
Industrials | 6.4 | |||
Consumer Staples | 5.4 | |||
Materials | 2.5 | |||
Telecommunication Services | 2.0 | |||
Energy | 1.3 | |||
Money Market Funds | ||||
Plus Other Assets Less Liabilities | 1.6 |
Top 10 Equity Holdings* |
| 1. Apple Inc. | 6.0% | |||
| 2. Facebook Inc.-Class A | 5.1 | |||
| 3. Google Inc.-Class A | 4.8 | |||
| 4. MasterCard, Inc.-Class A | 4.1 | |||
| 5. Gilead Sciences, Inc. | 3.7 | |||
| 6. Allergan PLC | 3.6 | |||
| 7. Amazon.com, Inc. | 3.6 | |||
| 8. Lowe’s Cos., Inc. | 3.4 | |||
| 9. Carnival Corp. | 3.2 | |||
| 10. Celgene Corp. | 2.9 | |||
| Total Net Assets | $9.2 billion | |||
| Total Number of Holdings* | 66 | |||
The Fund’s holdings are subject to change, and there is no assurance that the Fund will continue to hold any particular security.
*Excluding money market fund holdings.
| 4 | Invesco American Franchise Fund |
Health care was the best-performing sector of the market for the reporting period, but the Fund modestly underperformed its style-specific index in this sector. Biogen was a detractor from Fund performance as it faced foreign exchange headwinds and some challenges to its multiple sclerosis drugs. Gilead Sciences was another Fund holding that remained relatively flat over the fiscal year rather than appreciating with the health care sector. Much of the impact from these stocks was offset by solid contributions from other Fund holdings such as Celgene and Allergan, which were solid contributors to Fund results.
The Fund’s holdings in the industrials sector underperformed during the reporting period. At the start of the fiscal year, the Fund held stocks of industrial companies that were expected to benefit from infrastructure construction needed to transport and refine newfound US hydrocarbon resources. As the price of oil plummeted, many such projects were delayed or cancelled, causing the stocks of impacted companies to fall significantly. Jacobs Engineering Group, Fluor and Flowserve were detractors from Fund performance that we sold before the close of the reporting period.
Thank you for your commitment to Invesco American Franchise Fund and for sharing our long-term investment horizon.
The views and opinions expressed in management’s discussion of Fund performance are those of Invesco Advisers, Inc. These views and opinions are subject to change at any time based on factors such as market and economic conditions. These views and opinions may not be relied upon as investment advice or recommendations, or as an offer for a particular security. The information is not a complete analysis of every aspect of any market, country, industry, security or the Fund. Statements of fact are from sources considered reliable, but Invesco Advisers, Inc. makes no representation or warranty as to their completeness or accuracy. Although historical performance is no guarantee of future results, these insights may help you understand our investment management philosophy.
See important Fund and, if applicable, index disclosures later in this report.
| Erik Voss | |
| Chartered Financial Analyst, Portfolio Manager, is lead manager of Invesco American Franchise | ||
Fund. He joined Invesco in 2010. Mr. Voss earned a BS in mathematics and an MS in finance from the University of Wisconsin.
| ||
 | Ido Cohen Portfolio Manager, is manager of Invesco American Franchise Fund. He joined Invesco | |
| in 2010. Mr. Cohen earned a BS in economics from The Wharton School of the University of Pennsylvania. | ||

5 Invesco American Franchise Fund
Your Fund’s Long-Term Performance
Results of a $10,000 Investment – Oldest Share Class(es)
Fund and index data from 8/31/05
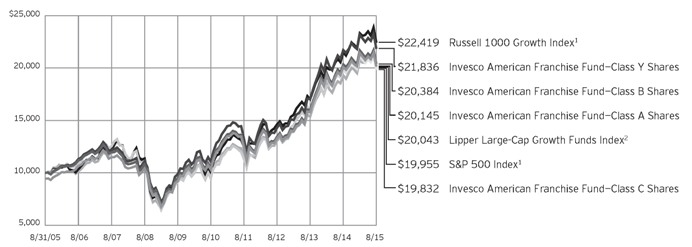
| 1 | Source: FactSet Research Systems Inc. |
| 2 | Source: Lipper Inc. |
Past performance cannot guarantee comparable future results.
The data shown in the chart include reinvested distributions, applicable sales charges and Fund expenses including management fees. Results for Class B shares are calculated as if a hypothetical
shareholder had liquidated his entire investment in the Fund at the close of the reporting period and paid the contingent deferred sales charges, if applicable. Index results include reinvested dividends, but they do not reflect sales charges. Performance of the peer group,
if applicable, reflects fund expenses and management fees; performance of a market index does not. Performance shown in the chart and table(s) does not reflect deduction of taxes a shareholder would pay on Fund distributions or sale of Fund shares.
6 Invesco American Franchise Fund
Average Annual Total Returns |
| |||
As of 8/31/15, including maximum applicable sales charges
|
| |||
Class A Shares | ||||
Inception (6/23/05) | 7.29 | % | ||
10 Years | 7.25 | |||
5 Years | 13.04 | |||
1 Year | -5.24 | |||
Class B Shares | ||||
Inception (6/23/05) | 7.40 | % | ||
10 Years | 7.38 | |||
5 Years | 13.94 | |||
1 Year | �� | -4.28 | ||
Class C Shares | ||||
Inception (6/23/05) | 7.11 | % | ||
10 Years | 7.09 | |||
5 Years | 13.50 | |||
1 Year | -1.36 | |||
Class R Shares | ||||
10 Years | 7.59 | % | ||
5 Years | 14.02 | |||
1 Year | 0.03 | |||
Class Y Shares | ||||
Inception (6/23/05) | 8.13 | % | ||
10 Years | 8.12 | |||
5 Years | 14.57 | |||
1 Year | 0.56 | |||
Class R5 Shares | ||||
10 Years | 8.04 | % | ||
5 Years | 14.71 | |||
1 Year | 0.62 | |||
Class R6 Shares | ||||
10 Years | 8.00 | % | ||
5 Years | 14.61 | |||
1 Year | 0.73 | |||
Effective June 1, 2010, Class A, Class B, Class C and Class I shares of the predecessor fund, Van Kampen American Franchise Fund, advised by Van Kampen Asset Management were reorganized into Class A, Class B, Class C and Class Y shares, respectively, of Invesco Van Kampen American Franchise Fund (renamed Invesco American Franchise Fund). Returns shown above for Class A, Class B, Class C and Class Y shares are blended returns of the predecessor fund and Invesco American Franchise Fund. Share class returns will differ from the predecessor fund because of different expenses.
Class R shares incepted on May 23, 2011. Performance shown prior to that date is that of the Fund’s and the predecessor fund’s Class A shares, restated to reflect the higher 12b-1 fees applicable to Class R shares.
Average Annual Total Returns |
| |||
As of 6/30/15, the most recent calendar quarter end, including maximum applicable sales charges |
| |||
Class A Shares | ||||
Inception (6/23/05) | 7.79 | % | ||
10 Years | 7.90 | |||
5 Years | 14.00 | |||
1 Year | 0.46 | |||
Class B Shares | ||||
Inception (6/23/05) | 7.90 | % | ||
10 Years | 8.03 | |||
5 Years | 14.88 | |||
1 Year | 1.47 | |||
Class C Shares | ||||
Inception (6/23/05) | 7.62 | % | ||
10 Years | 7.74 | |||
5 Years | 14.49 | |||
1 Year | 4.58 | |||
Class R Shares | ||||
10 Years | 8.24 | % | ||
5 Years | 15.00 | |||
1 Year | 6.01 | |||
Class Y Shares | ||||
Inception (6/23/05) | 8.65 | % | ||
10 Years | 8.76 | |||
5 Years | 15.54 | |||
1 Year | 6.57 | |||
Class R5 Shares | ||||
10 Years | 8.69 | % | ||
5 Years | 15.68 | |||
1 Year | 6.70 | |||
Class R6 Shares | ||||
10 Years | 8.65 | % | ||
5 Years | 15.58 | |||
1 Year | 6.81 | |||
Class R5 shares incepted on December 22, 2010. Performance shown prior to that date is that of the Fund’s and the predecessor fund’s Class A shares and includes the 12b-1 fees applicable to Class A shares.
Class R6 shares incepted on September 24, 2012. Performance shown prior to that date is that of the Fund’s and the predecessor fund’s Class A shares and includes the 12b-1 fees applicable to Class A shares.
The performance data quoted represent past performance and cannot guarantee comparable future results; current performance may be lower or higher. Please visit invesco.com/performance for the most recent month-end performance. Performance figures reflect reinvested distributions, changes in net asset value and the effect of the maximum sales charge unless otherwise
stated. Investment return and principal value will fluctuate so that you may have a gain or loss when you sell shares.
The total annual Fund operating expense ratio set forth in the most recent Fund prospectus as of the date of this report for Class A, Class B, Class C, Class R, Class Y, Class R5 and Class R6 shares was 1.08%, 1.08%, 1.83%, 1.33%, 0.83%, 0.70% and 0.63%, respectively. The expense ratios presented above may vary from the expense ratios presented in other sections of this report that are based on expenses incurred during the period covered by this report.
Class A share performance reflects the maximum 5.50% sales charge, and Class B and Class C share performance reflects the applicable contingent deferred sales charge (CDSC) for the period involved. For shares purchased prior to June 1, 2010, the CDSC on Class B shares declines from 5% at the time of purchase to 0% at the beginning of the sixth year. For shares purchased on or after June 1, 2010, the CDSC on Class B shares declines from 5% at the time of purchase to 0% at the beginning of the seventh year. The CDSC on Class C shares is 1% for the first year after purchase. Class R, Class Y, Class R5 and Class R6 shares do not have a front-end sales charge or a CDSC; therefore, performance is at net asset value.
The performance of the Fund’s share classes will differ primarily due to different sales charge structures and class expenses.
Fund performance reflects any applicable fee waivers and/or expense reimbursements. Had the adviser not waived fees and/or reimbursed expenses currently or in the past, returns would have been lower. See current prospectus for more information.
7 Invesco American Franchise Fund
Invesco American Franchise Fund’s investment objective is to seek long-term capital appreciation.
| n | Unless otherwise stated, information presented in this report is as of August 31, 2015, and is based on total net assets. |
| n | Unless otherwise noted, all data provided by Invesco. |
| n | To access your Fund’s reports/prospectus, visit invesco.com/fundreports. |
About share classes
| n | Class B shares may not be purchased for new or additional investments. Please see the prospectus for more information. |
| n | Class R shares are generally available only to employer sponsored retirement and benefit plans. Please see the prospectus for more information. |
| n | Class Y shares are available only to certain investors. Please see the prospectus for more information. |
| n | Class R5 shares and Class R6 shares are primarily intended for employer sponsored retirement and benefit plans that meet certain standards and for institutional investors. Please see the prospectus for more information. |
Principal risks of investing in the Fund
| n | Foreign securities risk. The Fund’s foreign investments may be affected by changes in a foreign country’s exchange rates, political and social instability, changes in economic or taxation policies, difficulties when enforcing obligations, decreased liquidity, and increased volatility. Foreign companies may be subject to less regulation resulting in less publicly available information about the companies. |
| n | Growth investing risk. Growth stocks tend to be more expensive relative to their earnings or assets compared with other types of stock. As a result they tend to be more sensitive to changes in their earnings and can be more volatile. |
| n | Management risk. The investment techniques and risk analysis used by the Fund’s portfolio managers may not produce the desired results. |
| n | Market risk. The prices of and the income generated by the Fund’s securities may decline in response to, among other things, investor sentiment, general economic and market conditions, regional or global instability, and currency and interest rate fluctuations. |
| n | Mid-capitalization risk. Stocks of mid-sized companies tend to be more vulnerable to adverse developments and |
may have little or no operating history or track record of success, and limited product lines, markets, management and financial resources. The securities of mid-sized companies may be more volatile due to less market interest and less publicly available information about the issuer. They also may be illiquid or restricted as to resale, or may trade less frequently and in smaller volumes, all of which may cause difficulty when establishing or closing a position at a desirable price. |
About indexes used in this report
| n | The S&P 500® Index is an unmanaged index considered representative of the US stock market. |
| n | The Russell 1000® Growth Index is an unmanaged index considered representative of large-cap growth stocks. The Russell 1000 Growth Index is a trademark/service mark of the Frank Russell Co. Russell® is a trademark of the Frank Russell Co. |
| n | The Lipper Large-Cap Growth Funds Index is an unmanaged index considered representative of large-cap growth funds tracked by Lipper. |
| n | The Fund is not managed to track the performance of any particular index, including the index(es) described here, and consequently, the performance of the Fund may deviate significantly from the performance of the index(es). |
| n | A direct investment cannot be made in an index. Unless otherwise indicated, index results include reinvested dividends, and they do not reflect sales charges. Performance of the peer group, if applicable, reflects fund expenses; performance of a market index does not. |
Other information
| n | The returns shown in management’s discussion of Fund performance are based on net asset values (NAVs) calculated for shareholder transactions. Generally accepted accounting principles require adjustments to be made to the net assets of the Fund at period end |
This report must be accompanied or preceded by a currently effective Fund prospectus, which contains more complete information, including sales charges and expenses. Investors should read it carefully before investing.
NOT FDIC INSURED | MAY LOSE VALUE | NO BANK GUARANTEE |
| for financial reporting purposes, and as such, the NAVs for shareholder transactions and the returns based on those NAVs may differ from the NAVs and returns reported in the Financial Highlights. |
| n | Industry classifications used in this report are generally according to the Global Industry Classification Standard, which was developed by and is the exclusive property and a service mark of MSCI Inc. and Standard & Poor’s. |
8 Invesco American Franchise Fund
Schedule of Investments(a)
August 31, 2015
| Shares | Value | |||||||
Common Stocks & Other Equity Interests–98.42% |
| |||||||
| Aerospace & Defense–2.31% | ||||||||
Honeywell International Inc. | 1,214,708 | $ | 120,584,063 | |||||
Raytheon Co. | 895,318 | 91,823,814 | ||||||
| 212,407,877 | ||||||||
| Airlines–1.38% | ||||||||
Southwest Airlines Co. | 3,464,596 | 127,150,673 | ||||||
| Application Software–2.72% | ||||||||
Autodesk, Inc.(b) | 785,393 | 36,717,123 | ||||||
salesforce.com, inc.(b) | 3,074,384 | 213,239,274 | ||||||
| 249,956,397 | ||||||||
| Biotechnology–13.01% | ||||||||
Alexion Pharmaceuticals, Inc.(b) | 373,592 | 64,328,806 | ||||||
Alkermes PLC(b) | 3,233,450 | 192,584,282 | ||||||
Amgen Inc. | 605,729 | 91,937,548 | ||||||
Biogen Inc.(b) | 454,537 | 135,133,850 | ||||||
Celgene Corp.(b) | 2,272,216 | 268,303,265 | ||||||
Gilead Sciences, Inc. | 3,192,137 | 335,397,835 | ||||||
Vertex Pharmaceuticals Inc.(b) | 842,456 | 107,429,989 | ||||||
| 1,195,115,575 | ||||||||
| Cable & Satellite–4.10% | ||||||||
Comcast Corp.–Class A | 963,466 | 54,272,040 | ||||||
DISH Network Corp.–Class A(b) | 4,276,920 | 253,493,048 | ||||||
Time Warner Cable Inc. | 369,938 | 68,815,867 | ||||||
| 376,580,955 | ||||||||
| Communications Equipment–1.35% | ||||||||
Cisco Systems, Inc. | 2,971,427 | 76,900,531 | ||||||
Palo Alto Networks, Inc.(b) | 287,720 | 47,249,378 | ||||||
| 124,149,909 | ||||||||
| Consumer Electronics–2.77% | ||||||||
Harman International Industries, Inc. | 1,208,190 | 118,088,491 | ||||||
Sony Corp. (Japan)(c) | 5,259,100 | 136,687,998 | ||||||
| 254,776,489 | ||||||||
| Consumer Finance–0.61% | ||||||||
American Express Co. | 726,601 | 55,744,829 | ||||||
| Data Processing & Outsourced Services–5.13% | ||||||||
MasterCard, Inc.–Class A | 4,119,584 | 380,525,974 | ||||||
Visa Inc.–Class A | 1,269,456 | 90,512,213 | ||||||
| 471,038,187 | ||||||||
| Distillers & Vintners–0.97% | ||||||||
Constellation Brands, Inc.–Class A | 697,577 | 89,289,856 | ||||||
| Diversified Chemicals–0.80% | ||||||||
Dow Chemical Co. (The) | 1,687,006 | 73,823,383 | ||||||
| Drug Retail–1.56% | ||||||||
CVS Health Corp. | 1,395,887 | 142,938,829 | ||||||
| Shares | Value | |||||||
| Environmental & Facilities Services–1.20% | ||||||||
Republic Services, Inc. | 2,688,460 | $ | 110,173,091 | |||||
| Fertilizers & Agricultural Chemicals–1.23% | ||||||||
Monsanto Co. | 1,152,942 | 112,584,786 | ||||||
| General Merchandise Stores–0.54% | ||||||||
Dollar General Corp. | 662,396 | 49,341,878 | ||||||
| Health Care Equipment–0.63% | ||||||||
Medtronic PLC | 802,862 | 58,038,894 | ||||||
Health Care Facilities–1.56% |
| |||||||
HCA Holdings, Inc.(b)(c) | 1,658,145 | 143,628,520 | ||||||
| Home Improvement Retail–3.40% | ||||||||
Lowe’s Cos., Inc. | 4,511,000 | 312,025,870 | ||||||
| Hotels, Resorts & Cruise Lines–3.23% | ||||||||
Carnival Corp. | 6,028,522 | 296,784,138 | ||||||
| Household Appliances–1.35% | ||||||||
Whirlpool Corp. | 740,269 | 124,439,219 | ||||||
| Industrial Conglomerates–1.55% | ||||||||
Danaher Corp. | 1,124,918 | 97,890,364 | ||||||
Roper Technologies, Inc. | 275,354 | 44,632,130 | ||||||
| 142,522,494 | ||||||||
| Industrial Gases–0.50% | ||||||||
Air Products and Chemicals, Inc. | 331,051 | 46,191,546 | ||||||
| Internet Retail–5.96% | ||||||||
Amazon.com, Inc.(b) | 637,856 | 327,149,964 | ||||||
Netflix Inc.(b) | 767,177 | 88,248,370 | ||||||
Priceline Group Inc. (The)(b) | 105,600 | 131,856,384 | ||||||
| 547,254,718 | ||||||||
| Internet Software & Services–11.46% | ||||||||
Alibaba Group Holding Ltd.–ADR (China)(b)(c) | 813,310 | 53,776,057 | ||||||
Facebook Inc.–Class A(b) | 5,189,310 | 464,079,994 | ||||||
Google Inc.–Class A(b) | 686,672 | 444,839,855 | ||||||
LinkedIn Corp.–Class A(b) | 497,512 | 89,850,667 | ||||||
| 1,052,546,573 | ||||||||
| Investment Banking & Brokerage–2.26% | ||||||||
Charles Schwab Corp. (The) | 5,958,262 | 181,012,000 | ||||||
Morgan Stanley | 784,321 | 27,019,858 | ||||||
| 208,031,858 | ||||||||
| Life Sciences Tools & Services–0.51% | ||||||||
Thermo Fisher Scientific, Inc. | 374,699 | 46,976,014 | ||||||
| Managed Health Care–0.78% | ||||||||
UnitedHealth Group Inc. | 617,347 | 71,427,048 | ||||||
See accompanying Notes to Financial Statements which are an integral part of the financial statements.
9 Invesco American Franchise Fund
| Shares | Value | |||||||
| Oil & Gas Exploration & Production–1.32% | ||||||||
Cimarex Energy Co. | 202,742 | $ | 22,405,019 | |||||
Devon Energy Corp. | 859,305 | 36,657,951 | ||||||
Pioneer Natural Resources Co. | 366,926 | 45,153,914 | ||||||
Whiting Petroleum Corp.(b) | 890,980 | 17,222,643 | ||||||
| 121,439,527 | ||||||||
| Packaged Foods & Meats–0.53% | ||||||||
Tyson Foods, Inc.–Class A | 1,149,736 | 48,610,838 | ||||||
| Pharmaceuticals–4.52% | ||||||||
Allergan PLC(b) | 1,078,240 | 327,504,618 | ||||||
Bristol-Myers Squibb Co. | 1,477,960 | 87,894,281 | ||||||
| 415,398,899 | ||||||||
| Semiconductor Equipment–0.29% | ||||||||
Lam Research Corp. | 363,098 | 26,422,641 | ||||||
| Semiconductors–3.24% | ||||||||
Avago Technologies Ltd. (Singapore) | 805,864 | 101,514,688 | ||||||
NXP Semiconductors N.V. (Netherlands)(b) | 2,312,966 | 195,792,572 | ||||||
| 297,307,260 | ||||||||
| Soft Drinks–0.86% | ||||||||
Monster Beverage Corp.(b) | 572,822 | 79,312,934 | ||||||
| Specialized Finance–2.90% | ||||||||
CME Group Inc.–Class A | 986,528 | 93,167,704 | ||||||
McGraw Hill Financial, Inc. | 1,788,699 | 173,485,916 | ||||||
| 266,653,620 | ||||||||
| Specialized REIT’s–0.77% | ||||||||
American Tower Corp. | 762,112 | 70,259,105 | ||||||
| Systems Software–1.72% | ||||||||
Check Point Software Technologies Ltd. (Israel)(b)(c) | 551,588 | 43,029,380 | ||||||
| Shares | Value | |||||||
| Systems Software–(continued) | ||||||||
ServiceNow, Inc.(b)(c) | 1,614,001 | $ | 114,529,511 | |||||
| 157,558,891 | ||||||||
| Technology Hardware, Storage & Peripherals–5.95% | ||||||||
Apple Inc. | 4,848,416 | 546,707,388 | ||||||
| Tobacco–1.45% | ||||||||
Altria Group, Inc. | 2,489,367 | 133,380,284 | ||||||
| Wireless Telecommunication Services–2.00% | ||||||||
Sprint Corp.(b)(c) | 36,332,372 | 183,841,802 | ||||||
Total Common Stocks & Other Equity Interests |
| 9,041,832,795 | ||||||
Money Market Funds–1.46% |
| |||||||
Liquid Assets Portfolio–Institutional Class, 0.12%(d) | 66,797,944 | 66,797,944 | ||||||
Premier Portfolio–Institutional Class, 0.09%(d) | 66,797,943 | 66,797,943 | ||||||
Total Money Market Funds |
| 133,595,887 | ||||||
TOTAL INVESTMENTS (excluding investments purchased with cash collateral from securities on loan)–99.88% |
| 9,175,428,682 | ||||||
Investments Purchased with Cash |
| |||||||
Money Market Funds–1.67% |
| |||||||
Liquid Assets Portfolio–Institutional Class, 0.12% | 153,280,627 | 153,280,627 | ||||||
TOTAL INVESTMENTS–101.55% |
| 9,328,709,309 | ||||||
OTHER ASSETS LESS LIABILITIES–(1.55)% |
| (141,993,047 | ) | |||||
NET ASSETS–100.00% |
| $ | 9,186,716,262 | |||||
Investment Abbreviations:
| ADR | – American Depositary Receipt | |
| REIT | – Real Estate Investment Trust |
Notes to Schedule of Investments:
| (a) | Industry and/or sector classifications used in this report are generally according to the Global Industry Classification Standard, which was developed by and is the exclusive property and a service mark of MSCI Inc. and Standard & Poor’s. |
| (b) | Non-income producing security. |
| (c) | All or a portion of this security was out on loan at August 31, 2015. |
| (d) | The money market fund and the Fund are affiliated by having the same investment adviser. The rate shown is the 7-day SEC standardized yield as of August 31, 2015. |
| (e) | The security has been segregated to satisfy the commitment to return the cash collateral received in securities lending transactions upon the borrower’s return of the securities loaned. See Note 1I. The following table presents the Fund’s gross and net amount of assets available for offset by the Fund as of August 31, 2015. |
| Counterparty | Gross Amount of Securities on Loan at Value | Cash Collateral Received for Securities Loaned* | Net Amount | |||||||||
State Street Bank and Trust Co. | $ | 141,450,870 | $ | (141,450,870 | ) | $ | — | |||||
| * | Amount does not include excess collateral received. |
See accompanying Notes to Financial Statements which are an integral part of the financial statements.
10 Invesco American Franchise Fund
Statement of Assets and Liabilities
August 31, 2015
Assets: | ||||
Investments, at value (Cost $6,580,312,545)* | $ | 9,041,832,795 | ||
Investments in affiliated money market funds, at value and cost | 286,876,514 | |||
Total investments, at value (Cost $6,867,189,059) | 9,328,709,309 | |||
Receivable for: | ||||
Investments sold | 27,398,954 | |||
Fund shares sold | 3,195,794 | |||
Dividends | 4,785,639 | |||
Investment for trustee deferred compensation and retirement plans | 2,400,996 | |||
Other assets | 149,798 | |||
Total assets | 9,366,640,490 | |||
Liabilities: | ||||
Payable for: | ||||
Investments purchased | 10,797,080 | |||
Fund shares reacquired | 7,574,995 | |||
Collateral upon return of securities loaned | 153,280,627 | |||
Accrued fees to affiliates | 5,403,605 | |||
Accrued trustees’ and officers’ fees and benefits | 23,687 | |||
Accrued other operating expenses | 74,597 | |||
Trustee deferred compensation and retirement plans | 2,769,637 | |||
Total liabilities | 179,924,228 | |||
Net assets applicable to shares outstanding | $ | 9,186,716,262 | ||
Net assets consist of: | ||||
Shares of beneficial interest | $ | 6,519,883,500 | ||
Undistributed net investment income (loss) | (17,439,548 | ) | ||
Undistributed net realized gain | 222,757,042 | |||
Net unrealized appreciation | 2,461,515,268 | |||
| $ | 9,186,716,262 | |||
Net Assets: | ||||
Class A | $ | 8,320,796,117 | ||
Class B | $ | 165,264,595 | ||
Class C | $ | 381,263,891 | ||
Class R | $ | 30,716,058 | ||
Class Y | $ | 152,179,209 | ||
Class R5 | $ | 50,052,334 | ||
Class R6 | $ | 86,444,058 | ||
Shares outstanding, $0.01 par value per share, |
| |||
Class A | 504,650,824 | |||
Class B | 10,279,350 | |||
Class C | 24,380,457 | |||
Class R | 1,883,003 | |||
Class Y | 9,117,994 | |||
Class R5 | 3,000,172 | |||
Class R6 | 5,170,070 | |||
Class A: | ||||
Net asset value per share | $ | 16.49 | ||
Maximum offering price per share | ||||
(Net asset value of $16.49 ¸ 94.50%) | $ | 17.45 | ||
Class B: | ||||
Net asset value and offering price per share | $ | 16.08 | ||
Class C: | ||||
Net asset value and offering price per share | $ | 15.64 | ||
Class R: | ||||
Net asset value and offering price per share | $ | 16.31 | ||
Class Y: | ||||
Net asset value and offering price per share | $ | 16.69 | ||
Class R5: | ||||
Net asset value and offering price per share | $ | 16.68 | ||
Class R6: | ||||
Net asset value and offering price per share | $ | 16.72 | ||
| * | At August 31, 2015, securities with an aggregate value of $141,450,870 were on loan to brokers. |
See accompanying Notes to Financial Statements which are an integral part of the financial statements.
11 Invesco American Franchise Fund
Statement of Operations
For the year ended August 31, 2015
Investment income: |
| |||
Dividends (net of foreign withholding taxes of $195,538) | $ | 76,008,581 | ||
Dividends from affiliated money market funds (includes securities lending income of $142,889) | 197,473 | |||
Total investment income | 76,206,054 | |||
Expenses: | ||||
Advisory fees | 58,005,769 | |||
Administrative services fees | 776,261 | |||
Custodian fees | 202,396 | |||
Distribution fees: | ||||
Class A | 22,255,841 | |||
Class B | 528,422 | |||
Class C | 4,093,656 | |||
Class R | 161,301 | |||
Transfer agent fees — A, B, C, R and Y | 18,758,650 | |||
Transfer agent fees — R5 | 49,075 | |||
Transfer agent fees — R6 | 4,558 | |||
Trustees’ and officers’ fees and benefits | 228,027 | |||
Other | 1,135,993 | |||
Total expenses | 106,199,949 | |||
Less: Fees waived and expense offset arrangement(s) | (189,769 | ) | ||
Net expenses | 106,010,180 | |||
Net investment income (loss) | (29,804,126 | ) | ||
Realized and unrealized gain (loss) from: | ||||
Net realized gain from: | ||||
Investment securities | 664,595,639 | |||
Foreign currencies | 91,163 | |||
| 664,686,802 | ||||
Change in net unrealized appreciation (depreciation) of: | ||||
Investment securities | (586,170,110 | ) | ||
Foreign currencies | (6,015 | ) | ||
| (586,176,125 | ) | |||
Net realized and unrealized gain | 78,510,677 | |||
Net increase in net assets resulting from operations | $ | 48,706,551 | ||
See accompanying Notes to Financial Statements which are an integral part of the financial statements.
12 Invesco American Franchise Fund
Statement of Changes in Net Assets
For the years ended August 31, 2015 and 2014
| 2015 | 2014 | |||||||
Operations: | ||||||||
Net investment income (loss) | $ | (29,804,126 | ) | $ | (27,492,665 | ) | ||
Net realized gain | 664,686,802 | 1,356,621,426 | ||||||
Change in net unrealized appreciation (depreciation) | (586,176,125 | ) | 853,805,517 | |||||
Net increase in net assets resulting from operations | 48,706,551 | 2,182,934,278 | ||||||
Distributions to shareholders from net investment income: | ||||||||
Class A | — | (8,146,047 | ) | |||||
Class B | — | (284,805 | ) | |||||
Class Y | — | (287,210 | ) | |||||
Class R5 | — | (126,411 | ) | |||||
Class R6 | — | (414,675 | ) | |||||
Total distributions from net investment income | — | (9,259,148 | ) | |||||
Distributions to shareholders from net realized gains: | ||||||||
Class A | (784,832,614 | ) | (349,819,587 | ) | ||||
Class B | (20,473,568 | ) | (12,230,508 | ) | ||||
Class C | (37,732,374 | ) | (16,851,639 | ) | ||||
Class R | (2,796,858 | ) | (1,234,648 | ) | ||||
Class Y | (13,159,645 | ) | (4,914,966 | ) | ||||
Class R5 | (4,625,060 | ) | (1,888,689 | ) | ||||
Class R6 | (11,435,482 | ) | (5,092,450 | ) | ||||
Total distributions from net realized gains | (875,055,601 | ) | (392,032,487 | ) | ||||
Share transactions–net: | ||||||||
Class A | 29,568,935 | 2,022,415,364 | ||||||
Class B | (64,542,055 | ) | (32,429,104 | ) | ||||
Class C | 2,440,937 | 74,675,675 | ||||||
Class R | 1,750,654 | 6,673,587 | ||||||
Class Y | 23,546,565 | 25,320,157 | ||||||
Class R5 | 2,253,149 | (119,562,564 | ) | |||||
Class R6 | (43,605,157 | ) | (1,645,431 | ) | ||||
Net increase (decrease) in net assets resulting from share transactions | (48,586,972 | ) | 1,975,447,684 | |||||
Net increase (decrease) in net assets | (874,936,022 | ) | 3,757,090,327 | |||||
Net assets: | ||||||||
Beginning of year | 10,061,652,284 | 6,304,561,957 | ||||||
End of year (includes undistributed net investment income (loss) of $(17,439,548) and $(23,695,349), respectively) | $ | 9,186,716,262 | $ | 10,061,652,284 | ||||
Notes to Financial Statements
August 31, 2015
NOTE 1—Significant Accounting Policies
Invesco American Franchise Fund (the “Fund”) is a series portfolio of AIM Counselor Series Trust (Invesco Counselor Series Trust) (the “Trust”). The Trust is a Delaware statutory trust registered under the Investment Company Act of 1940, as amended (the “1940 Act”), as an open-end series management investment company consisting of thirteen separate portfolios, each authorized to issue an unlimited number of shares of beneficial interest. The assets, liabilities and operations of each portfolio are accounted for separately. Information presented in these financial statements pertains only to the Fund. Matters affecting each portfolio or class will be voted on exclusively by the shareholders of such portfolio or class.
The Fund’s investment objective is to seek long-term capital appreciation.
The Fund currently consists of seven different classes of shares: Class A, Class B, Class C, Class R, Class Y, Class R5 and Class R6. Class A shares are sold with a front-end sales charge unless certain waiver criteria are met and under certain circumstances load waived shares may be subject to contingent deferred sales charges (“CDSC”). Class C shares are sold with a CDSC. Class R, Class Y, Class R5 and Class R6 shares are sold at net asset value. Effective November 30, 2010, new or additional investments in Class B shares are no longer permitted. Existing shareholders of Class B shares may continue to reinvest dividends and capital gains distributions in Class B shares until they convert to Class A shares. Also, shareholders in Class B shares will be able to exchange those shares for Class B shares of other Invesco Funds offering such shares until they convert to Class A shares.
13 Invesco American Franchise Fund
Generally, Class B shares will automatically convert to Class A shares on or about the month-end, which is at least eight years after the date of purchase. Redemption of Class B shares prior to the conversion date will be subject to a CDSC.
The following is a summary of the significant accounting policies followed by the Fund in the preparation of its financial statements.
A. Security Valuations — Securities, including restricted securities, are valued according to the following policy.
A security listed or traded on an exchange (except convertible securities) is valued at its last sales price or official closing price as of the close of the customary trading session on the exchange where the security is principally traded, or lacking any sales or official closing price on a particular day, the security may be valued at the closing bid price on that day. Securities traded in the over-the-counter market are valued based on prices furnished by independent pricing services or market makers. When such securities are valued by an independent pricing service they may be considered fair valued. Futures contracts are valued at the final settlement price set by an exchange on which they are principally traded. Listed options are valued at the mean between the last bid and asked prices from the exchange on which they are principally traded. Options not listed on an exchange are valued by an independent source at the mean between the last bid and asked prices. For purposes of determining net asset value (“NAV”) per share, futures and option contracts generally are valued 15 minutes after the close of the customary trading session of the New York Stock Exchange (“NYSE”).
Investments in open-end and closed-end registered investment companies that do not trade on an exchange are valued at the end-of-day net asset value per share. Investments in open-end and closed-end registered investment companies that trade on an exchange are valued at the last sales price or official closing price as of the close of the customary trading session on the exchange where the security is principally traded.
Debt obligations (including convertible securities) and unlisted equities are fair valued using an evaluated quote provided by an independent pricing service. Evaluated quotes provided by the pricing service may be determined without exclusive reliance on quoted prices, and may reflect appropriate factors such as institution-size trading in similar groups of securities, developments related to specific securities, dividend rate (for unlisted equities), yield (for debt obligations), quality, type of issue, coupon rate (for debt obligations), maturity (for debt obligations), individual trading characteristics and other market data. Debt obligations are subject to interest rate and credit risks. In addition, all debt obligations involve some risk of default with respect to interest and/or principal payments.
Foreign securities’ (including foreign exchange contracts) prices are converted into U.S. dollar amounts using the applicable exchange rates as of the close of the NYSE. If market quotations are available and reliable for foreign exchange-traded equity securities, the securities will be valued at the market quotations. Because trading hours for certain foreign securities end before the close of the NYSE, closing market quotations may become unreliable. If between the time trading ends on a particular security and the close of the customary trading session on the NYSE, events occur that the Adviser determines are significant and make the closing price unreliable, the Fund may fair value the security. If the event is likely to have affected the closing price of the security, the security will be valued at fair value in good faith using procedures approved by the Board of Trustees. Adjustments to closing prices to reflect fair value may also be based on a screening process of an independent pricing service to indicate the degree of certainty, based on historical data, that the closing price in the principal market where a foreign security trades is not the current value as of the close of the NYSE. Foreign securities’ prices meeting the approved degree of certainty that the price is not reflective of current value will be priced at the indication of fair value from the independent pricing service. Multiple factors may be considered by the independent pricing service in determining adjustments to reflect fair value and may include information relating to sector indices, American Depositary Receipts and domestic and foreign index futures. Foreign securities may have additional risks including exchange rate changes, potential for sharply devalued currencies and high inflation, political and economic upheaval, the relative lack of issuer information, relatively low market liquidity and the potential lack of strict financial and accounting controls and standards.
Securities for which market prices are not provided by any of the above methods may be valued based upon quotes furnished by independent sources. The last bid price may be used to value equity securities. The mean between the last bid and asked prices is used to value debt obligations, including corporate loans.
Securities for which market quotations are not readily available or became unreliable are valued at fair value as determined in good faith by or under the supervision of the Trust’s officers following procedures approved by the Board of Trustees. Issuer specific events, market trends, bid/asked quotes of brokers and information providers and other market data may be reviewed in the course of making a good faith determination of a security’s fair value.
The Fund may invest in securities that are subject to interest rate risk, meaning the risk that the prices will generally fall as interest rates rise and, conversely, the prices will generally rise as interest rates fall. Specific securities differ in their sensitivity to changes in interest rates depending on their individual characteristics. Changes in interest rates may result in increased market volatility, which may affect the value and/or liquidity of certain Fund investments.
Valuations change in response to many factors including the historical and prospective earnings of the issuer, the value of the issuer’s assets, general economic conditions, interest rates, investor perceptions and market liquidity. Because of the inherent uncertainties of valuation, the values reflected in the financial statements may materially differ from the value received upon actual sale of those investments.
| B. | Securities Transactions and Investment Income — Securities transactions are accounted for on a trade date basis. Realized gains or losses on sales are computed on the basis of specific identification of the securities sold. Interest income (net of withholding tax, if any) is recorded on the accrual basis from settlement date. Dividend income (net of withholding tax, if any) is recorded on the ex-dividend date. |
The Fund may periodically participate in litigation related to Fund investments. As such, the Fund may receive proceeds from litigation settlements. Any proceeds received are included in the Statement of Operations as realized gain (loss) for investments no longer held and as unrealized gain (loss) for investments still held.
Brokerage commissions and mark ups are considered transaction costs and are recorded as an increase to the cost basis of securities purchased and/or a reduction of proceeds on a sale of securities. Such transaction costs are included in the determination of net realized and unrealized gain (loss) from investment securities reported in the Statement of Operations and the Statement of Changes in Net Assets and the net realized and unrealized gains (losses) on securities per share in the Financial Highlights. Transaction costs are included in the calculation of the Fund’s net asset value and, accordingly, they reduce the Fund’s total returns. These transaction costs are not considered operating expenses and are not reflected in net investment income reported in the Statement of Operations and the Statement of Changes in Net Assets, or the net investment income per share and the ratios of expenses and net investment income reported in the Financial Highlights, nor are they limited by any expense limitation arrangements between the Fund and the investment adviser.
14 Invesco American Franchise Fund
The Fund allocates income and realized and unrealized capital gains and losses to a class based on the relative net assets of each class.
| C. | Country Determination — For the purposes of making investment selection decisions and presentation in the Schedule of Investments, the investment adviser may determine the country in which an issuer is located and/or credit risk exposure based on various factors. These factors include the laws of the country under which the issuer is organized, where the issuer maintains a principal office, the country in which the issuer derives 50% or more of its total revenues and the country that has the primary market for the issuer’s securities, as well as other criteria. Among the other criteria that may be evaluated for making this determination are the country in which the issuer maintains 50% or more of its assets, the type of security, financial guarantees and enhancements, the nature of the collateral and the sponsor organization. Country of issuer and/or credit risk exposure has been determined to be the United States of America, unless otherwise noted. |
| D. | Distributions — Distributions from net investment income and net realized capital gain, if any, are generally declared and paid annually and recorded on the ex-dividend date. The Fund may elect to treat a portion of the proceeds from redemptions as distributions for federal income tax purposes. |
| E. | Federal Income Taxes — The Fund intends to comply with the requirements of Subchapter M of the Internal Revenue Code of 1986, as amended (the “Internal Revenue Code”), necessary to qualify as a regulated investment company and to distribute substantially all of the Fund’s taxable earnings to shareholders. As such, the Fund will not be subject to federal income taxes on otherwise taxable income (including net realized capital gain) that is distributed to shareholders. Therefore, no provision for federal income taxes is recorded in the financial statements. |
The Fund recognizes the tax benefits of uncertain tax positions only when the position is more likely than not to be sustained. Management has analyzed the Fund’s uncertain tax positions and concluded that no liability for unrecognized tax benefits should be recorded related to uncertain tax positions. Management is not aware of any tax positions for which it is reasonably possible that the total amounts of unrecognized tax benefits will change materially in the next 12 months.
The Fund files tax returns in the U.S. Federal jurisdiction and certain other jurisdictions. Generally, the Fund is subject to examinations by such taxing authorities for up to three years after the filing of the return for the tax period.
| F. | Expenses — Fees provided for under the Rule 12b-1 plan of a particular class of the Fund are charged to the operations of such class. Transfer agency fees and expenses and other shareholder recordkeeping fees and expenses attributable to Class R5 and Class R6 are allocated to each share class based on relative net assets. Sub-accounting fees attributable to Class R5 are charged to the operations of the class. Transfer agency fees and expenses and other shareholder recordkeeping fees and expenses relating to all other classes are allocated among those classes based on relative net assets. All other expenses are allocated among the classes based on relative net assets. |
| G. | Accounting Estimates — The preparation of financial statements in conformity with accounting principles generally accepted in the United States of America (“GAAP”) requires management to make estimates and assumptions that affect the reported amounts of assets and liabilities at the date of the financial statements and the reported amounts of revenues and expenses during the reporting period including estimates and assumptions related to taxation. Actual results could differ from those estimates by a significant amount. In addition, the Fund monitors for material events or transactions that may occur or become known after the period-end date and before the date the financial statements are released to print. |
| H. | Indemnifications — Under the Trust’s organizational documents, each Trustee, officer, employee or other agent of the Trust is indemnified against certain liabilities that may arise out of the performance of their duties to the Fund. Additionally, in the normal course of business, the Fund enters into contracts, including the Fund’s servicing agreements, that contain a variety of indemnification clauses. The Fund’s maximum exposure under these arrangements is unknown as this would involve future claims that may be made against the Fund that have not yet occurred. The risk of material loss as a result of such indemnification claims is considered remote. |
| I. | Securities Lending — The Fund may lend portfolio securities having a market value up to one-third of the Fund’s total assets. Such loans are secured by collateral equal to no less than the market value of the loaned securities determined daily by the securities lending provider. Such collateral will be cash or debt securities issued or guaranteed by the U.S. Government or any of its sponsored agencies. Cash collateral received in connection with these loans is invested in short-term money market instruments or affiliated money market funds and is shown as such on the Schedule of Investments. It is the Fund’s policy to obtain additional collateral from or return excess collateral to the borrower by the end of the next business day, following the valuation date of the securities loaned. Therefore, the value of the collateral held may be temporarily less than the value of the securities on loan. Lending securities entails a risk of loss to the Fund if, and to the extent that, the market value of the securities loaned were to increase and the borrower did not increase the collateral accordingly, and the borrower failed to return the securities. Upon the failure of the borrower to return the securities, collateral may be liquidated and the securities may be purchased on the open market to replace the loaned securities. The Fund could experience delays and costs in gaining access to the collateral. The Fund bears the risk of any deficiency in the amount of the collateral available for return to the borrower due to any loss on the collateral invested. Dividends received on cash collateral investments for securities lending transactions, which are net of compensation to counterparties, is included in Dividends from affiliated money market funds on the Statement of Operations. The aggregate value of securities out on loan, if any, is shown as a footnote on the Statement of Assets and Liabilities. |
| J. | Foreign Currency Translations — Foreign currency is valued at the close of the NYSE based on quotations posted by banks and major currency dealers. Portfolio securities and other assets and liabilities denominated in foreign currencies are translated into U.S. dollar amounts at date of valuation. Purchases and sales of portfolio securities (net of foreign taxes withheld on disposition) and income items denominated in foreign currencies are translated into U.S. dollar amounts on the respective dates of such transactions. The Fund does not separately account for the portion of the results of operations resulting from changes in foreign exchange rates on investments and the fluctuations arising from changes in market prices of securities held. The combined results of changes in foreign exchange rates and the fluctuation of market prices on investments (net of estimated foreign tax withholding) are included with the net realized and unrealized gain or loss from investments in the Statement of Operations. Reported net realized foreign currency gains or losses arise from (1) sales of foreign currencies, (2) currency gains or losses realized between the trade and settlement dates on securities transactions, and (3) the difference between the amounts of dividends, interest, and foreign withholding taxes recorded on the Fund’s books and the U.S. dollar equivalent of the amounts actually received or paid. Net unrealized foreign currency gains and losses arise from changes in the fair values of assets and liabilities, other than investments in securities at fiscal period end, resulting from changes in exchange rates. |
15 Invesco American Franchise Fund
The Fund may invest in foreign securities, which may be subject to foreign taxes on income, gains on investments or currency repatriation, a portion of which may be recoverable. Foreign taxes, if any, are recorded based on the tax regulations and rates that exist in the foreign markets in which the Fund invests and are shown in the Statement of Operations.
| K. | Forward Foreign Currency Contracts — The Fund may engage in foreign currency transactions either on a spot (i.e. for prompt delivery and settlement) basis, or through forward foreign currency contracts, to manage or minimize currency or exchange rate risk. |
The Fund may also enter into forward foreign currency contracts for the purchase or sale of a security denominated in a foreign currency in order to “lock in” the U.S. dollar price of that security, or the Fund may also enter into forward foreign currency contracts that do not provide for physical settlement of the two currencies, but instead are settled by a single cash payment calculated as the difference between the agreed upon exchange rate and the spot rate at settlement based upon an agreed upon notional amount (non-deliverable forwards). The Fund will set aside liquid assets in an amount equal to daily mark-to-market obligation for forward foreign currency contracts.
A forward foreign currency contract is an obligation between two parties (“Counterparties”) to purchase or sell a specific currency for an agreed-upon price at a future date. The use of forward foreign currency contracts does not eliminate fluctuations in the price of the underlying securities the Fund owns or intends to acquire but establishes a rate of exchange in advance. Fluctuations in the value of these contracts are measured by the difference in the contract date and reporting date exchange rates and are recorded as unrealized appreciation (depreciation) until the contracts are closed. When the contracts are closed, realized gains (losses) are recorded. Realized and unrealized gains (losses) on the contracts are included in the Statement of Operations. The primary risks associated with forward foreign currency contracts include failure of the Counterparty to meet the terms of the contract and the value of the foreign currency changing unfavorably. These risks may be in excess of the amounts reflected in the Statement of Assets and Liabilities.
NOTE 2—Advisory Fees and Other Fees Paid to Affiliates
The Trust has entered into a master investment advisory agreement with Invesco Advisers, Inc. (the “Adviser” or “Invesco”). Under the terms of the investment advisory agreement, the Fund pays an advisory fee to the Adviser based on the annual rate of the Fund’s average daily net assets as follows:
| Average Daily Net Assets | Rate | |||||
First $250 million | 0 | .695% | ||||
Next $250 million | 0 | .67% | ||||
Next $500 million | 0 | .645% | ||||
Next $550 million | 0 | .62% | ||||
Next $3.45 billion | 0 | .60% | ||||
Next $250 million | 0 | .595% | ||||
Next $2.25 billion | 0 | .57% | ||||
Next $2.5 billion | 0 | .545% | ||||
Over $10 billion | 0 | .52% | ||||
For the year ended August 31, 2015, the effective advisory fees incurred by the Fund was 0.59%.
Under the terms of a master sub-advisory agreement between the Adviser and each of Invesco Asset Management Deutschland GmbH, Invesco Asset Management Limited, Invesco Asset Management (Japan) Limited, Invesco Hong Kong Limited, Invesco Senior Secured Management, Inc. and Invesco Canada Ltd. (collectively, the “Affiliated Sub-Advisers”) the Adviser, not the Fund, may pay 40% of the fees paid to the Adviser to any such Affiliated Sub-Adviser(s) that provide(s) discretionary investment management services to the Fund based on the percentage of assets allocated to such Affiliated Sub-Adviser(s).
The Adviser has contractually agreed, through at least June 30, 2016, to waive advisory fees and/or reimburse expenses of all shares to the extent necessary to limit total annual fund operating expenses after fee waiver and/or expense reimbursement (excluding certain items discussed below) of Class A, Class B, Class C, Class R, Class Y, Class R5 and Class R6 shares to 2.00%, 2.75%, 2.75%, 2.25%, 1.75%, 1.75% and 1.75%, respectively, of average daily net assets. In determining the Adviser’s obligation to waive advisory fees and/or reimburse expenses, the following expenses are not taken into account, and could cause the total annual fund operating expenses after fee waiver and/or expense reimbursement to exceed the numbers reflected above: (1) interest; (2) taxes; (3) dividend expense on short sales; (4) extraordinary or non-routine items, including litigation expenses; and (5) expenses that the Fund has incurred but did not actually pay because of an expense offset arrangement. Unless Invesco continues the fee waiver agreement, it will terminate on June 30, 2016. The fee waiver agreement cannot be terminated during its term. The Adviser did not waive fees and/or reimburse expenses during the period under this expense limitation.
Further, the Adviser has contractually agreed, through at least June 30, 2017, to waive the advisory fee payable by the Fund in an amount equal to 100% of the net advisory fees the Adviser receives from the affiliated money market funds on investments by the Fund of uninvested cash (excluding investments of cash collateral from securities lending) in such affiliated money market funds.
For the year ended August 31, 2015, the Adviser waived advisory fees of $131,028.
The Trust has entered into a master administrative services agreement with Invesco pursuant to which the Fund has agreed to pay Invesco for certain administrative costs incurred in providing accounting services to the Fund. For the year ended August 31, 2015, expenses incurred under the agreement are shown in the Statement of Operations as Administrative services fees.
The Trust has entered into a transfer agency and service agreement with Invesco Investment Services, Inc. (“IIS”) pursuant to which the Fund has agreed to pay IIS a fee for providing transfer agency and shareholder services to the Fund and reimburse IIS for certain expenses incurred by IIS in the course of providing such services. IIS may make payments to intermediaries that provide omnibus account services, sub-accounting services and/or networking services. All fees payable by IIS to intermediaries that provide omnibus account services or sub-accounting are charged back to the Fund, subject to certain limitations approved by the Trust’s Board of Trustees. For the year ended August 31, 2015, expenses incurred under the agreement are shown in the Statement of Operations as Transfer agent fees.
16 Invesco American Franchise Fund
Shares of the Fund are distributed by Invesco Distributors, Inc. (“IDI”). The Fund has adopted a distribution plan pursuant to Rule 12b-1 under the 1940 Act, and a service plan (collectively, the “Plans”) for Class A, Class B, Class C and Class R shares to compensate IDI for the sale, distribution, shareholder servicing and maintenance of shareholder accounts for these shares. Under the Plans, the Fund will incur annual fees of up to 0.25% of Class A average daily net assets, up to 1.00% each of Class B and Class C average daily net assets and up to 0.50% of Class R average daily net assets.
With respect to Class B and Class C shares, the Fund is authorized to reimburse in future years any distribution related expenses that exceed the maximum annual reimbursement rate for such class, so long as such reimbursement does not cause the Fund to exceed the Class B and Class C maximum annual reimbursement rate, respectively. With respect to Class A shares, distribution related expenses that exceed the maximum annual reimbursement rate for such class are not carried forward to future years and the Fund will not reimburse IDI for any such expenses.
Front-end sales commissions and CDSC (collectively, the “sales charges”) are not recorded as expenses of the Fund. Front-end sales commissions are deducted from proceeds from the sales of Fund shares prior to investment in Class A shares of the Fund. CDSC are deducted from redemption proceeds prior to remittance to the shareholder. During the year ended August 31, 2015, IDI advised the Fund that IDI retained $557,686 in front-end sales commissions from the sale of Class A shares and $7,150, $31,934 and $8,304 from Class A, Class B and Class C shares, respectively, for CDSC imposed on redemptions by shareholders.
For the year ended August 31, 2015, the Fund incurred $355,196 in brokerage commissions with Invesco Capital Markets, Inc., an affiliate of the Adviser and IDI, for portfolio transactions executed on behalf of the Fund.
Certain officers and trustees of the Trust are officers and directors of the Adviser, IIS and/or IDI.
NOTE 3—Additional Valuation Information
GAAP defines fair value as the price that would be received to sell an asset or paid to transfer a liability in an orderly transaction between market participants at the measurement date, under current market conditions. GAAP establishes a hierarchy that prioritizes the inputs to valuation methods, giving the highest priority to readily available unadjusted quoted prices in an active market for identical assets (Level 1) and the lowest priority to significant unobservable inputs (Level 3), generally when market prices are not readily available or are unreliable. Based on the valuation inputs, the securities or other investments are tiered into one of three levels. Changes in valuation methods may result in transfers in or out of an investment’s assigned level:
| Level 1 — | Prices are determined using quoted prices in an active market for identical assets. |
| Level 2 — | Prices are determined using other significant observable inputs. Observable inputs are inputs that other market participants may use in pricing a security. These may include quoted prices for similar securities, interest rates, prepayment speeds, credit risk, yield curves, loss severities, default rates, discount rates, volatilities and others. |
| Level 3 — | Prices are determined using significant unobservable inputs. In situations where quoted prices or observable inputs are unavailable (for example, when there is little or no market activity for an investment at the end of the period), unobservable inputs may be used. Unobservable inputs reflect the Fund’s own assumptions about the factors market participants would use in determining fair value of the securities or instruments and would be based on the best available information. |
The following is a summary of the tiered valuation input levels, as of August 31, 2015. The level assigned to the securities valuations may not be an indication of the risk or liquidity associated with investing in those securities. Because of the inherent uncertainties of valuation, the values reflected in the financial statements may materially differ from the value received upon actual sale of those investments.
| Level 1 | Level 2 | Level 3 | Total | |||||||||||||
Equity Securities | $ | 9,192,021,311 | $ | 136,687,998 | $ | — | $ | 9,328,709,309 | ||||||||
NOTE 4—Expense Offset Arrangement(s)
The expense offset arrangement is comprised of transfer agency credits which result from balances in demand deposit accounts used by the transfer agent for clearing shareholder transactions. For the year ended August 31, 2015, the Fund received credits from this arrangement, which resulted in the reduction of the Fund’s total expenses of $58,741.
NOTE 5—Trustees’ and Officers’ Fees and Benefits
Trustees’ and Officers’ Fees and Benefits include amounts accrued by the Fund to pay remuneration to certain Trustees and Officers of the Fund. Trustees have the option to defer compensation payable by the Fund, and Trustees’ and Officers’ Fees and Benefits also include amounts accrued by the Fund to fund such deferred compensation amounts. Those Trustees who defer compensation have the option to select various Invesco Funds in which their deferral accounts shall be deemed to be invested. Finally, certain current Trustees were eligible to participate in a retirement plan that provided for benefits to be paid upon retirement to Trustees over a period of time based on the number of years of service. The Fund may have certain former Trustees who also participate in a retirement plan and receive benefits under such plan. Trustees’ and Officers’ Fees and Benefits include amounts accrued by the Fund to fund such retirement benefits. Obligations under the deferred compensation and retirement plans represent unsecured claims against the general assets of the Fund.
NOTE 6—Cash Balances
The Fund is permitted to temporarily carry a negative or overdrawn balance in its account with State Street Bank and Trust Company, the custodian bank. Such balances, if any at period end, are shown in the Statement of Assets and Liabilities under the payable caption Amount due custodian. To compensate the custodian bank for such overdrafts, the overdrawn Fund may either (1) leave funds as a compensating balance in the account so the custodian bank can be compensated by earning the additional interest; or (2) compensate by paying the custodian bank at a rate agreed upon by the custodian bank and Invesco, not to exceed the contractually agreed upon rate.
17 Invesco American Franchise Fund
NOTE 7—Distributions to Shareholders and Tax Components of Net Assets
Tax Character of Distributions to Shareholders Paid During the Fiscal Years Ended August 31, 2015 and 2014:
| 2015 | 2014 | |||||||
Ordinary income | $ | — | $ | 9,609,951 | ||||
Long-term capital gain | 875,055,601 | 391,681,684 | ||||||
Total distributions | $ | 875,055,601 | $ | 401,291,635 | ||||
Tax Components of Net Assets at Period-End:
| 2015 | ||||
Undistributed long-term gain | $ | 446,865,655 | ||
Net unrealized appreciation — investments | 2,425,814,248 | |||
Net unrealized appreciation (depreciation) — other investments | (4,983 | ) | ||
Temporary book/tax differences | (2,837,745 | ) | ||
Capital loss carryforward | (188,402,611 | ) | ||
Late-Year Ordinary Loss Deferral | (14,601,802 | ) | ||
Shares of beneficial interest | 6,519,883,500 | |||
Total net assets | $ | 9,186,716,262 | ||
The difference between book-basis and tax-basis unrealized appreciation (depreciation) is due to differences in the timing of recognition of gains and losses on investments for tax and book purposes. The Fund’s net unrealized appreciation difference is attributable primarily to wash sales.
The temporary book/tax differences are a result of timing differences between book and tax recognition of income and/or expenses. The Fund’s temporary book/tax differences are the result of the trustee deferral of compensation and retirement plan benefits.
Capital loss carryforward is calculated and reported as of a specific date. Results of transactions and other activity after that date may affect the amount of capital loss carryforward actually available for the Fund to utilize. Capital losses generated in years beginning after December 22, 2010 can be carried forward for an unlimited period, whereas previous losses expire in eight tax years. Capital losses with an expiration period may not be used to offset capital gains until all net capital losses without an expiration date have been utilized. Capital loss carryforwards with no expiration date will retain their character as either short-term or long-term capital losses instead of as short-term capital losses as under prior law. The ability to utilize capital loss carryforwards in the future may be limited under the Internal Revenue Code and related regulations based on the results of future transactions.
The Fund has a capital loss carryforward as of August 31, 2015, which expires as follows:
| Capital Loss Carryforward* | ||||||||||||
| Expiration | Short-Term | Long-Term | Total | |||||||||
August 31, 2017 | $ | 188,402,611 | $ | — | $ | 188,402,611 | ||||||
| * | Capital loss carryforward as of the date listed above is reduced for limitations, if any, to the extent required by the Internal Revenue Code and may be further limited depending upon a variety of factors, including the realization of net unrealized gains or losses as of the date of any reorganization. |
NOTE 8—Investment Securities
The aggregate amount of investment securities (other than short-term securities, U.S. Treasury obligations and money market funds, if any) purchased and sold by the Fund during the year ended August 31, 2015 was $7,244,750,154 and $8,253,797,345, respectively. Cost of investments on a tax basis includes the adjustments for financial reporting purposes as of the most recently completed federal income tax reporting period-end.
| Unrealized Appreciation (Depreciation) of Investment Securities on a Tax Basis | ||||
Aggregate unrealized appreciation of investment securities | $ | 2,589,745,544 | ||
Aggregate unrealized (depreciation) of investment securities | (163,931,296 | ) | ||
Net unrealized appreciation of investment securities | $ | 2,425,814,248 | ||
Cost of investments for tax purposes is $6,902,895,061.
NOTE 9—Reclassification of Permanent Differences
Primarily as a result of differing book/tax treatment of net operating losses on August 31, 2015, undistributed net investment income (loss) was increased by $36,059,927, undistributed net realized gain was decreased by $1,097,821 and shares of beneficial interest was decreased by $34,962,106. This reclassification had no effect on the net assets of the Fund.
18 Invesco American Franchise Fund
NOTE 10—Share Information
| Summary of Share Activity | ||||||||||||||||
| Years ended August 31, | ||||||||||||||||
| 2015(a) | 2014 | |||||||||||||||
| Shares | Amount | Shares | Amount | |||||||||||||
Sold: | ||||||||||||||||
Class A | 11,430,895 | $ | 198,025,073 | 13,434,382 | $ | 224,500,898 | ||||||||||
Class B | 114,963 | 1,953,963 | 194,996 | 3,185,824 | ||||||||||||
Class C | 1,474,703 | 24,315,642 | 1,375,112 | 22,116,190 | ||||||||||||
Class R | 422,057 | 7,207,296 | 288,299 | 4,772,689 | ||||||||||||
Class Y | 2,828,241 | 49,644,068 | 2,508,529 | 42,978,258 | ||||||||||||
Class R5 | 925,325 | 16,123,386 | 772,745 | 13,042,930 | ||||||||||||
Class R6 | 340,306 | 5,918,560 | 901,334 | 15,272,963 | ||||||||||||
Issued as reinvestment of dividends: | ||||||||||||||||
Class A | 45,566,849 | 740,461,291 | 20,978,874 | 337,759,873 | ||||||||||||
Class B | 1,268,110 | 20,099,547 | 779,837 | 12,274,118 | ||||||||||||
Class C | 2,276,570 | 35,286,826 | 1,015,415 | 15,779,551 | ||||||||||||
Class R | 173,586 | 2,796,462 | 77,072 | 1,233,927 | ||||||||||||
Class Y | 691,278 | 11,350,786 | 281,452 | 4,562,336 | ||||||||||||
Class R5 | 281,944 | 4,623,889 | 124,583 | 2,014,511 | ||||||||||||
Class R6 | 696,013 | 11,435,482 | 340,156 | 5,507,125 | ||||||||||||
Issued in connection with acquisitions:(b) | ||||||||||||||||
Class A | — | — | 159,648,030 | 2,468,502,143 | ||||||||||||
Class B | — | — | 3,865,089 | 58,449,775 | ||||||||||||
Class C | — | — | 6,095,479 | 91,112,251 | ||||||||||||
Class R | — | — | 518,148 | 7,963,354 | ||||||||||||
Class Y | — | — | 969,446 | 15,095,293 | ||||||||||||
Class R5 | — | — | 189,764 | 2,949,334 | ||||||||||||
Automatic conversion of Class B shares to Class A shares: | ||||||||||||||||
Class A | 3,624,145 | 63,022,397 | 4,281,870 | 72,109,330 | ||||||||||||
Class B | (3,714,455 | ) | (63,022,397 | ) | (4,380,637 | ) | (72,109,330 | ) | ||||||||
Reacquired: | ||||||||||||||||
Class A | (56,061,210 | ) | (971,939,826 | ) | (64,487,337 | ) | (1,080,456,880 | ) | ||||||||
Class B | (1,391,879 | ) | (23,573,168 | ) | (2,096,465 | ) | (34,229,491 | ) | ||||||||
Class C | (3,461,721 | ) | (57,161,531 | ) | (3,357,178 | ) | (54,332,317 | ) | ||||||||
Class R | (483,878 | ) | (8,253,104 | ) | (440,363 | ) | (7,296,383 | ) | ||||||||
Class Y | (2,143,896 | ) | (37,448,289 | ) | (2,205,531 | ) | (37,315,730 | ) | ||||||||
Class R5 | (1,073,189 | ) | (18,494,126 | ) | (8,388,466 | ) | (137,569,339 | ) | ||||||||
Class R6 | (3,413,210 | ) | (60,959,199 | ) | (1,334,727 | ) | (22,425,519 | ) | ||||||||
Net increase (decrease) in share activity | 371,547 | $ | (48,586,972 | ) | 131,949,908 | $ | 1,975,447,684 | |||||||||
| (a) | There are entities that are record owners of more than 5% of the outstanding shares of the Fund and in the aggregate own 15% of the outstanding shares of the Fund. IDI has an agreement with these entities to sell Fund shares. The Fund, Invesco and/or Invesco affiliates may make payments to these entities, which are considered to be related to the Fund, for providing services to the Fund, Invesco and/or Invesco affiliates including but not limited to services such as securities brokerage, distribution, third party record keeping and account servicing. The Fund has no knowledge as to whether all or any portion of the shares owned of record by these entities are also owned beneficially. |
| (b) | As of the opening of business on September 16, 2013, the Fund acquired all the net assets of Invesco Constellation Fund (the “Target Fund”) pursuant to a plan of reorganization approved by the Trustees of the Fund on August 27, 2013. The acquisition was accomplished by a tax-free exchange of 171,285,956 shares of the Fund for 90,880,346 shares outstanding of the Target Fund as of the close of business on September 13, 2013. Shares of the Target Fund were exchanged for the like class of shares of the Fund, based on the relative net asset value of the Target Fund to the net asset value of the Fund on the close of business, September 13, 2013. The Target Fund’s net assets as of the close of business on September 13, 2013 of $2,644,072,150, including $725,175,144 of unrealized appreciation, were combined with those of the Fund. The net assets of the Fund immediately before the acquisition were $6,558,988,103 and $9,203,060,253 immediately after the acquisition. |
| The pro forma results of operations for the year ended August 31, 2014 assuming the reorganization had been completed on September 1, 2013, the beginning of the annual reporting period are as follows: |
Net investment income (loss) | $ | (28,410,833 | ) | |
Net realized/unrealized gains | 4,238,871,492 | |||
Change in net assets resulting from operations | $ | 4,210,460,659 |
| As the combined investment portfolios have been managed as a single integrated portfolio since the acquisition was completed, it is not practicable to separate the amounts of revenue and earnings of the Target Fund that have been included in the Fund’s Statement of Operations since September 16, 2013. |
19 Invesco American Franchise Fund
NOTE 11—Financial Highlights
The following schedule presents financial highlights for a share of the Fund outstanding throughout the periods indicated.
| Net asset value, beginning of period | Net investment income (loss)(a) | Net gains (losses) on securities (both realized and unrealized) | Total from investment operations | Dividends from net investment income | Distributions from net realized gains | Total distributions | Net asset value, end of period | Total return(b) | Net assets, end of period (000’s omitted) | Ratio of expenses to average net assets with fee waivers and/or expenses absorbed | Ratio of expenses to average net assets without fee waivers and/or expenses absorbed | Ratio of net investment income (loss) to average net assets | Portfolio turnover(c) | |||||||||||||||||||||||||||||||||||||||||||
Class A |
| |||||||||||||||||||||||||||||||||||||||||||||||||||||||
Year ended 08/31/15 | $ | 18.07 | $ | (0.05 | ) | $ | 0.08 | $ | 0.03 | $ | — | $ | (1.61 | ) | $ | (1.61 | ) | $ | 16.49 | 0.27 | % | $ | 8,320,796 | 1.05 | %(d) | 1.05 | %(d) | (0.28 | )%(d) | 74 | % | |||||||||||||||||||||||||
Year ended 08/31/14 | 14.82 | (0.04 | ) | 3.99 | 3.95 | (0.02 | ) | (0.68 | ) | (0.70 | ) | 18.07 | 27.22 | 9,034,217 | 1.08 | 1.08 | (0.27 | ) | 77 | |||||||||||||||||||||||||||||||||||||
Year ended 08/31/13 | 12.47 | 0.02 | 2.33 | 2.35 | (0.00 | ) | — | (0.00 | ) | 14.82 | 18.89 | 5,428,321 | 1.06 | 1.14 | 0.17 | 80 | ||||||||||||||||||||||||||||||||||||||||
Year ended 08/31/12 | 11.72 | (0.01 | ) | 0.88 | 0.87 | — | (0.12 | ) | (0.12 | ) | 12.47 | 7.55 | 4,728,364 | 1.05 | 1.18 | (0.05 | ) | 96 | ||||||||||||||||||||||||||||||||||||||
Year ended 08/31/11 | 9.79 | (0.05 | ) | 1.98 | 1.93 | — | — | — | 11.72 | 19.71 | 4,894,163 | 1.06 | 1.17 | (0.43 | ) | 179 | ||||||||||||||||||||||||||||||||||||||||
Class B |
| |||||||||||||||||||||||||||||||||||||||||||||||||||||||
Year ended 08/31/15 | 17.66 | (0.05 | ) | 0.08 | 0.03 | — | (1.61 | ) | (1.61 | ) | 16.08 | 0.27 | (e) | 165,265 | 1.05 | (d)(e) | 1.05 | (d)(e) | (0.28 | )(d)(e) | 74 | |||||||||||||||||||||||||||||||||||
Year ended 08/31/14 | 14.50 | (0.04 | ) | 3.90 | 3.86 | (0.02 | ) | (0.68 | ) | (0.70 | ) | 17.66 | 27.20 | (e) | 247,220 | 1.08 | (e) | 1.08 | (e) | (0.27 | )(e) | 77 | ||||||||||||||||||||||||||||||||||
Year ended 08/31/13 | 12.20 | 0.02 | 2.28 | 2.30 | (0.00 | ) | — | (0.00 | ) | 14.50 | 18.90 | (e) | 226,796 | 1.06 | (e) | 1.14 | (e) | 0.17 | (e) | 80 | ||||||||||||||||||||||||||||||||||||
Year ended 08/31/12 | 11.47 | (0.01 | ) | 0.86 | 0.85 | — | (0.12 | ) | (0.12 | ) | 12.20 | 7.54 | (e) | 273,177 | 1.05 | (e) | 1.18 | (e) | (0.05 | )(e) | 96 | |||||||||||||||||||||||||||||||||||
Year ended 08/31/11 | 9.64 | (0.08 | ) | 1.91 | 1.83 | — | — | — | 11.47 | 18.98 | (e) | 373,157 | 1.28 | (e) | 1.65 | (e) | (0.64 | )(e) | 179 | |||||||||||||||||||||||||||||||||||||
Class C |
| |||||||||||||||||||||||||||||||||||||||||||||||||||||||
Year ended 08/31/15 | 17.34 | (0.17 | ) | 0.08 | (0.09 | ) | — | (1.61 | ) | (1.61 | ) | 15.64 | (0.46 | ) | 381,264 | 1.80 | (d) | 1.80 | (d) | (1.03 | )(d) | 74 | ||||||||||||||||||||||||||||||||||
Year ended 08/31/14 | 14.34 | (0.16 | ) | 3.84 | 3.68 | — | (0.68 | ) | (0.68 | ) | 17.34 | 26.23 | 417,687 | 1.83 | 1.83 | (1.02 | ) | 77 | ||||||||||||||||||||||||||||||||||||||
Year ended 08/31/13 | 12.16 | (0.08 | ) | 2.26 | 2.18 | — | — | — | 14.34 | 17.93 | 271,960 | 1.81 | 1.89 | (0.58 | ) | 80 | ||||||||||||||||||||||||||||||||||||||||
Year ended 08/31/12 | 11.51 | (0.09 | ) | 0.86 | 0.77 | — | (0.12 | ) | (0.12 | ) | 12.16 | 6.82 | 252,685 | 1.80 | 1.93 | (0.80 | ) | 96 | ||||||||||||||||||||||||||||||||||||||
Year ended 08/31/11 | 9.68 | (0.11 | ) | 1.94 | 1.83 | — | — | — | 11.51 | 18.90 | (f) | 266,990 | 1.60 | (f) | 1.71 | (f) | (0.97 | )(f) | 179 | |||||||||||||||||||||||||||||||||||||
Class R |
| |||||||||||||||||||||||||||||||||||||||||||||||||||||||
Year ended 08/31/15 | 17.93 | (0.09 | ) | 0.08 | (0.01 | ) | — | (1.61 | ) | (1.61 | ) | 16.31 | 0.03 | 30,716 | 1.30 | (d) | 1.30 | (d) | (0.53 | )(d) | 74 | |||||||||||||||||||||||||||||||||||
Year ended 08/31/14 | 14.74 | (0.09 | ) | 3.96 | 3.87 | — | (0.68 | ) | (0.68 | ) | 17.93 | 26.83 | 31,760 | 1.33 | 1.33 | (0.52 | ) | 77 | ||||||||||||||||||||||||||||||||||||||
Year ended 08/31/13 | 12.43 | (0.01 | ) | 2.32 | 2.31 | — | — | — | 14.74 | 18.58 | 19,576 | 1.31 | 1.39 | (0.08 | ) | 80 | ||||||||||||||||||||||||||||||||||||||||
Year ended 08/31/12 | 11.71 | (0.04 | ) | 0.88 | 0.84 | — | (0.12 | ) | (0.12 | ) | 12.43 | 7.30 | 18,746 | 1.30 | 1.43 | (0.30 | ) | 96 | ||||||||||||||||||||||||||||||||||||||
Year ended 08/31/11(g) | 12.81 | (0.02 | ) | (1.08 | ) | (1.10 | ) | — | — | — | 11.71 | (8.59 | ) | 17,698 | 1.30 | (h) | 1.42 | (h) | (0.66 | )(h) | 179 | |||||||||||||||||||||||||||||||||||
Class Y |
| |||||||||||||||||||||||||||||||||||||||||||||||||||||||
Year ended 08/31/15 | 18.22 | (0.01 | ) | 0.09 | 0.08 | — | (1.61 | ) | (1.61 | ) | 16.69 | 0.56 | 152,179 | 0.80 | (d) | 0.80 | (d) | (0.03 | )(d) | 74 | ||||||||||||||||||||||||||||||||||||
Year ended 08/31/14 | 14.93 | (0.00 | ) | 4.01 | 4.01 | (0.04 | ) | (0.68 | ) | (0.72 | ) | 18.22 | 27.48 | 141,094 | 0.83 | 0.83 | (0.02 | ) | 77 | |||||||||||||||||||||||||||||||||||||
Year ended 08/31/13 | 12.57 | 0.06 | 2.34 | 2.40 | (0.04 | ) | — | (0.04 | ) | 14.93 | 19.13 | 92,418 | 0.81 | 0.89 | 0.42 | 80 | ||||||||||||||||||||||||||||||||||||||||
Year ended 08/31/12 | 11.78 | 0.02 | 0.89 | 0.91 | — | (0.12 | ) | (0.12 | ) | 12.57 | 7.86 | 99,758 | 0.80 | 0.93 | 0.20 | 96 | ||||||||||||||||||||||||||||||||||||||||
Year ended 08/31/11 | 9.83 | (0.02 | ) | 1.97 | 1.95 | — | — | — | 11.78 | 19.84 | 117,471 | 0.81 | 0.92 | (0.18 | ) | 179 | ||||||||||||||||||||||||||||||||||||||||
Class R5 |
| |||||||||||||||||||||||||||||||||||||||||||||||||||||||
Year ended 08/31/15 | 18.20 | 0.01 | 0.08 | 0.09 | — | (1.61 | ) | (1.61 | ) | 16.68 | 0.62 | 50,052 | 0.71 | (d) | 0.71 | (d) | 0.06 | (d) | 74 | |||||||||||||||||||||||||||||||||||||
Year ended 08/31/14 | 14.90 | 0.02 | 4.01 | 4.03 | (0.05 | ) | (0.68 | ) | (0.73 | ) | 18.20 | 27.65 | 52,164 | 0.70 | 0.70 | 0.11 | 77 | |||||||||||||||||||||||||||||||||||||||
Year ended 08/31/13 | 12.55 | 0.06 | 2.34 | 2.40 | (0.05 | ) | — | (0.05 | ) | 14.90 | 19.22 | 151,535 | 0.75 | 0.75 | 0.48 | 80 | ||||||||||||||||||||||||||||||||||||||||
Year ended 08/31/12 | 11.75 | 0.04 | 0.88 | 0.92 | — | (0.12 | ) | (0.12 | ) | 12.55 | 7.96 | 301,283 | 0.69 | 0.69 | 0.31 | 96 | ||||||||||||||||||||||||||||||||||||||||
Year ended 08/31/11(g) | 12.07 | (0.00 | ) | (0.32 | ) | (0.32 | ) | — | — | — | 11.75 | (2.65 | ) | 197,097 | 0.66 | (h) | 0.66 | (h) | (0.03 | )(h) | 179 | |||||||||||||||||||||||||||||||||||
Class R6 |
| |||||||||||||||||||||||||||||||||||||||||||||||||||||||
Year ended 08/31/15 | 18.22 | 0.03 | 0.08 | 0.11 | — | (1.61 | ) | (1.61 | ) | 16.72 | 0.73 | 86,444 | 0.62 | (d) | 0.62 | (d) | 0.15 | (d) | 74 | |||||||||||||||||||||||||||||||||||||
Year ended 08/31/14 | 14.92 | 0.03 | 4.01 | 4.04 | (0.06 | ) | (0.68 | ) | (0.74 | ) | 18.22 | 27.69 | 137,509 | 0.63 | 0.63 | 0.18 | 77 | |||||||||||||||||||||||||||||||||||||||
Year ended 08/31/13(g) | 13.03 | 0.07 | 1.87 | 1.94 | (0.05 | ) | — | (0.05 | ) | 14.92 | 14.98 | 113,955 | 0.65 | (h) | 0.65 | (h) | 0.58 | (h) | 80 | |||||||||||||||||||||||||||||||||||||
| (a) | Calculated using average shares outstanding. |
| (b) | Includes adjustments in accordance with accounting principles generally accepted in the United States of America and as such, the net asset value for financial reporting purposes and the returns based upon those net asset values may differ from the net asset value and returns for shareholder transactions. Does not include sales charges and is not annualized for periods less than one year, if applicable. |
| (c) | Portfolio turnover is calculated at the fund level and is not annualized for periods less than one year, if applicable. For the year ended August 31, 2014, the portfolio turnover calculation excludes the value of securities purchased of $1,921,954,452 and sales of $1,568,687,370 in the effort to realign the Fund’s portfolio holdings after the reorganization of Invesco Constellation Fund into the Fund. For the year ended August 31, 2013, the portfolio turnover calculation excludes the value of securities purchased of $279,161,573 and sales of $299,305,234 in the effort to realign the Fund’s portfolio holdings after the reorganization of Invesco Leisure Fund into the Fund. For the year ended August 31, 2011, the portfolio turnover calculation excludes the value of securities purchased of $4,947,460,310 and sales of $2,251,028,915 in the effort to realign the Fund’s portfolio holdings after the reorganization of Invesco Large Cap Growth Fund, Invesco Van Kampen Capital Growth Fund and Invesco Van Kampen Enterprise Fund into the Fund. |
| (d) | Ratios are based on average daily net assets (000’s omitted) of $8,902,336, $211,369, $409,366, $32,260, $154,896, $51,201 and $113,943 for Class A, Class B, Class C, Class R, Class Y, Class R5 and Class R6 shares, respectively. |
| (e) | The total return, ratio of expenses to average net assets and ratio of net investment income (loss) to average net assets reflect actual 12b-1 fees of 0.25%, 0.25%, 0.25%, 0.25% and 0.47% for the years ended August 31, 2015, 2014, 2013, 2012 and 2011, respectively. |
| (f) | The total return, ratio of expenses to average net assets and ratio of net investment income (loss) to average net assets reflect actual 12b-1 fees of 0.79% for the year ended August 31, 2011. |
| (g) | Commencement date of May 23, 2011 for Class R shares, December 22, 2010 for Class R5 shares and September 24, 2012 for Class R6 shares. |
| (h) | Annualized. |
20 Invesco American Franchise Fund
Report of Independent Registered Public Accounting Firm
To the Board of Trustees of AIM Counselor Series Trust (Invesco Counselor Series Trust)
and Shareholders of Invesco American Franchise Fund:
In our opinion, the accompanying statement of assets and liabilities, including the schedule of investments, and the related statements of operations and of changes in net assets and the financial highlights present fairly, in all material respects, the financial position of Invesco American Franchise Fund (one of the funds constituting AIM Counselor Series Trust (Invesco Counselor Series Trust), hereafter referred to as the “Fund”) at August 31, 2015, the results of its operations for the year then ended, the changes in its net assets for each of the two years in the period then ended and the financial highlights for each of the five years in the period then ended, in conformity with accounting principles generally accepted in the United States of America. These financial statements and financial highlights (hereafter referred to as “financial statements”) are the responsibility of the Fund’s management. Our responsibility is to express an opinion on these financial statements based on our audits. We conducted our audits of these financial statements in accordance with the standards of the Public Company Accounting Oversight Board (United States). Those standards require that we plan and perform the audit to obtain reasonable assurance about whether the financial statements are free of material misstatement. An audit includes examining, on a test basis, evidence supporting the amounts and disclosures in the financial statements, assessing the accounting principles used and significant estimates made by management, and evaluating the overall financial statement presentation. We believe that our audits, which included confirmation of securities at August 31, 2015 by correspondence with the custodian and brokers, and the application of alternative auditing procedures where confirmations of security purchases have not been received, provide a reasonable basis for our opinion.
PRICEWATERHOUSECOOPERS LLP
October 27, 2015
Houston, Texas
21 Invesco American Franchise Fund
Calculating your ongoing Fund expenses
Example
As a shareholder of the Fund, you incur two types of costs: (1) transaction costs, which may include sales charges (loads) on purchase payments or contingent deferred sales charges on redemptions, if any; and (2) ongoing costs, including management fees, distribution and/or service (12b-1) fees, and other Fund expenses. This example is intended to help you understand your ongoing costs (in dollars) of investing in the Fund and to compare these costs with ongoing costs of investing in other mutual funds. The example is based on an investment of $1,000 invested at the beginning of the period and held for the entire period March 1, 2015 through August 31, 2015.
Actual expenses
The table below provides information about actual account values and actual expenses. You may use the information in this table, together with the amount you invested, to estimate the expenses that you paid over the period. Simply divide your account value by $1,000 (for example, an $8,600 account value divided by $1,000 = 8.6), then multiply the result by the number in the table under the heading entitled “Actual Expenses Paid During Period” to estimate the expenses you paid on your account during this period.
Hypothetical example for comparison purposes
The table below also provides information about hypothetical account values and hypothetical expenses based on the Fund’s actual expense ratio and an assumed rate of return of 5% per year before expenses, which is not the Fund’s actual return.
The hypothetical account values and expenses may not be used to estimate the actual ending account balance or expenses you paid for the period. You may use this information to compare the ongoing costs of investing in the Fund and other funds. To do so, compare this 5% hypothetical example with the 5% hypothetical examples that appear in the shareholder reports of the other funds.
Please note that the expenses shown in the table are meant to highlight your ongoing costs only and do not reflect any transaction costs, such as sales charges (loads) on purchase payments or contingent deferred sales charges on redemptions, if any. Therefore, the hypothetical information is useful in comparing ongoing costs only, and will not help you determine the relative total costs of owning different funds. In addition, if these transaction costs were included, your costs would have been higher.
| Class | Beginning Account Value (03/01/15) | ACTUAL | HYPOTHETICAL (5% annual return before expenses) | Annualized Expense Ratio | ||||||||||||||||||||
| Ending Account Value (08/31/15)1 | Expenses Paid During Period2 | Ending Account Value (08/31/15) | Expenses Paid During Period2 | |||||||||||||||||||||
| A | $ | 1,000.00 | $ | 940.70 | $ | 5.09 | $ | 1,019.96 | $ | 5.30 | 1.04 | % | ||||||||||||
| B | 1,000.00 | 940.90 | 5.09 | 1,019.96 | 5.30 | 1.04 | ||||||||||||||||||
| C | 1,000.00 | 937.10 | 8.74 | 1,016.18 | 9.10 | 1.79 | ||||||||||||||||||
| R | 1,000.00 | 939.00 | 6.30 | 1,018.70 | 6.56 | 1.29 | ||||||||||||||||||
| Y | 1,000.00 | 941.90 | 3.87 | 1,021.22 | 4.02 | 0.79 | ||||||||||||||||||
| R5 | 1,000.00 | 941.80 | 3.52 | 1,021.58 | 3.67 | 0.72 | ||||||||||||||||||
| R6 | 1,000.00 | 942.50 | 2.99 | 1,022.13 | 3.11 | 0.61 | ||||||||||||||||||
| 1 | The actual ending account value is based on the actual total return of the Fund for the period March 1, 2015 through August 31, 2015, after actual expenses and will differ from the hypothetical ending account value which is based on the Fund’s expense ratio and a hypothetical annual return of 5% before expenses. |
| 2 | Expenses are equal to the Fund’s annualized expense ratio as indicated above multiplied by the average account value over the period, multiplied by 184/365 to reflect the most recent fiscal half year. |
22 Invesco American Franchise Fund
Approval of Investment Advisory and Sub-Advisory Contracts
The Board of Trustees (the Board) of AIM Counselor Series Trust (Invesco Counselor Series Trust) is required under the Investment Company Act of 1940, as amended, to approve annually the renewal of Invesco American Franchise Fund’s (the Fund) investment advisory agreements. During contract renewal meetings held on June 9-10, 2015, the Board as a whole, and the disinterested or “independent” Trustees, who comprise over 75% of the Board, voting separately, approved the continuance for the Fund of the Master Investment Advisory Agreement with Invesco Advisers, Inc. (Invesco Advisers and the investment advisory agreement) and the Master Intergroup Sub-Advisory Contract for Mutual Funds with Invesco Asset Management Deutschland GmbH, Invesco Asset Management Limited, Invesco Asset Management (Japan) Limited, Invesco Hong Kong Limited, Invesco Senior Secured Management, Inc. and Invesco Canada Ltd. (collectively, the Affiliated Sub-Advisers and the sub-advisory contracts) for another year, effective July 1, 2015.
In evaluating the fairness and reasonableness of compensation under the Fund’s investment advisory agreement and sub-advisory contracts, the Board considered, among other things, the factors discussed below. The Board determined that continuation of the Fund’s investment advisory agreement and the sub-advisory contracts is in the best interest of the Fund and its shareholders and that the compensation payable to Invesco Advisers and the Affiliated Sub-Advisers under the agreements is fair and reasonable.
The Board’s Fund Evaluation Process
The Board’s Investments Committee has established three Sub-Committees, each of which is primarily responsible for overseeing the performance and investment management services provided by Invesco Advisers and the Affiliated Sub-Advisers to a number of the funds advised by Invesco Advisers (the Invesco Funds). The Sub-Committees meet throughout the year to review the performance of their assigned Invesco Funds, including reviewing materials prepared under the direction of the independent Senior Officer, an officer of the Invesco Funds who reports directly to the independent Trustees. Over the course of each year, the Sub-Committees meet with portfolio managers for their assigned Invesco Funds and other members of management to review the performance, investment objective(s), policies, strategies, limitations and investment risks of these funds. The Board had the benefit of reports from the Sub-Committees and Investments Committee throughout the year in considering approval of the continuance of each Invesco Fund’s investment advisory agreement and sub-advisory contracts for another year.
During the contract renewal process, the Board receives comparative performance and fee data regarding the Invesco Funds prepared by Invesco Advisers and Lipper Inc. (Lipper), an independent provider of investment company data. The Board also receives a report and this independent written evaluation from the Senior Officer. The Senior Officer’s evaluation is prepared as part of his responsibility to manage the process by which the Invesco Funds’ proposed management fees are negotiated during the annual contract renewal process to ensure they are negotiated in a manner that is at arms’ length and reasonable. In addition to meetings with Invesco Advisers and fund counsel, the independent Trustees also discuss the continuance of the investment advisory agreement and sub-advisory contracts in separate sessions with the Senior Officer and with independent legal counsel.
The Trustees recognized that the advisory fee rates for the Invesco Funds are, in many cases, the result of years of review and negotiation. The Trustees’ deliberations and conclusions in a particular year may be based in part on their deliberations and conclusions regarding these arrangements throughout the year and in prior years. The Trustees’ review and conclusions are based on the comprehensive consideration of all information presented to them and are not the result of any single determinative factor. Moreover, one Trustee may have weighed a particular piece of information or factor differently than another Trustee.
The discussion below is a summary of the Senior Officer’s independent written evaluation with respect to the Fund’s investment advisory agreement as well as a discussion of the material factors and related conclusions that formed the basis for the Board’s approval of the Fund’s investment advisory agreement and sub-advisory contracts. Unless otherwise stated, this information is current as of June 10, 2015, and does not reflect consideration of factors that became known to the Board after that date.
Factors and Conclusions and Summary of Independent Written Fee Evaluation
| A. | Nature, Extent and Quality of Services Provided by Invesco Advisers and the Affiliated Sub-Advisers |
The Board reviewed the advisory services provided to the Fund by Invesco Advisers under the Fund’s investment advisory agreement, the performance of Invesco Advisers in providing these services, and the credentials and experience of the officers and employees of Invesco Advisers who provide these services, including the Fund’s portfolio manager or managers. The Board’s review of the qualifications of Invesco Advisers to provide advisory services included the Board’s consideration of Invesco Advisers’ investment
process oversight, independent credit analysis and investment risk management. The Board also considered non-advisory services that Invesco Advisers and its affiliates provide to the Invesco Funds such as various back office support functions, equity and fixed income trading operations, internal audit, distribution, valuation and legal and compliance.
In determining whether to continue the Fund’s investment advisory agreement, the Board considered the benefits of reapproving an existing relationship and the greater uncertainty that may be associated with entering into a new relationship. The Board concluded that the nature, extent and quality of the services provided to the Fund by Invesco Advisers are appropriate and satisfactory and consistent with the terms of the Fund’s investment advisory agreement.
The Board reviewed the services that may be provided by the Affiliated Sub-Advisers under the sub-advisory contracts and the credentials and experience of the officers and employees of the Affiliated Sub-Advisers who provide these services. The Board noted that the Affiliated Sub-Advisers have offices and personnel that are located in financial centers around the world. As a result, the Affiliated Sub-Advisers can provide research and investment analysis on the markets and economies of various countries in which the Fund may invest, make recommendations regarding securities and assist with security trades. The Board concluded that the sub-advisory contracts benefit the Fund and its shareholders by permitting Invesco Advisers to use the resources and talents of the Affiliated Sub-Advisers in managing the Fund. The Board concluded that the nature, extent and quality of the services that may be provided by the Affiliated Sub-Advisers are appropriate and satisfactory and consistent with the terms of the Fund’s sub-advisory contracts.
| B. | Fund Performance |
The Board considered Fund performance as a relevant factor in considering whether to approve the investment advisory agreement. The Board did not view Fund performance as a relevant factor in considering whether to approve the sub-advisory contracts for the Fund, as no Affiliated Sub-Adviser currently manages assets of the Fund.
The Board compared the Fund’s performance during the past one, three and five calendar years to the performance of funds in the Lipper performance universe and against the Lipper Large-Cap Growth Funds Index. The Board noted that performance of Class A shares of the Fund was in the fifth quintile of its performance universe for the one year period, and the third quintile for the three and five year periods (the first quintile being the best performing funds and the fifth quintile being the worst performing funds). The Board noted that performance of
23 Invesco American Franchise Fund
Class A shares of the Fund was below the performance of the Index for the one and three year periods and above the performance of the Index for the five year period. Invesco Advisers noted that the markets had been challenging for growth-oriented styles that have higher exposures to market sensitivity, volatility and momentum. The Trustees also reviewed more recent Fund performance and this review did not change their conclusions.
| C. | Advisory and Sub-Advisory Fees |
The Board compared the Fund’s contractual management fee rate to the contractual management fee rates of funds in the Fund’s Lipper expense group at a common asset level. The Board noted that the contractual management fee rate for Class A shares of the Fund was below the median contractual management fee rate of funds in its expense group. The Board noted that the term “contractual management fee” may include both advisory and certain administrative services fees, but that Lipper does not provide information on a fund by fund basis as to what is included. The Board noted that Invesco Advisers does not charge the Invesco Funds for the administrative services included in the term as defined by Lipper. The Board also reviewed the methodology used by Lipper in providing expense group information, which includes using each fund’s contractual management fee schedule (including any applicable breakpoints) as reported in the most recent prospectus or statement of additional information for each fund in the expense group.
The Board also compared the Fund’s effective advisory fee rate (the advisory fee rate after advisory fee waivers and before other expense limitations/waivers) to the effective advisory fee rates of other mutual funds advised by Invesco Advisers and its affiliates with investment strategies comparable to those of the Fund. The Board noted that the Fund’s rate was below the rate of one such mutual fund. The Board also noted how the Fund’s rate compared to the effective sub-adviser fee rate of one mutual fund sub-advised by Invesco Advisers.
The Board also considered the fees charged by Invesco Advisers and the Affiliated Sub-Advisers to other client accounts with investment strategies comparable to those of the Fund. The Board noted that Invesco Advisers or the Affiliated Sub-Advisers may charge lower fees to large institutional clients. Invesco Advisers reviewed with the Board the significantly greater scope of services it provides to the Invesco Funds relative to certain other types of client accounts. These additional services include provision of administrative services, officers and office space, oversight of service providers, preparation of annual registration statement updates and financial information and regulatory compliance under the Investment Company Act of 1940, as amended.
Invesco Advisers also reviewed generally the higher frequency of shareholder purchases and redemptions in the Invesco Funds relative to the
flow of assets for other client accounts. Invesco Advisers advised the Board that advance notice of redemptions is often provided to Invesco Advisers by institutional clients. The Board did note that sub-advisory fee rates charged by the Affiliated Sub-Advisers to manage the Invesco Funds and to manage other client accounts tended to be more comparable, reflecting a similar scope of services. The information received by the Board demonstrated that the aggregate services provided to the Invesco Funds were sufficiently different from those provided to institutional clients to support the difference in fees.
The Board also considered the services that may be provided by the Affiliated Sub-Advisers pursuant to the sub-advisory contracts, as well as the fees payable by Invesco Advisers to the Affiliated Sub-Advisers pursuant to the sub-advisory contracts. The Board also noted that the sub-advisory fees are not paid directly by the Fund, but rather, are payable by Invesco Advisers to the Affiliated Sub-Advisers.
| D. | Economies of Scale and Breakpoints |
The Board considered the extent to which there are economies of scale in the provision of advisory services to the Fund. The Board also considered whether the Fund benefits from economies of scale through contractual breakpoints in the Fund’s advisory fee schedule. The Board also noted that the Fund shares directly in economies of scale through lower fees charged by third party service providers based on the combined size of the Invesco Funds and other clients advised by Invesco Advisers.
| E. | Profitability and Financial Resources |
The Board reviewed information from Invesco Advisers concerning the costs of the advisory and other services that Invesco Advisers and its affiliates provide to the Fund and the Invesco Funds and the profitability of Invesco Advisers and its affiliates in providing these services. The Board received information from Invesco Advisers about the methodology used to prepare the profitability information. The Board noted that Invesco Advisers continues to operate at a net profit from services Invesco Advisers and its affiliates provide to the Invesco Funds and the Fund. The Board did not deem the level of profits realized by Invesco Advisers and its affiliates from providing services to the Fund to be excessive given the nature, quality and extent of the services provided.
The Board received and accepted information from Invesco Advisers demonstrating that Invesco Advisers and each Affiliated Sub-Adviser are financially sound and have the resources necessary to perform their obligations under the investment advisory agreement and sub-advisory contracts.
| F. | Collateral Benefits to Invesco Advisers and its Affiliates |
The Board considered various other benefits received by Invesco Advisers and its affiliates from the relationship with the Fund, including the fees received for providing transfer agency and distribution services to the Fund. The Board
considered comparative information regarding fees charged for these services, including information provided by Lipper and other independent sources. The Board considered the performance of Invesco Advisers and its affiliates in providing these services and the organizational structure employed to provide these services. The Board also considered that these services are provided to the Fund pursuant to written contracts that are reviewed and approved on an annual basis by the Board; and that the services are required for the operation of the Fund.
The Board considered the benefits realized by Invesco Advisers and the Affiliated Sub-Advisers as a result of portfolio brokerage transactions executed through “soft dollar” arrangements. The Board noted that soft dollar arrangements shift the payment obligation for research services from Invesco Advisers and the Affiliated Sub-Advisers to the Invesco Funds and that the research received may be used with other clients of Invesco Advisers and may reduce Invesco Advisers’ and the Affiliated Sub-Advisers’ expenses. The Board also considered that it receives periodic reports from the Chief Compliance Officer of the Invesco Funds demonstrating that these arrangements are consistent with regulatory requirements. The Board did not deem the soft dollar arrangements to be inappropriate.
The Board considered that the Fund’s uninvested cash and cash collateral from any securities lending arrangements may be invested in money market funds advised by Invesco Advisers pursuant to procedures approved by the Board. The Board noted that Invesco Advisers receives advisory fees from these affiliated money market funds attributable to such investments, although Invesco Advisers has contractually agreed to waive through varying periods the advisory fees payable by the Invesco Funds with respect to investments in the affiliated money market funds. The waiver is in an amount equal to 100% of the net advisory fee Invesco Advisers receives from the affiliated money market funds with respect to the Fund’s investment in the affiliated money market funds of uninvested cash, but not cash collateral. The Board concluded that the amount of advisory fees received by Invesco Advisors from the Fund’s investment of cash collateral from any securities lending arrangements in the affiliated money market funds is fair and reasonable.
The Board also considered the Fund may use an affiliated broker to execute certain trades for the Fund to, among other things, control information leakage, and were advised that such trades would be executed in compliance with rules under the Investment Company Act of 1940, as amended, and consistent with best execution obligations.
24 Invesco American Franchise Fund
Tax Information
Form 1099-DIV, Form 1042-S and other year–end tax information provide shareholders with actual calendar year amounts that should be included in their tax returns. Shareholders should consult their tax advisors.
The following distribution information is being provided as required by the Internal Revenue Code or to meet a specific state’s requirement.
The Fund designates the following amounts or, if subsequently determined to be different, the maximum amount allowable for its fiscal year ended August 31, 2015:
Federal and State Income Tax | ||||
Long-Term Capital Gain Distributions | $ | 875,055,601 | ||
Qualified Dividend Income* | 0 | % | ||
Corporate Dividends Received Deduction* | 0 | % | ||
U.S. Treasury Obligations* | 0 | % | ||
Tax-Exempt Interest Dividends* | 0 | % | ||
| * | The above percentages are based on ordinary income dividends paid to shareholders during the Fund’s fiscal year. |
25 Invesco American Franchise Fund
Trustees and Officers
The address of each trustee and officer is AIM Counselor Series Trust (Invesco Counselor Series Trust) (the “Trust”), 11 Greenway Plaza, Suite 1000, Houston, Texas 77046-1173. The trustees serve for the life of the Trust, subject to their earlier death, incapacitation, resignation, retirement or removal as more specifically provided in the Trust’s organizational documents. Each officer serves for a one year term or until their successors are elected and qualified. Column two below includes length of time served with predecessor entities, if any.
| Name, Year of Birth and Position(s) Held with the Trust | Trustee and/ or Officer Since | Principal Occupation(s) During Past 5 Years | Number of Funds in Fund Complex Overseen by Trustee | Other Directorship(s) Held by Trustee During Past 5 Years | ||||
| Interested Persons | ||||||||
| Martin L. Flanagan1 — 1960 Trustee | 2007 | Executive Director, Chief Executive Officer and President, Invesco Ltd. (ultimate parent of Invesco and a global investment management firm); Advisor to the Board, Invesco Advisers, Inc. (formerly known as Invesco Institutional (N.A.), Inc.); Trustee, The Invesco Funds; Vice Chair, Investment Company Institute; and Member of Executive Board, SMU Cox School of Business
Formerly: Chairman and Chief Executive Officer, Invesco Advisers, Inc. (registered investment adviser); Director, Chairman, Chief Executive Officer and President, IVZ Inc. (holding company), INVESCO Group Services, Inc. (service provider) and Invesco North American Holdings, Inc. (holding company); Director, Chief Executive Officer and President, Invesco Holding Company Limited (parent of Invesco and a global investment management firm); Director, Invesco Ltd.; Chairman, Investment Company Institute and President, Co-Chief Executive Officer, Co-President, Chief Operating Officer and Chief Financial Officer, Franklin Resources, Inc. (global investment management organization). | 144 | None | ||||
| Philip A. Taylor2 — 1954 Trustee, President and Principal Executive Officer | 2006 | Head of North American Retail and Senior Managing Director, Invesco Ltd.; Director, Co-Chairman, Co-President and Co-Chief Executive Officer, Invesco Advisers, Inc. (formerly known as Invesco Institutional (N.A.), Inc.) (registered investment adviser); Director, Chairman, Chief Executive Officer and President, Invesco Management Group, Inc. (formerly known as Invesco Aim Management Group, Inc.) (financial services holding company); Director and President, INVESCO Funds Group, Inc. (registered investment adviser and registered transfer agent); Director and Chairman, Invesco Investment Services, Inc. (formerly known as Invesco Aim Investment Services, Inc.) (registered transfer agent) and IVZ Distributors, Inc. (formerly known as INVESCO Distributors, Inc.) (registered broker dealer); Director, President and Chairman, Invesco Inc. (holding company), Invesco Canada Holdings Inc. (holding company), Trimark Investments Ltd./Placements Trimark Ltèe and Invesco Financial Services Ltd/Services Financiers Invesco Ltèe; Chief Executive Officer, Invesco Corporate Class Inc. (corporate mutual fund company) Director, Chairman and Chief Executive Officer, Invesco Canada Ltd. (formerly known as Invesco Trimark Ltd./Invesco Trimark Ltèe) (registered investment adviser and registered transfer agent); Trustee, President and Principal Executive Officer, The Invesco Funds (other than AIM Treasurer’s Series Trust (Invesco Treasurer’s Series Trust), Short-Term Investments Trust and Invesco Management Trust); Trustee and Executive Vice President, The Invesco Funds (AIM Treasurer’s Series Trust (Invesco Treasurer’s Series Trust), Short-Term Investments Trust and Invesco Management Trust only); Director, Invesco Investment Advisers LLC (formerly known as Van Kampen Asset Management); Director, Chief Executive Officer and President, Van Kampen Exchange Corp.
Formerly: Chief Executive Officer, Invesco Canada Fund Inc (corporate mutual fund company); Director and Chairman, Van Kampen Investor Services Inc.; Director, Chief Executive Officer and President, 1371 Preferred Inc. (holding company) and Van Kampen Investments Inc.; Director and President, AIM GP Canada Inc. (general partner for limited partnerships) and Van Kampen Advisors, Inc.; Director and Chief Executive Officer, Invesco Trimark Dealer Inc. (registered broker dealer); Director, Invesco Distributors, Inc. (formerly known as Invesco Aim Distributors, Inc.) (registered broker dealer); Manager, Invesco PowerShares Capital Management LLC; Director, Chief Executive Officer and President, Invesco Advisers, Inc.; Director, Chairman, Chief Executive Officer and President, Invesco Aim Capital Management, Inc.; President, Invesco Trimark Dealer Inc. and Invesco Trimark Ltd./Invesco Trimark Ltèe; Director and President, AIM Trimark Corporate Class Inc. and AIM Trimark Canada Fund Inc.; Senior Managing Director, Invesco Holding Company Limited; Director and Chairman, Fund Management Company (former registered broker dealer); President and Principal Executive Officer, The Invesco Funds (AIM Treasurer’s Series Trust (Invesco Treasurer’s Series Trust), and Short-Term Investments Trust only); President, AIM Trimark Global Fund Inc. and AIM Trimark Canada Fund Inc.. | 144 | None |
| 1 | Mr. Flanagan is considered an interested person (within the meaning of Section 2(a)(19) of the 1940 Act) of the Trust because he is an officer of the Adviser to the Trust, and an officer and a director of Invesco Ltd., ultimate parent of the Adviser. |
| 2 | Mr. Taylor is considered an interested person (within the meaning of Section 2(a)(19) of the 1940 Act) of the Trust because he is an officer and a director of the Adviser. |
T-1 Invesco American Franchise Fund
Trustees and Officers—(continued)
| Name, Year of Birth and Position(s) Held with the Trust | Trustee and/ or Officer Since | Principal Occupation(s) During Past 5 Years | Number of Funds in Fund Complex Overseen by Trustee | Other Directorship(s) Held by Trustee During Past 5 Years | ||||
| Independent Trustees | ||||||||
Bruce L. Crockett — 1944 Trustee and Chair | 2003 | Chairman, Crockett Technologies Associates (technology consulting company)
Formerly: Director, Captaris (unified messaging provider); Director, President and Chief Executive Officer, COMSAT Corporation; Chairman, Board of Governors of INTELSAT (international communications company); ACE Limited (insurance company); Independent Directors Council and Investment Company Institute | 144 | ALPS (Attorneys Liability Protection Society) (insurance company) and Globe Specialty Metals, Inc. (metallurgical company) | ||||
David C. Arch — 1945 Trustee | 2010 | Chairman of Blistex Inc., a consumer health care products manufacturer | 144 | Board member of the Illinois Manufacturers’ Association; Member of the Board of Visitors, Institute for the Humanities, University of Michigan; Member of the Audit Committee of the Edward-Elmhurst Hospital | ||||
James T. Bunch — 1942 Trustee | 2000 | Managing Member, Grumman Hill Group LLC (family office/private equity investments)
Formerly: Founder, Green Manning & Bunch Ltd. (investment banking firm) (1988-2010); Executive Committee, United States Golf Association; and Chairman, Board of Governors, Western Golf Association | 144 | Chairman of the Board of Trustees, Evans Scholars Foundation; and Chairman of the Board, Denver Film Society | ||||
Rodney F. Dammeyer — 1940 Trustee | 2010 | Chairman of CAC, LLC, (private company offering capital investment and management advisory services)
Formerly: Prior to 2001, Managing Partner at Equity Group Corporate Investments; Prior to 1995, Chief Executive Officer of Itel Corporation (formerly Anixter International); Prior to 1985, experience includes Senior Vice President and Chief Financial Officer of Household International, Inc., Executive Vice President and Chief Financial Officer of Northwest Industries, Inc. and Partner of Arthur Andersen & Co.; From 1987 to 2010, Director/Trustee of investment companies in the Van Kampen Funds complex | 144 | Director of Quidel Corporation and Stericycle, Inc. | ||||
Albert R. Dowden — 1941 Trustee | 2003 | Director of a number of public and private business corporations, including the Boss Group, Ltd. (private investment and management); Nature’s Sunshine Products, Inc. and Reich & Tang Funds (5 portfolios) (registered investment company)
Formerly: Director, Homeowners of America Holding Corporation/Homeowners of America Insurance Company (property casualty company); Director, Continental Energy Services, LLC (oil and gas pipeline service); Director, CompuDyne Corporation (provider of product and services to the public security market) and Director, Annuity and Life Re (Holdings), Ltd. (reinsurance company); Director, President and Chief Executive Officer, Volvo Group North America, Inc.; Senior Vice President, AB Volvo; Director of various public and private corporations; Chairman, DHJ Media, Inc.; Director, Magellan Insurance Company; and Director, The Hertz Corporation, Genmar Corporation (boat manufacturer), National Media Corporation; Advisory Board of Rotary Power International (designer, manufacturer, and seller of rotary power engines); and Chairman, Cortland Trust, Inc. (registered investment company) | 144 | Director of: Nature’s Sunshine Products, Inc., Reich & Tang Funds, Homeowners of America Holding Corporation/ Homeowners of America Insurance Company, the Boss Group | ||||
Jack M. Fields — 1952 Trustee | 2003 | Chief Executive Officer, Twenty First Century Group, Inc. (government affairs company); Owner and Chief Executive Officer, Dos Angeles Ranch, L.P. (cattle, hunting, corporate entertainment); and Discovery Global Education Fund (non-profit)
Formerly: Chief Executive Officer, Texana Timber LP (sustainable forestry company); Director of Cross Timbers Quail Research Ranch (non-profit); and member of the U.S. House of Representatives | 144 | Insperity, Inc. (formerly known as Administaff) | ||||
Prema Mathai-Davis — 1950 Trustee | 2003 | Retired. Formerly: Chief Executive Officer, YWCA of the U.S.A. | 144 | None | ||||
Larry Soll — 1942 Trustee | 1997 | Retired. Formerly: Chairman, Chief Executive Officer and President, Synergen Corp. (a biotechnology company) | 144 | None | ||||
Hugo F. Sonnenschein — 1940 Trustee | 2010 | President Emeritus and Honorary Trustee of the University of Chicago and the Adam Smith Distinguished Service Professor in the Department of Economics at the University of Chicago. Prior to 2000, President of the University of Chicago | 144 | Trustee of the University of Rochester and a member of its investment committee; Member of the National Academy of Sciences and the American Philosophical Society; Fellow of the American Academy of Arts and Sciences | ||||
| Raymond Stickel, Jr. — 1944 Trustee | 2005 | Retired. Formerly: Director, Mainstay VP Series Funds, Inc. (25 portfolios) and Partner, Deloitte & Touche | 144 | None |
T-2 Invesco American Franchise Fund
Trustees and Officers—(continued)
| Name, Year of Birth and Position(s) Held with the Trust | Trustee and/ or Officer Since | Principal Occupation(s) During Past 5 Years | Number of Funds in Fund Complex Overseen by Trustee | Other Directorship(s) Held by Trustee During Past 5 Years | ||||
| Independent Trustees—(continued) | ||||||||
Suzanne H. Woolsey — 1941 Trustee | 2014 | Chief Executive Officer of Woolsey Partners LLC | 144 | Emeritus Chair of the Board of Trustees of the Institute for Defense Analyses; Trustee of Colorado College; Trustee of California Institute of Technology; Prior to 2014, Director of Fluor Corp.; Prior to 2010, Trustee of the German Marshall Fund of the United States; Prior to 2010 Trustee of the Rocky Mountain Institute | ||||
| Other Officers | ||||||||
Russell C. Burk — 1958 Senior Vice President and Senior Officer | 2005 | Senior Vice President and Senior Officer, The Invesco Funds | N/A | N/A | ||||
John M. Zerr — 1962 Senior Vice President, Chief Legal Officer and Secretary | 2006 | Director, Senior Vice President, Secretary and General Counsel, Invesco Management Group, Inc. (formerly known as Invesco Aim Management Group, Inc.) and Van Kampen Exchange Corp.; Senior Vice President, Invesco Advisers, Inc. (formerly known as Invesco Institutional (N.A.), Inc.) (registered investment adviser); Senior Vice President and Secretary, Invesco Distributors, Inc. (formerly known as Invesco Aim Distributors, Inc.); Director, Vice President and Secretary, Invesco Investment Services, Inc. (formerly known as Invesco Aim Investment Services, Inc.) and IVZ Distributors, Inc. (formerly known as INVESCO Distributors, Inc.); Director and Vice President, INVESCO Funds Group, Inc.; Senior Vice President, Chief Legal Officer and Secretary, The Invesco Funds; Managing Director, Invesco PowerShares Capital Management LLC; Director, Secretary and General Counsel, Invesco Investment Advisers LLC (formerly known as Van Kampen Asset Management); Secretary and General Counsel, Invesco Capital Markets, Inc. (formerly known as Van Kampen Funds Inc.) and Chief Legal Officer, PowerShares Exchange-Traded Fund Trust, PowerShares Exchange-Traded Fund Trust II, PowerShares India Exchange-Traded Fund Trust, PowerShares Actively Managed Exchange-Traded Fund Trust, and PowerShares Actively Managed Exchange-Traded Commodity Fund Trust
Formerly: Director and Vice President, Van Kampen Advisors Inc.; Director, Vice President, Secretary and General Counsel, Van Kampen Investor Services Inc.; Director, Invesco Distributors, Inc. (formerly known as Invesco Aim Distributors, Inc.); Director, Senior Vice President, General Counsel and Secretary, Invesco Aim Advisers, Inc. and Van Kampen Investments Inc.; Director, Vice President and Secretary, Fund Management Company; Director, Senior Vice President, Secretary, General Counsel and Vice President, Invesco Aim Capital Management, Inc.; Chief Operating Officer and General Counsel, Liberty Ridge Capital, Inc. (an investment adviser); Vice President and Secretary, PBHG Funds (an investment company) and PBHG Insurance Series Fund (an investment company); Chief Operating Officer, General Counsel and Secretary, Old Mutual Investment Partners (a broker-dealer); General Counsel and Secretary, Old Mutual Fund Services (an administrator) and Old Mutual Shareholder Services (a shareholder servicing center); Executive Vice President, General Counsel and Secretary, Old Mutual Capital, Inc. (an investment adviser); and Vice President and Secretary, Old Mutual Advisors Funds (an investment company) | N/A | N/A | ||||
| Sheri Morris — 1964 Vice President, Treasurer and Principal Financial Officer | 2003 | Vice President, Treasurer and Principal Financial Officer, The Invesco Funds; Vice President, Invesco Advisers, Inc. (formerly known as Invesco Institutional (N.A.), Inc.) (registered investment adviser); and Vice President, PowerShares Exchange-Traded Fund Trust, PowerShares Exchange-Traded Fund Trust II, PowerShares India Exchange-Traded Fund Trust, PowerShares Actively Managed Exchange-Traded Fund Trust, and PowerShares Actively Managed Exchange-Traded Commodity Fund Trust
Formerly: Vice President, Invesco Aim Advisers, Inc., Invesco Aim Capital Management, Inc. and Invesco Aim Private Asset Management, Inc.; Assistant Vice President and Assistant Treasurer, The Invesco Funds and Assistant Vice President, Invesco Advisers, Inc., Invesco Aim Capital Management, Inc. and Invesco Aim Private Asset Management, Inc.; and Treasurer, PowerShares Exchange-Traded Fund Trust, PowerShares Exchange-Traded Fund Trust II, PowerShares India Exchange-Traded Fund Trust and PowerShares Actively Managed Exchange-Traded Fund Trust | N/A | N/A | ||||
T-3 Invesco American Franchise Fund
Trustees and Officers—(continued)
| Name, Year of Birth and Position(s) Held with the Trust | Trustee and/ or Officer Since | Principal Occupation(s) During Past 5 Years | Number of Funds in Fund Complex Overseen by Trustee | Other Directorship(s) Held by Trustee During Past 5 Years | ||||
| Other Officers—(continued) | ||||||||
| Karen Dunn Kelley — 1960 Vice President | 2003 | Senior Managing Director, Investments, Invesco Ltd.; Director, Co-President, Co-Chief Executive Officer, and Co-Chairman, Invesco Advisers, Inc. (formerly known as Invesco Institutional (N.A.), Inc.) (registered investment adviser); Chairman, Invesco Senior Secured Management, Inc.; Senior Vice President, Invesco Management Group, Inc. (formerly known as Invesco Aim Management Group, Inc.); Executive Vice President, Invesco Distributors, Inc. (formerly known as Invesco Aim Distributors, Inc.); Director, Invesco Mortgage Capital Inc. and Invesco Management Company Limited; Vice President, The Invesco Funds (other than AIM Treasurer’s Series Trust (Invesco Treasurer’s Series Trust), Short-Term Investments Trust and Invesco Management Trust); and President and Principal Executive Officer, The Invesco Funds (AIM Treasurer’s Series Trust (Invesco Treasurer’s Series Trust), Short-Term Investments Trust and Invesco Management Trust only)
Formerly: Director and President, INVESCO Asset Management (Bermuda) Ltd., Director, INVESCO Global Asset Management Limited and INVESCO Management S.A.; Senior Vice President, Van Kampen Investments Inc. and Invesco Advisers, Inc. (formerly known as Invesco Institutional (N.A.), Inc.) (registered investment adviser); Vice President, Invesco Advisers, Inc. (formerly known as Invesco Institutional (N.A.), Inc.); Director of Cash Management and Senior Vice President, Invesco Advisers, Inc. and Invesco Aim Capital Management, Inc.; Director and President, Fund Management Company; Chief Cash Management Officer, Director of Cash Management, Senior Vice President, and Managing Director, Invesco Aim Capital Management, Inc.; Director of Cash Management, Senior Vice President, and Vice President, Invesco Advisers, Inc. and The Invesco Funds (AIM Treasurer’s Series Trust (Invesco Treasurer’s Series Trust), and Short-Term Investments Trust only) | N/A | N/A | ||||
| Crissie M. Wisdom — 1969 Anti-Money Laundering Compliance Officer | 2013 | Anti-Money Laundering Compliance Officer, Invesco Advisers, Inc. (formerly known as Invesco Institutional (N.A.), Inc.) (registered investment adviser), Invesco Capital Markets, Inc. (formerly known as Van Kampen Funds Inc.), Invesco Distributors, Inc., Invesco Investment Services, Inc., Invesco Management Group, Inc., Van Kampen Exchange Corp., The Invesco Funds, and PowerShares Exchange-Traded Fund Trust, PowerShares Exchange-Traded Fund Trust II, PowerShares India Exchange-Traded Fund Trust, PowerShares Actively Managed Exchange-Traded Fund Trust and PowerShares Actively Managed Exchange-Traded Commodity Fund Trust; Anti-Money Laundering Compliance Officer and Bank Secrecy Act Officer, INVESCO National Trust Company and Invesco Trust Company; and Fraud Prevention Manager and Controls and Risk Analysis Manager for Invesco Investment Services, Inc.. | N/A | N/A | ||||
Lisa O. Brinkley — 1959 Chief Compliance Officer | 2004 | Senior Vice President and Chief Compliance Officer, Invesco Advisers, Inc. (registered investment adviser) (formerly known as Invesco Institutional (N.A., Inc.); and Chief Compliance Officer, The Invesco Funds
Formerly: Global Assurance Officer, Invesco Ltd. and Vice President, The Invesco Funds; Chief Compliance Officer, Invesco Distributors, Inc. (formerly known as Invesco Aim Distributors, Inc.), Invesco Investment Services, Inc.(formerly known as Invesco Aim Investment Services, Inc.) and Van Kampen Investor Services Inc.; Senior Vice President, Invesco Management Group, Inc.; Senior Vice President and Chief Compliance Officer, Invesco Advisers, Inc. and The Invesco Funds; Vice President and Chief Compliance Officer, Invesco Aim Capital Management, Inc. and Invesco Distributors, Inc.; Vice President, Invesco Investment Services, Inc. and Fund Management Company. | N/A | N/A |
The Statement of Additional Information of the Trust includes additional information about the Fund’s Trustees and is available upon request, without charge, by calling 1.800.959.4246. Please refer to the Fund’s prospectus for information on the Fund’s sub-advisers.
Office of the Fund 11 Greenway Plaza, Suite 1000 Houston, TX 77046-1173 | Investment Adviser Invesco Advisers, Inc. 1555 Peachtree Street, N.E. Atlanta, GA 30309 | Distributor Invesco Distributors, Inc. 11 Greenway Plaza, Suite 1000 Houston, TX 77046-1173 | Auditors PricewaterhouseCoopers LLP 1000 Louisiana Street, Suite 5800 Houston, TX 77002-5678 | |||
Counsel to the Fund Stradley Ronon Stevens & Young, LLP 2005 Market Street, Suite 2600 Philadelphia, PA 19103-7018 | Counsel to the Independent Trustees Goodwin Procter LLP 901 New York Avenue, N.W. Washington, D.C. 20001 | Transfer Agent Invesco Investment Services, Inc. 11 Greenway Plaza, Suite 1000 Houston, TX 77046-1173 | Custodian State Street Bank and Trust Company 225 Franklin Street Boston, MA 02110-2801 | |||
T-4 Invesco American Franchise Fund

Invesco mailing information
Send general correspondence to Invesco Investment Services, Inc., P.O. Box 219078, Kansas City, MO 64121-9078.
Important notice regarding delivery of security holder documents
To reduce Fund expenses, only one copy of most shareholder documents may be mailed to shareholders with multiple accounts at the same address (Householding). Mailing of your shareholder documents may be householded indefinitely unless you instruct us otherwise. If you do not want the mailing of these documents to be combined with those for other members of your household, please contact Invesco Investment Services, Inc. at 800 959 4246 or contact your financial institution. We will begin sending you individual copies for each account within 30 days after receiving your request.
Fund holdings and proxy voting information
The Fund provides a complete list of its holdings four times in each fiscal year, at the quarter ends. For the second and fourth quarters, the lists appear in the Fund’s semiannual and annual reports to shareholders. For the first and third quarters, the Fund files the lists with the Securities and Exchange Commission (SEC) on Form N-Q. The most recent list of portfolio holdings is available at invesco.com/completeqtrholdings. Shareholders can also look up the Fund’s Forms N-Q on the SEC website at sec.gov. Copies of the Fund’s Forms N-Q may be reviewed and copied at the SEC Public Reference Room in Washington, D.C. You can obtain information on the operation of the Public Reference Room, including information about duplicating fee charges, by calling 202 551 8090 or 800 732 0330, or by electronic request at the following email address: publicinfo@sec.gov. The SEC file numbers for the Fund are shown below.
A description of the policies and procedures that the Fund uses to determine how to vote proxies relating to portfolio securities is available without charge, upon request, from our Client Services department at 800 959 4246 or at invesco.com/proxyguidelines. The information is also available on the SEC website, sec.gov.
Information regarding how the Fund voted proxies related to its portfolio securities during the most recent 12-month period ended June 30 is available at invesco.com/proxysearch. The information is also available on the SEC website, sec.gov. Invesco Advisers, Inc. is an investment adviser; it provides investment advisory services to individual and institutional clients and does not sell securities. Invesco Distributors, Inc. is the US distributor for Invesco Ltd.’s retail mutual funds, exchange-traded funds and institutional money market funds. Both are wholly owned, indirect subsidiaries of Invesco Ltd. |
|

SEC file numbers: 811-09913 and 333-36074 VK-AMFR-AR-1 Invesco Distributors, Inc.
| Annual Report to Shareholders
| August 31, 2015 | ||
Invesco California Tax-Free Income Fund | ||||
Nasdaq: A: CLFAX ¡ B: CLFBX ¡ C: CLFCX ¡ Y: CLFDX | ||||


Letters to Shareholders
Philip Taylor | Dear Shareholders: This annual report includes information about your Fund, including performance data and a complete list of its investments as of the close of the reporting period. Inside is a discussion of how your Fund was managed and the factors that affected its performance during the reporting period. I hope you find this report of interest. The US economy expanded and unemployment declined throughout the reporting period. The sharp drop in oil prices that began in mid-2014 continued to benefit consumers, but a strong US dollar crimped corporate profits. The US Federal Reserve signaled that it was increasingly likely to raise interest rates, based on generally positive economic data, but uncertainty remained about when it would act. Overseas, the story was much different. Low energy prices hurt the economies of some oil-producing nations, such as Brazil and Russia. During the reporting period, | |
the European Central Bank as well as central banks in China and Japan – among other countries – either instituted or maintained extraordinarily accommodative monetary policies in response to economic weakness. Investor uncertainty, such as we saw for much of the reporting period – and market volatility, such as we saw at the end of the reporting period – are unfortunate facts of life when it comes to investing. Some investors use these things as excuses to delay saving and investing for their long-term financial goals. That’s why Invesco encourages investors to work with a professional financial adviser who can stress the importance of starting to save and invest early and the importance of adhering to a disciplined investment plan – when times are good and when they’re uncertain. A financial adviser who knows your unique financial situation, investment goals and risk tolerance can be an invaluable partner as you seek to achieve your financial goals. He or she can offer a long-term perspective when markets are volatile and time-tested advice and guidance when your financial situation or investment goals change. | ||

Timely information when and where you want it
Invesco’s efforts to help investors achieve their financial objectives include providing individual investors and financial professionals with timely information about the markets, the economy and investing – whenever and wherever they want it.
Our website, invesco.com/us, offers a wide range of market insights and investment perspectives. On the website, you’ll find detailed information about our funds, including prices, performance, holdings and portfolio manager commentaries. You can access information about your account by completing a simple, secure online registration. Click on the “Need to register” link in the “Account Access” box on our homepage to get started.
Invesco’s mobile apps for iPhone® and iPad® (both available free from the App StoreSM) allow you to obtain the same detailed information, monitor your account and create customizable watch lists. Also, they allow you to access investment insights from our investment leaders, market strategists, economists and retirement experts. You can sign up to be alerted when new commentary is added, and you can watch portfolio manager videos and have instant access to Invesco news and updates wherever you may be.
In addition to the resources accessible on our website and through our mobile app, you can obtain timely updates to help you stay informed about the markets, the economy and investing by connecting with Invesco on Twitter, LinkedIn or Facebook. You can access our blog at blog.invesco.us.com. Our goal is to provide you the information you want, when and where you want it.
Have questions?
For questions about your account, feel free to contact an Invesco client services representative at 800 959 4246. For Invesco-related questions or comments, please email me directly at phil@invesco.com.
All of us at Invesco look forward to serving your investment management needs for many years to come. Thank you for investing with us.
Sincerely,

Philip Taylor
Senior Managing Director, Invesco Ltd.
iPhone and iPad are trademarks of Apple Inc., registered in the US and other countries. App Store is a service mark of Apple Inc. Invesco Distributors, Inc. is not affiliated with Apple Inc.
2 Invesco California Tax-Free Income Fund
Bruce Crockett | Dear Fellow Shareholders: Among the many important lessons I’ve learned in more than 40 years in a variety of business endeavors is the value of a trusted advocate. As independent chair of the Invesco Funds Board, I can assure you that the members of the Board are strong advocates for the interests of investors in Invesco’s mutual funds. We work hard to represent your interests through oversight of the quality of the investment management services your funds receive and other matters important to your investment, including but not limited to: n Ensuring that Invesco offers a diverse lineup of mutual funds that your financial adviser can use to strive to meet your financial needs as your investment goals change over time. n Monitoring how the portfolio management teams of the Invesco funds are performing in light of changing economic and market conditions. |

| n | Assessing each portfolio management team’s investment performance within the context of the investment strategy described in the fund’s prospectus. |
| n | Monitoring for potential conflicts of interests that may impact the nature of the services that your funds receive. |
We believe one of the most important services we provide our fund shareholders is the annual review of the funds’ advisory and sub-advisory contracts with Invesco Advisers and its affiliates. This review is required by the Investment Company Act of 1940 and focuses on the nature and quality of the services Invesco provides as the adviser to the Invesco funds and the reasonableness of the fees that it charges for those services. Each year, we spend months carefully reviewing information received from Invesco and a variety of independent sources, such as performance and fee data prepared by Lipper Inc., an independent, third-party firm widely recognized as a leader in its field. We also meet with our independent legal counsel and other independent advisers to review and help us assess the information that we have received. Our goal is to assure that you receive quality investment management services for a reasonable fee.
I trust the measures outlined above provide assurance that you have a worthy advocate when it comes to choosing the Invesco Funds.
As always, please contact me at bruce@brucecrockett.com with any questions or concerns you may have. On behalf of the Board, we look forward to continuing to represent your interests and serving your needs.
Sincerely,

Bruce L. Crockett
Independent Chair
Invesco Funds Board of Trustees
3 Invesco California Tax-Free Income Fund
Management’s Discussion of Fund Performance
Performance summary For the fiscal year ended August 31, 2015, Class A shares of Invesco California Tax-Free Income Fund (the Fund), at net asset value (NAV), posted a positive return. At NAV, the Fund outperformed the S&P Municipal Bond Index, its broad market benchmark, and the S&P Municipal Bond California 5+ Year Investment Grade Index, its style-specific benchmark. Your Fund’s long-term performance appears later in this report.
Fund vs. Indexes Total returns, 8/31/14 to 8/31/15, at net asset value (NAV). Performance shown does not include applicable contingent deferred sales charges (CDSC) or front-end sales charges, which would have reduced performance. |
| Class A Shares | 3.48 | % | ||||||
| Class B Shares | 3.51 | |||||||
| Class C Shares | 2.87 | |||||||
| Class Y Shares | 3.65 | |||||||
| S&P Municipal Bond Indexq (Broad Market Index) | 2.38 | |||||||
S&P Municipal Bond California 5+ Year Investment Grade Indexq (Style-Specific Index)* | 3.41 | |||||||
| Barclays California Municipal Indexq (Former Style-Specific Index) * | 2.77 | |||||||
| Lipper California Municipal Debt Funds Indexn (Peer Group Index) | 3.42 | |||||||
Source(s): qFactSet Research Systems Inc.; nLipper Inc. *The Fund has elected to use the S&P Municipal Bond California 5+ Year Investment Grade Index rather than the Barclays California Municipal Index as its style-specific index because the S&P Municipal Bond California 5+ Year Investment Grade Index more closely represents the performance of the types of securities in which the Fund invests.
|
| |||||||
Market conditions and your Fund
During the reporting period, California’s fiscal situation continued to improve, buoyed by economic growth, a declining unemployment rate and an improving housing market. The state benefits from a large, diverse economy, high wealth levels and a moderate debt burden. The population of California, the nation’s most populous state, grew by an estimated 4.2% between 2010 and 2014.1 California’s economy is the nation’s largest, its per capita income and median household income remain strong, and the unemployment rate of 6.2% in July 2015 was a dramatic improvement from a peak of 12.2% in October 2010.2 In July 2015, Standard & Poor’s upgraded California’s general obligation bond rating to AA- from A+ with a stable outlook while
Moody’s maintained a rating of A1 with a stable outlook.3
California’s financial performance has been volatile relative to most states with revenues sensitive to both gross domestic product and stock market performance. This stems from a high percentage of California’s total personal income taxes coming from a relatively small number of high-income citizens, which can make the state’s tax collections vary widely. Passage of temporary tax increases in 2012 improved the state’s financial standing, but it also increased the sensitivity of tax revenues to the economic cycle. Recently, California voters approved a constitutional amendment that created a rainy day fund, which the state will be able to tap if specific spending criteria are met, or in the event of a natural disaster. Going forward, the creation of a rainy day
| Portfolio Composition | ||||
| By credit sector, based on total investments | ||||
Revenue Bonds | 75.2 | % | ||
General Obligation Bonds | 15.4 | |||
Pre-Refunded Bonds | 9.4 | |||
Total Net Assets | $ | 368.1 million | ||
Total Number of Holdings | 218 | |||
The Fund’s holdings are subject to change, and there is no assurance that the Fund will continue to hold any particular security.
Top Five Debt Holdings | ||||
| 1. Long Beach (City of) Financing Authority; Series 1992 | 2.7% | |||
2. Southern California Metropolitan Water District; Series 2009 B | 2.6 | |||
3. California State University; Series 2012 A | 2.1 | |||
4. Bay Area Toll Authority (San Francisco Bay Area); Series 2009 F-1 | 1.6 | |||
5. California (State of); Series 2009 | 1.6 | |||
fund may provide the state with greater flexibility during periods of economic weakness. California’s constitution establishes a high priority for the repayment of the state’s general obligation bonds; this priority of payments may provide general obligation bondholders some reassurance during periods of weak economic and revenue growth.
Throughout the reporting period, fundamentals for municipal debt issuers improved modestly. Overall, state finances continued to improve, albeit at a modest pace, and spending proposals for fiscal 2016 remained cautious. While new spending is expected to be limited, state budgets in 42 states call for higher general fund levels in fiscal 2016 than fiscal 2015. Mid-year fiscal 2015 budget cuts were minimal, although higher than the previous year’s level. Mid-year budget cuts typically address state budget gaps that occur during the fiscal year, as previously appropriated spending must be reduced. These mid-year budget cuts have subsided compared to the post-recession years when states were forced to make substantial spending cuts and take other actions to balance their budgets.
During the reporting period, investment grade municipal bonds, as measured by the S&P Municipal Bond Index, returned 2.38%.4 California municipal bonds, as measured by the S&P Municipal Bond California Index, returned 3.14%.4 These modest gains occurred despite investor anxiety over the potential for rising interest rates, uncertainty related to the Greek debt crisis and heightened concern about potential defaults by Chicago and Puerto Rico. Expectations that the US Federal Reserve (the Fed) would raise interest rates drove volatility in the US Treasury market, with the municipal market following suit. A spike in refundings seen in the municipal market in 2015 also contributed to volatility as it boosted issuance, leading to an imbalance between supply and demand.
The Greek debt crisis and expectations that the Fed was close to raising interest rates resulted in large upward moves in US Treasury rates during the reporting period. In June, Fed Chair Janet Yellen indicated that while the short-term federal funds target rate is still on track to rise by year-end, rates will remain low for the long term, and increases will be made at a measured pace. If the Fed raises interest rates before the end of calendar year 2015, it will be the first increase in the federal funds target rate since the 2004-
4 Invesco California Tax-Free Income Fund
2006 cycle, when the target rate was raised by 0.25% 17 times over 24 months, from 1.00% to 5.25%.5
Fundamentally, the municipal bond market continued to see credit appreciation as tax collections continued to be strong and the housing market remained firm through the end of the reporting period. Revenue bonds continued to improve as the economy grew only modestly.
During the reporting period, the municipal market was characterized by low supply and strong demand. Historically low interest rates continued to make refundings attractive to issuers, while new bond issuance remained low as of the end of the reporting period. Municipal bond mutual fund flows turned negative in May, primarily due to investor reaction to the increase in interest rates and negative returns in April.
Over the reporting period, security selection in longer-maturity bonds benefited the Fund’s performance versus its style-specific benchmark. An overweight allocation to short-maturity (0-2 years) bonds slightly offset these gains. Security selection in bonds with coupons of 5.0% to 5.5% aided relative Fund performance, as did holdings in the hospital sector, the sector to which the Fund had its largest allocation. Security selection in the appropriation and pre-refunded/escrowed-to-maturity sectors detracted from relative Fund performance.
During the reporting period, leverage contributed to Fund performance. The Fund achieved a leveraged position through the use of inverse floating rate securities. The Fund uses leverage because we believe that, over time, leveraging provides opportunities for additional income and total return for shareholders. However, the use of leverage also can expose shareholders to additional volatility. For more information about the Fund’s use of leverage, see the Notes to Financial Statements later in this report.
We wish to remind you that the Fund is subject to interest rate risk, meaning when interest rates rise, the value of fixed income securities tends to fall. This risk may be greater in the current market environment because interest rates are at or near historic lows. The degree to which the value of fixed income securities may decline due to rising interest rates may vary depending on the speed and magnitude of the increase in interest rates, as well as individual security characteristics such as price, maturity, duration and coupon and market forces such as supply and demand for similar securities. We are monitoring interest rates,
and the market, economic and geopolitical factors that may impact the direction, speed and magnitude of changes to interest rates across the maturity spectrum, including the potential impact of monetary policy changes by the Fed and certain foreign central banks. If interest rates rise, markets may experience increased volatility, which may affect the value and/ or liquidity of certain of the Fund’s investments.
Thank you for investing in Invesco California Tax-Free Income Fund and for sharing our long-term investment horizon.
| 1 | Source: US Census Bureau |
| 2 | Source: Bureau of Labor Statistics |
| 3 | Sources: Standard & Poor’s, Moody’s. A credit rating is an assessment provided by a nationally recognized statistical rating organization (NRSRO) of the creditworthiness of an issuer with respect to debt obligations, including specific securities, money market instruments or other debts. Ratings are measured on a scale that generally ranges from AAA (highest) to D (lowest); ratings are subject to change without notice. If securities are rated differently by the rating agencies, the higher rating is applied. For more information on the rating methodology, please visit www.standardandpoors.com and select “Understanding Ratings” under Rating Resources on the homepage, and www.moodys.com and select “Rating Methodologies” under Research and Ratings on the homepage. |
| 4 | Source: S&P Dow Jones |
| 5 | Source: Federal Reserve Bank of New York |
The views and opinions expressed in management’s discussion of Fund performance are those of Invesco Advisers, Inc. These views and opinions are subject to change at any time based on factors such as market and economic conditions. These views and opinions may not be relied upon as investment advice or recommendations, or as an offer for a particular security. The information is not a complete analysis of every aspect of any market, country, industry, security or the Fund. Statements of fact are from sources considered reliable, but Invesco Advisers, Inc. makes no representation or warranty as to their completeness or accuracy. Although historical performance is no guarantee of future results, these insights may help you understand our investment management philosophy.
See important Fund and, if applicable, index disclosures later in this report.
 | William Black Chartered Financial Analyst, Portfolio Manager, is manager of Invesco California Tax-Free Income Fund. He joined | |
| Invesco in 2010. Mr. Black earned a BS in engineering and public policy from Washington University in St. Louis and an MBA from Kellogg School of Management, Northwestern University. | ||
 | Mark Paris Portfolio Manager, is manager of Invesco California Tax-Free Income Fund. He joined Invesco in 2010. Mr. Paris earned | |
| a BBA in finance from Baruch College, The City University of New York. | ||
 | James Phillips Portfolio Manager, is manager of Invesco California Tax-Free Income Fund. He joined Invesco in 2010. Mr. Phillips | |
| earned a BA in American literature from Empire State College and an MBA in finance from University at Albany, The State University of New York. | ||
 | Robert Stryker Chartered Financial Analyst, Portfolio Manager, is manager of Invesco California Tax-Free Income Fund. He joined | |
| Invesco in 2010. Mr. Stryker earned a BS in finance from the University of Illinois at Chicago. | ||
 | Julius Williams Portfolio Manager, is manager of Invesco California Tax-Free Income Fund. He joined Invesco in 2010. Mr. Williams | |
| earned a BA in economics and sociology and a Master of Education degree in educational psychology from the University of Virginia. | ||
| 5 Invesco California Tax-Free Income Fund |
Your Fund’s Long-Term Performance
Results of a $10,000 Investment – Oldest Share Class(es)
Fund and index data from 8/31/05
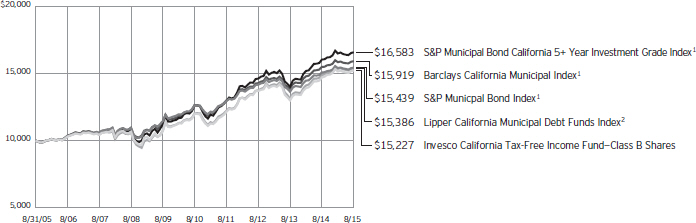
1 Source: FactSet Research Systems Inc.
2 Source: Lipper Inc.
Past performance cannot guarantee comparable future results.
During the reporting period, the Fund elected to use the S&P Municipal Bond California 5+ Year Investment Grade Index rather than the Barclays California Municipal Index as its style-specific index because the S&P Municipal Bond California 5+ Year Investment Grade Index more closely represents the performance of the types of securities in which the Fund invests. Because this is the first reporting
period since we adopted the new index, SEC guidelines require that we compare performance to both the old and new indexes.
The data shown in the chart include reinvested distributions, applicable sales charges and Fund expenses including management fees. Results for Class B shares are calculated as if a hypothetical shareholder had liquidated his entire investment in the Fund at the close of the reporting period and paid the contingent
deferred sales charges, if applicable. Index results include reinvested dividends, but they do not reflect sales charges. Performance of the peer group, if applicable, reflects fund expenses and management fees; performance of a market index does not. Performance shown in the chart and table(s) does not reflect deduction of taxes a shareholder would pay on Fund distributions or sale of Fund shares.
continued from page 9
| n | The Fund is not managed to track the performance of any particular index, including the index(es) described here, and consequently, the performance of the Fund may deviate significantly from the performance of the index(es). |
| n | A direct investment cannot be made in an index. Unless otherwise indicated, index results include reinvested dividends, and they do not reflect sales charges. Performance of the peer group, if applicable, reflects fund expenses; performance of a market index does not. |
Other information
| n | The returns shown in management’s discussion of Fund performance are based on net asset values (NAVs) calculated for shareholder transactions. Generally accepted accounting principles require adjustments to be made to the net assets of the Fund at period end for financial reporting purposes, and as such, the NAVs for shareholder transactions and the returns based on those NAVs may differ from the NAVs and returns reported in the Financial Highlights. |
6 Invesco California Tax-Free Income Fund
| Average Annual Total Returns | ||||
As of 8/31/15, including maximum applicable sales charges
|
| |||
Class A Shares | ||||
Inception (7/28/97) | 4.33 | % | ||
10 Years | 3.81 | |||
5 Years | 3.98 | |||
1 Year | -0.92 | |||
Class B Shares | ||||
Inception (7/11/84) | 6.21 | % | ||
10 Years | 4.29 | |||
5 Years | 4.60 | |||
1 Year | -1.47 | |||
Class C Shares | ||||
Inception (7/28/97) | 4.07 | % | ||
10 Years | 3.74 | |||
5 Years | 4.35 | |||
1 Year | 1.88 | |||
Class Y Shares | ||||
Inception (7/28/97) | 4.84 | % | ||
10 Years | 4.52 | |||
5 Years | 5.14 | |||
1 Year | 3.65 | |||
Effective June 1, 2010, Class A, Class B, Class C and Class I shares of the predecessor fund, Morgan Stanley California Tax-Free Income Fund, advised by Morgan Stanley Investment Advisors Inc. were reorganized into Class A, Class B, Class C and Class Y shares, respectively, of Invesco California Tax-Free Income Fund. Returns shown above for Class A, Class B, Class C and Class Y shares are blended returns of the predecessor fund and Invesco California Tax-Free Income Fund. Share class returns will differ from the predecessor fund because of different expenses.
The performance data quoted represent past performance and cannot guarantee comparable future results; current performance may be lower or higher. Please visit invesco.com/performance for the most recent month-end performance. Performance figures reflect reinvested distributions, changes in net asset value and the effect of the maximum sales charge unless otherwise stated. Investment return and principal value will fluctuate so that you may have a gain or loss when you sell shares.
The total annual Fund operating expense ratio set forth in the most recent Fund prospectus as of the date of this report for Class A, Class B,
| Average Annual Total Returns | ||||
| As of 6/30/15, the most recent calendar quarter end, including maximum applicable sales charges | ||||
Class A Shares | ||||
Inception (7/28/97) | 4.30 | % | ||
10 Years | 3.74 | |||
5 Years | 4.60 | |||
1 Year | -0.08 | |||
Class B Shares | ||||
Inception (7/11/84) | 6.21 | % | ||
10 Years | 4.23 | |||
5 Years | 5.24 | |||
1 Year | -0.68 | |||
Class C Shares | ||||
Inception (7/28/97) | 4.05 | % | ||
10 Years | 3.68 | |||
5 Years | 5.01 | |||
1 Year | 2.80 | |||
Class Y Shares | ||||
Inception (7/28/97) | 4.82 | % | ||
10 Years | 4.47 | |||
5 Years | 5.79 | |||
1 Year | 4.59 | |||
Class C and Class Y shares was 0.93%, 0.93%, 1.43% and 0.69%, respectively. The expense ratios presented above may vary from the expense ratios presented in other sections of this report that are based on expenses incurred during the period covered by this report.
Class A share performance reflects the maximum 4.25% sales charge, and Class B and Class C share performance reflects the applicable contingent deferred sales charge (CDSC) for the period involved. The CDSC on Class B shares declines from 5% beginning at the time of purchase to 0% at the beginning of the seventh year. The CDSC on Class C shares is 1% for the first year after purchase. Class Y shares do not have a front-end sales charge or a CDSC; therefore, performance is at net asset value.
The performance of the Fund’s share classes will differ primarily due to different sales charge structures and class expenses.
Fund performance reflects any applicable fee waivers and/or expense reimbursements. Had the adviser not waived fees and/or reimbursed expenses currently or in the past, returns would have been lower. See current prospectus for more information.
7 Invesco California Tax-Free Income Fund
Invesco California Tax-Free Income Fund’s investment objective is to provide a high level of current income exempt from federal and California income tax, consistent with the preservation of capital.
| n | Unless otherwise stated, information presented in this report is as of August 31, 2015, and is based on total net assets. |
| n | Unless otherwise noted, all data provided by Invesco. |
| n | To access your Fund’s reports/prospectus, visit invesco.com/fundreports. |
About share classes
| n | Class B shares may not be purchased for new or additional investments. Please see the prospectus for more information. |
| n | Class Y shares are available to only certain investors. Please see the prospectus for more information. |
Principal risks of investing in the Fund
| n | Alternative minimum tax risk. A portion of the Fund’s otherwise tax-exempt income may be taxable to those shareholders subject to the federal alternative minimum tax. |
| n | Bond insurance risk. Some of the municipal obligations in which the Fund invests will be covered by insurance at the time of issuance or at a later date. Such insurance guarantees that interest payments on a bond will be made on time and that principal will be repaid when the bond matures. Insured municipal obligations would generally be assigned a lower rating if the rating were based primarily on the credit quality of the issuer without regard to the insurance feature. If the claims-paying ability of the insurer were downgraded, the ratings on the municipal obligations it insures may also be downgraded. Insurance does not protect the Fund against losses caused by declines in a bond’s value due to a change in market conditions. |
| n | California and US territories municipal securities risk. The Fund is more susceptible to political, economic, regulatory or other factors affecting issuers of California municipal securities than a fund that does not limit its investments to such issuers. As with California municipal securities, events in any of the territories where the Fund is invested may affect the Fund’s investments and its performance. |
| n | Call risk. If interest rates fall, it is possible that issuers of debt securities with high interest rates will prepay or call |
their securities before their maturity dates. In this event, the proceeds from the called securities would likely be reinvested by the Fund in securities bearing the new, lower interest rates, resulting in a possible decline in the Fund’s income and distributions to shareholders. |
| n | Changing fixed income market conditions risk. The current low interest rate environment was created in part by the Federal Reserve Board (FRB) and certain foreign central banks keeping the federal funds and equivalent foreign rates at or near zero. There is a risk that interest rates will rise when the FRB and central banks raise these rates. This risk is heightened due to the completion of the FRB’s quantitative easing program and the “tapering” of other similar foreign central bank actions. This eventual increase in the federal funds and equivalent foreign rates may expose fixed income markets to heightened volatility and reduced liquidity for certain fixed income investments, particularly those with longer maturities. In addition, decreases in fixed income dealer market-making capacity may also potentially lead to heightened volatility and reduced liquidity in the fixed income markets. As a result, the value of the Fund’s investments and share price may decline. Changes in central bank policies could also result in higher than normal shareholder redemptions, which could potentially increase portfolio turnover and the Fund’s transaction costs. |
| n | Credit risk. The issuer of instruments in which the Fund invests may be unable to meet interest and/or principal payments, thereby causing its instruments to decrease in value and lowering the issuer’s credit rating. |
| n | Derivatives risk. The value of a derivative instrument depends largely on (and is derived from) the value of an underlying security, currency, commodity, interest rate, index or other asset (each referred to as an underlying asset). In addition to risks relating to the underlying assets, the use of derivatives |
This report must be accompanied or preceded by a currently effective Fund prospectus, which contains more complete information, including sales charges and expenses. Investors should read it carefully before investing.
NOT FDIC INSURED | MAY LOSE VALUE | NO BANK GUARANTEE |
| may include other, possibly greater, risks, including counterparty, leverage and liquidity risks. Counterparty risk is the risk that the counterparty to the derivative contract will default on its obligation to pay the Fund the amount owed or otherwise perform under the derivative contract. Derivatives create leverage risk because they do not require payment up front equal to the economic exposure created by owning the derivative. As a result, an adverse change in the value of the underlying asset could result in the Fund sustaining a loss that is substantially greater than the amount invested in the derivative, which may make the Fund’s returns more volatile and increase the risk of loss. Derivative instruments may also be less liquid than more traditional investments and the Fund may be unable to sell or close out its derivative positions at a desirable time or price. This risk may be more acute under adverse market conditions, during which the Fund may be most in need of liquidating its derivative positions. Derivatives may also be harder to value, less tax efficient and subject to changing government regulation that could impact the Fund’s ability to use certain derivatives or their cost. Also, derivatives used for hedging or to gain or limit exposure to a particular market segment may not provide the expected benefits, particularly during adverse market conditions. |
| n | High yield bond (junk bond) risk. Junk bonds involve a greater risk of default or price changes due to changes in the credit quality of the issuer. The values of junk bonds fluctuate more than those of high-quality bonds in response to company, political, regulatory or economic developments. Values of junk bonds can decline significantly over short periods of time. |
| n | Income risk. The income you receive from the Fund is based primarily on prevailing interest rates, which can vary widely over the short- and long-term. If interest rates drop, your income from the Fund may drop as well. |
continued on page 9
8 Invesco California Tax-Free Income Fund
| n | Interest rate risk. Interest rate risk refers to the risk that bond prices generally fall as interest rates rise; conversely, bond prices generally rise as interest rates fall. Specific bonds differ in their sensitivity to changes in interest rates depending on their individual characteristics, including duration. |
| n | Inverse floating rate obligations risk. Inverse floating rate obligations, including tender option bonds, may be subject to greater price volatility than a fixed income security with similar qualities. When short-term interest rates rise, they may decrease in value and produce less or no income. Additionally, these securities may lose principal. Similar to derivatives, inverse floating rate obligations have the following risks: counterparty, leverage, correlation, liquidity, market, interest rate, and management risks. |
| n | Liquidity risk. The Fund may hold illiquid securities that it may be unable to sell at the preferred time or price and could lose its entire investment in such securities. |
| n | Management risk. The investment techniques and risk analysis used by the Fund’s portfolio managers may not produce the desired results. |
| n | Market risk. The prices of and the income generated by the Fund’s securities may decline in response to, among other things, investor sentiment, general economic and market conditions, regional or global instability, and currency and interest rate fluctuations. |
| n | Medium- and lower-grade municipal securities risk. Securities which are in the medium- and lower-grade categories generally offer higher yields than are offered by higher-grade securities of similar maturity, but they also generally involve more volatility and greater risks, such as greater credit risk, market risk, liquidity risk, management risk, and regulatory risk. Furthermore, many medium- and lower-grade securities are not listed for trading on any national securities exchange and many issuers of medium- and lower-grade securities choose not to have a rating assigned to their obligations by any nationally recognized statistical rating organization. As a result, the Fund’s portfolio may consist of a higher portion of unlisted or unrated securities as compared with an investment company that invests solely in higher-grade securities. Unrated securities are usually not as attractive to as many buyers as are rated securities, a factor which may make unrated securities less marketable. |
These factors may have the effect of limiting the availability of the securities for purchase by the Fund and may also limit the ability of the Fund to sell such securities at their fair value either to meet redemption requests or in response to changes in the economy or the financial markets. Investors should carefully consider the risks of owning shares of a Fund which invests in medium- and lower-grade municipal securities before investing in the Fund. |
| n | Municipal issuer focus risk. The Fund generally considers investments in municipal securities not to be subject to industry concentration policies (issuers of municipal securities as a group is not an industry) and the Fund may invest in municipal securities issued by entities having similar characteristics. The issuers may be located in the same geographic area or may pay their interest obligations from revenue of similar projects, such as hospitals, airports, utility systems and housing finance agencies. This may make the Fund’s investments more susceptible to similar social, economic, political or regulatory occurrences. As the similarity in issuers increases, the potential for fluctuation in the Fund’s net asset value also increases. |
| n | Municipal securities risk. The Fund may invest in municipal securities. Constitutional amendments, legislative enactments, executive orders, administrative regulations, voter initiatives, and the issuer’s regional economic conditions may affect the municipal security’s value, interest payments, repayment of principal and the Fund’s ability to sell it. Failure of a municipal security issuer to comply with applicable tax requirements may make income paid thereon taxable, resulting in a decline in the security’s value. In addition, there could be changes in applicable tax laws or tax treatments that reduce or eliminate the current federal income tax exemption on municipal securities or otherwise adversely affect the current federal or state tax status of municipal securities. |
| n | Reinvestment risk. Reinvestment risk is the risk that a bond’s cash flows (coupon income and principal repayment) will be reinvested at an interest rate below that on the original bond. |
| n | Variable-rate demand notes risk. The absence of an active secondary market for certain variable and floating rate notes could make it difficult to dispose of the instruments, and the Fund could suffer a loss if the issuer defaults during periods in which the Fund is not entitled to exercise its demand rights. |
| n | When-issued and delayed delivery risks. When-issued and delayed delivery transactions are subject to market risk as the value or yield of a security at delivery may be more or less than the purchase price or the yield generally available on securities when delivery occurs. In addition, the Fund is subject to counterparty risk because it relies on the buyer or seller, as the case may be, to consummate the transaction, and failure by the other party to complete the transaction may result in the Fund missing the opportunity of obtaining a price or yield considered to be advantageous. |
| n | Zero coupon or pay-in-kind securities risk. The value, interest rates, and liquidity of non-cash paying instruments, such as zero coupon and pay-in-kind securities, are subject to greater fluctuation than other types of securities. The higher yields and interest rates on pay-in-kind securities reflect the payment deferral and increased credit risk associated with such instruments and that such investments may represent a higher credit risk than coupon loans. Pay-in-kind securities may have a potential variability in valuations because their continuing accruals require continuing judgments about the collectability of the deferred payments and the value of any associated collateral. |
About indexes used in this report
| n | The S&P Municipal Bond Index is a broad, market value-weighted index that seeks to measure the performance of the US municipal bond market. |
| n | The S&P Municipal Bond California 5+ Year Investment Grade Index is a subset of the broad S&P Municipal Bond Index. This index of market value-weighted investment grade US municipal bonds seeks to measure the performance of California-issued US municipals whose maturities are greater than or equal to 5 years. |
| n | The Barclays California Municipal Index is an unmanaged index considered representative of California investment-grade municipal bonds. |
| n | The Lipper California Municipal Debt Funds Index is an unmanaged index considered representative of California municipal debt funds tracked by Lipper. |
| n | The S&P Municipal Bond California Index is a broad, market value-weighted index that seeks to measure the performance of bonds issued within California. |
continued on page 6
9 Invesco California Tax-Free Income Fund
Schedule of Investments
August 31, 2015
| Interest Rate | Maturity Date | Principal Amount (000) | Value | |||||||||||||
Municipal Obligations–106.59% |
| |||||||||||||||
| California–102.09% | ||||||||||||||||
ABAG Finance Authority For Nonprofit Corps. (Sharp HealthCare); Series 2014 A, RB | 5.00 | % | 08/01/43 | $ | 500 | $ | 554,370 | |||||||||
Alhambra (City of) (Atherton Baptist Homes); Series 2010 A, RB | 7.63 | % | 01/01/40 | 1,575 | 1,680,777 | |||||||||||
Alhambra Elementary School District (Election of 1999); Series 1999 A, Unlimited Tax CAB GO Bonds (INS–AGM)(a)(b) | 0.00 | % | 09/01/20 | 1,925 | 1,720,526 | |||||||||||
Anaheim (City of) Public Financing Authority (Anaheim Public Improvements); Series 1997 C, Sub. Lease RB (INS–AGM)(a) | 6.00 | % | 09/01/16 | 2,110 | 2,167,476 | |||||||||||
Anaheim (City of) Public Financing Authority (Electric System Distribution Facilities); | 5.38 | % | 10/01/36 | 2,500 | 2,919,500 | |||||||||||
Arcadia Unified School District (Election of 2006); Series 2007 A, Unlimited Tax GO Bonds | 5.00 | % | 08/01/37 | 1,500 | 1,580,295 | |||||||||||
Bakersfield (City of); Series 2007 A, Wastewater RB(c)(d) | 5.00 | % | 09/15/17 | 2,215 | 2,413,398 | |||||||||||
Bay Area Governments Association (California Capital); Series 2001 A, Lease RB (INS–AMBAC)(a) | 5.25 | % | 07/01/17 | 1,040 | 1,070,815 | |||||||||||
Bay Area Toll Authority (San Francisco Bay Area); | ||||||||||||||||
Series 2008 F-1, Toll Bridge RB(c)(d)(e) | 5.00 | % | 04/01/18 | 1,250 | 1,385,663 | |||||||||||
Series 2008 F-1, Toll Bridge RB(c)(d) | 5.00 | % | 04/01/18 | 2,500 | 2,771,325 | |||||||||||
Series 2009 F-1, Toll Bridge RB(c)(d)(e) | 5.13 | % | 04/01/19 | 1,500 | 1,720,395 | |||||||||||
Series 2009 F-1, Toll Bridge RB(c)(d)(e) | 5.25 | % | 04/01/19 | 4,685 | 5,393,981 | |||||||||||
Series 2009 F-1, Toll Bridge RB(c)(d)(e) | 5.25 | % | 04/01/19 | 5,205 | 5,992,673 | |||||||||||
Bay Area Water Supply & Conservation Agency; Series 2013 A, RB | 5.00 | % | 10/01/34 | 1,500 | 1,717,410 | |||||||||||
Beverly Hills Unified School District (Election of 2008); | ||||||||||||||||
Series 2009, Unlimited Tax CAB GO Bonds(b) | 0.00 | % | 08/01/26 | 1,465 | 1,071,706 | |||||||||||
Series 2009, Unlimited Tax CAB GO Bonds(b) | 0.00 | % | 08/01/32 | 3,045 | 1,691,650 | |||||||||||
Brea Olinda Unified School District; Series 2002 A, Ref. COP (INS–AGM)(a) | 5.50 | % | 08/01/18 | 1,090 | 1,094,850 | |||||||||||
California (State of) (Green Bonds); Series 2014, Various Purpose Unlimited Tax GO Bonds | 5.00 | % | 10/01/37 | 1,745 | 1,983,472 | |||||||||||
California (State of) Educational Facilities Authority (Claremont McKenna College); Series 2007, RB(e) | 5.00 | % | 01/01/38 | 2,100 | 2,262,351 | |||||||||||
California (State of) Educational Facilities Authority (Pitzer College); Series 2009, RB | 6.00 | % | 04/01/40 | 2,000 | 2,365,280 | |||||||||||
California (State of) Educational Facilities Authority (University of Southern California); Series 2009 B, RB(e) | 5.25 | % | 10/01/39 | 1,800 | 2,001,042 | |||||||||||
California (State of) Health Facilities Financing Authority (Adventist Health System West); Series 2009 A, RB | 5.75 | % | 09/01/39 | 500 | 569,875 | |||||||||||
California (State of) Health Facilities Financing Authority (Catholic Healthcare West); | ||||||||||||||||
Series 2009 A, RB | 6.00 | % | 07/01/39 | 500 | 571,640 | |||||||||||
Series 2011 A, RB | 5.25 | % | 03/01/41 | 2,500 | 2,746,675 | |||||||||||
California (State of) Health Facilities Financing Authority (Cedars-Sinai Medical Center); Series 2009, RB | 5.00 | % | 08/15/39 | 1,050 | 1,164,566 | |||||||||||
California (State of) Health Facilities Financing Authority (Children’s Hospital Los Angeles); Series 2010, RB (INS–AGM)(a) | 5.25 | % | 07/01/38 | 2,950 | 3,278,718 | |||||||||||
California (State of) Health Facilities Financing Authority (Kaiser Permanente); Series 2006 A, RB | 5.25 | % | 04/01/39 | 2,000 | 2,036,540 | |||||||||||
California (State of) Health Facilities Financing Authority (Providence Health & Services); | ||||||||||||||||
Series 2008, RB(c)(d) | 6.50 | % | 10/01/18 | 20 | 23,438 | |||||||||||
Series 2008, RB(c)(d) | 6.50 | % | 10/01/18 | 980 | 1,148,462 | |||||||||||
California (State of) Health Facilities Financing Authority (Scripps Health); Series 2010 A, RB | 5.00 | % | 11/15/36 | 4,000 | 4,491,920 | |||||||||||
California (State of) Health Facilities Financing Authority (St. Joseph Health System); Series 2013 A, RB | 5.00 | % | 07/01/37 | 1,000 | 1,118,660 | |||||||||||
California (State of) Health Facilities Financing Authority (Stanford Hospital); Series 2008 A-2, Ref. RB | 5.25 | % | 11/15/40 | 2,000 | 2,329,260 | |||||||||||
California (State of) Health Facilities Financing Authority (Sutter Health); Series 2011 B, RB | 5.50 | % | 08/15/26 | 1,000 | 1,164,330 | |||||||||||
California (State of) Municipal Finance Authority (American Heritage Education Foundation); Series 2006 A, Education RB | 5.25 | % | 06/01/26 | 1,000 | 1,008,050 | |||||||||||
California (State of) Municipal Finance Authority (Caritas Affordable Housing, Inc.); | ||||||||||||||||
Series 2012 A, Mobile Home Park RB | 5.50 | % | 08/15/47 | 1,500 | 1,649,325 | |||||||||||
Series 2014 A, Sr. Mobile Home Park RB | 5.25 | % | 08/15/39 | 1,200 | 1,303,476 | |||||||||||
See accompanying Notes to Financial Statements which are an integral part of the financial statements.
10 Invesco California Tax-Free Income Fund
| Interest Rate | Maturity Date | Principal Amount (000) | Value | |||||||||||||
| California–(continued) | ||||||||||||||||
California (State of) Municipal Finance Authority (Community Hospitals of Central California Obligated Group); | ||||||||||||||||
Series 2007, COP | 5.00 | % | 02/01/20 | $ | 2,385 | $ | 2,501,197 | |||||||||
Series 2007, COP | 5.25 | % | 02/01/37 | 500 | 517,240 | |||||||||||
California (State of) Municipal Finance Authority (Eisenhower Medical Center); | ||||||||||||||||
Series 2010 A, RB | 5.50 | % | 07/01/30 | 1,000 | 1,085,630 | |||||||||||
Series 2010 A, RB | 5.75 | % | 07/01/40 | 1,500 | 1,638,690 | |||||||||||
California (State of) Municipal Finance Authority (Emerson College); Series 2011, RB | 5.75 | % | 01/01/33 | 1,315 | 1,510,672 | |||||||||||
California (State of) Municipal Finance Authority (Touro College and University System); Series 2014 A, RB | 5.25 | % | 01/01/34 | 620 | 672,526 | |||||||||||
California (State of) Municipal Finance Authority (University of La Verne); Series 2010 A, RB | 6.13 | % | 06/01/30 | 1,000 | 1,146,280 | |||||||||||
California (State of) Pollution Control Finance Authority; Series 2012, Water Furnishing RB(f)(g) | 5.00 | % | 07/01/37 | 3,000 | 3,193,350 | |||||||||||
California (State of) Pollution Control Financing Authority (Waste Management Inc.); Series 2002 A, Ref. Solid Waste Disposal RB(f) | 5.00 | % | 01/01/22 | 2,000 | 2,066,340 | |||||||||||
California (State of) Public Works Board (Various Capital); Series 2011 A, Lease RB | 5.13 | % | 10/01/31 | 2,000 | 2,292,100 | |||||||||||
California (State of) Public Works Board (Various Correctional Facilities); Series 2014 A, Lease RB | 5.00 | % | 09/01/39 | 1,735 | 1,950,123 | |||||||||||
California (State of) Public Works Board (Various State Universities); Series 2013 H, Lease RB | 5.00 | % | 09/01/38 | 1,000 | 1,123,160 | |||||||||||
California (State of) School Finance Authority (Alliance for College-Ready Public Schools); Series 2013 A, School Facility RB | 6.30 | % | 07/01/43 | 840 | 949,267 | |||||||||||
California (State of) School Finance Authority (Alliance For College-Ready Public Schools); Series 2015, School Facility RB(g) | 5.00 | % | 07/01/45 | 615 | 629,840 | |||||||||||
California (State of) School Finance Authority (KIPP LA);Series 2015 A, Facilities RB | 5.00 | % | 07/01/45 | 500 | 525,340 | |||||||||||
California (State of) Statewide Communities Development Authority (Adventist Health System); | ||||||||||||||||
Series 2015, Ref. RB | 5.00 | % | 03/01/33 | 775 | 868,814 | |||||||||||
Series 2015, Ref. RB | 5.00 | % | 03/01/45 | 2,315 | 2,550,528 | |||||||||||
California (State of) Statewide Communities Development Authority (Alliance for College-Ready Public Schools); Series 2012, School Facility RB | 6.10 | % | 07/01/32 | 820 | 887,035 | |||||||||||
California (State of) Statewide Communities Development Authority (American Baptist Homes of the West); Series 2010, RB | 6.25 | % | 10/01/39 | 2,000 | 2,205,520 | |||||||||||
California (State of) Statewide Communities Development Authority (California Baptist University); | ||||||||||||||||
Series 2007 A, RB | 5.40 | % | 11/01/27 | 1,785 | 1,848,457 | |||||||||||
Series 2014 A, RB | 5.13 | % | 11/01/23 | 715 | 757,492 | |||||||||||
California (State of) Statewide Communities Development Authority (Cottage Health System Obligated Group); Series 2010, RB | 5.25 | % | 11/01/30 | 1,675 | 1,896,033 | |||||||||||
California (State of) Statewide Communities Development Authority (Henry Mayo Newhall Memorial Hospital); Series 2014 A, RB (INS–AGM)(a) | 5.25 | % | 10/01/43 | 600 | 669,948 | |||||||||||
California (State of) Statewide Communities Development Authority (Huntington Memorial Hospital); Series 2014 B, Ref. RB | 5.00 | % | 07/01/44 | 750 | 827,918 | |||||||||||
California (State of) Statewide Communities Development Authority (Loma Linda University Medical Center); Series 2014, RB | 5.50 | % | 12/01/54 | 1,500 | 1,585,035 | |||||||||||
California (State of) Statewide Communities Development Authority (Methodist Hospital); Series 2009, RB (CEP–FHA) | 6.75 | % | 02/01/38 | 445 | 525,563 | |||||||||||
California (State of) Statewide Communities Development Authority (Southern California Presbyterian Homes); | ||||||||||||||||
Series 2009, Senior Living RB(g) | 6.25 | % | 11/15/19 | 2,000 | 2,185,000 | |||||||||||
Series 2009, Senior Living RB(g) | 7.25 | % | 11/15/41 | 500 | 582,375 | |||||||||||
California (State of) Statewide Communities Development Authority (Terraces at San Joaquin Garden); Series 2012, RB | 5.63 | % | 10/01/32 | 1,000 | 1,062,410 | |||||||||||
California (State of) Statewide Communities Development Authority (University of California — Irvine East Campus Apartments); Series 2012, Ref. Student Housing RB | 5.38 | % | 05/15/38 | 2,000 | 2,208,100 | |||||||||||
California (State of) Statewide Finance Authority (Pooled Tobacco Securitization); Series 2006 A, Tobacco Settlement CAB Turbo RB(b) | 0.00 | % | 06/01/46 | 8,000 | 790,800 | |||||||||||
California (State of); | ||||||||||||||||
Series 2009, Various Purpose Unlimited Tax GO Bonds | 5.75 | % | 04/01/31 | 5,000 | 5,793,650 | |||||||||||
Series 2009, Various Purpose Unlimited Tax GO Bonds | 6.00 | % | 11/01/35 | 1,750 | 2,086,437 | |||||||||||
Series 2009, Various Purpose Unlimited Tax GO Bonds | 6.00 | % | 04/01/38 | 1,250 | 1,456,938 | |||||||||||
Series 2010, Unlimited Tax GO Bonds | 5.25 | % | 11/01/40 | 3,000 | 3,497,100 | |||||||||||
Series 2011, Various Purpose Unlimited Tax GO Bonds | 5.00 | % | 09/01/32 | 2,450 | 2,780,529 | |||||||||||
Series 2011, Various Purpose Unlimited Tax GO Bonds | 5.00 | % | 10/01/41 | 2,500 | 2,792,275 | |||||||||||
Series 2012, Ref. Unlimited Tax GO Bonds | 5.25 | % | 02/01/30 | 1,000 | 1,156,940 | |||||||||||
See accompanying Notes to Financial Statements which are an integral part of the financial statements.
11 Invesco California Tax-Free Income Fund
| Interest Rate | Maturity Date | Principal Amount (000) | Value | |||||||||||||
| California–(continued) | ||||||||||||||||
California Infrastructure & Economic Development Bank (Broad Museum); Series 2011 A, RB | 5.00 | % | 06/01/21 | $ | 2,000 | $ | 2,373,640 | |||||||||
California State University; | ||||||||||||||||
Series 2009 A, Systemwide RB (INS–AGC)(a) | 5.25 | % | 11/01/38 | 1,000 | 1,130,490 | |||||||||||
Series 2012 A, Systemwide RB(e) | 5.00 | % | 11/01/37 | 6,750 | 7,595,977 | |||||||||||
Chino Basin Regional Financing Authority (Inland Empire Utilities Agency); Series 2008 A, RB | 5.00 | % | 11/01/33 | 725 | 779,767 | |||||||||||
Clovis Unified School District (Election of 2004); Series 2004 A, Unlimited Tax CAB GO Bonds | 0.00 | % | 08/01/29 | 735 | 465,130 | |||||||||||
Desert Community College District (Election of 2004); Series 2007 C, Unlimited Tax GO Bonds | 5.00 | % | 08/01/37 | 2,500 | 2,666,525 | |||||||||||
East Bay Municipal Utility District; Series 2010 A, Ref. Sub. Water System RB | 5.00 | % | 06/01/36 | 2,000 | 2,289,160 | |||||||||||
Eden (Township of) Healthcare District; Series 2010, COP | 6.13 | % | 06/01/34 | 1,000 | 1,068,060 | |||||||||||
El Monte Union High School District (Election of 2008); Series 2009 A, Unlimited Tax GO Bonds | 5.50 | % | 06/01/34 | 1,000 | 1,127,680 | |||||||||||
El Segundo Unified School District (Election of 2008); Series 2009 A, Unlimited Tax CAB GO Bonds(b) | 0.00 | % | 08/01/33 | 4,430 | 2,050,868 | |||||||||||
Emeryville (City of) Public Financing Authority (Alameda County); | ||||||||||||||||
Series 2014 A, Ref. Tax Allocation RB (INS–AGM)(a) | 5.00 | % | 09/01/32 | 445 | 504,977 | |||||||||||
Series 2014 A, Ref. Tax Allocation RB (INS–AGM)(a) | 5.00 | % | 09/01/33 | 385 | 436,567 | |||||||||||
Series 2014 A, Ref. Tax Allocation RB (INS–AGM)(a) | 5.00 | % | 09/01/34 | 500 | 566,135 | |||||||||||
Fairfield (City of) Community Facilities District No. 3 (North Cordelia General Improvements); Series 2008, Special Tax RB | 6.00 | % | 09/01/32 | 1,800 | 1,989,414 | |||||||||||
Fontana (City of) Public Financing Authority (North Fontana Redevelopment); Series 2003 A, Tax Allocation RB (INS–AMBAC)(a) | 5.38 | % | 09/01/25 | 1,500 | 1,503,255 | |||||||||||
Fontana (City of) Redevelopment Agency (Downtown Redevelopment); Series 2000, Ref. Tax Allocation RB (INS–NATL)(a) | 5.00 | % | 09/01/21 | 1,480 | 1,482,590 | |||||||||||
Foothill-Eastern Transportation Corridor Agency; Series 2015, Ref. CAB Toll Road RB (INS–AGM)(a)(b) | 0.00 | % | 01/15/35 | 2,745 | 1,177,989 | |||||||||||
Fremont Community Facilities District No. 1 (Pacific Commons); | ||||||||||||||||
Series 2015, Ref. Special Tax RB | 5.00 | % | 09/01/35 | 815 | 873,525 | |||||||||||
Series 2015, Ref. Special Tax RB | 5.00 | % | 09/01/45 | 905 | 960,585 | |||||||||||
Fullerton (City of) Community Facilities District No. 1 (Amerige Heights); | ||||||||||||||||
Series 2012, Ref. Special Tax RB | 5.00 | % | 09/01/26 | 1,960 | 2,213,310 | |||||||||||
Series 2012, Ref. Special Tax RB | 5.00 | % | 09/01/32 | 1,090 | 1,192,144 | |||||||||||
Gilroy Unified School District (Election of 2008); | ||||||||||||||||
Series 2009 A, Unlimited Tax CAB GO Bonds(b)(d) | 0.00 | % | 08/01/29 | 615 | 413,378 | |||||||||||
Series 2009 A, Unlimited Tax CAB GO Bonds(b)(d) | 0.00 | % | 08/01/31 | 2,235 | 1,403,424 | |||||||||||
Series 2009 A, Unlimited Tax CAB GO Bonds (INS–AGC)(a)(b) | 0.00 | % | 08/01/29 | 4,735 | 2,809,938 | |||||||||||
Series 2009 A, Unlimited Tax CAB GO Bonds (INS–AGC)(a)(b) | 0.00 | % | 08/01/31 | 1,415 | 746,894 | |||||||||||
Glendora (City of) Public Finance Authority; Series 2003 A, Project No. One Tax Allocation RB | 5.00 | % | 09/01/24 | 2,425 | 2,434,773 | |||||||||||
Golden State Tobacco Securitization Corp.; | ||||||||||||||||
Series 2007 A-1, Sr. Tobacco Settlement Asset-Backed RB | 4.50 | % | 06/01/27 | 2,740 | 2,615,193 | |||||||||||
Series 2007 A-1, Sr. Tobacco Settlement Asset-Backed RB | 5.00 | % | 06/01/33 | 3,440 | 2,924,378 | |||||||||||
Series 2007 A-1, Sr. Tobacco Settlement Asset-Backed RB | 5.13 | % | 06/01/47 | 2,000 | 1,568,220 | |||||||||||
Series 2013 A, Enhanced Tobacco Settlement Asset-Backed RB | 5.00 | % | 06/01/30 | 2,000 | 2,265,820 | |||||||||||
Series 2015 A, Ref. Tobacco Settlement Asset-Backed RB | 5.00 | % | 06/01/40 | 1,170 | 1,296,512 | |||||||||||
Inglewood (City of) Redevelopment Agency (Merged Redevelopment); Series 1998 A, Ref. Tax Allocation RB (INS–AMBAC)(a) | 5.25 | % | 05/01/23 | 1,000 | 1,096,160 | |||||||||||
Inland Empire Tobacco Securitization Authority; Series 2007 A, Tobacco Settlement RB | 4.63 | % | 06/01/21 | 1,725 | 1,692,225 | |||||||||||
Irvine (City of) Community Facilities District No. 2013-3 (Great Park Improvement Area No. 1) ; | ||||||||||||||||
Series 2014, Special Tax RB | 5.00 | % | 09/01/44 | 445 | 476,969 | |||||||||||
Series 2014, Special Tax RB | 5.00 | % | 09/01/49 | 445 | 476,969 | |||||||||||
Irvine Unified School District (Community Facilities District No. 06-1- Portola Springs); Series 2010, Special Tax RB | 6.70 | % | 09/01/35 | 515 | 594,676 | |||||||||||
Irvine Unified School District; Series 2015, Ref. Special Tax RB | 5.00 | % | 09/01/38 | 3,500 | 3,951,395 | |||||||||||
Kern (County of) (Capital Improvments); Series 2009 A, COP (INS–AGC)(a) | 5.75 | % | 08/01/35 | 1,000 | 1,127,520 | |||||||||||
Kern (County of) Water Agency Improvement District No. 4; Series 2008 A, Water Revenue COP | 5.00 | % | 05/01/28 | 1,700 | 1,862,809 | |||||||||||
See accompanying Notes to Financial Statements which are an integral part of the financial statements.
12 Invesco California Tax-Free Income Fund
| Interest Rate | Maturity Date | Principal Amount (000) | Value | |||||||||||||
| California–(continued) | ||||||||||||||||
Lodi (City of); Series 2007 A, Wastewater System Revenue COP (INS–AGM)(a) | 5.00 | % | 10/01/37 | $ | 1,000 | $ | 1,069,220 | |||||||||
Long Beach (City of) Bond Finance Authority (Aquarium of the Pacific); Series 2012, Ref. RB | 5.00 | % | 11/01/29 | 2,000 | 2,241,520 | |||||||||||
Long Beach (City of) Bond Finance Authority (Natural Gas Purchase); Series 2007 A, RB | 5.50 | % | 11/15/32 | 1,105 | 1,302,088 | |||||||||||
Long Beach (City of) Financing Authority; Series 1992, RB (INS–AMBAC)(a) | 6.00 | % | 11/01/17 | 9,575 | 9,900,837 | |||||||||||
Long Beach (City of); | ||||||||||||||||
Series 2010 A, Sr. Airport RB | 5.00 | % | 06/01/40 | 2,500 | 2,742,925 | |||||||||||
Series 2015, Marina System RB | 5.00 | % | 05/15/45 | 1,615 | 1,728,987 | |||||||||||
Los Angeles (City of) Community Facilities District No. 4 (Playa Vista–Phase 1); Series 2014, Ref. Special Tax RB | 5.00 | % | 09/01/31 | 600 | 670,446 | |||||||||||
Los Angeles (City of) Department of Airports (Los Angeles International Airport); | ||||||||||||||||
Series 2010 A, Sr. RB | 5.00 | % | 05/15/35 | 2,500 | 2,831,500 | |||||||||||
Series 2010 B, Sub. RB | 5.00 | % | 05/15/40 | 1,000 | 1,124,950 | |||||||||||
Series 2013, RB(f) | 5.00 | % | 05/15/43 | 3,000 | 3,303,600 | |||||||||||
Los Angeles (City of) Department of Airports; Series 2015 C, Ref. Sub. RB | 5.00 | % | 05/15/38 | 1,000 | 1,137,480 | |||||||||||
Los Angeles (City of) Department of Water & Power; | ||||||||||||||||
Series 2011 A, Power System RB(e) | 5.00 | % | 07/01/22 | 1,800 | 2,152,260 | |||||||||||
Series 2011 A, Water System RB | 5.25 | % | 07/01/39 | 1,500 | 1,710,270 | |||||||||||
Subseries 2006 A-1, Water System RB (INS–AMBAC)(a) | 5.00 | % | 07/01/36 | 1,485 | 1,536,812 | |||||||||||
Subseries 2007 A-1, Power System RB (INS–AMBAC)(a) | 5.00 | % | 07/01/37 | 1,000 | 1,070,300 | |||||||||||
Subseries 2008 A-1, Power System RB | 5.25 | % | 07/01/38 | 2,000 | 2,202,860 | |||||||||||
Los Angeles (City of) Harbor Department; Series 2014 A, Ref. RB(f) | 5.00 | % | 08/01/36 | 1,000 | 1,122,970 | |||||||||||
Los Angeles Community College District (Election of 2003); Series 2008 F-1, Unlimited Tax GO Bonds(c)(d)(e) | 5.00 | % | 08/01/18 | 2,000 | 2,241,040 | |||||||||||
Los Angeles County Schools Regionalized Business Services Corp. (Los Angeles County Schools Pooled Financing Program); Series 1999 A, CAB COP (INS–AMBAC)(a)(b) | 0.00 | % | 08/01/24 | 1,265 | 941,982 | |||||||||||
Los Angeles Unified School District (Election of 2004); | ||||||||||||||||
Series 2007 H, Unlimited Tax GO Bonds (INS–AGM)(a) | 5.00 | % | 07/01/32 | 1,000 | 1,066,900 | |||||||||||
Series 2009 I, Unlimited Tax GO Bonds (INS–AGC)(a) | 5.00 | % | 01/01/34 | 3,000 | 3,380,130 | |||||||||||
M-S-R Energy Authority; Series 2009 B, Gas RB | 6.13 | % | 11/01/29 | 1,600 | 1,976,672 | |||||||||||
Menifee Union School District (Election of 2008); Series 2009 C, Unlimited Tax CAB GO Bonds | 0.00 | % | 08/01/35 | 940 | 392,760 | |||||||||||
Montclair (City of) Redevelopment Agency (Montclair Redevelopment Project No. V); Series 2001, Ref. Tax Allocation RB (INS–NATL)(a) | 5.00 | % | 10/01/20 | 1,120 | 1,122,442 | |||||||||||
Montebello Unified School District (Election of 2004); Series 2009 A-1, Unlimited Tax GO Bonds | 5.25 | % | 08/01/34 | 1,000 | 1,118,700 | |||||||||||
Moorpark Unified School District (Election of 2008); Series 2009 A, Unlimited Tax CAB GO Bonds | 0.00 | % | 08/01/31 | 840 | 428,770 | |||||||||||
Morongo Band of Mission Indians (The) (Enterprise Casino); Series 2008 B, RB(g) | 6.50 | % | 03/01/28 | 1,000 | 1,111,380 | |||||||||||
National City (City of) Community Development Commission (National City Redevelopment); Series 2011, Tax Allocation RB | 7.00 | % | 08/01/32 | 1,500 | 1,873,035 | |||||||||||
Norco (City of) Financing Authority; Series 2009, Ref. Enterprise RB (INS–AGM)(a) | 5.63 | % | 10/01/34 | 1,000 | 1,130,740 | |||||||||||
Oakland Unified School District (County of Alameda, California); Series 2015 A, Unlimited Tax GO Bonds | 5.00 | % | 08/01/40 | 1,070 | 1,167,841 | |||||||||||
Palomar Pomerado Health; Series 2009, COP | 6.75 | % | 11/01/39 | 2,000 | 2,189,340 | |||||||||||
Panama-Buena Vista Union School District (School Construction); Series 2006, COP(c)(d) | 5.00 | % | 09/01/16 | 1,045 | 1,094,376 | |||||||||||
Paramount Unified School District (Election of 2006); Series 2007, Unlimited Tax GO Bonds(c)(d) | 5.25 | % | 08/01/17 | 1,600 | 1,743,328 | |||||||||||
Pittsburg Unified School District (Election of 2006); Series 2009 B, Unlimited Tax GO Bonds(c)(d) | 5.50 | % | 08/01/18 | 1,000 | 1,135,210 | |||||||||||
Pomona (City of) Public Financing Authority (Merged Redevelopment); | ||||||||||||||||
Series 2001 AD, Tax Allocation RB (INS–NATL)(a) | 5.00 | % | 02/01/16 | 1,110 | 1,113,929 | |||||||||||
Series 2007 AW, Sub. RB | 5.13 | % | 02/01/33 | 1,075 | 1,078,311 | |||||||||||
Port Hueneme (City of) (Capital Improvement Program); Series 1992, Ref. COP (INS–NATL)(a) | 6.00 | % | 04/01/19 | 840 | 915,558 | |||||||||||
Rancho Cordova (City of) Community Facilities District No. 2003-1 (Sunridge Anatolia); Series 2012, Ref. Special Tax RB | 5.00 | % | 09/01/27 | 1,000 | 1,111,200 | |||||||||||
Rancho Cucamonga (City of) Redevelopment Agency (Rancho Redevelopment Housing Set Aside) Series 2007 A, Tax Allocation RB (INS–NATL)(a) | 5.00 | % | 09/01/34 | 1,000 | 1,065,430 | |||||||||||
See accompanying Notes to Financial Statements which are an integral part of the financial statements.
13 Invesco California Tax-Free Income Fund
| Interest Rate | Maturity Date | Principal Amount (000) | Value | |||||||||||||
| California–(continued) | ||||||||||||||||
Redding (City of) Redevelopment Agency (Canby-Hilltop-Cypress Redevelopment); Series 2003 A, Tax Allocation RB (INS–NATL)(a) | 5.00 | % | 09/01/23 | $ | 1,400 | $ | 1,405,320 | |||||||||
Regents of the University of California; | ||||||||||||||||
Series 2009 E, Medical Center Pooled RB | 5.50 | % | 05/15/27 | 2,500 | 2,717,700 | |||||||||||
Series 2009 O, General RB(c)(d)(e) | 5.75 | % | 05/15/19 | 705 | 826,951 | |||||||||||
Series 2009 O, General RB(c)(d)(e) | 5.75 | % | 05/15/19 | 1,050 | 1,231,629 | |||||||||||
Series 2009 Q, General RB(e)(h) | 5.00 | % | 05/15/34 | 920 | 985,513 | |||||||||||
Riverside (City of); | ||||||||||||||||
Series 2008 B, Water RB (INS–AGM)(a) | 5.00 | % | 10/01/33 | 1,000 | 1,104,190 | |||||||||||
Series 2008 D, Electric RB (INS–AGM)(a) | 5.00 | % | 10/01/38 | 1,800 | 1,967,580 | |||||||||||
Riverside (County of) Community Facilities District No. 07-2 (Clinton Keith); Series 2015, Special Tax Bonds | 5.00 | % | 09/01/44 | 1,000 | 1,033,400 | |||||||||||
Riverside (County of) Transportation Commission; Series 2010 A, Limited Sales Tax RB | 5.00 | % | 06/01/32 | 1,500 | 1,713,930 | |||||||||||
Romoland School District Community Facilities No. 2004-1; Series 2015, Ref. Special Tax Bonds | 5.00 | % | 09/01/38 | 1,000 | 1,066,180 | |||||||||||
Sacramento (County of) Sanitation Districts Financing Authority (Sacramento Regional County Sanitation District); Series 2006, RB(c)(d) | 5.00 | % | 06/01/16 | 2,000 | 2,072,340 | |||||||||||
Sacramento (County of); | ||||||||||||||||
Series 2008 A, Sr. Airport System RB (INS–AGM)(a) | 5.00 | % | 07/01/32 | 1,000 | 1,087,270 | |||||||||||
Series 2008 A, Sr. Airport System RB (INS–AGM)(a) | 5.00 | % | 07/01/41 | 1,015 | 1,103,579 | |||||||||||
Series 2010, Sr. Airport System RB | 5.00 | % | 07/01/40 | 2,200 | 2,453,638 | |||||||||||
San Buenaventura (City of) (Community Memorial Health System); Series 2011, RB | 7.50 | % | 12/01/41 | 2,000 | 2,433,540 | |||||||||||
San Diego (City of) Public Facilities Financing Authority (Southcrest & Central Imperial Redevelopment); Series 2007 B, Pooled Financing Tax Allocation RB (INS–AGC)(a) | 5.25 | % | 10/01/27 | 2,535 | 2,634,195 | |||||||||||
San Diego (City of) Public Facilities Financing Authority; Subseries 2012 A, Ref. Water RB | 5.00 | % | 08/01/32 | 2,215 | 2,529,907 | |||||||||||
San Diego (County of) Regional Transportation Commission; Series 2014 A, Sales & Use Tax RB(e) | 5.00 | % | 04/01/48 | 2,980 | 3,370,171 | |||||||||||
San Diego Community College District (Election of 2002); Series 2009, Unlimited Tax GO Bonds(e) | 5.25 | % | 08/01/33 | 1,500 | 1,714,515 | |||||||||||
San Diego Community College District (Election of 2006); Series 2011, Unlimited Tax GO Bonds | 5.00 | % | 08/01/31 | 2,500 | 2,887,950 | |||||||||||
San Francisco (City & County of) Airport Commission (San Francisco International Airport); | ||||||||||||||||
Series 2009 E, Second Series RB | 6.00 | % | 05/01/39 | 1,000 | 1,161,380 | |||||||||||
Series 2011 C, Ref. Second Series RB(f) | 5.00 | % | 05/01/23 | 5,000 | 5,701,000 | |||||||||||
Series 2011 G, Second Series RB | 5.25 | % | 05/01/28 | 2,000 | 2,349,720 | |||||||||||
San Francisco (City & County of) Public Utilities Commission (Water System Improvement Program); Subseries 2011 A, Water RB | 5.00 | % | 11/01/36 | 4,000 | 4,616,000 | |||||||||||
San Francisco (City & County of) Redevelopment Financing Authority (Mission Bay North Redevelopment); Series 2011 C, Tax Allocation RB | 6.75 | % | 08/01/41 | 1,000 | 1,203,760 | |||||||||||
San Francisco (City & County of) Redevelopment Financing Authority (Mission Bay South Redevelopment); Series 2011 D, Tax Allocation RB | 7.00 | % | 08/01/33 | 500 | 598,940 | |||||||||||
San Francisco (City & County of) Successor Agency to the Redevelopment Agency (Mission Bay South Redevelopment); Series 2014 A, Tax Allocation RB | 5.00 | % | 08/01/43 | 1,060 | 1,152,898 | |||||||||||
San Francisco (City & County of) Successor Agency to the Redevelopment Agency Community Facilities District No. 6 (Mission Bay South Public Improvements); Series 2013 A, Ref. Special Tax RB | 5.00 | % | 08/01/33 | 500 | 544,185 | |||||||||||
San Francisco (City of) Bay Area Rapid Transit District; Series 2012 A, RB | 5.00 | % | 07/01/36 | 1,000 | 1,120,730 | |||||||||||
San Joaquin Hills Transportation Corridor Agency; Series 2014 B, Ref. Jr. Toll Road RB | 5.25 | % | 01/15/44 | 2,000 | 2,159,600 | |||||||||||
San Jose Evergreen Community College District (Election of 2004); Series 2008 B, Unlimited Tax CAB GO Bonds (INS–AGM)(a)(b) | 0.00 | % | 09/01/31 | 3,110 | 1,656,759 | |||||||||||
San Luis Obispo (County of) Financing Authority (Lopez Dam Improvement); Series 2011 A, Ref. RB (INS–AGM)(a) | 5.00 | % | 08/01/30 | 1,500 | 1,655,505 | |||||||||||
Santa Clara (County of) Financing Authority (Multiple Facilities); Series 2008 L, Ref. Lease RB | 5.25 | % | 05/15/36 | 3,000 | 3,273,870 | |||||||||||
Santa Margarita Water District (Community Facilities District No. 2013-1); | ||||||||||||||||
Series 2013, Special Tax RB | 5.63 | % | 09/01/36 | 1,000 | 1,114,420 | |||||||||||
Series 2013, Special Tax RB | 5.63 | % | 09/01/43 | 1,000 | 1,108,390 | |||||||||||
Santaluz Community Facilities District No. 2 (Improvement Area No. 1); | ||||||||||||||||
Series 2011 A, Ref. Special Tax RB | 5.00 | % | 09/01/28 | 825 | 905,792 | |||||||||||
Series 2011 A, Ref. Special Tax RB | 5.00 | % | 09/01/29 | 715 | 782,303 | |||||||||||
Series 2011 A, Ref. Special Tax RB | 5.10 | % | 09/01/30 | 465 | 509,533 | |||||||||||
See accompanying Notes to Financial Statements which are an integral part of the financial statements.
14 Invesco California Tax-Free Income Fund
| Interest Rate | Maturity Date | Principal Amount (000) | Value | |||||||||||||
| California–(continued) | ||||||||||||||||
Sierra View Local Health Care District; Series 2007, RB | 5.25 | % | 07/01/32 | $ | 1,500 | $ | 1,566,270 | |||||||||
Silicon Valley Tobacco Securitization Authority (Santa Clara); Series 2007 A, CAB Turbo RB(b) | 0.00 | % | 06/01/36 | 3,000 | 690,660 | |||||||||||
Simi Valley Unified School District (Election of 2004); | ||||||||||||||||
Series 2007 C, Unlimited Tax CAB GO Bonds (INS–AGM)(a)(b) | 0.00 | % | 08/01/28 | 3,480 | 2,165,917 | |||||||||||
Series 2007 C, Unlimited Tax CAB GO Bonds (INS–AGM)(a)(b) | 0.00 | % | 08/01/30 | 2,765 | 1,497,220 | |||||||||||
South Orange (County of) Public Financing Authority (Ladera Ranch); Series 2014 A, Ref. Sr. Lien Special Tax RB | 5.00 | % | 08/15/34 | 895 | 997,048 | |||||||||||
Southern California Metropolitan Water District; Series 2009 B, Ref. RB(e) | 5.00 | % | 07/01/27 | 8,585 | 9,718,048 | |||||||||||
Southern California Public Power Authority (Milford Wind Corridor Phase II); | ||||||||||||||||
Series 2011 1, RB(e) | 5.25 | % | 07/01/31 | 2,100 | 2,415,924 | |||||||||||
Series 2011-1, RB(e) | 5.25 | % | 07/01/29 | 2,100 | 2,446,920 | |||||||||||
Southern California Tobacco Securitization Authority (San Diego County Tobacco Asset Securitization Corp.); Series 2006 A-1, Sr. Tobacco Settlement Asset-Backed RB | 5.13 | % | 06/01/46 | 2,700 | 2,264,247 | |||||||||||
Temecula (City of) Redevelopment Agency (Temecula Redevelopment Project No. 1); Series 2002, Tax Allocation RB (INS–NATL)(a) | 5.13 | % | 08/01/27 | 2,150 | 2,166,727 | |||||||||||
Tustin (City of) Public Financing Authority; Series 2011 A, Water RB | 5.00 | % | 04/01/41 | 1,000 | 1,097,240 | |||||||||||
Tustin Unified School District (Community Facilities District No. 97-1); Series 2015, Ref. Special Tax RB | 5.00 | % | 09/01/38 | 3,000 | 3,320,880 | |||||||||||
Val Verde Unified School District; Series 2009 A, Ref. COP (INS–AGC)(a) | 5.13 | % | 03/01/36 | 1,475 | 1,618,813 | |||||||||||
Walnut (City of) Energy Center Authority; Series 2010 A, Ref. RB | 5.00 | % | 01/01/35 | 3,000 | 3,340,020 | |||||||||||
West Contra Costa Unified School District; Series 2005, Unlimited Tax CAB GO Bonds (INS–NATL)(a)(b) | 0.00 | % | 08/01/25 | 2,500 | 1,776,950 | |||||||||||
Western Riverside (County of) Water & Wastewater Financing Authority (Eastern Municipal Water District Improvement); Series 2009, RB (INS–AGC)(a) | 5.63 | % | 09/01/39 | 1,000 | 1,128,550 | |||||||||||
Whittier (City of) (Presbyterian Intercommunity Hospital, Inc.); Series 2014, Health Facility RB | 5.00 | % | 06/01/44 | 1,500 | 1,631,100 | |||||||||||
Yosemite Community College District (Election of 2004); Series 2008 C, Unlimited Tax CAB GO Bonds (INS–AGM)(a)(b) | 0.00 | % | 08/01/24 | 4,685 | 3,537,971 | |||||||||||
| 375,768,470 | ||||||||||||||||
| Guam–1.48% | ||||||||||||||||
Guam (Territory of) (Section 30); | ||||||||||||||||
Series 2009 A, Limited Obligation RB | 5.38 | % | 12/01/24 | 1,000 | 1,105,730 | |||||||||||
Series 2009 A, Limited Obligation RB | 5.63 | % | 12/01/29 | 660 | 729,168 | |||||||||||
Guam (Territory of) International Airport Authority; Series 2013 C, General RB(f) | 6.25 | % | 10/01/34 | 1,000 | 1,163,060 | |||||||||||
Guam (Territory of) Waterworks Authority; Series 2014 A, Ref. Water & Wastewater System RB | 5.00 | % | 07/01/35 | 765 | 829,712 | |||||||||||
Guam (Territory of); Series 2011 A, Business Privilege Tax RB | 5.13 | % | 01/01/42 | 1,500 | 1,617,870 | |||||||||||
| 5,445,540 | ||||||||||||||||
| Puerto Rico–1.09% | ||||||||||||||||
Puerto Rico (Commonwealth of) Public Buildings Authority; Series 2002 D, RB(c)(d) | 5.45 | % | 07/01/17 | 3,680 | 4,004,540 | |||||||||||
| Virgin Islands–1.93% | ||||||||||||||||
Virgin Islands (Government of) Port Authority; | ||||||||||||||||
Series 2014 A, Ref. Marine RB(f) | 5.00 | % | 09/01/29 | 1,645 | 1,807,444 | |||||||||||
Series 2014 A, Ref. RB(f) | 5.00 | % | 09/01/33 | 1,500 | 1,621,860 | |||||||||||
Virgin Islands (Government of) Public Finance Authority (Matching Fund Loan Note — Diageo); Series 2009 A, Sub. RB | 6.63 | % | 10/01/29 | 1,675 | 1,877,574 | |||||||||||
Virgin Islands (Government of) Public Finance Authority (Matching Fund Loan Note); Series 2010 A, Sr. Lien RB | 5.00 | % | 10/01/25 | 1,600 | 1,785,744 | |||||||||||
| 7,092,622 | ||||||||||||||||
TOTAL INVESTMENTS(i)–106.59% (Cost $356,635,205) | 392,311,172 | |||||||||||||||
FLOATING RATE NOTE OBLIGATIONS–(8.45)% | ||||||||||||||||
Notes with interest and fee rates ranging from 0.54% to 0.75% at 08/31/2015 and contractual maturities of collateral ranging from 07/01/22 to 04/01/48 (See Note 1J)(j) | (31,105,000 | ) | ||||||||||||||
OTHER ASSETS LESS LIABILITIES–1.86% | 6,851,335 | |||||||||||||||
NET ASSETS–100.00% | $ | 368,057,507 | ||||||||||||||
See accompanying Notes to Financial Statements which are an integral part of the financial statements.
15 Invesco California Tax-Free Income Fund
Investment Abbreviations:
| AGC | – Assured Guaranty Corp. | |
| AGM | – Assured Guaranty Municipal Corp. | |
| AMBAC | – American Municipal Bond Assurance Corp. | |
| CAB | – Capital Appreciation Bonds | |
| CEP | – Credit Enhancement Provider | |
| COP | – Certificates of Participation | |
| FHA | – Federal Housing Administration | |
| GO | – General Obligation | |
| INS | – Insurer | |
| Jr. | – Junior | |
| NATL | – National Public Finance Guarantee Corp. | |
| RB | – Revenue Bonds | |
| Ref. | – Refunding | |
| Sr. | – Senior | |
| Sub. | – Subordinated |
Notes to Schedule of Investments:
| (a) | Principal and/or interest payments are secured by the bond insurance company listed. |
| (b) | Zero coupon bond issued at a discount. |
| (c) | Security has an irrevocable call by the issuer or mandatory put by the holder. Maturity date reflects such call or put. |
| (d) | Advance refunded; secured by an escrow fund of U.S. Government obligations or other highly rated collateral. |
| (e) | Underlying security related to TOB Trusts entered into by the Fund. See Note 1J. |
| (f) | Security subject to the alternative minimum tax. |
| (g) | Security purchased or received in a transaction exempt from registration under the Securities Act of 1933, as amended (the “1933 Act”). The security may be resold pursuant to an exemption from registration under the 1933 Act, typically to qualified institutional buyers. The aggregate value of these securities at August 31, 2015 was $7,701,945, which represented 2.09% of the Fund’s Net Assets. |
| (h) | Security is subject to a reimbursement agreement which may require the Fund to pay amounts to a counterparty in the event of a significant decline in the market value of the security underlying the TOB Trusts. In case of a shortfall, the maximum potential amount of payments the Fund could ultimately be required to make under the agreement is $615,000. However, such shortfall payment would be reduced by the proceeds from the sale of the security underlying the TOB Trusts. |
| (i) | This table provides a listing of those entities that have either issued, guaranteed, backed or otherwise enhanced the credit quality of more than 5% of the securities held in the portfolio. In instances where the entity has guaranteed, backed or otherwise enhanced the credit quality of a security, it is not primarily responsible for the issuer’s obligations but may be called upon to satisfy the issuer’s obligations. |
| Entity | Percentage | |||
Assured Guaranty Municipal Corp. | 8.9 | % | ||
| (j) | Floating rate note obligations related to securities held. The interest and fee rates shown reflect the rates in effect at August 31, 2015. At August 31, 2015, the Fund’s investments with a value of $53,455,053 are held by TOB Trusts and serve as collateral for the $31,105,000 in the floating rate note obligations outstanding at that date. |
See accompanying Notes to Financial Statements which are an integral part of the financial statements.
16 Invesco California Tax-Free Income Fund
Statement of Assets and Liabilities
August 31, 2015
Assets: |
| |||
Investments, at value (Cost $356,635,205) | $ | 392,311,172 | ||
Cash | 1,221,334 | |||
Receivable for: | ||||
Investments sold | 2,080,000 | |||
Fund shares sold | 684,403 | |||
Interest | 4,895,209 | |||
Investment for trustee deferred compensation and retirement plans | 53,362 | |||
Other assets | 33,172 | |||
Total assets | 401,278,652 | |||
Liabilities: |
| |||
Floating rate note obligations | 31,105,000 | |||
Payable for: | ||||
Investments purchased | 523,615 | |||
Fund shares reacquired | 732,493 | |||
Dividends | 541,634 | |||
Accrued fees to affiliates | 145,414 | |||
Accrued trustees’ and officers’ fees and benefits | 4,018 | |||
Accrued other operating expenses | 46,551 | |||
Trustee deferred compensation and retirement plans | 122,420 | |||
Total liabilities | 33,221,145 | |||
Net assets applicable to shares outstanding | $ | 368,057,507 | ||
Net assets consist of: |
| |||
Shares of beneficial interest | $ | 364,002,769 | ||
Undistributed net investment income | 1,172,059 | |||
Undistributed net realized gain (loss) | (32,793,288 | ) | ||
Net unrealized appreciation | 35,675,967 | |||
| $ | 368,057,507 | |||
Net Assets: |
| |||
Class A | $ | 300,873,449 | ||
Class B | $ | 15,150,387 | ||
Class C | $ | 28,335,193 | ||
Class Y | $ | 23,698,478 | ||
Shares outstanding, $0.01 par value per share, |
| |||
Class A | 24,895,169 | |||
Class B | 1,241,805 | |||
Class C | 2,329,352 | |||
Class Y | 1,953,187 | |||
Class A: | ||||
Net asset value per share | $ | 12.09 | ||
Maximum offering price per share | ||||
(Net asset value of $12.09 ¸ 95.75%) | $ | 12.63 | ||
Class B: | ||||
Net asset value and offering price per share | $ | 12.20 | ||
Class C: | ||||
Net asset value and offering price per share | $ | 12.16 | ||
Class Y: | ||||
Net asset value and offering price per share | $ | 12.13 | ||
See accompanying Notes to Financial Statements which are an integral part of the financial statements.
17 Invesco California Tax-Free Income Fund
Statement of Operations
For the year ended August 31, 2015
Investment income: |
| |||
Interest | $ | 17,897,126 | ||
Expenses: | ||||
Advisory fees | 1,734,602 | |||
Administrative services fees | 99,885 | |||
Custodian fees | 6,733 | |||
Distribution fees: | ||||
Class A | 749,953 | |||
Class B | 35,224 | |||
Class C | 189,995 | |||
Interest, facilities and maintenance fees | 181,644 | |||
Transfer agent fees | 195,730 | |||
Trustees’ and officers’ fees and benefits | 33,125 | |||
Other | 181,889 | |||
Total expenses | 3,408,780 | |||
Less: Expense offset arrangement(s) | (145 | ) | ||
Net expenses | 3,408,635 | |||
Net investment income | 14,488,491 | |||
Realized and unrealized gain (loss) from: | ||||
Net realized gain (loss) from investment securities | (24,505 | ) | ||
Change in net unrealized appreciation (depreciation) of investment securities | (2,247,668 | ) | ||
Net realized and unrealized gain (loss) | (2,272,173 | ) | ||
Net increase in net assets resulting from operations | $ | 12,216,318 | ||
See accompanying Notes to Financial Statements which are an integral part of the financial statements.
18 Invesco California Tax-Free Income Fund
Statement of Changes in Net Assets
For the years ended August 31, 2015 and 2014
| 2015 | 2014 | |||||||
Operations: |
| |||||||
Net investment income | $ | 14,488,491 | $ | 14,854,955 | ||||
Net realized gain (loss) | (24,505 | ) | (3,637,228 | ) | ||||
Change in net unrealized appreciation (depreciation) | (2,247,668 | ) | 32,124,016 | |||||
Net increase in net assets resulting from operations | 12,216,318 | 43,341,743 | ||||||
Distributions to shareholders from net investment income: | ||||||||
Class A | (11,927,147 | ) | (11,020,336 | ) | ||||
Class B | (621,320 | ) | (2,113,675 | ) | ||||
Class C | (862,100 | ) | (751,172 | ) | ||||
Class Y | (995,664 | ) | (926,911 | ) | ||||
Total distributions from net investment income | (14,406,231 | ) | (14,812,094 | ) | ||||
Share transactions–net: | ||||||||
Class A | 6,401,757 | 110,057,457 | ||||||
Class B | (1,193,174 | ) | (143,702,426 | ) | ||||
Class C | 8,082,680 | (2,708,476 | ) | |||||
Class Y | 1,472,808 | 137,694 | ||||||
Net increase (decrease) in net assets resulting from share transactions | 14,764,071 | (36,215,751 | ) | |||||
Net increase (decrease) in net assets | 12,574,158 | (7,686,102 | ) | |||||
Net assets: | ||||||||
Beginning of year | 355,483,349 | 363,169,451 | ||||||
End of year (includes undistributed net investment income of $1,172,059 and $1,175,971, respectively) | $ | 368,057,507 | $ | 355,483,349 | ||||
Notes to Financial Statements
August 31, 2015
NOTE 1—Significant Accounting Policies
Invesco California Tax-Free Income Fund (the “Fund”) is a series portfolio of AIM Counselor Series Trust (Invesco Counselor Series Trust) (the “Trust”). The Trust is a Delaware statutory trust registered under the Investment Company Act of 1940, as amended (the “1940 Act”), as an open-end series management investment company consisting of thirteen separate portfolios, each authorized to issue an unlimited number of shares of beneficial interest. The assets, liabilities and operations of each portfolio are accounted for separately. Information presented in these financial statements pertains only to the Fund. Matters affecting each portfolio or class will be voted on exclusively by the shareholders of such portfolio or class.
The Fund’s investment objective is to provide a high level of current income exempt from federal and California income tax, consistent with the preservation of capital.
The Fund currently consists of four different classes of shares: Class A, Class B, Class C and Class Y. Class A shares are sold with a front-end sales charge unless certain waiver criteria are met and under certain circumstances load waived shares may be subject to contingent deferred sales charges (“CDSC”). Class C shares are sold with a CDSC. Class Y shares are sold at net asset value. Effective November 30, 2010, new or additional investments in Class B shares are no longer permitted. Existing shareholders of Class B shares may continue to reinvest dividends and capital gains distributions in Class B shares until they convert to Class A shares. Also, shareholders in Class B shares will be able to exchange those shares for Class B shares of other Invesco Funds offering such shares until they convert to Class A shares. Generally, Class B shares will automatically convert to Class A shares on or about the month-end, which is at least eight years after the date of purchase. Redemption of Class B shares prior to conversion date will be subject to a CDSC.
The following is a summary of the significant accounting policies followed by the Fund in the preparation of its financial statements.
| A. | Security Valuations — Securities, including restricted securities, are valued according to the following policy. |
Securities are fair valued using an evaluated quote provided by an independent pricing service approved by the Board of Trustees. Evaluated quotes provided by the pricing service may be determined without exclusive reliance on quoted prices, and may reflect appropriate factors such as institution-size trading in similar groups of securities, developments related to specific securities, dividend rate (for unlisted equities), yield (for debt obligations), quality, type of issue, coupon rate (for debt obligations), maturity (for debt obligations), individual trading characteristics and other market data. Debt obligations are subject to interest rate and credit risks. In addition, all debt obligations involve some risk of default with respect to interest and/or principal payments.
Securities for which market quotations either are not readily available or became unreliable are valued at fair value as determined in good faith by or under the supervision of the Trust’s officers following procedures approved by the Board of Trustees. Some of the factors which may be considered in determining fair value are fundamental analytical data relating to the investment; the nature and duration of any restrictions on
19 Invesco California Tax-Free Income Fund
transferability or disposition; trading in similar securities by the same issuer or comparable companies; relevant political, economic or issuer specific news; and other relevant factors under the circumstances.
The Fund may invest in securities that are subject to interest rate risk, meaning the risk that the prices will generally fall as interest rates rise and, conversely, the prices will generally rise as interest rates fall. Specific securities differ in their sensitivity to changes in interest rates depending on their individual characteristics. Changes in interest rates may result in increased market volatility, which may affect the value and/or liquidity of certain Fund investments.
Valuations change in response to many factors including the historical and prospective earnings of the issuer, the value of the issuer’s assets, general economic conditions, interest rates, investor perceptions and market liquidity. Because of the inherent uncertainties of valuation, the values reflected in the financial statements may materially differ from the value received upon actual sale of those investments.
| B. | Securities Transactions and Investment Income — Securities transactions are accounted for on a trade date basis. Realized gains or losses on sales are computed on the basis of specific identification of the securities sold. Interest income (net of withholding tax, if any), adjusted for amortization of premiums and accretion of discounts on investments, is recorded on the accrual basis from settlement date. |
The Fund may periodically participate in litigation related to Fund investments. As such, the Fund may receive proceeds from litigation settlements. Any proceeds received are included in the Statement of Operations as realized gain (loss) for investments no longer held and as unrealized gain (loss) for investments still held.
Brokerage commissions and mark ups are considered transaction costs and are recorded as an increase to the cost basis of securities purchased and/or a reduction of proceeds on a sale of securities. Such transaction costs are included in the determination of net realized and unrealized gain (loss) from investment securities reported in the Statement of Operations and the Statement of Changes in Net Assets and the net realized and unrealized gains (losses) on securities per share in the Financial Highlights. Transaction costs are included in the calculation of the Fund’s net asset value and, accordingly, they reduce the Fund’s total returns. These transaction costs are not considered operating expenses and are not reflected in net investment income reported in the Statement of Operations and the Statement of Changes in Net Assets, or the net investment income per share and the ratios of expenses and net investment income reported in the Financial Highlights, nor are they limited by any expense limitation arrangements between the Fund and the investment adviser.
The Fund allocates realized and unrealized capital gains and losses to a class based on the relative net assets of each class. The Fund allocates income to a class based on the relative value of the settled shares of each class.
| C. | Country Determination — For the purposes of making investment selection decisions and presentation in the Schedule of Investments, the investment adviser may determine the country in which an issuer is located and/or credit risk exposure based on various factors. These factors include the laws of the country under which the issuer is organized, where the issuer maintains a principal office, the country in which the issuer derives 50% or more of its total revenues and the country that has the primary market for the issuer’s securities, as well as other criteria. Among the other criteria that may be evaluated for making this determination are the country in which the issuer maintains 50% or more of its assets, the type of security, financial guarantees and enhancements, the nature of the collateral and the sponsor organization. Country of issuer and/or credit risk exposure has been determined to be the United States of America, unless otherwise noted. |
| D. | Distributions — Distributions from net investment income, if any, are declared daily and paid monthly. Distributions from net realized capital gain, if any, are generally declared and paid annually and recorded on the ex-dividend date. The Fund may elect to treat a portion of the proceeds from redemptions as distributions for federal income tax purposes. |
| E. | Federal Income Taxes — The Fund intends to comply with the requirements of Subchapter M of the Internal Revenue Code of 1986, as amended (the “Internal Revenue Code”), necessary to qualify as a regulated investment company and to distribute substantially all of the Fund’s taxable and tax-exempt earnings to shareholders. As such, the Fund will not be subject to federal income taxes on otherwise taxable income (including net realized capital gain) that is distributed to shareholders. Therefore, no provision for federal income taxes is recorded in the financial statements. |
The Fund recognizes the tax benefits of uncertain tax positions only when the position is more likely than not to be sustained. Management has analyzed the Fund’s uncertain tax positions and concluded that no liability for unrecognized tax benefits should be recorded related to uncertain tax positions. Management is not aware of any tax positions for which it is reasonably possible that the total amounts of unrecognized tax benefits will change materially in the next 12 months.
In addition, the Fund intends to invest in such municipal securities to allow it to qualify to pay shareholders “exempt-interest dividends”, as defined in the Internal Revenue Code.
The Fund files tax returns in the U.S. Federal jurisdiction and certain other jurisdictions. Generally, the Fund is subject to examinations by such taxing authorities for up to three years after the filing of the return for the tax period.
| F. | Expenses — Fees provided for under the Rule 12b-1 plan of a particular class of the Fund and which are directly attributable to that class are charged to the operations of such class. All other expenses are allocated among the classes based on relative net assets. |
| G. | Interest, Facilities and Maintenance Fees — Interest, Facilities and Maintenance Fees include interest and related borrowing costs such as commitment fees and other expenses associated with lines of credit and interest and administrative expenses related to establishing and maintaining floating rate note obligations, if any. |
| H. | Accounting Estimates — The preparation of financial statements in conformity with accounting principles generally accepted in the United States of America (“GAAP”) requires management to make estimates and assumptions that affect the reported amounts of assets and liabilities at the date of the financial statements and the reported amounts of revenues and expenses during the reporting period including estimates and assumptions related to taxation. Actual results could differ from those estimates by a significant amount. In addition, the Fund monitors for material events or transactions that may occur or become known after the period-end date and before the date the financial statements are released to print. |
| I. | Indemnifications — Under the Trust’s organizational documents, each Trustee, officer, employee or other agent of the Trust is indemnified against certain liabilities that may arise out of the performance of their duties to the Fund. Additionally, in the normal course of business, the Fund enters into contracts, including the Fund’s servicing agreements, that contain a variety of indemnification clauses. The Fund’s maximum exposure under these arrangements is unknown as this would involve future claims that may be made against the Fund that have not yet occurred. The risk of material loss as a result of such indemnification claims is considered remote. |
20 Invesco California Tax-Free Income Fund
| J. | Floating Rate Note Obligations — The Fund invests in inverse floating rate securities, such as Tender Option Bonds (“TOBs”), for investment purposes and to enhance the yield of the Fund. Such securities may be purchased in the secondary market without first owning an underlying bond but generally are created through the sale of fixed rate bonds by the Fund to special purpose trusts established by a broker dealer or by the Fund (“TOB Trusts”) in exchange for cash and residual interests in the TOB Trusts’ assets and cash flows, which are in the form of inverse floating rate securities. The TOB Trusts finance the purchases of the fixed rate bonds by issuing floating rate notes to third parties and allowing the Fund to retain residual interests in the bonds. The floating rate notes issued by the TOB Trusts have interest rates that reset weekly and the floating rate note holders have the option to tender their notes to the TOB Trusts for redemption at par at each reset date. The residual interests held by the Fund (inverse floating rate securities) include the right of the Fund (1) to cause the holders of the floating rate notes to tender their notes at par at the next interest rate reset date, and (2) to transfer the municipal bond from the TOB Trust to the Fund, thereby collapsing the TOB Trust. Inverse floating rate securities tend to underperform the market for fixed rate bonds in a rising interest rate environment, but tend to outperform the market for fixed rate bonds when interest rates decline or remain relatively stable. |
The Fund generally invests in inverse floating rate securities that include embedded leverage, thus exposing the Fund to greater risks and increased costs. The primary risks associated with inverse floating rate securities are varying degrees of liquidity and decreases in the value of such securities in response to changes in interest rates to a greater extent than fixed rate securities having similar credit quality, redemption provisions and maturity, which may cause the Fund’s net asset value to be more volatile than if it had not invested in inverse floating rate securities. In certain instances, the short-term floating rate notes created by the TOB Trust may not be able to be sold to third parties or, in the case of holders tendering (or putting) such notes for repayment of principal, may not be able to be remarketed to third parties. In such cases, the TOB Trust holding the fixed rate bonds may be collapsed with the entity that contributed the fixed rate bonds to the TOB Trust. In the case where a TOB Trust is collapsed with the Fund, the Fund will be required to repay the principal amount of the tendered securities, which may require the Fund to sell other portfolio holdings to raise cash to meet that obligation. The Fund could therefore be required to sell other portfolio holdings at a disadvantageous time or price to raise cash to meet this obligation, which risk will be heightened during times of market volatility, illiquidity or uncertainty. The embedded leverage in the TOB Trust could cause the Fund to lose more money than the value of the asset it has contributed to the TOB Trust and greater levels of leverage create the potential for greater losses. In addition, a Fund may enter into reimbursement agreements with the liquidity provider of certain TOB transactions in connection with certain residuals held by the Fund. These agreements commit a Fund to reimburse the liquidity provider to the extent that the liquidity provider must provide cash to a TOB Trust, including following the termination of a TOB Trust resulting from a mandatory tender event (“liquidity shortfall”). The reimbursement agreement will effectively make the Fund liable for the amount of the negative difference, if any, between the liquidation value of the underlying security and the purchase price of the floating rate notes issued by the TOB Trust.
The Fund accounts for the transfer of fixed rate bonds to the TOB Trusts as secured borrowings, with the securities transferred remaining in the Fund’s investment assets, and the related floating rate notes reflected as Fund liabilities under the caption Floating rate note obligations on the Statement of Assets and Liabilities. The Fund records the interest income from the fixed rate bonds under the caption Interest and records the expenses related to floating rate obligations and any administrative expenses of the TOB Trusts as a component of Interest, facilities and maintenance fees on the Statement of Operations.
Final rules implementing section 619 of the Dodd-Frank Wall Street Reform and Consumer Protection Act (the “Volcker Rule”) prohibit banking entities from engaging in proprietary trading of certain instruments and limit such entities’ investments in, and relationships with, “covered funds”, as defined in the rules. These rules preclude banking entities and their affiliates from sponsoring and/or providing services for existing TOB Trusts. A new TOB structure is being utilized by the Fund wherein the Fund, as holder of the residuals, will perform certain duties previously performed by banking entities as “sponsors” of TOB Trusts. These duties may be performed by a third-party service provider. The Fund’s expanded role under the new TOB structure may increase its operational and regulatory risk. The new structure is substantially similar to the previous structure; however, pursuant to the Volcker Rule, the remarketing agent would not be able to repurchase tendered floaters for its own account upon a failed remarketing. In the event of a failed remarketing, a banking entity serving as liquidity provider may loan the necessary funds to the TOB Trust to purchase the tendered floaters. The TOB Trust, not the Fund, would be the borrower and the loan from the liquidity provider will be secured by the purchased floaters now held by the TOB Trust. However, as previously described, the Fund would bear the risk of loss with respect to any liquidity shortfall to the extent it entered into a reimbursement agreement with the liquidity provider.
There can be no assurances that the new TOB structure will continue to be a viable form of leverage. Further, there can be no assurances that alternative forms of leverage will be available to the Fund in order to maintain current levels of leverage. Any alternative forms of leverage may be less advantageous to the Fund, and may adversely affect the Fund’s net asset value, distribution rate and ability to achieve its investment objective.
TOBs are presently classified as private placement securities. Private placement securities are subject to restrictions on resale because they have not been registered under the Securities Act of 1933, as amended (the “1933 Act”), or are otherwise not readily marketable. As a result of the absence of a public trading market for these securities, they may be less liquid than publicly traded securities. Although atypical, these securities may be resold in privately negotiated transactions, the prices realized from these sales could be less than those originally paid by the Fund or less than what may be considered the fair value of such securities.
| K. | Other Risks — The value of, payment of interest on, repayment of principal for and the ability to sell a municipal security may be affected by constitutional amendments, legislative enactments, executive orders, administrative regulations, voter initiatives and the economics of the regions in which the issuers are located. |
Since many municipal securities are issued to finance similar projects, especially those relating to education, health care, transportation and utilities, conditions in those sectors can affect the overall municipal securities market and a Fund’s investments in municipal securities.
There is some risk that a portion or all of the interest received from certain tax-free municipal securities could become taxable as a result of determinations by the Internal Revenue Service.
21 Invesco California Tax-Free Income Fund
NOTE 2—Advisory Fees and Other Fees Paid to Affiliates
The Trust has entered into a master investment advisory agreement with Invesco Advisers, Inc. (the “Adviser” or “Invesco”). Under the terms of the investment advisory agreement, the Fund pays an advisory fee to the Adviser based on the annual rate of the Fund’s average daily net assets as follows:
| Average Daily Net Assets | Rate | |||||
First $500 million | 0 | .47% | ||||
Next $250 million | 0 | .445% | ||||
Next $250 million | 0 | .42% | ||||
Next $250 million | 0 | .395% | ||||
Over $1.25 billion | 0 | .37% | ||||
For the year ended August 31, 2015, the effective advisory fees incurred by the Fund was 0.47%.
Under the terms of a master sub-advisory agreement between the Adviser and each of Invesco Asset Management Deutschland GmbH, Invesco Asset Management Limited, Invesco Asset Management (Japan) Limited, Invesco Hong Kong Limited, Invesco Senior Secured Management, Inc. and Invesco Canada Ltd. (collectively, the “Affiliated Sub-Advisers”) the Adviser, not the Fund, may pay 40% of the fees paid to the Adviser to any such Affiliated Sub-Adviser(s) that provide(s) discretionary investment management services to the Fund based on the percentage of assets allocated to such Affiliated Sub-Adviser(s).
The Adviser has contractually agreed, through at least June 30, 2016, to waive advisory fees and/or reimburse expenses to the extent necessary to limit total annual fund operating expenses and/or reimbursement (excluding certain items discussed below) of Class A, Class B, Class C and Class Y shares to 1.50%, 2.00%, 2.00% and 1.25% of average daily net assets, respectively. In determining the Adviser’s obligation to waive advisory fees and/or reimburse expenses, the following expenses are not taken into account, and could cause the net annual fund operating expenses and/or reimbursement to exceed the numbers reflected above: (1) interest, facilities and maintenance fees; (2) taxes; (3) dividend expense on short sales; (4) extraordinary or non-routine items, including litigation expenses; and (5) expenses that the Fund has incurred but did not actually pay because of an expense offset arrangement. Unless Invesco continues the fee waiver agreement, it will terminate on June 30, 2016. The fee waiver agreement cannot be terminated during its term. The Adviser did not waive fees and/or reimburse expenses during the period under this expense limitation.
The Trust has entered into a master administrative services agreement with Invesco pursuant to which the Fund has agreed to pay Invesco for certain administrative costs incurred in providing accounting services to the Fund. For the year ended August 31, 2015, expenses incurred under the agreement are shown in the Statement of Operations as Administrative services fees.
The Trust has entered into a transfer agency and service agreement with Invesco Investment Services, Inc. (“IIS”) pursuant to which the Fund has agreed to pay IIS a fee for providing transfer agency and shareholder services to the Fund and reimburse IIS for certain expenses incurred by IIS in the course of providing such services. IIS may make payments to intermediaries that provide omnibus account services, sub-accounting services and/or networking services. All fees payable by IIS to intermediaries that provide omnibus account services or sub-accounting are charged back to the Fund, subject to certain limitations approved by the Trust’s Board of Trustees. For the year ended August 31, 2015, expenses incurred under the agreement are shown in the Statement of Operations as Transfer agent fees.
Shares of the Fund are distributed by Invesco Distributors, Inc. (“IDI”), an affiliate of the Adviser. The Fund has adopted a Plan of Distribution (the “Plan”) pursuant to Rule 12b-1 under the 1940 Act. The Plan provides that the Fund will reimburse IDI for distribution related expenses that IDI incurs up to a maximum of the following annual rates: (1) Class A — up to 0.25% of the average daily net assets of Class A shares; (2) Class B — up to 0.75% of the average daily net assets of Class B shares; and (3) Class C — up to 0.75% of the average daily net assets of Class C shares.
In the case of Class B shares, provided that the Plan continues in effect, any cumulative expenses incurred by IDI, but not yet reimbursed to IDI, may be recovered through the payment of future distribution fees from the Fund pursuant to the Plan and contingent deferred sales charges paid by investors upon redemption of Class B shares.
For the year ended August 31, 2015, expenses incurred under these agreements are shown in the Statement of Operations as Distribution fees.
Front-end sales commissions and CDSC (collectively, the “sales charges”) are not recorded as expenses of the Fund. Front-end sales commissions are deducted from proceeds from the sales of Fund shares prior to investment in Class A shares of the Fund. CDSC are deducted from redemption proceeds prior to remittance to the shareholder. During the year ended August 31, 2015, IDI advised the Fund that IDI retained $42,843 in front-end sales commissions from the sale of Class A shares and $765, $2,746 and $1,436 from Class A, Class B and Class C shares, respectively, for CDSC imposed on redemptions by shareholders.
Certain officers and trustees of the Trust are officers and directors of the Adviser, IIS and/or IDI.
NOTE 3—Additional Valuation Information
GAAP defines fair value as the price that would be received to sell an asset or paid to transfer a liability in an orderly transaction between market participants at the measurement date, under current market conditions. GAAP establishes a hierarchy that prioritizes the inputs to valuation methods, giving the highest priority to readily available unadjusted quoted prices in an active market for identical assets (Level 1) and the lowest priority to significant unobservable inputs (Level 3), generally when market prices are not readily available or are unreliable. Based on the valuation inputs, the securities or other investments are tiered into one of three levels. Changes in valuation methods may result in transfers in or out of an investment’s assigned level:
| Level 1 — | Prices are determined using quoted prices in an active market for identical assets. |
| Level 2 — | Prices are determined using other significant observable inputs. Observable inputs are inputs that other market participants may use in pricing a security. These may include quoted prices for similar securities, interest rates, prepayment speeds, credit risk, yield curves, loss severities, default rates, discount rates, volatilities and others. |
22 Invesco California Tax-Free Income Fund
| Level 3 — | Prices are determined using significant unobservable inputs. In situations where quoted prices or observable inputs are unavailable (for example, when there is little or no market activity for an investment at the end of the period), unobservable inputs may be used. Unobservable inputs reflect the Fund’s own assumptions about the factors market participants would use in determining fair value of the securities or instruments and would be based on the best available information. |
As of August 31, 2015, all of the securities in this Fund were valued based on Level 2 inputs (see the Schedule of Investments for security categories). The level assigned to the securities valuations may not be an indication of the risk or liquidity associated with investing in those securities. Because of the inherent uncertainties of valuation, the values reflected in the financial statements may materially differ from the value received upon actual sale of those investments.
NOTE 4—Expense Offset Arrangement(s)
The expense offset arrangement is comprised of transfer agency credits which result from balances in demand deposit accounts used by the transfer agent for clearing shareholder transactions. For the year ended August 31, 2015, the Fund received credits from this arrangement, which resulted in the reduction of the Fund’s total expenses of $145.
NOTE 5—Trustees’ and Officers’ Fees and Benefits
Trustees’ and Officers’ Fees and Benefits include amounts accrued by the Fund to pay remuneration to certain Trustees and Officers of the Fund. Trustees have the option to defer compensation payable by the Fund, and Trustees’ and Officers’ Fees and Benefits also include amounts accrued by the Fund to fund such deferred compensation amounts. Those Trustees who defer compensation have the option to select various Invesco Funds in which their deferral accounts shall be deemed to be invested. Finally, certain current Trustees were eligible to participate in a retirement plan that provided for benefits to be paid upon retirement to Trustees over a period of time based on the number of years of service. The Fund may have certain former Trustees who also participate in a retirement plan and receive benefits under such plan. Trustees’ and Officers’ Fees and Benefits include amounts accrued by the Fund to fund such retirement benefits. Obligations under the deferred compensation and retirement plans represent unsecured claims against the general assets of the Fund.
NOTE 6—Cash Balances and Borrowings
The Fund is permitted to temporarily carry a negative or overdrawn balance in its account with SSB, the custodian bank. Such balances, if any at period end, are shown in the Statement of Assets and Liabilities under the payable caption Amount due custodian. To compensate the custodian bank for such overdrafts, the overdrawn Fund may either (1) leave funds as a compensating balance in the account so the custodian bank can be compensated by earning the additional interest; or (2) compensate by paying the custodian bank at a rate agreed upon by the custodian bank and Invesco, not to exceed the contractually agreed upon rate.
Inverse floating rate obligations resulting from the transfer of bonds to TOB Trusts are accounted for as secured borrowings. The average floating rate notes outstanding and average annual interest and fee rate related to inverse floating rate note obligations during August 31, 2015 were $29,745,769 and 0.60%, respectively.
NOTE 7—Distributions to Shareholders and Tax Components of Net Assets
Tax Character of Distributions to Shareholders Paid During the Fiscal Years Ended August 31, 2015 and 2014:
| 2015 | 2014 | |||||||
Ordinary income | $ | 14,406,231 | $ | 14,812,094 | ||||
Tax Components of Net Assets at Period-End:
| 2015 | ||||
Undistributed ordinary income | $ | 798,637 | ||
Net unrealized appreciation — investments | 35,988,404 | |||
Temporary book/tax differences | (123,274 | ) | ||
Capital loss carryforward | (32,609,029 | ) | ||
Shares of beneficial interest | 364,002,769 | |||
Total net assets | $ | 368,057,507 | ||
The difference between book-basis and tax-basis unrealized appreciation (depreciation) is due to differences in the timing of recognition of gains and losses on investments for tax and book purposes. The Fund’s net unrealized appreciation difference is attributable primarily to TOBs, amortization differences and wash sales.
The temporary book/tax differences are a result of timing differences between book and tax recognition of income and/or expenses. The Fund’s temporary book/tax differences are the result of the trustee deferral of compensation and retirement plan benefits.
Capital loss carryforward is calculated and reported as of a specific date. Results of transactions and other activity after that date may affect the amount of capital loss carryforward actually available for the Fund to utilize. Capital losses generated in years beginning after December 22, 2010 can be carried forward for an unlimited period, whereas previous losses expire in eight tax years. Capital losses with an expiration period may not be used to offset capital gains until all net capital losses without an expiration date have been utilized. Capital loss carryforwards with no expiration date will retain their character as either short-term or long-term capital losses instead of as short-term capital losses as under prior law. The ability to utilize capital loss carryforwards in the future may be limited under the Internal Revenue Code and related regulations based on the results of future transactions.
23 Invesco California Tax-Free Income Fund
The Fund has a capital loss carryforward as of August 31, 2015, which expires as follows:
| Capital Loss Carryforward* | ||||||||||||
| Expiration | Short-Term | Long-Term | Total | |||||||||
August 31, 2016 | $ | 4,399,730 | $ | — | $ | 4,399,730 | ||||||
August 31, 2017 | 9,460,903 | — | 9,460,903 | |||||||||
August 31, 2018 | 6,678,872 | — | 6,678,872 | |||||||||
August 31, 2019 | 1,906,728 | — | 1,906,728 | |||||||||
Not subject to expiration | 2,145,450 | 8,017,346 | 10,162,796 | |||||||||
| $ | 24,591,683 | $ | 8,017,346 | $ | 32,609,029 | |||||||
| * | Capital loss carryforward as of the date listed above is reduced for limitations, if any, to the extent required by the Internal Revenue Code and may be further limited depending upon a variety of factors, including the realization of net unrealized gains or losses as of the date of any reorganization. |
NOTE 8—Investment Securities
The aggregate amount of investment securities (other than short-term securities, U.S. Treasury obligations and money market funds, if any) purchased and sold by the Fund during the year ended August 31, 2015 was $60,613,197 and $45,824,899, respectively. Cost of investments on a tax basis includes the adjustments for financial reporting purposes as of the most recently completed federal income tax reporting period-end.
| Unrealized Appreciation (Depreciation) of Investment Securities on a Tax Basis | ||||
Aggregate unrealized appreciation of investment securities | $ | 38,521,067 | ||
Aggregate unrealized (depreciation) of investment securities | (2,532,663 | ) | ||
Net unrealized appreciation of investment securities | $ | 35,988,404 | ||
Cost of investments for tax purposes is $356,322,768.
NOTE 9—Reclassification of Permanent Differences
Primarily as a result of differing book/tax treatment of expired capital loss carryforward and taxable income, on August 31, 2015, undistributed net investment income was decreased by $86,172, undistributed net realized gain (loss) was increased by $807,867 and shares of beneficial interest was decreased by $721,695. This reclassification had no effect on the net assets of the Fund.
NOTE 10—Share Information
| Summary of Share Activity | ||||||||||||||||
| Years ended August 31, | ||||||||||||||||
| 2015(a) | 2014 | |||||||||||||||
| Shares | Amount | Shares | Amount | |||||||||||||
Sold: | ||||||||||||||||
Class A | 2,990,754 | $ | 36,545,462 | 12,738,568 | $ | 145,897,191 | ||||||||||
Class B | 16,866 | 209,331 | 11,680 | 138,829 | ||||||||||||
Class C | 1,108,401 | 13,637,252 | 293,547 | 3,474,609 | ||||||||||||
Class Y | 378,080 | 4,644,193 | 371,700 | 4,380,591 | ||||||||||||
Issued as reinvestment of dividends: | ||||||||||||||||
Class A | 570,873 | 6,959,438 | 531,097 | 6,254,004 | ||||||||||||
Class B | 24,298 | 298,984 | 54,886 | 649,950 | ||||||||||||
Class C | 41,519 | 509,049 | 29,514 | 350,041 | ||||||||||||
Class Y | 33,587 | 410,776 | 29,763 | 352,317 | ||||||||||||
Automatic conversion of Class B shares to Class A shares: | ||||||||||||||||
Class A | 35,876 | 436,722 | 390,948 | 4,608,714 | ||||||||||||
Class B | (35,543 | ) | (436,722 | ) | (387,175 | ) | (4,608,714 | ) | ||||||||
Reacquired: | ||||||||||||||||
Class A | (3,086,033 | ) | (37,539,865 | ) | (4,023,477 | ) | (46,702,452 | ) | ||||||||
Class B | (102,736 | ) | (1,264,767 | ) | (12,162,839 | ) | (139,882,491 | ) | ||||||||
Class C | (495,997 | ) | (6,063,621 | ) | (560,471 | ) | (6,533,126 | ) | ||||||||
Class Y | (293,620 | ) | (3,582,161 | ) | (396,116 | ) | (4,595,214 | ) | ||||||||
Net increase (decrease) in share activity | 1,186,325 | $ | 14,764,071 | (3,078,375 | ) | $ | (36,215,751 | ) | ||||||||
| (a) | There are entities that are record owners of more than 5% of the outstanding shares of the Fund and in the aggregate own 61% of the outstanding shares of the Fund. IDI has an agreement with these entities to sell Fund shares. The Fund, Invesco and/or Invesco affiliates may make payments to these entities, which are considered to be related to the Fund, for providing services to the Fund, Invesco and/or Invesco affiliates including but not limited to services such as securities brokerage, distribution, third party record keeping and account servicing. The Fund has no knowledge as to whether all or any portion of the shares owned of record by these entities are also owned beneficially. |
24 Invesco California Tax-Free Income Fund
NOTE 11—Financial Highlights
The following schedule presents financial highlights for a share of the Fund outstanding throughout the periods indicated.
| Net asset value, beginning of period | Net investment income(a) | Net gains (losses) on securities (both realized and unrealized) | Total from investment operations | Dividends from net investment income | Net asset value, end of period | Total return(b) | Net assets, end of period (000’s omitted) | Ratio of expenses to average net assets with fee waivers and/or expenses absorbed | Ratio of expenses to average net assets without fee waivers and/or expenses absorbed | Supplemental ratio of expenses to average net assets (excluding interest, facilities and maintenance fees)(c) | Ratio of net investment income to average net assets | Portfolio turnover(d) | ||||||||||||||||||||||||||||||||||||||||
Class A |
| |||||||||||||||||||||||||||||||||||||||||||||||||||
Year ended 08/31/15 | $ | 12.15 | $ | 0.48 | $ | (0.06 | ) | $ | 0.42 | $ | (0.48 | ) | $ | 12.09 | 3.48 | % | $ | 300,873 | 0.91 | %(e) | 0.91 | %(e) | 0.86 | %(e) | 3.94 | %(e) | 12 | % | ||||||||||||||||||||||||
Year ended 08/31/14 | 11.20 | 0.49 | 0.95 | 1.44 | (0.49 | ) | 12.15 | 13.14 | 296,200 | 0.93 | 0.93 | 0.87 | 4.25 | 12 | ||||||||||||||||||||||||||||||||||||||
Year ended 08/31/13 | 12.28 | 0.49 | (1.08 | ) | (0.59 | ) | (0.49 | ) | 11.20 | (5.06 | ) | 165,142 | 0.89 | 0.89 | 0.84 | 4.02 | 12 | |||||||||||||||||||||||||||||||||||
Year ended 08/31/12 | 11.34 | 0.50 | 0.94 | 1.44 | (0.50 | ) | 12.28 | 12.91 | 163,047 | 0.87 | 0.87 | 0.82 | 4.21 | 18 | ||||||||||||||||||||||||||||||||||||||
Year ended 08/31/11 | 11.75 | 0.52 | (0.41 | ) | 0.11 | (0.52 | ) | 11.34 | 1.13 | 148,884 | 0.90 | 0.90 | 0.85 | 4.66 | 25 | |||||||||||||||||||||||||||||||||||||
Class B |
| |||||||||||||||||||||||||||||||||||||||||||||||||||
Year ended 08/31/15 | 12.26 | 0.49 | (0.06 | ) | 0.43 | (0.49 | ) | 12.20 | 3.51 | (f) | 15,150 | 0.88 | (e)(f) | 0.88 | (e)(f) | 0.83 | (e)(f) | 3.97 | (e)(f) | 12 | ||||||||||||||||||||||||||||||||
Year ended 08/31/14 | 11.28 | 0.50 | 0.98 | 1.48 | (0.50 | ) | 12.26 | 13.35 | (f) | 16,419 | 0.93 | (f) | 0.93 | (f) | 0.87 | (f) | 4.25 | (f) | 12 | |||||||||||||||||||||||||||||||||
Year ended 08/31/13 | 12.37 | 0.49 | (1.09 | ) | (0.60 | ) | (0.49 | ) | 11.28 | (5.11 | )(f) | 155,900 | 0.93 | (f) | 0.93 | (f) | 0.88 | (f) | 3.98 | (f) | 12 | |||||||||||||||||||||||||||||||
Year ended 08/31/12 | 11.42 | 0.50 | 0.95 | 1.45 | (0.50 | ) | 12.37 | 12.93 | (f) | 217,489 | 0.88 | (f) | 0.88 | (f) | 0.83 | (f) | 4.20 | (f) | 18 | |||||||||||||||||||||||||||||||||
Year ended 08/31/11 | 11.83 | 0.52 | (0.41 | ) | 0.11 | (0.52 | ) | 11.42 | 1.16 | (f) | 220,478 | 0.89 | (f) | 0.89 | (f) | 0.84 | (f) | 4.67 | (f) | 25 | ||||||||||||||||||||||||||||||||
Class C |
| |||||||||||||||||||||||||||||||||||||||||||||||||||
Year ended 08/31/15 | 12.23 | 0.42 | (0.07 | ) | 0.35 | (0.42 | ) | 12.16 | 2.87 | 28,335 | 1.41 | (e) | 1.41 | (e) | 1.36 | (e) | 3.44 | (e) | 12 | |||||||||||||||||||||||||||||||||
Year ended 08/31/14 | 11.27 | 0.44 | 0.96 | 1.40 | (0.44 | ) | 12.23 | 12.62 | (g) | 20,485 | 1.43 | (g) | 1.43 | (g) | 1.37 | (g) | 3.75 | (g) | 12 | |||||||||||||||||||||||||||||||||
Year ended 08/31/13 | 12.36 | 0.43 | (1.09 | ) | (0.66 | ) | (0.43 | ) | 11.27 | (5.57 | ) | 21,558 | 1.40 | 1.40 | 1.35 | 3.51 | 12 | |||||||||||||||||||||||||||||||||||
Year ended 08/31/12 | 11.41 | 0.44 | 0.95 | 1.39 | (0.44 | ) | 12.36 | 12.37 | 27,394 | 1.38 | 1.38 | 1.33 | 3.70 | 18 | ||||||||||||||||||||||||||||||||||||||
Year ended 08/31/11 | 11.82 | 0.46 | (0.40 | ) | 0.06 | (0.47 | ) | 11.41 | 0.65 | 21,800 | 1.40 | 1.40 | 1.35 | 4.16 | 25 | |||||||||||||||||||||||||||||||||||||
Class Y |
| |||||||||||||||||||||||||||||||||||||||||||||||||||
Year ended 08/31/15 | 12.20 | 0.51 | (0.07 | ) | 0.44 | (0.51 | ) | 12.13 | 3.65 | 23,698 | 0.66 | (e) | 0.66 | (e) | 0.61 | (e) | 4.19 | (e) | 12 | |||||||||||||||||||||||||||||||||
Year ended 08/31/14 | 11.24 | 0.52 | 0.96 | 1.48 | (0.52 | ) | 12.20 | 13.48 | 22,380 | 0.69 | 0.69 | 0.63 | 4.49 | 12 | ||||||||||||||||||||||||||||||||||||||
Year ended 08/31/13 | 12.33 | 0.52 | (1.09 | ) | (0.57 | ) | (0.52 | ) | 11.24 | (4.88 | ) | 20,569 | 0.65 | 0.65 | 0.60 | 4.26 | 12 | |||||||||||||||||||||||||||||||||||
Year ended 08/31/12 | 11.38 | 0.53 | 0.95 | 1.48 | (0.53 | ) | 12.33 | 13.24 | 24,742 | 0.63 | 0.63 | 0.58 | 4.45 | 18 | ||||||||||||||||||||||||||||||||||||||
Year ended 08/31/11 | 11.79 | 0.55 | (0.41 | ) | 0.14 | (0.55 | ) | 11.38 | 1.40 | 24,195 | 0.65 | 0.65 | 0.60 | 4.91 | 25 | |||||||||||||||||||||||||||||||||||||
| (a) | Calculated using average shares outstanding. |
| (b) | Includes adjustments in accordance with accounting principles generally accepted in the United States of America and as such, the net asset value for financial reporting purposes and the returns based upon those net asset values may differ from the net asset value and returns for shareholder transactions. Does not include sales charges and is not annualized for periods less than one year, if applicable. |
| (c) | For the year ended August 31, 2011, ratio does not exclude facilities and maintenance fees. |
| (d) | Portfolio turnover is calculated at the fund level and is not annualized for periods less than one year, if applicable. For the period ended August 31, 2011, the portfolio turnover calculation excludes the value of securities purchased of $139,542,348 and sold of $13,399,363 in the effort to realign the Fund’s portfolio holdings after the reorganization of Invesco Van Kampen California Insured Tax Free Income Fund into the Fund. |
| (e) | Ratios are based on average daily net assets (000’s omitted) of $304,130, $15,739, $25,333 and $23,863, for Class A, Class B, Class C, and Class Y shares, respectively. |
| (f) | The total return, ratio of expenses to average net assets and ratio of net investment income to average net assets reflect actual 12b-1 fees of 0.22%, 0.24%, 0.27%, 0.25% and 0.25% for the years ended August 31, 2015, 2014, 2013, 2012 and 2011, respectively. |
| (g) | The total return, ratio of expenses to average net assets and ratio of net investment income to average net assets reflect actual 12b-1 fees of 0.74%. |
25 Invesco California Tax-Free Income Fund
Report of Independent Registered Public Accounting Firm
To the Board of Trustees of AIM Counselor Series Trust (Invesco Counselor Series Trust)
and Shareholders of Invesco California Tax-Free Income Fund:
In our opinion, the accompanying statement of assets and liabilities, including the schedule of investments, and the related statements of operations and of changes in net assets and the financial highlights present fairly, in all material respects, the financial position of Invesco California Tax-Free Income Fund (one of the funds constituting AIM Counselor Series Trust (Invesco Counselor Series Trust), hereafter referred to as the “Fund”) at August 31, 2015, the results of its operations for the year then ended, the changes in its net assets for each of the two years in the period then ended and the financial highlights for each of the five years in the period then ended, in conformity with accounting principles generally accepted in the United States of America. These financial statements and financial highlights (hereafter referred to as “financial statements”) are the responsibility of the Fund’s management. Our responsibility is to express an opinion on these financial statements based on our audits. We conducted our audits of these financial statements in accordance with the standards of the Public Company Accounting Oversight Board (United States). Those standards require that we plan and perform the audit to obtain reasonable assurance about whether the financial statements are free of material misstatement. An audit includes examining, on a test basis, evidence supporting the amounts and disclosures in the financial statements, assessing the accounting principles used and significant estimates made by management, and evaluating the overall financial statement presentation. We believe that our audits, which included confirmation of securities at August 31, 2015 by correspondence with the custodian and brokers, and the application of alternative auditing procedures where confirmations of security purchases have not been received, provide a reasonable basis for our opinion.
PRICEWATERHOUSECOOPERS LLP
October 27, 2015
Houston, Texas
26 Invesco California Tax-Free Income Fund
Calculating your ongoing Fund expenses
Example
As a shareholder of the Fund, you incur two types of costs: (1) transaction costs, which may include sales charges (loads) on purchase payments or contingent deferred sales charges on redemptions, if any; and (2) ongoing costs, including management fees, distribution and/or service (12b-1) fees, and other Fund expenses. This example is intended to help you understand your ongoing costs (in dollars) of investing in the Fund and to compare these costs with ongoing costs of investing in other mutual funds. The example is based on an investment of $1,000 invested at the beginning of the period and held for the entire period March 1, 2015 through August 31, 2015.
Actual expenses
The table below provides information about actual account values and actual expenses. You may use the information in this table, together with the amount you invested, to estimate the expenses that you paid over the period. Simply divide your account value by $1,000 (for example, an $8,600 account value divided by $1,000 = 8.6), then multiply the result by the number in the table under the heading entitled “Actual Expenses Paid During Period” to estimate the expenses you paid on your account during this period.
Hypothetical example for comparison purposes
The table below also provides information about hypothetical account values and hypothetical expenses based on the Fund’s actual expense ratio and an assumed rate of return of 5% per year before expenses, which is not the Fund’s actual return.
The hypothetical account values and expenses may not be used to estimate the actual ending account balance or expenses you paid for the period. You may use this information to compare the ongoing costs of investing in the Fund and other funds. To do so, compare this 5% hypothetical example with the 5% hypothetical examples that appear in the shareholder reports of the other funds.
Please note that the expenses shown in the table are meant to highlight your ongoing costs only and do not reflect any transaction costs, such as sales charges (loads) on purchase payments or contingent deferred sales charges on redemptions, if any. Therefore, the hypothetical information is useful in comparing ongoing costs only, and will not help you determine the relative total costs of owning different funds. In addition, if these transaction costs were included, your costs would have been higher.
| Class | Beginning Account Value (03/01/15) | ACTUAL | HYPOTHETICAL (5% annual return before | Annualized | ||||||||||||||||||||
| Ending Account Value (08/31/15)1 | Expenses Paid During Period2 | Ending Account Value (08/31/15) | Expenses Paid During Period2 | |||||||||||||||||||||
A | $ | 1,000.00 | $ | 1,004.30 | $ | 4.65 | $ | 1,020.57 | $ | 4.69 | 0.92 | % | ||||||||||||
B | 1,000.00 | 1,004.60 | 4.50 | 1,020.72 | 4.53 | 0.89 | ||||||||||||||||||
C | 1,000.00 | 1,001.00 | 7.16 | 1,018.05 | 7.22 | 1.42 | ||||||||||||||||||
Y | 1,000.00 | 1,004.80 | 3.39 | 1,021.83 | 3.41 | 0.67 | ||||||||||||||||||
| 1 | The actual ending account value is based on the actual total return of the Fund for the period March 1, 2015 through August 31, 2015, after actual expenses and will differ from the hypothetical ending account value which is based on the Fund’s expense ratio and a hypothetical annual return of 5% before expenses. |
| 2 | Expenses are equal to the Fund’s annualized expense ratio as indicated above multiplied by the average account value over the period, multiplied by 184/365 to reflect the most recent fiscal half year. |
27 Invesco California Tax-Free Income Fund
Approval of Investment Advisory and Sub-Advisory Contracts
The Board of Trustees (the Board) of AIM Counselor Series Trust (Invesco Counselor Series Trust) is required under the Investment Company Act of 1940, as amended, to approve annually the renewal of Invesco California Tax-Free Income Fund’s (the Fund) investment advisory agreements. During contract renewal meetings held on June 9-10, 2015, the Board as a whole, and the disinterested or “independent” Trustees, who comprise over 75% of the Board, voting separately, approved the continuance for the Fund of the Master Investment Advisory Agreement with Invesco Advisers, Inc. (Invesco Advisers and the investment advisory agreement) and the Master Intergroup Sub-Advisory Contract for Mutual Funds with Invesco Asset Management Deutschland GmbH, Invesco Asset Management Limited, Invesco Asset Management (Japan) Limited, Invesco Hong Kong Limited, Invesco Senior Secured Management, Inc. and Invesco Canada Ltd. (collectively, the Affiliated Sub-Advisers and the sub-advisory contracts) for another year, effective July 1, 2015.
In evaluating the fairness and reasonableness of compensation under the Fund’s investment advisory agreement and sub-advisory contracts, the Board considered, among other things, the factors discussed below. The Board determined that continuation of the Fund’s investment advisory agreement and the sub-advisory contracts is in the best interest of the Fund and its shareholders and that the compensation payable to Invesco Advisers and the Affiliated Sub-Advisers under the agreements is fair and reasonable.
The Board’s Fund Evaluation Process
The Board’s Investments Committee has established three Sub-Committees, each of which is primarily responsible for overseeing the performance and investment management services provided by Invesco Advisers and the Affiliated Sub-Advisers to a number of the funds advised by Invesco Advisers (the Invesco Funds). The Sub-Committees meet throughout the year to review the performance of their assigned Invesco Funds, including reviewing materials prepared under the direction of the independent Senior Officer, an officer of the Invesco Funds who reports directly to the independent Trustees. Over the course of each year, the Sub-Committees meet with portfolio managers for their assigned Invesco Funds and other members of management to review the performance, investment objective(s), policies, strategies, limitations and investment risks of these funds. The Board had the benefit of reports from the Sub-Committees and Investments Committee throughout the year in considering approval of the continuance of each Invesco Fund’s investment advisory agreement and sub-advisory contracts for another year.
During the contract renewal process, the Board receives comparative performance and fee data regarding the Invesco Funds prepared by Invesco Advisers and Lipper Inc. (Lipper), an independent provider of investment company data. The Board also receives a report and this independent written evaluation from the Senior Officer. The Senior Officer’s evaluation is prepared as part of his responsibility to manage the process by which the Invesco Funds’ proposed management fees are negotiated during the annual contract renewal process to ensure they are negotiated in a manner that is at arms’ length and reasonable. In addition to meetings with Invesco Advisers and fund counsel, the independent Trustees also discuss the continuance of the investment advisory agreement and sub-advisory contracts in separate sessions with the Senior Officer and with independent legal counsel.
The Trustees recognized that the advisory fee rates for the Invesco Funds are, in many cases, the result of years of review and negotiation. The Trustees’ deliberations and conclusions in a particular year may be based in part on their deliberations and conclusions regarding these arrangements throughout the year and in prior years. The Trustees’ review and conclusions are based on the comprehensive consideration of all information presented to them and are not the result of any single determinative factor. Moreover, one Trustee may have weighed a particular piece of information or factor differently than another Trustee.
The discussion below is a summary of the Senior Officer’s independent written evaluation with respect to the Fund’s investment advisory agreement as well as a discussion of the material factors and related conclusions that formed the basis for the Board’s approval of the Fund’s investment advisory agreement and sub-advisory contracts. Unless otherwise stated, this information is current as of June 10, 2015, and does not reflect consideration of factors that became known to the Board after that date.
Factors and Conclusions and Summary of Independent Written Fee Evaluation
| A. | Nature, Extent and Quality of Services Provided by Invesco Advisers and the Affiliated Sub-Advisers |
The Board reviewed the advisory services provided to the Fund by Invesco Advisers under the Fund’s investment advisory agreement, the performance of Invesco Advisers in providing these services, and the credentials and experience of the officers and employees of Invesco Advisers who provide these services, including the Fund’s portfolio manager or managers. The Board’s review of the qualifications of Invesco Advisers to provide advisory services included the Board’s consideration of Invesco Advisers’ investment
process oversight, independent credit analysis and investment risk management. The Board also considered non-advisory services that Invesco Advisers and its affiliates provide to the Invesco Funds such as various back office support functions, equity and fixed income trading operations, internal audit, distribution, valuation and legal and compliance.
In determining whether to continue the Fund’s investment advisory agreement, the Board considered the benefits of reapproving an existing relationship and the greater uncertainty that may be associated with entering into a new relationship. The Board concluded that the nature, extent and quality of the services provided to the Fund by Invesco Advisers are appropriate and satisfactory and consistent with the terms of the Fund’s investment advisory agreement.
The Board reviewed the services that may be provided by the Affiliated Sub-Advisers under the sub-advisory contracts and the credentials and experience of the officers and employees of the Affiliated Sub-Advisers who provide these services. The Board concluded that the sub-advisory contracts benefit the Fund and its shareholders by permitting Invesco Advisers to use the resources and talents of the Affiliated Sub-Advisers in managing the Fund. The Board concluded that the nature, extent and quality of the services that may be provided by the Affiliated Sub-Advisers are appropriate and satisfactory and consistent with the terms of the Fund’s sub-advisory contracts.
| B. | Fund Performance |
The Board considered Fund performance as a relevant factor in considering whether to approve the investment advisory agreement. The Board did not view Fund performance as a relevant factor in considering whether to approve the sub-advisory contracts for the Fund, as no Affiliated Sub-Adviser currently manages assets of the Fund.
The Board compared the Fund’s performance during the past one, three and five calendar years to the performance of funds in the Lipper performance universe and against the Lipper California Municipal Debt Funds Index. The Board noted that performance of Class A shares of the Fund was in the second quintile of its performance universe for the one and five year periods and the third quintile for the three year period (the first quintile being the best performing funds and the fifth quintile being the worst performing funds). The Board noted that performance of Class A shares of the Fund was below the performance of the Index for the one, three and five year periods. The Trustees also reviewed more recent Fund performance and this review did not change their conclusions.
| C. | Advisory and Sub-Advisory Fees |
The Board compared the Fund’s contractual management fee rate to the contractual
28 Invesco California Tax-Free Income Fund
management fee rates of funds in the Fund’s Lipper expense group at a common asset level. The Board noted that the contractual management fee rate for Class A shares of the Fund was below the median contractual management fee rate of funds in its expense group. The Board noted that the term “contractual management fee” may include both advisory and certain administrative services fees, but that Lipper does not provide information on a fund by fund basis as to what is included. The Board noted that Invesco Advisers does not charge the Invesco Funds for the administrative services included in the term as defined by Lipper. The Board also reviewed the methodology used by Lipper in providing expense group information, which includes using each fund’s contractual management fee schedule (including any applicable breakpoints) as reported in the most recent prospectus or statement of additional information for each fund in the expense group.
The Board also compared the Fund’s effective advisory fee rate (the advisory fee rate after advisory fee waivers and before other expense limitations/waivers) to the effective advisory fee rates of other mutual funds advised by Invesco Advisers and its affiliates with investment strategies comparable to those of the Fund. The Board noted that the Fund’s rate was below the rate of one such mutual fund. The Board noted that Invesco Advisers and the Affiliated Sub-Advisers do not manage other client accounts with investment strategies comparable to those of the Fund.
The Board also considered the services that may be provided by the Affiliated Sub-Advisers pursuant to the sub-advisory contracts, as well as the fees payable by Invesco Advisers to Affiliated Sub-Advisers pursuant to the sub-advisory contracts. The Board also noted that the sub-advisory fees are not paid directly by the Fund, but rather, are payable by Invesco Advisers to the Affiliated Sub-Advisers.
| D. | Economies of Scale and Breakpoints |
The Board considered the extent to which there are economies of scale in the provision of advisory services to the Fund. The Board also considered whether the Fund benefits from economies of scale through contractual breakpoints in the Fund’s advisory fee schedule. The Board also noted that the Fund shares directly in economies of scale through lower fees charged by third party service providers based on the combined size of the Invesco Funds and other clients advised by Invesco Advisers.
| E. | Profitability and Financial Resources |
The Board reviewed information from Invesco Advisers concerning the costs of the advisory and other services that Invesco Advisers and its affiliates provide to the Fund and the Invesco Funds and the profitability of Invesco Advisers and its affiliates in providing these services. The Board received information from Invesco Advisers about the methodology used to prepare the profitability information. The Board noted that Invesco Advisers continues to
operate at a net profit from services Invesco Advisers and its affiliates provide to the Invesco Funds and the Fund. The Board did not deem the level of profits realized by Invesco Advisers and its affiliates from providing services to the Fund to be excessive given the nature, quality and extent of the services provided. The Board received and accepted information from Invesco Advisers demonstrating that Invesco Advisers and each Affiliated Sub-Adviser are financially sound and have the resources necessary to perform their obligations under the investment advisory agreement and sub-advisory contracts.
| F. | Collateral Benefits to Invesco Advisers and its Affiliates |
The Board considered various other benefits received by Invesco Advisers and its affiliates from the relationship with the Fund, including the fees received for providing transfer agency and distribution services to the Fund. The Board considered comparative information regarding fees charged for these services, including information provided by Lipper and other independent sources. The Board considered the performance of Invesco Advisers and its affiliates in providing these services and the organizational structure employed to provide these services. The Board also considered that these services are provided to the Fund pursuant to written contracts that are reviewed and approved on an annual basis by the Board; and that the services are required for the operation of the Fund.
The Board considered the benefits realized by Invesco Advisers and the Affiliated Sub-Advisers as a result of portfolio brokerage transactions executed through “soft dollar” arrangements. Invesco Advisers noted that the Fund does not execute brokerage transactions through “soft dollar” arrangements to any significant degree.
The Board considered that the Fund’s uninvested cash and cash collateral from any securities lending arrangements may be invested in money market funds advised by Invesco Advisers pursuant to procedures approved by the Board. The Board noted that Invesco Advisers receives advisory fees from these affiliated money market funds attributable to such investments, although Invesco Advisers has contractually agreed to waive through varying periods the advisory fees payable by the Invesco Funds with respect to investments in the affiliated money market funds. The waiver is in an amount equal to 100% of the net advisory fee Invesco Advisers receives from the affiliated money market funds with respect to the Fund’s investment in the affiliated money market funds of uninvested cash, but not cash collateral. The Board concluded that the amount of advisory fees received by Invesco Advisors from the Fund’s investment of cash collateral from any securities lending arrangements in the affiliated money market funds is fair and reasonable.
29 Invesco California Tax-Free Income Fund
Tax Information
Form 1099-DIV, Form 1042-S and other year–end tax information provide shareholders with actual calendar year amounts that should be included in their tax returns. Shareholders should consult their tax advisors.
The following distribution information is being provided as required by the Internal Revenue Code or to meet a specific state’s requirement.
The Fund designates the following amounts or, if subsequently determined to be different, the maximum amount allowable for its fiscal year ended August 31, 2015:
Federal and State Income Tax | ||||
Qualified Dividend Income* | 0.00 | % | ||
Corporate Dividends Received Deduction* | 0.00 | % | ||
Tax-Exempt Interest Dividends* | 100.00 | % | ||
U.S. Treasury Obligations* | 0.00 | % | ||
| * | The above percentages are based on ordinary income dividends paid to shareholders during the Fund’s fiscal year. |
30 Invesco California Tax-Free Income Fund
Trustees and Officers
The address of each trustee and officer is AIM Counselor Series Trust (Invesco Counselor Series Trust) (the “Trust”), 11 Greenway Plaza, Suite 1000, Houston, Texas 77046-1173. The trustees serve for the life of the Trust, subject to their earlier death, incapacitation, resignation, retirement or removal as more specifically provided in the Trust’s organizational documents. Each officer serves for a one year term or until their successors are elected and qualified. Column two below includes length of time served with predecessor entities, if any.
| Name, Year of Birth and Position(s) Held with the Trust | Trustee and/ or Officer Since | Principal Occupation(s) During Past 5 Years | Number of Funds in Fund Complex Overseen by Trustee | Other Directorship(s) Held by Trustee During Past 5 Years | ||||
| Interested Persons | ||||||||
| Martin L. Flanagan1 — 1960 Trustee | 2007 | Executive Director, Chief Executive Officer and President, Invesco Ltd. (ultimate parent of Invesco and a global investment management firm); Advisor to the Board, Invesco Advisers, Inc. (formerly known as Invesco Institutional (N.A.), Inc.); Trustee, The Invesco Funds; Vice Chair, Investment Company Institute; and Member of Executive Board, SMU Cox School of Business
Formerly: Chairman and Chief Executive Officer, Invesco Advisers, Inc. (registered investment adviser); Director, Chairman, Chief Executive Officer and President, IVZ Inc. (holding company), INVESCO Group Services, Inc. (service provider) and Invesco North American Holdings, Inc. (holding company); Director, Chief Executive Officer and President, Invesco Holding Company Limited (parent of Invesco and a global investment management firm); Director, Invesco Ltd.; Chairman, Investment Company Institute and President, Co-Chief Executive Officer, Co-President, Chief Operating Officer and Chief Financial Officer, Franklin Resources, Inc. (global investment management organization). | 144 | None | ||||
| Philip A. Taylor2 — 1954 Trustee, President and Principal Executive Officer | 2006 | Head of North American Retail and Senior Managing Director, Invesco Ltd.; Director, Co-Chairman, Co-President and Co-Chief Executive Officer, Invesco Advisers, Inc. (formerly known as Invesco Institutional (N.A.), Inc.) (registered investment adviser); Director, Chairman, Chief Executive Officer and President, Invesco Management Group, Inc. (formerly known as Invesco Aim Management Group, Inc.) (financial services holding company); Director and President, INVESCO Funds Group, Inc. (registered investment adviser and registered transfer agent); Director and Chairman, Invesco Investment Services, Inc. (formerly known as Invesco Aim Investment Services, Inc.) (registered transfer agent) and IVZ Distributors, Inc. (formerly known as INVESCO Distributors, Inc.) (registered broker dealer); Director, President and Chairman, Invesco Inc. (holding company), Invesco Canada Holdings Inc. (holding company), Trimark Investments Ltd./Placements Trimark Ltèe and Invesco Financial Services Ltd/Services Financiers Invesco Ltèe; Chief Executive Officer, Invesco Corporate Class Inc. (corporate mutual fund company) Director, Chairman and Chief Executive Officer, Invesco Canada Ltd. (formerly known as Invesco Trimark Ltd./Invesco Trimark Ltèe) (registered investment adviser and registered transfer agent); Trustee, President and Principal Executive Officer, The Invesco Funds (other than AIM Treasurer’s Series Trust (Invesco Treasurer’s Series Trust), Short-Term Investments Trust and Invesco Management Trust); Trustee and Executive Vice President, The Invesco Funds (AIM Treasurer’s Series Trust (Invesco Treasurer’s Series Trust), Short-Term Investments Trust and Invesco Management Trust only); Director, Invesco Investment Advisers LLC (formerly known as Van Kampen Asset Management); Director, Chief Executive Officer and President, Van Kampen Exchange Corp.
Formerly: Chief Executive Officer, Invesco Canada Fund Inc (corporate mutual fund company); Director and Chairman, Van Kampen Investor Services Inc.; Director, Chief Executive Officer and President, 1371 Preferred Inc. (holding company) and Van Kampen Investments Inc.; Director and President, AIM GP Canada Inc. (general partner for limited partnerships) and Van Kampen Advisors, Inc.; Director and Chief Executive Officer, Invesco Trimark Dealer Inc. (registered broker dealer); Director, Invesco Distributors, Inc. (formerly known as Invesco Aim Distributors, Inc.) (registered broker dealer); Manager, Invesco PowerShares Capital Management LLC; Director, Chief Executive Officer and President, Invesco Advisers, Inc.; Director, Chairman, Chief Executive Officer and President, Invesco Aim Capital Management, Inc.; President, Invesco Trimark Dealer Inc. and Invesco Trimark Ltd./Invesco Trimark Ltèe; Director and President, AIM Trimark Corporate Class Inc. and AIM Trimark Canada Fund Inc.; Senior Managing Director, Invesco Holding Company Limited; Director and Chairman, Fund Management Company (former registered broker dealer); President and Principal Executive Officer, The Invesco Funds (AIM Treasurer’s Series Trust (Invesco Treasurer’s Series Trust), and Short-Term Investments Trust only); President, AIM Trimark Global Fund Inc. and AIM Trimark Canada Fund Inc.. | 144 | None |
| 1 | Mr. Flanagan is considered an interested person (within the meaning of Section 2(a)(19) of the 1940 Act) of the Trust because he is an officer of the Adviser to the Trust, and an officer and a director of Invesco Ltd., ultimate parent of the Adviser. |
| 2 | Mr. Taylor is considered an interested person (within the meaning of Section 2(a)(19) of the 1940 Act) of the Trust because he is an officer and a director of the Adviser. |
T-1 Invesco California Tax-Free Income Fund
Trustees and Officers—(continued)
| Name, Year of Birth and Position(s) Held with the Trust | Trustee and/ or Officer Since | Principal Occupation(s) During Past 5 Years | Number of Funds in Fund Complex Overseen by Trustee | Other Directorship(s) Held by Trustee During Past 5 Years | ||||
| Independent Trustees | ||||||||
Bruce L. Crockett — 1944 Trustee and Chair | 2003 | Chairman, Crockett Technologies Associates (technology consulting company)
Formerly: Director, Captaris (unified messaging provider); Director, President and Chief Executive Officer, COMSAT Corporation; Chairman, Board of Governors of INTELSAT (international communications company); ACE Limited (insurance company); Independent Directors Council and Investment Company Institute | 144 | ALPS (Attorneys Liability Protection Society) (insurance company) and Globe Specialty Metals, Inc. (metallurgical company) | ||||
David C. Arch — 1945 Trustee | 2010 | Chairman of Blistex Inc., a consumer health care products manufacturer | 144 | Board member of the Illinois Manufacturers’ Association; Member of the Board of Visitors, Institute for the Humanities, University of Michigan; Member of the Audit Committee of the Edward-Elmhurst Hospital | ||||
James T. Bunch — 1942 Trustee | 2000 | Managing Member, Grumman Hill Group LLC (family office/private equity investments)
Formerly: Founder, Green Manning & Bunch Ltd. (investment banking firm) (1988-2010); Executive Committee, United States Golf Association; and Chairman, Board of Governors, Western Golf Association | 144 | Chairman of the Board of Trustees, Evans Scholars Foundation; and Chairman of the Board, Denver Film Society | ||||
Rodney F. Dammeyer — 1940 Trustee | 2010 | Chairman of CAC, LLC, (private company offering capital investment and management advisory services)
Formerly: Prior to 2001, Managing Partner at Equity Group Corporate Investments; Prior to 1995, Chief Executive Officer of Itel Corporation (formerly Anixter International); Prior to 1985, experience includes Senior Vice President and Chief Financial Officer of Household International, Inc., Executive Vice President and Chief Financial Officer of Northwest Industries, Inc. and Partner of Arthur Andersen & Co.; From 1987 to 2010, Director/Trustee of investment companies in the Van Kampen Funds complex | 144 | Director of Quidel Corporation and Stericycle, Inc. | ||||
Albert R. Dowden — 1941 Trustee | 2003 | Director of a number of public and private business corporations, including the Boss Group, Ltd. (private investment and management); Nature’s Sunshine Products, Inc. and Reich & Tang Funds (5 portfolios) (registered investment company)
Formerly: Director, Homeowners of America Holding Corporation/Homeowners of America Insurance Company (property casualty company); Director, Continental Energy Services, LLC (oil and gas pipeline service); Director, CompuDyne Corporation (provider of product and services to the public security market) and Director, Annuity and Life Re (Holdings), Ltd. (reinsurance company); Director, President and Chief Executive Officer, Volvo Group North America, Inc.; Senior Vice President, AB Volvo; Director of various public and private corporations; Chairman, DHJ Media, Inc.; Director, Magellan Insurance Company; and Director, The Hertz Corporation, Genmar Corporation (boat manufacturer), National Media Corporation; Advisory Board of Rotary Power International (designer, manufacturer, and seller of rotary power engines); and Chairman, Cortland Trust, Inc. (registered investment company) | 144 | Director of: Nature’s Sunshine Products, Inc., Reich & Tang Funds, Homeowners of America Holding Corporation/ Homeowners of America Insurance Company, the Boss Group | ||||
Jack M. Fields — 1952 Trustee | 2003 | Chief Executive Officer, Twenty First Century Group, Inc. (government affairs company); Owner and Chief Executive Officer, Dos Angeles Ranch, L.P. (cattle, hunting, corporate entertainment); and Discovery Global Education Fund (non-profit)
Formerly: Chief Executive Officer, Texana Timber LP (sustainable forestry company); Director of Cross Timbers Quail Research Ranch (non-profit); and member of the U.S. House of Representatives | 144 | Insperity, Inc. (formerly known as Administaff) | ||||
Prema Mathai-Davis — 1950 Trustee | 2003 | Retired. Formerly: Chief Executive Officer, YWCA of the U.S.A. | 144 | None | ||||
Larry Soll — 1942 Trustee | 1997 | Retired. Formerly: Chairman, Chief Executive Officer and President, Synergen Corp. (a biotechnology company) | 144 | None | ||||
Hugo F. Sonnenschein — 1940 Trustee | 2010 | President Emeritus and Honorary Trustee of the University of Chicago and the Adam Smith Distinguished Service Professor in the Department of Economics at the University of Chicago. Prior to 2000, President of the University of Chicago | 144 | Trustee of the University of Rochester and a member of its investment committee; Member of the National Academy of Sciences and the American Philosophical Society; Fellow of the American Academy of Arts and Sciences | ||||
| Raymond Stickel, Jr. — 1944 Trustee | 2005 | Retired. Formerly: Director, Mainstay VP Series Funds, Inc. (25 portfolios) and Partner, Deloitte & Touche | 144 | None |
T-2 Invesco California Tax-Free Income Fund
Trustees and Officers—(continued)
| Name, Year of Birth and Position(s) Held with the Trust | Trustee and/ or Officer Since | Principal Occupation(s) During Past 5 Years | Number of Funds in Fund Complex Overseen by Trustee | Other Directorship(s) Held by Trustee During Past 5 Years | ||||
| Independent Trustees—(continued) | ||||||||
Suzanne H. Woolsey — 1941 Trustee | 2014 | Chief Executive Officer of Woolsey Partners LLC | 144 | Emeritus Chair of the Board of Trustees of the Institute for Defense Analyses; Trustee of Colorado College; Trustee of California Institute of Technology; Prior to 2014, Director of Fluor Corp.; Prior to 2010, Trustee of the German Marshall Fund of the United States; Prior to 2010 Trustee of the Rocky Mountain Institute | ||||
| Other Officers | ||||||||
Russell C. Burk — 1958 Senior Vice President and Senior Officer | 2005 | Senior Vice President and Senior Officer, The Invesco Funds | N/A | N/A | ||||
John M. Zerr — 1962 Senior Vice President, Chief Legal Officer and Secretary | 2006 | Director, Senior Vice President, Secretary and General Counsel, Invesco Management Group, Inc. (formerly known as Invesco Aim Management Group, Inc.) and Van Kampen Exchange Corp.; Senior Vice President, Invesco Advisers, Inc. (formerly known as Invesco Institutional (N.A.), Inc.) (registered investment adviser); Senior Vice President and Secretary, Invesco Distributors, Inc. (formerly known as Invesco Aim Distributors, Inc.); Director, Vice President and Secretary, Invesco Investment Services, Inc. (formerly known as Invesco Aim Investment Services, Inc.) and IVZ Distributors, Inc. (formerly known as INVESCO Distributors, Inc.); Director and Vice President, INVESCO Funds Group, Inc.; Senior Vice President, Chief Legal Officer and Secretary, The Invesco Funds; Managing Director, Invesco PowerShares Capital Management LLC; Director, Secretary and General Counsel, Invesco Investment Advisers LLC (formerly known as Van Kampen Asset Management); Secretary and General Counsel, Invesco Capital Markets, Inc. (formerly known as Van Kampen Funds Inc.) and Chief Legal Officer, PowerShares Exchange-Traded Fund Trust, PowerShares Exchange-Traded Fund Trust II, PowerShares India Exchange-Traded Fund Trust, PowerShares Actively Managed Exchange-Traded Fund Trust, and PowerShares Actively Managed Exchange-Traded Commodity Fund Trust
Formerly: Director and Vice President, Van Kampen Advisors Inc.; Director, Vice President, Secretary and General Counsel, Van Kampen Investor Services Inc.; Director, Invesco Distributors, Inc. (formerly known as Invesco Aim Distributors, Inc.); Director, Senior Vice President, General Counsel and Secretary, Invesco Aim Advisers, Inc. and Van Kampen Investments Inc.; Director, Vice President and Secretary, Fund Management Company; Director, Senior Vice President, Secretary, General Counsel and Vice President, Invesco Aim Capital Management, Inc.; Chief Operating Officer and General Counsel, Liberty Ridge Capital, Inc. (an investment adviser); Vice President and Secretary, PBHG Funds (an investment company) and PBHG Insurance Series Fund (an investment company); Chief Operating Officer, General Counsel and Secretary, Old Mutual Investment Partners (a broker-dealer); General Counsel and Secretary, Old Mutual Fund Services (an administrator) and Old Mutual Shareholder Services (a shareholder servicing center); Executive Vice President, General Counsel and Secretary, Old Mutual Capital, Inc. (an investment adviser); and Vice President and Secretary, Old Mutual Advisors Funds (an investment company) | N/A | N/A | ||||
| Sheri Morris — 1964 Vice President, Treasurer and Principal Financial Officer | 2003 | Vice President, Treasurer and Principal Financial Officer, The Invesco Funds; Vice President, Invesco Advisers, Inc. (formerly known as Invesco Institutional (N.A.), Inc.) (registered investment adviser); and Vice President, PowerShares Exchange-Traded Fund Trust, PowerShares Exchange-Traded Fund Trust II, PowerShares India Exchange-Traded Fund Trust, PowerShares Actively Managed Exchange-Traded Fund Trust, and PowerShares Actively Managed Exchange-Traded Commodity Fund Trust
Formerly: Vice President, Invesco Aim Advisers, Inc., Invesco Aim Capital Management, Inc. and Invesco Aim Private Asset Management, Inc.; Assistant Vice President and Assistant Treasurer, The Invesco Funds and Assistant Vice President, Invesco Advisers, Inc., Invesco Aim Capital Management, Inc. and Invesco Aim Private Asset Management, Inc.; and Treasurer, PowerShares Exchange-Traded Fund Trust, PowerShares Exchange-Traded Fund Trust II, PowerShares India Exchange-Traded Fund Trust and PowerShares Actively Managed Exchange-Traded Fund Trust | N/A | N/A | ||||
T-3 Invesco California Tax-Free Income Fund
Trustees and Officers—(continued)
| Name, Year of Birth and Position(s) Held with the Trust | Trustee and/ or Officer Since | Principal Occupation(s) During Past 5 Years | Number of Funds in Fund Complex Overseen by Trustee | Other Directorship(s) Held by Trustee During Past 5 Years | ||||
| Other Officers—(continued) | ||||||||
| Karen Dunn Kelley — 1960 Vice President | 2003 | Senior Managing Director, Investments, Invesco Ltd.; Director, Co-President, Co-Chief Executive Officer, and Co-Chairman, Invesco Advisers, Inc. (formerly known as Invesco Institutional (N.A.), Inc.) (registered investment adviser); Chairman, Invesco Senior Secured Management, Inc.; Senior Vice President, Invesco Management Group, Inc. (formerly known as Invesco Aim Management Group, Inc.); Executive Vice President, Invesco Distributors, Inc. (formerly known as Invesco Aim Distributors, Inc.); Director, Invesco Mortgage Capital Inc. and Invesco Management Company Limited; Vice President, The Invesco Funds (other than AIM Treasurer’s Series Trust (Invesco Treasurer’s Series Trust), Short-Term Investments Trust and Invesco Management Trust); and President and Principal Executive Officer, The Invesco Funds (AIM Treasurer’s Series Trust (Invesco Treasurer’s Series Trust), Short-Term Investments Trust and Invesco Management Trust only)
Formerly: Director and President, INVESCO Asset Management (Bermuda) Ltd., Director, INVESCO Global Asset Management Limited and INVESCO Management S.A.; Senior Vice President, Van Kampen Investments Inc. and Invesco Advisers, Inc. (formerly known as Invesco Institutional (N.A.), Inc.) (registered investment adviser); Vice President, Invesco Advisers, Inc. (formerly known as Invesco Institutional (N.A.), Inc.); Director of Cash Management and Senior Vice President, Invesco Advisers, Inc. and Invesco Aim Capital Management, Inc.; Director and President, Fund Management Company; Chief Cash Management Officer, Director of Cash Management, Senior Vice President, and Managing Director, Invesco Aim Capital Management, Inc.; Director of Cash Management, Senior Vice President, and Vice President, Invesco Advisers, Inc. and The Invesco Funds (AIM Treasurer’s Series Trust (Invesco Treasurer’s Series Trust), and Short-Term Investments Trust only) | N/A | N/A | ||||
| Crissie M. Wisdom — 1969 Anti-Money Laundering Compliance Officer | 2013 | Anti-Money Laundering Compliance Officer, Invesco Advisers, Inc. (formerly known as Invesco Institutional (N.A.), Inc.) (registered investment adviser), Invesco Capital Markets, Inc. (formerly known as Van Kampen Funds Inc.), Invesco Distributors, Inc., Invesco Investment Services, Inc., Invesco Management Group, Inc., Van Kampen Exchange Corp., The Invesco Funds, and PowerShares Exchange-Traded Fund Trust, PowerShares Exchange-Traded Fund Trust II, PowerShares India Exchange-Traded Fund Trust, PowerShares Actively Managed Exchange-Traded Fund Trust and PowerShares Actively Managed Exchange-Traded Commodity Fund Trust; Anti-Money Laundering Compliance Officer and Bank Secrecy Act Officer, INVESCO National Trust Company and Invesco Trust Company; and Fraud Prevention Manager and Controls and Risk Analysis Manager for Invesco Investment Services, Inc.. | N/A | N/A | ||||
Lisa O. Brinkley — 1959 Chief Compliance Officer | 2004 | Senior Vice President and Chief Compliance Officer, Invesco Advisers, Inc. (registered investment adviser) (formerly known as Invesco Institutional (N.A., Inc.); and Chief Compliance Officer, The Invesco Funds
Formerly: Global Assurance Officer, Invesco Ltd. and Vice President, The Invesco Funds; Chief Compliance Officer, Invesco Distributors, Inc. (formerly known as Invesco Aim Distributors, Inc.), Invesco Investment Services, Inc.(formerly known as Invesco Aim Investment Services, Inc.) and Van Kampen Investor Services Inc.; Senior Vice President, Invesco Management Group, Inc.; Senior Vice President and Chief Compliance Officer, Invesco Advisers, Inc. and The Invesco Funds; Vice President and Chief Compliance Officer, Invesco Aim Capital Management, Inc. and Invesco Distributors, Inc.; Vice President, Invesco Investment Services, Inc. and Fund Management Company. | N/A | N/A |
The Statement of Additional Information of the Trust includes additional information about the Fund’s Trustees and is available upon request, without charge, by calling 1.800.959.4246. Please refer to the Fund’s prospectus for information on the Fund’s sub-advisers.
Office of the Fund 11 Greenway Plaza, Suite 1000 Houston, TX 77046-1173 | Investment Adviser Invesco Advisers, Inc. 1555 Peachtree Street, N.E. Atlanta, GA 30309 | Distributor Invesco Distributors, Inc. 11 Greenway Plaza, Suite 1000 Houston, TX 77046-1173 | Auditors PricewaterhouseCoopers LLP 1000 Louisiana Street, Suite 5800 Houston, TX 77002-5678 | |||
Counsel to the Fund Stradley Ronon Stevens & Young, LLP 2005 Market Street, Suite 2600 Philadelphia, PA 19103-7018 | Counsel to the Independent Trustees Goodwin Procter LLP 901 New York Avenue, N.W. Washington, D.C. 20001 | Transfer Agent Invesco Investment Services, Inc. 11 Greenway Plaza, Suite 1000 Houston, TX 77046-1173 | Custodian State Street Bank and Trust Company 225 Franklin Street Boston, MA 02110-2801 | |||
T-4 Invesco California Tax-Free Income Fund

Invesco mailing information
Send general correspondence to Invesco Investment Services, Inc., P.O. Box 219078, Kansas City, MO 64121-9078.
Important notice regarding delivery of security holder documents
To reduce Fund expenses, only one copy of most shareholder documents may be mailed to shareholders with multiple accounts at the same address (Householding). Mailing of your shareholder documents may be householded indefinitely unless you instruct us otherwise. If you do not want the mailing of these documents to be combined with those for other members of your household, please contact Invesco Investment Services, Inc. at 800 959 4246 or contact your financial institution. We will begin sending you individual copies for each account within 30 days after receiving your request.
Fund holdings and proxy voting information
The Fund provides a complete list of its holdings four times in each fiscal year, at the quarter ends. For the second and fourth quarters, the lists appear in the Fund’s semiannual and annual reports to shareholders. For the first and third quarters, the Fund files the lists with the Securities and Exchange Commission (SEC) on Form N-Q. The most recent list of portfolio holdings is available at invesco.com/completeqtrholdings. Shareholders can also look up the Fund’s Forms N-Q on the SEC website at sec.gov. Copies of the Fund’s Forms N-Q may be reviewed and copied at the SEC Public Reference Room in Washington, D.C. You can obtain information on the operation of the Public Reference Room, including information about duplicating fee charges, by calling 202 551 8090 or 800 732 0330, or by electronic request at the following email address: publicinfo@sec.gov. The SEC file numbers for the Fund are shown below.
A description of the policies and procedures that the Fund uses to determine how to vote proxies relating to portfolio securities is available without charge, upon request, from our Client Services department at 800 959 4246 or at invesco.com/proxyguidelines. The information is also available on the SEC website, sec.gov.
Information regarding how the Fund voted proxies related to its portfolio securities during the most recent 12-month period ended June 30 is available at invesco.com/proxysearch. The information is also available on the SEC website, sec.gov. Invesco Advisers, Inc. is an investment adviser; it provides investment advisory services to individual and institutional clients and does not sell securities. Invesco Distributors, Inc. is the US distributor for Invesco Ltd.’s retail mutual funds, exchange-traded funds and institutional money market funds. Both are wholly owned, indirect subsidiaries of Invesco Ltd. |
|

SEC file numbers: 811-09913 and 333-36074 MS-CTFI-AR-1 Invesco Distributors, Inc. |

Letters to Shareholders
 Philip Taylor | Dear Shareholders: This annual report includes information about your Fund, including performance data and a The US economy expanded and unemployment declined throughout the reporting period. |
and Japan – among other countries – either instituted or maintained extraordinarily accommodative monetary policies in response to economic weakness.
Investor uncertainty, such as we saw for much of the reporting period – and market volatility, such as we saw at the end of the reporting period – are unfortunate facts of life when it comes to investing. Some investors use these things as excuses to delay saving and investing for their long-term financial goals. That’s why Invesco encourages investors to work with a professional financial adviser who can stress the importance of starting to save and invest early and the importance of adhering to a disciplined investment plan – when times are good and when they’re uncertain. A financial adviser who knows your unique financial situation, investment goals and risk tolerance can be an invaluable partner as you seek to achieve your financial goals. He or she can offer a long-term perspective when markets are volatile and time-tested advice and guidance when your financial situation or investment goals change.
Timely information when and where you want it
Invesco’s efforts to help investors achieve their financial objectives include providing individual investors and financial professionals with timely information about the markets, the economy and investing – whenever and wherever they want it.
Our website, invesco.com/us, offers a wide range of market insights and investment perspectives. On the website, you’ll find detailed information about our funds, including prices, performance, holdings and portfolio manager commentaries. You can access information about your account by completing a simple, secure online registration. Click on the “Need to register” link in the “Account Access” box on our homepage to get started.
Invesco’s mobile apps for iPhone® and iPad® (both available free from the App StoreSM) allow you to obtain the same detailed information, monitor your account and create customizable watch lists. Also, they allow you to access investment insights from our investment leaders, market strategists, economists and retirement experts. You can sign up to be alerted when new commentary is added, and you can watch portfolio manager videos and have instant access to Invesco news and updates wherever you may be.
In addition to the resources accessible on our website and through our mobile app, you can obtain timely updates to help you stay informed about the markets, the economy and investing by connecting with Invesco on Twitter, LinkedIn or Facebook. You can access our blog at blog.invesco.us.com. Our goal is to provide you the information you want, when and where you want it.
Have questions?
For questions about your account, feel free to contact an Invesco client services representative at 800 959 4246. For Invesco-related questions or comments, please email me directly at phil@invesco.com.
All of us at Invesco look forward to serving your investment management needs for many years to come. Thank you for investing with us.
Sincerely,

Philip Taylor
Senior Managing Director, Invesco Ltd.
iPhone and iPad are trademarks of Apple Inc., registered in the US and other countries. App Store is a service mark of Apple Inc. Invesco Distributors, Inc. is not affiliated with Apple Inc.
2 Invesco Core Plus Bond Fund
Bruce Crockett | Dear Fellow Shareholders: Among the many important lessons I’ve learned in more than 40 years in a variety of business endeavors is the value of a trusted advocate. As independent chair of the Invesco Funds Board, I can assure you that the members of the Board are strong advocates for the interests of investors in Invesco’s mutual funds. We work hard to represent your interests through oversight of the quality of the investment management services your funds receive and other matters important to your investment, including but not limited to: n Ensuring that Invesco offers a diverse lineup of mutual funds that your financial adviser can use to strive to meet your financial needs as your investment goals change over time. n Monitoring how the portfolio management teams of the Invesco funds are performing in light of changing economic and market conditions. |

n Assessing each portfolio management team’s investment performance within the context of the investment strategy described in the fund’s prospectus.
n Monitoring for potential conflicts of interests that may impact the nature of the services that your funds receive.
We believe one of the most important services we provide our fund shareholders is the annual review of the funds’ advisory and sub-advisory contracts with Invesco Advisers and its affiliates. This review is required by the Investment Company Act of 1940 and focuses on the nature and quality of the services Invesco provides as the adviser to the Invesco funds and the reasonableness of the fees that it charges for those services. Each year, we spend months carefully reviewing information received from Invesco and a variety of independent sources, such as performance and fee data prepared by Lipper Inc., an independent, third-party firm widely recognized as a leader in its field. We also meet with our independent legal counsel and other independent advisers to review and help us assess the information that we have received. Our goal is to assure that you receive quality investment management services for a reasonable fee.
I trust the measures outlined above provide assurance that you have a worthy advocate when it comes to choosing the Invesco Funds.
As always, please contact me at bruce@brucecrockett.com with any questions or concerns you may have. On behalf of the Board, we look forward to continuing to represent your interests and serving your needs.
Sincerely,

Bruce L. Crockett
Independent Chair
Invesco Funds Board of Trustees
3 Invesco Core Plus Bond Fund
Management’s Discussion of Fund Performance
Performance summary
For the fiscal year ended August 31, 2015, Class A shares of Invesco Core Plus Bond Fund (the Fund), at net asset value (NAV), underformed the Fund’s broad market/style-specific index, the Barclays U.S. Aggregate Index.
Your Fund’s long-term performance appears later in this report.
Fund vs. Indexes
Total returns, 8/31/14 to 8/31/15, at net asset value (NAV). Performance shown does not include applicable contingent deferred sales charges (CDSC) or front-end sales charges, which would have reduced performance.
Class A Shares | 0.91 | % | ||
Class B Shares | 0.25 | |||
Class C Shares | 0.25 | |||
Class R Shares | 0.75 | |||
Class Y Shares | 1.25 | |||
Class R5 Shares | 1.25 | |||
Class R6 Shares | 1.32 | |||
Barclays U.S. Aggregate Indexq (Broad Market/Style-Specific Index) | 1.56 | |||
Lipper Core Plus Bond Funds Indexn (Peer Group Index) | 1.15 |
Source(s): qFactSet Research Systems Inc.; nLipper Inc.
Market conditions and your Fund The fiscal year began on the back of a US bond market rally as slowing global growth and lower inflation helped to push US Treasury yields lower and bond prices higher. Following a brief spike in yields at the beginning of September, the down-trend accelerated through the end of 2014 as oil prices hit lows not seen since the height of the financial crisis and global deflationary fears began to set in. As quickly as US Treasury yields declined in 2014, they snapped back even faster during the first half of 2015. Stronger-than-expected economic data helped to drive interest rates higher following the European Central Bank’s (ECB) version of quantitative easing whereby the ECB committed to purchasing longer-dated euro-area fixed income instruments in an effort to push longer-term interest rates |
lower and spur economic growth. Also supporting higher US interest rates was the end of the US Federal Reserve’s (the Fed) quantitative easing program of purchasing long-dated Treasury bonds, coupled with supportive US economic data in the form of stronger economic growth and employment. At the end of the fiscal year, the yield on the 10-year US Treasury stood at 2.22%, 12 basis points lower than where it began the fiscal year.1 (A basis point is one one-hundredth of a percentage point.)
During this reporting period of interest rate volatility, bonds, as represented by the Barclays U.S. Aggregate Bond Index, returned 1.56% and fared better than most risk assets, particularly equities, supported by the US Treasury/government-related and US securitized sectors, which posted gains for the fiscal year. Investment-grade corporate credit posted
losses despite continued strong US credit fundamentals mainly due to an abundance of new supply. Out-of-index exposures, including the high yield and emerging markets sectors, also finished the reporting period in negative territory as falling energy and commodity prices, amid slowing global growth, weighed on both sectors.
The Fund generated positive returns for the reporting period in absolute terms but, at NAV, underperformed its broad market/style-specific benchmark, the Barclays U.S. Aggregate Bond Index. Security selection within mortgage-backed securities (MBS) and investment-grade corporate bonds was one of the most notable contributors to relative performance. Overweight positions within the commercial mortgage-backed securities and asset-backed securities sectors also added value relative to the Fund’s broad market/style-specific index. An overweight position in investment-grade corporate credit was the most notable detractor from Fund performance but was tempered by positive security selection within the sector. Out-of-index exposures in sectors such as high yield and emerging markets, in addition to underweight Treasury exposure, weighed on relative Fund performance.
The Fund benefited from incremental income earned from transactions in the highly liquid to-be-announced (TBA) market for agency MBS. Such transactions involve the Fund selling an MBS to a financial institution, with an agreement to repurchase a substantially similar security at an agreed upon price and date. Cash received by the Fund as a result of this repurchase transaction may be invested in short-term instruments, and the income from these investments,
Portfolio Composition
By security type, based on total investments
| U.S. Dollar Denominated Bonds and Notes | 41.4 | % | ||
| U.S. Government Sponsored Agency Mortgage-Backed Securities | 21.3 | |||
Asset-Backed Securities | 16.6 | |||
U.S. Treasury Securities | 10.2 | |||
Money Market Funds | 9.5 | |||
Preferred Stocks | 0.5 | |||
Municipal Obligations | 0.2 | |||
Put Options Purchased | 0.2 | |||
Non-U.S. Dollar Denominated Bonds and Notes | 0.1 | |||
Common Stocks | 0.0 |
Top 10 Debt Issuers*
| 1. | Federal National Mortgage Association | 14.1 | % | |||
| 2. | U.S. Treasury | 12.1 | ||||
| 3. | Federal Home Loan Mortgage Corp. | 8.1 | ||||
| 4. | Government National Mortgage Association | 2.7 | ||||
| 5. | WFRBS Commercial Mortgage Trust | 1.4 | ||||
| 6. | CCO Safari II, LLC | 1.2 | ||||
| 7. | Coca-Cola Co. (The) | 1.1 | ||||
| 8. | Wells Fargo Mortgage Backed Securities Trust | 1.1 | ||||
| 9. | John Deere Capital Corp. | 1.1 | ||||
| 10. | JP Morgan Mortgage Trust | 0.9 |
Total Net Assets | $952.8 million | |
Total Number of Holdings* | 762 | |
The Fund’s holdings are subject to change, and there is no assurance that the Fund will continue to hold any particular security.
*Excluding money market fund holdings.
| 4 Invesco Core Plus Bond Fund |
together with any additional fee income received from this activity, generates income for the Fund.
The Fund also may use active duration and yield curve positioning for risk management and for generating excess return versus its broad market/style-specific benchmark. Duration measures a portfolio’s price sensitivity to interest rate changes. Yield curve positioning refers to actively emphasizing particular points (maturities) along the yield curve with favorable risk/return expectations. Duration of the portfolio was maintained slightly above benchmark, on average, and the timing of changes and the degree of variance from the Fund’s broad market/style-specific benchmark during the reporting period provided a small boost to relative returns. Buying and selling US Treasury futures and interest rate swaptions were important tools used for the management of interest rate risk and to maintain our targeted portfolio duration.
Part of the Fund’s strategy to manage credit and currency risk in the portfolio during the reporting period entailed purchasing and selling credit and currency derivatives. Credit market risk was managed by purchasing and selling protection through credit default swaps at various points throughout the fiscal year. The currency management was carried out via currency forwards and options on an as-needed basis and was effective in managing the currency positioning within the Fund.
We wish to remind you that the Fund is subject to interest rate risk, meaning when interest rates rise, the value of fixed income securities tends to fall. The risk may be greater in the current market environment because interest rates are at or near historic lows. The degree to which the value of fixed income securities may decline due to rising interest rates may vary depending on the speed and magnitude of the increase in interest rates, as well as individual security characteristics such as price, maturity, duration and coupon and market forces such as supply and demand for similar securities. We are monitoring interest rates, and the market, economic and geopolitical factors that may impact the direction, speed and magnitude of changes to interest rates across the maturity spectrum, including the potential impact of monetary policy changes by the Fed and certain foreign central banks. If interest rates rise, markets may experience increased volatility, which may affect the value and/or liquidity of certain of the Fund’s investments.
Thank you for investing in Invesco Core Plus Bond Fund and for sharing our long-term investment horizon.
| 1 | Source: Bloomberg |
The views and opinions expressed in management’s discussion of Fund performance are those of Invesco Advisers, Inc. These views and opinions are subject to change at any time based on factors such as market and economic conditions. These views and opinions may not be relied upon as investment advice or recommendations, or as an offer for a particular security. The information is not a complete analysis of every aspect of any market, country, industry, security or the Fund. Statements of fact are from sources considered reliable, but Invesco Advisers, Inc. makes no representation or warranty as to their completeness or accuracy. Although historical performance is no guarantee of future results, these insights may help you understand our investment management philosophy.
See important Fund and, if applicable, index disclosures later in this report.
Matthew Brill
Chartered Financial Analyst, Portfolio Manager, is manager of Invesco Core Plus Bond Fund. He joined Invesco in 2013. Mr. Brill earned a BA in economics from Washington and Lee University.
Chuck Burge
Portfolio Manager, is manager of Invesco Core Plus Bond Fund. He joined Invesco in 2002. Mr. Burge earned a BS in economics from Texas A&M University and an MBA in finance and accounting from Rice University.
Darren Hughes
Chartered Financial Analyst, Portfolio Manager, is manager of Invesco Core Plus Bond Fund. He joined Invesco in 1992. Mr. Hughes earned a BBA in finance and economics from Baylor University.
Michael Hyman
Portfolio Manager, is manager of Invesco Core Plus Bond Fund. He joined Invesco in 2013. Mr. Hyman earned a BSE in finance from Pennsylvania State University and an MBA from the Stern School of Business at New York University.
Joseph Portera
Portfolio Manager, is manager of Invesco Core Plus Bond Fund. He joined Invesco in 2012. Mr. Portera earned BA and MA degrees in Soviet studies and an MA in international political economy and development from Fordham University.
Rashique Rahman
Portfolio Manager, is manager of Invesco Core Plus Bond Fund. Mr. Rahman is the Head of Emerging Markets for Invesco Fixed Income. He joined Invesco in 2014. Mr. Rahman earned a BA in economics and political science from the University of California, Los Angeles and an MA in international affairs, as well as an MBA, from Columbia University.
Scott Roberts
Chartered Financial Analyst, Portfolio Manager, is manager of Invesco Core Plus Bond Fund. He joined Invesco in 2000. Mr. Roberts earned a BBA in finance from the University of Houston.
Robert Waldner
Chartered Financial Analyst, Portfolio Manager, is manager of Invesco Core Plus Bond Fund. He joined Invesco in 2013. Mr. Waldner earned a BSE degree in civil engineering from Princeton University.
5 Invesco Core Plus Bond Fund
Your Fund’s Long-Term Performance
Results of a $10,000 Investment – Oldest Share Class(es) since Inception
Fund and index data from 6/3/09
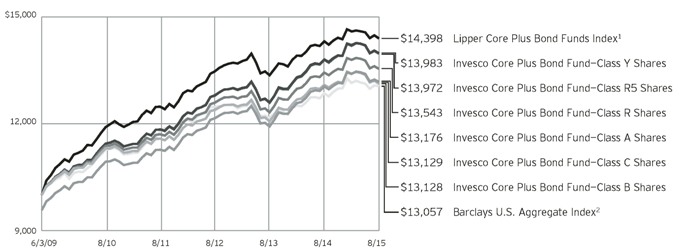
| 1 | Source: Lipper Inc. |
| 2 | Source: FactSet Research Systems Inc. |
Past performance cannot guarantee comparable future results.
The data shown in the chart include reinvested distributions, applicable sales charges and Fund expenses including management fees. Results for Class B shares are calculated as if a hypothetical
shareholder had liquidated his entire investment in the Fund at the close of the reporting period and paid the contingent deferred sales charges, if applicable. Index results include reinvested dividends, but they do not reflect sales charges. Performance of the peer group,
if applicable, reflects fund expenses and management fees; performance of a market index does not.
Performance shown in the chart and table(s) does not reflect deduction of taxes a shareholder would pay on Fund distributions or sale of Fund shares.
continued from page 9
About indexes used in this report
| n | The Barclays U.S. Aggregate Index is an unmanaged index considered representative of the US investment-grade, fixed-rate bond market. |
| n | The Lipper Core Plus Bond Funds Index is an unmanaged index consisting of funds that invest at least 65% in domestic investment-grade debt issues (rated in the top four grades) with any remaining investment in non-benchmark sectors such as high-yield, global and emerging market debt. These funds maintain dollar-weighted average maturities of five to 10 years. |
| n | The Fund is not managed to track the performance of any particular index, including the index(es) described here, and consequently, the performance of the Fund may deviate significantly from the performance of the index(es). |
| n | A direct investment cannot be made in an index. Unless otherwise indicated, index results include reinvested dividends, and they do not reflect sales charges. Performance of the peer group, if applicable, reflects fund expenses; performance of a market index does not. |
Other information
| n | The returns shown in management’s discussion of Fund performance are based on net asset values (NAVs) calculated for shareholder transactions. Generally accepted accounting principles require adjustments to be made to the net assets of the Fund at period end for financial reporting purposes, and as such, the NAVs for shareholder transactions and the returns based on those NAVs may differ from the NAVs and returns reported in the Financial Highlights. |
6 Invesco Core Plus Bond Fund
Average Annual Total Returns
As of 8/31/15, including maximum applicable sales charges
Class A Shares | ||||
Inception (6/3/09) | 4.52 | % | ||
5 Years | 2.89 | |||
1 Year | -3.34 | |||
Class B Shares | ||||
Inception (6/3/09) | 4.46 | % | ||
5 Years | 2.68 | |||
1 Year | -4.62 | |||
Class C Shares | ||||
Inception (6/3/09) | 4.46 | % | ||
5 Years | 3.02 | |||
1 Year | -0.73 | |||
Class R Shares | ||||
Inception (6/3/09) | 4.98 | % | ||
5 Years | 3.55 | |||
1 Year | 0.75 | |||
Class Y Shares | ||||
Inception (6/3/09) | 5.52 | % | ||
5 Years | 4.09 | |||
1 Year | 1.25 | |||
Class R5 Shares | ||||
Inception (6/3/09) | 5.50 | % | ||
5 Years | 4.07 | |||
1 Year | 1.25 | |||
Class R6 Shares | ||||
Inception | 5.39 | % | ||
5 Years | 3.98 | |||
1 Year | 1.32 | |||
Class R6 shares incepted on September 24, 2012. Performance shown prior to that date is that of Class A shares and includes the 12b-1 fees applicable to Class A shares.
The performance data quoted represent past performance and cannot guarantee comparable future results; current performance may be lower or higher. Please visit invesco.com/performance for the most recent month-end performance. Performance figures reflect reinvested distributions, changes in net asset value and the effect of the maximum sales charge unless otherwise stated. Investment return and principal value will fluctuate so that you may have a gain or loss when you sell shares.
The net annual Fund operating expense ratio set forth in the most recent Fund prospectus as of the date of this report for Class A, Class B, Class C, Class R, Class Y, Class R5 and
Average Annual Total Returns
As of 6/30/15, the most recent calendar quarter end, including maximum applicable sales charges
Class A Shares | ||||
Inception (6/3/09) | 4.68 | % | ||
5 Years | 3.46 | |||
1 Year | -2.35 | |||
Class B Shares | ||||
Inception (6/3/09) | 4.64 | % | ||
5 Years | 3.26 | |||
1 Year | -3.64 | |||
Class C Shares | ||||
Inception (6/3/09) | 4.62 | % | ||
5 Years | 3.57 | |||
1 Year | 0.21 | |||
Class R Shares | ||||
Inception (6/3/09) | 5.15 | % | ||
5 Years | 4.11 | |||
1 Year | 1.70 | |||
Class Y Shares | ||||
Inception (6/3/09) | 5.69 | % | ||
5 Years | 4.65 | |||
1 Year | 2.11 | |||
Class R5 Shares | ||||
Inception (6/3/09) | 5.67 | % | ||
5 Years | 4.61 | |||
1 Year | 2.21 | |||
Class R6 Shares | ||||
Inception | 5.56 | % | ||
5 Years | 4.52 | |||
1 Year | 2.27 | |||
Class R6 shares was 0.86%, 1.61%, 1.61%, 1.11%, 0.61%, 0.60% and 0.56%, respectively.1 The total annual Fund operating expense ratio set forth in the most recent Fund prospectus as of the date of this report for Class A, Class B, Class C, Class R, Class Y, Class R5 and Class R6 shares was 1.03%, 1.78%, 1.78%, 1.28%, 0.78%, 0.60% and 0.56%, respectively. The expense ratios presented above may vary from the expense ratios presented in other sections of this report that are based on expenses incurred during the period covered by this report.
Class A share performance reflects the maximum 4.25% sales charge, and Class B and Class C share performance reflects the applicable contingent deferred sales charge (CDSC) for the period involved. The CDSC on Class B shares declines from 5% beginning at the time of purchase to 0% at the beginning of the seventh year. The CDSC on Class C shares is 1% for the
first year after purchase. Class R, Class Y, Class R5 and Class R6 shares do not have a front-end sales charge or a CDSC; therefore, performance is at net asset value.
The performance of the Fund’s share classes will differ primarily due to different sales charge structures and class expenses.
Fund performance reflects any applicable fee waivers and/or expense reimbursements. Had the adviser not waived fees and/or reimbursed expenses currently or in the past, returns would have been lower. See current prospectus for more information.
| 1 | Total annual Fund operating expenses after any contractual fee waivers and/or expense reimbursements by the adviser in effect through at least December 31, 2015. See current prospectus for more information. |
7 Invesco Core Plus Bond Fund
Invesco Core Plus Bond Fund’s investment objective is total return, comprised of current income and capital appreciation.
| n | Unless otherwise stated, information presented in this report is as of August 31, 2015, and is based on total net assets. |
| n | Unless otherwise noted, all data provided by Invesco. |
| n | To access your Fund’s reports/prospectus, visit invesco.com/fundreports. |
About share classes
| n | Class B shares may not be purchased for new or additional investments. Please see the prospectus for more information. |
| n | Class R shares are generally available only to employer sponsored retirement and benefit plans. Please see the prospectus for more information. |
| n | Class Y shares are available only to certain investors. Please see the prospectus for more information. |
| n | Class R5 shares and Class R6 shares are primarily intended for employer sponsored retirement and benefit plans that meet certain standards and for institutional investors. Please see the prospectus for more information. |
Principal risks of investing in the Fund
| n | Changing fixed income market conditions risk. The current low interest rate environment was created in part by the Federal Reserve Board (FRB) and certain foreign central banks keeping the federal funds and equivalent foreign rates at or near zero. There is a risk that interest rates will rise when the FRB and central banks raise these rates. This risk is heightened due to the completion of the FRB’s quantitative easing program and the “tapering” of other similar foreign central bank actions. This eventual increase in the federal funds and equivalent foreign rates may expose fixed income markets to heightened volatility and reduced liquidity for certain fixed income investments, particularly those with longer maturities. In addition, decreases in fixed income dealer market-making capacity may also potentially lead to heightened volatility and reduced liquidity in the fixed income markets. As a result, the value of the Fund’s investments and share price may decline. Changes in central bank policies could also result in higher than normal shareholder redemptions, which could potentially increase portfolio turnover and the Fund’s transaction costs. |
| n | Collateralized loan obligations risk. In addition to the normal interest rate, default and other risk of fixed income securities, collateralized loan obligations carry additional risks, including the possibility that distributions from collateral securities will not be adequate to make interest or other payments, the quality of the collateral may decline in value or default, the Fund may invest in collateralized loan obligations that are subordinate to other classes, values may be volatile, and disputes with the issuer may produce unexpected investment results. |
| n | Credit risk. The issuer of instruments in which the Fund invests may be unable to meet interest and/or principal payments, thereby causing its instruments to decrease in value and lowering the issuer’s credit rating. |
| n | Currency/exchange rate risk. The dollar value of the Fund’s foreign investments will be affected by changes in the exchange rates between the dollar and the currencies in which those investments are traded. |
| n | Derivatives risk. The value of a derivative instrument depends largely on (and is derived from) the value of an underlying security, currency, commodity, interest rate, index or other asset (each referred to as an underlying asset). In addition to risks relating to the underlying assets, the use of derivatives may include other, possibly greater, risks, including counterparty, leverage and liquidity risks. Counter-party risk is the risk that the counter-party to the derivative contract will default on its obligation to pay the Fund the amount owed or otherwise perform under the derivative contract. Derivatives create leverage risk because they do not require payment up front equal to the economic exposure created by owning the derivative. As a result, an adverse change in the value of the underlying asset could result in the Fund sustaining a loss that is substantially greater than the amount invested in |
This report must be accompanied or preceded by a currently effective Fund prospectus, which contains more complete information, including sales charges and expenses. Investors should read it carefully before investing.
| the derivative, which may make the Fund’s returns more volatile and increase the risk of loss. Derivative instruments may also be less liquid than more traditional investments and the Fund may be unable to sell or close out its derivative positions at a desirable time or price. This risk may be more acute under adverse market conditions, during which the Fund may be most in need of liquidating its derivative positions. Derivatives may also be harder to value, less tax efficient and subject to changing government regulation that could impact the Fund’s ability to use certain derivatives or their cost. Also, derivatives used for hedging or to gain or limit exposure to a particular market segment may not provide the expected benefits, particularly during adverse market conditions. |
| n | Developing/emerging markets securities risk. The prices of securities issued by foreign companies and governments located in developing/emerging markets countries may be affected more negatively by inflation, devaluation of their currencies, higher transaction costs, delays in settlement, adverse political developments, the introduction of capital controls, withholding taxes, nationalization of private assets, expropriation, social unrest, war or lack of timely information than those in developed countries. |
| n | Foreign securities risk. The Fund’s foreign investments may be affected by changes in a foreign country’s exchange rates, political and social instability, changes in economic or taxation policies, difficulties when enforcing obligations, decreased liquidity, and increased volatility. Foreign companies may be subject to less regulation resulting in less publicly available information about the companies. |
| n | High yield (junk bond) risk. Junk bonds involve a greater risk of default or price changes due to changes in the credit quality of the issuer. The values of junk bonds fluctuate more than those of high-quality bonds in response to company, political, regulatory or economic developments. Values of junk bonds can decline significantly over short periods of time. |
NOT FDIC INSURED | MAY LOSE VALUE | NO BANK GUARANTEE | continued on page 9 |
8 Invesco Core Plus Bond Fund
| n | Interest rate risk. Interest rate risk refers to the risk that bond prices generally fall as interest rates rise; conversely, bond prices generally rise as interest rates fall. Specific bonds differ in their sensitivity to changes in interest rates depending on their individual characteristics, including duration. |
| n | Liquidity risk. The Fund may hold illiquid securities that it may be unable to sell at the preferred time or price and could lose its entire investment in such securities. |
| n | Management risk. The investment techniques and risk analysis used by the Fund’s portfolio managers may not produce the desired results. |
| n | Market risk. The prices of and the income generated by the Fund’s securities may decline in response to, among other things, investor sentiment, general economic and market conditions, regional or global instability, and currency and interest rate fluctuations. |
| n | Mortgage- and asset-backed securities risk. The Fund may invest in mortgage- and asset-backed securities that are subject to prepayment or call risk, which is the risk that the borrower’s payments may be received earlier or later than expected due to changes in prepayment rates on underlying loans. Faster prepayments often happen when interest rates are falling. As a result, the Fund may reinvest these early payments at lower interest rates, thereby reducing the Fund’s income. Conversely, when interest rates rise, prepayments may happen more slowly, causing the security to lengthen in duration. Longer duration securities tend to be more volatile. Securities may be prepaid at a price less than the original purchase value. An unexpectedly high rate of defaults on the mortgages held by a mortgage pool may adversely affect the value of mortgage-backed securities and could result in losses to the Fund. The risk of such defaults is generally higher in the case of mortgage pools that include subprime mortgages. Subprime mortgages refer to loans made to borrowers with weakened credit histories or with lower capacity to make timely payments on their mortgages. |
| n | Municipal securities risk. The Fund may invest in municipal securities. Constitutional amendments, legislative enactments, executive orders, administrative regulations, voter initiatives, and the issuer’s regional economic conditions may affect the municipal security’s value, interest payments, repayment of principal and the Fund’s ability to sell it. Failure of a municipal security issuer to comply with applicable tax requirements may make income paid thereon taxable, resulting in a decline in the security’s value. In addition, there could be changes in applicable tax laws or tax treatments that reduce or eliminate the current federal income tax exemption on municipal securities or otherwise adversely affect the current federal or state tax status of municipal securities. |
| n | Reinvestment risk. Reinvestment risk is the risk that a bond’s cash flows (coupon income and principal repayment) will be reinvested at an interest rate below that on the original bond. |
| n | TBA transactions risk. TBA transactions involve the risk that the securities received may be less favorable than what was anticipated by the Fund when entering into the TBA transaction. TBA transactions also involve the risk that a counterparty will fail to deliver the securities, exposing the Fund to further losses. Whether or not the Fund takes delivery of the securities at the termination date of a TBA transaction, the Fund will nonetheless be exposed to changes in the value of the underlying investments during the term of the agreement. When the Fund enters into a short sale of a TBA mortgage it does not own, the Fund may have to purchase deliverable mortgages to settle the short sale at a higher price than anticipated, thereby causing a loss. A short position in a TBA mortgage poses more risk than holding the same TBA mortgage long. As there is no limit on how much the price of mortgage securities can increase, the Fund’s exposure is unlimited. The Fund may not always be able to purchase mortgage securities to close out the short position at a particular time or at an acceptable price. A Fund will earmark or segregate |
liquid assets in an amount at least equal to its exposure for the duration of the contract. The Fund will incur increased transaction costs associated with selling TBA mortgages short. In addition, taking short positions in TBA mortgages results in a form of leverage which could increase the volatility of the Fund’s share price. |
| n | US government obligations risk. The Fund may invest in obligations issued by US government agencies and instrumentalities that may receive varying levels of support from the government, which could affect the Fund’s ability to recover should they default. |
| n | When-issued and delayed delivery risks. When-issued and delayed delivery transactions are subject to market risk as the value or yield of a security at delivery may be more or less than the purchase price or the yield generally available on securities when delivery occurs. In addition, the Fund is subject to counterparty risk because it relies on the buyer or seller, as the case may be, to consummate the transaction, and failure by the other party to complete the transaction may result in the Fund missing the opportunity of obtaining a price or yield considered to be advantageous. |
| n | Zero coupon or pay-in-kind securities risk. The value, interest rates, and liquidity of non-cash paying instruments, such as zero coupon and pay-in-kind securities, are subject to greater fluctuation than other types of securities. The higher yields and interest rates on pay-in-kind securities reflect the payment deferral and increased credit risk associated with such instruments and that such investments may represent a higher credit risk than coupon loans. Pay-in-kind securities may have a potential variability in valuations because their continuing accruals require continuing judgments about the collectability of the deferred payments and the value of any associated collateral. |
continued on page 6
9 Invesco Core Plus Bond Fund
Schedule of Investments(a)
August 31, 2015
| Principal Amount | Value | |||||||
U.S. Dollar Denominated Bonds and Notes–49.33% |
| |||||||
| Aerospace & Defense–0.36% | ||||||||
Aerojet Rocketdyne Holdings, Inc., | $ | 204,000 | $ | 215,730 | ||||
Bombardier Inc. (Canada), | ||||||||
7.50%, 03/15/18(b) | 70,000 | 65,887 | ||||||
7.50%, 03/15/25(b) | 323,000 | 245,480 | ||||||
7.75%, 03/15/20(b) | 83,000 | 69,720 | ||||||
DigitalGlobe Inc., Sr. Unsec. Gtd. Notes, 5.25%, 02/01/21(b) | 61,000 | 59,170 | ||||||
KLX Inc., Sr. Unsec. Gtd. Notes, | 106,000 | 104,675 | ||||||
L-3 Communications Corp., | ||||||||
3.95%, 05/28/24 | 1,540,000 | 1,464,370 | ||||||
Sr. Unsec. Gtd. Notes, 4.95%, 02/15/21 | 679,000 | 717,345 | ||||||
Moog Inc., Sr. Unsec. Gtd. Notes, | 100,000 | 100,500 | ||||||
TransDigm Inc., | ||||||||
Sr. Unsec. Gtd. Sub. Global Notes, 5.50%, 10/15/20 | 130,000 | 128,050 | ||||||
Sr. Unsec. Gtd. Sub. Notes, 6.50%, 05/15/25(b) | 229,000 | 225,565 | ||||||
| 3,396,492 | ||||||||
| Agricultural & Farm Machinery–1.07% | ||||||||
John Deere Capital Corp., Sr. Unsec. | 10,000,000 | 10,103,485 | ||||||
Titan International Inc., Sr. Sec. | 109,000 | 98,236 | ||||||
| 10,201,721 | ||||||||
| Air Freight & Logistics–0.47% | ||||||||
United Parcel Service, Inc., | 4,379,000 | 4,508,272 | ||||||
| Airlines–0.74% | ||||||||
Air Canada (Canada), | ||||||||
Sec. Gtd. Second Lien Notes, 8.75%, 04/01/20(b) | 30,000 | 33,156 | ||||||
Sr. Unsec. Gtd. Notes, 7.75%, 04/15/21(b) | 130,000 | 140,264 | ||||||
Continental Airlines Pass Through Trust, | 962,806 | 1,025,388 | ||||||
Series 2009-2, Class B, Sec. Second Lien Global Pass Through Ctfs., 9.25%, 05/10/17 | 2,166 | 2,357 | ||||||
Series 2012-1, Class A, Sr. Sec. First Lien Pass Through Ctfs., 4.15%, 04/11/24 | 450,781 | 461,487 | ||||||
| Principal Amount | Value | |||||||
| Airlines–(continued) | ||||||||
LATAM Airlines Group S.A. Pass Through Trust (Chile), | $ | 5,651,000 | $ | 5,424,129 | ||||
US Airways Pass Through Trust, | 8,649 | 9,724 | ||||||
| 7,096,505 | ||||||||
| Alternative Carriers–0.05% | ||||||||
Level 3 Communications, Inc., | 125,000 | 125,312 | ||||||
Level 3 Financing, Inc., | 308,000 | 311,465 | ||||||
Sr. Unsec. Gtd. Notes, | 45,000 | 44,100 | ||||||
| 480,877 | ||||||||
| Apparel Retail–0.06% | ||||||||
Hot Topic, Inc., Sr. Sec. Gtd. First Lien Notes, 9.25%, 06/15/21(b) | 166,000 | 167,867 | ||||||
L Brands, Inc., Sr. Unsec. Gtd. Notes, 6.63%, 04/01/21 | 170,000 | 191,675 | ||||||
Men’s Wearhouse, Inc. (The), | 238,000 | 252,875 | ||||||
| 612,417 | ||||||||
| Apparel, Accessories & Luxury Goods–0.00% | ||||||||
William Carter Co. (The), Sr. Unsec. Gtd. Global Notes, | 41,000 | 42,230 | ||||||
| Application Software–0.01% | ||||||||
SS&C Technologies Holdings, Inc., | 58,000 | 60,175 | ||||||
| Asset Management & Custody Banks–0.91% | ||||||||
Affiliated Managers Group, Inc., | 2,865,000 | 2,923,237 | ||||||
Alphabet Holding Co., Inc., | 344,000 | 341,850 | ||||||
Apollo Management Holdings L.P., | 965,000 | 965,243 | ||||||
Blackstone Holdings Finance Co. LLC, Sr. Unsec. Gtd. Notes, | 2,645,000 | 2,685,782 | ||||||
See accompanying Notes to Financial Statements which are an integral part of the financial statements.
10 Invesco Core Plus Bond Fund
| Principal Amount | Value | |||||||
| Asset Management & Custody Banks–(continued) | ||||||||
Carlyle Holdings II Finance LLC, | $ | 1,545,000 | $ | 1,656,212 | ||||
DJO Finco Inc./DJO Finance LLC/Corp., Sec. Second Lien Notes, | 123,000 | 128,074 | ||||||
| 8,700,398 | ||||||||
| Auto Parts & Equipment–0.07% | ||||||||
CTP Transportation Products LLC/CTP Finance Inc., Sr. Sec. Notes, | 170,000 | 181,475 | ||||||
Dana Holding Corp., | 128,000 | 128,640 | ||||||
5.50%, 12/15/24 | 24,000 | 23,640 | ||||||
Stackpole International Intermediate Co. S.A./Stackpole International Powder Metal (Canada), Sr. Sec. Gtd. First Lien Notes, 7.75%, 10/15/21 (Acquired 10/01/13-05/11/15; Cost $164,630)(b) | 163,000 | 180,115 | ||||||
Tenneco Inc., Sr. Unsec. Gtd. Global Notes, 5.38%, 12/15/24 | 110,000 | 112,200 | ||||||
| 626,070 | ||||||||
| Automobile Manufacturers–0.83% | ||||||||
Ford Motor Credit Co. LLC, | 3,918,000 | 3,923,266 | ||||||
General Motors Co., Sr. Unsec. | 2,355,000 | 2,393,857 | ||||||
General Motors Financial Co., Inc., Sr. Unsec. Gtd. Notes, | 1,565,000 | 1,547,001 | ||||||
| 7,864,124 | ||||||||
| Automotive Retail–0.01% | ||||||||
CST Brands, Inc., Sr. Unsec. Gtd. Global Notes, 5.00%, 05/01/23 | 82,000 | 80,770 | ||||||
| Biotechnology–0.56% | ||||||||
Celgene Corp., Sr. Unsec. | 3,543,000 | 3,527,186 | ||||||
5.00%, 08/15/45 | 1,795,000 | 1,800,761 | ||||||
| 5,327,947 | ||||||||
| Broadcasting–0.03% | ||||||||
iHeartCommunications, Inc., | 110,000 | 99,550 | ||||||
Sinclair Television Group Inc., | 110,000 | 105,050 | ||||||
TEGNA, Inc., Sr. Unsec. Gtd. | 83,000 | 87,357 | ||||||
| 291,957 | ||||||||
| Principal Amount | Value | |||||||
| Building Products–0.11% | ||||||||
Builders FirstSource, Inc., | $ | 215,000 | $ | 226,556 | ||||
Sr. Unsec. Gtd. Notes, | 209,000 | 213,180 | ||||||
Building Materials Holding Corp., | 126,000 | 134,820 | ||||||
Gibraltar Industries Inc., Sr. Unsec. | 220,000 | 223,300 | ||||||
Hardwoods Acquisition, Inc., | 35,000 | 33,556 | ||||||
NCI Building Systems, Inc., | 20,000 | 20,825 | ||||||
Norbord Inc. (Canada), | 89,000 | 89,080 | ||||||
Sr. Sec. Gtd. First Lien Notes, | 60,000 | 59,980 | ||||||
| 1,001,297 | ||||||||
| Cable & Satellite–1.78% | ||||||||
Altice Luxembourg S.A. (Luxembourg), Sr. Unsec. Gtd. Notes, 7.75%, 05/15/22(b) | 300,000 | 293,625 | ||||||
CCO Holdings LLC/CCO Holdings | 35,000 | 35,481 | ||||||
Sr. Unsec. Gtd. Notes, | 431,000 | 433,155 | ||||||
5.38%, 05/01/25(b) | 55,000 | 53,625 | ||||||
CCO Safari II, LLC, | 2,464,000 | 2,465,780 | ||||||
Sr. Sec. Gtd. First Lien Notes, | 2,000,000 | 1,994,853 | ||||||
4.91%, 07/23/25(b) | 6,659,000 | 6,611,641 | ||||||
Cox Communications, Inc., | 1,220,000 | 1,512,679 | ||||||
9.38%, 01/15/19(b) | 25,000 | 30,019 | ||||||
DIRECTV Holdings LLC/DIRECTV Financing Co., Inc., Sr. Unsec. Gtd. Notes, 4.45%, 04/01/24 | 1,090,000 | 1,104,766 | ||||||
DISH DBS Corp., Sr. Unsec. Gtd. Global Notes, | 207,000 | 203,895 | ||||||
5.88%, 11/15/24 | 268,000 | 245,220 | ||||||
Hughes Satellite Systems Corp., | 59,000 | 64,900 | ||||||
Intelsat Jackson Holdings S.A. (Luxembourg), Sr. Unsec. Gtd. Global Bonds, | 288,000 | 256,320 | ||||||
6.63%, 12/15/22 | 70,000 | 61,600 | ||||||
See accompanying Notes to Financial Statements which are an integral part of the financial statements.
11 Invesco Core Plus Bond Fund
| Principal Amount | Value | |||||||
| Cable & Satellite–(continued) | ||||||||
Myriad International Holdings B.V. | $ | 462,000 | $ | 464,722 | ||||
Numericable-SFR S.A. (France), | 256,000 | 257,280 | ||||||
Unitymedia Hessen GmbH & Co. KG/Unitymedia NRW GmbH (Germany), Sr. Sec. Gtd. First Lien Bonds, | 200,000 | 195,500 | ||||||
VTR Finance B.V. (Chile), | 250,000 | 247,813 | ||||||
REGS, Sr. Sec. First Lien Euro Notes, 6.88%, 01/15/24(b) | 450,000 | 444,375 | ||||||
| 16,977,249 | ||||||||
| Casinos & Gaming–0.04% | ||||||||
Boyd Gaming Corp., Sr. Unsec. Gtd. Global Notes, 6.88%, 05/15/23 | 188,000 | 195,520 | ||||||
MGM Resorts International, | 30,000 | 30,600 | ||||||
7.75%, 03/15/22 | 110,000 | 122,650 | ||||||
Mohegan Tribal Gaming Authority, | 30,000 | 31,050 | ||||||
| 379,820 | ||||||||
| Catalog Retail–0.62% | ||||||||
QVC, Inc., Sr. Sec. Gtd. First Lien Global Notes, | 2,800,000 | 2,650,835 | ||||||
4.85%, 04/01/24 | 1,736,000 | 1,666,529 | ||||||
5.45%, 08/15/34 | 1,815,000 | 1,610,956 | ||||||
| 5,928,320 | ||||||||
| Commercial Printing–0.02% | ||||||||
Multi-Color Corp., Sr. Unsec. Gtd. Notes, 6.13%, 12/01/22(b) | 156,000 | 159,705 | ||||||
| Communications Equipment–0.37% | ||||||||
Avaya Inc., Sr. Sec. Gtd. First Lien Notes, 9.00%, 04/01/19(b) | 133,000 | 126,350 | ||||||
QUALCOMM Inc., Sr. Unsec. Global Notes, 4.65%, 05/20/35 | 3,725,000 | 3,397,161 | ||||||
| 3,523,511 | ||||||||
| Computer & Electronics Retail–0.02% | ||||||||
Rent-A-Center, Inc., Sr. Unsec. Gtd. Global Notes, 4.75%, 05/01/21 | 193,000 | 165,015 | ||||||
| Construction & Engineering–0.04% | ||||||||
AECOM, Sr. Unsec. Gtd. Notes, | 250,000 | 249,920 | ||||||
Odebrecht Finance Ltd. (Brazil), REGS, Sr. Unsec. Gtd. Euro Notes, | 200,000 | 127,000 | ||||||
| 376,920 | ||||||||
| Principal Amount | Value | |||||||
| Construction Machinery & Heavy Trucks–0.11% | ||||||||
Allied Specialty Vehicles, Inc., | $ | 237,000 | $ | 249,443 | ||||
Commercial Vehicle Group Inc., Sec. Gtd. Second Lien Global Notes, 7.88%, 04/15/19 | 204,000 | 211,905 | ||||||
Meritor Inc., Sr. Unsec. Gtd. Notes, | 59,000 | 57,820 | ||||||
6.75%, 06/15/21 | 34,000 | 34,680 | ||||||
Navistar International Corp., Sr. Unsec. Gtd. Notes, 8.25%, 11/01/21 | 245,000 | 213,456 | ||||||
Oshkosh Corp., Sr. Unsec. Gtd. Global Notes, | 212,000 | 215,180 | ||||||
5.38%, 03/01/25 | 60,000 | 60,450 | ||||||
| 1,042,934 | ||||||||
| Construction Materials–0.05% | ||||||||
Building Materials Corp. of America, Sr. Unsec. Notes, | 215,000 | 220,644 | ||||||
CPG Merger Sub LLC, Sr. Unsec. Gtd. | 30,000 | 30,712 | ||||||
Shea Homes L.P./Shea Homes Funding Corp., Sr. Unsec. Gtd. Notes, 5.88%, 04/01/23(b) | 24,000 | 24,720 | ||||||
Unifrax I LLC/Unifrax Holding Co., Sr. Unsec. Gtd. Notes, | 170,000 | 171,275 | ||||||
| 447,351 | ||||||||
| Consumer Finance–1.20% | ||||||||
Ally Financial Inc., Sr. Unsec. Global Notes, | 3,525,000 | 3,542,625 | ||||||
4.63%, 03/30/25 | 1,813,000 | 1,758,610 | ||||||
5.13%, 09/30/24 | 274,000 | 276,740 | ||||||
Credit Acceptance Corp., Sr. Unsec. Gtd. Notes, 7.38%, 03/15/23(b) | 62,000 | 63,705 | ||||||
Navient Corp., Sr. Unsec. Medium-Term Global Notes, 6.25%, 01/25/16 | 355,000 | 358,994 | ||||||
Synchrony Financial, Sr. Unsec. Global Notes, 4.50%, 07/23/25 | 5,430,000 | 5,397,965 | ||||||
| 11,398,639 | ||||||||
| Data Processing & Outsourced Services–0.05% | ||||||||
First Data Corp., Sr. Unsec. Gtd. Sub. Global Notes, 11.75%, 08/15/21 | 391,000 | 442,319 | ||||||
| Department Stores–0.63% | ||||||||
El Puerto de Liverpool, S.A.B. de C.V. (Mexico), REGS, Sr. Unsec. Gtd. Euro Notes, 3.95%, 10/02/24(b) | 200,000 | 198,060 | ||||||
Kohl’s Corp., Sr. Unsec. Global | 5,857,000 | 5,539,673 | ||||||
SACI Falabella (Chile), Sr. Unsec. | 300,000 | 300,118 | ||||||
| 6,037,851 | ||||||||
See accompanying Notes to Financial Statements which are an integral part of the financial statements.
12 Invesco Core Plus Bond Fund
| Principal Amount | Value | |||||||
| Distillers & Vintners–0.25% | ||||||||
Constellation Brands Inc., | $ | 2,275,000 | $ | 2,346,094 | ||||
| Diversified Banks–5.18% | ||||||||
Banco Santander Mexico S.A. Institucion de Banca Multiple Grupo Financiero Santander (Mexico), Unsec. Sub. Notes, | 200,000 | 207,625 | ||||||
Bank of America Corp., | 1,645,000 | 1,632,663 | ||||||
Series Z, Jr. Unsec. Sub. Notes, | 3,360,000 | 3,477,600 | ||||||
BBVA Bancomer S.A. (Mexico), | 1,385,000 | 1,393,405 | ||||||
Unsec. Sub. Notes, | 600,000 | 648,929 | ||||||
Citigroup Inc., | 2,970,000 | 3,225,181 | ||||||
Series Q, Jr. Unsec. Sub. Global Notes, 5.95%(d) | 2,300,000 | 2,288,500 | ||||||
Crédit Agricole S.A. (France), Unsec. Sub. Notes, 4.38%, 03/17/25(b) | 5,620,000 | 5,455,812 | ||||||
HBOS PLC (United Kingdom), Unsec. | 1,360,000 | 1,499,930 | ||||||
HSBC Holdings PLC (United Kingdom), Sr. Unsec. | 1,050,000 | 1,092,202 | ||||||
ING Groep N.V. (Netherlands), | 2,710,000 | 2,642,250 | ||||||
Intesa Sanpaolo SpA (Italy), | 2,840,000 | 2,928,794 | ||||||
Itaú Unibanco Holding S.A. (Brazil), | 3,760,000 | 3,655,810 | ||||||
JPMorgan Chase & Co., Series R, | 2,980,000 | 2,972,550 | ||||||
KEB Hana Bank (South Korea), | 700,000 | 729,520 | ||||||
Unsec. Sub. Notes, | 990,000 | 1,034,147 | ||||||
Nordea Bank AB (Sweden), | 2,140,000 | 2,129,300 | ||||||
Societe Generale S.A. (France), | 1,309,000 | 1,315,545 | ||||||
Unsec. Sub. Notes, | 3,175,000 | 3,037,068 | ||||||
Standard Chartered PLC (United Kingdom), Unsec. Sub. Notes, 5.70%, 03/26/44(b) | 960,000 | 976,145 | ||||||
| Principal Amount | Value | |||||||
| Diversified Banks–(continued) | ||||||||
VTB Bank OJSC Via VTB Capital S.A. (Russia), REGS, Unsec. Sub. Euro Bonds, 6.95%, 10/17/22(b) | $ | 340,000 | $ | 298,996 | ||||
Wells Fargo & Co., | 3,500,000 | 3,764,001 | ||||||
Series U, Jr. Unsec. Sub. Global Notes, 5.88%(d) | 2,835,000 | 2,905,875 | ||||||
| 49,311,848 | ||||||||
| Diversified Capital Markets–0.78% | ||||||||
Credit Suisse Group Funding (Guernsey) Ltd. (Switzerland), | 1,965,000 | 1,905,036 | ||||||
4.88%, 05/15/45(b) | 5,640,000 | 5,573,115 | ||||||
| 7,478,151 | ||||||||
| Diversified Chemicals–0.23% | ||||||||
OCP S.A. (Morocco), Sr. Unsec. | 2,302,000 | 2,166,757 | ||||||
Tronox Finance LLC, Sr. Unsec. | 32,000 | 25,920 | ||||||
| 2,192,677 | ||||||||
| Diversified Metals & Mining–1.33% | ||||||||
Anglo American Capital PLC (United Kingdom), | ||||||||
3.63%, 05/14/20(b) | 1,283,000 | 1,226,733 | ||||||
Sr. Unsec. Gtd. Notes, | ||||||||
4.13%, 04/15/21(b) | 3,301,000 | 3,087,515 | ||||||
4.88%, 05/14/25(b) | 1,981,000 | 1,743,062 | ||||||
Compass Minerals International, Inc., Sr. Unsec. Gtd. Notes, 4.88%, 07/15/24(b) | 59,000 | 57,083 | ||||||
Rio Tinto Finance USA Ltd. (United Kingdom), Sr. Unsec. Gtd. Global Notes, 7.13%, 07/15/28 | 565,000 | 709,306 | ||||||
Teck Resources Ltd. (Canada), | ||||||||
5.20%, 03/01/42 | 1,817,000 | 1,144,279 | ||||||
Sr. Unsec. Gtd. Yankee Notes, | ||||||||
4.50%, 01/15/21 | 5,960,000 | 4,735,667 | ||||||
| 12,703,645 | ||||||||
| Diversified Real Estate Activities–0.18% | ||||||||
Brookfield Asset Management Inc. (Canada), Sr. Unsec. Yankee Notes, 4.00%, 01/15/25 | 1,705,000 | 1,678,831 | ||||||
| Diversified REIT’s–0.70% | ||||||||
Select Income REIT, Sr. Unsec. Global Notes, 4.50%, 02/01/25 | 1,570,000 | 1,513,933 | ||||||
W.P. Carey Inc., Sr. Unsec. Notes, 4.00%, 02/01/25 | 5,375,000 | 5,202,806 | ||||||
| 6,716,739 | ||||||||
See accompanying Notes to Financial Statements which are an integral part of the financial statements.
13 Invesco Core Plus Bond Fund
| Principal Amount | Value | |||||||
| Electric Utilities–1.22% | ||||||||
Appalachian Power Co., Sr. Unsec. Notes, 4.45%, 06/01/45 | $ | 2,679,000 | $ | 2,576,619 | ||||
Duke Energy Carolinas, LLC, Sr. Sec. First Mortgage Bonds, 3.90%, 06/15/21 | 4,379,000 | 4,666,473 | ||||||
Electricite de France S.A. (France), Jr. Unsec. Sub. Notes, 5.63%(b)(d) | 1,535,000 | 1,560,327 | ||||||
Majapahit Holding B.V. (Indonesia), REGS, Sr. Unsec. Gtd. Euro Notes, 7.75%, 01/20/20(b) | 200,000 | 224,750 | ||||||
Potomac Electric Power Co., | 2,650,000 | 2,574,074 | ||||||
| 11,602,243 | ||||||||
| Electrical Components & Equipment–0.03% | ||||||||
EnerSys, Sr. Unsec. Gtd. Notes, 5.00%, 04/30/23(b) | 173,000 | 167,594 | ||||||
Sensata Technologies B.V. (Netherlands), Sr. Unsec. | ||||||||
4.88%, 10/15/23(b) | 40,000 | 39,500 | ||||||
5.00%, 10/01/25(b) | 60,000 | 58,650 | ||||||
| 265,744 | ||||||||
| Environmental & Facilities Services–0.01% | ||||||||
ADS Waste Holdings, Inc., Sr. Unsec. Gtd. Global Notes, 8.25%, 10/01/20 | 128,000 | 133,280 | ||||||
| Gas Utilities–0.35% | ||||||||
Ferrellgas L.P./Ferrellgas | ||||||||
6.50%, 05/01/21 | 120,000 | 117,000 | ||||||
6.75%, 01/15/22 | 30,000 | 29,250 | ||||||
Sr. Unsec. Gtd. Notes, | ||||||||
6.75%, 06/15/23(b) | 65,000 | 63,050 | ||||||
Kinder Morgan Finance Co. LLC, | 2,851,000 | 3,042,934 | ||||||
Suburban Propane Partners, L.P./Suburban Energy Finance Corp., Sr. Unsec. Global Notes, 5.50%, 06/01/24 | 40,000 | 37,800 | ||||||
| 3,290,034 | ||||||||
| General Merchandise Stores–0.04% | ||||||||
Dollar Tree, Inc., Sr. Unsec. Gtd. Notes, 5.75%, 03/01/23(b) | 396,000 | 417,780 | ||||||
| Gold–0.12% | ||||||||
Kinross Gold Corp. (Canada), | 1,365,000 | 1,167,792 | ||||||
| Health Care Equipment–0.21% | ||||||||
Becton, Dickinson and Co., | 1,989,000 | 1,999,899 | ||||||
| Principal Amount | Value | |||||||
| Health Care Facilities–0.26% | ||||||||
Acadia Healthcare Co., Inc., | $ | 69,000 | $ | 70,208 | ||||
Community Health Systems, Inc., | ||||||||
5.13%, 08/01/21 | 33,000 | 34,155 | ||||||
Sr. Unsec. Gtd. Global Notes, | ||||||||
6.88%, 02/01/22 | 59,737 | 63,769 | ||||||
HCA Holdings, Inc., Sr. Unsec. Notes, 6.25%, 02/15/21 | 130,000 | 141,700 | ||||||
HCA, Inc., | ||||||||
5.88%, 03/15/22 | 186,000 | 203,379 | ||||||
6.50%, 02/15/20 | 675,000 | 750,516 | ||||||
Sr. Sec. Gtd. First Lien Notes, | ||||||||
5.25%, 04/15/25 | 40,000 | 41,750 | ||||||
Sr. Unsec. Gtd. Notes, | ||||||||
5.38%, 02/01/25 | 402,000 | 412,050 | ||||||
Surgical Care Affiliates, Inc., | 159,000 | 161,385 | ||||||
Tenet Healthcare Corp., Sr. Unsec. Global Notes, | ||||||||
6.75%, 02/01/20 | 40,000 | 42,200 | ||||||
6.75%, 06/15/23 | 53,000 | 55,120 | ||||||
8.13%, 04/01/22 | 438,000 | 486,180 | ||||||
| 2,462,412 | ||||||||
| Health Care REIT’s–0.44% | ||||||||
HCP, Inc., Sr. Unsec. Global Notes, 4.25%, 11/15/23 | 1,305,000 | 1,304,091 | ||||||
Senior Housing Properties Trust, | 2,550,000 | 2,884,172 | ||||||
| 4,188,263 | ||||||||
| Health Care Services–0.76% | ||||||||
DaVita HealthCare Partners Inc., | 240,000 | 237,000 | ||||||
Express Scripts Holding Co., | 958,000 | 922,819 | ||||||
Laboratory Corp. of America Holdings, Sr. Unsec. Notes, | ||||||||
3.60%, 02/01/25 | 3,974,000 | 3,808,221 | ||||||
4.70%, 02/01/45 | 2,261,000 | 2,066,469 | ||||||
MPH Acquisition Holdings LLC, | 169,000 | 174,070 | ||||||
Omnicare Inc., Sr. Unsec. Gtd. Notes, 5.00%, 12/01/24 | 40,000 | 43,150 | ||||||
| 7,251,729 | ||||||||
| Home Improvement Retail–0.03% | ||||||||
Hillman Group Inc. (The), Sr. Unsec. Notes, 6.38%, 07/15/22(b) | 287,000 | 269,780 | ||||||
See accompanying Notes to Financial Statements which are an integral part of the financial statements.
14 Invesco Core Plus Bond Fund
| Principal Amount | Value | |||||||
| Homebuilding–0.27% | ||||||||
Ashton Woods USA LLC/Ashton Woods Finance Co., Sr. Unsec. Notes, 6.88%, 02/15/21(b) | $ | 301,000 | $ | 282,940 | ||||
Beazer Homes USA Inc., Sr. Unsec. Gtd. Global Notes, 7.50%, 09/15/21 | 281,000 | 278,190 | ||||||
K. Hovnanian Enterprises Inc., | ||||||||
Sr. Sec. Gtd. First Lien Notes, | ||||||||
7.25%, 10/15/20(b) | 26,000 | 25,578 | ||||||
Sr. Unsec. Gtd. Notes, | ||||||||
7.00%, 01/15/19(b) | 165,000 | 128,081 | ||||||
8.00%, 11/01/19(b) | 225,000 | 174,094 | ||||||
KB Home, Sr. Unsec. Gtd. Notes, | ||||||||
7.00%, 12/15/21 | 42,000 | 42,735 | ||||||
7.50%, 09/15/22 | 20,000 | 20,925 | ||||||
Lennar Corp., Sr. Unsec. Gtd. Global Notes, 4.75%, 11/15/22 | 60,000 | 59,850 | ||||||
MDC Holdings, Inc., Sr. Unsec. Gtd. Notes, 6.00%, 01/15/43 | 1,470,000 | 1,234,436 | ||||||
Meritage Homes Corp., Sr. Unsec. Gtd. Global Notes, | ||||||||
6.00%, 06/01/25 | 65,000 | 64,838 | ||||||
7.15%, 04/15/20 | 55,000 | 59,606 | ||||||
Ryland Group Inc. (The), Sr. Unsec. Gtd. Notes, 5.38%, 10/01/22 | 177,000 | 179,876 | ||||||
| 2,551,149 | ||||||||
| Hotels, Resorts & Cruise Lines–0.00% | ||||||||
Choice Hotels International, Inc., | 40,000 | 43,088 | ||||||
| Household Products–0.07% | ||||||||
Reynolds Group Issuer Inc./LLC (New Zealand), | ||||||||
Sr. Sec. Gtd. First Lien | ||||||||
5.75%, 10/15/20 | 147,000 | 152,329 | ||||||
Sr. Unsec. Gtd. Global Notes, | ||||||||
8.25%, 02/15/21 | 350,000 | 359,187 | ||||||
Springs Industries, Inc., Sr. Sec. Global Notes, 6.25%, 06/01/21 | 140,000 | 140,175 | ||||||
| 651,691 | ||||||||
| Housewares & Specialties–0.34% | ||||||||
Tupperware Brands Corp., | 3,157,000 | 3,271,880 | ||||||
| Hypermarkets & Super Centers–0.37% | ||||||||
Cencosud S.A. (Chile), REGS, | 200,000 | 198,578 | ||||||
Wal-Mart Stores, Inc., Sr. Unsec. Global Notes, 4.25%, 04/15/21 | 3,046,000 | 3,326,509 | ||||||
| 3,525,087 | ||||||||
| Principal Amount | Value | |||||||
| Independent Power Producers & Energy Traders–0.05% | ||||||||
AES Corp., | ||||||||
Sr. Unsec. Global Notes, | ||||||||
7.38%, 07/01/21 | $ | 66,000 | $ | 71,445 | ||||
Sr. Unsec. Notes, | ||||||||
5.50%, 04/15/25 | 200,000 | 189,000 | ||||||
Calpine Corp., | ||||||||
Sr. Sec. Gtd. First Lien Notes, | ||||||||
5.88%, 01/15/24(b) | 11,000 | 11,619 | ||||||
7.88%, 01/15/23(b) | 80,000 | 86,800 | ||||||
Sr. Unsec. Global Notes, | ||||||||
5.38%, 01/15/23 | 58,000 | 56,550 | ||||||
5.50%, 02/01/24 | 102,000 | 99,577 | ||||||
| 514,991 | ||||||||
| Industrial Conglomerates–0.34% | ||||||||
ALFA, S.A.B. de C.V. (Mexico), REGS, Sr. Unsec. Euro Notes, 5.25%, 03/25/24(b) | 400,000 | 413,000 | ||||||
Siemens Financieringsmaatschappij N.V. (Germany), Sr. Unsec. | ||||||||
2.15%, 05/27/20(b) | 1,701,000 | 1,691,649 | ||||||
3.25%, 05/27/25(b) | 1,190,000 | 1,166,621 | ||||||
| 3,271,270 | ||||||||
| Industrial Machinery–0.50% | ||||||||
Ingersoll-Rand Luxembourg Finance S.A., Sr. Unsec. Gtd. | ||||||||
2.63%, 05/01/20 | 664,000 | 660,391 | ||||||
4.65%, 11/01/44 | 1,321,000 | 1,245,254 | ||||||
Optimas OE Solutions Holding, LLC/Optimas OE Solutions, Inc., Sr. Sec. Notes, 8.63%, 06/01/21(b) | 126,000 | 122,850 | ||||||
Valmont Industries, Inc., Sr. Unsec. Gtd. Global Notes, 5.25%, 10/01/54 | 2,916,000 | 2,595,873 | ||||||
Waterjet Holdings, Inc., Sr. Sec. Gtd. Notes, 7.63%, 02/01/20(b) | 116,000 | 116,435 | ||||||
| 4,740,803 | ||||||||
| Industrial REIT’s–0.15% | ||||||||
Prologis L.P., Sr. Unsec. Gtd. Global Notes, 4.25%, 08/15/23 | 1,415,000 | 1,454,461 | ||||||
| Integrated Oil & Gas–0.31% | ||||||||
BP Capital Markets PLC (United Kingdom), Sr. Unsec. Gtd. Global Bonds, 3.54%, 11/04/24 | 1,730,000 | 1,696,117 | ||||||
California Resources Corp., | 233,000 | 181,740 | ||||||
Ecopetrol S.A. (Colombia), | ||||||||
Sr. Unsec. Global Notes, | ||||||||
4.13%, 01/16/25 | 500,000 | 441,875 | ||||||
Sr. Unsec. Global Notes, | ||||||||
5.38%, 06/26/26 | 303,000 | 282,169 | ||||||
Petrobras Global Finance B.V. (Brazil), Sr. Unsec. Gtd. Global Notes, 6.85%, 06/05/2115 | 290,000 | 219,646 | ||||||
See accompanying Notes to Financial Statements which are an integral part of the financial statements.
15 �� Invesco Core Plus Bond Fund
| Principal Amount | Value | |||||||
| Integrated Oil & Gas–(continued) | ||||||||
Petroleos Mexicanos (Mexico), | $ | 100,000 | $ | 100,657 | ||||
| 2,922,204 | ||||||||
| Integrated Telecommunication Services–1.16% | ||||||||
AT&T Inc., Sr. Unsec. Global Notes, | ||||||||
3.40%, 05/15/25 | 1,567,000 | 1,488,385 | ||||||
4.75%, 05/15/46 | 2,287,000 | 2,074,953 | ||||||
Telecom Italia S.p.A. (Italy), | 540,000 | 551,135 | ||||||
Verizon Communications Inc., | ||||||||
4.52%, 09/15/48 | 4,812,000 | 4,258,923 | ||||||
5.01%, 08/21/54 | 1,698,000 | 1,558,143 | ||||||
5.15%, 09/15/23 | 665,000 | 727,635 | ||||||
6.40%, 09/15/33 | 342,000 | 392,298 | ||||||
| 11,051,472 | ||||||||
| Internet Retail–0.01% | ||||||||
Netflix, Inc., Sr. Unsec. Global Notes, 5.75%, 03/01/24 | 121,000 | 126,445 | ||||||
| Internet Software & Services–0.80% | ||||||||
Alibaba Group Holding Ltd. (China), Sr. Unsec. Gtd. Notes, | ||||||||
3.13%, 11/28/21(b) | 2,207,000 | 2,139,295 | ||||||
3.60%, 11/28/24(b) | 1,665,000 | 1,574,491 | ||||||
4.50%, 11/28/34(b) | 1,124,000 | 1,050,870 | ||||||
EarthLink Holdings Corp., Sr. Sec. Gtd. First Lien Global Notes, 7.38%, 06/01/20 | 186,000 | 194,835 | ||||||
Equinix Inc., Sr. Unsec. Notes, | ||||||||
5.38%, 01/01/22 | 111,000 | 112,387 | ||||||
5.38%, 04/01/23 | 265,000 | 267,981 | ||||||
Tencent Holdings Ltd. (China), | 2,255,000 | 2,279,938 | ||||||
| 7,619,797 | ||||||||
| Investment Banking & Brokerage–0.37% | ||||||||
Cantor Fitzgerald, L.P., Unsec. Notes, 6.50%, 06/17/22(b) | 1,896,000 | 1,978,903 | ||||||
Charles Schwab Corp. (The), | 1,315,000 | 1,508,962 | ||||||
| 3,487,865 | ||||||||
| Leisure Products–0.03% | ||||||||
Party City Holdings Inc., Sr. Unsec. Gtd. Notes, 6.13%, 08/15/23(b) | 102,000 | 103,658 | ||||||
Vista Outdoor Inc., Sr. Unsec. Gtd. Notes, 5.88%, 10/01/23(b) | 176,000 | 180,400 | ||||||
| 284,058 | ||||||||
| Principal Amount | Value | |||||||
| Life & Health Insurance–1.13% | ||||||||
Forethought Financial Group, Inc., Sr. Unsec. Notes, 8.63%, 04/15/21(b) | $ | 50,000 | $ | 57,700 | ||||
MetLife, Inc., | ||||||||
4.13%, 08/13/42 | 2,200,000 | 2,051,124 | ||||||
Series C, Jr. Unsec. Sub. | 3,605,000 | 3,659,075 | ||||||
Nationwide Financial Services, Inc., Sr. Unsec. Notes, | 735,000 | 812,805 | ||||||
Prudential Financial, Inc., Jr. Unsec. Sub. Global Notes, 8.88%, 06/15/38 | 1,640,000 | 1,898,300 | ||||||
TIAA Asset Management Finance Co. LLC, Sr. Unsec. Notes, 4.13%, 11/01/24(b) | 2,235,000 | 2,257,972 | ||||||
| 10,736,976 | ||||||||
| Managed Health Care–0.67% | ||||||||
UnitedHealth Group Inc., Sr. Unsec. Global Notes, 3.75%, 07/15/25 | 6,261,000 | 6,396,100 | ||||||
| Marine–0.05% | ||||||||
Navios Maritime Acquisition Corp./Navios Acquisition Finance U.S. Inc., Sr. Sec. Gtd. First Lien Mortgage Notes, 8.13%, 11/15/21(b) | 318,000 | 306,075 | ||||||
PT Pelabuhan Indonesia II (Indonesia), Sr. Unsec. Notes, 4.25%, 05/05/25(b) | 200,000 | 178,250 | ||||||
| 484,325 | ||||||||
| Metal & Glass Containers–0.03% | ||||||||
Berry Plastics Corp., Sec. Gtd. Second Lien Notes, 5.50%, 05/15/22 | 144,000 | 140,400 | ||||||
Owens-Brockway Glass Container, Inc., Sr. Unsec. Gtd. Notes, | ||||||||
5.00%, 01/15/22(b) | 25,000 | 24,750 | ||||||
5.88%, 08/15/23(b) | 49,000 | 49,796 | ||||||
6.38%, 08/15/25(b) | 74,000 | 75,850 | ||||||
| 290,796 | ||||||||
| Movies & Entertainment–0.22% | ||||||||
Time Warner, Inc., Sr. Unsec. Gtd. Global Deb., 5.35%, 12/15/43 | 2,100,000 | 2,121,584 | ||||||
| Multi-Line Insurance–0.22% | ||||||||
Nationwide Mutual Insurance Co., Unsec. Sub. Notes, 4.95%, 04/22/44(b) | 2,185,000 | 2,123,288 | ||||||
| Multi-Sector Holdings–0.46% | ||||||||
BNSF Railway Co. Pass Through Trust, Series 2015-1, Sr. Sec. First Lien Pass-Through Ctfs., 3.44%, 06/16/28(b) | 4,201,000 | 4,196,713 | ||||||
See accompanying Notes to Financial Statements which are an integral part of the financial statements.
16 Invesco Core Plus Bond Fund
| Principal Amount | Value | |||||||
| Multi-Sector Holdings–(continued) | ||||||||
SUAM Finance B.V. (Colombia), | $ | 200,000 | $ | 202,257 | ||||
| 4,398,970 | ||||||||
| Multi-Utilities–0.23% | ||||||||
Enable Midstream Partners L.P., | 2,525,000 | 2,221,325 | ||||||
| Office REIT’s–0.19% | ||||||||
CyrusOne L.P./CyrusOne Finance Corp., Sr. Unsec. Gtd. Global Notes, 6.38%, 11/15/22 | 259,000 | 264,827 | ||||||
Piedmont Operating Partnership L.P., Sr. Unsec. Gtd. Global Notes, 4.45%, 03/15/24 | 1,290,000 | 1,299,153 | ||||||
Wanda Properties International Co., Ltd. (China), REGS, Sr. Unsec. Gtd. Euro Bonds, 7.25%, 01/29/24 | 200,000 | 215,111 | ||||||
| 1,779,091 | ||||||||
| Office Services & Supplies–0.55% | ||||||||
Pitney Bowes Inc., Sr. Unsec. Global Notes, 4.63%, 03/15/24 | 1,070,000 | 1,071,152 | ||||||
Steelcase, Inc., Sr. Unsec. Global Bonds, 6.38%, 02/15/21 | 3,730,000 | 4,200,118 | ||||||
| 5,271,270 | ||||||||
| Oil & Gas Drilling–0.19% | ||||||||
Rowan Cos., Inc., Sr. Unsec. Gtd. Notes, 5.85%, 01/15/44 | 2,495,000 | 1,815,029 | ||||||
| Oil & Gas Equipment & Services–0.75% | ||||||||
Bristow Group, Inc., Sr. Unsec. Gtd. Notes, 6.25%, 10/15/22 | 42,000 | 36,750 | ||||||
Odebrecht Oil & Gas Finance Ltd. (Brazil), | 200,000 | 88,500 | ||||||
REGS, Sr. Unsec. Gtd. Euro Notes, 7.00%(b)(d) | 301,000 | 131,687 | ||||||
Petrofac Ltd. (United Kingdom), | 7,020,000 | 6,924,872 | ||||||
| 7,181,809 | ||||||||
| Oil & Gas Exploration & Production–0.63% | ||||||||
Antero Resources Corp., Sr. Unsec. Gtd. Global Notes, | ||||||||
5.38%, 11/01/21 | 119,000 | 110,670 | ||||||
6.00%, 12/01/20 | 91,000 | 87,815 | ||||||
Carrizo Oil & Gas, Inc., | ||||||||
Sr. Unsec. Gtd. Global Notes, | ||||||||
6.25%, 04/15/23 | 195,000 | 176,963 | ||||||
Sr. Unsec. Gtd. Notes, | ||||||||
7.50%, 09/15/20 | 4,000 | 3,840 | ||||||
Chaparral Energy, Inc., Sr. Unsec. Gtd. Global Notes, 9.88%, 10/01/20 | 137,000 | 72,610 | ||||||
| Principal Amount | Value | |||||||
| Oil & Gas Exploration & Production–(continued) | ||||||||
Chesapeake Energy Corp., | $ | 89,000 | $ | 71,868 | ||||
Concho Resources Inc., Sr. Unsec. Gtd. Global Notes, | ||||||||
5.50%, 10/01/22 | 61,000 | 60,619 | ||||||
5.50%, 04/01/23 | 368,000 | 365,240 | ||||||
Denbury Resources Inc., Sr. Unsec. Gtd. Sub. Notes, 5.50%, 05/01/22 | 118,000 | 85,255 | ||||||
Devon Energy Corp., Sr. Unsec. Global Notes, 2.25%, 12/15/18 | 910,000 | 908,302 | ||||||
Gulfport Energy Corp., Sr. Unsec. Gtd. Notes, 6.63%, 05/01/23(b) | 49,000 | 46,305 | ||||||
Halcón Resources Corp., Sec. Gtd. Second Lien Notes, | 59,000 | 52,363 | ||||||
KazMunayGas National Co. JSC (Kazakhstan), Sr. Unsec. Notes, | ||||||||
4.40%, 04/30/23(b) | 200,000 | 176,500 | ||||||
7.00%, 05/05/20(b) | 210,000 | 217,875 | ||||||
Laredo Petroleum, Inc., Sr. Unsec. Gtd. Global Notes, 7.38%, 05/01/22 | 174,000 | 171,390 | ||||||
Noble Energy Inc., Sr. Unsec. Notes, 3.90%, 11/15/24 | 1,098,000 | 1,037,706 | ||||||
Pacific Rubiales Energy Corp. (Colombia), REGS, Sr. Unsec. Gtd. Euro Notes, 5.13%, 03/28/23(b) | 111,000 | 56,055 | ||||||
Parsley Energy LLC/Parsley Finance Corp., Sr. Unsec. Notes, 7.50%, 02/15/22(b) | 88,000 | 86,680 | ||||||
Pertamina Persero PT (Indonesia), REGS, Sr. Unsec. Medium-Term Euro Notes, 4.30%, 05/20/23(b) | 400,000 | 370,520 | ||||||
QEP Resources Inc., Sr. Unsec. Notes, 5.38%, 10/01/22 | 140,000 | 121,800 | ||||||
Range Resources Corp., | ||||||||
Sr. Unsec. Gtd. Sub. | ||||||||
5.00%, 03/15/23 | 139,000 | 127,185 | ||||||
Sr. Unsec. Gtd. Sub. Notes, | ||||||||
5.00%, 08/15/22 | 371,000 | 344,102 | ||||||
5.75%, 06/01/21 | 87,000 | 84,390 | ||||||
Rice Energy Inc., Sr. Unsec. Gtd. Notes, 7.25%, 05/01/23(b) | 196,000 | 184,240 | ||||||
RSP Permian, Inc., Sr. Unsec. | ||||||||
6.63%, 10/01/22(b) | 30,000 | 29,700 | ||||||
6.63%, 10/01/22(b) | 78,000 | 77,220 | ||||||
SandRidge Energy, Inc., Sr. Unsec. Gtd. Global Notes, 7.50%, 03/15/21 | 85,000 | 24,650 | ||||||
SM Energy Co., Sr. Unsec. | ||||||||
6.13%, 11/15/22 | 164,000 | 154,570 | ||||||
6.50%, 11/15/21 | 395,000 | 385,125 | ||||||
6.50%, 01/01/23 | 68,000 | 65,620 | ||||||
See accompanying Notes to Financial Statements which are an integral part of the financial statements.
17 Invesco Core Plus Bond Fund
| Principal Amount | Value | |||||||
| Oil & Gas Exploration & Production–(continued) | ||||||||
Whiting Petroleum Corp., Sr. Unsec. Gtd. Notes, | ||||||||
5.00%, 03/15/19 | $ | 71,000 | $ | 63,900 | ||||
5.75%, 03/15/21 | 50,000 | 45,000 | ||||||
WPX Energy, Inc., Sr. Unsec. Notes, 7.50%, 08/01/20 | 189,700 | 183,060 | ||||||
| 6,049,138 | ||||||||
| Oil & Gas Refining & Marketing–0.06% | ||||||||
Reliance Industries Ltd. (India), REGS, Sr. Unsec. Euro Notes, 4.13%, 01/28/25(b) | 590,000 | 576,019 | ||||||
| Oil & Gas Storage & Transportation–1.77% | ||||||||
Crestwood Midstream Partners L.P./ Crestwood Midstream | ||||||||
Sr. Unsec. Gtd. Global Bonds, | ||||||||
6.13%, 03/01/22 | 48,000 | 44,400 | ||||||
Sr. Unsec. Gtd. Global Notes, | ||||||||
6.00%, 12/15/20 | 237,000 | 223,965 | ||||||
Energy Transfer Equity, L.P., | ||||||||
Sr. Sec. First Lien Notes, | ||||||||
5.50%, 06/01/27 | 123,000 | 115,620 | ||||||
Sr. Sec. Gtd. First Lien Notes, | ||||||||
7.50%, 10/15/20 | 50,000 | 53,813 | ||||||
Enterprise Products Operating LLC, Sr. Unsec. Gtd. Notes, 3.75%, 02/15/25 | 1,594,000 | 1,522,967 | ||||||
EQT Midstream Partners L.P., | 2,255,000 | 2,028,085 | ||||||
Genesis Energy L.P./Genesis Energy Finance Corp., Sr. Unsec. Gtd. Notes, 6.75%, 08/01/22 | 134,000 | 130,650 | ||||||
Kinder Morgan Inc., Sr. Unsec. Gtd. Notes, 5.30%, 12/01/34 | 1,167,000 | 1,012,147 | ||||||
MarkWest Energy Partners, L.P./ MarkWest Energy Finance Corp., Sr. Unsec. Gtd. Notes, | ||||||||
4.88%, 06/01/25 | 125,000 | 116,250 | ||||||
5.50%, 02/15/23 | 194,000 | 191,090 | ||||||
NGL Energy Partners L.P./NGL Energy Finance Corp., Sr. Unsec. Gtd. Global Notes, 6.88%, 10/15/21 | 57,000 | 55,575 | ||||||
Sabine Pass Liquefaction, LLC, | 200,000 | 197,500 | ||||||
Spectra Energy Partners, L.P., | ||||||||
3.50%, 03/15/25 | 3,053,000 | 2,832,009 | ||||||
4.50%, 03/15/45 | 2,490,000 | 2,074,994 | ||||||
Targa Resources Partners L.P./ Targa Resources Partners Finance Corp., | ||||||||
Sr. Unsec. Gtd. Global Bonds, | ||||||||
5.25%, 05/01/23 | 89,000 | 84,105 | ||||||
Sr. Unsec. Gtd. Global Notes, | ||||||||
6.88%, 02/01/21 | 94,000 | 94,470 | ||||||
| Principal Amount | Value | |||||||
| Oil & Gas Storage & Transportation–(continued) | ||||||||
Teekay Corp. (Bermuda), Sr. Unsec. Global Notes, 8.50%, 01/15/20 | $ | 35,000 | $ | 36,619 | ||||
Teekay Offshore Partners L.P./Teekay Offshore Finance Corp. (Bermuda), Sr. Unsec. Global Notes, 6.00%, 07/30/19 | 81,000 | 69,052 | ||||||
Tesoro Logistics L.P./Tesoro Logistics Finance Corp., | 133,000 | 133,997 | ||||||
Texas Eastern Transmission L.P., Sr. Unsec. Notes, 7.00%, 07/15/32 | 255,000 | 305,822 | ||||||
Williams Partners L.P., Sr. Unsec. Global Notes, | 5,289,000 | 4,728,898 | ||||||
Williams Partners L.P./ACMP Finance Corp., Sr. Unsec. Global Notes, 4.88%, 05/15/23 | 810,000 | 765,450 | ||||||
| 16,817,478 | ||||||||
| Other Diversified Financial Services–0.46% | ||||||||
BOC Aviation Pte. Ltd. (Singapore), Sr. Unsec. Notes, | 2,477,000 | 2,436,045 | ||||||
Neuberger Berman Group LLC/Neuberger Berman Finance Corp., Sr. Unsec. Notes, 4.88%, 04/15/45(b) | 2,125,000 | 1,955,000 | ||||||
| 4,391,045 | ||||||||
| Packaged Foods & Meats–1.27% | ||||||||
Chiquita Brands International Inc., Sr. Unsec. Conv. Notes, 4.25%, 08/15/16 | 5,805,000 | 5,805,000 | ||||||
Diamond Foods Inc., Sr. Unsec. Gtd. Notes, 7.00%, 03/15/19(b) | 302,000 | 311,438 | ||||||
FAGE Dairy Industry S.A./FAGE USA Dairy Industry, Inc. (Greece), | 100,000 | 104,260 | ||||||
Gruma, S.A.B. de C.V. (Mexico), REGS, Sr. Unsec. Euro Notes, 4.88%, 12/01/24(b) | 320,000 | 337,120 | ||||||
JBS Investments GmbH (Brazil), | 2,154,000 | 2,170,155 | ||||||
Marfrig Overseas Ltd. (Brazil), REGS, Sr. Unsec. Gtd. Euro Notes, 9.50%, 05/04/20(b) | 440,000 | 447,150 | ||||||
Smithfield Foods Inc., Sr. Unsec. Notes, 6.63%, 08/15/22 | 2,687,000 | 2,871,731 | ||||||
WhiteWave Foods Co. (The), | 61,000 | 63,440 | ||||||
| 12,110,294 | ||||||||
See accompanying Notes to Financial Statements which are an integral part of the financial statements.
18 Invesco Core Plus Bond Fund
| Principal Amount | Value | |||||||
| Paper Packaging–0.23% | ||||||||
Graphic Packaging International Inc., Sr. Unsec. Gtd. Notes, | ||||||||
4.75%, 04/15/21 | $ | 468,000 | $ | 477,360 | ||||
4.88%, 11/15/22 | 65,000 | 65,813 | ||||||
Klabin Finance S.A. (Brazil), | 1,770,000 | 1,677,296 | ||||||
| 2,220,469 | ||||||||
| Paper Products–0.49% | ||||||||
Clearwater Paper Corp., | ||||||||
4.50%, 02/01/23 | 26,000 | 24,830 | ||||||
Sr. Unsec. Gtd. Notes, | ||||||||
5.38%, 02/01/25(b) | 66,000 | 64,350 | ||||||
International Paper Co., Sr. Unsec. Global Notes, | ||||||||
3.80%, 01/15/26 | 991,000 | 961,956 | ||||||
5.15%, 05/15/46 | 3,418,000 | 3,315,754 | ||||||
Mercer International Inc., Sr. Unsec. Gtd. Global Notes, 7.00%, 12/01/19 | 87,000 | 89,501 | ||||||
PH Glatfelter Co., Sr. Unsec. Gtd. Global Notes, 5.38%, 10/15/20 | 168,000 | 171,570 | ||||||
| 4,627,961 | ||||||||
| Personal Products–0.01% | ||||||||
Elizabeth Arden, Inc., Sr. Unsec. Global Notes, 7.38%, 03/15/21 | 121,000 | 78,953 | ||||||
| Pharmaceuticals–1.32% | ||||||||
Actavis Funding SCS, Sr. Unsec. Gtd. Global Notes, 3.00%, 03/12/20 | 4,574,000 | 4,531,375 | ||||||
Bayer US Finance LLC (Germany), Sr. Unsec. Gtd. Notes, | 2,202,000 | 2,215,788 | ||||||
Bristol-Myers Squibb Co., Sr. Unsec. Deb., 6.88%, 08/01/97 | 2,492,000 | 3,358,572 | ||||||
Concordia Healthcare Corp. (Canada), Sr. Unsec. Gtd. Notes, 7.00%, 04/15/23(b) | 263,000 | 271,547 | ||||||
Perrigo Finance PLC, Sr. Unsec. Gtd. Yankee Bonds, 3.90%, 12/15/24 | 1,654,000 | 1,606,258 | ||||||
Quintiles Transnational Corp., | 30,000 | 30,675 | ||||||
Valeant Pharmaceuticals International, Inc., Sr. Unsec. Gtd. Notes, | ||||||||
5.50%, 03/01/23(b) | 55,000 | 55,688 | ||||||
5.63%, 12/01/21(b) | 130,000 | 133,087 | ||||||
5.88%, 05/15/23(b) | 33,000 | 33,908 | ||||||
6.13%, 04/15/25(b) | 344,000 | 356,900 | ||||||
| 12,593,798 | ||||||||
| Property & Casualty Insurance–1.07% | ||||||||
Allstate Corp. (The), Unsec. Sub. Global Deb., 5.75%, 08/15/53 | 2,085,000 | 2,165,793 | ||||||
| Principal Amount | Value | |||||||
| Property & Casualty Insurance–(continued) | ||||||||
Liberty Mutual Group Inc., | $ | 1,320,000 | $ | 1,547,700 | ||||
Travelers Cos., Inc. (The), | 3,880,000 | 3,822,679 | ||||||
XLIT Ltd. (Ireland), Unsec. Sub. Gtd. Yankee Notes, 4.45%, 03/31/25 | 2,675,000 | 2,644,247 | ||||||
| 10,180,419 | ||||||||
| Railroads–0.50% | ||||||||
Burlington Northern Santa Fe, LLC, Sr. Unsec. Global Deb., 3.00%, 04/01/25 | 2,657,000 | 2,530,968 | ||||||
Lima Metro Line 2 Finance Ltd. (Peru), Sr. Sec. First Lien Bonds, 5.88%, 07/05/34(b) | 200,000 | 204,000 | ||||||
Transnet SOC Ltd. (South Africa), Sr. Unsec. Notes, | ||||||||
4.00%, 07/26/22(b) | 400,000 | 376,000 | ||||||
REGS, Sr. Unsec. Euro Notes, 4.00%, 07/26/22(b) | 400,000 | 377,200 | ||||||
Union Pacific Corp., Sr. Unsec. Notes, 3.25%, 08/15/25 | 1,335,000 | 1,321,506 | ||||||
| 4,809,674 | ||||||||
| Real Estate Development–0.05% | ||||||||
AV Homes, Inc., Sr. Unsec. Gtd. Global Notes, 8.50%, 07/01/19 | 40,000 | 40,250 | ||||||
Country Garden Holdings Co. Ltd. (China), REGS, Sr. Unsec. Gtd. Euro Notes, 7.50%, 01/10/23(b) | 200,000 | 198,000 | ||||||
Shimao Property Holdings Ltd. (Hong Kong), REGS, Sr. Unsec. Gtd. Euro Bonds, 8.38%, 02/10/22 | 200,000 | 204,106 | ||||||
| 442,356 | ||||||||
| Regional Banks–0.65% | ||||||||
Banco Internacional del Perú S.A.A. (Peru), Unsec. Sub. Notes, 6.63%, 03/19/29(b) | 500,000 | 527,429 | ||||||
CIT Group Inc., Sr. Unsec. | ||||||||
5.00%, 08/15/22 | 222,000 | 226,995 | ||||||
5.00%, 08/01/23 | 35,000 | 35,525 | ||||||
Fifth Third Bancorp, | ||||||||
3.50%, 03/15/22 | 1,550,000 | 1,568,591 | ||||||
Series J, Jr. Unsec. Sub. Bonds, | ||||||||
4.90%(d) | 1,520,000 | 1,436,400 | ||||||
First Niagara Financial Group Inc., Unsec. Sub. Notes, 7.25%, 12/15/21 | 650,000 | 731,617 | ||||||
SVB Financial Group, Sr. Unsec. Global Notes, 3.50%, 01/29/25 | 1,455,000 | 1,409,576 | ||||||
Synovus Financial Corp., Sr. Unsec. Global Notes, 7.88%, 02/15/19 | 185,000 | 209,512 | ||||||
| 6,145,645 | ||||||||
See accompanying Notes to Financial Statements which are an integral part of the financial statements.
19 Invesco Core Plus Bond Fund
| Principal Amount | Value | |||||||
| Reinsurance–0.19% | ||||||||
Reinsurance Group of America, Inc., Sr. Unsec. Medium-Term Notes, 4.70%, 09/15/23 | $ | 1,650,000 | $ | 1,767,973 | ||||
| Renewable Electricity–0.12% | ||||||||
Oglethorpe Power Corp., Sr. Sec. First Mortgage Bonds, 4.55%, 06/01/44 | 1,194,000 | 1,173,417 | ||||||
| Residential REIT’s–0.23% | ||||||||
Essex Portfolio L.P., Sr. Unsec. Gtd. Global Notes, 3.63%, 08/15/22 | 2,135,000 | 2,156,651 | ||||||
| Restaurants–0.72% | ||||||||
1011778 BC ULC/ New Red Finance, Inc. (Canada), | ||||||||
6.00%, 04/01/22(b) | 3,498,000 | 3,607,313 | ||||||
Sr. Sec. Gtd. First Lien Notes, | ||||||||
4.63%, 01/15/22(b) | 68,000 | 68,595 | ||||||
Carrols Restaurant Group, Inc., Sec. Gtd. Second Lien Global Notes, 8.00%, 05/01/22 | 155,000 | 164,106 | ||||||
Yum! Brands, Inc., Sr. Unsec. Notes, 3.75%, 11/01/21 | 2,962,000 | 3,013,669 | ||||||
| 6,853,683 | ||||||||
| Security & Alarm Services–0.01% | ||||||||
ADT Corp. (The), Sr. Unsec. Global Notes, 6.25%, 10/15/21 | 50,000 | 51,875 | ||||||
| Semiconductor Equipment–0.01% | ||||||||
Amkor Technology Inc., Sr. Unsec. Global Notes, 6.38%, 10/01/22 | 81,000 | 79,380 | ||||||
| Semiconductors–0.25% | ||||||||
Micron Technology, Inc., | ||||||||
5.88%, 02/15/22 | 140,000 | 138,600 | ||||||
Sr. Unsec. Notes, | ||||||||
5.25%, 08/01/23(b) | 55,000 | 51,700 | ||||||
NXP BV/NXP Funding LLC (Netherlands), Sr. Unsec. Gtd. Notes, 5.75%, 03/15/23(b) | 2,120,000 | 2,215,400 | ||||||
| 2,405,700 | ||||||||
| Soft Drinks–1.60% | ||||||||
Coca-Cola Co. (The), Sr. Unsec. Global Notes, 3.30%, 09/01/21 | 10,000,000 | 10,401,550 | ||||||
Corp. Lindley S.A. (Peru), REGS, Sr. Unsec. Euro Notes, 4.63%, 04/12/23(b) | 440,000 | 426,857 | ||||||
PepsiCo Inc., Sr. Unsec. Global Notes, 3.00%, 08/25/21 | 4,378,000 | 4,463,925 | ||||||
| 15,292,332 | ||||||||
| Sovereign Debt–0.61% | ||||||||
Argentina Boden Bonds (Argentina), Sr. Unsec. Bonds, 7.00%, 10/03/15 | 685,000 | 705,550 | ||||||
| Principal Amount | Value | |||||||
| Sovereign Debt–(continued) | ||||||||
Dominican Republic International Bond (Dominican Repubic), | ||||||||
5.50%, 01/27/25(b) | $ | 541,000 | $ | 538,295 | ||||
REGS, Sr. Unsec. Euro Bonds, 5.50%, 01/27/25(b) | 100,000 | 99,500 | ||||||
El Salvador Government International Bond (El Salvador), Unsec. Notes, 6.38%, 01/18/27(b) | 228,000 | 216,600 | ||||||
Guatemala Government Bond (Guatemala), | ||||||||
8.13%, 10/06/19(b)(e) | 220,000 | 289,520 | ||||||
REGS, Sr. Unsec. Euro Bonds, 8.13%, 10/06/19(b)(e) | 90,000 | 118,440 | ||||||
Honduras Government International Bond (Honduras), REGS, | 200,000 | 212,000 | ||||||
Ivory Coast Government International Bond (Ivory Coast), Sr. Unsec. Notes, 6.38%, 03/03/28(b) | 324,000 | 302,551 | ||||||
Jamaica Government International Bond (Jamaica), Sr. Unsec. Global Notes, 6.75%, 04/28/28 | 252,000 | 252,000 | ||||||
Lebanon Government International Bond (Lebanon), REGS, Sr. Unsec. Euro Bonds, 6.00%, 01/27/23(b) | 500,000 | 500,100 | ||||||
Mexico Government International Bond (Mexico), Sr. Unsec. Global Notes, 4.60%, 01/23/46 | 200,000 | 183,250 | ||||||
Panama Government International Bond (Panama), Sr. Unsec. | ||||||||
4.00%, 09/22/24 | 320,000 | 320,000 | ||||||
5.20%, 01/30/20 | 400,000 | 438,500 | ||||||
Peruvian Government International Bond (Peru), Sr. Unsec. Global Bonds, 4.13%, 08/25/27 | 299,000 | 295,741 | ||||||
Poland Government International Bond (Poland), Sr. Unsec. Global Notes, 4.00%, 01/22/24 | 400,000 | 421,507 | ||||||
Romanian Government International Bond (Romania), Sr. Unsec. Notes, 4.88%, 01/22/24(b) | 200,000 | 216,250 | ||||||
Russian Foreign Bond (Russia), REGS, Sr. Unsec. Euro Bonds, 4.88%, 09/16/23(b) | 400,000 | 384,052 | ||||||
Uruguay Government International Bond (Uruguay), Sr. Unsec. Global Bonds, 5.10%, 06/18/50 | 320,000 | 294,000 | ||||||
| 5,787,856 | ||||||||
| Specialized Consumer Services–0.02% | ||||||||
ServiceMaster Co., LLC (The), | 191,000 | 193,626 | ||||||
See accompanying Notes to Financial Statements which are an integral part of the financial statements.
20 Invesco Core Plus Bond Fund
| Principal Amount | Value | |||||||
| Specialized Finance–1.28% | ||||||||
Aircastle Ltd., | ||||||||
7.63%, 04/15/20 | $ | 157,000 | $ | 178,980 | ||||
Sr. Unsec. Notes, | ||||||||
5.13%, 03/15/21 | 55,000 | 56,512 | ||||||
5.50%, 02/15/22 | 50,000 | 51,750 | ||||||
Fly Leasing Ltd. (Ireland), Sr. Unsec. Global Notes, 6.75%, 12/15/20 | 200,000 | 207,000 | ||||||
International Lease Finance Corp., Sr. Unsec. Global Notes, | ||||||||
5.88%, 08/15/22 | 120,000 | 129,900 | ||||||
Sr. Unsec. Notes, | ||||||||
8.25%, 12/15/20 | 126,000 | 150,570 | ||||||
McGraw Hill Financial, Inc., | 3,850,000 | 3,834,200 | ||||||
Moody’s Corp., Sr. Unsec. | ||||||||
2.75%, 07/15/19 | 1,470,000 | 1,489,802 | ||||||
4.88%, 02/15/24 | 4,595,000 | 4,793,888 | ||||||
5.25%, 07/15/44 | 1,140,000 | 1,190,553 | ||||||
MSCI Inc., Sr. Unsec. Gtd. Notes, 5.25%, 11/15/24(b) | 100,000 | 102,250 | ||||||
| 12,185,405 | ||||||||
| Specialized REIT’s–0.73% | ||||||||
Crown Castle International Corp., Sr. Unsec. Global Notes, | ||||||||
5.25%, 01/15/23 | 180,000 | 189,450 | ||||||
Sr. Unsec. Notes, | ||||||||
4.88%, 04/15/22 | 81,000 | 83,532 | ||||||
EPR Properties, Sr. Unsec. Gtd. Global Notes, | ||||||||
4.50%, 04/01/25 | 2,244,000 | 2,100,891 | ||||||
7.75%, 07/15/20 | 3,880,000 | 4,575,096 | ||||||
| 6,948,969 | ||||||||
| Specialty Chemicals–0.02% | ||||||||
PolyOne Corp., Sr. Unsec. Global Notes, 5.25%, 03/15/23 | 223,000 | 220,213 | ||||||
| Specialty Stores–0.22% | ||||||||
Tiffany & Co., Sr. Unsec. | ||||||||
3.80%, 10/01/24 | 1,005,000 | 984,599 | ||||||
4.90%, 10/01/44 | 1,140,000 | 1,090,771 | ||||||
| 2,075,370 | ||||||||
| Steel–0.24% | ||||||||
FMG Resources (August 2006) Pty. Ltd. (Australia), Sr. Unsec. | ||||||||
6.88%, 04/01/22(b) | 30,000 | 18,675 | ||||||
8.25%, 11/01/19(b) | 2,043,000 | 1,588,432 | ||||||
GTL Trade Finance Inc. (Brazil), REGS, Sr. Unsec. Gtd. Euro Bonds, 5.89%, 04/29/24(b) | 340,000 | 298,078 | ||||||
| Principal Amount | Value | |||||||
| Steel–(continued) | ||||||||
Steel Dynamics, Inc., Sr. Unsec. Gtd. Global Notes, | ||||||||
5.13%, 10/01/21 | $ | 63,000 | $ | 62,370 | ||||
5.50%, 10/01/24 | 150,000 | 147,562 | ||||||
SunCoke Energy Partners L.P./SunCoke Energy Partners Finance Corp., Sr. Unsec. Gtd. Notes, | ||||||||
7.38%, 02/01/20(b) | 154,000 | 141,103 | ||||||
| 2,256,220 | ||||||||
| Technology Hardware, Storage & Peripherals–0.16% | ||||||||
Seagate HDD Cayman, Sr. Unsec. Gtd. Notes, 5.75%, 12/01/34(b) | 1,540,000 | 1,516,900 | ||||||
| Tobacco–0.92% | ||||||||
Philip Morris International Inc., | 4,500,000 | 4,479,476 | ||||||
Reynolds American, Inc., Sr. Unsec. Gtd. Global Notes, | ||||||||
4.45%, 06/12/25 | 2,187,000 | 2,244,580 | ||||||
5.85%, 08/15/45 | 1,912,000 | 2,060,166 | ||||||
| 8,784,222 | ||||||||
| Trading Companies & Distributors–0.35% | ||||||||
AerCap Ireland Capital Ltd./AerCap Global Aviation Trust (Netherlands), Sr. Unsec. Gtd. Global Notes, 5.00%, 10/01/21 | 630,000 | 652,837 | ||||||
Air Lease Corp., Sr. Unsec. Global Notes, 3.88%, 04/01/21 | 2,425,000 | 2,453,797 | ||||||
United Rentals North America Inc., Sr. Unsec. Gtd. Global Notes, | ||||||||
5.50%, 07/15/25 | 130,000 | 125,775 | ||||||
Sr. Unsec. Gtd. Notes, 6.13%, 06/15/23 | 90,000 | 92,813 | ||||||
| 3,325,222 | ||||||||
| Trucking–0.25% | ||||||||
OPE KAG Finance Sub Inc., | 123,000 | 126,382 | ||||||
Penske Truck Leasing Co., L.P./PTL Finance Corp., Sr. Unsec. Notes, 3.20%, 07/15/20(b) | 2,272,000 | 2,273,703 | ||||||
| 2,400,085 | ||||||||
| Wireless Telecommunication Services–1.10% | ||||||||
America Movil S.A.B. de C.V. (Mexico), Sr. Unsec. Gtd. Global Notes, 6.13%, 03/30/40 | 1,115,000 | 1,258,581 | ||||||
Bharti Airtel International Netherlands B.V. (India), | 500,000 | 532,500 | ||||||
Comcel Trust via Comunicaciones Celulares S.A. (Guatemala), REGS, Sr. Unsec. Gtd. Euro Bonds, 6.88%, 02/06/24(b) | 266,000 | 273,980 | ||||||
See accompanying Notes to Financial Statements which are an integral part of the financial statements.
21 Invesco Core Plus Bond Fund
| Principal Amount | Value | |||||||
| Wireless Telecommunication Services–(continued) | ||||||||
Crown Castle Towers LLC, Sr. Sec. Gtd. First Lien Notes, 4.88%, 08/15/20(b) | $ | 1,835,000 | $ | 2,009,813 | ||||
Digicel Ltd. (Jamaica), Sr. Unsec. Notes, 6.00%, 04/15/21(b) | 200,000 | 184,000 | ||||||
MTN Mauritius Investments Ltd. (South Africa), Sr. Unsec. Gtd. Notes, 4.76%, | 400,000 | 401,500 | ||||||
Rogers Communications Inc. (Canada), Sr. Unsec. Gtd. Global Notes, 5.00%, 03/15/44 | 2,955,000 | 2,892,833 | ||||||
SBA Communications Corp., | 315,000 | 313,425 | ||||||
Sprint Capital Corp., Sr. Unsec. Gtd. Global Notes, 6.88%, 11/15/28 | 160,000 | 138,400 | ||||||
Sprint Communications Inc., | ||||||||
11.50%, 11/15/21 | 65,000 | 74,588 | ||||||
Sr. Unsec. Gtd. Notes, | ||||||||
7.00%, 03/01/20(b) | 780,000 | 833,625 | ||||||
Sprint Corp., Sr. Unsec. Gtd. | ||||||||
7.63%, 02/15/25 | 350,000 | 329,000 | ||||||
7.88%, 09/15/23 | 171,000 | 165,870 | ||||||
T-Mobile USA, Inc., | ||||||||
6.84%, 04/28/23 | 135,000 | 142,762 | ||||||
Sr. Unsec. Gtd. Global Notes, | ||||||||
6.38%, 03/01/25 | 152,000 | 155,800 | ||||||
6.63%, 04/01/23 | 194,000 | 203,215 | ||||||
Wind Acquisition Finance | ||||||||
7.38%, 04/23/21(b) | 250,000 | 256,250 | ||||||
Sr. Sec. Gtd. First Lien Notes, | ||||||||
4.75%, 07/15/20(b) | 300,000 | 303,750 | ||||||
| 10,469,892 | ||||||||
Total U.S. Dollar Denominated Bonds and Notes (Cost $476,994,184) |
| 469,972,891 | ||||||
U.S. Government Sponsored Agency Mortgage-Backed Securities–25.43% |
| |||||||
| Collateralized Mortgage Obligations–0.52% | ||||||||
Fannie Mae REMICs, IO, | ||||||||
7.00%, 05/25/33 | 16,878 | 3,465 | ||||||
6.00%, 07/25/33 | 16,878 | 4,052 | ||||||
Ginnie Mae REMICs, IO, | ||||||||
1.59%, 09/20/64(f) | 13,394,763 | 1,398,413 | ||||||
1.64%, 11/20/64(f) | 8,803,886 | 968,428 | ||||||
1.69%, 12/20/64(f) | 22,709,216 | 2,568,412 | ||||||
| 4,942,770 | ||||||||
| Federal Deposit Insurance Co. (FDIC)–0.02% | ||||||||
Federal Deposit Insurance Co., Series 2010-S1, Class 1A, Structured Sale Gtd., Floating Rate Notes , 0.75%, 02/25/48(b)(f) | 222,618 | 222,705 | ||||||
| Principal Amount | Value | |||||||
| Federal Home Loan Mortgage Corp. (FHLMC)–8.10% | ||||||||
Pass Through Ctfs., | ||||||||
5.50%, 05/01/16 to 07/01/40 | $ | 5,511,919 | $ | 6,175,891 | ||||
6.50%, 05/01/16 to 09/01/36 | 1,024,750 | 1,176,943 | ||||||
7.00%, 08/01/16 to 10/01/34 | 2,220,402 | 2,570,522 | ||||||
6.00%, 04/01/17 to 02/01/34 | 498,805 | 556,545 | ||||||
7.50%, 04/01/17 to 05/01/35 | 997,611 | 1,197,067 | ||||||
3.50%, 08/01/26 | 1,489,695 | 1,578,617 | ||||||
8.50%, 08/01/31 | 76,092 | 94,383 | ||||||
8.00%, 08/01/32 | 66,134 | 81,904 | ||||||
5.00%, 07/01/34 to 06/01/40 | 5,217,090 | 5,748,105 | ||||||
4.50%, 06/01/41 | 3,804,048 | 4,147,455 | ||||||
Pass Through Ctfs., ARM, | ||||||||
2.48%, 12/01/36(f) | 168,108 | 179,267 | ||||||
2.66%, 02/01/37(f) | 51,722 | 55,550 | ||||||
2.56%, 05/01/37(f) | 424,552 | 456,506 | ||||||
2.39%, 06/01/43(f) | 3,793,192 | 3,850,131 | ||||||
Pass Through Ctfs., TBA, | ||||||||
3.50%, 09/01/45(g) | 16,800,000 | 17,392,761 | ||||||
4.00%, 09/01/45(g) | 30,100,000 | 31,931,865 | ||||||
| 77,193,512 | ||||||||
| Federal National Mortgage Association (FNMA)–14.13% | ||||||||
Pass Through Ctfs., | ||||||||
7.50%, 11/01/15 to 08/01/37 | 1,254,854 | 1,487,056 | ||||||
7.00%, 12/01/15 to 02/01/34 | 869,822 | 1,015,100 | ||||||
6.50%, 05/01/16 to 01/01/37 | 355,156 | 409,215 | ||||||
6.00%, 05/01/17 to 10/01/39 | 79,435 | 89,319 | ||||||
5.00%, 03/01/18 to 12/01/39 | 1,601,711 | 1,766,440 | ||||||
5.50%, 11/01/18 to 06/01/40 | 2,612,150 | 2,945,527 | ||||||
8.00%, 08/01/21 to 04/01/33 | 131,804 | 161,483 | ||||||
9.50%, 04/01/30 | 28,435 | 33,165 | ||||||
8.50%, 10/01/32 | 117,645 | 151,314 | ||||||
3.00%, 08/01/43 | 5,838,307 | 5,892,430 | ||||||
Pass Through Ctfs., ARM, | ||||||||
2.41%, 05/01/35(f) | 533,750 | 568,122 | ||||||
2.23%, 01/01/37(f) | 337,948 | 360,343 | ||||||
2.32%, 03/01/38(f) | 166,050 | 177,591 | ||||||
Pass Through Ctfs., TBA, | ||||||||
3.00%, 09/01/30 to 09/01/45(g) | 28,900,000 | 29,411,858 | ||||||
3.50%, 09/01/45(g) | 52,200,000 | 54,149,748 | ||||||
4.00%, 09/01/45(g) | 13,500,000 | 14,351,661 | ||||||
4.50%, 09/01/45(g) | 20,000,000 | 21,678,126 | ||||||
| 134,648,498 | ||||||||
| Government National Mortgage Association (GNMA)–2.66% | ||||||||
Pass Through Ctfs., | ||||||||
7.50%, 06/15/23 to 05/15/32 | 30,847 | 33,490 | ||||||
9.00%, 09/15/24 to 10/15/24 | 18,834 | 18,925 | ||||||
8.50%, 02/15/25 | 6,683 | 6,751 | ||||||
8.00%, 08/15/25 to 09/15/26 | 56,870 | 60,371 | ||||||
6.56%, 01/15/27 | 152,134 | 173,977 | ||||||
7.00%, 04/15/28 to 09/15/32 | 367,069 | 415,318 | ||||||
6.00%, 11/15/28 to 02/15/33 | 113,091 | 130,529 | ||||||
See accompanying Notes to Financial Statements which are an integral part of the financial statements.
22 Invesco Core Plus Bond Fund
| Principal Amount | Value | |||||||
| Government National Mortgage Association (GNMA)–(continued) | ||||||||
6.50%, 01/15/29 to 09/15/34 | $ | 307,485 | $ | 352,196 | ||||
5.50%, 06/15/35 | 151,672 | 171,970 | ||||||
5.00%, 07/15/35 to 08/15/35 | 69,660 | 76,878 | ||||||
Pass Through Ctfs., ARM, | ||||||||
2.00%, 01/20/25 to 05/20/25(f) | 70,465 | 72,990 | ||||||
3.00%, 06/20/25(f) | 9,453 | 9,841 | ||||||
Pass Through Ctfs., TBA, | ||||||||
3.50%, 09/01/45(g) | 15,700,000 | 16,369,090 | ||||||
4.00%, 09/01/45(g) | 7,000,000 | 7,426,835 | ||||||
| 25,319,161 | ||||||||
Total U.S. Government Sponsored Agency Mortgage-Backed Securities (Cost $240,318,198) |
| 242,326,646 | ||||||
Asset-Backed Securities–19.79% |
| |||||||
Adjustable Rate Mortgage Trust, Series 2005-1, Class 4A1, Floating Rate Pass Through Ctfs., 2.73%, 05/25/35(f) | 2,419,445 | 2,398,013 | ||||||
Banc of America Commercial Mortgage Trust, | ||||||||
Series 2006-1, Class AJ, Variable Rate Pass Through Ctfs., 5.46%, 09/10/45(f) | 3,100,000 | 3,130,803 | ||||||
Series 2006-1, Class B, Variable Rate Pass Through Ctfs., 5.49%, 09/10/45(f) | 3,077,000 | 3,111,545 | ||||||
Banc of America Mortgage Trust, Series 2005-12, Class A2, Floating Rate Pass Through Ctfs., 1.10%, 01/25/36(f) | 2,605,447 | 2,348,732 | ||||||
Barclays Bank Commercial Mortgage Securities Trust, | 3,730,000 | 3,707,818 | ||||||
Bear Stearns Adjustable Rate Mortgage Trust, | ||||||||
Series 2003-6, Class 1A3, Floating Rate Pass Through Ctfs., 2.40%, 08/25/33(f) | 429,328 | 429,100 | ||||||
Series 2005-2, Class A1, Floating Rate Pass Through Ctfs., 2.68%, 03/25/35(f) | 3,637,164 | 3,660,431 | ||||||
Series 2006-1, Class A1, Floating Rate Pass Through Ctfs., 2.36%, 02/25/36(f) | 1,796,270 | 1,786,383 | ||||||
Bear Stearns ALT-A Trust, | 3,906,228 | 3,807,594 | ||||||
Boca Hotel Portfolio Trust, | 2,500,000 | 2,496,436 | ||||||
| Principal Amount | Value | |||||||
Carlyle High Yield Partners VIII, Ltd., | ||||||||
Series 2006-8A, Class B, Floating Rate Pass Through Ctfs., 0.71%, 05/21/21(b)(f) | $ | 700,000 | $ | 678,128 | ||||
Series 2006-8A, Class A2B, Floating Rate Pass Through Ctfs., 0.67%, 05/21/21(b)(f) | 4,184,000 | 4,079,358 | ||||||
CDGJ Commercial Mortgage Trust, Series 2014-BXCH, Class A, Floating Rate Pass Through Ctfs., 1.60%, 12/15/27(b)(f) | 1,150,000 | 1,151,068 | ||||||
Centurion CDO 9 Ltd. (Cayman Islands), Series 2005-9X, Class A2, Floating Rate Pass Through Ctfs., 0.72%, 07/17/19(f) | 2,750,000 | 2,674,385 | ||||||
CFCRE Commercial Mortgage Trust, Series 2011-C2, Class C, Variable Rate Pass Through Ctfs., 5.76%, 12/15/47(b)(f) | 5,000,000 | 5,565,008 | ||||||
Citigroup Commercial Mortgage Trust, Series 2014-388G, Class C, Floating Rate Pass Through Ctfs., 1.60%, 06/15/33(b)(f) | 5,000,000 | 4,976,885 | ||||||
Citigroup Mortgage Loan Trust, Inc., | ||||||||
Series 2004-HYB3, Class 2A, Floating Rate Pass Through Ctfs., 2.69%, 09/25/34(f) | 3,202,187 | 3,163,941 | ||||||
Series 2004-UST1, Class A4, Floating Rate Pass Through Ctfs., 2.26%, 08/25/34(f) | 1,559,202 | 1,550,837 | ||||||
Commercial Mortgage Trust, | ||||||||
Series 2013-THL, Class A2, Floating Rate Pass Through Ctfs., 1.24%, 06/08/30(b)(f) | 2,875,000 | 2,871,700 | ||||||
Series 2015-CR25, Class B, Pass Through Ctfs., 4.70%, 08/10/48 | 4,367,000 | 4,458,480 | ||||||
Countrywide Asset-Backed Ctfs., Series 2003-1, Class 3A, Floating Rate Pass Through Ctfs., 0.88%, 06/25/33(f) | 162,481 | 144,773 | ||||||
Countrywide Home Loans Mortgage Pass Through Trust, Series 2007-13, Class A10, Pass Through Ctfs., 6.00%, 08/25/37 | 759,471 | 726,331 | ||||||
Credit Suisse Mortgage Trust, Series 2009-2R, Class 1A11, Floating Rate Pass Through Ctfs., 2.71%, 09/26/34(b)(f) | 214,355 | 214,932 | ||||||
First Horizon Alternative Mortgage Securities Trust, | ||||||||
Series 2005-FA8, Class 2A1, Pass Through Ctfs., 5.00%, 11/25/20 | 272,265 | 277,762 | ||||||
Series 2006-FA5, Class A3, Pass Through Ctfs., 6.25%, 08/25/36 | 365,650 | 294,167 | ||||||
Foothill CLO Ltd. (Cayman Islands), Series 2007-1A, Class C, Floating Rate Pass Through Ctfs., 1.04%, 02/22/21(b)(f) | 1,531,000 | 1,516,166 | ||||||
See accompanying Notes to Financial Statements which are an integral part of the financial statements.
23 Invesco Core Plus Bond Fund
| Principal Amount | Value | |||||||
GMACM Mortgage Loan Trust, | $ | 1,690,473 | $ | 1,522,078 | ||||
GP Portfolio Trust, | 5,000,000 | 5,002,278 | ||||||
Hamlet II Ltd. (Cayman Islands), Series 2006-2A, Class A2B, Floating Rate Pass Through Ctfs., 0.64%, 05/11/21(b)(f) | 5,000,000 | 4,816,402 | ||||||
Harborview Mortgage Loan Trust, Series 2005-9, Class 2A1C, Floating Rate Pass Through Ctfs., 0.65%, 06/20/35(f) | 39,164 | 36,255 | ||||||
Hilton USA Trust, Series 2013-HLT, Class BFX, Pass Through Ctfs., 3.37%, 11/05/30(b) | 1,500,000 | 1,507,323 | ||||||
Hyatt Hotel Portfolio Trust, | 3,998,000 | 4,019,539 | ||||||
ING Investment Management CLO II, Ltd. (Cayman Islands), | ||||||||
Series 2006-2A, Class A2, Floating Rate Pass Through Ctfs., 0.65%, 08/01/20(b)(f) | 5,000,000 | 4,949,262 | ||||||
Series 2006-2A, Class B, Floating Rate Pass Through Ctfs., 0.71%, 08/01/20(b)(f) | 2,718,000 | 2,664,749 | ||||||
JP Morgan Chase Commercial Mortgage Securities Corp., | 5,000,000 | 5,039,643 | ||||||
JP Morgan Chase Commercial Mortgage Securities Trust, | ||||||||
Series 2006-LDP6, Class AJ, Variable Rate Pass Through Ctfs., 5.57%, 04/15/43(f) | 3,000,000 | 3,032,741 | ||||||
Series 2006-LDP8, Class AJ, Pass Through Ctfs., 5.48%, 05/15/45 | 1,200,000 | 1,232,246 | ||||||
Series 2006-LDP9, Class A3, Pass Through Ctfs., 5.34%, 05/15/47 | 860,895 | 892,189 | ||||||
JP Morgan Mortgage Trust, | ||||||||
Series 2005-A3, Class 1A1, Floating Rate Pass Through Ctfs., 2.12%, 06/25/35(f) | 1,498,906 | 1,471,545 | ||||||
Series 2005-A3, Class 6A5, Floating Rate Pass Through Ctfs., 2.62%, 06/25/35(f) | 1,705,128 | 1,671,265 | ||||||
Series 2005-A5, Class 1A2, Floating Rate Pass Through Ctfs., 3.03%, 08/25/35(f) | 2,556,726 | 2,548,813 | ||||||
Series 2005-A6, Class 7A1, Floating Rate Pass Through Ctfs., 2.90%, 08/25/35(f) | 1,585,642 | 1,511,050 | ||||||
Series 2007-A4, Class 3A1, Floating Rate Pass Through Ctfs., 4.98%, 06/25/37(f) | 1,987,794 | 1,813,393 | ||||||
| Principal Amount | Value | |||||||
Katonah Ltd. (Cayman Islands), Series 2007-IA, Class A2L, Floating Rate Pass Through Ctfs., 1.79%, 04/23/22(b)(f) | $ | 2,630,000 | $ | 2,626,745 | ||||
LB-UBS Commercial Mortgage Trust, | ||||||||
Series 2006-C7, Class AM, Pass Through Ctfs., 5.38%, 11/15/38 | 2,110,000 | 2,183,984 | ||||||
Series 2005-C7, Class AJ, Pass Through Ctfs., 5.32%, 11/15/40 | 4,348,190 | 4,355,621 | ||||||
Series 2006-C7, Class A3, Pass Through Ctfs., 5.35%, 11/15/38 | 300,000 | 310,026 | ||||||
Lehman Mortgage Trust, | 541,283 | 526,540 | ||||||
Luminent Mortgage Trust, | 1,662,815 | 1,510,372 | ||||||
MAPS CLO Fund II Ltd. (Cayman Islands), Series 2007-2A, Class A2, Floating Rate Pass Through Ctfs., 0.74%, 07/20/22(b)(f) | 3,448,000 | 3,325,164 | ||||||
Merrill Lynch Mortgage Investors Trust, Series 2005-A5, Class A9, Floating Rate Pass Through Ctfs., 2.57%, 06/25/35(f) | 3,475,306 | 3,403,855 | ||||||
Provident Home Equity Loan Trust, Series 2000-2, Class A1, Floating Rate Pass Through Ctfs., 0.74%, 08/25/31(f) | 266,507 | 205,001 | ||||||
Residential Funding Mortgage Sec I Trust, Series 2005-S9, Class A10, Pass Through Ctfs., 6.25%, 12/25/35 | 1,988,835 | 1,922,443 | ||||||
Sequoia Mortgage Trust, | ||||||||
Series 2013-3, Class A1, Pass Through Ctfs., 2.00%, 03/25/43 | 2,511,551 | 2,338,939 | ||||||
Series 2013-4, Class A3, Pass Through Ctfs., 1.55%, 04/25/43 | 2,308,288 | 2,244,742 | ||||||
Series 2013-7, Class A2, Pass Through Ctfs., 3.00%, 06/25/43 | 2,124,940 | 2,077,627 | ||||||
Shellpoint Asset Funding Trust, Series 2013-1, Class A3, Pass Through Ctfs., 3.75%, 07/25/43(b) | 3,618,946 | 3,726,813 | ||||||
Sierra Timeshare Receivables Funding LLC, Series 2013-2A, Class A, Pass Through Ctfs., 2.28%, 11/20/25(b) | 780,205 | 781,991 | ||||||
Specialty Underwriting & Residential Finance Trust, Series 2004-BC2, Class A2, Floating Rate Pass Through Ctfs., 0.74%, 05/25/35(f) | 41,645 | 36,182 | ||||||
See accompanying Notes to Financial Statements which are an integral part of the financial statements.
24 Invesco Core Plus Bond Fund
| Principal Amount | Value | |||||||
Structured Adjustable Rate Mortgage Loan Trust, | ||||||||
Series 2004-8, Class 3A, Floating Rate Pass Through Ctfs., 2.49%, 07/25/34(f) | $ | 3,266,622 | $ | 3,271,800 | ||||
Series 2007-3, Class 4A2, Floating Rate Pass Through Ctfs., 4.68%, 04/25/47(f) | 975,939 | 703,690 | ||||||
Structured Asset Investment Loan Trust, Series 2003-BC12, Class 3A, Floating Rate Pass Through Ctfs., 0.94%, 11/25/33(f) | 17,992 | 17,467 | ||||||
Suntrust Alternative Loan Trust, Series 2005-1F, Class 2A8, Pass Through Ctfs., 6.00%, 12/25/35 | 595,286 | 558,458 | ||||||
Symphony CLO II, Ltd. (Cayman Islands), Series 2006-2A, Class A2B, Floating Rate Pass Through Ctfs., 0.66%, 10/25/20(b)(f) | 4,545,000 | 4,367,921 | ||||||
Thornburg Mortgage | ||||||||
Series 2003-6, Class A2, Floating Rate Pass Through Ctfs., 1.20%, 12/25/33(f) | 1,397,160 | 1,298,878 | ||||||
Series 2005-1, Class A3, Floating Rate Pass Through Ctfs., 2.15%, 04/25/45(f) | 2,959,684 | 2,979,055 | ||||||
UBS-Citigroup Commercial Mortgage Trust, Series 2011-C1, Class C, Variable Rate Pass Through Ctfs., 6.08%, 01/10/45(b)(f) | 4,500,000 | 5,051,752 | ||||||
Wachovia Bank Commercial Mortgage Trust, | ||||||||
Series 2005-C21, Class AJ, Variable Rate Pass Through Ctfs., 5.45%, 10/15/44(f) | 1,515,000 | 1,514,514 | ||||||
Series 2005-C21, Class AM, Variable Rate Pass Through Ctfs., 5.45%, 10/15/44(f) | 1,464,333 | 1,464,079 | ||||||
WaMu Mortgage Pass Through Trust, | ||||||||
Series 2003-AR8, Class A, Floating Rate Pass Through Ctfs., 2.49%, 08/25/33(f) | 1,193,300 | 1,228,991 | ||||||
Series 2005-AR10, Class 1A3, Floating Rate Pass Through Ctfs., 2.50%, 09/25/35(f) | 525,000 | 509,333 | ||||||
Series 2005-AR12, Class 1A8, Floating Rate Pass Through Ctfs., 2.35%, 10/25/35(f) | 2,172,332 | 2,099,330 | ||||||
Series 2007-HY2, Class 2A2, Floating Rate Pass Through Ctfs., 2.49%, 11/25/36(f) | 1,446,011 | 1,277,689 | ||||||
Wells Fargo Commercial Mortgage Trust, Series 2014-TISH, Class B, Floating Rate Pass Through Ctfs., 1.54%, 02/15/27(b)(f) | 2,500,000 | 2,474,624 | ||||||
| Principal Amount | Value | |||||||
Wells Fargo Mortgage Backed Securities Trust, | ||||||||
Series 2004-K, Class 1A2, Floating Rate Pass Through Ctfs., 2.74%, 07/25/34(f) | $ | 979,115 | $ | 983,699 | ||||
Series 2004-Z, Class 2A1, Floating Rate Pass Through Ctfs., 2.62%, 12/25/34(f) | 1,167,202 | 1,169,851 | ||||||
Series 2005-AR14, Class A1, Floating Rate Pass Through Ctfs., 2.74%, 08/25/35(f) | 1,046,733 | 1,036,758 | ||||||
Series 2005-AR2, Class 2A2, Floating Rate Pass Through Ctfs., 2.62%, 03/25/35(f) | 2,452,039 | 2,500,366 | ||||||
Series 2006-AR8, Class 1A3, Floating Rate Pass Through Ctfs., 2.65%, 04/25/36(f) | 2,772,776 | 2,763,848 | ||||||
Series 2007-7, Class A1, Pass Through Ctfs., 6.00%, 06/25/37 | 1,642,333 | 1,649,969 | ||||||
WFRBS Commercial Mortgage Trust, | ||||||||
Series 2011-C5, Class B, Variable Rate Pass Through Ctfs., 5.82%, 11/15/44(b)(f) | 5,000,000 | 5,641,885 | ||||||
Series 2013-C15, Class B, Variable Rate Pass Through Ctfs., 4.63%, 08/15/46(f) | 3,800,000 | 4,004,037 | ||||||
Series 2013-C16, Class B, Variable Rate Pass Through Ctfs., 5.15%, 09/15/46(f) | 3,127,000 | 3,410,572 | ||||||
Total Asset-Backed Securities |
| 188,506,158 | ||||||
U.S. Treasury Securities–12.13% |
| |||||||
| U.S. Treasury Bills–0.48% | ||||||||
0.23%, 05/26/16(h)(i) | 1,795,000 | 1,791,190 | ||||||
0.24%, 05/26/16(h)(i) | 100,000 | 99,788 | ||||||
0.25%, 05/26/16(h)(i) | 1,000,000 | 997,878 | ||||||
0.29%, 05/26/16(h)(i) | 1,720,000 | 1,716,349 | ||||||
| 4,605,205 | ||||||||
| U.S. Treasury Notes–9.46% | ||||||||
1.63%, 07/31/20(i) | 25,499,200 | 25,589,864 | ||||||
2.00%, 07/31/22 | 18,780,400 | 18,865,597 | ||||||
2.00%, 08/15/25 | 46,600,600 | 45,722,524 | ||||||
| 90,177,985 | ||||||||
| U.S. Treasury Bonds–2.19% | ||||||||
3.00%, 05/15/45 | 20,670,200 | 20,820,642 | ||||||
Total U.S. Treasury Securities |
| 115,603,832 | ||||||
| Shares | ||||||||
Preferred Stocks–0.61% |
| |||||||
| Investment Banking & Brokerage–0.44% | ||||||||
Goldman Sachs Group, Inc. (The), Series J, 5.50% Pfd. | 78,000 | 1,920,360 | ||||||
Morgan Stanley, Series F, 6.88% Pfd. | 85,000 | 2,302,650 | ||||||
| 4,223,010 | ||||||||
See accompanying Notes to Financial Statements which are an integral part of the financial statements.
25 Invesco Core Plus Bond Fund
| Shares | Value | |||||||
| Regional Banks–0.08% | ||||||||
PNC Financial Services Group, Inc. (The), Series P, 6.13% Pfd. | 27,000 | $ | 741,150 | |||||
| Reinsurance–0.09% | ||||||||
Reinsurance Group of America, Inc., 6.20% Unsec. Sub. Pfd. | 30,000 | 846,600 | ||||||
Total Preferred Stocks |
| 5,810,760 | ||||||
| Principal Amount | ||||||||
Municipal Obligations–0.28% |
| |||||||
Florida Hurricane Catastrophe Fund Finance Corp. Series 2013 A, RB, 3.00%, 07/01/20 | $ | 1,450,000 | 1,475,824 | |||||
Georgia (State of) Municipal Electric Authority (Plant Vogtle Units 3 & 4 Project J); | ||||||||
Series 2010, Class A, Build America Taxable RB, 6.66%, 04/01/57 | 550,000 | 641,812 | ||||||
Series 2010 A, Taxable Build America RB, 6.64%, 04/01/57 | 500,000 | 588,720 | ||||||
Total Municipal Obligations |
| 2,706,356 | ||||||
Non-U.S. Dollar Denominated Bonds & |
| |||||||
| Construction & Engineering–0.01% | ||||||||
Abengoa Finance S.A.U. (Spain), | EUR | 100,000 | 71,031 | |||||
| Hotels, Resorts & Cruise Lines–0.02% | ||||||||
Thomas Cook Group PLC (United Kingdom), Sr. Unsec. Gtd. Medium-Term Euro Notes, 7.75%, 06/22/17 | GBP | 100,000 | 161,878 | |||||
| Multi-Sector Holdings–0.02% | ||||||||
Gala Electric Casinos PLC (United Kingdom), REGS, Sec. Gtd. Second Lien Euro Notes, 11.50%, 06/01/19(b) | GBP | 100,000 | 163,909 | |||||
| Principal Amount | Value | |||||||
| Other Diversified Financial Services–0.02% | ||||||||
Lowell Group Financing PLC (United Kingdom), REGS, Sr. Sec. Gtd. First Lien Euro Notes, 10.75%, 04/01/19(b) | GBP | 100,000 | $ | 166,099 | ||||
| Packaged Foods & Meats–0.01% | ||||||||
Moy Park (Bondco) PLC (United Kingdom), Sr. Unsec. Gtd. Notes, 6.25%, 05/29/21(b) | GBP | 100,000 | 157,468 | |||||
Total Non-U.S. Dollar Denominated Bonds & Notes |
| 720,385 | ||||||
| Shares | ||||||||
Common Stocks–0.00% |
| |||||||
| Paper Products–0.00% | ||||||||
Verso Corp. (Cost $972)(k) | 302 | 72 | ||||||
Money Market Funds–11.28% |
| |||||||
Liquid Assets Portfolio–Institutional | 53,717,716 | 53,717,716 | ||||||
Premier Portfolio–Institutional | 53,717,715 | 53,717,715 | ||||||
Total Money Market Funds | 107,435,431 | |||||||
Options Purchased–0.2% |
| |||||||
(Cost $2,140,154)(m) | 1,948,413 | |||||||
TOTAL INVESTMENTS–119.13% |
| 1,135,030,944 | ||||||
OTHER ASSETS LESS LIABILITIES–(19.13)% |
| (182,242,822 | ) | |||||
NET ASSETS–100.00% | $ | 952,788,122 | ||||||
Investment Abbreviations:
| ARM | – Adjustable Rate Mortgage | |||||
| Conv. | – Convertible | |||||
| Ctfs. | – Certificates | |||||
| Deb. | – Debentures | |||||
| EUR | – Euro | |||||
| GBP | – British Pound Sterling | |||||
| Gtd. | – Guaranteed | |||||
| IO | – Interest Only | |||||
| Jr. | – Junior | |||||
| Pfd. | – Preferred | |||||
| PIK | – Payment in Kind | |||||
| RB | – Revenue Bonds | |||||
| REGS | – Regulation S | |||||
| REIT | – Real Estate Investment Trust | |||||
| REMICs | – Real Estate Mortgage Investment Conduits | |||||
| Sec. | – Secured | |||||
| Sr. | – Senior | |||||
| Sub. | – Subordinated | |||||
| TBA | – To Be Announced | |||||
| Unsec. | – Unsecured | |||||
See accompanying Notes to Financial Statements which are an integral part of the financial statements.
26 Invesco Core Plus Bond Fund
Notes to Schedule of Investments:
| (a) | Industry and/or sector classifications used in this report are generally according to the Global Industry Classification Standard, which was developed by and is the exclusive property and a service mark of MSCI Inc. and Standard & Poor’s. |
| (b) | Security purchased or received in a transaction exempt from registration under the Securities Act of 1933, as amended (the “1933 Act”). The security may be resold pursuant to an exemption from registration under the 1933 Act, typically to qualified institutional buyers. The aggregate value of these securities at August 31, 2015 was $234,335,782 which represented 24.59% of the Fund’s Net Assets. |
| (c) | All or a portion of this security is Payment-in-Kind. |
| Issuer | Cash Rate | PIK Rate | ||||||
Alphabet Holding Co., Inc., Sr. Unsec. Global PIK Notes | — | 8.50 | % | |||||
| (d) | Perpetual bond with no specified maturity date. |
| (e) | Security has an irrevocable call by the issuer or mandatory put by the holder. Maturity date reflects such call or put. |
| (f) | Interest or dividend rate is redetermined periodically. Rate shown is the rate in effect on August 31, 2015. |
| (g) | Security purchased on a forward commitment basis. This security is subject to dollar roll transactions. See Note 1J. |
| (h) | Security traded on a discount basis. The interest rate shown represents the discount rate at the time of purchase by the Fund. |
| (i) | All or a portion of the value was pledged and/or designated as collateral to cover margin requirements for open futures contract, options and swap agreements. See Note 1I, Note 1N, Note 1O and Note 4. |
| (j) | Foreign denominated security. Principal amount is denominated in the currency indicated. |
| (k) | Non-income producing security. |
| (l) | The money market fund and the Fund are affiliated by having the same investment adviser. The rate shown is the 7-day SEC standardized yield as of August 31, 2015. |
| (m) | The table below details options purchased: |
| Open Over-The-Counter Foreign Currency Options Purchased | ||||||||||||||||||||||||||
| Description | Type of Contract | Counterparty | Expiration Date | Strike Price | Notional Value | Value | ||||||||||||||||||||
USD versus CNY | Call | Goldman Sachs International | 02/05/16 | CNY 6.50 | USD | 9,500,000 | $ | 167,404 | ||||||||||||||||||
EUR versus MXN | Put | Bank of America Merrill Lynch | 11/09/15 | MXN 16.43 | EUR | 17,000,000 | 10,215 | |||||||||||||||||||
EUR versus NOK | Put | Goldman Sachs International | 09/10/15 | NOK 8.90 | EUR | 19,500,000 | 3,316 | |||||||||||||||||||
CHF versus JPY | Put | Goldman Sachs International | 10/14/15 | JPY 123.50 | CHF | 29,400,000 | 242,614 | |||||||||||||||||||
Subtotal Foreign Currency Options Purchased — Currency Risk |
| $ | 423,549 | |||||||||||||||||||||||
| Open Over-The-Counter Credit Default Swaptions Purchased – Credit Risk | ||||||||||||||||||||||||||||||||
| Description | Type of Contract | Counterparty | Exercise Rate | Pay/ Receive Floating Rate | Reference Entity | Expiration Date | Implied Credit Spread(a) | Notional Value | Value | |||||||||||||||||||||||
5 Year Credit Default Swap | Call | Bank of America Merrill Lynch | 107.50 | % | Pay | Markit CDX North America High Yield Index, Series 24 | 10/21/15 | 3.91 | % | $ | 54,000,000 | $ | 11,574 | |||||||||||||||||||
| Open Over-The-Counter Interest Rate Swaptions Purchased | ||||||||||||||||||||||||||||
| Description | Type of Contract | Counterparty | Exercise Rate | Pay/ Receive Exercise Rate | Floating Rate Index | Expiration Date | Notional Value | Value | ||||||||||||||||||||
3 Year Interest Rate Swap | Put | Barclays Bank PLC | 1.80 | % | Receive | 3 Month USD LIBOR | 02/26/16 | $ | 237,000,000 | $ | 704,426 | |||||||||||||||||
10 Year Interest Rate Swap(b) | Put | Deutsche Bank Securities Inc. | 2.80 | Receive | 3 Month USD LIBOR | 02/24/16 | 95,000,000 | 808,864 | ||||||||||||||||||||
Subtotal Interest Rate Swaptions Purchased — Interest Rate Risk |
| $ | 1,513,290 | |||||||||||||||||||||||||
Total Options Purchased (Cost $2,140,154) |
| $ | 1,948,413 | |||||||||||||||||||||||||
Abbreviations:
| CHF | – Swiss Franc | |
| CNY | – Chinese Yuan | |
| EUR | – Euro | |
| JPY | – Japanese Yen |
| NOK | – Norwegian Krone | |
| LIBOR | – London Interbank Offered Rate | |
| MXN | – Mexican New Peso | |
| USD | – U.S. Dollar |
| (a) | Implied credit spreads represent the current level as of August 31, 2015 at which protection could be bought or sold given the terms of the existing credit default swap contract and serve as an indicator of the current status of the payment/performance risk of the credit default swap contract. An implied credit spread that has widened or increased since entry into the initial contract may indicate a deteriorating credit profile and increased risk of default for the reference entity. A declining or narrowing spread may indicate an improving credit profile or decreased risk of default for the reference entity. Alternatively, credit spreads may increase or decrease reflecting the general tolerance for risk in the credit markets generally. |
| (b) | Swaptions collateralized by $660,000 cash received from the counterparty. |
See accompanying Notes to Financial Statements which are an integral part of the financial statements.
27 Invesco Core Plus Bond Fund
Statement of Assets and Liabilities
August 31, 2015
Assets: | ||||
Investments, at value (Cost $1,031,603,351) | $ | 1,027,595,513 | ||
Investments in affiliated money market funds, at value and cost | 107,435,431 | |||
Total investments, at value (Cost $1,139,038,782) | 1,135,030,944 | |||
Foreign currencies, at value (Cost $63) | 271 | |||
Receivable for: | ||||
Investments sold | 45,925,908 | |||
Variation margin — futures | 192,208 | |||
Fund shares sold | 2,346,436 | |||
Dividends and interest | 6,787,650 | |||
Principal paydowns | 69,905 | |||
Premiums paid on swap agreements — OTC | 160,240 | |||
Investment for trustee deferred compensation and retirement plans | 105,946 | |||
Unrealized appreciation on forward foreign currency contracts outstanding | 4,694,263 | |||
Total assets | 1,195,313,771 | |||
Liabilities: | ||||
Payable for: | ||||
Investments purchased | 232,983,646 | |||
Fund shares reacquired | 677,361 | |||
Options written, at value (premiums received $531,961) | 949,599 | |||
Amount due custodian | 1,262,320 | |||
Collateral received from brokers | 660,000 | |||
Dividends | 309,110 | |||
Swaps payable — OTC | 24,903 | |||
Variation margin — centrally cleared swap agreements | 67,519 | |||
Accrued fees to affiliates | 377,620 | |||
Accrued trustees’ and officers’ fees and benefits | 4,387 | |||
Accrued other operating expenses | 728,505 | |||
Trustee deferred compensation and retirement plans | 119,409 | |||
Unrealized depreciation on forward foreign currency contracts outstanding | 4,144,220 | |||
Unrealized depreciation on swap agreements — OTC | 217,050 | |||
Total liabilities | 242,525,649 | |||
Net assets applicable to shares outstanding | $ | 952,788,122 | ||
Net assets consist of: |
| |||
Shares of beneficial interest | $ | 1,035,475,218 | ||
Undistributed net investment income | (509,458 | ) | ||
Undistributed net realized gain (loss) | (77,521,475 | ) | ||
Net unrealized appreciation (depreciation) | (4,656,163 | ) | ||
| $ | 952,788,122 | |||
Net Assets: | ||||
Class A | $ | 495,225,617 | ||
Class B | $ | 8,493,722 | ||
Class C | $ | 65,160,046 | ||
Class R | $ | 5,848,221 | ||
Class Y | $ | 102,379,673 | ||
Class R5 | $ | 667,626 | ||
Class R6 | $ | 275,013,217 | ||
Shares outstanding, $0.01 par value per share, |
| |||
Class A | 46,567,236 | |||
Class B | 798,904 | |||
Class C | 6,129,667 | |||
Class R | 550,200 | |||
Class Y | 9,620,536 | |||
Class R5 | 62,815 | |||
Class R6 | 25,877,642 | |||
Class A: | ||||
Net asset value per share | $ | 10.63 | ||
Maximum offering price per share | ||||
(Net asset value of $10.63 ¸ 95.75%) | $ | 11.10 | ||
Class B: | ||||
Net asset value and offering price per share | $ | 10.63 | ||
Class C: | ||||
Net asset value and offering price per share | $ | 10.63 | ||
Class R: | ||||
Net asset value and offering price per share | $ | 10.63 | ||
Class Y: | ||||
Net asset value and offering price per share | $ | 10.64 | ||
Class R5: | ||||
Net asset value and offering price per share | $ | 10.63 | ||
Class R6: | ||||
Net asset value and offering price per share | $ | 10.63 | ||
See accompanying Notes to Financial Statements which are an integral part of the financial statements.
28 Invesco Core Plus Bond Fund
Statement of Operations
For the year ended August 31, 2015
Investment income: |
| |||
Interest (net of foreign withholding taxes of $688) | $ | 29,119,600 | ||
Dividends | 618,953 | |||
Dividends from affiliated money market funds | 34,513 | |||
Total investment income | 29,773,066 | |||
Expenses: | ||||
Advisory fees | 3,624,273 | |||
Administrative services fees | 219,372 | |||
Custodian fees | 86,478 | |||
Distribution fees: | ||||
Class A | 1,043,052 | |||
Class B | 104,117 | |||
Class C | 524,498 | |||
Class R | 26,597 | |||
Transfer agent fees — A, B, C, R and Y | 1,074,220 | |||
Transfer agent fees — R5 | 592 | |||
Transfer agent fees — R6 | 533 | |||
Trustees’ and officers’ fees and benefits | 32,080 | |||
Other | 384,663 | |||
Total expenses | 7,120,475 | |||
Less: Fees waived, expenses reimbursed and expense offset arrangement(s) | (710,282 | ) | ||
Net expenses | 6,410,193 | |||
Net investment income | 23,362,873 | |||
Realized and unrealized gain (loss) from: | ||||
Net realized gain (loss) from: | ||||
Investment securities | 13,912,535 | |||
Foreign currencies | (380,784 | ) | ||
Forward foreign currency contracts | 2,472,716 | |||
Futures contracts | (2,573,838 | ) | ||
Option contracts written | 1,491,314 | |||
Swap agreements | (1,019,024 | ) | ||
| 13,902,919 | ||||
Change in net unrealized appreciation (depreciation) of: | ||||
Investment securities | (31,271,748 | ) | ||
Foreign currencies | 25,891 | |||
Forward foreign currency contracts | (138,197 | ) | ||
Futures contracts | 84,668 | |||
Option contracts written | (417,638 | ) | ||
Swap agreements | (5,303 | ) | ||
| (31,722,327 | ) | |||
Net realized and unrealized gain (loss) | (17,819,408 | ) | ||
Net increase in net assets resulting from operations | $ | 5,543,465 | ||
See accompanying Notes to Financial Statements which are an integral part of the financial statements.
29 Invesco Core Plus Bond Fund
Statement of Changes in Net Assets
For the years ended August 31, 2015 and 2014
| 2015 | 2014 | |||||||
Operations: | ||||||||
Net investment income | $ | 23,362,873 | $ | 21,983,027 | ||||
Net realized gain | 13,902,919 | 3,118,290 | ||||||
Change in net unrealized appreciation (depreciation) | (31,722,327 | ) | 28,530,746 | |||||
Net increase in net assets resulting from operations | 5,543,465 | 53,632,063 | ||||||
Distributions to shareholders from net investment income: | ||||||||
Class A | (14,917,587 | ) | (13,587,195 | ) | ||||
Class B | (298,682 | ) | (483,748 | ) | ||||
Class C | (1,472,780 | ) | (1,171,456 | ) | ||||
Class R | (179,006 | ) | (120,792 | ) | ||||
Class Y | (2,379,308 | ) | (124,974 | ) | ||||
Class R5 | (33,725 | ) | (75,598 | ) | ||||
Class R6 | (10,732,408 | ) | (10,148,675 | ) | ||||
Total distributions from net investment income | (30,013,496 | ) | (25,712,438 | ) | ||||
Share transactions–net: | ||||||||
Class A | 174,061,422 | (6,017,746 | ) | |||||
Class B | (3,166,515 | ) | (4,652,287 | ) | ||||
Class C | 28,719,763 | 778,537 | ||||||
Class R | 2,433,288 | 592,575 | ||||||
Class Y | 95,315,767 | 8,120,874 | ||||||
Class R5 | (808,803 | ) | (547,261 | ) | ||||
Class R6 | 15,020,198 | 71,556,506 | ||||||
Net increase in net assets resulting from share transactions | 311,575,120 | 69,831,198 | ||||||
Net increase in net assets | 287,105,089 | 97,750,823 | ||||||
Net assets: | ||||||||
Beginning of year | 665,683,033 | 567,932,210 | ||||||
End of year (includes undistributed net investment income of $(509,458) and $(360,638), respectively) | $ | 952,788,122 | $ | 665,683,033 | ||||
Notes to Financial Statements
August 31, 2015
NOTE 1—Significant Accounting Policies
Invesco Core Plus Bond Fund (the “Fund”) is a series portfolio of AIM Counselor Series Trust (Invesco Counselor Series Trust) (the “Trust”). The Trust is a Delaware statutory trust registered under the Investment Company Act of 1940, as amended (the “1940 Act”), as an open-end series management investment company consisting of thirteen separate portfolios, each authorized to issue an unlimited number of shares of beneficial interest. The assets, liabilities and operations of each portfolio are accounted for separately. Information presented in these financial statements pertains only to the Fund. Matters affecting each portfolio or class will be voted on exclusively by the shareholders of such portfolio or class.
The Fund’s investment objective is total return, comprised of current income and capital appreciation.
The Fund currently consists of seven different classes of shares: Class A, Class B, Class C, Class R, Class Y, Class R5 and Class R6. Class A shares are sold with a front-end sales charge unless certain waiver criteria are met and under certain circumstances load waived shares may be subject to contingent deferred sales charges (“CDSC”). Class C shares are sold with a CDSC. Class R, Class Y, Class R5 and Class R6 shares are sold at net asset value. Effective November 30, 2010, new or additional investments in Class B shares are no longer permitted. Existing shareholders of Class B shares may continue to reinvest dividends and capital gains distributions in Class B shares until they convert to Class A shares. Also, shareholders in Class B shares will be able to exchange those shares for Class B shares of other Invesco Funds offering such shares until they convert to Class A shares. Generally, Class B shares will automatically convert to Class A shares on or about the month-end, which is at least eight years after the date of purchase. Redemption of Class B shares prior to the conversion date will be subject to a CDSC.
The following is a summary of the significant accounting policies followed by the Fund in the preparation of its financial statements.
| A. | Security Valuations — Securities, including restricted securities, are valued according to the following policy. |
Debt obligations (including convertible securities) and unlisted equities are fair valued using an evaluated quote provided by an independent pricing service. Evaluated quotes provided by the pricing service may be determined without exclusive reliance on quoted prices, and may reflect appropriate factors such as institution-size trading in similar groups of securities, developments related to specific securities, dividend rate (for
30 Invesco Core Plus Bond Fund
unlisted equities), yield (for debt obligations), quality, type of issue, coupon rate (for debt obligations), maturity (for debt obligations), individual trading characteristics and other market data. Debt obligations are subject to interest rate and credit risks. In addition, all debt obligations involve some risk of default with respect to interest and/or principal payments.
A security listed or traded on an exchange (except convertible securities) is valued at its last sales price or official closing price as of the close of the customary trading session on the exchange where the security is principally traded, or lacking any sales or official closing price on a particular day, the security may be valued at the closing bid price on that day. Securities traded in the over-the-counter market are valued based on prices furnished by independent pricing services or market makers. When such securities are valued by an independent pricing service they may be considered fair valued. Futures contracts are valued at the final settlement price set by an exchange on which they are principally traded. Listed options are valued at the mean between the last bid and asked prices from the exchange on which they are principally traded. Options not listed on an exchange are valued by an independent source at the mean between the last bid and asked prices. For purposes of determining net asset value (“NAV”) per share, futures and option contracts generally are valued 15 minutes after the close of the customary trading session of the New York Stock Exchange (“NYSE”).
Investments in open-end and closed-end registered investment companies that do not trade on an exchange are valued at the end-of-day net asset value per share. Investments in open-end and closed-end registered investment companies that trade on an exchange are valued at the last sales price or official closing price as of the close of the customary trading session on the exchange where the security is principally traded.
Swap agreements are fair valued using an evaluated quote, if available, provided by an independent pricing service. Evaluated quotes provided by the pricing service are valued based on a model which may include end-of-day net present values, spreads, ratings, industry, company performance and returns of referenced assets.
Foreign securities’ (including foreign exchange contracts) prices are converted into U.S. dollar amounts using the applicable exchange rates as of the close of the NYSE. If market quotations are available and reliable for foreign exchange-traded equity securities, the securities will be valued at the market quotations. Because trading hours for certain foreign securities end before the close of the NYSE, closing market quotations may become unreliable. If between the time trading ends on a particular security and the close of the customary trading session on the NYSE, events occur that the Adviser determines are significant and make the closing price unreliable, the Fund may fair value the security. If the event is likely to have affected the closing price of the security, the security will be valued at fair value in good faith using procedures approved by the Board of Trustees. Adjustments to closing prices to reflect fair value may also be based on a screening process of an independent pricing service to indicate the degree of certainty, based on historical data, that the closing price in the principal market where a foreign security trades is not the current value as of the close of the NYSE. Foreign securities’ prices meeting the approved degree of certainty that the price is not reflective of current value will be priced at the indication of fair value from the independent pricing service. Multiple factors may be considered by the independent pricing service in determining adjustments to reflect fair value and may include information relating to sector indices, American Depositary Receipts and domestic and foreign index futures. Foreign securities may have additional risks including exchange rate changes, potential for sharply devalued currencies and high inflation, political and economic upheaval, the relative lack of issuer information, relatively low market liquidity and the potential lack of strict financial and accounting controls and standards.
Securities for which market prices are not provided by any of the above methods may be valued based upon quotes furnished by independent sources. The last bid price may be used to value equity securities. The mean between the last bid and asked prices is used to value debt obligations, including corporate loans.
Securities for which market quotations are not readily available or became unreliable are valued at fair value as determined in good faith by or under the supervision of the Trust’s officers following procedures approved by the Board of Trustees. Issuer specific events, market trends, bid/asked quotes of brokers and information providers and other market data may be reviewed in the course of making a good faith determination of a security’s fair value.
The Fund may invest in securities that are subject to interest rate risk, meaning the risk that the prices will generally fall as interest rates rise and, conversely, the prices will generally rise as interest rates fall. Specific securities differ in their sensitivity to changes in interest rates depending on their individual characteristics. Changes in interest rates may result in increased market volatility, which may affect the value and/or liquidity of certain Fund investments.
Valuations change in response to many factors including the historical and prospective earnings of the issuer, the value of the issuer’s assets, general economic conditions, interest rates, investor perceptions and market liquidity. Because of the inherent uncertainties of valuation, the values reflected in the financial statements may materially differ from the value received upon actual sale of those investments.
| B. | Securities Transactions and Investment Income — Securities transactions are accounted for on a trade date basis. Realized gains or losses on sales are computed on the basis of specific identification of the securities sold. Interest income (net of withholding tax, if any) is recorded on the accrual basis from settlement date. Paydown gains and losses on mortgage and asset-backed securities are recorded as adjustments to interest income. Dividend income (net of withholding tax, if any) is recorded on the ex-dividend date. Bond premiums and discounts are amortized and/or accreted for financial reporting purposes. |
The Fund may periodically participate in litigation related to Fund investments. As such, the Fund may receive proceeds from litigation settlements. Any proceeds received are included in the Statement of Operations as realized gain (loss) for investments no longer held and as unrealized gain (loss) for investments still held.
Brokerage commissions and mark ups are considered transaction costs and are recorded as an increase to the cost basis of securities purchased and/or a reduction of proceeds on a sale of securities. Such transaction costs are included in the determination of net realized and unrealized gain (loss) from investment securities reported in the Statement of Operations and the Statement of Changes in Net Assets and the net realized and unrealized gains (losses) on securities per share in the Financial Highlights. Transaction costs are included in the calculation of the Fund’s net asset value and, accordingly, they reduce the Fund’s total returns. These transaction costs are not considered operating expenses and are not reflected in net investment income reported in the Statement of Operations and the Statement of Changes in Net Assets, or the net investment income per share and the ratios of expenses and net investment income reported in the Financial Highlights, nor are they limited by any expense limitation arrangements between the Fund and the investment adviser.
The Fund allocates realized and unrealized capital gains and losses to a class based on the relative net assets of each class. The Fund allocates income to a class based on the relative value of the settled shares of each class.
31 Invesco Core Plus Bond Fund
| C. | Country Determination — For the purposes of making investment selection decisions and presentation in the Schedule of Investments, the investment adviser may determine the country in which an issuer is located and/or credit risk exposure based on various factors. These factors include the laws of the country under which the issuer is organized, where the issuer maintains a principal office, the country in which the issuer derives 50% or more of its total revenues and the country that has the primary market for the issuer’s securities, as well as other criteria. Among the other criteria that may be evaluated for making this determination are the country in which the issuer maintains 50% or more of its assets, the type of security, financial guarantees and enhancements, the nature of the collateral and the sponsor organization. Country of issuer and/or credit risk exposure has been determined to be the United States of America, unless otherwise noted. |
| D. | Distributions — Distributions from net investment income, if any, are declared daily and paid monthly. Distributions from net realized capital gain, if any, are generally declared and paid annually and recorded on the ex-dividend date. The Fund may elect to treat a portion of the proceeds from redemptions as distributions for federal income tax purposes. |
| E. | Federal Income Taxes — The Fund intends to comply with the requirements of Subchapter M of the Internal Revenue Code of 1986, as amended (the “Internal Revenue Code”), necessary to qualify as a regulated investment company and to distribute substantially all of the Fund’s taxable earnings to shareholders. As such, the Fund will not be subject to federal income taxes on otherwise taxable income (including net realized capital gain) that is distributed to shareholders. Therefore, no provision for federal income taxes is recorded in the financial statements. |
The Fund recognizes the tax benefits of uncertain tax positions only when the position is more likely than not to be sustained. Management has analyzed the Fund’s uncertain tax positions and concluded that no liability for unrecognized tax benefits should be recorded related to uncertain tax positions. Management is not aware of any tax positions for which it is reasonably possible that the total amounts of unrecognized tax benefits will change materially in the next 12 months.
The Fund files tax returns in the U.S. Federal jurisdiction and certain other jurisdictions. Generally, the Fund is subject to examinations by such taxing authorities for up to three years after the filing of the return for the tax period.
| F. | Expenses — Fees provided for under the Rule 12b-1 plan of a particular class of the Fund are charged to the operations of such class. Transfer agency fees and expenses and other shareholder recordkeeping fees and expenses attributable to Class R5 and Class R6 are allocated to each share class based on relative net assets. Sub-accounting fees attributable to Class R5 are charged to the operations of the class. Transfer agency fees and expenses and other shareholder recordkeeping fees and expenses relating to all other classes are allocated among those classes based on relative net assets. All other expenses are allocated among the classes based on relative net assets. |
| G. | Accounting Estimates — The preparation of financial statements in conformity with accounting principles generally accepted in the United States of America (“GAAP”) requires management to make estimates and assumptions that affect the reported amounts of assets and liabilities at the date of the financial statements and the reported amounts of revenues and expenses during the reporting period including estimates and assumptions related to taxation. Actual results could differ from those estimates by a significant amount. In addition, the Fund monitors for material events or transactions that may occur or become known after the period-end date and before the date the financial statements are released to print. |
| H. | Indemnifications — Under the Trust’s organizational documents, each Trustee, officer, employee or other agent of the Trust is indemnified against certain liabilities that may arise out of the performance of their duties to the Fund. Additionally, in the normal course of business, the Fund enters into contracts, including the Fund’s servicing agreements, that contain a variety of indemnification clauses. The Fund’s maximum exposure under these arrangements is unknown as this would involve future claims that may be made against the Fund that have not yet occurred. The risk of material loss as a result of such indemnification claims is considered remote. |
| I. | Futures Contracts — The Fund may enter into futures contracts to manage exposure to interest rate, equity and market price movements and/or currency risks. A futures contract is an agreement between two parties (“Counterparties”) to purchase or sell a specified underlying security, currency or commodity (or delivery of a cash settlement price, in the case of an index future) for a fixed price at a future date. The Fund currently invests only in exchange-traded futures and they are standardized as to maturity date and underlying financial instrument. Initial margin deposits required upon entering into futures contracts are satisfied by the segregation of specific securities or cash as collateral at the futures commission merchant (broker). During the period the futures contracts are open, changes in the value of the contracts are recognized as unrealized gains or losses by recalculating the value of the contracts on a daily basis. Subsequent or variation margin payments are received or made depending upon whether unrealized gains or losses are incurred. These amounts are reflected as receivables or payables on the Statement of Assets and Liabilities. When the contracts are closed or expire, the Fund recognizes a realized gain or loss equal to the difference between the proceeds from, or cost of, the closing transaction and the Fund’s basis in the contract. The net realized gain (loss) and the change in unrealized gain (loss) on futures contracts held during the period is included on the Statement of Operations. The primary risks associated with futures contracts are market risk and the absence of a liquid secondary market. If the Fund were unable to liquidate a futures contract and/or enter into an offsetting closing transaction, the Fund would continue to be subject to market risk with respect to the value of the contracts and continue to be required to maintain the margin deposits on the futures contracts. Futures contracts have minimal Counterparty risk since the exchange’s clearinghouse, as Counterparty to all exchange-traded futures, guarantees the futures against default. Risks may exceed amounts recognized in the Statement of Assets and Liabilities. |
| J. | Dollar Rolls and Forward Commitment Transactions — The Fund may enter into dollar roll transactions to enhance the Fund’s performance. The Fund executes its dollar roll transactions in the to be announced (“TBA”) market whereby the Fund makes a forward commitment to purchase a security and, instead of accepting delivery, the position is offset by the sale of the security with a simultaneous agreement to repurchase at a future date. |
The Fund accounts for dollar roll transactions as purchases and sales and realizes gains and losses on these transactions. These transactions increase the Fund’s portfolio turnover rate. The Fund will segregate liquid assets in an amount equal to its dollar roll commitments. Dollar roll transactions are considered borrowings under the 1940 Act.
Dollar roll transactions involve the risk that a Counterparty to the transaction may fail to complete the transaction. If this occurs, the Fund may lose the opportunity to purchase or sell the security at the agreed upon price. Dollar roll transactions also involve the risk that the value of the securities retained by the Fund may decline below the price of the securities that the Fund has sold but is obligated to purchase under the agreement.
32 Invesco Core Plus Bond Fund
| K. | Foreign Currency Translations — Foreign currency is valued at the close of the NYSE based on quotations posted by banks and major currency dealers. Portfolio securities and other assets and liabilities denominated in foreign currencies are translated into U.S. dollar amounts at date of valuation. Purchases and sales of portfolio securities (net of foreign taxes withheld on disposition) and income items denominated in foreign currencies are translated into U.S. dollar amounts on the respective dates of such transactions. The Fund does not separately account for the portion of the results of operations resulting from changes in foreign exchange rates on investments and the fluctuations arising from changes in market prices of securities held. The combined results of changes in foreign exchange rates and the fluctuation of market prices on investments (net of estimated foreign tax withholding) are included with the net realized and unrealized gain or loss from investments in the Statement of Operations. Reported net realized foreign currency gains or losses arise from (1) sales of foreign currencies, (2) currency gains or losses realized between the trade and settlement dates on securities transactions, and (3) the difference between the amounts of dividends, interest, and foreign withholding taxes recorded on the Fund’s books and the U.S. dollar equivalent of the amounts actually received or paid. Net unrealized foreign currency gains and losses arise from changes in the fair values of assets and liabilities, other than investments in securities at fiscal period end, resulting from changes in exchange rates. |
The Fund may invest in foreign securities, which may be subject to foreign taxes on income, gains on investments or currency repatriation, a portion of which may be recoverable. Foreign taxes, if any, are recorded based on the tax regulations and rates that exist in the foreign markets in which the Fund invests and are shown in the Statement of Operations.
| L. | Forward Foreign Currency Contracts — The Fund may engage in foreign currency transactions either on a spot (i.e. for prompt delivery and settlement) basis, or through forward foreign currency contracts, to manage or minimize currency or exchange rate risk. |
The Fund may also enter into forward foreign currency contracts for the purchase or sale of a security denominated in a foreign currency in order to “lock in” the U.S. dollar price of that security, or the Fund may also enter into forward foreign currency contracts that do not provide for physical settlement of the two currencies, but instead are settled by a single cash payment calculated as the difference between the agreed upon exchange rate and the spot rate at settlement based upon an agreed upon notional amount (non-deliverable forwards). The Fund will set aside liquid assets in an amount equal to daily mark-to-market obligation for forward foreign currency contracts.
A forward foreign currency contract is an obligation between Counterparties to purchase or sell a specific currency for an agreed-upon price at a future date. The use of forward foreign currency contracts does not eliminate fluctuations in the price of the underlying securities the Fund owns or intends to acquire but establishes a rate of exchange in advance. Fluctuations in the value of these contracts are measured by the difference in the contract date and reporting date exchange rates and are recorded as unrealized appreciation (depreciation) until the contracts are closed. When the contracts are closed, realized gains (losses) are recorded. Realized and unrealized gains (losses) on the contracts are included in the Statement of Operations. The primary risks associated with forward foreign currency contracts include failure of the Counterparty to meet the terms of the contract and the value of the foreign currency changing unfavorably. These risks may be in excess of the amounts reflected in the Statement of Assets and Liabilities.
| M. | Call Options Written and Purchased — The Fund may write call options and/or buy call options. A covered call option gives the purchaser of such option the right to buy, and the writer the obligation to sell, the underlying security or foreign currency at the stated exercise price during the option period. An uncovered call option exists without the ownership of the underlying security. Options written by the Fund normally will have expiration dates between three and nine months from the date written. The exercise price of a call option may be below, equal to, or above the current market value of the underlying security at the time the option is written. |
Additionally, the Fund may enter into an option on a swap agreement, also called a “swaption”. A swaption is an option that gives the buyer the right, but not the obligation, to enter into a swap on a future date in exchange for paying a market-based premium. A receiver swaption gives the owner the right to receive the total return of a specified asset, reference rate or index. Swaptions also include options that allow an existing swap to be terminated or extended by one of the Counterparties.
When the Fund writes a covered call option, an amount equal to the premium received by the Fund is recorded as an asset and an equivalent liability in the Statement of Assets and Liabilities. The amount of the liability is subsequently “marked-to-market” to reflect the current market value of the option written. If a written covered call option expires on the stipulated expiration date, or if the Fund enters into a closing purchase transaction, the Fund realizes a gain (or a loss if the closing purchase transaction exceeds the premium received when the option was written) without regard to any unrealized gain or loss on the underlying security, and the liability related to such option is extinguished. If a written covered call option is exercised, the Fund realizes a gain or a loss from the sale of the underlying security and the proceeds of the sale are increased by the premium originally received. Realized and unrealized gains and losses on these contracts are included in the Statement of Operations. A risk in writing a covered call option is that the Fund gives up the opportunity for profit if the market price of the security increases and the option is exercised. The risk in writing an uncovered call option is that the Fund may incur significant losses if the value of the written security exceeds the exercise price of the option.
When the Fund buys a call option, an amount equal to the premium paid by the Fund is recorded as an investment on the Statement of Assets and Liabilities. The amount of the investment is subsequently “marked-to-market” to reflect the current value of the option purchased. Realized and unrealized gains and losses on these contracts are included in the Statement of Operations. A risk in buying an option is that the Fund pays a premium whether or not the option is exercised. In addition, there can be no assurance that a liquid secondary market will exist for any option purchased.
| N. | Put Options Purchased and Written — The Fund may purchase and write put options including options on securities indexes, or foreign currency and/or futures contracts. By purchasing a put option, the Fund obtains the right (but not the obligation) to sell the option’s underlying instrument at a fixed strike price. In return for this right, the Fund pays an option premium. The option’s underlying instrument may be a security, securities index, or a futures contract. |
Additionally, the Fund may enter into an option on a swap agreement, also called a “swaption”. A swaption is an option that gives the buyer the right, but not the obligation, to enter into a swap on a future date in exchange for paying a market-based premium. A receiver swaption gives the owner the right to receive the total return of a specified asset, reference rate or index. Swaptions also include options that allow an existing swap to be terminated or extended by one of the Counterparties.
Put options may be used by the Fund to hedge securities it owns by locking in a minimum price at which the Fund can sell. If security prices fall, the put option could be exercised to offset all or a portion of the Fund’s resulting losses. At the same time, because the maximum the Fund has at
33 Invesco Core Plus Bond Fund
risk is the cost of the option, purchasing put options does not eliminate the potential for the Fund to profit from an increase in the value of the underlying portfolio securities. The Fund may write put options to earn additional income in the form of option premiums if it expects the price of the underlying instrument to remain stable or rise during the option period so that the option will not be exercised. The risk in this strategy is that the price of the underlying securities may decline by an amount greater than the premium received. Put options written are reported as a liability in the Statement of Assets and Liabilities. Realized and unrealized gains and losses on these contracts are included in the Statement of Operations as Net realized gain from Investment securities. A risk in buying an option is that the Fund pays a premium whether or not the option is exercised. In addition, there can be no assurance that a liquid secondary market will exist for any option purchased.
| O. | Swap Agreements — The Fund may enter into various swap transactions, including interest rate, total return, index, currency and credit default swap contracts (“CDS”) for investment purposes or to manage interest rate, currency or credit risk. Such transactions are agreements between Counterparties. A swap agreement may be negotiated bilaterally and traded over-the-counter (“OTC”) between two parties (“uncleared/OTC”) or, in some instances, must be transacted through a futures commission merchant (“FCM”) and cleared through a clearinghouse that serves as a central Counterparty (“centrally cleared swap”). These agreements may contain among other conditions, events of default and termination events, and various covenants and representations such as provisions that require the Fund to maintain a pre-determined level of net assets, and/or provide limits regarding the decline of the Fund’s NAV over specific periods of time. If the Fund were to trigger such provisions and have open derivative positions at that time, the Counterparty may be able to terminate such agreement and request immediate payment in an amount equal to the net liability positions, if any. |
Interest rate, total return, index, and currency swap agreements are two-party contracts entered into primarily to exchange the returns (or differentials in rates of returns) earned or realized on particular predetermined investments or instruments. The gross returns to be exchanged or “swapped” between the parties are calculated with respect to a notional amount, i.e., the return on or increase in value of a particular dollar amount invested at a particular interest rate or return of an underlying asset, in a particular foreign currency, or in a “basket” of securities representing a particular index.
In a centrally cleared swap, the Fund’s ultimate Counterparty is a central clearinghouse. The Fund initially will enter into centrally cleared swaps through an executing broker. When a fund enters into a centrally cleared swap, it must deliver to the central Counterparty (via the FCM) an amount referred to as “initial margin.” Initial margin requirements are determined by the central Counterparty, but an FCM may require additional initial margin above the amount required by the central Counterparty. Initial margin deposits required upon entering into centrally cleared swaps are satisfied by cash or securities as collateral at the FCM. Securities deposited as initial margin are designated on the Schedule of Investments and cash deposited is recorded on the Statement of Assets and Liabilities. During the term of a cleared swap agreement, a “variation margin” amount may be required to be paid by the Fund or may be received by the Fund, based on the daily change in price of the underlying reference instrument subject to the swap agreement and is recorded as a receivable or payable for variation margin in the Statement of Assets and Liabilities until the centrally cleared swap is terminated at which time a realized gain or loss is recorded.
A CDS is an agreement between Counterparties to exchange the credit risk of an issuer. A buyer of a CDS is said to buy protection by paying a fixed payment over the life of the agreement and in some situations an upfront payment to the seller of the CDS. If a defined credit event occurs (such as payment default or bankruptcy), the Fund as a protection buyer would cease paying its fixed payment, the Fund would deliver eligible bonds issued by the reference entity to the seller, and the seller would pay the full notional value, or the “par value”, of the referenced obligation to the Fund. A seller of a CDS is said to sell protection and thus would receive a fixed payment over the life of the agreement and an upfront payment, if applicable. If a credit event occurs, the Fund as a protection seller would cease to receive the fixed payment stream, the Fund would pay the buyer “par value” or the full notional value of the referenced obligation, and the Fund would receive the eligible bonds issued by the reference entity. In turn, these bonds may be sold in order to realize a recovery value. Alternatively, the seller of the CDS and its Counterparty may agree to net the notional amount and the market value of the bonds and make a cash payment equal to the difference to the buyer of protection. If no credit event occurs, the Fund receives the fixed payment over the life of the agreement. As the seller, the Fund would effectively add leverage to its portfolio because, in addition to its total net assets, the Fund would be subject to investment exposure on the notional amount of the CDS. In connection with these agreements, cash and securities may be identified as collateral in accordance with the terms of the respective swap agreements to provide assets of value and recourse in the event of default under the swap agreement or bankruptcy/insolvency of a party to the swap agreement. If a Counterparty becomes bankrupt or otherwise fails to perform its obligations due to financial difficulties, the Fund may experience significant delays in obtaining any recovery in a bankruptcy or other reorganization proceeding. The Fund may obtain only limited recovery or may obtain no recovery in such circumstances. The Fund’s maximum risk of loss from Counterparty risk, either as the protection seller or as the protection buyer, is the value of the contract. The risk may be mitigated by having a master netting arrangement between the Fund and the Counterparty and by the designation of collateral by the Counterparty to cover the Fund’s exposure to the Counterparty.
Implied credit spreads represent the current level at which protection could be bought or sold given the terms of the existing CDS contract and serve as an indicator of the current status of the payment/performance risk of the CDS. An implied spread that has widened or increased since entry into the initial contract may indicate a deteriorating credit profile and increased risk of default for the reference entity. A declining or narrowing spread may indicate an improving credit profile or decreased risk of default for the reference entity. Alternatively, credit spreads may increase or decrease reflecting the general tolerance for risk in the credit markets.
An interest rate swap is an agreement between Counterparties pursuant to which the parties exchange a floating rate payment for a fixed rate payment based on a specified notional amount.
Changes in the value of centrally cleared and OTC swap agreements are recognized as unrealized gains (losses) in the Statement of Operations by “marking to market” on a daily basis to reflect the value of the swap agreement at the end of each trading day. Payments received or paid at the beginning of the agreement are reflected as such on the Statement of Assets and Liabilities and may be referred to as upfront payments. The Fund accrues for the fixed payment stream and amortizes upfront payments, if any, on swap agreements on a daily basis with the net amount, recorded as a component of realized gain (loss) on the Statement of Operations. A liquidation payment received or made at the termination of a swap agreement is recorded as realized gain (loss) on the Statement of Operations. The Fund segregates liquid securities having a value at least equal to the amount of the potential obligation of a Fund under any swap transaction. Entering into these agreements involves, to varying degrees, lack of liquidity and elements of credit, market, and Counterparty risk in excess of amounts recognized on the Statement of Assets and
34 Invesco Core Plus Bond Fund
Liabilities. Such risks involve the possibility that a swap is difficult to sell or liquidate; the Counterparty does not honor its obligations under the agreement and unfavorable interest rates and market fluctuations. It is possible that developments in the swaps market, including potential government regulation, could adversely affect the Fund’s ability to terminate existing swap agreements or to realize amounts to be received under such agreements. A short position in a security poses more risk than holding the same security long. As there is no limit on how much the price of the security can increase, the Fund’s exposure is unlimited.
Notional amounts of each individual credit default swap agreement outstanding as of August 31, 2015 for which the Fund is the seller of protection are disclosed in the open swap agreements table. These potential amounts would be partially offset by any recovery values of the respective referenced obligations, upfront payments received upon entering into the agreement, or net amounts received from the settlement of buy protection credit default swap agreements entered into by the Fund for the same referenced entity or entities.
| P. | Other Risks — The Fund may invest in obligations issued by agencies and instrumentalities of the U.S. Government that may vary in the level of support they receive from the government. The government may choose not to provide financial support to government sponsored agencies or instrumentalities if it is not legally obligated to do so. In this case, if the issuer defaulted, the Fund may not be able to recover its investment in such issuer from the U.S. Government. Many securities purchased by the Fund are not guaranteed by the U.S. Government. |
| Q. | Leverage Risk — Leverage exists when the Fund can lose more than it originally invests because it purchases or sells an instrument or enters into a transaction without investing an amount equal to the full economic exposure of the instrument or transaction. |
| R. | Collateral — To the extent the Fund has designated or segregated a security as collateral and that security is subsequently sold, it is the Fund’s practice to replace such collateral no later than the next business day. |
NOTE 2—Advisory Fees and Other Fees Paid to Affiliates
The Trust has entered into a master investment advisory agreement with Invesco Advisers, Inc. (the “Adviser” or “Invesco”). Under the terms of the investment advisory agreement, the Fund pays an advisory fee to the Adviser based on the annual rate of the Fund’s average daily net assets as follows:
| Average Daily Net Assets | Rate | |||||
First $500 million | 0 | .45% | ||||
Next $500 million | 0 | .425% | ||||
Next $1.5 billion | 0 | .40% | ||||
Next $2.5 billion | 0 | .375% | ||||
Over $5 billion | 0 | .35% | ||||
For the year ended August 31, 2015, the effective advisory fees incurred by the Fund was 0.44%.
Under the terms of a master sub-advisory agreement between the Adviser and each of Invesco Asset Management Deutschland GmbH, Invesco Asset Management Limited, Invesco Asset Management (Japan) Limited, Invesco Hong Kong Limited, Invesco Senior Secured Management, Inc. and Invesco Canada Ltd. (collectively, the “Affiliated Sub-Advisers”) the Adviser, not the Fund, may pay 40% of the fees paid to the Adviser to any such Affiliated Sub-Adviser(s) that provide(s) discretionary investment management services to the Fund based on the percentage of assets allocated to such Affiliated Sub-Adviser(s).
Effective January 1, 2015, the Adviser has contractually agreed, through at least December 31, 2015, to waive advisory fees and/or reimburse expenses of all shares to the extent necessary to limit total annual fund operating expenses after fee waiver and/or expense reimbursement (excluding certain items discussed below) of Class A, Class B, Class C, Class R, Class Y, Class R5 and Class R6 shares to 0.86%, 1.61%, 1.61%, 1.11%, 0.61%, 0.61% and 0.61%, respectively, of average daily net assets. Prior to January 1, 2015, the Adviser had contractually agreed to waive advisory fees and/or reimburse expenses of all shares to the extent necessary to limit total annual fund operating expenses after fee waiver and/or expense reimbursement (excluding certain items discussed below) of Class A, Class B, Class C, Class R, Class Y, Class R5 and Class R6 shares to 0.84%, 1.59%, 1.59%, 1.09%, 0.59%, 0.59% and 0.59%, respectively, of average daily net assets. In determining the Adviser’s obligation to waive advisory fees and/or reimburse expenses, the following expenses are not taken into account, and could cause the total annual fund operating expenses after fee waiver and/or reimbursement to exceed the numbers reflected above: (1) interest; (2) taxes; (3) dividend expense on short sales; (4) extraordinary or non-routine items, including litigation expenses; and (5) expenses that the Fund has incurred but did not actually pay because of an expense offset arrangement. Unless Invesco continues the fee waiver agreement, it will terminate on December 31, 2015. The fee waiver agreement cannot be terminated during its term.
Further, the Adviser has contractually agreed, through at least June 30, 2017, to waive the advisory fee payable by the Fund in an amount equal to 100% of the net advisory fees the Adviser receives from the affiliated money market funds on investments by the Fund of uninvested cash in such affiliated money market funds.
For the year ended August 31, 2015, the Adviser waived advisory fees of $62,583 and reimbursed class level expenses of $491,236, $12,259, $61,754, $6,263 and $74,788 of Class A, Class B, Class C, Class R and Class Y shares, respectively.
The Trust has entered into a master administrative services agreement with Invesco pursuant to which the Fund has agreed to pay Invesco for certain administrative costs incurred in providing accounting services to the Fund. For the year ended August 31, 2015, expenses incurred under the agreement are shown in the Statement of Operations as Administrative services fees.
The Trust has entered into a transfer agency and service agreement with Invesco Investment Services, Inc. (“IIS”) pursuant to which the Fund has agreed to pay IIS a fee for providing transfer agency and shareholder services to the Fund and reimburse IIS for certain expenses incurred by IIS in the course of providing such services. IIS may make payments to intermediaries that provide omnibus account services, sub-accounting services and/or networking services. All fees payable by IIS to intermediaries that provide omnibus account services or sub-accounting are charged back to the Fund, subject to certain limitations approved by the Trust’s Board of Trustees. For the year ended August 31, 2015, expenses incurred under the agreement are shown in the Statement of Operations as Transfer agent fees.
The Trust has entered into master distribution agreements with Invesco Distributors, Inc. (“IDI”) to serve as the distributor for the Class A, Class B, Class C, Class R, Class Y, Class R5 and Class R6 shares of the Fund. The Trust has adopted plans pursuant to Rule 12b-1 under the 1940 Act with
35 Invesco Core Plus Bond Fund
respect to the Fund’s Class A, Class B, Class C and Class R shares (collectively, the “Plans”). The Fund, pursuant to the Plans, pays IDI compensation at the annual rate of 0.25% of the Fund’s average daily net assets of Class A shares, 1.00% of the average daily net assets of Class B and Class C shares and 0.50% of the average daily net assets of Class R shares. Of the Plan payments, up to 0.25% of the average daily net assets of each class of shares may be paid to furnish continuing personal shareholder services to customers who purchase and own shares of such classes. Any amounts not paid as a service fee under the Plans would constitute an asset-based sales charge. Rules of the Financial Industry Regulatory Authority (“FINRA”) impose a cap on the total sales charges, including asset-based sales charges, that may be paid by any class of shares of the Fund. For the year ended August 31, 2015, expenses incurred under the Plans are shown in the Statement of Operations as Distribution fees.
Front-end sales commissions and CDSC (collectively, the “sales charges”) are not recorded as expenses of the Fund. Front-end sales commissions are deducted from proceeds from the sales of Fund shares prior to investment in Class A shares of the Fund. CDSC are deducted from redemption proceeds prior to remittance to the shareholder. During the year ended August 31, 2015, IDI advised the Fund that IDI retained $276,576 in front-end sales commissions from the sale of Class A shares and $2,138, $4,326 and $2,474 from Class A, Class B and Class C shares, respectively, for CDSC imposed on redemptions by shareholders.
Certain officers and trustees of the Trust are officers and directors of the Adviser, IIS and/or IDI.
NOTE 3—Additional Valuation Information
GAAP defines fair value as the price that would be received to sell an asset or paid to transfer a liability in an orderly transaction between market participants at the measurement date, under current market conditions. GAAP establishes a hierarchy that prioritizes the inputs to valuation methods, giving the highest priority to readily available unadjusted quoted prices in an active market for identical assets (Level 1) and the lowest priority to significant unobservable inputs (Level 3), generally when market prices are not readily available or are unreliable. Based on the valuation inputs, the securities or other investments are tiered into one of three levels. Changes in valuation methods may result in transfers in or out of an investment’s assigned level:
| Level 1 — | Prices are determined using quoted prices in an active market for identical assets. |
| Level 2 — | Prices are determined using other significant observable inputs. Observable inputs are inputs that other market participants may use in pricing a security. These may include quoted prices for similar securities, interest rates, prepayment speeds, credit risk, yield curves, loss severities, default rates, discount rates, volatilities and others. |
| Level 3 — | Prices are determined using significant unobservable inputs. In situations where quoted prices or observable inputs are unavailable (for example, when there is little or no market activity for an investment at the end of the period), unobservable inputs may be used. Unobservable inputs reflect the Fund’s own assumptions about the factors market participants would use in determining fair value of the securities or instruments and would be based on the best available information. |
The following is a summary of the tiered valuation input levels, as of August 31, 2015. The level assigned to the securities valuations may not be an indication of the risk or liquidity associated with investing in those securities. Because of the inherent uncertainties of valuation, the values reflected in the financial statements may materially differ from the value received upon actual sale of those investments.
| Level 1 | Level 2 | Level 3 | Total | |||||||||||||
Equity Securities | $ | 113,246,263 | $ | — | $ | — | $ | 113,246,263 | ||||||||
U.S. Treasury Securities | — | 115,603,832 | — | 115,603,832 | ||||||||||||
Corporate Debt Securities | — | 464,185,035 | — | 464,185,035 | ||||||||||||
U.S. Government Sponsored Agency Securities | — | 242,326,646 | — | 242,326,646 | ||||||||||||
Asset-Backed Securities | — | 188,506,158 | — | 188,506,158 | ||||||||||||
Municipal Obligations | — | 2,706,356 | — | 2,706,356 | ||||||||||||
Foreign Debt Securities | — | 720,385 | — | 720,385 | ||||||||||||
Foreign Sovereign Debt Securities | — | 5,787,856 | — | 5,787,856 | ||||||||||||
Options Purchased | — | 1,948,413 | — | 1,948,413 | ||||||||||||
| 113,246,263 | 1,021,784,681 | — | 1,135,030,944 | |||||||||||||
Forward Foreign Currency Contracts* | — | 550,043 | — | 550,043 | ||||||||||||
Futures Contracts* | (191,683 | ) | — | — | (191,683 | ) | ||||||||||
Options Written* | — | (949,599 | ) | — | (949,599 | ) | ||||||||||
Swap Agreements* | — | (602,051 | ) | — | (602,051 | ) | ||||||||||
Total Investments | $ | 113,054,580 | $ | 1,020,783,074 | $ | — | $ | 1,133,837,654 | ||||||||
| * | Forward foreign currency contracts, futures contracts and swap agreements are valued at unrealized appreciation (depreciation). Options written are shown at value. |
36 Invesco Core Plus Bond Fund
NOTE 4—Derivative Investments
Value of Derivative Investments at Period-End
The table below summarizes the value of the Fund’s derivative investments, detailed by primary risk exposure, held as of August 31, 2015:
| Value | ||||||||
| Risk Exposure/Derivative Type | Assets | Liabilities | ||||||
Credit risk: | ||||||||
Options purchased(a) | $ | 11,574 | $ | — | ||||
Options written(b) | — | (138,370 | ) | |||||
Swap agreements(c)(d) | 142,862 | (217,050 | ) | |||||
Currency risk: | ||||||||
Forward foreign currency contracts(e) | 4,694,263 | (4,144,220 | ) | |||||
Options purchased(a) | 423,549 | — | ||||||
Options written(b) | — | (811,229 | ) | |||||
Interest rate risk: | ||||||||
Futures contracts(f) | 89,878 | (281,561 | ) | |||||
Options purchased(a) | 1,513,290 | — | ||||||
Swap agreements(c)(d) | 87,606 | (615,469 | ) | |||||
Total | $ | 6,963,022 | $ | (6,207,899 | ) | |||
| (a) | Options purchased at value as reported in the Schedule of Investments. |
| (b) | Values are disclosed on the Statement of Assets and Liabilities under the caption Options written, at value. |
| (c) | Values are disclosed on the Statement of Assets and Liabilities under the caption Unrealized depreciation on swap agreements — OTC. |
| (d) | Includes cumulative appreciation (depreciation) of centrally cleared swap agreements. Only current day’s variation margin receivable (payable) is reported within the Statement of Assets and Liabilities. |
| (e) | Values are disclosed on the Statement of Assets and Liabilities under the caption Unrealized appreciation on forward foreign currency contracts outstanding and Unrealized depreciation on forward foreign currency contracts outstanding. |
| (f) | Includes cumulative appreciation (depreciation) of futures contracts. Only current day’s variation margin receivable is reported within the Statement of Assets and Liabilities. |
Effect of Derivative Investments for the year ended August 31, 2015
The table below summarizes the gains (losses) on derivative investments, detailed by primary risk exposure, recognized in earnings during the period:
| Location of Gain (Loss) on Statement of Operations | ||||||||||||||||||||
| Forward Foreign Currency Contracts | Futures Contracts | Options Purchased(a) | Options Written | Swap Agreements | ||||||||||||||||
Realized Gain (Loss): | ||||||||||||||||||||
Credit risk | $ | — | $ | — | $ | (228,632 | ) | $ | 477,151 | $ | (997,528 | ) | ||||||||
Currency risk | (380,784 | ) | — | 2,841,580 | 1,014,163 | — | ||||||||||||||
Interest rate risk | — | (2,573,838 | ) | (1,374,831 | ) | — | (21,496 | ) | ||||||||||||
Change in Net Unrealized Appreciation (Depreciation): | ||||||||||||||||||||
Credit risk | — | — | (95,346 | ) | (15,412 | ) | 522,560 | |||||||||||||
Currency risk | (138,197 | ) | — | (412,992 | ) | (402,226 | ) | — | ||||||||||||
Interest rate risk | — | 84,668 | 444,369 | — | (527,863 | ) | ||||||||||||||
Total | $ | (518,981 | ) | $ | (2,489,170 | ) | $ | 1,174,148 | $ | 1,073,676 | $ | (1,024,327 | ) | |||||||
| (a) | Options purchased are included in the net realized gain (loss) from investment securities and the change in net unrealized appreciation (depreciation) of investment securities. |
The table below summarizes the average notional value of forward foreign currency contracts, futures contracts, options purchased, options written and swap agreements outstanding during the period.
| Forward Foreign Currency Contracts | Futures Contracts | Options Purchased | Options Written | Swap Agreements | ||||||||||||||||
Average notional value | $ | 182,073,326 | $ | 247,346,480 | $ | 289,530,388 | $ | 63,571,851 | $ | 65,542,750 | ||||||||||
37 Invesco Core Plus Bond Fund
| Open Forward Foreign Currency Contracts | ||||||||||||||||||||||||||
Settlement Date
| Contract to | Notional Value | Unrealized Appreciation (Depreciation) | |||||||||||||||||||||||
| Counterparty | Deliver | Receive | ||||||||||||||||||||||||
09/03/15 | Deutsche Bank Securities Inc. | MYR | 36,998,400 | USD | 9,600,000 | $ | 8,829,450 | $ | 770,550 | |||||||||||||||||
09/03/15 | Deutsche Bank Securities Inc. | USD | 9,379,744 | MYR | 36,998,400 | 8,829,450 | (550,294 | ) | ||||||||||||||||||
09/04/15 | Deutsche Bank Securities Inc. | EUR | 286,690 | USD | 324,303 | 321,711 | 2,592 | |||||||||||||||||||
09/04/15 | Deutsche Bank Securities Inc. | USD | 285,376 | EUR | 258,049 | 289,572 | 4,196 | |||||||||||||||||||
09/04/15 | Goldman Sachs International | GBP | 516,691 | USD | 793,017 | 792,796 | 221 | |||||||||||||||||||
09/04/15 | Goldman Sachs International | USD | 190,114 | GBP | 121,544 | 186,494 | (3,620 | ) | ||||||||||||||||||
09/09/15 | Nomura Securities International, Inc. | CHF | 19,600,000 | USD | 20,041,105 | 20,276,216 | (235,111 | ) | ||||||||||||||||||
09/09/15 | Nomura Securities International, Inc. | JPY | 2,550,744,000 | USD | 20,492,319 | 21,042,318 | (549,999 | ) | ||||||||||||||||||
09/09/15 | Nomura Securities International, Inc. | USD | 19,979,563 | CHF | 19,600,000 | 20,276,216 | 296,653 | |||||||||||||||||||
09/09/15 | Nomura Securities International, Inc. | USD | 20,535,407 | JPY | 2,550,744,000 | 21,042,319 | 506,912 | |||||||||||||||||||
09/10/15 | Goldman Sachs International | EUR | 5,850,000 | USD | 6,524,914 | 6,565,135 | (40,221 | ) | ||||||||||||||||||
09/10/15 | Goldman Sachs International | NOK | 52,866,450 | EUR | 5,850,000 | 6,411,600 | 176,188 | |||||||||||||||||||
09/10/15 | Goldman Sachs International | USD | 6,396,518 | NOK | 52,866,450 | 6,388,948 | (7,570 | ) | ||||||||||||||||||
09/14/15 | Citigroup Global Markets Inc. | KRW | 11,570,860,000 | USD | 9,800,000 | 9,777,357 | 22,643 | |||||||||||||||||||
09/14/15 | Citigroup Global Markets Inc. | TWD | 318,010,000 | USD | 9,800,000 | 9,732,944 | 67,056 | |||||||||||||||||||
09/14/15 | Citigroup Global Markets Inc. | USD | 9,821,186 | TWD | 318,010,000 | 9,732,944 | (88,242 | ) | ||||||||||||||||||
09/14/15 | Goldman Sachs International | CNY | 61,607,500 | USD | 9,500,000 | 9,618,807 | (118,807 | ) | ||||||||||||||||||
09/23/15 | Nomura Securities International, Inc. | SGD | 13,862,590 | USD | 9,800,000 | 9,811,005 | (11,005 | ) | ||||||||||||||||||
09/24/15 | Citigroup Global Markets Inc. | CHF | 19,600,000 | JPY | 2,501,347,100 | 20,486,053 | 355,608 | |||||||||||||||||||
09/24/15 | Citigroup Global Markets Inc. | JPY | 2,501,347,100 | USD | 21,194,567 | 20,640,575 | 553,992 | |||||||||||||||||||
09/24/15 | Citigroup Global Markets Inc. | USD | 21,069,755 | CHF | 19,600,000 | 20,284,966 | (784,789 | ) | ||||||||||||||||||
09/24/15 | Deutsche Bank Securities Inc. | CHF | 18,290,157 | USD | 19,300,000 | 18,929,348 | 370,652 | |||||||||||||||||||
09/24/15 | Deutsche Bank Securities Inc. | USD | 9,569,590 | CHF | 9,071,493 | 9,388,517 | (181,073 | ) | ||||||||||||||||||
09/24/15 | Goldman Sachs International | EUR | 100,000 | MXN | 1,931,797 | 115,377 | 3,206 | |||||||||||||||||||
09/24/15 | Goldman Sachs International | MXN | 45,764,996 | EUR | 2,375,000 | 2,664,275 | (69,254 | ) | ||||||||||||||||||
09/24/15 | Bank of America Merrill Lynch | MXN | 277,943,773 | EUR | 14,725,000 | 16,417,305 | (82,795 | ) | ||||||||||||||||||
09/24/15 | Bank of America Merrill Lynch | EUR | 17,000,000 | USD | 19,479,280 | 19,081,630 | 397,650 | |||||||||||||||||||
09/24/15 | Bank of America Merrill Lynch | USD | 18,900,869 | MXN | 321,776,972 | 19,230,474 | 329,605 | |||||||||||||||||||
09/24/15 | Nomura Securities International, Inc. | CHF | 9,800,000 | NOK | 85,272,054 | 10,374,360 | 159,789 | |||||||||||||||||||
09/24/15 | Nomura Securities International, Inc. | NOK | 85,272,054 | USD | 10,188,307 | 10,302,272 | (113,965 | ) | ||||||||||||||||||
10/02/15 | Deutsche Bank Securities Inc. | MXN | 159,876,500 | EUR | 8,500,000 | 9,507,250 | (7,093 | ) | ||||||||||||||||||
10/19/15 | JPMorgan Chase Bank, N.A. | EUR | 9,800,000 | PLN | 40,628,056 | 10,824,046 | (263,620 | ) | ||||||||||||||||||
10/19/15 | JPMorgan Chase Bank, N.A. | PLN | 40,628,056 | USD | 10,609,950 | 10,740,814 | (130,864 | ) | ||||||||||||||||||
10/19/15 | JPMorgan Chase Bank, N.A. | USD | 10,783,704 | EUR | 9,800,000 | 11,004,434 | 220,730 | |||||||||||||||||||
11/13/15 | Citigroup Global Markets Inc. | EUR | 17,721,288 | USD | 19,565,720 | 19,907,938 | (342,218 | ) | ||||||||||||||||||
11/13/15 | Citigroup Global Markets Inc. | USD | 20,197,212 | EUR | 17,721,288 | 19,907,937 | (289,275 | ) | ||||||||||||||||||
11/13/15 | Goldman Sachs International | CNY | 61,930,500 | USD | 9,500,000 | 9,558,680 | (58,680 | ) | ||||||||||||||||||
11/17/15 | Citigroup Global Markets Inc. | KRW | 10,932,475,000 | JPY | 1,150,000,000 | 9,194,851 | 276,244 | |||||||||||||||||||
06/13/16 | Deutsche Bank Securities Inc. | CNY | 38,840,580 | USD | 6,084,051 | 5,904,275 | 179,776 | |||||||||||||||||||
06/13/16 | Deutsche Bank Securities Inc. | USD | 6,120,000 | CNY | 38,840,580 | 5,904,275 | (215,725 | ) | ||||||||||||||||||
Total Forward Foreign Currency Contracts — Currency Risk | $ | 550,043 | ||||||||||||||||||||||||
Currency Abbreviations:
| CHF | – Swiss Franc | |
| CNY | – Chinese Yuan | |
| EUR | – Euro | |
| GBP | – British Pound Sterling | |
| JPY | – Japanese Yen | |
| KRW | – South Korean Won | |
| MXN | – Mexican Peso |
| MYR | – Malaysian Ringgit | |
| NOK | – Norwegian Krone | |
| PLN | – Polish Zloty | |
| SGD | – Singapore Dollar | |
| TWD | – New Taiwan Dollar | |
| USD | – U.S. Dollar |
38 Invesco Core Plus Bond Fund
| Open Futures Contracts | ||||||||||||||||||||
| Futures Contracts | Type of Contract | Number of Contracts | Expiration Month | Notional Value | Unrealized Appreciation (Depreciation) | |||||||||||||||
U.S. 2 Year Treasury Notes | Long | 260 | December-2015 | $ | 56,801,875 | $ | (98,067 | ) | ||||||||||||
U.S. 5 Year Treasury Notes | Long | 413 | December-2015 | 49,327,688 | (183,494 | ) | ||||||||||||||
U.S. 10 Year Treasury Notes | Short | 943 | December-2015 | (119,819,938 | ) | 12,679 | ||||||||||||||
U.S. Long Bond | Short | 181 | December-2015 | (27,987,125 | ) | 26,767 | ||||||||||||||
U.S. Ultra Bond | Short | 17 | December-2015 | (2,692,906 | ) | 50,432 | ||||||||||||||
Total Futures Contracts — Interest Rate Risk |
| $ | (191,683 | ) | ||||||||||||||||
| Open Over-The-Counter Credit Default Swaptions Written — Credit Risk | ||||||||||||||||||||||||||||||||||||||||
| Description | Type of Contract | Counterparty | Exercise Rate | Pay/ Receive Floating Rate | Reference Entity | Expiration Date | Implied Credit Spread(a) | Premiums Received | Notional Value | Value | Unrealized Appreciation (Depreciation) | |||||||||||||||||||||||||||||
5 Year Credit Default Swap | Put | Bank of America Merrill Lynch | 104.50 | % | Pay | Markit CDX North America High Yield Index, Series 24 | 10/21/15 | 3.91 | % | $ | (122,958 | ) | $ | 9,000,000 | $ | (138,370 | ) | $ | (15,412 | ) | ||||||||||||||||||||
| Open Over-The-Counter Foreign Currency Options Written | ||||||||||||||||||||||||||||||||||||||
| Description | Type of Contract | Counterparty | Expiration Date | Strike Price | Premiums Received | Notional Value | Value | Unrealized Appreciation (Depreciation) | ||||||||||||||||||||||||||||||
EUR versus MXN | Call | Bank of America Merrill Lynch | 11/09/15 | MXN | 18.60 | $ | (215,916 | ) | EUR | 17,000,000 | $ | (687,812 | ) | $ | (471,896 | ) | ||||||||||||||||||||||
USD versus CNY | Call | Goldman Sachs International | 11/11/15 | CNY | 6.80 | (52,126 | ) | USD | 9,500,000 | (26,687 | ) | 25,439 | ||||||||||||||||||||||||||
USD versus CNY | Call | Goldman Sachs International | 11/13/15 | CNY | 6.80 | (47,500 | ) | USD | 9,500,000 | (27,587 | ) | 19,913 | ||||||||||||||||||||||||||
USD versus CNY | Call | Goldman Sachs International | 02/05/16 | CNY | 6.80 | (93,461 | ) | USD | 9,500,000 | (69,143 | ) | 24,318 | ||||||||||||||||||||||||||
Subtotal Foreign Currency Options Written — Currency Risk |
| $ | (409,003 | ) | $ | (811,229 | ) | $ | (402,226 | ) | ||||||||||||||||||||||||||||
Total Options Written |
| $ | (531,961 | ) | $ | (949,599 | ) | $ | (417,638 | ) | ||||||||||||||||||||||||||||
Abbreviations:
| CNY | – Chinese Yuan | |
| EUR | – Euro | |
| MXN | – Mexican Peso | |
| USD | – U.S. Dollar |
| (a) | Implied credit spreads represent the current level as of August 31, 2015 at which protection could be bought or sold given the terms of the existing credit default swap contract and serve as an indicator of the current status of the payment/performance risk of the credit default swap contract. An implied credit spread that has widened or increased since entry into the initial contract may indicate a deteriorating credit profile and increased risk of default for the reference entity. A declining or narrowing spread may indicate an improving credit profile or decreased risk of default for the reference entity. Alternatively, credit spreads may increase or decrease reflecting the general tolerance for risk in the credit markets generally. |
| Options Written Transactions | ||||||||||||||||||||||||||||||||||||
| Call Options | ||||||||||||||||||||||||||||||||||||
| Notional Value | Notional Value | Notional Value | Notional Value | Premiums Received | ||||||||||||||||||||||||||||||||
Beginning of period | CAD | — | CHF | — | EUR | — | USD | — | $ | — | ||||||||||||||||||||||||||
Written | CAD | 30,000,000 | CHF | 13,900,000 | EUR | 17,000,000 | USD | 181,300,000 | 1,442,067 | |||||||||||||||||||||||||||
Closed | CAD | (30,000,000 | ) | CHF | (13,900,000 | ) | EUR | — | USD | (57,800,000 | ) | (753,604 | ) | |||||||||||||||||||||||
Expired | CAD | — | CHF | — | EUR | — | USD | (95,000,000 | ) | (279,460 | ) | |||||||||||||||||||||||||
End of period | CAD | — | CHF | — | EUR | 17,000,000 | USD | 28,500,000 | $ | 409,003 | ||||||||||||||||||||||||||
| Put Options | ||||||||||||||||||||||||||||||||||||
| Notional Value | Notional Value | Notional Value | Notional Value | Premiums Received | ||||||||||||||||||||||||||||||||
Beginning of period | AUD | — | CHF | — | EUR | — | USD | — | $ | — | ||||||||||||||||||||||||||
Written | AUD | 21,250,000 | CHF | 13,900,000 | EUR | 27,000,000 | USD | 234,000,000 | 1,466,291 | |||||||||||||||||||||||||||
Closed | AUD | (21,250,000 | ) | CHF | — | EUR | (27,000,000 | ) | USD | (25,000,000 | ) | (287,062 | ) | |||||||||||||||||||||||
Expired | AUD | — | CHF | (13,900,000 | ) | EUR | — | USD | (200,000,000 | ) | (1,056,271 | ) | ||||||||||||||||||||||||
End of period | AUD | — | CHF | — | EUR | — | USD | 9,000,000 | $ | 122,958 | ||||||||||||||||||||||||||
39 Invesco Core Plus Bond Fund
| Open Centrally Cleared Credit Default Swap Agreements — Credit Risk | ||||||||||||||||||||||||||||||
Counterparty/ Clearinghouse | Reference Entity | Buy/Sell Protection | (Pay)/Receive Fixed Rate | Expiration Date | Implied Credit Spread(a) | Notional Value | Upfront Payments | Unrealized Appreciation | ||||||||||||||||||||||
Credit Suisse Securities (USA) LLC/CME | Markit CDX North America High Yield Index, Series 24 | Sell | 5.00 | % | 06/20/20 | 3.91 | % | $ | 17,820,000 | $ | 656,667 | $ | 142,862 | |||||||||||||||||
Abbreviations:
| CME | – Chicago Mercantile Exchange |
| (a) | Implied credit spreads represent the current level as of August 31, 2015 at which protection could be bought or sold given the terms of the existing credit default swap contract and serve as an indicator of the current status of the payment/performance risk of the credit default swap contract. An implied credit spread that has widened or increased since entry into the initial contract may indicate a deteriorating credit profile and increased risk of default for the reference entity. A declining or narrowing spread may indicate an improving credit profile or decreased risk of default for the reference entity. Alternatively, credit spreads may increase or decrease reflecting the general tolerance for risk in the credit markets generally. |
| Open Centrally Cleared Interest Rate Swap Agreements | ||||||||||||||||||||||||
Counterparty/ Clearinghouse | Pay/ Receive Floating Rate | Floating Rate Index | Fixed Rate | Termination Date | Notional Value | Unrealized (Depreciation) | ||||||||||||||||||
Credit Suisse Securities (USA) LLC/CME | Pay | 3 Month USD LIBOR | 2.285 | % | February-2026 | USD | $ | 19,000,000 | $ | (200,993 | ) | |||||||||||||
Credit Suisse Securities (USA) LLC/CME | Pay | 6 Month AUD BBSW | 2.535 | July-2020 | AUD | 25,000,000 | 87,606 | |||||||||||||||||
Credit Suisse Securities (USA) LLC/CME | Receive | 3 Month USD LIBOR | 1.862 | June-2020 | USD | (35,000,000 | ) | (414,476 | ) | |||||||||||||||
Total Interest Rate Swap Agreements — Interest Rate Risk |
| $ | (527,863 | ) | ||||||||||||||||||||
Abbreviations:
| AUD | – Australian Dollar | |
| BBSW | – Bank Bill Swap Benchmark Rate | |
| CME | – Chicago Mercantile Exchange | |
| LIBOR | – London Interbank Offered Rate | |
| USD | – U.S. Dollar |
| Open Over-The-Counter Credit Default Swap Agreements — Credit Risk | ||||||||||||||||||||||||||||||
| Counterparty | Reference Entity | Buy/Sell Protection | (Pay)/Receive Fixed Rate | Expiration Date | Implied Credit Spread(a) | Notional Value | Upfront Payments | Unrealized Appreciation (Depreciation) | ||||||||||||||||||||||
Bank of America Merrill Lynch | Citigroup Inc. | Buy | (1.00 | )% | 06/20/17 | 0.43 | % | $ | (5,500,000 | ) | $ | 160,240 | $ | (217,050 | ) | |||||||||||||||
| (a) | Implied credit spreads represent the current level as of August 31, 2015 at which protection could be bought or sold given the terms of the existing credit default swap contract and serve as an indicator of the current status of the payment/performance risk of the credit default swap contract. An implied credit spread that has widened or increased since entry into the initial contract may indicate a deteriorating credit profile and increased risk of default for the reference entity. A declining or narrowing spread may indicate an improving credit profile or decreased risk of default for the reference entity. Alternatively, credit spreads may increase or decrease reflecting the general tolerance for risk in the credit markets generally. |
Offsetting Assets and Liabilities
Accounting Standards Update (“ASU”) No. 2011-11, Disclosures about Offsetting Assets and Liabilities, which was subsequently clarified in Financial Accounting Standards Board ASU 2013-01 “Clarifying the Scope of Disclosures about Offsetting Assets and Liabilities” is intended to enhance disclosures about financial instruments and derivative instruments that are subject to offsetting arrangements on the Statement of Assets and Liabilities and to enable investors to better understand the effect of those arrangements on the Fund’s financial position. In order for an arrangement to be eligible for netting, the Fund must have a basis to conclude that such netting arrangements are legally enforceable. The Fund enters into netting agreements and collateral agreements in an attempt to reduce the Fund’s Counterparty credit risk by providing for a single net settlement with a Counterparty of all financial transactions covered by the agreement in an event of default as defined under such agreement.
40 Invesco Core Plus Bond Fund
There were no derivative instruments subject to a netting agreement for which the Fund is not currently netting. The following tables present derivative instruments that are either subject to an enforceable netting agreement or offset by collateral arrangements as of August 31, 2015.
| Assets: | ||||||||||||||||||||
| Gross Amounts Not Offset in the Statement of Assets and Liabilities | ||||||||||||||||||||
| Gross Amounts of Recognized Assets | Financial Instruments | Collateral Received | ||||||||||||||||||
| Counterparty | Non-Cash | Cash | Net Amount | |||||||||||||||||
Bank of America Merrill Lynch(a) | $ | 727,255 | $ | (82,795 | ) | $ | — | $ | — | $ | 644,460 | |||||||||
Bank of America Merrill Lynch(b) | 21,789 | (21,789 | ) | — | — | — | ||||||||||||||
Bank of America Merrill Lynch(c) | 160,240 | (160,240 | ) | — | — | — | ||||||||||||||
Barclays Bank PLC(b) | 704,426 | — | — | — | 704,426 | |||||||||||||||
Citigroup Global Markets Inc.(a) | 1,275,543 | (1,275,543 | ) | — | — | — | ||||||||||||||
Credit Suisse Securities (USA) LLC(d) | 230,468 | (230,468 | ) | — | — | — | ||||||||||||||
Deutsche Bank Securities Inc.(a) | 1,327,766 | (954,185 | ) | — | — | 373,581 | ||||||||||||||
Deutsche Bank Securities Inc.(b) | 808,864 | — | — | (660,000 | ) | 148,864 | ||||||||||||||
Goldman Sachs International(a) | 179,615 | (179,615 | ) | — | — | — | ||||||||||||||
Goldman Sachs International(b) | 413,334 | (123,417 | ) | — | — | 289,917 | ||||||||||||||
JPMorgan Chase Bank, N.A.(a) | 220,730 | (220,730 | ) | — | — | — | ||||||||||||||
Nomura Securities International, Inc.(a) | 963,354 | (910,080 | ) | — | — | 53,274 | ||||||||||||||
Total | $ | 7,033,384 | $ | (4,158,862 | ) | $ | — | $ | (660,000 | ) | $ | 2,214,522 | ||||||||
| Liabilities: | ||||||||||||||||||||
| Gross Amounts Not Offset in the Statement of Assets and Liabilities | ||||||||||||||||||||
| Gross Amounts of Recognized Liabilities | Financial Instruments | Collateral Pledged | ||||||||||||||||||
| Counterparty | Non-Cash | Cash | Net Amount | |||||||||||||||||
Bank of America Merrill Lynch(a) | $ | 82,795 | $ | (82,795 | ) | $ | — | $ | — | $ | — | |||||||||
Bank of America Merrill Lynch(b) | 826,182 | (21,789 | ) | (660,148 | ) | — | 144,245 | |||||||||||||
Bank of America Merrill Lynch(c) | 241,953 | (160,240 | ) | (81,713 | ) | — | — | |||||||||||||
Citigroup Global Markets Inc.(a) | 1,504,524 | (1,275,543 | ) | — | — | 228,981 | ||||||||||||||
Credit Suisse Securities (USA) LLC(d) | 615,469 | (230,468 | ) | (385,001 | ) | — | — | |||||||||||||
Deutsche Bank Securities Inc.(a) | 954,185 | (954,185 | ) | — | — | — | ||||||||||||||
Goldman Sachs International(a) | 298,152 | (179,615 | ) | — | — | 118,537 | ||||||||||||||
Goldman Sachs International(b) | 123,417 | (123,417 | ) | — | — | — | ||||||||||||||
JPMorgan Chase Bank, N.A.(a) | 394,484 | (220,730 | ) | — | — | 173,754 | ||||||||||||||
Nomura Securities International, Inc.(a) | 910,080 | (910,080 | ) | — | — | — | ||||||||||||||
Total | $ | 5,951,241 | $ | (4,158,862 | ) | $ | (1,126,862 | ) | $ | — | $ | 665,517 | ||||||||
| (a) | Forward foreign currency contracts Counterparty. |
| (b) | Options contracts — OTC Counterparty. |
| (c) | Swap agreements — OTC Counterparty. |
| (d) | Swap agreements — centrally cleared Counterparty. Includes cumulative appreciation (depreciation). |
NOTE 5—Security Transactions with Affiliated Funds
The Fund is permitted to purchase or sell securities from or to certain other Invesco Funds under specified conditions outlined in procedures adopted by the Board of Trustees of the Trust. The procedures have been designed to ensure that any purchase or sale of securities by the Fund from or to another fund or portfolio that is or could be considered an affiliate by virtue of having a common investment adviser (or affiliated investment advisers), common Trustees and/or common officers complies with Rule 17a-7 of the 1940 Act. Further, as defined under the procedures, each transaction is effected at the current market price. Pursuant to these procedures, for the year ended August 31, 2015, the Fund engaged in securities purchases of $5,912,336.
NOTE 6—Expense Offset Arrangement(s)
The expense offset arrangement is comprised of transfer agency credits which result from balances in demand deposit accounts used by the transfer agent for clearing shareholder transactions. For the year ended August 31, 2015, the Fund received credits from this arrangement, which resulted in the reduction of the Fund’s total expenses of $1,399.
41 Invesco Core Plus Bond Fund
NOTE 7—Trustees’ and Officers’ Fees and Benefits
Trustees’ and Officers’ Fees and Benefits include amounts accrued by the Fund to pay remuneration to certain Trustees and Officers of the Fund. Trustees have the option to defer compensation payable by the Fund, and Trustees’ and Officers’ Fees and Benefits also include amounts accrued by the Fund to fund such deferred compensation amounts. Those Trustees who defer compensation have the option to select various Invesco Funds in which their deferral accounts shall be deemed to be invested. Finally, certain current Trustees were eligible to participate in a retirement plan that provided for benefits to be paid upon retirement to Trustees over a period of time based on the number of years of service. The Fund may have certain former Trustees who also participate in a retirement plan and receive benefits under such plan. Trustees’ and Officers’ Fees and Benefits include amounts accrued by the Fund to fund such retirement benefits. Obligations under the deferred compensation and retirement plans represent unsecured claims against the general assets of the Fund.
NOTE 8—Cash Balances
The Fund may borrow for leveraging in an amount up to 5% of the Fund’s total assets (excluding the amount borrowed) at the time the borrowing is made. In doing so, the Fund is permitted to temporarily carry a negative or overdrawn balance in its account with State Street Bank and Trust Company, the custodian bank. Such balances, if any at period end, are shown in the Statement of Assets and Liabilities under the payable caption Amount due custodian. To compensate the custodian bank for such overdrafts, the overdrawn Fund may either (1) leave funds as a compensating balance in the account so the custodian bank can be compensated by earning the additional interest; or (2) compensate by paying the custodian bank at a rate agreed upon by the custodian bank and Invesco, not to exceed the contractually agreed upon rate. The Fund may not purchase additional securities when any borrowings from banks exceed 5% of the Fund’s total assets.
NOTE 9—Distributions to Shareholders and Tax Components of Net Assets
Tax Character of Distributions to Shareholders Paid During the Fiscal Years Ended August 31, 2015 and 2014:
| 2015 | 2014 | |||||||
Ordinary income | $ | 30,013,496 | $ | 25,712,438 | ||||
Tax Components of Net Assets at Period-End:
| 2015 | ||||
Net unrealized appreciation (depreciation) — investments | $ | (4,923,741 | ) | |
Net unrealized appreciation (depreciation) — other investments | (821,824 | ) | ||
Temporary book/tax differences | (120,892 | ) | ||
Capital loss carryforward | (76,820,639 | ) | ||
Shares of beneficial interest | 1,035,475,218 | |||
Total net assets | $ | 952,788,122 | ||
The difference between book-basis and tax-basis unrealized appreciation (depreciation) is due to differences in the timing of recognition of gains and losses on investments for tax and book purposes. The Fund’s net unrealized appreciation (depreciation) difference is attributable primarily to wash sales and book to tax bond premium amortization differences.
The temporary book/tax differences are a result of timing differences between book and tax recognition of income and/or expenses. The Fund’s temporary book/tax differences are the result of the trustee deferral of compensation and retirement plan benefits.
Capital loss carryforward is calculated and reported as of a specific date. Results of transactions and other activity after that date may affect the amount of capital loss carryforward actually available for the Fund to utilize. Capital losses generated in years beginning after December 22, 2010 can be carried forward for an unlimited period, whereas previous losses expire in eight tax years. Capital losses with an expiration period may not be used to offset capital gains until all net capital losses without an expiration date have been utilized. Capital loss carryforwards with no expiration date will retain their character as either short-term or long-term capital losses instead of as short-term capital losses as under prior law. The ability to utilize capital loss carryforwards in the future may be limited under the Internal Revenue Code and related regulations based on the results of future transactions.
The Fund has a capital loss carryforward as of August 31, 2015, which expires as follows:
| Capital Loss Carryforward* | ||||||||||||
| Expiration | Short-Term | Long-Term | Total | |||||||||
August 31, 2016 | $ | (76,820,639 | ) | $ | — | $ | (76,820,639 | ) | ||||
| * | Capital loss carryforward as of the date listed above is reduced for limitations, if any, to the extent required by the Internal Revenue Code and may be further limited depending upon a variety of factors, including the realization of net unrealized gains or losses as of the date of any reorganization. |
42 Invesco Core Plus Bond Fund
NOTE 10—Investment Securities
The aggregate amount of investment securities (other than short-term securities, U.S. Treasury obligations and money market funds, if any) purchased and sold by the Fund during the year ended August 31, 2015 was $3,657,122,901 and $3,444,407,530, respectively. During the same period, purchases and sales of U.S. Treasury obligations were $1,607,432,342 and $1,537,264,231, respectively. Cost of investments on a tax basis includes the adjustments for financial reporting purposes as of the most recently completed federal income tax reporting period-end.
| Unrealized Appreciation (Depreciation) of Investment Securities on a Tax Basis | ||||
Aggregate unrealized appreciation of investment securities | $ | 12,503,754 | ||
Aggregate unrealized (depreciation) of investment securities | (17,427,495 | ) | ||
Net unrealized appreciation (depreciation) of investment securities | $ | (4,923,741 | ) | |
Cost of investments for tax purposes is $1,139,954,685.
NOTE 11—Reclassification of Permanent Differences
Primarily as a result of differing book/tax treatment of mortgage-backed dollar rolls, swap income, foreign currency transactions, bond premium amortization and paydowns, on August 31, 2015, undistributed net investment income was increased by $6,501,803, undistributed net realized gain (loss) was decreased by $6,275,883 and shares of beneficial interest was decreased by $225,920. This reclassification had no effect on the net assets of the Fund.
NOTE 12—Share Information
| Summary of Share Activity | ||||||||||||||||
| Years ended August 31, | ||||||||||||||||
| 2015(a) | 2014 | |||||||||||||||
| Shares | Amount | Shares | Amount | |||||||||||||
Sold: | ||||||||||||||||
Class A | 22,794,656 | $ | 247,856,089 | 5,936,190 | $ | 63,761,071 | ||||||||||
Class B | 97,108 | 1,055,710 | 119,540 | 1,281,173 | ||||||||||||
Class C | 4,218,004 | 45,900,723 | 1,227,666 | 13,233,897 | ||||||||||||
Class R | 434,461 | 4,705,542 | 78,626 | 845,313 | ||||||||||||
Class Y | 10,907,806 | 118,966,984 | 984,592 | 10,675,204 | ||||||||||||
Class R5 | 29,743 | 317,612 | 28,631 | 306,446 | ||||||||||||
Class R6 | 2,716,835 | 29,628,889 | 6,811,615 | 73,005,951 | ||||||||||||
Issued as reinvestment of dividends: | ||||||||||||||||
Class A | 1,361,980 | 14,812,636 | 1,199,252 | 12,892,430 | ||||||||||||
Class B | 25,983 | 282,808 | 41,100 | 441,232 | ||||||||||||
Class C | 132,476 | 1,439,880 | 101,712 | 1,092,648 | ||||||||||||
Class R | 16,338 | 177,776 | 11,219 | 120,554 | ||||||||||||
Class Y | 155,336 | 1,687,568 | 9,882 | 106,881 | ||||||||||||
Class R5 | 2,906 | 31,585 | 6,921 | 74,217 | ||||||||||||
Class R6 | 987,288 | 10,732,408 | 944,113 | 10,147,976 | ||||||||||||
Automatic conversion of Class B shares to Class A shares: | ||||||||||||||||
Class A | 196,567 | 2,136,815 | 224,452 | 2,413,768 | ||||||||||||
Class B | (196,584 | ) | (2,136,815 | ) | (224,505 | ) | (2,413,768 | ) | ||||||||
Reacquired: | ||||||||||||||||
Class A | (8,351,410 | ) | (90,744,118 | ) | (7,964,908 | ) | (85,085,015 | ) | ||||||||
Class B | (218,008 | ) | (2,368,218 | ) | (370,860 | ) | (3,960,924 | ) | ||||||||
Class C | (1,716,630 | ) | (18,620,840 | ) | (1,270,424 | ) | (13,548,008 | ) | ||||||||
Class R | (226,273 | ) | (2,450,030 | ) | (35,142 | ) | (373,292 | ) | ||||||||
Class Y | (2,330,560 | ) | (25,338,785 | ) | (246,283 | ) | (2,661,211 | ) | ||||||||
Class R5 | (106,862 | ) | (1,158,000 | ) | (86,919 | ) | (927,924 | ) | ||||||||
Class R6 | (2,325,168 | ) | (25,341,099 | ) | (1,086,134 | ) | (11,597,421 | ) | ||||||||
Net increase in share activity | 28,605,992 | $ | 311,575,120 | 6,440,336 | $ | 69,831,198 | ||||||||||
| (a) | There are entities that are record owners of more than 5% of the outstanding shares of the Fund and in the aggregate own 32% of the outstanding shares of the Fund. IDI has an agreement with these entities to sell Fund shares. The Fund, Invesco and/or Invesco affiliates may make payments to these entities, which are considered to be related to the Fund, for providing services to the Fund, Invesco and/or Invesco affiliates including but not limited to services such as securities brokerage, distribution, third party record keeping and account servicing. The Fund has no knowledge as to whether all or any portion of the shares owned of record by these entities are also owned beneficially. |
| In addition, 29% of the outstanding shares of the Fund are owned by affiliated mutual funds. Affiliated mutual funds are mutual funds that are advised by Invesco. |
43 Invesco Core Plus Bond Fund
NOTE 13—Financial Highlights
The following schedule presents financial highlights for a share of the Fund outstanding throughout the periods indicated.
| Net asset value, beginning of period | Net investment income(a) | Net gains (losses) on securities (both realized and unrealized) | Total from investment operations | Dividends from net investment income | Distributions from net realized gains | Total distributions | Net asset value, end of period | Total return(b) | Net assets, end of period (000’s omitted) | Ratio of expenses to average net assets with fee waivers and/or expenses absorbed | Ratio of expenses to average net assets without fee waivers and/or expenses absorbed | Ratio of net investment income to average net assets | Portfolio turnover(c) | |||||||||||||||||||||||||||||||||||||||||||
Class A | ||||||||||||||||||||||||||||||||||||||||||||||||||||||||
Year ended 08/31/15 | $ | 10.92 | $ | 0.30 | $ | (0.20 | ) | $ | 0.10 | $ | (0.39 | ) | $ | — | $ | (0.39 | ) | $ | 10.63 | 0.91 | % | $ | 495,226 | 0.84 | %(d) | 0.97 | %(d) | 2.78 | %(d) | 537 | % | |||||||||||||||||||||||||
Year ended 08/31/14 | 10.41 | 0.39 | 0.58 | 0.97 | (0.46 | ) | — | (0.46 | ) | 10.92 | 9.44 | 333,641 | 0.81 | 1.03 | 3.62 | 398 | ||||||||||||||||||||||||||||||||||||||||
Year ended 08/31/13 | 10.95 | 0.31 | (0.51 | ) | (0.20 | ) | (0.34 | ) | — | (0.34 | ) | 10.41 | (1.92 | ) | 324,537 | 0.73 | 0.99 | 2.86 | 252 | |||||||||||||||||||||||||||||||||||||
Year ended 08/31/12 | 10.60 | 0.37 | 0.44 | 0.81 | (0.44 | ) | (0.02 | ) | (0.46 | ) | 10.95 | 7.86 | 295,311 | 0.74 | 1.01 | 3.44 | 297 | |||||||||||||||||||||||||||||||||||||||
Year ended 08/31/11 | 10.75 | 0.35 | (0.03 | ) | 0.32 | (0.32 | ) | (0.15 | ) | (0.47 | ) | 10.60 | 3.10 | 225,417 | 0.75 | 1.20 | 3.27 | 138 | ||||||||||||||||||||||||||||||||||||||
Class B | ||||||||||||||||||||||||||||||||||||||||||||||||||||||||
Year ended 08/31/15 | 10.91 | 0.22 | (0.19 | ) | 0.03 | (0.31 | ) | — | (0.31 | ) | 10.63 | 0.25 | 8,494 | 1.59 | (d) | 1.72 | (d) | 2.03 | (d) | 537 | ||||||||||||||||||||||||||||||||||||
Year ended 08/31/14 | 10.41 | 0.31 | 0.57 | 0.88 | (0.38 | ) | — | (0.38 | ) | 10.91 | 8.53 | 11,899 | 1.56 | 1.78 | 2.87 | 398 | ||||||||||||||||||||||||||||||||||||||||
Year ended 08/31/13 | 10.95 | 0.23 | (0.51 | ) | (0.28 | ) | (0.26 | ) | — | (0.26 | ) | 10.41 | (2.66 | ) | 15,876 | 1.48 | 1.74 | 2.11 | 252 | |||||||||||||||||||||||||||||||||||||
Year ended 08/31/12 | 10.60 | 0.29 | 0.44 | 0.73 | (0.36 | ) | (0.02 | ) | (0.38 | ) | 10.95 | 7.06 | 22,465 | 1.49 | 1.76 | 2.69 | 297 | |||||||||||||||||||||||||||||||||||||||
Year ended 08/31/11 | 10.74 | 0.27 | (0.02 | ) | 0.25 | (0.24 | ) | (0.15 | ) | (0.39 | ) | 10.60 | 2.43 | 24,401 | 1.50 | 1.95 | 2.52 | 138 | ||||||||||||||||||||||||||||||||||||||
Class C | ||||||||||||||||||||||||||||||||||||||||||||||||||||||||
Year ended 08/31/15 | 10.91 | 0.22 | (0.19 | ) | 0.03 | (0.31 | ) | — | (0.31 | ) | 10.63 | 0.25 | 65,160 | 1.59 | (d) | 1.72 | (d) | 2.03 | (d) | 537 | ||||||||||||||||||||||||||||||||||||
Year ended 08/31/14 | 10.41 | 0.31 | 0.57 | 0.88 | (0.38 | ) | — | (0.38 | ) | 10.91 | 8.53 | 38,142 | 1.56 | 1.78 | 2.87 | 398 | ||||||||||||||||||||||||||||||||||||||||
Year ended 08/31/13 | 10.94 | 0.23 | (0.50 | ) | (0.27 | ) | (0.26 | ) | — | (0.26 | ) | 10.41 | (2.56 | ) | 35,770 | 1.48 | 1.74 | 2.11 | 252 | |||||||||||||||||||||||||||||||||||||
Year ended 08/31/12 | 10.60 | 0.29 | 0.44 | 0.73 | (0.37 | ) | (0.02 | ) | (0.39 | ) | 10.94 | 6.96 | 37,950 | 1.49 | 1.76 | 2.69 | 297 | |||||||||||||||||||||||||||||||||||||||
Year ended 08/31/11 | 10.74 | 0.27 | (0.02 | ) | 0.25 | (0.24 | ) | (0.15 | ) | (0.39 | ) | 10.60 | 2.43 | 33,476 | 1.50 | 1.95 | 2.52 | 138 | ||||||||||||||||||||||||||||||||||||||
Class R | ||||||||||||||||||||||||||||||||||||||||||||||||||||||||
Year ended 08/31/15 | 10.91 | 0.27 | (0.19 | ) | 0.08 | (0.36 | ) | — | (0.36 | ) | 10.63 | 0.75 | 5,848 | 1.09 | (d) | 1.22 | (d) | 2.53 | (d) | 537 | ||||||||||||||||||||||||||||||||||||
Year ended 08/31/14 | 10.41 | 0.36 | 0.57 | 0.93 | (0.43 | ) | — | (0.43 | ) | 10.91 | 9.07 | 3,554 | 1.06 | 1.28 | 3.37 | 398 | ||||||||||||||||||||||||||||||||||||||||
Year ended 08/31/13 | 10.95 | 0.28 | (0.51 | ) | (0.23 | ) | (0.31 | ) | — | (0.31 | ) | 10.41 | (2.16 | ) | 2,820 | 0.98 | 1.24 | 2.61 | 252 | |||||||||||||||||||||||||||||||||||||
Year ended 08/31/12 | 10.60 | 0.34 | 0.44 | 0.78 | (0.41 | ) | (0.02 | ) | (0.43 | ) | 10.95 | 7.59 | 3,313 | 0.99 | 1.26 | 3.19 | 297 | |||||||||||||||||||||||||||||||||||||||
Year ended 08/31/11 | 10.74 | 0.32 | (0.02 | ) | 0.30 | (0.29 | ) | (0.15 | ) | (0.44 | ) | 10.60 | 2.94 | 2,301 | 1.00 | 1.45 | 3.02 | 138 | ||||||||||||||||||||||||||||||||||||||
Class Y | ||||||||||||||||||||||||||||||||||||||||||||||||||||||||
Year ended 08/31/15 | 10.92 | 0.33 | (0.19 | ) | 0.14 | (0.42 | ) | — | (0.42 | ) | 10.64 | 1.25 | 102,380 | 0.59 | (d) | 0.72 | (d) | 3.03 | (d) | 537 | ||||||||||||||||||||||||||||||||||||
Year ended 08/31/14 | 10.42 | 0.42 | 0.56 | 0.98 | (0.48 | ) | — | (0.48 | ) | 10.92 | 9.61 | 9,699 | 0.56 | 0.78 | 3.87 | 398 | ||||||||||||||||||||||||||||||||||||||||
Year ended 08/31/13 | 10.95 | 0.34 | (0.50 | ) | (0.16 | ) | (0.37 | ) | — | (0.37 | ) | 10.42 | (1.58 | ) | 1,456 | 0.48 | 0.74 | 3.11 | 252 | |||||||||||||||||||||||||||||||||||||
Year ended 08/31/12 | 10.60 | 0.39 | 0.45 | 0.84 | (0.47 | ) | (0.02 | ) | (0.49 | ) | 10.95 | 8.12 | 5,753 | 0.49 | 0.76 | 3.69 | 297 | |||||||||||||||||||||||||||||||||||||||
Year ended 08/31/11 | 10.74 | 0.37 | (0.01 | ) | 0.36 | (0.35 | ) | (0.15 | ) | (0.50 | ) | 10.60 | 3.46 | 5,234 | 0.50 | 0.95 | 3.52 | 138 | ||||||||||||||||||||||||||||||||||||||
Class R5 | ||||||||||||||||||||||||||||||||||||||||||||||||||||||||
Year ended 08/31/15 | 10.91 | 0.33 | (0.19 | ) | 0.14 | (0.42 | ) | — | (0.42 | ) | 10.63 | 1.25 | 668 | 0.59 | (d) | 0.60 | (d) | 3.03 | (d) | 537 | ||||||||||||||||||||||||||||||||||||
Year ended 08/31/14 | 10.40 | 0.41 | 0.58 | 0.99 | (0.48 | ) | — | (0.48 | ) | 10.91 | 9.72 | 1,495 | 0.56 | 0.60 | 3.87 | 398 | ||||||||||||||||||||||||||||||||||||||||
Year ended 08/31/13 | 10.94 | 0.34 | (0.51 | ) | (0.17 | ) | (0.37 | ) | — | (0.37 | ) | 10.40 | (1.68 | ) | 1,960 | 0.48 | 0.56 | 3.11 | 252 | |||||||||||||||||||||||||||||||||||||
Year ended 08/31/12 | 10.60 | 0.39 | 0.44 | 0.83 | (0.47 | ) | (0.02 | ) | (0.49 | ) | 10.94 | 8.03 | 169,474 | 0.49 | 0.56 | 3.69 | 297 | |||||||||||||||||||||||||||||||||||||||
Year ended 08/31/11 | 10.74 | 0.37 | (0.01 | ) | 0.36 | (0.35 | ) | (0.15 | ) | (0.50 | ) | 10.60 | 3.46 | 166,656 | 0.50 | 0.66 | 3.52 | 138 | ||||||||||||||||||||||||||||||||||||||
Class R6 | ||||||||||||||||||||||||||||||||||||||||||||||||||||||||
Year ended 08/31/15 | 10.91 | 0.34 | (0.19 | ) | 0.15 | (0.43 | ) | — | (0.43 | ) | 10.63 | 1.32 | 275,013 | 0.52 | (d) | 0.53 | (d) | 3.10 | (d) | 537 | ||||||||||||||||||||||||||||||||||||
Year ended 08/31/14 | 10.41 | 0.42 | 0.56 | 0.98 | (0.48 | ) | — | (0.48 | ) | 10.91 | 9.64 | 267,254 | 0.54 | 0.56 | 3.89 | 398 | ||||||||||||||||||||||||||||||||||||||||
Year ended 08/31/13(e) | 10.97 | 0.32 | (0.54 | ) | (0.22 | ) | (0.34 | ) | — | (0.34 | ) | 10.41 | (2.07 | ) | 185,513 | 0.48 | (f) | 0.54 | (f) | 3.11 | (f) | 252 | ||||||||||||||||||||||||||||||||||
| (a) | Calculated using average shares outstanding. |
| (b) | Includes adjustments in accordance with accounting principles generally accepted in the United States of America and as such, the net asset value for financial reporting purposes and the returns based upon those net asset values may differ from the net asset value and returns for shareholder transactions. Does not include sales charges and is not annualized for periods less than one year, if applicable. |
| (c) | Portfolio turnover is calculated at the fund level and is not annualized for periods less than one year, if applicable. For the period ended August 31, 2011, the portfolio turnover calculation excludes the value of securities purchased of $390,261,951 and sold of $29,803,473 in the effort to realign the Fund’s portfolio holdings after the reorganization of Invesco Core Bond Fund and Invesco Van Kampen Core Plus Fixed Income Fund into the Fund. |
| (d) | Ratios are based on average daily net assets (000’s omitted) of $417,221, $10,412, $52,450, $5,319, $63,520, $867 and $273,570 for Class A, Class B, Class C, Class R, Class Y, Class R5 and Class R6 shares, respectively. |
| (e) | Commencement date of September 24, 2012 for Class R6 shares. |
| (f) | Annualized. |
44 Invesco Core Plus Bond Fund
Report of Independent Registered Public Accounting Firm
To the Board of Trustees of AIM Counselor Series Trust (Invesco Counselor Series Trust)
and Shareholders of Invesco Core Plus Bond Fund:
In our opinion, the accompanying statement of assets and liabilities, including the schedule of investments, and the related statements of operations and of changes in net assets and the financial highlights present fairly, in all material respects, the financial position of Invesco Core Plus Bond Fund (one of the funds constituting AIM Counselor Series Trust (Invesco Counselor Series Trust), hereafter referred to as the “Fund”) at August 31, 2015, the results of its operations for the year then ended, the changes in its net assets for each of the two years in the period then ended and the financial highlights for each of the five years in the period then ended, in conformity with accounting principles generally accepted in the United States of America. These financial statements and financial highlights (hereafter referred to as “financial statements”) are the responsibility of the Fund’s management. Our responsibility is to express an opinion on these financial statements based on our audits. We conducted our audits of these financial statements in accordance with the standards of the Public Company Accounting Oversight Board (United States). Those standards require that we plan and perform the audit to obtain reasonable assurance about whether the financial statements are free of material misstatement. An audit includes examining, on a test basis, evidence supporting the amounts and disclosures in the financial statements, assessing the accounting principles used and significant estimates made by management, and evaluating the overall financial statement presentation. We believe that our audits, which included confirmation of securities at August 31, 2015 by correspondence with the custodian and brokers, and the application of alternative auditing procedures where confirmations of security purchases have not been received, provide a reasonable basis for our opinion.
PRICEWATERHOUSECOOPERS LLP
October 27, 2015
Houston, Texas
45 Invesco Core Plus Bond Fund
Calculating your ongoing Fund expenses
Example
As a shareholder of the Fund, you incur two types of costs: (1) transaction costs, which may include sales charges (loads) on purchase payments or contingent deferred sales charges on redemptions, if any; and (2) ongoing costs, including management fees, distribution and/or service (12b-1) fees, and other Fund expenses. This example is intended to help you understand your ongoing costs (in dollars) of investing in the Fund and to compare these costs with ongoing costs of investing in other mutual funds. The example is based on an investment of $1,000 invested at the beginning of the period and held for the entire period March 1, 2015 through August 31, 2015.
Actual expenses
The table below provides information about actual account values and actual expenses. You may use the information in this table, together with the amount you invested, to estimate the expenses that you paid over the period. Simply divide your account value by $1,000 (for example, an $8,600 account value divided by $1,000 = 8.6), then multiply the result by the number in the table under the heading entitled “Actual Expenses Paid During Period” to estimate the expenses you paid on your account during this period.
Hypothetical example for comparison purposes
The table below also provides information about hypothetical account values and hypothetical expenses based on the Fund’s actual expense ratio and an assumed rate of return of 5% per year before expenses, which is not the Fund’s actual return.
The hypothetical account values and expenses may not be used to estimate the actual ending account balance or expenses you paid for the period. You may use this information to compare the ongoing costs of investing in the Fund and other funds. To do so, compare this 5% hypothetical example with the 5% hypothetical examples that appear in the shareholder reports of the other funds.
Please note that the expenses shown in the table are meant to highlight your ongoing costs only and do not reflect any transaction costs, such as sales charges (loads) on purchase payments or contingent deferred sales charges on redemptions, if any. Therefore, the hypothetical information is useful in comparing ongoing costs only, and will not help you determine the relative total costs of owning different funds. In addition, if these transaction costs were included, your costs would have been higher.
| Class | Beginning Account Value (03/01/15) | ACTUAL | HYPOTHETICAL (5% annual return before | Annualized Ratio | ||||||||||||||||||||
| Ending Account Value (08/31/15)1 | Expenses Paid During Period2 | Ending Account Value (08/31/15) | Expenses Paid During Period2 | |||||||||||||||||||||
A | $ | 1,000.00 | $ | 982.50 | $ | 4.25 | $ | 1,020.92 | $ | 4.33 | 0.85 | % | ||||||||||||
B | 1,000.00 | 978.80 | 7.98 | 1,017.14 | 8.13 | 1.60 | ||||||||||||||||||
C | 1,000.00 | 978.80 | 7.98 | 1,017.14 | 8.13 | 1.60 | ||||||||||||||||||
R | 1,000.00 | 981.20 | 5.49 | 1,019.66 | 5.60 | 1.10 | ||||||||||||||||||
Y | 1,000.00 | 983.70 | 3.00 | 1,022.18 | 3.06 | 0.60 | ||||||||||||||||||
R5 | 1,000.00 | 984.60 | 2.90 | 1,022.28 | 2.96 | 0.58 | ||||||||||||||||||
R6 | 1,000.00 | 985.00 | 2.55 | 1,022.63 | 2.60 | 0.51 | ||||||||||||||||||
| 1 | The actual ending account value is based on the actual total return of the Fund for the period March 1, 2015 through August 31, 2015, after actual expenses and will differ from the hypothetical ending account value which is based on the Fund’s expense ratio and a hypothetical annual return of 5% before expenses. |
| 2 | Expenses are equal to the Fund’s annualized expense ratio as indicated above multiplied by the average account value over the period, multiplied by 184/365 to reflect the most recent fiscal half year. |
46 Invesco Core Plus Bond Fund
Approval of Investment Advisory and Sub-Advisory Contracts
The Board of Trustees (the Board) of AIM Counselor Series Trust (Invesco Counselor Series Trust) is required under the Investment Company Act of 1940, as amended, to approve annually the renewal of Invesco Core Plus Bond Fund’s (the Fund) investment advisory agreements. During contract renewal meetings held on June 9-10, 2015, the Board as a whole, and the disinterested or “independent” Trustees, who comprise over 75% of the Board, voting separately, approved the continuance for the Fund of the Master Investment Advisory Agreement with Invesco Advisers, Inc. (Invesco Advisers and the investment advisory agreement) and the Master Intergroup Sub-Advisory Contract for Mutual Funds with Invesco Asset Management Deutschland GmbH, Invesco Asset Management Limited, Invesco Asset Management (Japan) Limited, Invesco Hong Kong Limited, Invesco Senior Secured Management, Inc. and Invesco Canada Ltd. (collectively, the Affiliated Sub-Advisers and the sub-advisory contracts) for another year, effective July 1, 2015.
In evaluating the fairness and reasonableness of compensation under the Fund’s investment advisory agreement and sub-advisory contracts, the Board considered, among other things, the factors discussed below. The Board determined that continuation of the Fund’s investment advisory agreement and the sub-advisory contracts is in the best interest of the Fund and its shareholders and that the compensation payable to Invesco Advisers and the Affiliated Sub-Advisers under the agreements is fair and reasonable.
The Board’s Fund Evaluation Process
The Board’s Investments Committee has established three Sub-Committees, each of which is primarily responsible for overseeing the performance and investment management services provided by Invesco Advisers and the Affiliated Sub-Advisers to a number of the funds advised by Invesco Advisers (the Invesco Funds). The Sub-Committees meet throughout the year to review the performance of their assigned Invesco Funds, including reviewing materials prepared under the direction of the independent Senior Officer, an officer of the Invesco Funds who reports directly to the independent Trustees. Over the course of each year, the Sub-Committees meet with portfolio managers for their assigned Invesco Funds and other members of management to review the performance, investment objective(s), policies, strategies, limitations and investment risks of these funds. The Board had the benefit of reports from the Sub-Committees and Investments Committee throughout the year in considering approval of the continuance of each Invesco Fund’s investment advisory agreement and sub-advisory contracts for another year.
During the contract renewal process, the Board receives comparative performance and fee data regarding the Invesco Funds prepared by Invesco Advisers and Lipper Inc. (Lipper), an independent provider of investment company data. The Board also receives a report and this independent written evaluation from the Senior Officer. The Senior Officer’s evaluation is prepared as part of his responsibility to manage the process by which the Invesco Funds’ proposed management fees are negotiated during the annual contract renewal process to ensure they are negotiated in a manner that is at arms’ length and reasonable. In addition to meetings with Invesco Advisers and fund counsel, the independent Trustees also discuss the continuance of the investment advisory agreement and sub-advisory contracts in separate sessions with the Senior Officer and with independent legal counsel.
The Trustees recognized that the advisory fee rates for the Invesco Funds are, in many cases, the result of years of review and negotiation. The Trustees’ deliberations and conclusions in a particular year may be based in part on their deliberations and conclusions regarding these arrangements throughout the year and in prior years. The Trustees’ review and conclusions are based on the comprehensive consideration of all information presented to them and are not the result of any single determinative factor. Moreover, one Trustee may have weighed a particular piece of information or factor differently than another Trustee.
The discussion below is a summary of the Senior Officer’s independent written evaluation with respect to the Fund’s investment advisory agreement as well as a discussion of the material factors and related conclusions that formed the basis for the Board’s approval of the Fund’s investment advisory agreement and sub-advisory contracts. Unless otherwise stated, this information is current as of June 10, 2015, and does not reflect consideration of factors that became known to the Board after that date.
Factors and Conclusions and Summary of Independent Written Fee Evaluation
| A. | Nature, Extent and Quality of Services Provided by Invesco Advisers and the Affiliated Sub-Advisers |
The Board reviewed the advisory services provided to the Fund by Invesco Advisers under the Fund’s investment advisory agreement, the performance of Invesco Advisers in providing these services, and the credentials and experience of the officers and employees of Invesco Advisers who provide these services, including the Fund’s portfolio manager or managers. The Board’s review of the qualifications of Invesco Advisers to provide advisory services included the Board’s consideration of Invesco Advisers’ investment
process oversight, independent credit analysis and investment risk management. The Board also considered non-advisory services that Invesco Advisers and its affiliates provide to the Invesco Funds such as various back office support functions, equity and fixed income trading operations, internal audit, distribution, valuation and legal and compliance.
In determining whether to continue the Fund’s investment advisory agreement, the Board considered the benefits of reapproving an existing relationship and the greater uncertainty that may be associated with entering into a new relationship. The Board concluded that the nature, extent and quality of the services provided to the Fund by Invesco Advisers are appropriate and satisfactory and consistent with the terms of the Fund’s investment advisory agreement.
The Board reviewed the services that may be provided by the Affiliated Sub-Advisers under the sub-advisory contracts and the credentials and experience of the officers and employees of the Affiliated Sub-Advisers who provide these services. The Board noted that the Affiliated Sub-Advisers have offices and personnel that are located in financial centers around the world. As a result, the Affiliated Sub-Advisers can provide research and investment analysis on the markets and economies of various countries in which the Fund may invest, make recommendations regarding securities and assist with security trades. The Board concluded that the sub-advisory contracts benefit the Fund and its shareholders by permitting Invesco Advisers to use the resources and talents of the Affiliated Sub-Advisers in managing the Fund. The Board concluded that the nature, extent and quality of the services that may be provided by the Affiliated Sub-Advisers are appropriate and satisfactory and consistent with the terms of the Fund’s sub-advisory contracts.
| B. | Fund Performance |
The Board considered Fund performance as a relevant factor in considering whether to approve the investment advisory agreement. The Board did not view Fund performance as a relevant factor in considering whether to approve the sub-advisory contracts for the Fund, as no Affiliated Sub-Adviser currently manages assets of the Fund.
The Board compared the Fund’s performance during the past one, three and five calendar years to the performance of funds in the Lipper performance universe and against the Lipper Core Plus Bond Funds Index. The Board noted that performance of Class A shares of the Fund was in the first quintile of its performance universe for the one year period, the second quintile for the three year period and the third quintile for the five year period (the first quintile being the best performing funds and the fifth quintile being the worst performing funds).
47 Invesco Core Plus Bond Fund
The Board noted that performance of Class A shares of the Fund was above the performance of the Index for the one and three year periods and below the Index for the five year period. The Board noted that the Fund had merged with another fund in 2011 and achieved sufficient assets to implement fully the “plus” factors of investing in emerging market and high yield bonds. The Trustees also reviewed more recent Fund performance and this review did not change their conclusions.
| C. | Advisory and Sub-Advisory Fees |
The Board compared the Fund’s contractual management fee rate to the contractual management fee rates of funds in the Fund’s Lipper expense group at a common asset level. The Board noted that the contractual management fee rate for Class A shares of the Fund was below the median contractual management fee rate of funds in its expense group. The Board noted that the term “contractual management fee” may include both advisory and certain administrative services fees, but that Lipper does not provide information on a fund by fund basis as to what is included. The Board noted that Invesco Advisers does not charge the Invesco Funds for the administrative services included in the term as defined by Lipper. The Board also reviewed the methodology used by Lipper in providing expense group information, which includes using each fund’s contractual management fee schedule (including any applicable breakpoints) as reported in the most recent prospectus or statement of additional information for each fund in the expense group.
The Board noted that Invesco Advisers has contractually agreed to waive fees and/or limit expenses of the Fund through at least December 31. 2015 in an amount necessary to limit total annual operating expenses to a specified percentage of average daily net assets for each class of the Fund.
The Board noted that Invesco Advisers and the Affiliated Sub-Advisers do not manage other mutual funds with investment strategies comparable to those of the Fund.
The Board considered the fees charged by Invesco Advisers and the Affiliated Sub-Advisers to other client accounts with investment strategies comparable to those of the Fund. The Board noted that Invesco Advisers or the Affiliated Sub-Advisers may charge lower fees to large institutional clients. Invesco Advisers reviewed with the Board the significantly greater scope of services it provides to the Invesco Funds relative to certain other types of client accounts. These additional services include provision of administrative services, officers and office space, oversight of service providers, preparation of annual registration statement updates and financial information and regulatory compliance under the Investment Company Act of 1940, as amended.
Invesco Advisers also reviewed generally the higher frequency of shareholder purchases and redemptions in the Invesco Funds relative to the flow of assets for other client accounts. Invesco
Advisers advised the Board that advance notice of redemptions is often provided to Invesco Advisers by institutional clients. The Board did note that sub-advisory fee rates charged by the Affiliated Sub-Advisers to manage the Invesco Funds and to manage other client accounts tended to be more comparable, reflecting a similar scope of services. The information received by the Board demonstrated that the aggregate services provided to the Invesco Funds were sufficiently different from those provided to institutional clients to support the difference in fees.
The Board also considered the services that may be provided by the Affiliated Sub-Advisers pursuant to the sub-advisory contracts, as well as the fees payable by Invesco Advisers to the Affiliated Sub-Advisers pursuant to the sub-advisory contracts. The Board also noted that the sub-advisory fees are not paid directly by the Fund, but rather, are payable by Invesco Advisers to the Affiliated Sub-Advisers.
| D. | Economies of Scale and Breakpoints |
The Board considered the extent to which there are economies of scale in the provision of advisory services to the Fund. The Board also considered whether the Fund benefits from economies of scale through contractual breakpoints in the Fund’s advisory fee schedule. The Board also noted that the Fund shares directly in economies of scale through lower fees charged by third party service providers based on the combined size of the Invesco Funds and other clients advised by Invesco Advisers.
| E. | Profitability and Financial Resources |
The Board reviewed information from Invesco Advisers concerning the costs of the advisory and other services that Invesco Advisers and its affiliates provide to the Fund and the Invesco Funds and the profitability of Invesco Advisers and its affiliates in providing these services. The Board received information from Invesco Advisers about the methodology used to prepare the profitability information. The Board noted that Invesco Advisers continues to operate at a net profit from services Invesco Advisers and its affiliates provide to the Invesco Funds and the Fund. The Board did not deem the level of profits realized by Invesco Advisers and its affiliates from providing services to the Fund to be excessive given the nature, quality and extent of the services provided. The Board received and accepted information from Invesco Advisers demonstrating that Invesco Advisers and each Affiliated Sub-Adviser are financially sound and have the resources necessary to perform their obligations under the investment advisory agreement and sub-advisory contracts.
| F. | Collateral Benefits to Invesco Advisers and its Affiliates |
The Board considered various other benefits received by Invesco Advisers and its affiliates from the relationship with the Fund, including the fees received for providing transfer agency and distribution services to the Fund. The Board considered comparative information regarding fees charged for these services, including
information provided by Lipper and other independent sources. The Board considered the performance of Invesco Advisers and its affiliates in providing these services and the organizational structure employed to provide these services. The Board also considered that these services are provided to the Fund pursuant to written contracts that are reviewed and approved on an annual basis by the Board; and that the services are required for the operation of the Fund.
The Board considered the benefits realized by Invesco Advisers and the Affiliated Sub-Advisers as a result of portfolio brokerage transactions executed through “soft dollar” arrangements. Invesco Advisers noted that the Fund does not execute brokerage transactions through “soft dollar” arrangements to any significant degree.
The Board considered that the Fund’s uninvested cash and cash collateral from any securities lending arrangements may be invested in money market funds advised by Invesco Advisers pursuant to procedures approved by the Board. The Board noted that Invesco Advisers receives advisory fees from these affiliated money market funds attributable to such investments, although Invesco Advisers has contractually agreed to waive through varying periods the advisory fees payable by the Invesco Funds with respect to investments in the affiliated money market funds. The waiver is in an amount equal to 100% of the net advisory fee Invesco Advisers receives from the affiliated money market funds with respect to the Fund’s investment in the affiliated money market funds of uninvested cash, but not cash collateral. The Board concluded that the amount of advisory fees received by Invesco Advisors from the Fund’s investment of cash collateral from any securities lending arrangements in the affiliated money market funds is fair and reasonable.
48 Invesco Core Plus Bond Fund
Tax Information
Form 1099-DIV, Form 1042-S and other year-end tax information provide shareholders with actual calendar year amounts that should be included in their tax returns. Shareholders should consult their tax advisors.
The following distribution information is being provided as required by the Internal Revenue Code or to meet a specific state’s requirement.
The Fund designates the following amounts or, if subsequently determined to be different, the maximum amount allowable for its fiscal year ended August 31, 2015:
Federal and State Income Tax | ||||
Qualified Dividend Income* | 1.95 | % | ||
Corporate Dividends Received Deduction* | 1.95 | % | ||
U.S. Treasury Obligations* | 7.61 | % | ||
49 Invesco Core Plus Bond Fund
Trustees and Officers
The address of each trustee and officer is AIM Counselor Series Trust (Invesco Counselor Series Trust) (the “Trust”), 11 Greenway Plaza, Suite 1000, Houston, Texas 77046-1173. The trustees serve for the life of the Trust, subject to their earlier death, incapacitation, resignation, retirement or removal as more specifically provided in the Trust’s organizational documents. Each officer serves for a one year term or until their successors are elected and qualified. Column two below includes length of time served with predecessor entities, if any.
| Name, Year of Birth and Position(s) Held with the Trust | Trustee and/ or Officer Since | Principal Occupation(s) During Past 5 Years | Number of Funds in Fund Complex Overseen by Trustee | Other Directorship(s) Held by Trustee During Past 5 Years | ||||
| Interested Persons | ||||||||
| Martin L. Flanagan1 — 1960 Trustee | 2007 | Executive Director, Chief Executive Officer and President, Invesco Ltd. (ultimate parent of Invesco and a global investment management firm); Advisor to the Board, Invesco Advisers, Inc. (formerly known as Invesco Institutional (N.A.), Inc.); Trustee, The Invesco Funds; Vice Chair, Investment Company Institute; and Member of Executive Board, SMU Cox School of Business
Formerly: Chairman and Chief Executive Officer, Invesco Advisers, Inc. (registered investment adviser); Director, Chairman, Chief Executive Officer and President, IVZ Inc. (holding company), INVESCO Group Services, Inc. (service provider) and Invesco North American Holdings, Inc. (holding company); Director, Chief Executive Officer and President, Invesco Holding Company Limited (parent of Invesco and a global investment management firm); Director, Invesco Ltd.; Chairman, Investment Company Institute and President, Co-Chief Executive Officer, Co-President, Chief Operating Officer and Chief Financial Officer, Franklin Resources, Inc. (global investment management organization). | 144 | None | ||||
| Philip A. Taylor2 — 1954 Trustee, President and Principal Executive Officer | 2006 | Head of North American Retail and Senior Managing Director, Invesco Ltd.; Director, Co-Chairman, Co-President and Co-Chief Executive Officer, Invesco Advisers, Inc. (formerly known as Invesco Institutional (N.A.), Inc.) (registered investment adviser); Director, Chairman, Chief Executive Officer and President, Invesco Management Group, Inc. (formerly known as Invesco Aim Management Group, Inc.) (financial services holding company); Director and President, INVESCO Funds Group, Inc. (registered investment adviser and registered transfer agent); Director and Chairman, Invesco Investment Services, Inc. (formerly known as Invesco Aim Investment Services, Inc.) (registered transfer agent) and IVZ Distributors, Inc. (formerly known as INVESCO Distributors, Inc.) (registered broker dealer); Director, President and Chairman, Invesco Inc. (holding company), Invesco Canada Holdings Inc. (holding company), Trimark Investments Ltd./Placements Trimark Ltèe and Invesco Financial Services Ltd/Services Financiers Invesco Ltèe; Chief Executive Officer, Invesco Corporate Class Inc. (corporate mutual fund company) Director, Chairman and Chief Executive Officer, Invesco Canada Ltd. (formerly known as Invesco Trimark Ltd./Invesco Trimark Ltèe) (registered investment adviser and registered transfer agent); Trustee, President and Principal Executive Officer, The Invesco Funds (other than AIM Treasurer’s Series Trust (Invesco Treasurer’s Series Trust), Short-Term Investments Trust and Invesco Management Trust); Trustee and Executive Vice President, The Invesco Funds (AIM Treasurer’s Series Trust (Invesco Treasurer’s Series Trust), Short-Term Investments Trust and Invesco Management Trust only); Director, Invesco Investment Advisers LLC (formerly known as Van Kampen Asset Management); Director, Chief Executive Officer and President, Van Kampen Exchange Corp.
Formerly: Chief Executive Officer, Invesco Canada Fund Inc (corporate mutual fund company); Director and Chairman, Van Kampen Investor Services Inc.; Director, Chief Executive Officer and President, 1371 Preferred Inc. (holding company) and Van Kampen Investments Inc.; Director and President, AIM GP Canada Inc. (general partner for limited partnerships) and Van Kampen Advisors, Inc.; Director and Chief Executive Officer, Invesco Trimark Dealer Inc. (registered broker dealer); Director, Invesco Distributors, Inc. (formerly known as Invesco Aim Distributors, Inc.) (registered broker dealer); Manager, Invesco PowerShares Capital Management LLC; Director, Chief Executive Officer and President, Invesco Advisers, Inc.; Director, Chairman, Chief Executive Officer and President, Invesco Aim Capital Management, Inc.; President, Invesco Trimark Dealer Inc. and Invesco Trimark Ltd./Invesco Trimark Ltèe; Director and President, AIM Trimark Corporate Class Inc. and AIM Trimark Canada Fund Inc.; Senior Managing Director, Invesco Holding Company Limited; Director and Chairman, Fund Management Company (former registered broker dealer); President and Principal Executive Officer, The Invesco Funds (AIM Treasurer’s Series Trust (Invesco Treasurer’s Series Trust), and Short-Term Investments Trust only); President, AIM Trimark Global Fund Inc. and AIM Trimark Canada Fund Inc.. | 144 | None |
| 1 | Mr. Flanagan is considered an interested person (within the meaning of Section 2(a)(19) of the 1940 Act) of the Trust because he is an officer of the Adviser to the Trust, and an officer and a director of Invesco Ltd., ultimate parent of the Adviser. |
| 2 | Mr. Taylor is considered an interested person (within the meaning of Section 2(a)(19) of the 1940 Act) of the Trust because he is an officer and a director of the Adviser. |
T-1 Invesco Core Plus Bond Fund
Trustees and Officers—(continued)
| Name, Year of Birth and Position(s) Held with the Trust | Trustee and/ or Officer Since | Principal Occupation(s) During Past 5 Years | Number of Funds in Fund Complex Overseen by Trustee | Other Directorship(s) Held by Trustee During Past 5 Years | ||||
| Independent Trustees | ||||||||
Bruce L. Crockett — 1944 Trustee and Chair | 2003 | Chairman, Crockett Technologies Associates (technology consulting company)
Formerly: Director, Captaris (unified messaging provider); Director, President and Chief Executive Officer, COMSAT Corporation; Chairman, Board of Governors of INTELSAT (international communications company); ACE Limited (insurance company); Independent Directors Council and Investment Company Institute | 144 | ALPS (Attorneys Liability Protection Society) (insurance company) and Globe Specialty Metals, Inc. (metallurgical company) | ||||
David C. Arch — 1945 Trustee | 2010 | Chairman of Blistex Inc., a consumer health care products manufacturer | 144 | Board member of the Illinois Manufacturers’ Association; Member of the Board of Visitors, Institute for the Humanities, University of Michigan; Member of the Audit Committee of the Edward-Elmhurst Hospital | ||||
James T. Bunch — 1942 Trustee | 2000 | Managing Member, Grumman Hill Group LLC (family office/private equity investments)
Formerly: Founder, Green Manning & Bunch Ltd. (investment banking firm) (1988-2010); Executive Committee, United States Golf Association; and Chairman, Board of Governors, Western Golf Association | 144 | Chairman of the Board of Trustees, Evans Scholars Foundation; and Chairman of the Board, Denver Film Society | ||||
Rodney F. Dammeyer — 1940 Trustee | 2010 | Chairman of CAC, LLC, (private company offering capital investment and management advisory services)
Formerly: Prior to 2001, Managing Partner at Equity Group Corporate Investments; Prior to 1995, Chief Executive Officer of Itel Corporation (formerly Anixter International); Prior to 1985, experience includes Senior Vice President and Chief Financial Officer of Household International, Inc., Executive Vice President and Chief Financial Officer of Northwest Industries, Inc. and Partner of Arthur Andersen & Co.; From 1987 to 2010, Director/Trustee of investment companies in the Van Kampen Funds complex | 144 | Director of Quidel Corporation and Stericycle, Inc. | ||||
Albert R. Dowden — 1941 Trustee | 2003 | Director of a number of public and private business corporations, including the Boss Group, Ltd. (private investment and management); Nature’s Sunshine Products, Inc. and Reich & Tang Funds (5 portfolios) (registered investment company)
Formerly: Director, Homeowners of America Holding Corporation/Homeowners of America Insurance Company (property casualty company); Director, Continental Energy Services, LLC (oil and gas pipeline service); Director, CompuDyne Corporation (provider of product and services to the public security market) and Director, Annuity and Life Re (Holdings), Ltd. (reinsurance company); Director, President and Chief Executive Officer, Volvo Group North America, Inc.; Senior Vice President, AB Volvo; Director of various public and private corporations; Chairman, DHJ Media, Inc.; Director, Magellan Insurance Company; and Director, The Hertz Corporation, Genmar Corporation (boat manufacturer), National Media Corporation; Advisory Board of Rotary Power International (designer, manufacturer, and seller of rotary power engines); and Chairman, Cortland Trust, Inc. (registered investment company) | 144 | Director of: Nature’s Sunshine Products, Inc., Reich & Tang Funds, Homeowners of America Holding Corporation/ Homeowners of America Insurance Company, the Boss Group | ||||
Jack M. Fields — 1952 Trustee | 2003 | Chief Executive Officer, Twenty First Century Group, Inc. (government affairs company); Owner and Chief Executive Officer, Dos Angeles Ranch, L.P. (cattle, hunting, corporate entertainment); and Discovery Global Education Fund (non-profit)
Formerly: Chief Executive Officer, Texana Timber LP (sustainable forestry company); Director of Cross Timbers Quail Research Ranch (non-profit); and member of the U.S. House of Representatives | 144 | Insperity, Inc. (formerly known as Administaff) | ||||
Prema Mathai-Davis — 1950 Trustee | 2003 | Retired. Formerly: Chief Executive Officer, YWCA of the U.S.A. | 144 | None | ||||
Larry Soll — 1942 Trustee | 1997 | Retired. Formerly: Chairman, Chief Executive Officer and President, Synergen Corp. (a biotechnology company) | 144 | None | ||||
Hugo F. Sonnenschein — 1940 Trustee | 2010 | President Emeritus and Honorary Trustee of the University of Chicago and the Adam Smith Distinguished Service Professor in the Department of Economics at the University of Chicago. Prior to 2000, President of the University of Chicago | 144 | Trustee of the University of Rochester and a member of its investment committee; Member of the National Academy of Sciences and the American Philosophical Society; Fellow of the American Academy of Arts and Sciences | ||||
| Raymond Stickel, Jr. — 1944 Trustee | 2005 | Retired. Formerly: Director, Mainstay VP Series Funds, Inc. (25 portfolios) and Partner, Deloitte & Touche | 144 | None |
T-2 Invesco Core Plus Bond Fund
Trustees and Officers—(continued)
| Name, Year of Birth and Position(s) Held with the Trust | Trustee and/ or Officer Since | Principal Occupation(s) During Past 5 Years | Number of Funds in Fund Complex Overseen by Trustee | Other Directorship(s) Held by Trustee During Past 5 Years | ||||
| Independent Trustees—(continued) | ||||||||
Suzanne H. Woolsey — 1941 Trustee | 2014 | Chief Executive Officer of Woolsey Partners LLC | 144 | Emeritus Chair of the Board of Trustees of the Institute for Defense Analyses; Trustee of Colorado College; Trustee of California Institute of Technology; Prior to 2014, Director of Fluor Corp.; Prior to 2010, Trustee of the German Marshall Fund of the United States; Prior to 2010 Trustee of the Rocky Mountain Institute | ||||
| Other Officers | ||||||||
Russell C. Burk — 1958 Senior Vice President and Senior Officer | 2005 | Senior Vice President and Senior Officer, The Invesco Funds | N/A | N/A | ||||
John M. Zerr — 1962 Senior Vice President, Chief Legal Officer and Secretary | 2006 | Director, Senior Vice President, Secretary and General Counsel, Invesco Management Group, Inc. (formerly known as Invesco Aim Management Group, Inc.) and Van Kampen Exchange Corp.; Senior Vice President, Invesco Advisers, Inc. (formerly known as Invesco Institutional (N.A.), Inc.) (registered investment adviser); Senior Vice President and Secretary, Invesco Distributors, Inc. (formerly known as Invesco Aim Distributors, Inc.); Director, Vice President and Secretary, Invesco Investment Services, Inc. (formerly known as Invesco Aim Investment Services, Inc.) and IVZ Distributors, Inc. (formerly known as INVESCO Distributors, Inc.); Director and Vice President, INVESCO Funds Group, Inc.; Senior Vice President, Chief Legal Officer and Secretary, The Invesco Funds; Managing Director, Invesco PowerShares Capital Management LLC; Director, Secretary and General Counsel, Invesco Investment Advisers LLC (formerly known as Van Kampen Asset Management); Secretary and General Counsel, Invesco Capital Markets, Inc. (formerly known as Van Kampen Funds Inc.) and Chief Legal Officer, PowerShares Exchange-Traded Fund Trust, PowerShares Exchange-Traded Fund Trust II, PowerShares India Exchange-Traded Fund Trust, PowerShares Actively Managed Exchange-Traded Fund Trust, and PowerShares Actively Managed Exchange-Traded Commodity Fund Trust
Formerly: Director and Vice President, Van Kampen Advisors Inc.; Director, Vice President, Secretary and General Counsel, Van Kampen Investor Services Inc.; Director, Invesco Distributors, Inc. (formerly known as Invesco Aim Distributors, Inc.); Director, Senior Vice President, General Counsel and Secretary, Invesco Aim Advisers, Inc. and Van Kampen Investments Inc.; Director, Vice President and Secretary, Fund Management Company; Director, Senior Vice President, Secretary, General Counsel and Vice President, Invesco Aim Capital Management, Inc.; Chief Operating Officer and General Counsel, Liberty Ridge Capital, Inc. (an investment adviser); Vice President and Secretary, PBHG Funds (an investment company) and PBHG Insurance Series Fund (an investment company); Chief Operating Officer, General Counsel and Secretary, Old Mutual Investment Partners (a broker-dealer); General Counsel and Secretary, Old Mutual Fund Services (an administrator) and Old Mutual Shareholder Services (a shareholder servicing center); Executive Vice President, General Counsel and Secretary, Old Mutual Capital, Inc. (an investment adviser); and Vice President and Secretary, Old Mutual Advisors Funds (an investment company) | N/A | N/A | ||||
| Sheri Morris — 1964 Vice President, Treasurer and Principal Financial Officer | 2003 | Vice President, Treasurer and Principal Financial Officer, The Invesco Funds; Vice President, Invesco Advisers, Inc. (formerly known as Invesco Institutional (N.A.), Inc.) (registered investment adviser); and Vice President, PowerShares Exchange-Traded Fund Trust, PowerShares Exchange-Traded Fund Trust II, PowerShares India Exchange-Traded Fund Trust, PowerShares Actively Managed Exchange-Traded Fund Trust, and PowerShares Actively Managed Exchange-Traded Commodity Fund Trust
Formerly: Vice President, Invesco Aim Advisers, Inc., Invesco Aim Capital Management, Inc. and Invesco Aim Private Asset Management, Inc.; Assistant Vice President and Assistant Treasurer, The Invesco Funds and Assistant Vice President, Invesco Advisers, Inc., Invesco Aim Capital Management, Inc. and Invesco Aim Private Asset Management, Inc.; and Treasurer, PowerShares Exchange-Traded Fund Trust, PowerShares Exchange-Traded Fund Trust II, PowerShares India Exchange-Traded Fund Trust and PowerShares Actively Managed Exchange-Traded Fund Trust | N/A | N/A | ||||
T-3 Invesco Core Plus Bond Fund
Trustees and Officers—(continued)
| Name, Year of Birth and Position(s) Held with the Trust | Trustee and/ or Officer Since | Principal Occupation(s) During Past 5 Years | Number of Funds in Fund Complex Overseen by Trustee | Other Directorship(s) Held by Trustee During Past 5 Years | ||||
| Other Officers—(continued) | ||||||||
| Karen Dunn Kelley — 1960 Vice President | 2003 | Senior Managing Director, Investments, Invesco Ltd.; Director, Co-President, Co-Chief Executive Officer, and Co-Chairman, Invesco Advisers, Inc. (formerly known as Invesco Institutional (N.A.), Inc.) (registered investment adviser); Chairman, Invesco Senior Secured Management, Inc.; Senior Vice President, Invesco Management Group, Inc. (formerly known as Invesco Aim Management Group, Inc.); Executive Vice President, Invesco Distributors, Inc. (formerly known as Invesco Aim Distributors, Inc.); Director, Invesco Mortgage Capital Inc. and Invesco Management Company Limited; Vice President, The Invesco Funds (other than AIM Treasurer’s Series Trust (Invesco Treasurer’s Series Trust), Short-Term Investments Trust and Invesco Management Trust); and President and Principal Executive Officer, The Invesco Funds (AIM Treasurer’s Series Trust (Invesco Treasurer’s Series Trust), Short-Term Investments Trust and Invesco Management Trust only)
Formerly: Director and President, INVESCO Asset Management (Bermuda) Ltd., Director, INVESCO Global Asset Management Limited and INVESCO Management S.A.; Senior Vice President, Van Kampen Investments Inc. and Invesco Advisers, Inc. (formerly known as Invesco Institutional (N.A.), Inc.) (registered investment adviser); Vice President, Invesco Advisers, Inc. (formerly known as Invesco Institutional (N.A.), Inc.); Director of Cash Management and Senior Vice President, Invesco Advisers, Inc. and Invesco Aim Capital Management, Inc.; Director and President, Fund Management Company; Chief Cash Management Officer, Director of Cash Management, Senior Vice President, and Managing Director, Invesco Aim Capital Management, Inc.; Director of Cash Management, Senior Vice President, and Vice President, Invesco Advisers, Inc. and The Invesco Funds (AIM Treasurer’s Series Trust (Invesco Treasurer’s Series Trust), and Short-Term Investments Trust only) | N/A | N/A | ||||
| Crissie M. Wisdom — 1969 Anti-Money Laundering Compliance Officer | 2013 | Anti-Money Laundering Compliance Officer, Invesco Advisers, Inc. (formerly known as Invesco Institutional (N.A.), Inc.) (registered investment adviser), Invesco Capital Markets, Inc. (formerly known as Van Kampen Funds Inc.), Invesco Distributors, Inc., Invesco Investment Services, Inc., Invesco Management Group, Inc., Van Kampen Exchange Corp., The Invesco Funds, and PowerShares Exchange-Traded Fund Trust, PowerShares Exchange-Traded Fund Trust II, PowerShares India Exchange-Traded Fund Trust, PowerShares Actively Managed Exchange-Traded Fund Trust and PowerShares Actively Managed Exchange-Traded Commodity Fund Trust; Anti-Money Laundering Compliance Officer and Bank Secrecy Act Officer, INVESCO National Trust Company and Invesco Trust Company; and Fraud Prevention Manager and Controls and Risk Analysis Manager for Invesco Investment Services, Inc.. | N/A | N/A | ||||
Lisa O. Brinkley — 1959 Chief Compliance Officer | 2004 | Senior Vice President and Chief Compliance Officer, Invesco Advisers, Inc. (registered investment adviser) (formerly known as Invesco Institutional (N.A., Inc.); and Chief Compliance Officer, The Invesco Funds
Formerly: Global Assurance Officer, Invesco Ltd. and Vice President, The Invesco Funds; Chief Compliance Officer, Invesco Distributors, Inc. (formerly known as Invesco Aim Distributors, Inc.), Invesco Investment Services, Inc.(formerly known as Invesco Aim Investment Services, Inc.) and Van Kampen Investor Services Inc.; Senior Vice President, Invesco Management Group, Inc.; Senior Vice President and Chief Compliance Officer, Invesco Advisers, Inc. and The Invesco Funds; Vice President and Chief Compliance Officer, Invesco Aim Capital Management, Inc. and Invesco Distributors, Inc.; Vice President, Invesco Investment Services, Inc. and Fund Management Company. | N/A | N/A |
The Statement of Additional Information of the Trust includes additional information about the Fund’s Trustees and is available upon request, without charge, by calling 1.800.959.4246. Please refer to the Fund’s prospectus for information on the Fund’s sub-advisers.
Office of the Fund 11 Greenway Plaza, Suite 1000 Houston, TX 77046-1173 | Investment Adviser Invesco Advisers, Inc. 1555 Peachtree Street, N.E. Atlanta, GA 30309 | Distributor Invesco Distributors, Inc. 11 Greenway Plaza, Suite 1000 Houston, TX 77046-1173 | Auditors PricewaterhouseCoopers LLP 1000 Louisiana Street, Suite 5800 Houston, TX 77002-5678 | |||
Counsel to the Fund Stradley Ronon Stevens & Young, LLP 2005 Market Street, Suite 2600 Philadelphia, PA 19103-7018 | Counsel to the Independent Trustees Goodwin Procter LLP 901 New York Avenue, N.W. Washington, D.C. 20001 | Transfer Agent Invesco Investment Services, Inc. 11 Greenway Plaza, Suite 1000 Houston, TX 77046-1173 | Custodian State Street Bank and Trust Company 225 Franklin Street Boston, MA 02110-2801 | |||
T-4 Invesco Core Plus Bond Fund

Invesco mailing information
Send general correspondence to Invesco Investment Services, Inc., P.O. Box 219078, Kansas City, MO 64121-9078.
Important notice regarding delivery of security holder documents
To reduce Fund expenses, only one copy of most shareholder documents may be mailed to shareholders with multiple accounts at the same address (Householding). Mailing of your shareholder documents may be householded indefinitely unless you instruct us otherwise. If you do not want the mailing of these documents to be combined with those for other members of your household, please contact Invesco Investment Services, Inc. at 800 959 4246 or contact your financial institution. We will begin sending you individual copies for each account within 30 days after receiving your request.
Fund holdings and proxy voting information
The Fund provides a complete list of its holdings four times in each fiscal year, at the quarter ends. For the second and fourth quarters, the lists appear in the Fund’s semiannual and annual reports to shareholders. For the first and third quarters, the Fund files the lists with the Securities and Exchange Commission (SEC) on Form N-Q. The most recent list of portfolio holdings is available at invesco.com/completeqtrholdings. Shareholders can also look up the Fund’s Forms N-Q on the SEC website at sec.gov. Copies of the Fund’s Forms N-Q may be reviewed and copied at the SEC Public Reference Room in Washington, D.C. You can obtain information on the operation of the Public Reference Room, including information about duplicating fee charges, by calling 202 551 8090 or 800 732 0330, or by electronic request at the following email address: publicinfo@sec.gov.
The SEC file numbers for the Fund are shown below.
A description of the policies and procedures that the Fund uses to determine how to vote proxies relating to portfolio securities is available without charge, upon request, from our Client Services department at 800 959 4246 or at invesco.com/proxyguidelines. The information is also available on the SEC website, sec.gov.
Information regarding how the Fund voted proxies related to its portfolio securities during the most recent 12-month period ended June 30 is available at invesco.com/proxysearch. The information is also available on the SEC website, sec.gov. Invesco Advisers, Inc. is an investment adviser; it provides investment advisory services to individual and institutional clients and does not sell securities. Invesco Distributors, Inc. is the US distributor for Invesco Ltd.’s retail mutual funds, exchange-traded funds and institutional money market funds. Both are wholly owned, indirect subsidiaries of Invesco Ltd. |  |
SEC file numbers: 811-09913 and 333-36074 CPB-AR-1 Invesco Distributors, Inc.
| Annual Report to Shareholders
| August 31, 2015 | ||
Invesco Equally-Weighted S&P 500 Fund | ||||
Nasdaq: A: VADAX ¡ B: VADBX ¡ C: VADCX ¡ R: VADRX ¡ Y: VADDX ¡ R6: VADFX | ||||


Letters to Shareholders
Philip Taylor | Dear Shareholders: This annual report includes information about your Fund, including performance data and a complete list of its investments as of the close of the reporting period. Inside is a discussion of how your Fund was managed and the factors that affected its performance during the reporting period. I hope you find this report of interest. The US economy expanded and unemployment declined throughout the reporting period. The sharp drop in oil prices that began in mid-2014 continued to benefit consumers, but a strong US dollar crimped corporate profits. The US Federal Reserve signaled that it was increasingly likely to raise interest rates, based on generally positive economic data, but uncertainty remained about when it would act. Overseas, the story was much different. Low energy prices hurt the economies of some oil-producing nations, such as Brazil and Russia. During the reporting period, the European Central Bank as well as central banks in China and Japan – among other countries – either | |
instituted or maintained extraordinarily accommodative monetary policies in response to economic weakness. Investor uncertainty, such as we saw for much of the reporting period – and market volatility, such as we saw at the end of the reporting period – are unfortunate facts of life when it comes to investing. Some investors use these things as excuses to delay saving and investing for their long-term financial goals. That’s why Invesco encourages investors to work with a professional financial adviser who can stress the importance of starting to save and invest early and the importance of adhering to a disciplined investment plan – when times are good and when they’re uncertain. A financial adviser who knows your unique financial situation, investment goals and risk tolerance can be an invaluable partner as you seek to achieve your financial goals. He or she can offer a long-term perspective when markets are volatile and time-tested advice and guidance when your financial situation or investment goals change. | ||

Timely information when and where you want it
Invesco’s efforts to help investors achieve their financial objectives include providing individual investors and financial professionals with timely information about the markets, the economy and investing – whenever and wherever they want it.
Our website, invesco.com/us, offers a wide range of market insights and investment perspectives. On the website, you’ll find detailed information about our funds, including prices, performance, holdings and portfolio manager commentaries. You can access information about your account by completing a simple, secure online registration. Click on the “Need to register” link in the “Account Access” box on our homepage to get started.
Invesco’s mobile apps for iPhone® and iPad® (both available free from the App StoreSM) allow you to obtain the same detailed information, monitor your account and create customizable watch lists. Also, they allow you to access investment insights from our investment leaders, market strategists, economists and retirement experts. You can sign up to be alerted when new commentary is added, and you can watch portfolio manager videos and have instant access to Invesco news and updates wherever you may be.
In addition to the resources accessible on our website and through our mobile app, you can obtain timely updates to help you stay informed about the markets, the economy and investing by connecting with Invesco on Twitter, LinkedIn or Facebook. You can access our blog at blog.invesco.us.com. Our goal is to provide you the information you want, when and where you want it.
Have questions?
For questions about your account, feel free to contact an Invesco client services representative at 800 959 4246. For Invesco-related questions or comments, please email me directly at phil@invesco.com.
All of us at Invesco look forward to serving your investment management needs for many years to come. Thank you for investing with us.
Sincerely,

Philip Taylor
Senior Managing Director, Invesco Ltd.
iPhone and iPad are trademarks of Apple Inc., registered in the US and other countries. App Store is a service mark of Apple Inc. Invesco Distributors, Inc. is not affiliated with Apple Inc.
2 Invesco Equally-Weighted S&P 500 Fund
Bruce Crockett | Dear Fellow Shareholders: Among the many important lessons I’ve learned in more than 40 years in a variety of business endeavors is the value of a trusted advocate. As independent chair of the Invesco Funds Board, I can assure you that the members of the Board are strong advocates for the interests of investors in Invesco’s mutual funds. We work hard to represent your interests through oversight of the quality of the investment management services your funds receive and other matters important to your investment, including but not limited to: n Ensuring that Invesco offers a diverse lineup of mutual funds that your financial adviser can use to strive to meet your financial needs as your investment goals change over time. n Monitoring how the portfolio management teams of the Invesco funds are performing in light of changing economic and market conditions. |

| n | Assessing each portfolio management team’s investment performance within the context of the investment strategy described in the fund’s prospectus. |
| n | Monitoring for potential conflicts of interests that may impact the nature of the services that your funds receive. |
We believe one of the most important services we provide our fund shareholders is the annual review of the funds’ advisory and sub-advisory contracts with Invesco Advisers and its affiliates. This review is required by the Investment Company Act of 1940 and focuses on the nature and quality of the services Invesco provides as the adviser to the Invesco funds and the reasonableness of the fees that it charges for those services. Each year, we spend months carefully reviewing information received from Invesco and a variety of independent sources, such as performance and fee data prepared by Lipper Inc., an independent, third-party firm widely recognized as a leader in its field. We also meet with our independent legal counsel and other independent advisers to review and help us assess the information that we have received. Our goal is to assure that you receive quality investment management services for a reasonable fee.
I trust the measures outlined above provide assurance that you have a worthy advocate when it comes to choosing the Invesco Funds.
As always, please contact me at bruce@brucecrockett.com with any questions or concerns you may have. On behalf of the Board, we look forward to continuing to represent your interests and serving your needs.
Sincerely,

Bruce L. Crockett
Independent Chair
Invesco Funds Board of Trustees
3 Invesco Equally-Weighted S&P 500 Fund
Management’s Discussion of Fund Performance
Performance summary |
For the fiscal year ended August 31, 2015, Class A shares of Invesco Equally-Weighted S&P 500 Fund (the Fund), at net asset value, underperformed the Fund’s broad market index, the S&P 500 Index.
Your Fund’s long-term performance appears later in this report.
Fund vs. Indexes
Total returns, 8/31/14 to 8/31/15, at net asset value (NAV). Performance shown does not include applicable contingent deferred sales charges (CDSC) or front-end sales charges, which would have reduced performance.
Class A Shares | -1.07 | % | ||
Class B Shares | -1.81 | |||
Class C Shares | -1.81 | |||
Class R Shares | -1.33 | |||
Class Y Shares | -0.83 | |||
Class R6 Shares | -0.70 | |||
S&P 500 Indexq (Broad Market Index) | -0.48 | |||
S&P 500 Equal Weight Indexq (Style-Specific Index) | -0.49 | |||
Lipper Multi-Cap Core Funds Indexn (Peer Group Index) | -0.88 | |||
Source(s): qFactSet Research Systems Inc.; nLipper Inc. | ||||
Market conditions and your Fund
The US economy improved slowly, but somewhat steadily, during the fiscal year ended August 31, 2015 – although the performance of the underlying sectors of the economy varied dramatically. The headline story was the massive slowdown in energy markets, as oil prices plummeted when too much supply overwhelmed slowing global demand. However the more subtle story, which drove the economy forward during the year, was the improved position of the US consumer.
As the reporting period began, economic growth appeared to be stronger in the US than in the rest of the world. In mid-2014, when the price of oil began its sharp and prolonged decline, US equities fell as well. However, while global growth weakened and commodity-based economies and currencies underperformed those of the US, continued strengthening
of the US consumer led US equity markets higher through the spring. Continued low interest rates, the increasing availability of credit from lenders and an improving employment picture all contributed to higher consumer confidence. This strength also helped the market overcome summer fears that Greece and the eurozone would fail to reach an agreement on a financial bailout plan. In the final weeks of the fiscal year, however, US equity markets moved sharply lower. A significant downturn in China’s financial markets, weak global economic growth and the uncertain timing of a potential US interest rate increase were negatives for jittery US markets. While stocks were up slightly for the fiscal year, they ended the reporting period on a negative note.
The Fund seeks total return through growth of capital and current income. The Fund invests in a diversified portfolio of common stocks represented in the S&P 500 Index. The Fund generally
invests in each common stock included in the S&P 500 Index in approximately equal proportions, which differs from the S&P 500 Index because stocks in the S&P 500 Index are represented in proportion to their market value or market capitalization. Due to the equally weighted nature of the Fund and the capitalization weighted nature of the index, the Fund will lag when large-cap stocks outperform mid-cap stocks.
During the reporting period, sectors that contributed the most to overall Fund performance were the health care, consumer staples and utilities sectors. The energy, consumer discretionary, industrials, information technology (IT) and materials sectors were the top detractors from the Fund’s overall performance. Relative to the S&P 500 Index, overweight allocations in the consumer discretionary and utilities sectors and underweight allocations in the energy and telecommunication services sectors contributed to Fund results. Overweight allocations in the industrials and materials sectors and underweight allocations in the consumer staples, health care and IT sectors detracted from Fund results.
The top-performing stock during the fiscal year was Internet television network Netflix. The firm reported strong earnings and increasing service subscriber growth toward the end of the fiscal year. Also contributing to the Fund’s performance was video game developer Electronic Arts. The company announced strong quarterly revenues and beat earnings estimates throughout the fiscal year. A third contributor to performance was Hospira, a pharmaceutical and medical device company. The company’s stock price soared following the announcement of its acquisition by Pfizer (not a Fund holding).
| Portfolio Composition | |||||
By sector
|
| ||||
Financials | 17.2 | % | |||
Consumer Discretionary | 16.8 | ||||
Information Technology | 13.2 | ||||
Industrials | 12.5 | ||||
Health Care | 11.2 | ||||
Consumer Staples | 7.7 | ||||
Energy | 7.1 | ||||
Utilities | 6.1 | ||||
Materials | 5.2 | ||||
Telecommunication Services | 1.0 | ||||
Money Market Funds | |||||
| Plus Other Assets Less Liabilities | 2.0 | ||||
| Top 10 Equity Holdings* | |||||
1. AGL Resources Inc. | 0.3 | % | |||
2. Cameron International Corp. | 0.3 | ||||
3. Chubb Corp. (The) | 0.3 | ||||
4. Netflix Inc. | 0.3 | ||||
5. Amazon.com, Inc. | 0.3 | ||||
6. TECO Energy, Inc. | 0.3 | ||||
7. Signet Jewelers Ltd. | 0.3 | ||||
8. Coca-Cola Enterprises, Inc. | 0.3 | ||||
9. Under Armour, Inc.-Class A | 0.3 | ||||
10. Chipotle Mexican Grill, Inc. | 0.2 | ||||
Total Net Assets | $ | 4.8 billion | ||
Total Number of Holdings* | 503 | |||
The Fund’s holdings are subject to change, and there is no assurance that the Fund will continue to hold any particular security.
*Excluding money market fund holdings.
4 Invesco Equally-Weighted S&P 500 Fund
The energy sector struggled the most with Chesapeake Energy, Ensco and Freeport-McMoRan being the top detractors from Fund performance during the reporting period. Chesapeake Energy, primarily a natural gas company, was hurt by a decrease in natural gas commodities prices with its stock price falling approximately
70%1 over the fiscal year. Ensco, an oil and gas services company, was affected by falling oil prices due to oversupply. Freeport-McMoRan, a major metals miner with oil holdings, suffered from a commodities selloff with copper and crude oil down during the reporting period. Like Chesapeake Energy, its stock price also fell approximatively 70%1 over the fiscal year.
Please note that the Fund’s strategy is principally implemented through equity investments, but the Fund also may use S&P 500 futures contracts, a derivative instrument, to gain exposure to the equity market. During the reporting period, the Fund invested in S&P 500 futures contracts, which generated a negative return and was a slight detractor from Fund performance. Derivatives can be a cost-effective way to gain exposure to asset classes. However, derivatives may amplify traditional investment risks through the creation of leverage and may be less liquid than traditional securities.
We welcome new investors who joined the Fund during the fiscal year and thank all our shareholders for their investments in Invesco Equally-Weighted S&P 500 Index Fund.
| 1 | Source: CNBC |
The views and opinions expressed in management’s discussion of Fund performance are those of Invesco Advisers, Inc. These views and opinions are subject to change at any time based on factors such as market and economic conditions. These views and opinions may not be relied upon as investment advice or recommendations, or as an offer for a particular security. The information is not a complete analysis of every aspect of any market, country, industry, security or the Fund. Statements of fact are from sources considered reliable, but Invesco Advisers, Inc. makes no representation or warranty as to their completeness or accuracy. Although historical performance is no guarantee of future results, these insights may help you understand our investment management philosophy.
See important Fund and, if applicable, index disclosures later in this report.
| Anthony Munchak Chartered Financial Analyst, Portfolio Manager, is manager of Invesco Equally-Weighted S&P 500 Fund. He joined | |
| Invesco in 2000. Mr. Munchak earned a BS and an MS in finance from Boston College and an MBA from Bentley College. | ||
| Glen Murphy Chartered Financial Analyst, Portfolio Manager, is manager of Invesco Equally-Weighted S&P 500 Fund. He joined | |
| Invesco in 1995. Mr. Murphy earned a BA in business administration from the University of Massachusetts Amherst and an MS in finance from Boston College. | ||
 | Francis Orlando Chartered Financial Analyst, Portfolio Manager, is manager of Invesco Equally-Weighted S&P 500 Fund. He joined | |
| Invesco in 1987. Mr. Orlando earned a BA in business administration from Merrimack College and an MBA from Boston University. | ||
| Daniel Tsai Chartered Financial Analyst, Portfolio Manager, is manager of Invesco Equally-Weighted S&P 500 Fund. He joined | |
| Invesco in 2000. Mr. Tsai earned a BS in mechanical engineering from National Taiwan University, an MS in mechanical engineering from the University of Michigan and an MS in computer science from Wayne State University. | ||
| Anne Unflat Portfolio Manager, is manager of Invesco Equally-Weighted S&P 500 Fund. She joined Invesco in 1988. Ms. Unflat earned a | |
| BA in economics from Queens College and an MBA in finance from St. John’s University. | ||


5 Invesco Equally-Weighted S&P 500 Fund
Your Fund’s Long-Term Performance
Results of a $10,000 Investment – Oldest Share Class(es)
Fund and index data from 8/31/05
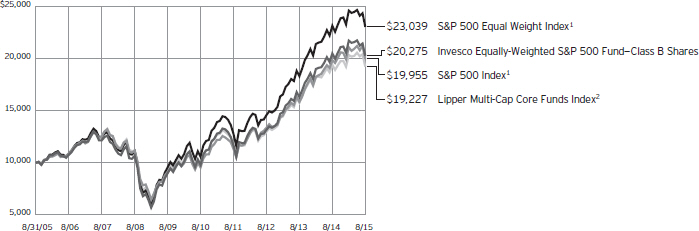
| 1 | Source: FactSet Research Systems Inc. |
| 2 | Source: Lipper Inc. |
Past performance cannot guarantee comparable future results.
The data shown in the chart include reinvested distributions, applicable sales charges and Fund expenses including management fees. Results for Class B shares are calculated as if a hypothetical
shareholder had liquidated his entire investment in the Fund at the close of the reporting period and paid the contingent deferred sales charges, if applicable. Index results include reinvested dividends, but they do not reflect sales charges. Performance of the peer group, if applicable,
reflects fund expenses and management fees; performance of a market index does not. Performance shown in the chart and table(s) does not reflect deduction of taxes a shareholder would pay on Fund distributions or sale of Fund shares.
continued from page 8
Other information
| n | The returns shown in management’s discussion of Fund performance are based on net asset values (NAVs) calculated for shareholder transactions. Generally accepted accounting principles require adjustments to be made to the net assets of the Fund at period end for financial reporting purposes, and as such, the NAVs for shareholder transactions and the returns based on those NAVs may differ from the NAVs and returns reported in the Financial Highlights. |
| n | Industry classifications used in this report are generally according to the Global Industry Classification Standard, which was developed by and is the exclusive property and a service mark of MSCI Inc. and Standard & Poor’s. |
6 Invesco Equally-Weighted S&P 500 Fund
| Average Annual Total Returns | ||||
| As of 8/31/15, including maximum applicable sales charges | ||||
Class A Shares | ||||
Inception (7/28/97) | 7.93 | % | ||
10 Years | 7.37 | |||
5 Years | 14.85 | |||
1 Year | -6.52 | |||
Class B Shares | ||||
Inception (12/1/87) | 10.96 | % | ||
10 Years | 7.32 | |||
5 Years | 15.06 | |||
1 Year | -6.62 | |||
Class C Shares | ||||
Inception (7/28/97) | 7.47 | % | ||
10 Years | 7.18 | |||
5 Years | 15.29 | |||
1 Year | -2.77 | |||
Class R Shares | ||||
Inception (3/31/08) | 9.29 | % | ||
5 Years | 15.86 | |||
1 Year | -1.33 | |||
Class Y Shares | ||||
Inception (7/28/97) | 8.53 | % | ||
10 Years | 8.24 | |||
5 Years | 16.45 | |||
1 Year | -0.83 | |||
Class R6 Shares | ||||
10 Years | 8.08 | % | ||
5 Years | 16.38 | |||
1 Year | -0.70 | |||
| Average Annual Total Returns | ||||
| As of 6/30/15, the most recent calendar quarter end, including maximum applicable sales charges | ||||
Class A Shares | ||||
Inception (7/28/97) | 8.29 | % | ||
10 Years | 8.28 | |||
5 Years | 16.45 | |||
1 Year | -0.29 | |||
Class B Shares | ||||
Inception (12/1/87) | 11.22 | % | ||
10 Years | 8.24 | |||
5 Years | 16.68 | |||
1 Year | -0.29 | |||
Class C Shares | ||||
Inception (7/28/97) | 7.84 | % | ||
10 Years | 8.09 | |||
5 Years | 16.89 | |||
1 Year | 3.71 | |||
Class R Shares | ||||
Inception (3/31/08) | 10.23 | % | ||
5 Years | 17.48 | |||
1 Year | 5.24 | |||
Class Y Shares | ||||
Inception (7/28/97) | 8.90 | % | ||
10 Years | 9.16 | |||
5 Years | 18.07 | |||
1 Year | 5.77 | |||
Class R6 Shares | ||||
10 Years | 8.99 | % | ||
5 Years | 17.98 | |||
1 Year | 5.91 | |||
Effective June 1, 2010, Class A, Class B, Class C, Class R, Class W and Class I shares of the predecessor fund, Morgan Stanley Equally-Weighted S&P 500 Fund, advised by Morgan Stanley Investment Advisors Inc. were reorganized into Class A, Class B, Class C, Class R, Class A and Class Y shares, respectively, of Invesco Equally-Weighted S&P 500 Fund. Returns shown above for Class A, Class B, Class C, Class R and Class Y shares are blended returns of the predecessor fund and Invesco Equally-Weighted S&P 500 Fund. Share class returns will differ from the predecessor fund because of different expenses.
Class R6 shares incepted on September 24, 2012. Performance shown prior to that date is that of the Fund’s and the predecessor fund’s Class A shares and includes the 12b-1 fees applicable to Class A shares.
The performance data quoted represent past performance and cannot guarantee comparable future results; current performance may
be lower or higher. Please visit invesco.com/performance for the most recent month-end performance. Performance figures reflect reinvested distributions, changes in net asset value and the effect of the maximum sales charge unless otherwise stated. Investment return and principal value will fluctuate so that you may have a gain or loss when you sell shares.
The total annual Fund operating expense ratio set forth in the most recent Fund prospectus as of the date of this report for Class A, Class B, Class C, Class R, Class Y and Class R6 shares was 0.56%, 1.31%, 1.31%, 0.81%, 0.31% and 0.22%, respectively. The expense ratios presented above may vary from the expense ratios presented in other sections of this report that are based on expenses incurred during the period covered by this report.
Class A share performance reflects the maximum 5.50% sales charge, and Class B and Class C share performance reflects the applicable contingent
deferred sales charge (CDSC) for the period involved. The CDSC on Class B shares declines from 5% beginning at the time of purchase to 0% at the beginning of the seventh year. The CDSC on Class C shares is 1% for the first year after purchase. Class R, Class Y and Class R6 shares do not have a front-end sales charge or a CDSC; therefore, performance is at net asset value.
The performance of the Fund’s share classes will differ primarily due to different sales charge structures and class expenses.
Fund performance reflects any applicable fee waivers and/or expense reimbursements. Had the adviser not waived fees and/or reimbursed expenses currently or in the past, returns would have been lower. See current prospectus for more information.
7 Invesco Equally-Weighted S&P 500 Fund
Invesco Equally-Weighted S&P 500 Fund’s investment objective is total return through growth of capital and current income.
| n | Unless otherwise stated, information presented in this report is as of August 31, 2015, and is based on total net assets. |
| n | Unless otherwise noted, all data provided by Invesco. |
| n | To access your Fund’s reports/prospectus, visit invesco.com/fundreports. |
About share classes n Class B shares may not be purchased for new or additional investments. Please see the prospectus for more information. n Class R shares are generally available only to employer sponsored retirement and benefit plans. Please see the prospectus for more information. n Class Y shares are available only to certain investors. Please see the prospectus for more information. n Class R6 shares are primarily intended for employer sponsored retirement and benefit plans that meet certain standards and for institutional investors.
Principal risks of investing in the Fund n Depositary receipts risk. Depositary receipts involve many of the same risks as those associated with direct investment in foreign securities. In addition, the underlying issuers of certain depositary receipts, particularly unsponsored or unregistered depositary receipts, are under no obligation to distribute shareholder communications to the holders of such receipts or to pass through to them any voting rights with respect to the deposited securities. n Derivatives risk. The value of a derivative instrument depends largely on (and is derived from) the value of an underlying security, currency, commodity, interest rate, index or other asset (each referred to as an underlying asset). In addition to risks relating to the underlying assets, the use of derivatives may include other, possibly greater, risks, including counterparty, leverage and liquidity risks. Counterparty risk is the risk that the counterparty to the derivative contract will default on its obligation to pay the Fund the amount owed or otherwise perform under the derivative contract. Derivatives create leverage risk because they do not require payment up front equal to the economic exposure created by | owning the derivative. As a result, an adverse change in the value of the underlying asset could result in the Fund sustaining a loss that is substantially greater than the amount invested in the derivative, which may make the Fund’s returns more volatile and increase the risk of loss. Derivative instruments may also be less liquid than more traditional investments and the Fund may be unable to sell or close out its derivative positions at a desirable time or price. This risk may be more acute under adverse market conditions, during which the Fund may be most in need of liquidating its derivative positions. Derivatives may also be harder to value, less tax efficient and subject to changing government regulation that could impact the Fund’s ability to use certain derivatives or their cost. Also, derivatives used for hedging or to gain or limit exposure to a particular market segment may not provide the expected benefits, particularly during adverse market conditions. n Developing/emerging markets securities risk. The prices of securities issued by foreign companies and governments located in developing/emerging markets countries may be affected more negatively by inflation, devaluation of their currencies, higher transaction costs, delays in settlement, adverse political developments, the introduction of capital controls, withholding taxes, nationalization of private assets, expropriation, social unrest, war or lack of timely information than those in developed countries. n Foreign securities risk. The Fund’s foreign investments may be affected by changes in a foreign country’s exchange rates, political and social instability, changes in economic or taxation policies, difficulties when enforcing obligations, decreased liquidity, and increased volatility. Foreign companies may be subject to less regulation resulting in less publicly available information about the companies.
| n Indexing risk. The Fund is operated as a passively managed index fund. As such, the adverse performance of a particular stock ordinarily will not result in the elimination of the stock from the Fund’s portfolio. The Fund will remain invested in common stocks even when stock prices are generally falling. Ordinarily, the Adviser will not sell the Fund’s portfolio securities except to reflect additions or deletions of the stocks that comprise the S&P 500 Index, or as may be necessary to raise cash to pay Fund shareholders who sell Fund shares. The Fund’s ability to correlate its performance, before expenses, with the S&P 500 Index may be affected by, among other things, changes in securities markets, the manner in which the S&P 500 Index is calculated and the timing of purchases and sales, and also depends to some extent on the size of the Fund’s portfolio, the size of cash flows into and out of the Fund and differences between how and when the Fund and the Index are valued. n Management risk. The investment techniques and risk analysis used by the Fund’s portfolio managers may not produce the desired results. n Market risk. The prices of and the income generated by the Fund’s securities may decline in response to, among other things, investor sentiment, general economic and market conditions, regional or global instability, and currency and interest rate fluctuations.
About indexes used in this report n The S&P 500® Index is an unmanaged index considered representative of the US stock market. n The S&P 500® Equal Weight Index is the equally weighted version of the S&P 500 Index. n The Lipper Multi-Cap Core Funds Index is an unmanaged index considered representative of multicap core funds tracked by Lipper. n A direct investment cannot be made in an index. Unless otherwise indicated, index results include reinvested dividends, and they do not reflect sales charges. Performance of the peer group, if applicable, reflects fund expenses; performance of a market index does not.
continued on page 6 | ||
This report must be accompanied or preceded by a currently effective Fund prospectus, which contains more complete information, including sales charges and expenses. Investors should read it carefully before investing.
| ||||
NOT FDIC INSURED | MAY LOSE VALUE | NO BANK GUARANTEE | ||||
8 Invesco Equally-Weighted S&P 500 Fund
Schedule of Investments(a)
August 31, 2015
| Shares | Value | |||||||
Common Stocks & Other Equity Interests–97.99% |
| |||||||
| Advertising–0.39% | ||||||||
Interpublic Group of Cos., Inc. (The) | 499,319 | $ | 9,427,143 | |||||
Omnicom Group Inc. | 137,605 | 9,216,783 | ||||||
| 18,643,926 | ||||||||
| Aerospace & Defense–2.18% | ||||||||
Boeing Co. (The) | 69,862 | 9,129,566 | ||||||
General Dynamics Corp. | 70,231 | 9,974,909 | ||||||
Honeywell International Inc. | 95,880 | 9,518,008 | ||||||
L-3 Communications Holdings, Inc. | 85,596 | 9,027,810 | ||||||
Lockheed Martin Corp. | 52,237 | 10,509,040 | ||||||
Northrop Grumman Corp. | 61,941 | 10,142,219 | ||||||
Precision Castparts Corp. | 47,986 | 11,048,776 | ||||||
Raytheon Co. | 98,124 | 10,063,597 | ||||||
Rockwell Collins, Inc. | 105,995 | 8,675,691 | ||||||
Textron Inc. | 217,066 | 8,422,161 | ||||||
United Technologies Corp. | 84,832 | 7,771,460 | ||||||
| 104,283,237 | ||||||||
| Agricultural & Farm Machinery–0.19% | ||||||||
Deere & Co. | 107,782 | 8,814,412 | ||||||
| Agricultural Products–0.18% | ||||||||
Archer-Daniels-Midland Co. | 192,185 | 8,646,403 | ||||||
| Air Freight & Logistics–0.81% | ||||||||
C.H. Robinson Worldwide, Inc. | 156,615 | 10,560,550 | ||||||
Expeditors International of Washington, Inc. | 207,430 | 10,157,847 | ||||||
FedEx Corp. | 54,328 | 8,182,340 | ||||||
United Parcel Service, Inc.–Class B | 99,703 | 9,735,998 | ||||||
| 38,636,735 | ||||||||
| Airlines–0.64% | ||||||||
American Airlines Group Inc. | 245,089 | 9,553,569 | ||||||
Delta Air Lines, Inc. | 242,497 | 10,616,519 | ||||||
Southwest Airlines Co. | 285,039 | 10,460,931 | ||||||
| 30,631,019 | ||||||||
| Alternative Carriers–0.17% | ||||||||
Level 3 Communications, Inc.(b) | 182,216 | 8,150,522 | ||||||
| Aluminum–0.16% | ||||||||
Alcoa Inc. | 827,229 | 7,817,314 | ||||||
| Apparel Retail–1.00% | ||||||||
Gap, Inc. (The) | 260,616 | 8,550,811 | ||||||
L Brands, Inc. | 117,811 | 9,884,343 | ||||||
Ross Stores, Inc. | 205,571 | 9,994,862 | ||||||
TJX Cos., Inc. (The) | 152,614 | 10,731,816 | ||||||
Urban Outfitters, Inc.(b) | 280,708 | 8,662,649 | ||||||
| 47,824,481 | ||||||||
| Apparel, Accessories & Luxury Goods–1.60% | ||||||||
Coach, Inc. | 284,065 | 8,592,966 | ||||||
| Shares | Value | |||||||
| Apparel, Accessories & Luxury Goods–(continued) | ||||||||
Fossil Group, Inc.(b) | 140,176 | $ | 8,632,038 | |||||
Hanesbrands, Inc. | 305,274 | 9,191,800 | ||||||
Michael Kors Holdings Ltd.(b) | 206,849 | 8,989,658 | ||||||
PVH Corp. | 88,481 | 10,527,469 | ||||||
Ralph Lauren Corp. | 73,762 | 8,201,597 | ||||||
Under Armour, Inc.–Class A(b) | 122,725 | 11,723,919 | ||||||
VF Corp. | 144,188 | 10,443,537 | ||||||
| 76,302,984 | ||||||||
| Application Software–0.96% | ||||||||
Adobe Systems Inc.(b) | 124,923 | 9,815,200 | ||||||
Autodesk, Inc.(b) | 184,542 | 8,627,338 | ||||||
Citrix Systems, Inc.(b) | 138,734 | 9,449,173 | ||||||
Intuit Inc. | 95,257 | 8,168,288 | ||||||
salesforce.com, inc.(b) | 139,005 | 9,641,387 | ||||||
| 45,701,386 | ||||||||
| Asset Management & Custody Banks–1.82% | ||||||||
Affiliated Managers Group, Inc.(b) | 45,009 | 8,391,478 | ||||||
Ameriprise Financial, Inc. | 77,739 | 8,758,853 | ||||||
Bank of New York Mellon Corp. (The) | 228,396 | 9,090,161 | ||||||
BlackRock, Inc. | 28,227 | 8,537,821 | ||||||
Franklin Resources, Inc. | 199,328 | 8,088,730 | ||||||
Invesco Ltd.(c) | 252,758 | 8,621,575 | ||||||
Legg Mason, Inc. | 188,696 | 8,364,894 | ||||||
Northern Trust Corp. | 128,578 | 8,979,888 | ||||||
State Street Corp. | 123,714 | 8,897,511 | ||||||
T. Rowe Price Group Inc. | 127,363 | 9,154,852 | ||||||
| 86,885,763 | ||||||||
| Auto Parts & Equipment–0.50% | ||||||||
BorgWarner, Inc. | 164,898 | 7,196,148 | ||||||
Delphi Automotive PLC (United Kingdom) | 113,923 | 8,603,465 | ||||||
Johnson Controls, Inc. | 190,570 | 7,840,050 | ||||||
| 23,639,663 | ||||||||
| Automobile Manufacturers–0.36% | ||||||||
Ford Motor Co. | 655,048 | 9,085,516 | ||||||
General Motors Co. | 279,372 | 8,224,711 | ||||||
| 17,310,227 | ||||||||
| Automotive Retail–1.04% | ||||||||
Advance Auto Parts, Inc. | 60,385 | 10,582,471 | ||||||
AutoNation, Inc.(b) | 158,279 | 9,471,415 | ||||||
AutoZone, Inc.(b) | 14,626 | 10,472,070 | ||||||
CarMax, Inc.(b) | 136,925 | 8,352,425 | ||||||
O’Reilly Automotive, Inc.(b) | 44,250 | 10,623,098 | ||||||
| 49,501,479 | ||||||||
| Biotechnology–1.65% | ||||||||
Alexion Pharmaceuticals, Inc.(b) | 59,017 | 10,162,137 | ||||||
Amgen Inc. | 63,901 | 9,698,894 | ||||||
See accompanying Notes to Financial Statements which are an integral part of the financial statements.
9 Invesco Equally-Weighted S&P 500 Fund
| Shares | Value | |||||||
| Biotechnology–(continued) | ||||||||
Baxalta Inc.(b) | 311,674 | $ | 10,955,341 | |||||
Biogen Inc.(b) | 25,661 | 7,629,015 | ||||||
Celgene Corp.(b) | 89,618 | 10,582,093 | ||||||
Gilead Sciences, Inc. | 84,789 | 8,908,780 | ||||||
Regeneron Pharmaceuticals, Inc.(b) | 20,265 | 10,406,078 | ||||||
Vertex Pharmaceuticals Inc.(b) | 80,221 | 10,229,782 | ||||||
| 78,572,120 | ||||||||
| Brewers–0.20% | ||||||||
Molson Coors Brewing Co.–Class B | 137,094 | 9,334,730 | ||||||
| Broadcasting–0.67% | ||||||||
CBS Corp.–Class B | 170,565 | 7,716,360 | ||||||
Discovery Communications, Inc.–Class A(b) | 116,428 | 3,096,985 | ||||||
Discovery Communications, Inc.–Class C(b) | 203,813 | 5,168,698 | ||||||
Scripps Networks Interactive Inc.–Class A | 149,615 | 7,943,060 | ||||||
TEGNA Inc. | 344,792 | 8,202,602 | ||||||
| 32,127,705 | ||||||||
| Building Products–0.43% | ||||||||
Allegion PLC | 163,279 | 9,733,061 | ||||||
Masco Corp. | 408,913 | 10,725,788 | ||||||
| 20,458,849 | ||||||||
| Cable & Satellite–0.64% | ||||||||
Cablevision Systems Corp.–Class A | 416,724 | 10,488,943 | ||||||
Comcast Corp.–Class A | 171,238 | 9,645,837 | ||||||
Time Warner Cable Inc. | 55,814 | 10,382,520 | ||||||
| 30,517,300 | ||||||||
| Casinos & Gaming–0.15% | ||||||||
Wynn Resorts Ltd. | 97,055 | 7,283,978 | ||||||
| Coal & Consumable Fuels–0.13% | ||||||||
CONSOL Energy Inc. | 394,948 | 6,015,058 | ||||||
| Commodity Chemicals–0.17% | ||||||||
LyondellBasell Industries N.V.–Class A | 95,668 | 8,168,134 | ||||||
| Communications Equipment–1.21% | ||||||||
Cisco Systems, Inc. | 349,557 | 9,046,535 | ||||||
F5 Networks, Inc.(b) | 79,689 | 9,675,042 | ||||||
Harris Corp. | 127,493 | 9,794,012 | ||||||
Juniper Networks, Inc. | 364,234 | 9,364,456 | ||||||
Motorola Solutions, Inc. | 173,050 | 11,217,101 | ||||||
QUALCOMM, Inc. | 148,845 | 8,421,650 | ||||||
| 57,518,796 | ||||||||
| Computer & Electronics Retail–0.43% | ||||||||
Best Buy Co., Inc. | 291,707 | 10,717,315 | ||||||
GameStop Corp.–Class A | 232,224 | 9,864,876 | ||||||
| 20,582,191 | ||||||||
| Construction & Engineering–0.54% | ||||||||
Fluor Corp. | 181,190 | 8,265,888 | ||||||
Jacobs Engineering Group, Inc.(b) | 231,416 | 9,351,520 | ||||||
Quanta Services, Inc.(b) | 335,453 | 8,131,381 | ||||||
| 25,748,789 | ||||||||
| Shares | Value | |||||||
| Construction Machinery & Heavy Trucks–0.69% | ||||||||
Caterpillar Inc. | 113,560 | $ | 8,680,527 | |||||
Cummins Inc. | 72,756 | 8,858,043 | ||||||
Joy Global Inc. | 256,792 | 6,219,502 | ||||||
PACCAR Inc. | 153,459 | 9,049,477 | ||||||
| 32,807,549 | ||||||||
| Construction Materials–0.46% | ||||||||
Martin Marietta Materials, Inc. | 67,457 | 11,319,284 | ||||||
Vulcan Materials Co. | 112,232 | 10,507,160 | ||||||
| 21,826,444 | ||||||||
| Consumer Electronics–0.35% | ||||||||
Garmin Ltd. | 222,736 | 8,377,101 | ||||||
Harman International Industries, Inc. | 82,729 | 8,085,932 | ||||||
| 16,463,033 | ||||||||
| Consumer Finance–0.72% | ||||||||
American Express Co. | 125,441 | 9,623,834 | ||||||
Capital One Financial Corp. | 113,923 | 8,857,513 | ||||||
Discover Financial Services | 168,122 | 9,033,195 | ||||||
Navient Corp. | 513,453 | 6,567,064 | ||||||
| 34,081,606 | ||||||||
| Data Processing & Outsourced Services–2.39% | ||||||||
Alliance Data Systems Corp.(b) | 33,083 | 8,508,617 | ||||||
Automatic Data Processing, Inc. | 118,978 | 9,199,379 | ||||||
Computer Sciences Corp. | 147,252 | 9,128,151 | ||||||
Fidelity National Information Services, Inc. | 157,704 | 10,891,038 | ||||||
Fiserv, Inc.(b) | 124,207 | 10,591,131 | ||||||
MasterCard, Inc.–Class A | 106,391 | 9,827,337 | ||||||
Paychex, Inc. | 207,862 | 9,283,117 | ||||||
PayPal Holdings, Inc.(b) | 216,530 | 7,578,550 | ||||||
Total System Services, Inc. | 239,816 | 10,990,767 | ||||||
Visa Inc.–Class A | 143,897 | 10,259,856 | ||||||
Western Union Co. (The) | 464,666 | 8,568,441 | ||||||
Xerox Corp. | 893,142 | 9,083,254 | ||||||
| 113,909,638 | ||||||||
| Department Stores–0.55% | ||||||||
Kohl’s Corp. | 159,189 | 8,123,414 | ||||||
Macy’s, Inc. | 143,318 | 8,399,868 | ||||||
Nordstrom, Inc. | 134,852 | 9,828,014 | ||||||
| 26,351,296 | ||||||||
| Distillers & Vintners–0.43% | ||||||||
Brown-Forman Corp.–Class B | 101,622 | 9,969,118 | ||||||
Constellation Brands, Inc.–Class A | 82,777 | 10,595,456 | ||||||
| 20,564,574 | ||||||||
| Distributors–0.19% | ||||||||
Genuine Parts Co. | 109,822 | 9,169,039 | ||||||
| Diversified Banks–1.16% | ||||||||
Bank of America Corp. | 570,405 | 9,320,418 | ||||||
Citigroup Inc. | 174,687 | 9,342,261 | ||||||
Comerica Inc. | 191,485 | 8,425,340 | ||||||
See accompanying Notes to Financial Statements which are an integral part of the financial statements.
10 Invesco Equally-Weighted S&P 500 Fund
| Shares | Value | |||||||
| Diversified Banks–(continued) | ||||||||
JPMorgan Chase & Co. | 146,174 | $ | 9,369,753 | |||||
U.S. Bancorp | 222,786 | 9,434,987 | ||||||
Wells Fargo & Co. | 174,748 | 9,319,311 | ||||||
| 55,212,070 | ||||||||
| Diversified Chemicals–0.54% | ||||||||
Dow Chemical Co. (The) | 192,445 | 8,421,393 | ||||||
E. I. du Pont de Nemours and Co. | 151,937 | 7,824,756 | ||||||
Eastman Chemical Co. | 128,198 | 9,289,227 | ||||||
| 25,535,376 | ||||||||
| Diversified Metals & Mining–0.11% | ||||||||
Freeport-McMoRan Inc. | 503,604 | 5,358,347 | ||||||
| Diversified Support Services–0.21% | ||||||||
Cintas Corp. | 115,936 | 9,853,401 | ||||||
| Drug Retail–0.42% | ||||||||
CVS Health Corp. | 97,596 | 9,993,830 | ||||||
Walgreens Boots Alliance, Inc. | 117,285 | 10,151,017 | ||||||
| 20,144,847 | ||||||||
| Electric Utilities–2.68% | ||||||||
American Electric Power Co., Inc. | 184,987 | 10,042,944 | ||||||
Duke Energy Corp. | 137,548 | 9,753,529 | ||||||
Edison International | 174,412 | 10,199,614 | ||||||
Entergy Corp. | 141,088 | 9,217,279 | ||||||
Eversource Energy | 216,407 | 10,223,067 | ||||||
Exelon Corp. | 294,288 | 9,052,299 | ||||||
FirstEnergy Corp. | 296,298 | 9,469,684 | ||||||
NextEra Energy, Inc. | 100,527 | 9,892,862 | ||||||
Pepco Holdings, Inc. | 373,367 | 8,579,973 | ||||||
Pinnacle West Capital Corp. | 175,024 | 10,419,179 | ||||||
PPL Corp. | 330,891 | 10,254,312 | ||||||
Southern Co. (The) | 235,847 | 10,238,118 | ||||||
Xcel Energy, Inc. | 305,088 | 10,290,618 | ||||||
| 127,633,478 | ||||||||
| Electrical Components & Equipment–0.73% | ||||||||
AMETEK, Inc. | 182,183 | 9,805,089 | ||||||
Eaton Corp. PLC(b) | 138,792 | 7,919,472 | ||||||
Emerson Electric Co. | 167,304 | 7,983,747 | ||||||
Rockwell Automation, Inc. | 79,258 | 8,863,422 | ||||||
| 34,571,730 | ||||||||
| Electronic Components–0.36% | ||||||||
Amphenol Corp.–Class A | 172,930 | 9,054,615 | ||||||
Corning Inc. | 480,789 | 8,274,378 | ||||||
| 17,328,993 | ||||||||
| Electronic Equipment & Instruments–0.19% | ||||||||
FLIR Systems, Inc. | 320,269 | 9,169,301 | ||||||
| Electronic Manufacturing Services–0.18% | ||||||||
TE Connectivity Ltd. (Switzerland) | 144,984 | 8,596,101 | ||||||
| Environmental & Facilities Services–0.65% | ||||||||
Republic Services, Inc. | 246,756 | 10,112,061 | ||||||
| Shares | Value | |||||||
| Environmental & Facilities Services–(continued) | ||||||||
Stericycle, Inc.(b) | 73,452 | $ | 10,367,015 | |||||
Waste Management, Inc. | 205,953 | 10,310,007 | ||||||
| 30,789,083 | ||||||||
| Fertilizers & Agricultural Chemicals–0.72% | ||||||||
CF Industries Holdings, Inc. | 157,774 | 9,053,072 | ||||||
FMC Corp. | 181,190 | 7,666,149 | ||||||
Monsanto Co. | 87,419 | 8,536,465 | ||||||
Mosaic Co. (The) | 223,986 | 9,145,349 | ||||||
| 34,401,035 | ||||||||
| Food Distributors–0.23% | ||||||||
Sysco Corp. | 270,216 | 10,773,512 | ||||||
| Food Retail–0.37% | ||||||||
Kroger Co. (The) | 278,474 | 9,607,353 | ||||||
Whole Foods Market, Inc. | 247,123 | 8,095,749 | ||||||
| 17,703,102 | ||||||||
| Footwear–0.23% | ||||||||
NIKE, Inc.–Class B | 96,129 | 10,742,416 | ||||||
| Gas Utilities–0.27% | ||||||||
AGL Resources Inc. | 208,536 | 12,718,611 | ||||||
| General Merchandise Stores–0.61% | ||||||||
Dollar General Corp. | 128,214 | 9,550,661 | ||||||
Dollar Tree, Inc.(b) | 126,651 | 9,658,405 | ||||||
Target Corp. | 125,536 | 9,755,403 | ||||||
| 28,964,469 | ||||||||
| Gold–0.15% | ||||||||
Newmont Mining Corp. | 423,625 | 7,231,279 | ||||||
| Health Care Distributors–0.96% | ||||||||
AmerisourceBergen Corp. | 90,570 | 9,060,623 | ||||||
Cardinal Health, Inc. | 112,244 | 9,234,314 | ||||||
Henry Schein, Inc.(b) | 70,176 | 9,600,779 | ||||||
McKesson Corp. | 42,430 | 8,383,319 | ||||||
Patterson Cos. Inc. | 206,165 | 9,448,542 | ||||||
| 45,727,577 | ||||||||
| Health Care Equipment–2.51% | ||||||||
Abbott Laboratories | 204,979 | 9,283,499 | ||||||
Baxter International Inc. | 269,030 | 10,344,204 | ||||||
Becton, Dickinson and Co. | 71,463 | 10,077,712 | ||||||
Boston Scientific Corp.(b) | 568,131 | 9,510,513 | ||||||
C.R. Bard, Inc. | 58,508 | 11,338,265 | ||||||
Edwards Lifesciences Corp.(b) | 74,684 | 10,521,482 | ||||||
Intuitive Surgical, Inc.(b) | 20,127 | 10,283,891 | ||||||
Medtronic PLC | 132,102 | 9,549,654 | ||||||
St. Jude Medical, Inc. | 134,199 | 9,502,631 | ||||||
Stryker Corp. | 104,278 | 10,287,025 | ||||||
Varian Medical Systems, Inc.(b) | 116,301 | 9,449,456 | ||||||
Zimmer Biomet Holdings, Inc. | 88,915 | 9,208,037 | ||||||
| 119,356,369 | ||||||||
See accompanying Notes to Financial Statements which are an integral part of the financial statements.
11 Invesco Equally-Weighted S&P 500 Fund
| Shares | Value | |||||||
| Health Care Facilities–0.64% | ||||||||
HCA Holdings, Inc.(b) | 120,983 | $ | 10,479,548 | |||||
Tenet Healthcare Corp.(b) | 192,519 | 9,477,710 | ||||||
Universal Health Services, Inc.–Class B | 76,599 | 10,504,787 | ||||||
| 30,462,045 | ||||||||
| Health Care REIT’s–0.60% | ||||||||
Care Capital Properties, Inc.(b) | 1 | 16 | ||||||
HCP, Inc. | 262,122 | 9,714,241 | ||||||
Health Care REIT, Inc. | 146,797 | 9,299,590 | ||||||
Ventas, Inc. | 178,017 | 9,794,496 | ||||||
| 28,808,343 | ||||||||
| Health Care Services–0.80% | ||||||||
DaVita HealthCare Partners Inc.(b) | 122,559 | 9,270,363 | ||||||
Express Scripts Holding Co.(b) | 114,132 | 9,541,435 | ||||||
Laboratory Corp. of America Holdings(b) | 83,219 | 9,804,030 | ||||||
Quest Diagnostics Inc. | 136,588 | 9,260,667 | ||||||
| 37,876,495 | ||||||||
| Health Care Supplies–0.21% | ||||||||
DENTSPLY International Inc. | 191,448 | 10,033,790 | ||||||
| Health Care Technology–0.19% | ||||||||
Cerner Corp.(b) | 147,035 | 9,080,882 | ||||||
| Home Entertainment Software–0.43% | ||||||||
Activision Blizzard, Inc. | 349,686 | 10,011,510 | ||||||
Electronic Arts Inc.(b) | 158,986 | 10,516,924 | ||||||
| 20,528,434 | ||||||||
| Home Furnishings–0.41% | ||||||||
Leggett & Platt, Inc. | 204,099 | 9,066,077 | ||||||
Mohawk Industries, Inc.(b) | 52,336 | 10,308,622 | ||||||
| 19,374,699 | ||||||||
| Home Improvement Retail–0.43% | ||||||||
Home Depot, Inc. (The) | 90,201 | 10,504,808 | ||||||
Lowe’s Cos., Inc. | 144,522 | 9,996,587 | ||||||
| 20,501,395 | ||||||||
| Homebuilding–0.69% | ||||||||
D.R. Horton, Inc. | 373,506 | 11,343,377 | ||||||
Lennar Corp.–Class A | 210,161 | 10,697,195 | ||||||
PulteGroup Inc. | 517,716 | 10,711,544 | ||||||
| 32,752,116 | ||||||||
| Homefurnishing Retail–0.19% | ||||||||
Bed Bath & Beyond Inc.(b) | 142,601 | 8,856,948 | ||||||
| Hotel and Resort REIT’s–0.19% | ||||||||
Host Hotels & Resorts Inc. | 500,823 | 8,879,592 | ||||||
| Hotels, Resorts & Cruise Lines–1.02% | ||||||||
Carnival Corp. | 210,383 | 10,357,155 | ||||||
Marriott International Inc.–Class A | 130,189 | 9,199,155 | ||||||
Royal Caribbean Cruises Ltd. | 129,900 | 11,451,984 | ||||||
Starwood Hotels & Resorts Worldwide, Inc. | 121,395 | 8,676,101 | ||||||
| Shares | Value | |||||||
| Hotels, Resorts & Cruise Lines–(continued) | ||||||||
Wyndham Worldwide Corp. | 117,951 | $ | 9,020,892 | |||||
| 48,705,287 | ||||||||
| Household Appliances–0.19% | ||||||||
Whirlpool Corp. | 53,639 | 9,016,716 | ||||||
| Household Products–0.82% | ||||||||
Clorox Co. (The) | 95,048 | 10,566,486 | ||||||
Colgate-Palmolive Co. | 150,496 | 9,452,654 | ||||||
Kimberly-Clark Corp. | 93,463 | 9,956,613 | ||||||
Procter & Gamble Co. (The) | 126,491 | 8,939,119 | ||||||
| 38,914,872 | ||||||||
| Housewares & Specialties–0.21% | ||||||||
Newell Rubbermaid Inc. | 242,438 | 10,213,913 | ||||||
| Human Resource & Employment Services–0.19% | ||||||||
Robert Half International, Inc. | 176,760 | 9,020,063 | ||||||
| Hypermarkets & Super Centers–0.40% | ||||||||
Costco Wholesale Corp. | 71,885 | 10,067,494 | ||||||
Wal-Mart Stores, Inc. | 137,738 | 8,915,781 | ||||||
| 18,983,275 | ||||||||
| Independent Power Producers & Energy Traders–0.36% | ||||||||
AES Corp. (The) | 747,294 | 8,967,528 | ||||||
NRG Energy, Inc. | 412,588 | 8,218,753 | ||||||
| 17,186,281 | ||||||||
| Industrial Conglomerates–0.79% | ||||||||
3M Co. | 63,125 | 8,972,587 | ||||||
Danaher Corp. | 117,299 | 10,207,359 | ||||||
General Electric Co. | 364,234 | 9,040,288 | ||||||
Roper Technologies, Inc. | 56,735 | 9,196,176 | ||||||
| 37,416,410 | ||||||||
| Industrial Gases–0.57% | ||||||||
Air Products and Chemicals, Inc. | 68,825 | 9,603,152 | ||||||
Airgas, Inc. | 94,741 | 9,144,401 | ||||||
Praxair, Inc. | 80,989 | 8,564,587 | ||||||
| 27,312,140 | ||||||||
| Industrial Machinery–1.68% | ||||||||
Dover Corp. | 136,419 | 8,451,157 | ||||||
Flowserve Corp. | 183,862 | 8,297,692 | ||||||
Illinois Tool Works Inc. | 106,470 | 8,999,909 | ||||||
Ingersoll-Rand PLC | 142,805 | 7,895,689 | ||||||
Parker Hannifin Corp. | 83,715 | 9,012,757 | ||||||
Pentair PLC (United Kingdom) | 160,676 | 8,883,776 | ||||||
Snap-on Inc. | 63,596 | 10,160,733 | ||||||
Stanley Black & Decker Inc. | 93,868 | 9,529,479 | ||||||
Xylem, Inc. | 273,026 | 8,859,694 | ||||||
| 80,090,886 | ||||||||
| Industrial REIT’s–0.20% | ||||||||
Prologis, Inc. | 253,916 | 9,648,808 | ||||||
See accompanying Notes to Financial Statements which are an integral part of the financial statements.
12 Invesco Equally-Weighted S&P 500 Fund
| Shares | Value | |||||||
| Insurance Brokers–0.38% | ||||||||
Aon PLC | 97,586 | $ | 9,118,436 | |||||
Marsh & McLennan Cos., Inc. | 168,747 | 9,066,776 | ||||||
| 18,185,212 | ||||||||
| Integrated Oil & Gas–0.55% | ||||||||
Chevron Corp. | 99,893 | 8,090,334 | ||||||
Exxon Mobil Corp. | 118,737 | 8,933,772 | ||||||
Occidental Petroleum Corp. | 128,264 | 9,364,555 | ||||||
| 26,388,661 | ||||||||
| Integrated Telecommunication Services–0.79% | ||||||||
AT&T Inc. | 287,918 | 9,558,878 | ||||||
CenturyLink Inc. | 306,399 | 8,285,029 | ||||||
Frontier Communications Corp. | 2,011,370 | 10,197,646 | ||||||
Verizon Communications Inc. | 211,140 | 9,714,551 | ||||||
| 37,756,104 | ||||||||
| Internet Retail–1.14% | ||||||||
Amazon.com, Inc.(b)(d) | 23,205 | 11,901,612 | ||||||
Expedia, Inc. | 92,639 | 10,652,559 | ||||||
Netflix Inc.(b) | 105,658 | 12,153,840 | ||||||
Priceline Group Inc. (The)(b) | 8,496 | 10,608,445 | ||||||
TripAdvisor Inc.(b) | 131,095 | 9,163,541 | ||||||
| 54,479,997 | ||||||||
| Internet Software & Services–1.30% | ||||||||
Akamai Technologies, Inc.(b) | 135,844 | 9,687,036 | ||||||
eBay Inc.(b) | 402,735 | 10,918,146 | ||||||
Facebook Inc.–Class A(b) | 122,363 | 10,942,923 | ||||||
Google Inc.,–Class A(b) | 9,217 | 5,970,957 | ||||||
Google Inc.,–Class C(b) | 9,261 | 5,725,613 | ||||||
VeriSign, Inc.(b) | 158,481 | 10,925,680 | ||||||
Yahoo! Inc.(b) | 246,177 | 7,936,746 | ||||||
| 62,107,101 | ||||||||
| Investment Banking & Brokerage–0.74% | ||||||||
Charles Schwab Corp. (The) | 299,052 | 9,085,200 | ||||||
E*TRADE Financial Corp.(b) | 324,540 | 8,532,156 | ||||||
Goldman Sachs Group, Inc. (The) | 46,823 | 8,830,818 | ||||||
Morgan Stanley | 251,865 | 8,676,749 | ||||||
| 35,124,923 | ||||||||
| IT Consulting & Other Services–0.76% | ||||||||
Accenture PLC–Class A | 103,811 | 9,786,263 | ||||||
Cognizant Technology Solutions Corp.–Class A(b) | 156,836 | 9,871,258 | ||||||
International Business Machines Corp. | 59,742 | 8,835,244 | ||||||
Teradata Corp.(b) | 258,656 | 7,560,515 | ||||||
| 36,053,280 | ||||||||
| Leisure Products–0.40% | ||||||||
Hasbro, Inc. | 137,000 | 10,218,830 | ||||||
Mattel, Inc. | 381,798 | 8,945,527 | ||||||
| 19,164,357 | ||||||||
| Shares | Value | |||||||
| Life & Health Insurance–1.35% | ||||||||
Aflac, Inc. | 159,443 | $ | 9,343,360 | |||||
Lincoln National Corp. | 162,959 | 8,276,688 | ||||||
MetLife, Inc. | 178,884 | 8,962,088 | ||||||
Principal Financial Group, Inc. | 189,556 | 9,544,145 | ||||||
Prudential Financial, Inc. | 111,792 | 9,021,614 | ||||||
Torchmark Corp. | 171,444 | 10,022,616 | ||||||
Unum Group | 270,216 | 9,063,045 | ||||||
| 64,233,556 | ||||||||
| Life Sciences Tools & Services–0.78% | ||||||||
Agilent Technologies, Inc. | 250,411 | 9,092,423 | ||||||
PerkinElmer, Inc. | 191,632 | 9,328,646 | ||||||
Thermo Fisher Scientific, Inc. | 76,729 | 9,619,515 | ||||||
Waters Corp.(b) | 74,483 | 9,040,746 | ||||||
| 37,081,330 | ||||||||
| Managed Health Care–0.99% | ||||||||
Aetna Inc. | 86,099 | 9,860,058 | ||||||
Anthem, Inc. | 62,076 | 8,755,820 | ||||||
Cigna Corp. | 72,655 | 10,229,097 | ||||||
Humana Inc. | 46,954 | 8,582,722 | ||||||
UnitedHealth Group Inc. | 84,796 | 9,810,897 | ||||||
| 47,238,594 | ||||||||
| Metal & Glass Containers–0.37% | ||||||||
Ball Corp. | 138,368 | 9,119,835 | ||||||
Owens-Illinois, Inc.(b) | 410,382 | 8,556,465 | ||||||
| 17,676,300 | ||||||||
| Motorcycle Manufacturers–0.22% | ||||||||
Harley-Davidson, Inc. | 182,985 | 10,256,309 | ||||||
| Movies & Entertainment–0.67% | ||||||||
Time Warner Inc. | 115,990 | 8,246,889 | ||||||
Twenty-First Century Fox, Inc.–Class A | 305,134 | 8,357,620 | ||||||
Viacom Inc.–Class B | 150,246 | 6,125,529 | ||||||
Walt Disney Co. (The) | 90,735 | 9,244,082 | ||||||
| 31,974,120 | ||||||||
| Multi-Line Insurance–0.99% | ||||||||
American International Group, Inc. | 161,195 | 9,726,506 | ||||||
Assurant, Inc. | 149,302 | 11,100,604 | ||||||
Genworth Financial Inc.–Class A(b) | 1,254,892 | 6,500,340 | ||||||
Hartford Financial Services Group, Inc. (The) | 236,406 | 10,862,856 | ||||||
Loews Corp. | 249,347 | 9,088,698 | ||||||
| 47,279,004 | ||||||||
| Multi-Sector Holdings–0.39% | ||||||||
Berkshire Hathaway Inc.–Class B(b) | 71,112 | 9,531,853 | ||||||
Leucadia National Corp. | 412,588 | 8,854,138 | ||||||
| 18,385,991 | ||||||||
| Multi-Utilities–2.80% | ||||||||
Ameren Corp. | 264,135 | 10,641,999 | ||||||
CenterPoint Energy, Inc. | 517,985 | 9,644,881 | ||||||
See accompanying Notes to Financial Statements which are an integral part of the financial statements.
13 Invesco Equally-Weighted S&P 500 Fund
| Shares | Value | |||||||
| Multi-Utilities–(continued) | ||||||||
CMS Energy Corp. | 308,961 | $ | 10,127,741 | |||||
Consolidated Edison, Inc. | 173,381 | 10,907,399 | ||||||
Dominion Resources, Inc. | 149,347 | 10,416,953 | ||||||
DTE Energy Co. | 134,670 | 10,512,340 | ||||||
NiSource Inc. | 552,390 | 9,274,628 | ||||||
PG&E Corp. | 198,574 | 9,845,299 | ||||||
Public Service Enterprise Group Inc. | 251,294 | 10,114,583 | ||||||
SCANA Corp. | 198,258 | 10,485,866 | ||||||
Sempra Energy | 96,989 | 9,199,407 | ||||||
TECO Energy, Inc. | 560,471 | 11,809,124 | ||||||
WEC Energy Group, Inc. | 218,924 | 10,431,729 | ||||||
| 133,411,949 | ||||||||
| Office REIT’s–0.56% | ||||||||
Boston Properties, Inc. | 79,114 | 8,969,945 | ||||||
SL Green Realty Corp. | 86,795 | 8,984,151 | ||||||
Vornado Realty Trust | 101,768 | 8,873,152 | ||||||
| 26,827,248 | ||||||||
| Office Services & Supplies–0.19% | ||||||||
Pitney Bowes Inc. | 458,895 | 9,090,710 | ||||||
| Oil & Gas Drilling–0.67% | ||||||||
Diamond Offshore Drilling, Inc. | 350,417 | 8,308,387 | ||||||
Ensco PLC–Class A | 423,805 | 7,675,109 | ||||||
Helmerich & Payne, Inc. | 135,733 | 8,009,604 | ||||||
Transocean Ltd. | 561,417 | 7,988,964 | ||||||
| 31,982,064 | ||||||||
| Oil & Gas Equipment & Services–1.16% | ||||||||
Baker Hughes Inc. | 155,564 | 8,711,584 | ||||||
Cameron International Corp.(b) | 186,474 | 12,449,004 | ||||||
FMC Technologies, Inc.(b) | 233,201 | 8,110,731 | ||||||
Halliburton Co. | 219,357 | 8,631,698 | ||||||
National Oilwell Varco Inc. | 206,550 | 8,743,262 | ||||||
Schlumberger Ltd. | 110,663 | 8,561,996 | ||||||
| 55,208,275 | ||||||||
| Oil & Gas Exploration & Production–2.79% | ||||||||
Anadarko Petroleum Corp. | 120,023 | 8,591,246 | ||||||
Apache Corp. | 171,474 | 7,757,484 | ||||||
Cabot Oil & Gas Corp. | 295,159 | 6,986,413 | ||||||
Chesapeake Energy Corp. | 814,399 | 6,360,456 | ||||||
Cimarex Energy Co. | 84,394 | 9,326,381 | ||||||
ConocoPhillips | 157,083 | 7,720,629 | ||||||
Devon Energy Corp. | 161,247 | 6,878,797 | ||||||
EOG Resources, Inc. | 111,429 | 8,726,005 | ||||||
EQT Corp. | 118,300 | 9,206,106 | ||||||
Hess Corp. | 147,448 | 8,765,784 | ||||||
Marathon Oil Corp. | 376,609 | 6,511,570 | ||||||
Murphy Oil Corp. | 229,923 | 7,127,613 | ||||||
Newfield Exploration Co.(b) | 272,058 | 9,062,252 | ||||||
Noble Energy, Inc. | 215,146 | 7,188,028 | ||||||
Pioneer Natural Resources Co. | 67,594 | 8,318,118 | ||||||
Range Resources Corp. | 188,803 | 7,291,572 | ||||||
| Shares | Value | |||||||
| Oil & Gas Exploration & Production–(continued) | ||||||||
Southwestern Energy Co.(b) | 433,567 | $ | 7,041,128 | |||||
| 132,859,582 | ||||||||
| Oil & Gas Refining & Marketing–0.85% | ||||||||
Marathon Petroleum Corp. | 195,500 | 9,249,105 | ||||||
Phillips 66 | 128,479 | 10,158,835 | ||||||
Tesoro Corp. | 119,405 | 10,986,454 | ||||||
Valero Energy Corp. | 169,522 | 10,059,435 | ||||||
| 40,453,829 | ||||||||
| Oil & Gas Storage & Transportation–0.94% | ||||||||
Columbia Pipeline Group, Inc. | 328,741 | 8,336,872 | ||||||
Kinder Morgan Inc. | 256,330 | 8,307,655 | ||||||
ONEOK, Inc. | 256,924 | 9,251,833 | ||||||
Spectra Energy Corp. | 302,865 | 8,804,285 | ||||||
Williams Cos., Inc. (The) | 212,308 | 10,233,246 | ||||||
| 44,933,891 | ||||||||
| Packaged Foods & Meats–2.69% | ||||||||
Campbell Soup Co. | 213,489 | 10,245,337 | ||||||
ConAgra Foods, Inc. | 261,778 | 10,910,907 | ||||||
General Mills, Inc. | 181,652 | 10,310,568 | ||||||
Hershey Co. (The) | 109,581 | 9,809,691 | ||||||
Hormel Foods Corp. | 176,698 | 10,796,248 | ||||||
JM Smucker Co. (The) | 89,642 | 10,552,656 | ||||||
Kellogg Co. | 160,572 | 10,642,712 | ||||||
Keurig Green Mountain Inc. | 119,006 | 6,735,740 | ||||||
Kraft Heinz Co. (The) | 117,784 | 8,558,185 | ||||||
McCormick & Co., Inc. | 129,614 | 10,275,798 | ||||||
Mead Johnson Nutrition Co. | 109,895 | 8,609,174 | ||||||
Mondelez International Inc.–Class A | 246,512 | 10,442,248 | ||||||
Tyson Foods, Inc.–Class A | 239,874 | 10,141,873 | ||||||
| 128,031,137 | ||||||||
| Paper Packaging–0.60% | ||||||||
Avery Dennison Corp. | 160,676 | 9,332,062 | ||||||
Sealed Air Corp. | 196,966 | 10,133,901 | ||||||
WestRock Co. | 156,728 | 9,301,807 | ||||||
| 28,767,770 | ||||||||
| Paper Products–0.18% | ||||||||
International Paper Co. | 195,041 | 8,414,069 | ||||||
| Personal Products–0.19% | ||||||||
Estee Lauder Cos. Inc. (The)–Class A | 114,683 | 9,148,263 | ||||||
| Pharmaceuticals–2.49% | ||||||||
AbbVie Inc. | 148,790 | 9,285,984 | ||||||
Allergan PLC(b) | 33,367 | 10,134,893 | ||||||
Bristol-Myers Squibb Co. | 152,824 | 9,088,443 | ||||||
Eli Lilly and Co. | 118,469 | 9,755,922 | ||||||
Endo International PLC(b) | 123,867 | 9,537,759 | ||||||
Hospira, Inc.(b) | 113,071 | 10,172,998 | ||||||
Johnson & Johnson | 101,436 | 9,532,955 | ||||||
Mallinckrodt PLC(b) | 80,454 | 6,938,353 | ||||||
See accompanying Notes to Financial Statements which are an integral part of the financial statements.
14 Invesco Equally-Weighted S&P 500 Fund
| Shares | Value | |||||||
| Pharmaceuticals–(continued) | ||||||||
Merck & Co., Inc. | 172,392 | $ | 9,283,309 | |||||
Mylan N.V.(b) | 135,364 | 6,712,701 | ||||||
Perrigo Co. PLC | 54,051 | 9,889,711 | ||||||
Pfizer Inc. | 291,621 | 9,396,029 | ||||||
Zoetis Inc. | 203,267 | 9,120,590 | ||||||
| 118,849,647 | ||||||||
| Property & Casualty Insurance–1.50% | ||||||||
ACE Ltd. | 94,580 | 9,662,293 | ||||||
Allstate Corp. (The) | 148,083 | 8,630,277 | ||||||
Chubb Corp. (The) | 102,689 | 12,405,858 | ||||||
Cincinnati Financial Corp. | 194,774 | 10,192,523 | ||||||
Progressive Corp. (The) | 359,250 | 10,763,130 | ||||||
Travelers Cos., Inc. (The) | 100,294 | 9,984,268 | ||||||
XL Group PLC | 265,541 | 9,902,024 | ||||||
| 71,540,373 | ||||||||
| Publishing–0.20% | ||||||||
News Corp.–Class A(b) | 692,564 | 9,439,647 | ||||||
| Railroads–0.73% | ||||||||
CSX Corp. | 287,090 | 7,860,524 | ||||||
Kansas City Southern | 105,961 | 9,826,823 | ||||||
Norfolk Southern Corp. | 108,793 | 8,476,063 | ||||||
Union Pacific Corp. | 99,266 | 8,511,067 | ||||||
| 34,674,477 | ||||||||
| Real Estate Services–0.18% | ||||||||
CBRE Group, Inc.–Class A(b) | 267,535 | 8,566,471 | ||||||
| Regional Banks–1.94% | ||||||||
BB&T Corp. | 242,911 | 8,968,274 | ||||||
Fifth Third Bancorp | 471,250 | 9,387,300 | ||||||
Huntington Bancshares Inc. | 866,005 | 9,448,114 | ||||||
KeyCorp | 649,082 | 8,918,387 | ||||||
M&T Bank Corp. | 79,095 | 9,352,193 | ||||||
People’s United Financial Inc. | 621,968 | 9,640,504 | ||||||
PNC Financial Services Group, Inc. (The) | 101,364 | 9,236,288 | ||||||
Regions Financial Corp. | 942,948 | 9,042,871 | ||||||
SunTrust Banks, Inc. | 228,083 | 9,207,711 | ||||||
Zions Bancorp. | 312,249 | 9,055,221 | ||||||
| 92,256,863 | ||||||||
| Research & Consulting Services–0.59% | ||||||||
Dun & Bradstreet Corp. (The) | 77,263 | 8,187,560 | ||||||
Equifax Inc. | 101,241 | 9,911,494 | ||||||
Nielsen Holdings PLC | 221,992 | 10,040,698 | ||||||
| 28,139,752 | ||||||||
| Residential REIT’s–0.83% | ||||||||
Apartment Investment & Management Co.–Class A | 268,326 | 9,667,786 | ||||||
AvalonBay Communities, Inc. | 61,377 | 10,130,887 | ||||||
Equity Residential | 139,432 | 9,934,530 | ||||||
Essex Property Trust, Inc. | 46,537 | 9,987,771 | ||||||
| 39,720,974 | ||||||||
| Shares | Value | |||||||
| Restaurants–1.06% | ||||||||
Chipotle Mexican Grill, Inc.(b) | 16,361 | $ | 11,616,473 | |||||
Darden Restaurants, Inc. | 146,474 | 9,961,697 | ||||||
McDonald’s Corp. | 104,947 | 9,972,064 | ||||||
Starbucks Corp. | 189,556 | 10,370,609 | ||||||
Yum! Brands, Inc. | 109,497 | 8,734,576 | ||||||
| 50,655,419 | ||||||||
| Retail REIT’s–1.02% | ||||||||
General Growth Properties, Inc. | 372,391 | 9,451,284 | ||||||
Kimco Realty Corp. | 428,723 | 9,882,065 | ||||||
Macerich Co. (The) | 122,997 | 9,369,911 | ||||||
Realty Income Corp. | 220,034 | 9,833,320 | ||||||
Simon Property Group, Inc. | 56,404 | 10,114,365 | ||||||
| 48,650,945 | ||||||||
| Security & Alarm Services–0.38% | ||||||||
ADT Corp. (The) | 271,984 | 8,915,635 | ||||||
Tyco International PLC | 247,675 | 8,988,126 | ||||||
| 17,903,761 | ||||||||
| Semiconductor Equipment–0.55% | ||||||||
Applied Materials, Inc. | 508,480 | 8,178,901 | ||||||
KLA-Tencor Corp. | 178,500 | 8,944,635 | ||||||
Lam Research Corp. | 122,468 | 8,911,996 | ||||||
| 26,035,532 | ||||||||
| Semiconductors–2.57% | ||||||||
Altera Corp. | 193,377 | 9,388,453 | ||||||
Analog Devices, Inc. | 150,564 | 8,410,505 | ||||||
Avago Technologies Ltd. (Singapore) | 71,020 | 8,946,389 | ||||||
Broadcom Corp.–Class A | 184,679 | 9,542,364 | ||||||
First Solar, Inc.(b) | 197,630 | 9,454,619 | ||||||
Intel Corp. | 318,530 | 9,090,846 | ||||||
Linear Technology Corp. | 217,895 | 8,776,811 | ||||||
Microchip Technology Inc. | 210,649 | 8,952,583 | ||||||
Micron Technology, Inc.(b) | 396,991 | 6,514,622 | ||||||
NVIDIA Corp. | 472,590 | 10,623,823 | ||||||
Qorvo, Inc.(b) | 119,462 | 6,631,336 | ||||||
Skyworks Solutions, Inc. | 95,057 | 8,303,229 | ||||||
Texas Instruments Inc. | 188,197 | 9,003,345 | ||||||
Xilinx, Inc. | 213,855 | 8,958,386 | ||||||
| 122,597,311 | ||||||||
| Soft Drinks–1.11% | ||||||||
Coca-Cola Co. (The) | 249,659 | 9,816,592 | ||||||
Coca-Cola Enterprises, Inc.(d) | 228,553 | 11,768,194 | ||||||
Dr Pepper Snapple Group, Inc. | 135,659 | 10,409,115 | ||||||
Monster Beverage Corp.(b) | 77,706 | 10,759,173 | ||||||
PepsiCo, Inc. | 106,425 | 9,890,075 | ||||||
| 52,643,149 | ||||||||
| Specialized Consumer Services–0.23% | ||||||||
H&R Block, Inc. | 325,812 | 11,084,124 | ||||||
See accompanying Notes to Financial Statements which are an integral part of the financial statements.
15 Invesco Equally-Weighted S&P 500 Fund
| Shares | Value | |||||||
| Specialized Finance–1.01% | ||||||||
CME Group Inc.–Class A | 102,922 | $ | 9,719,954 | |||||
Intercontinental Exchange, Inc. | 41,820 | 9,552,106 | ||||||
McGraw Hill Financial, Inc. | 96,203 | 9,330,729 | ||||||
Moody’s Corp. | 91,770 | 9,388,989 | ||||||
NASDAQ OMX Group, Inc. (The) | 196,617 | 10,064,824 | ||||||
| 48,056,602 | ||||||||
| Specialized REIT’s–1.43% | ||||||||
American Tower Corp. | 107,042 | 9,868,202 | ||||||
Crown Castle International Corp. | 120,632 | 10,059,502 | ||||||
Equinix, Inc. | 38,264 | 10,322,479 | ||||||
Iron Mountain Inc. | 311,567 | 8,829,809 | ||||||
Plum Creek Timber Co., Inc. | 243,385 | 9,367,889 | ||||||
Public Storage | 53,429 | 10,753,655 | ||||||
Weyerhaeuser Co. | 311,178 | 8,694,313 | ||||||
| 67,895,849 | ||||||||
| Specialty Chemicals–0.98% | ||||||||
Ecolab Inc. | 87,312 | 9,529,232 | ||||||
International Flavors & Fragrances Inc. | 90,422 | 9,905,730 | ||||||
PPG Industries, Inc. | 85,541 | 8,151,202 | ||||||
Sherwin-Williams Co. (The) | 35,514 | 9,084,836 | ||||||
Sigma-Aldrich Corp. | 71,715 | 9,997,788 | ||||||
| 46,668,788 | ||||||||
| Specialty Stores–0.81% | ||||||||
Signet Jewelers Ltd. | 85,327 | 11,775,126 | ||||||
Staples, Inc. | 610,923 | 8,681,216 | ||||||
Tiffany & Co. | 108,344 | 8,911,294 | ||||||
Tractor Supply Co. | 110,614 | 9,436,480 | ||||||
| 38,804,116 | ||||||||
| Steel–0.19% | ||||||||
Nucor Corp. | 205,317 | 8,888,173 | ||||||
| Systems Software–0.94% | ||||||||
CA, Inc. | 331,001 | 9,033,017 | ||||||
Microsoft Corp. | 217,019 | 9,444,667 | ||||||
Oracle Corp. | 224,996 | 8,345,102 | ||||||
Red Hat, Inc.(b) | 127,591 | 9,213,346 | ||||||
Symantec Corp. | 420,058 | 8,606,988 | ||||||
| 44,643,120 | ||||||||
| Technology Hardware, Storage & Peripherals–1.32% | ||||||||
Apple Inc. | 78,448 | 8,845,796 | ||||||
| Shares | Value | |||||||
| Technology Hardware, Storage & Peripheral–(continued) | ||||||||
EMC Corp. | 368,539 | $ | 9,165,565 | |||||
Hewlett-Packard Co.(d) | 307,818 | 8,637,373 | ||||||
NetApp, Inc. | 297,980 | 9,523,441 | ||||||
SanDisk Corp. | 150,928 | 8,234,632 | ||||||
Seagate Technology PLC | 186,300 | 9,575,820 | ||||||
Western Digital Corp. | 107,260 | 8,791,030 | ||||||
| 62,773,657 | ||||||||
| Thrifts & Mortgage Finance–0.20% | ||||||||
Hudson City Bancorp, Inc. | 1,001,646 | 9,315,308 | ||||||
| Tires & Rubber–0.20% | ||||||||
Goodyear Tire & Rubber Co. (The) | 316,811 | 9,431,463 | ||||||
| Tobacco–0.68% | ||||||||
Altria Group, Inc. | 207,667 | 11,126,798 | ||||||
Philip Morris International Inc. | 121,870 | 9,725,226 | ||||||
Reynolds American Inc. | 138,560 | 11,604,400 | ||||||
| 32,456,424 | ||||||||
| Trading Companies & Distributors–0.55% | ||||||||
Fastenal Co. | 237,362 | 9,147,931 | ||||||
United Rentals, Inc.(b) | 109,102 | 7,564,042 | ||||||
W.W. Grainger, Inc. | 41,890 | 9,359,902 | ||||||
| 26,071,875 | ||||||||
| Trucking–0.37% | ||||||||
J.B. Hunt Transport Services, Inc. | 121,155 | 8,817,661 | ||||||
Ryder System, Inc. | 106,312 | 8,714,395 | ||||||
| 17,532,056 | ||||||||
Total Common Stocks & Other Equity Interests (Cost $3,697,909,433) |
| 4,667,574,369 | ||||||
Money Market Funds–1.32% |
| |||||||
Liquid Assets Portfolio–Institutional Class, 0.12%(e) | 31,511,548 | 31,511,548 | ||||||
Premier Portfolio–Institutional Class, 0.09%(e) | 31,511,547 | 31,511,547 | ||||||
Total Money Market Funds |
| 63,023,095 | ||||||
TOTAL INVESTMENTS–99.31% |
| 4,730,597,464 | ||||||
OTHER ASSETS LESS LIABILITIES–0.69% |
| 32,938,662 | ||||||
NET ASSETS–100.00% |
| $ | 4,763,536,126 | |||||
Investment Abbreviations:
| REIT | – Real Estate Investment Trust |
Notes to Schedule of Investments:
| (a) | Industry and/or sector classifications used in this report are generally according to the Global Industry Classification Standard, which was developed by and is the exclusive property and a service mark of MSCI Inc. and Standard & Poor’s. |
| (b) | Non-income producing security. |
| (c) | The Fund’s Adviser is a subsidiary of Invesco Ltd. and therefore, Invesco Ltd. is considered to be affiliated with the Fund. See Note 5. |
| (d) | All or a portion of the value was pledged as collateral to cover margin requirements for open futures contracts. See Note 1I and Note 4. |
| (e) | The money market fund and the Fund are affiliated by having the same investment adviser. The rate shown is the 7-day SEC standardized yield as of August 31, 2015. |
See accompanying Notes to Financial Statements which are an integral part of the financial statements.
16 Invesco Equally-Weighted S&P 500 Fund
Statement of Assets and Liabilities
August 31, 2015
Assets: |
| |||
Investments, at value (Cost $3,690,295,826) | $ | 4,658,952,794 | ||
Investments in affiliates, at value (Cost $70,636,702) | 71,644,670 | |||
Total investments, at value (Cost $3,760,932,528) | 4,730,597,464 | |||
Cash | 10,172,252 | |||
Receivable for: | ||||
Fund shares sold | 41,542,399 | |||
Dividends | 8,423,330 | |||
Investment for trustee deferred compensation and retirement plans | 116,808 | |||
Other assets | 132,753 | |||
Total assets | 4,790,985,006 | |||
Liabilities: |
| |||
Payable for: | ||||
Investments purchased | 10,213,978 | |||
Fund shares reacquired | 13,433,777 | |||
Variation margin — futures | 679,359 | |||
Accrued fees to affiliates | 2,633,786 | |||
Accrued trustees’ and officers’ fees and benefits | 11,533 | |||
Accrued other operating expenses | 275,815 | |||
Trustee deferred compensation and retirement plans | 200,632 | |||
Total liabilities | 27,448,880 | |||
Net assets applicable to shares outstanding | $ | 4,763,536,126 | ||
Net assets consist of: |
| |||
Shares of beneficial interest | $ | 3,752,568,203 | ||
Undistributed net investment income | 40,101,146 | |||
Undistributed net realized gain | 4,716,681 | |||
Net unrealized appreciation | 966,150,096 | |||
| $ | 4,763,536,126 | |||
Net Assets: |
| |||
Class A | $ | 1,789,490,526 | ||
Class B | $ | 8,950,111 | ||
Class C | $ | 750,897,514 | ||
Class R | $ | 89,588,434 | ||
Class Y | $ | 1,945,878,692 | ||
Class R6 | $ | 178,730,849 | ||
Shares outstanding, $0.01 par value per share, |
| |||
Class A | 38,176,329 | |||
Class B | 192,219 | |||
Class C | 16,676,507 | |||
Class R | 1,920,449 | |||
Class Y | 41,137,152 | |||
Class R6 | 3,773,263 | |||
Class A: | ||||
Net asset value per share | $ | 46.87 | ||
Maximum offering price per share | ||||
(Net asset value of $46.87 ¸ 94.50%) | $ | 49.60 | ||
Class B: | ||||
Net asset value and offering price per share | $ | 46.56 | ||
Class C: | ||||
Net asset value and offering price per share | $ | 45.03 | ||
Class R: | ||||
Net asset value and offering price per share | $ | 46.65 | ||
Class Y: | ||||
Net asset value and offering price per share | $ | 47.30 | ||
Class R6: | ||||
Net asset value and offering price per share | $ | 47.37 | ||
See accompanying Notes to Financial Statements which are an integral part of the financial statements.
17 Invesco Equally-Weighted S&P 500 Fund
Statement of Operations
For the year ended August 31, 2015
Investment income: |
| |||
Dividends (net of foreign withholding taxes of $54,723) | $ | 79,971,851 | ||
Dividends from affiliates | 268,105 | |||
Total investment income | 80,239,956 | |||
Expenses: | ||||
Advisory fees | 4,634,572 | |||
Administrative services fees | 602,037 | |||
Custodian fees | 141,514 | |||
Distribution fees: | ||||
Class A | 4,449,385 | |||
Class B | 128,764 | |||
Class C | 5,860,257 | |||
Class R | 412,681 | |||
Transfer agent fees — A, B, C, R & Y | 5,122,122 | |||
Transfer agent fees — R6 | 2,075 | |||
Trustees’ and officers’ fees and benefits | 82,008 | |||
Other | 1,424,685 | |||
Total expenses | 22,860,100 | |||
Less: Fees waived and expense offset arrangement(s) | (100,362 | ) | ||
Net expenses | 22,759,738 | |||
Net investment income | 57,480,218 | |||
Realized and unrealized gain (loss) from: | ||||
Net realized gain (loss) from: | ||||
Investment securities | 49,916,805 | |||
Futures contracts | (5,515,889 | ) | ||
| 44,400,916 | ||||
Change in net unrealized appreciation (depreciation) of: | ||||
Investment securities | (197,100,075 | ) | ||
Futures contracts | (3,546,207 | ) | ||
| (200,646,282 | ) | |||
Net realized and unrealized gain (loss) | (156,245,366 | ) | ||
Net increase (decrease) in net assets resulting from operations | $ | (98,765,148 | ) | |
See accompanying Notes to Financial Statements which are an integral part of the financial statements.
18 Invesco Equally-Weighted S&P 500 Fund
Statement of Changes in Net Assets
For the years ended August 31, 2015 and 2014
| 2015 | 2014 | |||||||
Operations: |
| |||||||
Net investment income | $ | 57,480,218 | $ | 30,074,136 | ||||
Net realized gain | 44,400,916 | 57,887,030 | ||||||
Change in net unrealized appreciation (depreciation) | (200,646,282 | ) | 412,469,081 | |||||
Net increase (decrease) in net assets resulting from operations | (98,765,148 | ) | 500,430,247 | |||||
Distributions to shareholders from net investment income: | ||||||||
Class A | (16,858,607 | ) | (12,875,050 | ) | ||||
Class B | (75,582 | ) | (126,859 | ) | ||||
Class C | (2,502,255 | ) | (1,210,824 | ) | ||||
Class R | (624,853 | ) | (354,344 | ) | ||||
Class Y | (16,046,854 | ) | (7,443,262 | ) | ||||
Class R6 | (1,937,107 | ) | (165 | ) | ||||
Total distributions from net investment income | (38,045,258 | ) | (22,010,504 | ) | ||||
Distributions to shareholders from net realized gains: | ||||||||
Class A | (22,937,580 | ) | (29,164,508 | ) | ||||
Class B | (195,607 | ) | (532,180 | ) | ||||
Class C | (6,475,856 | ) | (5,079,486 | ) | ||||
Class R | (1,012,662 | ) | (946,483 | ) | ||||
Class Y | (18,300,963 | ) | (14,325,712 | ) | ||||
Class R6 | (2,090,876 | ) | (311 | ) | ||||
Total distributions from net realized gains | (51,013,544 | ) | (50,048,680 | ) | ||||
Share transactions–net: | ||||||||
Class A | 350,674,194 | 266,279,740 | ||||||
Class B | (6,623,821 | ) | (10,881,910 | ) | ||||
Class C | 434,132,904 | 164,908,129 | ||||||
Class R | 27,401,759 | 27,842,070 | ||||||
Class Y | 996,912,519 | 406,934,786 | ||||||
Class R6 | 188,329,413 | 1,159,547 | ||||||
Net increase in net assets resulting from share transactions | 1,990,826,968 | 856,242,362 | ||||||
Net increase in net assets | 1,803,003,018 | 1,284,613,425 | ||||||
Net assets: | ||||||||
Beginning of year | 2,960,533,108 | 1,675,919,683 | ||||||
End of year (includes undistributed net investment income of $40,101,146 and $20,614,719, respectively) | $ | 4,763,536,126 | $ | 2,960,533,108 | ||||
Notes to Financial Statements
August 31, 2015
NOTE 1—Significant Accounting Policies
Invesco Equally-Weighted S&P 500 Fund (the “Fund”) is a series portfolio of AIM Counselor Series Trust (Invesco Counselor Series Trust) (the “Trust”). The Trust is a Delaware statutory trust registered under the Investment Company Act of 1940, as amended (the “1940 Act”), as an open-end series management investment company consisting of thirteen separate portfolios, each authorized to issue an unlimited number of shares of beneficial interest. The assets, liabilities and operations of each portfolio are accounted for separately. Information presented in these financial statements pertains only to the Fund. Matters affecting each portfolio or class will be voted on exclusively by the shareholders of such portfolio or class.
The Fund’s investment objective is total return through growth of capital and current income.
The Fund currently consists of six different classes of shares: Class A, Class B, Class C, Class R, Class Y and Class R6. Class A shares are sold with a front-end sales charge unless certain waiver criteria are met and under certain circumstances load waived shares may be subject to contingent deferred sales charges (“CDSC”). Class C shares are sold with a CDSC. Class R, Class Y and Class R6 shares are sold at net asset value. Effective November 30, 2010, new or additional investments in Class B shares are no longer permitted. Existing shareholders of Class B shares may continue to reinvest dividends and capital gains distributions in Class B shares until they convert to Class A shares. Also, shareholders in Class B shares will be able to exchange those shares for Class B shares of other Invesco Funds offering such shares until they convert to Class A shares. Generally, Class B
19 Invesco Equally-Weighted S&P 500 Fund
shares will automatically convert to Class A shares on or about the month-end, which is at least eight years after the date of purchase. Redemption of Class B shares prior to the conversion date will be subject to a CDSC.
The following is a summary of the significant accounting policies followed by the Fund in the preparation of its financial statements.
| A. | Security Valuations — Securities, including restricted securities, are valued according to the following policy. |
A security listed or traded on an exchange (except convertible securities) is valued at its last sales price or official closing price as of the close of the customary trading session on the exchange where the security is principally traded, or lacking any sales or official closing price on a particular day, the security may be valued at the closing bid price on that day. Securities traded in the over-the-counter market are valued based on prices furnished by independent pricing services or market makers. When such securities are valued by an independent pricing service they may be considered fair valued. Futures contracts are valued at the final settlement price set by an exchange on which they are principally traded. Listed options are valued at the mean between the last bid and asked prices from the exchange on which they are principally traded. Options not listed on an exchange are valued by an independent source at the mean between the last bid and asked prices. For purposes of determining net asset value (“NAV”) per share, futures and option contracts generally are valued 15 minutes after the close of the customary trading session of the New York Stock Exchange (“NYSE”).
Investments in open-end and closed-end registered investment companies that do not trade on an exchange are valued at the end-of-day net asset value per share. Investments in open-end and closed-end registered investment companies that trade on an exchange are valued at the last sales price or official closing price as of the close of the customary trading session on the exchange where the security is principally traded.
Debt obligations (including convertible securities) and unlisted equities are fair valued using an evaluated quote provided by an independent pricing service. Evaluated quotes provided by the pricing service may be determined without exclusive reliance on quoted prices, and may reflect appropriate factors such as institution-size trading in similar groups of securities, developments related to specific securities, dividend rate (for unlisted equities), yield (for debt obligations), quality, type of issue, coupon rate (for debt obligations), maturity (for debt obligations), individual trading characteristics and other market data. Debt obligations are subject to interest rate and credit risks. In addition, all debt obligations involve some risk of default with respect to interest and/or principal payments.
Foreign securities’ (including foreign exchange contracts) prices are converted into U.S. dollar amounts using the applicable exchange rates as of the close of the NYSE. If market quotations are available and reliable for foreign exchange-traded equity securities, the securities will be valued at the market quotations. Because trading hours for certain foreign securities end before the close of the NYSE, closing market quotations may become unreliable. If between the time trading ends on a particular security and the close of the customary trading session on the NYSE, events occur that the Adviser determines are significant and make the closing price unreliable, the Fund may fair value the security. If the event is likely to have affected the closing price of the security, the security will be valued at fair value in good faith using procedures approved by the Board of Trustees. Adjustments to closing prices to reflect fair value may also be based on a screening process of an independent pricing service to indicate the degree of certainty, based on historical data, that the closing price in the principal market where a foreign security trades is not the current value as of the close of the NYSE. Foreign securities’ prices meeting the approved degree of certainty that the price is not reflective of current value will be priced at the indication of fair value from the independent pricing service. Multiple factors may be considered by the independent pricing service in determining adjustments to reflect fair value and may include information relating to sector indices, American Depositary Receipts and domestic and foreign index futures. Foreign securities may have additional risks including exchange rate changes, potential for sharply devalued currencies and high inflation, political and economic upheaval, the relative lack of issuer information, relatively low market liquidity and the potential lack of strict financial and accounting controls and standards.
Securities for which market prices are not provided by any of the above methods may be valued based upon quotes furnished by independent sources. The last bid price may be used to value equity securities. The mean between the last bid and asked prices is used to value debt obligations, including corporate loans.
Securities for which market quotations are not readily available or became unreliable are valued at fair value as determined in good faith by or under the supervision of the Trust’s officers following procedures approved by the Board of Trustees. Issuer specific events, market trends, bid/asked quotes of brokers and information providers and other market data may be reviewed in the course of making a good faith determination of a security’s fair value.
The Fund may invest in securities that are subject to interest rate risk, meaning the risk that the prices will generally fall as interest rates rise and, conversely, the prices will generally rise as interest rates fall. Specific securities differ in their sensitivity to changes in interest rates depending on their individual characteristics. Changes in interest rates may result in increased market volatility, which may affect the value and/or liquidity of certain Fund investments.
Valuations change in response to many factors including the historical and prospective earnings of the issuer, the value of the issuer’s assets, general economic conditions, interest rates, investor perceptions and market liquidity. Because of the inherent uncertainties of valuation, the values reflected in the financial statements may materially differ from the value received upon actual sale of those investments.
| B. | Securities Transactions and Investment Income — Securities transactions are accounted for on a trade date basis. Realized gains or losses on sales are computed on the basis of specific identification of the securities sold. Interest income (net of withholding tax, if any) is recorded on the accrual basis from settlement date. Dividend income (net of withholding tax, if any) is recorded on the ex-dividend date. |
The Fund may periodically participate in litigation related to Fund investments. As such, the Fund may receive proceeds from litigation settlements. Any proceeds received are included in the Statement of Operations as realized gain (loss) for investments no longer held and as unrealized gain (loss) for investments still held.
Brokerage commissions and mark ups are considered transaction costs and are recorded as an increase to the cost basis of securities purchased and/or a reduction of proceeds on a sale of securities. Such transaction costs are included in the determination of net realized and unrealized gain (loss) from investment securities reported in the Statement of Operations and the Statement of Changes in Net Assets and the net realized and unrealized gains (losses) on securities per share in the Financial Highlights. Transaction costs are included in the calculation of the Fund’s net asset value and, accordingly, they reduce the Fund’s total returns. These transaction costs are not considered operating expenses and are not reflected in net investment income reported in the Statement of Operations and the Statement of Changes in Net Assets, or the net investment income per share and the ratios of expenses and net investment income reported in the Financial Highlights, nor are they limited by any expense limitation arrangements between the Fund and the investment adviser.
20 Invesco Equally-Weighted S&P 500 Fund
The Fund allocates income and realized and unrealized capital gains and losses to a class based on the relative net assets of each class.
| C. | Country Determination — For the purposes of making investment selection decisions and presentation in the Schedule of Investments, the investment adviser may determine the country in which an issuer is located and/or credit risk exposure based on various factors. These factors include the laws of the country under which the issuer is organized, where the issuer maintains a principal office, the country in which the issuer derives 50% or more of its total revenues and the country that has the primary market for the issuer’s securities, as well as other criteria. Among the other criteria that may be evaluated for making this determination are the country in which the issuer maintains 50% or more of its assets, the type of security, financial guarantees and enhancements, the nature of the collateral and the sponsor organization. Country of issuer and/or credit risk exposure has been determined to be the United States of America, unless otherwise noted. |
| D. | Distributions — Distributions from net investment income and net realized capital gain, if any, are generally declared and paid annually and recorded on the ex-dividend date. The Fund may elect to treat a portion of the proceeds from redemptions as distributions for federal income tax purposes. |
| E. | Federal Income Taxes — The Fund intends to comply with the requirements of Subchapter M of the Internal Revenue Code of 1986, as amended (the “Internal Revenue Code”), necessary to qualify as a regulated investment company and to distribute substantially all of the Fund’s taxable earnings to shareholders. As such, the Fund will not be subject to federal income taxes on otherwise taxable income (including net realized capital gain) that is distributed to shareholders. Therefore, no provision for federal income taxes is recorded in the financial statements. |
The Fund recognizes the tax benefits of uncertain tax positions only when the position is more likely than not to be sustained. Management has analyzed the Fund’s uncertain tax positions and concluded that no liability for unrecognized tax benefits should be recorded related to uncertain tax positions. Management is not aware of any tax positions for which it is reasonably possible that the total amounts of unrecognized tax benefits will change materially in the next 12 months.
The Fund files tax returns in the U.S. Federal jurisdiction and certain other jurisdictions. Generally, the Fund is subject to examinations by such taxing authorities for up to three years after the filing of the return for the tax period.
| F. | Expenses — Fees provided for under the Rule 12b-1 plan of a particular class of the Fund are charged to the operations of such class. Transfer agency fees and expenses and other shareholder recordkeeping fees and expenses attributable to Class R6 are charged to such class. Transfer agency fees and expenses and other shareholder recordkeeping fees and expenses relating to all other classes are allocated among those classes based on relative net assets. All other expenses are allocated among the classes based on relative net assets. |
| G. | Accounting Estimates — The preparation of financial statements in conformity with accounting principles generally accepted in the United States of America (“GAAP”) requires management to make estimates and assumptions that affect the reported amounts of assets and liabilities at the date of the financial statements and the reported amounts of revenues and expenses during the reporting period including estimates and assumptions related to taxation. Actual results could differ from those estimates by a significant amount. In addition, the Fund monitors for material events or transactions that may occur or become known after the period-end date and before the date the financial statements are released to print. |
| H. | Indemnifications — Under the Trust’s organizational documents, each Trustee, officer, employee or other agent of the Trust is indemnified against certain liabilities that may arise out of the performance of their duties to the Fund. Additionally, in the normal course of business, the Fund enters into contracts, including the Fund’s servicing agreements, that contain a variety of indemnification clauses. The Fund’s maximum exposure under these arrangements is unknown as this would involve future claims that may be made against the Fund that have not yet occurred. The risk of material loss as a result of such indemnification claims is considered remote. |
| I. | Futures Contracts — The Fund may enter into futures contracts to manage exposure to interest rate, equity and market price movements and/or currency risks. A futures contract is an agreement between two parties (“Counterparties”) to purchase or sell a specified underlying security, currency or commodity (or delivery of a cash settlement price, in the case of an index future) for a fixed price at a future date. The Fund currently invests only in exchange-traded futures and they are standardized as to maturity date and underlying financial instrument. Initial margin deposits required upon entering into futures contracts are satisfied by the segregation of specific securities or cash as collateral at the futures commission merchant (broker). During the period the futures contracts are open, changes in the value of the contracts are recognized as unrealized gains or losses by recalculating the value of the contracts on a daily basis. Subsequent or variation margin payments are received or made depending upon whether unrealized gains or losses are incurred. These amounts are reflected as receivables or payables on the Statement of Assets and Liabilities. When the contracts are closed or expire, the Fund recognizes a realized gain or loss equal to the difference between the proceeds from, or cost of, the closing transaction and the Fund’s basis in the contract. The net realized gain (loss) and the change in unrealized gain (loss) on futures contracts held during the period is included on the Statement of Operations. The primary risks associated with futures contracts are market risk and the absence of a liquid secondary market. If the Fund were unable to liquidate a futures contract and/or enter into an offsetting closing transaction, the Fund would continue to be subject to market risk with respect to the value of the contracts and continue to be required to maintain the margin deposits on the futures contracts. Futures contracts have minimal Counterparty risk since the exchange’s clearinghouse, as Counterparty to all exchange-traded futures, guarantees the futures against default. Risks may exceed amounts recognized in the Statement of Assets and Liabilities. |
| J. | Collateral — To the extent the Fund has designated or segregated a security as collateral and that security is subsequently sold, it is the Fund’s practice to replace such collateral no later than the next business day. |
NOTE 2—Advisory Fees and Other Fees Paid to Affiliates
The Trust has entered into a master investment advisory agreement with Invesco Advisers, Inc. (the “Adviser” or “Invesco”). Under the terms of the investment advisory agreement, the Fund pays an advisory fee to the Adviser based on the annual rate of the Fund’s average daily net assets as follows:
| Average Daily Net Assets | Rate | |||
First $2 billion | 0.12% | |||
Over $2 billion | 0.10% | |||
21 Invesco Equally-Weighted S&P 500 Fund
For the year ended August 31, 2015, the effective advisory fees incurred by the Fund was 0.11%.
Under the terms of a master sub-advisory agreement between the Adviser and each of Invesco Asset Management Deutschland GmbH, Invesco Asset Management Limited, Invesco Asset Management (Japan) Limited, Invesco Hong Kong Limited, Invesco Senior Secured Management, Inc. and Invesco Canada Ltd. (collectively, the “Affiliated Sub-Advisers”) the Adviser, not the Fund, may pay 40% of the fees paid to the Adviser to any such Affiliated Sub-Adviser(s) that provide(s) discretionary investment management services to the Fund based on the percentage of assets allocated to such Affiliated Sub-Adviser(s).
The Adviser has contractually agreed, through at least June 30, 2016, to waive advisory fees and/or reimburse expenses to the extent necessary to limit total annual fund operating expenses and/or reimbursement (excluding certain items discussed below) of Class A, Class B, Class C, Class R, Class Y and Class R6 shares to 2.00%, 2.75%, 2.75%, 2.25%, 1.75% and 1.75% of average daily net assets, respectively. In determining the Adviser’s obligation to waive advisory fees and/or reimburse expenses, the following expenses are not taken into account, and could cause the net annual fund operating expenses and/or reimbursement to exceed the numbers reflected above: (1) interest; (2) taxes; (3) dividend expense on short sales; (4) extraordinary or non-routine items, including litigation expenses; and (5) expenses that the Fund has incurred but did not actually pay because of an expense offset arrangement. Unless Invesco continues the fee waiver agreement, it will terminate on June 30, 2016. The fee waiver agreement cannot be terminated during its term. The Adviser did not waive fees and/or reimburse expenses during the period under this expense limitation.
Further, the Adviser has contractually agreed, through at least June 30, 2017, to waive the advisory fee payable by the Fund in an amount equal to 100% of the net advisory fees the Adviser receives from the affiliated money market funds on investments by the Fund of uninvested cash in such affiliated money market funds.
For the year ended August 31, 2015, the Adviser waived advisory fees of $98,173.
The Trust has entered into a master administrative services agreement with Invesco pursuant to which the Fund has agreed to pay Invesco for certain administrative costs incurred in providing accounting services to the Fund. For the year ended August 31, 2015, expenses incurred under the agreement are shown in the Statement of Operations as Administrative services fees.
The Trust has entered into a transfer agency and service agreement with Invesco Investment Services, Inc. (“IIS”) pursuant to which the Fund has agreed to pay IIS a fee for providing transfer agency and shareholder services to the Fund and reimburse IIS for certain expenses incurred by IIS in the course of providing such services. IIS may make payments to intermediaries that provide omnibus account services, sub-accounting services and/or networking services. All fees payable by IIS to intermediaries that provide omnibus account services or sub-accounting are charged back to the Fund, subject to certain limitations approved by the Trust’s Board of Trustees. For the year ended August 31, 2015, expenses incurred under the agreement are shown in the Statement of Operations as Transfer agent fees.
Shares of the Fund are distributed by Invesco Distributors, Inc. (“IDI”), an affiliate of the Adviser. The Fund has adopted a Plan of Distribution (the “Plan”) pursuant to Rule 12b-1 under the 1940 Act. The Plan provides that the Fund will reimburse IDI for distribution related expenses that IDI incurs up to a maximum of the following annual rates: (1) Class A — up to 0.25% of the average daily net assets of Class A shares; (2) Class B — up to 1.00% of the average daily net assets of Class B shares; (3) Class C — up to 1.00% of the average daily net assets of Class C shares; and (4) Class R — up to 0.50% of the average daily net assets of Class R shares.
In the case of Class B shares, provided that the Plan continues in effect, any cumulative expenses incurred by IDI, but not yet reimbursed to IDI, may be recovered through the payment of future distribution fees from the Fund pursuant to the Plan and contingent deferred sales charges paid by investors upon redemption of Class B shares.
For the year ended August 31, 2015, expenses incurred under these agreements are shown in the Statement of Operations as Distribution fees.
Front-end sales commissions and CDSC (collectively, the “sales charges”) are not recorded as expenses of the Fund. Front-end sales commissions are deducted from proceeds from the sales of Fund shares prior to investment in Class A shares of the Fund. CDSC are deducted from redemption proceeds prior to remittance to the shareholder. During the year ended August 31, 2015, IDI advised the Fund that IDI retained $730,433 in front-end sales commissions from the sale of Class A shares and $16,682, $5,567 and $85,303 from Class A, Class B and Class C shares, respectively, for CDSC imposed on redemptions by shareholders.
Certain officers and trustees of the Trust are officers and directors of the Adviser, IIS and/or IDI.
NOTE 3—Additional Valuation Information
GAAP defines fair value as the price that would be received to sell an asset or paid to transfer a liability in an orderly transaction between market participants at the measurement date, under current market conditions. GAAP establishes a hierarchy that prioritizes the inputs to valuation methods, giving the highest priority to readily available unadjusted quoted prices in an active market for identical assets (Level 1) and the lowest priority to significant unobservable inputs (Level 3), generally when market prices are not readily available or are unreliable. Based on the valuation inputs, the securities or other investments are tiered into one of three levels. Changes in valuation methods may result in transfers in or out of an investment’s assigned level:
| Level 1 — | Prices are determined using quoted prices in an active market for identical assets. |
| Level 2 — | Prices are determined using other significant observable inputs. Observable inputs are inputs that other market participants may use in pricing a security. These may include quoted prices for similar securities, interest rates, prepayment speeds, credit risk, yield curves, loss severities, default rates, discount rates, volatilities and others. |
| Level 3 — | Prices are determined using significant unobservable inputs. In situations where quoted prices or observable inputs are unavailable (for example, when there is little or no market activity for an investment at the end of the period), unobservable inputs may be used. Unobservable inputs reflect the Fund’s own assumptions about the factors market participants would use in determining fair value of the securities or instruments and would be based on the best available information. |
22 Invesco Equally-Weighted S&P 500 Fund
The following is a summary of the tiered valuation input levels, as of August 31, 2015. The level assigned to the securities valuations may not be an indication of the risk or liquidity associated with investing in those securities. Because of the inherent uncertainties of valuation, the values reflected in the financial statements may materially differ from the value received upon actual sale of those investments.
| Level 1 | Level 2 | Level 3 | Total | |||||||||||||
Equity Securities | $ | 4,730,597,464 | $ | — | $ | — | $ | 4,730,597,464 | ||||||||
Futures Contracts* | (3,514,840 | ) | — | — | (3,514,840 | ) | ||||||||||
Total Investments | $ | 4,727,082,624 | $ | — | $ | — | $ | 4,727,082,624 | ||||||||
| * | Unrealized appreciation (depreciation). |
NOTE 4—Derivative Investments
Value of Derivative Investments at Period-End
The table below summarizes the value of the Fund’s derivative investments, detailed by primary risk exposure, held as of August 31, 2015:
| Value | ||||||||
| Risk Exposure/Derivative Type | Assets | Liabilities | ||||||
Equity risk: | ||||||||
Futures contracts(a) | $ | — | $ | (3,514,840 | ) | |||
| (a) | Includes cumulative appreciation (depreciation) of futures contracts. Only current day’s variation margin receivable (payable) is reported within the Statement of Assets and Liabilities. |
Effect of Derivative Investments for the year ended August 31, 2015
The table below summarizes the gains (losses) on derivative investments, detailed by primary risk exposure, recognized in earnings during the period:
| Location of Gain (Loss) on Statement of Operations | ||||
| Futures Contracts | ||||
Realized Gain (Loss): | ||||
Equity Risk | $ | (5,515,889 | ) | |
Change in Net Unrealized Appreciation (Depreciation): | ||||
Equity Risk | (3,546,207 | ) | ||
Total | $ | (9,062,096 | ) | |
The table below summarizes the average notional value of futures contracts outstanding during the period.
| Futures Contracts | ||||
Average notional value | $ | 58,144,714 | ||
| Open Futures Contracts — Equity Risk | ||||||||||||||||||||
| Futures Contracts | Type of Contract | Number of Contracts | Expiration Month | Notional Value | Unrealized Appreciation (Depreciation) | |||||||||||||||
E-Mini S&P 500 Index | Long | 713 | September-2015 | $ | 70,201,980 | $ | (3,514,840 | ) | ||||||||||||
NOTE 5—Investments in Affiliates
The Fund’s Adviser is a subsidiary of Invesco Ltd. and therefore, Invesco Ltd. is considered to be affiliated with the Fund. The following is a summary of the transactions in, and earnings from, investments in Invesco Ltd. for the year ended August 31, 2015.
Value 08/31/14 | Purchases at Cost | Proceeds from Sales | Change in Unrealized Appreciation (Depreciation) | Realized Gain | Value 08/31/15 | Dividend Income | ||||||||||||||||||||||
Invesco Ltd. | $ | 6,217,400 | $ | 4,495,760 | $ | (565,450 | ) | $ | (1,543,766 | ) | $ | 17,631 | $ | 8,621,575 | $ | 225,334 | ||||||||||||
NOTE 6—Expense Offset Arrangement(s)
The expense offset arrangement is comprised of transfer agency credits which result from balances in demand deposit accounts used by the transfer agent for clearing shareholder transactions. For the year ended August 31, 2015, the Fund received credits from this arrangement, which resulted in the reduction of the Fund’s total expenses of $2,189.
23 Invesco Equally-Weighted S&P 500 Fund
NOTE 7—Trustees’ and Officers’ Fees and Benefits
Trustees’ and Officers’ Fees and Benefits include amounts accrued by the Fund to pay remuneration to certain Trustees and Officers of the Fund. Trustees have the option to defer compensation payable by the Fund, and Trustees’ and Officers’ Fees and Benefits also include amounts accrued by the Fund to fund such deferred compensation amounts. Those Trustees who defer compensation have the option to select various Invesco Funds in which their deferral accounts shall be deemed to be invested. Finally, certain current Trustees were eligible to participate in a retirement plan that provided for benefits to be paid upon retirement to Trustees over a period of time based on the number of years of service. The Fund may have certain former Trustees who also participate in a retirement plan and receive benefits under such plan. Trustees’ and Officers’ Fees and Benefits include amounts accrued by the Fund to fund such retirement benefits. Obligations under the deferred compensation and retirement plans represent unsecured claims against the general assets of the Fund.
NOTE 8—Cash Balances
The Fund is permitted to temporarily carry a negative or overdrawn balance in its account with State Street Bank and Trust Company, the custodian bank. Such balances, if any at period end, are shown in the Statement of Assets and Liabilities under the payable caption Amount due custodian. To compensate the custodian bank for such overdrafts, the overdrawn Fund may either (1) leave funds as a compensating balance in the account so the custodian bank can be compensated by earning the additional interest; or (2) compensate by paying the custodian bank at a rate agreed upon by the custodian bank and Invesco, not to exceed the contractually agreed upon rate.
NOTE 9—Distributions to Shareholders and Tax Components of Net Assets
Tax Character of Distributions to Shareholders Paid During the Fiscal Years Ended August 31, 2015 and 2014:
| 2015 | 2014 | |||||||
Ordinary income | $ | 59,449,974 | $ | 39,735,545 | ||||
Long-term capital gain | 29,608,828 | 32,323,639 | ||||||
Total distributions | $ | 89,058,802 | $ | 72,059,184 | ||||
Tax Components of Net Assets at Period-End:
| 2015 | ||||
Undistributed ordinary income | $ | 58,419,524 | ||
Undistributed long-term gain | 26,190,535 | |||
Net unrealized appreciation — investments | 926,562,110 | |||
Temporary book/tax differences | (204,246 | ) | ||
Shares of beneficial interest | 3,752,568,203 | |||
Total net assets | $ | 4,763,536,126 | ||
The difference between book-basis and tax-basis unrealized appreciation (depreciation) is due to differences in the timing of recognition of gains and losses on investments for tax and book purposes. The Fund’s net unrealized appreciation difference is attributable primarily to wash sales.
The temporary book/tax differences are a result of timing differences between book and tax recognition of income and/or expenses. The Fund’s temporary book/tax differences are the result of the trustee deferral of compensation and retirement plan benefits.
Capital loss carryforward is calculated and reported as of a specific date. Results of transactions and other activity after that date may affect the amount of capital loss carryforward actually available for the Fund to utilize. Capital losses generated in years beginning after December 22, 2010 can be carried forward for an unlimited period, whereas previous losses expire in eight tax years. Capital losses with an expiration period may not be used to offset capital gains until all net capital losses without an expiration date have been utilized. Capital loss carryforwards with no expiration date will retain their character as either short-term or long-term capital losses instead of as short-term capital losses as under prior law. The ability to utilize capital loss carryforwards in the future may be limited under the Internal Revenue Code and related regulations based on the results of future transactions.
The Fund does not have a capital loss carryforward as of August 31, 2015.
NOTE 10—Investment Securities
The aggregate amount of investment securities (other than short-term securities, U.S. Treasury obligations and money market funds, if any) purchased and sold by the Fund during the year ended August 31, 2015 was $2,764,595,754 and $878,894,415, respectively. Cost of investments on a tax basis includes the adjustments for financial reporting purposes as of the most recently completed federal income tax reporting period-end.
| Unrealized Appreciation (Depreciation) of Investment Securities on a Tax Basis | ||||
Aggregate unrealized appreciation of investment securities | $ | 1,087,015,413 | ||
Aggregate unrealized (depreciation) of investment securities | (160,453,303 | ) | ||
Net unrealized appreciation of investment securities | $ | 926,562,110 | ||
Cost of investments for tax purposes is $3,804,035,354.
24 Invesco Equally-Weighted S&P 500 Fund
NOTE 11—Reclassification of Permanent Differences
Primarily as a result of differing book/tax treatment of prior year return of capital reversal and fair fund adjustment, on August 31, 2015, undistributed net investment income was increased by $51,467, undistributed net realized gain was decreased by $15,443 and shares of beneficial interest was decreased by $36,024. This reclassification had no effect on the net assets of the Fund.
NOTE 12—Share Information
| Summary of Share Activity | ||||||||||||||||
| Years ended August 31, | ||||||||||||||||
| 2015(a) | 2014 | |||||||||||||||
| Shares | Amount | Shares | Amount | |||||||||||||
Sold: | ||||||||||||||||
Class A | 16,005,691 | $ | 784,165,212 | 11,111,178 | $ | 497,003,093 | ||||||||||
Class B | 34,912 | 1,702,372 | 36,745 | 1,631,827 | ||||||||||||
Class C | 10,580,817 | 499,514,855 | 4,539,053 | 196,758,364 | ||||||||||||
Class R | 1,121,093 | 54,845,808 | 908,413 | 40,579,106 | ||||||||||||
Class Y | 30,177,325 | 1,486,812,841 | 11,606,461 | 529,732,277 | ||||||||||||
Class R6 | 4,487,464 | 224,884,801 | 25,789 | 1,182,670 | ||||||||||||
Issued as reinvestment of dividends: | ||||||||||||||||
Class A | 738,018 | 34,922,997 | 886,321 | 37,385,013 | ||||||||||||
Class B | 5,237 | 247,497 | 14,292 | 603,698 | ||||||||||||
Class C | 181,392 | 8,289,654 | 141,126 | 5,767,810 | ||||||||||||
Class R | 34,670 | 1,635,742 | 30,735 | 1,293,625 | ||||||||||||
Class Y | 615,826 | 29,356,434 | 453,253 | 19,245,106 | ||||||||||||
Class R6 | 84,454 | 4,027,614 | — | — | ||||||||||||
Automatic conversion of Class B shares to Class A shares: | ||||||||||||||||
Class A | 117,662 | 5,790,549 | 230,621 | 10,198,764 | ||||||||||||
Class B | (118,138 | ) | (5,790,549 | ) | (230,900 | ) | (10,198,764 | ) | ||||||||
Reacquired: | ||||||||||||||||
Class A | (9,723,008 | ) | (474,204,564 | ) | (6,140,632 | ) | (278,307,130 | ) | ||||||||
Class B | (57,629 | ) | (2,783,141 | ) | (65,314 | ) | (2,918,671 | ) | ||||||||
Class C | (1,560,796 | ) | (73,671,605 | ) | (868,921 | ) | (37,618,045 | ) | ||||||||
Class R | (595,599 | ) | (29,079,791 | ) | (312,777 | ) | (14,030,661 | ) | ||||||||
Class Y | (10,517,430 | ) | (519,256,756 | ) | (3,134,890 | ) | (142,042,597 | ) | ||||||||
Class R6 | (824,237 | ) | (40,583,002 | ) | (493 | ) | (23,123 | ) | ||||||||
Net increase in share activity | 40,787,724 | $ | 1,990,826,968 | 19,230,060 | $ | 856,242,362 | ||||||||||
| (a) | There are entities that are record owners of more than 5% of the outstanding shares of the Fund and in the aggregate own 46% of the outstanding shares of the Fund. IDI has an agreement with these entities to sell Fund shares. The Fund, Invesco and/or Invesco affiliates may make payments to these entities, which are considered to be related to the Fund, for providing services to the Fund, Invesco and/or Invesco affiliates including but not limited to services such as securities brokerage, distribution, third party record keeping and account servicing. The Fund has no knowledge as to whether all or any portion of the shares owned of record by these entities are also owned beneficially. |
| On October 16, 2015, a total of 3,109,979 Class R6 shares of the Fund valued at $149,863,711 were redeemed by a significant shareholder and settled through a redemption-in-kind transaction. |
25 Invesco Equally-Weighted S&P 500 Fund
NOTE 13—Financial Highlights
The following schedule presents financial highlights for a share of the Fund outstanding throughout the periods indicated.
| Net asset value, beginning of period | Net investment income(a) | Net gains (losses) on securities (both realized and unrealized) | Total from investment operations | Dividends from net investment income | Distributions from net realized gains | Total distributions | Net asset value, end of period | Total return(b) | Net assets, end of period (000’s omitted) | Ratio of expenses to average net assets with fee waivers and/or expenses absorbed | Ratio of expenses to average net assets without fee waivers and/or expenses absorbed | Ratio of net investment income to average net assets | Portfolio turnover(c) | |||||||||||||||||||||||||||||||||||||||||||
Class A | ||||||||||||||||||||||||||||||||||||||||||||||||||||||||
Year ended 08/31/15 | $ | 48.54 | $ | 0.67 | $ | (1.18 | ) | $ | (0.51 | ) | $ | (0.49 | ) | $ | (0.67 | ) | $ | (1.16 | ) | $ | 46.87 | (1.07 | )% | $ | 1,789,491 | 0.54 | %(d) | 0.54 | %(d) | 1.36 | %(d) | 21 | % | |||||||||||||||||||||||
Year ended 08/31/14 | 40.07 | 0.59 | 9.45 | 10.04 | (0.48 | ) | (1.09 | ) | (1.57 | ) | 48.54 | 25.64 | 1,506,665 | 0.56 | 0.56 | 1.31 | 17 | |||||||||||||||||||||||||||||||||||||||
Year ended 08/31/13 | 33.40 | 0.55 | 7.47 | 8.02 | (0.51 | ) | (0.84 | ) | (1.35 | ) | 40.07 | 24.83 | 999,730 | 0.57 | 0.57 | 1.48 | 18 | |||||||||||||||||||||||||||||||||||||||
Year ended 08/31/12 | 29.89 | 0.42 | 3.61 | 4.03 | (0.52 | ) | — | (0.52 | ) | 33.40 | 13.66 | 730,648 | 0.60 | 0.60 | 1.34 | 27 | ||||||||||||||||||||||||||||||||||||||||
Year ended 08/31/11 | 25.26 | 0.39 | 4.65 | 5.04 | (0.41 | ) | — | (0.41 | ) | 29.89 | 19.91 | 639,478 | 0.56 | 0.56 | 1.26 | 22 | ||||||||||||||||||||||||||||||||||||||||
Class B | ||||||||||||||||||||||||||||||||||||||||||||||||||||||||
Year ended 08/31/15 | 48.35 | 0.30 | (1.16 | ) | (0.86 | ) | (0.26 | ) | (0.67 | ) | (0.93 | ) | 46.56 | (1.81 | ) | 8,950 | 1.29 | (d) | 1.29 | (d) | 0.61 | (d) | 21 | |||||||||||||||||||||||||||||||||
Year ended 08/31/14 | 40.01 | 0.25 | 9.44 | 9.69 | (0.26 | ) | (1.09 | ) | (1.35 | ) | 48.35 | 24.70 | 15,851 | 1.31 | 1.31 | 0.56 | 17 | |||||||||||||||||||||||||||||||||||||||
Year ended 08/31/13 | 33.34 | 0.27 | 7.49 | 7.76 | (0.25 | ) | (0.84 | ) | (1.09 | ) | 40.01 | 23.90 | 22,925 | 1.32 | 1.32 | 0.73 | 18 | |||||||||||||||||||||||||||||||||||||||
Year ended 08/31/12 | 29.70 | 0.18 | 3.61 | 3.79 | (0.15 | ) | — | (0.15 | ) | 33.34 | 12.82 | 42,131 | 1.35 | 1.35 | 0.59 | 27 | ||||||||||||||||||||||||||||||||||||||||
Year ended 08/31/11 | 25.05 | 0.16 | 4.60 | 4.76 | (0.11 | ) | — | (0.11 | ) | 29.70 | 18.98 | 77,702 | 1.31 | 1.31 | 0.51 | 22 | ||||||||||||||||||||||||||||||||||||||||
Class C | ||||||||||||||||||||||||||||||||||||||||||||||||||||||||
Year ended 08/31/15 | 46.79 | 0.29 | (1.12 | ) | (0.83 | ) | (0.26 | ) | (0.67 | ) | (0.93 | ) | 45.03 | (1.81 | ) | 750,898 | 1.29 | (d) | 1.29 | (d) | 0.61 | (d) | 21 | |||||||||||||||||||||||||||||||||
Year ended 08/31/14 | 38.75 | 0.25 | 9.14 | 9.39 | (0.26 | ) | (1.09 | ) | (1.35 | ) | 46.79 | 24.73 | 349,739 | 1.31 | 1.31 | 0.56 | 17 | |||||||||||||||||||||||||||||||||||||||
Year ended 08/31/13 | 32.33 | 0.26 | 7.24 | 7.50 | (0.24 | ) | (0.84 | ) | (1.08 | ) | 38.75 | 23.88 | 141,986 | 1.32 | 1.32 | 0.73 | 18 | |||||||||||||||||||||||||||||||||||||||
Year ended 08/31/12 | 28.81 | 0.18 | 3.49 | 3.67 | (0.15 | ) | — | (0.15 | ) | 32.33 | 12.80 | 77,691 | 1.35 | 1.35 | 0.59 | 27 | ||||||||||||||||||||||||||||||||||||||||
Year ended 08/31/11 | 24.29 | 0.16 | 4.47 | 4.63 | (0.11 | ) | — | (0.11 | ) | 28.81 | 19.04 | 67,788 | 1.31 | 1.31 | 0.51 | 22 | ||||||||||||||||||||||||||||||||||||||||
Class R | ||||||||||||||||||||||||||||||||||||||||||||||||||||||||
Year ended 08/31/15 | 48.36 | 0.54 | (1.17 | ) | (0.63 | ) | (0.41 | ) | (0.67 | ) | (1.08 | ) | 46.65 | (1.33 | ) | 89,588 | 0.79 | (d) | 0.79 | (d) | 1.11 | (d) | 21 | |||||||||||||||||||||||||||||||||
Year ended 08/31/14 | 39.95 | 0.48 | 9.43 | 9.91 | (0.41 | ) | (1.09 | ) | (1.50 | ) | 48.36 | 25.35 | 65,777 | 0.81 | 0.81 | 1.06 | 17 | |||||||||||||||||||||||||||||||||||||||
Year ended 08/31/13 | 33.31 | 0.46 | 7.44 | 7.90 | (0.42 | ) | (0.84 | ) | (1.26 | ) | 39.95 | 24.48 | 29,320 | 0.82 | 0.82 | 1.23 | 18 | |||||||||||||||||||||||||||||||||||||||
Year ended 08/31/12 | 29.77 | 0.35 | 3.59 | 3.94 | (0.40 | ) | — | (0.40 | ) | 33.31 | 13.36 | 8,924 | 0.85 | 0.85 | 1.09 | 27 | ||||||||||||||||||||||||||||||||||||||||
Year ended 08/31/11 | 25.14 | 0.31 | 4.63 | 4.94 | (0.31 | ) | — | (0.31 | ) | 29.77 | 19.62 | 1,176 | 0.81 | 0.81 | 1.01 | 22 | ||||||||||||||||||||||||||||||||||||||||
Class Y | ||||||||||||||||||||||||||||||||||||||||||||||||||||||||
Year ended 08/31/15 | 48.95 | 0.80 | (1.19 | ) | (0.39 | ) | (0.59 | ) | (0.67 | ) | (1.26 | ) | 47.30 | (0.83 | ) | 1,945,879 | 0.29 | (d) | 0.29 | (d) | 1.61 | (d) | 21 | |||||||||||||||||||||||||||||||||
Year ended 08/31/14 | 40.38 | 0.71 | 9.52 | 10.23 | (0.57 | ) | (1.09 | ) | (1.66 | ) | 48.95 | 25.95 | 1,021,247 | 0.31 | 0.31 | 1.56 | 17 | |||||||||||||||||||||||||||||||||||||||
Year ended 08/31/13 | 33.64 | 0.65 | 7.52 | 8.17 | (0.59 | ) | (0.84 | ) | (1.43 | ) | 40.38 | 25.16 | 481,948 | 0.32 | 0.32 | 1.73 | 18 | |||||||||||||||||||||||||||||||||||||||
Year ended 08/31/12 | 30.13 | 0.50 | 3.63 | 4.13 | (0.62 | ) | — | (0.62 | ) | 33.64 | 13.94 | 309,645 | 0.35 | 0.35 | 1.59 | 27 | ||||||||||||||||||||||||||||||||||||||||
Year ended 08/31/11 | 25.47 | 0.47 | 4.68 | 5.15 | (0.49 | ) | — | (0.49 | ) | 30.13 | 20.19 | 178,056 | 0.31 | 0.31 | 1.51 | 22 | ||||||||||||||||||||||||||||||||||||||||
Class R6 | ||||||||||||||||||||||||||||||||||||||||||||||||||||||||
Year ended 08/31/15 | 48.99 | 0.87 | (1.20 | ) | (0.33 | ) | (0.62 | ) | (0.67 | ) | (1.29 | ) | 47.37 | (0.70 | ) | 178,731 | 0.16 | (d) | 0.16 | (d) | 1.74 | (d) | 21 | |||||||||||||||||||||||||||||||||
Year ended 08/31/14 | 40.39 | 0.78 | 9.49 | 10.27 | (0.58 | ) | (1.09 | ) | (1.67 | ) | 48.99 | 26.05 | 1,253 | 0.22 | 0.22 | 1.65 | 17 | |||||||||||||||||||||||||||||||||||||||
Year ended 08/31/13(e) | 34.93 | 0.62 | 6.27 | 6.89 | (0.59 | ) | (0.84 | ) | (1.43 | ) | 40.39 | 20.58 | 12 | 0.27 | (f) | 0.27 | (f) | 1.78 | (f) | 18 | ||||||||||||||||||||||||||||||||||||
| (a) | Calculated using average shares outstanding. |
| (b) | Includes adjustments in accordance with accounting principles generally accepted in the United States of America and as such, the net asset value for financial reporting purposes and the returns based upon those net asset values may differ from the net asset value and returns for shareholder transactions. Does not include sales charges and is not annualized for periods less than one year, if applicable. |
| (c) | Portfolio turnover is calculated at the fund level and is not annualized for periods less than one year, if applicable. |
| (d) | Ratios are based on average daily net assets (000’s omitted) of $1,781,509, $12,876, $586,026, $82,536, $1,638,525 and $133,100 for Class A, Class B, Class C, Class R, Class Y and Class R6 shares, respectively. |
| (e) | Commencement date of September 24, 2012. |
| (f) | Annualized. |
26 Invesco Equally-Weighted S&P 500 Fund
Report of Independent Registered Public Accounting Firm
To the Board of Trustees of AIM Counselor Series Trust (Invesco Counselor Series Trust)
and Shareholders of Invesco Equally-Weighted S&P 500 Fund:
In our opinion, the accompanying statement of assets and liabilities, including the schedule of investments, and the related statements of operations and of changes in net assets and the financial highlights present fairly, in all material respects, the financial position of Invesco Equally-Weighted S&P 500 Fund (one of the funds constituting AIM Counselor Series Trust (Invesco Counselor Series Trust), hereafter referred to as the “Fund”) at August 31, 2015, the results of its operations for the year then ended, the changes in its net assets for each of the two years in the period then ended and the financial highlights for each of the five years in the period then ended, in conformity with accounting principles generally accepted in the United States of America. These financial statements and financial highlights (hereafter referred to as “financial statements”) are the responsibility of the Fund’s management. Our responsibility is to express an opinion on these financial statements based on our audits. We conducted our audits of these financial statements in accordance with the standards of the Public Company Accounting Oversight Board (United States). Those standards require that we plan and perform the audit to obtain reasonable assurance about whether the financial statements are free of material misstatement. An audit includes examining, on a test basis, evidence supporting the amounts and disclosures in the financial statements, assessing the accounting principles used and significant estimates made by management, and evaluating the overall financial statement presentation. We believe that our audits, which included confirmation of securities at August 31, 2015 by correspondence with the custodian and brokers, and the application of alternative auditing procedures where confirmations of security purchases have not been received, provide a reasonable basis for our opinion.
PRICEWATERHOUSECOOPERS LLP
October 27, 2015
Houston, Texas
27 Invesco Equally-Weighted S&P 500 Fund
Calculating your ongoing Fund expenses
Example
As a shareholder of the Fund, you incur two types of costs: (1) transaction costs, which may include sales charges (loads) on purchase payments or contingent deferred sales charges on redemptions, if any; and (2) ongoing costs, including management fees, distribution and/or service (12b-1) fees, and other Fund expenses. This example is intended to help you understand your ongoing costs (in dollars) of investing in the Fund and to compare these costs with ongoing costs of investing in other mutual funds. The example is based on an investment of $1,000 invested at the beginning of the period and held for the entire period March 1, 2015 through August 31, 2015.
Actual expenses
The table below provides information about actual account values and actual expenses. You may use the information in this table, together with the amount you invested, to estimate the expenses that you paid over the period. Simply divide your account value by $1,000 (for example, an $8,600 account value divided by $1,000 = 8.6), then multiply the result by the number in the table under the heading entitled “Actual Expenses Paid During Period” to estimate the expenses you paid on your account during this period.
Hypothetical example for comparison purposes
The table below also provides information about hypothetical account values and hypothetical expenses based on the Fund’s actual expense ratio and an assumed rate of return of 5% per year before expenses, which is not the Fund’s actual return.
The hypothetical account values and expenses may not be used to estimate the actual ending account balance or expenses you paid for the period. You may use this information to compare the ongoing costs of investing in the Fund and other funds. To do so, compare this 5% hypothetical example with the 5% hypothetical examples that appear in the shareholder reports of the other funds.
Please note that the expenses shown in the table are meant to highlight your ongoing costs only and do not reflect any transaction costs, such as sales charges (loads) on purchase payments or contingent deferred sales charges on redemptions, if any. Therefore, the hypothetical information is useful in comparing ongoing costs only, and will not help you determine the relative total costs of owning different funds. In addition, if these transaction costs were included, your costs would have been higher.
| Class | Beginning Account Value (03/01/15) | ACTUAL | HYPOTHETICAL (5% annual return before | Annualized Expense Ratio | ||||||||||||||||||||
| Ending Account Value (08/31/15)1 | Expenses Paid During Period2 | Ending Account Value (08/31/15) | Expenses Paid During Period2 | |||||||||||||||||||||
| A | $ | 1,000.00 | $ | 933.50 | $ | 2.58 | $ | 1,022.53 | $ | 2.70 | 0.53 | % | ||||||||||||
| B | 1,000.00 | 930.10 | 6.23 | 1,018.75 | 6.51 | 1.28 | ||||||||||||||||||
| C | 1,000.00 | 930.20 | 6.23 | 1,018.75 | 6.51 | 1.28 | ||||||||||||||||||
| R | 1,000.00 | 932.40 | 3.80 | 1,021.27 | 3.97 | 0.78 | ||||||||||||||||||
| Y | 1,000.00 | 934.60 | 1.37 | 1,023.79 | 1.43 | 0.28 | ||||||||||||||||||
| R6 | 1,000.00 | 935.40 | 0.78 | 1,024.40 | 0.82 | 0.16 | ||||||||||||||||||
| 1 | The actual ending account value is based on the actual total return of the Fund for the period March 1, 2015 through August 31, 2015, after actual expenses and will differ from the hypothetical ending account value which is based on the Fund’s expense ratio and a hypothetical annual return of 5% before expenses. |
| 2 | Expenses are equal to the Fund’s annualized expense ratio as indicated above multiplied by the average account value over the period, multiplied by 184/365 to reflect the most recent fiscal half year. |
28 Invesco Equally-Weighted S&P 500 Fund
Approval of Investment Advisory and Sub-Advisory Contracts
The Board of Trustees (the Board) of AIM Counselor Series Trust (Invesco Counselor Series Trust) is required under the Investment Company Act of 1940, as amended, to approve annually the renewal of Invesco Equally-Weighted S&P 500 Fund’s (the Fund) investment advisory agreements. During contract renewal meetings held on June 9-10, 2015, the Board as a whole, and the disinterested or “independent” Trustees, who comprise over 75% of the Board, voting separately, approved the continuance for the Fund of the Master Investment Advisory Agreement with Invesco Advisers, Inc. (Invesco Advisers and the investment advisory agreement) and the Master Intergroup Sub-Advisory Contract for Mutual Funds with Invesco Asset Management Deutschland GmbH, Invesco Asset Management Limited, Invesco Asset Management (Japan) Limited, Invesco Hong Kong Limited, Invesco Senior Secured Management, Inc. and Invesco Canada Ltd. (collectively, the Affiliated Sub-Advisers and the sub-advisory contracts) for another year, effective July 1, 2015.
In evaluating the fairness and reasonableness of compensation under the Fund’s investment advisory agreement and sub-advisory contracts, the Board considered, among other things, the factors discussed below. The Board determined that continuation of the Fund’s investment advisory agreement and the sub-advisory contracts is in the best interest of the Fund and its shareholders and that the compensation payable to Invesco Advisers and the Affiliated Sub-Advisers under the agreements is fair and reasonable.
The Board’s Fund Evaluation Process
The Board’s Investments Committee has established three Sub-Committees, each of which is primarily responsible for overseeing the performance and investment management services provided by Invesco Advisers and the Affiliated Sub-Advisers to a number of the funds advised by Invesco Advisers (the Invesco Funds). The Sub-Committees meet throughout the year to review the performance of their assigned Invesco Funds, including reviewing materials prepared under the direction of the independent Senior Officer, an officer of the Invesco Funds who reports directly to the independent Trustees. Over the course of each year, the Sub-Committees meet with portfolio managers for their assigned Invesco Funds and other members of management to review the performance, investment objective(s), policies, strategies, limitations and investment risks of these funds. The Board had the benefit of reports from the Sub-Committees and Investments Committee throughout the year in considering approval of the continuance of each Invesco Fund’s investment advisory agreement and sub-advisory contracts for another year.
During the contract renewal process, the Board receives comparative performance and fee data regarding the Invesco Funds prepared by Invesco Advisers and Lipper Inc. (Lipper), an independent provider of investment company data. The Board also receives a report and this independent written evaluation from the Senior Officer. The Senior Officer’s evaluation is prepared as part of his responsibility to manage the process by which the Invesco Funds’ proposed management fees are negotiated during the annual contract renewal process to ensure they are negotiated in a manner that is at arms’ length and reasonable. In addition to meetings with Invesco Advisers and fund counsel, the independent Trustees also discuss the continuance of the investment advisory agreement and sub-advisory contracts in separate sessions with the Senior Officer and with independent legal counsel.
The Trustees recognized that the advisory fee rates for the Invesco Funds are, in many cases, the result of years of review and negotiation. The Trustees’ deliberations and conclusions in a particular year may be based in part on their deliberations and conclusions regarding these arrangements throughout the year and in prior years. The Trustees’ review and conclusions are based on the comprehensive consideration of all information presented to them and are not the result of any single determinative factor. Moreover, one Trustee may have weighed a particular piece of information or factor differently than another Trustee.
The discussion below is a summary of the Senior Officer’s independent written evaluation with respect to the Fund’s investment advisory agreement as well as a discussion of the material factors and related conclusions that formed the basis for the Board’s approval of the Fund’s investment advisory agreement and sub-advisory contracts. Unless otherwise stated, this information is current as of June 10, 2015, and does not reflect consideration of factors that became known to the Board after that date.
Factors and Conclusions and Summary of Independent Written Fee Evaluation
| A. | Nature, Extent and Quality of Services Provided by Invesco Advisers and the Affiliated Sub-Advisers |
The Board reviewed the advisory services provided to the Fund by Invesco Advisers under the Fund’s investment advisory agreement, the performance of Invesco Advisers in providing these services, and the credentials and experience of the officers and employees of Invesco Advisers who provide these services, including the Fund’s portfolio manager or managers. The Board’s review of the qualifications of Invesco Advisers to provide advisory services included the Board’s consideration of Invesco Advisers’ investment
process oversight, independent credit analysis and investment risk management. The Board also considered non-advisory services that Invesco Advisers and its affiliates provide to the Invesco Funds such as various back office support functions, equity and fixed income trading operations, internal audit, distribution, valuation and legal and compliance.
In determining whether to continue the Fund’s investment advisory agreement, the Board considered the benefits of reapproving an existing relationship and the greater uncertainty that may be associated with entering into a new relationship. The Board concluded that the nature, extent and quality of the services provided to the Fund by Invesco Advisers are appropriate and satisfactory and consistent with the terms of the Fund’s investment advisory agreement.
The Board reviewed the services that may be provided by the Affiliated Sub-Advisers under the sub-advisory contracts and the credentials and experience of the officers and employees of the Affiliated Sub-Advisers who provide these services. The Board noted that the Affiliated Sub-Advisers have offices and personnel that are located in financial centers around the world. As a result, the Affiliated Sub-Advisers can provide research and investment analysis on the markets and economies of various countries in which the Fund may invest, make recommendations regarding securities and assist with security trades. The Board concluded that the sub-advisory contracts benefit the Fund and its shareholders by permitting Invesco Advisers to use the resources and talents of the Affiliated Sub-Advisers in managing the Fund. The Board concluded that the nature, extent and quality of the services that may be provided by the Affiliated Sub-Advisers are appropriate and satisfactory and consistent with the terms of the Fund’s sub-advisory contracts.
| B. | Fund Performance |
The Board considered Fund performance as a relevant factor in considering whether to approve the investment advisory agreement. The Board did not view Fund performance as a relevant factor in considering whether to approve the sub-advisory contracts for the Fund, as no Affiliated Sub-Adviser currently manages assets of the Fund.
The Board compared the Fund’s performance during the past one, three and five calendar years to the performance of funds in the Lipper performance universe and against the Lipper Multi-Cap Core Funds Index. The Board noted that performance of Class A shares of the Fund was in the first quintile of its performance universe for the one, three and five year periods (the first quintile being the best performing funds and the fifth quintile being the worst performing funds). The Board noted that performance of Class A shares of the Fund was above the performance of the Index for the one,
29 Invesco Equally-Weighted S&P 500 Fund
three and five year periods. The Trustees also reviewed more recent Fund performance and this review did not change their conclusions.
| C. | Advisory and Sub-Advisory Fees |
The Board compared the Fund’s contractual management fee rate to the contractual management fee rates of funds in the Fund’s Lipper expense group at a common asset level. The Board noted that the contractual management fee rate for Class A shares of the Fund was below the median contractual management fee rate of funds in its expense group. The Board noted that the term “contractual management fee” may include both advisory and certain administrative services fees, but that Lipper does not provide information on a fund by fund basis as to what is included. The Board noted that Invesco Advisers does not charge the Invesco Funds for the administrative services included in the term as defined by Lipper. The Board also reviewed the methodology used by Lipper in providing expense group information, which includes using each fund’s contractual management fee schedule (including any applicable breakpoints) as reported in the most recent prospectus or statement of additional information for each fund in the expense group.
The Board also compared the Fund’s effective advisory fee rate (the advisory fee rate after advisory fee waivers and before other expense limitations/waivers) to the effective advisory fee rates of other mutual funds advised by Invesco Advisers and its affiliates with investment strategies comparable to those of the Fund. The Board noted that the Fund’s rate was below the rate of one such mutual fund.
The Board noted that Invesco Advisers and the Affiliated Sub-Advisers do not manage other client accounts with investment strategies comparable to those of the Fund.
The Board also considered the services that may be provided by the Affiliated Sub-Advisers pursuant to the sub-advisory contracts, as well as the fees payable by Invesco Advisers to the Affiliated Sub-Advisers pursuant to the sub-advisory contracts. The Board also noted that the sub-advisory fees are not paid directly by the Fund, but rather, are payable by Invesco Advisers to the Affiliated Sub-Advisers.
| D. | Economies of Scale and Breakpoints |
The Board considered the extent to which there are economies of scale in the provision of advisory services to the Fund. The Board also considered whether the Fund benefits from economies of scale through contractual breakpoints in the Fund’s advisory fee schedule. The Board also noted that the Fund shares directly in economies of scale through lower fees charged by third party service providers based on the combined size of the Invesco Funds and other clients advised by Invesco Advisers.
| E. | Profitability and Financial Resources |
The Board reviewed information from Invesco Advisers concerning the costs of the advisory and other services that Invesco Advisers and its affiliates provide to the Fund and the Invesco
Funds and the profitability of Invesco Advisers and its affiliates in providing these services. The Board received information from Invesco Advisers about the methodology used to prepare the profitability information. The Board noted that Invesco Advisers continues to operate at a net profit from services Invesco Advisers and its affiliates provide to the Invesco Funds . Invesco Advisers and its subsidiaries did not make a profit from managing the Fund. The Board received and accepted information from Invesco Advisers demonstrating that Invesco Advisers and each Affiliated Sub-Adviser are financially sound and have the resources necessary to perform their obligations under the investment advisory agreement and sub-advisory contracts.
| F. | Collateral Benefits to Invesco Advisers and its Affiliates |
The Board considered various other benefits received by Invesco Advisers and its affiliates from the relationship with the Fund, including the fees received for providing transfer agency and distribution services to the Fund. The Board considered comparative information regarding fees charged for these services, including information provided by Lipper and other independent sources. The Board considered the performance of Invesco Advisers and its affiliates in providing these services and the organizational structure employed to provide these services. The Board also considered that these services are provided to the Fund pursuant to written contracts that are reviewed and approved on an annual basis by the Board; and that the services are required for the operation of the Fund.
The Board considered the benefits realized by Invesco Advisers and the Affiliated Sub-Advisers as a result of portfolio brokerage transactions executed through “soft dollar” arrangements. The Board noted that soft dollar arrangements shift the payment obligation for research services from Invesco Advisers and the Affiliated Sub-Advisers to the Invesco Funds and that the research received may be used with other clients of Invesco Advisers and may reduce Invesco Advisers’ and the Affiliated Sub-Advisers’ expenses. The Board also considered that it receives periodic reports from the Chief Compliance Officer of the Invesco Funds demonstrating that these arrangements are consistent with regulatory requirements. The Board did not deem the soft dollar arrangements to be inappropriate.
The Board considered that the Fund’s uninvested cash and cash collateral from any securities lending arrangements may be invested in money market funds advised by Invesco Advisers pursuant to procedures approved by the Board. The Board noted that Invesco Advisers receives advisory fees from these affiliated money market funds attributable to such investments, although Invesco Advisers has contractually agreed to waive through varying periods the advisory fees payable by the Invesco Funds with respect to investments in the affiliated money market
funds. The waiver is in an amount equal to 100% of the net advisory fee Invesco Advisers receives from the affiliated money market funds with respect to the Fund’s investment in the affiliated money market funds of uninvested cash, but not cash collateral. The Board concluded that the amount of advisory fees received by Invesco Advisors from the Fund’s investment of cash collateral from any securities lending arrangements in the affiliated money market funds is fair and reasonable.
The Board also considered the Fund may use an affiliated broker to execute certain trades for the Fund to, among other things, control information leakage, and were advised that such trades would be executed in compliance with rules under the Investment Company Act of 1940, as amended, and consistent with best execution obligations.
30 Invesco Equally-Weighted S&P 500 Fund
Tax Information
Form 1099-DIV, Form 1042-S and other year–end tax information provide shareholders with actual calendar year amounts that should be included in their tax returns. Shareholders should consult their tax advisors.
The following distribution information is being provided as required by the Internal Revenue Code or to meet a specific state’s requirement.
The Fund designates the following amounts or, if subsequently determined to be different, the maximum amount allowable for its fiscal year ended August 31, 2015:
Federal and State Income Tax | ||||
Long-Term Capital Gain Distributions | $ | 29,608,828 | ||
Qualified Dividend Income* | 81.12 | % | ||
Corporate Dividends Received Deduction* | 75.90 | % | ||
U.S. Treasury Obligations* | 0 | % | ||
| * | The above percentages are based on ordinary income dividends paid to shareholders during the Fund’s fiscal year. |
Non-Resident Alien Shareholders | ||||
Qualified Short-Term Gains | $ | 21,404,716 | ||
31 Invesco Equally-Weighted S&P 500 Fund
Trustees and Officers
The address of each trustee and officer is AIM Counselor Series Trust (Invesco Counselor Series Trust) (the “Trust”), 11 Greenway Plaza, Suite 1000, Houston, Texas 77046-1173. The trustees serve for the life of the Trust, subject to their earlier death, incapacitation, resignation, retirement or removal as more specifically provided in the Trust’s organizational documents. Each officer serves for a one year term or until their successors are elected and qualified. Column two below includes length of time served with predecessor entities, if any.
| Name, Year of Birth and Position(s) Held with the Trust | Trustee and/ or Officer Since | Principal Occupation(s) During Past 5 Years | Number of Funds in Fund Complex Overseen by Trustee | Other Directorship(s) Held by Trustee During Past 5 Years | ||||
| Interested Persons | ||||||||
| Martin L. Flanagan1 — 1960 Trustee | 2007 | Executive Director, Chief Executive Officer and President, Invesco Ltd. (ultimate parent of Invesco and a global investment management firm); Advisor to the Board, Invesco Advisers, Inc. (formerly known as Invesco Institutional (N.A.), Inc.); Trustee, The Invesco Funds; Vice Chair, Investment Company Institute; and Member of Executive Board, SMU Cox School of Business
Formerly: Chairman and Chief Executive Officer, Invesco Advisers, Inc. (registered investment adviser); Director, Chairman, Chief Executive Officer and President, IVZ Inc. (holding company), INVESCO Group Services, Inc. (service provider) and Invesco North American Holdings, Inc. (holding company); Director, Chief Executive Officer and President, Invesco Holding Company Limited (parent of Invesco and a global investment management firm); Director, Invesco Ltd.; Chairman, Investment Company Institute and President, Co-Chief Executive Officer, Co-President, Chief Operating Officer and Chief Financial Officer, Franklin Resources, Inc. (global investment management organization). | 144 | None | ||||
| Philip A. Taylor2 — 1954 Trustee, President and Principal Executive Officer | 2006 | Head of North American Retail and Senior Managing Director, Invesco Ltd.; Director, Co-Chairman, Co-President and Co-Chief Executive Officer, Invesco Advisers, Inc. (formerly known as Invesco Institutional (N.A.), Inc.) (registered investment adviser); Director, Chairman, Chief Executive Officer and President, Invesco Management Group, Inc. (formerly known as Invesco Aim Management Group, Inc.) (financial services holding company); Director and President, INVESCO Funds Group, Inc. (registered investment adviser and registered transfer agent); Director and Chairman, Invesco Investment Services, Inc. (formerly known as Invesco Aim Investment Services, Inc.) (registered transfer agent) and IVZ Distributors, Inc. (formerly known as INVESCO Distributors, Inc.) (registered broker dealer); Director, President and Chairman, Invesco Inc. (holding company), Invesco Canada Holdings Inc. (holding company), Trimark Investments Ltd./Placements Trimark Ltèe and Invesco Financial Services Ltd/Services Financiers Invesco Ltèe; Chief Executive Officer, Invesco Corporate Class Inc. (corporate mutual fund company) Director, Chairman and Chief Executive Officer, Invesco Canada Ltd. (formerly known as Invesco Trimark Ltd./Invesco Trimark Ltèe) (registered investment adviser and registered transfer agent); Trustee, President and Principal Executive Officer, The Invesco Funds (other than AIM Treasurer’s Series Trust (Invesco Treasurer’s Series Trust), Short-Term Investments Trust and Invesco Management Trust); Trustee and Executive Vice President, The Invesco Funds (AIM Treasurer’s Series Trust (Invesco Treasurer’s Series Trust), Short-Term Investments Trust and Invesco Management Trust only); Director, Invesco Investment Advisers LLC (formerly known as Van Kampen Asset Management); Director, Chief Executive Officer and President, Van Kampen Exchange Corp.
Formerly: Chief Executive Officer, Invesco Canada Fund Inc (corporate mutual fund company); Director and Chairman, Van Kampen Investor Services Inc.; Director, Chief Executive Officer and President, 1371 Preferred Inc. (holding company) and Van Kampen Investments Inc.; Director and President, AIM GP Canada Inc. (general partner for limited partnerships) and Van Kampen Advisors, Inc.; Director and Chief Executive Officer, Invesco Trimark Dealer Inc. (registered broker dealer); Director, Invesco Distributors, Inc. (formerly known as Invesco Aim Distributors, Inc.) (registered broker dealer); Manager, Invesco PowerShares Capital Management LLC; Director, Chief Executive Officer and President, Invesco Advisers, Inc.; Director, Chairman, Chief Executive Officer and President, Invesco Aim Capital Management, Inc.; President, Invesco Trimark Dealer Inc. and Invesco Trimark Ltd./Invesco Trimark Ltèe; Director and President, AIM Trimark Corporate Class Inc. and AIM Trimark Canada Fund Inc.; Senior Managing Director, Invesco Holding Company Limited; Director and Chairman, Fund Management Company (former registered broker dealer); President and Principal Executive Officer, The Invesco Funds (AIM Treasurer’s Series Trust (Invesco Treasurer’s Series Trust), and Short-Term Investments Trust only); President, AIM Trimark Global Fund Inc. and AIM Trimark Canada Fund Inc.. | 144 | None |
| 1 | Mr. Flanagan is considered an interested person (within the meaning of Section 2(a)(19) of the 1940 Act) of the Trust because he is an officer of the Adviser to the Trust, and an officer and a director of Invesco Ltd., ultimate parent of the Adviser. |
| 2 | Mr. Taylor is considered an interested person (within the meaning of Section 2(a)(19) of the 1940 Act) of the Trust because he is an officer and a director of the Adviser. |
T-1 Invesco Equally-Weighted S&P 500 Fund
Trustees and Officers—(continued)
| Name, Year of Birth and Position(s) Held with the Trust | Trustee and/ or Officer Since | Principal Occupation(s) During Past 5 Years | Number of Funds in Fund Complex Overseen by Trustee | Other Directorship(s) Held by Trustee During Past 5 Years | ||||
| Independent Trustees | ||||||||
Bruce L. Crockett — 1944 Trustee and Chair | 2003 | Chairman, Crockett Technologies Associates (technology consulting company)
Formerly: Director, Captaris (unified messaging provider); Director, President and Chief Executive Officer, COMSAT Corporation; Chairman, Board of Governors of INTELSAT (international communications company); ACE Limited (insurance company); Independent Directors Council and Investment Company Institute | 144 | ALPS (Attorneys Liability Protection Society) (insurance company) and Globe Specialty Metals, Inc. (metallurgical company) | ||||
David C. Arch — 1945 Trustee | 2010 | Chairman of Blistex Inc., a consumer health care products manufacturer | 144 | Board member of the Illinois Manufacturers’ Association; Member of the Board of Visitors, Institute for the Humanities, University of Michigan; Member of the Audit Committee of the Edward-Elmhurst Hospital | ||||
James T. Bunch — 1942 Trustee | 2000 | Managing Member, Grumman Hill Group LLC (family office/private equity investments)
Formerly: Founder, Green Manning & Bunch Ltd. (investment banking firm) (1988-2010); Executive Committee, United States Golf Association; and Chairman, Board of Governors, Western Golf Association | 144 | Chairman of the Board of Trustees, Evans Scholars Foundation; and Chairman of the Board, Denver Film Society | ||||
Rodney F. Dammeyer — 1940 Trustee | 2010 | Chairman of CAC, LLC, (private company offering capital investment and management advisory services)
Formerly: Prior to 2001, Managing Partner at Equity Group Corporate Investments; Prior to 1995, Chief Executive Officer of Itel Corporation (formerly Anixter International); Prior to 1985, experience includes Senior Vice President and Chief Financial Officer of Household International, Inc., Executive Vice President and Chief Financial Officer of Northwest Industries, Inc. and Partner of Arthur Andersen & Co.; From 1987 to 2010, Director/Trustee of investment companies in the Van Kampen Funds complex | 144 | Director of Quidel Corporation and Stericycle, Inc. | ||||
Albert R. Dowden — 1941 Trustee | 2003 | Director of a number of public and private business corporations, including the Boss Group, Ltd. (private investment and management); Nature’s Sunshine Products, Inc. and Reich & Tang Funds (5 portfolios) (registered investment company)
Formerly: Director, Homeowners of America Holding Corporation/Homeowners of America Insurance Company (property casualty company); Director, Continental Energy Services, LLC (oil and gas pipeline service); Director, CompuDyne Corporation (provider of product and services to the public security market) and Director, Annuity and Life Re (Holdings), Ltd. (reinsurance company); Director, President and Chief Executive Officer, Volvo Group North America, Inc.; Senior Vice President, AB Volvo; Director of various public and private corporations; Chairman, DHJ Media, Inc.; Director, Magellan Insurance Company; and Director, The Hertz Corporation, Genmar Corporation (boat manufacturer), National Media Corporation; Advisory Board of Rotary Power International (designer, manufacturer, and seller of rotary power engines); and Chairman, Cortland Trust, Inc. (registered investment company) | 144 | Director of: Nature’s Sunshine Products, Inc., Reich & Tang Funds, Homeowners of America Holding Corporation/ Homeowners of America Insurance Company, the Boss Group | ||||
Jack M. Fields — 1952 Trustee | 2003 | Chief Executive Officer, Twenty First Century Group, Inc. (government affairs company); Owner and Chief Executive Officer, Dos Angeles Ranch, L.P. (cattle, hunting, corporate entertainment); and Discovery Global Education Fund (non-profit)
Formerly: Chief Executive Officer, Texana Timber LP (sustainable forestry company); Director of Cross Timbers Quail Research Ranch (non-profit); and member of the U.S. House of Representatives | 144 | Insperity, Inc. (formerly known as Administaff) | ||||
Prema Mathai-Davis — 1950 Trustee | 2003 | Retired. Formerly: Chief Executive Officer, YWCA of the U.S.A. | 144 | None | ||||
Larry Soll — 1942 Trustee | 1997 | Retired. Formerly: Chairman, Chief Executive Officer and President, Synergen Corp. (a biotechnology company) | 144 | None | ||||
Hugo F. Sonnenschein — 1940 Trustee | 2010 | President Emeritus and Honorary Trustee of the University of Chicago and the Adam Smith Distinguished Service Professor in the Department of Economics at the University of Chicago. Prior to 2000, President of the University of Chicago | 144 | Trustee of the University of Rochester and a member of its investment committee; Member of the National Academy of Sciences and the American Philosophical Society; Fellow of the American Academy of Arts and Sciences | ||||
| Raymond Stickel, Jr. — 1944 Trustee | 2005 | Retired. Formerly: Director, Mainstay VP Series Funds, Inc. (25 portfolios) and Partner, Deloitte & Touche | 144 | None |
T-2 Invesco Equally-Weighted S&P 500 Fund
Trustees and Officers—(continued)
| Name, Year of Birth and Position(s) Held with the Trust | Trustee and/ or Officer Since | Principal Occupation(s) During Past 5 Years | Number of Funds in Fund Complex Overseen by Trustee | Other Directorship(s) Held by Trustee During Past 5 Years | ||||
| Independent Trustees—(continued) | ||||||||
Suzanne H. Woolsey — 1941 Trustee | 2014 | Chief Executive Officer of Woolsey Partners LLC | 144 | Emeritus Chair of the Board of Trustees of the Institute for Defense Analyses; Trustee of Colorado College; Trustee of California Institute of Technology; Prior to 2014, Director of Fluor Corp.; Prior to 2010, Trustee of the German Marshall Fund of the United States; Prior to 2010 Trustee of the Rocky Mountain Institute | ||||
| Other Officers | ||||||||
Russell C. Burk — 1958 Senior Vice President and Senior Officer | 2005 | Senior Vice President and Senior Officer, The Invesco Funds | N/A | N/A | ||||
John M. Zerr — 1962 Senior Vice President, Chief Legal Officer and Secretary | 2006 | Director, Senior Vice President, Secretary and General Counsel, Invesco Management Group, Inc. (formerly known as Invesco Aim Management Group, Inc.) and Van Kampen Exchange Corp.; Senior Vice President, Invesco Advisers, Inc. (formerly known as Invesco Institutional (N.A.), Inc.) (registered investment adviser); Senior Vice President and Secretary, Invesco Distributors, Inc. (formerly known as Invesco Aim Distributors, Inc.); Director, Vice President and Secretary, Invesco Investment Services, Inc. (formerly known as Invesco Aim Investment Services, Inc.) and IVZ Distributors, Inc. (formerly known as INVESCO Distributors, Inc.); Director and Vice President, INVESCO Funds Group, Inc.; Senior Vice President, Chief Legal Officer and Secretary, The Invesco Funds; Managing Director, Invesco PowerShares Capital Management LLC; Director, Secretary and General Counsel, Invesco Investment Advisers LLC (formerly known as Van Kampen Asset Management); Secretary and General Counsel, Invesco Capital Markets, Inc. (formerly known as Van Kampen Funds Inc.) and Chief Legal Officer, PowerShares Exchange-Traded Fund Trust, PowerShares Exchange-Traded Fund Trust II, PowerShares India Exchange-Traded Fund Trust, PowerShares Actively Managed Exchange-Traded Fund Trust, and PowerShares Actively Managed Exchange-Traded Commodity Fund Trust
Formerly: Director and Vice President, Van Kampen Advisors Inc.; Director, Vice President, Secretary and General Counsel, Van Kampen Investor Services Inc.; Director, Invesco Distributors, Inc. (formerly known as Invesco Aim Distributors, Inc.); Director, Senior Vice President, General Counsel and Secretary, Invesco Aim Advisers, Inc. and Van Kampen Investments Inc.; Director, Vice President and Secretary, Fund Management Company; Director, Senior Vice President, Secretary, General Counsel and Vice President, Invesco Aim Capital Management, Inc.; Chief Operating Officer and General Counsel, Liberty Ridge Capital, Inc. (an investment adviser); Vice President and Secretary, PBHG Funds (an investment company) and PBHG Insurance Series Fund (an investment company); Chief Operating Officer, General Counsel and Secretary, Old Mutual Investment Partners (a broker-dealer); General Counsel and Secretary, Old Mutual Fund Services (an administrator) and Old Mutual Shareholder Services (a shareholder servicing center); Executive Vice President, General Counsel and Secretary, Old Mutual Capital, Inc. (an investment adviser); and Vice President and Secretary, Old Mutual Advisors Funds (an investment company) | N/A | N/A | ||||
| Sheri Morris — 1964 Vice President, Treasurer and Principal Financial Officer | 2003 | Vice President, Treasurer and Principal Financial Officer, The Invesco Funds; Vice President, Invesco Advisers, Inc. (formerly known as Invesco Institutional (N.A.), Inc.) (registered investment adviser); and Vice President, PowerShares Exchange-Traded Fund Trust, PowerShares Exchange-Traded Fund Trust II, PowerShares India Exchange-Traded Fund Trust, PowerShares Actively Managed Exchange-Traded Fund Trust, and PowerShares Actively Managed Exchange-Traded Commodity Fund Trust
Formerly: Vice President, Invesco Aim Advisers, Inc., Invesco Aim Capital Management, Inc. and Invesco Aim Private Asset Management, Inc.; Assistant Vice President and Assistant Treasurer, The Invesco Funds and Assistant Vice President, Invesco Advisers, Inc., Invesco Aim Capital Management, Inc. and Invesco Aim Private Asset Management, Inc.; and Treasurer, PowerShares Exchange-Traded Fund Trust, PowerShares Exchange-Traded Fund Trust II, PowerShares India Exchange-Traded Fund Trust and PowerShares Actively Managed Exchange-Traded Fund Trust | N/A | N/A | ||||
T-3 Invesco Equally-Weighted S&P 500 Fund
Trustees and Officers—(continued)
| Name, Year of Birth and Position(s) Held with the Trust | Trustee and/ or Officer Since | Principal Occupation(s) During Past 5 Years | Number of Funds in Fund Complex Overseen by Trustee | Other Directorship(s) Held by Trustee During Past 5 Years | ||||
| Other Officers—(continued) | ||||||||
| Karen Dunn Kelley — 1960 Vice President | 2003 | Senior Managing Director, Investments, Invesco Ltd.; Director, Co-President, Co-Chief Executive Officer, and Co-Chairman, Invesco Advisers, Inc. (formerly known as Invesco Institutional (N.A.), Inc.) (registered investment adviser); Chairman, Invesco Senior Secured Management, Inc.; Senior Vice President, Invesco Management Group, Inc. (formerly known as Invesco Aim Management Group, Inc.); Executive Vice President, Invesco Distributors, Inc. (formerly known as Invesco Aim Distributors, Inc.); Director, Invesco Mortgage Capital Inc. and Invesco Management Company Limited; Vice President, The Invesco Funds (other than AIM Treasurer’s Series Trust (Invesco Treasurer’s Series Trust), Short-Term Investments Trust and Invesco Management Trust); and President and Principal Executive Officer, The Invesco Funds (AIM Treasurer’s Series Trust (Invesco Treasurer’s Series Trust), Short-Term Investments Trust and Invesco Management Trust only)
Formerly: Director and President, INVESCO Asset Management (Bermuda) Ltd., Director, INVESCO Global Asset Management Limited and INVESCO Management S.A.; Senior Vice President, Van Kampen Investments Inc. and Invesco Advisers, Inc. (formerly known as Invesco Institutional (N.A.), Inc.) (registered investment adviser); Vice President, Invesco Advisers, Inc. (formerly known as Invesco Institutional (N.A.), Inc.); Director of Cash Management and Senior Vice President, Invesco Advisers, Inc. and Invesco Aim Capital Management, Inc.; Director and President, Fund Management Company; Chief Cash Management Officer, Director of Cash Management, Senior Vice President, and Managing Director, Invesco Aim Capital Management, Inc.; Director of Cash Management, Senior Vice President, and Vice President, Invesco Advisers, Inc. and The Invesco Funds (AIM Treasurer’s Series Trust (Invesco Treasurer’s Series Trust), and Short-Term Investments Trust only) | N/A | N/A | ||||
| Crissie M. Wisdom — 1969 Anti-Money Laundering Compliance Officer | 2013 | Anti-Money Laundering Compliance Officer, Invesco Advisers, Inc. (formerly known as Invesco Institutional (N.A.), Inc.) (registered investment adviser), Invesco Capital Markets, Inc. (formerly known as Van Kampen Funds Inc.), Invesco Distributors, Inc., Invesco Investment Services, Inc., Invesco Management Group, Inc., Van Kampen Exchange Corp., The Invesco Funds, and PowerShares Exchange-Traded Fund Trust, PowerShares Exchange-Traded Fund Trust II, PowerShares India Exchange-Traded Fund Trust, PowerShares Actively Managed Exchange-Traded Fund Trust and PowerShares Actively Managed Exchange-Traded Commodity Fund Trust; Anti-Money Laundering Compliance Officer and Bank Secrecy Act Officer, INVESCO National Trust Company and Invesco Trust Company; and Fraud Prevention Manager and Controls and Risk Analysis Manager for Invesco Investment Services, Inc.. | N/A | N/A | ||||
Lisa O. Brinkley — 1959 Chief Compliance Officer | 2004 | Senior Vice President and Chief Compliance Officer, Invesco Advisers, Inc. (registered investment adviser) (formerly known as Invesco Institutional (N.A., Inc.); and Chief Compliance Officer, The Invesco Funds
Formerly: Global Assurance Officer, Invesco Ltd. and Vice President, The Invesco Funds; Chief Compliance Officer, Invesco Distributors, Inc. (formerly known as Invesco Aim Distributors, Inc.), Invesco Investment Services, Inc.(formerly known as Invesco Aim Investment Services, Inc.) and Van Kampen Investor Services Inc.; Senior Vice President, Invesco Management Group, Inc.; Senior Vice President and Chief Compliance Officer, Invesco Advisers, Inc. and The Invesco Funds; Vice President and Chief Compliance Officer, Invesco Aim Capital Management, Inc. and Invesco Distributors, Inc.; Vice President, Invesco Investment Services, Inc. and Fund Management Company. | N/A | N/A |
The Statement of Additional Information of the Trust includes additional information about the Fund’s Trustees and is available upon request, without charge, by calling 1.800.959.4246. Please refer to the Fund’s prospectus for information on the Fund’s sub-advisers.
Office of the Fund 11 Greenway Plaza, Suite 1000 Houston, TX 77046-1173 | Investment Adviser Invesco Advisers, Inc. 1555 Peachtree Street, N.E. Atlanta, GA 30309 | Distributor Invesco Distributors, Inc. 11 Greenway Plaza, Suite 1000 Houston, TX 77046-1173 | Auditors PricewaterhouseCoopers LLP 1000 Louisiana Street, Suite 5800 Houston, TX 77002-5678 | |||
Counsel to the Fund Stradley��Ronon Stevens & Young, LLP 2005 Market Street, Suite 2600 Philadelphia, PA 19103-7018 | Counsel to the Independent Trustees Goodwin Procter LLP 901 New York Avenue, N.W. Washington, D.C. 20001 | Transfer Agent Invesco Investment Services, Inc. 11 Greenway Plaza, Suite 1000 Houston, TX 77046-1173 | Custodian State Street Bank and Trust Company 225 Franklin Street Boston, MA 02110-2801 | |||
T-4 Invesco Equally-Weighted S&P 500 Fund

Invesco mailing information
Send general correspondence to Invesco Investment Services, Inc., P.O. Box 219078, Kansas City, MO 64121-9078.
Important notice regarding delivery of security holder documents
To reduce Fund expenses, only one copy of most shareholder documents may be mailed to shareholders with multiple accounts at the same address (Householding). Mailing of your shareholder documents may be householded indefinitely unless you instruct us otherwise. If you do not want the mailing of these documents to be combined with those for other members of your household, please contact Invesco Investment Services, Inc. at 800 959 4246 or contact your financial institution. We will begin sending you individual copies for each account within 30 days after receiving your request.
Fund holdings and proxy voting information
The Fund provides a complete list of its holdings four times in each fiscal year, at the quarter ends. For the second and fourth quarters, the lists appear in the Fund’s semiannual and annual reports to shareholders. For the first and third quarters, the Fund files the lists with the Securities and Exchange Commission (SEC) on Form N-Q. The most recent list of portfolio holdings is available at invesco.com/completeqtrholdings. Shareholders can also look up the Fund’s Forms N-Q on the SEC website at sec.gov. Copies of the Fund’s Forms N-Q may be reviewed and copied at the SEC Public Reference Room in Washington, D.C. You can obtain information on the operation of the Public Reference Room, including information about duplicating fee charges, by calling 202 551 8090 or 800 732 0330, or by electronic request at the following email address: publicinfo@sec.gov.
The SEC file numbers for the Fund are shown below.
A description of the policies and procedures that the Fund uses to determine how to vote proxies relating to portfolio securities is available without charge, upon request, from our Client Services department at 800 959 4246 or at invesco.com/proxyguidelines. The information is also available on the SEC website, sec.gov.
Information regarding how the Fund voted proxies related to its portfolio securities during the most recent 12-month period ended June 30 is available at invesco.com/proxysearch. The information is also available on the SEC website, sec.gov. Invesco Advisers, Inc. is an investment adviser; it provides investment advisory services to individual and institutional clients and does not sell securities. Invesco Distributors, Inc. is the US distributor for Invesco Ltd.’s retail mutual funds, exchange-traded funds and institutional money market funds. Both are wholly owned, indirect subsidiaries of Invesco Ltd. |  |
SEC file numbers: 811-09913 and 333-36074 MS-EWSP-AR-1 Invesco Distributors, Inc.
|
| |||
Annual Report to Shareholders
| August 31, 2015 | |||
Invesco Equity and Income Fund | ||||
Nasdaq: A: ACEIX ¡ B: ACEQX ¡ C: ACERX ¡ R: ACESX ¡ Y: ACETX ¡ R5: ACEKX ¡ R6: IEIFX | ||||


Letters to Shareholders
Philip Taylor | Dear Shareholders: This annual report includes information about your Fund, including performance data and a complete list of its investments as of the close of the reporting period. Inside is a discussion of how your Fund was managed and the factors that affected its performance during the reporting period. I hope you find this report of interest. The US economy expanded and unemployment declined throughout the reporting period. The sharp drop in oil prices that began in mid-2014 continued to benefit consumers, but a strong US dollar crimped corporate profits. The US Federal Reserve signaled that it was increasingly likely to raise interest rates, based on generally positive economic data, but uncertainty remained about when it would act. Overseas, the story was much different. Low energy prices hurt the economies of some oil-producing nations, such as Brazil and Russia. During the reporting period, | |
the European Central Bank as well as central banks in China and Japan – among other countries – either instituted or maintained extraordinarily accommodative monetary policies in response to economic weakness. Investor uncertainty, such as we saw for much of the reporting period – and market volatility, such as we saw at the end of the reporting period – are unfortunate facts of life when it comes to investing. Some investors use these things as excuses to delay saving and investing for their long-term financial goals. That’s why Invesco encourages investors to work with a professional financial adviser who can stress the importance of starting to save and invest early and the importance of adhering to a disciplined investment plan – when times are good and when they’re uncertain. A financial adviser who knows your unique financial situation, investment goals and risk tolerance can be an invaluable partner as you seek to achieve your financial goals. He or she can offer a long-term perspective when markets are volatile and time-tested advice and guidance when your financial situation or investment goals change. | ||

Timely information when and where you want it
Invesco’s efforts to help investors achieve their financial objectives include providing individual investors and financial professionals with timely information about the markets, the economy and investing – whenever and wherever they want it.
Our website, invesco.com/us, offers a wide range of market insights and investment perspectives. On the website, you’ll find detailed information about our funds, including prices, performance, holdings and portfolio manager commentaries. You can access information about your account by completing a simple, secure online registration. Click on the “Need to register” link in the “Account Access” box on our homepage to get started.
Invesco’s mobile apps for iPhone® and iPad® (both available free from the App StoreSM) allow you to obtain the same detailed information, monitor your account and create customizable watch lists. Also, they allow you to access investment insights from our investment leaders, market strategists, economists and retirement experts. You can sign up to be alerted when new commentary is added, and you can watch portfolio manager videos and have instant access to Invesco news and updates wherever you may be.
In addition to the resources accessible on our website and through our mobile app, you can obtain timely updates to help you stay informed about the markets, the economy and investing by connecting with Invesco on Twitter, LinkedIn or Facebook. You can access our blog at blog.invesco.us.com. Our goal is to provide you the information you want, when and where you want it.
Have questions?
For questions about your account, feel free to contact an Invesco client services representative at 800 959 4246. For Invesco-related questions or comments, please email me directly at phil@invesco.com.
All of us at Invesco look forward to serving your investment management needs for many years to come. Thank you for investing with us.
Sincerely,

Philip Taylor
Senior Managing Director, Invesco Ltd.
iPhone and iPad are trademarks of Apple Inc., registered in the US and other countries. App Store is a service mark of Apple Inc. Invesco Distributors, Inc. is not affiliated with Apple Inc.
2 Invesco Equity and Income Fund
Bruce Crockett | Dear Fellow Shareholders: Among the many important lessons I’ve learned in more than 40 years in a variety of business endeavors is the value of a trusted advocate. As independent chair of the Invesco Funds Board, I can assure you that the members of the Board are strong advocates for the interests of investors in Invesco’s mutual funds. We work hard to represent your interests through oversight of the quality of the investment management services your funds receive and other matters important to your investment, including but not limited to: n Ensuring that Invesco offers a diverse lineup of mutual funds that your financial adviser can use to strive to meet your financial needs as your investment goals change over time. |

| n | Monitoring how the portfolio management teams of the Invesco funds are performing in light of changing economic and market conditions. |
| n | Assessing each portfolio management team’s investment performance within the context of the investment strategy described in the fund’s prospectus. |
| n | Monitoring for potential conflicts of interests that may impact the nature of the services that your funds receive. |
We believe one of the most important services we provide our fund shareholders is the annual review of the funds’ advisory and sub-advisory contracts with Invesco Advisers and its affiliates. This review is required by the Investment Company Act of 1940 and focuses on the nature and quality of the services Invesco provides as the adviser to the Invesco funds and the reasonableness of the fees that it charges for those services. Each year, we spend months carefully reviewing information received from Invesco and a variety of independent sources, such as performance and fee data prepared by Lipper Inc., an independent, third-party firm widely recognized as a leader in its field. We also meet with our independent legal counsel and other independent advisers to review and help us assess the information that we have received. Our goal is to assure that you receive quality investment management services for a reasonable fee.
I trust the measures outlined above provide assurance that you have a worthy advocate when it comes to choosing the Invesco Funds.
As always, please contact me at bruce@brucecrockett.com with any questions or concerns you may have. On behalf of the Board, we look forward to continuing to represent your interests and serving your needs.
Sincerely,

Bruce L. Crockett
Independent Chair
Invesco Funds Board of Trustees
3 Invesco Equity and Income Fund
Management’s Discussion of Fund Performance
Performance summary
For the fiscal year ended August 31, 2015, Class A shares of Invesco Equity and Income Fund (the Fund), at net asset value (NAV), outperformed the Russell 1000 Value Index.
Your Fund’s long-term performance appears later in this report.
Fund vs. Indexes
Total returns, 8/31/14 to 8/31/15, at net asset value (NAV). Performance shown does not include applicable contingent deferred sales charges (CDSC) or front-end sales charges, which would have reduced performance.
Class A Shares | -1.65 | % | ||
Class B Shares | -2.41 | |||
Class C Shares | -2.48 | |||
Class R Shares | -1.98 | |||
Class Y Shares | -1.49 | |||
Class R5 Shares | -1.32 | |||
Class R6 Shares | -1.33 | |||
Russell 1000 Value Indexq (Broad Market Index) | -3.48 | |||
Barclays U.S. Government/Credit Indexq (Style-Specific Index) | 1.09 | |||
Source(s): qFactSet Research Systems Inc. |
Market conditions and your Fund
The US economy improved slowly, but somewhat steadily, during the fiscal year ended August 31, 2015 – although the performance of the underlying sectors of the economy varied dramatically. The headline story was the massive slowdown in energy markets, as oil prices plummeted when too much supply overwhelmed slowing global demand. However the more subtle story, which drove the economy forward during the year, was the improved position of the US consumer.
As the reporting period began, economic growth appeared to be stronger in the US than in the rest of the world. In mid-2014, when the price of oil began its sharp and prolonged decline, US equities fell as well. However, while global growth weakened and commodity-based economies and currencies underperformed those of the US, continued strengthening of the US consumer led US equity markets higher through the spring. Continued low interest rates, the increasing
availability of credit from lenders and an improving employment picture all contributed to higher consumer confidence. This strength also helped the market overcome summer fears that Greece and the eurozone would fail to reach agreement on a financial bailout plan. In the final weeks of the fiscal year, however, US equity markets moved sharply lower. A significant downturn in China’s financial markets, weak global economic growth and the uncertain timing of a potential US interest rate increase were negatives for jittery US markets. While stocks were up slightly for the fiscal year, they ended the reporting period on a negative note.
Sector performance within the Russell 1000 Value Index was mixed for the reporting period, with the health care sector returning positive returns in the teens, while other sectors, like the energy and materials sectors posting negative double-digit returns.
The Fund’s underweight exposure to energy stocks was a large positive relative contributor to its performance versus
the Russell 1000 Value Index. The energy sector was the worst-performing sector within the benchmark, as oil prices dropped to levels not seen in years.
The Fund’s allocation to high-grade bonds posted positive returns and contributed to its performance, as bonds generally outperformed equities during the reporting period. The Fund’s allocation to cash also acted as a contributor to performance in a modestly weak equity market. The Fund is a balanced or moderate allocation fund; therefore, allocations to cash and/or fixed income typically are contributors during a weak or falling equity market. Cash is utilized for investment opportunities, and the fixed income allocation potentially provides income and capital preservation during equity market downturns.
Stock selection in the financials sector was a large contributor to Fund performance versus the Russell 1000 Value Index. Specifically within banks, two of the Fund’s largest holdings, JPMorgan Chase and Citigroup, were the sector’s top contributors. In 2015, JPMorgan Chase reported back-to-back quarterly earnings and revenues that outpaced analysts’ estimates. In April, the company reported a year-over-year increase in profits and rise in revenues from strong growth in its investment banking, asset management and mortgage lending divisions.
On the negative side, stock selection within, and underweight exposure to, the consumer staples sector were large detractors from the Fund’s relative performance. Notably, Avon Products, a household and personal products company, was a large detractor, posting a double-digit loss for the reporting period. The stock performed poorly after the company settled bribery charges with the Justice Department toward the end of 2014. We sold Avon in the fourth quarter of 2014 due to deteriorating fundamentals and
Portfolio Composition
By security type
| Common Stocks and Other Equity Interests | 63.7 | % | ||
Bonds and Notes | 22.5 | |||
U.S. Treasury Securities | 6.2 | |||
Preferred Stocks | 1.0 | |||
| Security Types Each Less Than 1 % of Portfolio | 0.8 | |||
Money Market Funds Plus Other Assets Less Liabilities | 5.8 |
Top 10 Equity Holdings*
1. | Citigroup Inc. | 3.2 | % | |||
2. | JPMorgan Chase & Co. | 3.1 | ||||
3. | General Electric Co. | 1.9 | ||||
4. | Bank of America Corp. | 1.8 | ||||
5. | Morgan Stanley | 1.5 | ||||
6. | Royal Dutch Shell PLC- Class A | 1.3 | ||||
7. | Target Corp. | 1.2 | ||||
8. | Merck & Co., Inc. | 1.2 | ||||
9. | PNC Financial Services Group, Inc. (The) | 1.2 | ||||
10. | Carnival Corp. | 1.2 |
Total Net Assets | $ | 13.4 billion | ||
Total Number of Holdings* | 432 | |||
The Fund’s holdings are subject to change, and there is no assurance that the Fund will continue to hold any particular security.
*Excluding money market fund holdings.
4 Invesco Equity and Income Fund
unclear guidance from management on the company’s long-term prospects.
The Fund’s underweight allocation in the health care sector also dampened its relative performance versus the Russell 1000 Value Index. More specifically, having an underweight allocation in the health care equipment and services industry was the main drag on relative performance within the sector, as that industry posted returns over 20% for the reporting period.
Stock selection within the industrials sector also detracted from the Fund’s relative performance. Caterpillar within capital goods and Tyco International within commercial and professional services performed poorly for the reporting period, posting negative double-digit returns. Shares of Caterpillar suffered after the company missed revenue forecasts in July 2015 and cut full-year guidance. Soft materials pricing and a slowing Chinese economy, made worse by a strong US dollar, crimped profits in the multinational company, as less than half of its revenue is based in the US.
We used currency forward contracts for the purpose of hedging currency exposure of non-US-based companies held in the portfolio. Derivatives were used solely for the purpose of hedging and not for speculative purposes or leverage. The use of currency forward contracts contributed to the Fund’s performance relative to the Russell 1000 Value Index for the reporting period. This was mainly due to the strength of the US dollar compared to the foreign currencies in which the Fund’s non-US holdings were denominated.
Equity markets experienced continued volatility during the reporting period. Reasons for volatility included a sluggish Chinese economy and falling oil and commodity prices affecting the global economy. We believe that market volatility creates opportunities to invest in companies with attractive valuations and strong fundamentals. We believe that ultimately those valuations and fundamentals will be reflected in those companies’ stock prices.
Thank you for your investment in Invesco Equity and Income Fund and for sharing our long-term investment horizon.
The views and opinions expressed in management’s discussion of Fund performance are those of Invesco Advisers, Inc. These views and opinions are subject to change at any time based on factors such as market and economic conditions. These views and opinions may not be relied upon as investment advice or recommendations, or as an offer for a particular security. The information is not a complete analysis of every aspect of any market, country, industry, security or the Fund. Statements of fact are from sources considered reliable, but Invesco Advisers, Inc. makes no representation or warranty as to their completeness or accuracy. Although historical performance is no guarantee of future results, these insights may help you understand our investment management philosophy.
See important Fund and, if applicable, index disclosures later in this report.
 | Thomas Bastian Chartered Financial Analyst, Portfolio Manager, is lead manager of Invesco Equity and Income Fund. He joined | |
| Invesco in 2010. Mr. Bastian earned a BA in accounting from St. John’s University and an MBA in finance from University of Michigan. | ||
 | Chuck Burge Portfolio Manager, is manager of Invesco Equity and Income Fund. He joined Invesco in 2002. Mr. Burge earned a BS in economics | |
| from Texas A&M University and an MBA in finance and accounting from Rice University. | ||
 | Mary Jayne Maly Chartered Financial Analyst, Portfolio Manager, is manager of Invesco Equity and Income Fund. She joined Invesco in | |
| 2010. Ms. Maly earned a BA from the University of Pittsburgh and an MBA from the Thunderbird School of Global Management. | ||
 | Sergio Marcheli Portfolio Manager, is manager of Invesco Equity and Income Fund. He joined Invesco in 2010. Mr. Marcheli earned a | |
| BBA from the University of Houston and an MBA from the University of St. Thomas. | ||
 | James Roeder Chartered Financial Analyst, Portfolio Manager, is manager of Invesco Equity and Income Fund. He joined Invesco in | |
| 2010. Mr. Roeder earned a BS in accounting from Clemson University and an MBA in economics and finance from the University of Chicago Booth School of Business. | ||
5 Invesco Equity and Income Fund
Your Fund’s Long-Term Performance
Results of a $10,000 Investment – Oldest Share Class(es)
Fund and index data from 8/31/05
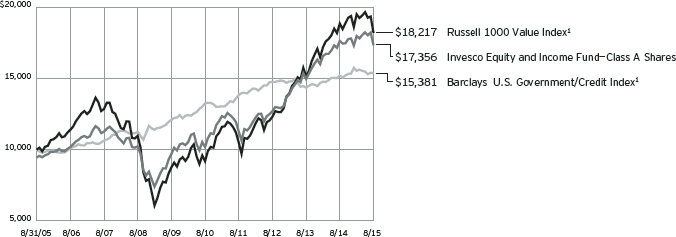
1 Source: FactSet Research Systems Inc.
Past performance cannot guarantee comparable future results.
The data shown in the chart include reinvested distributions, applicable sales charges and Fund expenses including
management fees. Index results include reinvested dividends, but they do not reflect sales charges. Performance of the peer group, if applicable, reflects fund expenses and management fees;
performance of a market index does not. Performance shown in the chart and table(s) does not reflect deduction of taxes a shareholder would pay on Fund distributions or sale of Fund shares.
6 Invesco Equity and Income Fund
Average Annual Total Returns |
| |||
As of 8/31/15, including maximum applicable sales charges |
| |||
Class A Shares | ||||
Inception (8/3/60) | 10.13 | % | ||
10 Years | 5.67 | |||
5 Years | 10.00 | |||
1 Year | -7.02 | |||
Class B Shares | ||||
Inception (5/1/92) | 9.41 | % | ||
10 Years | 5.99 | |||
5 Years | 10.40 | |||
1 Year | -6.78 | |||
Class C Shares | ||||
Inception (7/6/93) | 8.65 | % | ||
10 Years | 5.48 | |||
5 Years | 10.41 | |||
1 Year | -3.35 | |||
Class R Shares | ||||
Inception (10/1/02) | 7.87 | % | ||
10 Years | 6.00 | |||
5 Years | 10.93 | |||
1 Year | -1.98 | |||
Class Y Shares | ||||
Inception (12/22/04) | 6.68 | % | ||
10 Years | 6.54 | |||
5 Years | 11.50 | |||
1 Year | -1.49 | |||
Class R5 Shares | ||||
10 Years | 6.47 | % | ||
5 Years | 11.62 | |||
1 Year | -1.32 | |||
Class R6 Shares | ||||
10 Years | 6.39 | % | ||
5 Years | 11.50 | |||
1 Year | -1.33 | |||
Effective June 1, 2010, Class A, Class B, Class C, Class I and Class R shares of the predecessor fund, Van Kampen Equity and Income Fund, advised by Van Kampen Asset Management were reorganized into Class A, Class B, Class C, Class Y and Class R shares, respectively, of Invesco Van Kampen Equity and Income Fund (renamed Invesco Equity and Income Fund). Returns shown above for Class A, Class B, Class C, Class R and Class Y shares are blended returns of the predecessor fund and Invesco Equity and Income Fund. Share class returns will differ from the predecessor fund because of different expenses.
Class R5 shares incepted on June 1, 2010. Performance shown prior to that
Average Annual Total Returns |
| |||
As of 6/30/15, the most recent calendar quarter end, including maximum applicable sales charges |
| |||
Class A Shares | ||||
Inception (8/3/60) | 10.24 | % | ||
10 Years | 6.44 | |||
5 Years | 11.37 | |||
1 Year | -1.60 | |||
Class B Shares | ||||
Inception (5/1/92) | 9.66 | % | ||
10 Years | 6.77 | |||
5 Years | 11.85 | |||
1 Year | -1.29 | |||
Class C Shares | ||||
Inception (7/6/93) | 8.92 | % | ||
10 Years | 6.25 | |||
5 Years | 11.80 | |||
1 Year | 2.32 | |||
Class R Shares | ||||
Inception (10/1/02) | 8.32 | % | ||
10 Years | 6.78 | |||
5 Years | 12.36 | |||
1 Year | 3.83 | |||
Class Y Shares | ||||
Inception (12/22/04) | 7.19 | % | ||
10 Years | 7.31 | |||
5 Years | 12.92 | |||
1 Year | 4.36 | |||
Class R5 Shares | ||||
10 Years | 7.23 | % | ||
5 Years | 13.02 | |||
1 Year | 4.35 | |||
Class R6 Shares | ||||
10 Years | 7.17 | % | ||
5 Years | 12.90 | |||
1 Year | 4.54 | |||
date is that of the predecessor fund’s Class A shares and includes the 12b-1 fees applicable to Class A shares.
Class R6 shares incepted on September 24, 2012. Performance shown prior to that date is that of the Fund’s and the predecessor fund’s Class A shares and includes the 12b-1 fees applicable to Class A shares.
The performance data quoted represent past performance and cannot guarantee comparable future results; current performance may be lower or higher. Please visit invesco.com/performance for the most recent month-end performance. Performance figures reflect reinvested distributions, changes in net asset value and the effect of the maximum sales charge unless otherwise
stated. Investment return and principal value will fluctuate so that you may have a gain or loss when you sell shares.
The net annual Fund operating expense ratio set forth in the most recent Fund prospectus as of the date of this report for Class A, Class B, Class C, Class R, Class Y, Class R5 and Class R6 shares was 0.80%, 1.55%, 1.55%, 1.05%, 0.55%, 0.49% and 0.40%, respectively.1 The total annual Fund operating expense ratio set forth in the most recent Fund prospectus as of the date of this report for Class A, Class B, Class C, Class R, Class Y, Class R5 and Class R6 shares was 0.81%, 1.56%, 1.56%, 1.06%, 0.56%, 0.50% and 0.41%, respectively. The expense ratios presented above may vary from the expense ratios presented in other sections of this report that are based on expenses incurred during the period covered by this report.
Class A share performance reflects the maximum 5.50% sales charge, and Class B and Class C share performance reflects the applicable contingent deferred sales charge (CDSC) for the period involved. The CDSC on Class B shares declines from 5% beginning at the time of purchase to 0% at the beginning of the seventh year. The CDSC on Class C shares is 1% for the first year after purchase. Class R, Class Y, Class R5 and Class R6 shares do not have a front-end sales charge or a CDSC; therefore, performance is at net asset value.
The performance of the Fund’s share classes will differ primarily due to different sales charge structures and class expenses.
Fund performance reflects any applicable fee waivers and/or expense reimbursements. Had the adviser not waived fees and/or reimbursed expenses currently or in the past, returns would have been lower. See current prospectus for more information.
| 1 | Total annual Fund operating expenses after any contractual fee waivers and/or expense reimbursements by the adviser in effect through at least June 30, 2017. See current prospectus for more information. |
7 Invesco Equity and Income Fund
Invesco Equity and Income Fund’s investment objective is current income and, secondarily, capital appreciation.
| n | Unless otherwise stated, information presented in this report is as of August 31, 2015, and is based on total net assets. |
| n | Unless otherwise noted, all data provided by Invesco. |
| n | To access your Fund’s reports/prospectus, visit invesco.com/fundreports. |
About share classes
| n | Class B shares may not be purchased for new or additional investments. Please see the prospectus for more information. |
| n | Class R shares are generally available only to employer sponsored retirement and benefit plans. Please see the prospectus for more information. |
| n | Class Y shares are available only to certain investors. Please see the prospectus for more information. |
| n | Class R5 shares and Class R6 shares are primarily intended for employer sponsored retirement and benefit plans that meet certain standards and for institutional investors. Please see the prospectus for more information. |
Principal risks of investing in the Fund
| n | Call risk. If interest rates fall, it is possible that issuers of debt securities with high interest rates will prepay or call their securities before their maturity dates. In this event, the proceeds from the called securities would likely be reinvested by the Fund in securities bearing the new, lower interest rates, resulting in a possible decline in the Fund’s income and distributions to shareholders. |
| n | Changing fixed income market conditions risk. The current low interest rate environment was created in part by the Federal Reserve Board (FRB) and certain foreign central banks keeping the federal funds and equivalent foreign rates at or near zero. There is a risk that interest rates will rise when the FRB and central banks raise these rates. This risk is heightened due to the “tapering” of the FRB’s quantitative easing program and other similar foreign central bank actions. This tapering and eventual increase in the federal funds and equivalent foreign rates may expose fixed income markets to heightened volatility and reduced liquidity for certain fixed income investments, particularly those with longer maturities. In addition, decreases in fixed income dealer market-making capacity may also |
potentially lead to heightened volatility and reduced liquidity in the fixed income markets. As a result, the value of the Fund’s investments and share price may decline. Changes in central bank policies could also result in higher than normal shareholder redemptions, which could potentially increase portfolio turnover and the Fund’s transaction costs. |
| n | Convertible securities risk. The Fund may own convertible securities, the value of which may be affected by market interest rates, the risk that the issuer will default, the value of the underlying stock or the right of the issuer to buy back the convertible securities. |
| n | Credit risk. The issuer of instruments in which the Fund invests may be unable to meet interest and/or principal payments, thereby causing its instruments to decrease in value and lowering the issuer’s credit rating. |
| n | Depositary receipts risk. Depositary receipts involve many of the same risks as those associated with direct investment in foreign securities. In addition, the underlying issuers of certain depositary receipts, particularly unsponsored or unregistered depositary receipts, are under no obligation to distribute shareholder communications to the holders of such receipts or to pass through to them any voting rights with respect to the deposited securities. |
| n | Derivatives risk. The value of a derivative instrument depends largely on (and is derived from) the value of an underlying security, currency, commodity, interest rate, index or other asset (each referred to as an underlying asset). In addition to risks relating to the underlying assets, the use of derivatives may include other, possibly greater, risks, including counterparty, leverage and liquidity risks. |
Counterparty risk is the risk that the counterparty to the derivative contract will default on its obligation to pay the Fund the amount owed or otherwise perform under the derivative contract. Derivatives create
leverage risk because they do not require payment up front equal to the economic exposure created by owning the derivative. As a result, an adverse change in the value of the underlying asset could result in the Fund sustaining a loss that is substantially greater than the amount invested in the derivative, which may make the Fund’s returns more volatile and increase the risk of loss. Derivative instruments may also be less liquid than more traditional investments and the Fund may be unable to sell or close out its derivative positions at a desirable time or price. This risk may be more acute under adverse market conditions, during which the Fund may be most in need of liquidating its derivative positions. Derivatives may also be harder to value, less tax efficient and subject to changing government regulation that could impact the Fund’s ability to use certain derivatives or their cost. Also, derivatives used for hedging or to gain or limit exposure to a particular market segment may not provide the expected benefits, particularly during adverse market conditions.
| n | Foreign securities risk. The Fund’s foreign investments may be affected by changes in a foreign country’s exchange rates, political and social instability, changes in economic or taxation policies, difficulties when enforcing obligations, decreased liquidity, and increased volatility. Foreign companies may be subject to less regulation resulting in less publicly available information about the companies. |
| n | Income risk. The income you receive from the Fund is based primarily on prevailing interest rates, which can vary widely over the short- and long-term. If interest rates drop, your income from the Fund may drop as well. |
| n | Interest risk. Interest rate risk refers to the risk that bond prices generally fall as interest rates rise; conversely, bond prices generally rise as interest rates fall. Specific bonds differ in their sensitivity to changes in interest rates depending on their individual characteristics, including duration. |
This report must be accompanied or preceded by a currently effective Fund prospectus, which contains more complete information, including sales charges and expenses. Investors should read it carefully before investing.
NOT FDIC INSURED | MAY LOSE VALUE | NO BANK GUARANTEE |
8 Invesco Equity and Income Fund
| n | Management risk. The investment techniques and risk analysis used by the Fund’s portfolio managers may not produce the desired results. |
| n | Market risk. The prices of and the income generated by the Fund’s securities may decline in response to, among other things, investor sentiment, general economic and market conditions, regional or global instability, and currency and interest rate fluctuations. |
| n | Preferred securities risk. Preferred securities may include provisions that permit the issuer, in its discretion, to defer or omit distributions for a certain period of time. If the Fund owns a security that is deferring or omitting its distributions, the Fund may be required to report the distribution on its tax returns, even though it may not have received this income. Further, preferred securities may lose substantial value due to the omission or deferment of dividend payments. |
| n | Real estate investment trust (REIT) risk/real estate risk. Investments in real estate related instruments may be affected by economic, legal, cultural, environmental or technological factors that affect property values, rents or occupancies of real estate related to the Fund’s holdings. Shares of real estate related companies, which tend to be small- and mid-cap companies, may be more volatile and less liquid. |
| n | Small- and mid-capitalization risks. Stocks of small- and mid-sized companies tend to be more vulnerable to adverse developments and may have little or no operating history or track record of success, and limited product lines, markets, management and financial resources. The securities of small- and mid-sized companies may be more volatile due to less market interest and less publicly available information about the issuer. They also may be illiquid or restricted as to resale, or may trade less frequently and in smaller volumes, all of which may cause difficulty when establishing or closing a position at a desirable price. |
| n | Value investing style risk. The Fund emphasizes a value style of investing, which focuses on undervalued companies with characteristics for improved valuations. This style of investing is subject to the risk that the valuations |
never improve or that the returns on value equity securities are less than returns on other styles of investing or the overall stock market. Value stocks also may decline in price, even though in theory they are already underpriced. |
About indexes used in this report
| n | The Russell 1000 Value® Index is an unmanaged index considered representative of large-cap value stocks. The Russell 1000 Value Index is a trademark/service mark of the Frank Russell Co. Russell® is a trademark of the Frank Russell Co. |
| n | The Barclays U.S. Government/Credit Index includes treasuries and agencies that represent the government portion of the index, and includes publically issued US corporate and foreign debentures and secured notes that meet specified maturity, liquidity and quality requirements. |
| n | The Fund is not managed to track the performance of any particular index, including the index(es) described here, and consequently, the performance of the Fund may deviate significantly from the performance of the index(es). |
| n | A direct investment cannot be made in an index. Unless otherwise indicated, index results include reinvested dividends, and they do not reflect sales charges. Performance of the peer group, if applicable, reflects fund expenses; performance of a market index does not. |
Other information
| n | The returns shown in management’s discussion of Fund performance are based on net asset values (NAVs) calculated for shareholder transactions. Generally accepted accounting principles require adjustments to be made to the net assets of the Fund at period end for financial reporting purposes, and as such, the NAVs for shareholder transactions and the returns based on those NAVs may differ from the NAVs and returns reported in the Financial Highlights. |
| n | Industry classifications used in this report are generally according to the Global Industry Classification Standard, which was developed by and is the exclusive property and a service mark of MSCI Inc. and Standard & Poor’s. |
9 Invesco Equity and Income Fund
Schedule of Investments(a)
August 31, 2015
| Shares | Value | |||||||
Common Stocks & Other Equity Interests–63.71% |
| |||||||
| Aerospace & Defense–0.86% | ||||||||
General Dynamics Corp. | 816,564 | $ | 115,976,585 | |||||
| Agricultural Products–0.85% | ||||||||
Archer-Daniels-Midland Co. | 2,521,996 | 113,464,600 | ||||||
| Application Software–1.12% | ||||||||
Adobe Systems Inc.(b) | 963,557 | 75,706,673 | ||||||
Citrix Systems, Inc.(b) | 1,093,790 | 74,498,037 | ||||||
| 150,204,710 | ||||||||
| Asset Management & Custody Banks–1.69% | ||||||||
Northern Trust Corp. | 1,328,082 | 92,753,247 | ||||||
State Street Corp. | 1,869,352 | 134,443,796 | ||||||
| 227,197,043 | ||||||||
| Automobile Manufacturers–0.51% | ||||||||
General Motors Co. | 2,325,585 | 68,465,222 | ||||||
| Biotechnology–0.88% | ||||||||
Amgen Inc. | 496,208 | 75,314,450 | ||||||
Baxalta Inc.(b) | 1,224,758 | 43,050,244 | ||||||
| 118,364,694 | ||||||||
| Broadcasting–0.17% | ||||||||
CBS Corp.–Class B | 507,111 | 22,941,702 | ||||||
| Cable & Satellite–1.58% | ||||||||
Comcast Corp.–Class A | 2,190,490 | 123,390,302 | ||||||
Time Warner Cable Inc. | 478,258 | 88,965,553 | ||||||
| 212,355,855 | ||||||||
| Communications Equipment–1.72% | ||||||||
Cisco Systems, Inc. | 5,206,480 | 134,743,702 | ||||||
Juniper Networks, Inc. | 3,731,964 | 95,948,795 | ||||||
| 230,692,497 | ||||||||
| Construction Machinery & Heavy Trucks–0.52% | ||||||||
Caterpillar Inc. | 918,117 | 70,180,864 | ||||||
| Data Processing & Outsourced Services–0.68% | ||||||||
PayPal Holdings, Inc.(b) | 2,610,606 | 91,371,210 | ||||||
| Diversified Banks–8.69% | ||||||||
Bank of America Corp. | 14,732,714 | 240,732,547 | ||||||
Citigroup Inc. | 8,049,359 | 430,479,719 | ||||||
Comerica Inc. | 1,936,708 | 85,215,152 | ||||||
JPMorgan Chase & Co. | 6,404,012 | 410,497,169 | ||||||
| 1,166,924,587 | ||||||||
| Electric Utilities–0.35% | ||||||||
FirstEnergy Corp. | 1,449,825 | 46,336,407 | ||||||
| Electronic Components–0.55% | ||||||||
Corning Inc. | 4,314,744 | 74,256,744 | ||||||
| Shares | Value | |||||||
| Fertilizers & Agricultural Chemicals–0.52% | ||||||||
Mosaic Co. (The) | 1,691,241 | $ | 69,053,370 | |||||
| Food Distributors–0.07% | ||||||||
Sysco Corp. | 227,055 | 9,052,683 | ||||||
| General Merchandise Stores–1.24% | ||||||||
Target Corp. | 2,147,830 | 166,907,869 | ||||||
| Health Care Equipment–1.33% | ||||||||
Baxter International Inc. | 1,721,161 | 66,178,640 | ||||||
Medtronic PLC | 1,560,274 | 112,792,208 | ||||||
| 178,970,848 | ||||||||
| Health Care Services–0.53% | ||||||||
Express Scripts Holding Co.(b) | 845,545 | 70,687,562 | ||||||
| Hotels, Resorts & Cruise Lines–1.16% | ||||||||
Carnival Corp. | 3,163,553 | 155,741,714 | ||||||
| Household Products–0.79% | ||||||||
Procter & Gamble Co. (The) | 1,507,640 | 106,544,919 | ||||||
| Hypermarkets & Super Centers–1.04% | ||||||||
Wal-Mart Stores, Inc. | 2,155,555 | 139,529,075 | ||||||
| Industrial Conglomerates–1.94% | ||||||||
General Electric Co. | 10,494,691 | 260,478,231 | ||||||
| Industrial Machinery–0.69% | ||||||||
Ingersoll-Rand PLC | 1,663,691 | 91,985,475 | ||||||
| Insurance Brokers–1.96% | ||||||||
Aon PLC | 987,640 | 92,285,082 | ||||||
Marsh & McLennan Cos., Inc. | 1,760,784 | 94,606,924 | ||||||
Willis Group Holdings PLC | 1,778,169 | 76,621,302 | ||||||
| 263,513,308 | ||||||||
| Integrated Oil & Gas–3.23% | ||||||||
Exxon Mobil Corp. | 970,016 | 72,984,004 | ||||||
Occidental Petroleum Corp. | 1,219,429 | 89,030,511 | ||||||
Royal Dutch Shell PLC–Class A (United Kingdom) | 6,727,771 | 174,363,464 | ||||||
TOTAL S.A. (France) | 2,135,273 | 97,140,399 | ||||||
| 433,518,378 | ||||||||
| Integrated Telecommunication Services–1.12% | ||||||||
Koninklijke KPN N.V. (Netherlands) | 6,446,001 | 25,052,503 | ||||||
Orange S.A. (France) | 1,440,950 | 22,781,980 | ||||||
Telecom Italia S.p.A. (Italy)(b) | 13,461,916 | 16,359,382 | ||||||
Telefónica, S.A. (Spain) | 1,047,883 | 14,779,060 | ||||||
Verizon Communications Inc. | 1,535,929 | 70,668,094 | ||||||
| 149,641,019 | ||||||||
| Internet Software & Services–0.70% | ||||||||
eBay Inc.(b) | 3,484,486 | 94,464,415 | ||||||
See accompanying Notes to Financial Statements which are an integral part of the financial statements.
10 Invesco Equity and Income Fund
| Shares | Value | |||||||
| Investment Banking & Brokerage–2.96% | ||||||||
Charles Schwab Corp. (The) | 3,338,662 | $ | 101,428,551 | |||||
Goldman Sachs Group, Inc. (The) | 518,948 | 97,873,593 | ||||||
Morgan Stanley | 5,766,969 | 198,672,082 | ||||||
| 397,974,226 | ||||||||
| IT Consulting & Other Services–0.91% | ||||||||
Amdocs Ltd. | 2,134,021 | 122,087,341 | ||||||
| Managed Health Care–1.11% | ||||||||
Anthem, Inc. | 568,030 | 80,120,631 | ||||||
UnitedHealth Group Inc. | 596,964 | 69,068,735 | ||||||
| 149,189,366 | ||||||||
| Movies & Entertainment–0.46% | ||||||||
Time Warner Inc. | 443,050 | 31,500,855 | ||||||
Viacom Inc.–Class B | 741,840 | 30,244,817 | ||||||
| 61,745,672 | ||||||||
| Multi-Utilities–0.42% | ||||||||
PG&E Corp. | 1,141,562 | 56,598,644 | ||||||
| Oil & Gas Equipment & Services–0.78% | ||||||||
Baker Hughes Inc. | 1,730,357 | 96,899,992 | ||||||
Weatherford International PLC(b) | 701,076 | 7,115,921 | ||||||
| 104,015,913 | ||||||||
| Oil & Gas Exploration & Production–1.87% | ||||||||
Anadarko Petroleum Corp. | 774,876 | 55,465,624 | ||||||
Apache Corp. | 2,621,306 | 118,587,884 | ||||||
Canadian Natural Resources Ltd. (Canada) | 3,438,991 | 77,499,493 | ||||||
| 251,553,001 | ||||||||
| Other Diversified Financial Services–0.99% | ||||||||
Voya Financial, Inc. | 3,092,330 | 133,217,576 | ||||||
| Packaged Foods & Meats–0.86% | ||||||||
Mondelez International Inc.–Class A | 2,714,661 | 114,993,040 | ||||||
| Pharmaceuticals–5.28% | ||||||||
Eli Lilly and Co. | 1,355,699 | 111,641,813 | ||||||
Merck & Co., Inc. | 3,016,538 | 162,440,571 | ||||||
Novartis AG (Switzerland) | 1,280,464 | 125,125,485 | ||||||
Pfizer Inc. | 2,798,001 | 90,151,592 | ||||||
Sanofi (France) | 1,001,019 | 98,431,062 | ||||||
Teva Pharmaceutical Industries Ltd.–ADR (Israel) | 1,871,911 | 120,569,788 | ||||||
| 708,360,311 | ||||||||
| Publishing–0.54% | ||||||||
Thomson Reuters Corp. | 1,869,055 | 72,705,203 | ||||||
| Railroads–0.63% | ||||||||
CSX Corp. | 3,087,108 | 84,525,017 | ||||||
| Regional Banks–3.86% | ||||||||
BB&T Corp. | 1,995,806 | 73,685,158 | ||||||
Citizens Financial Group Inc. | 5,240,430 | 130,067,473 | ||||||
| Shares | Value | |||||||
| Regional Banks–(continued) | ||||||||
Fifth Third Bancorp | 4,791,674 | $ | 95,450,146 | |||||
First Horizon National Corp. | 4,009,904 | 58,263,905 | ||||||
PNC Financial Services Group, Inc. (The) | 1,764,604 | 160,790,716 | ||||||
| 518,257,398 | ||||||||
| Security & Alarm Services–0.82% | ||||||||
Tyco International PLC | 3,035,230 | 110,148,497 | ||||||
| Semiconductor Equipment–0.62% | ||||||||
Applied Materials, Inc. | 5,181,224 | 83,339,988 | ||||||
| Semiconductors–1.09% | ||||||||
Broadcom Corp.–Class A | 958,353 | 49,518,100 | ||||||
Intel Corp. | 3,401,989 | 97,092,766 | ||||||
| 146,610,866 | ||||||||
| Specialized Finance–0.47% | ||||||||
CME Group Inc.–Class A | 673,454 | 63,600,996 | ||||||
| Systems Software–1.47% | ||||||||
Microsoft Corp. | 2,285,681 | 99,472,837 | ||||||
Symantec Corp. | 4,753,753 | 97,404,399 | ||||||
| 196,877,236 | ||||||||
| Technology Hardware, Storage & Peripherals–0.54% | ||||||||
NetApp, Inc. | 2,281,192 | 72,906,896 | ||||||
| Tobacco–0.88% | ||||||||
Philip Morris International Inc. | 1,478,441 | 117,979,592 | ||||||
| Wireless Telecommunication Services–0.66% | ||||||||
Vodafone Group PLC–ADR (United Kingdom) | 2,583,256 | 89,070,667 | ||||||
Total Common Stocks & Other Equity Interests |
| 8,554,579,032 | ||||||
| Principal Amount | ||||||||
Bonds and Notes–22.46% |
| |||||||
| Advertising–0.03% | ||||||||
Interpublic Group of Cos., Inc. (The), Sr. Unsec. Global Notes, 2.25%, 11/15/17 | $ | 4,145,000 | 4,159,081 | |||||
| Aerospace & Defense–0.20% | ||||||||
Boeing Capital Corp., Sr. Unsec. Notes, 2.13%, 08/15/16 | 10,000,000 | 10,117,280 | ||||||
L-3 Communications Corp., Sr. Unsec. Gtd. Global Notes, 3.95%, 05/28/24 | 4,355,000 | 4,141,124 | ||||||
Lockheed Martin Corp., Sr. Unsec. Global Notes, 2.13%, 09/15/16 | 6,515,000 | 6,590,114 | ||||||
Northrop Grumman Corp., Sr. Unsec. Global Notes, 3.85%, 04/15/45 | 1,938,000 | 1,692,976 | ||||||
Precision Castparts Corp., Sr. Unsec. Global Notes, 2.50%, 01/15/23 | 4,150,000 | 3,963,412 | ||||||
| 26,504,906 | ||||||||
See accompanying Notes to Financial Statements which are an integral part of the financial statements.
11 Invesco Equity and Income Fund
| Principal Amount | Value | |||||||
| Agricultural & Farm Machinery–0.11% | ||||||||
Deere & Co., Sr. Unsec. Notes, 2.60%, 06/08/22 | $ | 14,645,000 | $ | 14,306,561 | ||||
| Agricultural Products–0.03% | ||||||||
Ingredion Inc., Sr. Unsec. Notes, 6.63%, 04/15/37 | 3,940,000 | 4,704,325 | ||||||
| Air Freight & Logistics–0.29% | ||||||||
FedEx Corp., | 4,310,000 | 4,474,888 | ||||||
Sr. Unsec. Gtd. Notes, 5.10%, 01/15/44 | 8,875,000 | 9,160,140 | ||||||
UTi Worldwide Inc., Sr. Unsec. Conv. Bonds, 4.50%, 03/01/19 | 29,179,000 | 25,367,493 | ||||||
| 39,002,521 | ||||||||
| Airlines–0.22% | ||||||||
American Airlines Pass Through Trust, Series 2014-1, Class A, Sr. Sec. First Lien Pass Through Ctfs., 3.70%, 10/01/26 | 4,387,526 | 4,362,846 | ||||||
Continental Airlines Pass Through Trust, | 2,458,226 | 2,618,011 | ||||||
Series 2010-1, Class A, | 3,721,292 | 3,934,103 | ||||||
Series 2012-1, Class A, | 5,183,985 | 5,307,104 | ||||||
Delta Air Lines Pass Through Trust, Series 2010-1, Class A, Sr. Sec. First Lien Pass Through Ctfs., 6.20%, 07/02/18 | 1,891,366 | 2,046,221 | ||||||
United Airlines Pass Through Trust, Series 2014-2, Class A, Sr. Sec. First Lien Pass Through Ctfs., 3.75%, 09/03/26 | 5,455,000 | 5,478,866 | ||||||
Virgin Australia Pass Through Trust (Australia), Series 2013-1, Class A, Sec. Gtd. Pass Through Ctfs., 5.00%, 10/23/23(c) | 5,381,616 | 5,580,359 | ||||||
| 29,327,510 | ||||||||
| Apparel Retail–0.03% | ||||||||
Ross Stores, Inc., Sr. Unsec. Notes, 3.38%, 09/15/24 | 3,638,000 | 3,578,249 | ||||||
| Apparel, Accessories & Luxury Goods–0.10% | ||||||||
Iconix Brand Group Inc., | 8,015,000 | 6,532,225 | ||||||
Sr. Unsec. Sub. Conv. Notes, 2.50%, 06/01/16 | 6,557,000 | 6,253,739 | ||||||
| 12,785,964 | ||||||||
| Principal Amount | Value | |||||||
| Application Software–0.36% | ||||||||
Citrix Systems, Inc., Sr. Unsec. Conv. Bonds, 0.50%, 04/15/19 | $ | 46,415,000 | $ | 48,822,778 | ||||
| Asset Management & Custody Banks–0.08% | ||||||||
Apollo Management Holdings L.P., Sr. Unsec. Gtd. Notes, 4.00%, 05/30/24(c) | 4,260,000 | 4,261,073 | ||||||
Blackstone Holdings Finance Co. LLC, Sr. Unsec. Gtd. Notes, 5.00%, 06/15/44(c) | 3,975,000 | 4,036,289 | ||||||
KKR Group Finance Co. III LLC, Sr. Unsec. Gtd. Bonds, 5.13%, 06/01/44(c) | 3,217,000 | 3,116,126 | ||||||
| 11,413,488 | ||||||||
| Automobile Manufacturers–0.24% | ||||||||
Daimler Finance North America LLC (Germany), Sr. Unsec. Gtd. Notes, 1.88%, 01/11/18(c) | 5,220,000 | 5,223,690 | ||||||
Ford Motor Credit Co. LLC, Sr. Unsec. Global Notes, 2.50%, 01/15/16 | 20,370,000 | 20,481,994 | ||||||
4.13%, 08/04/25 | 7,006,000 | 6,946,523 | ||||||
| 32,652,207 | ||||||||
| Automotive Retail–0.11% | ||||||||
Advance Auto Parts, Inc., Sr. Unsec. Gtd. Notes, | 6,415,000 | 6,647,441 | ||||||
5.75%, 05/01/20 | 7,393,000 | 8,191,873 | ||||||
| 14,839,314 | ||||||||
| Biotechnology–0.49% | ||||||||
Amgen Inc., Sr. Unsec. Notes, 2.30%, 06/15/16 | 7,477,000 | 7,549,048 | ||||||
BioMarin Pharmaceutical Inc., Sr. Unsec. Sub. Conv. Notes, 1.50%, 10/15/20 | 21,842,000 | 33,704,936 | ||||||
Celgene Corp., Sr. Unsec. Global Notes, | 4,735,000 | 4,799,581 | ||||||
4.63%, 05/15/44 | 13,875,000 | 13,087,587 | ||||||
5.00%, 08/15/45 | 1,714,000 | 1,719,501 | ||||||
Gilead Sciences, Inc., Sr. Unsec. Global Notes, 4.40%, 12/01/21 | 4,988,000 | 5,349,603 | ||||||
| 66,210,256 | ||||||||
| Broadcasting–0.46% | ||||||||
Grupo Televisa S.A.B. (Mexico), Sr. Unsec. Global Notes, 5.00%, 05/13/45 | 3,000,000 | 2,760,459 | ||||||
Liberty Media Corp., Sr. Unsec. Conv. Bonds, 1.38%, 10/15/23 | 61,171,000 | 59,412,334 | ||||||
| 62,172,793 | ||||||||
| Cable & Satellite–0.41% | ||||||||
CCO Safari II, LLC, Sr. Sec. Gtd. First Lien Notes, 4.91%, 07/23/25(c) | 10,845,000 | 10,767,871 | ||||||
See accompanying Notes to Financial Statements which are an integral part of the financial statements.
12 Invesco Equity and Income Fund
| Principal Amount | Value | |||||||
| Cable & Satellite–(continued) | ||||||||
Comcast Corp., | $ | 1,605,000 | $ | 1,587,618 | ||||
5.70%, 05/15/18 | 4,735,000 | 5,232,776 | ||||||
Sr. Unsec. Gtd. Notes, 4.40%, 08/15/35 | 7,245,000 | 7,264,906 | ||||||
6.45%, 03/15/37 | 2,465,000 | 3,061,022 | ||||||
Cox Communications, Inc., Sr. Unsec. Deb., 7.25%, 11/15/15 | 5,000,000 | 5,064,505 | ||||||
Sr. Unsec. Notes, 4.70%, | 4,980,000 | 4,270,547 | ||||||
6.25%, 06/01/18(c) | 3,700,000 | 4,067,830 | ||||||
8.38%, 03/01/39(c) | 655,000 | 812,135 | ||||||
DIRECTV Holdings LLC/DIRECTV Financing Co., Inc., Sr. Unsec. Gtd. Global Notes, | 3,340,000 | 3,313,375 | ||||||
5.15%, 03/15/42 | 1,370,000 | 1,287,280 | ||||||
NBCUniversal Media LLC, Sr. Unsec. Gtd. Global Notes, 5.15%, 04/30/20 | 3,320,000 | 3,716,468 | ||||||
5.95%, 04/01/41 | 3,365,000 | 4,021,528 | ||||||
| 54,467,861 | ||||||||
| Catalog Retail–0.24% | ||||||||
Liberty Interactive LLC, Sr. Unsec. Conv. Global Deb., 0.75%, 03/30/23(d) | 15,395,000 | 23,968,091 | ||||||
QVC, Inc., Sr. Sec. Gtd. First Lien Global Notes, 5.45%, 08/15/34 | 8,810,000 | 7,819,571 | ||||||
| 31,787,662 | ||||||||
| Commodity Chemicals–0.07% | ||||||||
Montell Finance Co. B.V. (Netherlands), Sr. Unsec. Gtd. Deb., 8.10%, 03/15/27(c) | 7,384,000 | 9,633,004 | ||||||
| Communications Equipment–0.39% | ||||||||
Ciena Corp., Sr. Unsec. Conv. Notes, 4.00%, 12/15/20(c) | 14,876,000 | 20,287,145 | ||||||
QUALCOMM Inc., Sr. Unsec. Global Notes, 3.00%, 05/20/22 | 3,325,000 | 3,232,134 | ||||||
Viavi Solutions Inc., Sr. Unsec. Conv. Deb., 0.63%, 08/15/18(d) | 31,263,000 | 29,015,972 | ||||||
| 52,535,251 | ||||||||
| Consumer Finance–0.36% | ||||||||
American Express Co., Unsec. Sub. Global Notes, 3.63%, 12/05/24 | 3,423,000 | 3,362,242 | ||||||
American Express Credit Corp., Sr. Unsec. Medium-Term Notes, 2.75%, 09/15/15 | 27,545,000 | 27,565,466 | ||||||
Capital One Financial Corp., Sr. Unsec. Global Notes, 1.00%, 11/06/15 | 17,827,000 | 17,834,032 | ||||||
| 48,761,740 | ||||||||
| Principal Amount | Value | |||||||
| Data Processing & Outsourced Services–0.09% | ||||||||
Computer Sciences Corp., Sr. Unsec. Global Notes, 4.45%, 09/15/22 | $ | 4,954,000 | $ | 5,074,355 | ||||
Xerox Corp., Sr. Unsec. Global Notes, 4.80%, 03/01/35 | 7,279,000 | 6,658,753 | ||||||
| 11,733,108 | ||||||||
| Diversified Banks–1.84% | ||||||||
Abbey National Treasury Services PLC (United Kingdom), Sr. Unsec. Gtd. Global Notes, 4.00%, 04/27/16 | 21,928,000 | 22,373,073 | ||||||
ABN AMRO Bank N.V. (Netherlands), Sr. Unsec. Notes, 1.38%, | 16,795,000 | 16,834,678 | ||||||
Australia and New Zealand Banking Group Ltd. (Australia), Sr. Unsec. Global Notes, 0.90%, 02/12/16 | 9,510,000 | 9,526,105 | ||||||
Bank of America Corp., | 2,825,000 | 3,054,836 | ||||||
Sr. Unsec. Medium-Term Global Notes, 5.65%, 05/01/18 | 8,680,000 | 9,452,251 | ||||||
Sr. Unsec. Medium-Term Notes, 1.25%, 01/11/16 | 6,465,000 | 6,476,618 | ||||||
Barclays Bank PLC (United Kingdom), Series BKNT, Sr. Unsec. Global Notes, 6.75%, 05/22/19 | 8,500,000 | 9,859,443 | ||||||
BBVA Bancomer S.A. (Mexico), Sr. Unsec. Notes, 4.38%, | 6,875,000 | 6,916,721 | ||||||
Bear Stearns Cos., LLC (The), Sr. Unsec. Global Notes, 7.25%, 02/01/18 | 8,140,000 | 9,131,871 | ||||||
BNP Paribas S.A. (France), Unsec. Sub. Medium-Term Notes, 4.25%, 10/15/24 | 5,010,000 | 4,995,045 | ||||||
Citigroup Inc., Unsec. Sub. Global Notes, | 2,765,000 | 2,890,859 | ||||||
6.68%, 09/13/43 | 8,000,000 | 9,911,252 | ||||||
Danske Bank A/S (Denmark), Sr. Unsec. Notes, 3.88%, | 9,435,000 | 9,598,726 | ||||||
HBOS PLC (United Kingdom), Unsec. Sub. Medium-Term Global Notes, 6.75%, 05/21/18(c) | 8,535,000 | 9,413,162 | ||||||
HSBC Finance Corp., Sr. Unsec. Global Notes, 5.50%, 01/19/16 | 16,910,000 | 17,205,181 | ||||||
JPMorgan Chase & Co., | 6,410,000 | 6,249,750 | ||||||
Series X, Jr. Unsec. Sub. Global Notes, 6.10%(e) | 10,895,000 | 10,895,000 | ||||||
Series Z, Jr. Unsec. Sub. Global Notes, 5.30%(e) | 7,145,000 | 7,082,481 | ||||||
Lloyds Bank PLC (United Kingdom), Sr. Unsec. Gtd. Global Notes, 2.30%, 11/27/18 | 5,240,000 | 5,274,348 | ||||||
See accompanying Notes to Financial Statements which are an integral part of the financial statements.
13 Invesco Equity and Income Fund
| Principal Amount | Value | |||||||
| Diversified Banks–(continued) | ||||||||
Mizuho Financial Group Cayman 3 Ltd. (Japan), Unsec. Gtd. Sub. Notes, 4.60%, 03/27/24(c) | $ | 545,000 | $ | 553,497 | ||||
Santander Holdings USA Inc., Sr. Unsec. Global Notes, 3.00%, 09/24/15 | 16,313,000 | 16,324,672 | ||||||
Societe Generale S.A. (France), Unsec. Sub. Notes, 5.00%, 01/17/24(c) | 7,365,000 | 7,521,510 | ||||||
Standard Chartered PLC (United Kingdom), Unsec. Sub. Notes, 5.70%, 03/26/44(c) | 4,170,000 | 4,240,129 | ||||||
Sumitomo Mitsui Banking Corp. (Japan), Sr. Unsec. Gtd. Medium-Term Global Notes, 2.65%, 07/23/20 | 7,235,000 | 7,267,015 | ||||||
Wells Fargo & Co., | 2,070,000 | 2,065,491 | ||||||
Sr. Unsec. Notes, 3.90%, 05/01/45 | 14,525,000 | 13,307,369 | ||||||
Unsec. Sub. Medium-Term Notes, 4.10%, 06/03/26 | 4,515,000 | 4,530,622 | ||||||
4.65%, 11/04/44 | 14,430,000 | 14,093,355 | ||||||
| 247,045,060 | ||||||||
| Diversified Capital Markets–0.05% | ||||||||
Credit Suisse AG (Switzerland), Unsec. Sub. Notes, 6.50%, 08/08/23(c) | 6,536,000 | 7,140,100 | ||||||
| Diversified Chemicals–0.06% | ||||||||
Eastman Chemical Co., Sr. Unsec. Global Notes, 2.70%, 01/15/20 | 8,092,000 | 8,038,119 | ||||||
| Diversified Metals & Mining–0.14% | ||||||||
Glencore Finance Canada Ltd. (Switzerland), Sr. Unsec. Gtd. Notes, | 4,700,000 | 4,706,030 | ||||||
2.70%, 10/25/17(c) | 4,700,000 | 4,581,950 | ||||||
Rio Tinto Finance USA Ltd. (United Kingdom), Sr. Unsec. Gtd. Global Notes, | 2,175,000 | 2,730,516 | ||||||
9.00%, 05/01/19 | 5,240,000 | 6,450,547 | ||||||
| 18,469,043 | ||||||||
| Diversified Real Estate Activities–0.06% | ||||||||
Brookfield Asset Management Inc. (Canada), Sr. Unsec. Yankee Notes, 4.00%, 01/15/25 | 7,670,000 | 7,552,277 | ||||||
| Diversified Support Services–0.03% | ||||||||
Cintas Corp. No. 2, Sr. Unsec. Gtd. Notes, 2.85%, 06/01/16 | 4,605,000 | 4,666,587 | ||||||
| Drug Retail–0.18% | ||||||||
CVS Health Corp., Sr. Unsec. Global Bonds, 3.38%, 08/12/24 | 3,740,000 | 3,679,083 | ||||||
| Principal Amount | Value | |||||||
| Drug Retail–(continued) | ||||||||
CVS Pass Through Trust, Sr. Sec. First Lien Global Pass Through Ctfs., 6.04%, 12/10/28 | $ | 8,947,920 | $ | 10,113,374 | ||||
Walgreens Boots Alliance Inc., Sr. Unsec. Gtd. Global Notes, 3.30%, 11/18/21 | 6,129,000 | 6,076,848 | ||||||
4.50%, 11/18/34 | 4,519,000 | 4,168,775 | ||||||
| 24,038,080 | ||||||||
| Electric Utilities–0.50% | ||||||||
Electricite de France S.A. (France), | 8,670,000 | 8,813,055 | ||||||
Sr. Unsec. Notes, | 2,150,000 | 2,359,278 | ||||||
4.88%, 01/22/44(c) | 9,110,000 | 9,562,020 | ||||||
Georgia Power Co., Sr. Unsec. Notes, 3.00%, 04/15/16 | 8,795,000 | 8,909,243 | ||||||
Louisville Gas & Electric Co., Sr. Sec. First Mortgage Global Bonds, 1.63%, 11/15/15 | 5,525,000 | 5,536,746 | ||||||
NextEra Energy Capital Holdings Inc., Sr. Unsec. Gtd. Deb., 2.60%, 09/01/15 | 14,910,000 | 14,910,000 | ||||||
Ohio Power Co., Series M, Sr. Unsec. Notes, 5.38%, 10/01/21 | 1,050,000 | 1,195,277 | ||||||
PPL Electric Utilities Corp., Sr. Sec. First Mortgage Bonds, 6.25%, 05/15/39 | 355,000 | 453,550 | ||||||
Southern Co. (The), Series A, Sr. Unsec. Notes, 2.38%, 09/15/15 | 15,960,000 | 15,970,175 | ||||||
| 67,709,344 | ||||||||
| Electrical Components & Equipment–0.11% | ||||||||
Eaton Corp., Sr. Unsec. Gtd. Global Notes, 0.95%, 11/02/15 | 14,550,000 | 14,554,874 | ||||||
| Environmental & Facilities Services–0.03% | ||||||||
Waste Management, Inc., Sr. Unsec. Gtd. Global Notes, 3.90%, 03/01/35 | 4,786,000 | 4,410,572 | ||||||
| Fertilizers & Agricultural Chemicals–0.04% | ||||||||
Monsanto Co., Sr. Unsec. Global Notes, | 3,055,000 | 3,037,214 | ||||||
3.38%, 07/15/24 | 2,085,000 | 2,006,671 | ||||||
| 5,043,885 | ||||||||
| Food Retail–0.08% | ||||||||
Kraft Heinz Co. (The), Sr. Unsec. Gtd. Notes, 1.60%, 06/30/17(c) | 10,860,000 | 10,850,101 | ||||||
| General Merchandise Stores–0.21% | ||||||||
Dollar General Corp., Sr. Unsec. Global Notes, 3.25%, 04/15/23 | 3,650,000 | 3,471,824 | ||||||
See accompanying Notes to Financial Statements which are an integral part of the financial statements.
14 Invesco Equity and Income Fund
| Principal Amount | Value | |||||||
| General Merchandise Stores–(continued) | ||||||||
Target Corp., | $ | 9,830,000 | $ | 9,904,290 | ||||
Sr. Unsec. Notes, 5.88%, 07/15/16 | 14,510,000 | 15,160,055 | ||||||
| 28,536,169 | ||||||||
| Gold–0.01% | ||||||||
Newmont Mining Corp., Sr. Unsec. Gtd. Global Notes, 3.50%, 03/15/22 | 1,423,000 | 1,296,377 | ||||||
| Health Care Distributors–0.08% | ||||||||
McKesson Corp., Sr. Unsec. Global Notes, 2.28%, 03/15/19 | 11,085,000 | 11,111,632 | ||||||
| Health Care Equipment–0.67% | ||||||||
Becton, Dickinson and Co., | 7,465,000 | 7,505,905 | ||||||
Sr. Unsec. Global Notes, 3.88%, 05/15/24 | 6,825,000 | 6,897,976 | ||||||
Sr. Unsec. Notes, 2.68%, 12/15/19 | 3,198,000 | 3,207,229 | ||||||
Edwards Lifesciences Corp., Sr. Unsec. Global Notes, 2.88%, 10/15/18 | 7,055,000 | 7,165,827 | ||||||
Medtronic Inc., | 5,720,000 | 5,220,776 | ||||||
4.63%, 03/15/44 | 5,490,000 | 5,495,081 | ||||||
Sr. Unsec. Gtd. Notes, 3.15%, 03/15/22(c) | 10,944,000 | 10,944,317 | ||||||
4.38%, 03/15/35(c) | 3,883,000 | 3,850,684 | ||||||
NuVasive Inc., Sr. Unsec. Conv. Notes, 2.75%, 07/01/17 | 13,684,000 | 18,610,240 | ||||||
Wright Medical Group, Inc., Sr. Unsec. Conv. Notes, 2.00%, 02/15/20(c) | 20,807,000 | 20,624,939 | ||||||
| 89,522,974 | ||||||||
| Health Care Facilities–0.52% | ||||||||
Brookdale Senior Living Inc., Sr. Unsec. Conv. Notes, 2.75%, 06/15/18 | 24,795,000 | 28,219,809 | ||||||
HealthSouth Corp., Sr. Unsec. Sub. Conv. Notes, 2.00%, 12/01/20(d) | 33,605,000 | 41,103,116 | ||||||
| 69,322,925 | ||||||||
| Health Care REIT’s–0.15% | ||||||||
HCP, Inc., Sr. Unsec. Global Notes, | 5,085,000 | 4,922,313 | ||||||
4.20%, 03/01/24 | 4,690,000 | 4,673,625 | ||||||
Senior Housing Properties Trust, Sr. Unsec. Notes, 4.30%, 01/15/16 | 6,620,000 | 6,661,375 | ||||||
Ventas Realty L.P., Sr. Unsec. Gtd. Notes, 5.70%, 09/30/43 | 2,080,000 | 2,268,708 | ||||||
| Principal Amount | Value | |||||||
| Health Care REIT’s–(continued) | ||||||||
Ventas Realty L.P./Ventas Capital Corp., Sr. Unsec. Gtd. Notes, 4.25%, 03/01/22 | $ | 1,905,000 | $ | 1,963,953 | ||||
| 20,489,974 | ||||||||
| Health Care Services–0.30% | ||||||||
Express Scripts Holding Co., | 9,380,000 | 9,288,048 | ||||||
Sr. Unsec. Gtd. Notes, | 18,659,000 | 18,912,296 | ||||||
Laboratory Corp. of America Holdings, Sr. Unsec. Notes, 3.20%, 02/01/22 | 6,132,000 | 6,003,102 | ||||||
4.70%, 02/01/45 | 2,694,000 | 2,462,215 | ||||||
Medco Health Solutions Inc., Sr. Unsec. Gtd. Notes, 2.75%, 09/15/15 | 3,535,000 | 3,537,540 | ||||||
| 40,203,201 | ||||||||
| Homebuilding–0.06% | ||||||||
MDC Holdings, Inc., Sr. Unsec. Gtd. Notes, 6.00%, 01/15/43 | 10,130,000 | 8,506,693 | ||||||
| Hotels, Resorts & Cruise Lines–0.01% | ||||||||
Wyndham Worldwide Corp., Sr. Unsec. Notes, 2.95%, 03/01/17 | 1,225,000 | 1,237,882 | ||||||
| Housewares & Specialties–0.09% | ||||||||
Tupperware Brands Corp., Sr. Unsec. Gtd. Global Notes, 4.75%, 06/01/21 | 12,185,000 | 12,628,400 | ||||||
| Hypermarkets & Super Centers–0.03% | ||||||||
Wal-Mart Stores, Inc., Sr. Unsec. Global Notes, | 3,610,000 | 3,643,925 | ||||||
6.50%, 08/15/37 | 730,000 | 948,754 | ||||||
| 4,592,679 | ||||||||
| Industrial Conglomerates–0.14% | ||||||||
General Electric Co., Sr. Unsec. Global Notes, 0.85%,10/09/15 | 18,135,000 | 18,144,739 | ||||||
| Industrial Machinery–0.18% | ||||||||
Pentair Finance S.A., Sr. Unsec. Gtd. Global Notes, 5.00%, 05/15/21 | 7,940,000 | 8,713,888 | ||||||
Valmont Industries, Inc., Sr. Unsec. Gtd. Global Notes, | 4,195,000 | 3,875,616 | ||||||
5.25%, 10/01/54 | 13,347,000 | 11,881,726 | ||||||
| 24,471,230 | ||||||||
| Insurance Brokers–0.03% | ||||||||
Marsh & McLennan Cos., Inc., Sr. Unsec. Global Notes, 4.05%, 10/15/23 | 3,960,000 | 4,080,309 | ||||||
See accompanying Notes to Financial Statements which are an integral part of the financial statements.
15 Invesco Equity and Income Fund
| Principal Amount | Value | |||||||
| Integrated Oil & Gas–0.24% | ||||||||
BP Capital Markets PLC (United Kingdom), Sr. Unsec. Gtd. Global Notes, 2.24%, 05/10/19 | $ | 5,302,000 | $ | 5,315,014 | ||||
Chevron Corp., Sr. Unsec. Global Notes, | 14,553,000 | 14,489,491 | ||||||
1.72%, 06/24/18 | 5,275,000 | 5,294,325 | ||||||
Husky Energy Inc. (Canada), Sr. Unsec. Global Notes, 3.95%, 04/15/22 | 3,630,000 | 3,541,165 | ||||||
Suncor Energy Inc. (Canada), Sr. Unsec. Yankee Notes, 3.60%, 12/01/24 | 3,379,000 | 3,329,345 | ||||||
| 31,969,340 | ||||||||
| Integrated Telecommunication Services–0.48% | ||||||||
AT&T Corp., Sr. Unsec. Gtd. Global Notes, 8.25%, 11/15/31 | 63,000 | 83,121 | ||||||
AT&T Inc., Sr. Unsec. Global Notes, | 5,334,000 | 5,122,822 | ||||||
3.40%, 05/15/25 | 2,967,000 | 2,818,147 | ||||||
4.50%, 05/15/35 | 4,755,000 | 4,369,867 | ||||||
5.35%, 09/01/40 | 2,077,000 | 2,040,743 | ||||||
6.15%, 09/15/34 | 3,675,000 | 3,964,081 | ||||||
British Telecommunications PLC (United Kingdom), Sr. Unsec. Global Notes, 1.25%, 02/14/17 | 5,420,000 | 5,408,474 | ||||||
Telefonica Emisiones S.A.U. (Spain), Sr. Unsec. Gtd. Global Notes, 7.05%, 06/20/36 | 3,600,000 | 4,369,385 | ||||||
Verizon Communications Inc., Sr. Unsec. Global Notes, | 3,285,000 | 3,028,745 | ||||||
4.52%, 09/15/48 | 19,069,000 | 16,877,266 | ||||||
5.01%, 08/21/54 | 6,727,000 | 6,172,927 | ||||||
5.15%, 09/15/23 | 4,525,000 | 4,951,203 | ||||||
6.40%, 09/15/33 | 1,352,000 | 1,550,840 | ||||||
6.40%, 02/15/38 | 3,500,000 | 3,957,464 | ||||||
| 64,715,085 | ||||||||
| Internet Retail–0.16% | ||||||||
Amazon.com, Inc., Sr. Unsec. Global Notes, 0.65%, 11/27/15 | 21,420,000 | 21,427,636 | ||||||
| Investment Banking & Brokerage–1.82% | ||||||||
Goldman Sachs Group, Inc. (The), Sr. Unsec. Global Notes, 5.25%, 07/27/21 | 5,510,000 | 6,123,092 | ||||||
6.15%, 04/01/18 | 10,325,000 | 11,386,864 | ||||||
Unsec. Sub. Global Notes, 6.75%, 10/01/37 | 4,585,000 | 5,444,513 | ||||||
Series 0000, Sr. Unsec. Exchangeable Basket-Linked Conv. Medium-Term Notes, 1.00%, 03/15/17(c)(f) | 61,461,000 | 83,124,159 | ||||||
1.00%, 09/28/20(c)(g) | 59,890,000 | 62,242,479 | ||||||
Jefferies Group LLC, Sr. Unsec. Conv. Deb., 3.88%, 11/01/17(d) | 30,876,000 | 31,474,223 | ||||||
| Principal Amount | Value | |||||||
| Investment Banking & Brokerage–(continued) | ||||||||
Lazard Group LLC, Sr. Unsec. Global Notes, 3.75%, 02/13/25 | $ | 11,653,000 | $ | 11,038,870 | ||||
Macquarie Bank Ltd. (Australia), Sr. Unsec. Notes, 5.00%, | 6,100,000 | 6,385,373 | ||||||
Morgan Stanley, | 8,140,000 | 10,094,479 | ||||||
Sr. Unsec. Medium-Term Global Notes, 4.00%, 07/23/25 | 6,870,000 | 6,988,205 | ||||||
Sr. Unsec. Notes, | 9,855,000 | 9,899,022 | ||||||
| 244,201,279 | ||||||||
| Life & Health Insurance–0.19% | ||||||||
Aegon N.V. (Netherlands), Sr. Unsec. Global Bonds, 4.63%, 12/01/15 | 12,442,000 | 12,543,029 | ||||||
Prudential Financial, Inc., | 4,010,000 | 4,216,964 | ||||||
Series D, Sr. Unsec. Disc. Medium-Term Notes, | 5,030,000 | 5,037,686 | ||||||
Sr. Unsec. Medium-Term Notes, 6.63%, 12/01/37 | 3,475,000 | 4,281,758 | ||||||
| 26,079,437 | ||||||||
| Managed Health Care–0.22% | ||||||||
Aetna, Inc., Sr. Unsec. Global Notes, 3.95%, 09/01/20 | 9,990,000 | 10,547,327 | ||||||
Anthem, Inc., Sr. Unsec. Global Notes, 1.25%, 09/10/15 | 19,318,000 | 19,319,951 | ||||||
| 29,867,278 | ||||||||
| Movies & Entertainment–0.11% | ||||||||
Live Nation Entertainment, Inc., Sr. Unsec. Conv. Bonds, 2.50%, 05/15/19 | 11,374,000 | 11,843,178 | ||||||
Viacom Inc., Sr. Unsec. Global Deb., 4.85%, 12/15/34 | 3,527,000 | 2,981,588 | ||||||
| 14,824,766 | ||||||||
| Multi-Line Insurance–0.22% | ||||||||
American International Group, Inc., Sr. Unsec. Global Notes, 2.30%, 07/16/19 | 3,855,000 | 3,850,424 | ||||||
4.38%, 01/15/55 | 7,405,000 | 6,689,107 | ||||||
Farmers Exchange Capital III, Unsec. Sub. Notes, 5.45%, 10/15/54(c) | 9,460,000 | 9,365,230 | ||||||
Nationwide Financial Services Inc., Sr. Unsec. Notes, 5.30%, | 9,220,000 | 9,372,250 | ||||||
| 29,277,011 | ||||||||
| Multi-Utilities–0.03% | ||||||||
Enable Midstream Partners L.P., Sr. Unsec. Gtd. Notes, 2.40%, 05/15/19(c) | 4,395,000 | 4,142,659 | ||||||
See accompanying Notes to Financial Statements which are an integral part of the financial statements.
16 Invesco Equity and Income Fund
| Principal Amount | Value | |||||||
| Office REIT’s–0.06% | ||||||||
Highwoods Realty L.P., Sr. Unsec. Notes, 3.20%, 06/15/21 | $ | 1,650,000 | $ | 1,627,392 | ||||
Piedmont Operating Partnership L.P., Sr. Unsec. Gtd. Global Notes, 4.45%, 03/15/24 | 6,115,000 | 6,158,386 | ||||||
| 7,785,778 | ||||||||
| Office Services & Supplies–0.04% | ||||||||
Pitney Bowes Inc., Sr. Unsec. Global Notes, 4.63%, 03/15/24 | 5,065,000 | 5,070,452 | ||||||
| Oil & Gas Drilling–0.07% | ||||||||
Noble Holding International Ltd., Sr. Unsec. Gtd. Global Notes, 2.50%, 03/15/17 | 1,150,000 | 1,124,778 | ||||||
Rowan Cos., Inc., Sr. Unsec. Gtd. Notes, | 3,671,000 | 2,545,741 | ||||||
5.85%, 01/15/44 | 7,719,000 | 5,615,314 | ||||||
| 9,285,833 | ||||||||
| Oil & Gas Equipment & Services–0.07% | ||||||||
Helix Energy Solutions Group, Inc., Sr. Unsec. Conv. Notes, 3.25%, 03/15/18(d) | 11,911,000 | 9,878,686 | ||||||
| Oil & Gas Exploration & Production–0.74% | ||||||||
Cobalt International Energy Inc., Sr. Unsec. Conv. Notes, 2.63%, 12/01/19 | 18,562,000 | 13,364,640 | ||||||
ConocoPhillips Co., Sr. Unsec. Gtd. Global Notes, | 8,738,000 | 8,663,133 | ||||||
4.15%, 11/15/34 | 9,367,000 | 8,788,368 | ||||||
Devon Energy Corp., Sr. Unsec. Global Notes, | 4,368,000 | 4,359,852 | ||||||
3.25%, 05/15/22 | 1,655,000 | 1,596,844 | ||||||
Marathon Oil Corp., Sr. Unsec. Notes, 0.90%, 11/01/15 | 21,730,000 | 21,724,220 | ||||||
Noble Energy, Inc., Sr. Unsec. Global Notes, 5.25%, 11/15/43 | 7,940,000 | 7,115,312 | ||||||
Petroleos Mexicanos (Mexico), Sr. Unsec. Gtd. Global Notes, 4.88%, 01/24/22 | 7,430,000 | 7,589,381 | ||||||
Southwestern Energy Co., Sr. Unsec. Global Notes, 4.10%, 03/15/22 | 6,279,000 | 5,708,609 | ||||||
Stone Energy Corp., Sr. Unsec. Gtd. Conv. Notes, 1.75%, 03/01/17 | 24,746,000 | 20,384,517 | ||||||
| 99,294,876 | ||||||||
| Oil & Gas Storage & Transportation–0.80% | ||||||||
Energy Transfer Partners, L.P., Sr. Unsec. Notes, 4.90%, 03/15/35 | 3,640,000 | 3,039,904 | ||||||
| Principal Amount | Value | |||||||
| Oil & Gas Storage & Transportation–(continued) | ||||||||
Enterprise Products Operating LLC, Sr. Unsec. Gtd. Global Bonds, 6.45%, 09/01/40 | $ | 555,000 | $ | 600,828 | ||||
Sr. Unsec. Gtd. Global Notes, 5.25%, 01/31/20 | 2,889,000 | 3,161,098 | ||||||
Sr. Unsec. Gtd. Notes, 2.55%, 10/15/19 | 3,770,000 | 3,753,463 | ||||||
3.20%, 02/01/16 | 21,585,000 | 21,762,202 | ||||||
Series N, Sr. Unsec. Gtd. Notes, 6.50%, 01/31/19 | 4,420,000 | 4,947,147 | ||||||
Kinder Morgan Inc., Sr. Unsec. Gtd. Notes, 5.30%, 12/01/34 | 5,398,000 | 4,681,721 | ||||||
Plains All American Pipeline L.P./ PAA Finance Corp., Sr. Unsec. Global Notes, 3.65%, 06/01/22 | 4,275,000 | 4,152,778 | ||||||
Spectra Energy Capital LLC, Sr. Unsec. Gtd. Notes, 7.50%, 09/15/38 | 2,245,000 | 2,431,647 | ||||||
Spectra Energy Partners, L.P., Sr. Unsec. Global Notes, 4.50%, 03/15/45 | 5,468,000 | 4,556,654 | ||||||
Sr. Unsec. Notes, 2.95%, 06/15/16 | 12,896,000 | 13,035,625 | ||||||
Sunoco Logistics Partners Operations L.P., Sr. Unsec. Gtd. Notes, | 8,165,000 | 6,817,689 | ||||||
5.50%, 02/15/20 | 5,405,000 | 5,834,562 | ||||||
Texas Eastern Transmission L.P., Sr. Unsec. Notes, 7.00%, 07/15/32 | 3,835,000 | 4,599,323 | ||||||
Western Gas Partners L.P., Sr. Unsec. Notes, 5.45%, 04/01/44 | 9,710,000 | 9,123,433 | ||||||
Williams Partners L.P., Sr. Unsec. Global Notes, | 9,003,000 | 7,368,829 | ||||||
5.40%, 03/04/44 | 9,000,000 | 7,631,807 | ||||||
| 107,498,710 | ||||||||
| Other Diversified Financial Services–0.07% | ||||||||
ERAC USA Finance LLC, Sr. Unsec. Gtd. Notes, 2.35%, 10/15/19(c) | 9,335,000 | 9,277,907 | ||||||
| Packaged Foods & Meats–0.37% | ||||||||
General Mills Inc., Sr. Unsec. Global Notes, 0.88%, 01/29/16 | 9,115,000 | 9,122,155 | ||||||
General Mills, Inc., Sr. Unsec. Global Notes, 2.20%, 10/21/19 | 8,595,000 | 8,573,702 | ||||||
Grupo Bimbo S.A.B. de C.V. (Mexico), Sr. Unsec. Gtd. Notes, 3.88%, 06/27/24(c) | 7,565,000 | 7,387,949 | ||||||
Mondelez International, Inc., Sr. Unsec. Global Notes, 4.13%, 02/09/16 | 20,000,000 | 20,283,430 | ||||||
Tyson Foods, Inc., Sr. Unsec. Gtd. Global Bonds, 4.88%, 08/15/34 | 2,136,000 | 2,121,830 | ||||||
5.15%, 08/15/44 | 2,202,000 | 2,238,948 | ||||||
| 49,728,014 | ||||||||
See accompanying Notes to Financial Statements which are an integral part of the financial statements.
17 Invesco Equity and Income Fund
| Principal Amount | Value | |||||||
| Paper Packaging–0.09% | ||||||||
Packaging Corp. of America, Sr. Unsec. Global Notes, 4.50%, 11/01/23 | $ | 11,003,000 | $ | 11,460,653 | ||||
| Paper Products–0.02% | ||||||||
International Paper Co., Sr. Unsec. Global Notes, 6.00%, 11/15/41 | 2,855,000 | 3,035,540 | ||||||
| Personal Products–0.10% | ||||||||
Unilever Capital Corp. (Netherlands), Sr. Unsec. Gtd. Global Notes, 2.75%, 02/10/16 | 13,005,000 | 13,132,475 | ||||||
| Pharmaceuticals–1.27% | ||||||||
AbbVie Inc., Sr. Unsec. Global Notes, | 30,195,000 | 30,224,078 | ||||||
4.50%, 05/14/35 | 7,233,000 | 6,923,359 | ||||||
Actavis Funding SCS, Sr. Unsec. Gtd. Global Notes, | 9,281,000 | 9,293,191 | ||||||
4.55%, 03/15/35 | 2,770,000 | 2,513,139 | ||||||
4.85%, 06/15/44 | 9,265,000 | 8,472,226 | ||||||
Allergan, Inc., Sr. Unsec. Gtd. Global Notes, 5.75%, 04/01/16 | 9,117,000 | 9,366,291 | ||||||
Bayer US Finance LLC (Germany), Sr. Unsec. Gtd. Notes, 3.00%, 10/08/21(c) | 6,079,000 | 6,117,064 | ||||||
Jazz Investments I Ltd., Sr. Unsec. Gtd. Conv. Bonds, 1.88%, 08/15/21 | 14,556,000 | 16,666,620 | ||||||
Merck & Co., Inc., Sr. Unsec. Global Notes, 0.70%, 05/18/16 | 19,405,000 | 19,431,633 | ||||||
Perrigo Co. PLC, Sr. Unsec. Global Notes, 2.30%, 11/08/18 | 3,945,000 | 3,938,585 | ||||||
Sanofi (France), Sr. Unsec. Global Notes, 2.63%, 03/29/16 | 28,540,000 | 28,885,148 | ||||||
Zoetis Inc., Sr. Unsec. Global Notes, | 25,605,000 | 25,632,154 | ||||||
4.70%, 02/01/43 | 4,101,000 | 3,571,750 | ||||||
| 171,035,238 | ||||||||
| Property & Casualty Insurance–0.28% | ||||||||
CNA Financial Corp., Sr. Unsec. Global Bonds, 5.88%, 08/15/20 | 4,915,000 | 5,545,506 | ||||||
Sr. Unsec. Notes, 7.35%, 11/15/19 | 425,000 | 500,601 | ||||||
Liberty Mutual Group Inc., Sr. Unsec. Gtd. Bonds, 4.85%, 08/01/44(c) | 6,360,000 | 6,034,298 | ||||||
Markel Corp., Sr. Unsec. Notes, 5.00%, 03/30/43 | 4,185,000 | 4,238,982 | ||||||
Old Republic International Corp., Sr. Unsec. Conv. Notes, 3.75%, 03/15/18 | 8,381,000 | 9,742,913 | ||||||
Travelers Cos., Inc. (The), Sr. Unsec. Global Notes, 4.60%, 08/01/43 | 6,455,000 | 6,646,539 | ||||||
| Principal Amount | Value | |||||||
| Property & Casualty Insurance–(continued) | ||||||||
WR Berkley Corp., Sr. Unsec. Global Notes, 4.63%, 03/15/22 | $ | 5,040,000 | $ | 5,343,045 | ||||
| 38,051,884 | ||||||||
| Railroads–0.24% | ||||||||
Burlington Northern Santa Fe, LLC, Sr. Unsec. Deb., 5.15%, 09/01/43 | 19,380,000 | 20,359,998 | ||||||
CSX Corp., Sr. Unsec. Notes, 5.50%, 04/15/41 | 1,660,000 | 1,827,809 | ||||||
Union Pacific Corp., Sr. Unsec. Notes, 4.15%, 01/15/45 | 4,410,000 | 4,250,861 | ||||||
4.85%, 06/15/44 | 5,560,000 | 5,976,230 | ||||||
| 32,414,898 | ||||||||
| Regional Banks–0.64% | ||||||||
BB&T Corp., Series A, Sr. Unsec. Medium-Term Notes, 3.20%, 03/15/16 | 17,762,000 | 17,951,449 | ||||||
Fifth Third Bancorp, Sr. Unsec. Notes, 3.63%, 01/25/16 | 27,480,000 | 27,776,482 | ||||||
PNC Bank, N.A., Series BKNT Sr. Unsec. Notes, 1.30%, 10/03/16 | 16,480,000 | 16,531,805 | ||||||
SunTrust Banks, Inc., Sr. Unsec. Notes, 3.60%, 04/15/16 | 23,334,000 | 23,674,315 | ||||||
| 85,934,051 | ||||||||
| Reinsurance–0.06% | ||||||||
Reinsurance Group of America, Inc., Sr. Unsec. Medium-Term Notes, 4.70%, 09/15/23 | 7,510,000 | 8,046,954 | ||||||
| Renewable Electricity–0.04% | ||||||||
Oglethorpe Power Corp., Sr. Sec. First Mortgage Bonds, 4.55%, 06/01/44 | 5,806,000 | 5,705,910 | ||||||
| Research & Consulting Services–0.04% | ||||||||
Verisk Analytics, Inc., Sr. Unsec. Global Notes, 5.50%, 06/15/45 | 5,065,000 | 5,035,501 | ||||||
| Semiconductor Equipment–0.37% | ||||||||
Lam Research Corp., | 6,120,000 | 5,791,065 | ||||||
Series B, Sr. Unsec. Conv. Notes, 1.25%, 05/15/18 | 33,039,000 | 43,879,922 | ||||||
| 49,670,987 | ||||||||
| Semiconductors–0.98% | ||||||||
Microchip Technology Inc., Sr. Unsec. Sub. Conv. Notes, 1.63%, | 18,228,000 | 17,179,890 | ||||||
Micron Technology, Inc., Series G, Sr. Unsec. Conv. Global Bonds, 3.00%, 11/15/28(d) | 31,699,000 | 27,895,120 | ||||||
NVIDIA Corp., Sr. Unsec. Conv. Bonds, 1.00%, 12/01/18 | 42,110,000 | 52,137,444 | ||||||
See accompanying Notes to Financial Statements which are an integral part of the financial statements.
18 Invesco Equity and Income Fund
| Principal Amount | Value | |||||||
| Semiconductors–(continued) | ||||||||
ON Semiconductor Corp., Sr. Unsec. Gtd. Conv. Notes, | $ | 36,461,000 | $ | 34,204,975 | ||||
| 131,417,429 | ||||||||
| Soft Drinks–0.37% | ||||||||
Coca-Cola Co. (The), Sr. Unsec. Global Notes, 1.80%, 09/01/16 | 17,475,000 | 17,665,941 | ||||||
PepsiCo, Inc., | 6,320,000 | 6,464,456 | ||||||
Sr. Unsec. Notes, 2.50%, 05/10/16 | 25,410,000 | 25,746,911 | ||||||
| 49,877,308 | ||||||||
| Specialized Finance–0.19% | ||||||||
Air Lease Corp., Sr. Unsec. Global Notes, | 8,760,000 | 8,707,440 | ||||||
4.25%, 09/15/24 | 4,355,000 | 4,295,119 | ||||||
Moody’s Corp., Sr. Unsec. Global Notes, 4.50%, 09/01/22 | 9,185,000 | 9,780,174 | ||||||
National Rural Utilities Cooperative Finance Corp., Sr. Sec. Collateral Trust Bonds, 3.05%, 02/15/22 | 2,550,000 | 2,548,585 | ||||||
| 25,331,318 | ||||||||
| Steel–0.08% | ||||||||
ArcelorMittal (Luxembourg), Sr. Unsec. Global Bonds, 10.60%, 06/01/19 | 7,005,000 | 8,195,850 | ||||||
Sr. Unsec. Global Notes, 6.13%, 06/01/18 | 390,000 | 407,550 | ||||||
7.50%, 03/01/41 | 2,225,000 | 2,052,563 | ||||||
| 10,655,963 | ||||||||
| Systems Software–0.41% | ||||||||
FireEye, Inc., | 10,953,000 | 10,638,101 | ||||||
Series B, Sr. Unsec. Conv. Notes, 1.63%, 06/01/22(c)(d) | 10,953,000 | 10,494,343 | ||||||
Microsoft Corp., Sr. Unsec. Global Notes, 3.50%, 02/12/35 | 4,259,000 | 3,924,662 | ||||||
NetSuite Inc., Sr. Unsec. Conv. Notes, 0.25%, 06/01/18 | 23,004,000 | 23,694,120 | ||||||
Oracle Corp., Sr. Unsec. Global Notes, 4.30%, 07/08/34 | 6,045,000 | 5,987,609 | ||||||
| 54,738,835 | ||||||||
| Technology Hardware, Storage & Peripherals–0.57% | ||||||||
Apple Inc., Sr. Unsec. Global Notes, 2.15%, 02/09/22 | 7,303,000 | 7,017,150 | ||||||
Hewlett-Packard Co., Sr. Unsec. Global Notes, 2.13%, 09/13/15 | 7,930,000 | 7,933,045 | ||||||
SanDisk Corp., Sr. Unsec. Conv. Bonds, 0.50%, 10/15/20 | 55,749,000 | 53,902,314 | ||||||
| Principal Amount | Value | |||||||
| Technology Hardware, Storage & Peripherals–(continued) | ||||||||
Seagate HDD Cayman, | $ | 890,000 | $ | 856,625 | ||||
Sr. Unsec. Gtd. Notes, 5.75%, 12/01/34(c) | 7,094,000 | 6,987,590 | ||||||
| 76,696,724 | ||||||||
| Thrifts & Mortgage Finance–0.46% | ||||||||
MGIC Investment Corp., Sr. Unsec. Conv. Notes, | 6,962,000 | 11,034,770 | ||||||
5.00%, 05/01/17 | 24,396,000 | 27,094,807 | ||||||
Radian Group Inc., Sr. Unsec. Conv. Notes, | 4,063,000 | 6,917,258 | ||||||
3.00%, 11/15/17 | 10,019,000 | 16,130,590 | ||||||
| 61,177,425 | ||||||||
| Tobacco–0.37% | ||||||||
Altria Group, Inc., Sr. Unsec. Gtd. Global Notes, 4.13%, 09/11/15 | 5,138,000 | 5,142,206 | ||||||
B.A.T. International Finance PLC (United Kingdom), Sr. Unsec. Gtd. Bonds, 3.95%, 06/15/25(c) | 7,251,000 | 7,386,775 | ||||||
Imperial Tobacco Finance PLC (United Kingdom), Sr. Unsec. Gtd. Notes, | 7,237,000 | 7,185,002 | ||||||
Philip Morris International Inc., | 2,167,000 | 2,166,146 | ||||||
Sr. Unsec. Global Notes, 2.50%, 05/16/16 | 10,825,000 | 10,963,560 | ||||||
3.60%, 11/15/23 | 3,940,000 | 4,004,492 | ||||||
4.88%, 11/15/43 | 11,740,000 | 12,267,290 | ||||||
| 49,115,471 | ||||||||
| Trucking–0.06% | ||||||||
Penske Truck Leasing Co., L.P./PTL Finance Corp., Sr. Unsec. Notes, 2.50%, 03/15/16(c) | 7,435,000 | 7,477,870 | ||||||
| Wireless Telecommunication Services–0.22% | ||||||||
America Movil S.A.B. de C.V. (Mexico), | 6,610,000 | 5,995,316 | ||||||
Sr. Unsec. Gtd. Global Notes, 2.38%, 09/08/16 | 4,450,000 | 4,492,598 | ||||||
Crown Castle Towers LLC, Sr. Sec. Gtd. First Lien Notes, 4.88%, 08/15/20(c) | 5,425,000 | 5,941,818 | ||||||
6.11%, 01/15/20(c) | 6,300,000 | 7,018,638 | ||||||
Rogers Communications Inc. (Canada), Sr. Unsec. Gtd. Global Notes, 4.50%, 03/15/43 | 6,080,000 | 5,509,003 | ||||||
| 28,957,373 | ||||||||
Total Bonds and Notes |
| 3,016,356,359 | ||||||
See accompanying Notes to Financial Statements which are an integral part of the financial statements.
19 Invesco Equity and Income Fund
| Principal Amount | Value | |||||||
U.S. Treasury Securities–6.25% |
| |||||||
| U.S. Treasury Bills–0.02% | ||||||||
0.29%, 05/26/16(h)(i) | $ | 1,865,000 | $ | 1,861,042 | ||||
| U.S. Treasury Notes–5.75% | ||||||||
2.00%, 04/30/16 | 17,445,000 | 17,636,388 | ||||||
1.75%, 05/31/16 | 950,000 | 959,833 | ||||||
0.50%, 04/30/17 | 48,000,000 | 47,876,457 | ||||||
0.88%, 04/30/17 | 2,000,000 | 2,006,728 | ||||||
0.63%, 07/31/17 | 41,915,000 | 41,853,480 | ||||||
1.00%, 08/15/18 | 73,025,000 | 72,918,836 | ||||||
1.25%, 01/31/19 | 23,000,000 | 23,017,251 | ||||||
3.63%, 08/15/19 | 58,350,000 | 63,391,496 | ||||||
3.38%, 11/15/19 | 10,000,000 | 10,783,874 | ||||||
1.63%, 07/31/20 | 294,563,000 | 295,610,339 | ||||||
2.00%, 07/31/22 | 1,182,000 | 1,187,362 | ||||||
2.00%, 08/15/25 | 198,134,200 | 194,400,839 | ||||||
| 771,642,883 | ||||||||
| U.S. Treasury Bonds–0.48% | ||||||||
3.00%, 05/15/45 | 64,597,100 | 65,067,251 | ||||||
Total U.S. Treasury Securities (Cost $834,377,695) |
| 838,571,176 | ||||||
| Shares | ||||||||
Preferred Stocks–0.98% |
| |||||||
| Asset Management & Custody Banks–0.20% | ||||||||
AMG Capital Trust II, $2.58 Jr. Unsec. Gtd. Sub. Conv. Pfd. | 438,000 | 25,130,250 | ||||||
State Street Corp., Series D, 5.90% Pfd. | 55,128 | 1,434,982 | ||||||
| 26,565,232 | ||||||||
| Diversified Banks–0.03% | ||||||||
Wells Fargo & Co., 5.85% Pfd. | 142,800 | 3,655,680 | ||||||
| Oil & Gas Storage & Transportation–0.34% | ||||||||
El Paso Energy Capital Trust I, $2.38 Jr. Unsec. Gtd. Sub. Conv. Pfd. | 875,900 | 45,292,789 | ||||||
| Regional Banks–0.41% | ||||||||
KeyCorp, Series A, $7.75 Conv. Pfd. | 427,098 | 55,992,548 | ||||||
Total Preferred Stocks |
| 131,506,249 | ||||||
| Principal Amount | ||||||||
U.S. Government Sponsored Agency Securities–0.71% |
| |||||||
| Federal Home Loan Mortgage Corp. (FHLMC)–0.35% | ||||||||
Unsec. Global Notes, 4.88%, 06/13/18 | $ | 33,680,000 | 37,163,691 | |||||
6.75%, 03/15/31 | 7,000,000 | 10,081,557 | ||||||
| 47,245,248 | ||||||||
| Principal Amount | Value | |||||||
| Federal National Mortgage Association (FNMA)–0.36% | ||||||||
Unsec. Global Notes, 4.38%, 10/15/15 | $ | 38,850,000 | $ | 39,053,050 | ||||
6.63%, 11/15/30 | 6,315,000 | 9,007,994 | ||||||
| 48,061,044 | ||||||||
Total U.S. Government Sponsored Agency Securities (Cost $97,504,798) |
| 95,306,292 | ||||||
Municipal Obligations–0.07% |
| |||||||
Georgia (State of) Municipal Electric Authority (Plant Vogtle Units 3 & 4 Project J); | 2,600,000 | 3,061,344 | ||||||
Series 2010, Class A, Build America Taxable RB, 6.66%, 04/01/57 | 4,980,000 | 5,811,311 | ||||||
Total Municipal Obligations |
| 8,872,655 | ||||||
U.S. Government Sponsored Agency Mortgage-Backed Securities–0.00% |
| |||||||
| Federal Home Loan Mortgage Corp. (FHLMC)–0.00% | ||||||||
Pass Through Ctfs., 6.50%, 05/01/29 | 2 | 2 | ||||||
5.50%, 02/01/37 | 74 | 82 | ||||||
| 84 | ||||||||
| Federal National Mortgage Association (FNMA)–0.00% | ||||||||
Pass Through Ctfs., 7.00%, 07/01/18 to 07/01/32 | 41,123 | 43,900 | ||||||
5.50%, 03/01/21 | 105 | 113 | ||||||
8.00%, 08/01/21 | 2,765 | 2,921 | ||||||
| 46,934 | ||||||||
| Government National Mortgage Association (GNMA)–0.00% | ||||||||
Pass Through Ctfs., 8.00%, 04/15/26 to 01/20/31 | 33,344 | 36,212 | ||||||
7.50%, 12/20/30 | 2,100 | 2,616 | ||||||
| 38,828 | ||||||||
Total U.S. Government Sponsored Agency Mortgage-Backed Securities (Cost $81,793) |
| 85,846 | ||||||
| Shares | ||||||||
Money Market Funds–5.70% |
| |||||||
Liquid Assets Portfolio–Institutional Class, 0.12%(j) | 382,575,849 | 382,575,849 | ||||||
Premier Portfolio–Institutional Class, 0.09%(j) | 382,575,849 | 382,575,849 | ||||||
Total Money Market Funds | 765,151,698 | |||||||
TOTAL INVESTMENTS–99.88% |
| 13,410,429,307 | ||||||
OTHER ASSETS LESS LIABILITIES–0.12% |
| 16,612,749 | ||||||
NET ASSETS–100.00% |
| $ | 13,427,042,056 | |||||
See accompanying Notes to Financial Statements which are an integral part of the financial statements.
20 Invesco Equity and Income Fund
Investment Abbreviations:
| ADR | – American Depositary Receipt | |
| Conv. | – Convertible | |
| Ctfs. | – Certificates | |
| Deb. | – Debentures | |
| Disc. | – Discounted | |
| Gtd. | – Guaranteed | |
| Jr. | – Junior | |
| Pfd. | – Preferred | |
| RB | – Revenue Bonds | |
| REIT | – Real Estate Investment Trust | |
| Sec. | – Secured | |
| Sr. | – Senior | |
| Sub. | – Subordinated | |
| Unsec. | – Unsecured |
Notes to Schedule of Investments:
| (a) | Industry and/or sector classifications used in this report are generally according to the Global Industry Classification Standard, which was developed by and is the exclusive property and a service mark of MSCI Inc. and Standard & Poor’s. |
| (b) | Non-income producing security. |
| (c) | Security purchased or received in a transaction exempt from registration under the Securities Act of 1933, as amended (the “1933 Act”). The security may be resold pursuant to an exemption from registration under the 1933 Act, typically to qualified institutional buyers. The aggregate value of these securities at August 31, 2015 was $528,531,336, which represented 3.94% of the Fund’s Net Assets. |
| (d) | Security has an irrevocable call by the issuer or mandatory put by the holder. Maturity date reflects such call or put. |
| (e) | Perpetual bond with no specified maturity date. |
| (f) | Exchangeable for a basket of four common stocks and one ordinary Share. |
| (g) | Exchangeable for a basket of five common shares. |
| (h) | Security traded on a discount basis. The interest rate shown represents the discount rate at the time of purchase by the Fund. |
| (i) | All or a portion of the value was pledged as collateral to cover margin requirements for open futures contracts. See Note 1K and Note 4. |
| (j) | The money market fund and the Fund are affiliated by having the same investment adviser. The rate shown is the 7-day SEC standardized yield as of August 31, 2015. |
See accompanying Notes to Financial Statements which are an integral part of the financial statements.
21 Invesco Equity and Income Fund
Statement of Assets and Liabilities
August 31, 2015
Assets: | ||||
Investments, at value (Cost $11,098,599,577) | $ | 12,645,277,609 | ||
Investments in affiliated money market funds, at value and cost | 765,151,698 | |||
Total investments, at value (Cost $11,863,751,275) | 13,410,429,307 | |||
Foreign currencies, at value (Cost $415,715) | 414,959 | |||
Receivable for: | ||||
Variation margin — futures contracts | 198,063 | |||
Fund shares sold | 22,268,048 | |||
Dividends and interest | 50,255,456 | |||
Investment for trustee deferred compensation and retirement plans | 1,165,809 | |||
Unrealized appreciation on forward foreign currency contracts outstanding | 7,927,155 | |||
Other assets | 147,224 | |||
Total assets | 13,492,806,021 | |||
Liabilities: | ||||
Payable for: | ||||
Investments purchased | 25,778,834 | |||
Fund shares reacquired | 27,232,320 | |||
Accrued fees to affiliates | 9,289,762 | |||
Accrued trustees’ and officers’ fees and benefits | 26,155 | |||
Accrued other operating expenses | 554,372 | |||
Unrealized depreciation on forward foreign currency contracts outstanding | 1,519,365 | |||
Trustee deferred compensation and retirement plans | 1,363,157 | |||
Total liabilities | 65,763,965 | |||
Net assets applicable to shares outstanding | $ | 13,427,042,056 | ||
Net assets consist of: | ||||
Shares of beneficial interest | $ | 11,500,372,237 | ||
Undistributed net investment income | 64,061,542 | |||
Undistributed net realized gain | 309,077,698 | |||
Net unrealized appreciation | 1,553,530,579 | |||
| $ | 13,427,042,056 | |||
Net Assets: | ||||
Class A | $ | 9,879,021,518 | ||
Class B | $ | 271,120,206 | ||
Class C | $ | 1,667,768,568 | ||
Class R | $ | 221,986,656 | ||
Class Y | $ | 784,238,121 | ||
Class R5 | $ | 411,579,189 | ||
Class R6 | $ | 191,327,798 | ||
Shares outstanding, $0.01 par value per share, |
| |||
Class A | 987,080,359 | |||
Class B | 27,717,686 | |||
Class C | 169,591,638 | |||
Class R | 22,079,204 | |||
Class Y | 78,330,395 | |||
Class R5 | 41,094,109 | |||
Class R6 | 19,108,201 | |||
Class A: | ||||
Net asset value per share | $ | 10.01 | ||
Maximum offering price per share | ||||
(Net asset value of $10.01 ¸ 94.50%) | $ | 10.59 | ||
Class B: | ||||
Net asset value and offering price per share | $ | 9.78 | ||
Class C: | ||||
Net asset value and offering price per share | $ | 9.83 | ||
Class R: | ||||
Net asset value and offering price per share | $ | 10.05 | ||
Class Y: | ||||
Net asset value and offering price per share | $ | 10.01 | ||
Class R5: | ||||
Net asset value and offering price per share | $ | 10.02 | ||
Class R6: | ||||
Net asset value and offering price per share | $ | 10.01 | ||
See accompanying Notes to Financial Statements which are an integral part of the financial statements.
22 Invesco Equity and Income Fund
Statement of Operations
For the year ended August 31, 2015
Investment income: | ||||
Dividends (net of foreign withholding taxes of $5,520,995) | $ | 200,859,796 | ||
Dividends from affiliated money market funds | 690,172 | |||
Interest | 99,126,297 | |||
Total investment income | 300,676,265 | |||
Expenses: | ||||
Advisory fees | 48,872,507 | |||
Administrative services fees | 895,693 | |||
Custodian fees | 441,605 | |||
Distribution fees: | ||||
Class A | 25,501,630 | |||
Class B | 3,633,180 | |||
Class C | 16,802,122 | |||
Class R | 1,165,132 | |||
Transfer agent fees — A, B, C, R and Y | 22,264,362 | |||
Transfer agent fees — R5 | 433,649 | |||
Transfer agent fees — R6 | 6,656 | |||
Trustees’ and officers’ fees and benefits | 228,548 | |||
Other | 1,931,731 | |||
Total expenses | 122,176,815 | |||
Less: Fees waived and expense offset arrangement(s) | (1,806,795 | ) | ||
Net expenses | 120,370,020 | |||
Net investment income | 180,306,245 | |||
Realized and unrealized gain (loss) from: | ||||
Net realized gain (loss) from: | ||||
Investment securities | 564,232,720 | |||
Foreign currencies | (477,826 | ) | ||
Forward foreign currency contracts | 82,375,502 | |||
Futures contracts | (6,355,390 | ) | ||
| 639,775,006 | ||||
Change in net unrealized appreciation (depreciation) of: | ||||
Investment securities | (1,070,081,611 | ) | ||
Foreign currencies | (66,637 | ) | ||
Forward foreign currency contracts | 6,100,291 | |||
Futures contracts | 542,155 | |||
| (1,063,505,802 | ) | |||
Net realized and unrealized gain (loss) | (423,730,796 | ) | ||
Net increase (decrease) in net assets resulting from operations | $ | (243,424,551 | ) | |
See accompanying Notes to Financial Statements which are an integral part of the financial statements.
23 Invesco Equity and Income Fund
Statement of Changes in Net Assets
For the years ended August 31, 2015 and 2014
| 2015 | 2014 | |||||||
Operations: | ||||||||
Net investment income | $ | 180,306,245 | $ | 242,381,622 | ||||
Net realized gain | 639,775,006 | 1,231,080,527 | ||||||
Change in net unrealized appreciation (depreciation) | (1,063,505,802 | ) | 602,657,350 | |||||
Net increase (decrease) in net assets resulting from operations | (243,424,551 | ) | 2,076,119,499 | |||||
Distributions to shareholders from net investment income: | ||||||||
Class A | (260,216,393 | ) | (176,864,717 | ) | ||||
Class B | (7,021,414 | ) | (6,019,914 | ) | ||||
Class C | (30,002,656 | ) | (16,287,779 | ) | ||||
Class R | (5,368,311 | ) | (3,426,602 | ) | ||||
Class Y | (21,553,271 | ) | (12,338,759 | ) | ||||
Class R5 | (12,247,206 | ) | (7,043,126 | ) | ||||
Class R6 | (4,726,916 | ) | (1,862,221 | ) | ||||
Total distributions from net investment income | (341,136,167 | ) | (223,843,118 | ) | ||||
Distributions to shareholders from net realized gains: | ||||||||
Class A | (842,979,900 | ) | (493,452,271 | ) | ||||
Class B | (33,958,762 | ) | (29,777,478 | ) | ||||
Class C | (140,184,003 | ) | (75,974,395 | ) | ||||
Class R | (19,237,356 | ) | (10,930,123 | ) | ||||
Class Y | (63,938,513 | ) | (30,498,502 | ) | ||||
Class R5 | (34,430,457 | ) | (15,792,758 | ) | ||||
Class R6 | (12,907,558 | ) | (3,739,507 | ) | ||||
Total distributions from net realized gains | (1,147,636,549 | ) | (660,165,034 | ) | ||||
Share transactions–net: | ||||||||
Class A | 970,871,766 | 535,605,880 | ||||||
Class B | (124,425,413 | ) | (174,743,171 | ) | ||||
Class C | 254,679,990 | 204,432,386 | ||||||
Class R | 18,275,914 | 18,698,631 | ||||||
Class Y | 162,275,763 | 187,672,956 | ||||||
Class R5 | 60,543,892 | 129,099,607 | ||||||
Class R6 | 63,841,482 | 102,986,907 | ||||||
Net increase in net assets resulting from share transactions | 1,406,063,394 | 1,003,753,196 | ||||||
Net increase (decrease) in net assets | (326,133,873 | ) | 2,195,864,543 | |||||
Net assets: | ||||||||
Beginning of year | 13,753,175,929 | 11,557,311,386 | ||||||
End of year (includes undistributed net investment income of $64,061,542 and $132,247,328, respectively) | $ | 13,427,042,056 | $ | 13,753,175,929 | ||||
Notes to Financial Statements
August 31, 2015
NOTE 1—Significant Accounting Policies
Invesco Equity and Income Fund (the “Fund”) is a series portfolio of AIM Counselor Series Trust (Invesco Counselor Series Trust) (the “Trust”). The Trust is a Delaware statutory trust registered under the Investment Company Act of 1940, as amended (the “1940 Act”), as an open-end series management investment company consisting of thirteen separate portfolios, each authorized to issue an unlimited number of shares of beneficial interest. The assets, liabilities and operations of each portfolio are accounted for separately. Information presented in these financial statements pertains only to the Fund. Matters affecting each portfolio or class will be voted on exclusively by the shareholders of such portfolio or class.
The Fund’s investment objective is current income and, secondarily, capital appreciation.
The Fund currently consists of seven different classes of shares: Class A, Class B, Class C, Class R, Class Y, Class R5 and Class R6. Class A shares are sold with a front-end sales charge unless certain waiver criteria are met and under certain circumstances load waived shares may be subject to
24 Invesco Equity and Income Fund
contingent deferred sales charges (“CDSC”). Class C shares are sold with a CDSC. Class R, Class Y, Class R5 and Class R6 shares are sold at net asset value. Effective November 30, 2010, new or additional investments in Class B shares are no longer permitted. Existing shareholders of Class B shares may continue to reinvest dividends and capital gains distributions in Class B shares until they convert to Class A shares. Also, shareholders in Class B shares will be able to exchange those shares for Class B shares of other Invesco Funds offering such shares until they convert to Class A shares. Generally, Class B shares will automatically convert to Class A shares on or about the month-end, which is at least eight years after the date of purchase. Redemption of Class B shares prior to the conversion date will be subject to a CDSC.
The following is a summary of the significant accounting policies followed by the Fund in the preparation of its financial statements.
| A. | Security Valuations — Securities, including restricted securities, are valued according to the following policy. |
Debt obligations (including convertible securities) and unlisted equities are fair valued using an evaluated quote provided by an independent pricing service. Evaluated quotes provided by the pricing service may be determined without exclusive reliance on quoted prices, and may reflect appropriate factors such as institution-size trading in similar groups of securities, developments related to specific securities, dividend rate (for unlisted equities), yield (for debt obligations), quality, type of issue, coupon rate (for debt obligations), maturity (for debt obligations), individual trading characteristics and other market data. Debt obligations are subject to interest rate and credit risks. In addition, all debt obligations involve some risk of default with respect to interest and/or principal payments.
A security listed or traded on an exchange (except convertible securities) is valued at its last sales price or official closing price as of the close of the customary trading session on the exchange where the security is principally traded, or lacking any sales or official closing price on a particular day, the security may be valued at the closing bid price on that day. Securities traded in the over-the-counter market are valued based on prices furnished by independent pricing services or market makers. When such securities are valued by an independent pricing service they may be considered fair valued. Futures contracts are valued at the final settlement price set by an exchange on which they are principally traded. Listed options are valued at the mean between the last bid and asked prices from the exchange on which they are principally traded. Options not listed on an exchange are valued by an independent source at the mean between the last bid and asked prices. For purposes of determining net asset value (“NAV”) per share, futures and option contracts generally are valued 15 minutes after the close of the customary trading session of the New York Stock Exchange (“NYSE”).
Investments in open-end and closed-end registered investment companies that do not trade on an exchange are valued at the end-of-day net asset value per share. Investments in open-end and closed-end registered investment companies that trade on an exchange are valued at the last sales price or official closing price as of the close of the customary trading session on the exchange where the security is principally traded.
Foreign securities’ (including foreign exchange contracts) prices are converted into U.S. dollar amounts using the applicable exchange rates as of the close of the NYSE. If market quotations are available and reliable for foreign exchange-traded equity securities, the securities will be valued at the market quotations. Because trading hours for certain foreign securities end before the close of the NYSE, closing market quotations may become unreliable. If between the time trading ends on a particular security and the close of the customary trading session on the NYSE, events occur that the Adviser determines are significant and make the closing price unreliable, the Fund may fair value the security. If the event is likely to have affected the closing price of the security, the security will be valued at fair value in good faith using procedures approved by the Board of Trustees. Adjustments to closing prices to reflect fair value may also be based on a screening process of an independent pricing service to indicate the degree of certainty, based on historical data, that the closing price in the principal market where a foreign security trades is not the current value as of the close of the NYSE. Foreign securities’ prices meeting the approved degree of certainty that the price is not reflective of current value will be priced at the indication of fair value from the independent pricing service. Multiple factors may be considered by the independent pricing service in determining adjustments to reflect fair value and may include information relating to sector indices, American Depositary Receipts and domestic and foreign index futures. Foreign securities may have additional risks including exchange rate changes, potential for sharply devalued currencies and high inflation, political and economic upheaval, the relative lack of issuer information, relatively low market liquidity and the potential lack of strict financial and accounting controls and standards.
Securities for which market prices are not provided by any of the above methods may be valued based upon quotes furnished by independent sources. The last bid price may be used to value equity securities. The mean between the last bid and asked prices is used to value debt obligations, including corporate loans.
Securities for which market quotations are not readily available or became unreliable are valued at fair value as determined in good faith by or under the supervision of the Trust’s officers following procedures approved by the Board of Trustees. Issuer specific events, market trends, bid/asked quotes of brokers and information providers and other market data may be reviewed in the course of making a good faith determination of a security’s fair value.
The Fund may invest in securities that are subject to interest rate risk, meaning the risk that the prices will generally fall as interest rates rise and, conversely, the prices will generally rise as interest rates fall. Specific securities differ in their sensitivity to changes in interest rates depending on their individual characteristics. Changes in interest rates may result in increased market volatility, which may affect the value and/or liquidity of certain Fund investments.
Valuations change in response to many factors including the historical and prospective earnings of the issuer, the value of the issuer’s assets, general economic conditions, interest rates, investor perceptions and market liquidity. Because of the inherent uncertainties of valuation, the values reflected in the financial statements may materially differ from the value received upon actual sale of those investments.
| B. | Securities Transactions and Investment Income — Securities transactions are accounted for on a trade date basis. Realized gains or losses on sales are computed on the basis of specific identification of the securities sold. Interest income (net of withholding tax, if any) is recorded on the accrual basis from settlement date. Paydown gains and losses on mortgage and asset-backed securities are recorded as adjustments to interest income. Dividend income (net of withholding tax, if any) is recorded on the ex-dividend date. Bond premiums and discounts are amortized and/or accreted for financial reporting purposes. |
The Fund may periodically participate in litigation related to Fund investments. As such, the Fund may receive proceeds from litigation settlements. Any proceeds received are included in the Statement of Operations as realized gain (loss) for investments no longer held and as unrealized gain (loss) for investments still held.
Brokerage commissions and mark ups are considered transaction costs and are recorded as an increase to the cost basis of securities purchased and/or a reduction of proceeds on a sale of securities. Such transaction costs are included in the determination of net realized and
25 Invesco Equity and Income Fund
unrealized gain (loss) from investment securities reported in the Statement of Operations and the Statement of Changes in Net Assets and the net realized and unrealized gains (losses) on securities per share in the Financial Highlights. Transaction costs are included in the calculation of the Fund’s net asset value and, accordingly, they reduce the Fund’s total returns. These transaction costs are not considered operating expenses and are not reflected in net investment income reported in the Statement of Operations and the Statement of Changes in Net Assets, or the net investment income per share and the ratios of expenses and net investment income reported in the Financial Highlights, nor are they limited by any expense limitation arrangements between the Fund and the investment adviser.
The Fund allocates income and realized and unrealized capital gains and losses to a class based on the relative net assets of each class.
| C. | Country Determination — For the purposes of making investment selection decisions and presentation in the Schedule of Investments, the investment adviser may determine the country in which an issuer is located and/or credit risk exposure based on various factors. These factors include the laws of the country under which the issuer is organized, where the issuer maintains a principal office, the country in which the issuer derives 50% or more of its total revenues and the country that has the primary market for the issuer’s securities, as well as other criteria. Among the other criteria that may be evaluated for making this determination are the country in which the issuer maintains 50% or more of its assets, the type of security, financial guarantees and enhancements, the nature of the collateral and the sponsor organization. Country of issuer and/or credit risk exposure has been determined to be the United States of America, unless otherwise noted. |
| D. | Distributions — Distributions from net investment income, if any, are declared and paid quarterly and are recorded on the ex-dividend date. Distributions from net realized capital gain, if any, are generally declared and paid annually and recorded on the ex-dividend date. The Fund may elect to treat a portion of the proceeds from redemptions as distributions for federal income tax purposes. |
| E. | Federal Income Taxes — The Fund intends to comply with the requirements of Subchapter M of the Internal Revenue Code of 1986, as amended (the “Internal Revenue Code”), necessary to qualify as a regulated investment company and to distribute substantially all of the Fund’s taxable earnings to shareholders. As such, the Fund will not be subject to federal income taxes on otherwise taxable income (including net realized capital gain) that is distributed to shareholders. Therefore, no provision for federal income taxes is recorded in the financial statements. |
The Fund recognizes the tax benefits of uncertain tax positions only when the position is more likely than not to be sustained. Management has analyzed the Fund’s uncertain tax positions and concluded that no liability for unrecognized tax benefits should be recorded related to uncertain tax positions. Management is not aware of any tax positions for which it is reasonably possible that the total amounts of unrecognized tax benefits will change materially in the next 12 months.
The Fund files tax returns in the U.S. Federal jurisdiction and certain other jurisdictions. Generally, the Fund is subject to examinations by such taxing authorities for up to three years after the filing of the return for the tax period.
| F. | Expenses — Fees provided for under the Rule 12b-1 plan of a particular class of the Fund are charged to the operations of such class. Transfer agency fees and expenses and other shareholder recordkeeping fees and expenses attributable to Class R5 and Class R6 are allocated to each share class based on relative net assets. Sub-accounting fees attributable to Class R5 are charged to the operations of the class. Transfer agency fees and expenses and other shareholder recordkeeping fees and expenses relating to all other classes are allocated among those classes based on relative net assets. All other expenses are allocated among the classes based on relative net assets. |
| G. | Accounting Estimates — The preparation of financial statements in conformity with accounting principles generally accepted in the United States of America (“GAAP”) requires management to make estimates and assumptions that affect the reported amounts of assets and liabilities at the date of the financial statements and the reported amounts of revenues and expenses during the reporting period including estimates and assumptions related to taxation. Actual results could differ from those estimates by a significant amount. In addition, the Fund monitors for material events or transactions that may occur or become known after the period-end date and before the date the financial statements are released to print. |
| H. | Indemnifications — Under the Trust’s organizational documents, each Trustee, officer, employee or other agent of the Trust is indemnified against certain liabilities that may arise out of the performance of their duties to the Fund. Additionally, in the normal course of business, the Fund enters into contracts, including the Fund’s servicing agreements, that contain a variety of indemnification clauses. The Fund’s maximum exposure under these arrangements is unknown as this would involve future claims that may be made against the Fund that have not yet occurred. The risk of material loss as a result of such indemnification claims is considered remote. |
| I. | Foreign Currency Translations — Foreign currency is valued at the close of the NYSE based on quotations posted by banks and major currency dealers. Portfolio securities and other assets and liabilities denominated in foreign currencies are translated into U.S. dollar amounts at date of valuation. Purchases and sales of portfolio securities (net of foreign taxes withheld on disposition) and income items denominated in foreign currencies are translated into U.S. dollar amounts on the respective dates of such transactions. The Fund does not separately account for the portion of the results of operations resulting from changes in foreign exchange rates on investments and the fluctuations arising from changes in market prices of securities held. The combined results of changes in foreign exchange rates and the fluctuation of market prices on investments (net of estimated foreign tax withholding) are included with the net realized and unrealized gain or loss from investments in the Statement of Operations. Reported net realized foreign currency gains or losses arise from (1) sales of foreign currencies, (2) currency gains or losses realized between the trade and settlement dates on securities transactions, and (3) the difference between the amounts of dividends, interest, and foreign withholding taxes recorded on the Fund’s books and the U.S. dollar equivalent of the amounts actually received or paid. Net unrealized foreign currency gains and losses arise from changes in the fair values of assets and liabilities, other than investments in securities at fiscal period end, resulting from changes in exchange rates. |
The Fund may invest in foreign securities, which may be subject to foreign taxes on income, gains on investments or currency repatriation, a portion of which may be recoverable. Foreign taxes, if any, are recorded based on the tax regulations and rates that exist in the foreign markets in which the Fund invests and are shown in the Statement of Operations.
| J. | Forward Foreign Currency Contracts — The Fund may engage in foreign currency transactions either on a spot (i.e. for prompt delivery and settlement) basis, or through forward foreign currency contracts, to manage or minimize currency or exchange rate risk. |
The Fund may also enter into forward foreign currency contracts for the purchase or sale of a security denominated in a foreign currency in order to “lock in” the U.S. dollar price of that security, or the Fund may also enter into forward foreign currency contracts that do not provide for physical settlement of the two currencies, but instead are settled by a single cash payment calculated as the difference between the agreed upon
26 Invesco Equity and Income Fund
exchange rate and the spot rate at settlement based upon an agreed upon notional amount (non-deliverable forwards). The Fund will set aside liquid assets in an amount equal to daily mark-to-market obligation for forward foreign currency contracts.
A forward foreign currency contract is an obligation between two parties (“Counterparties”) to purchase or sell a specific currency for an agreed-upon price at a future date. The use of forward foreign currency contracts does not eliminate fluctuations in the price of the underlying securities the Fund owns or intends to acquire but establishes a rate of exchange in advance. Fluctuations in the value of these contracts are measured by the difference in the contract date and reporting date exchange rates and are recorded as unrealized appreciation (depreciation) until the contracts are closed. When the contracts are closed, realized gains (losses) are recorded. Realized and unrealized gains (losses) on the contracts are included in the Statement of Operations. The primary risks associated with forward foreign currency contracts include failure of the Counterparty to meet the terms of the contract and the value of the foreign currency changing unfavorably. These risks may be in excess of the amounts reflected in the Statement of Assets and Liabilities.
| K. | Futures Contracts — The Fund may enter into futures contracts to manage exposure to interest rate, equity and market price movements and/or currency risks. A futures contract is an agreement between Counterparties to purchase or sell a specified underlying security, currency or commodity (or delivery of a cash settlement price, in the case of an index future) for a fixed price at a future date. The Fund currently invests only in exchange-traded futures and they are standardized as to maturity date and underlying financial instrument. Initial margin deposits required upon entering into futures contracts are satisfied by the segregation of specific securities or cash as collateral at the futures commission merchant (broker). During the period the futures contracts are open, changes in the value of the contracts are recognized as unrealized gains or losses by recalculating the value of the contracts on a daily basis. Subsequent or variation margin payments are received or made depending upon whether unrealized gains or losses are incurred. These amounts are reflected as receivables or payables on the Statement of Assets and Liabilities. When the contracts are closed or expire, the Fund recognizes a realized gain or loss equal to the difference between the proceeds from, or cost of, the closing transaction and the Fund’s basis in the contract. The net realized gain (loss) and the change in unrealized gain (loss) on futures contracts held during the period is included on the Statement of Operations. The primary risks associated with futures contracts are market risk and the absence of a liquid secondary market. If the Fund were unable to liquidate a futures contract and/or enter into an offsetting closing transaction, the Fund would continue to be subject to market risk with respect to the value of the contracts and continue to be required to maintain the margin deposits on the futures contracts. Futures contracts have minimal Counterparty risk since the exchange’s clearinghouse, as Counterparty to all exchange-traded futures, guarantees the futures against default. Risks may exceed amounts recognized in the Statement of Assets and Liabilities. |
| L. | Put Options Purchased — The Fund may purchase put options including options on securities indexes, or foreign currency and/or futures contracts. By purchasing a put option, the Fund obtains the right (but not the obligation) to sell the option’s underlying instrument at a fixed strike price. In return for this right, the Fund pays an option premium. The option’s underlying instrument may be a security, securities index, or a futures contract. Put options may be used by the Fund to hedge securities it owns by locking in a minimum price at which the Fund can sell. If security prices fall, the put option could be exercised to offset all or a portion of the Fund’s resulting losses. At the same time, because the maximum the Fund has at risk is the cost of the option, purchasing put options does not eliminate the potential for the Fund to profit from an increase in the value of the securities hedged. Realized and unrealized gains and losses on these contracts are included in the Statement of Operations as Net realized gain from Investment Securities. A risk in buying an option is that the Fund pays a premium whether or not the option is exercised. In addition, there can be no assurance that a liquid secondary market will exist for any option purchased. |
| M. | Collateral — To the extent the Fund has designated or segregated a security as collateral and that security is subsequently sold, it is the Fund’s practice to replace such collateral no later than the next business day. |
NOTE 2—Advisory Fees and Other Fees Paid to Affiliates
The Trust has entered into a master investment advisory agreement with Invesco Advisers, Inc. (the “Adviser” or “Invesco”). Under the terms of the investment advisory agreement, the Fund pays an advisory fee to the Adviser based on the annual rate of the Fund’s average daily net assets as follows:
| Average Daily Net Assets | Rate | |||
First $150 million | 0.50% | |||
Next $100 million | 0.45% | |||
Next $100 million | 0.40% | |||
Over $350 million | 0.35% | |||
For the year ended August 31, 2015, the effective advisory fees incurred by the Fund was 0.35%.
Under the terms of a master sub-advisory agreement between the Adviser and each of Invesco Asset Management Deutschland GmbH, Invesco Asset Management Limited, Invesco Asset Management (Japan) Limited, Invesco Hong Kong Limited, Invesco Senior Secured Management, Inc. and Invesco Canada Ltd. (collectively, the “Affiliated Sub-Advisers”) the Adviser, not the Fund, may pay 40% of the fees paid to the Adviser to any such Affiliated Sub-Adviser(s) that provide(s) discretionary investment management services to the Fund based on the percentage of assets allocated to such Affiliated Sub-Adviser(s).
The Adviser has contractually agreed, through at least June 30, 2016, to waive advisory fees and/or reimburse expenses to the extent necessary to limit total annual fund operating expenses after fee waiver and/or expense reimbursement (excluding certain items discussed below) of Class A, Class B, Class C, Class R, Class Y, Class R5 and Class R6 shares to 1.50%, 2.25%, 2.25%, 1.75%, 1.25%, 1.25% and 1.25% of average daily net assets, respectively. In determining the Adviser’s obligation to waive advisory fees and/or reimburse expenses, the following expenses are not taken into account, and could cause total annual fund operating expenses after fee waiver and/or expense reimbursement to exceed the numbers reflected above: (1) interest; (2) taxes; (3) dividend expense on short sales; (4) extraordinary or non-routine items, including litigation expenses; and (5) expenses that the Fund has incurred but did not actually pay because of an expense offset arrangement. Unless Invesco continues the fee waiver agreement, it will terminate on June 30, 2016. The fee waiver agreement cannot be terminated during its term. The Adviser did not waive fees and/or reimburse expenses during the period under this expense limitation.
27 Invesco Equity and Income Fund
Further, the Adviser has contractually agreed, through at least June 30, 2017, to waive the advisory fee payable by the Fund in an amount equal to 100% of the net advisory fees the Adviser receives from the affiliated money market funds on investments by the Fund of uninvested cash in such affiliated money market funds.
For the year ended August 31, 2015, the Adviser waived advisory fees of $1,787,302.
The Trust has entered into a master administrative services agreement with Invesco pursuant to which the Fund has agreed to pay Invesco for certain administrative costs incurred in providing accounting services to the Fund. For the year ended August 31, 2015, expenses incurred under the agreement are shown in the Statement of Operations as Administrative services fees.
The Trust has entered into a transfer agency and service agreement with Invesco Investment Services, Inc. (“IIS”) pursuant to which the Fund has agreed to pay IIS a fee for providing transfer agency and shareholder services to the Fund and reimburse IIS for certain expenses incurred by IIS in the course of providing such services. IIS may make payments to intermediaries that provide omnibus account services, sub-accounting services and/or networking services. All fees payable by IIS to intermediaries that provide omnibus account services or sub-accounting are charged back to the Fund, subject to certain limitations approved by the Trust’s Board of Trustees. For the year ended August 31, 2015, expenses incurred under the agreement are shown in the Statement of Operations as Transfer agent fees.
Shares of the Fund are distributed by Invesco Distributors, Inc. (“IDI”). The Fund has adopted a distribution plan pursuant to Rule 12b-1 under the 1940 Act, and a service plan (collectively, the “Plans”) for Class A shares, Class B shares, Class C shares and Class R shares to compensate IDI for the sale, distribution, shareholder servicing and maintenance of shareholder accounts for these shares. Under the Plans, the Fund will incur annual fees of up to 0.25% of Class A average daily net assets, up to 1.00% each of Class B and Class C average daily net assets and up to 0.50% of Class R average daily net assets.
With respect to Class B and Class C shares, the Fund is authorized to reimburse in future years any distribution related expenses that exceed the maximum annual reimbursement rate for such class, so long as such reimbursement does not cause the Fund to exceed the Class B and Class C maximum annual reimbursement rate, respectively. With respect to Class A shares, distribution related expenses that exceed the maximum annual reimbursement rate for such class are not carried forward to future years and the Fund will not reimburse IDI for any such expenses.
For the year ended August 31, 2015, expenses incurred under these agreements are shown in the Statement of Operations as Distribution fees.
Front-end sales commissions and CDSC (collectively, the “sales charges”) are not recorded as expenses of the Fund. Front-end sales commissions are deducted from proceeds from the sales of Fund shares prior to investment in Class A shares of the Fund. CDSC are deducted from redemption proceeds prior to remittance to the shareholder. During the year ended August 31, 2015, IDI advised the Fund that IDI retained $3,564,054 in front-end sales commissions from the sale of Class A shares and $32,750, $68,351 and $58,971 from Class A, Class B and Class C shares, respectively, for CDSC imposed on redemptions by shareholders.
For the year ended August 31, 2015, the Fund incurred $59,247 in brokerage commissions with Invesco Capital Markets, Inc., an affiliate of the Adviser and IDI, for portfolio transactions executed on behalf of the Fund.
Certain officers and trustees of the Trust are officers and directors of the Adviser, IIS and/or IDI.
NOTE 3—Additional Valuation Information
GAAP defines fair value as the price that would be received to sell an asset or paid to transfer a liability in an orderly transaction between market participants at the measurement date, under current market conditions. GAAP establishes a hierarchy that prioritizes the inputs to valuation methods, giving the highest priority to readily available unadjusted quoted prices in an active market for identical assets (Level 1) and the lowest priority to significant unobservable inputs (Level 3), generally when market prices are not readily available or are unreliable. Based on the valuation inputs, the securities or other investments are tiered into one of three levels. Changes in valuation methods may result in transfers in or out of an investment’s assigned level:
| Level 1 — | Prices are determined using quoted prices in an active market for identical assets. |
| Level 2 — | Prices are determined using other significant observable inputs. Observable inputs are inputs that other market participants may use in pricing a security. These may include quoted prices for similar securities, interest rates, prepayment speeds, credit risk, yield curves, loss severities, default rates, discount rates, volatilities and others. |
| Level 3 — | Prices are determined using significant unobservable inputs. In situations where quoted prices or observable inputs are unavailable (for example, when there is little or no market activity for an investment at the end of the period), unobservable inputs may be used. Unobservable inputs reflect the Fund’s own assumptions about the factors market participants would use in determining fair value of the securities or instruments and would be based on the best available information. |
The following is a summary of the tiered valuation input levels, as of August 31, 2015. The level assigned to the securities valuations may not be an indication of the risk or liquidity associated with investing in those securities. Because of the inherent uncertainties of valuation, the values reflected in the financial statements may materially differ from the value received upon actual sale of those investments.
| Level 1 | Level 2 | Level 3 | Total | |||||||||||||
Equity Securities | $ | 8,891,214,756 | $ | 560,022,223 | $ | — | $ | 9,451,236,979 | ||||||||
U.S. Treasury Securities | — | 838,571,176 | — | 838,571,176 | ||||||||||||
Corporate Debt Securities | — | 3,016,356,359 | — | 3,016,356,359 | ||||||||||||
U.S. Government Sponsored Agency Securities | — | 95,392,138 | — | 95,392,138 | ||||||||||||
Municipal Obligations | — | 8,872,655 | — | 8,872,655 | ||||||||||||
| 8,891,214,756 | 4,519,214,551 | — | 13,410,429,307 | |||||||||||||
Forward Foreign Currency Contracts* | — | 6,407,790 | — | 6,407,790 | ||||||||||||
Futures Contracts* | 512,668 | — | — | 512,668 | ||||||||||||
Total Investments | $ | 8,891,727,424 | $ | 4,525,622,341 | $ | — | $ | 13,417,349,765 | ||||||||
| * | Unrealized appreciation (depreciation). |
28 Invesco Equity and Income Fund
NOTE 4—Derivative Investments
Value of Derivative Investments at Period-End
The table below summarizes the value of the Fund’s derivative investments, detailed by primary risk exposure, held as of August 31, 2015:
| Value | ||||||||
| Risk Exposure/Derivative Type | Assets | Liabilities | ||||||
Currency risk: | ||||||||
Forward foreign currency contracts(a) | $ | 7,927,155 | $ | (1,519,365 | ) | |||
Interest rate risk: | ||||||||
Futures contracts(b) | 512,668 | — | ||||||
Total | $ | 8,439,823 | $ | (1,519,365 | ) | |||
| (a) | Values are disclosed on the Statement of Assets and Liabilities under the caption Unrealized appreciation on forward foreign currency contracts outstanding and Unrealized depreciation on forward foreign currency contracts outstanding. |
| (b) | Includes cumulative appreciation (depreciation) of futures contracts. Only current day’s variation margin receivable (payable) is reported within the Statement of Assets and Liabilities. |
Effect of Derivative Investments for the year ended August 31, 2015
The table below summarizes the gains (losses) on derivative investments, detailed by primary risk exposure, recognized in earnings during the period:
| Location of Gain (Loss) on Statement of Operations | ||||||||||||
| Forward Foreign Currency Contracts | Futures Contracts | Options Purchased(a) | ||||||||||
Realized Gain (Loss): | ||||||||||||
Equity risk | $ | — | $ | — | $ | (608,140 | ) | |||||
Currency risk | 82,375,502 | — | — | |||||||||
Interest rate risk | — | (6,355,390 | ) | — | ||||||||
Change in Net Unrealized Appreciation (Depreciation): | ||||||||||||
Equity risk | — | — | 480,242 | |||||||||
Currency risk | 6,100,291 | — | — | |||||||||
Interest rate risk | — | 542,155 | — | |||||||||
Total | $ | 88,475,793 | $ | (5,813,235 | ) | $ | (127,898 | ) | ||||
| (a) | Options purchased are included in the net realized gain (loss) from investment securities and the change in net unrealized appreciation (depreciation) of investment securities. |
The table below summarizes the twelve month average notional value of forward foreign currency contracts and futures contracts and the four month average notional value of options purchased outstanding during the period.
| Forward Foreign Currency Contracts | Futures Contracts | Options Purchased | ||||||||||
Average notional value | $ | 774,331,649 | $ | 198,944,698 | $ | 19,988,775 | ||||||
| Forward Foreign Currency Contracts | ||||||||||||||||||||||||||
Settlement
| Counterparty | Contract to | Notional Value | Unrealized Appreciation (Depreciation) | ||||||||||||||||||||||
| Deliver | Receive | |||||||||||||||||||||||||
10/02/15 | Bank of New York Mellon (The) | CAD | 67,968,979 | USD | 51,040,982 | $ | 51,657,712 | $ | (616,730 | ) | ||||||||||||||||
10/02/15 | State Street Bank and Trust Co. | CAD | 67,969,208 | USD | 51,033,413 | 51,657,886 | (624,473 | ) | ||||||||||||||||||
10/02/15 | Bank of New York Mellon (The) | CHF | 47,880,050 | USD | 50,615,836 | 49,565,895 | 1,049,941 | |||||||||||||||||||
10/02/15 | State Street Bank and Trust Co. | CHF | 47,880,288 | USD | 50,636,964 | 49,566,142 | 1,070,822 | |||||||||||||||||||
10/02/15 | Bank of New York Mellon (The) | EUR | 89,803,688 | USD | 102,426,045 | 100,811,327 | 1,614,718 | |||||||||||||||||||
10/02/15 | State Street Bank and Trust Co. | EUR | 89,804,210 | USD | 102,364,227 | 100,811,914 | 1,552,313 | |||||||||||||||||||
10/02/15 | State Street Bank and Trust Co. | GBP | 61,412,762 | USD | 95,550,090 | 94,218,067 | 1,332,023 | |||||||||||||||||||
10/02/15 | Bank of New York Mellon (The) | GBP | 61,412,904 | USD | 95,525,623 | 94,218,285 | 1,307,338 | |||||||||||||||||||
10/02/15 | Bank of New York Mellon (The) | ILS | 174,361,425 | USD | 44,332,369 | 44,457,651 | (125,282 | ) | ||||||||||||||||||
10/02/15 | State Street Bank and Trust Co. | ILS | 174,361,506 | USD | 44,304,791 | 44,457,671 | (152,880 | ) | ||||||||||||||||||
Total Forward Foreign Currency Contracts | $ | 6,407,790 | ||||||||||||||||||||||||
Currency Abbreviations:
| CAD | – Canadian Dollar | |
| CHF | – Swiss Franc | |
| EUR | – Euro |
| GBP | – British Pound Sterling | |
| ILS | – Israeli Shekel | |
| USD | – U.S. Dollar |
29 Invesco Equity and Income Fund
| Open Futures Contracts | ||||||||||||||||||||
| Futures Contracts | Type of Contract | Number of Contracts | Expiration Month | Notional Value | Unrealized Appreciation | |||||||||||||||
U.S. Treasury 5 Year Notes | Short | 563 | December-2015 | $ | (67,243,313 | ) | $ | 245,085 | ||||||||||||
U.S. Treasury 10 Year Notes | Short | 908 | December-2015 | (115,372,750 | ) | 267,583 | ||||||||||||||
Total — Interest Rate Risk |
| $ | 512,668 | |||||||||||||||||
Offsetting Assets and Liabilities
Accounting Standards Update (“ASU”) No. 2011-11, Disclosures about Offsetting Assets and Liabilities, which was subsequently clarified in Financial Accounting Standards Board ASU 2013-01 “Clarifying the Scope of Disclosures about Offsetting Assets and Liabilities” is intended to enhance disclosures about financial instruments and derivative instruments that are subject to offsetting arrangements on the Statement of Assets and Liabilities and to enable investors to better understand the effect of those arrangements on the Fund’s financial position. In order for an arrangement to be eligible for netting, the Fund must have a basis to conclude that such netting arrangements are legally enforceable. The Fund enters into netting agreements and collateral agreements in an attempt to reduce the Fund’s Counterparty credit risk by providing for a single net settlement with a Counterparty of all financial transactions covered by the agreement in an event of default as defined under such agreement.
There were no derivative instruments subject to a netting agreement for which the Fund is not currently netting. The following tables present derivative instruments that are either subject to an enforceable netting agreement or offset by collateral arrangements as of August 31, 2015.
| Gross Amounts Not Offset in the Statement of Assets and Liabilities | ||||||||||||||||||||
| Gross Amounts of Recognized Assets | Financial Instruments | Collateral Received | Net Amount | |||||||||||||||||
| Counterparty | Non-Cash | Cash | ||||||||||||||||||
Bank of New York Mellon (The) | $ | 3,971,997 | $ | (742,012 | ) | $ | — | $ | — | $ | 3,229,985 | |||||||||
State Street Bank & Trust Co. | 3,955,158 | (777,353 | ) | — | — | 3,177,805 | ||||||||||||||
Total | $ | 7,927,155 | $ | (1,519,365 | ) | $ | — | $ | — | $ | 6,407,790 | |||||||||
| Gross Amounts Not Offset in the Statement of Assets and Liabilities | ||||||||||||||||||||
| Gross Amounts of Recognized Liabilities | Financial Instruments | Collateral Pledged | Net Amount | |||||||||||||||||
| Counterparty | Non-Cash | Cash | ||||||||||||||||||
Bank of New York Mellon (The) | $ | 742,012 | $ | (742,012 | ) | $ | — | $ | — | $ | — | |||||||||
State Street Bank & Trust Co. | 777,353 | (777,353 | ) | — | — | — | ||||||||||||||
Total | $ | 1,519,365 | $ | (1,519,365 | ) | $ | — | $ | — | $ | — | |||||||||
NOTE 5—Security Transactions with Affiliated Funds
The Fund is permitted to purchase or sell securities from or to certain other Invesco Funds under specified conditions outlined in procedures adopted by the Board of Trustees of the Trust. The procedures have been designed to ensure that any purchase or sale of securities by the Fund from or to another fund or portfolio that is or could be considered an affiliate by virtue of having a common investment adviser (or affiliated investment advisers), common Trustees and/or common officers complies with Rule 17a-7 of the 1940 Act. Further, as defined under the procedures, each transaction is effected at the current market price. Pursuant to these procedures, for the year ended August 31, 2015, the Fund engaged in securities purchases of $852,469.
NOTE 6—Expense Offset Arrangement(s)
The expense offset arrangement is comprised of transfer agency credits which result from balances in demand deposit accounts used by the transfer agent for clearing shareholder transactions. For the year ended August 31, 2015, the Fund received credits from this arrangement, which resulted in the reduction of the Fund’s total expenses of $19,493.
NOTE 7—Trustees’ and Officers’ Fees and Benefits
Trustees’ and Officers’ Fees and Benefits include amounts accrued by the Fund to pay remuneration to certain Trustees and Officers of the Fund. Trustees have the option to defer compensation payable by the Fund, and Trustees’ and Officers’ Fees and Benefits also include amounts accrued by the Fund to fund such deferred compensation amounts. Those Trustees who defer compensation have the option to select various Invesco Funds in which their deferral accounts shall be deemed to be invested. Finally, certain current Trustees were eligible to participate in a retirement plan that provided for benefits to be paid upon retirement to Trustees over a period of time based on the number of years of service. The Fund may have certain former Trustees who also participate in a retirement plan and receive benefits under such plan. Trustees’ and Officers’ Fees and Benefits include amounts accrued by the Fund to fund such retirement benefits. Obligations under the deferred compensation and retirement plans represent unsecured claims against the general assets of the Fund.
30 Invesco Equity and Income Fund
NOTE 8—Cash Balances
The Fund is permitted to temporarily carry a negative or overdrawn balance in its account with State Street Bank and Trust Company, the custodian bank. Such balances, if any at period end, are shown in the Statement of Assets and Liabilities under the payable caption Amount due custodian. To compensate the custodian bank for such overdrafts, the overdrawn Fund may either (1) leave funds as a compensating balance in the account so the custodian bank can be compensated by earning the additional interest; or (2) compensate by paying the custodian bank at a rate agreed upon by the custodian bank and Invesco, not to exceed the contractually agreed upon rate.
NOTE 9—Distributions to Shareholders and Tax Components of Net Assets
Tax Character of Distributions to Shareholders Paid During the Fiscal Years Ended August 31, 2015 and 2014:
| 2015 | 2014 | |||||||
Ordinary income | $ | 429,824,056 | $ | 223,843,118 | ||||
Long-term capital gain | 1,058,948,660 | 660,165,034 | ||||||
Total distributions | $ | 1,488,772,716 | $ | 884,008,152 | ||||
Tax Components of Net Assets at Period-End:
| 2015 | ||||
Undistributed ordinary income | $ | 116,093,046 | ||
Undistributed long-term gain | 330,485,795 | |||
Net unrealized appreciation — investments | 1,486,404,881 | |||
Net unrealized appreciation (depreciation) — other investments | (67,911 | ) | ||
Temporary book/tax differences | (6,245,992 | ) | ||
Shares of beneficial interest | 11,500,372,237 | |||
Total net assets | $ | 13,427,042,056 | ||
The difference between book-basis and tax-basis unrealized appreciation (depreciation) is due to differences in the timing of recognition of gains and losses on investments for tax and book purposes. The Fund’s net unrealized appreciation difference is attributable primarily to wash sales, book to tax accretion and amortization differences and contingent payment debt instruments.
The temporary book/tax differences are a result of timing differences between book and tax recognition of income and/or expenses. The Fund’s temporary book/tax differences are the result of the trustee deferral of compensation and retirement plan benefits.
Capital loss carryforward is calculated and reported as of a specific date. Results of transactions and other activity after that date may affect the amount of capital loss carryforward actually available for the Fund to utilize. Capital losses generated in years beginning after December 22, 2010 can be carried forward for an unlimited period, whereas previous losses expire in eight tax years. Capital losses with an expiration period may not be used to offset capital gains until all net capital losses without an expiration date have been utilized. Capital loss carryforwards with no expiration date will retain their character as either short-term or long-term capital losses instead of as short-term capital losses as under prior law. The ability to utilize capital loss carryforwards in the future may be limited under the Internal Revenue Code and related regulations based on the results of future transactions.
The Fund does not have a capital loss carryforward as of August 31, 2015.
NOTE 10—Investment Securities
The aggregate amount of investment securities (other than short-term securities, U.S. Treasury obligations and money market funds, if any) purchased and sold by the Fund during the year ended August 31, 2015 was $4,164,321,118 and $3,693,934,643, respectively. During the same period, purchases and sales of U.S. Treasury obligations were $5,093,029,614 and $4,964,580,856, respectively. Cost of investments on a tax basis includes the adjustments for financial reporting purposes as of the most recently completed federal income tax reporting period-end.
| Unrealized Appreciation (Depreciation) of Investment Securities on a Tax Basis | ||||
Aggregate unrealized appreciation of investment securities | $ | 1,933,887,468 | ||
Aggregate unrealized (depreciation) of investment securities | (447,482,587 | ) | ||
Net unrealized appreciation of investment securities | $ | 1,486,404,881 | ||
Cost of investments for tax purposes is $11,924,024,426.
NOTE 11—Reclassification of Permanent Differences
Primarily as a result of differing book/tax treatment of bond premiums and contingent payment debt instruments, on August 31, 2015, undistributed net investment income was increased by $92,644,136, undistributed net realized gain was decreased by $92,618,693 and shares of beneficial interest was decreased by $25,443. This reclassification had no effect on the net assets of the Fund.
31 Invesco Equity and Income Fund
NOTE 12—Share Information
| Summary of Share Activity | ||||||||||||||||
| Years ended August 31, | ||||||||||||||||
| 2015(a) | 2014 | |||||||||||||||
| Shares | Amount | Shares | Amount | |||||||||||||
Sold: | ||||||||||||||||
Class A | 132,855,407 | $ | 1,407,335,195 | 123,294,433 | $ | 1,338,786,753 | ||||||||||
Class B | 391,128 | 4,066,382 | 681,308 | 7,216,215 | ||||||||||||
Class C | 31,927,192 | 332,741,941 | 27,559,284 | 294,554,564 | ||||||||||||
Class R | 5,817,559 | 61,877,721 | 6,158,932 | 67,354,694 | ||||||||||||
Class Y | 29,754,125 | 316,032,681 | 25,562,881 | 279,392,264 | ||||||||||||
Class R5 | 14,653,172 | 154,978,913 | 21,087,163 | 228,477,944 | ||||||||||||
Class R6 | 13,351,616 | 140,910,100 | 11,239,560 | 122,857,003 | ||||||||||||
Issued as reinvestment of dividends: | ||||||||||||||||
Class A | 101,273,868 | 1,032,701,699 | 59,884,857 | 626,269,537 | ||||||||||||
Class B | 3,975,218 | 39,580,117 | 3,366,931 | 34,386,317 | ||||||||||||
Class C | 15,458,277 | 154,681,888 | 8,120,425 | 83,387,271 | ||||||||||||
Class R | 2,401,902 | 24,594,997 | 1,367,065 | 14,353,524 | ||||||||||||
Class Y | 7,619,261 | 77,752,111 | 3,766,637 | 39,437,002 | ||||||||||||
Class R5 | 4,569,798 | 46,663,503 | 2,125,920 | 22,271,818 | ||||||||||||
Class R6 | 1,726,337 | 17,634,474 | 533,196 | 5,601,728 | ||||||||||||
Automatic conversion of Class B shares to Class A shares: | ||||||||||||||||
Class A | 10,509,185 | 111,300,490 | 12,844,760 | 139,827,651 | ||||||||||||
Class B | (10,741,031 | ) | (111,300,490 | ) | (13,105,664 | ) | (139,827,651 | ) | ||||||||
Reacquired: | ||||||||||||||||
Class A | (148,952,999 | ) | (1,580,465,618 | ) | (144,137,291 | ) | (1,569,278,061 | ) | ||||||||
Class B | (5,457,994 | ) | (56,771,422 | ) | (7,178,837 | ) | (76,518,052 | ) | ||||||||
Class C | (22,383,709 | ) | (232,743,839 | ) | (16,168,255 | ) | (173,509,449 | ) | ||||||||
Class R | (6,407,390 | ) | (68,196,804 | ) | (5,756,408 | ) | (63,009,587 | ) | ||||||||
Class Y | (22,048,368 | ) | (231,509,029 | ) | (12,079,237 | ) | (131,156,310 | ) | ||||||||
Class R5 | (13,327,278 | ) | (141,098,524 | ) | (11,162,020 | ) | (121,650,155 | ) | ||||||||
Class R6 | (9,037,781 | ) | (94,703,092 | ) | (2,336,610 | ) | (25,471,824 | ) | ||||||||
Net increase in share activity | 137,927,495 | $ | 1,406,063,394 | 95,669,030 | $ | 1,003,753,196 | ||||||||||
| (a) | There are entities that are record owners of more than 5% of the outstanding shares of the Fund and in the aggregate own 35% of the outstanding shares of the Fund. IDI has an agreement with these entities to sell Fund shares. The Fund, Invesco and/or Invesco affiliates may make payments to these entities, which are considered to be related to the Fund, for providing services to the Fund, Invesco and/or Invesco affiliates including but not limited to services such as securities brokerage, distribution, third party record keeping and account servicing. The Fund has no knowledge as to whether all or any portion of the shares owned of record by these entities are also owned beneficially. |
32 Invesco Equity and Income Fund
NOTE 13—Financial Highlights
The following schedule presents financial highlights for a share of the Fund outstanding throughout the periods indicated.
| Net asset value, beginning of period | Net investment income(a) | Net gains (losses) on securities (both realized and unrealized) | Total from investment operations | Dividends from net investment income | Distributions from net realized gains | Total distributions | Net asset value, end | Total return(b) | Net assets, end of period (000’s omitted) | Ratio of expenses to average net assets with fee waivers and/or expenses absorbed | Ratio of expenses to average net assets without fee waivers and/or expenses absorbed | Ratio of net investment income to average net assets | Portfolio turnover(c) | |||||||||||||||||||||||||||||||||||||||||||||||||||||||||
Class A | ||||||||||||||||||||||||||||||||||||||||||||||||||||||||||||||||||||||
Year ended 08/31/15 | $ | 11.42 | $ | 0.15 | $ | (0.33 | ) | $ | (0.18 | ) | $ | (0.28 | ) | $ | (0.95 | ) | $ | (1.23 | ) | $ | 10.01 | (1.65 | )% | $ | 9,879,022 | 0.79 | %(d) | 0.80 | %(d) | 1.38 | %(d) | 69 | % | |||||||||||||||||||||||||||||||||||||
Year ended 08/31/14 | 10.43 | 0.22 | (e) | 1.56 | 1.78 | (0.20 | ) | (0.59 | ) | (0.79 | ) | 11.42 | 17.86 | 10,181,796 | 0.79 | 0.80 | 1.99 | (e) | 60 | |||||||||||||||||||||||||||||||||||||||||||||||||||
Year ended 08/31/13 | 9.05 | 0.17 | 1.42 | 1.59 | (0.21 | ) | — | (0.21 | ) | 10.43 | 17.80 | 8,752,700 | 0.78 | 0.79 | 1.74 | 26 | ||||||||||||||||||||||||||||||||||||||||||||||||||||||
Year ended 08/31/12 | 8.19 | 0.17 | 0.85 | 1.02 | (0.16 | ) | — | (0.16 | ) | 9.05 | 12.67 | 7,878,694 | 0.80 | 0.81 | 2.05 | 21 | ||||||||||||||||||||||||||||||||||||||||||||||||||||||
Year ended 08/31/11 | 7.53 | 0.15 | 0.66 | 0.81 | (0.15 | ) | — | (0.15 | ) | 8.19 | 10.78 | 7,908,623 | 0.81 | 0.81 | 1.74 | 22 | ||||||||||||||||||||||||||||||||||||||||||||||||||||||
Class B | ||||||||||||||||||||||||||||||||||||||||||||||||||||||||||||||||||||||
Year ended 08/31/15 | 11.18 | 0.07 | (0.32 | ) | (0.25 | ) | (0.20 | ) | (0.95 | ) | (1.15 | ) | 9.78 | (2.41 | ) | 271,120 | 1.54 | (d) | 1.55 | (d) | 0.63 | (d) | 69 | |||||||||||||||||||||||||||||||||||||||||||||||
Year ended 08/31/14 | 10.22 | 0.13 | (e) | 1.54 | 1.67 | (0.12 | ) | (0.59 | ) | (0.71 | ) | 11.18 | 17.01 | 442,318 | 1.54 | 1.55 | 1.24 | (e) | 60 | |||||||||||||||||||||||||||||||||||||||||||||||||||
Year ended 08/31/13 | 8.87 | 0.09 | 1.39 | 1.48 | (0.13 | ) | — | (0.13 | ) | 10.22 | 16.90 | 570,146 | 1.53 | 1.54 | 0.99 | 26 | ||||||||||||||||||||||||||||||||||||||||||||||||||||||
Year ended 08/31/12 | 8.04 | 0.15 | 0.83 | 0.98 | (0.15 | ) | — | (0.15 | ) | 8.87 | 12.36 | 739,631 | 1.02 | 1.56 | 1.83 | 21 | ||||||||||||||||||||||||||||||||||||||||||||||||||||||
Year ended 08/31/11 | 7.39 | 0.14 | 0.65 | 0.79 | (0.14 | ) | — | (0.14 | ) | 8.04 | 10.69 | (f) | 1,014,527 | 0.84 | (f) | 0.98 | (f) | 1.71 | (f) | 22 | ||||||||||||||||||||||||||||||||||||||||||||||||||
Class C | ||||||||||||||||||||||||||||||||||||||||||||||||||||||||||||||||||||||
Year ended 08/31/15 | 11.24 | 0.07 | (0.33 | ) | (0.26 | ) | (0.20 | ) | (0.95 | ) | (1.15 | ) | 9.83 | (2.48 | ) | 1,667,769 | 1.54 | (d) | 1.55 | (d) | 0.63 | (d) | 69 | |||||||||||||||||||||||||||||||||||||||||||||||
Year ended 08/31/14 | 10.27 | 0.13 | (e) | 1.55 | 1.68 | (0.12 | ) | (0.59 | ) | (0.71 | ) | 11.24 | 17.03 | 1,624,965 | 1.54 | 1.55 | 1.24 | (e) | 60 | |||||||||||||||||||||||||||||||||||||||||||||||||||
Year ended 08/31/13 | 8.91 | 0.10 | 1.40 | 1.50 | (0.14 | ) | — | (0.14 | ) | 10.27 | 16.95 | 1,284,225 | 1.53 | 1.54 | 0.99 | 26 | ||||||||||||||||||||||||||||||||||||||||||||||||||||||
Year ended 08/31/12 | 8.07 | 0.11 | 0.83 | 0.94 | (0.10 | ) | — | (0.10 | ) | 8.91 | 11.77 | (g) | 1,157,325 | 1.54 | (g) | 1.54 | (g) | 1.31 | (g) | 21 | ||||||||||||||||||||||||||||||||||||||||||||||||||
Year ended 08/31/11 | 7.42 | 0.09 | 0.65 | 0.74 | (0.09 | ) | — | (0.09 | ) | 8.07 | 9.95 | (g) | 1,216,936 | 1.54 | (g) | 1.54 | (g) | 1.01 | (g) | 22 | ||||||||||||||||||||||||||||||||||||||||||||||||||
Class R | ||||||||||||||||||||||||||||||||||||||||||||||||||||||||||||||||||||||
Year ended 08/31/15 | 11.47 | 0.13 | (0.34 | ) | (0.21 | ) | (0.26 | ) | (0.95 | ) | (1.21 | ) | 10.05 | (1.98 | ) | 221,987 | 1.04 | (d) | 1.05 | (d) | 1.13 | (d) | 69 | |||||||||||||||||||||||||||||||||||||||||||||||
Year ended 08/31/14 | 10.47 | 0.19 | (e) | 1.58 | 1.77 | (0.18 | ) | (0.59 | ) | (0.77 | ) | 11.47 | 17.60 | 232,455 | 1.04 | 1.05 | 1.74 | (e) | 60 | |||||||||||||||||||||||||||||||||||||||||||||||||||
Year ended 08/31/13 | 9.08 | 0.15 | 1.43 | 1.58 | (0.19 | ) | — | (0.19 | ) | 10.47 | 17.57 | 193,610 | 1.03 | 1.04 | 1.49 | 26 | ||||||||||||||||||||||||||||||||||||||||||||||||||||||
Year ended 08/31/12 | 8.23 | 0.15 | 0.85 | 1.00 | (0.15 | ) | — | (0.15 | ) | 9.08 | 12.23 | 176,940 | 1.05 | 1.06 | 1.80 | 21 | ||||||||||||||||||||||||||||||||||||||||||||||||||||||
Year ended 08/31/11 | 7.57 | 0.13 | 0.66 | 0.79 | (0.13 | ) | — | (0.13 | ) | 8.23 | 10.45 | 182,135 | 1.06 | 1.06 | 1.49 | 22 | ||||||||||||||||||||||||||||||||||||||||||||||||||||||
Class Y | ||||||||||||||||||||||||||||||||||||||||||||||||||||||||||||||||||||||
Year ended 08/31/15 | 11.43 | 0.17 | (0.33 | ) | (0.16 | ) | (0.31 | ) | (0.95 | ) | (1.26 | ) | 10.01 | (1.49 | ) | 784,238 | 0.54 | (d) | 0.55 | (d) | 1.63 | (d) | 69 | |||||||||||||||||||||||||||||||||||||||||||||||
Year ended 08/31/14 | 10.43 | 0.24 | (e) | 1.58 | 1.82 | (0.23 | ) | (0.59 | ) | (0.82 | ) | 11.43 | 18.25 | 719,931 | 0.54 | 0.55 | 2.24 | (e) | 60 | |||||||||||||||||||||||||||||||||||||||||||||||||||
Year ended 08/31/13 | 9.05 | 0.20 | 1.41 | 1.61 | (0.23 | ) | — | (0.23 | ) | 10.43 | 18.10 | 477,207 | 0.53 | 0.54 | 1.99 | 26 | ||||||||||||||||||||||||||||||||||||||||||||||||||||||
Year ended 08/31/12 | 8.20 | 0.20 | 0.84 | 1.04 | (0.19 | ) | — | (0.19 | ) | 9.05 | 12.83 | 410,600 | 0.55 | 0.56 | 2.30 | 21 | ||||||||||||||||||||||||||||||||||||||||||||||||||||||
Year ended 08/31/11 | 7.54 | 0.17 | 0.67 | 0.84 | (0.18 | ) | — | (0.18 | ) | 8.20 | 11.04 | 422,009 | 0.56 | 0.56 | 1.99 | 22 | ||||||||||||||||||||||||||||||||||||||||||||||||||||||
Class R5 | ||||||||||||||||||||||||||||||||||||||||||||||||||||||||||||||||||||||
Year ended 08/31/15 | 11.43 | 0.18 | (0.32 | ) | (0.14 | ) | (0.32 | ) | (0.95 | ) | (1.27 | ) | 10.02 | (1.32 | ) | 411,579 | 0.47 | (d) | 0.48 | (d) | 1.70 | (d) | 69 | |||||||||||||||||||||||||||||||||||||||||||||||
Year ended 08/31/14 | 10.43 | 0.25 | (e) | 1.58 | 1.83 | (0.24 | ) | (0.59 | ) | (0.83 | ) | 11.43 | 18.33 | 402,366 | 0.48 | 0.49 | 2.30 | (e) | 60 | |||||||||||||||||||||||||||||||||||||||||||||||||||
Year ended 08/31/13 | 9.05 | 0.20 | 1.42 | 1.62 | (0.24 | ) | — | (0.24 | ) | 10.43 | 18.17 | 241,540 | 0.47 | 0.48 | 2.05 | 26 | ||||||||||||||||||||||||||||||||||||||||||||||||||||||
Year ended 08/31/12 | 8.20 | 0.21 | 0.84 | 1.05 | (0.20 | ) | — | (0.20 | ) | 9.05 | 12.96 | 238,392 | 0.44 | 0.44 | 2.41 | 21 | ||||||||||||||||||||||||||||||||||||||||||||||||||||||
Year ended 08/31/11 | 7.54 | 0.19 | 0.65 | 0.84 | (0.18 | ) | — | (0.18 | ) | 8.20 | 11.16 | 156,096 | 0.39 | 0.39 | 2.16 | 22 | ||||||||||||||||||||||||||||||||||||||||||||||||||||||
Class R6 | ||||||||||||||||||||||||||||||||||||||||||||||||||||||||||||||||||||||
Year ended 08/31/15 | 11.43 | 0.19 | (0.33 | ) | (0.14 | ) | (0.33 | ) | (0.95 | ) | (1.28 | ) | 10.01 | (1.33 | ) | 191,328 | 0.37 | (d) | 0.38 | (d) | 1.80 | (d) | 69 | |||||||||||||||||||||||||||||||||||||||||||||||
Year ended 08/31/14 | 10.43 | 0.26 | (e) | 1.58 | 1.84 | (0.25 | ) | (0.59 | ) | (0.84 | ) | 11.43 | 18.44 | 149,346 | 0.39 | 0.40 | 2.39 | (e) | 60 | |||||||||||||||||||||||||||||||||||||||||||||||||||
Year ended 08/31/13(h) | 9.27 | 0.21 | 1.14 | 1.35 | (0.19 | ) | — | (0.19 | ) | 10.43 | 14.81 | 37,884 | 0.37 | (i) | 0.38 | (i) | 2.15 | (i) | 26 | |||||||||||||||||||||||||||||||||||||||||||||||||||
| (a) | Calculated using average shares outstanding. |
| (b) | Includes adjustments in accordance with accounting principles generally accepted in the United States of America and as such, the net asset value for financial reporting purposes and the returns based upon those net asset values may differ from the net asset value and returns for shareholder transactions. Does not include sales charges and is not annualized for periods less than one year, if applicable. |
| (c) | Portfolio turnover is calculated at the fund level and is not annualized for periods less than one year, if applicable. |
| (d) | Ratios are based on average daily net assets (000’s omitted) of $10,208,819, $363,318, $1,680,212, $233,026, $775,006, $433,625 and $162,423 for Class A, Class B, Class C, Class R, Class Y, Class R5 and Class R6 shares, respectively. |
| (e) | Net investment income per share and the ratio of net investment income to average net assets includes significant dividends received during the period. Net investment income per share and the ratio of net investment income to average net assets excluding the significant dividends are $0.16 and 1.47%, $0.07 and 0.72%, $0.07 and 0.72%, $0.13 and 1.22%, $0.18 and 1.72%, $0.19 and 1.78% and $0.20 and 1.87% for Class A, Class B, Class C, Class R, Class Y, Class R5 and Class R6 shares, respectively. |
| (f) | The total return, ratio of expenses to average net assets and ratio of net investment income to average net assets reflect actual 12b-1 fees of 0.28% for the year ended August 31, 2011. |
| (g) | The total return, ratio of expenses to average net assets and ratio of net investment income to average net assets reflect actual 12b-1 fees of 0.99% and 0.97% for the years ended August 31, 2012 and August 31, 2011, respectively. |
| (h) | Commencement date of September 24, 2012. |
| (i) | Annualized. |
33 Invesco Equity and Income Fund
Report of Independent Registered Public Accounting Firm
To the Board of Trustees of AIM Counselor Series Trust (Invesco Counselor Series Trust)
and Shareholders of Invesco Equity and Income Fund:
In our opinion, the accompanying statement of assets and liabilities, including the schedule of investments, and the related statements of operations and of changes in net assets and the financial highlights present fairly, in all material respects, the financial position of Invesco Equity and Income Fund (one of the funds constituting AIM Counselor Series Trust (Invesco Counselor Series Trust), hereafter referred to as the “Fund”) at August 31, 2015, the results of its operations for the year then ended, the changes in its net assets for each of the two years in the period then ended and the financial highlights for each of the five years in the period then ended, in conformity with accounting principles generally accepted in the United States of America. These financial statements and financial highlights (hereafter referred to as “financial statements”) are the responsibility of the Fund’s management. Our responsibility is to express an opinion on these financial statements based on our audits. We conducted our audits of these financial statements in accordance with the standards of the Public Company Accounting Oversight Board (United States). Those standards require that we plan and perform the audit to obtain reasonable assurance about whether the financial statements are free of material misstatement. An audit includes examining, on a test basis, evidence supporting the amounts and disclosures in the financial statements, assessing the accounting principles used and significant estimates made by management, and evaluating the overall financial statement presentation. We believe that our audits, which included confirmation of securities at August 31, 2015 by correspondence with the custodian and brokers, and the application of alternative auditing procedures where confirmations of security purchases have not been received, provide a reasonable basis for our opinion.
PRICEWATERHOUSECOOPERS LLP
October 27, 2015
Houston, Texas
34 Invesco Equity and Income Fund
Calculating your ongoing Fund expenses
Example
As a shareholder of the Fund, you incur two types of costs: (1) transaction costs, which may include sales charges (loads) on purchase payments or contingent deferred sales charges on redemptions, if any; and (2) ongoing costs, including management fees, distribution and/or service (12b-1) fees, and other Fund expenses. This example is intended to help you understand your ongoing costs (in dollars) of investing in the Fund and to compare these costs with ongoing costs of investing in other mutual funds. The example is based on an investment of $1,000 invested at the beginning of the period and held for the entire period March 1, 2015 through August 31, 2015.
Actual expenses
The table below provides information about actual account values and actual expenses. You may use the information in this table, together with the amount you invested, to estimate the expenses that you paid over the period. Simply divide your account value by $1,000 (for example, an $8,600 account value divided by $1,000 = 8.6), then multiply the result by the number in the table under the heading entitled “Actual Expenses Paid During Period” to estimate the expenses you paid on your account during this period.
Hypothetical example for comparison purposes
The table below also provides information about hypothetical account values and hypothetical expenses based on the Fund’s actual expense ratio and an assumed rate of return of 5% per year before expenses, which is not the Fund’s actual return.
The hypothetical account values and expenses may not be used to estimate the actual ending account balance or expenses you paid for the period. You may use this information to compare the ongoing costs of investing in the Fund and other funds. To do so, compare this 5% hypothetical example with the 5% hypothetical examples that appear in the shareholder reports of the other funds.
Please note that the expenses shown in the table are meant to highlight your ongoing costs only and do not reflect any transaction costs, such as sales charges (loads) on purchase payments or contingent deferred sales charges on redemptions, if any. Therefore, the hypothetical information is useful in comparing ongoing costs only, and will not help you determine the relative total costs of owning different funds. In addition, if these transaction costs were included, your costs would have been higher.
| Class | Beginning Account Value (03/01/15) | ACTUAL | HYPOTHETICAL (5% annual return before expenses) | Annualized Expense Ratio | ||||||||||||||||||||
| Ending Account Value (08/31/15)1 | Expenses Paid During Period2 | Ending Account Value (08/31/15) | Expenses Paid During Period2 | |||||||||||||||||||||
| A | $ | 1,000.00 | $ | 964.60 | $ | 3.91 | $ | 1,021.22 | $ | 4.02 | 0.79 | % | ||||||||||||
| B | 1,000.00 | 960.90 | 7.61 | 1,017.44 | 7.83 | 1.54 | ||||||||||||||||||
| C | 1,000.00 | 960.20 | 7.61 | 1,017.44 | 7.83 | 1.54 | ||||||||||||||||||
| R | 1,000.00 | 962.60 | 5.14 | 1,019.96 | 5.30 | 1.04 | ||||||||||||||||||
| Y | 1,000.00 | 965.80 | 2.68 | 1,022.48 | 2.75 | 0.54 | ||||||||||||||||||
| R5 | 1,000.00 | 966.20 | 2.33 | 1,022.84 | 2.40 | 0.47 | ||||||||||||||||||
| R6 | 1,000.00 | 965.70 | 1.83 | 1,023.34 | 1.89 | 0.37 | ||||||||||||||||||
| 1 | The actual ending account value is based on the actual total return of the Fund for the period March 1, 2015 through August 31, 2015, after actual expenses and will differ from the hypothetical ending account value which is based on the Fund’s expense ratio and a hypothetical annual return of 5% before expenses. |
| 2 | Expenses are equal to the Fund’s annualized expense ratio as indicated above multiplied by the average account value over the period, multiplied by 184/365 to reflect the most recent fiscal half year. |
35 Invesco Equity and Income Fund
Approval of Investment Advisory and Sub-Advisory Contracts
The Board of Trustees (the Board) of AIM Counselor Series Trust (Invesco Counselor Series Trust) is required under the Investment Company Act of 1940, as amended, to approve annually the renewal of Invesco Equity and Income Fund’s (the Fund) investment advisory agreements. During contract renewal meetings held on June 9-10, 2015, the Board as a whole, and the disinterested or “independent” Trustees, who comprise over 75% of the Board, voting separately, approved the continuance for the Fund of the Master Investment Advisory Agreement with Invesco Advisers, Inc. (Invesco Advisers and the investment advisory agreement) and the Master Intergroup Sub-Advisory Contract for Mutual Funds with Invesco Asset Management Deutschland GmbH, Invesco Asset Management Limited, Invesco Asset Management (Japan) Limited , Invesco Hong Kong Limited, Invesco Senior Secured Management, Inc. and Invesco Canada Ltd. (collectively, the Affiliated Sub-Advisers and the sub-advisory contracts) for another year, effective July 1, 2015.
In evaluating the fairness and reasonableness of compensation under the Fund’s investment advisory agreement and sub-advisory contracts, the Board considered, among other things, the factors discussed below. The Board determined that continuation of the Fund’s investment advisory agreement and the sub-advisory contracts is in the best interest of the Fund and its shareholders and that the compensation payable to Invesco Advisers and the Affiliated Sub-Advisers under the agreements is fair and reasonable.
The Board’s Fund Evaluation Process
The Board’s Investments Committee has established three Sub-Committees, each of which is primarily responsible for overseeing the performance and investment management services provided by Invesco Advisers and the Affiliated Sub-Advisers to a number of the funds advised by Invesco Advisers (the Invesco Funds). The Sub-Committees meet throughout the year to review the performance of their assigned Invesco Funds, including reviewing materials prepared under the direction of the independent Senior Officer, an officer of the Invesco Funds who reports directly to the independent Trustees. Over the course of each year, the Sub-Committees meet with portfolio managers for their assigned Invesco Funds and other members of management to review the performance, investment objective(s), policies, strategies, limitations and investment risks of these funds. The Board had the benefit of reports form the Sub-Committees and Investments Committee throughout the year in considering approval of the continuance of each Invesco Fund’s investment advisory agreement and sub-advisory contracts for another year.
During the contract renewal process, the Board receives comparative performance and fee data regarding the Invesco Funds prepared by Invesco Advisers and Lipper Inc. (Lipper), an independent provider of investment company data. The Board also receives a report and this independent written evaluation from the Senior Officer. The Senior Officer’s evaluation is prepared as part of his responsibility to manage the process by which the Invesco Funds’ proposed management fees are negotiated during the annual contract renewal process to ensure they are negotiated in a manner that is at arms’ length and reasonable. In addition to meetings with Invesco Advisers and fund counsel, the independent Trustees also discuss the continuance of the investment advisory agreement and sub-advisory contracts in separate sessions with the Senior Officer and with independent legal counsel.
The Trustees recognized that the advisory fee rates for the Invesco Funds are, in many cases, the result of years of review and negotiation. The Trustees’ deliberations and conclusions in a particular year may be based in part on their deliberations and conclusions regarding these same arrangements throughout the year and in prior years. The Trustees’ review and conclusions are based on the comprehensive consideration of all information presented to them and are not the result of any single determinative factor. Moreover, one Trustee may have weighed a particular piece of information or factor differently than another Trustee.
The discussion below is a summary of the Senior Officer’s independent written evaluation with respect to the Fund’s investment advisory agreement as well as a discussion of the material factors and related conclusions that formed the basis for the Board’s approval of the Fund’s investment advisory agreement and sub-advisory contracts. Unless otherwise stated, this information is current as of June 10, 2015, and does not reflect consideration of factors that became known to the Board after that date.
Factors and Conclusions and Summary of Independent Written Fee Evaluation
| A. | Nature, Extent and Quality of Services Provided by Invesco Advisers and the Affiliated Sub-Advisers |
The Board reviewed the advisory services provided to the Fund by Invesco Advisers under the Fund’s investment advisory agreement, the performance of Invesco Advisers in providing these services, and the credentials and experience of the officers and employees of Invesco Advisers who provide these services, including the Fund’s portfolio manager or managers. The Board’s review of the qualifications of Invesco Advisers to provide advisory services included the Board’s
consideration of Invesco Advisers’ investment process oversight, independent credit analysis and investment risk management. The Board also considered non-advisory services that Invesco Advisers and its affiliates provide to the Invesco Funds such as various back office support functions, equity and fixed income trading operations, internal audit, distribution, valuation and legal and compliance.
In determining whether to continue the Fund’s investment advisory agreement, the Board considered the benefits of reapproving an existing relationship and the greater uncertainty that may be associated with entering into a new relationship. The Board concluded that the nature, extent and quality of the services provided to the Fund by Invesco Advisers are appropriate and satisfactory and consistent with the terms of the Fund’s investment advisory agreement.
The Board reviewed the services that may be provided by the Affiliated Sub-Advisers under the sub-advisory contracts and the credentials and experience of the officers and employees of the Affiliated Sub-Advisers who provide these services. The Board noted that the Affiliated Sub-Advisers have offices and personnel that are located in financial centers around the world. As a result, the Affiliated Sub-Advisers can provide research and investment analysis on the markets and economies of various countries in which the Fund may invest, make recommendations regarding securities and assist with security trades. The Board concluded that the sub-advisory contracts benefit the Fund and its shareholders by permitting Invesco Advisers to use the resources and talents of the Affiliated Sub-Advisers in managing the Fund. The Board concluded that the nature, extent and quality of the services that may be provided by the Affiliated Sub-Advisers are appropriate and satisfactory and consistent with the terms of the Fund’s sub-advisory contracts.
| B. | Fund Performance |
The Board considered Fund performance as a relevant factor in considering whether to approve the investment advisory agreement. The Board did not view Fund performance as a relevant factor in considering whether to approve the sub-advisory contracts for the Fund, as no Affiliated Sub-Adviser currently manages assets of the Fund.
The Board compared the Fund’s performance during the past one, three and five calendar years to the performance of funds in the Lipper performance universe and against the Lipper Mixed-Asset Target Allocation Growth Funds Index. The Board noted that performance of Class A shares of the Fund was in the first quintile of its performance universe for the one, three and five year periods (the first quintile being the best performing funds and the fifth quintile being the worst performing funds). The Board noted that performance of Class A shares
36 Invesco Equity and Income Fund
of the Fund was above the performance of the Index for the one, three and five year periods. The Trustees also reviewed more recent Fund performance and this review did not change their conclusions.
| C. | Advisory and Sub-Advisory Fees |
The Board compared the Fund’s contractual management fee rate to the contractual management fee rates of funds in the Fund’s Lipper expense group at a common asset level. The Board noted that the contractual management fee rate for Class A shares of the Fund was below the median contractual management fee rate of funds in its expense group. The Board noted that the term “contractual management fee” may include both advisory and certain administrative services fees, but that Lipper does not provide information on a fund by fund basis as to what is included. The Board noted that Invesco Advisers does not charge the Invesco Funds for the administrative services included in the term as defined by Lipper. The Board also reviewed the methodology used by Lipper in providing expense group information, which includes using each fund’s contractual management fee schedule (including any applicable breakpoints) as reported in the most recent prospectus or statement of additional information for each fund in the expense group.
The Board also compared the Fund’s effective advisory fee rate (the advisory fee rate after advisory fee waivers and before other expense limitations/waivers) to the effective advisory fee rates of other mutual funds advised by Invesco Advisers and its affiliates with investment strategies comparable to those of the Fund. The Board noted that the Fund’s rate was below the rate of one such mutual fund. The Board also noted how the Fund’s rate compared to the effective sub-adviser fee rate of three mutual funds sub-advised by Invesco Advisers. The Board noted that Invesco Advisers and the Affiliated Sub-Advisers do not advise other client accounts that are managed using an investment process substantially similar to the investment process used for the Fund.
The Board also considered the services that may be provided by the Affiliated Sub-Advisers pursuant to the sub-advisory contracts, as well as the fees payable by Invesco Advisers to the Affiliated Sub-Advisers pursuant to the sub-advisory contracts. The Board also noted that the sub-advisory fees are not paid directly by the Fund, but rather, are payable by Invesco Advisers to the Affiliated Sub-Advisers.
| D. | Economies of Scale and Breakpoints |
The Board considered the extent to which there are economies of scale in the provision of advisory services to the Fund. The Board also considered whether the Fund benefits from economies of scale through contractual breakpoints in the Fund’s advisory fee schedule. The Board also noted that the Fund shares directly in economies of scale through lower fees charged by third party service providers based on the combined size of the Invesco
Funds and other clients advised by Invesco Advisers.
| E. | Profitability and Financial Resources |
The Board reviewed information from Invesco Advisers concerning the costs of the advisory and other services that Invesco Advisers and its affiliates provide to the Fund and the Invesco Funds and the profitability of Invesco Advisers and its affiliates in providing these services. The Board received information from Invesco Advisers about the methodology used to prepare the profitability information. The Board noted that Invesco Advisers continues to operate at a net profit from services Invesco Advisers and its affiliates provide to the Invesco Funds and the Fund. The Board did not deem the level of profits realized by Invesco Advisers and its affiliates from providing services to the Fund to be excessive given the nature, quality and extent of the services provided. The Board received and accepted information from Invesco Advisers demonstrating that Invesco Advisers and each Affiliated Sub-Adviser are financially sound and have the resources necessary to perform their obligations under the investment advisory agreement and sub-advisory contracts.
| F. | Collateral Benefits to Invesco Advisers and its Affiliates |
The Board considered various other benefits received by Invesco Advisers and its affiliates from the relationship with the Fund, including the fees received for providing transfer agency and distribution services to the Fund. The Board considered comparative information regarding fees charged for these services, including information provided by Lipper and other independent sources. The Board considered the performance of Invesco Advisers and its affiliates in providing these services and the organizational structure employed to provide these services. The Board also considered that these services are provided to the Fund pursuant to written contracts that are reviewed and approved on an annual basis by the Board; and that the services are required for the operation of the Fund.
The Board considered the benefits realized by Invesco Advisers and the Affiliated Sub-Advisers as a result of portfolio brokerage transactions executed through “soft dollar” arrangements. The Board noted that soft dollar arrangements shift the payment obligation for research services from Invesco Advisers and the Affiliated Sub-Advisers to the Invesco Funds and that the research received may be used with other clients of Invesco Advisers and may reduce Invesco Advisers’ and the Affiliated Sub-Advisers’ expenses. The Board also considered that it receives periodic reports from the Chief Compliance Officer of the Invesco Funds demonstrating that these arrangements are consistent with regulatory requirements. The Board did not deem the soft dollar arrangements to be inappropriate.
The Board considered that the Fund’s uninvested cash and cash collateral from any securities lending arrangements may be invested in money market funds advised by
Invesco Advisers pursuant to procedures approved by the Board. The Board noted that Invesco Advisers receives advisory fees from these affiliated money market funds attributable to such investments, although Invesco Advisers has contractually agreed to waive through varying periods the advisory fees payable by the Invesco Funds with respect to investments in the affiliated money market funds. The waiver is in an amount equal to 100% of the net advisory fee Invesco Advisers receives from the affiliated money market funds with respect to the Fund’s investment in the affiliated money market funds of uninvested cash, but not cash collateral. The Board concluded that the amount of advisory fees received by Invesco Advisors from the Fund’s investment of cash collateral from any securities lending arrangements in the affiliated money market funds is fair and reasonable.
The Board also considered the Fund may use an affiliated broker to execute certain trades for the Fund to among other things, control information leakage, and were advised that such trades would be executed in compliance with rules under the Investment Company Act of 1940, as amended, and consistent with best execution obligations.
37 Invesco Equity and Income Fund
Tax Information
Form 1099-DIV, Form 1042-S and other year-end tax information provide shareholders with actual calendar year amounts that should be included in their tax returns. Shareholders should consult their tax advisors.
The following distribution information is being provided as required by the Internal Revenue Code or to meet a specific state’s requirement.
The Fund designates the following amounts or, if subsequently determined to be different, the maximum amount allowable for its fiscal year ended August 31, 2015:
Federal and State Income Tax | ||||
Long-Term Capital Gain Distributions | $ | 1,058,948,660 | ||
Qualified Dividend Income* | 67.98 | % | ||
Corporate Dividends Received Deduction* | 43.43 | % | ||
U.S. Treasury Obligations* | 4.14 | % | ||
| * | The above percentages are based on ordinary income dividends paid to shareholders during the Fund’s fiscal year. |
Non-Resident Alien Shareholders | ||||
Qualified Short-Term Gains | $ | 88,687,889 | ||
38 Invesco Equity and Income Fund
Trustees and Officers
The address of each trustee and officer is AIM Counselor Series Trust (Invesco Counselor Series Trust) (the “Trust”), 11 Greenway Plaza, Suite 1000, Houston, Texas 77046-1173. The trustees serve for the life of the Trust, subject to their earlier death, incapacitation, resignation, retirement or removal as more specifically provided in the Trust’s organizational documents. Each officer serves for a one year term or until their successors are elected and qualified. Column two below includes length of time served with predecessor entities, if any.
| Name, Year of Birth and Position(s) Held with the Trust | Trustee and/ or Officer Since | Principal Occupation(s) During Past 5 Years | Number of Funds in Fund Complex Overseen by Trustee | Other Directorship(s) Held by Trustee During Past 5 Years | ||||
| Interested Persons | ||||||||
| Martin L. Flanagan1 — 1960 Trustee | 2007 | Executive Director, Chief Executive Officer and President, Invesco Ltd. (ultimate parent of Invesco and a global investment management firm); Advisor to the Board, Invesco Advisers, Inc. (formerly known as Invesco Institutional (N.A.), Inc.); Trustee, The Invesco Funds; Vice Chair, Investment Company Institute; and Member of Executive Board, SMU Cox School of Business
Formerly: Chairman and Chief Executive Officer, Invesco Advisers, Inc. (registered investment adviser); Director, Chairman, Chief Executive Officer and President, IVZ Inc. (holding company), INVESCO Group Services, Inc. (service provider) and Invesco North American Holdings, Inc. (holding company); Director, Chief Executive Officer and President, Invesco Holding Company Limited (parent of Invesco and a global investment management firm); Director, Invesco Ltd.; Chairman, Investment Company Institute and President, Co-Chief Executive Officer, Co-President, Chief Operating Officer and Chief Financial Officer, Franklin Resources, Inc. (global investment management organization). | 144 | None | ||||
| Philip A. Taylor2 — 1954 Trustee, President and Principal Executive Officer | 2006 | Head of North American Retail and Senior Managing Director, Invesco Ltd.; Director, Co-Chairman, Co-President and Co-Chief Executive Officer, Invesco Advisers, Inc. (formerly known as Invesco Institutional (N.A.), Inc.) (registered investment adviser); Director, Chairman, Chief Executive Officer and President, Invesco Management Group, Inc. (formerly known as Invesco Aim Management Group, Inc.) (financial services holding company); Director and President, INVESCO Funds Group, Inc. (registered investment adviser and registered transfer agent); Director and Chairman, Invesco Investment Services, Inc. (formerly known as Invesco Aim Investment Services, Inc.) (registered transfer agent) and IVZ Distributors, Inc. (formerly known as INVESCO Distributors, Inc.) (registered broker dealer); Director, President and Chairman, Invesco Inc. (holding company), Invesco Canada Holdings Inc. (holding company), Trimark Investments Ltd./Placements Trimark Ltèe and Invesco Financial Services Ltd/Services Financiers Invesco Ltèe; Chief Executive Officer, Invesco Corporate Class Inc. (corporate mutual fund company) Director, Chairman and Chief Executive Officer, Invesco Canada Ltd. (formerly known as Invesco Trimark Ltd./Invesco Trimark Ltèe) (registered investment adviser and registered transfer agent); Trustee, President and Principal Executive Officer, The Invesco Funds (other than AIM Treasurer’s Series Trust (Invesco Treasurer’s Series Trust), Short-Term Investments Trust and Invesco Management Trust); Trustee and Executive Vice President, The Invesco Funds (AIM Treasurer’s Series Trust (Invesco Treasurer’s Series Trust), Short-Term Investments Trust and Invesco Management Trust only); Director, Invesco Investment Advisers LLC (formerly known as Van Kampen Asset Management); Director, Chief Executive Officer and President, Van Kampen Exchange Corp.
Formerly: Chief Executive Officer, Invesco Canada Fund Inc (corporate mutual fund company); Director and Chairman, Van Kampen Investor Services Inc.; Director, Chief Executive Officer and President, 1371 Preferred Inc. (holding company) and Van Kampen Investments Inc.; Director and President, AIM GP Canada Inc. (general partner for limited partnerships) and Van Kampen Advisors, Inc.; Director and Chief Executive Officer, Invesco Trimark Dealer Inc. (registered broker dealer); Director, Invesco Distributors, Inc. (formerly known as Invesco Aim Distributors, Inc.) (registered broker dealer); Manager, Invesco PowerShares Capital Management LLC; Director, Chief Executive Officer and President, Invesco Advisers, Inc.; Director, Chairman, Chief Executive Officer and President, Invesco Aim Capital Management, Inc.; President, Invesco Trimark Dealer Inc. and Invesco Trimark Ltd./Invesco Trimark Ltèe; Director and President, AIM Trimark Corporate Class Inc. and AIM Trimark Canada Fund Inc.; Senior Managing Director, Invesco Holding Company Limited; Director and Chairman, Fund Management Company (former registered broker dealer); President and Principal Executive Officer, The Invesco Funds (AIM Treasurer’s Series Trust (Invesco Treasurer’s Series Trust), and Short-Term Investments Trust only); President, AIM Trimark Global Fund Inc. and AIM Trimark Canada Fund Inc.. | 144 | None |
| 1 | Mr. Flanagan is considered an interested person (within the meaning of Section 2(a)(19) of the 1940 Act) of the Trust because he is an officer of the Adviser to the Trust, and an officer and a director of Invesco Ltd., ultimate parent of the Adviser. |
| 2 | Mr. Taylor is considered an interested person (within the meaning of Section 2(a)(19) of the 1940 Act) of the Trust because he is an officer and a director of the Adviser. |
T-1 Invesco Equity and Income Fund
Trustees and Officers—(continued)
| Name, Year of Birth and Position(s) Held with the Trust | Trustee and/ or Officer Since | Principal Occupation(s) During Past 5 Years | Number of Funds in Fund Complex Overseen by Trustee | Other Directorship(s) Held by Trustee During Past 5 Years | ||||
| Independent Trustees | ||||||||
Bruce L. Crockett — 1944 Trustee and Chair | 2003 | Chairman, Crockett Technologies Associates (technology consulting company)
Formerly: Director, Captaris (unified messaging provider); Director, President and Chief Executive Officer, COMSAT Corporation; Chairman, Board of Governors of INTELSAT (international communications company); ACE Limited (insurance company); Independent Directors Council and Investment Company Institute | 144 | ALPS (Attorneys Liability Protection Society) (insurance company) and Globe Specialty Metals, Inc. (metallurgical company) | ||||
David C. Arch — 1945 Trustee | 2010 | Chairman of Blistex Inc., a consumer health care products manufacturer | 144 | Board member of the Illinois Manufacturers’ Association; Member of the Board of Visitors, Institute for the Humanities, University of Michigan; Member of the Audit Committee of the Edward-Elmhurst Hospital | ||||
James T. Bunch — 1942 Trustee | 2000 | Managing Member, Grumman Hill Group LLC (family office/private equity investments)
Formerly: Founder, Green Manning & Bunch Ltd. (investment banking firm) (1988-2010); Executive Committee, United States Golf Association; and Chairman, Board of Governors, Western Golf Association | 144 | Chairman of the Board of Trustees, Evans Scholars Foundation; and Chairman of the Board, Denver Film Society | ||||
Rodney F. Dammeyer — 1940 Trustee | 2010 | Chairman of CAC, LLC, (private company offering capital investment and management advisory services)
Formerly: Prior to 2001, Managing Partner at Equity Group Corporate Investments; Prior to 1995, Chief Executive Officer of Itel Corporation (formerly Anixter International); Prior to 1985, experience includes Senior Vice President and Chief Financial Officer of Household International, Inc., Executive Vice President and Chief Financial Officer of Northwest Industries, Inc. and Partner of Arthur Andersen & Co.; From 1987 to 2010, Director/Trustee of investment companies in the Van Kampen Funds complex | 144 | Director of Quidel Corporation and Stericycle, Inc. | ||||
Albert R. Dowden — 1941 Trustee | 2003 | Director of a number of public and private business corporations, including the Boss Group, Ltd. (private investment and management); Nature’s Sunshine Products, Inc. and Reich & Tang Funds (5 portfolios) (registered investment company)
Formerly: Director, Homeowners of America Holding Corporation/Homeowners of America Insurance Company (property casualty company); Director, Continental Energy Services, LLC (oil and gas pipeline service); Director, CompuDyne Corporation (provider of product and services to the public security market) and Director, Annuity and Life Re (Holdings), Ltd. (reinsurance company); Director, President and Chief Executive Officer, Volvo Group North America, Inc.; Senior Vice President, AB Volvo; Director of various public and private corporations; Chairman, DHJ Media, Inc.; Director, Magellan Insurance Company; and Director, The Hertz Corporation, Genmar Corporation (boat manufacturer), National Media Corporation; Advisory Board of Rotary Power International (designer, manufacturer, and seller of rotary power engines); and Chairman, Cortland Trust, Inc. (registered investment company) | 144 | Director of: Nature’s Sunshine Products, Inc., Reich & Tang Funds, Homeowners of America Holding Corporation/ Homeowners of America Insurance Company, the Boss Group | ||||
Jack M. Fields — 1952 Trustee | 2003 | Chief Executive Officer, Twenty First Century Group, Inc. (government affairs company); Owner and Chief Executive Officer, Dos Angeles Ranch, L.P. (cattle, hunting, corporate entertainment); and Discovery Global Education Fund (non-profit)
Formerly: Chief Executive Officer, Texana Timber LP (sustainable forestry company); Director of Cross Timbers Quail Research Ranch (non-profit); and member of the U.S. House of Representatives | 144 | Insperity, Inc. (formerly known as Administaff) | ||||
Prema Mathai-Davis — 1950 Trustee | 2003 | Retired. Formerly: Chief Executive Officer, YWCA of the U.S.A. | 144 | None | ||||
Larry Soll — 1942 Trustee | 1997 | Retired. Formerly: Chairman, Chief Executive Officer and President, Synergen Corp. (a biotechnology company) | 144 | None | ||||
Hugo F. Sonnenschein — 1940 Trustee | 2010 | President Emeritus and Honorary Trustee of the University of Chicago and the Adam Smith Distinguished Service Professor in the Department of Economics at the University of Chicago. Prior to 2000, President of the University of Chicago | 144 | Trustee of the University of Rochester and a member of its investment committee; Member of the National Academy of Sciences and the American Philosophical Society; Fellow of the American Academy of Arts and Sciences | ||||
| Raymond Stickel, Jr. — 1944 Trustee | 2005 | Retired. Formerly: Director, Mainstay VP Series Funds, Inc. (25 portfolios) and Partner, Deloitte & Touche | 144 | None |
T-2 Invesco Equity and Income Fund
Trustees and Officers—(continued)
| Name, Year of Birth and Position(s) Held with the Trust | Trustee and/ or Officer Since | Principal Occupation(s) During Past 5 Years | Number of Funds in Fund Complex Overseen by Trustee | Other Directorship(s) Held by Trustee During Past 5 Years | ||||
| Independent Trustees—(continued) | ||||||||
Suzanne H. Woolsey — 1941 Trustee | 2014 | Chief Executive Officer of Woolsey Partners LLC | 144 | Emeritus Chair of the Board of Trustees of the Institute for Defense Analyses; Trustee of Colorado College; Trustee of California Institute of Technology; Prior to 2014, Director of Fluor Corp.; Prior to 2010, Trustee of the German Marshall Fund of the United States; Prior to 2010 Trustee of the Rocky Mountain Institute | ||||
| Other Officers | ||||||||
Russell C. Burk — 1958 Senior Vice President and Senior Officer | 2005 | Senior Vice President and Senior Officer, The Invesco Funds | N/A | N/A | ||||
John M. Zerr — 1962 Senior Vice President, Chief Legal Officer and Secretary | 2006 | Director, Senior Vice President, Secretary and General Counsel, Invesco Management Group, Inc. (formerly known as Invesco Aim Management Group, Inc.) and Van Kampen Exchange Corp.; Senior Vice President, Invesco Advisers, Inc. (formerly known as Invesco Institutional (N.A.), Inc.) (registered investment adviser); Senior Vice President and Secretary, Invesco Distributors, Inc. (formerly known as Invesco Aim Distributors, Inc.); Director, Vice President and Secretary, Invesco Investment Services, Inc. (formerly known as Invesco Aim Investment Services, Inc.) and IVZ Distributors, Inc. (formerly known as INVESCO Distributors, Inc.); Director and Vice President, INVESCO Funds Group, Inc.; Senior Vice President, Chief Legal Officer and Secretary, The Invesco Funds; Managing Director, Invesco PowerShares Capital Management LLC; Director, Secretary and General Counsel, Invesco Investment Advisers LLC (formerly known as Van Kampen Asset Management); Secretary and General Counsel, Invesco Capital Markets, Inc. (formerly known as Van Kampen Funds Inc.) and Chief Legal Officer, PowerShares Exchange-Traded Fund Trust, PowerShares Exchange-Traded Fund Trust II, PowerShares India Exchange-Traded Fund Trust, PowerShares Actively Managed Exchange-Traded Fund Trust, and PowerShares Actively Managed Exchange-Traded Commodity Fund Trust
Formerly: Director and Vice President, Van Kampen Advisors Inc.; Director, Vice President, Secretary and General Counsel, Van Kampen Investor Services Inc.; Director, Invesco Distributors, Inc. (formerly known as Invesco Aim Distributors, Inc.); Director, Senior Vice President, General Counsel and Secretary, Invesco Aim Advisers, Inc. and Van Kampen Investments Inc.; Director, Vice President and Secretary, Fund Management Company; Director, Senior Vice President, Secretary, General Counsel and Vice President, Invesco Aim Capital Management, Inc.; Chief Operating Officer and General Counsel, Liberty Ridge Capital, Inc. (an investment adviser); Vice President and Secretary, PBHG Funds (an investment company) and PBHG Insurance Series Fund (an investment company); Chief Operating Officer, General Counsel and Secretary, Old Mutual Investment Partners (a broker-dealer); General Counsel and Secretary, Old Mutual Fund Services (an administrator) and Old Mutual Shareholder Services (a shareholder servicing center); Executive Vice President, General Counsel and Secretary, Old Mutual Capital, Inc. (an investment adviser); and Vice President and Secretary, Old Mutual Advisors Funds (an investment company) | N/A | N/A | ||||
| Sheri Morris — 1964 Vice President, Treasurer and Principal Financial Officer | 2003 | Vice President, Treasurer and Principal Financial Officer, The Invesco Funds; Vice President, Invesco Advisers, Inc. (formerly known as Invesco Institutional (N.A.), Inc.) (registered investment adviser); and Vice President, PowerShares Exchange-Traded Fund Trust, PowerShares Exchange-Traded Fund Trust II, PowerShares India Exchange-Traded Fund Trust, PowerShares Actively Managed Exchange-Traded Fund Trust, and PowerShares Actively Managed Exchange-Traded Commodity Fund Trust
Formerly: Vice President, Invesco Aim Advisers, Inc., Invesco Aim Capital Management, Inc. and Invesco Aim Private Asset Management, Inc.; Assistant Vice President and Assistant Treasurer, The Invesco Funds and Assistant Vice President, Invesco Advisers, Inc., Invesco Aim Capital Management, Inc. and Invesco Aim Private Asset Management, Inc.; and Treasurer, PowerShares Exchange-Traded Fund Trust, PowerShares Exchange-Traded Fund Trust II, PowerShares India Exchange-Traded Fund Trust and PowerShares Actively Managed Exchange-Traded Fund Trust | N/A | N/A | ||||
T-3 Invesco Equity and Income Fund
Trustees and Officers—(continued)
| Name, Year of Birth and Position(s) Held with the Trust | Trustee and/ or Officer Since | Principal Occupation(s) During Past 5 Years | Number of Funds in Fund Complex Overseen by Trustee | Other Directorship(s) Held by Trustee During Past 5 Years | ||||
| Other Officers—(continued) | ||||||||
| Karen Dunn Kelley — 1960 Vice President | 2003 | Senior Managing Director, Investments, Invesco Ltd.; Director, Co-President, Co-Chief Executive Officer, and Co-Chairman, Invesco Advisers, Inc. (formerly known as Invesco Institutional (N.A.), Inc.) (registered investment adviser); Chairman, Invesco Senior Secured Management, Inc.; Senior Vice President, Invesco Management Group, Inc. (formerly known as Invesco Aim Management Group, Inc.); Executive Vice President, Invesco Distributors, Inc. (formerly known as Invesco Aim Distributors, Inc.); Director, Invesco Mortgage Capital Inc. and Invesco Management Company Limited; Vice President, The Invesco Funds (other than AIM Treasurer’s Series Trust (Invesco Treasurer’s Series Trust), Short-Term Investments Trust and Invesco Management Trust); and President and Principal Executive Officer, The Invesco Funds (AIM Treasurer’s Series Trust (Invesco Treasurer’s Series Trust), Short-Term Investments Trust and Invesco Management Trust only)
Formerly: Director and President, INVESCO Asset Management (Bermuda) Ltd., Director, INVESCO Global Asset Management Limited and INVESCO Management S.A.; Senior Vice President, Van Kampen Investments Inc. and Invesco Advisers, Inc. (formerly known as Invesco Institutional (N.A.), Inc.) (registered investment adviser); Vice President, Invesco Advisers, Inc. (formerly known as Invesco Institutional (N.A.), Inc.); Director of Cash Management and Senior Vice President, Invesco Advisers, Inc. and Invesco Aim Capital Management, Inc.; Director and President, Fund Management Company; Chief Cash Management Officer, Director of Cash Management, Senior Vice President, and Managing Director, Invesco Aim Capital Management, Inc.; Director of Cash Management, Senior Vice President, and Vice President, Invesco Advisers, Inc. and The Invesco Funds (AIM Treasurer’s Series Trust (Invesco Treasurer’s Series Trust), and Short-Term Investments Trust only) | N/A | N/A | ||||
| Crissie M. Wisdom — 1969 Anti-Money Laundering Compliance Officer | 2013 | Anti-Money Laundering Compliance Officer, Invesco Advisers, Inc. (formerly known as Invesco Institutional (N.A.), Inc.) (registered investment adviser), Invesco Capital Markets, Inc. (formerly known as Van Kampen Funds Inc.), Invesco Distributors, Inc., Invesco Investment Services, Inc., Invesco Management Group, Inc., Van Kampen Exchange Corp., The Invesco Funds, and PowerShares Exchange-Traded Fund Trust, PowerShares Exchange-Traded Fund Trust II, PowerShares India Exchange-Traded Fund Trust, PowerShares Actively Managed Exchange-Traded Fund Trust and PowerShares Actively Managed Exchange-Traded Commodity Fund Trust; Anti-Money Laundering Compliance Officer and Bank Secrecy Act Officer, INVESCO National Trust Company and Invesco Trust Company; and Fraud Prevention Manager and Controls and Risk Analysis Manager for Invesco Investment Services, Inc.. | N/A | N/A | ||||
Lisa O. Brinkley — 1959 Chief Compliance Officer | 2004 | Senior Vice President and Chief Compliance Officer, Invesco Advisers, Inc. (registered investment adviser) (formerly known as Invesco Institutional (N.A., Inc.); and Chief Compliance Officer, The Invesco Funds
Formerly: Global Assurance Officer, Invesco Ltd. and Vice President, The Invesco Funds; Chief Compliance Officer, Invesco Distributors, Inc. (formerly known as Invesco Aim Distributors, Inc.), Invesco Investment Services, Inc.(formerly known as Invesco Aim Investment Services, Inc.) and Van Kampen Investor Services Inc.; Senior Vice President, Invesco Management Group, Inc.; Senior Vice President and Chief Compliance Officer, Invesco Advisers, Inc. and The Invesco Funds; Vice President and Chief Compliance Officer, Invesco Aim Capital Management, Inc. and Invesco Distributors, Inc.; Vice President, Invesco Investment Services, Inc. and Fund Management Company. | N/A | N/A |
The Statement of Additional Information of the Trust includes additional information about the Fund’s Trustees and is available upon request, without charge, by calling 1.800.959.4246. Please refer to the Fund’s prospectus for information on the Fund’s sub-advisers.
Office of the Fund 11 Greenway Plaza, Suite 1000 Houston, TX 77046-1173 | Investment Adviser Invesco Advisers, Inc. 1555 Peachtree Street, N.E. Atlanta, GA 30309 | Distributor Invesco Distributors, Inc. 11 Greenway Plaza, Suite 1000 Houston, TX 77046-1173 | Auditors PricewaterhouseCoopers LLP 1000 Louisiana Street, Suite 5800 Houston, TX 77002-5678 | |||
Counsel to the Fund Stradley Ronon Stevens & Young, LLP 2005 Market Street, Suite 2600 Philadelphia, PA 19103-7018 | Counsel to the Independent Trustees Goodwin Procter LLP 901 New York Avenue, N.W. Washington, D.C. 20001 | Transfer Agent Invesco Investment Services, Inc. 11 Greenway Plaza, Suite 1000 Houston, TX 77046-1173 | Custodian State Street Bank and Trust Company 225 Franklin Street Boston, MA 02110-2801 | |||
T-4 Invesco Equity and Income Fund

Invesco mailing information
Send general correspondence to Invesco Investment Services, Inc., P.O. Box 219078, Kansas City, MO 64121-9078.
Important notice regarding delivery of security holder documents
To reduce Fund expenses, only one copy of most shareholder documents may be mailed to shareholders with multiple accounts at the same address (Householding). Mailing of your shareholder documents may be householded indefinitely unless you instruct us otherwise. If you do not want the mailing of these documents to be combined with those for other members of your household, please contact Invesco Investment Services, Inc. at 800 959 4246 or contact your financial institution. We will begin sending you individual copies for each account within 30 days after receiving your request.
Fund holdings and proxy voting information
The Fund provides a complete list of its holdings four times in each fiscal year, at the quarter ends. For the second and fourth quarters, the lists appear in the Fund’s semiannual and annual reports to shareholders. For the first and third quarters, the Fund files the lists with the Securities and Exchange Commission (SEC) on Form N-Q. The most recent list of portfolio holdings is available at invesco.com/completeqtrholdings. Shareholders can also look up the Fund’s Forms N-Q on the SEC website at sec.gov. Copies of the Fund’s Forms N-Q may be reviewed and copied at the SEC Public Reference Room in Washington, D.C. You can obtain information on the operation of the Public Reference Room, including information about duplicating fee charges, by calling 202 551 8090 or 800 732 0330, or by electronic request at the following email address: publicinfo@sec.gov.
The SEC file numbers for the Fund are shown below.
A description of the policies and procedures that the Fund uses to determine how to vote proxies relating to portfolio securities is available without charge, upon request, from our Client Services department at 800 959 4246 or at invesco.com/proxyguidelines. The information is also available on the SEC website, sec.gov.
Information regarding how the Fund voted proxies related to its portfolio securities during the most recent 12-month period ended June 30 is available at invesco.com/proxysearch. The information is also available on the SEC website, sec.gov. Invesco Advisers, Inc. is an investment adviser; it provides investment advisory services to individual and institutional clients and does not sell securities. Invesco Distributors, Inc. is the US distributor for Invesco Ltd.’s retail mutual funds, exchange-traded funds and institutional money market funds. Both are wholly owned, indirect subsidiaries of Invesco Ltd. |  |
SEC file numbers: 811-09913 and 333-36074 VK-EQI-AR-1 Invesco Distributors, Inc.
|
| |||
Annual Report to Shareholders
| August 31, 2015 | |||
Invesco Floating Rate Fund | ||||
Nasdaq: A: AFRAX ¡ C: AFRCX ¡ R: AFRRX ¡ Y: AFRYX ¡ R5: AFRIX ¡ R6: AFRFX | ||||


Letters to Shareholders
Philip Taylor | Dear Shareholders: This annual report includes information about your Fund, including performance data and a complete list of its investments as of the close of the reporting period. Inside is a discussion of how your Fund was managed and the factors that affected its performance during the reporting period. I hope you find this report of interest. The US economy expanded and unemployment declined throughout the reporting period. The sharp drop in oil prices that began in mid-2014 continued to benefit consumers, but a strong US dollar crimped corporate profits. The US Federal Reserve signaled that it was increasingly likely to raise interest rates, based on generally positive economic data, but uncertainty remained about when it would act. Overseas, the story was much different. Low energy prices hurt the economies of some oil-producing nations, such as Brazil and Russia. During the reporting period, the European Central Bank as well as central banks in China and | |
| Japan – among other countries – either instituted or maintained extraordinarily accommodative monetary policies in response to economic weakness. | ||
Investor uncertainty, such as we saw for much of the reporting period – and market volatility, such as we saw at the end of the reporting period – are unfortunate facts of life when it comes to investing. Some investors use these things as excuses to delay saving and investing for their long-term financial goals. That’s why Invesco encourages investors to work with a professional financial adviser who can stress the importance of starting to save and invest early and the importance of adhering to a disciplined investment plan – when times are good and when they’re uncertain. A financial adviser who knows your unique financial situation, investment goals and risk tolerance can be an invaluable partner as you seek to achieve your financial goals. He or she can offer a long-term perspective when markets are volatile and time-tested advice and guidance when your financial situation or investment goals change. | ||

Timely information when and where you want it
Invesco’s efforts to help investors achieve their financial objectives include providing individual investors and financial professionals with timely information about the markets, the economy and investing – whenever and wherever they want it.
Our website, invesco.com/us, offers a wide range of market insights and investment perspectives. On the website, you’ll find detailed information about our funds, including prices, performance, holdings and portfolio manager commentaries. You can access information about your account by completing a simple, secure online registration. Click on the “Need to register” link in the “Account Access” box on our homepage to get started.
Invesco’s mobile apps for iPhone® and iPad® (both available free from the App StoreSM) allow you to obtain the same detailed information, monitor your account and create customizable watch lists. Also, they allow you to access investment insights from our investment leaders, market strategists, economists and retirement experts. You can sign up to be alerted when new commentary is added, and you can watch portfolio manager videos and have instant access to Invesco news and updates wherever you may be.
In addition to the resources accessible on our website and through our mobile app, you can obtain timely updates to help you stay informed about the markets, the economy and investing by connecting with Invesco on Twitter, LinkedIn or Facebook. You can access our blog at blog.invesco.us.com. Our goal is to provide you the information you want, when and where you want it.
Have questions?
For questions about your account, feel free to contact an Invesco client services representative at 800 959 4246. For Invesco-related questions or comments, please email me directly at phil@invesco.com.
All of us at Invesco look forward to serving your investment management needs for many years to come. Thank you for investing with us.
Sincerely,

Philip Taylor
Senior Managing Director, Invesco Ltd.
iPhone and iPad are trademarks of Apple Inc., registered in the US and other countries. App Store is a service mark of Apple Inc. Invesco Distributors, Inc. is not affiliated with Apple Inc.
2 Invesco Floating Rate Fund
Bruce Crockett | Dear Fellow Shareholders: Among the many important lessons I’ve learned in more than 40 years in a variety of business endeavors is the value of a trusted advocate. As independent chair of the Invesco Funds Board, I can assure you that the members of the Board are strong advocates for the interests of investors in Invesco’s mutual funds. We work hard to represent your interests through oversight of the quality of the investment management services your funds receive and other matters important to your investment, including but not limited to: n Ensuring that Invesco offers a diverse lineup of mutual funds that your financial adviser can use to strive to meet your financial needs as your investment goals change over time. n Monitoring how the portfolio management teams of the Invesco funds are performing in light of changing economic and market conditions. | |

| n | Assessing each portfolio management team’s investment performance within the context of the investment strategy described in the fund’s prospectus. |
| n | Monitoring for potential conflicts of interests that may impact the nature of the services that your funds receive. |
We believe one of the most important services we provide our fund shareholders is the annual review of the funds’ advisory and sub-advisory contracts with Invesco Advisers and its affiliates. This review is required by the Investment Company Act of 1940 and focuses on the nature and quality of the services Invesco provides as the adviser to the Invesco funds and the reasonableness of the fees that it charges for those services. Each year, we spend months carefully reviewing information received from Invesco and a variety of independent sources, such as performance and fee data prepared by Lipper Inc., an independent, third-party firm widely recognized as a leader in its field. We also meet with our independent legal counsel and other independent advisers to review and help us assess the information that we have received. Our goal is to assure that you receive quality investment management services for a reasonable fee.
I trust the measures outlined above provide assurance that you have a worthy advocate when it comes to choosing the Invesco Funds.
As always, please contact me at bruce@brucecrockett.com with any questions or concerns you may have. On behalf of the Board, we look forward to continuing to represent your interests and serving your needs.
Sincerely,

Bruce L. Crockett
Independent Chair
Invesco Funds Board of Trustees
3 Invesco Floating Rate Fund
Management’s Discussion of Fund Performance
Performance summary
For the fiscal year ended August 31, 2015, Class A shares of Invesco Floating Rate Fund (the Fund), at net asset value (NAV), underperformed the Fund’s broad market and style-specific indexes. The Fund invests in lower-rated fixed income instruments, primarily senior secured corporate loans.
Your Fund’s long-term performance appears later in this report.
Fund vs. Indexes
Total returns, 8/31/14 to 8/31/15, at net asset value (NAV). Performance shown does not include applicable contingent deferred sales charges (CDSC) or front-end sales charges, which would have reduced performance.
Class A Shares | -0.42 | % | ||
Class C Shares | -1.07 | |||
Class R Shares | -0.79 | |||
Class Y Shares | -0.31 | |||
Class R5 Shares | -0.29 | |||
Class R6 Shares | -0.06 | |||
Barclays U.S. Aggregate Indexq (Broad Market Index) | 1.56 | |||
Credit Suisse Leveraged Loan Indexn (Style-Specific Index) | 1.39 | |||
Lipper Loan Participation Funds Classification Average¿ (Peer Group) | 0.23 | |||
| Source(s): qFactSet Research Systems Inc.; n Bloomberg LP; ¿Lipper Inc. |
Market conditions and your Fund
During the fiscal year covered by this report, the senior secured loan market was generally steady in terms of price volatility on both a relative and an absolute level with the vast majority of loans trading at or near par. At the same time, credit-specific weakness in a number of names caused the average price of loans to drop to $96.89 at the end of the fiscal year, according to the S&P/LSTA Leveraged Loan Index.1 Given the price at the end of the fiscal year, senior secured loans were providing a 5.91% yield.1 While loans continued to show correlation with equities and other high-risk assets, loans experienced meaningfully lower levels of volatility. Some of the lack of loan volatility was a function of a generally
benign credit environment and a low default rate. Additionally, loan prices were supported by strong technicals as loan demand remained robust throughout the fiscal year. This demand principally came from:
| n | Collateralized loan obligation (CLO) issuance, which during the fiscal year remained strong with total inflows of $125.12 billion.2 |
| n | Net retail flows that were muted at -$28.33 billion during the same period.2 |
| n | Institutional flows. |
Corporate issuers in the senior secured loan market have benefited from robust capital markets since 2009, and issuers have generally maintained good credit performance, strengthened their balance
sheets, improved liquidity and addressed near-term maturities. The trailing 12-month default rate by principal amounted to 1.30% through August 31, 2015.1 The trailing 12-month default rate was well below the long-term average of 3.19% and the calendar year 2015 outlook for defaults remains benign as there are few near-term catalysts.1
Despite loans’ negative performance during several months of the Fund’s fiscal year, the asset class continued to be an effective diversifier – providing relatively lower volatility than other credit-based assets during August 2015 and posting relatively strong performance on a 2015 calendar year-to-date basis.3
While direct exposure to China and commodities was muted for the loan asset class, the recent softness in loans was in part the result of contagion. Concerns regarding global growth induced volatility in credit-based assets, declining oil/commodity prices further pressured high yield bond prices, and redemptions in high yield bonds and loan retail funds pushed prices lower. In periods in which the market is selling off, loans typically perform in sympathy with broader capital markets but the senior position in the capital structure and secured status can help lower volatility as the structural features serve as a form of protection.
We managed the Fund with a view toward taking advantage of what appeared to be an expanding (albeit slowly) economy, an absence of corporate restructurings, and strong demand for floating rate assets from investors concerned about how rising interest rates might impact the market value of longer-dated fixed income investments.
Portfolio Composition* By credit quality
| ||||
BBB | 0.6 | % | ||
BBB- | 2.2 | |||
BB+ | 7.6 | |||
BB | 14.0 | |||
BB- | 15.7 | |||
B+ | 14.5 | |||
B | 24.3 | |||
B- | 8.8 | |||
CCC+ | 7.1 | |||
CCC | 0.7 | |||
D | 0.5 | |||
NR | 3.6 | |||
Equity | 0.4 |
Top 10 Debt Issuers*
|
| |||||
1. | Asurion LLC | 2.1 | % | |||
2. | Level 3 Communications, Inc. | 1.8 | ||||
3. | First Data Corp. | 1.8 | ||||
4. | iHeart Communications, Inc. | 1.8 | ||||
5. | Realogy Corp. | 1.3 | ||||
6. | Valeant Pharmaceutical International, Inc. | 1.3 | ||||
7. | Federal-Mogul Corp. | 1.3 | ||||
8. | Freescale Semiconductor Inc. | 1.3 | ||||
9. | Transdigm Inc. | 1.2 | ||||
10. | Alpha Topco Ltd. | 1.2 | ||||
Total Net Assets | $ | 2.3 billion | ||||||
Total Number of Holdings* | 659 | |||||||
The Fund’s holdings are subject to change, and there is no assurance that the Fund will continue to hold any particular security.
* Excluding money market fund holdings.
Source: Standard & Poor’s. A credit rating is an assessment provided by a nationally recognized statistical rating organization (NRSRO) of the creditworthiness of an issuer with respect to debt obligations, including specific securities, money market instruments or other debts. Ratings are measured on a scale that generally ranges from AAA (highest) to D (lowest); ratings are subject to change without notice. “Non-Rated” indicates the debtor was not rated, and should not be interpreted as indicating low quality. For more information on Standard and Poor’s rating methodology, please visit standardandpoors.com and select “Understanding Ratings” under Rating Resources on the homepage.
| 4 Invesco Floating Rate Fund |
As part of the Fund’s investment strategy, we seek to take advantage of market opportunities by decreasing risk in the Fund when we believe loans are overbought and increasing risk when we believe loans are oversold. The Fund ben-efited from some of the newer primary institutional loans which exhibited low levels of market volatility during the reporting period and were sold at prices that offered, in our opinion, above-market returns for the associated risk.
We seek to efficiently allocate risk within the portfolio in order to maximize risk-adjusted returns through five different considerations consisting of credit selection, sector migration, risk positioning, asset selection and trading. While we were successful in this approach for the majority of the Fund’s fiscal year, security selection proved to be a detractor from the Fund’s performance beginning in June. More specifically, one position, Millennium Laboratories, was a key driver of the Fund’s underperformance. Additionally, several positions in the oil and gas sector were major causes of underperformance.
The Fund’s allocations to information technology, food and tobacco, and service companies were the top three leading contributors to Fund performance. More specifically, by individual credit investments the top three contributors to Fund returns were Scientific Games, Asurion and First Data. The Fund’s allocation to structured products and reorganized equities, although small, added to relative performance versus the Fund’s style-specific index, the Credit Suisse Leveraged Loan Index. The Fund’s allocation to recent primary deals, broadly speaking, also contributed to relative Fund performance.
The Fund’s allocations to energy, metals and mining, utility and health care companies all detracted from
Fund performance on a sector basis. On an individual name basis, detractors from returns included Millennium Laboratories, Seadrill, Fieldwood and Texas Competitive Electric Holdings Co. Additionally, on a credit specific basis, our investments in Getty Images and Weight Watchers both hurt Fund performance.
Senior secured loans are an asset class that behaves differently from many traditional fixed income investments. The interest income generated by a portfolio of senior secured loans is usually determined by a fixed credit spread over the London Interbank Offered Rate (Libor). Because senior secured loans generally
have a very short duration and the coupons or interest rates are usually adjusted every 30 to 90 days as Libor changes, the yield on the portfolio adjusts. Interest rate risk refers to the tendency for traditional fixed income prices to decline when interest rates rise. For senior secured loans, however, interest rates and income are variable and the prices of loans are therefore less sensitive to interest rate changes than traditional fixed income bonds – and senior secured loans can provide a natural hedge against rising interest rates.
We are monitoring interest rates, the market and economic and geopolitical factors that may impact the direction, speed and magnitude of changes to interest rates across the maturity spectrum, including the potential impact of monetary policy changes by the Federal Reserve and certain central banks. If interest rates rise, markets may experience increased volatility, which may affect the value and/or liquidity of certain of the Fund’s investments or the market price of the Fund’s shares.
As always, we appreciate your continued participation in Invesco Floating Rate Fund.
| 1 | Source: Standard & Poor’s |
| 2 | Source: J.P. Morgan |
| 3 | Source: Credit Suisse |
The views and opinions expressed in management’s discussion of Fund performance are those of Invesco Advisers, Inc. These views and opinions are subject to change at any time based on factors such as market and economic conditions. These views and opinions may not be relied upon as investment advice or recommendations, or as an offer for a particular security. The information is not a complete analysis of every aspect of any market, country, industry, security or the Fund. Statements of fact are from sources considered reliable, but Invesco Advisers, Inc. makes no representation or warranty as to their completeness or accuracy. Although historical performance is no guarantee of future results, these insights may help you understand our investment management philosophy.
See important Fund and, if applicable, index disclosures later in this report.
| Tom Ewald Portfolio Manager, is lead manager of Invesco Floating Rate Fund. He joined Invesco or its investment advisory | |
| affiliates in 2000. Mr. Ewald earned a BA from Harvard College and an MBA from the University of Virginia Darden School of Business. | ||
| Scott Baskind Portfolio Manager, is manager of Invesco Floating Rate Fund. He joined Invesco or its investment advisory affiliates in | |
| 1999. Mr. Baskind earned a BS in business administration from University at Albany, The State University of New York. | ||
| Philip Yarrow Chartered Financial Analyst, Portfolio Manager, is manager of Invesco Floating Rate Fund. He joined Invesco in | |
| 2010. Mr. Yarrow earned a BS in mathematics and economics from The University of Nottingham and a Master of Management degree in finance from Northwestern University. | ||


5 Invesco Floating Rate Fund
Your Fund’s Long-Term Performance
Results of a $10,000 Investment – Oldest Share Class(es)
Fund and index data from 8/31/05
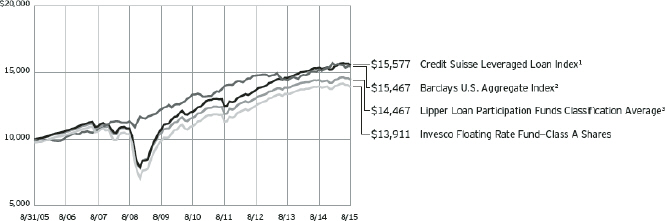
| 1 | Source: Bloomberg LP |
| 2 | Source: FactSet Research Systems Inc. |
| 3 | Source: Lipper Inc. |
Past performance cannot guarantee comparable future results.
The data shown in the chart include reinvested distributions, applicable sales charges and Fund expenses including
management fees. Index results include reinvested dividends, but they do not reflect sales charges. Performance of the peer group, if applicable, reflects fund expenses and management fees;
performance of a market index does not. Performance shown in the chart and table(s) does not reflect deduction of taxes a shareholder would pay on Fund distributions or sale of Fund shares.
6 Invesco Floating Rate Fund
Average Annual Total Returns
As of 8/31/15, including maximum applicable sales charges
Class A Shares | ||||
Inception (5/1/97) | 3.95 | % | ||
10 Years | 3.36 | |||
5 Years | 4.34 | |||
1 Year | -2.87 | |||
Class C Shares | ||||
Inception (3/31/00) | 3.29 | % | ||
10 Years | 3.10 | |||
5 Years | 4.32 | |||
1 Year | -2.02 | |||
Class R Shares | ||||
10 Years | 3.39 | % | ||
5 Years | 4.58 | |||
1 Year | -0.79 | |||
Class Y Shares | ||||
10 Years | 3.76 | % | ||
5 Years | 5.10 | |||
1 Year | -0.31 | |||
Class R5 Shares | ||||
10 Years | 3.92 | % | ||
5 Years | 5.17 | |||
1 Year | -0.29 | |||
Class R6 Shares | ||||
10 Years | 3.72 | % | ||
5 Years | 5.08 | |||
1 Year | -0.06 | |||
On April 13, 2006, the Fund reorganized from a Closed-End Fund to an Open-End Fund. Performance shown for Class A shares prior to that date is that of the Closed-End Fund’s Class B shares and includes the management and 12b-1 fees applicable to B shares.
On April 13, 2006, the Fund reorganized from a Closed-End Fund to an Open-End Fund. Performance shown for Class C shares prior to that date is that of the Closed-End Fund’s Class C shares and includes the management and 12b-1 fees applicable to C shares.
Class R shares incepted on April 13, 2006. Performance shown prior to that date is that of Class A shares and includes the 12b-1 fees applicable to Class A shares.
Class Y shares incepted on October 3, 2008. Performance shown prior to that date is that of Class A shares and includes the 12b-1 fees applicable to Class A shares.
Class R5 shares incepted on April 13, 2006. Performance shown prior to that date is that of Class A shares and
Average Annual Total Returns
As of 6/30/15, the most recent calendar quarter end, including maximum applicable sales charges
Class A Shares | ||||
Inception (5/1/97) | 4.06 | % | ||
10 Years | 3.63 | |||
5 Years | 5.05 | |||
1 Year | -1.49 | |||
Class C Shares | ||||
Inception (3/31/00) | 3.42 | % | ||
10 Years | 3.37 | |||
5 Years | 5.06 | |||
1 Year | -0.50 | |||
Class R Shares | ||||
10 Years | 3.66 | % | ||
5 Years | 5.32 | |||
1 Year | 0.73 | |||
Class Y Shares | ||||
10 Years | 4.04 | % | ||
5 Years | 5.88 | |||
1 Year | 1.35 | |||
Class R5 Shares | ||||
10 Years | 4.20 | % | ||
5 Years | 5.92 | |||
1 Year | 1.38 | |||
Class R6 Shares | ||||
10 Years | 3.99 | % | ||
5 Years | 5.79 | |||
1 Year | 1.34 | |||
includes the 12b-1 fees applicable to Class A shares.
Class R6 shares incepted on September 24, 2012. Performance shown prior to that date is that of Class A shares and includes the 12b-1 fees applicable to Class A shares.
The performance data quoted represent past performance and cannot guarantee comparable future results; current performance may be lower or higher. Please visit invesco.com/performance for the most recent month-end performance. Performance figures reflect reinvested distributions, changes in net asset value and the effect of the maximum sales charge unless otherwise stated. Investment return and principal value will fluctuate so that you may have a gain or loss when you sell shares.
The net annual Fund operating expense ratio set forth in the most recent Fund prospectus as of the date of this report for Class A, Class C, Class R, Class Y, Class R5 and Class R6 shares was 1.04%, 1.54%, 1.29%,
0.79%, 0.77% and 0.70%, respectively.1 The total annual Fund operating expense ratio set forth in the most recent Fund prospectus as of the date of this report for Class A, Class C, Class R, Class Y, Class R5 and Class R6 shares was 1.05%, 1.55%, 1.30%, 0.80%, 0.78% and 0.71%, respectively. The expense ratios presented above may vary from the expense ratios presented in other sections of this report that are based on expenses incurred during the period covered by this report.
Class A share performance reflects the maximum 2.50% sales charge and Class C share performance reflects the applicable contingent deferred sales charge (CDSC) for the period involved. The CDSC on Class C shares is 1% for the first year after purchase. Class R, Class Y, Class R5 and Class R6 shares do not have a front-end sales charge or a CDSC; therefore, performance is at net asset value.
The performance of the Fund’s share classes will differ primarily due to different sales charge structures and class expenses.
Fund performance reflects any applicable fee waivers and/or expense reimbursements. Had the adviser not waived fees and/or reimbursed expenses currently or in the past, returns would have been lower. See current prospectus for more information.
| 1 | Total annual Fund operating expenses after any contractual fee waivers and/or expense reimbursements by the adviser in effect through at least June 30, 2017. See current prospectus for more information. |
7 Invesco Floating Rate Fund
Invesco Floating Rate Fund’s investment objective is total return, comprised of current income and capital appreciation.
| n | Unless otherwise stated, information presented in this report is as of August 31, 2015, and is based on total net assets. |
| n | Unless otherwise noted, all data provided by Invesco. |
| n | To access your Fund’s reports/prospectus, visit invesco.com/fundreports. |
About share classes
| n | As of the close of business on April 13, 2006, Invesco Floating Rate Fund reorganized from a Closed-End Fund to an Open-End Fund. Information presented for Class A shares prior to the reorganization includes financial data for Class B shares of the Closed-End Fund. Information presented for Class C shares prior to the reorganization includes financial data for Class C shares of the Closed-End Fund. |
| n | On July 27, 2006, all Class B1 shares converted into Class A shares. |
| n | Class R shares are generally available only to employer sponsored retirement and benefit plans. Please see the prospectus for more information. |
| n | Class Y shares are available only to certain investors. Please see the prospectus for more information. |
| n | Class R5 shares and Class R6 shares are primarily intended for employer sponsored retirement and benefit plans that meet certain standards and for institutional investors. Please see the prospectus for more information. |
Principal risks of investing
in the Fund
| n | Borrowing risk. Borrowing money to buy securities exposes the Fund to leverage because the Fund can achieve a return on a capital base larger than the assets that shareholders have contributed to the Fund. Borrowing may cause the Fund to be more volatile because it may exaggerate the effect of any increase or decrease in the value of the Fund’s portfolio securities. Borrowing may also cause the Fund to liquidate positions when it may not be advantageous to do so. In addition, borrowing will cause the Fund to incur interest expenses and other fees. There can be no assurance that the Fund’s borrowing strategy will be successful. |
| n | Changing fixed income market conditions risk. The current low interest rate environment was created in part by the Federal Reserve Board (FRB) and certain |
foreign central banks keeping the federal funds and equivalent foreign rates at or near zero. There is a risk that interest rates will rise when the FRB and central banks raise these rates. This risk is heightened due to the completion of the FRB’s quantitative easing program and the “tapering” of other similar foreign central bank actions. This eventual increase in the federal funds and equivalent foreign rates may expose fixed income markets to heightened volatility and reduced liquidity for certain fixed income investments, particularly those with longer maturities. In addition, decreases in fixed income dealer market-making capacity may also potentially lead to heightened volatility and reduced liquidity in the fixed income markets. As a result, the value of the Fund’s investments and share price may decline. Changes in central bank policies could also result in higher than normal shareholder redemptions, which could potentially increase portfolio turnover and the Fund’s transaction costs. |
| n | Collateralized loan obligations risk. In addition to the normal interest rate, default and other risk of fixed income securities, collateralized loan obligations carry additional risks, including the possibility that distributions from collateral securities will not be adequate to make interest or other payments, the quality of the collateral may decline in value or default, the Fund may invest in collateralized loan obligations that are subordinate to other classes, values may be volatile, and disputes with the issuer may produce unexpected investment results. |
| n | Credit-linked notes risk. Risks of credit linked notes include those risks associated with the underlying reference obligation including but not limited to market risk, interest rate risk, credit risk, default risk and foreign currency risk. In the case of a credit linked note created with credit default swaps, the structure will be “funded” such that the par amount of the security will represent |
This report must be accompanied or preceded by a currently effective Fund prospectus, which contains more complete information, including sales charges and expenses. Investors should read it carefully before investing.
|
NOT FDIC INSURED | MAY LOSE VALUE | NO BANK GUARANTEE
| the maximum loss that could be incurred on the investment and no leverage is introduced. An investor in a credit linked note bears counterparty risk or the risk that the issuer of the credit linked note will default or become bankrupt and not make timely payment of principal and interest of the structured security. |
| n | Credit risk. The issuer of instruments in which the Fund invests may be unable to meet interest and/or principal payments, thereby causing its instruments to decrease in value and lowering the issuer’s credit rating. Even in the case of collateralized debt obligations, there is no assurance that the sale of collateral would raise enough cash to satisfy an issuer’s payment obligations or that the collateral can or will be liquidated. |
| n | Defaulted securities risk. Defaulted securities involve the substantial risk that principal will not be repaid. Defaulted securities and any securities received in an exchange for such securities may be subject to restrictions on resale. |
| n | Derivatives risk. The value of a derivative instrument depends largely on (and is derived from) the value of an underlying security, currency, commodity, interest rate, index or other asset (each referred to as an underlying asset). In addition to risks relating to the underlying assets, the use of derivatives may include other, possibly greater, risks, including counterparty, leverage and liquidity risks. Counter-party risk is the risk that the counter-party to the derivative contract will default on its obligation to pay the Fund the amount owed or otherwise perform under the derivative contract. Derivatives create leverage risk because they do not require payment up front equal to the economic exposure created by owning the derivative. As a result, an adverse change in the value of the underlying asset could result in the Fund sustaining a loss that is substantially greater than the amount invested in the derivative, which may make the Fund’s returns more volatile and increase the risk of loss. Derivative instruments may also be less liquid than more traditional investments and the Fund may be unable to sell or close out its derivative positions at a desirable |
8 Invesco Floating Rate Fund
time or price. This risk may be more acute under adverse market conditions, during which the Fund may be most in need of liquidating its derivative positions. Derivatives may also be harder to value, less tax efficient and subject to changing government regulation that could impact the Fund’s ability to use certain derivatives or their cost. Also, derivatives used for hedging or to gain or limit exposure to a particular market segment may not provide the expected benefits, particularly during adverse market conditions.
| n | Floating rate risk. The Fund may invest in floating rate loans and debt securities that require collateral. There is a risk that the value of the collateral may not be sufficient to cover the amount owed, collateral securing a loan may be found invalid, and collateral may be used to pay other outstanding obligations of the borrower under applicable law or may be difficult to sell. There is also the risk that the collateral may be difficult to liquidate, or that a majority of the collateral may be illiquid. |
| n | Foreign securities risk. The Fund’s foreign investments may be affected by changes in a foreign country’s exchange rates, political and social instability, changes in economic or taxation policies, difficulties when enforcing obligations, decreased liquidity, and increased volatility. Foreign companies may be subject to less regulation resulting in less publicly available information about the companies. |
| n | High yield bond (junk bond) risk. Junk bonds involve a greater risk of default or price changes due to changes in the credit quality of the issuer. The values of junk bonds fluctuate more than those of high- quality bonds in response to company, political, regulatory or economic developments. Values of junk bonds can decline significantly over short periods of time. |
| n | Industry focus risk. To the extent a Fund invests in securities issued or guaranteed by companies in the banking and financial services industries, the Fund’s performance will depend on the overall condition of those industries, which may be affected by the |
following factors: the supply of short-term financing; changes in government regulation and interest rates; and the overall economy. |
| n | Interest rate risk. Interest rate risk refers to the risk that bond prices generally fall as interest rates rise; conversely, bond prices generally rise as interest rates fall. Specific bonds differ in their sensitivity to changes in interest rates depending on their individual characteristics, including duration. |
| n | Liquidity risk. The Fund may hold illiquid securities that it may be unable to sell at the preferred time or price and could lose its entire investment in such securities. The majority of the Fund’s assets are likely to be invested in loans and securities that are less liquid than those traded on national exchanges. The risks of illiquidity are particularly important when the Fund’s operations require cash, and may in certain circumstances require that the Fund borrow to meet short-term cash requirements. Illiquid securities are also difficult to value. In the event the Fund voluntarily or involuntarily liquidates portfolio assets during periods of infrequent trading, it may not receive full value for those assets. |
| n | Management risk. The investment techniques and risk analysis used by the Fund’s portfolio managers may not produce the desired results. |
| n | Market risk. The prices of and the income generated by the Fund’s securities may decline in response to, among other things, investor sentiment, general economic and market conditions, regional or global instability, and currency and interest rate fluctuations. |
| n | Prepayment risk. An issuer’s ability to prepay principal on a loan or debt security prior to maturity can limit the Fund’s potential gains. Prepayments may require the Fund to replace the loan or debt security with a lower yielding security, adversely affecting the Fund’s yield. |
About indexes used in this report
| n | The Barclays U.S. Aggregate Index is an unmanaged index considered representative of the US investment-grade, fixed-rate bond market. |
| n | The Credit Suisse Leveraged Loan Index represents tradable, senior-secured, US-dollar-denominated, noninvestment-grade loans. |
| n | The Lipper Loan Participation Funds Classification Average represents an average of all of the funds in the Lipper Loan Participation Funds classification. |
| n | The S&P/LSTA Leveraged Loan Index is a broad index designed to reflect the performance of US dollar facilities in the leverage loan market. |
| n | The Fund is not managed to track the performance of any particular index, including the index(es) described here, and consequently, the performance of the Fund may deviate significantly from the performance of the index(es). |
| n | A direct investment cannot be made in an index. Unless otherwise indicated, index results include reinvested dividends, and they do not reflect sales charges. Performance of the peer group, if applicable, reflects fund expenses; performance of a market index does not. |
Other information
| n | The returns shown in management’s discussion of Fund performance are based on net asset values (NAVs) calculated for shareholder transactions. Generally accepted accounting principles require adjustments to be made to the net assets of the Fund at period end for financial reporting purposes, and as such, the NAVs for shareholder transactions and the returns based on those NAVs may differ from the NAVs and returns reported in the Financial Highlights. |
| n | Industry classifications used in this report are generally according to the Global Industry Classification Standard, which was developed by and is the exclusive property and a service mark of MSCI Inc. and Standard & Poor’s. |
9 Invesco Floating Rate Fund
Schedule of Investments
August 31, 2015
| Interest Rate | Maturity Date | Principal Amount (000)* | Value | |||||||||||||
Variable Rate Senior Loan Interests–88.74%(a)(b) |
| |||||||||||||||
| Aerospace & Defense–2.21% | ||||||||||||||||
BE Aerospace Inc., Term Loan | 4.00 | % | 12/16/21 | $ | 1,961 | $ | 1,973,733 | |||||||||
Camp International Holding Co., | 4.75 | % | 05/31/19 | 3,677 | 3,653,917 | |||||||||||
Second Lien Term Loan | 8.25 | % | 11/30/19 | 258 | 258,252 | |||||||||||
Consolidated Aerospace Manufacturing, LLC, Term Loan(c) | — | 08/11/22 | 2,393 | 2,387,311 | ||||||||||||
Element Materials Technology Group US Holdings Inc., Term Loan B | 5.00 | % | 08/06/21 | 961 | 963,394 | |||||||||||
IAP Worldwide Services, | 0.00 | % | 07/18/18 | 877 | 859,152 | |||||||||||
Second Lien Term Loan | 8.00 | % | 07/18/19 | 1,026 | 1,030,943 | |||||||||||
Landmark U.S. Holdings LLC, | 4.75 | % | 10/25/19 | 245 | 243,862 | |||||||||||
First Lien Term Loan | 4.75 | % | 10/25/19 | 6,175 | 6,144,410 | |||||||||||
PRV Aerospace, LLC, Term Loan | 6.50 | % | 05/09/18 | 1,782 | 1,764,417 | |||||||||||
Sequa Corp., Term Loan | 5.25 | % | 06/19/17 | 4,501 | 3,843,707 | |||||||||||
Transdigm Inc., | 3.75 | % | 02/28/20 | 11,587 | 11,489,902 | |||||||||||
Term Loan D | 3.75 | % | 06/04/21 | 7,009 | 6,950,395 | |||||||||||
Term Loan E | 3.50 | % | 05/14/22 | 10,230 | 10,131,549 | |||||||||||
| 51,694,944 | ||||||||||||||||
| Air Transport–0.51% | ||||||||||||||||
American Airlines, Inc., Term Loan | 3.25 | % | 06/26/20 | 4,004 | 3,972,494 | |||||||||||
Delta Air Lines, Inc., Revolver Loan(d) | 0.00 | % | 10/18/17 | 1,145 | 1,111,943 | |||||||||||
Gol LuxCo S.A. (Luxembourg), Term Loan(c) | — | 08/31/20 | 5,842 | 5,819,747 | ||||||||||||
United Continental Holdings, Inc., Term Loan B-1 | 3.50 | % | 09/15/21 | 959 | 958,872 | |||||||||||
| 11,863,056 | ||||||||||||||||
| Automotive–4.25% | ||||||||||||||||
Affinia Group Inc., Term Loan B-2 | 4.75 | % | 04/27/20 | 4,794 | 4,803,432 | |||||||||||
Allison Transmission, Inc., Term Loan B-3 | 3.50 | % | 08/23/19 | 1,076 | 1,075,012 | |||||||||||
American Tire Distributors, Inc., Term Loan | 5.25 | % | 09/01/21 | 8,612 | 8,665,663 | |||||||||||
Autoparts Holdings Ltd., First Lien Term Loan | 7.00 | % | 07/29/17 | 1,283 | 1,154,356 | |||||||||||
BBB Industries, LLC, | 6.00 | % | 11/03/21 | 2,357 | 2,357,464 | |||||||||||
Second Lien Term Loan | 9.75 | % | 11/03/22 | 1,033 | 1,010,131 | |||||||||||
Dealer Tire, LLC, Term Loan | 5.50 | % | 12/22/21 | 2,571 | 2,592,103 | |||||||||||
Dexter Axle Co., Term Loan | 4.50 | % | 02/28/20 | 3,447 | 3,425,476 | |||||||||||
FCA US LLC, Term Loan | 3.50 | % | 05/24/17 | 2,034 | 2,033,399 | |||||||||||
Federal-Mogul Corp., Term Loan C | 4.75 | % | 04/15/21 | 30,586 | 29,935,807 | |||||||||||
Gates Global, LLC, Term Loan | 4.25 | % | 07/05/21 | 8,937 | 8,583,350 | |||||||||||
Goodyear Tire & Rubber Co., Second Lien Term Loan | 3.75 | % | 04/30/19 | 1,462 | 1,468,503 | |||||||||||
Henniges Automotive Holdings, Inc., Term Loan | 5.50 | % | 06/12/21 | 2,173 | 2,175,432 | |||||||||||
Key Safety Systems, Inc., Term Loan | 4.75 | % | 08/29/21 | 652 | 651,343 | |||||||||||
Midas Intermediate Holdco II, LLC, | 4.50 | % | 08/18/21 | 235 | 235,712 | |||||||||||
Term Loan | 4.50 | % | 08/18/21 | 2,088 | 2,091,948 | |||||||||||
MPG Holdco I Inc., Term Loan B-1 | 3.75 | % | 10/20/21 | 3,150 | 3,146,831 | |||||||||||
Nelson Bidco Limited (United Kingdom), Second Lien Term Loan(c) | — | 12/17/22 | GBP | 1,000 | 1,547,160 | |||||||||||
TI Group Automotive Systems, L.L.C., Term Loan | 4.50 | % | 06/25/22 | 6,914 | 6,893,056 | |||||||||||
See accompanying Notes to Financial Statements which are an integral part of the financial statements.
10 Invesco Floating Rate Fund
| Interest Rate | Maturity Date | Principal Amount (000)* | Value | |||||||||||||
| Automotive–(continued) | ||||||||||||||||
Tower Automotive Holdings USA, LLC, Term Loan | 4.00 | % | 04/23/20 | $ | 5,920 | $ | 5,903,008 | |||||||||
Transtar Holding Co., | 5.75 | % | 10/09/18 | 4,645 | 4,604,087 | |||||||||||
Second Lien Term Loan | 10.00 | % | 10/09/19 | 1,654 | 1,608,142 | |||||||||||
Wand Intermediate I L.P., | 4.75 | % | 09/17/21 | 1,980 | 1,984,036 | |||||||||||
Second Lien Term Loan | 8.25 | % | 09/19/22 | 1,406 | 1,399,021 | |||||||||||
| 99,344,472 | ||||||||||||||||
| Beverage and Tobacco–0.06% | ||||||||||||||||
Winebow Holdings, Inc., Second Lien Term Loan (Acquired 07/02/14; Cost $1,498,598) | 8.50 | % | 12/31/21 | 1,508 | 1,455,393 | |||||||||||
| Building & Development–2.35% | ||||||||||||||||
ABC Supply Co., Inc., Term Loan B | 3.50 | % | 04/16/20 | 3,092 | 3,083,148 | |||||||||||
Capital Automotive L.P., Second Lien Term Loan | 6.00 | % | 04/30/20 | 4,080 | 4,110,126 | |||||||||||
Distribution International, Inc., First Lien Term Loan | 6.00 | % | 12/15/21 | 1,602 | 1,582,303 | |||||||||||
Lake at Las Vegas Joint Venture, LLC, | 0.00 | % | 02/28/17 | 13 | 9,590 | |||||||||||
PIK Exit Revolver Loan(e) | 5.00 | % | 02/28/17 | 153 | 115,475 | |||||||||||
Mannington Mills, Inc., Term Loan | 4.75 | % | 10/01/21 | 1,162 | 1,165,381 | |||||||||||
Mueller Water Products, Inc., Term Loan | 4.00 | % | 11/25/21 | 105 | 105,415 | |||||||||||
Nortek, Inc., Incremental Term Loan 1 | 3.50 | % | 10/30/20 | 1,711 | 1,702,430 | |||||||||||
Quikrete Holdings, Inc., First Lien Term Loan | 4.00 | % | 09/28/20 | 9,428 | 9,394,883 | |||||||||||
Re/Max International, Inc., Term Loan | 4.25 | % | 07/31/20 | 2,748 | 2,757,383 | |||||||||||
Realogy Corp., | 0.00 | % | 03/05/18 | 5,984 | 5,774,207 | |||||||||||
Synthetic LOC | 4.45 | % | 10/10/16 | — | 289 | |||||||||||
Term Loan B | 3.75 | % | 03/05/20 | 25,334 | 25,286,807 | |||||||||||
| 55,087,437 | ||||||||||||||||
| Business Equipment & Services–9.59% | ||||||||||||||||
Accelya International S.A. (Luxembourg), | 5.03 | % | 03/06/20 | 2,272 | 2,266,237 | |||||||||||
Term Loan A-2 | 5.03 | % | 03/06/20 | 785 | 783,140 | |||||||||||
Acosta, Inc., Term Loan B-1 | 4.25 | % | 09/26/21 | 4,394 | 4,357,707 | |||||||||||
Asurion LLC, | 4.25 | % | 07/08/20 | 19,855 | 19,414,200 | |||||||||||
Second Lien Incremental Term Loan | 8.50 | % | 03/03/21 | 27,005 | 26,554,873 | |||||||||||
Incremental Term Loan B-4 | 5.00 | % | 08/04/22 | 2,695 | 2,672,208 | |||||||||||
AVSC Holding Corp., First Lien Term Loan | 4.50 | % | 01/24/21 | 2,464 | 2,451,115 | |||||||||||
Brickman Group Ltd. LLC, | 4.00 | % | 12/18/20 | 1,718 | 1,696,272 | |||||||||||
Second Lien Term Loan | 7.50 | % | 12/17/21 | 1,110 | 1,088,698 | |||||||||||
Brock Holdings III, Inc., First Lien Term Loan | 6.00 | % | 03/16/17 | 225 | 219,790 | |||||||||||
Caraustar Industries, Inc., | 8.00 | % | 05/01/19 | 5,843 | 5,847,725 | |||||||||||
Incremental Term Loan | 8.00 | % | 05/01/19 | 330 | 329,905 | |||||||||||
Cast and Crew Payroll, LLC, Term Loan | 4.75 | % | 08/12/22 | 1,624 | 1,617,601 | |||||||||||
Checkout Holding Corp., | 7.75 | % | 04/11/22 | 4,379 | 3,078,096 | |||||||||||
Term Loan B | 4.50 | % | 04/09/21 | 7,492 | 6,705,571 | |||||||||||
Connolly, LLC, Second Lien Term Loan | 8.00 | % | 05/14/22 | 3,931 | 3,948,002 | |||||||||||
See accompanying Notes to Financial Statements which are an integral part of the financial statements.
11 Invesco Floating Rate Fund
| Interest Rate | Maturity Date | Principal Amount (000)* | Value | |||||||||||||
| Business Equipment & Services–(continued) | ||||||||||||||||
Crossmark Holdings, Inc., | 4.50 | % | 12/20/19 | $ | 4,590 | $ | 4,080,434 | |||||||||
Second Lien Term Loan | 8.75 | % | 12/21/20 | 576 | 466,909 | |||||||||||
Dream Secured BondCo AB (Sweden), Mezzanine Loan(c) | — | 08/15/19 | EUR | 4,000 | 4,617,650 | |||||||||||
Emdeon Inc., Term Loan B-2 | 3.75 | % | 11/02/18 | 3,885 | 3,879,624 | |||||||||||
Expert Global Solutions, Inc., First Lien Term Loan B | 8.50 | % | 04/03/18 | 3,809 | 3,804,233 | |||||||||||
First Data Corp., Second Lien | 3.70 | % | 03/24/17 | 10,732 | 10,716,342 | |||||||||||
Term Loan | 3.70 | % | 03/24/18 | 24,815 | 24,667,754 | |||||||||||
Term Loan | 3.70 | % | 09/24/18 | 3,107 | 3,088,465 | |||||||||||
Term Loan | 4.20 | % | 03/24/21 | 969 | 969,286 | |||||||||||
Term Loan | 3.95 | % | 07/08/22 | 1,069 | 1,064,012 | |||||||||||
Genesys Telecom Holdings, U.S., Inc., | 4.00 | % | 02/08/20 | 785 | 782,720 | |||||||||||
Term Loan 2 | 4.50 | % | 11/13/20 | 5,045 | 5,045,086 | |||||||||||
Global Healthcare Exchange, LLC, Term Loan(c) | — | 08/15/22 | 1,552 | 1,556,370 | ||||||||||||
Inmar, Inc., | 8.00 | % | 01/27/22 | 306 | 299,938 | |||||||||||
Term Loan | 4.25 | % | 01/27/21 | 1,712 | 1,695,508 | |||||||||||
Intertrust Group Holding B.V. (Netherlands), | 8.00 | % | 04/16/22 | 3,172 | 3,180,967 | |||||||||||
Term Loan B-5 | 4.53 | % | 04/16/21 | 1,746 | 1,750,679 | |||||||||||
Karman Buyer Corp., | 7.50 | % | 07/25/22 | 2,541 | 2,475,928 | |||||||||||
Term Loan | 4.25 | % | 07/23/21 | 8,515 | 8,444,217 | |||||||||||
Kronos Inc., | 4.50 | % | 10/30/19 | 601 | 601,738 | |||||||||||
Second Lien Term Loan | 9.75 | % | 04/30/20 | 1,710 | 1,744,319 | |||||||||||
Learning Care Group (US) No. 2 Inc., Term Loan | 5.00 | % | 05/05/21 | 2,363 | 2,367,878 | |||||||||||
LS Deco LLC, Term Loan B | 5.50 | % | 05/21/22 | 2,035 | 2,053,038 | |||||||||||
Nuance Communications, Inc., Term Loan C | 2.95 | % | 08/07/19 | 6,059 | 6,021,434 | |||||||||||
Prime Security Services Borrower, LLC, | 5.00 | % | 07/01/21 | 3,496 | 3,497,977 | |||||||||||
Second Lien Term Loan B | 9.75 | % | 07/01/22 | 1,317 | 1,305,935 | |||||||||||
Sensus USA, Inc., First Lien Term Loan | 4.50 | % | 05/09/17 | 3,322 | 3,317,401 | |||||||||||
ServiceMaster Co., (The), Term Loan | 4.25 | % | 07/01/21 | 1,403 | 1,400,003 | |||||||||||
Spin Holdco Inc., First Lien Term Loan | 4.25 | % | 11/14/19 | 16,928 | 16,748,437 | |||||||||||
Stiphout Finance LLC, | — | 01/01/23 | 1,020 | 1,022,392 | ||||||||||||
Term Loan(c) | — | 01/01/22 | 1,989 | 1,993,328 | ||||||||||||
SunGard Data Systems Inc., Term Loan C | 3.94 | % | 02/28/17 | 791 | 791,237 | |||||||||||
TNS Inc., | 5.00 | % | 02/14/20 | 4,032 | 4,043,671 | |||||||||||
Second Lien Term Loan | 9.00 | % | 08/14/20 | 241 | 239,589 | |||||||||||
Trans Union LLC, Term Loan B-2 | 3.50 | % | 04/09/21 | 9,057 | 9,003,356 | |||||||||||
Wash MultiFamily Acquisition Inc., | 4.25 | % | 05/14/22 | 357 | 354,743 | |||||||||||
First Lien Term Loan | 4.25 | % | 05/14/22 | 2,036 | 2,025,608 | |||||||||||
Second Lien Canadian Term Loan | 8.00 | % | 05/12/23 | 39 | 39,154 | |||||||||||
Second Lien Term Loan | 8.00 | % | 05/14/23 | 222 | 223,548 | |||||||||||
| 224,412,048 | ||||||||||||||||
See accompanying Notes to Financial Statements which are an integral part of the financial statements.
12 Invesco Floating Rate Fund
| Interest Rate | Maturity Date | Principal Amount (000)* | Value | |||||||||||||
| Cable & Satellite Television–3.81% | ||||||||||||||||
Altice Financing SA (Luxembourg), | 5.50 | % | 07/02/19 | $ | 1,515 | $ | 1,524,943 | |||||||||
Term Loan(c) | — | 02/04/22 | EUR | 1,000 | 1,126,448 | |||||||||||
Term Loan | 5.25 | % | 02/04/22 | 3,874 | 3,905,817 | |||||||||||
Cequel Communications, LLC, Revolver Loan(d) | 0.00 | % | 02/14/17 | 9,469 | 9,303,184 | |||||||||||
Charter Communications Operating, LLC, Term Loan I | 3.50 | % | 01/24/23 | 15,588 | 15,589,878 | |||||||||||
ION Media Networks, Inc., Term Loan B-1 | 4.75 | % | 12/18/20 | 2,743 | 2,749,365 | |||||||||||
MCC Iowa LLC, | 3.25 | % | 01/29/21 | 3,244 | 3,211,286 | |||||||||||
Term Loan J | 3.75 | % | 06/30/21 | 1,854 | 1,851,695 | |||||||||||
Mediacom Illinois LLC, | 3.16 | % | 10/23/17 | 1,913 | 1,909,693 | |||||||||||
Term Loan G | 3.50 | % | 06/30/21 | 2,243 | 2,239,850 | |||||||||||
Numericable Group SA (France), Term Loan B-5 | 4.00 | % | 07/31/22 | 2,224 | 2,219,029 | |||||||||||
Quebecor Media Inc. (Canada), Term Loan B-1 | 3.25 | % | 08/17/20 | 2,467 | 2,425,204 | |||||||||||
Virgin Media Investment Holdings Ltd. (United Kingdom), Term Loan F | 3.50 | % | 06/30/23 | 13,995 | 13,865,305 | |||||||||||
WideOpenWest Finance, LLC, | 4.50 | % | 04/01/19 | 8,086 | 8,075,437 | |||||||||||
Term Loan B-1 | 3.75 | % | 07/17/17 | 921 | 919,424 | |||||||||||
Ziggo B.V. (Netherlands), | 3.50 | % | 01/15/22 | 6,854 | 6,775,437 | |||||||||||
Term Loan B-2 | 3.50 | % | 01/15/22 | 4,417 | 4,366,219 | |||||||||||
Term Loan B-3 | 3.50 | % | 01/15/22 | 7,264 | 7,180,871 | |||||||||||
| 89,239,085 | ||||||||||||||||
| Chemicals & Plastics–3.26% | ||||||||||||||||
Allnex & Cy S.C.A., | 4.50 | % | 10/03/19 | 566 | 566,947 | |||||||||||
Term Loan B-2 | 4.50 | % | 10/03/19 | 294 | 294,171 | |||||||||||
Ascend Performance Materials Operations LLC, Term Loan B | 6.75 | % | 04/10/18 | 1,970 | 1,766,001 | |||||||||||
Charter NEX US Holdings, Inc., First Lien Term Loan | 5.25 | % | 02/07/22 | 1,130 | 1,136,695 | |||||||||||
Chemours Co. (The), Term Loan B | 3.75 | % | 05/12/22 | 4,050 | 3,919,270 | |||||||||||
Chemstralia Finco LLC., Term Loan (Acquired 02/09/15; Cost $4,002,252) | 7.25 | % | 02/28/22 | 4,197 | 4,207,124 | |||||||||||
Chromaflo Technologies Corp., | 4.50 | % | 12/02/19 | 346 | 336,975 | |||||||||||
Second Lien Term Loan (Acquired 11/20/13; Cost $812,030) | 8.25 | % | 06/02/20 | 815 | 774,309 | |||||||||||
Colouroz Investment LLC (Germany), | 4.50 | % | 09/07/21 | 4,309 | 4,303,499 | |||||||||||
Second Lien Term Loan B-2 | 8.25 | % | 09/06/22 | 4,949 | 4,942,769 | |||||||||||
Term Loan C | 4.50 | % | 09/07/21 | 712 | 712,533 | |||||||||||
Constantinople Acquisition GmbH (Austria), | 4.75 | % | 04/29/22 | 274 | 275,833 | |||||||||||
Term Loan B-2 | 4.75 | % | 04/29/22 | 1,409 | 1,416,441 | |||||||||||
Eco Services Operations LLC, Term Loan | 4.75 | % | 12/04/21 | 2,190 | 2,184,230 | |||||||||||
Ferro Corp., Term Loan (Acquired 08/04/14; Cost $1,352,946) | 4.00 | % | 07/31/21 | 1,359 | 1,358,747 | |||||||||||
Gemini HDPE LLC, Term Loan | 4.75 | % | 08/07/21 | 1,606 | 1,609,112 | |||||||||||
HII Holding Corp., First Lien Term Loan | 4.25 | % | 12/20/19 | 2,025 | 2,015,680 | |||||||||||
Huntsman International LLC, Incremental Term Loan 1 | 3.75 | % | 10/01/21 | 2,279 | 2,283,888 | |||||||||||
Ineos Holdings Ltd., | 3.75 | % | 05/04/18 | 8,256 | 8,234,412 | |||||||||||
Term Loan | 4.25 | % | 03/31/22 | 1,115 | 1,114,204 | |||||||||||
See accompanying Notes to Financial Statements which are an integral part of the financial statements.
13 Invesco Floating Rate Fund
| Interest Rate | Maturity Date | Principal Amount (000)* | Value | |||||||||||||
| Chemicals & Plastics–(continued) | ||||||||||||||||
MacDermid, Inc., | 4.50 | % | 06/07/20 | $ | 465 | $ | 465,147 | |||||||||
Term Loan B-2 | 4.75 | % | 06/07/20 | 1,286 | 1,289,071 | |||||||||||
OMNOVA Solutions, Inc., Term Loan B-1 | 4.25 | % | 05/31/18 | 2,506 | 2,504,052 | |||||||||||
Otter Products, LLC, Term Loan B | 5.75 | % | 06/03/20 | 6,157 | 6,059,769 | |||||||||||
Oxea Finance LLC, | 4.25 | % | 01/15/20 | 5,493 | 5,376,317 | |||||||||||
Second Lien Term Loan | 8.25 | % | 07/15/20 | 1,557 | 1,466,348 | |||||||||||
Prolampac Intermediate Inc., | 9.25 | % | 08/18/23 | 1,289 | 1,266,683 | |||||||||||
Term Loan | 5.00 | % | 08/18/22 | 3,332 | 3,340,201 | |||||||||||
Royal Holdings, Inc., | 8.50 | % | 06/19/23 | 660 | 661,251 | |||||||||||
Term Loan | 4.50 | % | 06/19/22 | 387 | 386,078 | |||||||||||
Styrolution US Holding LLC, First Lien Term Loan B-1 | 6.50 | % | 11/07/19 | 6,957 | 7,009,072 | |||||||||||
Tata Chemicals North America Inc., Term Loan | 3.75 | % | 08/07/20 | 1,559 | 1,559,540 | |||||||||||
Trinseo Materials Finance, Inc., Term Loan B | 4.25 | % | 11/05/21 | 1,409 | 1,408,315 | |||||||||||
| 76,244,684 | ||||||||||||||||
| Clothing & Textiles–1.10% | ||||||||||||||||
ABG Intermediate Holdings 2 LLC, | 5.50 | % | 05/27/21 | 4,319 | 4,322,768 | |||||||||||
Delayed Draw Incremental Term Loan(d) | 0.00 | % | 05/27/21 | 328 | 328,310 | |||||||||||
Second Lien Delayed Draw Incremental Term Loan(d) | 0.00 | % | 05/23/22 | 99 | 99,052 | |||||||||||
Second Lien Term Loan | 9.50 | % | 05/27/22 | 2,243 | 2,265,124 | |||||||||||
Ascena Retail Group, Inc., Term Loan B(c) | — | 08/21/22 | 16,608 | 16,290,194 | ||||||||||||
Varsity Brands Holding Co., Inc., Term Loan | 5.00 | % | 12/11/21 | 2,484 | 2,494,391 | |||||||||||
| 25,799,839 | ||||||||||||||||
| Conglomerates–0.65% | ||||||||||||||||
CeramTec Acquisition Corp., | 4.25 | % | 08/30/20 | 3,231 | 3,232,769 | |||||||||||
Term Loan B-2 | 4.25 | % | 08/30/20 | 332 | 332,322 | |||||||||||
Term Loan B-3 | 4.25 | % | 08/30/20 | 978 | 978,431 | |||||||||||
Epiq Systems, Inc., Term Loan | 4.50 | % | 08/27/20 | 5,350 | 5,336,205 | |||||||||||
Jarden Corp., Term Loan B-2 | 2.95 | % | 07/30/22 | 35 | 34,552 | |||||||||||
Penn Engineering & Manufacturing Corp., Incremental Term Loan B | 4.00 | % | 08/30/21 | 125 | 124,568 | |||||||||||
Spectrum Brands, Inc., Term Loan | 3.75 | % | 06/23/22 | 1,791 | 1,794,663 | |||||||||||
Tekni-Plex, Inc., | 8.75 | % | 06/01/23 | 1,122 | 1,123,764 | |||||||||||
Term Loan B-1 | 4.50 | % | 06/01/22 | 2,175 | 2,169,001 | |||||||||||
| 15,126,275 | ||||||||||||||||
| Containers & Glass Products–1.71% | ||||||||||||||||
Berlin Packaging, LLC, | 7.75 | % | 10/01/22 | 760 | 756,367 | |||||||||||
Term Loan | 4.50 | % | 10/01/21 | 3,026 | 3,033,358 | |||||||||||
Berry Plastics Group, Inc., Term Loan D | 3.50 | % | 02/08/20 | 15,383 | 15,182,060 | |||||||||||
BWAY Holding Co., Term Loan | 5.50 | % | 08/14/20 | 2,702 | 2,708,322 | |||||||||||
Consolidated Container Co. LLC, Term Loan | 5.00 | % | 07/03/19 | 930 | 885,631 | |||||||||||
Devix US, Inc., First Lien Term Loan B | 4.25 | % | 05/02/21 | 1,852 | 1,852,828 | |||||||||||
Duran Group (Germany), Term Loan C(c) | — | 11/28/19 | 2,621 | 2,627,752 | ||||||||||||
See accompanying Notes to Financial Statements which are an integral part of the financial statements.
14 Invesco Floating Rate Fund
| Interest Rate | Maturity Date | Principal Amount (000)* | Value | |||||||||||||
| Containers & Glass Products–(continued) | ||||||||||||||||
Hoffmaster Group, Inc., | 5.25 | % | 05/09/20 | $ | 3,844 | $ | 3,840,799 | |||||||||
Second Lien Term Loan | 10.00 | % | 05/09/21 | 786 | 774,368 | |||||||||||
Horizon Holdings III (France), Term Loan B(c) | — | 08/07/22 | EUR | 3,500 | 3,938,367 | |||||||||||
Klockner Pentaplast of America, Inc., | 5.00 | % | 04/28/20 | 1,267 | 1,270,607 | |||||||||||
Term Loan | 5.00 | % | 04/28/20 | 542 | 542,994 | |||||||||||
Ranpak Corp., | 8.25 | % | 10/03/22 | 415 | 413,245 | |||||||||||
Term Loan B-1 | 4.25 | % | 10/01/21 | 610 | 609,732 | |||||||||||
Reynolds Group Holdings Inc., Incremental Term Loan | 4.50 | % | 12/01/18 | 1,574 | 1,576,409 | |||||||||||
| 40,012,839 | ||||||||||||||||
| Cosmetics & Toiletries–0.47% | ||||||||||||||||
Prestige Brands, Inc., Term Loan B-3 | 3.51 | % | 09/03/21 | 2,157 | 2,157,197 | |||||||||||
Revlon Consumer Products Corp., Term Loan | 4.00 | % | 10/08/19 | 2,428 | 2,425,304 | |||||||||||
Vogue International LLC, Term Loan B | 5.75 | % | 02/14/20 | 6,311 | 6,346,207 | |||||||||||
| 10,928,708 | ||||||||||||||||
| Drugs–2.40% | ||||||||||||||||
BPA Laboratories, | 2.79 | % | 07/01/17 | 1,202 | 989,532 | |||||||||||
Second Lien Term Loan | 2.79 | % | 07/01/17 | 1,045 | 817,933 | |||||||||||
Endo Pharmaceuticals Holdings Inc., Incremental Term Loan B(c) | — | 01/01/22 | 10,552 | 10,574,669 | ||||||||||||
Grifols Worldwide Operations USA, Inc., Term Loan B | 3.20 | % | 02/27/21 | 13,221 | 13,227,425 | |||||||||||
Valeant Pharmaceuticals International, Inc. (Canada), | 3.75 | % | 12/11/19 | 7,649 | 7,636,790 | |||||||||||
Series E-1 Term Loan B | 3.75 | % | 08/05/20 | 16,968 | 16,945,744 | |||||||||||
Series F-1, Term Loan B | 4.00 | % | 04/01/22 | 6,083 | 6,092,373 | |||||||||||
| 56,284,466 | ||||||||||||||||
| Ecological Services & Equipment–0.20% | ||||||||||||||||
ADS Waste Holdings, Inc., Term Loan B-2 | 3.75 | % | 10/09/19 | 4,407 | 4,377,942 | |||||||||||
PSSI Holdings LLC, Term Loan | 5.00 | % | 12/02/21 | 109 | 109,479 | |||||||||||
Waste Industries USA, Inc., Term Loan | 4.25 | % | 02/27/20 | 90 | 90,319 | |||||||||||
| 4,577,740 | ||||||||||||||||
| Electronics & Electrical–8.66% | ||||||||||||||||
4L Technologies Inc., Term Loan | 5.50 | % | 05/08/20 | 10,259 | 10,104,963 | |||||||||||
Accuvant Finance LLC, Term Loan | 6.25 | % | 01/28/22 | 3,617 | 3,635,451 | |||||||||||
Avago Technologies Cayman Ltd. (Luxembourg), Term Loan | 3.75 | % | 05/06/21 | 9,481 | 9,486,897 | |||||||||||
AVG Technologies N.V. (Netherlands), Term Loan | 5.75 | % | 10/15/20 | 2,506 | 2,521,797 | |||||||||||
Blackboard Inc., Term Loan B-3 | 4.75 | % | 10/04/18 | 8,452 | 8,418,449 | |||||||||||
Blue Coat Holdings, Inc., Term Loan | 4.50 | % | 05/20/22 | 1,640 | 1,632,684 | |||||||||||
BMC Software Finance, Inc., Term Loan | 5.00 | % | 09/10/20 | 1,536 | 1,418,525 | |||||||||||
Carros US LLC, Term Loan | 4.50 | % | 09/30/21 | 1,230 | 1,229,917 | |||||||||||
CommScope, Inc., Term Loan 5 | 3.75 | % | 12/29/22 | 5,669 | 5,661,192 | |||||||||||
Compuware Corp., | 6.25 | % | 12/15/19 | 3,413 | 3,328,157 | |||||||||||
Term Loan B-2 | 6.25 | % | 12/15/21 | 1,173 | 1,135,089 | |||||||||||
Deltek, Inc., Term Loan | 5.00 | % | 06/25/22 | 9,178 | 9,195,158 | |||||||||||
Diamond US Holding LLC, Term Loan | 4.75 | % | 12/17/21 | 2,720 | 2,729,606 | |||||||||||
Fidji Luxembourg BC4 S.a r.l. (Luxembourg), Term Loan | 6.25 | % | 12/24/20 | 2,432 | 2,437,018 | |||||||||||
See accompanying Notes to Financial Statements which are an integral part of the financial statements.
15 Invesco Floating Rate Fund
| Interest Rate | Maturity Date | Principal Amount (000)* | Value | |||||||||||||
| Electronics & Electrical–(continued) | ||||||||||||||||
Freescale Semiconductor, Inc., Term Loan B-4 | 4.25 | % | 02/28/20 | $ | 29,383 | $ | 29,382,684 | |||||||||
Hyland Software, Inc., Second Lien Term Loan | 8.25 | % | 07/01/23 | 643 | 640,811 | |||||||||||
Infor (US), Inc., Term Loan B-3 | 3.75 | % | 06/03/20 | 6,172 | 6,003,988 | |||||||||||
Lattice Semiconductor Corp., Term Loan | 5.25 | % | 03/10/21 | 2,848 | 2,783,837 | |||||||||||
Linxens France SA, | — | 01/01/22 | 2,790 | 2,785,491 | ||||||||||||
Second Lien Term Loan B-1(c) | — | 01/01/23 | 1,281 | 1,276,191 | ||||||||||||
MA Finance Co., LLC, Term Loan C | 4.50 | % | 11/20/19 | 8,920 | 8,922,333 | |||||||||||
Mediaocean LLC, Term Loan | 5.75 | % | 08/15/22 | 2,160 | 2,154,963 | |||||||||||
Mirion Technologies, Inc., Term Loan | 5.75 | % | 03/31/22 | 3,391 | 3,405,395 | |||||||||||
MSC.Software Corp., | 5.00 | % | 05/29/20 | 1,606 | 1,586,006 | |||||||||||
Second Lien Term Loan | 8.50 | % | 06/01/21 | 803 | 778,538 | |||||||||||
Natel Engineering Co., Inc., Term Loan | 6.75 | % | 04/10/20 | 2,462 | 2,472,371 | |||||||||||
Oberthur Technologies of America Corp., Term Loan B-2 | 4.50 | % | 10/18/19 | 1,866 | 1,861,587 | |||||||||||
Omnitracs, Inc., Term Loan | 4.75 | % | 11/25/20 | 4,862 | 4,834,318 | |||||||||||
Peak 10, Inc., | 5.00 | % | 06/17/21 | 454 | 453,150 | |||||||||||
Second Lien Term Loan (Acquired 06/18/14; Cost $780,930) | 8.25 | % | 06/17/22 | 788 | 752,186 | |||||||||||
Riverbed Technology, Inc., Term Loan | 6.00 | % | 04/24/22 | 7,255 | 7,276,242 | |||||||||||
RP Crown Parent, LLC, | 6.00 | % | 12/21/18 | 13,597 | 12,529,216 | |||||||||||
Second Lien Term Loan | 11.25 | % | 12/20/19 | 602 | 526,806 | |||||||||||
Science Applications International Corp., Incremental Term Loan B | 3.75 | % | 05/04/22 | 2,821 | 2,828,559 | |||||||||||
Ship Luxco 3 S.a.r.l. (Luxembourg), | 4.50 | % | 11/30/19 | 3,702 | 3,711,663 | |||||||||||
Term Loan B-2A-II | 5.25 | % | 11/30/19 | 1,500 | 1,509,533 | |||||||||||
Term Loan C-2 | 4.75 | % | 11/29/19 | 2,401 | 2,414,844 | |||||||||||
SkillSoft Corp., Term Loan | 5.75 | % | 04/28/21 | 8,899 | 8,543,036 | |||||||||||
SS&C Technologies Inc., | 4.00 | % | 07/08/22 | 9,112 | 9,142,525 | |||||||||||
Term Loan B-2 | 4.00 | % | 07/08/22 | 1,476 | 1,481,191 | |||||||||||
Sybil Software LLC, Term Loan | 4.25 | % | 03/20/20 | 1,119 | 1,121,326 | |||||||||||
TTM Technologies, Inc., Term Loan B | 6.00 | % | 05/31/21 | 6,066 | 5,793,111 | |||||||||||
Zebra Technologies Corp., Term Loan | 4.75 | % | 10/27/21 | 12,606 | 12,698,359 | |||||||||||
| 202,605,163 | ||||||||||||||||
| Equipment Leasing–0.13% | ||||||||||||||||
Flying Fortress Inc., Term Loan | 3.50 | % | 04/30/20 | 104 | 104,444 | |||||||||||
IBC Capital US LLC, Term Loan | 4.75 | % | 09/09/21 | 3,070 | 2,989,804 | |||||||||||
| 3,094,248 | ||||||||||||||||
| Financial Intermediaries–1.04% | ||||||||||||||||
Bankruptcy Management Solutions, Inc., Term Loan B | 7.00 | % | 06/27/18 | 22 | 19,413 | |||||||||||
Black Knight InfoServ, LLC, Term Loan B | 3.75 | % | 05/27/22 | 945 | 948,318 | |||||||||||
iPayment Inc., Term Loan | 6.75 | % | 05/08/17 | 3,978 | 3,909,930 | |||||||||||
MoneyGram International, Inc., Term Loan | 4.25 | % | 03/27/20 | 10,169 | 9,576,182 | |||||||||||
RJO Holdings Corp., Term Loan | 6.95 | % | 12/10/16 | 1,606 | 1,493,694 | |||||||||||
RPI Finance Trust, Term Loan B-4 | 3.50 | % | 11/09/20 | 6,715 | 6,722,422 | |||||||||||
SAM Finance Lux S.a r.l. (Luxembourg), Term Loan | 4.25 | % | 12/17/20 | 1,641 | 1,646,790 | |||||||||||
| 24,316,749 | ||||||||||||||||
See accompanying Notes to Financial Statements which are an integral part of the financial statements.
16 Invesco Floating Rate Fund
| Interest Rate | Maturity Date | Principal Amount (000)* | Value | |||||||||||||
| Food & Drug Retailers–0.93% | ||||||||||||||||
Albertson’s LLC, Term Loan B-4 | 5.50 | % | 08/25/21 | $ | 15,933 | $ | 15,967,419 | |||||||||
Pret A Manger (United Kingdom), Term Loan B(c) | — | 06/19/20 | GBP | 1,150 | 1,764,684 | |||||||||||
Supervalu Inc., Term Loan | 4.50 | % | 03/21/19 | 3,944 | 3,960,992 | |||||||||||
| 21,693,095 | ||||||||||||||||
| Food Products–3.23% | ||||||||||||||||
AdvancePierre Foods, Inc., | 5.75 | % | 07/10/17 | 6,602 | 6,621,672 | |||||||||||
Second Lien Term Loan | 9.50 | % | 10/10/17 | 2,540 | 2,560,988 | |||||||||||
Candy Intermediate Holdings, Inc., Term Loan | 7.50 | % | 06/18/18 | 2,985 | 2,981,728 | |||||||||||
Charger OpCo B.V., Term Loan B-1 | 4.25 | % | 07/02/22 | 10,769 | 10,798,830 | |||||||||||
CSM Bakery Solutions LLC, | 5.00 | % | 07/03/20 | 5,922 | 5,917,303 | |||||||||||
Second Lien Term Loan | 8.75 | % | 07/03/21 | 2,515 | 2,377,141 | |||||||||||
Dole Food Co., Inc., Term Loan B | 4.50 | % | 11/01/18 | 9,401 | 9,418,774 | |||||||||||
Hearthside Group Holdings, LLC, | 0.00 | % | 06/02/19 | 2,701 | 2,668,799 | |||||||||||
Term Loan | 4.50 | % | 06/02/21 | 3,179 | 3,166,831 | |||||||||||
Hostess Brands, LLC, Second Lien Term Loan B | 8.50 | % | 08/03/23 | 1,231 | 1,236,485 | |||||||||||
JBS USA, LLC, | — | 01/01/22 | 7,481 | 7,462,223 | ||||||||||||
Term Loan | 3.75 | % | 05/25/18 | 6,906 | 6,906,466 | |||||||||||
Onex Wizard US Acquisition Inc., Term Loan | 4.25 | % | 03/13/22 | 7,020 | 7,030,612 | |||||||||||
Post Holdings, Inc., | 3.75 | % | 06/02/21 | 728 | �� | 728,331 | ||||||||||
Revolver Loan(d) | 0.00 | % | 01/29/19 | 3,566 | 3,556,245 | |||||||||||
QCE LLC, PIK Term Loan(e) | 15.00 | % | 07/01/19 | 6 | 2,019 | |||||||||||
Shearer’s Foods, LLC, | 4.50 | % | 06/30/21 | 1,823 | 1,807,180 | |||||||||||
Second Lien Term Loan | 7.75 | % | 06/30/22 | 457 | 449,875 | |||||||||||
| 75,691,502 | ||||||||||||||||
| Food Service–1.23% | ||||||||||||||||
Aramark Corp., LOC | 3.69 | % | 07/26/16 | 82 | 81,751 | |||||||||||
Portillo’s Holdings, LLC, | 4.75 | % | 08/02/21 | 2,147 | 2,144,415 | |||||||||||
Second Lien Term Loan | 8.00 | % | 08/01/22 | 841 | 839,545 | |||||||||||
Red Lobster Management, LLC, Term Loan | 6.25 | % | 07/28/21 | 3,398 | 3,423,535 | |||||||||||
Restaurant Holding Co., LLC, First Lien Term Loan | 8.75 | % | 02/28/19 | 2,734 | 2,433,219 | |||||||||||
Steak n Shake Operations, Inc., Term Loan | 4.75 | % | 03/19/21 | 2,464 | 2,455,242 | |||||||||||
TMK Hawk Parent, Corp., | 5.25 | % | 10/01/21 | 2,346 | 2,350,249 | |||||||||||
Second Lien Term Loan (Acquired 10/01/14; Cost $1,073,648) | 8.50 | % | 10/01/22 | 1,083 | 1,094,077 | |||||||||||
US Foods, Inc., Incremental Term Loan | 4.50 | % | 03/31/19 | 8,871 | 8,896,243 | |||||||||||
Weight Watchers International, Inc., Term Loan B-2 | 4.00 | % | 04/02/20 | 9,825 | 4,962,838 | |||||||||||
| 28,681,114 | ||||||||||||||||
| Forest Products–0.35% | ||||||||||||||||
Builders FirstSource, Inc., Term Loan | 6.00 | % | 07/31/22 | 1,369 | 1,365,210 | |||||||||||
NewPage Corp., Term Loan B | 9.50 | % | 02/11/21 | 4,718 | 2,838,084 | |||||||||||
Xerium Technologies, Inc., Term Loan | 5.75 | % | 05/17/19 | 3,966 | 3,988,704 | |||||||||||
| 8,191,998 | ||||||||||||||||
See accompanying Notes to Financial Statements which are an integral part of the financial statements.
17 Invesco Floating Rate Fund
| Interest Rate | Maturity Date | Principal Amount (000)* | Value | |||||||||||||
| Health Care–5.87% | ||||||||||||||||
Acadia Healthcare Co., Inc., Incremental Term Loan B | 4.25 | % | 02/11/22 | $ | 1,099 | $ | 1,108,494 | |||||||||
Accellent Inc., | 7.50 | % | 03/11/22 | 2,122 | 2,139,057 | |||||||||||
Term Loan | 4.50 | % | 03/12/21 | 9,640 | 9,640,123 | |||||||||||
ATI Holdings, Inc., Term Loan | 5.25 | % | 12/20/19 | 2,295 | 2,307,678 | |||||||||||
Auris Luxembourg III S.a.r.l. (Luxembourg), Term Loan B-4 | 4.75 | % | 01/15/22 | 3,524 | 3,529,604 | |||||||||||
CareCore National, LLC, Term Loan | 5.50 | % | 03/05/21 | 7,845 | 7,688,284 | |||||||||||
Carestream Health, Inc., First Lien Term Loan | 5.00 | % | 06/07/19 | 7,738 | 7,686,896 | |||||||||||
Community Health Systems, Inc., Incremental Term Loan F | 3.57 | % | 12/31/18 | 3,862 | 3,865,828 | |||||||||||
Concordia Healthcare Corp. (Canada), Term Loan | 4.75 | % | 04/21/22 | 2,231 | 2,238,390 | |||||||||||
Creganna Finance (US) LLC, | 4.75 | % | 12/01/21 | 1,160 | 1,163,545 | |||||||||||
Second Lien Term Loan | 9.00 | % | 06/01/22 | 1,156 | 1,161,693 | |||||||||||
DJO Finance LLC, Term Loan | 4.25 | % | 06/08/20 | 8,801 | 8,776,574 | |||||||||||
eResearchTechnology, Inc., Term Loan | 5.50 | % | 05/08/22 | 2,874 | 2,880,556 | |||||||||||
HC Group Holdings III, Inc., Term Loan | 6.00 | % | 04/07/22 | 2,827 | 2,841,343 | |||||||||||
Hill-Rom Holdings, Inc., Term Loan B(c) | — | 09/08/22 | 3,300 | 3,307,870 | ||||||||||||
Indigo Cleanco Ltd. (United Kingdom), Term Loan B(c) | — | 07/08/21 | GBP | 2,000 | 3,049,819 | |||||||||||
Kindred Healthcare, Inc., Term Loan | 4.25 | % | 04/09/21 | 10,072 | 10,087,713 | |||||||||||
Kinetic Concepts, Inc., Term Loan E-1 | 4.50 | % | 05/04/18 | 13,557 | 13,562,640 | |||||||||||
Millennium Laboratories, LLC, Term Loan B | 5.25 | % | 04/16/21 | 25,974 | 13,019,609 | |||||||||||
MPH Acquisition Holdings LLC, Term Loan | 3.75 | % | 03/31/21 | 8,472 | 8,384,263 | |||||||||||
National Surgical Hospitals, Inc., Term Loan | 4.50 | % | 06/01/22 | 1,783 | 1,784,729 | |||||||||||
Ortho-Clinical Diagnostics, Inc., Term Loan | 4.75 | % | 06/30/21 | 3,706 | 3,658,031 | |||||||||||
Pharmaceutical Product Development LLC, Term Loan | 4.25 | % | 08/18/22 | 1,939 | 1,930,360 | |||||||||||
Phillips-Medisize Corp., | 8.25 | % | 06/16/22 | 788 | 788,122 | |||||||||||
Term Loan | 4.75 | % | 06/16/21 | 1,615 | 1,615,519 | |||||||||||
Surgery Center Holdings, Inc., | 8.50 | % | 11/03/21 | 3,764 | 3,762,808 | |||||||||||
Term Loan | 5.25 | % | 11/03/20 | 3,089 | 3,094,251 | |||||||||||
Surgical Care Affiliates, LLC, Term Loan | 4.25 | % | 03/17/22 | 5,196 | 5,195,678 | |||||||||||
Vedici Groupe (France), Term Loan B(c) | — | 07/20/22 | EUR | 3,000 | 3,375,928 | |||||||||||
Western Dental Services, Inc., Term Loan | 6.00 | % | 11/01/18 | 4,060 | 3,626,589 | |||||||||||
| 137,271,994 | ||||||||||||||||
| Home Furnishings–0.31% | ||||||||||||||||
Britax Group Ltd., Term Loan | 4.50 | % | 10/15/20 | 1,773 | 1,329,424 | |||||||||||
Mattress Holdings Corp., Term Loan | 5.00 | % | 10/20/21 | 4,610 | 4,639,063 | |||||||||||
PGT, Inc., Term Loan | 5.25 | % | 09/22/21 | 1,321 | 1,326,564 | |||||||||||
| 7,295,051 | ||||||||||||||||
| Industrial Equipment–1.65% | ||||||||||||||||
Accudyne Industries LLC, Term Loan | 4.00 | % | 12/13/19 | 1,311 | 1,227,013 | |||||||||||
Crosby US Acquisition Corp., | 3.75 | % | 11/23/20 | 7,214 | 6,420,626 | |||||||||||
Second Lien Term Loan | 7.00 | % | 11/22/21 | 1,620 | 1,425,246 | |||||||||||
Delachaux S.A. (France), Term Loan B-2 | 4.50 | % | 10/28/21 | 1,763 | 1,761,988 | |||||||||||
Doosan Infracore International, Inc., Term Loan B | 4.50 | % | 05/28/21 | 7,305 | 7,341,040 | |||||||||||
Filtration Group Corp., | 4.25 | % | 11/21/20 | 1,445 | 1,446,448 | |||||||||||
Second Lien Term Loan | 8.25 | % | 11/21/21 | 446 | 447,797 | |||||||||||
See accompanying Notes to Financial Statements which are an integral part of the financial statements.
18 Invesco Floating Rate Fund
| Interest Rate | Maturity Date | Principal Amount (000)* | Value | |||||||||||||
| Industrial Equipment–(continued) | ||||||||||||||||
Gardner Denver, Inc., Term Loan | 4.25 | % | 07/30/20 | $ | 1,182 | $ | 1,131,100 | |||||||||
Generac Power System, Inc., Term Loan B | 3.50 | % | 05/31/20 | 1,500 | 1,475,144 | |||||||||||
Milacron LLC, Term Loan | 4.50 | % | 09/28/20 | 1,437 | 1,440,769 | |||||||||||
North American Lifting Holdings, Inc., First Lien Term Loan | 5.50 | % | 11/27/20 | 4,372 | 4,153,073 | |||||||||||
Rexnord LLC/ RBS Global, Inc., Term Loan B | 4.00 | % | 08/21/20 | 7,751 | 7,687,865 | |||||||||||
Tank Holding Corp., Term Loan | 5.25 | % | 03/16/22 | 889 | 887,504 | |||||||||||
Virtuoso US LLC, Term Loan | 4.25 | % | 02/11/21 | 1,714 | 1,716,832 | |||||||||||
| 38,562,445 | ||||||||||||||||
| Insurance–0.25% | ||||||||||||||||
Cooper Gay Swett & Crawford Ltd., | 5.00 | % | 04/16/20 | 1,911 | 1,757,730 | |||||||||||
Second Lien Term Loan | 8.25 | % | 10/16/20 | 1,300 | 1,065,763 | |||||||||||
York Risk Services Holding Corp., Term Loan | 4.75 | % | 10/01/21 | 3,161 | 3,040,012 | |||||||||||
| 5,863,505 | ||||||||||||||||
| Leisure Goods, Activities & Movies–2.62% | ||||||||||||||||
Alpha Topco Ltd. (United Kingdom), | 7.75 | % | 07/31/22 | 7,492 | 7,370,080 | |||||||||||
Term Loan B-3 | 4.75 | % | 07/30/21 | 20,386 | 20,271,326 | |||||||||||
Bright Horizons Family Solutions, Inc., Term Loan B-1 | 4.25 | % | 01/30/20 | 470 | 472,230 | |||||||||||
Cinemark USA, Inc., Term Loan | 3.22 | % | 05/06/22 | 242 | 243,584 | |||||||||||
Creative Artists Agency, LLC, Term Loan | 5.50 | % | 12/17/21 | 2,642 | 2,664,867 | |||||||||||
CWGS Group, LLC, Term Loan | 5.25 | % | 02/20/20 | 6,224 | 6,252,587 | |||||||||||
Dorna Sports S.L. (Spain), Term Loan B (Acquired 04/28/14; Cost $1,779,795) | 3.95 | % | 04/30/21 | 1,780 | 1,761,997 | |||||||||||
Equinox Holdings Inc., | 5.00 | % | 01/31/20 | 4,450 | 4,458,564 | |||||||||||
Revolver Loan(d) | 0.00 | % | 02/01/18 | 1,866 | 1,679,639 | |||||||||||
Fitness International, LLC, Term Loan B | 5.50 | % | 07/01/20 | 5,818 | 5,571,990 | |||||||||||
Metro-Goldwyn-Mayer Inc., Second Lien Term Loan | 5.13 | % | 06/26/20 | 1,556 | 1,563,869 | |||||||||||
Performance Sports Group Ltd. (Canada), Term Loan | 4.00 | % | 04/15/21 | 387 | 385,863 | |||||||||||
Regal Cinemas Corp., Term Loan | 3.75 | % | 04/01/22 | 2,542 | 2,545,172 | |||||||||||
Seaworld Parks & Entertainment, Inc., | — | 05/14/20 | 3,378 | 3,247,215 | ||||||||||||
Term Loan B-3 | 4.00 | % | 05/14/20 | 1,176 | 1,167,608 | |||||||||||
Six Flags Theme Parks, Inc., Term Loan B | 3.50 | % | 06/30/22 | 1,316 | 1,319,763 | |||||||||||
US FinCo LLC, Term Loan B | 4.00 | % | 05/29/20 | 256 | 254,703 | |||||||||||
| 61,231,057 | ||||||||||||||||
| Lodging & Casinos–3.07% | ||||||||||||||||
Belmond Interfin Ltd. (Bermuda), Term Loan | 4.00 | % | 03/21/21 | 2,399 | 2,392,070 | |||||||||||
Caesars Growth Properties Holdings, LLC, Term Loan B | 6.25 | % | 05/08/21 | 6,985 | 6,123,249 | |||||||||||
Cannery Casino Resorts, LLC, First Lien Term Loan | 6.00 | % | 10/02/18 | 4,494 | 4,460,032 | |||||||||||
ESH Hospitality, Inc., Term Loan | 5.00 | % | 06/24/19 | 3,771 | 3,811,177 | |||||||||||
Four Seasons Holdings Inc. (Canada), | 3.50 | % | 06/27/20 | 3,230 | 3,213,475 | |||||||||||
Second Lien Term Loan | 6.25 | % | 12/27/20 | 485 | 486,819 | |||||||||||
Harrah’s Operating Co., Inc., Term Loan B-6(f) | 1.50 | % | 03/01/17 | 11,423 | 10,921,727 | |||||||||||
Hilton Worldwide Finance, LLC, Term Loan | 3.50 | % | 10/26/20 | 9,266 | 9,266,182 | |||||||||||
La Quinta Intermediate Holdings LLC, Term Loan | 3.75 | % | 04/14/21 | 7,624 | 7,620,740 | |||||||||||
Scientific Games International, Inc., Term Loan | 6.00 | % | 10/18/20 | 17,368 | 17,216,525 | |||||||||||
Twin River Management Group, Inc., Term Loan | 5.25 | % | 07/10/20 | 6,231 | 6,243,128 | |||||||||||
| 71,755,124 | ||||||||||||||||
See accompanying Notes to Financial Statements which are an integral part of the financial statements.
19 Invesco Floating Rate Fund
| Interest Rate | Maturity Date | Principal Amount (000)* | Value | |||||||||||||
| Nonferrous Metals & Minerals–0.69% | ||||||||||||||||
Arch Coal, Inc., Term Loan | 6.25 | % | 05/16/18 | $ | 9,570 | $ | 5,201,243 | |||||||||
Dynacast International LLC, | 4.50 | % | 01/28/22 | 1,986 | 1,983,239 | |||||||||||
Second Lien Term Loan | 9.50 | % | 01/30/23 | 848 | 846,411 | |||||||||||
EP Minerals, LLC, Term Loan | 5.50 | % | 08/20/20 | 878 | 878,298 | |||||||||||
Novelis Inc., Term Loan | 4.00 | % | 06/02/22 | 7,224 | 7,153,271 | |||||||||||
| 16,062,462 | ||||||||||||||||
| Oil & Gas–5.19% | ||||||||||||||||
American Energy — Marcellus, LLC, | 5.25 | % | 08/04/20 | 5,037 | 3,036,518 | |||||||||||
Second Lien Term Loan | 8.50 | % | 08/04/21 | 999 | 283,156 | |||||||||||
Ameriforge Group Inc., First Lien Term Loan | 5.00 | % | 12/19/19 | 68 | 49,460 | |||||||||||
Bronco Midstream Funding, LLC, Term Loan | 5.00 | % | 08/15/20 | 6,136 | 5,920,911 | |||||||||||
CITGO Holding Inc., Term Loan | 9.50 | % | 05/12/18 | 11,891 | 11,955,418 | |||||||||||
CJ Holding Co., | — | 03/23/20 | 334 | 272,833 | ||||||||||||
Term Loan B-2 | 7.25 | % | 03/24/22 | 2,761 | 2,215,780 | |||||||||||
Crestwood Holdings LLC, Term Loan B-1 | 7.00 | % | 06/19/19 | 3,945 | 3,648,910 | |||||||||||
Drillships Financing Holding Inc., Term Loan B-1 | 6.00 | % | 03/31/21 | 16,871 | 12,197,912 | |||||||||||
Drillships Ocean Ventures, Inc., Term Loan | 5.50 | % | 07/25/21 | 6,980 | 5,444,743 | |||||||||||
EMG Utica, LLC, Term Loan | 4.75 | % | 03/27/20 | 2,584 | 2,480,425 | |||||||||||
Fieldwood Energy LLC, | 8.38 | % | 09/30/20 | 16,993 | 6,542,176 | |||||||||||
Term Loan | 3.88 | % | 09/28/18 | 1,365 | 1,205,177 | |||||||||||
Floatel International Ltd., Term Loan | 6.00 | % | 06/27/20 | 6,610 | 4,759,028 | |||||||||||
Glenn Pool Oil & Gas Trust I, Term Loan | 4.50 | % | 05/02/16 | 253 | 252,763 | |||||||||||
HGIM Corp., Term Loan B | 5.50 | % | 06/18/20 | 9,137 | 6,468,408 | |||||||||||
Jonah Energy LLC, Second Lien Term Loan | 7.50 | % | 05/12/21 | 4,220 | 3,544,430 | |||||||||||
McDermott International, Inc., Term Loan | 5.25 | % | 04/16/19 | 1,476 | 1,472,392 | |||||||||||
NGPL PipeCo LLC, Term Loan | 6.75 | % | 09/15/17 | 4,529 | 4,098,524 | |||||||||||
Obsidian Natural Gas Trust (United Kingdom), Term Loan | 7.00 | % | 11/02/15 | 118 | 118,209 | |||||||||||
Osum Productions Corp. (Canada), Term Loan | 6.50 | % | 07/28/20 | 3,472 | 2,846,683 | |||||||||||
Pacific Drilling S.A. (Luxembourg), Term Loan | 4.50 | % | 06/03/18 | 2,532 | 1,852,458 | |||||||||||
Paragon Offshore Finance Co. (Cayman Islands), Term Loan | 3.75 | % | 07/18/21 | 2,538 | 1,488,048 | |||||||||||
Petroleum GEO-Services ASA, Term Loan | 3.25 | % | 03/19/21 | 6,856 | 5,772,246 | |||||||||||
Samchully Midstream 3 LLC, Term Loan | 5.75 | % | 10/20/21 | 3,227 | 3,162,516 | |||||||||||
Samson Investment Co., Second Lien Term Loan | 5.00 | % | 09/25/18 | 10,513 | 1,655,775 | |||||||||||
Seadrill Operating LP, Term Loan | 4.00 | % | 02/21/21 | 26,831 | 18,499,705 | |||||||||||
Seventy Seven Operating LLC, Term Loan | 3.75 | % | 06/25/21 | 2,434 | 2,088,528 | |||||||||||
Southcross Energy Partners, L.P., Term Loan | 5.25 | % | 08/04/21 | 1,883 | 1,817,236 | |||||||||||
Targa Resources Corp., Term Loan | 5.75 | % | 02/25/22 | 970 | 974,469 | |||||||||||
Veresen Midstream US LLC, Term Loan B-1 | 5.25 | % | 03/31/22 | 5,372 | 5,388,105 | |||||||||||
| 121,512,942 | ||||||||||||||||
| Publishing–2.19% | ||||||||||||||||
Chesapeake US Holdings Inc., | 4.25 | % | 09/30/20 | 1,555 | 1,539,631 | |||||||||||
Term Loan B | 4.25 | % | 09/30/20 | 3,315 | 3,283,365 | |||||||||||
Term Loan C | 4.25 | % | 09/30/20 | 2,129 | 2,110,365 | |||||||||||
Getty Images, Inc., | 0.00 | % | 10/18/17 | 6,893 | 5,342,298 | |||||||||||
Term Loan | 4.75 | % | 10/18/19 | 7,058 | 4,527,040 | |||||||||||
See accompanying Notes to Financial Statements which are an integral part of the financial statements.
20 Invesco Floating Rate Fund
| Interest Rate | Maturity Date | Principal Amount (000)* | Value | |||||||||||||
| Publishing–(continued) | ||||||||||||||||
Interactive Data Corp., Term Loan | 4.75 | % | 05/02/21 | $ | 308 | $ | 308,205 | |||||||||
MediMedia USA, Inc., First Lien Term Loan | 7.50 | % | 11/20/18 | 2,521 | 2,460,800 | |||||||||||
Merrill Communications LLC, Term Loan | 6.25 | % | 06/01/22 | 6,430 | 6,422,054 | |||||||||||
Newsday, LLC, Term Loan | 3.70 | % | 10/12/16 | 4,979 | 4,985,380 | |||||||||||
ProQuest LLC, Term Loan | 5.25 | % | 10/24/21 | 4,871 | 4,886,324 | |||||||||||
Southern Graphics Inc., Term Loan | 4.25 | % | 10/17/19 | 3,348 | 3,322,651 | |||||||||||
Tribune Media Co., Term Loan B | 3.75 | % | 12/27/20 | 12,172 | 12,140,111 | |||||||||||
| 51,328,224 | ||||||||||||||||
| Radio & Television–2.28% | ||||||||||||||||
Block Communications, Inc., Term Loan B | 4.00 | % | 11/07/21 | 1,161 | 1,166,910 | |||||||||||
Gray Television, Inc., Term Loan | 3.75 | % | 06/10/21 | 3,131 | 3,133,172 | |||||||||||
iHeartCommunications, Inc., |
| |||||||||||||||
Term Loan D | 6.95 | % | 01/30/19 | 8,709 | 7,718,300 | |||||||||||
Term Loan E | 7.70 | % | 07/30/19 | 38,655 | 34,628,205 | |||||||||||
Media General Inc., Term Loan B | 4.00 | % | 07/31/20 | 5,498 | 5,500,548 | |||||||||||
Sinclair Television Group Inc., Incremental Term Loan B-1 | 3.50 | % | 07/30/21 | 1,317 | 1,304,136 | |||||||||||
| 53,451,271 | ||||||||||||||||
| Retailers (except Food & Drug)–5.18% | ||||||||||||||||
Bass Pro Group, LLC, Term Loan | 4.00 | % | 06/05/20 | 1,624 | 1,620,134 | |||||||||||
David’s Bridal, Inc., |
| |||||||||||||||
Asset-Based Revolver Loan(d) | 0.00 | % | 10/11/17 | 1,573 | 1,431,139 | |||||||||||
Term Loan | 5.25 | % | 10/11/19 | 2,397 | 2,296,030 | |||||||||||
Eyemart Express, LLC, Term Loan B | 5.00 | % | 12/18/21 | 131 | 131,484 | |||||||||||
Fullbeauty Brands, LLC, First Lien Term Loan | 4.75 | % | 03/18/21 | 5,220 | 5,213,437 | |||||||||||
Hudson’s Bay Company (Canada), Term Loan(c) | — | 01/01/22 | 2,826 | 2,835,023 | ||||||||||||
J. Crew Group, Inc., Term Loan | 4.00 | % | 03/05/21 | 12,878 | 10,048,422 | |||||||||||
J.C. Penney Corp., Inc., Term Loan | 5.00 | % | 06/20/19 | 3,578 | 3,571,491 | |||||||||||
Jill Holdings LLC, Term Loan | 6.00 | % | 05/08/22 | 1,948 | 1,951,585 | |||||||||||
Kirk Beauty One GmbH (Germany), | ||||||||||||||||
Term Loan B-1(c) | — | 08/13/22 | EUR | 211 | 237,701 | |||||||||||
Term Loan B-2(c) | — | 08/13/22 | EUR | 129 | 144,842 | |||||||||||
Term Loan B-3(c) | — | 08/13/22 | EUR | 220 | 248,330 | |||||||||||
Term Loan B-4(c) | — | 08/13/22 | EUR | 146 | 164,869 | |||||||||||
Term Loan B-5(c) | — | 08/13/22 | EUR | 33 | 36,637 | |||||||||||
Term Loan B-6(c) | — | 08/13/22 | EUR | 168 | 189,127 | |||||||||||
Term Loan B-7(c) | — | 08/13/22 | EUR | 93 | 104,696 | |||||||||||
Lands’ End, Inc., Term Loan B | 4.25 | % | 04/04/21 | 4,857 | 4,592,706 | |||||||||||
Leonardo Acquisition Corp., Term Loan | 4.25 | % | 01/31/21 | 228 | 227,789 | |||||||||||
Men’s Wearhouse, Inc. (The), Term Loan B | 4.50 | % | 06/18/21 | 6,246 | 6,266,381 | |||||||||||
Michaels Stores, Inc., Term Loan B | 3.75 | % | 01/28/20 | 352 | 352,038 | |||||||||||
National Vision, Inc., |
| |||||||||||||||
First Lien Term Loan | 4.00 | % | 03/12/21 | 5,859 | 5,729,435 | |||||||||||
Second Lien Term Loan | 6.75 | % | 03/11/22 | 132 | 129,993 | |||||||||||
Nine West Holdings, Inc., Term Loan | 4.75 | % | 10/08/19 | 3,545 | 2,840,341 | |||||||||||
Payless, Inc., |
| |||||||||||||||
Second Lien Term Loan | 8.50 | % | 03/11/22 | 2,178 | 1,878,212 | |||||||||||
Term Loan | 5.00 | % | 03/11/21 | 7,661 | 6,971,676 | |||||||||||
Pep Boys — Manny, Moe & Jack, Term Loan | 4.25 | % | 10/11/18 | 1,100 | 1,100,967 | |||||||||||
PetSmart, Inc., Term Loan B-1 | 4.25 | % | 03/11/22 | 4,454 | 4,454,003 | |||||||||||
Pier 1 Imports (U.S.), Inc., Term Loan | 4.50 | % | 04/30/21 | 2,676 | 2,661,164 | |||||||||||
See accompanying Notes to Financial Statements which are an integral part of the financial statements.
21 Invesco Floating Rate Fund
| Interest Rate | Maturity Date | Principal Amount (000)* | Value | |||||||||||||
| Retailers (except Food & Drug)–(continued) | ||||||||||||||||
Savers Inc., Term Loan | 5.00 | % | 07/09/19 | $ | 4,262 | $ | 3,993,144 | |||||||||
Sears Roebuck Acceptance Corp., Term Loan | 5.50 | % | 06/30/18 | 24,737 | 24,458,389 | |||||||||||
Staples, Inc., Term Loan(c) | — | 01/01/21 | 7,079 | 7,059,124 | ||||||||||||
Toys ‘R’ US Property Co. I, LLC, Term Loan | 6.00 | % | 08/21/19 | 13,584 | 12,644,393 | |||||||||||
Toys ‘R’ US-Delaware, Inc., |
| |||||||||||||||
Canadian Term Loan A-1 | 8.25 | % | 10/24/19 | 1,745 | 1,746,292 | |||||||||||
Term Loan A-1 | 8.25 | % | 10/24/19 | 2,164 | 2,165,402 | |||||||||||
Term Loan B-2 | 5.25 | % | 05/25/18 | 95 | 73,769 | |||||||||||
Term Loan B-3 | 5.25 | % | 05/25/18 | 27 | 21,327 | |||||||||||
Wilton Brands LLC, Term Loan B | 8.50 | % | 08/30/18 | 1,658 | 1,629,943 | |||||||||||
| 121,221,435 | ||||||||||||||||
| Steel–0.13% | ||||||||||||||||
TMS International Corp., Term Loan B | 4.50 | % | 10/16/20 | 3,168 | 3,093,087 | |||||||||||
| Surface Transport–0.58% | ||||||||||||||||
Hertz Corp. (The), LOC (Acquired 03/14/11; Cost $546,565) | 3.75 | % | 03/11/18 | 552 | 547,107 | |||||||||||
Kenan Advantage Group, Inc., | ||||||||||||||||
Canadian Term Loan | 4.00 | % | 07/31/22 | 242 | 241,858 | |||||||||||
Delayed Draw Term Loan 1(d) | 0.00 | % | 01/31/17 | 106 | 105,895 | |||||||||||
Term Loan | 4.00 | % | 07/31/22 | 759 | 758,259 | |||||||||||
Navios Partners Finance (US) Inc., Term Loan | 5.25 | % | 06/27/18 | 317 | 317,459 | |||||||||||
PODS Holding, LLC, | ||||||||||||||||
First Lien Term Loan | 4.50 | % | 02/02/22 | 1,422 | 1,425,357 | |||||||||||
Second Lien Term Loan | 9.25 | % | 02/02/23 | 1,276 | 1,299,869 | |||||||||||
Stena International S.A. (Luxembourg), Term Loan | 4.00 | % | 03/03/21 | 4,639 | 4,190,902 | |||||||||||
U.S. Shipping Corp., Term Loan B-2 | 5.25 | % | 06/26/21 | 3,865 | 3,871,807 | |||||||||||
Vouvray US Finance LLC, Term Loan | 5.00 | % | 06/27/21 | 930 | 932,714 | |||||||||||
| 13,691,227 | ||||||||||||||||
| Telecommunications–6.40% | ||||||||||||||||
Avaya Inc., | ||||||||||||||||
Term Loan B-6 | 6.50 | % | 03/30/18 | 11,451 | 10,778,635 | |||||||||||
Term Loan B-7 | 6.25 | % | 05/29/20 | 12,456 | 10,770,372 | |||||||||||
Communications Sales & Leasing, Inc., Term Loan | 5.00 | % | 10/24/22 | 8,898 | 8,530,905 | |||||||||||
Consolidated Communications, Inc., Term Loan | 4.25 | % | 12/23/20 | 6,648 | 6,641,628 | |||||||||||
Eircom Finco S.a.r.l. (Ireland), Term Loan B-3 | 4.50 | % | 05/31/22 | EUR | 2,737 | 3,042,583 | ||||||||||
Fairpoint Communications, Inc., Term Loan | 7.50 | % | 02/14/19 | 9,956 | 10,007,686 | |||||||||||
Hargray Communications Group, Inc., Term Loan | 5.25 | % | 06/26/19 | 2,938 | 2,950,723 | |||||||||||
Level 3 Communications, Inc., | ||||||||||||||||
Term Loan B | 4.00 | % | 01/15/20 | 17,059 | 17,077,441 | |||||||||||
Term Loan B-II | 3.50 | % | 05/31/22 | 25,933 | 25,714,399 | |||||||||||
Term Loan B-III | 4.00 | % | 08/01/19 | 428 | 428,653 | |||||||||||
LTS Buyer LLC, Second Lien Term Loan | 8.00 | % | 04/12/21 | 82 | 82,481 | |||||||||||
Nextgen Finance, LLC, Term Loan B | 5.00 | % | 05/31/21 | 5,425 | 4,774,159 | |||||||||||
NTELOS Inc., Term Loan B | 5.75 | % | 11/09/19 | 6,534 | 6,525,920 | |||||||||||
SBA Senior Finance II LLC, Incremental Term Loan B-2 | 3.25 | % | 06/10/22 | 469 | 463,519 | |||||||||||
Syniverse Holdings, Inc., | ||||||||||||||||
Term Loan | 4.00 | % | 04/23/19 | 5,500 | 5,108,125 | |||||||||||
Term Loan | 4.00 | % | 04/23/19 | 9,263 | 8,591,585 | |||||||||||
Telesat LLC, Term Loan B-2 | 3.50 | % | 03/28/19 | 1,253 | 1,247,289 | |||||||||||
U.S. Telepacific Corp., Term Loan | 6.00 | % | 11/25/20 | 7,230 | 7,245,447 | |||||||||||
XO Communications, LLC, Term Loan | 4.25 | % | 03/17/21 | 1,404 | 1,398,300 | |||||||||||
See accompanying Notes to Financial Statements which are an integral part of the financial statements.
22 Invesco Floating Rate Fund
| Interest Rate | Maturity Date | Principal Amount (000)* | Value | |||||||||||||
| Telecommunications–(continued) | ||||||||||||||||
Yankee Cable Acquisition, LLC, Term Loan | 4.25 | % | 03/01/20 | $ | 565 | $ | 565,223 | |||||||||
Zayo Group, LLC, Term Loan | 3.75 | % | 05/06/21 | 17,814 | 17,740,075 | |||||||||||
| 149,685,148 | ||||||||||||||||
| Utilities–4.19% | ||||||||||||||||
Aria Energy Operating LLC, Term Loan | 5.00 | % | 05/27/22 | 1,729 | 1,720,244 | |||||||||||
Calpine Construction Finance Co., L.P., | ||||||||||||||||
Term Loan B-1 | 3.00 | % | 05/03/20 | 1,000 | 981,000 | |||||||||||
Term Loan B-2 | 3.25 | % | 01/31/22 | 14,129 | 13,861,029 | |||||||||||
Calpine Corp., | ||||||||||||||||
Term Loan | 3.50 | % | 05/27/22 | 5,941 | 5,878,530 | |||||||||||
Term Loan B | 4.00 | % | 10/30/20 | 8,217 | 8,214,281 | |||||||||||
Dynegy Inc., Term Loan B-2 | 4.00 | % | 04/23/20 | 7,071 | 7,070,266 | |||||||||||
Energy Future Intermediate Holding Co. LLC, DIP Term Loan | 4.25 | % | 06/19/16 | 2,516 | 2,520,110 | |||||||||||
Granite Acquisition, Inc., | ||||||||||||||||
First Lien Term Loan B | 5.00 | % | 12/19/21 | 9,829 | 9,849,955 | |||||||||||
First Lien Term Loan C | 5.00 | % | 12/19/21 | 432 | 433,395 | |||||||||||
Second Lien Term Loan B | 8.25 | % | 12/19/22 | 1,757 | 1,764,597 | |||||||||||
NSG Holdings LLC, Term Loan | 3.75 | % | 12/11/19 | 821 | 815,425 | |||||||||||
Southeast PowerGen LLC, Term Loan B | 4.50 | % | 12/02/21 | 1,867 | 1,879,165 | |||||||||||
Texas Competitive Electric Holdings Co. LLC, | ||||||||||||||||
DIP Revolver Loan(d) | 0.00 | % | 05/05/16 | 26,667 | 26,506,400 | |||||||||||
Term Loan(f) | 4.67 | % | 10/10/17 | 5,116 | 2,336,973 | |||||||||||
TPF II Power, LLC, Term Loan | 5.50 | % | 10/02/21 | 9,339 | 9,369,787 | |||||||||||
USIC Holding, Inc., First Lien Term Loan | 4.00 | % | 07/10/20 | 4,829 | 4,799,022 | |||||||||||
| 98,000,179 | ||||||||||||||||
Total Variable Rate Senior Loan Interests | 2,076,370,006 | |||||||||||||||
Bonds and Notes–5.81% | ||||||||||||||||
| Aerospace & Defense–0.17% | ||||||||||||||||
LMI Aerospace, Inc.(g) | 7.38 | % | 07/15/19 | 4,076 | 3,953,720 | |||||||||||
| Business Equipment & Services–0.19% | ||||||||||||||||
ADT Corp. (The) | 6.25 | % | 10/15/21 | 2,222 | 2,305,325 | |||||||||||
First Data Corp.(g) | 6.75 | % | 11/01/20 | 1,977 | 2,085,735 | |||||||||||
| 4,391,060 | ||||||||||||||||
| Cable & Satellite Television–0.50% | ||||||||||||||||
Altice Financing SA (Luxembourg)(g) | 6.63 | % | 02/15/23 | 851 | 851,000 | |||||||||||
Charter Communications Operating LLC(g) | 4.91 | % | 07/23/25 | 2,038 | 2,023,506 | |||||||||||
UPC Broadband Holdings, B.V. (Netherlands)(g) | 7.25 | % | 11/15/21 | 967 | 1,039,095 | |||||||||||
UPC Broadband Holdings, B.V. (Netherlands)(g) | 6.88 | % | 01/15/22 | 156 | 167,782 | |||||||||||
Virgin Media Investment Holdings Ltd. (United Kingdom)(g) | 5.50 | % | 01/15/25 | GBP | 3,015 | 4,672,783 | ||||||||||
YPSO Holding SA (France)(g) | 5.63 | % | 05/15/24 | EUR | 1,000 | 1,148,735 | ||||||||||
Ziggo B.V. (Netherlands)(g) | 7.13 | % | 05/15/24 | EUR | 1,400 | 1,719,267 | ||||||||||
| 11,622,168 | ||||||||||||||||
| Chemicals & Plastics–0.35% | ||||||||||||||||
Chemours Co. (The)(g) | 6.63 | % | 05/15/23 | 1,010 | 883,750 | |||||||||||
Hexion Specialty Chemicals, Inc. | 6.63 | % | 04/15/20 | 7,205 | 6,736,675 | |||||||||||
Ineos Holdings Ltd.(g) | 6.13 | % | 08/15/18 | 615 | 618,075 | |||||||||||
| 8,238,500 | ||||||||||||||||
See accompanying Notes to Financial Statements which are an integral part of the financial statements.
23 Invesco Floating Rate Fund
| Interest Rate | Maturity Date | Principal Amount (000)* | Value | |||||||||||||
| Clothing & Textiles–0.02% | ||||||||||||||||
SMCP S.A.S. (France)(g) | 8.88 | % | 06/15/20 | EUR 350 | $ | 422,209 | ||||||||||
| Containers & Glass Products–0.30% | ||||||||||||||||
Ardagh Glass Finance PLC(g) | 6.25 | % | 01/31/19 | $ | 1,631 | 1,671,775 | ||||||||||
Ardagh Glass Finance PLC(g) | 7.00 | % | 11/15/20 | 151 | 153,683 | |||||||||||
Ardagh Glass Finance PLC(g) | 6.00 | % | 06/30/21 | 375 | 374,062 | |||||||||||
Ardagh Glass Finance PLC(g) | 4.25 | % | 01/15/22 | EUR | 1,000 | 1,128,592 | ||||||||||
Reynolds Group Holdings Inc. | 9.88 | % | 08/15/19 | 561 | 591,154 | |||||||||||
Reynolds Group Holdings Inc. | 5.75 | % | 10/15/20 | 2,901 | 3,006,161 | |||||||||||
| 6,925,427 | ||||||||||||||||
| Electronics & Electrical–0.25% | ||||||||||||||||
Blackboard Inc.(g) | 7.75 | % | 11/15/19 | 4,194 | 3,785,085 | |||||||||||
Blue Coat Holdings, Inc.(g) | 8.38 | % | 06/01/23 | 2,044 | 2,064,440 | |||||||||||
| 5,849,525 | ||||||||||||||||
| Financial Intermediaries–0.30% | ||||||||||||||||
Cabot Financial S.A. (Luxembourg)(g) | 6.50 | % | 04/01/21 | GBP | 3,000 | 4,531,226 | ||||||||||
Garfunkelux Holdco 3 SA (Luxembourg)(g) | 7.50 | % | 08/01/22 | EUR | 2,220 | 2,503,630 | ||||||||||
| 7,034,856 | ||||||||||||||||
| Food Products–0.05% | ||||||||||||||||
Chiquita Brands LLC | 7.88 | % | 02/01/21 | 190 | 202,825 | |||||||||||
Onex Wizard US Acquisition Inc.(g) | 7.75 | % | 02/15/23 | EUR | 750 | 870,733 | ||||||||||
| 1,073,558 | ||||||||||||||||
| Forest Products–0.02% | ||||||||||||||||
Verso Paper Holdings LLC | 11.75 | % | 01/15/19 | 1,626 | 481,702 | |||||||||||
| Health Care–0.79% | ||||||||||||||||
Care UK Health & Social Care PLC (United Kingdom)(g)(h) | 5.58 | % | 07/15/19 | GBP | 1,884 | 2,806,061 | ||||||||||
Community Health Systems, Inc. | 6.88 | % | 02/01/22 | 971 | 1,036,543 | |||||||||||
DJO Finance LLC(g) | 10.75 | % | 04/15/20 | 5,087 | 5,176,022 | |||||||||||
DJO Finance LLC(g) | 8.13 | % | 06/15/21 | 4,493 | 4,678,336 | |||||||||||
IDH Finance PLC (United Kingdom)(g)(h) | 5.57 | % | 12/01/18 | GBP | 2,000 | 3,061,328 | ||||||||||
Kinetic Concepts, Inc. | 10.50 | % | 11/01/18 | 1,764 | 1,856,610 | |||||||||||
| 18,614,900 | ||||||||||||||||
| Industrial Equipment–0.10% | ||||||||||||||||
Galapagos Holding S.A. (Luxembourg)(g)(h) | 4.74 | % | 06/15/21 | EUR | 2,225 | 2,391,920 | ||||||||||
| Insurance–0.16% | ||||||||||||||||
Domestic & General Group Ltd. (United Kingdom)(g)(h) | 5.59 | % | 11/15/19 | GBP | 2,450 | 3,759,525 | ||||||||||
| Leisure Goods, Activities & Movies–0.20% | ||||||||||||||||
Carmike Cinemas, Inc.(g) | 6.00 | % | 06/15/23 | 1,019 | 1,044,475 | |||||||||||
Corleone Capital Ltd. (United Kingdom)(g)(h) | 4.98 | % | 08/01/18 | EUR | 3,240 | 3,603,046 | ||||||||||
| 4,647,521 | ||||||||||||||||
| Lodging & Casinos–0.04% | ||||||||||||||||
ESH Hospitality, Inc.(g) | 5.25 | % | 05/01/25 | 1,019 | 990,977 | |||||||||||
| Nonferrous Metals & Minerals–0.11% | ||||||||||||||||
TiZir Ltd. (United Kingdom) | 9.00 | % | 09/28/17 | 3,600 | 2,592,000 | |||||||||||
See accompanying Notes to Financial Statements which are an integral part of the financial statements.
24 Invesco Floating Rate Fund
| Interest Rate | Maturity Date | Principal Amount (000)* | Value | |||||||||||||
| Oil & Gas–0.39% | ||||||||||||||||
Drill Rigs Holdings Inc.(g) | 6.50 | % | 10/01/17 | $ | 7,256 | $ | 5,478,280 | |||||||||
FTS International, Inc.(g)(h) | 7.78 | % | 06/15/20 | 2,012 | 1,520,235 | |||||||||||
Pacific Drilling S.A. (Luxembourg)(g) | 5.38 | % | 06/01/20 | 2,798 | 2,013,497 | |||||||||||
Seventy Seven Operating LLC(g) | 6.50 | % | 07/15/22 | 236 | 105,020 | |||||||||||
| 9,117,032 | ||||||||||||||||
| Radio & Television–0.05% | ||||||||||||||||
Sinclair Television Group, Inc. | 6.38 | % | 11/01/21 | 1,208 | 1,238,200 | |||||||||||
| Retailers (except Food & Drug)–0.78% | ||||||||||||||||
Claire’s Stores Inc.(g) | 9.00 | % | 03/15/19 | 2,952 | 2,527,650 | |||||||||||
Claire’s Stores Inc.(g) | 6.13 | % | 03/15/20 | 1,210 | 961,950 | |||||||||||
Guitar Center, Inc.(g) | 6.50 | % | 04/15/19 | 6,547 | 6,162,364 | |||||||||||
Matalan (United Kingdom)(g) | 6.88 | % | 06/01/19 | GBP | 2,500 | 3,624,873 | ||||||||||
New Look PLC (United Kingdom)(g)(h) | 4.48 | % | 07/01/22 | EUR | 1,000 | 1,106,573 | ||||||||||
New Look PLC (United Kingdom)(g) | 8.00 | % | 07/01/23 | GBP | 2,725 | 4,003,798 | ||||||||||
| 18,387,208 | ||||||||||||||||
| Telecommunications–0.90% | ||||||||||||||||
Avaya Inc.(g) | 7.00 | % | 04/01/19 | 2,320 | 2,088,180 | |||||||||||
Goodman Networks Inc. | 12.13 | % | 07/01/18 | 7,708 | 2,967,580 | |||||||||||
Softbank Corp. (Japan)(g) | 4.75 | % | 07/30/25 | EUR | 3,000 | 3,389,007 | ||||||||||
Wind Telecomunicazioni S.p.A. (Italy)(g) | 6.50 | % | 04/30/20 | 256 | 270,720 | |||||||||||
Wind Telecomunicazioni S.p.A. (Italy)(g) | 7.00 | % | 04/23/21 | EUR | 3,950 | 4,654,120 | ||||||||||
Wind Telecomunicazioni S.p.A. (Italy)(g) | 7.38 | % | 04/23/21 | 1,422 | 1,457,550 | |||||||||||
Windstream Corp. | 7.50 | % | 06/01/22 | 1,484 | 1,179,780 | |||||||||||
Windstream Corp. | 6.38 | % | 08/01/23 | 17 | 12,644 | |||||||||||
Zayo Group, LLC(g) | 6.38 | % | 05/15/25 | 5,089 | 5,025,387 | |||||||||||
| 21,044,968 | ||||||||||||||||
| Utilities–0.14% | ||||||||||||||||
Calpine Corp.(g) | 6.00 | % | 01/15/22 | 807 | 867,525 | |||||||||||
Calpine Corp.(g) | 7.88 | % | 01/15/23 | — | 280 | |||||||||||
NRG Energy Inc. | 6.25 | % | 07/15/22 | 1,579 | 1,549,394 | |||||||||||
NRG Energy Inc. | 6.63 | % | 03/15/23 | 880 | 875,600 | |||||||||||
| 3,292,799 | ||||||||||||||||
Total Bonds and Notes | 136,069,775 | |||||||||||||||
Structured Products–5.03% | ||||||||||||||||
Apidos Cinco CDO(g)(h) | 4.56 | % | 05/14/20 | 345 | 344,730 | |||||||||||
Apidos CLO IX(g)(h) | 6.39 | % | 07/15/23 | 3,032 | 3,038,352 | |||||||||||
Apidos CLO X(g)(h) | 6.53 | % | 10/30/22 | 2,190 | 2,195,394 | |||||||||||
Apidos CLO X(g)(h) | 6.55 | % | 10/30/22 | 3,367 | 3,375,293 | |||||||||||
Apidos CLO XI(g)(h) | 5.42 | % | 01/17/23 | 1,181 | 1,104,295 | |||||||||||
Apidos CLO XV(g)(h) | 4.92 | % | 10/20/25 | 6,500 | 5,909,391 | |||||||||||
Apidos Quattro CDO(g)(h) | 3.89 | % | 01/20/19 | 272 | 270,839 | |||||||||||
Ares XI CLO Ltd(g)(h) | 6.29 | % | 10/11/21 | 1,002 | 1,005,145 | |||||||||||
Atrium X LLC(g)(h) | 4.79 | % | 07/16/25 | 3,742 | 3,341,647 | |||||||||||
Babson CLO Ltd. 2007-I(g)(h) | 3.54 | % | 01/18/21 | 1,034 | 1,012,378 | |||||||||||
Babson CLO Ltd. 2013-II(g)(h) | 4.79 | % | 01/18/25 | 6,540 | 5,789,162 | |||||||||||
Carlyle Global Market Strategies CLO 2012-3(g)(h) | 5.79 | % | 10/04/24 | 3,188 | 3,156,643 | |||||||||||
Carlyle Global Market Strategies CLO 2013-1(g)(h) | 5.81 | % | 02/14/25 | 3,200 | 3,044,323 | |||||||||||
Carlyle High Yield Partners 2007-10(g)(h) | 3.37 | % | 04/19/22 | 2,000 | 1,912,586 | |||||||||||
See accompanying Notes to Financial Statements which are an integral part of the financial statements.
25 Invesco Floating Rate Fund
| Interest Rate | Maturity Date | Principal Amount (000)* | Value | |||||||||||||
| Structured Products–(continued) | ||||||||||||||||
Columbus Nova CLO Ltd.(g)(h) | 3.92 | % | 05/16/19 | $ | 1,093 | $ | 1,079,810 | |||||||||
Columbus Nova CLO Ltd.(g)(h) | 3.92 | % | 05/16/19 | 429 | 423,823 | |||||||||||
Dryden Senior Loan Fund 2013-30(g)(h) | 5.27 | % | 11/15/25 | 3,276 | 2,965,727 | |||||||||||
Dryden Senior Loan Fund 2014-34(g)(h) | 5.09 | % | 10/15/26 | 1,000 | 896,394 | |||||||||||
Dryden XI-Leveraged Loan CDO 2006(g)(h) | 4.19 | % | 04/12/20 | 427 | 424,483 | |||||||||||
Duane Street CLO 2007-4(g)(h) | 4.56 | % | 11/14/21 | 2,428 | 2,418,672 | |||||||||||
Flagship CLO VI(g)(h) | 5.03 | % | 06/10/21 | 3,254 | 3,253,288 | |||||||||||
Flagship CLO VI(g)(h) | 5.03 | % | 06/10/21 | 987 | 986,543 | |||||||||||
Four Corners CLO II, Ltd.(g)(h) | 2.15 | % | 01/26/20 | 310 | 305,693 | |||||||||||
Four Corners CLO II, Ltd.(g)(h) | 2.15 | % | 01/26/20 | 103 | 101,569 | |||||||||||
Gallatin Funding CLO VII 2014-1 Ltd.(g)(h) | 5.96 | % | 07/15/23 | 3,068 | 3,070,230 | |||||||||||
Halcyon Loan Investors CLO II, Ltd.(g)(h) | 3.89 | % | 04/24/21 | 917 | 890,682 | |||||||||||
Highbridge Loan Management 6-2015, Ltd.(g)(h) | 5.75 | % | 05/05/27 | 500 | 447,620 | |||||||||||
ING Investment Management CLO 2012-4, Ltd.(g)(h) | 6.04 | % | 10/15/23 | 1,861 | 1,855,553 | |||||||||||
ING Investment Management CLO 2013-1, Ltd.(g)(h) | 5.29 | % | 04/15/24 | 4,808 | 4,435,189 | |||||||||||
ING Investment Management CLO 2013-3, Ltd.(g)(h) | 4.67 | % | 01/18/26 | 2,745 | 2,441,430 | |||||||||||
ING Investment Management CLO III, Ltd.(g)(h) | 3.79 | % | 12/13/20 | 1,188 | 1,167,669 | |||||||||||
ING Investment Management CLO IV, Ltd.(g)(h) | 4.53 | % | 06/14/22 | 293 | 289,108 | |||||||||||
Keuka Park CLO 2013-1(g)(h) | 4.79 | % | 10/21/24 | 617 | 549,377 | |||||||||||
Kingsland Ltd. 2006-2(g)(h) | 4.79 | % | 04/21/21 | 1,205 | 1,197,099 | |||||||||||
KKR Financial CLO 2012-1(g)(h) | 5.68 | % | 12/15/24 | 2,100 | 2,052,149 | |||||||||||
KKR Financial CLO 2013-1(g)(h) | 5.04 | % | 07/15/25 | 2,461 | 2,173,619 | |||||||||||
Madison Park Funding II, Ltd.(g)(h) | 5.02 | % | 03/25/20 | 700 | 708,378 | |||||||||||
Madison Park Funding IV Ltd.(g)(h) | 3.88 | % | 03/22/21 | 1,344 | 1,318,425 | |||||||||||
Madison Park Funding IX, Ltd.(g)(h) | 5.52 | % | 08/15/22 | 736 | 730,284 | |||||||||||
Madison Park Funding X, Ltd.(g)(h) | 5.54 | % | 01/20/25 | 1,953 | 1,945,723 | |||||||||||
Madison Park Funding XIV, Ltd.(g)(h) | 5.04 | % | 07/20/26 | 1,350 | 1,211,752 | |||||||||||
Madison Park Funding XIV, Ltd.(g)(h) | 5.69 | % | 07/20/26 | 1,915 | 1,585,430 | |||||||||||
Magnetite CLO Ltd. 2012-6(g)(h) | 5.83 | % | 09/15/23 | 1,988 | 1,974,454 | |||||||||||
Maps CLO Fund LLC 2007-2(g)(h) | 4.54 | % | 07/20/22 | 1,685 | 1,649,910 | |||||||||||
NewStar Commercial Loan Funding 2015-1(g)(h) | 5.77 | % | 01/20/27 | 1,000 | 1,010,184 | |||||||||||
Northwoods Capital X Ltd. 2013-10A(g)(h) | 3.91 | % | 11/04/25 | 1,130 | 1,066,119 | |||||||||||
Octagon Investment Partners XIV Ltd.(g)(h) | 5.54 | % | 01/15/24 | 2,052 | 1,977,363 | |||||||||||
Octagon Investment Partners XIX Ltd.(g)(h) | 5.13 | % | 04/15/26 | 2,920 | 2,582,264 | |||||||||||
Octagon Investment Partners XVII Ltd.(g)(h) | 4.78 | % | 10/25/25 | 1,975 | 1,750,083 | |||||||||||
Octagon Investment Partners XVIII Ltd.(g)(h) | 5.57 | % | 12/16/24 | 4,442 | 4,117,814 | |||||||||||
Octagon Investment Partners XXI Ltd.(g)(h) | 6.91 | % | 11/14/26 | 3,500 | 3,471,104 | |||||||||||
Pacifica CDO VI, Ltd.(g)(h) | 4.07 | % | 08/15/21 | 565 | 541,793 | |||||||||||
Regatta IV Funding Ltd. 2014-1(g)(h) | 5.23 | % | 07/25/26 | 3,250 | 2,815,355 | |||||||||||
Seneca Park CLO Ltd.(g)(h) | 4.87 | % | 07/17/26 | 2,750 | 2,456,682 | |||||||||||
Sierra CLO II Ltd.(h) | 3.80 | % | 01/22/21 | 733 | 735,889 | |||||||||||
Silverado CLO 2006-II Ltd.(g)(h) | 4.04 | % | 10/16/20 | 886 | 850,774 | |||||||||||
Slater Mill Loan Fund, LP(g)(h) | 5.82 | % | 08/17/22 | 1,108 | 1,098,435 | |||||||||||
St. James River CLO Ltd. 2007-1(g)(h) | 4.59 | % | 06/11/21 | 481 | 475,378 | |||||||||||
Stone Tower CLO 2007-6, Ltd.(g)(h) | 3.89 | % | 04/17/21 | 1,750 | 1,721,024 | |||||||||||
Symphony CLO VIII, Ltd.(g)(h) | 6.28 | % | 01/09/23 | 1,156 | 1,159,681 | |||||||||||
Symphony CLO XI, Ltd.(g)(h) | 5.54 | % | 01/17/25 | 2,640 | 2,473,474 | |||||||||||
Symphony CLO XII Ltd.(g)(h) | 5.19 | % | 10/15/25 | 1,850 | 1,699,902 | |||||||||||
Symphony CLO XIV Ltd.(g)(h) | 4.89 | % | 07/14/26 | 2,750 | 2,439,448 | |||||||||||
TriMaran CLO VII Ltd.(g)(h) | 3.69 | % | 06/15/21 | 1,535 | 1,490,721 | |||||||||||
Voya CLO 2014-2, Ltd.(g)(h) | 4.92 | % | 07/17/26 | 1,875 | 1,666,328 | |||||||||||
Total Structured Products | 117,650,076 | |||||||||||||||
See accompanying Notes to Financial Statements which are an integral part of the financial statements.
26 Invesco Floating Rate Fund
| Shares | Value | |||||||||||
Common Stocks & Other Equity Interests–0.43%(i) | ||||||||||||
| Aerospace & Defense–0.01% | ||||||||||||
IAP Worldwide Services(g)(j) | 134 | $ | 100,432 | |||||||||
| Automotive–0.01% | ||||||||||||
Dayco Products, LLC(g)(j) | 3,266 | 129,007 | ||||||||||
Dayco Products, LLC(g) | 3,261 | 128,809 | ||||||||||
| 257,816 | ||||||||||||
| Building & Development–0.16% | ||||||||||||
Lake at Las Vegas Joint Venture, LLC, Class A (Acquired 04/28/10-07/15/10; Cost $664,569)(g)(j) | 518 | 0 | ||||||||||
Lake at Las Vegas Joint Venture, LLC, Class B (Acquired 06/30/10; | 4 | 0 | ||||||||||
Stile Acquisition Corp. (Canada)(j) | 53,093 | 3,506,793 | ||||||||||
United Subcontractors, Inc.(g)(j) | 4,840 | 145,214 | ||||||||||
| 3,652,007 | ||||||||||||
| Business Equipment & Services–0.03% | ||||||||||||
Koosharem LLC(g)(j) | 43,971 | 654,420 | ||||||||||
| Cable & Satellite Television–0.09% | ||||||||||||
ION Media Networks, Inc. | 4,471 | 2,179,165 | ||||||||||
| Chemicals & Plastics–0.00% | ||||||||||||
LyondellBasell Industries N.V.–Class A | 218 | 18,613 | ||||||||||
| Drugs–0.00% | ||||||||||||
BPA Laboratories, Class A, Wts. expiring 04/29/24 (Acquired 04/29/14; Cost $0)(g)(j) | 3,490 | 0 | ||||||||||
BPA Laboratories, Class B, Wts. expiring 04/29/24 (Acquired 04/29/14; Cost $0)(g)(j) | 5,595 | 0 | ||||||||||
| 0 | ||||||||||||
| Financial Intermediaries–0.00% | ||||||||||||
Bankruptcy Management Solutions, Inc.(g)(j) | 335 | 13,484 | ||||||||||
Bankruptcy Management Solutions, Inc., Class A, Wts. expiring 06/27/18 | 19 | 152 | ||||||||||
Bankruptcy Management Solutions, Inc., Class B, Wts. expiring 06/27/18 | 21 | 74 | ||||||||||
Bankruptcy Management Solutions, Inc., Class C, Wts. expiring 06/27/18 | 31 | 77 | ||||||||||
| 13,787 | ||||||||||||
| Food Products–0.00% | ||||||||||||
QCE LLC(g)(j) | 17 | 9 | ||||||||||
| Forest Products–0.00% | ||||||||||||
Xerium Technologies, Inc.(j) | 1,766 | 21,492 | ||||||||||
| Leisure Goods, Activities & Movies–0.00% | ||||||||||||
AMF Bowling Centers, Inc.(j) | 1,665 | 82,418 | ||||||||||
| Lodging & Casinos–0.03% | ||||||||||||
Twin River Worldwide Holdings, Inc.,(g)(j) | 18,663 | 696,746 | ||||||||||
| Publishing–0.07% | ||||||||||||
F&W Publications, Inc.(g)(j) | 288 | 24,480 | ||||||||||
Merrill Communications LLC-Class A(g)(j) | 133,776 | 1,085,860 | ||||||||||
Tribune Media Co.–Class A | 9,050 | 361,457 | ||||||||||
Tribune Publishing Co. | 2,262 | 26,669 | ||||||||||
| 1,498,466 | ||||||||||||
See accompanying Notes to Financial Statements which are an integral part of the financial statements.
27 Invesco Floating Rate Fund
| Shares | Value | |||||||||||
| Surface Transport–0.00% | ||||||||||||
U.S. Shipping Corp. (Acquired 09/28/07-09/30/09; Cost $87,805)(g)(j) | 87,805 | $ | 74,634 | |||||||||
U.S. Shipping Corp. (Acquired 09/28/07-09/30/09; Cost $0)(g)(j) | 6,189 | 62 | ||||||||||
| 74,696 | ||||||||||||
| Telecommunications–0.03% | ||||||||||||
FairPoint Communications, Inc.(j) | 44,928 | 735,022 | ||||||||||
| Utilities–0.00% | ||||||||||||
Bicent Power, LLC, Series A, Wts. expiring 08/21/22 (Acquired 08/21/12; Cost $0)(g)(j) | 101 | 0 | ||||||||||
Bicent Power, LLC, Series B, Wts. expiring 08/21/22 (Acquired 08/21/12; Cost $0)(g)(j) | 164 | 0 | ||||||||||
| 0 | ||||||||||||
Total Common Stocks & Other Equity Interests | 9,985,089 | |||||||||||
Preferred Stock–0.00% | ||||||||||||
| Building & Development–0.00% | ||||||||||||
United Subcontractors, Inc.(g)(j) | 4,840 | 101,650 | ||||||||||
TOTAL INVESTMENTS–100.01% (Cost $2,442,262,196) | 2,340,176,596 | |||||||||||
OTHER ASSETS LESS LIABILITIES–(0.01)% | (241,239 | ) | ||||||||||
NET ASSETS–100.00% | $ | 2,339,935,357 | ||||||||||
Investment Abbreviations:
| CDO | – Collateralized Debt Obligation | |
| CLO | – Collateralized Loan Obligation | |
| DIP | – Debtor-in-possession | |
| EUR | – Euro |
| GBP | – British Pound | |
| LOC | – Letter of Credit | |
| PIK | – Payment in Kind | |
| Wts. | – Warrants |
Notes to Schedule of Investments:
| * | Principal amounts are denominated in U.S. dollars unless otherwise noted. |
| (a) | Variable rate senior loan interests often require prepayments from excess cash flow or permit the borrower to repay at its election. The degree to which borrowers repay, whether as a contractual requirement or at their election, cannot be predicted with accuracy. As a result, the actual remaining maturity may be substantially less than the stated maturities shown. However, it is anticipated that the variable rate senior loan interests will have an expected average life of three to five years. |
| (b) | Variable rate senior loan interests are, at present, not readily marketable, not registered under the Securities Act of 1933, as amended (the “1933 Act”), and may be subject to contractual and legal restrictions on sale. Senior secured corporate loans and senior secured debt securities in the Fund’s portfolio generally have variable rates which adjust to a base, such as the London Inter-Bank Offered Rate (“LIBOR”), on set dates, typically every 30 days but not greater than one year; and/or have interest rates that float at a margin above a widely recognized base lending rate such as the Prime Rate of a designated U.S. bank. |
| (c) | This floating rate interest will settle after August 31, 2015, at which time the interest rate will be determined. |
| (d) | All or a portion of this holding is subject to unfunded loan commitments. Interest rate will be determined at the time of funding. See Note 8. |
| (e) | All or a portion of this security is Payment-in-Kind. |
| Issuer | Cash Rate | PIK Rate | ||||||
Lake at Las Vegas Joint Venture LLC, Exit Revolver Loan | — | % | 5.00 | % | ||||
QCE LLC, Term Loan | — | 15.00 | ||||||
| (f) | The borrower has filed for protection in federal bankruptcy court. |
| (g) | Security purchased or received in a transaction exempt from registration under the 1933 Act. The security may be resold pursuant to an exemption from registration under the 1933 Act, typically to qualified institutional buyers. The aggregate value of these securities at August 31, 2015 was $229,506,879, which represented 9.81% of the Fund’s Net Assets. |
| (h) | Interest or dividend rate is redetermined periodically. Rate shown is the rate in effect on August 31, 2015. |
| (i) | Acquired through the restructuring of senior loans. |
| (j) | Non-income producing security. |
See accompanying Notes to Financial Statements which are an integral part of the financial statements.
28 Invesco Floating Rate Fund
Statement of Assets and Liabilities
August 31, 2015
Assets: |
| |||
Investments, at value (Cost $2,442,262,196) | $ | 2,340,176,596 | ||
Cash | 13,699,062 | |||
Foreign currencies, at value (Cost $15,394,841) | 15,243,541 | |||
Receivable for: | ||||
Investments sold | 115,671,740 | |||
Interest and fees | 16,221,868 | |||
Fund shares sold | 9,386,517 | |||
Investments matured (Cost $20,062,830) | 9,059,458 | |||
Unrealized appreciation on forward foreign currency contracts outstanding | 465,136 | |||
Investment for trustee deferred compensation and retirement plans | 150,428 | |||
Other assets | 264,253 | |||
Total assets | 2,520,338,599 | |||
Liabilities: |
| |||
Payable for: | ||||
Investments purchased | 111,032,163 | |||
Fund shares repurchased | 5,718,596 | |||
Income distributions | 2,748,934 | |||
Accrued fees to affiliates | 1,261,020 | |||
Accrued trustees’ and officers’ fees and benefits | 9,180 | |||
Trustee deferred compensation and retirement plans | 172,307 | |||
Unrealized depreciation on forward foreign currency contracts outstanding | 685,189 | |||
Unfunded loan commitments | 58,775,853 | |||
Total liabilities | 180,403,242 | |||
Net assets applicable to shares outstanding | $ | 2,339,935,357 | ||
Net assets consist of: |
| |||
Shares of beneficial interest | $ | 2,477,223,348 | ||
Undistributed net investment income | (1,026,033 | ) | ||
Undistributed net realized gain (loss) | (22,685,405 | ) | ||
Net unrealized appreciation (depreciation) | (113,576,553 | ) | ||
| $ | 2,339,935,357 | |||
Net Assets: |
| |||
Class A | $ | 850,891,338 | ||
Class C | $ | 570,096,612 | ||
Class R | $ | 11,969,060 | ||
Class Y | $ | 805,610,878 | ||
Class R5 | $ | 3,465,790 | ||
Class R6 | $ | 97,901,679 | ||
Shares outstanding, $0.01 par value per share |
| |||
Class A | 112,615,610 | |||
Class C | 75,789,655 | |||
Class R | 1,581,263 | |||
Class Y | 106,789,303 | |||
Class R5 | 458,342 | |||
Class R6 | 12,956,174 | |||
Class A: | ||||
Net asset value per share | $ | 7.56 | ||
Maximum offering price per share | ||||
(Net asset value of $7.56 ¸ 97.50%) | $ | 7.75 | ||
Class C: | ||||
Net asset value and offering price per share | $ | 7.52 | ||
Class R: | ||||
Net asset value and offering price per share | $ | 7.57 | ||
Class Y: | ||||
Net asset value and offering price per share | $ | 7.54 | ||
Class R5: | ||||
Net asset value and offering price per share | $ | 7.56 | ||
Class R6: | ||||
Net asset value and offering price per share | $ | 7.56 | ||
See accompanying Notes to Financial Statements which are an integral part of the financial statements.
29 Invesco Floating Rate Fund
Statement of Operations
For the year ended August 31, 2015
Investment income: |
| |||
Interest | $ | 132,489,859 | ||
Dividends | 778,027 | |||
Dividends from affiliated money market funds | 43,547 | |||
Other income | 2,575,385 | |||
Total investment income | 135,886,818 | |||
Expenses: | ||||
Advisory fees | 14,891,130 | |||
Administrative services fees | 492,225 | |||
Custodian fees | 419,432 | |||
Distributions fees: | ||||
Class A | 2,239,213 | |||
Class C | 4,618,160 | |||
Class R | 56,769 | |||
Interest, facilities and maintenance fees | 798,333 | |||
Transfer agent fees — A, C, R & Y | 2,514,927 | |||
Transfer agent fees — R5 | 4,294 | |||
Transfer agent fees — R6 | 1,956 | |||
Trustees’ and officers’ fees and benefits | 55,145 | |||
Other | 549,804 | |||
Total expenses | 26,641,388 | |||
Less: Fees waived and expense offset arrangement(s) | (89,057 | ) | ||
Net expenses | 26,552,331 | |||
Net investment income | 109,334,487 | |||
Realized and unrealized gain (loss): | ||||
Net realized gain (loss) from: | ||||
Investment securities | (9,546,370 | ) | ||
Foreign currencies | 468,401 | |||
| (9,077,969 | ) | |||
Change in net unrealized appreciation (depreciation) of: | ||||
Investment securities | (117,556,695 | ) | ||
Foreign currencies | (267,528 | ) | ||
Forward foreign currency contracts | (220,053 | ) | ||
| (118,044,276 | ) | |||
Net realized and unrealized gain (loss) | (127,122,245 | ) | ||
Net increase (decrease) in net assets resulting from operations | $ | (17,787,758 | ) | |
See accompanying Notes to Financial Statements which are an integral part of the financial statements.
30 Invesco Floating Rate Fund
Statement of Changes in Net Assets
For the years ended August 31, 2015 and 2014
| 2015 | 2014 | |||||||
Operations: | ||||||||
Net investment income | $ | 109,334,487 | $ | 100,606,717 | ||||
Net realized gain (loss) | (9,077,969 | ) | (2,940,982 | ) | ||||
Change in net unrealized appreciation (depreciation) | (118,044,276 | ) | 7,995,687 | |||||
Net increase (decrease) in net assets resulting from operations | (17,787,758 | ) | 105,661,422 | |||||
Distributions to shareholders from net investment income: | ||||||||
Class A | (41,201,004 | ) | (44,823,675 | ) | ||||
Class C | (25,284,497 | ) | (22,528,888 | ) | ||||
Class R | (494,668 | ) | (344,787 | ) | ||||
Class Y | (39,480,871 | ) | (31,175,753 | ) | ||||
Class R5 | (212,956 | ) | (421,837 | ) | ||||
Class R6 | (4,858,586 | ) | (3,091,977 | ) | ||||
Total distributions to shareholders from net investment income | (111,532,582 | ) | (102,386,917 | ) | ||||
Share transactions–net: | ||||||||
Class A | (126,076,413 | ) | 65,718,204 | |||||
Class C | (88,632,668 | ) | 171,360,975 | |||||
Class R | 1,411,096 | 7,601,981 | ||||||
Class Y | 46,121,653 | 251,164,235 | ||||||
Class R5 | (4,354,384 | ) | (1,196,676 | ) | ||||
Class R6 | 19,769,006 | 19,879,757 | ||||||
Net change in net assets resulting from share transactions | (151,761,710 | ) | 514,528,476 | |||||
Net increase (decrease) in net assets | (281,082,050 | ) | 517,802,981 | |||||
Net assets: | ||||||||
Beginning of year | 2,621,017,407 | 2,103,214,426 | ||||||
End of year (includes undistributed net investment income of $(1,026,033) and $(1,290,187), respectively) | $ | 2,339,935,357 | $ | 2,621,017,407 | ||||
See accompanying Notes to Financial Statements which are an integral part of the financial statements.
31 Invesco Floating Rate Fund
Statement of Cash Flows
For the year ended August 31, 2015
Cash provided by operating activities: | ||||
Net increase (decrease) in net assets resulting from operations | $ | (17,787,758 | ) | |
Adjustments to reconcile net increase in net assets to net cash provided by operating activities: |
| |||
Purchases of investments | (1,498,159,991 | ) | ||
Proceeds from sales of investments | 1,637,374,988 | |||
Net change in transactions in forward foreign currency contracts | 220,053 | |||
Increase in receivables and other assets | (1,834,256 | ) | ||
Amortization of loan fees | (1,244,570 | ) | ||
Accretion of discount on investment securities | (8,915,654 | ) | ||
Decrease in accrued expenses and other payables | (231,332 | ) | ||
Net realized loss from investment securities | 9,546,370 | |||
Net change in unrealized depreciation on investment securities | 117,556,695 | |||
Net cash provided by operating activities | 236,524,545 | |||
Cash provided by (used by) financing activities: | ||||
Dividends paid to common shareholders from net investment income | (29,222,567 | ) | ||
Proceeds from shares of beneficial interest sold | 1,087,230,900 | |||
Disbursements from shares of beneficial interest reacquired | (1,323,216,394 | ) | ||
Net cash provided (used in) by financing activities | (265,208,061 | ) | ||
Net increase (decrease) in cash and cash equivalents | (28,683,516 | ) | ||
Cash and cash equivalents at beginning of period | 57,626,119 | |||
Cash and cash equivalents at end of period | $ | 28,942,603 | ||
Non-cash financing activities: | ||||
Value of shares of beneficial interest issued in reinvestment of dividends paid to shareholders | $ | 80,812,001 | ||
Supplemental disclosure of cash flow information: | ||||
Cash paid during the period for interest, facilities and maintenance fees | $ | 770,556 | ||
Notes to Financial Statements
August 31, 2015
NOTE 1—Significant Accounting Policies
Invesco Floating Rate Fund (the “Fund”) is a series portfolio of AIM Counselor Series Trust (Invesco Counselor Series Trust) (the “Trust”). The Trust is a Delaware statutory trust registered under the Investment Company Act of 1940, as amended (the “1940 Act”), as an open-end series management investment company consisting of thirteen separate portfolios, each authorized to issue an unlimited number of shares of beneficial interest. The assets, liabilities and operations of each portfolio are accounted for separately. Information presented in these financial statements pertains only to the Fund. Matters affecting each portfolio or class will be voted on exclusively by the shareholders of such portfolio or class.
The Fund’s investment objective is total return, comprised of current income and capital appreciation.
The Fund currently consists of six different classes of shares: Class A, Class C, Class R, Class Y, Class R5 and Class R6. Class A shares are sold with a front-end sales charge unless certain waiver criteria are met and under certain circumstances load waived shares may be subject to contingent deferred sales charges (“CDSC”). Class C shares are sold with a CDSC. Class R, Class Y, Class R5 and Class R6 shares are sold at net asset value.
The following is a summary of the significant accounting policies followed by the Fund in the preparation of its financial statements.
| A. | Security Valuations — Variable rate senior loan interests are fair valued using an evaluated quote provided by an independent pricing service. Evaluated quotes provided by the pricing service may reflect appropriate factors such as ratings, tranche type, industry, company performance, spread, individual trading characteristics, institution-size trading in similar groups of securities and other market data. |
Securities, including restricted securities, are valued according to the following policy. A security listed or traded on an exchange (except convertible securities) is valued at its last sales price as of the close of the customary trading session on the exchange where the security is principally traded, or lacking any sales on a particular day, the security may be valued at the closing bid price on that day. Securities traded in the over-the-counter market (but not securities reported on the NASDAQ Stock Exchange) are valued based on the prices furnished by independent pricing services, in which case the securities may be considered fair valued, or by market makers. Each security reported on the NASDAQ Stock Exchange is valued at the NASDAQ Official Closing Price (“NOCP”) as of the close of the customary trading session on the valuation date or absent a NOCP, at the closing bid price.
Futures contracts are valued at the final settlement price set by an exchange on which they are principally traded. Listed options are valued at the mean between the last bid and the asked prices from the exchange on which they are principally traded. Options not listed on an exchange are
32 Invesco Floating Rate Fund
valued by an independent source at the mean between the last bid and asked prices. For purposes of determining net asset value (“NAV”) per share, futures and option contracts generally are valued 15 minutes after the close of the customary trading session of the New York Stock Exchange (“NYSE”).
Investments in open-end and closed-end registered investment companies that do not trade on an exchange are valued at the end-of-day net asset value per share. Investments in open-end and closed-end registered investment companies that trade on an exchange are valued at the last sales price or official closing price as of the close of the customary trading session on the exchange where the security is principally traded.
Debt obligations (including convertible securities) and unlisted equities are fair valued using an evaluated quote provided by an independent pricing service. Evaluated quotes provided by the pricing service may be determined without exclusive reliance on quoted prices, and may reflect appropriate factors such as institution-size trading in similar groups of securities, developments related to specific securities, dividend rate (for unlisted equities), yield (for debt obligations), quality, type of issue, coupon rate (for debt obligations), maturity (for debt obligations), individual trading characteristics and other market data. Debt obligations are subject to interest rate and credit risks. In addition, all debt obligations involve some risk of default with respect to interest and/or principal payments.
Swap agreements are fair valued using an evaluated quote, if available, provided by an independent pricing service. Evaluated quotes provided by the pricing service are valued based on a model which may include end-of-day net present values, spreads, ratings, industry, company performance and returns of referenced assets.
Foreign securities’ (including foreign exchange contracts) prices are converted into U.S. dollar amounts using the applicable exchange rates as of the close of the NYSE. If market quotations are available and reliable for foreign exchange-traded equity securities, the securities will be valued at the market quotations. Because trading hours for certain foreign securities end before the close of the NYSE, closing market quotations may become unreliable. If between the time trading ends on a particular security and the close of the customary trading session on the NYSE, events occur that the Adviser determines are significant and make the closing price unreliable, the Fund may fair value the security. If the event is likely to have affected the closing price of the security, the security will be valued at fair value in good faith using procedures approved by the Board of Trustees. Adjustments to closing prices to reflect fair value may also be based on a screening process of an independent pricing service to indicate the degree of certainty, based on historical data, that the closing price in the principal market where a foreign security trades is not the current value as of the close of the NYSE. Foreign securities’ prices meeting the approved degree of certainty that the price is not reflective of current value will be priced at the indication of fair value from the independent pricing service. Multiple factors may be considered by the independent pricing service in determining adjustments to reflect fair value and may include information relating to sector indices, American Depositary Receipts and domestic and foreign index futures. Foreign securities may have additional risks including exchange rate changes, potential for sharply devalued currencies and high inflation, political and economic upheaval, the relative lack of issuer information, relatively low market liquidity and the potential lack of strict financial and accounting controls and standards.
Securities for which market prices are not provided by any of the above methods may be valued based upon quotes furnished by independent sources. The last bid price may be used to value equity securities. The mean between the last bid and asked prices is used to value debt obligations, including corporate loans.
Securities for which market quotations are not readily available or became unreliable are valued at fair value as determined in good faith by or under the supervision of the Trust’s officers following procedures approved by the Board of Trustees. Issuer specific events, market trends, bid/asked quotes of brokers and information providers and other market data may be reviewed in the course of making a good faith determination of a security’s fair value.
The Fund may invest in securities that are subject to interest rate risk, meaning the risk that the prices will generally fall as interest rates rise and, conversely, the prices will generally rise as interest rates fall. Specific securities differ in their sensitivity to changes in interest rates depending on their individual characteristics. Changes in interest rates may result in increased market volatility, which may affect the value and/or liquidity of certain Fund investments.
Valuations change in response to many factors including the historical and prospective earnings of the issuer, the value of the issuer’s assets, general economic conditions, interest rates, investor perceptions and market liquidity. Because of the inherent uncertainties of valuation, the values reflected in the financial statements may materially differ from the value received upon actual sale of those investments.
| B. | Securities Transactions and Investment Income — Securities transactions are accounted for on a trade date basis. Realized gains or losses on sales are computed on the basis of specific identification of the securities sold. Interest income (net of withholding tax, if any) is recorded on the accrual basis from the settlement date. Facility fees received may be amortized over the life of the loan. Dividend income (net of withholding tax, if any) is recorded on the ex-dividend date. Bond premiums and discounts are amortized and/or accreted for financial reporting purposes. |
The Fund may periodically participate in litigation related to Fund investments. As such, the Fund may receive proceeds from litigation settlements. Any proceeds received are included in the Statement of Operations as realized gain (loss) for investments no longer held and as unrealized gain (loss) for investments still held.
Other income is comprised primarily of amendment fees which are recorded when received. Amendment fees are received in return for changes in the terms of the loan or note.
Brokerage commissions and mark ups are considered transaction costs and are recorded as an increase to the cost basis of securities purchased and/or a reduction of proceeds on a sale of securities. Such transaction costs are included in the determination of net realized and unrealized gain (loss) from investment securities reported in the Statement of Operations and the Statement of Changes in Net Assets and the net realized and unrealized gains (losses) on securities per share in the Financial Highlights. Transaction costs are included in the calculation of the Fund’s net asset value and, accordingly, they reduce the Fund’s total returns. These transaction costs are not considered operating expenses and are not reflected in net investment income reported in the Statement of Operations and the Statement of Changes in Net Assets, or the net investment income per share and the ratios of expenses and net investment income reported in the Financial Highlights, nor are they limited by any expense limitation arrangements between the Fund and the investment adviser.
The Fund allocates realized and unrealized capital gains and losses to a class based on the relative net assets of each class. The Fund allocates income to a class based on the relative value of the settled shares of each class.
| C. | Country Determination — For the purposes of making investment selection decisions and presentation in the Schedule of Investments, the investment adviser may determine the country in which an issuer is located and/or credit risk exposure based on various factors. These factors |
33 Invesco Floating Rate Fund
| include the laws of the country under which the issuer is organized, where the issuer maintains a principal office, the country in which the issuer derives 50% or more of its total revenues and the country that has the primary market for the issuer’s securities, as well as other criteria. Among the other criteria that may be evaluated for making this determination are the country in which the issuer maintains 50% or more of its assets, the type of security, financial guarantees and enhancements, the nature of the collateral and the sponsor organization. Country of issuer and/or credit risk exposure has been determined to be the United States of America, unless otherwise noted. |
| D. | Distributions — Distributions from net investment income, if any, are declared daily and paid monthly. Distributions from net realized capital gain, if any, are generally declared and paid annually and recorded on the ex-dividend date. The Fund may elect to treat a portion of the proceeds from redemptions as distributions for federal income tax purposes. |
| E. | Federal Income Taxes — The Fund intends to comply with the requirements of Subchapter M of the Internal Revenue Code of 1986, as amended (the “Internal Revenue Code”), necessary to qualify as a regulated investment company and to distribute substantially all of the Fund’s taxable earnings to shareholders. As such, the Fund will not be subject to federal income taxes on otherwise taxable income (including net realized capital gain) that is distributed to shareholders. Therefore, no provision for federal income taxes is recorded in the financial statements. |
The Fund recognizes the tax benefits of uncertain tax positions only when the position is more likely than not to be sustained. Management has analyzed the Fund’s uncertain tax positions and concluded that no liability for unrecognized tax benefits should be recorded related to uncertain tax positions. Management is not aware of any tax positions for which it is reasonably possible that the total amounts of unrecognized tax benefits will change materially in the next 12 months.
The Fund files tax returns in the U.S. Federal jurisdiction and certain other jurisdictions. Generally, the Fund is subject to examinations by such taxing authorities for up to three years after the filing of the return for the tax period.
| F. | Expenses — Fees provided for under the Rule 12b-1 plan of a particular class of the Fund are charged to the operations of such class. Transfer agency fees and expenses and other shareholder recordkeeping fees and expenses attributable to Class R5 and Class R6 are allocated to each share class based on relative net assets. Sub-accounting fees attributable to Class R5 are charged to the operations of the class. Transfer agency fees and expenses and other shareholder recordkeeping fees and expenses relating to all other classes are allocated among those classes based on relative net assets. All other expenses are allocated among the classes based on relative net assets. |
| G. | Interest, Facilities and Maintenance Fees — Interest, Facilities and Maintenance Fees include interest and related borrowing costs such as commitment fees and other expenses associated with lines of credit and interest and administrative expenses related to establishing and maintaining the credit agreement. |
| H. | Accounting Estimates — The preparation of financial statements in conformity with accounting principles generally accepted in the United States of America (“GAAP”) requires management to make estimates and assumptions that affect the reported amounts of assets and liabilities at the date of the financial statements and the reported amounts of revenues and expenses during the reporting period including estimates and assumptions related to taxation. Actual results could differ from those estimates by a significant amount. In addition, the Fund monitors for material events or transactions that may occur or become known after the period-end date and before the date the financial statements are released to print. |
| I. | Indemnifications — Under the Trust’s organizational documents, each Trustee, officer, employee or other agent of the Trust is indemnified against certain liabilities that may arise out of the performance of their duties to the Fund. Additionally, in the normal course of business, the Fund enters into contracts, including the Fund’s servicing agreements, that contain a variety of indemnification clauses. The Fund’s maximum exposure under these arrangements is unknown as this would involve future claims that may be made against the Fund that have not yet occurred. The risk of material loss as a result of such indemnification claims is considered remote. |
| J. | Cash and Cash Equivalents — For the purposes of the Statement of Cash Flows, the Fund defines Cash and Cash Equivalents as cash (including foreign currency), money market funds and other investments held in lieu of cash and excludes investments made with cash collateral received. |
| K. | Securities Purchased on a When-Issued and Delayed Delivery Basis — The Fund may purchase and sell interests in corporate loans and corporate debt securities and other portfolio securities on a when-issued and delayed delivery basis, with payment and delivery scheduled for a future date. No income accrues to the Fund on such interests or securities in connection with such transactions prior to the date the Fund actually takes delivery of such interests or securities. These transactions are subject to market fluctuations and are subject to the risk that the value at delivery may be more or less than the trade date purchase price. Although the Fund will generally purchase these securities with the intention of acquiring such securities, they may sell such securities prior to the settlement date. |
| L. | Foreign Currency Translations — Foreign currency is valued at the close of the NYSE based on quotations posted by banks and major currency dealers. Portfolio securities and other assets and liabilities denominated in foreign currencies are translated into U.S. dollar amounts at date of valuation. Purchases and sales of portfolio securities (net of foreign taxes withheld on disposition) and income items denominated in foreign currencies are translated into U.S. dollar amounts on the respective dates of such transactions. The Fund does not separately account for the portion of the results of operations resulting from changes in foreign exchange rates on investments and the fluctuations arising from changes in market prices of securities held. The combined results of changes in foreign exchange rates and the fluctuation of market prices on investments (net of estimated foreign tax withholding) are included with the net realized and unrealized gain or loss from investments in the Statement of Operations. Reported net realized foreign currency gains or losses arise from (1) sales of foreign currencies, (2) currency gains or losses realized between the trade and settlement dates on securities transactions, and (3) the difference between the amounts of dividends, interest, and foreign withholding taxes recorded on the Fund’s books and the U.S. dollar equivalent of the amounts actually received or paid. Net unrealized foreign currency gains and losses arise from changes in the fair values of assets and liabilities, other than investments in securities at fiscal period end, resulting from changes in exchange rates. |
The Fund may invest in foreign securities, which may be subject to foreign taxes on income, gains on investments or currency repatriation, a portion of which may be recoverable. Foreign taxes, if any, are recorded based on the tax regulations and rates that exist in the foreign markets in which the Fund invests and are shown in the Statement of Operations.
| M. | Forward Foreign Currency Contracts — The Fund may engage in foreign currency transactions either on a spot (i.e. for prompt delivery and settlement) basis, or through forward foreign currency contracts, to manage or minimize currency or exchange rate risk. |
The Fund may also enter into forward foreign currency contracts for the purchase or sale of a security denominated in a foreign currency in order to “lock in” the U.S. dollar price of that security, or the Fund may also enter into forward foreign currency contracts that do not provide for
34 Invesco Floating Rate Fund
physical settlement of the two currencies, but instead are settled by a single cash payment calculated as the difference between the agreed upon exchange rate and the spot rate at settlement based upon an agreed upon notional amount (non-deliverable forwards). The Fund will set aside liquid assets in an amount equal to daily mark-to-market obligation for forward foreign currency contracts.
A forward foreign currency contract is an obligation between two parties (“Counterparties”) to purchase or sell a specific currency for an agreed-upon price at a future date. The use of forward foreign currency contracts does not eliminate fluctuations in the price of the underlying securities the Fund owns or intends to acquire but establishes a rate of exchange in advance. Fluctuations in the value of these contracts are measured by the difference in the contract date and reporting date exchange rates and are recorded as unrealized appreciation (depreciation) until the contracts are closed. When the contracts are closed, realized gains (losses) are recorded. Realized and unrealized gains (losses) on the contracts are included in the Statement of Operations. The primary risks associated with forward foreign currency contracts include failure of the Counterparty to meet the terms of the contract and the value of the foreign currency changing unfavorably. These risks may be in excess of the amounts reflected in the Statement of Assets and Liabilities.
| N. | Industry Focus — To the extent that the Fund invests a greater amount of its assets in securities of issuers in the banking and financial services industries, the Fund’s performance will depend to a greater extent on the overall condition of those industries. The value of these securities can be sensitive to changes in government regulation, interest rates and economic downturns in the U.S. and abroad. |
| O. | Bank Loan Risk — Although the resale, or secondary market for floating rate loans has grown substantially over the past decade, both in overall size and number of market participants, there is no organized exchange or board of trade on which floating rate loans are traded. Instead, the secondary market for floating rate loans is a private, unregulated interdealer or interbank resale market. Such a market may therefore be subject to irregular trading activity, wide bid/ask spreads, and extended trade settlement periods. Similar to other asset classes, bank loan funds may be exposed to counterparty credit risk, or the risk than an entity with which the Fund has unsettled or open transactions may fail to or be unable to perform on its commitments. The Fund manages counterparty credit risk by entering into transactions only with counterparties that it believes have the financial resources to honor their obligations and by monitoring the financial stability of those counterparties. |
| P. | Other Risks — The Fund may invest all or substantially of its assets in senior secured floating rate loans and senior secured debt securities that are determined to be rated below investment grade. These securities are generally considered to have speculative characteristics and are subject to greater risk of loss of principal and interest than higher rated securities. The value of lower quality debt securities and floating rate loans can be more volatile due to increased sensitivity to adverse issuer, political, regulatory, market or economic developments. |
The Fund invests in corporate loans from U.S. or non-U.S. companies (the “Borrowers”). The investment of the Fund in a corporate loan may take the form of participation interests or assignments. If the Fund purchases a participation interest from a syndicate of lenders (“Lenders”) or one of the participants in the syndicate (“Participant”), one or more of which administers the loan on behalf of all the Lenders (the “Agent Bank”), the Fund would be required to rely on the Lender that sold the participation interest not only for the enforcement of the Fund’s rights against the Borrower but also for the receipt and processing of payments due to the Fund under the corporate loans. As such, the Fund is subject to the credit risk of the Borrower and the Participant. Lenders and Participants interposed between the Fund and a Borrower, together with Agent Banks, are referred to as “Intermediate Participants”.
| Q. | Leverage Risk — The Fund may utilize leverage to seek to enhance the yield of the Fund by borrowing. There are risks associated with borrowing in an effort to increase the yield and distributions on the shares, including that the costs of the financial leverage may exceed the income from investments made with such leverage, the higher volatility of the net asset value of the shares, and that fluctuations in the interest rates on the borrowing may affect the yield and distributions to the shareholders. There can be no assurance that the Fund’s leverage strategy will be successful. |
NOTE 2—Advisory Fees and Other Fees Paid to Affiliates
The Trust has entered into a master investment advisory agreement with Invesco Advisers, Inc. (the “Adviser” or “Invesco”). Under the terms of the investment advisory agreement, the Fund pays an advisory fee to the Adviser based on the annual rate of the Fund’s average daily net assets as follows:
| Average Daily Net Assets | Rate | |||||
First $500 million | 0 | .65% | ||||
Next $4.5 billion | 0 | .60% | ||||
Next $5 billion | 0 | .575% | ||||
Over $10 billion | 0 | .55% | ||||
For the year ended August 31, 2015, the effective advisory fees incurred by the Fund was 0.61%.
Under the terms of a master sub-advisory agreement between the Adviser and each of Invesco Asset Management Deutschland GmbH, Invesco Asset Management Limited, Invesco Asset Management (Japan) Limited, Invesco Hong Kong Limited, Invesco Senior Secured Management, Inc. and Invesco Canada Ltd. (collectively, the “Affiliated Sub-Advisers”) the Adviser, not the Fund, may pay 40% of the fees paid to the Adviser to any such Affiliated Sub-Adviser(s) that provide(s) discretionary investment management services to the Fund based on the percentage of assets allocated to such Affiliated Sub-Adviser(s).
The Adviser has contractually agreed, through at least June 30, 2016, to waive advisory fees and/or reimburse expenses of all shares to the extent necessary to limit total annual fund operating expenses after fee waiver and/or reimbursement (excluding certain items discussed below) of Class A, Class C, Class R, Class Y, Class R5 and Class R6 shares to 1.50%, 2.00%, 1.75%, 1.25%, 1.25% and 1.25% of average daily net assets. In determining the Adviser’s obligation to waive advisory fees and/or reimburse expenses, the following expenses are not taken into account, and could cause the total annual fund operating expenses after fee waiver and/or reimbursement to exceed the numbers reflected above: (1) interest, facilities and maintenance fees; (2) taxes; (3) dividend expense on short sales; (4) extraordinary or non-routine items, including litigation expenses; and (5) expenses that the Fund has incurred but did not actually pay because of an expense offset arrangement. Unless Invesco continues the fee waiver agreement, it will terminate on June 30, 2016. The fee waiver agreement cannot be terminated during its term. The Adviser did not waive fees and/or reimburse expenses during the period under this expense limitation.
35 Invesco Floating Rate Fund
Further, the Adviser has contractually agreed, through at least June 30, 2017, to waive the advisory fee payable by the Fund in an amount equal to 100% of the net advisory fees the Adviser receives from the affiliated money market funds on investments by the Fund of uninvested cash in such affiliated money market funds.
For the year ended August 31, 2015, the Adviser waived advisory fees of $87,997.
The Trust has entered into a master administrative services agreement with Invesco pursuant to which the Fund has agreed to pay Invesco for certain administrative costs incurred in providing accounting services to the Fund. For the year ended August 31, 2015, expenses incurred under the agreement are shown in the Statement of Operations as Administrative services fees.
Also, Invesco has entered into service agreements whereby State Street Bank and Trust Company (“SSB”) serves as the custodian, fund accountant and provides certain administrative services to the Fund.
The Trust has entered into a transfer agency and service agreement with Invesco Investment Services, Inc. (“IIS”) pursuant to which the Fund has agreed to pay IIS a fee for providing transfer agency and shareholder services to the Fund and reimburse IIS for certain expenses incurred by IIS in the course of providing such services. IIS may make payments to intermediaries that provide omnibus account services, sub-accounting services and/or networking services. All fees payable by IIS to intermediaries that provide omnibus account services or sub-accounting are charged back to the Fund, subject to certain limitations approved by the Trust’s Board of Trustees. For the year ended August 31, 2015, expenses incurred under the agreement are shown in the Statement of Operations as Transfer agent fees.
The Trust has entered into master distribution agreements with Invesco Distributors, Inc. (“IDI”) to serve as the distributor for the Class A, Class C, Class R, Class Y, Class R5 and Class R6 shares of the Fund. The Trust has adopted plans pursuant to Rule 12b-1 under the 1940 Act with respect to the Fund’s Class A, Class C and Class R shares (collectively, the “Plans”). The Fund, pursuant to the Plans, pays IDI compensation at the annual rate of 0.25% of the Fund’s average daily net assets of Class A shares, 0.75% of the average daily net assets of Class C shares and 0.50% of the average daily net assets of Class R shares. Of the Plan payments, up to 0.25% of the average daily net assets of each class of shares may be paid to furnish continuing personal shareholder services to customers who purchase and own shares of such classes. Any amounts not paid as a service fee under the Plans would constitute an asset-based sales charge. Rules of the Financial Industry Regulatory Authority (“FINRA”) impose a cap on the total sales charges, including asset-based sales charges, that may be paid by any class of shares of the Fund. For the year ended August 31, 2015, expenses incurred under the Plans are shown in the Statement of Operations as Distribution fees.
Front-end sales commissions and CDSC (collectively, the “sales charges”) are not recorded as expenses of the Fund. Front-end sales commissions are deducted from proceeds from the sales of Fund shares prior to investment in Class A shares of the Fund. CDSC are deducted from redemption proceeds prior to remittance to the shareholder. During the year ended August 31, 2015, IDI advised the Fund that IDI retained $179,751 in front-end sales commissions from the sale of Class A shares and $262,936 and $72,410 from Class A and Class C shares, respectively, for CDSC imposed upon redemptions by shareholders.
Certain officers and trustees of the Trust are officers and directors of the Adviser, IIS and/or IDI.
NOTE 3—Additional Valuation Information
GAAP defines fair value as the price that would be received to sell an asset or paid to transfer a liability in an orderly transaction between market participants at the measurement date, under current market conditions. GAAP establishes a hierarchy that prioritizes the inputs to valuation methods, giving the highest priority to readily available unadjusted quoted prices in an active market for identical assets (Level 1) and the lowest priority to significant unobservable inputs (Level 3), generally when market prices are not readily available or are unreliable. Based on the valuation inputs, the securities or other investments are tiered into one of three levels. Changes in valuation methods may result in transfers in or out of an investment’s assigned level:
| Level 1 — | Prices are determined using quoted prices in an active market for identical assets. |
| Level 2 — | Prices are determined using other significant observable inputs. Observable inputs are inputs that other market participants may use in pricing a security. These may include quoted prices for similar securities, interest rates, prepayment speeds, credit risk, yield curves, loss severities, default rates, discount rates, volatilities and others. |
| Level 3 — | Prices are determined using significant unobservable inputs. In situations where quoted prices or observable inputs are unavailable (for example, when there is little or no market activity for an investment at the end of the period), unobservable inputs may be used. Unobservable inputs reflect the Fund’s own assumptions about the factors market participants would use in determining fair value of the securities or instruments and would be based on the best available information. |
The following is a summary of the tiered valuation input levels, as of August 31, 2015. The level assigned to the securities valuations may not be an indication of the risk or liquidity associated with investing in those securities. Because of the inherent uncertainties of valuation, the values reflected in the financial statements may materially differ from the value received upon actual sale of those investments.
During the year ended August 31, 2015, there were transfers from Level 3 to Level 2 of $60,771,134, due to third-party vendor quotations utilizing more than one market quote and from Level 2 to Level 3 of $39,165,955, due to third party vendor quotations utilizing single market quotes.
| Level 1 | Level 2 | Level 3 | Total | |||||||||||||
Equity Securities | $ | 4,670,046 | $ | 2,708,335 | $ | 2,708,358 | $ | 10,086,739 | ||||||||
Variable Rate Senior Loan Interests | — | 1,926,219,227 | 150,150,779 | 2,076,370,006 | ||||||||||||
Bonds and Notes | — | 136,069,775 | — | 136,069,775 | ||||||||||||
Structured Products | — | 117,650,076 | — | 117,650,076 | ||||||||||||
| 4,670,046 | 2,182,647,413 | 152,859,137 | 2,340,176,596 | |||||||||||||
Forward Foreign Currency Contracts* | (220,053 | ) | (220,053 | ) | ||||||||||||
Total Investments | $ | 4,670,046 | $ | 2,182,427,360 | $ | 152,859,137 | $ | 2,339,956,543 | ||||||||
| * | Unrealized appreciation (depreciation). |
36 Invesco Floating Rate Fund
A reconciliation of Level 3 investments is presented when the Fund had a significant amount of Level 3 investments at the beginning and/or end of the reporting period in relation to net assets.
The following is a reconciliation of the fair valuations using significant unobservable inputs (Level 3) during the year ended August 31, 2015:
Beginning 2014 | Purchases | Sales | Accrued discounts/ premiums | Net realized gain (loss) | Net Change in Unrealized Appreciation/ (Depreciation) | Transfers into Level 3 | Transfers out of Level 3 | Ending Balance, as of | ||||||||||||||||||||||||||||
Variable Rate Senior Loan Interests | $ | 137,602,418 | $ | 79,183,975 | $ | (42,172,739 | ) | $ | 437,241 | $ | (302,205 | ) | $ | (3,464,074 | ) | $ | 38,982,876 | $ | (60,116,713 | ) | $ | 150,150,779 | ||||||||||||||
Equity Securities | 2,970,561 | 198,785 | — | — | — | 10,354 | 183,079 | (654,421 | ) | 2,708,358 | ||||||||||||||||||||||||||
Total | $ | 140,572,979 | $ | 79,382,760 | $ | (42,172,739 | ) | $ | 437,241 | $ | (302,205 | ) | $ | (3,453,720 | ) | $ | 39,165,955 | $ | (60,771,134 | ) | $ | 152,859,137 | ||||||||||||||
Securities determined to be Level 3 at the end of the reporting period were valued utilizing quotes from a third-party vendor pricing service. A significant change in third-party pricing information could result in a significantly lower or higher value in Level 3 investments.
NOTE 4—Derivative Investments
Value of Derivative Investments at Period-End
The table below summarizes the value of the Fund’s derivative investments, detailed by primary risk exposure, held as of August 31, 2015:
| Value | ||||||||
| Risk Exposure/Derivative Type | Assets | Liabilities | ||||||
Currency Risk: | ||||||||
Forward foreign currency contracts(a) | $ | 465,136 | $ | (685,189 | ) | |||
| (a) | Values are disclosed on the Statement of Assets and Liabilities under the caption Unrealized appreciation on forward foreign currency contracts outstanding and Unrealized depreciation on forward foreign currency contracts outstanding. |
Effect of Derivative Investments for the year ended August 31, 2015
The table below summarizes the gains (losses) on derivative investments, detailed by primary risk exposure, recognized in earnings during the period:
| Location of Gain (Loss) on Statement of Operations | ||||
| Forward Foreign Currency Contracts | ||||
Realized Gain (Loss): | ||||
Currency risk | $ | — | ||
Change in Net Unrealized Appreciation (Depreciation): | ||||
Currency risk | (220,053 | ) | ||
Total | $ | (220,053 | ) | |
The table below summarizes the two month average notional value of forward foreign currency contracts outstanding during the period.
| Forward Foreign Currency Contracts | ||||
Average notional value | $ | 40,467,508 | ||
| Open Forward Foreign Currency Contracts | ||||||||||||||||||||||||||
Settlement Date | Contract to | Notional Value | Unrealized Appreciation (Depreciation) | |||||||||||||||||||||||
| Counterparty | Deliver | Receive | ||||||||||||||||||||||||
09/15/15 | State Street Bank and Trust | EUR | 13,075,000 | USD | 14,228,529 | $ | 14,674,853 | $ | (446,324 | ) | ||||||||||||||||
09/15/15 | State Street Bank and Trust | EUR | 13,500,000 | USD | 14,912,991 | 15,151,856 | (238,865 | ) | ||||||||||||||||||
09/15/15 | State Street Bank and Trust | EUR | 3,000,000 | USD | 3,394,665 | 3,367,079 | 27,586 | |||||||||||||||||||
09/15/15 | State Street Bank and Trust | EUR | 2,500,000 | USD | 2,871,145 | 2,805,899 | 65,246 | |||||||||||||||||||
09/15/15 | State Street Bank and Trust | GBP | 19,030,000 | USD | 29,571,567 | 29,199,263 | 372,304 | |||||||||||||||||||
Total Forward Foreign Currency Contracts — Currency Risk | $ | (220,053 | ) | |||||||||||||||||||||||
Currency Abbreviations:
| EUR | – Euro | |
| GBP | – British Pound Sterling | |
| USD | – U.S. Dollar |
37 Invesco Floating Rate Fund
Offsetting Assets and Liabilities
Accounting Standards Update (“ASU”) No. 2011-11, Disclosures about Offsetting Assets and Liabilities, which was subsequently clarified in Financial Accounting Standards Board ASU 2013-01 “Clarifying the Scope of Disclosures about Offsetting Assets and Liabilities” is intended to enhance disclosures about financial instruments and derivative instruments that are subject to offsetting arrangements on the Statement of Assets and Liabilities and to enable investors to better understand the effect of those arrangements on the Fund’s financial position. In order for an arrangement to be eligible for netting, the Fund must have a basis to conclude that such netting arrangements are legally enforceable. The Fund enters into netting agreements and collateral agreements in an attempt to reduce the Fund’s Counterparty credit risk by providing for a single net settlement with a Counterparty of all financial transactions covered by the agreement in an event of default as defined under such agreement.
There were no derivative instruments subject to a netting agreement for which the Fund is not currently netting. The following tables present derivative instruments that are either subject to an enforceable netting agreement or offset by collateral arrangements as of August 31, 2015.
| Gross Amounts Not Offset in the Statement of Assets and Liabilities | ||||||||||||||||||||
| Gross Amounts of Recognized Assets | Financial Instruments | Collateral Received | ||||||||||||||||||
| Counterparty | Non-Cash | Cash | Net Amount | |||||||||||||||||
State Street Bank & Trust Co. | $ | 465,136 | $ | (465,136 | ) | $ | — | $ | — | $ | — | |||||||||
| Gross Amounts Not Offset in the Statement of Assets and Liabilities | ||||||||||||||||||||
| Gross Amounts of Recognized Liabilities | Financial Instruments | Collateral Pledged | ||||||||||||||||||
| Counterparty | Non-Cash | Cash | Net Amount | |||||||||||||||||
State Street Bank & Trust Co. | $ | 685,189 | $ | (465,136 | ) | $ | — | $ | — | $ | 220,053 | |||||||||
NOTE 5—Expense Offset Arrangement(s)
The expense offset arrangement is comprised of transfer agency credits which result from balances in demand deposit accounts used by the transfer agent for clearing shareholder transactions. For the year ended August 31, 2015, the Fund received credits from this arrangement, which resulted in the reduction of the Fund’s total expenses of $1,060.
NOTE 6—Trustees’ and Officers’ Fees and Benefits
Trustees’ and Officers’ Fees and Benefits include amounts accrued by the Fund to pay remuneration to certain Trustees and Officers of the Fund. Trustees have the option to defer compensation payable by the Fund, and Trustees’ and Officers’ Fees and Benefits also include amounts accrued by the Fund to fund such deferred compensation amounts. Those Trustees who defer compensation have the option to select various Invesco Funds in which their deferral accounts shall be deemed to be invested. Finally, certain current Trustees were eligible to participate in a retirement plan that provided for benefits to be paid upon retirement to Trustees over a period of time based on the number of years of service. The Fund may have certain former Trustees who also participate in a retirement plan and receive benefits under such plan. Trustees’ and Officers’ Fees and Benefits include amounts accrued by the Fund to fund such retirement benefits. Obligations under the deferred compensation and retirement plans represent unsecured claims against the general assets of the Fund.
NOTE 7—Borrowings
The Board of Trustees of the Fund approved a revolving line of credit agreement with SSB in which the Fund may borrow up to the lesser of (1) $500,000,000 or (2) the limits set by its prospectus for borrowings. This agreement will expire on July 20, 2016.
Additionally, the Fund is permitted to temporarily carry a negative or overdrawn balance in its account with SSB, the custodian bank. Such balances, if any at period end, are shown in the Statement of Assets and Liabilities under the payable caption Amount due custodian. To compensate the custodian bank for such overdrafts, the overdrawn Fund may either (1) leave funds as a compensating balance in the account so the custodian bank can be compensated by earning the additional interest; or (2) compensate by paying the custodian bank at a rate agreed upon by the custodian bank and Invesco, not to exceed the contractually agreed upon rate.
38 Invesco Floating Rate Fund
NOTE 8—Unfunded Loan Commitments
As of August 31, 2015, the Fund had unfunded loan commitments, which could be extended at the option of the borrower, pursuant to the following loan agreements with the following borrowers:
| Borrower | Type | Principal Amount | Value | |||||||
ABG Intermediate Holdings 2 LLC | Delayed Draw Incremental Term Loan | $ | 328,310 | $ | 328,310 | |||||
ABG Intermediate Holdings 2 LLC | Second Lien Delayed Draw Incremental Term Loan | 99,052 | 99,052 | |||||||
Cequel Communications, LLC | Revolver Loan | 9,468,889 | 9,303,184 | |||||||
David’s Bridal, Inc. | Asset-Based Revolver Loan | 1,572,680 | 1,431,139 | |||||||
Delta Air Lines, Inc. | Revolver Loan | 1,144,857 | 1,111,943 | |||||||
Equinox Holdings Inc. | Revolver Loan | 1,866,265 | 1,679,639 | |||||||
Getty Images, Inc. | Revolver Loan | 6,893,288 | 5,342,298 | |||||||
Hearthside Group Holdings, LLC | Revolver Loan | 2,701,077 | 2,668,799 | |||||||
IAP Worldwide Services | Revolver Loan | 876,686 | 859,152 | |||||||
Kenan Advantage Group, Inc. | Delayed Draw Term Loan 1 | 106,061 | 105,895 | |||||||
Lake at Las Vegas Joint Venture, LLC | Exit Revolver Loan | 12,703 | 9,590 | |||||||
Post Holdings, Inc. | Revolver Loan | 3,566,087 | 3,556,245 | |||||||
Realogy Corp. | Revolver Loan | 5,983,634 | 5,774,207 | |||||||
Texas Competitive Electric Holdings Co. LLC | DIP Revolver Loan | 26,666,667 | 26,506,400 | |||||||
| $ | 61,286,256 | $ | 58,775,853 | |||||||
NOTE 9—Distributions to Shareholders and Tax Components of Net Assets
Tax Character of Distributions to Shareholders Paid During the Fiscal Years Ended August 31, 2015 and 2014:
| 2015 | 2014 | |||||||
Ordinary income | $ | 111,532,582 | $ | 102,386,917 | ||||
Tax Components of Net Assets at Period-End:
| 2015 | ||||
Undistributed ordinary income | $ | 769,995 | ||
Net unrealized appreciation (depreciation) — investments | (104,586,877 | ) | ||
Net unrealized appreciation (depreciation) — other investments | (11,270,900 | ) | ||
Temporary book/tax differences | (176,261 | ) | ||
Post-October deferrals | (8,828,082 | ) | ||
Capital loss carryforward | (13,195,866 | ) | ||
Shares of beneficial interest | 2,477,223,348 | |||
Total net assets | $ | 2,339,935,357 | ||
The difference between book-basis and tax-basis unrealized appreciation (depreciation) is due to differences in the timing of recognition of gains and losses on investments for tax and book purposes. The Fund’s net unrealized appreciation (depreciation) difference is attributable primarily to wash sales, book to tax accretion and amortization differences.
The temporary book/tax differences are a result of timing differences between book and tax recognition of income and/or expenses. The Fund’s temporary book/tax differences are the result of the trustee deferral of compensation and retirement plan benefits.
Capital loss carryforward is calculated and reported as of a specific date. Results of transactions and other activity after that date may affect the amount of capital loss carryforward actually available for the Fund to utilize. Capital losses generated in years beginning after December 22, 2010 can be carried forward for an unlimited period, whereas previous losses expire in eight tax years. Capital losses with an expiration period may not be used to offset capital gains until all net capital losses without an expiration date have been utilized. Capital loss carryforwards with no expiration date will retain their character as either short-term or long-term capital losses instead of as short-term capital losses as under prior law. The ability to utilize capital loss carryforwards in the future may be limited under the Internal Revenue Code and related regulations based on the results of future transactions.
The Fund has a capital loss carryforward as of August 31, 2015, which expires as follows:
| Capital Loss Carryforward* | ||||||||||||
| Expiration | Short-Term | Long-Term | Total | |||||||||
August 31, 2017 | $ | 2,739,285 | $ | — | $ | 2,739,285 | ||||||
No subject to expiration | 734,335 | 9,722,246 | 10,456,581 | |||||||||
| $ | 3,473,620 | $ | 9,722,246 | $ | 13,195,866 | |||||||
| * | Capital loss carryforward as of the date listed above is reduced for limitations, if any, to the extent required by the Internal Revenue Code and may be further limited depending upon a variety of factors, including the realization of net unrealized gains or losses as of the date of any reorganization. |
39 Invesco Floating Rate Fund
NOTE 10—Investment Securities
The aggregate amount of investment securities (other than short-term securities, U.S. Treasury obligations and money market funds, if any) purchased and sold by the Fund during the year ended August 31, 2015 was $1,452,180,671 and $1,669,689,464, respectively. Cost of investments on a tax basis includes the adjustments for financial reporting purposes as of the most recently completed federal income tax reporting period-end.
| Unrealized Appreciation (Depreciation) of Investment Securities on a Tax Basis | ||||
Aggregate unrealized appreciation of investment securities | $ | 15,158,466 | ||
Aggregate unrealized (depreciation) of investment securities | (119,745,343 | ) | ||
Net unrealized appreciation (depreciation) of investment securities | $ | (104,586,877 | ) | |
Cost of investments for tax purposes is $2,444,763,473.
NOTE 11—Reclassification of Permanent Differences
Primarily as a result of differing book/tax treatment of the sale of bonds with amortization and foreign currency transactions, on August 31, 2015, undistributed net investment income was increased by $2,462,249 and undistributed net realized gain (loss) was decreased by $2,462,249. This reclassification had no effect on the net assets of the Fund.
NOTE 12—Share Information
| Summary of Share Activity | ||||||||||||||||
| Years ended August 31, | ||||||||||||||||
| 2015 (a) | 2014 | |||||||||||||||
| Shares | Amount | Shares | Amount | |||||||||||||
Sold: | ||||||||||||||||
Class A | 39,709,720 | $ | 308,748,638 | 73,021,095 | $ | 582,061,700 | ||||||||||
Class C | 20,069,741 | 155,362,291 | 43,755,226 | 347,221,070 | ||||||||||||
Class R | 305,899 | 2,374,253 | 1,028,390 | 8,209,977 | ||||||||||||
Class Y | 75,722,818 | 587,249,556 | 86,284,466 | 686,988,793 | ||||||||||||
Class R5 | 183,215 | 1,423,310 | 670,297 | 5,353,051 | ||||||||||||
Class R6 | 4,230,090 | 33,067,238 | 3,394,845 | 27,056,438 | ||||||||||||
Issued as reinvestment of dividends: | ||||||||||||||||
Class A | 3,775,435 | 29,292,254 | 3,944,046 | 31,431,898 | ||||||||||||
Class C | 2,452,652 | 18,940,243 | 2,116,573 | 16,796,382 | ||||||||||||
Class R | 58,511 | 454,357 | 39,884 | 318,622 | ||||||||||||
Class Y | 3,496,532 | 27,064,107 | 2,630,434 | 20,928,501 | ||||||||||||
Class R5 | 26,246 | 204,201 | 52,414 | 418,127 | ||||||||||||
Class R6 | 626,454 | 4,856,839 | 387,916 | 3,091,977 | ||||||||||||
Reacquired: | ||||||||||||||||
Class A | (59,768,075 | ) | (464,117,305 | ) | (68,738,831 | ) | (547,775,394 | ) | ||||||||
Class C | (34,029,469 | ) | (262,935,202 | ) | (24,275,598 | ) | (192,656,477 | ) | ||||||||
Class R | (182,991 | ) | (1,417,514 | ) | (116,049 | ) | (926,618 | ) | ||||||||
Class Y | (73,501,780 | ) | (568,192,010 | ) | (57,403,642 | ) | (456,753,059 | ) | ||||||||
Class R5 | (767,212 | ) | (5,981,895 | ) | (873,072 | ) | (6,967,854 | ) | ||||||||
Class R6 | (2,338,925 | ) | (18,155,071 | ) | (1,286,994 | ) | (10,268,658 | ) | ||||||||
Net increase (decrease) in share activity | (19,931,139 | ) | $ | (151,761,710 | ) | 64,631,400 | $ | 514,528,476 | ||||||||
| (a) | There are entities that are record owners of more than 5% of the outstanding shares of the Fund and in the aggregate own 62% of the outstanding shares of the Fund. IDI has an agreement with these entities to sell Fund shares. The Fund, Invesco and/or Invesco affiliates may make payments to these entities, which are considered to be related to the Fund, for providing services to the Fund, Invesco and/or Invesco affiliates including but not limited to services such as securities brokerage, distribution, third party record keeping and account servicing. The Fund has no knowledge as to whether all or any portion of the shares owned of record by these entities are also owned beneficially. |
NOTE 13—Senior Loan Participation Commitments
The Fund invests in participations, assignments, or acts as a party to the primary lending syndicate of a Senior Loan interest to corporations, partnerships, and other entities. When the Fund purchases a participation of a Senior Loan interest, the Fund typically enters into a contractual agreement with the lender or other third party selling the participation, but not with the borrower directly. As such, the Fund assumes the credit risk of the borrower, selling participant or other persons interpositioned between the Fund and the borrower.
40 Invesco Floating Rate Fund
At the year ended August 31, 2015, the following sets forth the selling participants with respect to interest in Senior Loans purchased by the Fund on a participation basis.
| Selling Participant | Principal Amount | Value | ||||||
Barclays Bank PLC | $ | 6,893,288 | $ | 5,342,298 | ||||
Citibank N.A. | 32,650,301 | 32,280,607 | ||||||
Goldman Sachs Lending Partners LLC | 5,138,768 | 4,987,384 | ||||||
Total | $ | 44,682,357 | $ | 42,610,289 | ||||
NOTE 14—Financial Highlights
The following schedule presents financial highlights for a share of the Fund outstanding throughout the periods indicated.
| Net asset value, beginning of period | Net investment income(a) | Net gains (losses) on securities (both realized and unrealized) | Total from investment operations | Dividends from net investment income | Net asset value, end of period(b) | Total return(c) | Net assets, end of period (000’s omitted) | Ratio of expenses to average net assets with fee waivers and/or expenses absorbed | Ratio of expenses to average net assets without fee waivers and/or expenses absorbed | Ratio of net investment income to average net assets | Portfolio turnover(d) | |||||||||||||||||||||||||||||||||||||
Class A | ||||||||||||||||||||||||||||||||||||||||||||||||
Year ended 08/31/15 | $ | 7.95 | $ | 0.35 | $ | (0.38 | ) | $ | (0.03 | ) | $ | (0.36 | ) | $ | 7.56 | (0.42 | )% | $ | 850,891 | 1.06 | %(e)(f) | 1.06 | %(e)(f)) | 4.51 | %(e) | 59 | % | |||||||||||||||||||||
Year ended 08/31/14 | 7.93 | 0.32 | 0.03 | 0.35 | (0.33 | ) | 7.95 | 4.43 | 1,025,092 | 1.03 | (f) | 1.04 | (f) | 4.01 | 82 | |||||||||||||||||||||||||||||||||
Year ended 08/31/13 | 7.77 | 0.35 | 0.17 | 0.52 | (0.36 | ) | 7.93 | 6.83 | 957,442 | 1.08 | (f) | 1.09 | (f) | 4.36 | 97 | |||||||||||||||||||||||||||||||||
Year ended 08/31/12 | 7.36 | 0.37 | 0.41 | 0.78 | (0.37 | ) | 7.77 | 10.75 | 448,142 | 1.11 | (f) | 1.11 | (f) | 4.80 | 82 | |||||||||||||||||||||||||||||||||
Year ended 08/31/11 | 7.47 | 0.35 | (0.11 | ) | 0.24 | (0.35 | ) | 7.36 | 3.07 | 450,750 | 0.99 | (f) | 1.00 | (f) | 4.53 | 152 | ||||||||||||||||||||||||||||||||
Class C | ||||||||||||||||||||||||||||||||||||||||||||||||
Year ended 08/31/15 | 7.92 | 0.31 | (0.39 | ) | (0.08 | ) | (0.32 | ) | 7.52 | (1.07 | ) | 570,097 | 1.56 | (e)(f) | 1.56 | (e)(f) | 4.01 | (e) | 59 | |||||||||||||||||||||||||||||
Year ended 08/31/14 | 7.90 | 0.28 | 0.03 | 0.31 | (0.29 | ) | 7.92 | 3.91 | 691,152 | 1.53 | (f) | 1.54 | (f) | 3.51 | 82 | |||||||||||||||||||||||||||||||||
Year ended 08/31/13 | 7.73 | 0.31 | 0.18 | 0.49 | (0.32 | ) | 7.90 | 6.45 | 518,948 | 1.58 | (f) | 1.59 | (f) | 3.86 | 97 | |||||||||||||||||||||||||||||||||
Year ended 08/31/12 | 7.32 | 0.33 | 0.41 | 0.74 | (0.33 | ) | 7.73 | 10.24 | 258,800 | 1.61 | (f) | 1.61 | (f) | 4.30 | 82 | |||||||||||||||||||||||||||||||||
Year ended 08/31/11 | 7.44 | 0.31 | (0.12 | ) | 0.19 | (0.31 | ) | 7.32 | 2.41 | 267,796 | 1.49 | (f) | 1.50 | (f) | 4.03 | 152 | ||||||||||||||||||||||||||||||||
Class R | ||||||||||||||||||||||||||||||||||||||||||||||||
Year ended 08/31/15 | 7.97 | 0.33 | (0.39 | ) | (0.06 | ) | (0.34 | ) | 7.57 | (0.79 | ) | 11,969 | 1.31 | (e)(f) | 1.31 | (e)(f) | 4.26 | (e) | 59 | |||||||||||||||||||||||||||||
Year ended 08/31/14 | 7.95 | 0.30 | 0.03 | 0.33 | (0.31 | ) | 7.97 | 4.18 | 11,152 | 1.28 | (f) | 1.29 | (f) | 3.76 | 82 | |||||||||||||||||||||||||||||||||
Year ended 08/31/13 | 7.79 | 0.33 | 0.17 | 0.50 | (0.34 | ) | 7.95 | 6.57 | 3,559 | 1.33 | (f) | 1.34 | (f) | 4.11 | 97 | |||||||||||||||||||||||||||||||||
Year ended 08/31/12 | 7.37 | 0.35 | 0.42 | 0.77 | (0.35 | ) | 7.79 | 10.61 | 1,779 | 1.36 | (f) | 1.36 | (f) | 4.55 | 82 | |||||||||||||||||||||||||||||||||
Year ended 08/31/11 | 7.49 | 0.33 | (0.12 | ) | 0.21 | (0.33 | ) | 7.37 | 2.68 | 1,491 | 1.24 | (f) | 1.25 | (f) | 4.28 | 152 | ||||||||||||||||||||||||||||||||
Class Y | ||||||||||||||||||||||||||||||||||||||||||||||||
Year ended 08/31/15 | 7.94 | 0.37 | (0.39 | ) | (0.02 | ) | (0.38 | ) | 7.54 | (0.31 | ) | 805,611 | 0.81 | (e)(f) | 0.81 | (e)(f) | 4.76 | (e) | 59 | |||||||||||||||||||||||||||||
Year ended 08/31/14 | 7.92 | 0.34 | 0.03 | 0.37 | (0.35 | ) | 7.94 | 4.69 | 802,508 | 0.78 | (f) | 0.79 | (f) | 4.26 | 82 | |||||||||||||||||||||||||||||||||
Year ended 08/31/13 | 7.76 | 0.37 | 0.17 | 0.54 | (0.38 | ) | 7.92 | 7.10 | 550,974 | 0.83 | (f) | 0.84 | (f) | 4.61 | 97 | |||||||||||||||||||||||||||||||||
Year ended 08/31/12 | 7.34 | 0.38 | 0.42 | 0.80 | (0.38 | ) | 7.76 | 11.19 | 165,609 | 0.86 | (f) | 0.86 | (f) | 5.05 | 82 | |||||||||||||||||||||||||||||||||
Year ended 08/31/11 | 7.46 | 0.37 | (0.12 | ) | 0.25 | (0.37 | ) | 7.34 | 3.19 | 125,900 | 0.74 | (f) | 0.75 | (f) | 4.78 | 152 | ||||||||||||||||||||||||||||||||
Class R5 | ||||||||||||||||||||||||||||||||||||||||||||||||
Year ended 08/31/15 | 7.96 | 0.37 | (0.39 | ) | (0.02 | ) | (0.38 | ) | 7.56 | (0.29 | ) | 3,466 | 0.80 | (e)(f) | 0.80 | (e)(f) | 4.77 | (e) | 59 | |||||||||||||||||||||||||||||
Year ended 08/31/14 | 7.94 | 0.34 | 0.03 | 0.37 | (0.35 | ) | 7.96 | 4.72 | 8,087 | 0.76 | (f) | 0.77 | (f) | 4.28 | 82 | |||||||||||||||||||||||||||||||||
Year ended 08/31/13 | 7.77 | 0.37 | 0.18 | 0.55 | (0.38 | ) | 7.94 | 7.26 | 9,260 | 0.81 | (f) | 0.82 | (f) | 4.63 | 97 | |||||||||||||||||||||||||||||||||
Year ended 08/31/12 | 7.36 | 0.39 | 0.41 | 0.80 | (0.39 | ) | 7.77 | 11.13 | 58,039 | 0.77 | (f) | 0.77 | (f) | 5.14 | 82 | |||||||||||||||||||||||||||||||||
Year ended 08/31/11 | 7.47 | 0.38 | (0.12 | ) | 0.26 | (0.37 | ) | 7.36 | 3.40 | 48,967 | 0.68 | (f) | 0.69 | (f) | 4.84 | 152 | ||||||||||||||||||||||||||||||||
Class R6 | ||||||||||||||||||||||||||||||||||||||||||||||||
Year ended 08/31/15 | 7.95 | 0.38 | (0.38 | ) | 0.00 | (0.39 | ) | 7.56 | (0.06 | ) | 97,902 | 0.70 | (e)(f) | 0.70 | (e)(f) | 4.87 | (e) | 59 | ||||||||||||||||||||||||||||||
Year ended 08/31/14 | 7.94 | 0.35 | 0.01 | 0.36 | (0.35 | ) | 7.95 | 4.66 | 83,025 | 0.69 | (f) | 0.70 | (f) | 4.35 | 82 | |||||||||||||||||||||||||||||||||
Year ended 08/31/13(g) | 7.84 | 0.35 | 0.11 | 0.46 | (0.36 | ) | 7.94 | 6.01 | 63,032 | 0.76 | (f)(h) | 0.77 | (f)(h) | 4.68 | (h) | 97 | ||||||||||||||||||||||||||||||||
| (a) | Calculated using average shares outstanding. |
| (b) | Includes redemption fees added to shares of beneficial interest which were less than $0.005 per share for the fiscal years ended August 31, 2012 and prior. |
| (c) | Includes adjustments in accordance with accounting principles generally accepted in the United States of America and as such, the net asset value for financial reporting purposes and the returns based upon those net asset values may differ from the net asset value and returns for shareholder transactions. Does not include sales charges and is not annualized for periods less than one year, if applicable. |
| (d) | Portfolio turnover is calculated at the fund level and is not annualized for periods less than one year, if applicable. |
| (e) | Ratios are based on average daily net assets (000’s omitted) of $895,685, $615,755, $11,354, $815,239, $4,382 and $97,774 for Class A, Class C, Class R, Class Y, Class R5 and Class R6 shares, respectively. |
| (f) | Ratio includes line of credit expense of 0.03%, 0.02%, 0.02%, 0.03% and 0.01% for the years ended August 31, 2015, August 31, 2014, August 31, 2013, August 31, 2012 and August 31, 2011, respectively. |
| (g) | Commencement date September 24, 2012. |
| (h) | Annualized. |
41 Invesco Floating Rate Fund
Report of Independent Registered Public Accounting Firm
To the Board of Trustees of AIM Counselor Series Trust (Invesco Counselor Series Trust)
and Shareholders of Invesco Floating Rate Fund:
In our opinion, the accompanying statement of assets and liabilities, including the schedule of investments, and the related statements of operations, of changes in net assets, of cash flows and the financial highlights present fairly, in all material respects, the financial position of Invesco Floating Rate Fund (one of the funds constituting AIM Counselor Series Trust (Invesco Counselor Series Trust), hereafter referred to as the “Fund”) at August 31, 2015, the results of its operations for the year then ended, the changes in its net assets for each of the two years in the period then ended, its cash flows for the year then ended and the financial highlights for each of the five years in the period then ended, in conformity with accounting principles generally accepted in the United States of America. These financial statements and financial highlights (hereafter referred to as “financial statements”) are the responsibility of the Fund’s management. Our responsibility is to express an opinion on these financial statements based on our audits. We conducted our audits of these financial statements in accordance with the standards of the Public Company Accounting Oversight Board (United States). Those standards require that we plan and perform the audit to obtain reasonable assurance about whether the financial statements are free of material misstatement. An audit includes examining, on a test basis, evidence supporting the amounts and disclosures in the financial statements, assessing the accounting principles used and significant estimates made by management, and evaluating the overall financial statement presentation. We believe that our audits, which included confirmation of securities at August 31, 2015 by correspondence with the custodian and brokers, and the application of alternative auditing procedures where confirmations of security purchases have not been received, provide a reasonable basis for our opinion.
PRICEWATERHOUSECOOPERS LLP
October 28, 2015
Houston, Texas
42 Invesco Floating Rate Fund
Calculating your ongoing Fund expenses
Example
As a shareholder of the Fund, you incur two types of costs: (1) transaction costs, which may include sales charges (loads) on purchase payments or contingent deferred sales charges on redemptions, if any; and (2) ongoing costs, including management fees, distribution and/or service (12b-1) fees, and other Fund expenses. This example is intended to help you understand your ongoing costs (in dollars) of investing in the Fund and to compare these costs with ongoing costs of investing in other mutual funds. The example is based on an investment of $1,000 invested at the beginning of the period and held for the entire period March 1, 2015 through August 31, 2015.
Actual expenses
The table below provides information about actual account values and actual expenses. You may use the information in this table, together with the amount you invested, to estimate the expenses that you paid over the period. Simply divide your account value by $1,000 (for example, an $8,600 account value divided by $1,000 = 8.6), then multiply the result by the number in the table under the heading entitled “Actual Expenses Paid During Period” to estimate the expenses you paid on your account during this period.
Hypothetical example for comparison purposes
The table below also provides information about hypothetical account values and hypothetical expenses based on the Fund’s actual expense ratio and an assumed rate of return of 5% per year before expenses, which is not the Fund’s actual return.
The hypothetical account values and expenses may not be used to estimate the actual ending account balance or expenses you paid for the period. You may use this information to compare the ongoing costs of investing in the Fund and other funds. To do so, compare this 5% hypothetical example with the 5% hypothetical examples that appear in the shareholder reports of the other funds.
Please note that the expenses shown in the table are meant to highlight your ongoing costs only and do not reflect any transaction costs, such as sales charges (loads) on purchase payments or contingent deferred sales charges on redemptions, if any. Therefore, the hypothetical information is useful in comparing ongoing costs only, and will not help you determine the relative total costs of owning different funds. In addition, if these transaction costs were included, your costs would have been higher.
| Class | Beginning Account Value (03/01/15) | ACTUAL | HYPOTHETICAL (5% annual return before expenses) | Annualized Expense Ratio | ||||||||||||||||||||
| Ending Account Value (08/31/15)1 | Expenses Paid During Period2 | Ending Account Value (08/31/15) | Expenses Paid During Period2 | |||||||||||||||||||||
| A | $ | 1,000.00 | $ | 994.50 | $ | 5.33 | $ | 1,019.86 | $ | 5.40 | 1.06 | % | ||||||||||||
| C | 1,000.00 | 990.50 | 7.83 | 1,017.34 | 7.93 | 1.56 | ||||||||||||||||||
| R | 1,000.00 | 992.00 | 6.58 | 1,018.60 | 6.67 | 1.31 | ||||||||||||||||||
| Y | 1,000.00 | 994.40 | 4.07 | 1,021.12 | 4.13 | 0.81 | ||||||||||||||||||
| R5 | 1,000.00 | 994.50 | 4.02 | 1,021.17 | 4.08 | 0.80 | ||||||||||||||||||
| R6 | 1,000.00 | 996.20 | 3.52 | 1,021.68 | 3.57 | 0.70 | ||||||||||||||||||
| 1 | The actual ending account value is based on the actual total return of the Fund for the period March 1, 2015 through August 31, 2015, after actual expenses and will differ from the hypothetical ending account value which is based on the Fund’s expense ratio and a hypothetical annual return of 5% before expenses. |
| 2 | Expenses are equal to the Fund’s annualized expense ratio as indicated above multiplied by the average account value over the period, multiplied by 184/365 to reflect the most recent fiscal half year. |
43 Invesco Floating Rate Fund
Approval of Investment Advisory and Sub-Advisory Contracts
The Board of Trustees (the Board) of AIM Counselor Series Trust (Invesco Counselor Series Trust) is required under the Investment Company Act of 1940, as amended, to approve annually the renewal of Invesco Floating Rate Fund’s (the Fund) investment advisory agreements. During contract renewal meetings held on June 9-10, 2015, the Board as a whole, and the disinterested or “independent” Trustees, who comprise over 75% of the Board, voting separately, approved the continuance for the Fund of the Master Investment Advisory Agreement with Invesco Advisers, Inc. (Invesco Advisers and the investment advisory agreement) and the Master Intergroup Sub-Advisory Contract for Mutual Funds with Invesco Asset Management Deutschland GmbH, Invesco Asset Management Limited, Invesco Asset Management (Japan) Limited, Invesco Hong Kong Limited, Invesco Senior Secured Management, Inc. and Invesco Canada Ltd. (collectively, the Affiliated Sub-Advisers and the sub-advisory contracts) for another year, effective July 1, 2015.
In evaluating the fairness and reasonableness of compensation under the Fund’s investment advisory agreement and sub-advisory contracts, the Board considered, among other things, the factors discussed below. The Board determined that continuation of the Fund’s investment advisory agreement and the sub-advisory contracts is in the best interest of the Fund and its shareholders and that the compensation payable to Invesco Advisers and the Affiliated Sub-Advisers under the agreements is fair and reasonable.
The Board’s Fund Evaluation Process
The Board’s Investments Committee has established three Sub-Committees, each of which is primarily responsible for overseeing the performance and investment management services provided by Invesco Advisers and the Affiliated Sub-Advisers to a number of the funds advised by Invesco Advisers (the Invesco Funds). The Sub-Committees meet throughout the year to review the performance of their assigned Invesco Funds, including reviewing materials prepared under the direction of the independent Senior Officer, an officer of the Invesco Funds who reports directly to the independent Trustees. Over the course of each year, the Sub-Committees meet with portfolio managers for their assigned Invesco Funds and other members of management to review the performance, investment objective(s), policies, strategies, limitations and investment risks of these funds. The Board had the benefit of reports from the Sub-Committees and Investments Committee throughout the year in considering approval of the continuance of each Invesco Fund’s investment advisory agreement and sub-advisory contracts for another year.
During the contract renewal process, the Board receives comparative performance and fee data regarding the Invesco Funds prepared by Invesco Advisers and Lipper Inc. (Lipper), an independent provider of investment company data. The Board also receives a report and this independent written evaluation from the Senior Officer. The Senior Officer’s evaluation is prepared as part of his responsibility to manage the process by which the Invesco Funds’ proposed management fees are negotiated during the annual contract renewal process to ensure they are negotiated in a manner that is at arms’ length and reasonable. In addition to meetings with Invesco Advisers and fund counsel, the independent Trustees also discuss the continuance of the investment advisory agreement and sub-advisory contracts in separate sessions with the Senior Officer and with independent legal counsel.
The Trustees recognized that the advisory fee rates for the Invesco Funds are, in many cases, the result of years of review and negotiation. The Trustees’ deliberations and conclusions in a particular year may be based in part on their deliberations and conclusions regarding these arrangements throughout the year and in prior years. The Trustees’ review and conclusions are based on the comprehensive consideration of all information presented to them and are not the result of any single determinative factor. Moreover, one Trustee may have weighed a particular piece of information or factor differently than another Trustee.
The discussion below is a summary of the Senior Officer’s independent written evaluation with respect to the Fund’s investment advisory agreement as well as a discussion of the material factors and related conclusions that formed the basis for the Board’s approval of the Fund’s investment advisory agreement and sub-advisory contracts. Unless otherwise stated, this information is current as of June 10, 2015, and does not reflect consideration of factors that became known to the Board after that date.
Factors and Conclusions and Summary of Independent Written Fee Evaluation
| A. | Nature, Extent and Quality of Services Provided by Invesco Advisers and the Affiliated Sub-Advisers |
The Board reviewed the advisory services provided to the Fund by Invesco Advisers under the Fund’s investment advisory agreement, the performance of Invesco Advisers in providing these services, and the credentials and experience of the officers and employees of Invesco Advisers who provide these services, including the Fund’s portfolio manager or managers. The Board’s review of the qualifications of Invesco Advisers to provide advisory services included the Board’s consideration of Invesco Advisers’ investment
process oversight, independent credit analysis and investment risk management. The Board also considered non-advisory services that Invesco Advisers and its affiliates provide to the Invesco Funds such as various back office support functions, equity and fixed income trading operations, internal audit, distribution, valuation and legal and compliance.
In determining whether to continue the Fund’s investment advisory agreement, the Board considered the benefits of reapproving an existing relationship and the greater uncertainty that may be associated with entering into a new relationship. The Board concluded that the nature, extent and quality of the services provided to the Fund by Invesco Advisers are appropriate and satisfactory and consistent with the terms of the Fund’s investment advisory agreement.
The Board reviewed the services that may be provided by the Affiliated Sub-Advisers under the sub-advisory contracts and the credentials and experience of the officers and employees of the Affiliated Sub-Advisers who provide these services. The Board noted that the Affiliated Sub-Advisers have offices and personnel that are located in financial centers around the world. As a result, the Affiliated Sub-Advisers can provide research and investment analysis on the markets and economies of various countries in which the Fund may invest, make recommendations regarding securities and assist with security trades. The Board concluded that the sub-advisory contracts benefit the Fund and its shareholders by permitting Invesco Advisers to use the resources and talents of the Affiliated Sub-Advisers in managing the Fund. The Board concluded that the nature, extent and quality of the services that may be provided by the Affiliated Sub-Advisers are appropriate and satisfactory and consistent with the terms of the Fund’s sub-advisory contracts.
| B. | Fund Performance |
The Board considered Fund performance as a relevant factor in considering whether to approve the investment advisory agreement as well as the sub-advisory contracts for the Fund, as Invesco Senior Secured Management, Inc. currently manages assets of the Fund.
The Board compared the Fund’s performance during the past one, three and five calendar years to the performance of funds in the Lipper performance universe and against the Lipper Loan Participation Funds Index. The Board noted that performance of Class A shares of the Fund was in the second quintile of its performance universe for the one year period and the first quintile for the three and five year periods (the first quintile being the best performing funds and the fifth quintile being the worst performing funds). The Board noted that performance of Class A shares of the Fund was above the performance of the Index for the one, three and five year periods. The Trustees also reviewed
44 Invesco Floating Rate Fund
more recent Fund performance and this review did not change their conclusions.
| C. | Advisory and Sub-Advisory Fees |
The Board compared the Fund’s contractual management fee rate to the contractual management fee rates of funds in the Fund’s Lipper expense group at a common asset level. The Board noted that the contractual management fee rate for Class A shares of the Fund was below the median contractual management fee rate of funds in its expense group. The Board noted that the term “contractual management fee” may include both advisory and certain administrative services fees, but that Lipper does not provide information on a fund by fund basis as to what is included. The Board noted that Invesco Advisers does not charge the Invesco Funds for the administrative services included in the term as defined by Lipper. The Board also reviewed the methodology used by Lipper in providing expense group information, which includes using each fund’s contractual management fee schedule (including any applicable breakpoints) as reported in the most recent prospectus or statement of additional information for each fund in the expense group.
The Board also compared the Fund’s effective advisory fee rate (the advisory fee rate after advisory fee waivers and before other expense limitations/waivers) to the effective advisory fee rates of other funds advised by Invesco Advisers and its affiliates with investment strategies comparable to those of the Fund. The Board noted that the Fund’s rate was below the rate of one closed end fund. The Board also noted how the Fund’s rate compared to the effective sub-adviser fee rate of other funds sub-advised by Invesco Advisers.
The Board also considered the fees charged by Invesco Advisers and the Affiliated Sub-Advisers to other client accounts with investment strategies comparable to those of the Fund. The Board noted that Invesco Advisers or the Affiliated Sub-Advisers may charge lower fees to large institutional clients. Invesco Advisers reviewed with the Board the significantly greater scope of services it provides to the Invesco Funds relative to certain other types of client accounts. These additional services include provision of administrative services, officers and office space, oversight of service providers, preparation of annual registration statement updates and financial information and regulatory compliance under the Investment Company Act of 1940, as amended.
Invesco Advisers also reviewed generally the higher frequency of shareholder purchases and redemptions in the Invesco Funds relative to the flow of assets for other client accounts. Invesco Advisers advised the Board that advance notice of redemptions is often provided to Invesco Advisers by institutional clients. The Board did note that sub-advisory fee rates charged by the Affiliated Sub-Advisers to manage the Invesco Funds and to manage other client accounts tended to be more comparable, reflecting a
similar scope of services. The information received by the Board demonstrated that the aggregate services provided to the Invesco Funds were sufficiently different from those provided to institutional clients to support the difference in fees.
The Board also considered the services that may be provided by the Affiliated Sub-Advisers pursuant to the sub-advisory contracts, as well as the fees payable by Invesco Advisers to the Affiliated Sub-Advisers pursuant to the sub-advisory contracts. The Board noted that Invesco Advisers retains overall responsibility for, and provides services to, sub-advised Invesco Funds, including oversight of the Affiliated Sub-Advisers as well as the additional services described herein other than day-to-day portfolio management. The Board also noted that the sub-advisory fees are not paid directly by the Fund, but rather, are payable by Invesco Advisers to the Affiliated Sub-Advisers.
| D. | Economies of Scale and Breakpoints |
The Board considered the extent to which there are economies of scale in the provision of advisory services to the Fund. The Board also considered whether the Fund benefits from economies of scale through contractual breakpoints in the Fund’s advisory fee schedule. The Board also noted that the Fund shares directly in economies of scale through lower fees charged by third party service providers based on the combined size of the Invesco Funds and other clients advised by Invesco Advisers.
| E. | Profitability and Financial Resources |
The Board reviewed information from Invesco Advisers concerning the costs of the advisory and other services that Invesco Advisers and its affiliates provide to the Fund and the Invesco Funds and the profitability of Invesco Advisers and its affiliates in providing these services. The Board received information from Invesco Advisers about the methodology used to prepare the profitability information. The Board noted that Invesco Advisers continues to operate at a net profit from services Invesco Advisers and its affiliates provide to the Invesco Funds and the Fund. The Board did not deem the level of profits realized by Invesco Advisers and its affiliates from providing services to the Fund to be excessive given the nature, quality and extent of the services provided. The Board received and accepted information from Invesco Advisers demonstrating that Invesco Advisers and each Affiliated Sub-Adviser are financially sound and have the resources necessary to perform their obligations under the investment advisory agreement and sub-advisory contracts.
| F. | Collateral Benefits to Invesco Advisers and its Affiliates |
The Board considered various other benefits received by Invesco Advisers and its affiliates from the relationship with the Fund, including the fees received for providing transfer agency and distribution services to the Fund. The Board considered comparative information regarding fees charged for these services, including information provided by Lipper and other
independent sources. The Board considered the performance of Invesco Advisers and its affiliates in providing these services and the organizational structure employed to provide these services. The Board also considered that these services are provided to the Fund pursuant to written contracts that are reviewed and approved on an annual basis by the Board; and that the services are required for the operation of the Fund.
The Board considered the benefits realized by Invesco Advisers and the Affiliated Sub-Advisers as a result of portfolio brokerage transactions executed through “soft dollar” arrangements. Invesco Advisers noted that the Fund does not execute brokerage transactions through “soft dollar” arrangements to any significant degree.
The Board considered that the Fund’s uninvested cash and cash collateral from any securities lending arrangements may be invested in money market funds advised by Invesco Advisers pursuant to procedures approved by the Board. The Board noted that Invesco Advisers receives advisory fees from these affiliated money market funds attributable to such investments, although Invesco Advisers has contractually agreed to waive through varying periods the advisory fees payable by the Invesco Funds with respect to investments in the affiliated money market funds. The waiver is in an amount equal to 100% of the net advisory fee Invesco Advisers receives from the affiliated money market funds with respect to the Fund’s investment in the affiliated money market funds of uninvested cash, but not cash collateral. The Board concluded that the amount of advisory fees received by Invesco Advisors from the Fund’s investment of cash collateral from any securities lending arrangements in the affiliated money market funds is fair and reasonable.
45 Invesco Floating Rate Fund
Tax Information
Form 1099-DIV, Form 1042-S and other year–end tax information provide shareholders with actual calendar year amounts that should be included in their tax returns. Shareholders should consult their tax advisors.
The following distribution information is being provided as required by the Internal Revenue Code or to meet a specific state’s requirement.
The Fund designates the following amounts or, if subsequently determined to be different, the maximum amount allowable for its fiscal year ended August 31, 2015:
Federal and State Income Tax | ||||
Qualified Dividend Income* | 0.73 | % | ||
Corporate Dividends Received Deduction* | 0.73 | % | ||
| * | The above percentages are based on ordinary income dividends paid to shareholders during the Fund’s fiscal year. |
46 Invesco Floating Rate Fund
Trustees and Officers
The address of each trustee and officer is AIM Counselor Series Trust (Invesco Counselor Series Trust) (the “Trust”), 11 Greenway Plaza, Suite 1000, Houston, Texas 77046-1173. The trustees serve for the life of the Trust, subject to their earlier death, incapacitation, resignation, retirement or removal as more specifically provided in the Trust’s organizational documents. Each officer serves for a one year term or until their successors are elected and qualified. Column two below includes length of time served with predecessor entities, if any.
| Name, Year of Birth and Position(s) Held with the Trust | Trustee and/ or Officer Since | Principal Occupation(s) During Past 5 Years | Number of Funds in Fund Complex Overseen by Trustee | Other Directorship(s) Held by Trustee During Past 5 Years | ||||
| Interested Persons | ||||||||
| Martin L. Flanagan1 — 1960 Trustee | 2007 | Executive Director, Chief Executive Officer and President, Invesco Ltd. (ultimate parent of Invesco and a global investment management firm); Advisor to the Board, Invesco Advisers, Inc. (formerly known as Invesco Institutional (N.A.), Inc.); Trustee, The Invesco Funds; Vice Chair, Investment Company Institute; and Member of Executive Board, SMU Cox School of Business
Formerly: Chairman and Chief Executive Officer, Invesco Advisers, Inc. (registered investment adviser); Director, Chairman, Chief Executive Officer and President, IVZ Inc. (holding company), INVESCO Group Services, Inc. (service provider) and Invesco North American Holdings, Inc. (holding company); Director, Chief Executive Officer and President, Invesco Holding Company Limited (parent of Invesco and a global investment management firm); Director, Invesco Ltd.; Chairman, Investment Company Institute and President, Co-Chief Executive Officer, Co-President, Chief Operating Officer and Chief Financial Officer, Franklin Resources, Inc. (global investment management organization). | 144 | None | ||||
| Philip A. Taylor2 — 1954 Trustee, President and Principal Executive Officer | 2006 | Head of North American Retail and Senior Managing Director, Invesco Ltd.; Director, Co-Chairman, Co-President and Co-Chief Executive Officer, Invesco Advisers, Inc. (formerly known as Invesco Institutional (N.A.), Inc.) (registered investment adviser); Director, Chairman, Chief Executive Officer and President, Invesco Management Group, Inc. (formerly known as Invesco Aim Management Group, Inc.) (financial services holding company); Director and President, INVESCO Funds Group, Inc. (registered investment adviser and registered transfer agent); Director and Chairman, Invesco Investment Services, Inc. (formerly known as Invesco Aim Investment Services, Inc.) (registered transfer agent) and IVZ Distributors, Inc. (formerly known as INVESCO Distributors, Inc.) (registered broker dealer); Director, President and Chairman, Invesco Inc. (holding company), Invesco Canada Holdings Inc. (holding company), Trimark Investments Ltd./Placements Trimark Ltèe and Invesco Financial Services Ltd/Services Financiers Invesco Ltèe; Chief Executive Officer, Invesco Corporate Class Inc. (corporate mutual fund company) Director, Chairman and Chief Executive Officer, Invesco Canada Ltd. (formerly known as Invesco Trimark Ltd./Invesco Trimark Ltèe) (registered investment adviser and registered transfer agent); Trustee, President and Principal Executive Officer, The Invesco Funds (other than AIM Treasurer’s Series Trust (Invesco Treasurer’s Series Trust), Short-Term Investments Trust and Invesco Management Trust); Trustee and Executive Vice President, The Invesco Funds (AIM Treasurer’s Series Trust (Invesco Treasurer’s Series Trust), Short-Term Investments Trust and Invesco Management Trust only); Director, Invesco Investment Advisers LLC (formerly known as Van Kampen Asset Management); Director, Chief Executive Officer and President, Van Kampen Exchange Corp.
Formerly: Chief Executive Officer, Invesco Canada Fund Inc (corporate mutual fund company); Director and Chairman, Van Kampen Investor Services Inc.; Director, Chief Executive Officer and President, 1371 Preferred Inc. (holding company) and Van Kampen Investments Inc.; Director and President, AIM GP Canada Inc. (general partner for limited partnerships) and Van Kampen Advisors, Inc.; Director and Chief Executive Officer, Invesco Trimark Dealer Inc. (registered broker dealer); Director, Invesco Distributors, Inc. (formerly known as Invesco Aim Distributors, Inc.) (registered broker dealer); Manager, Invesco PowerShares Capital Management LLC; Director, Chief Executive Officer and President, Invesco Advisers, Inc.; Director, Chairman, Chief Executive Officer and President, Invesco Aim Capital Management, Inc.; President, Invesco Trimark Dealer Inc. and Invesco Trimark Ltd./Invesco Trimark Ltèe; Director and President, AIM Trimark Corporate Class Inc. and AIM Trimark Canada Fund Inc.; Senior Managing Director, Invesco Holding Company Limited; Director and Chairman, Fund Management Company (former registered broker dealer); President and Principal Executive Officer, The Invesco Funds (AIM Treasurer’s Series Trust (Invesco Treasurer’s Series Trust), and Short-Term Investments Trust only); President, AIM Trimark Global Fund Inc. and AIM Trimark Canada Fund Inc.. | 144 | None |
| 1 | Mr. Flanagan is considered an interested person (within the meaning of Section 2(a)(19) of the 1940 Act) of the Trust because he is an officer of the Adviser to the Trust, and an officer and a director of Invesco Ltd., ultimate parent of the Adviser. |
| 2 | Mr. Taylor is considered an interested person (within the meaning of Section 2(a)(19) of the 1940 Act) of the Trust because he is an officer and a director of the Adviser. |
T-1 Invesco Floating Rate Fund
Trustees and Officers—(continued)
| Name, Year of Birth and Position(s) Held with the Trust | Trustee and/ or Officer Since | Principal Occupation(s) During Past 5 Years | Number of Funds in Fund Complex Overseen by Trustee | Other Directorship(s) Held by Trustee During Past 5 Years | ||||
| Independent Trustees | ||||||||
Bruce L. Crockett — 1944 Trustee and Chair | 2003 | Chairman, Crockett Technologies Associates (technology consulting company)
Formerly: Director, Captaris (unified messaging provider); Director, President and Chief Executive Officer, COMSAT Corporation; Chairman, Board of Governors of INTELSAT (international communications company); ACE Limited (insurance company); Independent Directors Council and Investment Company Institute | 144 | ALPS (Attorneys Liability Protection Society) (insurance company) and Globe Specialty Metals, Inc. (metallurgical company) | ||||
David C. Arch — 1945 Trustee | 2010 | Chairman of Blistex Inc., a consumer health care products manufacturer | 144 | Board member of the Illinois Manufacturers’ Association; Member of the Board of Visitors, Institute for the Humanities, University of Michigan; Member of the Audit Committee of the Edward-Elmhurst Hospital | ||||
James T. Bunch — 1942 Trustee | 2000 | Managing Member, Grumman Hill Group LLC (family office/private equity investments)
Formerly: Founder, Green Manning & Bunch Ltd. (investment banking firm) (1988-2010); Executive Committee, United States Golf Association; and Chairman, Board of Governors, Western Golf Association | 144 | Chairman of the Board of Trustees, Evans Scholars Foundation; and Chairman of the Board, Denver Film Society | ||||
Rodney F. Dammeyer — 1940 Trustee | 2010 | Chairman of CAC, LLC, (private company offering capital investment and management advisory services)
Formerly: Prior to 2001, Managing Partner at Equity Group Corporate Investments; Prior to 1995, Chief Executive Officer of Itel Corporation (formerly Anixter International); Prior to 1985, experience includes Senior Vice President and Chief Financial Officer of Household International, Inc., Executive Vice President and Chief Financial Officer of Northwest Industries, Inc. and Partner of Arthur Andersen & Co.; From 1987 to 2010, Director/Trustee of investment companies in the Van Kampen Funds complex | 144 | Director of Quidel Corporation and Stericycle, Inc. | ||||
Albert R. Dowden — 1941 Trustee | 2003 | Director of a number of public and private business corporations, including the Boss Group, Ltd. (private investment and management); Nature’s Sunshine Products, Inc. and Reich & Tang Funds (5 portfolios) (registered investment company)
Formerly: Director, Homeowners of America Holding Corporation/Homeowners of America Insurance Company (property casualty company); Director, Continental Energy Services, LLC (oil and gas pipeline service); Director, CompuDyne Corporation (provider of product and services to the public security market) and Director, Annuity and Life Re (Holdings), Ltd. (reinsurance company); Director, President and Chief Executive Officer, Volvo Group North America, Inc.; Senior Vice President, AB Volvo; Director of various public and private corporations; Chairman, DHJ Media, Inc.; Director, Magellan Insurance Company; and Director, The Hertz Corporation, Genmar Corporation (boat manufacturer), National Media Corporation; Advisory Board of Rotary Power International (designer, manufacturer, and seller of rotary power engines); and Chairman, Cortland Trust, Inc. (registered investment company) | 144 | Director of: Nature’s Sunshine Products, Inc., Reich & Tang Funds, Homeowners of America Holding Corporation/ Homeowners of America Insurance Company, the Boss Group | ||||
Jack M. Fields — 1952 Trustee | 2003 | Chief Executive Officer, Twenty First Century Group, Inc. (government affairs company); Owner and Chief Executive Officer, Dos Angeles Ranch, L.P. (cattle, hunting, corporate entertainment); and Discovery Global Education Fund (non-profit)
Formerly: Chief Executive Officer, Texana Timber LP (sustainable forestry company); Director of Cross Timbers Quail Research Ranch (non-profit); and member of the U.S. House of Representatives | 144 | Insperity, Inc. (formerly known as Administaff) | ||||
Prema Mathai-Davis — 1950 Trustee | 2003 | Retired. Formerly: Chief Executive Officer, YWCA of the U.S.A. | 144 | None | ||||
Larry Soll — 1942 Trustee | 1997 | Retired. Formerly: Chairman, Chief Executive Officer and President, Synergen Corp. (a biotechnology company) | 144 | None | ||||
Hugo F. Sonnenschein — 1940 Trustee | 2010 | President Emeritus and Honorary Trustee of the University of Chicago and the Adam Smith Distinguished Service Professor in the Department of Economics at the University of Chicago. Prior to 2000, President of the University of Chicago | 144 | Trustee of the University of Rochester and a member of its investment committee; Member of the National Academy of Sciences and the American Philosophical Society; Fellow of the American Academy of Arts and Sciences | ||||
| Raymond Stickel, Jr. — 1944 Trustee | 2005 | Retired. Formerly: Director, Mainstay VP Series Funds, Inc. (25 portfolios) and Partner, Deloitte & Touche | 144 | None |
T-2 Invesco Floating Rate Fund
Trustees and Officers—(continued)
| Name, Year of Birth and Position(s) Held with the Trust | Trustee and/ or Officer Since | Principal Occupation(s) During Past 5 Years | Number of Funds in Fund Complex Overseen by Trustee | Other Directorship(s) Held by Trustee During Past 5 Years | ||||
| Independent Trustees—(continued) | ||||||||
Suzanne H. Woolsey — 1941 Trustee | 2014 | Chief Executive Officer of Woolsey Partners LLC | 144 | Emeritus Chair of the Board of Trustees of the Institute for Defense Analyses; Trustee of Colorado College; Trustee of California Institute of Technology; Prior to 2014, Director of Fluor Corp.; Prior to 2010, Trustee of the German Marshall Fund of the United States; Prior to 2010 Trustee of the Rocky Mountain Institute | ||||
| Other Officers | ||||||||
Russell C. Burk — 1958 Senior Vice President and Senior Officer | 2005 | Senior Vice President and Senior Officer, The Invesco Funds | N/A | N/A | ||||
John M. Zerr — 1962 Senior Vice President, Chief Legal Officer and Secretary | 2006 | Director, Senior Vice President, Secretary and General Counsel, Invesco Management Group, Inc. (formerly known as Invesco Aim Management Group, Inc.) and Van Kampen Exchange Corp.; Senior Vice President, Invesco Advisers, Inc. (formerly known as Invesco Institutional (N.A.), Inc.) (registered investment adviser); Senior Vice President and Secretary, Invesco Distributors, Inc. (formerly known as Invesco Aim Distributors, Inc.); Director, Vice President and Secretary, Invesco Investment Services, Inc. (formerly known as Invesco Aim Investment Services, Inc.) and IVZ Distributors, Inc. (formerly known as INVESCO Distributors, Inc.); Director and Vice President, INVESCO Funds Group, Inc.; Senior Vice President, Chief Legal Officer and Secretary, The Invesco Funds; Managing Director, Invesco PowerShares Capital Management LLC; Director, Secretary and General Counsel, Invesco Investment Advisers LLC (formerly known as Van Kampen Asset Management); Secretary and General Counsel, Invesco Capital Markets, Inc. (formerly known as Van Kampen Funds Inc.) and Chief Legal Officer, PowerShares Exchange-Traded Fund Trust, PowerShares Exchange-Traded Fund Trust II, PowerShares India Exchange-Traded Fund Trust, PowerShares Actively Managed Exchange-Traded Fund Trust, and PowerShares Actively Managed Exchange-Traded Commodity Fund Trust
Formerly: Director and Vice President, Van Kampen Advisors Inc.; Director, Vice President, Secretary and General Counsel, Van Kampen Investor Services Inc.; Director, Invesco Distributors, Inc. (formerly known as Invesco Aim Distributors, Inc.); Director, Senior Vice President, General Counsel and Secretary, Invesco Aim Advisers, Inc. and Van Kampen Investments Inc.; Director, Vice President and Secretary, Fund Management Company; Director, Senior Vice President, Secretary, General Counsel and Vice President, Invesco Aim Capital Management, Inc.; Chief Operating Officer and General Counsel, Liberty Ridge Capital, Inc. (an investment adviser); Vice President and Secretary, PBHG Funds (an investment company) and PBHG Insurance Series Fund (an investment company); Chief Operating Officer, General Counsel and Secretary, Old Mutual Investment Partners (a broker-dealer); General Counsel and Secretary, Old Mutual Fund Services (an administrator) and Old Mutual Shareholder Services (a shareholder servicing center); Executive Vice President, General Counsel and Secretary, Old Mutual Capital, Inc. (an investment adviser); and Vice President and Secretary, Old Mutual Advisors Funds (an investment company) | N/A | N/A | ||||
| Sheri Morris — 1964 Vice President, Treasurer and Principal Financial Officer | 2003 | Vice President, Treasurer and Principal Financial Officer, The Invesco Funds; Vice President, Invesco Advisers, Inc. (formerly known as Invesco Institutional (N.A.), Inc.) (registered investment adviser); and Vice President, PowerShares Exchange-Traded Fund Trust, PowerShares Exchange-Traded Fund Trust II, PowerShares India Exchange-Traded Fund Trust, PowerShares Actively Managed Exchange-Traded Fund Trust, and PowerShares Actively Managed Exchange-Traded Commodity Fund Trust
Formerly: Vice President, Invesco Aim Advisers, Inc., Invesco Aim Capital Management, Inc. and Invesco Aim Private Asset Management, Inc.; Assistant Vice President and Assistant Treasurer, The Invesco Funds and Assistant Vice President, Invesco Advisers, Inc., Invesco Aim Capital Management, Inc. and Invesco Aim Private Asset Management, Inc.; and Treasurer, PowerShares Exchange-Traded Fund Trust, PowerShares Exchange-Traded Fund Trust II, PowerShares India Exchange-Traded Fund Trust and PowerShares Actively Managed Exchange-Traded Fund Trust | N/A | N/A | ||||
T-3 Invesco Floating Rate Fund
Trustees and Officers—(continued)
| Name, Year of Birth and Position(s) Held with the Trust | Trustee and/ or Officer Since | Principal Occupation(s) During Past 5 Years | Number of Funds in Fund Complex Overseen by Trustee | Other Directorship(s) Held by Trustee During Past 5 Years | ||||
| Other Officers—(continued) | ||||||||
| Karen Dunn Kelley — 1960 Vice President | 2003 | Senior Managing Director, Investments, Invesco Ltd.; Director, Co-President, Co-Chief Executive Officer, and Co-Chairman, Invesco Advisers, Inc. (formerly known as Invesco Institutional (N.A.), Inc.) (registered investment adviser); Chairman, Invesco Senior Secured Management, Inc.; Senior Vice President, Invesco Management Group, Inc. (formerly known as Invesco Aim Management Group, Inc.); Executive Vice President, Invesco Distributors, Inc. (formerly known as Invesco Aim Distributors, Inc.); Director, Invesco Mortgage Capital Inc. and Invesco Management Company Limited; Vice President, The Invesco Funds (other than AIM Treasurer’s Series Trust (Invesco Treasurer’s Series Trust), Short-Term Investments Trust and Invesco Management Trust); and President and Principal Executive Officer, The Invesco Funds (AIM Treasurer’s Series Trust (Invesco Treasurer’s Series Trust), Short-Term Investments Trust and Invesco Management Trust only)
Formerly: Director and President, INVESCO Asset Management (Bermuda) Ltd., Director, INVESCO Global Asset Management Limited and INVESCO Management S.A.; Senior Vice President, Van Kampen Investments Inc. and Invesco Advisers, Inc. (formerly known as Invesco Institutional (N.A.), Inc.) (registered investment adviser); Vice President, Invesco Advisers, Inc. (formerly known as Invesco Institutional (N.A.), Inc.); Director of Cash Management and Senior Vice President, Invesco Advisers, Inc. and Invesco Aim Capital Management, Inc.; Director and President, Fund Management Company; Chief Cash Management Officer, Director of Cash Management, Senior Vice President, and Managing Director, Invesco Aim Capital Management, Inc.; Director of Cash Management, Senior Vice President, and Vice President, Invesco Advisers, Inc. and The Invesco Funds (AIM Treasurer’s Series Trust (Invesco Treasurer’s Series Trust), and Short-Term Investments Trust only) | N/A | N/A | ||||
| Crissie M. Wisdom — 1969 Anti-Money Laundering Compliance Officer | 2013 | Anti-Money Laundering Compliance Officer, Invesco Advisers, Inc. (formerly known as Invesco Institutional (N.A.), Inc.) (registered investment adviser), Invesco Capital Markets, Inc. (formerly known as Van Kampen Funds Inc.), Invesco Distributors, Inc., Invesco Investment Services, Inc., Invesco Management Group, Inc., Van Kampen Exchange Corp., The Invesco Funds, and PowerShares Exchange-Traded Fund Trust, PowerShares Exchange-Traded Fund Trust II, PowerShares India Exchange-Traded Fund Trust, PowerShares Actively Managed Exchange-Traded Fund Trust and PowerShares Actively Managed Exchange-Traded Commodity Fund Trust; Anti-Money Laundering Compliance Officer and Bank Secrecy Act Officer, INVESCO National Trust Company and Invesco Trust Company; and Fraud Prevention Manager and Controls and Risk Analysis Manager for Invesco Investment Services, Inc.. | N/A | N/A | ||||
Lisa O. Brinkley — 1959 Chief Compliance Officer | 2004 | Senior Vice President and Chief Compliance Officer, Invesco Advisers, Inc. (registered investment adviser) (formerly known as Invesco Institutional (N.A., Inc.); and Chief Compliance Officer, The Invesco Funds
Formerly: Global Assurance Officer, Invesco Ltd. and Vice President, The Invesco Funds; Chief Compliance Officer, Invesco Distributors, Inc. (formerly known as Invesco Aim Distributors, Inc.), Invesco Investment Services, Inc.(formerly known as Invesco Aim Investment Services, Inc.) and Van Kampen Investor Services Inc.; Senior Vice President, Invesco Management Group, Inc.; Senior Vice President and Chief Compliance Officer, Invesco Advisers, Inc. and The Invesco Funds; Vice President and Chief Compliance Officer, Invesco Aim Capital Management, Inc. and Invesco Distributors, Inc.; Vice President, Invesco Investment Services, Inc. and Fund Management Company. | N/A | N/A |
The Statement of Additional Information of the Trust includes additional information about the Fund’s Trustees and is available upon request, without charge, by calling 1.800.959.4246. Please refer to the Fund’s prospectus for information on the Fund’s sub-advisers.
Office of the Fund 11 Greenway Plaza, Suite 1000 Houston, TX 77046-1173 | Investment Adviser Invesco Advisers, Inc. 1555 Peachtree Street, N.E. Atlanta, GA 30309 | Distributor Invesco Distributors, Inc. 11 Greenway Plaza, Suite 1000 Houston, TX 77046-1173 | Auditors PricewaterhouseCoopers LLP 1000 Louisiana Street, Suite 5800 Houston, TX 77002-5678 | |||
Counsel to the Fund Stradley Ronon Stevens & Young, LLP 2005 Market Street, Suite 2600 Philadelphia, PA 19103-7018 | Counsel to the Independent Trustees Goodwin Procter LLP 901 New York Avenue, N.W. Washington, D.C. 20001 | Transfer Agent Invesco Investment Services, Inc. 11 Greenway Plaza, Suite 1000 Houston, TX 77046-1173 | Custodian State Street Bank and Trust Company 225 Franklin Street Boston, MA 02110-2801 | |||
T-4 Invesco Floating Rate Fund

Invesco mailing information
Send general correspondence to Invesco Investment Services, Inc., P.O. Box 219078, Kansas City, MO 64121-9078.
Important notice regarding delivery of security holder documents
To reduce Fund expenses, only one copy of most shareholder documents may be mailed to shareholders with multiple accounts at the same address (Householding). Mailing of your shareholder documents may be householded indefinitely unless you instruct us otherwise. If you do not want the mailing of these documents to be combined with those for other members of your household, please contact Invesco Investment Services, Inc. at 800 959 4246 or contact your financial institution. We will begin sending you individual copies for each account within 30 days after receiving your request.
Fund holdings and proxy voting information
The Fund provides a complete list of its holdings four times in each fiscal year, at the quarter ends. For the second and fourth quarters, the lists appear in the Fund’s semiannual and annual reports to shareholders. For the first and third quarters, the Fund files the lists with the Securities and Exchange Commission (SEC) on Form N-Q. The most recent list of portfolio holdings is available at invesco.com/completeqtrholdings. Shareholders can also look up the Fund’s Forms
N-Q on the SEC website at sec.gov. Copies of the Fund’s Forms N-Q may be reviewed and copied at the SEC Public Reference Room in Washington, D.C. You can obtain information on the operation of the Public Reference Room, including information about duplicating fee charges, by calling 202 551 8090 or 800 732 0330, or by electronic request at the following email address: publicinfo@sec.gov.
The SEC file numbers for the Fund are shown below.
A description of the policies and procedures that the Fund uses to determine how to vote proxies relating to portfolio securities is available without charge, upon request, from our Client Services department at 800 959 4246 or at invesco.com/proxyguidelines. The information is also available on the SEC website, sec.gov.
Information regarding how the Fund voted proxies related to its portfolio securities during the most recent 12-month period ended June 30 is available at invesco.com/proxysearch. The information is also available on the SEC website, sec.gov. Invesco Advisers, Inc. is an investment adviser; it provides investment advisory services to individual and institutional clients and does not sell securities. Invesco Distributors, Inc. is the US distributor for Invesco Ltd.’s retail mutual funds, exchange-traded funds and institutional money market funds. Both are wholly owned, indirect subsidiaries of Invesco Ltd. |  |
SEC file numbers: 811-09913 and 333-36074 FLR-AR-1 Invesco Distributors, Inc.
| ||||
| Annual Report to Shareholders
| August 31, 2015 | ||
Invesco Global Real Estate Income Fund | ||||
Nasdaq: A: ASRAX ¡ B: SARBX ¡ C: ASRCX ¡ Y: ASRYX ¡ R5: ASRIX ¡ R6: ASRFX | ||||


Letters to Shareholders
| Dear Shareholders: This annual report includes information about your Fund, including performance data and a complete list of its investments as of the close of the reporting period. Inside is a discussion of how your Fund was managed and the factors that affected its performance during the reporting period. I hope you find this report of interest. The US economy expanded and unemployment declined throughout the reporting period. The sharp drop in oil prices that began in mid-2014 continued to benefit consumers, but a strong US dollar crimped corporate profits. The US Federal Reserve signaled that it was increasingly likely to raise interest rates, based on generally positive economic data, but uncertainty remained about when it would act. Overseas, the story was much different. Low energy prices hurt the economies of some oil-producing nations, such as Brazil and Russia. During the reporting period, the European Central Bank as well as central banks in China and | |
| Japan – among other countries – either instituted or maintained extraordinarily accommodative monetary policies in response to economic weakness. | ||
 Philip Taylor
Investor uncertainty, such as we saw for much of the reporting period – and market volatility, such as we saw at the end of the reporting period – are unfortunate facts of life when it comes to investing. Some investors use these things as excuses to delay saving and investing for their long-term financial goals. That’s why Invesco encourages investors to work with a professional financial adviser who can stress the importance of starting to save and invest early and the importance of adhering to a disciplined investment plan – when times are good and when they’re uncertain. A financial adviser who knows your unique financial situation, investment goals and risk tolerance can be an invaluable partner as you seek to achieve your financial goals. He or she can offer a long-term perspective when markets are volatile and time-tested advice and guidance when your financial situation or investment goals change.
Timely information when and where you want it
Invesco’s efforts to help investors achieve their financial objectives include providing individual investors and financial professionals with timely information about the markets, the economy and investing – whenever and wherever they want it.
Our website, invesco.com/us, offers a wide range of market insights and investment perspectives. On the website, you’ll find detailed information about our funds, including prices, performance, holdings and portfolio manager commentaries. You can access information about your account by completing a simple, secure online registration. Click on the “Need to register” link in the “Account Access” box on our homepage to get started.
Invesco’s mobile apps for iPhone® and iPad® (both available free from the App StoreSM) allow you to obtain the same detailed information, monitor your account and create customizable watch lists. Also, they allow you to access investment insights from our investment leaders, market strategists, economists and retirement experts. You can sign up to be alerted when new commentary is added, and you can watch portfolio manager videos and have instant access to Invesco news and updates wherever you may be.
In addition to the resources accessible on our website and through our mobile app, you can obtain timely updates to help you stay informed about the markets, the economy and investing by connecting with Invesco on Twitter, LinkedIn or Facebook. You can access our blog at blog.invesco.us.com. Our goal is to provide you the information you want, when and where you want it.
Have questions?
For questions about your account, feel free to contact an Invesco client services representative at 800 959 4246. For Invesco-related questions or comments, please email me directly at phil@invesco.com.
All of us at Invesco look forward to serving your investment management needs for many years to come. Thank you for investing with us.
Sincerely,

Philip Taylor
Senior Managing Director, Invesco Ltd.
iPhone and iPad are trademarks of Apple Inc., registered in the US and other countries. App Store is a service mark of Apple Inc. Invesco Distributors, Inc. is not affiliated with Apple Inc.
2 Invesco Global Real Estate Income Fund
Bruce Crockett | Dear Fellow Shareholders: Among the many important lessons I’ve learned in more than 40 years in a variety of business endeavors is the value of a trusted advocate. As independent chair of the Invesco Funds Board, I can assure you that the members of the Board are strong advocates for the interests of investors in Invesco’s mutual funds. We work hard to represent your interests through oversight of the quality of the investment management services your funds receive and other matters important to your investment, including but not limited to: n Ensuring that Invesco offers a diverse lineup of mutual funds that your financial adviser can use to strive to meet your financial needs as your investment goals change over time. n Monitoring how the portfolio management teams of the Invesco funds are performing in light of changing economic and market conditions. |

| n | Assessing each portfolio management team’s investment performance within the context of the investment strategy described in the fund’s prospectus. |
| n | Monitoring for potential conflicts of interests that may impact the nature of the services that your funds receive. |
We believe one of the most important services we provide our fund shareholders is the annual review of the funds’ advisory and sub-advisory contracts with Invesco Advisers and its affiliates. This review is required by the Investment Company Act of 1940 and focuses on the nature and quality of the services Invesco provides as the adviser to the Invesco funds and the reasonableness of the fees that it charges for those services. Each year, we spend months carefully reviewing information received from Invesco and a variety of independent sources, such as performance and fee data prepared by Lipper Inc., an independent, third-party firm widely recognized as a leader in its field. We also meet with our independent legal counsel and other independent advisers to review and help us assess the information that we have received. Our goal is to assure that you receive quality investment management services for a reasonable fee.
I trust the measures outlined above provide assurance that you have a worthy advocate when it comes to choosing the Invesco Funds.
As always, please contact me at bruce@brucecrockett.com with any questions or concerns you may have. On behalf of the Board, we look forward to continuing to represent your interests and serving your needs.
Sincerely,

Bruce L. Crockett
Independent Chair
Invesco Funds Board of Trustees
3 Invesco Global Real Estate Income Fund
Management’s Discussion of Fund Performance
Performance summary For the fiscal year ended August 31, 2015, Class A shares of Invesco Global Real Estate Income Fund (the Fund), at net asset value (NAV), produced a negative return that outperformed the Fund’s style-specific benchmark, the Custom Global Real Estate Income Index. Your Fund’s long-term performance appears later in this report.
|
| |||
Fund vs. Indexes Total returns, 8/31/14 to 8/31/15, at net asset value (NAV). Performance shown does not include applicable contingent deferred sales charges (CDSC) or front-end sales charges, which would have reduced performance.
|
| |||
Class A Shares | -3.08 | % | ||
Class B Shares | -3.83 | |||
Class C Shares | -3.83 | |||
Class Y Shares | -2.75 | |||
Class R5 Shares | -2.68 | |||
Class R6 Shares | -2.70 | |||
MSCI World Indexq (Broad Market Index) | -4.13 | |||
Custom Global Real Estate Income Indexn (Style-Specific Index) | -4.78 | |||
| Lipper Global Real Estate Funds Classification Average¿ (Peer Group Index) | -4.45 | |||
| Source(s): qFactSet Research Systems Inc.; nInvesco, FactSet Research Systems Inc.; ¿Lipper Inc. | ||||
Market conditions and your Fund
We evaluate securities for the Fund based primarily on the relative attractiveness of income with a secondary consideration for the potential for capital appreciation. The qualified investment universe includes global public real estate equity and debt securities, including common stock, preferred securities, corporate debt and commercial mortgage-backed securities (CMBS). When constructing the portfolio, we first set a strategic equity versus debt asset allocation and then apply a fundamentals-driven investment process in an effort to identify securities with certain characteristics including: attractive relative yields, favorable property market outlook, and attractive valuations relative to peer investment alternatives.
While overall global growth remained positive during the fiscal year ended August 31, 2015, there was a great deal of variation from region to region, and
country to country, in the rate of growth, the sustainability of growth and the risks to continued growth. Most importantly, the US economy has been trending relatively well, despite the pullback in crude oil prices and equities. Economic growth in China, Japan and the eurozone remained weak, however, and as such, the use of historically unconventional means of economic stimulus remained necessary. Economic rebalancing and balance sheet repair still remain key themes in many nations’ economies and continue to be reflected in below-long-term-average gross domestic product growth and very modest inflationary pressures.
In most key real estate markets around the world, supply of newly developed buildings has been low since the global financial crisis, and vacancy levels have declined since 2009. This is resulting in many real estate markets, particularly
those in the US, now experiencing rental growth as improved trade, employment or consumption growth become reflected in demand for space. Security of existing earnings from lease contracts and the effect of low interest rates are proving supportive for cash flow from the sector.
Global real estate equities, as measured by the FTSE EPRA/NAREIT Developed Index, declined during the reporting period. This performance was generally in line with broad global equity markets, as measured by the MSCI World Index.
On an absolute basis, preferred securities, convertible preferred securities and CMBS contributed to Fund performance during the fiscal year. Common stocks and corporate debt detracted from performance during the fiscal year largely as a result of investor reaction to rising interest rates in the US, falling crude oil prices and the resulting impact on real estate demand, and concern about sluggish economic growth in Asia.
From a sector standpoint, residential, self-storage and health care real estate investment trusts (REITs) – generally more defensive sectors – contributed to absolute Fund performance. Diversified real estate companies, which are primarily international companies, were the largest detractor from Fund performance given growth concerns abroad. Additionally, industrial and office REITs, which tend to be more economically sensitive sectors, also detracted from absolute Fund performance. From a country standpoint, the US was the largest contributor to performance, while Japan and Australia were the largest detractors.
In light of increased volatility among equities, we reduced the Fund’s exposure to real estate common stocks during the reporting period. The equity portion of the Fund was focused on companies we believed may be able to grow their
Portfolio Composition
By country
United States | 62.3 | % | ||
Australia | 7.2 | |||
United Kingdom | 6.7 | |||
Japan | 6.4 | |||
Hong Kong | 3.5 | |||
France | 3.3 | |||
Singapore | 2.5 | |||
| Countries each less than 2.0% of the portfolio | 7.0 | |||
Other Assets Less Liabilities | 1.1 |
Top 10 Equity Holdings*
| 1. | Unibail-Rodamco S.E. | 2.7% | ||
| 2. | Land Securities Group PLC | 2.6 | ||
| 3. | Ventas, Inc. | 1.9 | ||
| 4. | Essex Property Trust, Inc., Series H, 7.13% Pfd. | 1.6 | ||
| 5. | Hudson Pacific Properties Inc., Series B, 8.38% Pfd. | 1.6 | ||
6. | Stockland | 1.5 | ||
| 7. | Simon Property Group, Inc. | 1.5 | ||
| 8. | LaSalle Hotel Properties | 1.4 | ||
| 9. | Mid-America Apartment Communities, Inc. | 1.4 | ||
| 10. | Brixmor Property Group, Inc. | 1.4 |
Total Net Assets | $ | 1.0 billion | ||
Total Number of Holdings* | 159 |
The Fund’s holdings are subject to change, and there is no assurance that the Fund will continue to hold any particular security.
*Excluding money market fund holdings.
4 Invesco Global Real Estate Income Fund
underlying cash flows and increase their dividends. The fixed income portion of the Fund sought to minimize interest rate risk while maximizing return potential. Thus, we maintained a short duration on our fixed income investments, as we believed interest rates could rise. Further-more, a significant portion of our fixed income investments were floating rate securities, which have yields that increase if interest rates rise. For our preferred securities allocation, we remained focused on higher-paying coupons with shorter-dated call schedules, which we believed may have the opportunity to be less volatile compared with those that have lower coupons and longer-dated call schedules.
The Fund has the flexibility to invest across equities and fixed income securities on a global basis, in an effort to take advantage of market dislocations driven by capital market influences rather than underlying commercial real estate fundamentals. We remain committed to owning quality real estate companies that we believe may benefit from relatively better sector trends. We continue to seek to manage risk by holding a portfolio that is diversified by property type and geographic location. We also continue to favor lower-leveraged companies with above-average levels of dividend coverage in the portfolio.
We thank you for your continued investment in Invesco Global Real Estate Income Fund.
The views and opinions expressed in management’s discussion of Fund performance are those of Invesco Advisers, Inc. These views and opinions are subject to change at any time based on factors such as market and economic conditions. These views and opinions may not be relied upon as investment advice or recommendations, or as an offer for a particular security. The information is not a complete analysis of every aspect of any market, country, industry, security or the Fund. Statements of fact are from sources considered reliable, but Invesco Advisers, Inc. makes no representation or warranty as to their completeness or accuracy. Although historical performance is no guarantee of future results, these insights may help you understand our investment management philosophy.
See important Fund and, if applicable, index disclosures later in this report.
| Joe Rodriguez Portfolio Manager, is lead manager of Invesco Global Real Estate Income Fund. He is Head of Global Securities with | |
| Invesco Real Estate, where he overseas all phases of the unit, including securities research and administration. Mr. Rodriguez joined Invesco in 1990. He earned a BBA in economics and finance and an MBA in finance from Baylor University. | ||

 | Mark Blackburn Chartered Financial Analyst, Portfolio Manager, is manager of Invesco Global Real Estate Income Fund. He joined | |
| Invesco in 1998. Mr. Blackburn earned a BS in accounting from Louisiana State University and an MBA from Southern Methodist University. | ||
 | James Cowen Portfolio Manager, is manager of Invesco Global Real Estate Income Fund. He joined Invesco in 2000. Mr. Cowen | |
| earned a Master of Town and Country Planning degree from the University of Manchester and a Master of Philosophy degree in land economy from Cambridge University. | ||
 | Paul Curbo Chartered Financial Analyst, Portfolio Manager, is manager of Invesco Global Real Estate Income Fund. He joined | |
| Invesco in 1998. Mr. Curbo earned a BBA in finance from The University of Texas at Austin. | ||
 | Darin Turner Portfolio Manager, is manager of Invesco Global Real Estate Income Fund. He joined Invesco in 2005. Mr. Turner | |
| earned a BBA in finance from Baylor University, an MS in real estate from The University of Texas at Arlington and an MBA specializing in investments from Southern Methodist University. | ||
 | Ping-Ying Wang Chartered Financial Analyst, Portfolio Manager, is manager of Invesco Global Real Estate Income Fund. She joined | |
| Invesco in 1998. Ms. Wang earned a BS in international finance from the People’s University of China and a PhD in finance from The University of Texas at Dallas. | ||
5 Invesco Global Real Estate Income Fund
Your Fund’s Long-Term Performance
Results of a $10,000 Investment – Oldest Share Class(es)
Fund and index data from 8/31/05
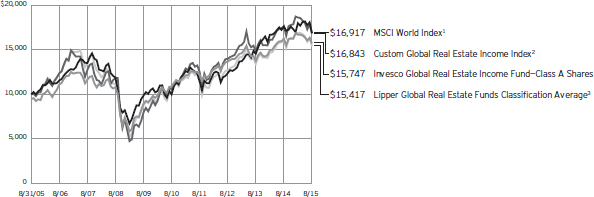
| 1 | Source: FactSet Research Systems Inc. |
| 2 | Source(s): Invesco, FactSet Research Systems Inc. |
| 3 | Source: Lipper Inc. |
Past performance cannot guarantee comparable future results.
The data shown in the chart include reinvested distributions, applicable sales charges and Fund expenses including
management fees. Index results include reinvested dividends, but they do not reflect sales charges. Performance of the peer group, if applicable, reflects fund expenses and management fees;
performance of a market index does not. Performance shown in the chart and table(s) does not reflect deduction of taxes a shareholder would pay on Fund distributions or sale of Fund shares.
6 Invesco Global Real Estate Income Fund
Average Annual Total Returns |
| |||
As of 8/31/15, including maximum applicable sales charges |
| |||
Class A Shares | ||||
Inception (5/31/02) | 8.40 | % | ||
10 Years | 4.65 | |||
5 Years | 6.45 | |||
1 Year | -8.39 | |||
Class B Shares | ||||
10 Years | 4.43 | % | ||
5 Years | 6.54 | |||
1 Year | -8.48 | |||
Class C Shares | ||||
10 Years | 4.39 | % | ||
5 Years | 6.85 | |||
1 Year | -4.76 | |||
Class Y Shares | ||||
10 Years | 5.39 | % | ||
5 Years | 7.94 | |||
1 Year | -2.75 | |||
Class R5 Shares | ||||
10 Years | 5.58 | % | ||
5 Years | 8.05 | |||
1 Year | -2.68 | |||
Class R6 Shares | ||||
10 Years | 5.38 | % | ||
5 Years | 7.95 | |||
1 Year | -2.70 | |||
On March 12, 2007, the Fund reorganized from a Closed-End Fund to an Open-End Fund. Performance shown prior to that date is that of the Closed-End Fund’s Common shares and includes the fees applicable to Common shares.
Class B shares incepted on March 9, 2007. Performance shown prior to that date is that of Class A shares, restated to reflect the higher 12b-1 fees applicable to Class B shares.
Class C shares incepted on March 9, 2007. Performance shown prior to that date is that of Class A shares, restated to reflect the higher 12b-1 fees applicable to Class C shares.
Class Y shares incepted on October 3, 2008. Performance shown prior to that date is that of Class A shares and includes the 12b-1 fees applicable to Class A shares.
Class R5 shares incepted on March 9, 2007. Performance shown prior to that date is that of Class A shares and includes the 12b-1 fees applicable to Class A shares.
Class R6 shares incepted on September 24, 2012. Performance shown prior
Average Annual Total Returns |
| |||
| As of 6/30/15, the most recent calendar quarter end,including maximum applicable sales charges | ||||
Class A Shares | ||||
Inception (5/31/02) | 8.68 | % | ||
10 Years | 4.98 | |||
5 Years | 8.32 | |||
1 Year | -4.81 | |||
Class B Shares | ||||
10 Years | 4.75 | % | ||
5 Years | 8.45 | |||
1 Year | -4.79 | |||
Class C Shares | ||||
10 Years | 4.73 | % | ||
5 Years | 8.74 | |||
1 Year | -0.92 | |||
Class Y Shares | ||||
10 Years | 5.73 | % | ||
5 Years | 9.83 | |||
1 Year | 1.06 | |||
Class R5 Shares | ||||
10 Years | 5.91 | % | ||
5 Years | 9.92 | |||
1 Year | 1.02 | |||
Class R6 Shares | ||||
10 Years | 5.72 | % | ||
5 Years | 9.83 | |||
1 Year | 1.21 | |||
to that date is that of Class A shares and includes the 12b-1 fees applicable to Class A shares.
The performance data quoted represent past performance and cannot guarantee comparable future results; current performance may be lower or higher. Please visit invesco.com/performance for the most recent month-end performance. Performance figures reflect reinvested distributions (reinvested at net asset value, except for periods prior to March 12, 2007 where reinvestments were made at the lower of the Closed-End Fund’s net asset value or market price), changes in net asset value and the effect of the maximum sales charge unless otherwise stated. Investment return and principal value will fluctuate so that you may have a gain or loss when you sell shares.
The total annual Fund operating expense ratio set forth in the most recent Fund prospectus as of the date of this report for Class A, Class B, Class C, Class Y, Class R5 and Class R6 shares was 1.28%, 2.03%, 2.03%, 1.03%, 0.92% and 0.88%, respectively. The expense ratios presented
above may vary from the expense ratios presented in other sections of this report that are based on expenses incurred during the period covered by this report.
Class A share performance reflects the maximum 5.50% sales charge, and Class B and Class C share performance reflects the applicable contingent deferred sales charge (CDSC) for the period involved. The CDSC on Class B shares declines from 5% beginning at the time of purchase to 0% at the beginning of the seventh year. The CDSC on Class C shares is 1% for the first year after purchase. Class Y, Class R5 and Class R6 shares do not have a front-end sales charge or a CDSC; therefore, performance is at net asset value.
The performance of the Fund’s share classes will differ primarily due to different sales charge structures and class expenses.
Fund performance reflects any applicable fee waivers and/or expense reimbursements. Had the adviser not waived fees and/or reimbursed expenses currently or in the past, returns would have been lower. See current prospectus for more information.
Fund performance was positively impacted by a temporary 2% fee on redemptions that was in effect from March 12, 2007 to March 12, 2008. Without income from this temporary fee, returns would have been lower.
7 Invesco Global Real Estate Income Fund
Invesco Global Real Estate Income Fund’s investment objective is current income and, secondarily, capital appreciation.
| n | Unless otherwise stated, information presented in this report is as of August 31, 2015, and is based on total net assets. |
| n | Unless otherwise noted, all data provided by Invesco. |
| n | To access your Fund’s reports/prospectus, visit invesco.com/fundreports. |
About share classes
| n | On March 12, 2007, Invesco Select Real Estate Income Fund was reorganized from a Closed-End Fund to an Open-End Fund. Information presented for Class A shares prior to the reorganization included financial data for the Closed-End Fund’s Common Shares. |
| n | Class B shares may not be purchased for new or additional investments. Please see the prospectus for more information. |
| n | Class Y shares are available only to certain investors. Please see the prospectus for more information. |
| n | Class R5 shares and Class R6 shares are primarily intended for employer- sponsored retirement and benefit plans that meet certain standards and for institutional investors. Please see the prospectus for more information. |
Principal risks of investing in the Fund
| n | Changing fixed income market conditions risk. The current low interest rate environment was created in part by the Federal Reserve Board (FRB) and certain foreign central banks keeping the federal funds and equivalent foreign rates at or near zero. There is a risk that interest rates will rise when the FRB and central banks raise these rates. This risk is heightened due to the “tapering” of the FRB’s quantitative easing program and other similar foreign central bank actions. This tapering and eventual increase in the federal funds and equivalent foreign rates may expose fixed income markets to heightened volatility and reduced liquidity for certain fixed income investments, particularly those with longer maturities. In addition, decreases in fixed income dealer market-making capacity may also potentially lead to heightened volatility and reduced liquidity in the fixed income markets. As a result, the value of the Fund’s investments and share price may decline. Changes in central bank policies could also result in higher than normal |
shareholder redemptions, which could potentially increase portfolio turnover and the Fund’s transaction costs. |
| n | Credit risk. The issuer of instruments in which the Fund invests may be unable to meet interest and/or principal payments, thereby causing its instruments to decrease in value and lowering the issuer’s credit rating. |
| n | Depositary receipts risk. Depositary receipts involve many of the same risks as those associated with direct investment in foreign securities. In addition, the underlying issuers of certain depositary receipts, particularly unsponsored or unregistered depositary receipts, are under no obligation to distribute shareholder communications to the holders of such receipts or to pass through to them any voting rights with respect to the deposited securities. |
| n | Derivatives risk. The value of a derivative instrument depends largely on (and is derived from) the value of an underlying security, currency, commodity, interest rate, index or other asset (each referred to as an underlying asset). In addition to risks relating to the underlying assets, the use of derivatives may include other, possibly greater, risks, including counterparty, leverage and liquidity risks. Counterparty risk is the risk that the counterparty to the derivative contract will default on its obligation to pay the Fund the amount owed or otherwise perform under the derivative contract. Derivatives create leverage risk because they do not require payment up front equal to the economic exposure created by owning the derivative. As a result, an adverse change in the value of the underlying asset could result in the Fund sustaining a loss that is substantially greater than the amount invested in the derivative, which may make the Fund’s returns more volatile and increase the risk of loss. Derivative instruments may also be less liquid than more traditional investments and the Fund may be unable to sell or close out |
its derivative positions at a desirable time or price. This risk may be more acute under adverse market conditions, during which the Fund may be most in need of liquidating its derivative positions. Derivatives may also be harder to value, less tax efficient and subject to changing government regulation that could impact the Fund’s ability to use certain derivatives or their cost. Also, derivatives used for hedging or to gain or limit exposure to a particular market segment may not provide the expected benefits, particularly during adverse market conditions. |
| n | Developing/emerging markets securities risk. The prices of securities issued by foreign companies and governments located in developing/emerging markets countries may be affected more negatively by inflation, devaluation of their currencies, higher transaction costs, delays in settlement, adverse political developments, the introduction of capital controls, withholding taxes, nationalization of private assets, expropriation, social unrest, war or lack of timely information than those in developed countries. |
| n | Foreign securities risk. The Fund’s foreign investments may be affected by changes in a foreign country’s exchange rates, political and social instability, changes in economic or taxation policies, difficulties when enforcing obligations, decreased liquidity, and increased volatility. Foreign companies may be subject to less regulation resulting in less publicly available information about the companies. |
| n | High yield bond (junk bond) risk. Junk bonds involve a greater risk of default or price changes due to changes in the credit quality of the issuer. The values of junk bonds fluctuate more than those of high- quality bonds in response to company, political, regulatory or economic developments. Values of junk bonds can decline significantly over short periods of time. |
| n | Interest rate risk. Interest rate risk refers to the risk that bond prices generally fall as interest rates rise; conversely, bond prices generally rise as interest rates fall. Specific bonds differ in their sensitivity to changes in interest rates depending on their individual characteristics, including duration. |
This report must be accompanied or preceded by a currently effective Fund prospectus, which contains more complete information, including sales charges and expenses. Investors should read it carefully before investing.
NOT FDIC INSURED | MAY LOSE VALUE | NO BANK GUARANTEE |
8 Invesco Global Real Estate Income Fund
| n | Management risk. The investment techniques and risk analysis used by the Fund’s portfolio managers may not produce the desired results. |
| n | Market risk. The prices of and the income generated by the Fund’s securities may decline in response to, among other things, investor sentiment, general economic and market conditions, regional or global instability, and currency and interest rate fluctuations. |
| n | Mortgage- and asset-backed securities risk. The Fund may invest in mortgage- and asset-backed securities that are subject to prepayment or call risk, which is the risk that the borrower’s payments may be received earlier or later than expected due to changes in prepayment rates on underlying loans. Faster prepayments often happen when interest rates are falling. As a result, the Fund may reinvest these early payments at lower interest rates, thereby reducing the Fund’s income. Conversely, when interest rates rise, prepayments may happen more slowly, causing the security to lengthen in duration. Longer duration securities tend to be more volatile. Securities may be prepaid at a price less than the original purchase value. An unexpectedly high rate of defaults on the mortgages held by a mortgage pool may adversely affect the value of mortgage-backed securities and could result in losses to the Fund. The risk of such defaults is generally higher in the case of mortgage pools that include subprime mortgages. Subprime mortgages refer to loans made to borrowers with weakened credit histories or with lower capacity to make timely payments on their mortgages. |
| n | REIT risk/real estate risk. The Fund concentrates its investments in the securities of real estate and real estate related companies. Investments in real estate related instruments may be affected by economic, legal, cultural, environmental or technological factors that affect property values, rents or occupancies of real estate related to the Fund’s holdings. Shares of real estate related companies, which tend to be small- and mid-cap companies, may be more volatile and less liquid. If a real estate related company defaults on |
certain types of debt obligations, the Fund may own real estate directly, which involves additional risks such as environmental liabilities; difficulty in valuing and selling the real estate; and economic or regulatory changes. |
| n | Short sales risk. Short sales may cause the Fund to repurchase a security at a higher price, thereby causing the Fund to incur a loss. A short position in a security poses more risk than holding the same security long. As there is no limit on how much the price of the security can increase, the Fund’s exposure is unlimited. In order to establish a short position in a security, the Fund must borrow the security from a broker. The Fund may not always be able to borrow a security the Fund seeks to sell short at a particular time or at an acceptable price. The Fund also may not always be able to close out the short position by replacing the borrowed securities at a particular time or at an acceptable price. The Fund will incur increased transaction costs associated with selling securities short. In addition, taking short positions in securities results in a form of leverage which may cause the Fund to be volatile. |
| n | Small- and mid-capitalization risks. Stocks of small- and mid-sized companies tend to be more vulnerable to adverse developments and may have little or no operating history or track record of success, and limited product lines, markets, management and financial resources. The securities of small- and mid-sized companies may be more volatile due to less market interest and less publicly available information about the issuer. They also may be illiquid or restricted as to resale, or may trade less frequently and in smaller volumes, all of which may cause difficulty when establishing or closing a position at a desirable price. |
About indexes used in this report
| n | The MSCI World Index is an unmanaged index considered representative of stocks of developed countries. The index is computed using the net return, which withholds applicable taxes for non-resident investors. |
| n | The Custom Global Real Estate Income Index is an index composed of |
the FTSE NAREIT All Equity REIT Index through August 31, 2011, and FTSE EPRA/NAREIT Developed Index thereafter, which is computed using the net return by withholding applicable taxes. |
| n | The FTSE EPRA/NAREIT Developed Index is an unmanaged index considered representative of global real estate companies and REITs. The index is computed using the gross return, which does not withhold taxes for nonresident investors. |
| n | The Lipper Global Real Estate Funds Classification Average represents an average of all funds in the Lipper Global Real Estate Funds classification. |
| n | The Fund is not managed to track the performance of any particular index, including the index(es) described here, and consequently, the performance of the Fund may deviate significantly from the performance of the index(es). |
| n | A direct investment cannot be made in an index. Unless otherwise indicated, index results include reinvested dividends, and they do not reflect sales charges. Performance of the peer group, if applicable, reflects fund expenses; performance of a market index does not. |
Other information
| n | The returns shown in management’s discussion of Fund performance are based on net asset values (NAVs) calculated for shareholder transactions. Generally accepted accounting principles require adjustments to be made to the net assets of the Fund at period end for financial reporting purposes, and as such, the NAVs for shareholder transactions and the returns based on those NAVs may differ from the NAVs and returns reported in the Financial Highlights. |
| n | Industry classifications used in this report are generally according to the Global Industry Classification Standard, which was developed by and is the exclusive property and a service mark of MSCI Inc. and Standard & Poor’s. |
9 Invesco Global Real Estate Income Fund
Schedule of Investments
August 31, 2015
| Shares | Value | |||||||
Real Estate Investment Trusts, Common Stocks & Other Equity Interests–56.00% |
| |||||||
| Australia–6.50% | ||||||||
Dexus Property Group | 475,232 | $ | 2,480,407 | |||||
Federation Centres | 6,052,345 | 12,153,646 | ||||||
Goodman Group | 2,520,015 | 10,890,506 | ||||||
Scentre Group | 4,377,709 | 11,823,084 | ||||||
Stockland | 5,515,956 | 15,294,513 | ||||||
Westfield Corp. | 1,962,030 | 13,614,673 | ||||||
| 66,256,829 | ||||||||
| Canada–1.65% | ||||||||
Allied Properties REIT | 220,500 | 5,842,236 | ||||||
Canadian REIT | 173,500 | 5,406,628 | ||||||
H&R REIT | 351,200 | 5,512,107 | ||||||
| 16,760,971 | ||||||||
| France–3.29% | ||||||||
ICADE | 40,245 | 2,883,397 | ||||||
Mercialys S.A. | 142,269 | 3,194,736 | ||||||
Unibail-Rodamco S.E. | 105,930 | 27,405,455 | ||||||
| 33,483,588 | ||||||||
| Germany–1.47% | ||||||||
Deutsche Wohnen AG | 360,945 | 9,470,724 | ||||||
LEG Immobilien AG | 73,282 | 5,499,524 | ||||||
| 14,970,248 | ||||||||
| Hong Kong–3.51% | ||||||||
Cheung Kong Property Holdings Ltd.(a) | 370,500 | 2,595,890 | ||||||
Fortune REIT | 1,272,800 | 1,226,532 | ||||||
Henderson Land Development Co. Ltd. | 771,700 | 4,739,462 | ||||||
Hongkong Land Holdings Ltd. | 683,300 | 4,728,436 | ||||||
Kerry Properties Ltd. | 547,500 | 1,631,792 | ||||||
Link REIT | 1,465,000 | 7,769,226 | ||||||
New World Development Co. Ltd. | 4,106,000 | 4,159,219 | ||||||
Sun Hung Kai Properties Ltd. | 379,000 | 4,789,609 | ||||||
Wharf Holdings Ltd. (The) | 736,000 | 4,142,054 | ||||||
| 35,782,220 | ||||||||
| Japan–6.36% | ||||||||
Activia Properties, Inc. | 534 | 4,367,163 | ||||||
AEON REIT Investment Corp. | 1,789 | 2,005,321 | ||||||
Japan Hotel REIT Investment Corp. | 8,124 | 5,006,809 | ||||||
Japan Logistics Fund Inc. | 1,106 | 1,998,926 | ||||||
Japan Prime Realty Investment Corp. | 1,350 | 4,368,844 | ||||||
Japan Retail Fund Investment Corp. | 4,031 | 7,412,724 | ||||||
Kenedix Retail REIT Corp.(a) | 2,078 | 4,391,055 | ||||||
Mitsubishi Estate Co. Ltd. | 280,000 | 5,999,501 | ||||||
Mitsui Fudosan Co., Ltd. | 460,000 | 12,705,854 | ||||||
Mori Hills REIT Investment Corp. | 5,868 | 6,747,248 | ||||||
ORIX JREIT Inc. | 2,451 | 3,086,225 | ||||||
| Shares | Value | |||||||
| Japan–(continued) | ||||||||
Tokyu Fudosan Holdings, Corp. | 519,000 | $ | 3,553,104 | |||||
United Urban Investment Corp. | 2,396 | 3,150,726 | ||||||
| 64,793,500 | ||||||||
| Netherlands–1.31% | ||||||||
Eurocommercial Properties N.V. | 72,804 | 3,221,671 | ||||||
Vastned Retail N.V. | 116,309 | 5,303,443 | ||||||
Wereldhave N.V. | 84,890 | 4,853,136 | ||||||
| 13,378,250 | ||||||||
| Singapore–2.50% | ||||||||
Ascendas REIT | 3,573,000 | 5,646,110 | ||||||
CapitaLand Commercial Trust | 3,946,500 | 3,719,420 | ||||||
CapitaLand Mall Trust | 1,462,100 | 1,980,189 | ||||||
Frasers Centrepoint Trust | 3,679,300 | 5,071,031 | ||||||
Mapletree Industrial Trust | 8,355,000 | 9,087,957 | ||||||
| 25,504,707 | ||||||||
| South Africa–0.84% | ||||||||
Growthpoint Properties Ltd. | 1,748,949 | 3,445,396 | ||||||
Hyprop Investments Ltd. | 551,798 | 5,151,533 | ||||||
| 8,596,929 | ||||||||
| Sweden–0.34% | ||||||||
Castellum AB | 246,106 | 3,476,234 | ||||||
| Switzerland–0.66% | ||||||||
Mobimo Holding AG | 7,530 | 1,556,776 | ||||||
Swiss Prime Site AG | 65,882 | 5,155,659 | ||||||
| 6,712,435 | ||||||||
| United Kingdom–4.67% | ||||||||
Big Yellow Group PLC | 323,624 | 3,337,960 | ||||||
British Land Co. PLC (The) | 484,195 | 6,038,478 | ||||||
Hammerson PLC | 1,023,815 | 9,788,593 | ||||||
Land Securities Group PLC | 1,366,563 | 26,020,831 | ||||||
Segro PLC | 368,423 | 2,349,874 | ||||||
| 47,535,736 | ||||||||
| United States–22.90% | ||||||||
American Campus Communities, Inc. | 162,100 | 5,551,925 | ||||||
Apple Hospitality REIT, Inc. | 417,300 | 7,390,383 | ||||||
AvalonBay Communities, Inc. | 80,026 | 13,209,092 | ||||||
Brandywine Realty Trust | 123,200 | 1,493,184 | ||||||
Brixmor Property Group, Inc. | 627,200 | 14,312,704 | ||||||
Care Capital Properties, Inc.(a) | 79,250 | 2,519,358 | ||||||
Cohen & Steers Quality Income Realty Fund, Inc. | 357,173 | 3,896,757 | ||||||
Corrections Corp. of America | 202,777 | 5,957,588 | ||||||
Crown Castle International Corp. | 49,100 | 4,094,449 | ||||||
DiamondRock Hospitality Co. | 780,100 | 9,173,976 | ||||||
Digital Realty Trust, Inc., | 63,800 | 4,039,816 | ||||||
See accompanying Notes to Financial Statements which are an integral part of the financial statements.
10 Invesco Global Real Estate Income Fund
| Shares | Value | |||||||
| United States–(continued) | ||||||||
Federal Realty Investment Trust | 65,700 | $ | 8,480,556 | |||||
Healthcare Trust of America, Inc.–Class A | 569,300 | 13,668,893 | ||||||
Highwoods Properties, Inc. | 128,100 | 4,860,114 | ||||||
Hudson Pacific Properties Inc. | 241,700 | 6,861,863 | ||||||
LaSalle Hotel Properties | 467,700 | 14,713,842 | ||||||
Liberty Property Trust | 163,900 | 5,038,286 | ||||||
Mid-America Apartment Communities, Inc. | 182,900 | 14,374,111 | ||||||
National Health Investors, Inc. | 111,900 | 6,165,690 | ||||||
National Retail Properties Inc. | 201,700 | 7,009,075 | ||||||
Prologis, Inc. | 53,300 | 2,025,400 | ||||||
QTS Realty Trust, Inc.–Class A | 73,400 | 2,949,946 | ||||||
Realty Income Corp. | 185,466 | 8,288,476 | ||||||
Retail Opportunity Investments Corp. | 871,000 | 13,875,030 | ||||||
Rexford Industrial Realty, Inc. | 233,300 | 3,014,236 | ||||||
RLJ Lodging Trust | 512,000 | 14,100,480 | ||||||
Simon Property Group, Inc. | 83,900 | 15,044,948 | ||||||
Terreno Realty Corp. | 111,800 | 2,274,012 | ||||||
Ventas, Inc. | 343,700 | 18,910,374 | ||||||
| 233,294,564 | ||||||||
Total Real Estate Investment Trusts, |
| 570,546,211 | ||||||
Preferred Stocks–21.69% |
| |||||||
| Australia–0.43% | ||||||||
Goodman PLUS Trust, 6.04% Unsec. Sub. Gtd. Floating Rate Pfd.(b) | 60,179 | 4,338,618 | ||||||
| United States–21.26% | ||||||||
Alexandria Real Estate Equities Inc., | 71,000 | 1,853,100 | ||||||
American Tower Corp., | 44,000 | 4,515,720 | ||||||
American Tower Corp., Series A, | 86,240 | 8,851,673 | ||||||
CoreSite Realty Corp., Series A, 7.25% Pfd. | 408,585 | 10,770,301 | ||||||
Crown Castle International Corp., | 123,900 | 12,933,921 | ||||||
CubeSmart, Series A, 7.75% Pfd. | 336,352 | 8,886,420 | ||||||
Digital Realty Trust, Inc. Series E, 7.00% Pfd. | 122,000 | 3,147,600 | ||||||
Eagle Hospitality Properties Trust Inc., | 195,800 | 12,257 | ||||||
Essex Property Trust, Inc., Series H, | 632,720 | 16,355,812 | ||||||
Health Care REIT, Inc., Series I, $3.25 Conv. Pfd. | 46,400 | 2,763,120 | ||||||
Health Care REIT, Inc., Series J, 6.50% Pfd. | 348,031 | 9,222,821 | ||||||
Hersha Hospitality Trust, Series B, 8.00% Pfd. | 340,500 | 8,686,155 | ||||||
Hudson Pacific Properties Inc., | 631,407 | 16,201,904 | ||||||
| Shares | Value | |||||||
| United States–(continued) | ||||||||
Kilroy Realty Corp., Series G, 6.88% Pfd. | 222,502 | $ | 5,767,252 | |||||
Kilroy Realty Corp., Series H, 6.38% Pfd. | 292,827 | 7,429,021 | ||||||
Kimco Realty Corp., Series H, 6.90% Pfd. | 100,000 | 2,537,000 | ||||||
LaSalle Hotel Properties, | 249,210 | 6,439,586 | ||||||
National Retail Properties Inc., | 334,504 | 8,740,589 | ||||||
Pebblebrook Hotel Trust, | 471,065 | 12,195,873 | ||||||
Pebblebrook Hotel Trust, | 365,910 | 9,469,751 | ||||||
Pebblebrook Hotel Trust, | 127,670 | 3,201,964 | ||||||
Public Storage, Series P, 6.50% Pfd. | 130,913 | 3,336,972 | ||||||
Public Storage, Series Q, 6.50% Pfd. | 215,309 | 5,565,738 | ||||||
Public Storage, Series R, 6.35% Pfd. | 278,634 | 7,233,339 | ||||||
Public Storage, Series Y, 6.38% Pfd. | 474,114 | 12,701,514 | ||||||
Realty Income Corp., | 104,640 | 2,781,331 | ||||||
Regency Centers Corp., Series 6, 6.63% Pfd. | 156,200 | 4,069,010 | ||||||
Regency Centers Corp., Series 7, 6.00% Pfd. | 30,162 | 754,050 | ||||||
Summit Hotel Properties, Inc., | 165,294 | 4,423,267 | ||||||
Summit Hotel Properties, Inc., | 161,156 | 4,152,990 | ||||||
Terreno Realty Corp., | 169,651 | 4,421,105 | ||||||
Vornado Realty Trust, | 281,574 | 7,182,953 | ||||||
| 216,604,109 | ||||||||
Total Preferred Stocks |
| 220,942,727 | ||||||
| Principal Amount | ||||||||
Mortgage-Backed Securities–19.65% |
| |||||||
| United Kingdom–2.09% | ||||||||
Hercules (Eclipse) PLC., Series 2006-4, Class B, Floating Rate Pass Through Ctfs., 0.93%, 10/25/18(b)(c) | GBP | 4,690,779 | 6,976,782 | |||||
Logistics UK PLC, Series 2015-1A, Class E, Floating Rate Pass through Ctfs., 4.00%, 08/20/25(b)(c)(d) | GBP | 7,500,000 | 11,349,765 | |||||
See accompanying Notes to Financial Statements which are an integral part of the financial statements.
11 Invesco Global Real Estate Income Fund
| Principal Amount | Value | |||||||
| United Kingdom–(continued) | ||||||||
Triton European Loan Conduit PLC, Series 26X, Class F, Floating Rate Pass Through Ctfs., 1.08%, 10/25/19(b)(c) | GBP | 661,678 | $ | 977,439 | ||||
Series 26X, Class G, Floating Rate Pass Through Ctfs., 1.26%, 10/25/19(b)(c) | GBP | 975,926 | 1,427,046 | |||||
Series 26X , Class H, Floating Rate Pass Through Ctfs., 1.42%, 10/25/19(b)(c) | GBP | 354,014 | 514,648 | |||||
| 21,245,680 | ||||||||
| United States–17.56% | ||||||||
ACRE Commercial Mortgage Trust, | ||||||||
Series 2013-FL1, Class C, Floating Rate Pass Through Ctfs., 3.20%, 06/15/30(b)(d) | $ | 11,137,295 | 11,165,266 | |||||
Series 2013-FL1, Class D, Floating Rate Pass Through Ctfs., 4.60%, 06/15/30(b)(d) | 19,706,000 | 19,816,718 | ||||||
Banc of America Merrill Lynch Commercial Mortgage Inc., Series 2004-2, Class L, Pass Through Ctfs., 4.90%, 11/10/38(d) | 600,000 | 600,489 | ||||||
Series 2005-5, Class F, Variable Rate Pass Through Ctfs., 5.56%, 10/10/45(b)(d) | 5,800,000 | 5,809,225 | ||||||
Banc of America Merrill Lynch Large Loan Inc., | 4,900,000 | 4,659,373 | ||||||
Series 2014-ICTS, Class E, Floating Rate Pass Through Ctfs., 3.15%, 06/15/28(b)(d) | 8,550,000 | 8,514,535 | ||||||
Series 2015-ASHF, Class E, Floating Rate Pass Through Ctfs., 4.20%, 01/15/28(b)(d) | 1,400,000 | 1,399,797 | ||||||
Bear Stearns Commercial Mortgage Securities Trust, Series 2004-PWR6, Class B, Pass Through Ctfs., 4.95%, 11/11/41(d) | 34,600 | 35,661 | ||||||
Series 2005-PWR8, Class C, Pass Through Ctfs., 4.86%, 06/11/41 | 100,560 | 100,488 | ||||||
Citigroup Commercial Mortgage Trust, Series 2014-388G, Class E, Floating Rate Pass Through Ctfs., 2.55%, 06/15/33(b)(d) | 11,700,000 | 11,592,869 | ||||||
Credit Suisse First Boston Mortgage Securities Corp., | 4,975,000 | 4,969,478 | ||||||
| Principal Amount | Value | |||||||
| United States–(continued) | ||||||||
Del Coronado Trust, | $ | 12,420,000 | $ | 12,355,416 | ||||
FREMF Mortgage Trust, | 1,278,000 | 1,340,065 | ||||||
GS Mortgage Securities Corp. Trust, Series 2013-NYC5, Class F, Variable Rate Pass Through Ctfs., 3.77%, 01/10/30(b)(d) | 9,200,000 | 9,241,308 | ||||||
Series 2013-NYC5, Class G, Variable Rate Pass Through Ctfs., 3.77%, 01/10/30(b)(d) | 4,000,000 | 3,952,600 | ||||||
GS Mortgage Securities Trust, | 7,888,000 | 7,681,883 | ||||||
Series GSMS 2011-GC3, Class F, Pass Through Ctfs., 5.00%, 03/10/44(d) | 4,900,000 | 4,342,748 | ||||||
Series GSMS 2011-GC5, Class E, Variable Rate Pass Through Ctfs., 5.47%, 08/10/44(b)(d) | 11,025,000 | 10,835,232 | ||||||
Hilton USA Trust, | 2,808,575 | 2,806,095 | ||||||
Series 2013-HLF, Class EFL, Floating Rate Pass Through Ctfs., 3.94%, 11/05/30(b)(d) | 12,195,130 | 12,184,715 | ||||||
JP Morgan Chase Commercial Mortgage Securities Corp., Series 2004-C3, Class F, Variable Rate Pass Through Ctfs., 5.17%, 01/15/42(b)(d) | 1,025,628 | 1,024,855 | ||||||
JP Morgan Chase Commercial Mortgage Securities Trust, | 1,849,962 | 1,973,086 | ||||||
Series 2012-C8, Class E, Variable Rate Pass Through Ctfs., 4.82%, 10/15/45(b)(d) | 2,805,000 | 2,698,505 | ||||||
Series 2014-PHH, Class E, Floating Rate Pass Through Ctfs., 3.49%, 08/15/27(b)(d) | 5,000,000 | 5,037,005 | ||||||
Merrill Lynch Mortgage Trust, | 863,604 | 865,099 | ||||||
Series 2005-MCP1, Class E, Pass Through Ctfs., 5.13%, 06/12/43(d) | 1,879,961 | 1,869,598 | ||||||
Series 2005-MKB2, Class E, Variable Rate Pass Through Ctfs., 6.27%, 09/12/42(b)(d) | 235,000 | 249,200 | ||||||
See accompanying Notes to Financial Statements which are an integral part of the financial statements.
12 Invesco Global Real Estate Income Fund
| Principal Amount | Value | |||||||
| United States–(continued) | ||||||||
Morgan Stanley Capital I Trust, | $ | 900,000 | $ | 919,152 | ||||
Series 2005-IQ10, Class B, Variable Rate Pass Through Ctfs., 5.55%, 09/15/42(b) | 6,475,000 | 6,485,651 | ||||||
Series 2006-IQ11, Class B, Variable Rate Pass Through Ctfs., 5.89%, 10/15/42(b) | 270,000 | 272,277 | ||||||
Series 2007-TOP27, Class AJ, Variable Rate Pass Through Ctfs., 5.83%, 06/11/42(b) | 7,400,000 | 7,898,168 | ||||||
Starwood Retail Property Trust, Series 2014-STAR, Class E, Floating Rate Pass Through Ctfs., 4.35%, 11/15/27(b)(d) | 12,200,000 | 12,177,644 | ||||||
Wachovia Bank Commercial Mortgage Trust, | 550,000 | 554,615 | ||||||
Series 2005-C21, Class D, Variable Rate Pass Through Ctfs., 5.45%, 10/15/44(b) | 3,450,000 | 3,457,599 | ||||||
| 178,886,415 | ||||||||
Total Mortgage-Backed Securities |
| 200,132,095 | ||||||
| Principal Amount | Value | |||||||
U.S. Dollar Denominated Bonds and Notes–1.28% |
| |||||||
| Brazil–0.70% | ||||||||
BR Properties S.A., Sr. Unsec. Gtd. | $ | 7,700,000 | $ | 7,103,250 | ||||
| United States–0.58% | ||||||||
Equinix Inc., Sr. Unsec. Notes, 5.38%, 01/01/22 | 4,975,000 | 5,037,188 | ||||||
Senior Housing Properties Trust, | 900,000 | 905,625 | ||||||
| 5,942,813 | ||||||||
Total U.S. Dollar Denominated Bonds & Notes |
| 13,046,063 | ||||||
Non U.S. Dollar Denominated Bonds & Notes–0.23%(c) |
| |||||||
| Australia–0.23% | ||||||||
General Property Trust, Sr. Unsec. Gtd. Medium-Term Notes, | AUD | 2,980,000 | 2,364,450 | |||||
TOTAL INVESTMENTS–98.85% |
| 1,007,031,546 | ||||||
OTHER ASSETS LESS LIABILITIES–1.15% |
| 11,756,056 | ||||||
NET ASSETS–100.00% |
| $ | 1,018,787,602 | |||||
Investment Abbreviations:
| AUD | – Australian Dollar | |
| Conv. | – Convertible | |
| Ctfs. | – Certificates | |
| GBP | – British Pound | |
| Gtd. | – Guaranteed |
| Pfd. | – Preferred | |
| REIT | – Real Estate Investment Trust | |
| Sr. | – Senior | |
| Sub. | – Subordinated | |
| Unsec. | – Unsecured |
Notes to Schedule of Investments:
| (a) | Non-income producing security. |
| (b) | Interest or dividend rate is redetermined periodically. Rate shown is the rate in effect on August 31, 2015. |
| (c) | Foreign denominated security. Principal amount is denominated in the currency indicated. |
| (d) | Security purchased or received in a transaction exempt from registration under the Securities Act of 1933, as amended (the “1933 Act”). The security may be resold pursuant to an exemption from registration under the 1933 Act, typically to qualified institutional buyers. The aggregate value of these securities at August 31, 2015 was $174,155,769, which represented 17.09% of the Fund’s Net Assets. |
| (e) | Perpetual bond with no specified maturity date. |
See accompanying Notes to Financial Statements which are an integral part of the financial statements.
13 Invesco Global Real Estate Income Fund
Statement of Assets and Liabilities
August 31, 2015
Assets: | ||||
Investments, at value (Cost $1,020,633,455) | $ | 1,007,031,546 | ||
Foreign currencies, at value (Cost $2,938,771) | 2,934,245 | |||
Receivable for: | ||||
Investments sold | 24,744,871 | |||
Fund shares sold | 1,497,133 | |||
Dividends and interest | 1,685,152 | |||
Investment for trustee deferred compensation and retirement plans | 119,758 | |||
Other assets | 43,057 | |||
Total assets | 1,038,055,762 | |||
Liabilities: | ||||
Payable for: | ||||
Investments purchased | 13,434,494 | |||
Fund shares reacquired | 1,691,175 | |||
Amount due custodian | 3,260,172 | |||
Accrued fees to affiliates | 581,983 | |||
Accrued trustees’ and officers’ fees and benefits | 5,634 | |||
Accrued other operating expenses | 157,725 | |||
Trustee deferred compensation and retirement plans | 136,977 | |||
Total liabilities | 19,268,160 | |||
Net assets applicable to shares outstanding | $ | 1,018,787,602 | ||
Net assets consist of: | ||||
Shares of beneficial interest | $ | 1,015,948,579 | ||
Undistributed net investment income | (3,939,313 | ) | ||
Undistributed net realized gain | 20,535,487 | |||
Net unrealized appreciation (depreciation) | (13,757,151 | ) | ||
| $ | 1,018,787,602 | |||
Net Assets: | ||||
Class A | $ | 499,799,038 | ||
Class B | $ | 1,063,642 | ||
Class C | $ | 103,988,055 | ||
Class Y | $ | 398,283,083 | ||
Class R5 | $ | 14,204,461 | ||
Class R6 | $ | 1,449,323 | ||
Shares outstanding, $0.01 par value per share, |
| |||
Class A | 56,723,586 | |||
Class B | 120,961 | |||
Class C | 11,826,325 | |||
Class Y | 45,329,535 | |||
Class R5 | 1,613,108 | |||
Class R6 | 164,451 | |||
Class A: | ||||
Net asset value per share | $ | 8.81 | ||
Maximum offering price per share | ||||
(Net asset value of $8.81 ¸ 94.50%) | $ | 9.32 | ||
Class B: | ||||
Net asset value and offering price per share | $ | 8.79 | ||
Class C: | ||||
Net asset value and offering price per share | $ | 8.79 | ||
Class Y: | ||||
Net asset value and offering price per share | $ | 8.79 | ||
Class R5: | ||||
Net asset value and offering price per share | $ | 8.81 | ||
Class R6: | ||||
Net asset value and offering price per share | $ | 8.81 | ||
See accompanying Notes to Financial Statements which are an integral part of the financial statements.
14 Invesco Global Real Estate Income Fund
Statement of Operations
For the year ended August 31, 2015
Investment income: |
| |||
Dividends (net of foreign withholding taxes of $1,947,098) | $ | 39,503,705 | ||
Dividends from affiliated money market funds | 14,396 | |||
Interest (net of foreign withholding taxes of $689) | 10,885,571 | |||
Total investment income | 50,403,672 | |||
Expenses: | ||||
Advisory fees | 8,545,804 | |||
Administrative services fees | 292,401 | |||
Custodian fees | 182,548 | |||
Distribution fees: | ||||
Class A | 1,439,585 | |||
Class B | 14,392 | |||
Class C | 1,160,262 | |||
Transfer Agent Fees — A, B, C and Y | 1,770,071 | |||
Transfer agent fees — R5 | 22,345 | |||
Transfer agent fees — R6 | 361 | |||
Trustees’ and officers’ fees and benefits | 37,960 | |||
Other | 405,412 | |||
Total expenses | 13,871,141 | |||
Less: Fees waived and expense offset arrangement(s) | (42,713 | ) | ||
Net expenses | 13,828,428 | |||
Net investment income | 36,575,244 | |||
Realized and unrealized gain (loss) from: | ||||
Net realized gain (loss) from: | ||||
Investment securities | 32,186,301 | |||
Foreign currencies | (175,830 | ) | ||
| 32,010,471 | ||||
Change in net unrealized appreciation (depreciation) of: | ||||
Investment securities | (100,434,460 | ) | ||
Foreign currencies | (147,729 | ) | ||
| (100,582,189 | ) | |||
Net realized and unrealized gain (loss) | (68,571,718 | ) | ||
Net increase (decrease) in net assets resulting from operations | $ | (31,996,474 | ) | |
See accompanying Notes to Financial Statements which are an integral part of the financial statements.
15 Invesco Global Real Estate Income Fund
Statement of Changes in Net Assets
For the years ended August 31, 2015 and 2014
| 2015 | 2014 | |||||||
Operations: |
| |||||||
Net investment income | $ | 36,575,244 | $ | 35,045,450 | ||||
Net realized gain | 32,010,471 | 8,931,020 | ||||||
Change in net unrealized appreciation (depreciation) | (100,582,189 | ) | 131,956,988 | |||||
Net increase (decrease) in net assets resulting from operations | (31,996,474 | ) | 175,933,458 | |||||
Distributions to shareholders from net investment income: | ||||||||
Class A | (23,842,662 | ) | (29,303,895 | ) | ||||
Class B | (50,721 | ) | (69,155 | ) | ||||
Class C | (3,912,502 | ) | (4,479,405 | ) | ||||
Class Y | (19,395,644 | ) | (14,944,102 | ) | ||||
Class R5 | (1,048,545 | ) | (1,233,982 | ) | ||||
Class R6 | (69,263 | ) | (3,215 | ) | ||||
Total distributions from net investment income | (48,319,337 | ) | (50,033,754 | ) | ||||
Distributions to shareholders from net realized gains: | ||||||||
Class A | (292,934 | ) | (7,329,405 | ) | ||||
Class B | (812 | ) | (20,716 | ) | ||||
Class C | (60,843 | ) | (1,307,959 | ) | ||||
Class Y | (234,608 | ) | (3,044,760 | ) | ||||
Class R5 | (12,797 | ) | (292,640 | ) | ||||
Class R6 | (758 | ) | (633 | ) | ||||
Total distributions from net realized gains | (602,752 | ) | (11,996,113 | ) | ||||
Share transactions-net: | ||||||||
Class A | (69,248,140 | ) | (71,036,172 | ) | ||||
Class B | (494,308 | ) | (356,965 | ) | ||||
Class C | (6,291,726 | ) | (2,483,292 | ) | ||||
Class Y | 27,381 | 124,475,560 | ||||||
Class R5 | (9,236,603 | ) | (1,406,971 | ) | ||||
Class R6 | 137,220 | 1,319,530 | ||||||
Net increase (decrease) in net assets resulting from share transactions | (85,106,176 | ) | 50,511,690 | |||||
Net increase (decrease) in net assets | (166,024,739 | ) | 164,415,281 | |||||
Net assets: | ||||||||
Beginning of year | 1,184,812,341 | 1,020,397,060 | ||||||
End of year (includes undistributed net investment income of $(3,939,313) and $(3,240,481), respectively) | $ | 1,018,787,602 | $ | 1,184,812,341 | ||||
Notes to Financial Statements
August 31, 2015
NOTE 1—Significant Accounting Policies
Invesco Global Real Estate Income Fund (the “Fund”) is a series portfolio of AIM Counselor Series Trust (Invesco Counselor Series Trust) (the “Trust”). The Trust is a Delaware statutory trust registered under the Investment Company Act of 1940, as amended (the “1940 Act”), as an open-end series management investment company consisting of thirteen separate portfolios, each authorized to issue an unlimited number of shares of beneficial interest. The assets, liabilities and operations of each portfolio are accounted for separately. Information presented in these financial statements pertains only to the Fund. Matters affecting each portfolio or class will be voted on exclusively by the shareholders of such portfolio or class.
The Fund’s investment objective is current income and, secondarily, capital appreciation.
The Fund currently consists of six different classes of shares: Class A, Class B, Class C, Class Y, Class R5 and Class R6. Class A shares are sold with a front-end sales charge unless certain waiver criteria are met and under certain circumstances load waived shares may be subject to contingent deferred sales charges (“CDSC”). Class C shares are sold with a CDSC. Class Y, Class R5 and Class R6 shares are sold at net asset value. Effective November 30, 2010, new or additional investments in Class B shares are no longer permitted. Existing shareholders of Class B shares may continue to reinvest dividends and capital gains distributions in Class B shares until they convert to Class A shares. Also, shareholders in Class B shares will be able to exchange those shares for Class B shares of other Invesco Funds offering such shares until they convert to Class A shares. Generally, Class B
16 Invesco Global Real Estate Income Fund
shares will automatically convert to Class A shares on or about the month-end, which is at least eight years after the date of purchase. Redemption of Class B shares prior to the conversion date will be subject to a CDSC.
The following is a summary of the significant accounting policies followed by the Fund in the preparation of its financial statements.
| A. | Security Valuations — Securities, including restricted securities, are valued according to the following policy. |
A security listed or traded on an exchange (except convertible securities) is valued at its last sales price or official closing price as of the close of the customary trading session on the exchange where the security is principally traded, or lacking any sales or official closing price on a particular day, the security may be valued at the closing bid price on that day. Securities traded in the over-the-counter market are valued based on prices furnished by independent pricing services or market makers. When such securities are valued by an independent pricing service they may be considered fair valued. Futures contracts are valued at the final settlement price set by an exchange on which they are principally traded. Listed options are valued at the mean between the last bid and asked prices from the exchange on which they are principally traded. Options not listed on an exchange are valued by an independent source at the mean between the last bid and asked prices. For purposes of determining net asset value (“NAV”) per share, futures and option contracts generally are valued 15 minutes after the close of the customary trading session of the New York Stock Exchange (“NYSE”).
Investments in open-end and closed-end registered investment companies that do not trade on an exchange are valued at the end-of-day net asset value per share. Investments in open-end and closed-end registered investment companies that trade on an exchange are valued at the last sales price or official closing price as of the close of the customary trading session on the exchange where the security is principally traded.
Debt obligations (including convertible securities) and unlisted equities are fair valued using an evaluated quote provided by an independent pricing service. Evaluated quotes provided by the pricing service may be determined without exclusive reliance on quoted prices, and may reflect appropriate factors such as institution-size trading in similar groups of securities, developments related to specific securities, dividend rate (for unlisted equities), yield (for debt obligations), quality, type of issue, coupon rate (for debt obligations), maturity (for debt obligations), individual trading characteristics and other market data. Debt obligations are subject to interest rate and credit risks. In addition, all debt obligations involve some risk of default with respect to interest and/or principal payments.
Foreign securities’ (including foreign exchange contracts) prices are converted into U.S. dollar amounts using the applicable exchange rates as of the close of the NYSE. If market quotations are available and reliable for foreign exchange-traded equity securities, the securities will be valued at the market quotations. Because trading hours for certain foreign securities end before the close of the NYSE, closing market quotations may become unreliable. If between the time trading ends on a particular security and the close of the customary trading session on the NYSE, events occur that the Adviser determines are significant and make the closing price unreliable, the Fund may fair value the security. If the event is likely to have affected the closing price of the security, the security will be valued at fair value in good faith using procedures approved by the Board of Trustees. Adjustments to closing prices to reflect fair value may also be based on a screening process of an independent pricing service to indicate the degree of certainty, based on historical data, that the closing price in the principal market where a foreign security trades is not the current value as of the close of the NYSE. Foreign securities’ prices meeting the approved degree of certainty that the price is not reflective of current value will be priced at the indication of fair value from the independent pricing service. Multiple factors may be considered by the independent pricing service in determining adjustments to reflect fair value and may include information relating to sector indices, American Depositary Receipts and domestic and foreign index futures. Foreign securities may have additional risks including exchange rate changes, potential for sharply devalued currencies and high inflation, political and economic upheaval, the relative lack of issuer information, relatively low market liquidity and the potential lack of strict financial and accounting controls and standards.
Securities for which market prices are not provided by any of the above methods may be valued based upon quotes furnished by independent sources. The last bid price may be used to value equity securities. The mean between the last bid and asked prices will be used to value debt obligations and corporate loans.
Securities for which market quotations are not readily available or became unreliable are valued at fair value as determined in good faith by or under the supervision of the Trust’s officers following procedures approved by the Board of Trustees. Issuer specific events, market trends, bid/asked quotes of brokers and information providers and other market data may be reviewed in the course of making a good faith determination of a security’s fair value.
The Fund may invest in securities that are subject to interest rate risk, meaning the risk that the prices will generally fall as interest rates rise and, conversely, the prices will generally rise as interest rates fall. Specific securities differ in their sensitivity to changes in interest rates depending on their individual characteristics. Changes in interest rates may result in increased market volatility, which may affect the value and/or liquidity of certain Fund investments.
Valuations change in response to many factors including the historical and prospective earnings of the issuer, the value of the issuer’s assets, general economic conditions, interest rates, investor perceptions and market liquidity. Because of the inherent uncertainties of valuation, the values reflected in the financial statements may materially differ from the value received upon actual sale of those investments.
| B. | Securities Transactions and Investment Income — Securities transactions are accounted for on a trade date basis. Realized gains or losses on sales are computed on the basis of specific identification of the securities sold. Interest income (net of withholding tax, if any) is recorded on the accrual basis from settlement date. Paydown gains and losses on mortgage and asset-backed securities are recorded as adjustments to interest income. Dividend income (net of withholding tax, if any) is recorded on the ex-dividend date. Bond premiums and discounts are amortized and/or accreted for financial reporting purposes. |
The Fund may periodically participate in litigation related to Fund investments. As such, the Fund may receive proceeds from litigation settlements. Any proceeds received are included in the Statement of Operations as realized gain (loss) for investments no longer held and as unrealized gain (loss) for investments still held.
Brokerage commissions and mark ups are considered transaction costs and are recorded as an increase to the cost basis of securities purchased and/or a reduction of proceeds on a sale of securities. Such transaction costs are included in the determination of net realized and unrealized gain (loss) from investment securities reported in the Statement of Operations and the Statement of Changes in Net Assets and the net realized and unrealized gains (losses) on securities per share in the Financial Highlights. Transaction costs are included in the calculation of the Fund’s net asset value and, accordingly, they reduce the Fund’s total returns. These transaction costs are not considered operating expenses and are not reflected in net investment income reported in the Statement of Operations and the Statement of Changes in Net Assets, or the net
17 Invesco Global Real Estate Income Fund
investment income per share and the ratios of expenses and net investment income reported in the Financial Highlights, nor are they limited by any expense limitation arrangements between the Fund and the investment adviser.
The Fund recharacterizes distributions received from REIT investments based on information provided by the REIT into the following categories: ordinary income, long-term and short-term capital gains, and return of capital. If information is not available timely from the REIT, the recharacterization will be based on available information which may include the previous year’s allocation. If new or additional information becomes available from the REIT at a later date, a recharacterization will be made in the following year. The Fund records as dividend income the amount recharacterized as ordinary income and as realized gain the amount recharacterized as capital gain in the Statement of Operations, and the amount recharacterized as return of capital in the Statement of Changes in Net Assets. These recharacterizations are reflected in the accompanying financial statements.
| C. | Country Determination — For the purposes of making investment selection decisions and presentation in the Schedule of Investments, the investment adviser may determine the country in which an issuer is located and/or credit risk exposure based on various factors. These factors include the laws of the country under which the issuer is organized, where the issuer maintains a principal office, the country in which the issuer derives 50% or more of its total revenues and the country that has the primary market for the issuer’s securities, as well as other criteria. Among the other criteria that may be evaluated for making this determination are the country in which the issuer maintains 50% or more of its assets, the type of security, financial guarantees and enhancements, the nature of the collateral and the sponsor organization. Country of issuer and/or credit risk exposure has been determined to be the United States of America, unless otherwise noted. |
| D. | Distributions — Distributions from net investment income, if any, are declared and paid quarterly and are recorded on the ex-dividend date. Distributions from net realized capital gain, if any, are generally declared and paid annually and recorded on the ex-dividend date. The Fund may elect to treat a portion of the proceeds from redemptions as distributions for federal income tax purposes. |
| E. | Federal Income Taxes — The Fund intends to comply with the requirements of Subchapter M of the Internal Revenue Code of 1986, as amended (the “Internal Revenue Code”), necessary to qualify as a regulated investment company and to distribute substantially all of the Fund’s taxable earnings to shareholders. As such, the Fund will not be subject to federal income taxes on otherwise taxable income (including net realized capital gain) that is distributed to shareholders. Therefore, no provision for federal income taxes is recorded in the financial statements. |
The Fund recognizes the tax benefits of uncertain tax positions only when the position is more likely than not to be sustained. Management has analyzed the Fund’s uncertain tax positions and concluded that no liability for unrecognized tax benefits should be recorded related to uncertain tax positions. Management is not aware of any tax positions for which it is reasonably possible that the total amounts of unrecognized tax benefits will change materially in the next 12 months.
The Fund files tax returns in the U.S. Federal jurisdiction and certain other jurisdictions. Generally, the Fund is subject to examinations by such taxing authorities for up to three years after the filing of the return for the tax period.
| F. | Expenses — Fees provided for under the Rule 12b-1 plan of a particular class of the Fund are charged to the operations of such class. Transfer agency fees and expenses and other shareholder recordkeeping fees and expenses attributable to Class R5 and Class R6 are allocated to each share class based on relative net assets. Sub-accounting fees attributable to Class R5 are charged to the operations of the class. Transfer agency fees and expenses and other shareholder recordkeeping fees and expenses relating to all other classes are allocated among those classes based on relative net assets. All other expenses are allocated among the classes based on relative net assets. |
| G. | Accounting Estimates — The preparation of financial statements in conformity with accounting principles generally accepted in the United States of America (“GAAP”) requires management to make estimates and assumptions that affect the reported amounts of assets and liabilities at the date of the financial statements and the reported amounts of revenues and expenses during the reporting period including estimates and assumptions related to taxation. Actual results could differ from those estimates by a significant amount. In addition, the Fund monitors for material events or transactions that may occur or become known after the period-end date and before the date the financial statements are released to print. |
| H. | Indemnifications — Under the Trust’s organizational documents, each Trustee, officer, employee or other agent of the Trust is indemnified against certain liabilities that may arise out of the performance of their duties to the Fund. Additionally, in the normal course of business, the Fund enters into contracts, including the Fund’s servicing agreements, that contain a variety of indemnification clauses. The Fund’s maximum exposure under these arrangements is unknown as this would involve future claims that may be made against the Fund that have not yet occurred. The risk of material loss as a result of such indemnification claims is considered remote. |
| I. | Foreign Currency Translations — Foreign currency is valued at the close of the NYSE based on quotations posted by banks and major currency dealers. Portfolio securities and other assets and liabilities denominated in foreign currencies are translated into U.S. dollar amounts at date of valuation. Purchases and sales of portfolio securities (net of foreign taxes withheld on disposition) and income items denominated in foreign currencies are translated into U.S. dollar amounts on the respective dates of such transactions. The Fund does not separately account for the portion of the results of operations resulting from changes in foreign exchange rates on investments and the fluctuations arising from changes in market prices of securities held. The combined results of changes in foreign exchange rates and the fluctuation of market prices on investments (net of estimated foreign tax withholding) are included with the net realized and unrealized gain or loss from investments in the Statement of Operations. Reported net realized foreign currency gains or losses arise from (1) sales of foreign currencies, (2) currency gains or losses realized between the trade and settlement dates on securities transactions, and (3) the difference between the amounts of dividends, interest, and foreign withholding taxes recorded on the Fund’s books and the U.S. dollar equivalent of the amounts actually received or paid. Net unrealized foreign currency gains and losses arise from changes in the fair values of assets and liabilities, other than investments in securities at fiscal period end, resulting from changes in exchange rates. |
The Fund may invest in foreign securities, which may be subject to foreign taxes on income, gains on investments or currency repatriation, a portion of which may be recoverable. Foreign taxes, if any, are recorded based on the tax regulations and rates that exist in the foreign markets in which the Fund invests and are shown in the Statement of Operations.
| J. | Forward Foreign Currency Contracts — The Fund may engage in foreign currency transactions either on a spot (i.e. for prompt delivery and settlement) basis, or through forward foreign currency contracts, to manage or minimize currency or exchange rate risk. |
The Fund may also enter into forward foreign currency contracts for the purchase or sale of a security denominated in a foreign currency in order to “lock in” the U.S. dollar price of that security, or the Fund may also enter into forward foreign currency contracts that do not provide for
18 Invesco Global Real Estate Income Fund
physical settlement of the two currencies, but instead are settled by a single cash payment calculated as the difference between the agreed upon exchange rate and the spot rate at settlement based upon an agreed upon notional amount (non-deliverable forwards). The Fund will set aside liquid assets in an amount equal to daily mark-to-market obligation for forward foreign currency contracts.
A forward foreign currency contract is an obligation between two parties (“Counterparties”) to purchase or sell a specific currency for an agreed-upon price at a future date. The use of forward foreign currency contracts does not eliminate fluctuations in the price of the underlying securities the Fund owns or intends to acquire but establishes a rate of exchange in advance. Fluctuations in the value of these contracts are measured by the difference in the contract date and reporting date exchange rates and are recorded as unrealized appreciation (depreciation) until the contracts are closed. When the contracts are closed, realized gains (losses) are recorded. Realized and unrealized gains (losses) on the contracts are included in the Statement of Operations. The primary risks associated with forward foreign currency contracts include failure of the Counterparty to meet the terms of the contract and the value of the foreign currency changing unfavorably. These risks may be in excess of the amounts reflected in the Statement of Assets and Liabilities.
| K. | Other Risks — The Fund’s investments are concentrated in a comparatively narrow segment of the economy. Consequently, the Fund may tend to be more volatile than other mutual funds, and the value of the Fund’s investments may tend to rise and fall more rapidly. |
Because, the Fund concentrates its assets in the real estate industry, an investment in the Fund will be closely linked to the performance of the real estate markets. Property values may fall due to increasing vacancies or declining rents resulting from economic, legal, cultural or technological developments.
NOTE 2—Advisory Fees and Other Fees Paid to Affiliates
The Trust has entered into a master investment advisory agreement with Invesco Advisers, Inc. (the “Adviser” or “Invesco”). Under the terms of the investment advisory agreement, the Fund pays an advisory fee to the Adviser based on the annual rate of the Fund’s average daily net assets as follows:
| Average Daily Net Assets | Rate | |||
First $250 million | 0.75% | |||
Next $250 million | 0.74% | |||
Next $500 million | 0.73% | |||
Next $1.5 billion | 0.72% | |||
Next $2.5 billion | 0.71% | |||
Next $2.5 billion | 0.70% | |||
Next $2.5 billion | 0.69% | |||
Over $10 billion | 0.68% | |||
For the year ended August 31, 2015, the effective advisory fees incurred by the Fund was 0.74%.
Under the terms of a master sub-advisory agreement between the Adviser and each of Invesco Asset Management Deutschland GmbH, Invesco Asset Management Limited, Invesco Asset Management (Japan) Limited, Invesco Hong Kong Limited, Invesco Senior Secured Management, Inc. and Invesco Canada Ltd. (collectively, the “Affiliated Sub-Advisers”) the Adviser, not the Fund, may pay 40% of the fees paid to the Adviser to any such Affiliated Sub-Adviser(s) that provide(s) discretionary investment management services to the Fund based on the percentage of assets allocated to such Affiliated Sub-Adviser(s).
The Adviser has contractually agreed, through at least June 30, 2016, to waive advisory fees and/or reimburse expenses of all shares to the extent necessary to limit total annual fund operating expenses after fee waiver and/or expense reimbursemnt (excluding certain items discussed below) of Class A, Class B, Class C, Class Y, Class R5 and Class R6 shares to 2.00%, 2.75%, 2.75%, 1.75%, 1.75% and 1.75% of average daily net assets. In determining the Adviser’s obligation to waive advisory fees and/or reimburse expenses, the following expenses are not taken into account, and could cause the total annual fund operating expenses after fee waiver and/or expense reimbursemnt to exceed the numbers reflected above: (1) interest; (2) taxes; (3) dividend expense on short sales; (4) extraordinary or non-routine items, including litigation expenses; and (5) expenses that the Fund has incurred but did not actually pay because of an expense offset arrangement. Unless Invesco continues the fee waiver agreement, it will terminate on June 30, 2016. The fee waiver agreement cannot be terminated during its term. The Adviser did not waive fees and/or reimburse expenses during the period under this expense limitation.
Further, the Adviser has contractually agreed, through at least June 30, 2017, to waive the advisory fee payable by the Fund in an amount equal to 100% of the net advisory fees the Adviser receives from the affiliated money market funds on investments by the Fund of uninvested cash in such affiliated money market funds.
For the year ended August 31, 2015, the Adviser waived advisory fees of $41,924.
The Trust has entered into a master administrative services agreement with Invesco pursuant to which the Fund has agreed to pay Invesco for certain administrative costs incurred in providing accounting services to the Fund. For the year ended August 31, 2015, expenses incurred under the agreement are shown in the Statement of Operations as Administrative services fees.
The Trust has entered into a transfer agency and service agreement with Invesco Investment Services, Inc. (“IIS”) pursuant to which the Fund has agreed to pay IIS a fee for providing transfer agency and shareholder services to the Fund and reimburse IIS for certain expenses incurred by IIS in the course of providing such services. IIS may make payments to intermediaries that provide omnibus account services, sub-accounting services and/or networking services. All fees payable by IIS to intermediaries that provide omnibus account services or sub-accounting are charged back to the Fund, subject to certain limitations approved by the Trust’s Board of Trustees. For the year ended August 31, 2015, expenses incurred under the agreement are shown in the Statement of Operations as Transfer agent fees.
The Trust has entered into master distribution agreements with Invesco Distributors, Inc. (“IDI”) to serve as the distributor for the Class A, Class B, Class C, Class Y, Class R5 and Class R6 shares of the Fund. The Trust has adopted plans pursuant to Rule 12b-1 under the 1940 Act with respect to the Fund’s Class A, Class B and Class C shares (collectively, the “Plans”). The Fund, pursuant to the Plans, pays IDI compensation at the annual rate of
19 Invesco Global Real Estate Income Fund
0.25% of the Fund’s average daily net assets of Class A shares and 1.00% of the average daily net assets of Class B and Class C shares. Of the Plan payments, up to 0.25% of the average daily net assets of each class of shares may be paid to furnish continuing personal shareholder services to customers who purchase and own shares of such classes. Any amounts not paid as a service fee under the Plans would constitute an asset-based sales charge. Rules of the Financial Industry Regulatory Authority (“FINRA”) impose a cap on the total sales charges, including asset-based sales charges, that may be paid by any class of shares of the Fund. For the year ended August 31, 2015, expenses incurred under the Plans are shown in the Statement of Operations as Distribution fees.
Front-end sales commissions and CDSC (collectively, the “sales charges”) are not recorded as expenses of the Fund. Front-end sales commissions are deducted from proceeds from the sales of Fund shares prior to investment in Class A shares of the Fund. CDSC are deducted from redemption proceeds prior to remittance to the shareholder. During the year ended August 31, 2015, IDI advised the Fund that IDI retained $99,957 in front-end sales commissions from the sale of Class A shares and $3,275, $506 and $6,599 from Class A, Class B and Class C shares, respectively, for CDSC imposed on redemptions by shareholders.
Certain officers and trustees of the Trust are officers and directors of the Adviser, IIS and/or IDI.
NOTE 3—Additional Valuation Information
GAAP defines fair value as the price that would be received to sell an asset or paid to transfer a liability in an orderly transaction between market participants at the measurement date, under current market conditions. GAAP establishes a hierarchy that prioritizes the inputs to valuation methods, giving the highest priority to readily available unadjusted quoted prices in an active market for identical assets (Level 1) and the lowest priority to significant unobservable inputs (Level 3), generally when market prices are not readily available or are unreliable. Based on the valuation inputs, the securities or other investments are tiered into one of three levels. Changes in valuation methods may result in transfers in or out of an investment’s assigned level:
| Level 1 — | Prices are determined using quoted prices in an active market for identical assets. |
| Level 2 — | Prices are determined using other significant observable inputs. Observable inputs are inputs that other market participants may use in pricing a security. These may include quoted prices for similar securities, interest rates, prepayment speeds, credit risk, yield curves, loss severities, default rates, discount rates, volatilities and others. |
| Level 3 — | Prices are determined using significant unobservable inputs. In situations where quoted prices or observable inputs are unavailable (for example, when there is little or no market activity for an investment at the end of the period), unobservable inputs may be used. Unobservable inputs reflect the Fund’s own assumptions about the factors market participants would use in determining fair value of the securities or instruments and would be based on the best available information. |
The following is a summary of the tiered valuation input levels, as of August 31, 2015. The level assigned to the securities valuations may not be an indication of the risk or liquidity associated with investing in those securities. Because of the inherent uncertainties of valuation, the values reflected in the financial statements may materially differ from the value received upon actual sale of those investments.
During the year ended August 31, 2015, there were transfers from Level 1 to Level 2 of $153,410,672, due to foreign fair value adjustments.
| Level 1 | Level 2 | Level 3 | Total | |||||||||||||
Australia | $ | 17,953,291 | $ | 55,006,606 | $ | — | $ | 72,959,897 | ||||||||
Brazil | — | 7,103,250 | — | 7,103,250 | ||||||||||||
Canada | 16,760,971 | — | — | 16,760,971 | ||||||||||||
France | 2,883,397 | 30,600,191 | — | 33,483,588 | ||||||||||||
Germany | 5,499,524 | 9,470,724 | — | 14,970,248 | ||||||||||||
Hong Kong | 16,320,084 | 19,462,136 | — | 35,782,220 | ||||||||||||
Japan | 2,005,321 | 62,788,179 | — | 64,793,500 | ||||||||||||
Netherlands | — | 13,378,250 | — | 13,378,250 | ||||||||||||
Singapore | 23,524,518 | 1,980,189 | — | 25,504,707 | ||||||||||||
South Africa | — | 8,596,929 | — | 8,596,929 | ||||||||||||
Sweden | — | 3,476,234 | — | 3,476,234 | ||||||||||||
Switzerland | 1,556,776 | 5,155,659 | — | 6,712,435 | ||||||||||||
United Kingdom | — | 68,781,416 | — | 68,781,416 | ||||||||||||
United States | 449,886,416 | 184,841,485 | — | 634,727,901 | ||||||||||||
Total Investments | $ | 536,390,298 | $ | 470,641,248 | $ | — | $ | 1,007,031,546 | ||||||||
NOTE 4—Expense Offset Arrangement(s)
The expense offset arrangement is comprised of transfer agency credits which result from balances in demand deposit accounts used by the transfer agent for clearing shareholder transactions. For the year ended August 31, 2015, the Fund received credits from this arrangement, which resulted in the reduction of the Fund’s total expenses of $789.
NOTE 5—Trustees’ and Officers’ Fees and Benefits
Trustees’ and Officers’ Fees and Benefits include amounts accrued by the Fund to pay remuneration to certain Trustees and Officers of the Fund. Trustees have the option to defer compensation payable by the Fund, and Trustees’ and Officers’ Fees and Benefits also include amounts accrued by the Fund to fund such deferred compensation amounts. Those Trustees who defer compensation have the option to select various Invesco Funds in which
20 Invesco Global Real Estate Income Fund
their deferral accounts shall be deemed to be invested. Finally, certain current Trustees were eligible to participate in a retirement plan that provided for benefits to be paid upon retirement to Trustees over a period of time based on the number of years of service. The Fund may have certain former Trustees who also participate in a retirement plan and receive benefits under such plan. Trustees’ and Officers’ Fees and Benefits include amounts accrued by the Fund to fund such retirement benefits. Obligations under the deferred compensation and retirement plans represent unsecured claims against the general assets of the Fund.
NOTE 6—Cash Balances
The Fund is permitted to temporarily carry a negative or overdrawn balance in its account with State Street Bank and Trust Company, the custodian bank. Such balances, if any at period end, are shown in the Statement of Assets and Liabilities under the payable caption Amount due custodian. To compensate the custodian bank for such overdrafts, the overdrawn Fund may either (1) leave funds as a compensating balance in the account so the custodian bank can be compensated by earning the additional interest; or (2) compensate by paying the custodian bank at a rate agreed upon by the custodian bank and Invesco, not to exceed the contractually agreed upon rate.
NOTE 7—Distributions to Shareholders and Tax Components of Net Assets
Tax Character of Distributions to Shareholders Paid During the Fiscal Years Ended August 31, 2015 and 2014:
| 2015 | 2014 | |||||||
Ordinary income | $ | 45,340,240 | $ | 49,534,870 | ||||
Long-term capital gain | 3,581,849 | 12,494,997 | ||||||
Total distributions | $ | 48,922,089 | $ | 62,029,867 | ||||
Tax Components of Net Assets at Period-End:
| 2015 | ||||
Undistributed long-term gain | $ | 20,848,321 | ||
Net unrealized appreciation (depreciation) — investments | (17,824,695 | ) | ||
Net unrealized appreciation (depreciation) — other investments | (155,242 | ) | ||
Temporary book/tax differences | (29,361 | ) | ||
Shares of beneficial interest | 1,015,948,579 | |||
Total net assets | $ | 1,018,787,602 | ||
The difference between book-basis and tax-basis unrealized appreciation (depreciation) is due to differences in the timing of recognition of gains and losses on investments for tax and book purposes. The Fund’s net unrealized appreciation (depreciation) difference is attributable primarily to wash sales and passive foreign investment companies.
The temporary book/tax differences are a result of timing differences between book and tax recognition of income and/or expenses. The Fund’s temporary book/tax differences are the result of the trustee deferral of compensation and retirement plan benefits.
Capital loss carryforward is calculated and reported as of a specific date. Results of transactions and other activity after that date may affect the amount of capital loss carryforward actually available for the Fund to utilize. Capital losses generated in years beginning after December 22, 2010 can be carried forward for an unlimited period, whereas previous losses expire in eight tax years. Capital losses with an expiration period may not be used to offset capital gains until all net capital losses without an expiration date have been utilized. Capital loss carryforwards with no expiration date will retain their character as either short-term or long-term capital losses instead of as short-term capital losses as under prior law. The ability to utilize capital loss carryforwards in the future may be limited under the Internal Revenue Code and related regulations based on the results of future transactions.
The Fund does not have a capital loss carryforward as of August 31, 2015.
NOTE 8—Investment Securities
The aggregate amount of investment securities (other than short-term securities, U.S. Treasury obligations and money market funds, if any) purchased and sold by the Fund during the year ended August 31, 2015 was $680,188,642 and $727,372,366, respectively. Cost of investments on a tax basis includes the adjustments for financial reporting purposes as of the most recently completed federal income tax reporting period-end.
| Unrealized Appreciation (Depreciation) of Investment Securities on a Tax Basis | ||||
Aggregate unrealized appreciation of investment securities | $ | 39,071,039 | ||
Aggregate unrealized (depreciation) of investment securities | (56,895,734 | ) | ||
Net unrealized appreciation (depreciation) of investment securities | $ | (17,824,695 | ) | |
Cost of investments for tax purposes is $1,024,856,241.
21 Invesco Global Real Estate Income Fund
NOTE 9—Reclassification of Permanent Differences
Primarily as a result of differing book/tax treatment of dividends, passive foreign investment companies and partnerships, on August 31, 2015, undistributed net investment income was increased by $11,045,261, undistributed net realized gain was decreased by $11,362,918 and shares of beneficial interest was increased by $317,657. This reclassification had no effect on the net assets of the Fund.
NOTE 10—Share Information
| Summary of Share Activity | ||||||||||||||||
| Years ended August 31, | ||||||||||||||||
| 2015(a) | 2014 | |||||||||||||||
| Shares | Amount | Shares | Amount | |||||||||||||
Sold: | ||||||||||||||||
Class A | 14,146,624 | $ | 132,193,306 | 21,831,402 | $ | 194,598,629 | ||||||||||
Class B | 8,986 | 85,063 | 19,347 | 175,050 | ||||||||||||
Class C | 1,694,288 | 15,727,052 | 2,660,455 | 23,754,784 | ||||||||||||
Class Y | 16,793,913 | 155,523,659 | 30,854,297 | 277,083,008 | ||||||||||||
Class R5 | 493,785 | 4,598,900 | 571,384 | 5,091,729 | ||||||||||||
Class R6 | 81,299 | 757,438 | 154,100 | 1,425,572 | ||||||||||||
Issued as reinvestment of dividends: | ||||||||||||||||
Class A | 1,728,158 | 15,861,225 | 3,295,294 | 28,602,726 | ||||||||||||
Class B | 4,439 | 40,677 | 8,822 | 76,364 | ||||||||||||
Class C | 328,419 | 3,010,348 | 553,619 | 4,795,746 | ||||||||||||
Class Y | 1,662,514 | 15,213,953 | 1,678,076 | 14,607,185 | ||||||||||||
Class R5 | 109,918 | 1,007,205 | 164,077 | 1,423,539 | ||||||||||||
Class R6 | 7,578 | 69,582 | 374 | 3,267 | ||||||||||||
Automatic conversion of Class B shares to Class A shares: | ||||||||||||||||
Class A | 35,460 | 327,764 | 21,919 | 197,730 | ||||||||||||
Class B | (35,507 | ) | (327,764 | ) | (21,948 | ) | (197,730 | ) | ||||||||
Reacquired: | ||||||||||||||||
Class A | (23,541,803 | ) | (217,630,435 | ) | (33,038,903 | ) | (294,435,257 | ) | ||||||||
Class B | (31,167 | ) | (292,284 | ) | (46,209 | ) | (410,649 | ) | ||||||||
Class C | (2,710,025 | ) | (25,029,126 | ) | (3,501,043 | ) | (31,033,822 | ) | ||||||||
Class Y | (18,509,565 | ) | (170,710,231 | ) | (18,932,345 | ) | (167,214,633 | ) | ||||||||
Class R5 | (1,604,082 | ) | (14,842,708 | ) | (889,093 | ) | (7,922,239 | ) | ||||||||
Class R6 | (74,210 | ) | (689,800 | ) | (11,744 | ) | (109,309 | ) | ||||||||
Net increase (decrease) in share activity | (9,410,978 | ) | $ | (85,106,176 | ) | 5,371,881 | $ | 50,511,690 | ||||||||
| (a) | There are entities that are record owners of more than 5% of the outstanding shares of the Fund and in the aggregate own 59% of the outstanding shares of the Fund. IDI has an agreement with these entities to sell Fund shares. The Fund, Invesco and/or Invesco affiliates may make payments to these entities, which are considered to be related to the Fund, for providing services to the Fund, Invesco and/or Invesco affiliates including but not limited to services such as securities brokerage, distribution, third party record keeping and account servicing. The Fund has no knowledge as to whether all or any portion of the shares owned of record by these entities are also owned beneficially. |
22 Invesco Global Real Estate Income Fund
NOTE 11—Financial Highlights
The following schedule presents financial highlights for a share of the Fund outstanding throughout the periods indicated.
| Net asset value, beginning of period | Net investment income(a) | Net gains (losses) on securities (both realized and unrealized) | Total from investment operations | Dividends from net investment income | Distributions from net realized gains | Total distributions | Net asset value, end of period | Total return(b) | Net assets, end of period (000’s omitted) | Ratio of expenses to average net assets with fee waivers and/or expenses absorbed | Ratio of expenses to average net assets without fee waivers and/or expenses absorbed | Ratio of net investment income to average net assets | Portfolio turnover(c) | |||||||||||||||||||||||||||||||||||||||||||
Class A | ||||||||||||||||||||||||||||||||||||||||||||||||||||||||
Year ended 08/31/15 | $ | 9.48 | $ | 0.29 | $ | (0.57 | ) | $ | (0.28 | ) | $ | (0.38 | ) | $ | (0.01 | ) | $ | (0.39 | ) | $ | 8.81 | (3.08 | )% | $ | 499,799 | 1.22 | %(d) | 1.22 | %(d) | 3.12 | %(d) | 60 | % | |||||||||||||||||||||||
Year ended 08/31/14 | 8.52 | 0.29 | 1.19 | 1.48 | (0.42 | ) | (0.10 | ) | (0.52 | ) | 9.48 | 18.13 | 609,824 | 1.27 | 1.27 | 3.26 | 61 | |||||||||||||||||||||||||||||||||||||||
Year ended 08/31/13 | 8.97 | 0.36 | (0.31 | ) | 0.05 | (0.50 | ) | — | (0.50 | ) | 8.52 | 0.43 | 615,876 | 1.26 | 1.27 | 4.00 | 63 | |||||||||||||||||||||||||||||||||||||||
Year ended 08/31/12 | 8.39 | 0.41 | 0.57 | 0.98 | (0.40 | ) | — | (0.40 | ) | 8.97 | (e) | 12.19 | 318,464 | 1.31 | 1.31 | 4.82 | 49 | |||||||||||||||||||||||||||||||||||||||
Year ended 08/31/11 | 7.77 | 0.32 | 0.61 | 0.93 | (0.31 | ) | — | (0.31 | ) | 8.39 | 12.11 | 203,100 | 1.30 | 1.30 | 3.83 | 101 | ||||||||||||||||||||||||||||||||||||||||
Class B | ||||||||||||||||||||||||||||||||||||||||||||||||||||||||
Year ended 08/31/15 | 9.46 | 0.22 | (0.57 | ) | (0.35 | ) | (0.31 | ) | (0.01 | ) | (0.32 | ) | 8.79 | (3.83 | ) | 1,064 | 1.97 | (d) | 1.97 | (d) | 2.37 | (d) | 60 | |||||||||||||||||||||||||||||||||
Year ended 08/31/14 | 8.51 | 0.23 | 1.18 | 1.41 | (0.36 | ) | (0.10 | ) | (0.46 | ) | 9.46 | 17.13 | 1,647 | 2.02 | 2.02 | 2.51 | 61 | |||||||||||||||||||||||||||||||||||||||
Year ended 08/31/13 | 8.95 | 0.29 | (0.30 | ) | (0.01 | ) | (0.43 | ) | — | (0.43 | ) | 8.51 | (0.23 | ) | 1,822 | 2.01 | 2.02 | 3.25 | 63 | |||||||||||||||||||||||||||||||||||||
Year ended 08/31/12 | 8.36 | 0.34 | 0.59 | 0.93 | (0.34 | ) | — | (0.34 | ) | 8.95 | (e) | 11.49 | 1,606 | 2.06 | 2.06 | 4.07 | 49 | |||||||||||||||||||||||||||||||||||||||
Year ended 08/31/11 | 7.75 | 0.26 | 0.59 | 0.85 | (0.24 | ) | — | (0.24 | ) | 8.36 | 11.15 | 1,772 | 2.05 | 2.05 | 3.08 | 101 | ||||||||||||||||||||||||||||||||||||||||
Class C | ||||||||||||||||||||||||||||||||||||||||||||||||||||||||
Year ended 08/31/15 | 9.46 | 0.22 | (0.57 | ) | (0.35 | ) | (0.31 | ) | (0.01 | ) | (0.32 | ) | 8.79 | (3.83 | ) | 103,988 | 1.97 | (d) | 1.97 | (d) | 2.37 | (d) | 60 | |||||||||||||||||||||||||||||||||
Year ended 08/31/14 | 8.51 | 0.23 | 1.18 | 1.41 | (0.36 | ) | (0.10 | ) | (0.46 | ) | 9.46 | 17.14 | 118,319 | 2.02 | 2.02 | 2.51 | 61 | |||||||||||||||||||||||||||||||||||||||
Year ended 08/31/13 | 8.95 | 0.29 | (0.30 | ) | (0.01 | ) | (0.43 | ) | — | (0.43 | ) | 8.51 | (0.23 | ) | 108,878 | 2.01 | 2.02 | 3.25 | 63 | |||||||||||||||||||||||||||||||||||||
Year ended 08/31/12 | 8.36 | 0.34 | 0.59 | 0.93 | (0.34 | ) | — | (0.34 | ) | 8.95 | (e) | 11.49 | 44,790 | 2.06 | 2.06 | 4.07 | 49 | |||||||||||||||||||||||||||||||||||||||
Year ended 08/31/11 | 7.75 | 0.26 | 0.59 | 0.85 | (0.24 | ) | — | (0.24 | ) | 8.36 | 11.15 | 26,511 | 2.05 | 2.05 | 3.08 | 101 | ||||||||||||||||||||||||||||||||||||||||
Class Y | ||||||||||||||||||||||||||||||||||||||||||||||||||||||||
Year ended 08/31/15 | 9.45 | 0.31 | (0.55 | ) | (0.24 | ) | (0.41 | ) | (0.01 | ) | (0.42 | ) | 8.79 | (2.75 | ) | 398,283 | 0.97 | (d) | 0.97 | (d) | 3.37 | (d) | 60 | |||||||||||||||||||||||||||||||||
Year ended 08/31/14 | 8.50 | 0.32 | 1.17 | 1.49 | (0.44 | ) | (0.10 | ) | (0.54 | ) | 9.45 | 18.33 | 428,854 | 1.02 | 1.02 | 3.51 | 61 | |||||||||||||||||||||||||||||||||||||||
Year ended 08/31/13 | 8.95 | 0.39 | (0.32 | ) | 0.07 | (0.52 | ) | — | (0.52 | ) | 8.50 | 0.68 | 270,196 | 1.01 | 1.02 | 4.25 | 63 | |||||||||||||||||||||||||||||||||||||||
Year ended 08/31/12 | 8.36 | 0.43 | 0.58 | 1.01 | (0.42 | ) | — | (0.42 | ) | 8.95 | (e) | 12.62 | 114,525 | 1.06 | 1.06 | 5.07 | 49 | |||||||||||||||||||||||||||||||||||||||
Year ended 08/31/11 | 7.75 | 0.34 | 0.60 | 0.94 | (0.33 | ) | — | (0.33 | ) | 8.36 | 12.28 | 26,139 | 1.05 | 1.05 | 4.08 | 101 | ||||||||||||||||||||||||||||||||||||||||
Class R5 | ||||||||||||||||||||||||||||||||||||||||||||||||||||||||
Year ended 08/31/15 | 9.47 | 0.32 | (0.56 | ) | (0.24 | ) | (0.41 | ) | (0.01 | ) | (0.42 | ) | 8.81 | (2.68 | ) | 14,204 | 0.91 | (d) | 0.91 | (d) | 3.43 | (d) | 60 | |||||||||||||||||||||||||||||||||
Year ended 08/31/14 | 8.52 | 0.32 | 1.18 | 1.50 | (0.45 | ) | (0.10 | ) | (0.55 | ) | 9.47 | 18.40 | 24,749 | 0.91 | 0.91 | 3.62 | 61 | |||||||||||||||||||||||||||||||||||||||
Year ended 08/31/13 | 8.96 | 0.39 | (0.30 | ) | 0.09 | (0.53 | ) | — | (0.53 | ) | 8.52 | 0.85 | 23,565 | 0.94 | 0.95 | 4.32 | 63 | |||||||||||||||||||||||||||||||||||||||
Year ended 08/31/12 | 8.38 | 0.44 | 0.57 | 1.01 | (0.43 | ) | — | (0.43 | ) | 8.96 | (e) | 12.63 | 30,076 | 0.98 | 0.98 | 5.15 | 49 | |||||||||||||||||||||||||||||||||||||||
Year ended 08/31/11 | 7.76 | 0.35 | 0.61 | 0.96 | (0.34 | ) | — | (0.34 | ) | 8.38 | 12.52 | 35,777 | 0.96 | 0.96 | 4.17 | 101 | ||||||||||||||||||||||||||||||||||||||||
Class R6 | ||||||||||||||||||||||||||||||||||||||||||||||||||||||||
Year ended 08/31/15 | 9.48 | 0.33 | (0.57 | ) | (0.24 | ) | (0.42 | ) | (0.01 | ) | (0.43 | ) | 8.81 | (2.70 | ) | 1,449 | 0.84 | (d) | 0.84 | (d) | 3.50 | (d) | 60 | |||||||||||||||||||||||||||||||||
Year ended 08/31/14 | 8.52 | 0.34 | 1.18 | 1.52 | (0.46 | ) | (0.10 | ) | (0.56 | ) | 9.48 | 18.62 | 1,420 | 0.87 | 0.87 | 3.66 | 61 | |||||||||||||||||||||||||||||||||||||||
Year ended 08/31/13(f) | 8.98 | 0.38 | (0.41 | ) | (0.03 | ) | (0.43 | ) | — | (0.43 | ) | 8.52 | (0.49 | ) | 60 | 0.86 | (g) | 0.87 | (g) | 4.40 | (g) | 63 | ||||||||||||||||||||||||||||||||||
| (a) | Calculated using average shares outstanding. |
| (b) | Includes adjustments in accordance with accounting principles generally accepted in the United States of America and as such, the net asset value for financial reporting purposes and the returns based upon those net asset values may differ from the net asset value and returns for shareholder transactions. Does not include sales charges and is not annualized for periods less than one year, if applicable. |
| (c) | Portfolio turnover is calculated at the fund level and is not annualized for periods less than one year, if applicable. |
| (d) | Ratios are based on average daily net assets (000’s omitted) of $575,834, $1,439, $116,026, $445,394, $22,350 and $1,568 for Class A, Class B, Class C, Class Y, Class R5 and Class R6 shares, respectively. |
| (e) | Includes redemption fees added to shares of beneficial interest which were less than $0.005 per share. |
| (f) | Commencement date of September 24, 2012. |
| (g) | Annualized. |
23 Invesco Global Real Estate Income Fund
Report of Independent Registered Public Accounting Firm
To the Board of Trustees of AIM Counselor Series Trust (Invesco Counselor Series Trust)
and Shareholders of Invesco Global Real Estate Income Fund:
In our opinion, the accompanying statement of assets and liabilities, including the schedule of investments, and the related statements of operations and of changes in net assets and the financial highlights present fairly, in all material respects, the financial position of Invesco Global Real Estate Income Fund (one of the funds constituting AIM Counselor Series Trust (Invesco Counselor Series Trust, hereafter referred to as the “Fund”) at August 31, 2015, the results of its operations for the year then ended, the changes in its net assets for each of the two years in the period then ended and the financial highlights for each of the five years in the period then ended, in conformity with accounting principles generally accepted in the United States of America. These financial statements and financial highlights (hereafter referred to as “financial statements”) are the responsibility of the Fund’s management. Our responsibility is to express an opinion on these financial statements based on our audits. We conducted our audits of these financial statements in accordance with the standards of the Public Company Accounting Oversight Board (United States). Those standards require that we plan and perform the audit to obtain reasonable assurance about whether the financial statements are free of material misstatement. An audit includes examining, on a test basis, evidence supporting the amounts and disclosures in the financial statements, assessing the accounting principles used and significant estimates made by management, and evaluating the overall financial statement presentation. We believe that our audits, which included confirmation of securities at August 31, 2015 by correspondence with the custodian and brokers, and the application of alternative auditing procedures where confirmations of security purchases have not been received, provide a reasonable basis for our opinion.
PRICEWATERHOUSECOOPERS LLP
October 27, 2015
Houston, Texas
24 Invesco Global Real Estate Income Fund
Calculating your ongoing Fund expenses
Example
As a shareholder of the Fund, you incur two types of costs: (1) transaction costs, which may include sales charges (loads) on purchase payments or contingent deferred sales charges on redemptions, if any; and (2) ongoing costs, including management fees, distribution and/or service (12b-1) fees, and other Fund expenses. This example is intended to help you understand your ongoing costs (in dollars) of investing in the Fund and to compare these costs with ongoing costs of investing in other mutual funds. The example is based on an investment of $1,000 invested at the beginning of the period and held for the entire period March 1, 2015 through August 31, 2015.
Actual expenses
The table below provides information about actual account values and actual expenses. You may use the information in this table, together with the amount you invested, to estimate the expenses that you paid over the period. Simply divide your account value by $1,000 (for example, an $8,600 account value divided by $1,000 = 8.6), then multiply the result by the number in the table under the heading entitled “Actual Expenses Paid During Period” to estimate the expenses you paid on your account during this period.
Hypothetical example for comparison purposes
The table below also provides information about hypothetical account values and hypothetical expenses based on the Fund’s actual expense ratio and an assumed rate of return of 5% per year before expenses, which is not the Fund’s actual return.
The hypothetical account values and expenses may not be used to estimate the actual ending account balance or expenses you paid for the period. You may use this information to compare the ongoing costs of investing in the Fund and other funds. To do so, compare this 5% hypothetical example with the 5% hypothetical examples that appear in the shareholder reports of the other funds.
Please note that the expenses shown in the table are meant to highlight your ongoing costs only and do not reflect any transaction costs, such as sales charges (loads) on purchase payments or contingent deferred sales charges on redemptions, if any. Therefore, the hypothetical information is useful in comparing ongoing costs only, and will not help you determine the relative total costs of owning different funds. In addition, if these transaction costs were included, your costs would have been higher.
| Class | Beginning Account Value (03/01/15) | ACTUAL | HYPOTHETICAL (5% annual return before | Annualized Expense Ratio | ||||||||||||||||||||
| Ending Account Value (08/31/15)1 | Expenses Paid During Period2 | Ending Account Value (08/31/15) | Expenses Paid During Period2 | |||||||||||||||||||||
| A | $ | 1,000.00 | $ | 942.60 | $ | 6.02 | $ | 1,019.00 | $ | 6.26 | 1.23 | % | ||||||||||||
| B | 1,000.00 | 937.90 | 9.67 | 1,015.22 | 10.06 | 1.98 | ||||||||||||||||||
| C | 1,000.00 | 937.90 | 9.67 | 1,015.22 | 10.06 | 1.98 | ||||||||||||||||||
| Y | 1,000.00 | 943.70 | 4.80 | 1,020.27 | 4.99 | 0.98 | ||||||||||||||||||
| R5 | 1,000.00 | 944.10 | 4.51 | 1,020.57 | 4.69 | 0.92 | ||||||||||||||||||
| R6 | 1,000.00 | 943.40 | 4.11 | 1,020.97 | 4.28 | 0.84 | ||||||||||||||||||
| 1 | The actual ending account value is based on the actual total return of the Fund for the period March 1, 2015 through August 31, 2015, after actual expenses and will differ from the hypothetical ending account value which is based on the Fund’s expense ratio and a hypothetical annual return of 5% before expenses. |
| 2 | Expenses are equal to the Fund’s annualized expense ratio as indicated above multiplied by the average account value over the period, multiplied by 184/365 to reflect the most recent fiscal half year. |
25 Invesco Global Real Estate Income Fund
Approval of Investment Advisory and Sub-Advisory Contracts
The Board of Trustees (the Board) of AIM Counselor Series Trust (Invesco Counselor Series Trust) is required under the Investment Company Act of 1940, as amended, to approve annually the renewal of Invesco Global Real Estate Income Fund’s (the Fund) investment advisory agreements. During contract renewal meetings held on June 9-10, 2015, the Board as a whole, and the disinterested or “independent” Trustees, who comprise over 75% of the Board, voting separately, approved the continuance for the Fund of the Master Investment Advisory Agreement with Invesco Advisers, Inc. (Invesco Advisers and the investment advisory agreement) and the Master Intergroup Sub-Advisory Contract for Mutual Funds with Invesco Asset Management Deutschland GmbH, Invesco Asset Management Limited, Invesco Asset Management (Japan) Limited, Invesco Hong Kong Limited, Invesco Senior Secured Management, Inc. and Invesco Canada Ltd. (collectively, the Affiliated Sub-Advisers and the sub-advisory contracts) for another year, effective July 1, 2015.
In evaluating the fairness and reasonableness of compensation under the Fund’s investment advisory agreement and sub-advisory contracts, the Board considered, among other things, the factors discussed below. The Board determined that continuation of the Fund’s investment advisory agreement and the sub-advisory contracts is in the best interest of the Fund and its shareholders and that the compensation payable to Invesco Advisers and the Affiliated Sub-Advisers under the agreements is fair and reasonable.
The Board’s Fund Evaluation Process
The Board’s Investments Committee has established three Sub-Committees, each of which is primarily responsible for overseeing the performance and investment management services provided by Invesco Advisers and the Affiliated Sub-Advisers to a number of the funds advised by Invesco Advisers (the Invesco Funds). The Sub-Committees meet throughout the year to review the performance of their assigned Invesco Funds, including reviewing materials prepared under the direction of the independent Senior Officer, an officer of the Invesco Funds who reports directly to the independent Trustees. Over the course of each year, the Sub-Committees meet with portfolio managers for their assigned Invesco Funds and other members of management to review the performance, investment objective(s), policies, strategies, limitations and investment risks of these funds. The Board had the benefit of reports from the Sub-Committees and Investments Committee throughout the year in considering approval of the continuance of each Invesco Fund’s investment advisory agreement and sub-advisory contracts for another year.
During the contract renewal process, the Board receives comparative performance and fee data regarding the Invesco Funds prepared by Invesco Advisers and Lipper Inc. (Lipper), an independent provider of investment company data. The Board also receives a report and this independent written evaluation from the Senior Officer. The Senior Officer’s evaluation is prepared as part of his responsibility to manage the process by which the Invesco Funds’ proposed management fees are negotiated during the annual contract renewal process to ensure they are negotiated in a manner that is at arms’ length and reasonable. In addition to meetings with Invesco Advisers and fund counsel, the independent Trustees also discuss the continuance of the investment advisory agreement and sub-advisory contracts in separate sessions with the Senior Officer and with independent legal counsel.
The Trustees recognized that the advisory fee rates for the Invesco Funds are, in many cases, the result of years of review and negotiation. The Trustees’ deliberations and conclusions in a particular year may be based in part on their deliberations and conclusions regarding these arrangements throughout the year and in prior years. The Trustees’ review and conclusions are based on the comprehensive consideration of all information presented to them and are not the result of any single determinative factor. Moreover, one Trustee may have weighed a particular piece of information or factor differently than another Trustee.
The discussion below is a summary of the Senior Officer’s independent written evaluation with respect to the Fund’s investment advisory agreement as well as a discussion of the material factors and related conclusions that formed the basis for the Board’s approval of the Fund’s investment advisory agreement and sub-advisory contracts. Unless otherwise stated, this information is current as of June 10, 2015, and does not reflect consideration of factors that became known to the Board after that date.
Factors and Conclusions and Summary of Independent Written Fee Evaluation
| A. | Nature, Extent and Quality of Services Provided by Invesco Advisers and the Affiliated Sub-Advisers |
The Board reviewed the advisory services provided to the Fund by Invesco Advisers under the Fund’s investment advisory agreement, the performance of Invesco Advisers in providing these services, and the credentials and experience of the officers and employees of Invesco Advisers who provide these services, including the Fund’s portfolio manager or managers. The Board’s review of the qualifications of Invesco Advisers to provide advisory services included the Board’s consideration of Invesco Advisers’ investment
process oversight, independent credit analysis and investment risk management. The Board also considered non-advisory services that Invesco Advisers and its affiliates provide to the Invesco Funds such as various back office support functions, equity and fixed income trading operations, internal audit, distribution, valuation and legal and compliance.
In determining whether to continue the Fund’s investment advisory agreement, the Board considered the benefits of reapproving an existing relationship and the greater uncertainty that may be associated with entering into a new relationship. The Board concluded that the nature, extent and quality of the services provided to the Fund by Invesco Advisers are appropriate and satisfactory and consistent with the terms of the Fund’s investment advisory agreement.
The Board reviewed the services that may be provided by the Affiliated Sub-Advisers under the sub-advisory contracts and the credentials and experience of the officers and employees of the Affiliated Sub-Advisers who provide these services. The Board noted that the Affiliated Sub-Advisers have offices and personnel that are located in financial centers around the world. As a result, the Affiliated Sub-Advisers can provide research and investment analysis on the markets and economies of various countries in which the Fund may invest, make recommendations regarding securities and assist with security trades. The Board concluded that the sub-advisory contracts benefit the Fund and its shareholders by permitting Invesco Advisers to use the resources and talents of the Affiliated Sub-Advisers in managing the Fund. The Board concluded that the nature, extent and quality of the services that may be provided by the Affiliated Sub-Advisers are appropriate and satisfactory and consistent with the terms of the Fund’s sub-advisory contracts.
| B. | Fund Performance |
The Board considered Fund performance as a relevant factor in considering whether to approve the investment advisory agreement as well as the sub-advisory contracts for the Fund, as Invesco Asset Management Limited currently manages assets of the Fund.
The Board compared the Fund’s performance during the past one, three and five calendar years to the performance of funds in the Lipper performance universe and against the Lipper Global Real Estate Funds Index. The Board noted that performance of Class A shares of the Fund was in the third quintile of the Lipper performance universe for the one and five year periods and the fifth quintile for the three year period (the first quintile being the best performing funds and the fifth quintile being the worst performing funds). The Board noted that performance of Class A shares of the Fund was above the performance of the Index for the one
26 Invesco Global Real Estate Income Fund
year period and below the performance of the Index for the three and five year periods. The Fund invests in a mix or equity and fixed income securities and will likely underperform when equities meaningfully outperform bonds. The Trustees also reviewed more recent Fund performance and this review did not change their conclusions.
| C. | Advisory and Sub-Advisory Fees |
The Board compared the Fund’s contractual management fee rate to the contractual management fee rates of funds in the Fund’s Lipper expense group at a common asset level. The Board noted that the contractual management fee rate for Class A shares of the Fund was below the median contractual management fee rate of funds in its expense group. The Board noted that the term “contractual management fee” may include both advisory and certain administrative services fees, but that Lipper does not provide information on a fund by fund basis as to what is included. The Board noted that Invesco Advisers does not charge the Invesco Funds for the administrative services included in the term as defined by Lipper. The Board also reviewed the methodology used by Lipper in providing expense group information, which includes using each fund’s contractual management fee schedule (including any applicable breakpoints) as reported in the most recent prospectus or statement of additional information for each fund in the expense group.
The Board noted that Invesco Advisers and the Affiliated Sub-Advisers do not manage other mutual funds or client accounts with investment strategies comparable to those of the Fund.
The Board also considered the services that may be provided by the Affiliated Sub-Advisers pursuant to the sub-advisory contracts, as well as the fees payable by Invesco Advisers to the Affiliated Sub-Advisers pursuant to the sub-advisory contracts. The Board noted that Invesco Advisers retains overall responsibility for, and provides services to, sub-advised Invesco Funds, including oversight of the Affiliated Sub-Advisers as well as the additional services described herein other than day-to-day portfolio management. The Board also noted that the sub-advisory fees are not paid directly by the Fund, but rather, are payable by Invesco Advisers to the Affiliated Sub-Advisers.
| D. | Economies of Scale and Breakpoints |
The Board considered the extent to which there are economies of scale in the provision of advisory services to the Fund. The Board also considered whether the Fund benefits from economies of scale through contractual breakpoints in the Fund’s advisory fee schedule. The Board also noted that the Fund shares directly in economies of scale through lower fees charged by third party service providers based on the combined size of the Invesco Funds and other clients advised by Invesco Advisers.
| E. | Profitability and Financial Resources |
The Board reviewed information from Invesco Advisers concerning the costs of the advisory
and other services that Invesco Advisers and its affiliates provide to the Fund and the Invesco Funds and the profitability of Invesco Advisers and its affiliates in providing these services. The Board received information from Invesco Advisers about the methodology used to prepare the profitability information. The Board noted that Invesco Advisers continues to operate at a net profit from services Invesco Advisers and its affiliates provide to the Invesco Funds and the Fund. The Board did not deem the level of profits realized by Invesco Advisers and its affiliates from providing services to the Fund to be excessive given the nature, quality and extent of the services provided. The Board received and accepted information from Invesco Advisers demonstrating that Invesco Advisers and each Affiliated Sub-Adviser are financially sound and have the resources necessary to perform their obligations under the investment advisory agreement and sub-advisory contracts.
| F. | Collateral Benefits to Invesco Advisers and its Affiliates |
The Board considered various other benefits received by Invesco Advisers and its affiliates from the relationship with the Fund, including the fees received for providing transfer agency and distribution services to the Fund. The Board considered comparative information regarding fees charged for these services, including information provided by Lipper and other independent sources. The Board considered the performance of Invesco Advisers and its affiliates in providing these services and the organizational structure employed to provide these services. The Board also considered that these services are provided to the Fund pursuant to written contracts that are reviewed and approved on an annual basis by the Board; and that the services are required for the operation of the Fund.
The Board considered the benefits realized by Invesco Advisers and the Affiliated Sub-Advisers as a result of portfolio brokerage transactions executed through “soft dollar” arrangements. The Board noted that soft dollar arrangements shift the payment obligation for research services from Invesco Advisers and the Affiliated Sub-Advisers to the Invesco Funds and that the research received may be used with other clients of Invesco Advisers and may reduce Invesco Advisers’ and the Affiliated Sub-Advisers’ expenses. The Board also considered that it receives periodic reports from the Chief Compliance Officer of the Invesco Funds demonstrating that these arrangements are consistent with regulatory requirements. The Board did not deem the soft dollar arrangements to be inappropriate.
The Board considered that the Fund’s uninvested cash and cash collateral from any securities lending arrangements may be invested in money market funds advised by Invesco Advisers pursuant to procedures approved by the Board. The Board noted that Invesco Advisers receives advisory fees from these affiliated money market funds attributable to such investments, although
Invesco Advisers has contractually agreed to waive through varying periods the advisory fees payable by the Invesco Funds with respect to investments in the affiliated money market funds. The waiver is in an amount equal to 100% of the net advisory fee Invesco Advisers receives from the affiliated money market funds with respect to the Fund’s investment in the affiliated money market funds of uninvested cash, but not cash collateral. The Board concluded that the amount of advisory fees received by Invesco Advisors from the Fund’s investment of cash collateral from any securities lending arrangements in the affiliated money market funds is fair and reasonable.
The Board also considered the Fund may use an affiliated broker to execute certain trades for the Fund to, among other things, control information leakage, and were advised that such trades would be executed in compliance with rules under the Investment Company Act of 1940, as amended, and consistent with best execution obligations.
27 Invesco Global Real Estate Income Fund
Tax Information
Form 1099-DIV, Form 1042-S and other year–end tax information provide shareholders with actual calendar year amounts that should be included in their tax returns. Shareholders should consult their tax advisors.
The following distribution information is being provided as required by the Internal Revenue Code or to meet a specific state’s requirement.
The Fund designates the following amounts or, if subsequently determined to be different, the maximum amount allowable for its fiscal year ended August 31, 2015:
Federal and State Income Tax | ||||
Long-Term Capital Gain Distributions | $ | 3,581,849 | ||
Qualified Dividend Income* | 0.00 | % | ||
Corporate Dividends Received Deduction* | 0.00 | % | ||
U.S. Treasury Obligations* | 0.00 | % | ||
| * | The above percentages are based on ordinary income dividends paid to shareholders during the Fund’s fiscal year. |
Distribution Information
The following table sets forth on a per share basis the distribution that was paid in June 2015. Included in the table is a written statement of the sources of the distribution on a generally accepted accounting principles (“GAAP”) basis.
| Net Income | Gain from Sale of Securities | Return of Principal | Total Distribution | |||||||||||||||
| 6/18/2015 | Class A | $ | 0.0523 | $ | 0.0236 | $ | 0.0000 | $ | 0.0759 | |||||||||
| 6/18/2015 | Class B | 0.0348 | 0.0236 | 0.0000 | 0.0584 | |||||||||||||
| 6/18/2015 | Class C | 0.0348 | 0.0236 | 0.0000 | 0.0584 | |||||||||||||
| 6/18/2015 | Class Y | 0.0578 | 0.0236 | 0.0000 | 0.0814 | |||||||||||||
| 6/18/2015 | Class R5 | 0.0592 | 0.0236 | 0.0000 | 0.0828 | |||||||||||||
| 6/18/2015 | Class R6 | 0.0611 | 0.0236 | 0.0000 | 0.0847 | |||||||||||||
Please note that the information in the preceding chart is for financial accounting purposes only. Shareholders should be aware that the tax treatment of distributions likely differs from GAAP treatment. Form 1099-DIV for the calendar year will report distributions for federal income tax purposes. This Notice is sent to comply with certain Securities and Exchange Commission requirements.
28 Invesco Global Real Estate Income Fund
Trustees and Officers
The address of each trustee and officer is AIM Counselor Series Trust (Invesco Counselor Series Trust) (the “Trust”), 11 Greenway Plaza, Suite 1000, Houston, Texas 77046-1173. The trustees serve for the life of the Trust, subject to their earlier death, incapacitation, resignation, retirement or removal as more specifically provided in the Trust’s organizational documents. Each officer serves for a one year term or until their successors are elected and qualified. Column two below includes length of time served with predecessor entities, if any.
| Name, Year of Birth and Position(s) Held with the Trust | Trustee and/ or Officer Since | Principal Occupation(s) During Past 5 Years | Number of Funds in Fund Complex Overseen by Trustee | Other Directorship(s) Held by Trustee During Past 5 Years | ||||
| Interested Persons | ||||||||
| Martin L. Flanagan1 — 1960 Trustee | 2007 | Executive Director, Chief Executive Officer and President, Invesco Ltd. (ultimate parent of Invesco and a global investment management firm); Advisor to the Board, Invesco Advisers, Inc. (formerly known as Invesco Institutional (N.A.), Inc.); Trustee, The Invesco Funds; Vice Chair, Investment Company Institute; and Member of Executive Board, SMU Cox School of Business
Formerly: Chairman and Chief Executive Officer, Invesco Advisers, Inc. (registered investment adviser); Director, Chairman, Chief Executive Officer and President, IVZ Inc. (holding company), INVESCO Group Services, Inc. (service provider) and Invesco North American Holdings, Inc. (holding company); Director, Chief Executive Officer and President, Invesco Holding Company Limited (parent of Invesco and a global investment management firm); Director, Invesco Ltd.; Chairman, Investment Company Institute and President, Co-Chief Executive Officer, Co-President, Chief Operating Officer and Chief Financial Officer, Franklin Resources, Inc. (global investment management organization). | 144 | None | ||||
| Philip A. Taylor2 — 1954 Trustee, President and Principal Executive Officer | 2006 | Head of North American Retail and Senior Managing Director, Invesco Ltd.; Director, Co-Chairman, Co-President and Co-Chief Executive Officer, Invesco Advisers, Inc. (formerly known as Invesco Institutional (N.A.), Inc.) (registered investment adviser); Director, Chairman, Chief Executive Officer and President, Invesco Management Group, Inc. (formerly known as Invesco Aim Management Group, Inc.) (financial services holding company); Director and President, INVESCO Funds Group, Inc. (registered investment adviser and registered transfer agent); Director and Chairman, Invesco Investment Services, Inc. (formerly known as Invesco Aim Investment Services, Inc.) (registered transfer agent) and IVZ Distributors, Inc. (formerly known as INVESCO Distributors, Inc.) (registered broker dealer); Director, President and Chairman, Invesco Inc. (holding company), Invesco Canada Holdings Inc. (holding company), Trimark Investments Ltd./Placements Trimark Ltèe and Invesco Financial Services Ltd/Services Financiers Invesco Ltèe; Chief Executive Officer, Invesco Corporate Class Inc. (corporate mutual fund company) Director, Chairman and Chief Executive Officer, Invesco Canada Ltd. (formerly known as Invesco Trimark Ltd./Invesco Trimark Ltèe) (registered investment adviser and registered transfer agent); Trustee, President and Principal Executive Officer, The Invesco Funds (other than AIM Treasurer’s Series Trust (Invesco Treasurer’s Series Trust), Short-Term Investments Trust and Invesco Management Trust); Trustee and Executive Vice President, The Invesco Funds (AIM Treasurer’s Series Trust (Invesco Treasurer’s Series Trust), Short-Term Investments Trust and Invesco Management Trust only); Director, Invesco Investment Advisers LLC (formerly known as Van Kampen Asset Management); Director, Chief Executive Officer and President, Van Kampen Exchange Corp.
Formerly: Chief Executive Officer, Invesco Canada Fund Inc (corporate mutual fund company); Director and Chairman, Van Kampen Investor Services Inc.; Director, Chief Executive Officer and President, 1371 Preferred Inc. (holding company) and Van Kampen Investments Inc.; Director and President, AIM GP Canada Inc. (general partner for limited partnerships) and Van Kampen Advisors, Inc.; Director and Chief Executive Officer, Invesco Trimark Dealer Inc. (registered broker dealer); Director, Invesco Distributors, Inc. (formerly known as Invesco Aim Distributors, Inc.) (registered broker dealer); Manager, Invesco PowerShares Capital Management LLC; Director, Chief Executive Officer and President, Invesco Advisers, Inc.; Director, Chairman, Chief Executive Officer and President, Invesco Aim Capital Management, Inc.; President, Invesco Trimark Dealer Inc. and Invesco Trimark Ltd./Invesco Trimark Ltèe; Director and President, AIM Trimark Corporate Class Inc. and AIM Trimark Canada Fund Inc.; Senior Managing Director, Invesco Holding Company Limited; Director and Chairman, Fund Management Company (former registered broker dealer); President and Principal Executive Officer, The Invesco Funds (AIM Treasurer’s Series Trust (Invesco Treasurer’s Series Trust), and Short-Term Investments Trust only); President, AIM Trimark Global Fund Inc. and AIM Trimark Canada Fund Inc.. | 144 | None |
| 1 | Mr. Flanagan is considered an interested person (within the meaning of Section 2(a)(19) of the 1940 Act) of the Trust because he is an officer of the Adviser to the Trust, and an officer and a director of Invesco Ltd., ultimate parent of the Adviser. |
| 2 | Mr. Taylor is considered an interested person (within the meaning of Section 2(a)(19) of the 1940 Act) of the Trust because he is an officer and a director of the Adviser. |
T-1 Invesco Global Real Estate Income Fund
Trustees and Officers—(continued)
| Name, Year of Birth and Position(s) Held with the Trust | Trustee and/ or Officer Since | Principal Occupation(s) During Past 5 Years | Number of Funds in Fund Complex Overseen by Trustee | Other Directorship(s) Held by Trustee During Past 5 Years | ||||
| Independent Trustees | ||||||||
Bruce L. Crockett — 1944 Trustee and Chair | 2003 | Chairman, Crockett Technologies Associates (technology consulting company)
Formerly: Director, Captaris (unified messaging provider); Director, President and Chief Executive Officer, COMSAT Corporation; Chairman, Board of Governors of INTELSAT (international communications company); ACE Limited (insurance company); Independent Directors Council and Investment Company Institute | 144 | ALPS (Attorneys Liability Protection Society) (insurance company) and Globe Specialty Metals, Inc. (metallurgical company) | ||||
David C. Arch — 1945 Trustee | 2010 | Chairman of Blistex Inc., a consumer health care products manufacturer | 144 | Board member of the Illinois Manufacturers’ Association; Member of the Board of Visitors, Institute for the Humanities, University of Michigan; Member of the Audit Committee of the Edward-Elmhurst Hospital | ||||
James T. Bunch — 1942 Trustee | 2000 | Managing Member, Grumman Hill Group LLC (family office/private equity investments)
Formerly: Founder, Green Manning & Bunch Ltd. (investment banking firm) (1988-2010); Executive Committee, United States Golf Association; and Chairman, Board of Governors, Western Golf Association | 144 | Chairman of the Board of Trustees, Evans Scholars Foundation; and Chairman of the Board, Denver Film Society | ||||
Rodney F. Dammeyer — 1940 Trustee | 2010 | Chairman of CAC, LLC, (private company offering capital investment and management advisory services)
Formerly: Prior to 2001, Managing Partner at Equity Group Corporate Investments; Prior to 1995, Chief Executive Officer of Itel Corporation (formerly Anixter International); Prior to 1985, experience includes Senior Vice President and Chief Financial Officer of Household International, Inc., Executive Vice President and Chief Financial Officer of Northwest Industries, Inc. and Partner of Arthur Andersen & Co.; From 1987 to 2010, Director/Trustee of investment companies in the Van Kampen Funds complex | 144 | Director of Quidel Corporation and Stericycle, Inc. | ||||
Albert R. Dowden — 1941 Trustee | 2003 | Director of a number of public and private business corporations, including the Boss Group, Ltd. (private investment and management); Nature’s Sunshine Products, Inc. and Reich & Tang Funds (5 portfolios) (registered investment company)
Formerly: Director, Homeowners of America Holding Corporation/Homeowners of America Insurance Company (property casualty company); Director, Continental Energy Services, LLC (oil and gas pipeline service); Director, CompuDyne Corporation (provider of product and services to the public security market) and Director, Annuity and Life Re (Holdings), Ltd. (reinsurance company); Director, President and Chief Executive Officer, Volvo Group North America, Inc.; Senior Vice President, AB Volvo; Director of various public and private corporations; Chairman, DHJ Media, Inc.; Director, Magellan Insurance Company; and Director, The Hertz Corporation, Genmar Corporation (boat manufacturer), National Media Corporation; Advisory Board of Rotary Power International (designer, manufacturer, and seller of rotary power engines); and Chairman, Cortland Trust, Inc. (registered investment company) | 144 | Director of: Nature’s Sunshine Products, Inc., Reich & Tang Funds, Homeowners of America Holding Corporation/ Homeowners of America Insurance Company, the Boss Group | ||||
Jack M. Fields — 1952 Trustee | 2003 | Chief Executive Officer, Twenty First Century Group, Inc. (government affairs company); Owner and Chief Executive Officer, Dos Angeles Ranch, L.P. (cattle, hunting, corporate entertainment); and Discovery Global Education Fund (non-profit)
Formerly: Chief Executive Officer, Texana Timber LP (sustainable forestry company); Director of Cross Timbers Quail Research Ranch (non-profit); and member of the U.S. House of Representatives | 144 | Insperity, Inc. (formerly known as Administaff) | ||||
Prema Mathai-Davis — 1950 Trustee | 2003 | Retired. Formerly: Chief Executive Officer, YWCA of the U.S.A. | 144 | None | ||||
Larry Soll — 1942 Trustee | 1997 | Retired. Formerly: Chairman, Chief Executive Officer and President, Synergen Corp. (a biotechnology company) | 144 | None | ||||
Hugo F. Sonnenschein — 1940 Trustee | 2010 | President Emeritus and Honorary Trustee of the University of Chicago and the Adam Smith Distinguished Service Professor in the Department of Economics at the University of Chicago. Prior to 2000, President of the University of Chicago | 144 | Trustee of the University of Rochester and a member of its investment committee; Member of the National Academy of Sciences and the American Philosophical Society; Fellow of the American Academy of Arts and Sciences | ||||
| Raymond Stickel, Jr. — 1944 Trustee | 2005 | Retired. Formerly: Director, Mainstay VP Series Funds, Inc. (25 portfolios) and Partner, Deloitte & Touche | 144 | None |
T-2 Invesco Global Real Estate Income Fund
Trustees and Officers—(continued)
| Name, Year of Birth and Position(s) Held with the Trust | Trustee and/ or Officer Since | Principal Occupation(s) During Past 5 Years | Number of Funds in Fund Complex Overseen by Trustee | Other Directorship(s) Held by Trustee During Past 5 Years | ||||
| Independent Trustees—(continued) | ||||||||
Suzanne H. Woolsey — 1941 Trustee | 2014 | Chief Executive Officer of Woolsey Partners LLC | 144 | Emeritus Chair of the Board of Trustees of the Institute for Defense Analyses; Trustee of Colorado College; Trustee of California Institute of Technology; Prior to 2014, Director of Fluor Corp.; Prior to 2010, Trustee of the German Marshall Fund of the United States; Prior to 2010 Trustee of the Rocky Mountain Institute | ||||
| Other Officers | ||||||||
Russell C. Burk — 1958 Senior Vice President and Senior Officer | 2005 | Senior Vice President and Senior Officer, The Invesco Funds | N/A | N/A | ||||
John M. Zerr — 1962 Senior Vice President, Chief Legal Officer and Secretary | 2006 | Director, Senior Vice President, Secretary and General Counsel, Invesco Management Group, Inc. (formerly known as Invesco Aim Management Group, Inc.) and Van Kampen Exchange Corp.; Senior Vice President, Invesco Advisers, Inc. (formerly known as Invesco Institutional (N.A.), Inc.) (registered investment adviser); Senior Vice President and Secretary, Invesco Distributors, Inc. (formerly known as Invesco Aim Distributors, Inc.); Director, Vice President and Secretary, Invesco Investment Services, Inc. (formerly known as Invesco Aim Investment Services, Inc.) and IVZ Distributors, Inc. (formerly known as INVESCO Distributors, Inc.); Director and Vice President, INVESCO Funds Group, Inc.; Senior Vice President, Chief Legal Officer and Secretary, The Invesco Funds; Managing Director, Invesco PowerShares Capital Management LLC; Director, Secretary and General Counsel, Invesco Investment Advisers LLC (formerly known as Van Kampen Asset Management); Secretary and General Counsel, Invesco Capital Markets, Inc. (formerly known as Van Kampen Funds Inc.) and Chief Legal Officer, PowerShares Exchange-Traded Fund Trust, PowerShares Exchange-Traded Fund Trust II, PowerShares India Exchange-Traded Fund Trust, PowerShares Actively Managed Exchange-Traded Fund Trust, and PowerShares Actively Managed Exchange-Traded Commodity Fund Trust
Formerly: Director and Vice President, Van Kampen Advisors Inc.; Director, Vice President, Secretary and General Counsel, Van Kampen Investor Services Inc.; Director, Invesco Distributors, Inc. (formerly known as Invesco Aim Distributors, Inc.); Director, Senior Vice President, General Counsel and Secretary, Invesco Aim Advisers, Inc. and Van Kampen Investments Inc.; Director, Vice President and Secretary, Fund Management Company; Director, Senior Vice President, Secretary, General Counsel and Vice President, Invesco Aim Capital Management, Inc.; Chief Operating Officer and General Counsel, Liberty Ridge Capital, Inc. (an investment adviser); Vice President and Secretary, PBHG Funds (an investment company) and PBHG Insurance Series Fund (an investment company); Chief Operating Officer, General Counsel and Secretary, Old Mutual Investment Partners (a broker-dealer); General Counsel and Secretary, Old Mutual Fund Services (an administrator) and Old Mutual Shareholder Services (a shareholder servicing center); Executive Vice President, General Counsel and Secretary, Old Mutual Capital, Inc. (an investment adviser); and Vice President and Secretary, Old Mutual Advisors Funds (an investment company) | N/A | N/A | ||||
| Sheri Morris — 1964 Vice President, Treasurer and Principal Financial Officer | 2003 | Vice President, Treasurer and Principal Financial Officer, The Invesco Funds; Vice President, Invesco Advisers, Inc. (formerly known as Invesco Institutional (N.A.), Inc.) (registered investment adviser); and Vice President, PowerShares Exchange-Traded Fund Trust, PowerShares Exchange-Traded Fund Trust II, PowerShares India Exchange-Traded Fund Trust, PowerShares Actively Managed Exchange-Traded Fund Trust, and PowerShares Actively Managed Exchange-Traded Commodity Fund Trust
Formerly: Vice President, Invesco Aim Advisers, Inc., Invesco Aim Capital Management, Inc. and Invesco Aim Private Asset Management, Inc.; Assistant Vice President and Assistant Treasurer, The Invesco Funds and Assistant Vice President, Invesco Advisers, Inc., Invesco Aim Capital Management, Inc. and Invesco Aim Private Asset Management, Inc.; and Treasurer, PowerShares Exchange-Traded Fund Trust, PowerShares Exchange-Traded Fund Trust II, PowerShares India Exchange-Traded Fund Trust and PowerShares Actively Managed Exchange-Traded Fund Trust | N/A | N/A | ||||
T-3 Invesco Global Real Estate Income Fund
Trustees and Officers—(continued)
| Name, Year of Birth and Position(s) Held with the Trust | Trustee and/ or Officer Since | Principal Occupation(s) During Past 5 Years | Number of Funds in Fund Complex Overseen by Trustee | Other Directorship(s) Held by Trustee During Past 5 Years | ||||
| Other Officers—(continued) | ||||||||
| Karen Dunn Kelley — 1960 Vice President | 2003 | Senior Managing Director, Investments, Invesco Ltd.; Director, Co-President, Co-Chief Executive Officer, and Co-Chairman, Invesco Advisers, Inc. (formerly known as Invesco Institutional (N.A.), Inc.) (registered investment adviser); Chairman, Invesco Senior Secured Management, Inc.; Senior Vice President, Invesco Management Group, Inc. (formerly known as Invesco Aim Management Group, Inc.); Executive Vice President, Invesco Distributors, Inc. (formerly known as Invesco Aim Distributors, Inc.); Director, Invesco Mortgage Capital Inc. and Invesco Management Company Limited; Vice President, The Invesco Funds (other than AIM Treasurer’s Series Trust (Invesco Treasurer’s Series Trust), Short-Term Investments Trust and Invesco Management Trust); and President and Principal Executive Officer, The Invesco Funds (AIM Treasurer’s Series Trust (Invesco Treasurer’s Series Trust), Short-Term Investments Trust and Invesco Management Trust only)
Formerly: Director and President, INVESCO Asset Management (Bermuda) Ltd., Director, INVESCO Global Asset Management Limited and INVESCO Management S.A.; Senior Vice President, Van Kampen Investments Inc. and Invesco Advisers, Inc. (formerly known as Invesco Institutional (N.A.), Inc.) (registered investment adviser); Vice President, Invesco Advisers, Inc. (formerly known as Invesco Institutional (N.A.), Inc.); Director of Cash Management and Senior Vice President, Invesco Advisers, Inc. and Invesco Aim Capital Management, Inc.; Director and President, Fund Management Company; Chief Cash Management Officer, Director of Cash Management, Senior Vice President, and Managing Director, Invesco Aim Capital Management, Inc.; Director of Cash Management, Senior Vice President, and Vice President, Invesco Advisers, Inc. and The Invesco Funds (AIM Treasurer’s Series Trust (Invesco Treasurer’s Series Trust), and Short-Term Investments Trust only) | N/A | N/A | ||||
| Crissie M. Wisdom — 1969 Anti-Money Laundering Compliance Officer | 2013 | Anti-Money Laundering Compliance Officer, Invesco Advisers, Inc. (formerly known as Invesco Institutional (N.A.), Inc.) (registered investment adviser), Invesco Capital Markets, Inc. (formerly known as Van Kampen Funds Inc.), Invesco Distributors, Inc., Invesco Investment Services, Inc., Invesco Management Group, Inc., Van Kampen Exchange Corp., The Invesco Funds, and PowerShares Exchange-Traded Fund Trust, PowerShares Exchange-Traded Fund Trust II, PowerShares India Exchange-Traded Fund Trust, PowerShares Actively Managed Exchange-Traded Fund Trust and PowerShares Actively Managed Exchange-Traded Commodity Fund Trust; Anti-Money Laundering Compliance Officer and Bank Secrecy Act Officer, INVESCO National Trust Company and Invesco Trust Company; and Fraud Prevention Manager and Controls and Risk Analysis Manager for Invesco Investment Services, Inc.. | N/A | N/A | ||||
Lisa O. Brinkley — 1959 Chief Compliance Officer | 2004 | Senior Vice President and Chief Compliance Officer, Invesco Advisers, Inc. (registered investment adviser) (formerly known as Invesco Institutional (N.A., Inc.); and Chief Compliance Officer, The Invesco Funds
Formerly: Global Assurance Officer, Invesco Ltd. and Vice President, The Invesco Funds; Chief Compliance Officer, Invesco Distributors, Inc. (formerly known as Invesco Aim Distributors, Inc.), Invesco Investment Services, Inc.(formerly known as Invesco Aim Investment Services, Inc.) and Van Kampen Investor Services Inc.; Senior Vice President, Invesco Management Group, Inc.; Senior Vice President and Chief Compliance Officer, Invesco Advisers, Inc. and The Invesco Funds; Vice President and Chief Compliance Officer, Invesco Aim Capital Management, Inc. and Invesco Distributors, Inc.; Vice President, Invesco Investment Services, Inc. and Fund Management Company. | N/A | N/A |
The Statement of Additional Information of the Trust includes additional information about the Fund’s Trustees and is available upon request, without charge, by calling 1.800.959.4246. Please refer to the Fund’s prospectus for information on the Fund’s sub-advisers.
Office of the Fund 11 Greenway Plaza, Suite 1000 Houston, TX 77046-1173 | Investment Adviser Invesco Advisers, Inc. 1555 Peachtree Street, N.E. Atlanta, GA 30309 | Distributor Invesco Distributors, Inc. 11 Greenway Plaza, Suite 1000 Houston, TX 77046-1173 | Auditors PricewaterhouseCoopers LLP 1000 Louisiana Street, Suite 5800 Houston, TX 77002-5678 | |||
Counsel to the Fund Stradley Ronon Stevens & Young, LLP 2005 Market Street, Suite 2600 Philadelphia, PA 19103-7018 | Counsel to the Independent Trustees Goodwin Procter LLP 901 New York Avenue, N.W. Washington, D.C. 20001 | Transfer Agent Invesco Investment Services, Inc. 11 Greenway Plaza, Suite 1000 Houston, TX 77046-1173 | Custodian State Street Bank and Trust Company 225 Franklin Street Boston, MA 02110-2801 | |||
T-4 Invesco Global Real Estate Income Fund

Invesco mailing information
Send general correspondence to Invesco Investment Services, Inc., P.O. Box 219078, Kansas City, MO 64121-9078.
Important notice regarding delivery of security holder documents
To reduce Fund expenses, only one copy of most shareholder documents may be mailed to shareholders with multiple accounts at the same address (Householding). Mailing of your shareholder documents may be householded indefinitely unless you instruct us otherwise. If you do not want the mailing of these documents to be combined with those for other members of your household, please contact Invesco Investment Services, Inc. at 800 959 4246 or contact your financial institution. We will begin sending you individual copies for each account within 30 days after receiving your request.
Fund holdings and proxy voting information
The Fund provides a complete list of its holdings four times in each fiscal year, at the quarter ends. For the second and fourth quarters, the lists appear in the Fund’s semiannual and annual reports to shareholders. For the first and third quarters, the Fund files the lists with the Securities and Exchange Commission (SEC) on Form N-Q. The most recent list of portfolio holdings is available at invesco.com/completeqtrholdings. Shareholders can also look up the Fund’s Forms N-Q on the SEC website at sec.gov. Copies of the Fund’s Forms N-Q may be reviewed and copied at the SEC Public Reference Room in Washington, D.C. You can obtain information on the operation of the Public Reference Room, including information about duplicating fee charges, by calling 202 551 8090 or 800 732 0330, or by electronic request at the following email address: publicinfo@sec.gov.
The SEC file numbers for the Fund are shown below.
A description of the policies and procedures that the Fund uses to determine how to vote proxies relating to portfolio securities is available without charge, upon request, from our Client Services department at 800 959 4246 or at invesco.com/proxyguidelines. The information is also available on the SEC website, sec.gov.
Information regarding how the Fund voted proxies related to its portfolio securities during the most recent 12-month period ended June 30 is available at invesco.com/proxysearch. The information is also available on the SEC website, sec.gov. Invesco Advisers, Inc. is an investment adviser; it provides investment advisory services to individual and institutional clients and does not sell securities. Invesco Distributors, Inc. is the US distributor for Invesco Ltd.’s retail mutual funds, exchange-traded funds and institutional money market funds. Both are wholly owned, indirect subsidiaries of Invesco Ltd. |  |
SEC file numbers: 811-09913 and 333-36074 GREI-AR-1 Invesco Distributors, Inc.
 |
| |||
Annual Report to Shareholders
| August 31, 2015 | |||
Invesco Growth and Income Fund | ||||
Nasdaq: A: ACGIX ¡ B: ACGJX ¡ C: ACGKX ¡ R: ACGLX ¡ Y: ACGMX ¡ R5: ACGQX ¡ R6: GIFFX | ||||

Letters to Shareholders
Philip Taylor | Dear Shareholders: This annual report includes information about your Fund, including performance data and a complete list of its investments as of the close of the reporting period. Inside is a discussion of how your Fund was managed and the factors that affected its performance during the reporting period. I hope you find this report of interest. The US economy expanded and unemployment declined throughout the reporting period. The sharp drop in oil prices that began in mid-2014 continued to benefit consumers, but a strong US dollar crimped corporate profits. The US Federal Reserve signaled that it was increasingly likely to raise interest rates, based on generally positive economic data, but uncertainty remained about when it would act. Overseas, the story was much different. Low energy prices hurt the economies of some oil-producing nations, such as Brazil and Russia. During the reporting period, the European Central Bank | |
as well as central banks in China and Japan – among other countries – either instituted or maintained extraordinarily accommodative monetary policies in response to economic weakness. | ||

Investor uncertainty, such as we saw for much of the reporting period – and market volatility, such as we saw at the end of the reporting period – are unfortunate facts of life when it comes to investing. Some investors use these things as excuses to delay saving and investing for their long-term financial goals. That’s why Invesco encourages investors to work with a professional financial adviser who can stress the importance of starting to save and invest early and the importance of adhering to a disciplined investment plan – when times are good and when they’re uncertain. A financial adviser who knows your unique financial situation, investment goals and risk tolerance can be an invaluable partner as you seek to achieve your financial goals. He or she can offer a long-term perspective when markets are volatile and time-tested advice and guidance when your financial situation or investment goals change.
Timely information when and where you want it
Invesco’s efforts to help investors achieve their financial objectives include providing individual investors and financial professionals with timely information about the markets, the economy and investing – whenever and wherever they want it.
Our website, invesco.com/us, offers a wide range of market insights and investment perspectives. On the website, you’ll find detailed information about our funds, including prices, performance, holdings and portfolio manager commentaries. You can access information about your account by completing a simple, secure online registration. Click on the “Need to register” link in the “Account Access” box on our homepage to get started.
Invesco’s mobile apps for iPhone® and iPad® (both available free from the App StoreSM) allow you to obtain the same detailed information, monitor your account and create customizable watch lists. Also, they allow you to access investment insights from our investment leaders, market strategists, economists and retirement experts. You can sign up to be alerted when new commentary is added, and you can watch portfolio manager videos and have instant access to Invesco news and updates wherever you may be.
In addition to the resources accessible on our website and through our mobile app, you can obtain timely updates to help you stay informed about the markets, the economy and investing by connecting with Invesco on Twitter, LinkedIn or Facebook. You can access our blog at blog.invesco.us.com. Our goal is to provide you the information you want, when and where you want it.
Have questions?
For questions about your account, feel free to contact an Invesco client services representative at 800 959 4246. For Invesco-related questions or comments, please email me directly at phil@invesco.com.
All of us at Invesco look forward to serving your investment management needs for many years to come. Thank you for investing with us.
Sincerely,

Philip Taylor
Senior Managing Director, Invesco Ltd.
iPhone and iPad are trademarks of Apple Inc., registered in the US and other countries. App Store is a service mark of Apple Inc. Invesco Distributors, Inc. is not affiliated with Apple Inc.
2 Invesco Growth and Income Fund
Bruce Crockett | Dear Fellow Shareholders: Among the many important lessons I’ve learned in more than 40 years in a variety of business endeavors is the value of a trusted advocate. As independent chair of the Invesco Funds Board, I can assure you that the members of the Board are strong advocates for the interests of investors in Invesco’s mutual funds. We work hard to represent your interests through oversight of the quality of the investment management services your funds receive and other matters important to your investment, including but not limited to: n Ensuring that Invesco offers a diverse lineup of mutual funds that your financial adviser can use to strive to meet your financial needs as your investment goals change over time. n Monitoring how the portfolio management teams of the Invesco funds are performing in light of changing economic and market conditions. |

| n | Assessing each portfolio management team’s investment performance within the context of the investment strategy described in the fund’s prospectus. |
| n | Monitoring for potential conflicts of interests that may impact the nature of the services that your funds receive. |
We believe one of the most important services we provide our fund shareholders is the annual review of the funds’ advisory and sub-advisory contracts with Invesco Advisers and its affiliates. This review is required by the Investment Company Act of 1940 and focuses on the nature and quality of the services Invesco provides as the adviser to the Invesco funds and the reasonableness of the fees that it charges for those services. Each year, we spend months carefully reviewing information received from Invesco and a variety of independent sources, such as performance and fee data prepared by Lipper Inc., an independent, third-party firm widely recognized as a leader in its field. We also meet with our independent legal counsel and other independent advisers to review and help us assess the information that we have received. Our goal is to assure that you receive quality investment management services for a reasonable fee.
I trust the measures outlined above provide assurance that you have a worthy advocate when it comes to choosing the Invesco Funds.
As always, please contact me at bruce@brucecrockett.com with any questions or concerns you may have. On behalf of the Board, we look forward to continuing to represent your interests and serving your needs.
Sincerely,

Bruce L. Crockett
Independent Chair
Invesco Funds Board of Trustees
3 Invesco Growth and Income Fund
Management’s Discussion of Fund Performance
| Performance summary |
For the fiscal year ended August 31, 2015, Class A shares of Invesco Growth and Income Fund (the Fund), at net asset value, outperformed the Russell 1000 Value Index, the Fund’s style-specific benchmark.
Your Fund’s long-term performance appears later in this report.
Fund vs. Indexes
Total returns, 8/31/14 to 8/31/15, at net asset value (NAV). Performance shown does not include applicable contingent deferred sales charges (CDSC) or front-end sales charges, which would have reduced performance.
Class A Shares | -2.65 | % | ||
Class B Shares | -2.65 | |||
Class C Shares | -3.33 | |||
Class R Shares | -2.86 | |||
Class Y Shares | -2.39 | |||
Class R5 Shares | -2.29 | |||
Class R6 Shares | -2.19 | |||
S&P 500 Indexq (Broad Market Index) | 0.48 | |||
Russell 1000 Value Indexq (Style-Specific Index) | -3.48 | |||
Lipper Large-Cap Value Funds Indexn (Peer Group Index) | -3.77 |
Source(s): qFactSet Research Systems Inc.; nLipper Inc.
Market conditions and your Fund
The US economy improved slowly, but somewhat steadily, during the fiscal year ended August 31, 2015 – although the performance of the underlying sectors of the economy varied dramatically. The headline story was the massive slowdown in energy markets, as oil prices plummeted when too much supply overwhelmed slowing global demand. However the more subtle story, which drove the economy forward during the year, was the improved position of the US consumer.
As the reporting period began, economic growth appeared to be stronger in the US than in the rest of the world. In mid-2014, when the price of oil began its sharp and prolonged decline, US equities fell as well. However, while global growth weakened and commodity-based economies and currencies underperformed those of the US, continued strengthening of the US consumer led US equity
markets higher through the spring. Continued low interest rates, the increasing availability of credit from lenders and an improving employment picture all contributed to higher consumer confidence. This strength also helped the market overcome summer fears that Greece and the eurozone would fail to reach agreement on a financial bailout plan. In the final weeks of the fiscal year, however, US equity markets moved sharply lower. A significant downturn in China’s financial markets, weak global economic growth and the uncertain timing of a potential US interest rate increase were negatives for jittery US markets. While stocks were up slightly for the fiscal year, they ended the reporting period on a negative note.
Sector performance within the Russell 1000 Value Index was mixed for the reporting period, with the health care sector returning positive returns in the
teens, while other sectors, like the energy and materials sectors posting negative double-digit returns.
Stock selection in the financials sector was a large contributor to Fund performance versus its style-specific benchmark. Specifically within banks, two of the Fund’s largest holdings, JPMorgan Chase and Citigroup, were the sector’s top contributors. In 2015, JPMorgan Chase reported back-to-back quarterly earnings and revenues that outpaced analysts’ estimates. In April, the company reported a year-over-year increase in profits and rise in revenues from strong growth in its investment banking, asset management and mortgage lending divisions.
Strong stock selection within the information technology sector was also a large contributor to the Fund’s relative returns for the reporting period. Notably, Amdocs within software and services was a large driver of performance, posting returns over 20% for the reporting period. UK-based Amdocs’ stock price rallied when the company reported record revenues in July 2015, after expanding its product suite and renewing major service contracts.
We used currency forward contracts for the purpose of hedging currency exposure of non-US-based companies held in the portfolio. These derivatives were used solely for the purpose of hedging and not for speculative purposes or leverage. The use of currency forward contracts had a large positive impact on the Fund’s performance relative to its style-specific benchmark for the reporting period. This was mainly due to the strength of the US dollar compared to the foreign currencies in which the Fund’s non-US holdings were denominated.
On the negative side, stock selection within, and underweight exposure to, the consumer staples sector were large
| Portfolio Composition | |||||
By sector
|
| ||||
Financials | 31.6 | % | |||
Health Care | 14.3 | ||||
Information Technology | 14.3 | ||||
Energy | 9.8 | ||||
Consumer Discretionary | 8.8 | ||||
Industrials | 8.2 | ||||
Consumer Staples | 6.7 | ||||
Telecommunication Services | 2.7 | ||||
Utilities | 1.2 | ||||
Materials | 0.8 | ||||
Money Market Funds | |||||
Plus Other Assets Less Liabilities | 1.6 | ||||
Top 10 Equity Holdings* | |||||
1. Citigroup Inc. | 4.8 | % | |||
2. JPMorgan Chase & Co. | 4.7 | ||||
3. General Electric Co. | 3.0 | ||||
4. Bank of America Corp. | 2.7 | ||||
5. Morgan Stanley | 2.5 | ||||
6. Royal Dutch Shell | 2.1 | ||||
7. Carnival Corp. | 2.0 | ||||
8. Target Corp. | 1.9 | ||||
9. PNC Financial Services | 1.9 | ||||
10. Merck & Co., Inc. | 1.8 | ||||
Total Net Assets | $ | 8.3 billion | ||
Total Number of Holdings* | 85 | |||
The Fund’s holdings are subject to change, and there is no assurance that the Fund will continue to hold any particular security.
*Excluding money market fund holdings.
4 Invesco Growth and Income Fund
detractors from the Fund’s relative performance. Notably, Avon Products, a household and personal products company, was a large detractor, posting a double-digit loss for the reporting period. The stock performed poorly after the company settled bribery charges with the Justice Department toward the end of 2014. We sold Avon in the fourth quarter of 2014 due to deteriorating fundamentals and unclear guidance from management on the company’s long-term prospects.
Stock selection within the industrials sector also detracted from the Fund’s relative performance. Caterpillar within capital goods and Tyco International within commercial and professional services performed poorly for the reporting period, posting negative double-digit returns. Shares of Caterpillar suffered after the company missed revenue forecasts in July 2015 and cut full-year guidance. Soft materials pricing and a slowing Chinese economy, made worse by a strong US dollar, crimped profits in the multinational company, as less than half of its revenue is based in the US.
Weak stock selection within the materials sector also dampened relative Fund returns. Mining company Freeport-McMoRan’s stock price suffered, along with the majority of miners, as the prices of gold, silver, copper and other metals fell, beginning in late 2014. We sold our position in Freeport-McMoRan during the fiscal year.
Equity markets experienced continued volatility during the reporting period. Reasons for volatility included a sluggish Chinese economy and falling oil and commodity prices affecting the global economy. We believe that market volatility creates opportunities to invest in companies with attractive valuations and strong fundamentals. We believe that ultimately those valuations and fundamentals will be reflected in those companies’ stock prices.
Thank you for your investment in Invesco Growth and Income Fund and for sharing our long-term investment horizon.
The views and opinions expressed in management’s discussion of Fund performance are those of Invesco Advisers, Inc. These views and opinions are subject to change at any time based on factors such as market and economic conditions. These views and opinions may not be relied upon as investment advice or recommendations, or as an offer for a particular security. The information is not a complete analysis of every aspect of any market, country, industry, security or the Fund. Statements of fact are from sources considered reliable, but Invesco Advisers, Inc. makes no representation or warranty as to their completeness or accuracy. Although historical performance is no guarantee of future results, these insights may help you understand our investment management philosophy.
See important Fund and, if applicable, index disclosures later in this report.
| Thomas Bastian Chartered Financial Analyst, Portfolio Manager, is lead manager of Invesco Growth and Income Fund. He joined | |
| Invesco in 2010. Mr. Bastian earned a BA in accounting from St. John’s University and an MBA in finance from University of Michigan. | ||

| Mary Jayne Maly Chartered Financial Analyst, Portfolio Manager, is manager of Invesco Growth and Income Fund. She joined | |||
| Invesco in 2010. Ms. Maly earned a BA from the University of Pittsburgh and an MBA from the Thunderbird School of Global Management. | ||||

| Sergio Marcheli Portfolio Manager, is manager of Invesco Growth and Income Fund. He joined Invesco in 2010. Mr. Marcheli earned a | |
| BBA from the University of Houston and an MBA from the University of St. Thomas. | ||

| James Roeder Chartered Financial Analyst, Portfolio Manager, is manager of Invesco Growth and Income Fund. He joined | |
| Invesco in 2010. Mr. Roeder earned a BS in accounting from Clemson University and an MBA in economics and finance from the University of Chicago Booth School of Business. | ||

5 Invesco Growth and Income Fund
Your Fund’s Long-Term Performance
Results of a $10,000 Investment – Oldest Share Class(es)
Fund and index data from 8/31/05

| 1 | Source: FactSet Research Systems Inc. |
| 2 | Source: Lipper Inc. |
Past performance cannot guarantee comparable future results.
The data shown in the chart include reinvested distributions, applicable sales charges and Fund expenses including
management fees. Index results include reinvested dividends, but they do not reflect sales charges. Performance of the peer group, if applicable, reflects fund expenses and management fees;
performance of a market index does not. Performance shown in the chart and table(s) does not reflect deduction of taxes a shareholder would pay on Fund distributions or sale of Fund shares.
continued from page 8
| n | The Lipper Large-Cap Value Funds Index is an unmanaged index considered representative of large-cap value funds tracked by Lipper. |
| n | The Fund is not managed to track the performance of any particular index, including the index(es) described here, and consequently, the performance of the Fund may deviate significantly from the performance of the index(es). |
| n | A direct investment cannot be made in an index. Unless otherwise indicated, index results include reinvested dividends, and they do not reflect sales charges. Performance of the peer group, if applicable, reflects fund expenses; performance of a market index does not. |
Other information
| n | The returns shown in management’s discussion of Fund performance are based on net asset values (NAVs) calculated for shareholder transactions. Generally accepted accounting principles require adjustments to be made to the net assets of the Fund at period end for financial reporting purposes, and as such, the NAVs for shareholder trans- |
| actions and the returns based on those NAVs may differ from the NAVs and returns reported in the Financial Highlights. |
| n | Industry classifications used in this report are generally according to the Global Industry Classification Standard, which was developed by and is the exclusive property and a service mark of MSCI Inc. and Standard & Poor’s. |
6 Invesco Growth and Income Fund
| Average Annual Total Returns |
As of 8/31/15, including maximum applicable sales charges
Class A Shares | ||||
Inception (8/1/46) | 9.39 | % | ||
10 Years | 5.79 | |||
5 Years | 12.63 | |||
1 Year | -8.01 | |||
Class B Shares | ||||
Inception (8/2/93) | 9.37 | % | ||
10 Years | 6.35 | |||
5 Years | 13.67 | |||
1 Year | -6.98 | |||
Class C Shares | ||||
Inception (8/2/93) | 8.87 | % | ||
10 Years | 5.62 | |||
5 Years | 13.06 | |||
1 Year | -4.20 | |||
Class R Shares | ||||
Inception (10/1/02) | 8.65 | % | ||
10 Years | 6.13 | |||
5 Years | 13.61 | |||
1 Year | -2.86 | |||
Class Y Shares | ||||
Inception (10/19/04) | 7.77 | % | ||
10 Years | 6.66 | |||
5 Years | 14.17 | |||
1 Year | -2.39 | |||
Class R5 Shares | ||||
10 Years | 6.61 | % | ||
5 Years | 14.32 | |||
1 Year | -2.29 | |||
Class R6 Shares | ||||
10 Years | 6.53 | % | ||
5 Years | 14.19 | |||
1 Year | -2.19 | |||
Effective June 1, 2010, Class A, Class B, Class C, Class R and Class I shares of the predecessor fund, Van Kampen Growth and Income Fund, advised by Van Kampen Asset Management were reorganized into Class A, Class B, Class C, Class R and Class Y shares, respectively, of Invesco Van Kampen Growth and Income Fund (renamed Invesco Growth and Income Fund). Returns shown above for Class A, Class B, Class C, Class R and Class Y shares are blended returns of the predecessor fund and Invesco Growth and Income Fund. Share class returns will differ from the predecessor fund because of different expenses.
Class R5 shares incepted on June 1, 2010. Performance shown prior to that date is that of the predecessor fund’s Class A shares and includes the 12b-1
| Average Annual Total Returns |
As of 6/30/15, the most recent calendar quarter end, including maximum applicable sales charges
Class A Shares | ||||
Inception (8/1/46) | 9.50 | % | ||
10 Years | 6.81 | |||
5 Years | 14.33 | |||
1 Year | -0.58 | |||
Class B Shares | ||||
Inception (8/2/93) | 9.73 | % | ||
10 Years | 7.35 | |||
5 Years | 15.42 | |||
1 Year | 0.51 | |||
Class C Shares | ||||
Inception (8/2/93) | 9.22 | % | ||
10 Years | 6.63 | |||
5 Years | 14.79 | |||
1 Year | 3.51 | |||
Class R Shares | ||||
Inception (10/1/02) | 9.25 | % | ||
10 Years | 7.15 | |||
5 Years | 15.36 | |||
1 Year | 5.51 | |||
Class Y Shares | ||||
Inception (10/19/04) | 8.47 | % | ||
10 Years | 7.69 | |||
5 Years | 15.94 | |||
1 Year | 5.51 | |||
Class R5 Shares | ||||
10 Years | 7.62 | % | ||
5 Years | 16.08 | |||
1 Year | 5.58 | |||
Class R6 Shares | ||||
10 Years | 7.54 | % | ||
5 Years | 15.92 | |||
1 Year | 5.68 | |||
fees applicable to Class A shares.
Class R6 shares incepted on September 24, 2012. Performance shown prior to that date is that of the Fund’s and the predecessor fund’s Class A shares and includes the 12b-1 fees applicable to Class A shares.
The performance data quoted represent past performance and cannot guarantee comparable future results; current performance may be lower or higher. Please visit invesco.com/performance for the most recent month-end performance. Performance figures reflect reinvested distributions, changes in net asset value and the effect of the maximum sales charge unless otherwise stated. Investment return and principal value will fluctuate so that you may have a gain or loss when you sell shares.
The net annual Fund operating expense ratio set forth in the most recent Fund prospectus as of the date of this report for Class A, Class B, Class C, Class R, Class Y, Class R5 and Class R6 shares was 0.84%, 0.84%, 1.59%, 1.09%, 0.59%, 0.48% and 0.39%, respectively.1 The total annual Fund operating expense ratio set forth in the most recent Fund prospectus as of the date of this report for Class A, Class B, Class C, Class R, Class Y, Class R5 and Class R6 shares was 0.85%, 0.85%, 1.60%, 1.10%, 0.60%, 0.49% and 0.40%, respectively. The expense ratios presented above may vary from the expense ratios presented in other sections of this report that are based on expenses incurred during the period covered by this report.
Class A share performance reflects the maximum 5.50% sales charge, and Class B and Class C share performance reflects the applicable contingent deferred sales charge (CDSC) for the period involved. For shares purchased prior to June 1, 2010, the CDSC on Class B shares declines from 5% at the time of purchase to 0% at the beginning of the sixth year. For shares purchased on or after June 1, 2010, the CDSC on Class B shares declines from 5% at the time of purchase to 0% at the beginning of the seventh year. The CDSC on Class C shares is 1% for the first year after purchase. Class R, Class Y, Class R5 and Class R6 shares do not have a front-end sales charge or a CDSC; therefore, performance is at net asset value.
The performance of the Fund’s share classes will differ primarily due to different sales charge structures and class expenses.
Fund performance reflects any applicable fee waivers and/or expense reimbursements. Had the adviser not waived fees and/or reimbursed expenses currently or in the past, returns would have been lower. See current prospectus for more information.
| 1 | Total annual Fund operating expenses after any contractual fee waivers and/or expense reimbursements by the adviser in effect through at least June 30, 2017. |
7 Invesco Growth and Income Fund |
Invesco Growth and Income Fund’s investment objective is total return through growth of capital and current income.
| n | Unless otherwise stated, information presented in this report is as of August 31, 2015, and is based on total net assets. |
| n | Unless otherwise noted, all data provided by Invesco. |
| n | To access your Fund’s reports/prospectus, visit invesco.com/fundreports. |
About share classes
| n | Class B shares may not be purchased for new or additional investments. Please see the prospectus for more information. |
| n | Class R shares are generally available only to employer sponsored retirement and benefit plans. Please see the prospectus for more information. |
| n | Class Y shares are available only to certain investors. Please see the prospectus for more information. |
| n | Class R5 shares and Class R6 shares are primarily intended for employer sponsored retirement and benefit plans that meet certain standards and for institutional investors. Please see the prospectus for more information. |
Principal risks of investing in the Fund
| n | Convertible securities risk. The Fund may own convertible securities, the value of which may be affected by market interest rates, the risk that the issuer will default, the value of the underlying stock or the right of the issuer to buy back the convertible securities. |
| n | Depositary receipts risk. Depositary receipts involve many of the same risks as those associated with direct investment in foreign securities. In addition, the underlying issuers of certain depositary receipts, particularly unsponsored or unregistered depositary receipts, are under no obligation to distribute shareholder communications to the holders of such receipts or to pass through to them any voting rights with respect to the deposited securities. |
| n | Derivatives risk. The value of a derivative instrument depends largely on (and is derived from) the value of an underlying security, currency, commodity, interest rate, index or |
other asset (each referred to as an underlying asset). In addition to risks relating to the underlying assets, the use of derivatives may include other, possibly greater, risks, including counterparty, leverage and liquidity risks. Counterparty risk is the risk that the counterparty to the derivative contract will default on its obligation to pay the Fund the amount owed or otherwise perform under the derivative contract. Derivatives create leverage risk because they do not require payment up front equal to the economic exposure created by owning the derivative. As a result, an adverse change in the value of the underlying asset could result in the Fund sustaining a loss that is substantially greater than the amount invested in the derivative, which may make the Fund’s returns more volatile and increase the risk of loss. Derivative instruments may also be less liquid than more traditional investments and the Fund may be unable to sell or close out its derivative positions at a desirable time or price. This risk may be more acute under adverse market conditions, during which the Fund may be most in need of liquidating its derivative positions. Derivatives may also be harder to value, less tax efficient and subject to changing government regulation that could impact the Fund’s ability to use certain derivatives or their cost. Also, derivatives used for hedging or to gain or limit exposure to a particular market segment may not provide the expected benefits, particularly during adverse market conditions. |
| n | Foreign securities risk. The Fund’s foreign investments may be affected by changes in a foreign country’s exchange rates, political and social instability, changes in economic or taxation policies, difficulties when enforcing obligations, decreased liquidity, and increased volatility. Foreign companies may be subject to less regulation resulting in less publicly available information about the companies. |
| n | Management risk. The investment techniques and risk analysis used by the Fund’s portfolio managers may not produce the desired results. |
This report must be accompanied or preceded by a currently effective Fund prospectus, which contains more complete information, including sales charges and expenses. Investors should read it carefully before investing.
NOT FDIC INSURED | MAY LOSE VALUE | NO BANK GUARANTEE |
| n | Market risk. The prices of and the income generated by the Fund’s securities may decline in response to, among other things, investor sentiment, general economic and market conditions, regional or global instability, and currency and interest rate fluctuations. |
| n | Real estate investment trust (REIT) risk/real estate risk. Investments in real estate related instruments may be affected by economic, legal, cultural, environmental or technological factors that affect property values, rents or occupancies of real estate related to the Fund’s holdings. Shares of real estate related companies, which tend to be small- and mid-cap companies, may be more volatile and less liquid. |
| n | Small- and mid-capitalization risks. Stocks of small- and mid-sized companies tend to be more vulnerable to adverse developments and may have little or no operating history or track record of success, and limited product lines, markets, management and financial resources. The securities of small- and mid-sized companies may be more volatile due to less market interest and less publicly available information about the issuer. They also may be illiquid or restricted as to resale, or may trade less frequently and in smaller volumes, all of which may cause difficulty when establishing or closing a position at a desirable price. |
| n | Value investing style risk. The Fund emphasizes a value style of investing, which focuses on undervalued companies with characteristics for improved valuations. This style of investing is subject to the risk that the valuations never improve or that the returns on value equity securities are less than returns on other styles of investing or the overall stock market. Value stocks also may decline in price, even though in theory they are already underpriced. |
About indexes used in this report
| n | The S&P 500® Index is an unmanaged index considered representative of the US stock market. |
| n | The Russell 1000® Value Index is an unmanaged index considered representative of large-cap value stocks. The Russell 1000 Value Index is a trademark/service mark of the Frank Russell Co. Russell® is a trademark of the Frank Russell Co. |
continued on page 6
8 Invesco Growth and Income Fund
Schedule of Investments(a)
August 31, 2015
| Shares | Value | |||||||
Common Stocks & Other Equity Interests–98.37% |
| |||||||
| Aerospace & Defense–1.29% | ||||||||
General Dynamics Corp. | 753,431 | $ | 107,009,805 | |||||
| Agricultural Products–1.26% | ||||||||
Archer-Daniels-Midland Co. | 2,322,974 | 104,510,600 | ||||||
| Application Software–1.68% | ||||||||
Adobe Systems Inc.(b) | 896,045 | 70,402,256 | ||||||
Citrix Systems, Inc.(b) | 1,018,517 | 69,371,193 | ||||||
| 139,773,449 | ||||||||
| Asset Management & Custody Banks–2.60% | ||||||||
Northern Trust Corp. | 1,315,199 | 91,853,498 | ||||||
State Street Corp. | 1,722,215 | 123,861,703 | ||||||
| 215,715,201 | ||||||||
| Automobile Manufacturers–0.76% | ||||||||
General Motors Co. | 2,146,253 | 63,185,688 | ||||||
| Biotechnology–1.38% | ||||||||
Amgen Inc. | 488,378 | 74,126,013 | ||||||
Baxalta Inc.(b) | 1,144,433 | 40,226,820 | ||||||
| 114,352,833 | ||||||||
| Broadcasting–0.25% | ||||||||
CBS Corp.–Class B | 466,045 | 21,083,876 | ||||||
| Cable & Satellite–2.35% | ||||||||
Comcast Corp.–Class A | 2,015,085 | 113,509,738 | ||||||
Time Warner Cable Inc. | 439,961 | 81,841,545 | ||||||
| 195,351,283 | ||||||||
| Communications Equipment–2.59% | ||||||||
Cisco Systems, Inc. | 4,849,530 | 125,505,836 | ||||||
Juniper Networks, Inc. | 3,483,117 | 89,550,938 | ||||||
| 215,056,774 | ||||||||
| Construction Machinery & Heavy Trucks–0.78% | ||||||||
Caterpillar Inc. | 845,006 | 64,592,259 | ||||||
| Data Processing & Outsourced Services–1.06% | ||||||||
PayPal Holdings, Inc.(b) | 2,513,175 | 87,961,125 | ||||||
| Diversified Banks–13.13% | ||||||||
Bank of America Corp. | 13,557,569 | 221,530,678 | ||||||
Citigroup Inc. | 7,397,528 | 395,619,797 | ||||||
Comerica Inc. | 1,943,548 | 85,516,112 | ||||||
JPMorgan Chase & Co. | 6,031,102 | 386,593,638 | ||||||
| 1,089,260,225 | ||||||||
| Electric Utilities–0.52% | ||||||||
FirstEnergy Corp. | 1,339,346 | 42,805,498 | ||||||
| Electronic Components–0.82% | ||||||||
Corning Inc. | 3,974,601 | 68,402,883 | ||||||
| Fertilizers & Agricultural Chemicals–0.78% | ||||||||
Mosaic Co. (The) | 1,594,362 | 65,097,800 | ||||||
| Shares | Value | |||||||
| Food Distributors–0.10% | ||||||||
Sysco Corp. | 209,473 | $ | 8,351,689 | |||||
| General Merchandise Stores–1.92% | ||||||||
Target Corp. | 2,049,975 | 159,303,557 | ||||||
| Health Care Equipment–2.05% | ||||||||
Baxter International Inc. | 1,601,225 | 61,567,101 | ||||||
Medtronic PLC | 1,505,717 | 108,848,282 | ||||||
| 170,415,383 | ||||||||
| Health Care Services–0.81% | ||||||||
Express Scripts Holding Co.(b) | 807,034 | 67,468,042 | ||||||
| Hotels, Resorts & Cruise Lines–1.98% | ||||||||
Carnival Corp. | 3,338,561 | 164,357,358 | ||||||
| Household Products–1.19% | ||||||||
Procter & Gamble Co. (The) | 1,391,841 | 98,361,403 | ||||||
| Hypermarkets & Super Centers–1.55% | ||||||||
Wal-Mart Stores, Inc. | 1,982,909 | 128,353,700 | ||||||
| Industrial Conglomerates–2.97% | ||||||||
General Electric Co. | 9,909,719 | 245,959,226 | ||||||
| Industrial Machinery–1.02% | ||||||||
Ingersoll-Rand PLC | 1,535,778 | 84,913,166 | ||||||
| Insurance Brokers–3.00% | ||||||||
Aon PLC | 938,875 | 87,728,480 | ||||||
Marsh & McLennan Cos., Inc. | 1,662,756 | 89,339,880 | ||||||
Willis Group Holdings PLC | 1,668,869 | 71,911,565 | ||||||
| 248,979,925 | ||||||||
| Integrated Oil & Gas–5.31% | ||||||||
Exxon Mobil Corp. | 955,063 | 71,858,940 | ||||||
Occidental Petroleum Corp. | 1,292,358 | 94,355,058 | ||||||
Royal Dutch Shell PLC–Class A (United Kingdom) | 6,792,154 | 176,032,077 | ||||||
TOTAL S.A. (France) | 2,155,708 | 98,070,052 | ||||||
| 440,316,127 | ||||||||
| Integrated Telecommunication Services–1.71% | ||||||||
Koninklijke KPN N.V. (Netherlands) | 6,154,596 | 23,919,952 | ||||||
Orange S.A. (France) | 1,375,813 | 21,752,139 | ||||||
Telecom Italia S.p.A. (Italy)(b) | 12,853,328 | 15,619,805 | ||||||
Telefónica, S.A. (Spain) | 1,038,798 | 14,650,928 | ||||||
Verizon Communications Inc. | 1,436,005 | 66,070,590 | ||||||
| 142,013,414 | ||||||||
| Internet Software & Services–1.05% | ||||||||
eBay Inc.(b) | 3,198,007 | 86,697,970 | ||||||
| Investment Banking & Brokerage–4.80% | ||||||||
Charles Schwab Corp. (The) | 3,108,903 | 94,448,473 | ||||||
Goldman Sachs Group, Inc. (The) | 500,606 | 94,414,292 | ||||||
Morgan Stanley | 6,074,094 | 209,252,538 | ||||||
| 398,115,303 | ||||||||
See accompanying Notes to Financial Statements which are an integral part of the financial statements.
9 Invesco Growth and Income Fund
| Shares | Value | |||||||
| IT Consulting & Other Services–1.37% | ||||||||
Amdocs Ltd. | 1,982,138 | $ | 113,398,115 | |||||
| Managed Health Care–1.80% | ||||||||
Anthem, Inc. | 542,521 | 76,522,587 | ||||||
UnitedHealth Group Inc. | 625,878 | 72,414,085 | ||||||
| 148,936,672 | ||||||||
| Movies & Entertainment–0.69% | ||||||||
Time Warner Inc. | 407,572 | 28,978,369 | ||||||
Viacom Inc.–Class B | 683,154 | 27,852,189 | ||||||
| 56,830,558 | ||||||||
| Multi-Utilities–0.69% | ||||||||
PG&E Corp. | 1,159,995 | 57,512,552 | ||||||
| Oil & Gas Equipment & Services–1.30% | ||||||||
Baker Hughes Inc. | 1,801,733 | 100,897,048 | ||||||
Weatherford International PLC(b) | 645,300 | 6,549,795 | ||||||
| 107,446,843 | ||||||||
| Oil & Gas Exploration & Production–3.18% | ||||||||
Anadarko Petroleum Corp. | 806,973 | 57,763,127 | ||||||
Apache Corp. | 2,640,167 | 119,441,155 | ||||||
Canadian Natural Resources Ltd. (Canada) | 3,835,974 | 86,445,717 | ||||||
| 263,649,999 | ||||||||
| Other Diversified Financial Services–1.48% | ||||||||
Voya Financial, Inc. | 2,858,874 | 123,160,292 | ||||||
| Packaged Foods & Meats–1.30% | ||||||||
Mondelez International Inc.–Class A | 2,545,122 | 107,811,368 | ||||||
| Pharmaceuticals–8.20% | ||||||||
Eli Lilly and Co. | 1,262,445 | 103,962,346 | ||||||
Merck & Co., Inc. | 2,809,041 | 151,266,858 | ||||||
Novartis AG (Switzerland) | 1,362,927 | 133,183,676 | ||||||
Pfizer Inc. | 2,753,819 | 88,728,048 | ||||||
Sanofi (France) | 925,677 | 91,022,618 | ||||||
Teva Pharmaceutical Industries Ltd.–ADR (Israel) | 1,745,771 | 112,445,110 | ||||||
| 680,608,656 | ||||||||
| Publishing–0.81% | ||||||||
Thomson Reuters Corp. | 1,732,102 | 67,377,807 | ||||||
| Railroads–0.94% | ||||||||
CSX Corp. | 2,849,049 | 78,006,962 | ||||||
| Regional Banks–5.90% | ||||||||
BB&T Corp. | 1,942,219 | 71,706,726 | ||||||
| Shares | Value | |||||||
| Regional Banks–(continued) | ||||||||
Citizens Financial Group Inc. | 4,824,381 | $ | 119,741,136 | |||||
Fifth Third Bancorp | 4,414,523 | 87,937,298 | ||||||
First Horizon National Corp. | 3,791,097 | 55,084,639 | ||||||
PNC Financial Services Group, Inc. (The) | 1,702,232 | 155,107,380 | ||||||
| 489,577,179 | ||||||||
| Security & Alarm Services–1.23% | ||||||||
Tyco International PLC | 2,801,866 | 101,679,717 | ||||||
| Semiconductor Equipment–0.93% | ||||||||
Applied Materials, Inc. | 4,772,777 | 76,770,118 | ||||||
| Semiconductors–1.67% | ||||||||
Broadcom Corp.–Class A | 884,640 | 45,709,349 | ||||||
Intel Corp. | 3,244,523 | 92,598,686 | ||||||
| 138,308,035 | ||||||||
| Specialized Finance–0.71% | ||||||||
CME Group Inc.–Class A | 622,180 | 58,758,679 | ||||||
| Systems Software–2.34% | ||||||||
Microsoft Corp. | 2,105,495 | 91,631,142 | ||||||
Symantec Corp. | 4,982,259 | 102,086,487 | ||||||
| 193,717,629 | ||||||||
| Technology Hardware, Storage & Peripherals–0.81% | ||||||||
NetApp, Inc. | 2,109,191 | 67,409,744 | ||||||
| Tobacco–1.31% | ||||||||
Philip Morris International Inc. | 1,362,732 | 108,746,014 | ||||||
| Wireless Telecommunication Services–1.00% | ||||||||
Vodafone Group PLC–ADR (United Kingdom) | 2,403,215 | 82,862,853 | ||||||
Total Common Stocks & Other Equity Interests |
| 8,160,335,354 | ||||||
Money Market Funds–2.06% |
| |||||||
Liquid Assets Portfolio–Institutional Class, 0.12%(c) | 85,481,992 | 85,481,992 | ||||||
Premier Portfolio–Institutional Class, 0.09%(c) | 85,481,993 | 85,481,993 | ||||||
Total Money Market Funds |
| 170,963,985 | ||||||
TOTAL INVESTMENTS–100.43% |
| 8,331,299,339 | ||||||
OTHER ASSETS LESS LIABILITIES–(0.43)% |
| (35,274,681 | ) | |||||
NET ASSETS–100.00% |
| $ | 8,296,024,658 | |||||
Investment Abbreviations:
| ADR | – American Depositary Receipt |
Notes to Schedule of Investments:
| (a) | Industry and/or sector classifications used in this report are generally according to the Global Industry Classification Standard, which was developed by and is the exclusive property and a service mark of MSCI Inc. and Standard & Poor’s. |
| (b) | Non-income producing security. |
| (c) | The money market fund and the Fund are affiliated by having the same investment adviser. The rate shown is the 7-day SEC standardized yield as of August 31, 2015. |
See accompanying Notes to Financial Statements which are an integral part of the financial statements.
10 Invesco Growth and Income Fund
Statement of Assets and Liabilities
August 31, 2015
Assets: | ||||
Investments, at value (Cost $6,397,308,661) | $ | 8,160,335,354 | ||
Investments in affiliated money market funds, at value and cost | 170,963,985 | |||
Total investments, at value (Cost $6,568,272,646) | 8,331,299,339 | |||
Foreign currencies, at value (Cost $201,747) | 202,410 | |||
Receivable for: | ||||
Investments sold | 18,941,836 | |||
Fund shares sold | 8,693,343 | |||
Dividends | 18,929,375 | |||
Investment for trustee deferred compensation and retirement plans | 589,326 | |||
Unrealized appreciation on forward foreign currency contracts outstanding | 7,932,794 | |||
Other assets | 83,120 | |||
Total assets | 8,386,671,543 | |||
Liabilities: | ||||
Payable for: | ||||
Investments purchased | 13,936,120 | |||
Fund shares reacquired | 68,911,629 | |||
Accrued fees to affiliates | 5,244,516 | |||
Accrued trustees’ and officers’ fees and benefits | 18,710 | |||
Accrued other operating expenses | 311,678 | |||
Trustee deferred compensation and retirement plans | 695,957 | |||
Unrealized depreciation on forward foreign currency contracts outstanding | 1,528,275 | |||
Total liabilities | 90,646,885 | |||
Net assets applicable to shares outstanding | $ | 8,296,024,658 | ||
Net assets consist of: | ||||
Shares of beneficial interest | $ | 6,012,207,345 | ||
Undistributed net investment income | 51,413,847 | |||
Undistributed net realized gain | 463,046,156 | |||
Net unrealized appreciation | 1,769,357,310 | |||
| $ | 8,296,024,658 | |||
Net Assets: | ||||
Class A | $ | 4,450,596,112 | ||
Class B | $ | 50,939,277 | ||
Class C | $ | 309,525,618 | ||
Class R | $ | 139,083,667 | ||
Class Y | $ | 1,886,927,866 | ||
Class R5 | $ | 738,797,372 | ||
Class R6 | $ | 720,154,746 | ||
Shares outstanding, $0.01 par value per share, |
| |||
Class A | 174,949,092 | |||
Class B | 2,018,122 | |||
Class C | 12,299,844 | |||
Class R | 5,465,188 | |||
Class Y | 74,106,413 | |||
Class R5 | 28,985,437 | |||
Class R6 | 28,247,221 | |||
Class A: | ||||
Net asset value per share | $ | 25.44 | ||
Maximum offering price per share | ||||
(Net asset value of $25.44 ¸ 94.50%) | $ | 26.92 | ||
Class B: | ||||
Net asset value and offering price per share | $ | 25.24 | ||
Class C: | ||||
Net asset value and offering price per share | $ | 25.17 | ||
Class R: | ||||
Net asset value and offering price per share | $ | 25.45 | ||
Class Y: | ||||
Net asset value and offering price per share | $ | 25.46 | ||
Class R5: | ||||
Net asset value and offering price per share | $ | 25.49 | ||
Class R6: | ||||
Net asset value and offering price per share | $ | 25.49 | ||
See accompanying Notes to Financial Statements which are an integral part of the financial statements.
11 Invesco Growth and Income Fund
Statement of Operations
For the year ended August 31, 2015
Investment income: | ||||
Dividends (net of foreign withholding taxes of $5,761,892) | $ | 196,817,502 | ||
Dividends from affiliated money market funds | 154,960 | |||
Total investment income | 196,972,462 | |||
Expenses: | ||||
Advisory fees | 32,733,175 | |||
Administrative services fees | 757,356 | |||
Custodian fees | 398,161 | |||
Distribution fees: | ||||
Class A | 12,428,244 | |||
Class B | 169,192 | |||
Class C | 3,285,455 | |||
Class R | 817,525 | |||
Transfer agent fees — A, B, C, R and Y | 15,882,252 | |||
Transfer agent fees — R5 | 812,063 | |||
Transfer agent fees — R6 | 14,106 | |||
Trustees’ and officers’ fees and benefits | 156,299 | |||
Other | 1,116,438 | |||
Total expenses | 68,570,266 | |||
Less: Fees waived and expense offset arrangement(s) | (414,217 | ) | ||
Net expenses | 68,156,049 | |||
Net investment income | 128,816,413 | |||
Realized and unrealized gain (loss) from: | ||||
Net realized gain (loss) from: | ||||
Investment securities | 624,657,775 | |||
Foreign currencies | (546,699 | ) | ||
Forward foreign currency contracts | 87,832,004 | |||
| 711,943,080 | ||||
Change in net unrealized appreciation (depreciation) of: | ||||
Investment securities | (1,045,960,753 | ) | ||
Foreign currencies | (81,311 | ) | ||
Forward foreign currency contracts | 6,150,275 | |||
| (1,039,891,789 | ) | |||
Net realized and unrealized gain (loss) | (327,948,709 | ) | ||
Net increase (decrease) in net assets resulting from operations | $ | (199,132,296 | ) | |
See accompanying Notes to Financial Statements which are an integral part of the financial statements.
12 Invesco Growth and Income Fund
Statement of Changes in Net Assets
For the years ended August 31, 2015 and 2014
| 2015 | 2014 | |||||||||
Operations: | ||||||||||
Net investment income | $ | 128,816,413 | $ | 190,760,236 | ||||||
Net realized gain | 711,943,080 | 717,887,643 | ||||||||
Change in net unrealized appreciation (depreciation) | (1,039,891,789 | ) | 866,967,078 | |||||||
Net increase (decrease) in net assets resulting from operations | (199,132,296 | ) | 1,775,614,957 | |||||||
Distributions to shareholders from net investment income: | ||||||||||
Class A | (95,852,748 | ) | (61,612,058 | ) | ||||||
Class B | (1,361,186 | ) | (1,179,649 | ) | ||||||
Class C | (3,750,293 | ) | (1,447,199 | ) | ||||||
Class R | (2,785,361 | ) | (1,736,950 | ) | ||||||
Class Y | (46,673,590 | ) | (29,080,386 | ) | ||||||
Class R5 | (18,554,045 | ) | (12,570,413 | ) | ||||||
Class R6 | (16,315,170 | ) | (7,418,125 | ) | ||||||
Total distributions from net investment income | (185,292,393 | ) | (115,044,780 | ) | ||||||
Distributions to shareholders from net realized gains: | ||||||||||
Class A | (452,856,740 | ) | (117,716,418 | ) | ||||||
Class B | (6,596,296 | ) | (2,338,436 | ) | ||||||
Class C | (29,434,651 | ) | (7,258,149 | ) | ||||||
Class R | (15,312,972 | ) | (4,191,643 | ) | ||||||
Class Y | (194,870,035 | ) | (45,186,746 | ) | ||||||
Class R5 | (71,525,594 | ) | (18,438,457 | ) | ||||||
Class R6 | (60,590,022 | ) | (8,430,934 | ) | ||||||
Total distributions from net realized gains | (831,186,310 | ) | (203,560,783 | ) | ||||||
Share transactions–net: | ||||||||||
Class A | (190,458,025 | ) | (288,693,649 | ) | ||||||
Class B | (22,934,232 | ) | (34,204,390 | ) | ||||||
Class C | 18,566,173 | (5,617,121 | ) | |||||||
Class R | (20,329,574 | ) | (18,402,121 | ) | ||||||
Class Y | (21,583,356 | ) | 34,843,158 | |||||||
Class R5 | (30,967,417 | ) | 29,578,569 | |||||||
Class R6 | 163,697,019 | 231,388,328 | ||||||||
Net increase (decrease) in net assets resulting from share transactions | (104,009,412 | ) | (51,107,226 | ) | ||||||
Net increase (decrease) in net assets | (1,319,620,411 | ) | 1,405,902,168 | |||||||
Net assets: | ||||||||||
Beginning of year | 9,615,645,069 | 8,209,742,901 | ||||||||
End of year (includes undistributed net investment income of $51,413,847 and $108,981,756, respectively) | $ | 8,296,024,658 | $ | 9,615,645,069 | ||||||
Notes to Financial Statements
August 31, 2015
NOTE 1—Significant Accounting Policies
Invesco Growth and Income Fund (the “Fund”) is a series portfolio of AIM Counselor Series Trust (Invesco Counselor Series Trust) (the “Trust”). The Trust is a Delaware statutory trust registered under the Investment Company Act of 1940, as amended (the “1940 Act”), as an open-end series management investment company consisting of thirteen separate portfolios, each authorized to issue an unlimited number of shares of beneficial interest. The assets, liabilities and operations of each portfolio are accounted for separately. Information presented in these financial statements pertains only to the Fund. Matters affecting each portfolio or class will be voted on exclusively by the shareholders of such portfolio or class.
The Fund’s investment objective is total return through growth of capital and current income.
The Fund currently consists of seven different classes of shares: Class A, Class B, Class C, Class R, Class Y, Class R5 and Class R6. Class A shares are sold with a front-end sales charge unless certain waiver criteria are met and under certain circumstances load waived shares may be subject to
13 Invesco Growth and Income Fund
contingent deferred sales charges (“CDSC”). Class C shares are sold with a CDSC. Class R, Class Y, Class R5 and Class R6 shares are sold at net asset value. Effective November 30, 2010, new or additional investments in Class B shares are no longer permitted. Existing shareholders of Class B shares may continue to reinvest dividends and capital gains distributions in Class B shares until they convert to Class A shares. Also, shareholders in Class B shares will be able to exchange those shares for Class B shares of other Invesco Funds offering such shares until they convert to Class A shares. Generally, Class B shares will automatically convert to Class A shares on or about the month-end, which is at least eight years after the date of purchase. Redemption of Class B shares prior to the conversion date will be subject to a CDSC.
The following is a summary of the significant accounting policies followed by the Fund in the preparation of its financial statements.
| A. | Security Valuations — Securities, including restricted securities, are valued according to the following policy. |
A security listed or traded on an exchange (except convertible securities) is valued at its last sales price or official closing price as of the close of the customary trading session on the exchange where the security is principally traded, or lacking any sales or official closing price on a particular day, the security may be valued at the closing bid price on that day. Securities traded in the over-the-counter market are valued based on prices furnished by independent pricing services or market makers. When such securities are valued by an independent pricing service they may be considered fair valued. Futures contracts are valued at the final settlement price set by an exchange on which they are principally traded. Listed options are valued at the mean between the last bid and asked prices from the exchange on which they are principally traded. Options not listed on an exchange are valued by an independent source at the mean between the last bid and asked prices. For purposes of determining net asset value (“NAV”) per share, futures and option contracts generally are valued 15 minutes after the close of the customary trading session of the New York Stock Exchange (“NYSE”).
Investments in open-end and closed-end registered investment companies that do not trade on an exchange are valued at the end-of-day net asset value per share. Investments in open-end and closed-end registered investment companies that trade on an exchange are valued at the last sales price or official closing price as of the close of the customary trading session on the exchange where the security is principally traded.
Debt obligations (including convertible securities) and unlisted equities are fair valued using an evaluated quote provided by an independent pricing service. Evaluated quotes provided by the pricing service may be determined without exclusive reliance on quoted prices, and may reflect appropriate factors such as institution-size trading in similar groups of securities, developments related to specific securities, dividend rate (for unlisted equities), yield (for debt obligations), quality, type of issue, coupon rate (for debt obligations), maturity (for debt obligations), individual trading characteristics and other market data. Debt obligations are subject to interest rate and credit risks. In addition, all debt obligations involve some risk of default with respect to interest and/or principal payments.
Foreign securities’ (including foreign exchange contracts) prices are converted into U.S. dollar amounts using the applicable exchange rates as of the close of the NYSE. If market quotations are available and reliable for foreign exchange-traded equity securities, the securities will be valued at the market quotations. Because trading hours for certain foreign securities end before the close of the NYSE, closing market quotations may become unreliable. If between the time trading ends on a particular security and the close of the customary trading session on the NYSE, events occur that the Adviser determines are significant and make the closing price unreliable, the Fund may fair value the security. If the event is likely to have affected the closing price of the security, the security will be valued at fair value in good faith using procedures approved by the Board of Trustees. Adjustments to closing prices to reflect fair value may also be based on a screening process of an independent pricing service to indicate the degree of certainty, based on historical data, that the closing price in the principal market where a foreign security trades is not the current value as of the close of the NYSE. Foreign securities’ prices meeting the approved degree of certainty that the price is not reflective of current value will be priced at the indication of fair value from the independent pricing service. Multiple factors may be considered by the independent pricing service in determining adjustments to reflect fair value and may include information relating to sector indices, American Depositary Receipts and domestic and foreign index futures. Foreign securities may have additional risks including exchange rate changes, potential for sharply devalued currencies and high inflation, political and economic upheaval, the relative lack of issuer information, relatively low market liquidity and the potential lack of strict financial and accounting controls and standards.
Securities for which market prices are not provided by any of the above methods may be valued based upon quotes furnished by independent sources. The last bid price may be used to value equity securities. The mean between the last bid and asked prices is used to value debt obligations, including corporate loans.
Securities for which market quotations are not readily available or became unreliable are valued at fair value as determined in good faith by or under the supervision of the Trust’s officers following procedures approved by the Board of Trustees. Issuer specific events, market trends, bid/asked quotes of brokers and information providers and other market data may be reviewed in the course of making a good faith determination of a security’s fair value.
The Fund may invest in securities that are subject to interest rate risk, meaning the risk that the prices will generally fall as interest rates rise and, conversely, the prices will generally rise as interest rates fall. Specific securities differ in their sensitivity to changes in interest rates depending on their individual characteristics. Changes in interest rates may result in increased market volatility, which may affect the value and/or liquidity of certain Fund investments.
Valuations change in response to many factors including the historical and prospective earnings of the issuer, the value of the issuer’s assets, general economic conditions, interest rates, investor perceptions and market liquidity. Because of the inherent uncertainties of valuation, the values reflected in the financial statements may materially differ from the value received upon actual sale of those investments.
| B. | Securities Transactions and Investment Income — Securities transactions are accounted for on a trade date basis. Realized gains or losses on sales are computed on the basis of specific identification of the securities sold. Interest income (net of withholding tax, if any) is recorded on the accrual basis from settlement date. Dividend income (net of withholding tax, if any) is recorded on the ex-dividend date. |
The Fund may periodically participate in litigation related to Fund investments. As such, the Fund may receive proceeds from litigation settlements. Any proceeds received are included in the Statement of Operations as realized gain (loss) for investments no longer held and as unrealized gain (loss) for investments still held.
Brokerage commissions and mark ups are considered transaction costs and are recorded as an increase to the cost basis of securities purchased and/or a reduction of proceeds on a sale of securities. Such transaction costs are included in the determination of net realized and unrealized gain (loss) from investment securities reported in the Statement of Operations and the Statement of Changes in Net Assets and the net realized and unrealized gains (losses) on securities per share in the Financial Highlights. Transaction costs are included in the calculation of the
14 Invesco Growth and Income Fund
Fund’s net asset value and, accordingly, they reduce the Fund’s total returns. These transaction costs are not considered operating expenses and are not reflected in net investment income reported in the Statement of Operations and the Statement of Changes in Net Assets, or the net investment income per share and the ratios of expenses and net investment income reported in the Financial Highlights, nor are they limited by any expense limitation arrangements between the Fund and the investment adviser.
The Fund allocates income and realized and unrealized capital gains and losses to a class based on the relative net assets of each class.
| C. | Country Determination — For the purposes of making investment selection decisions and presentation in the Schedule of Investments, the investment adviser may determine the country in which an issuer is located and/or credit risk exposure based on various factors. These factors include the laws of the country under which the issuer is organized, where the issuer maintains a principal office, the country in which the issuer derives 50% or more of its total revenues and the country that has the primary market for the issuer’s securities, as well as other criteria. Among the other criteria that may be evaluated for making this determination are the country in which the issuer maintains 50% or more of its assets, the type of security, financial guarantees and enhancements, the nature of the collateral and the sponsor organization. Country of issuer and/or credit risk exposure has been determined to be the United States of America, unless otherwise noted. |
| D. | Distributions — Distributions from net investment income, if any, are declared and paid quarterly and are recorded on the ex-dividend date. Distributions from net realized capital gain, if any, are generally declared and paid annually and recorded on the ex-dividend date. The Fund may elect to treat a portion of the proceeds from redemptions as distributions for federal income tax purposes. |
| E. | Federal Income Taxes — The Fund intends to comply with the requirements of Subchapter M of the Internal Revenue Code of 1986, as amended (the “Internal Revenue Code”), necessary to qualify as a regulated investment company and to distribute substantially all of the Fund’s taxable earnings to shareholders. As such, the Fund will not be subject to federal income taxes on otherwise taxable income (including net realized capital gain) that is distributed to shareholders. Therefore, no provision for federal income taxes is recorded in the financial statements. |
The Fund recognizes the tax benefits of uncertain tax positions only when the position is more likely than not to be sustained. Management has analyzed the Fund’s uncertain tax positions and concluded that no liability for unrecognized tax benefits should be recorded related to uncertain tax positions. Management is not aware of any tax positions for which it is reasonably possible that the total amounts of unrecognized tax benefits will change materially in the next 12 months.
The Fund files tax returns in the U.S. Federal jurisdiction and certain other jurisdictions. Generally, the Fund is subject to examinations by such taxing authorities for up to three years after the filing of the return for the tax period.
| F. | Expenses — Fees provided for under the Rule 12b-1 plan of a particular class of the Fund are charged to the operations of such class. Transfer agency fees and expenses and other shareholder recordkeeping fees and expenses attributable to Class R5 and Class R6 are allocated to each share class based on relative net assets. Sub-accounting fees attributable to Class R5 are charged to the operations of the class. Transfer agency fees and expenses and other shareholder recordkeeping fees and expenses relating to all other classes are allocated among those classes based on relative net assets. All other expenses are allocated among the classes based on relative net assets. |
| G. | Accounting Estimates — The preparation of financial statements in conformity with accounting principles generally accepted in the United States of America (“GAAP”) requires management to make estimates and assumptions that affect the reported amounts of assets and liabilities at the date of the financial statements and the reported amounts of revenues and expenses during the reporting period including estimates and assumptions related to taxation. Actual results could differ from those estimates by a significant amount. In addition, the Fund monitors for material events or transactions that may occur or become known after the period-end date and before the date the financial statements are released to print. |
| H. | Indemnifications — Under the Trust’s organizational documents, each Trustee, officer, employee or other agent of the Trust is indemnified against certain liabilities that may arise out of the performance of their duties to the Fund. Additionally, in the normal course of business, the Fund enters into contracts, including the Fund’s servicing agreements, that contain a variety of indemnification clauses. The Fund’s maximum exposure under these arrangements is unknown as this would involve future claims that may be made against the Fund that have not yet occurred. The risk of material loss as a result of such indemnification claims is considered remote. |
| I. | Foreign Currency Translations — Foreign currency is valued at the close of the NYSE based on quotations posted by banks and major currency dealers. Portfolio securities and other assets and liabilities denominated in foreign currencies are translated into U.S. dollar amounts at date of valuation. Purchases and sales of portfolio securities (net of foreign taxes withheld on disposition) and income items denominated in foreign currencies are translated into U.S. dollar amounts on the respective dates of such transactions. The Fund does not separately account for the portion of the results of operations resulting from changes in foreign exchange rates on investments and the fluctuations arising from changes in market prices of securities held. The combined results of changes in foreign exchange rates and the fluctuation of market prices on investments (net of estimated foreign tax withholding) are included with the net realized and unrealized gain or loss from investments in the Statement of Operations. Reported net realized foreign currency gains or losses arise from (1) sales of foreign currencies, (2) currency gains or losses realized between the trade and settlement dates on securities transactions, and (3) the difference between the amounts of dividends, interest, and foreign withholding taxes recorded on the Fund’s books and the U.S. dollar equivalent of the amounts actually received or paid. Net unrealized foreign currency gains and losses arise from changes in the fair values of assets and liabilities, other than investments in securities at fiscal period end, resulting from changes in exchange rates. |
The Fund may invest in foreign securities, which may be subject to foreign taxes on income, gains on investments or currency repatriation, a portion of which may be recoverable. Foreign taxes, if any, are recorded based on the tax regulations and rates that exist in the foreign markets in which the Fund invests and are shown in the Statement of Operations.
| J. | Forward Foreign Currency Contracts — The Fund may engage in foreign currency transactions either on a spot (i.e. for prompt delivery and settlement) basis, or through forward foreign currency contracts, to manage or minimize currency or exchange rate risk. |
The Fund may also enter into forward foreign currency contracts for the purchase or sale of a security denominated in a foreign currency in order to “lock in” the U.S. dollar price of that security, or the Fund may also enter into forward foreign currency contracts that do not provide for physical settlement of the two currencies, but instead are settled by a single cash payment calculated as the difference between the agreed upon exchange rate and the spot rate at settlement based upon an agreed upon notional amount (non-deliverable forwards). The Fund will set aside liquid assets in an amount equal to daily mark-to-market obligation for forward foreign currency contracts.
15 Invesco Growth and Income Fund
A forward foreign currency contract is an obligation between two parties (“Counterparties”) to purchase or sell a specific currency for an agreed-upon price at a future date. The use of forward foreign currency contracts does not eliminate fluctuations in the price of the underlying securities the Fund owns or intends to acquire but establishes a rate of exchange in advance. Fluctuations in the value of these contracts are measured by the difference in the contract date and reporting date exchange rates and are recorded as unrealized appreciation (depreciation) until the contracts are closed. When the contracts are closed, realized gains (losses) are recorded. Realized and unrealized gains (losses) on the contracts are included in the Statement of Operations. The primary risks associated with forward foreign currency contracts include failure of the Counterparty to meet the terms of the contract and the value of the foreign currency changing unfavorably. These risks may be in excess of the amounts reflected in the Statement of Assets and Liabilities.
| K. | Put Options Purchased — The Fund may purchase put options including options on securities indexes, or foreign currency and/or futures contracts. By purchasing a put option, the Fund obtains the right (but not the obligation) to sell the option’s underlying instrument at a fixed strike price. In return for this right, the Fund pays an option premium. The option’s underlying instrument may be a security, securities index, or a futures contract. Put options may be used by the Fund to hedge securities it owns by locking in a minimum price at which the Fund can sell. If security prices fall, the put option could be exercised to offset all or a portion of the Fund’s resulting losses. At the same time, because the maximum the Fund has at risk is the cost of the option, purchasing put options does not eliminate the potential for the Fund to profit from an increase in the value of the securities hedged. Realized and unrealized gains and losses on these contracts are included in the Statement of Operations as Net realized gain from Investment Securities. A risk in buying an option is that the Fund pays a premium whether or not the option is exercised. In addition, there can be no assurance that a liquid secondary market will exist for any option purchased. |
NOTE 2—Advisory Fees and Other Fees Paid to Affiliates
The Trust has entered into a master investment advisory agreement with Invesco Advisers, Inc. (the “Adviser” or “Invesco”). Under the terms of the investment advisory agreement, the Fund pays an advisory fee to the Adviser based on the annual rate of the Fund’s average daily net assets as follows:
| Average Daily Net Assets | Rate | |||
First $150 million | 0.50% | |||
Next $100 million | 0.45% | |||
Next $100 million | 0.40% | |||
Over $350 million | 0.35% | |||
For the year ended August 31, 2015, the effective advisory fees incurred by the Fund was 0.35%.
Under the terms of a master sub-advisory agreement between the Adviser and each of Invesco Asset Management Deutschland GmbH, Invesco Asset Management Limited, Invesco Asset Management (Japan) Limited, Invesco Hong Kong Limited, Invesco Senior Secured Management, Inc. and Invesco Canada Ltd. (collectively, the “Affiliated Sub-Advisers”) the Adviser, not the Fund, may pay 40% of the fees paid to the Adviser to any such Affiliated Sub-Adviser(s) that provide(s) discretionary investment management services to the Fund based on the percentage of assets allocated to such Affiliated Sub-Adviser(s).
The Adviser has contractually agreed, through at least June 30, 2016, to waive advisory fees and/or reimburse expenses to the extent necessary to limit total annual fund operating expenses after fee waiver and/or expense reimbursement (excluding certain items discussed below) of Class A, Class B, Class C, Class R, Class Y, Class R5 and Class R6 shares to 2.00%, 2.75%, 2.75%, 2.25%, 1.75%, 1.75% and 1.75% of average daily net assets, respectively. In determining the Adviser’s obligation to waive advisory fees and/or reimburse expenses, the following expenses are not taken into account, and could cause total annual fund operating expenses after fee waiver and/or expense reimbursement to exceed the numbers reflected above: (1) interest; (2) taxes; (3) dividend expense on short sales; (4) extraordinary or non-routine items, including litigation expenses; and (5) expenses that the Fund has incurred but did not actually pay because of an expense offset arrangement. Unless Invesco continues the fee waiver agreement, it will terminate on June 30, 2016. The fee waiver agreement cannot be terminated during its term. The Adviser did not waive fees and/or reimburse expenses during the period under this expense limitation.
Further, the Adviser has contractually agreed, through at least June 30, 2017, to waive the advisory fee payable by the Fund in an amount equal to 100% of the net advisory fees the Adviser receives from the affiliated money market funds on investments by the Fund of uninvested cash in such affiliated money market funds.
For the year ended August 31, 2015, the Adviser waived advisory fees of $407,931.
The Trust has entered into a master administrative services agreement with Invesco pursuant to which the Fund has agreed to pay Invesco for certain administrative costs incurred in providing accounting services to the Fund. For the year ended August 31, 2015, expenses incurred under the agreement are shown in the Statement of Operations as Administrative services fees.
The Trust has entered into a transfer agency and service agreement with Invesco Investment Services, Inc. (“IIS”) pursuant to which the Fund has agreed to pay IIS a fee for providing transfer agency and shareholder services to the Fund and reimburse IIS for certain expenses incurred by IIS in the course of providing such services. IIS may make payments to intermediaries that provide omnibus account services, sub-accounting services and/or networking services. All fees payable by IIS to intermediaries that provide omnibus account services or sub-accounting are charged back to the Fund, subject to certain limitations approved by the Trust’s Board of Trustees. For the year ended August 31, 2015, expenses incurred under the agreement are shown in the Statement of Operations as Transfer agent fees.
Shares of the Fund are distributed by Invesco Distributors, Inc. (“IDI”). The Fund has adopted a distribution plan pursuant to Rule 12b-1 under the 1940 Act, and a service plan (collectively, the “Plans”) for Class A, Class B, Class C and Class R shares to compensate IDI for the sale, distribution, shareholder servicing and maintenance of shareholder accounts for these shares. Under the Plans, the Fund will incur annual fees of up to 0.25% of Class A average daily net assets, up to 1.00% each of Class B and Class C average daily net assets and up to 0.50% of Class R average daily net assets.
With respect to Class B and Class C shares, the Fund is authorized to reimburse in future years any distribution related expenses that exceed the maximum annual reimbursement rate for such class, so long as such reimbursement does not cause the Fund to exceed the Class B and Class C
16 Invesco Growth and Income Fund
maximum annual reimbursement rate, respectively. With respect to Class A shares, distribution related expenses that exceed the maximum annual reimbursement rate for such class are not carried forward to future years and the Fund will not reimburse IDI for any such expenses.
For the year ended August 31, 2015, expenses incurred under these agreements are shown in the Statement of Operations as Distribution fees.
Front-end sales commissions and CDSC (collectively, the “sales charges”) are not recorded as expenses of the Fund. Front-end sales commissions are deducted from proceeds from the sales of Fund shares prior to investment in Class A shares of the Fund. CDSC are deducted from redemption proceeds prior to remittance to the shareholder. During the year ended August 31, 2015, IDI advised the Fund that IDI retained $577,696 in front-end sales commissions from the sale of Class A shares and $4,084, $12,374 and $5,356 from Class A, Class B and Class C shares, respectively, for CDSC imposed on redemptions by shareholders.
For the year ended August 31, 2015, the Fund incurred $61,544 in brokerage commissions with Invesco Capital Markets, Inc., an affiliate of the Adviser and IDI, for portfolio transactions executed on behalf of the Fund.
Certain officers and trustees of the Trust are officers and directors of the Adviser, IIS and/or IDI.
NOTE 3—Additional Valuation Information
GAAP defines fair value as the price that would be received to sell an asset or paid to transfer a liability in an orderly transaction between market participants at the measurement date, under current market conditions. GAAP establishes a hierarchy that prioritizes the inputs to valuation methods, giving the highest priority to readily available unadjusted quoted prices in an active market for identical assets (Level 1) and the lowest priority to significant unobservable inputs (Level 3), generally when market prices are not readily available or are unreliable. Based on the valuation inputs, the securities or other investments are tiered into one of three levels. Changes in valuation methods may result in transfers in or out of an investment’s assigned level:
| Level 1 — | Prices are determined using quoted prices in an active market for identical assets. |
| Level 2 — | Prices are determined using other significant observable inputs. Observable inputs are inputs that other market participants may use in pricing a security. These may include quoted prices for similar securities, interest rates, prepayment speeds, credit risk, yield curves, loss severities, default rates, discount rates, volatilities and others. |
| Level 3 — | Prices are determined using significant unobservable inputs. In situations where quoted prices or observable inputs are unavailable (for example, when there is little or no market activity for an investment at the end of the period), unobservable inputs may be used. Unobservable inputs reflect the Fund’s own assumptions about the factors market participants would use in determining fair value of the securities or instruments and would be based on the best available information. |
The following is a summary of the tiered valuation input levels, as of August 31, 2015. The level assigned to the securities valuations may not be an indication of the risk or liquidity associated with investing in those securities. Because of the inherent uncertainties of valuation, the values reflected in the financial statements may materially differ from the value received upon actual sale of those investments.
During the year ended August 31, 2015, there were transfers from Level 1 to Level 2 of $305,625,575 and from Level 2 to Level 1 of $37,371,944, due to foreign fair value adjustments.
| Level 1 | Level 2 | Level 3 | Total | |||||||||||||
Equity Securities | $ | 7,794,420,036 | $ | 536,879,303 | $ | — | $ | 8,331,299,339 | ||||||||
Forward Foreign Currency Contracts* | — | 6,404,519 | — | 6,404,519 | ||||||||||||
Total Investments | $ | 7,794,420,036 | $ | 543,283,822 | $ | — | $ | 8,337,703,858 | ||||||||
| * | Unrealized appreciation. |
NOTE 4—Derivative Investments
Value of Derivative Investments at Period-End
The table below summarizes the value of the Fund’s derivative investments, detailed by primary risk exposure, held as of August 31, 2015:
| Value | ||||||||
| Risk Exposure/Derivative Type | Assets | Liabilities | ||||||
Currency risk: | ||||||||
Forward foreign currency contracts(a) | $ | 7,932,794 | $ | (1,528,275 | ) | |||
| (a) | Values are disclosed on the Statement of Assets and Liabilities under the captions Unrealized appreciation on forward foreign currency contracts outstanding and Unrealized depreciation on forward foreign currency contracts outstanding. |
17 Invesco Growth and Income Fund
Effect of Derivative Investments for the year ended August 31, 2015
The table below summarizes the gains (losses) on derivative investments, detailed by primary risk exposure, recognized in earnings during the period:
| Location of Gain (Loss) on Statement of Operations | ||||||||
| Forward Foreign Currency Contracts | Options Purchased(a) | |||||||
Realized Gain (Loss): | ||||||||
Currency Risk | $ | 87,832,004 | $ | — | ||||
Equity Risk | — | (540,606 | ) | |||||
Change in Net Unrealized Appreciation: | ||||||||
Currency Risk | $ | 6,150,275 | $ | — | ||||
Equity Risk | — | 426,922 | ||||||
Total | $ | 93,982,279 | $ | (113,684 | ) | |||
| (a) | Options purchased are included in the net realized gain (loss) from investment securities and the change in net unrealized appreciation (depreciation) of investment securities. |
The table below summarizes the twelve month average notional value of forward foreign currency contracts and the four month average notional value of options purchased outstanding during the period.
| Forward Foreign Currency Contracts | Options Purchased | |||||||
Average notional value | $ | 805,882,098 | $ | 17,768,525 | ||||
| Open Forward Foreign Currency Contracts | ||||||||||||||||||||||||||
Settlement | Counterparty | Contract to | Notional Value | Unrealized Appreciation (Depreciation) | ||||||||||||||||||||||
| Deliver | Receive | |||||||||||||||||||||||||
10/02/15 | Bank of New York Mellon (The) | CAD | 69,448,249 | USD | 52,151,833 | $ | 52,781,985 | $ | (630,152 | ) | ||||||||||||||||
10/02/15 | State Street Bank & Trust Co. | CAD | 69,448,481 | USD | 52,144,097 | 52,782,161 | (638,064 | ) | ||||||||||||||||||
10/02/15 | Bank of New York Mellon (The) | CHF | 51,206,160 | USD | 54,131,994 | 53,009,116 | 1,122,878 | |||||||||||||||||||
10/02/15 | State Street Bank & Trust Co. | CHF | 51,206,414 | USD | 54,154,590 | 53,009,380 | 1,145,210 | |||||||||||||||||||
10/02/15 | Bank of New York Mellon (The) | EUR | 86,874,868 | USD | 99,085,565 | 97,523,509 | 1,562,056 | |||||||||||||||||||
10/02/15 | State Street Bank & Trust Co. | EUR | 86,875,374 | USD | 99,025,764 | 97,524,077 | 1,501,687 | |||||||||||||||||||
10/02/15 | Bank of New York Mellon (The) | GBP | 60,519,479 | USD | 94,135,931 | 92,847,613 | 1,288,318 | |||||||||||||||||||
10/02/15 | State Street Bank & Trust Co. | GBP | 60,519,339 | USD | 94,160,043 | 92,847,398 | 1,312,645 | |||||||||||||||||||
10/02/15 | Bank of New York Mellon (The) | ILK | 163,013,607 | USD | 41,447,123 | 41,564,251 | (117,128 | ) | ||||||||||||||||||
10/02/15 | State Street Bank & Trust Co. | ILK | 163,013,685 | USD | 41,421,340 | 41,564,271 | (142,931 | ) | ||||||||||||||||||
Total Open Forward Foreign Currency Contracts — Currency Risk | $ | 6,404,519 | ||||||||||||||||||||||||
Currency Abbreviations:
| CAD | – Canadian Dollar | |
| CHF | – Swiss Franc | |
| EUR | – Euro |
| GBP | – British Pound Sterling | |
| ILK | – Israeli Shekel | |
| USD | – U.S. Dollar |
Offsetting Assets and Liabilities
Accounting Standards Update (“ASU”) No. 2011-11, Disclosures about Offsetting Assets and Liabilities, which was subsequently clarified in Financial Accounting Standards Board ASU 2013-01 “Clarifying the Scope of Disclosures about Offsetting Assets and Liabilities” is intended to enhance disclosures about financial instruments and derivative instruments that are subject to offsetting arrangements on the Statement of Assets and Liabilities and to enable investors to better understand the effect of those arrangements on the Fund’s financial position. In order for an arrangement to be eligible for netting, the Fund must have a basis to conclude that such netting arrangements are legally enforceable. The Fund enters into netting agreements and collateral agreements in an attempt to reduce the Fund’s Counterparty credit risk by providing for a single net settlement with a Counterparty of all financial transactions covered by the agreement in an event of default as defined under such agreement.
18 Invesco Growth and Income Fund
There were no derivative instruments subject to a netting agreement for which the Fund is not currently netting. The following tables present derivative instruments that are either subject to an enforceable netting agreement or offset by collateral arrangements as of August 31, 2015.
| Gross Amounts Not Offset in the Statement of Assets and Liabilities | ||||||||||||||||||||
| Gross Amounts of Recognized Assets | Financial | Collateral Received | Net Amount | |||||||||||||||||
| Counterparty | Non-Cash | Cash | ||||||||||||||||||
Bank of New York Mellon (The) | $ | 3,973,252 | $ | (747,280 | ) | $ | — | $ | — | $ | 3,225,972 | |||||||||
State Street Bank & Trust Co. | 3,959,542 | (780,995 | ) | — | — | 3,178,547 | ||||||||||||||
Total | $ | 7,932,794 | $ | (1,528,275 | ) | $ | — | $ | — | $ | 6,404,519 | |||||||||
| Gross Amounts Not Offset in the Statement of Assets and Liabilities | ||||||||||||||||||||
| Gross Amounts of Recognized Liabilities | Financial | Collateral Pledged | Net Amount | |||||||||||||||||
| Counterparty | Non-Cash | Cash | ||||||||||||||||||
Bank of New York Mellon (The) | $ | 747,280 | $ | (747,280 | ) | $ | — | $ | — | $ | — | |||||||||
State Street Bank & Trust Co. | 780,995 | (780,995 | ) | — | — | — | ||||||||||||||
Total | $ | 1,528,275 | $ | (1,528,275 | ) | $ | — | $ | — | $ | — | |||||||||
NOTE 5—Security Transactions with Affiliated Funds
The Fund is permitted to purchase or sell securities from or to certain other Invesco Funds under specified conditions outlined in procedures adopted by the Board of Trustees of the Trust. The procedures have been designed to ensure that any purchase or sale of securities by the Fund from or to another fund or portfolio that is or could be considered an affiliate by virtue of having a common investment adviser (or affiliated investment advisers), common Trustees and/or common officers complies with Rule 17a-7 of the 1940 Act. Further, as defined under the procedures, each transaction is effected at the current market price. Pursuant to these procedures, for the year ended August 31, 2015, the Fund engaged in securities purchases of $771,115.
NOTE 6—Expense Offset Arrangement(s)
The expense offset arrangement is comprised of transfer agency credits which result from balances in demand deposit accounts used by the transfer agent for clearing shareholder transactions. For the year ended August 31, 2015, the Fund received credits from this arrangement, which resulted in the reduction of the Fund’s total expenses of $6,286.
NOTE 7—Trustees’ and Officers’ Fees and Benefits
Trustees’ and Officers’ Fees and Benefits include amounts accrued by the Fund to pay remuneration to certain Trustees and Officers of the Fund. Trustees have the option to defer compensation payable by the Fund, and Trustees’ and Officers’ Fees and Benefits also include amounts accrued by the Fund to fund such deferred compensation amounts. Those Trustees who defer compensation have the option to select various Invesco Funds in which their deferral accounts shall be deemed to be invested. Finally, certain current Trustees were eligible to participate in a retirement plan that provided for benefits to be paid upon retirement to Trustees over a period of time based on the number of years of service. The Fund may have certain former Trustees who also participate in a retirement plan and receive benefits under such plan. Trustees’ and Officers’ Fees and Benefits include amounts accrued by the Fund to fund such retirement benefits. Obligations under the deferred compensation and retirement plans represent unsecured claims against the general assets of the Fund.
NOTE 8—Cash Balances
The Fund is permitted to temporarily carry a negative or overdrawn balance in its account with State Street Bank and Trust Company, the custodian bank. Such balances, if any at period end, are shown in the Statement of Assets and Liabilities under the payable caption Amount due custodian. To compensate the custodian bank for such overdrafts, the overdrawn Fund may either (1) leave funds as a compensating balance in the account so the custodian bank can be compensated by earning the additional interest; or (2) compensate by paying the custodian bank at a rate agreed upon by the custodian bank and Invesco, not to exceed the contractually agreed upon rate.
19 Invesco Growth and Income Fund
NOTE 9—Distributions to Shareholders and Tax Components of Net Assets
Tax Character of Distributions to Shareholders Paid During the Fiscal Years Ended August 31, 2015 and 2014:
| 2015 | 2014 | |||||||
Ordinary income | $ | 262,808,879 | $ | 119,076,289 | ||||
Long-term capital gain | 753,669,824 | 199,529,274 | ||||||
Total distributions | $ | 1,016,478,703 | $ | 318,605,563 | ||||
Tax Components of Net Assets at Period-End:
| 2015 | ||||
Undistributed ordinary income | $ | 55,218,498 | ||
Undistributed long-term gain | 476,457,231 | |||
Net unrealized appreciation — investments | 1,752,935,611 | |||
Net unrealized appreciation (depreciation) — other investments | (73,902 | ) | ||
Temporary book/tax differences | (720,125 | ) | ||
Shares of beneficial interest | 6,012,207,345 | |||
Total net assets | $ | 8,296,024,658 | ||
The difference between book-basis and tax-basis unrealized appreciation (depreciation) is due to differences in the timing of recognition of gains and losses on investments for tax and book purposes. The Fund’s net unrealized appreciation difference is attributable primarily to wash sales.
The temporary book/tax differences are a result of timing differences between book and tax recognition of income and/or expenses. The Fund’s temporary book/tax differences are the result of the trustee deferral of compensation and retirement plan benefits.
Capital loss carryforward is calculated and reported as of a specific date. Results of transactions and other activity after that date may affect the amount of capital loss carryforward actually available for the Fund to utilize. Capital losses generated in years beginning after December 22, 2010 can be carried forward for an unlimited period, whereas previous losses expire in eight tax years. Capital losses with an expiration period may not be used to offset capital gains until all net capital losses without an expiration date have been utilized. Capital loss carryforwards with no expiration date will retain their character as either short-term or long-term capital losses instead of as short-term capital losses as under prior law. The ability to utilize capital loss carryforwards in the future may be limited under the Internal Revenue Code and related regulations based on the results of future transactions.
The Fund does not have a capital loss carryforward as of August 31, 2015.
NOTE 10—Investment Securities
The aggregate amount of investment securities (other than short-term securities, U.S. Treasury obligations and money market funds, if any) purchased and sold by the Fund during the year ended August 31, 2015 was $2,038,294,295 and $2,837,336,034, respectively. Cost of investments on a tax basis includes the adjustments for financial reporting purposes as of the most recently completed federal income tax reporting period-end.
| Unrealized Appreciation (Depreciation) of Investment Securities on a Tax Basis | ||||
Aggregate unrealized appreciation of investment securities | $ | 2,094,585,354 | ||
Aggregate unrealized (depreciation) of investment securities | (341,649,743 | ) | ||
Net unrealized appreciation of investment securities | $ | 1,752,935,611 | ||
Cost of investments for tax purposes is $6,578,363,728.
NOTE 11—Reclassification of Permanent Differences
Primarily as a result of differing book/tax treatment of foreign currency transactions, excise taxes and return of capital, on August 31, 2015, undistributed net investment income was decreased by $1,091,929, undistributed net realized gain was increased by $800,334 and shares of beneficial interest was increased by $291,595. This reclassification had no effect on the net assets of the Fund.
20 Invesco Growth and Income Fund
NOTE 12—Share Information
| Summary of Share Activity | ||||||||||||||||
| Years ended August 31, | ||||||||||||||||
| 2015(a) | 2014 | |||||||||||||||
| Shares | Amount | Shares | Amount | |||||||||||||
Sold: | ||||||||||||||||
Class A | 17,888,584 | $ | 485,903,239 | 20,450,645 | $ | 551,400,574 | ||||||||||
Class B | 24,494 | 667,225 | 55,993 | 1,492,955 | ||||||||||||
Class C | 1,253,277 | 33,557,232 | 1,054,947 | 28,254,914 | ||||||||||||
Class R | 1,075,763 | 29,268,433 | 1,443,041 | 39,138,626 | ||||||||||||
Class Y | 18,424,623 | 503,537,339 | 17,406,820 | 473,531,971 | ||||||||||||
Class R5 | 8,520,759 | 231,266,680 | 10,863,248 | 296,409,011 | ||||||||||||
Class R6 | 10,683,508 | 288,569,077 | 10,686,110 | 288,760,455 | ||||||||||||
Issued as reinvestment of dividends: | ||||||||||||||||
Class A | 20,187,250 | 521,859,531 | 6,491,884 | 170,525,029 | ||||||||||||
Class B | 295,592 | 7,581,858 | 128,924 | 3,358,844 | ||||||||||||
Class C | 1,183,905 | 30,214,201 | 306,483 | 7,924,492 | ||||||||||||
Class R | 699,242 | 18,074,952 | 225,990 | 5,927,788 | ||||||||||||
Class Y | 8,962,519 | 232,043,868 | 2,711,161 | 71,425,728 | ||||||||||||
Class R5 | 3,472,896 | 90,078,761 | 1,172,727 | 30,940,210 | ||||||||||||
Class R6 | 2,877,870 | 74,651,350 | 594,490 | 15,775,850 | ||||||||||||
Automatic conversion of Class B shares to Class A shares: | ||||||||||||||||
Class A | 815,263 | 22,186,231 | 970,672 | 26,486,043 | ||||||||||||
Class B | (821,538 | ) | (22,186,231 | ) | (977,570 | ) | (26,486,043 | ) | ||||||||
Reacquired: | ||||||||||||||||
Class A | (44,887,223 | ) | (1,220,407,026 | ) | (38,227,817 | ) | (1,037,105,295 | ) | ||||||||
Class B | (332,033 | ) | (8,997,084 | ) | (465,664 | ) | (12,570,146 | ) | ||||||||
Class C | (1,680,802 | ) | (45,205,260 | ) | (1,545,384 | ) | (41,796,527 | ) | ||||||||
Class R | (2,495,100 | ) | (67,672,959 | ) | (2,330,503 | ) | (63,468,535 | ) | ||||||||
Class Y | (27,829,736 | ) | (757,164,563 | ) | (18,798,733 | ) | (510,114,541 | ) | ||||||||
Class R5 | (12,993,861 | ) | (352,312,858 | ) | (10,842,356 | ) | (297,770,652 | ) | ||||||||
Class R6 | (7,359,673 | ) | (199,523,408 | ) | (2,670,780 | ) | (73,147,977 | ) | ||||||||
Net increase (decrease) in share activity | (2,034,421 | ) | $ | (104,009,412 | ) | (1,295,672 | ) | $ | (51,107,226 | ) | ||||||
| (a) | There are entities that are record owners of more than 5% of the outstanding shares of the Fund and in the aggregate own 34% of the outstanding shares of the Fund. IDI has an agreement with these entities to sell Fund shares. The Fund, Invesco and/or Invesco affiliates may make payments to these entities, which are considered to be related to the Fund, for providing services to the Fund, Invesco and/or Invesco affiliates including but not limited to services such as securities brokerage, distribution, third party record keeping and account servicing. The Fund has no knowledge as to whether all or any portion of the shares owned of record by these entities are also owned beneficially. |
21 Invesco Growth and Income Fund
NOTE 13—Financial Highlights
The following schedule presents financial highlights for a share of the Fund outstanding throughout the periods indicated.
| Net asset value, beginning of period | Net investment income(a) | Net gains (losses) on securities (both realized and unrealized) | Total from investment operations | Dividends from net investment income | Distributions from net realized gains | Total distributions | Net asset value, end of period | Total return(b) | Net assets, end of period (000’s omitted) | Ratio of expenses to average net assets with fee waivers and/or expenses absorbed | Ratio of expenses to average net assets without fee waivers and/or expenses absorbed | Ratio of net investment income to average net assets | Portfolio turnover(c) | |||||||||||||||||||||||||||||||||||||||||||
Class A | ||||||||||||||||||||||||||||||||||||||||||||||||||||||||
Year ended 08/31/15 | $ | 29.30 | $ | 0.35 | $ | (1.09 | ) | $ | (0.74 | ) | $ | (0.54 | ) | $ | (2.58 | ) | $ | (3.12 | ) | $ | 25.44 | (2.61 | )% | $ | 4,450,596 | 0.84 | %(d) | 0.84 | %(d) | 1.29 | %(d) | 23 | % | |||||||||||||||||||||||
Year ended 08/31/14 | 24.92 | 0.55 | (e) | 4.78 | 5.33 | (0.33 | ) | (0.62 | ) | (0.95 | ) | 29.30 | 21.84 | 5,302,375 | 0.83 | 0.84 | 2.03 | (e) | 31 | |||||||||||||||||||||||||||||||||||||
Year ended 08/31/13 | 20.48 | 0.31 | 4.47 | 4.78 | (0.34 | ) | — | (0.34 | ) | 24.92 | 23.57 | 4,766,860 | 0.81 | 0.82 | 1.37 | 29 | ||||||||||||||||||||||||||||||||||||||||
Year ended 08/31/12 | 18.01 | 0.32 | 2.42 | 2.74 | (0.27 | ) | — | (0.27 | ) | 20.48 | 15.33 | 4,266,135 | 0.83 | 0.84 | 1.66 | 25 | ||||||||||||||||||||||||||||||||||||||||
Year ended 08/31/11 | 16.06 | 0.24 | 1.91 | 2.15 | (0.20 | ) | — | (0.20 | ) | 18.01 | 13.37 | 4,149,537 | 0.83 | 0.84 | 1.23 | 23 | ||||||||||||||||||||||||||||||||||||||||
Class B | ||||||||||||||||||||||||||||||||||||||||||||||||||||||||
Year ended 08/31/15 | 29.10 | 0.35 | (1.09 | ) | (0.74 | ) | (0.54 | ) | (2.58 | ) | (3.12 | ) | 25.24 | (2.65 | )(f) | 50,939 | 0.84 | (d)(f) | 0.84 | (d)(f) | 1.29 | (d)(f) | 23 | |||||||||||||||||||||||||||||||||
Year ended 08/31/14 | 24.75 | 0.54 | (e) | 4.75 | 5.29 | (0.32 | ) | (0.62 | ) | (0.94 | ) | 29.10 | 21.86 | (f) | 82,970 | 0.83 | (f) | 0.84 | (f) | 2.03 | (e)(f) | 31 | ||||||||||||||||||||||||||||||||||
Year ended 08/31/13 | 20.34 | 0.31 | 4.44 | 4.75 | (0.34 | ) | — | (0.34 | ) | 24.75 | 23.57 | (f) | 101,723 | 0.81 | (f) | 0.82 | (f) | 1.37 | (f) | 29 | ||||||||||||||||||||||||||||||||||||
Year ended 08/31/12 | 17.88 | 0.31 | 2.41 | 2.72 | (0.26 | ) | — | (0.26 | ) | 20.34 | 15.37 | (f) | 124,930 | 0.81 | (f) | 0.82 | (f) | 1.68 | (f) | 25 | ||||||||||||||||||||||||||||||||||||
Year ended 08/31/11 | 15.93 | 0.23 | 1.90 | 2.13 | (0.18 | ) | — | (0.18 | ) | 17.88 | 13.36 | (f) | 173,129 | 0.83 | (f) | 0.84 | (f) | 1.23 | (f) | 23 | ||||||||||||||||||||||||||||||||||||
Class C | ||||||||||||||||||||||||||||||||||||||||||||||||||||||||
Year ended 08/31/15 | 29.01 | 0.15 | (1.08 | ) | (0.93 | ) | (0.33 | ) | (2.58 | ) | (2.91 | ) | 25.17 | (3.33 | ) | 309,526 | 1.59 | (d) | 1.59 | (d) | 0.54 | (d) | 23 | |||||||||||||||||||||||||||||||||
Year ended 08/31/14 | 24.68 | 0.34 | (e) | 4.73 | 5.07 | (0.12 | ) | (0.62 | ) | (0.74 | ) | 29.01 | 20.94 | 334,902 | 1.58 | 1.59 | 1.28 | (e) | 31 | |||||||||||||||||||||||||||||||||||||
Year ended 08/31/13 | 20.29 | 0.14 | 4.42 | 4.56 | (0.17 | ) | — | (0.17 | ) | 24.68 | 22.63 | 289,458 | 1.56 | 1.57 | 0.62 | 29 | ||||||||||||||||||||||||||||||||||||||||
Year ended 08/31/12 | 17.84 | 0.18 | 2.40 | 2.58 | (0.13 | ) | — | (0.13 | ) | 20.29 | 14.53 | (g) | 254,679 | 1.55 | (g) | 1.56 | (g) | 0.94 | (g) | 25 | ||||||||||||||||||||||||||||||||||||
Year ended 08/31/11 | 15.91 | 0.09 | 1.90 | 1.99 | (0.06 | ) | — | (0.06 | ) | 17.84 | 12.52 | (g) | 258,606 | 1.57 | (g) | 1.58 | (g) | 0.49 | (g) | 23 | ||||||||||||||||||||||||||||||||||||
Class R | ||||||||||||||||||||||||||||||||||||||||||||||||||||||||
Year ended 08/31/15 | 29.31 | 0.29 | (1.10 | ) | (0.81 | ) | (0.47 | ) | (2.58 | ) | (3.05 | ) | 25.45 | (2.86 | ) | 139,084 | 1.09 | (d) | 1.09 | (d) | 1.04 | (d) | 23 | |||||||||||||||||||||||||||||||||
Year ended 08/31/14 | 24.93 | 0.48 | (e) | 4.78 | 5.26 | (0.26 | ) | (0.62 | ) | (0.88 | ) | 29.31 | 21.53 | 181,301 | 1.08 | 1.09 | 1.78 | (e) | 31 | |||||||||||||||||||||||||||||||||||||
Year ended 08/31/13 | 20.49 | 0.25 | 4.47 | 4.72 | (0.28 | ) | — | (0.28 | ) | 24.93 | 23.26 | 170,691 | 1.06 | 1.07 | 1.12 | 29 | ||||||||||||||||||||||||||||||||||||||||
Year ended 08/31/12 | 18.02 | 0.27 | 2.42 | 2.69 | (0.22 | ) | — | (0.22 | ) | 20.49 | 15.03 | 147,659 | 1.08 | 1.09 | 1.41 | 25 | ||||||||||||||||||||||||||||||||||||||||
Year ended 08/31/11 | 16.07 | 0.19 | 1.92 | 2.11 | (0.16 | ) | — | (0.16 | ) | 18.02 | 13.08 | 147,453 | 1.08 | 1.09 | 0.98 | 23 | ||||||||||||||||||||||||||||||||||||||||
Class Y | ||||||||||||||||||||||||||||||||||||||||||||||||||||||||
Year ended 08/31/15 | 29.33 | 0.42 | (1.10 | ) | (0.68 | ) | (0.61 | ) | (2.58 | ) | (3.19 | ) | 25.46 | (2.39 | ) | 1,886,928 | 0.59 | (d) | 0.59 | (d) | 1.54 | (d) | 23 | |||||||||||||||||||||||||||||||||
Year ended 08/31/14 | 24.94 | 0.62 | (e) | 4.78 | 5.40 | (0.39 | ) | (0.62 | ) | (1.01 | ) | 29.33 | 22.17 | 2,186,472 | 0.58 | 0.59 | 2.28 | (e) | 31 | |||||||||||||||||||||||||||||||||||||
Year ended 08/31/13 | 20.50 | 0.37 | 4.47 | 4.84 | (0.40 | ) | — | (0.40 | ) | 24.94 | 23.86 | 1,826,646 | 0.56 | 0.57 | 1.62 | 29 | ||||||||||||||||||||||||||||||||||||||||
Year ended 08/31/12 | 18.03 | 0.36 | 2.42 | 2.78 | (0.31 | ) | — | (0.31 | ) | 20.50 | 15.60 | 1,504,586 | 0.58 | 0.59 | 1.91 | 25 | ||||||||||||||||||||||||||||||||||||||||
Year ended 08/31/11 | 16.08 | 0.28 | 1.92 | 2.20 | (0.25 | ) | — | (0.25 | ) | 18.03 | 13.64 | 1,544,968 | 0.58 | 0.59 | 1.48 | 23 | ||||||||||||||||||||||||||||||||||||||||
Class R5 | ||||||||||||||||||||||||||||||||||||||||||||||||||||||||
Year ended 08/31/15 | 29.36 | 0.45 | (1.10 | ) | (0.65 | ) | (0.64 | ) | (2.58 | ) | (3.22 | ) | 25.49 | (2.29 | ) | 738,797 | 0.48 | (d) | 0.48 | (d) | 1.65 | (d) | 23 | |||||||||||||||||||||||||||||||||
Year ended 08/31/14 | 24.97 | 0.65 | (e) | 4.78 | 5.43 | (0.42 | ) | (0.62 | ) | (1.04 | ) | 29.36 | 22.27 | 880,275 | 0.47 | 0.48 | 2.39 | (e) | 31 | |||||||||||||||||||||||||||||||||||||
Year ended 08/31/13 | 20.53 | 0.39 | 4.47 | 4.86 | (0.42 | ) | — | (0.42 | ) | 24.97 | 23.96 | 718,816 | 0.47 | 0.48 | 1.71 | 29 | ||||||||||||||||||||||||||||||||||||||||
Year ended 08/31/12 | 18.05 | 0.39 | 2.43 | 2.82 | (0.34 | ) | — | (0.34 | ) | 20.53 | 15.80 | 697,346 | 0.46 | 0.47 | 2.03 | 25 | ||||||||||||||||||||||||||||||||||||||||
Year ended 08/31/11 | 16.08 | 0.32 | 1.92 | 2.24 | (0.27 | ) | — | (0.27 | ) | 18.05 | 13.87 | 307,338 | 0.39 | 0.40 | 1.67 | 23 | ||||||||||||||||||||||||||||||||||||||||
Class R6 | ||||||||||||||||||||||||||||||||||||||||||||||||||||||||
Year ended 08/31/15 | 29.36 | 0.48 | (1.10 | ) | (0.62 | ) | (0.67 | ) | (2.58 | ) | (3.25 | ) | 25.49 | (2.19 | ) | 720,155 | 0.38 | (d) | 0.38 | (d) | 1.75 | (d) | 23 | |||||||||||||||||||||||||||||||||
Year ended 08/31/14 | 24.97 | 0.68 | (e) | 4.78 | 5.46 | (0.45 | ) | (0.62 | ) | (1.07 | ) | 29.36 | 22.38 | 647,350 | 0.38 | 0.39 | 2.48 | (e) | 31 | |||||||||||||||||||||||||||||||||||||
Year ended 08/31/13(h) | 21.23 | 0.43 | 3.66 | 4.09 | (0.35 | ) | — | (0.35 | ) | 24.97 | 19.45 | 335,549 | 0.38 | (i) | 0.38 | (i) | 1.80 | (i) | 29 | |||||||||||||||||||||||||||||||||||||
| (a) | Calculated using average shares outstanding. |
| (b) | Includes adjustments in accordance with accounting principles generally accepted in the United States of America and as such, the net asset value for financial reporting purposes and the returns based upon those net asset values may differ from the net asset value and returns for shareholder transactions. Does not include sales charges and is not annualized for periods less than one year, if applicable. |
| (c) | Portfolio turnover is calculated at the fund level and is not annualized for periods less than one year, if applicable. For year ended August 31, 2011, the portfolio turnover calculation excludes the value of securities purchased of $138,016,999 and sold of $13,000,923 in the effort to realign the Fund’s portfolio holdings after the reorganization of Invesco Fundamental Value Fund & Invesco Large Cap Relative Value Fund into the Fund. |
| (d) | Ratios are based on average daily net assets (000’s omitted) of $4,975,278, $67,677, $328,546, $163,505, $2,148,381, $828,466 and $733,340 for Class A, Class B, Class C, Class R, Class Y, Class R5 and Class R6 shares, respectively. |
| (e) | Net investment income per share and the ratio of net investment income to average net assets includes significant dividends received during the period. Net investment income per share and the ratio of net investment income to average net assets excluding the significant dividends are $0.34 and 1.24%, $0.33 and 1.24%, $0.13 and 0.49%, $0.27 and 0.99%, $0.41 and 1.49%, $0.44 and 1.60% and $0.47 and 1.69% for Class A, Class B, Class C, Class R, Class Y, Class R5 and Class R6 shares, respectively. |
| (f) | The total return, ratio of expenses to average net assets and ratio of net investment income to average net assets reflect actual 12b-1 fees of 0.25%, 0.25%, 0.25%, 0.23% and 0.25% for the years ended August 31, 2015, 2014, 2013, 2012 and 2011, respectively. |
| (g) | The total return, ratio of expenses to average net assets and ratio of net investment income to average net assets reflect actual 12b-1 fees of 0.97% and 0.99% for the years ended August 31, 2012 and 2011, respectively. |
| (h) | Commencement date of September 24, 2012. |
| (i) | Annualized. |
22 Invesco Growth and Income Fund
Report of Independent Registered Public Accounting Firm
To the Board of Trustees of AIM Counselor Series Trust (Invesco Counselor Series Trust)
and Shareholders of Invesco Growth and Income Fund:
In our opinion, the accompanying statement of assets and liabilities, including the schedule of investments, and the related statements of operations and of changes in net assets and the financial highlights present fairly, in all material respects, the financial position of Invesco Growth and Income Fund (one of the funds constituting AIM Counselor Series Trust (Invesco Counselor Series Trust), hereafter referred to as the “Fund”) at August 31, 2015, the results of its operations for the year then ended, the changes in its net assets for each of the two years in the period then ended and the financial highlights for each of the five years in the period then ended, in conformity with accounting principles generally accepted in the United States of America. These financial statements and financial highlights (hereafter referred to as “financial statements”) are the responsibility of the Fund’s management. Our responsibility is to express an opinion on these financial statements based on our audits. We conducted our audits of these financial statements in accordance with the standards of the Public Company Accounting Oversight Board (United States). Those standards require that we plan and perform the audit to obtain reasonable assurance about whether the financial statements are free of material misstatement. An audit includes examining, on a test basis, evidence supporting the amounts and disclosures in the financial statements, assessing the accounting principles used and significant estimates made by management, and evaluating the overall financial statement presentation. We believe that our audits, which included confirmation of securities at August 31, 2015 by correspondence with the custodian and brokers, and the application of alternative auditing procedures where confirmations of security purchases have not been received, provide a reasonable basis for our opinion.
PRICEWATERHOUSECOOPERS LLP
October 27, 2015
Houston, Texas
23 Invesco Growth and Income Fund
Calculating your ongoing Fund expenses
Example
As a shareholder of the Fund, you incur two types of costs: (1) transaction costs, which may include sales charges (loads) on purchase payments or contingent deferred sales charges on redemptions, if any; and (2) ongoing costs, including management fees, distribution and/or service (12b-1) fees, and other Fund expenses. This example is intended to help you understand your ongoing costs (in dollars) of investing in the Fund and to compare these costs with ongoing costs of investing in other mutual funds. The example is based on an investment of $1,000 invested at the beginning of the period and held for the entire period March 1, 2015 through August 31, 2015.
Actual expenses
The table below provides information about actual account values and actual expenses. You may use the information in this table, together with the amount you invested, to estimate the expenses that you paid over the period. Simply divide your account value by $1,000 (for example, an $8,600 account value divided by $1,000 = 8.6), then multiply the result by the number in the table under the heading entitled “Actual Expenses Paid During Period” to estimate the expenses you paid on your account during this period.
Hypothetical example for comparison purposes
The table below also provides information about hypothetical account values and hypothetical expenses based on the Fund’s actual expense ratio and an assumed rate of return of 5% per year before expenses, which is not the Fund’s actual return.
The hypothetical account values and expenses may not be used to estimate the actual ending account balance or expenses you paid for the period. You may use this information to compare the ongoing costs of investing in the Fund and other funds. To do so, compare this 5% hypothetical example with the 5% hypothetical examples that appear in the shareholder reports of the other funds.
Please note that the expenses shown in the table are meant to highlight your ongoing costs only and do not reflect any transaction costs, such as sales charges (loads) on purchase payments or contingent deferred sales charges on redemptions, if any. Therefore, the hypothetical information is useful in comparing ongoing costs only, and will not help you determine the relative total costs of owning different funds. In addition, if these transaction costs were included, your costs would have been higher.
| Class | Beginning Account Value (03/01/15) | ACTUAL | HYPOTHETICAL (5% annual return before expenses) | Annualized Expense Ratio | ||||||||||||||||||||
| Ending Account Value (08/31/15)1 | Expenses Paid During Period2 | Ending Account Value (08/31/15) | Expenses Paid During Period2 | |||||||||||||||||||||
| A | $ | 1,000.00 | $ | 956.50 | $ | 4.14 | $ | 1,020.97 | $ | 4.28 | 0.84 | % | ||||||||||||
| B | 1,000.00 | 956.50 | 4.14 | 1,020.97 | 4.28 | 0.84 | ||||||||||||||||||
| C | 1,000.00 | 953.20 | 7.83 | 1,017.19 | 8.08 | 1.59 | ||||||||||||||||||
| R | 1,000.00 | 955.40 | 5.37 | 1,019.71 | 5.55 | 1.09 | ||||||||||||||||||
| Y | 1,000.00 | 957.80 | 2.91 | 1,022.23 | 3.01 | 0.59 | ||||||||||||||||||
| R5 | 1,000.00 | 958.40 | 2.37 | 1,022.79 | 2.45 | 0.48 | ||||||||||||||||||
| R6 | 1,000.00 | 958.50 | 1.88 | 1,023.29 | 1.94 | 0.38 | ||||||||||||||||||
| 1 | The actual ending account value is based on the actual total return of the Fund for the period March 1, 2015 through August 31, 2015, after actual expenses and will differ from the hypothetical ending account value which is based on the Fund’s expense ratio and a hypothetical annual return of 5% before expenses. |
| 2 | Expenses are equal to the Fund’s annualized expense ratio as indicated above multiplied by the average account value over the period, multiplied by 184/365 to reflect the most recent fiscal half year. |
24 Invesco Growth and Income Fund
Approval of Investment Advisory and Sub-Advisory Contracts
The Board of Trustees (the Board) of AIM Counselor Series Trust (Invesco Counselor Series Trust) is required under the Investment Company Act of 1940, as amended, to approve annually the renewal of Invesco Growth and Income Fund’s (the Fund) investment advisory agreements. During contract renewal meetings held on June 9-10, 2015, the Board as a whole, and the disinterested or “independent” Trustees, who comprise over 75% of the Board, voting separately, approved the continuance for the Fund of the Master Investment Advisory Agreement with Invesco Advisers, Inc. (Invesco Advisers and the investment advisory agreement) and the Master Intergroup Sub-Advisory Contract for Mutual Funds with Invesco Asset Management Deutschland GmbH, Invesco Asset Management Limited, Invesco Asset Management (Japan) Limited , Invesco Hong Kong Limited, Invesco Senior Secured Management, Inc. and Invesco Canada Ltd. (collectively, the Affiliated Sub-Advisers and the sub-advisory contracts) for another year, effective July 1, 2015.
In evaluating the fairness and reasonableness of compensation under the Fund’s investment advisory agreement and sub-advisory contracts, the Board considered, among other things, the factors discussed below. The Board determined that continuation of the Fund’s investment advisory agreement and the sub-advisory contracts are in the best interest of the Fund and its shareholders and that the compensation payable to Invesco Advisers and the Affiliated Sub-Advisers under the agreements is fair and reasonable.
The Board’s Fund Evaluation Process
The Board’s Investments Committee has established three Sub-Committees, each of which is primarily responsible for overseeing the performance and investment management services provided by Invesco Advisers and the Affiliated Sub-Advisers to a number of the funds advised by Invesco Advisers (the Invesco Funds). The Sub-Committees meet throughout the year to review the performance of their assigned Invesco Funds, including reviewing materials prepared under the direction of the independent Senior Officer, an officer of the Invesco Funds who reports directly to the independent Trustees. Over the course of each year, the Sub-Committees meet with portfolio managers for their assigned Invesco Funds and other members of management to review the performance, investment objective(s), policies, strategies, limitations and investment risks of these funds. The Board had the benefit of reports form the Sub-Committees and Investments Committee throughout the year in considering approval of the continuance of each Invesco Fund’s investment advisory agreement and sub-advisory contracts for another year.
During the contract renewal process, the Board receives comparative performance and fee data regarding the Invesco Funds prepared by Invesco Advisers and Lipper Inc. (Lipper), an independent provider of investment company data. The Board also receives a report and this independent written evaluation from the Senior Officer. The Senior Officer’s evaluation is prepared as part of his responsibility to manage the process by which the Invesco Funds’ proposed management fees are negotiated during the annual contract renewal process to ensure they are negotiated in a manner that is at arms’ length and reasonable. In addition to meetings with Invesco Advisers and fund counsel, the independent Trustees also discuss the continuance of the investment advisory agreement and sub-advisory contracts in separate sessions with the Senior Officer and with independent legal counsel.
The Trustees recognized that the advisory fee rates for the Invesco Funds are, in many cases, the result of years of review and negotiation. The Trustees’ deliberations and conclusions in a particular year may be based in part on their deliberations and conclusions regarding these same arrangements throughout the year and in prior years. The Trustees’ review and conclusions are based on the comprehensive consideration of all information presented to them and are not the result of any single determinative factor. Moreover, one Trustee may have weighed a particular piece of information or factor differently than another Trustee.
The discussion below is a summary of the Senior Officer’s independent written evaluation with respect to the Fund’s investment advisory agreement as well as a discussion of the material factors and related conclusions that formed the basis for the Board’s approval of the Fund’s investment advisory agreement and sub-advisory contracts. Unless otherwise stated, this information is current as of June 10, 2015, and does not reflect consideration of factors that became known to the Board after that date.
Factors and Conclusions and Summary of Independent Written Fee Evaluation
| A. | Nature, Extent and Quality of Services Provided by Invesco Advisers and the Affiliated Sub-Advisers |
The Board reviewed the advisory services provided to the Fund by Invesco Advisers under the Fund’s investment advisory agreement, the performance of Invesco Advisers in providing these services, and the credentials and experience of the officers and employees of Invesco Advisers who provide these services, including the Fund’s portfolio manager or managers. The Board’s review of the qualifications of Invesco Advisers to provide advisory services included the Board’s
consideration of Invesco Advisers’ investment process oversight, independent credit analysis and investment risk management. The Board also considered non-advisory services that Invesco Advisers and its affiliates provide to the Invesco Funds such as various back office support functions, equity and fixed income trading operations, internal audit, distribution, valuation and legal and compliance.
In determining whether to continue the Fund’s investment advisory agreement, the Board considered the benefits of reapproving an existing relationship and the greater uncertainty that may be associated with entering into a new relationship. The Board concluded that the nature, extent and quality of the services provided to the Fund by Invesco Advisers are appropriate and satisfactory and consistent with the terms of the Fund’s investment advisory agreement.
The Board reviewed the services that may be provided by the Affiliated Sub-Advisers under the sub-advisory contracts and the credentials and experience of the officers and employees of the Affiliated Sub-Advisers who provide these services. The Board noted that the Affiliated Sub-Advisers have offices and personnel that are located in financial centers around the world. As a result, the Affiliated Sub-Advisers can provide research and investment analysis on the markets and economies of various countries in which the Fund may invest, make recommendations regarding securities and assist with security trades. The Board concluded that the sub-advisory contracts benefit the Fund and its shareholders by permitting Invesco Advisers to use the resources and talents of the Affiliated Sub-Advisers in managing the Fund. The Board concluded that the nature, extent and quality of the services that may be provided by the Affiliated Sub-Advisers are appropriate and satisfactory and consistent with the terms of the Fund’s sub-advisory contracts.
| B. | Fund Performance |
The Board considered Fund performance as a relevant factor in considering whether to approve the investment advisory agreement. The Board did not view Fund performance as a relevant factor in considering whether to approve the sub-advisory contracts for the Fund, as no Affiliated Sub-Adviser currently manages assets of the Fund.
The Board compared the Fund’s performance during the past one, three and five calendar years to the performance of funds in the Lipper performance universe and against the Lipper Large-Cap Value Funds Index. The Board noted that performance of Class A shares of the Fund was in the fourth quintile of its performance universe for the one year period and the third quintile for the three and five year periods (the first quintile being the best performing funds and the fifth quintile being the worst performing
25 Invesco Growth and Income Fund
funds). The Board noted that performance of Class A shares of the Fund was below the performance of the Index for the one, three and five year periods. The Trustees also reviewed more recent Fund performance and this review did not change their conclusions.
| C. | Advisory and Sub-Advisory Fees |
The Board compared the Fund’s contractual management fee rate to the contractual management fee rates of funds in the Fund’s Lipper expense group at a common asset level. The Board noted that the contractual management fee rate for Class A shares of the Fund was below the median contractual management fee rate of funds in its expense group. The Board noted that the term “contractual management fee” may include both advisory and certain administrative services fees, but that Lipper does not provide information on a fund by fund basis as to what is included. The Board noted that Invesco Advisers does not charge the Invesco Funds for the administrative services included in the term as defined by Lipper. The Board also reviewed the methodology used by Lipper in providing expense group information, which includes using each fund’s contractual management fee schedule (including any applicable breakpoints) as reported in the most recent prospectus or statement of additional information for each fund in the expense group.
The Board also compared the Fund’s effective advisory fee rate (the advisory fee rate after advisory fee waivers and before other expense limitations/waivers) to the effective advisory fee rates of other mutual funds advised by Invesco Advisers and its affiliates with investment strategies comparable to those of the Fund. The Board noted that the Fund’s rate was below the rate of one such mutual fund. The Board also noted how the Fund’s rate compared to the effective sub-adviser fee rate of two mutual funds sub-advised by Invesco Advisers.
The Board also considered the fees charged by Invesco Advisers and the Affiliated Sub-Advisers to other client accounts with investment strategies comparable to those of the Fund. The Board noted that Invesco Advisers or the Affiliated Sub-Advisers may charge lower fees to large institutional clients. Invesco Advisers reviewed with the Board the significantly greater scope of services it provides to the Invesco Funds relative to certain other types of client accounts. These additional services include provision of administrative services, officers and office space, oversight of service providers, preparation of annual registration statement updates and financial information and regulatory compliance under the Investment Company Act of 1940, as amended.
Invesco Advisers also reviewed generally the higher frequency of shareholder purchases and redemptions in the Invesco Funds relative to the flow of assets for other client accounts. Invesco Advisers advised the Board that advance notice of redemptions is often provided to Invesco Advisers by institutional clients. The Board did
note that sub-advisory fee rates charged by the Affiliated Sub-Advisers to manage the Invesco Funds and to manage other client accounts tended to be more comparable, reflecting a similar scope of services. The information received by the Board demonstrated that the aggregate services provided to the Invesco Funds were sufficiently different from those provided to institutional clients to support the difference in fees.
The Board also considered the services that may be provided by the Affiliated Sub-Advisers pursuant to the sub-advisory contracts, as well as the fees payable by Invesco Advisers to the Affiliated Sub-Advisers pursuant to the sub-advisory contracts. The Board also noted that the sub-advisory fees are not paid directly by the Fund, but rather, are payable by Invesco Advisers to the Affiliated Sub-Advisers.
| D. | Economies of Scale and Breakpoints |
The Board considered the extent to which there are economies of scale in the provision of advisory services to the Fund. The Board also considered whether the Fund benefits from economies of scale through contractual breakpoints in the Fund’s advisory fee schedule. The Board also noted that the Fund shares directly in economies of scale through lower fees charged by third party service providers based on the combined size of the Invesco Funds and other clients advised by Invesco Advisers.
| E. | Profitability and Financial Resources |
The Board reviewed information from Invesco Advisers concerning the costs of the advisory and other services that Invesco Advisers and its affiliates provide to the Fund and the Invesco Funds and the profitability of Invesco Advisers and its affiliates in providing these services. The Board received information from Invesco Advisers about the methodology used to prepare the profitability information. The Board noted that Invesco Advisers continues to operate at a net profit from services Invesco Advisers and its affiliates provide to the Invesco Funds and the Fund. The Board did not deem the level of profits realized by Invesco Advisers and its affiliates from providing services to the Fund to be excessive given the nature, quality and extent of the services provided. The Board received and accepted information from Invesco Advisers demonstrating that Invesco Advisers and each Affiliated Sub-Adviser are financially sound and have the resources necessary to perform their obligations under the investment advisory agreement and sub-advisory contracts.
| F. | Collateral Benefits to Invesco Advisers and its Affiliates |
The Board considered various other benefits received by Invesco Advisers and its affiliates from the relationship with the Fund, including the fees received for providing transfer agency and distribution services to the Fund. The Board considered comparative information regarding fees charged for these services, including information provided by Lipper and other independent sources. The Board considered the performance of Invesco Advisers and its
affiliates in providing these services and the organizational structure employed to provide these services. The Board also considered that these services are provided to the Fund pursuant to written contracts that are reviewed and approved on an annual basis by the Board; and that the services are required for the operation of the Fund.
The Board considered the benefits realized by Invesco Advisers and the Affiliated Sub-Advisers as a result of portfolio brokerage transactions executed through “soft dollar” arrangements. The Board noted that soft dollar arrangements shift the payment obligation for research services from Invesco Advisers and the Affiliated Sub-Advisers to the Invesco Funds and that the research received may be used with other clients of Invesco Advisers and may reduce Invesco Advisers’ and the Affiliated Sub-Advisers’ expenses. The Board also considered that it receives periodic reports from the Chief Compliance Officer of the Invesco Funds demonstrating that these arrangements are consistent with regulatory requirements. The Board did not deem the soft dollar arrangements to be inappropriate.
The Board considered that the Fund’s uninvested cash and cash collateral from any securities lending arrangements may be invested in money market funds advised by Invesco Advisers pursuant to procedures approved by the Board. The Board noted that Invesco Advisers receives advisory fees from these affiliated money market funds attributable to such investments, although Invesco Advisers has contractually agreed to waive through varying periods the advisory fees payable by the Invesco Funds with respect to investments in the affiliated money market funds. The waiver is in an amount equal to 100% of the net advisory fee Invesco Advisers receives from the affiliated money market funds with respect to the Fund’s investment in the affiliated money market funds of uninvested cash, but not cash collateral. The Board concluded that the amount of advisory fees received by Invesco Advisors from the Fund’s investment of cash collateral from any securities lending arrangements in the affiliated money market funds is fair and reasonable.
The Board also considered the Fund may use an affiliated broker to execute certain trades for the Fund to among other things, control information leakage, and were advised that such trades would be executed in compliance with rules under the Investment Company Act of 1940, as amended, and consistent with best execution obligations.
26 Invesco Growth and Income Fund
Tax Information
Form 1099-DIV, Form 1042-S and other year–end tax information provide shareholders with actual calendar year amounts that should be included in their tax returns. Shareholders should consult their tax advisors.
The following distribution information is being provided as required by the Internal Revenue Code or to meet a specific state’s requirement.
The Fund designates the following amounts or, if subsequently determined to be different, the maximum amount allowable for its fiscal year ended August 31, 2015:
Federal and State Income Tax | ||||
Long-Term Capital Gain Distributions | $ | 753,669,824 | ||
Qualified Dividend Income* | 100.00 | % | ||
Corporate Dividends Received Deduction* | 74.04 | % | ||
U.S. Treasury Obligations* | 0.00 | % | ||
| * | The above percentages are based on ordinary income dividends paid to shareholders during the Fund’s fiscal year. |
Non-Resident Alien Shareholders | ||||
Qualified Short-Term Gains | $ | 77,516,486 | ||
27 Invesco Growth and Income Fund
Trustees and Officers
The address of each trustee and officer is AIM Counselor Series Trust (Invesco Counselor Series Trust) (the “Trust”), 11 Greenway Plaza, Suite 1000, Houston, Texas 77046-1173. The trustees serve for the life of the Trust, subject to their earlier death, incapacitation, resignation, retirement or removal as more specifically provided in the Trust’s organizational documents. Each officer serves for a one year term or until their successors are elected and qualified. Column two below includes length of time served with predecessor entities, if any.
| Name, Year of Birth and Position(s) Held with the Trust | Trustee and/ or Officer Since | Principal Occupation(s) During Past 5 Years | Number of Funds in Fund Complex Overseen by Trustee | Other Directorship(s) Held by Trustee During Past 5 Years | ||||
| Interested Persons | ||||||||
| Martin L. Flanagan1 — 1960 Trustee | 2007 | Executive Director, Chief Executive Officer and President, Invesco Ltd. (ultimate parent of Invesco and a global investment management firm); Advisor to the Board, Invesco Advisers, Inc. (formerly known as Invesco Institutional (N.A.), Inc.); Trustee, The Invesco Funds; Vice Chair, Investment Company Institute; and Member of Executive Board, SMU Cox School of Business
Formerly: Chairman and Chief Executive Officer, Invesco Advisers, Inc. (registered investment adviser); Director, Chairman, Chief Executive Officer and President, IVZ Inc. (holding company), INVESCO Group Services, Inc. (service provider) and Invesco North American Holdings, Inc. (holding company); Director, Chief Executive Officer and President, Invesco Holding Company Limited (parent of Invesco and a global investment management firm); Director, Invesco Ltd.; Chairman, Investment Company Institute and President, Co-Chief Executive Officer, Co-President, Chief Operating Officer and Chief Financial Officer, Franklin Resources, Inc. (global investment management organization). | 144 | None | ||||
| Philip A. Taylor2 — 1954 Trustee, President and Principal Executive Officer | 2006 | Head of North American Retail and Senior Managing Director, Invesco Ltd.; Director, Co-Chairman, Co-President and Co-Chief Executive Officer, Invesco Advisers, Inc. (formerly known as Invesco Institutional (N.A.), Inc.) (registered investment adviser); Director, Chairman, Chief Executive Officer and President, Invesco Management Group, Inc. (formerly known as Invesco Aim Management Group, Inc.) (financial services holding company); Director and President, INVESCO Funds Group, Inc. (registered investment adviser and registered transfer agent); Director and Chairman, Invesco Investment Services, Inc. (formerly known as Invesco Aim Investment Services, Inc.) (registered transfer agent) and IVZ Distributors, Inc. (formerly known as INVESCO Distributors, Inc.) (registered broker dealer); Director, President and Chairman, Invesco Inc. (holding company), Invesco Canada Holdings Inc. (holding company), Trimark Investments Ltd./Placements Trimark Ltèe and Invesco Financial Services Ltd/Services Financiers Invesco Ltèe; Chief Executive Officer, Invesco Corporate Class Inc. (corporate mutual fund company) Director, Chairman and Chief Executive Officer, Invesco Canada Ltd. (formerly known as Invesco Trimark Ltd./Invesco Trimark Ltèe) (registered investment adviser and registered transfer agent); Trustee, President and Principal Executive Officer, The Invesco Funds (other than AIM Treasurer’s Series Trust (Invesco Treasurer’s Series Trust), Short-Term Investments Trust and Invesco Management Trust); Trustee and Executive Vice President, The Invesco Funds (AIM Treasurer’s Series Trust (Invesco Treasurer’s Series Trust), Short-Term Investments Trust and Invesco Management Trust only); Director, Invesco Investment Advisers LLC (formerly known as Van Kampen Asset Management); Director, Chief Executive Officer and President, Van Kampen Exchange Corp.
Formerly: Chief Executive Officer, Invesco Canada Fund Inc (corporate mutual fund company); Director and Chairman, Van Kampen Investor Services Inc.; Director, Chief Executive Officer and President, 1371 Preferred Inc. (holding company) and Van Kampen Investments Inc.; Director and President, AIM GP Canada Inc. (general partner for limited partnerships) and Van Kampen Advisors, Inc.; Director and Chief Executive Officer, Invesco Trimark Dealer Inc. (registered broker dealer); Director, Invesco Distributors, Inc. (formerly known as Invesco Aim Distributors, Inc.) (registered broker dealer); Manager, Invesco PowerShares Capital Management LLC; Director, Chief Executive Officer and President, Invesco Advisers, Inc.; Director, Chairman, Chief Executive Officer and President, Invesco Aim Capital Management, Inc.; President, Invesco Trimark Dealer Inc. and Invesco Trimark Ltd./Invesco Trimark Ltèe; Director and President, AIM Trimark Corporate Class Inc. and AIM Trimark Canada Fund Inc.; Senior Managing Director, Invesco Holding Company Limited; Director and Chairman, Fund Management Company (former registered broker dealer); President and Principal Executive Officer, The Invesco Funds (AIM Treasurer’s Series Trust (Invesco Treasurer’s Series Trust), and Short-Term Investments Trust only); President, AIM Trimark Global Fund Inc. and AIM Trimark Canada Fund Inc.. | 144 | None |
| 1 | Mr. Flanagan is considered an interested person (within the meaning of Section 2(a)(19) of the 1940 Act) of the Trust because he is an officer of the Adviser to the Trust, and an officer and a director of Invesco Ltd., ultimate parent of the Adviser. |
| 2 | Mr. Taylor is considered an interested person (within the meaning of Section 2(a)(19) of the 1940 Act) of the Trust because he is an officer and a director of the Adviser. |
T-1 Invesco Growth and Income Fund
Trustees and Officers—(continued)
| Name, Year of Birth and Position(s) Held with the Trust | Trustee and/ or Officer Since | Principal Occupation(s) During Past 5 Years | Number of Funds in Fund Complex Overseen by Trustee | Other Directorship(s) Held by Trustee During Past 5 Years | ||||
| Independent Trustees | ||||||||
Bruce L. Crockett — 1944 Trustee and Chair | 2003 | Chairman, Crockett Technologies Associates (technology consulting company)
Formerly: Director, Captaris (unified messaging provider); Director, President and Chief Executive Officer, COMSAT Corporation; Chairman, Board of Governors of INTELSAT (international communications company); ACE Limited (insurance company); Independent Directors Council and Investment Company Institute | 144 | ALPS (Attorneys Liability Protection Society) (insurance company) and Globe Specialty Metals, Inc. (metallurgical company) | ||||
David C. Arch — 1945 Trustee | 2010 | Chairman of Blistex Inc., a consumer health care products manufacturer | 144 | Board member of the Illinois Manufacturers’ Association; Member of the Board of Visitors, Institute for the Humanities, University of Michigan; Member of the Audit Committee of the Edward-Elmhurst Hospital | ||||
James T. Bunch — 1942 Trustee | 2000 | Managing Member, Grumman Hill Group LLC (family office/private equity investments)
Formerly: Founder, Green Manning & Bunch Ltd. (investment banking firm) (1988-2010); Executive Committee, United States Golf Association; and Chairman, Board of Governors, Western Golf Association | 144 | Chairman of the Board of Trustees, Evans Scholars Foundation; and Chairman of the Board, Denver Film Society | ||||
Rodney F. Dammeyer — 1940 Trustee | 2010 | Chairman of CAC, LLC, (private company offering capital investment and management advisory services)
Formerly: Prior to 2001, Managing Partner at Equity Group Corporate Investments; Prior to 1995, Chief Executive Officer of Itel Corporation (formerly Anixter International); Prior to 1985, experience includes Senior Vice President and Chief Financial Officer of Household International, Inc., Executive Vice President and Chief Financial Officer of Northwest Industries, Inc. and Partner of Arthur Andersen & Co.; From 1987 to 2010, Director/Trustee of investment companies in the Van Kampen Funds complex | 144 | Director of Quidel Corporation and Stericycle, Inc. | ||||
Albert R. Dowden — 1941 Trustee | 2003 | Director of a number of public and private business corporations, including the Boss Group, Ltd. (private investment and management); Nature’s Sunshine Products, Inc. and Reich & Tang Funds (5 portfolios) (registered investment company)
Formerly: Director, Homeowners of America Holding Corporation/Homeowners of America Insurance Company (property casualty company); Director, Continental Energy Services, LLC (oil and gas pipeline service); Director, CompuDyne Corporation (provider of product and services to the public security market) and Director, Annuity and Life Re (Holdings), Ltd. (reinsurance company); Director, President and Chief Executive Officer, Volvo Group North America, Inc.; Senior Vice President, AB Volvo; Director of various public and private corporations; Chairman, DHJ Media, Inc.; Director, Magellan Insurance Company; and Director, The Hertz Corporation, Genmar Corporation (boat manufacturer), National Media Corporation; Advisory Board of Rotary Power International (designer, manufacturer, and seller of rotary power engines); and Chairman, Cortland Trust, Inc. (registered investment company) | 144 | Director of: Nature’s Sunshine Products, Inc., Reich & Tang Funds, Homeowners of America Holding Corporation/ Homeowners of America Insurance Company, the Boss Group | ||||
Jack M. Fields — 1952 Trustee | 2003 | Chief Executive Officer, Twenty First Century Group, Inc. (government affairs company); Owner and Chief Executive Officer, Dos Angeles Ranch, L.P. (cattle, hunting, corporate entertainment); and Discovery Global Education Fund (non-profit)
Formerly: Chief Executive Officer, Texana Timber LP (sustainable forestry company); Director of Cross Timbers Quail Research Ranch (non-profit); and member of the U.S. House of Representatives | 144 | Insperity, Inc. (formerly known as Administaff) | ||||
Prema Mathai-Davis — 1950 Trustee | 2003 | Retired. Formerly: Chief Executive Officer, YWCA of the U.S.A. | 144 | None | ||||
Larry Soll — 1942 Trustee | 1997 | Retired. Formerly: Chairman, Chief Executive Officer and President, Synergen Corp. (a biotechnology company) | 144 | None | ||||
Hugo F. Sonnenschein — 1940 Trustee | 2010 | President Emeritus and Honorary Trustee of the University of Chicago and the Adam Smith Distinguished Service Professor in the Department of Economics at the University of Chicago. Prior to 2000, President of the University of Chicago | 144 | Trustee of the University of Rochester and a member of its investment committee; Member of the National Academy of Sciences and the American Philosophical Society; Fellow of the American Academy of Arts and Sciences | ||||
| Raymond Stickel, Jr. — 1944 Trustee | 2005 | Retired. Formerly: Director, Mainstay VP Series Funds, Inc. (25 portfolios) and Partner, Deloitte & Touche | 144 | None |
T-2 Invesco Growth and Income Fund
Trustees and Officers—(continued)
| Name, Year of Birth and Position(s) Held with the Trust | Trustee and/ or Officer Since | Principal Occupation(s) During Past 5 Years | Number of Funds in Fund Complex Overseen by Trustee | Other Directorship(s) Held by Trustee During Past 5 Years | ||||
| Independent Trustees—(continued) | ||||||||
Suzanne H. Woolsey — 1941 Trustee | 2014 | Chief Executive Officer of Woolsey Partners LLC | 144 | Emeritus Chair of the Board of Trustees of the Institute for Defense Analyses; Trustee of Colorado College; Trustee of California Institute of Technology; Prior to 2014, Director of Fluor Corp.; Prior to 2010, Trustee of the German Marshall Fund of the United States; Prior to 2010 Trustee of the Rocky Mountain Institute | ||||
| Other Officers | ||||||||
Russell C. Burk — 1958 Senior Vice President and Senior Officer | 2005 | Senior Vice President and Senior Officer, The Invesco Funds | N/A | N/A | ||||
John M. Zerr — 1962 Senior Vice President, Chief Legal Officer and Secretary | 2006 | Director, Senior Vice President, Secretary and General Counsel, Invesco Management Group, Inc. (formerly known as Invesco Aim Management Group, Inc.) and Van Kampen Exchange Corp.; Senior Vice President, Invesco Advisers, Inc. (formerly known as Invesco Institutional (N.A.), Inc.) (registered investment adviser); Senior Vice President and Secretary, Invesco Distributors, Inc. (formerly known as Invesco Aim Distributors, Inc.); Director, Vice President and Secretary, Invesco Investment Services, Inc. (formerly known as Invesco Aim Investment Services, Inc.) and IVZ Distributors, Inc. (formerly known as INVESCO Distributors, Inc.); Director and Vice President, INVESCO Funds Group, Inc.; Senior Vice President, Chief Legal Officer and Secretary, The Invesco Funds; Managing Director, Invesco PowerShares Capital Management LLC; Director, Secretary and General Counsel, Invesco Investment Advisers LLC (formerly known as Van Kampen Asset Management); Secretary and General Counsel, Invesco Capital Markets, Inc. (formerly known as Van Kampen Funds Inc.) and Chief Legal Officer, PowerShares Exchange-Traded Fund Trust, PowerShares Exchange-Traded Fund Trust II, PowerShares India Exchange-Traded Fund Trust, PowerShares Actively Managed Exchange-Traded Fund Trust, and PowerShares Actively Managed Exchange-Traded Commodity Fund Trust
Formerly: Director and Vice President, Van Kampen Advisors Inc.; Director, Vice President, Secretary and General Counsel, Van Kampen Investor Services Inc.; Director, Invesco Distributors, Inc. (formerly known as Invesco Aim Distributors, Inc.); Director, Senior Vice President, General Counsel and Secretary, Invesco Aim Advisers, Inc. and Van Kampen Investments Inc.; Director, Vice President and Secretary, Fund Management Company; Director, Senior Vice President, Secretary, General Counsel and Vice President, Invesco Aim Capital Management, Inc.; Chief Operating Officer and General Counsel, Liberty Ridge Capital, Inc. (an investment adviser); Vice President and Secretary, PBHG Funds (an investment company) and PBHG Insurance Series Fund (an investment company); Chief Operating Officer, General Counsel and Secretary, Old Mutual Investment Partners (a broker-dealer); General Counsel and Secretary, Old Mutual Fund Services (an administrator) and Old Mutual Shareholder Services (a shareholder servicing center); Executive Vice President, General Counsel and Secretary, Old Mutual Capital, Inc. (an investment adviser); and Vice President and Secretary, Old Mutual Advisors Funds (an investment company) | N/A | N/A | ||||
| Sheri Morris — 1964 Vice President, Treasurer and Principal Financial Officer | 2003 | Vice President, Treasurer and Principal Financial Officer, The Invesco Funds; Vice President, Invesco Advisers, Inc. (formerly known as Invesco Institutional (N.A.), Inc.) (registered investment adviser); and Vice President, PowerShares Exchange-Traded Fund Trust, PowerShares Exchange-Traded Fund Trust II, PowerShares India Exchange-Traded Fund Trust, PowerShares Actively Managed Exchange-Traded Fund Trust, and PowerShares Actively Managed Exchange-Traded Commodity Fund Trust
Formerly: Vice President, Invesco Aim Advisers, Inc., Invesco Aim Capital Management, Inc. and Invesco Aim Private Asset Management, Inc.; Assistant Vice President and Assistant Treasurer, The Invesco Funds and Assistant Vice President, Invesco Advisers, Inc., Invesco Aim Capital Management, Inc. and Invesco Aim Private Asset Management, Inc.; and Treasurer, PowerShares Exchange-Traded Fund Trust, PowerShares Exchange-Traded Fund Trust II, PowerShares India Exchange-Traded Fund Trust and PowerShares Actively Managed Exchange-Traded Fund Trust | N/A | N/A | ||||
T-3 Invesco Growth and Income Fund
Trustees and Officers—(continued)
| Name, Year of Birth and Position(s) Held with the Trust | Trustee and/ or Officer Since | Principal Occupation(s) During Past 5 Years | Number of Funds in Fund Complex Overseen by Trustee | Other Directorship(s) Held by Trustee During Past 5 Years | ||||
| Other Officers—(continued) | ||||||||
| Karen Dunn Kelley — 1960 Vice President | 2003 | Senior Managing Director, Investments, Invesco Ltd.; Director, Co-President, Co-Chief Executive Officer, and Co-Chairman, Invesco Advisers, Inc. (formerly known as Invesco Institutional (N.A.), Inc.) (registered investment adviser); Chairman, Invesco Senior Secured Management, Inc.; Senior Vice President, Invesco Management Group, Inc. (formerly known as Invesco Aim Management Group, Inc.); Executive Vice President, Invesco Distributors, Inc. (formerly known as Invesco Aim Distributors, Inc.); Director, Invesco Mortgage Capital Inc. and Invesco Management Company Limited; Vice President, The Invesco Funds (other than AIM Treasurer’s Series Trust (Invesco Treasurer’s Series Trust), Short-Term Investments Trust and Invesco Management Trust); and President and Principal Executive Officer, The Invesco Funds (AIM Treasurer’s Series Trust (Invesco Treasurer’s Series Trust), Short-Term Investments Trust and Invesco Management Trust only)
Formerly: Director and President, INVESCO Asset Management (Bermuda) Ltd., Director, INVESCO Global Asset Management Limited and INVESCO Management S.A.; Senior Vice President, Van Kampen Investments Inc. and Invesco Advisers, Inc. (formerly known as Invesco Institutional (N.A.), Inc.) (registered investment adviser); Vice President, Invesco Advisers, Inc. (formerly known as Invesco Institutional (N.A.), Inc.); Director of Cash Management and Senior Vice President, Invesco Advisers, Inc. and Invesco Aim Capital Management, Inc.; Director and President, Fund Management Company; Chief Cash Management Officer, Director of Cash Management, Senior Vice President, and Managing Director, Invesco Aim Capital Management, Inc.; Director of Cash Management, Senior Vice President, and Vice President, Invesco Advisers, Inc. and The Invesco Funds (AIM Treasurer’s Series Trust (Invesco Treasurer’s Series Trust), and Short-Term Investments Trust only) | N/A | N/A | ||||
| Crissie M. Wisdom — 1969 Anti-Money Laundering Compliance Officer | 2013 | Anti-Money Laundering Compliance Officer, Invesco Advisers, Inc. (formerly known as Invesco Institutional (N.A.), Inc.) (registered investment adviser), Invesco Capital Markets, Inc. (formerly known as Van Kampen Funds Inc.), Invesco Distributors, Inc., Invesco Investment Services, Inc., Invesco Management Group, Inc., Van Kampen Exchange Corp., The Invesco Funds, and PowerShares Exchange-Traded Fund Trust, PowerShares Exchange-Traded Fund Trust II, PowerShares India Exchange-Traded Fund Trust, PowerShares Actively Managed Exchange-Traded Fund Trust and PowerShares Actively Managed Exchange-Traded Commodity Fund Trust; Anti-Money Laundering Compliance Officer and Bank Secrecy Act Officer, INVESCO National Trust Company and Invesco Trust Company; and Fraud Prevention Manager and Controls and Risk Analysis Manager for Invesco Investment Services, Inc.. | N/A | N/A | ||||
Lisa O. Brinkley — 1959 Chief Compliance Officer | 2004 | Senior Vice President and Chief Compliance Officer, Invesco Advisers, Inc. (registered investment adviser) (formerly known as Invesco Institutional (N.A., Inc.); and Chief Compliance Officer, The Invesco Funds
Formerly: Global Assurance Officer, Invesco Ltd. and Vice President, The Invesco Funds; Chief Compliance Officer, Invesco Distributors, Inc. (formerly known as Invesco Aim Distributors, Inc.), Invesco Investment Services, Inc.(formerly known as Invesco Aim Investment Services, Inc.) and Van Kampen Investor Services Inc.; Senior Vice President, Invesco Management Group, Inc.; Senior Vice President and Chief Compliance Officer, Invesco Advisers, Inc. and The Invesco Funds; Vice President and Chief Compliance Officer, Invesco Aim Capital Management, Inc. and Invesco Distributors, Inc.; Vice President, Invesco Investment Services, Inc. and Fund Management Company. | N/A | N/A |
The Statement of Additional Information of the Trust includes additional information about the Fund’s Trustees and is available upon request, without charge, by calling 1.800.959.4246. Please refer to the Fund’s prospectus for information on the Fund’s sub-advisers.
Office of the Fund 11 Greenway Plaza, Suite 1000 Houston, TX 77046-1173 | Investment Adviser Invesco Advisers, Inc. 1555 Peachtree Street, N.E. Atlanta, GA 30309 | Distributor Invesco Distributors, Inc. 11 Greenway Plaza, Suite 1000 Houston, TX 77046-1173 | Auditors PricewaterhouseCoopers LLP 1000 Louisiana Street, Suite 5800 Houston, TX 77002-5678 | |||
Counsel to the Fund Stradley Ronon Stevens & Young, LLP 2005 Market Street, Suite 2600 Philadelphia, PA 19103-7018 | Counsel to the Independent Trustees Goodwin Procter LLP 901 New York Avenue, N.W. Washington, D.C. 20001 | Transfer Agent Invesco Investment Services, Inc. 11 Greenway Plaza, Suite 1000 Houston, TX 77046-1173 | Custodian State Street Bank and Trust Company 225 Franklin Street Boston, MA 02110-2801 | |||
T-4 Invesco Growth and Income Fund

Invesco mailing information
Send general correspondence to Invesco Investment Services, Inc., P.O. Box 219078, Kansas City, MO 64121-9078.
Important notice regarding delivery of security holder documents
To reduce Fund expenses, only one copy of most shareholder documents may be mailed to shareholders with multiple accounts at the same address (Householding). Mailing of your shareholder documents may be householded indefinitely unless you instruct us otherwise. If you do not want the mailing of these documents to be combined with those for other members of your household, please contact Invesco Investment Services, Inc. at 800 959 4246 or contact your financial institution. We will begin sending you individual copies for each account within 30 days after receiving your request.
Fund holdings and proxy voting information
The Fund provides a complete list of its holdings four times in each fiscal year, at the quarter ends. For the second and fourth quarters, the lists appear in the Fund’s semiannual and annual reports to shareholders. For the first and third quarters, the Fund files the lists with the Securities and Exchange Commission (SEC) on Form N-Q. The most recent list of portfolio holdings is available at invesco.com/completeqtrholdings. Shareholders can also look up the Fund’s Forms N-Q on the SEC website at sec.gov. Copies of the Fund’s Forms N-Q may be reviewed and copied at the SEC Public Reference Room in Washington, D.C. You can obtain information on the operation of the Public Reference Room, including information about duplicating fee charges, by calling 202 551 8090 or 800 732 0330, or by electronic request at the following email address: publicinfo@sec.gov. The SEC file numbers for the Fund are shown below.
A description of the policies and procedures that the Fund uses to determine how to vote proxies relating to portfolio securities is available without charge, upon request, from our Client Services department at 800 959 4246 or at invesco.com/proxyguidelines. The information is also available on the SEC website, sec.gov.
Information regarding how the Fund voted proxies related to its portfolio securities during the most Invesco Advisers, Inc. is an investment adviser; it provides investment advisory services to |  |
| SEC file numbers: 811-09913 and 333-36074 | VK-GRI-AR-1 | Invesco Distributors, Inc. |
| ||||
| Annual Report to Shareholders
| August 31, 2015 | ||
Invesco Low Volatility Equity Yield Fund | ||||
Nasdaq: A: SCAUX ¡ B: SBCUX ¡ C: SCCUX ¡ R: SCRUX ¡ Y: SCAYX Investor: SCNUX ¡ R5: SCIUX | ||||


Letters to Shareholders
Philip Taylor | Dear Shareholders: This annual report includes information about your Fund, including performance data and a complete list of its investments as of the close of the reporting period. Inside is a discussion of how your Fund was managed and the factors that affected its performance during the reporting period. I hope you find this report of interest. The US economy expanded and unemployment declined throughout the reporting period. The sharp drop in oil prices that began in mid-2014 continued to benefit consumers, but a strong US dollar crimped corporate profits. The US Federal Reserve signaled that it was increasingly likely to raise interest rates, based on generally positive economic data, but uncertainty remained about when it would act. Overseas, the story was much different. Low energy prices hurt the economies of some oil-producing nations, such as Brazil and Russia. During the reporting period, the European Central Bank as well as central banks in | |
| China and Japan – among other countries – either instituted or maintained extraordinarily accommodative monetary policies in response to economic weakness. | ||
Investor uncertainty, such as we saw for much of the reporting period – and market volatility, such as we saw at the end of the reporting period – are unfortunate facts of life when it comes to investing. Some investors use these things as excuses to delay saving and investing for their long-term financial goals. That’s why Invesco encourages investors to work with a professional financial adviser who can stress the importance of starting to save and invest early and the importance of adhering to a disciplined investment plan – when times are good and when they’re uncertain. A financial adviser who knows your unique financial situation, investment goals and risk tolerance can be an invaluable partner as you seek to achieve your financial goals. He or she can offer a long-term perspective when markets are volatile and time-tested advice and guidance when your financial situation or investment goals change. | ||

Timely information when and where you want it
Invesco’s efforts to help investors achieve their financial objectives include providing individual investors and financial professionals with timely information about the markets, the economy and investing – whenever and wherever they want it.
Our website, invesco.com/us, offers a wide range of market insights and investment perspectives. On the website, you’ll find detailed information about our funds, including prices, performance, holdings and portfolio manager commentaries. You can access information about your account by completing a simple, secure online registration. Click on the “Need to register” link in the “Account Access” box on our homepage to get started.
Invesco’s mobile apps for iPhone® and iPad® (both available free from the App StoreSM) allow you to obtain the same detailed information, monitor your account and create customizable watch lists. Also, they allow you to access investment insights from our investment leaders, market strategists, economists and retirement experts. You can sign up to be alerted when new commentary is added, and you can watch portfolio manager videos and have instant access to Invesco news and updates wherever you may be.
In addition to the resources accessible on our website and through our mobile app, you can obtain timely updates to help you stay informed about the markets, the economy and investing by connecting with Invesco on Twitter, LinkedIn or Facebook. You can access our blog at blog.invesco.us.com. Our goal is to provide you the information you want, when and where you want it.
Have questions?
For questions about your account, feel free to contact an Invesco client services representative at 800 959 4246. For Invesco-related questions or comments, please email me directly at phil@invesco.com.
All of us at Invesco look forward to serving your investment management needs for many years to come. Thank you for investing with us.
Sincerely,

Philip Taylor
Senior Managing Director, Invesco Ltd.
iPhone and iPad are trademarks of Apple Inc., registered in the US and other countries. App Store is a service mark of Apple Inc. Invesco Distributors, Inc. is not affiliated with Apple Inc.
2 Invesco Low Volatility Equity Yield Fund
Bruce Crockett | Dear Fellow Shareholders: Among the many important lessons I’ve learned in more than 40 years in a variety of business endeavors is the value of a trusted advocate. As independent chair of the Invesco Funds Board, I can assure you that the members of the Board are strong advocates for the interests of investors in Invesco’s mutual funds. We work hard to represent your interests through oversight of the quality of the investment management services your funds receive and other matters important to your investment, including but not limited to: n Ensuring that Invesco offers a diverse lineup of mutual funds that your financial adviser can use to strive to meet your financial needs as your investment goals change over time. n Monitoring how the portfolio management teams of the Invesco funds are performing in light of changing economic and market conditions. |

| n | Assessing each portfolio management team’s investment performance within the context of the investment strategy described in the fund’s prospectus. |
| n | Monitoring for potential conflicts of interests that may impact the nature of the services that your funds receive. |
We believe one of the most important services we provide our fund shareholders is the annual review of the funds’ advisory and sub-advisory contracts with Invesco Advisers and its affiliates. This review is required by the Investment Company Act of 1940 and focuses on the nature and quality of the services Invesco provides as the adviser to the Invesco funds and the reasonableness of the fees that it charges for those services. Each year, we spend months carefully reviewing information received from Invesco and a variety of independent sources, such as performance and fee data prepared by Lipper Inc., an independent, third-party firm widely recognized as a leader in its field. We also meet with our independent legal counsel and other independent advisers to review and help us assess the information that we have received. Our goal is to assure that you receive quality investment management services for a reasonable fee.
I trust the measures outlined above provide assurance that you have a worthy advocate when it comes to choosing the Invesco Funds.
As always, please contact me at bruce@brucecrockett.com with any questions or concerns you may have. On behalf of the Board, we look forward to continuing to represent your interests and serving your needs.
Sincerely,

Bruce L. Crockett
Independent Chair
Invesco Funds Board of Trustees
3 Invesco Low Volatility Equity Yield Fund
Management’s Discussion of Fund Performance
| Performance summary |
For the fiscal year ended August 31, 2015, Class A shares of Invesco Low Volatility Equity Yield Fund (the Fund), at net asset value, underperformed the Russell 1000 Index, the Fund’s style-specific benchmark.
Your Fund’s long-term performance appears later in this report.
Fund vs. Indexes
Total returns, 8/31/14 to 8/31/15, at net asset value (NAV). Performance shown does not include applicable contingent deferred sales charges (CDSC) or front-end sales charges, which would have reduced performance.
Class A Shares | -10.72 | % | ||
Class B Shares | -11.42 | |||
Class C Shares | -11.37 | |||
Class R Shares | -10.93 | |||
Class Y Shares | -10.43 | |||
Investor Class Shares | -10.76 | |||
Class R5 Shares | -10.35 | |||
S&P 500 Indexq (Broad Market Index) | 0.48 | |||
Russell 1000 Indexq (Style-Specific Index) | 0.40 | |||
Lipper Equity Income Funds Indexn (Peer Group Index) | -3.35 | |||
Source(s): qFactSet Research Systems Inc.; nLipper Inc. |
Market conditions and your Fund
The US economy improved slowly, but somewhat steadily, during the fiscal year ended August 31, 2015 – although the performance of the underlying sectors of the economy varied dramatically. The headline story was the massive slowdown in energy markets, as oil prices plummeted when too much supply overwhelmed slowing global demand. However the more subtle story, which drove the economy forward during the year, was the improved position of the US consumer.
As the fiscal year began, economic growth appeared to be stronger in the US than in the rest of the world. In mid-2014, when the price of oil began its sharp and prolonged decline, US equities fell as well. However, while global growth weakened and commodity-based econo-
mies and currencies underperformed those of the US, continued strengthening of the US consumer led US equity markets higher through the spring. Continued low interest rates, the increasing availability of credit from lenders and an improving employment picture all contributed to higher consumer confidence. This strength also helped the market overcome summer fears that Greece and the eurozone would fail to reach agreement on a financial bailout plan. In the final weeks of the fiscal year, however, US equity markets moved sharply lower. A significant downturn in China’s financial markets, weak global economic growth and the uncertain timing of a potential US interest rate increase were negatives for jittery US markets. While stocks were up slightly for the fiscal year, they ended the reporting period on a negative note.
The Fund seeks to combine a higher return and income potential than the Russell 1000 Index with less volatile stocks. The Fund attempts to do this through its stock selection process, in which we systematically evaluate fundamental and behavioral factors to forecast individual security returns and rank these securities based on their attractiveness relative to industry peers.
During the fiscal year, performance was mixed across sectors of the Fund and its style-specific benchmark. The energy, financials and information technology sectors detracted from Fund performance, while the utilities sector contributed to Fund performance.
The largest detractor from Fund performance, on both a relative and absolute basis, was our stock selection in the energy sector. Within this sector, Encana, Peabody Energy and Cenovus Energy were notable underperformers. Stock prices in the energy sector were hurt by lower energy prices during the fiscal year. The Fund liquidated its positions in both Encana and Peabody Energy during the fiscal year.
Also detracting from Fund performance were United States Steel in the materials sector and CenturyLink in the telecommunication services sector. We sold our position in United States Steel during the fiscal year.
Several companies in the consumer staples sector, including Staples, Altria Group and Dr Pepper Snapple Group, delivered strong absolute returns and contributed to the Fund’s performance. During the fiscal year, Dr Pepper Snapple Group announced the company would begin a share repurchase program valued at nearly $1 billion. In addition, the company acquired assets of Davis Beverage
| Portfolio Composition |
| By sector |
Financials | 24.6 | % | ||
Utilities | 11.7 | |||
Consumer Staples | 11.4 | |||
Information Technology | 10.6 | |||
Consumer Discretionary | 10.2 | |||
Energy | 9.4 | |||
Health Care | 7.8 | |||
Industrials | 5.2 | |||
Telecommunication Services | 4.6 | |||
Materials | 3.1 | |||
U.S. Treasury Bills, Plus Money Market Funds, Plus Other Assets Less Liabilities | | 1.4 | |
| Top 10 Equity Holdings* |
1. | Altria Group, Inc. | 2.0 | % | |||
2. | Digital Realty Trust, Inc. | 2.0 | ||||
3. | Dr Pepper Snapple Group, Inc. | 2.0 | ||||
4. | PG&E Corp. | 1.9 | ||||
5. | Pfizer Inc. | 1.9 | ||||
6. | Cisco Systems, Inc. | 1.9 | ||||
7. | Archer-Daniels-Midland Co. | 1.9 | ||||
8. | Annaly Capital Management Inc. | 1.8 | ||||
9. | Darden Restaurants, Inc. | 1.8 | ||||
10. | Entergy Corp. | 1.8 |
Total Net Assets | $ | 284.7 million | | |
Total Number of Holdings* | | 128 | |
The Fund’s holdings are subject to change, and there is no assurance that the Fund will continue to hold any particular security.
*Excluding money market fund holdings.
| 4 Invesco Low Volatility Equity Yield Fund |
Group and Davis Bottling (not Fund holdings). We sold our position in Staples during the fiscal year.
In addition, stock selection in the utilities sector was a contributor to the Fund’s absolute and relative performance, and the Fund benefited from its overweight allocation to the sector.
The Fund uses a quantitative method of investing and focuses on four investment concepts that make up its stock selection model – Earnings Expectations, Market Sentiment, Management and Quality, and Value. During the fiscal year, investors appeared to be temporarily chasing after securities with strong growth characteristics because of concerns over slowing economic expansion and decelerating corporate earnings growth. In a low growth environment, investors seemed willing to pay a premium for growth. This type of environment was a drag on Fund performance because the Fund tends to favor more value and quality characteristics. The Fund’s stock selection model does not favor growth stocks because we believe the rewards tend to be short-lived. Within the Fund’s stock selection model, Earnings Expectations and Market Sentiment concepts were positive predictors of returns given their correlation to growth. The Value and Management and Quality concepts struggled, however, due to their focus on stable, attractively valued stocks. In addition, one of the Fund’s objective of income put a damper on performance. Over the fiscal year, higher dividend paying stocks lagged by a significant margin to stocks that paid low to no dividends.
Please note that the Fund’s strategy is principally implemented through equity investments, but the Fund also may use S&P 500 futures contracts, a derivative instrument, to gain exposure to the equity market. During the fiscal year, the Fund invested in S&P 500 futures contracts, which generated a negative return and were a slight detractor from Fund performance. Derivatives can be a cost-effective way to gain exposure to asset classes. However, derivatives may amplify traditional investment risks through the creation of leverage and may be less liquid than traditional securities.
We welcome new investors who joined the Fund during the fiscal year and thank all our shareholders for their investment in Invesco Low Volatility Equity Yield Fund.
The views and opinions expressed in management’s discussion of Fund performance are those of Invesco Advisers, Inc. These views and opinions are subject to change at any time based on factors such as market and economic conditions. These views and opinions may not be relied upon as investment advice or recommendations, or as an offer for a particular security. The information is not a complete analysis of every aspect of any market, country, industry, security or the Fund. Statements of fact are from sources considered reliable, but Invesco Advisers, Inc. makes no representation or warranty as to their completeness or accuracy. Although historical performance is no guarantee of future results, these insights may help you understand our investment management philosophy.
See important Fund and, if applicable, index disclosures later in this report.
| Michael Abata Chartered Financial Analyst, Portfolio Manager, is manager of Invesco Low Volatility Equity Yield | |
Fund. He joined Invesco in 2011. Mr. Abata earned a BA in economics from Binghamton University.
| ||
 | Charlie Ko Chartered Financial Analyst, Portfolio Manager, is manager of Invesco Low Volatility Equity Yield | |
Fund. He joined Invesco in 2012. Mr. Ko earned a BS from MIT and an MBA from Yale University.
| ||
 | Anthony Munchak Chartered Financial Analyst, Portfolio Manager, is manager of Invesco Low Volatility Equity Yield | |
Fund. He joined Invesco in 2000. Mr. Munchak earned a BS and an MS in finance from Boston College and an MBA from Bentley College.
| ||
 | Glen Murphy Chartered Financial Analyst, Portfolio Manager, is manager of Invesco Low Volatility Equity Yield | |
Fund. He joined Invesco in 1995. Mr. Murphy earned a BA in business administration from the University of Massachusetts Amherst and an MS in finance from Boston College.
| ||
 | Francis Orlando Chartered Financial Analyst, Portfolio Manager, is manager of Invesco Low Volatility Equity Yield | |
Fund. He joined Invesco in 1987. Mr. Orlando earned a BA in business administration from Merrimack College and an MBA from Boston University.
| ||
 | Andrew Waisburd Portfolio Manager, is manager of Invesco Low Volatility Equity Yield Fund. He joined Invesco in 2008. | |
| Mr. Waisburd earned a BS in statistics from Cornell University and an MS and a PhD in finance from Indiana University. | ||

5 Invesco Low Volatility Equity Yield Fund
Your Fund’s Long-Term Performance
Results of a $10,000 Investment – Oldest Share Class(es) since Inception
Fund and index data from 3/31/06
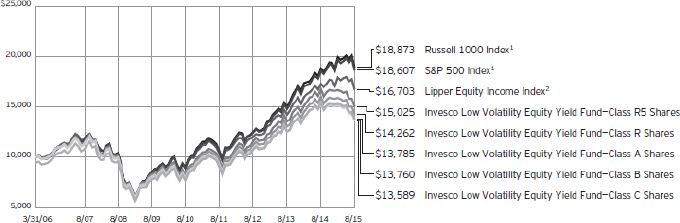
| 1 | Source: FactSet Research Systems Inc. |
| 2 | Source: Lipper Inc. |
Past performance cannot guarantee comparable future results.
The data shown in the chart include reinvested distributions, applicable sales charges and Fund expenses including management fees. Results for Class B shares are calculated as if a hypothetical
shareholder had liquidated his entire investment in the Fund at the close of the reporting period and paid the contingent deferred sales charges, if applicable. Index results include reinvested dividends, but they do not reflect sales charges. Performance of the peer group,
if applicable, reflects fund expenses and management fees; performance of a market index does not. Performance shown in the chart and table(s) does not reflect deduction of taxes a shareholder would pay on Fund distributions or sale of Fund shares.
continued from page 8
Other information
| n | The returns shown in management’s discussion of Fund performance are based on net asset values (NAVs) calculated for shareholder transactions. Generally accepted accounting principles require adjustments to be made to the net assets of the Fund at period end for financial reporting purposes, and as such, the NAVs for shareholder transactions and the returns based on those NAVs may differ from the NAVs and returns reported in the Financial Highlights. |
| n | Industry classifications used in this report are generally according to the Global Industry Classification Standard, which was developed by and is the exclusive property and a service mark of MSCI Inc. and Standard & Poor’s. |
6 Invesco Low Volatility Equity Yield Fund
Average Annual Total Returns |
| |||
| As of 8/31/15, including maximum applicable sales charges | ||||
Class A Shares | ||||
Inception (3/31/06) | 3.47 | % | ||
5 Years | 11.09 | |||
1 Year | -15.60 | |||
Class B Shares | ||||
Inception (3/31/06) | 3.45 | % | ||
5 Years | 11.28 | |||
1 Year | -15.41 | |||
Class C Shares | ||||
Inception (3/31/06) | 3.31 | % | ||
5 Years | 11.49 | |||
1 Year | -12.17 | |||
Class R Shares | ||||
Inception (3/31/06) | 3.84 | % | ||
5 Years | 12.07 | |||
1 Year | -10.93 | |||
Class Y Shares | ||||
Inception | 4.30 | % | ||
5 Years | 12.65 | |||
1 Year | -10.43 | �� | ||
Investor Class Shares | ||||
Inception | 4.10 | % | ||
5 Years | 12.32 | |||
1 Year | -10.76 | |||
Class R5 Shares | ||||
Inception (3/31/06) | 4.42 | % | ||
5 Years | 12.75 | |||
1 Year | -10.35 | |||
Average Annual Total Returns |
| |||
| As of 6/30/15, the most recent calendar quarter end, including maximum applicable sales charges | ||||
Class A Shares | ||||
Inception (3/31/06) | 4.11 | % | ||
5 Years | 12.35 | |||
1 Year | -9.51 | |||
Class B Shares | ||||
Inception (3/31/06) | 4.09 | % | ||
5 Years | 12.53 | |||
1 Year | -9.27 | |||
Class C Shares | ||||
Inception (3/31/06) | 3.96 | % | ||
5 Years | 12.75 | |||
1 Year | -5.87 | |||
Class R Shares | ||||
Inception (3/31/06) | 4.50 | % | ||
5 Years | 13.32 | |||
1 Year | -4.54 | |||
Class Y Shares | ||||
Inception | 4.96 | % | ||
5 Years | 13.90 | |||
1 Year | -4.07 | |||
Investor Class Shares | ||||
Inception | 4.76 | % | ||
5 Years | 13.60 | |||
1 Year | -4.32 | |||
Class R5 Shares | ||||
Inception (3/31/06) | 5.07 | % | ||
5 Years | 13.97 | |||
1 Year | -3.92 | |||
Class Y shares incepted on October 3, 2008. Performance shown prior to that date is that of Class A shares and includes the 12b-1 fees applicable to Class A shares.
Investor Class shares incepted on April 25, 2008. Performance shown prior to that date is that of Class A shares and includes the 12b-1 fees applicable to Class A shares.
The performance data quoted represent past performance and cannot guarantee comparable future results; current performance may be lower or higher. Please visit invesco.com/performance for the most recent month-end performance. Performance figures reflect reinvested distributions, changes in net asset value and the effect of the maximum sales charge unless otherwise stated. Performance figures do not reflect deduction of taxes a shareholder would pay on Fund distributions or sale of
Fund shares. Investment return and principal value will fluctuate so that you may have a gain or loss when you sell shares.
The total annual Fund operating expense ratio set forth in the most recent Fund prospectus as of the date of this report for Class A, Class B, Class C, Class R, Class Y, Investor Class and Class R5 shares was 1.14%, 1.89%, 1.89%, 1.39%, 0.89%, 1.14% and 0.75%, respectively. The expense ratios presented above may vary from the expense ratios presented in other sections of this report that are based on expenses incurred during the period covered by this report.
Class A share performance reflects the maximum 5.50% sales charge, and Class B and Class C share performance reflects the applicable contingent deferred sales charge (CDSC) for the period involved. The CDSC on Class B shares declines from 5% beginning at
the time of purchase to 0% at the beginning of the seventh year. The CDSC on Class C shares is 1% for the first year after purchase. Class R, Class Y, Investor Class and Class R5 shares do not have a front-end sales charge or a CDSC; therefore, performance is at net asset value.
The performance of the Fund’s share classes will differ primarily due to different sales charge structures and class expenses.
Fund performance reflects any applicable fee waivers and/or expense reimbursements. Had the adviser not waived fees and/or reimbursed expenses currently or in the past, returns would have been lower. See current prospectus for more information.
7 Invesco Low Volatility Equity Yield Fund
Invesco Low Volatility Equity Yield Fund’s investment objective is income and long-term growth of capital.
| n | Unless otherwise stated, information presented in this report is as of August 31, 2015, and is based on total net assets. |
| n | Unless otherwise noted, all data provided by Invesco. |
| n | To access your Fund’s reports/prospectus, visit invesco.com/fundreports. |
About share classes
| n | Class B shares may not be purchased for new or additional investments. Please see the prospectus for more information. |
| n | Class R shares are generally available only to employer sponsored retirement and benefit plans. Please see the prospectus for more information. |
| n | Class Y shares are available only to certain investors. Please see the prospectus for more information. |
| n | Investor Class shares are closed to new investors. Contact your financial adviser about purchasing our other share classes. Please see the prospectus for more information. |
| n | Class R5 shares are primarily intended for employer sponsored retirement and benefit plans that meet certain standards and for institutional investors. Please see the prospectus for more information. |
Principal risks of investing in the Fund
| n | Active trading risk. The Fund engages in frequent trading of portfolio securities. Active trading results in added expenses and may result in a lower return and increased tax liability. |
| n | Depositary receipts risk. Depositary receipts involve many of the same risks as those associated with direct investment in foreign securities. In addition, the underlying issuers of certain depositary receipts, particularly unsponsored or unregistered depositary receipts, are under no obligation to distribute shareholder communications to the holders of such receipts or to pass through to them any voting rights with respect to the deposited securities. |
| n | Derivatives risk. The value of a derivative instrument depends largely on (and is derived from) the value of an underlying security, currency, commodity, interest rate, index or other asset (each referred to as an underlying asset). In addition to risks relating to the underlying assets, the use of deriv- |
| atives may include other, possibly greater, risks, including counterparty, leverage and liquidity risks. Counter-party risk is the risk that the counter-party to the derivative contract will default on its obligation to pay the Fund the amount owed or otherwise perform under the derivative contract. Derivatives create leverage risk because they do not require payment up front equal to the economic exposure created by owning the derivative. As a result, an adverse change in the value of the underlying asset could result in the Fund sustaining a loss that is substantially greater than the amount invested in the derivative, which may make the Fund’s returns more volatile and increase the risk of loss. Derivative instruments may also be less liquid than more traditional investments and the Fund may be unable to sell or close out its derivative positions at a desirable time or price. This risk may be more acute under adverse market conditions, during which the Fund may be most in need of liquidating its derivative positions. Derivatives may also be harder to value, less tax efficient and subject to changing government regulation that could impact the Fund’s ability to use certain derivatives or their cost. Also, derivatives used for hedging or to gain or limit exposure to a particular market segment may not provide the expected benefits, particularly during adverse market conditions. |
| n | Foreign securities risk. The Fund’s foreign investments may be affected by changes in a foreign country’s exchange rates, political and social instability, changes in economic or taxation policies, difficulties when enforcing obligations, decreased liquidity, and increased volatility. Foreign companies may be subject to less regulation resulting in less publicly available information about the companies. |
| n | Management risk. The investment techniques and risk analysis used by the Fund’s portfolio managers may not produce the desired results. |
This report must be accompanied or preceded by a currently effective Fund prospectus, which contains more complete information, including sales charges and expenses. Investors should read it carefully before investing.
NOT FDIC INSURED | MAY LOSE VALUE | NO BANK GUARANTEE |
| n | Market risk. The prices of and the income generated by the Fund’s securities may decline in response to, among other things, investor sentiment, general economic and market conditions, regional or global instability, and currency and interest rate fluctuations. |
| n | Real estate investment trust (REIT) risk/real estate risk. Investments in real estate related instruments may be affected by economic, legal, cultural, environmental or technological factors that affect property values, rents or occupancies of real estate related to the Fund’s holdings. Shares of real estate related companies, which tend to be small- and mid-cap companies, may be more volatile and less liquid. |
About indexes used in this report
| n | The S&P 500® Index is an unmanaged index considered representative of the US stock market. |
| n | The Russell 1000® Index is an unmanaged index considered representative of large-cap stocks. The Russell 1000 Index is a trademark/service mark of the Frank Russell Co. Russell® is a trademark of the Frank Russell Co. |
| n | The Lipper Equity Income Funds Index is an unmanaged Index considered representative of equity income funds tracked by Lipper. |
| n | The Fund is not managed to track the performance of any particular index, including the index(es) described here, and consequently, the performance of the Fund may deviate significantly from the performance of the index(es). |
| n | A direct investment cannot be made in an index. Unless otherwise indicated, index results include reinvested dividends, and they do not reflect sales charges. Performance of the peer group, if applicable, reflects fund expenses; performance of a market index does not. |
continued on page 6
8 Invesco Low Volatility Equity Yield Fund
Schedule of Investments(a)
August 31, 2015
| Shares | Value | |||||||
Common Stocks & Other Equity Interests–98.61% |
| |||||||
| Aerospace & Defense–0.38% | ||||||||
Huntington Ingalls Industries, Inc. | 9,500 | $ | 1,069,510 | |||||
| Agricultural Products–3.35% | ||||||||
Archer-Daniels-Midland Co. | 118,900 | 5,349,311 | ||||||
Bunge Ltd. | 58,000 | 4,202,100 | ||||||
| 9,551,411 | ||||||||
| Apparel Retail–0.64% | ||||||||
Abercrombie & Fitch Co.–Class A(b) | 64,800 | 1,286,928 | ||||||
Guess?, Inc. | 24,400 | 539,484 | ||||||
| 1,826,412 | ||||||||
| Apparel, Accessories & Luxury Goods–1.44% | ||||||||
Coach, Inc. | 135,600 | 4,101,900 | ||||||
| Biotechnology–2.07% | ||||||||
PDL BioPharma Inc.(b) | 264,000 | 1,491,600 | ||||||
United Therapeutics Corp.(c) | 29,250 | 4,405,635 | ||||||
| 5,897,235 | ||||||||
| Broadcasting–0.14% | ||||||||
TEGNA Inc. | 17,000 | 404,430 | ||||||
| Coal & Consumable Fuels–0.11% | ||||||||
Cameco Corp. (Canada) | 22,300 | 313,538 | ||||||
| Commercial Printing–0.63% | ||||||||
R. R. Donnelley & Sons Co. | 113,600 | 1,783,520 | ||||||
| Commodity Chemicals–1.38% | ||||||||
LyondellBasell Industries N.V.–Class A | 46,100 | 3,936,018 | ||||||
| Communications Equipment–2.45% | ||||||||
Cisco Systems, Inc. | 208,200 | 5,388,216 | ||||||
InterDigital, Inc. | 23,600 | 1,167,492 | ||||||
Polycom, Inc.(c) | 39,000 | 419,640 | ||||||
| 6,975,348 | ||||||||
| Computer & Electronics Retail–0.10% | ||||||||
Rent-A-Center, Inc. | 10,600 | 285,034 | ||||||
| Consumer Finance–0.33% | ||||||||
Navient Corp. | 73,100 | 934,949 | ||||||
| Data Processing & Outsourced Services–1.30% | ||||||||
Western Union Co. (The) | 200,400 | 3,695,376 | ||||||
| Department Stores–1.32% | ||||||||
Kohl’s Corp. | 73,600 | 3,755,808 | ||||||
| Diversified Banks–0.53% | ||||||||
Citigroup Inc. | 28,400 | 1,518,832 | ||||||
| Diversified REIT’s–0.15% | ||||||||
Liberty Property Trust | 14,400 | 442,656 | ||||||
| Shares | Value | |||||||
| Diversified Support Services–0.10% | ||||||||
Ritchie Bros. Auctioneers Inc. (Canada) | 10,000 | $ | 275,800 | |||||
| Drug Retail–0.39% | ||||||||
CVS Health Corp. | 10,900 | 1,116,160 | ||||||
| Electric Utilities–4.58% | ||||||||
Entergy Corp. | 76,300 | 4,984,679 | ||||||
Exelon Corp. | 161,400 | 4,964,664 | ||||||
FirstEnergy Corp. | 97,000 | 3,100,120 | ||||||
| 13,049,463 | ||||||||
| Electrical Components & Equipment–0.20% | ||||||||
General Cable Corp. | 38,300 | 557,265 | ||||||
| Environmental & Facilities Services–0.56% | ||||||||
Waste Management, Inc. | 31,700 | 1,586,902 | ||||||
| Fertilizers & Agricultural Chemicals–0.27% | ||||||||
Potash Corp. of Saskatchewan Inc. (Canada) | 29,200 | 759,200 | ||||||
| Footwear–1.39% | ||||||||
Skechers U.S.A., Inc.–Class A(c) | 28,100 | 3,954,794 | ||||||
| Gas Utilities–1.53% | ||||||||
AGL Resources Inc. | 48,000 | 2,927,520 | ||||||
National Fuel Gas Co. | 8,200 | 442,472 | ||||||
New Jersey Resources Corp. | 35,300 | 997,931 | ||||||
| 4,367,923 | ||||||||
| General Merchandise Stores–1.68% | ||||||||
Target Corp. | 61,500 | 4,779,165 | ||||||
| Gold–1.21% | ||||||||
Newmont Mining Corp. | 202,300 | 3,453,261 | ||||||
| Health Care Distributors–2.31% | ||||||||
AmerisourceBergen Corp. | 42,400 | 4,241,696 | ||||||
Cardinal Health, Inc. | 28,300 | 2,328,241 | ||||||
| 6,569,937 | ||||||||
| Health Care REIT’s–3.73% | ||||||||
Care Capital Properties, Inc.(c) | 2,875 | 91,396 | ||||||
HCP, Inc. | 126,900 | 4,702,914 | ||||||
Healthcare Trust of America, Inc.–Class A | 34,900 | 837,949 | ||||||
Medical Properties Trust Inc. | 130,100 | 1,518,267 | ||||||
National Health Investors, Inc. | 14,600 | 804,460 | ||||||
Senior Housing Properties Trust | 130,000 | 2,041,000 | ||||||
Ventas, Inc. | 11,500 | 632,730 | ||||||
| 10,628,716 | ||||||||
| Health Care Services–0.15% | ||||||||
Premier Inc.–Class A(c) | 12,100 | 431,365 | ||||||
| Home Furnishings–0.24% | ||||||||
Tempur Sealy International, Inc.(c) | 9,400 | 686,388 | ||||||
See accompanying Notes to Financial Statements which are an integral part of the financial statements.
9 Invesco Low Volatility Equity Yield Fund
| Shares | Value | |||||||
| Hotel and Resort REIT’s–0.82% | ||||||||
Hospitality Properties Trust | 71,200 | $ | 1,831,264 | |||||
RLJ Lodging Trust | 18,400 | 506,736 | ||||||
| 2,338,000 | ||||||||
| Industrial Conglomerates–1.50% | ||||||||
General Electric Co. | 172,100 | 4,271,522 | ||||||
| Integrated Oil & Gas–1.81% | ||||||||
Cenovus Energy Inc. (Canada) | 142,900 | 2,067,763 | ||||||
Suncor Energy, Inc. (Canada) | 108,900 | 3,075,336 | ||||||
| 5,143,099 | ||||||||
| Integrated Telecommunication Services–4.51% | ||||||||
AT&T Inc. | 22,600 | 750,320 | ||||||
BCE Inc. (Canada) | 70,700 | 2,859,108 | ||||||
CenturyLink Inc. | 162,400 | 4,391,296 | ||||||
Verizon Communications Inc. | 95,700 | 4,403,157 | ||||||
Windstream Holdings Inc.(b) | 60,500 | 434,995 | ||||||
| 12,838,876 | ||||||||
| Internet Software & Services–0.29% | ||||||||
IAC/InterActiveCorp | 11,900 | 830,620 | ||||||
| IT Consulting & Other Services–0.55% | ||||||||
Leidos Holdings, Inc. | 37,400 | 1,573,792 | ||||||
| Leisure Facilities–0.57% | ||||||||
Six Flags Entertainment Corp. | 35,900 | 1,614,423 | ||||||
| Leisure Products–0.97% | ||||||||
Hasbro, Inc. | 37,000 | 2,759,830 | ||||||
| Life & Health Insurance–0.29% | ||||||||
Sun Life Financial Inc. (Canada)(b) | 26,000 | 828,620 | ||||||
| Managed Health Care–1.33% | ||||||||
Molina Healthcare, Inc.(c) | 50,700 | 3,781,713 | ||||||
| Mortgage REIT’s–5.37% | ||||||||
Annaly Capital Management Inc. | 506,700 | 5,097,402 | ||||||
Chimera Investment Corp. | 24,000 | 336,240 | ||||||
CYS Investments, Inc. | 208,600 | 1,629,166 | ||||||
Hatteras Financial Corp. | 69,500 | 1,127,985 | ||||||
MFA Financial, Inc. | 364,800 | 2,593,728 | ||||||
Starwood Property Trust, Inc. | 104,500 | 2,223,760 | ||||||
Two Harbors Investment Corp. | 242,700 | 2,295,942 | ||||||
| 15,304,223 | ||||||||
| Multi-Utilities–5.60% | ||||||||
Ameren Corp. | 57,700 | 2,324,733 | ||||||
Consolidated Edison, Inc. | 21,800 | 1,371,438 | ||||||
PG&E Corp. | 110,000 | 5,453,800 | ||||||
Public Service Enterprise Group Inc. | 89,200 | 3,590,300 | ||||||
TECO Energy, Inc. | 152,300 | 3,208,961 | ||||||
| 15,949,232 | ||||||||
| Office REIT’s–1.21% | ||||||||
Alexandria Real Estate Equities, Inc. | 20,800 | 1,788,592 | ||||||
| Shares | Value | |||||||
| Office REIT’s–(continued) | ||||||||
Highwoods Properties, Inc. | 6,000 | $ | 227,640 | |||||
Piedmont Office Realty Trust Inc.–Class A | 84,300 | 1,429,728 | ||||||
| 3,445,960 | ||||||||
| Office Services & Supplies–1.53% | ||||||||
Pitney Bowes Inc. | 203,400 | 4,029,354 | ||||||
West Corp. | 13,000 | 316,420 | ||||||
| 4,345,774 | ||||||||
| Oil & Gas Drilling–1.55% | ||||||||
Noble Corp. PLC(b) | 337,900 | 4,399,458 | ||||||
| Oil & Gas Equipment & Services–0.30% | ||||||||
Superior Energy Services, Inc. | 53,000 | 843,230 | ||||||
| Oil & Gas Exploration & Production–1.81% | ||||||||
Baytex Energy Corp. (Canada) | 18,400 | 106,168 | ||||||
California Resources Corp. | 77,100 | 299,148 | ||||||
Canadian Natural Resources Ltd. (Canada) | 38,100 | 856,107 | ||||||
Crescent Point Energy Corp. (Canada)(b) | 43,900 | 561,042 | ||||||
Denbury Resources Inc.(b) | 543,800 | 2,360,092 | ||||||
Enerplus Corp. (Canada)(b) | 151,900 | 963,046 | ||||||
| 5,145,603 | ||||||||
| Oil & Gas Refining & Marketing–3.84% | ||||||||
CVR Energy, Inc.(b) | 36,400 | 1,463,644 | ||||||
Tesoro Corp. | 30,900 | 2,843,109 | ||||||
Valero Energy Corp. | 83,700 | 4,966,758 | ||||||
Western Refining, Inc. | 38,800 | 1,669,176 | ||||||
| 10,942,687 | ||||||||
| Packaged Foods & Meats–3.76% | ||||||||
ConAgra Foods, Inc. | 88,500 | 3,688,680 | ||||||
Dean Foods Co. | 128,500 | 2,115,110 | ||||||
Pilgrim’s Pride Corp.(b) | 187,500 | 3,932,813 | ||||||
Pinnacle Foods Inc. | 11,100 | 497,724 | ||||||
Sanderson Farms, Inc.(b) | 6,700 | 462,568 | ||||||
| 10,696,895 | ||||||||
| Paper Packaging–0.22% | ||||||||
Avery Dennison Corp. | 10,600 | 615,648 | ||||||
| Pharmaceuticals–1.90% | ||||||||
Pfizer Inc. | 168,100 | 5,416,182 | ||||||
| Property & Casualty Insurance–1.48% | ||||||||
AmTrust Financial Services, Inc. | 19,000 | 1,104,850 | ||||||
Assured Guaranty Ltd. | 123,500 | 3,119,610 | ||||||
| 4,224,460 | ||||||||
| Regional Banks–1.20% | ||||||||
CIT Group, Inc. | 24,100 | 1,046,904 | ||||||
Commerce Bancshares, Inc. | 7,500 | 336,075 | ||||||
SunTrust Banks, Inc. | 50,400 | 2,034,648 | ||||||
| 3,417,627 | ||||||||
See accompanying Notes to Financial Statements which are an integral part of the financial statements.
10 Invesco Low Volatility Equity Yield Fund
| Shares | Value | |||||||
| Reinsurance–0.88% | ||||||||
Everest Re Group, Ltd. | 4,250 | $ | 747,192 | |||||
PartnerRe Ltd. | 5,900 | 816,619 | ||||||
Validus Holdings, Ltd. | 21,200 | 938,736 | ||||||
| 2,502,547 | ||||||||
| Residential REIT’s–1.94% | ||||||||
Equity Lifestyle Properties, Inc. | 17,700 | 986,952 | ||||||
Equity Residential | 63,800 | 4,545,750 | ||||||
| 5,532,702 | ||||||||
| Restaurants–1.77% | ||||||||
Darden Restaurants, Inc. | 74,300 | 5,053,143 | ||||||
| Retail REIT’s–1.76% | ||||||||
CBL & Associates Properties, Inc. | 99,800 | 1,485,024 | ||||||
Kimco Realty Corp. | 46,400 | 1,069,520 | ||||||
Regency Centers Corp. | 34,500 | 2,046,195 | ||||||
Urban Edge Properties | 20,000 | 418,200 | ||||||
| 5,018,939 | ||||||||
| Semiconductors–1.53% | ||||||||
Intel Corp. | 152,200 | 4,343,788 | ||||||
| Soft Drinks–1.95% | ||||||||
Dr Pepper Snapple Group, Inc. | 72,200 | 5,539,906 | ||||||
| Specialized REIT’s–4.04% | ||||||||
Communications Sales & Leasing, Inc. | 117,160 | 2,354,916 | ||||||
Corrections Corp. of America | 27,700 | 813,826 | ||||||
Digital Realty Trust, Inc. | 88,000 | 5,572,160 | ||||||
Geo Group Inc. (The) | 28,000 | 840,840 | ||||||
Lamar Advertising Co.–Class A | 36,200 | 1,930,908 | ||||||
| 11,512,650 | ||||||||
| Systems Software–0.39% | ||||||||
CA, Inc. | 40,300 | 1,099,787 | ||||||
| Technology Hardware, Storage & Peripherals–4.11% | ||||||||
Apple Inc. | 39,000 | 4,397,640 | ||||||
Lexmark International, Inc.–Class A | 86,500 | 2,593,270 | ||||||
| Shares | Value | |||||||
| Technology Hardware, Storage & Peripherals–(continued) | ||||||||
NetApp, Inc. | 147,200 | $ | 4,704,512 | |||||
| 11,695,422 | ||||||||
| Thrifts & Mortgage Finance–1.13% | ||||||||
New York Community Bancorp, Inc. | 182,700 | 3,226,482 | ||||||
| Tobacco–1.99% | ||||||||
Altria Group, Inc. | 105,900 | 5,674,122 | ||||||
| Wireless Telecommunication Services–0.05% | ||||||||
Rogers Communications, Inc.–Class B (Canada) | 4,400 | 150,128 | ||||||
Total Common Stocks & Other Equity Interests (Cost $292,139,092) |
| 280,785,406 | ||||||
| Principal Amount | ||||||||
U.S. Treasury Bills–0.24% |
| |||||||
0.09%, 09/10/15 | $ | 700,000 | 699,998 | |||||
| Shares | ||||||||
Money Market Funds–1.06% |
| |||||||
Liquid Assets Portfolio–Institutional Class, 0.12%(f) | 1,508,439 | 1,508,439 | ||||||
Premier Portfolio–Institutional Class, 0.09%(f) | 1,508,440 | 1,508,440 | ||||||
Total Money Market Funds (Cost $3,016,879) | 3,016,879 | |||||||
TOTAL INVESTMENTS (excluding investments purchased with cash collateral from securities on loan)–99.91% (Cost $295,855,955) |
| 284,502,283 | ||||||
Investments Purchased with Cash Collateral from Securities on Loan |
| |||||||
Money Market Funds–3.69% | ||||||||
Liquid Assets Portfolio–Institutional Class, 0.12% (Cost $10,500,630)(f)(g) | 10,500,630 | 10,500,630 | ||||||
TOTAL INVESTMENTS–103.60% |
| 295,002,913 | ||||||
OTHER ASSETS LESS LIABILITIES–(3.60)% |
| (10,261,217 | ) | |||||
NET ASSETS–100.00% |
| $ | 284,741,696 | |||||
Investment Abbreviations:
| REIT | – Real Estate Investment Trust |
Notes to Schedule of Investments:
| (a) | Industry and/or sector classifications used in this report are generally according to the Global Industry Classification Standard, which was developed by and is the exclusive property and a service mark of MSCI Inc. and Standard & Poor’s. |
| (b) | All or a portion of this security was out on loan at August 31, 2015. |
| (c) | Non-income producing security. |
| (d) | Security traded on a discount basis. The interest rate shown represents the discount rate at the time of purchase by the Fund. |
| (e) | All or a portion of the value was pledged as collateral to cover margin requirements for open futures contracts. See Note 1J and Note 4. |
| (f) | The money market fund and the Fund are affiliated by having the same investment adviser. The rate shown is the 7-day SEC standardized yield as of August 31, 2015. |
| (g) | The security has been segregated to satisfy the commitment to return the cash collateral received in securities lending transactions upon the borrower’s return of the securities loaned. See Note 1I. The following table presents the Fund’s gross and net amount of assets available for offset by the Fund as of August 31, 2015. |
| Counterparty | Gross Amount of Securities on Loan at Value | Cash Collateral Received for Securities Loaned* | Net Amount | |||||||||
State Street Bank and Trust Co. | $ | 10,409,335 | $ | (10,409,335 | ) | $ | — | |||||
| * | Amount does not include excess collateral received. |
See accompanying Notes to Financial Statements which are an integral part of the financial statements.
11 Invesco Low Volatility Equity Yield Fund
Statement of Assets and Liabilities
August 31, 2015
Assets: | ||||
Investments, at value (Cost $292,839,076)* | $ | 281,485,404 | ||
Investments in affiliated money market funds, at value and cost | 13,517,509 | |||
Total investments, at value (Cost $306,356,585) | 295,002,913 | |||
Receivable for: | ||||
Fund shares sold | 43,568 | |||
Dividends | 750,256 | |||
Investment for trustee deferred compensation and retirement plans | 207,192 | |||
Other assets | 33,412 | |||
Total assets | 296,037,341 | |||
Liabilities: | ||||
Payable for: | ||||
Fund shares reacquired | 291,929 | |||
Collateral upon return of securities loaned | 10,500,629 | |||
Variation margin — futures | 35,412 | |||
Accrued fees to affiliates | 201,707 | |||
Accrued trustees’ and officers’ fees and benefits | 3,447 | |||
Accrued other operating expenses | 35,874 | |||
Trustee deferred compensation and retirement plans | 226,647 | |||
Total liabilities | 11,295,645 | |||
Net assets applicable to shares outstanding | $ | 284,741,696 | ||
Net assets consist of: | ||||
Shares of beneficial interest | $ | 329,356,767 | ||
Undistributed net investment income | 2,738,304 | |||
Undistributed net realized gain (loss) | (35,811,712 | ) | ||
Net unrealized appreciation (depreciation) | (11,541,663 | ) | ||
| $ | 284,741,696 | |||
Net Assets: | ||||
Class A | $ | 177,738,732 | ||
Class B | $ | 5,252,538 | ||
Class C | $ | 29,959,292 | ||
Class R | $ | 170,446 | ||
Class Y | $ | 4,860,603 | ||
Investor Class | $ | 52,879,501 | ||
Class R5 | $ | 13,880,584 | ||
Shares outstanding, $0.01 par value per share, |
| |||
Class A | 18,906,149 | |||
Class B | 566,956 | |||
Class C | 3,241,798 | |||
Class R | 18,222 | |||
Class Y | 514,589 | |||
Investor Class | 5,605,555 | |||
Class R5 | 1,467,316 | |||
Class A: | ||||
Net asset value per share | $ | 9.40 | ||
Maximum offering price per share | ||||
(Net asset value of $9.40 ¸ 94.50%) | $ | 9.95 | ||
Class B: | ||||
Net asset value and offering price per share | $ | 9.26 | ||
Class C: | ||||
Net asset value and offering price per share | $ | 9.24 | ||
Class R: | ||||
Net asset value and offering price per share | $ | 9.35 | ||
Class Y: | ||||
Net asset value and offering price per share | $ | 9.45 | ||
Investor Class: | ||||
Net asset value and offering price per share | $ | 9.43 | ||
Class R5: | ||||
Net asset value and offering price per share | $ | 9.46 | ||
| * | At August 31, 2015, securities with an aggregate value of $10,409,335 were on loan to brokers. |
See accompanying Notes to Financial Statements which are an integral part of the financial statements.
12 Invesco Low Volatility Equity Yield Fund
Statement of Operations
For the year ended August 31, 2015
Investment income: | ||||
Dividends (net of foreign withholding taxes of $75,827) | $ | 12,029,437 | ||
Dividends from affiliated money market funds (includes securities lending income of $143,382) | 147,930 | |||
Total investment income | 12,177,367 | |||
Expenses: | ||||
Advisory fees | 1,987,944 | |||
Administrative services fees | 107,018 | |||
Custodian fees | 12,648 | |||
Distribution fees: | ||||
Class A | 520,507 | |||
Class B | 87,523 | |||
Class C | 361,610 | |||
Class R | 985 | |||
Investor Class | 151,603 | |||
Transfer agent fees — A, B, C, R, Y and Investor | 663,052 | |||
Transfer agent fees — R5 | 8,097 | |||
Trustees’ and officers’ fees and benefits | 28,183 | |||
Other | 202,360 | |||
Total expenses | 4,131,530 | |||
Less: Fees waived and expense offset arrangement(s) | (14,722 | ) | ||
Net expenses | 4,116,808 | |||
Net investment income | 8,060,559 | |||
Realized and unrealized gain (loss) from: | ||||
Net realized gain from: | ||||
Investment securities | 8,003,286 | |||
Futures contracts | 375,542 | |||
| 8,378,828 | ||||
Change in net unrealized appreciation (depreciation) of: | ||||
Investment securities | (52,140,910 | ) | ||
Futures contracts | (479,131 | ) | ||
| (52,620,041 | ) | |||
Net realized and unrealized gain (loss) | (44,241,213 | ) | ||
Net increase (decrease) in net assets resulting from operations | $ | (36,180,654 | ) | |
See accompanying Notes to Financial Statements which are an integral part of the financial statements.
13 Invesco Low Volatility Equity Yield Fund
Statement of Changes in Net Assets
For the years ended August 31, 2015 and 2014
| 2015 | 2014 | |||||||
Operations: | ||||||||
Net investment income | $ | 8,060,559 | $ | 9,377,063 | ||||
Net realized gain | 8,378,828 | 50,484,109 | ||||||
Change in net unrealized appreciation (depreciation) | (52,620,041 | ) | 11,013,580 | |||||
Net increase (decrease) in net assets resulting from operations | (36,180,654 | ) | 70,874,752 | |||||
Distributions to shareholders from net investment income: | ||||||||
Class A | (6,009,779 | ) | (5,646,913 | ) | ||||
Class B | (192,301 | ) | (254,144 | ) | ||||
Class C | (766,000 | ) | (751,282 | ) | ||||
Class R | (5,153 | ) | (4,843 | ) | ||||
Class Y | (175,638 | ) | (131,250 | ) | ||||
Investor Class | (1,748,652 | ) | (1,690,488 | ) | ||||
Class R5 | (498,712 | ) | (439,228 | ) | ||||
Total distributions from net investment income | (9,396,235 | ) | (8,918,148 | ) | ||||
Distributions to shareholders from net realized gains: | ||||||||
Class A | (16,453,349 | ) | (3,264,831 | ) | ||||
Class B | (783,284 | ) | (212,478 | ) | ||||
Class C | (2,900,697 | ) | (616,876 | ) | ||||
Class R | (12,480 | ) | (3,433 | ) | ||||
Class Y | (428,354 | ) | (68,027 | ) | ||||
Investor Class | (4,778,723 | ) | (956,050 | ) | ||||
Class R5 | (1,151,603 | ) | (215,652 | ) | ||||
Total distributions from net realized gains | (26,508,490 | ) | (5,337,347 | ) | ||||
Share transactions–net: | ||||||||
Class A | (2,198,900 | ) | (9,469,200 | ) | ||||
Class B | (4,876,741 | ) | (3,423,364 | ) | ||||
Class C | (2,365,103 | ) | (3,531,091 | ) | ||||
Class R | 3,817 | (26,497 | ) | |||||
Class Y | 674,638 | 444,728 | ||||||
Investor Class | 500,182 | (9,352,837 | ) | |||||
Class R5 | 932,506 | 877,747 | ||||||
Net increase (decrease) in net assets resulting from share transactions | (7,329,601 | ) | (24,480,514 | ) | ||||
Net increase (decrease) in net assets | (79,414,980 | ) | 32,138,743 | |||||
Net assets: | ||||||||
Beginning of year | 364,156,676 | 332,017,933 | ||||||
End of year (includes undistributed net investment income of $2,738,304 and $4,079,260, respectively) | $ | 284,741,696 | $ | 364,156,676 | ||||
Notes to Financial Statements
August 31, 2015
NOTE 1—Significant Accounting Policies
Invesco Low Volatility Equity Yield Fund (the “Fund”) is a series portfolio of AIM Counselor Series Trust (Invesco Counselor Series Trust) (the “Trust”). The Trust is a Delaware statutory trust registered under the Investment Company Act of 1940, as amended (the “1940 Act”), as an open-end series management investment company consisting of thirteen separate portfolios, each authorized to issue an unlimited number of shares of beneficial interest. The assets, liabilities and operations of each portfolio are accounted for separately. Information presented in these financial statements pertains only to the Fund. Matters affecting each portfolio or class will be voted on exclusively by the shareholders of such portfolio or class.
The Fund’s investment objective is income and long-term growth of capital.
The Fund currently consists of seven different classes of shares: Class A, Class B, Class C, Class R, Class Y, Investor Class and Class R5. Investor Class shares of the Fund are offered only to certain grandfathered investors. Class A shares are sold with a front-end sales charge unless certain
14 Invesco Low Volatility Equity Yield Fund
waiver criteria are met and under certain circumstances load waived shares may be subject to contingent deferred sales charges (“CDSC”). Class C shares are sold with a CDSC. Class R, Class Y, Investor Class and Class R5 shares are sold at net asset value. Effective November 30, 2010, new or additional investments in Class B shares are no longer permitted. Existing shareholders of Class B shares may continue to reinvest dividends and capital gains distributions in Class B shares until they convert to Class A shares. Also, shareholders in Class B shares will be able to exchange those shares for Class B shares of other Invesco Funds offering such shares until they convert to Class A shares. Generally, Class B shares will automatically convert to Class A shares on or about the month-end, which is at least eight years after the date of purchase. Redemption of Class B shares prior to the conversion date will be subject to a CDSC.
The following is a summary of the significant accounting policies followed by the Fund in the preparation of its financial statements.
| A. | Security Valuations — Securities, including restricted securities, are valued according to the following policy. |
A security listed or traded on an exchange (except convertible securities) is valued at its last sales price or official closing price as of the close of the customary trading session on the exchange where the security is principally traded, or lacking any sales or official closing price on a particular day, the security may be valued at the closing bid price on that day. Securities traded in the over-the-counter market are valued based on prices furnished by independent pricing services or market makers. When such securities are valued by an independent pricing service they may be considered fair valued. Futures contracts are valued at the final settlement price set by an exchange on which they are principally traded. Listed options are valued at the mean between the last bid and asked prices from the exchange on which they are principally traded. Options not listed on an exchange are valued by an independent source at the mean between the last bid and asked prices. For purposes of determining net asset value (“NAV”) per share, futures and option contracts generally are valued 15 minutes after the close of the customary trading session of the New York Stock Exchange (“NYSE”).
Investments in open-end and closed-end registered investment companies that do not trade on an exchange are valued at the end-of-day net asset value per share. Investments in open-end and closed-end registered investment companies that trade on an exchange are valued at the last sales price or official closing price as of the close of the customary trading session on the exchange where the security is principally traded.
Debt obligations (including convertible securities) and unlisted equities are fair valued using an evaluated quote provided by an independent pricing service. Evaluated quotes provided by the pricing service may be determined without exclusive reliance on quoted prices, and may reflect appropriate factors such as institution-size trading in similar groups of securities, developments related to specific securities, dividend rate (for unlisted equities), yield (for debt obligations), quality, type of issue, coupon rate (for debt obligations), maturity (for debt obligations), individual trading characteristics and other market data. Debt obligations are subject to interest rate and credit risks. In addition, all debt obligations involve some risk of default with respect to interest and/or principal payments.
Foreign securities’ (including foreign exchange contracts) prices are converted into U.S. dollar amounts using the applicable exchange rates as of the close of the NYSE. If market quotations are available and reliable for foreign exchange-traded equity securities, the securities will be valued at the market quotations. Because trading hours for certain foreign securities end before the close of the NYSE, closing market quotations may become unreliable. If between the time trading ends on a particular security and the close of the customary trading session on the NYSE, events occur that the Adviser determines are significant and make the closing price unreliable, the Fund may fair value the security. If the event is likely to have affected the closing price of the security, the security will be valued at fair value in good faith using procedures approved by the Board of Trustees. Adjustments to closing prices to reflect fair value may also be based on a screening process of an independent pricing service to indicate the degree of certainty, based on historical data, that the closing price in the principal market where a foreign security trades is not the current value as of the close of the NYSE. Foreign securities’ prices meeting the approved degree of certainty that the price is not reflective of current value will be priced at the indication of fair value from the independent pricing service. Multiple factors may be considered by the independent pricing service in determining adjustments to reflect fair value and may include information relating to sector indices, American Depositary Receipts and domestic and foreign index futures. Foreign securities may have additional risks including exchange rate changes, potential for sharply devalued currencies and high inflation, political and economic upheaval, the relative lack of issuer information, relatively low market liquidity and the potential lack of strict financial and accounting controls and standards.
Securities for which market prices are not provided by any of the above methods may be valued based upon quotes furnished by independent sources. The last bid price may be used to value equity securities. The mean between the last bid and asked prices is used to value debt obligations, including corporate loans.
Securities for which market quotations are not readily available or became unreliable are valued at fair value as determined in good faith by or under the supervision of the Trust’s officers following procedures approved by the Board of Trustees. Issuer specific events, market trends, bid/asked quotes of brokers and information providers and other market data may be reviewed in the course of making a good faith determination of a security’s fair value.
The Fund may invest in securities that are subject to interest rate risk, meaning the risk that the prices will generally fall as interest rates rise and, conversely, the prices will generally rise as interest rates fall. Specific securities differ in their sensitivity to changes in interest rates depending on their individual characteristics. Changes in interest rates may result in increased market volatility, which may affect the value and/or liquidity of certain Fund investments.
Valuations change in response to many factors including the historical and prospective earnings of the issuer, the value of the issuer’s assets, general economic conditions, interest rates, investor perceptions and market liquidity. Because of the inherent uncertainties of valuation, the values reflected in the financial statements may materially differ from the value received upon actual sale of those investments.
| B. | Securities Transactions and Investment Income — Securities transactions are accounted for on a trade date basis. Realized gains or losses on sales are computed on the basis of specific identification of the securities sold. Interest income (net of withholding tax, if any) is recorded on the accrual basis from settlement date. Dividend income (net of withholding tax, if any) is recorded on the ex-dividend date. Bond premiums and discounts are amortized and/or accreted for financial reporting purposes. |
The Fund may periodically participate in litigation related to Fund investments. As such, the Fund may receive proceeds from litigation settlements. Any proceeds received are included in the Statement of Operations as realized gain (loss) for investments no longer held and as unrealized gain (loss) for investments still held.
Brokerage commissions and mark ups are considered transaction costs and are recorded as an increase to the cost basis of securities purchased and/or a reduction of proceeds on a sale of securities. Such transaction costs are included in the determination of net realized and
15 Invesco Low Volatility Equity Yield Fund
unrealized gain (loss) from investment securities reported in the Statement of Operations and the Statement of Changes in Net Assets and the net realized and unrealized gains (losses) on securities per share in the Financial Highlights. Transaction costs are included in the calculation of the Fund’s net asset value and, accordingly, they reduce the Fund’s total returns. These transaction costs are not considered operating expenses and are not reflected in net investment income reported in the Statement of Operations and the Statement of Changes in Net Assets, or the net investment income per share and the ratios of expenses and net investment income reported in the Financial Highlights, nor are they limited by any expense limitation arrangements between the Fund and the investment adviser.
The Fund allocates income and realized and unrealized capital gains and losses to a class based on the relative net assets of each class.
| C. | Country Determination — For the purposes of making investment selection decisions and presentation in the Schedule of Investments, the investment adviser may determine the country in which an issuer is located and/or credit risk exposure based on various factors. These factors include the laws of the country under which the issuer is organized, where the issuer maintains a principal office, the country in which the issuer derives 50% or more of its total revenues and the country that has the primary market for the issuer’s securities, as well as other criteria. Among the other criteria that may be evaluated for making this determination are the country in which the issuer maintains 50% or more of its assets, the type of security, financial guarantees and enhancements, the nature of the collateral and the sponsor organization. Country of issuer and/or credit risk exposure has been determined to be the United States of America, unless otherwise noted. |
| D. | Distributions — Distributions from net investment income, if any, are declared and paid quarterly and are recorded on the ex-dividend date. Distributions from net realized capital gain, if any, are generally declared and paid annually and recorded on the ex-dividend date. The Fund may elect to treat a portion of the proceeds from redemptions as distributions for federal income tax purposes. |
| E. | Federal Income Taxes — The Fund intends to comply with the requirements of Subchapter M of the Internal Revenue Code of 1986, as amended (the “Internal Revenue Code”), necessary to qualify as a regulated investment company and to distribute substantially all of the Fund’s taxable earnings to shareholders. As such, the Fund will not be subject to federal income taxes on otherwise taxable income (including net realized capital gain) that is distributed to shareholders. Therefore, no provision for federal income taxes is recorded in the financial statements. |
The Fund recognizes the tax benefits of uncertain tax positions only when the position is more likely than not to be sustained. Management has analyzed the Fund’s uncertain tax positions and concluded that no liability for unrecognized tax benefits should be recorded related to uncertain tax positions. Management is not aware of any tax positions for which it is reasonably possible that the total amounts of unrecognized tax benefits will change materially in the next 12 months.
The Fund files tax returns in the U.S. Federal jurisdiction and certain other jurisdictions. Generally, the Fund is subject to examinations by such taxing authorities for up to three years after the filing of the return for the tax period.
| F. | Expenses — Fees provided for under the Rule 12b-1 plan of a particular class of the Fund are charged to the operations of such class. Transfer agency fees and expenses and other shareholder recordkeeping fees and expenses attributable to Class R5 are charged to such class. Transfer agency fees and expenses and other shareholder recordkeeping fees and expenses relating to all other classes are allocated among those classes based on relative net assets. All other expenses are allocated among the classes based on relative net assets. |
| G. | Accounting Estimates — The preparation of financial statements in conformity with accounting principles generally accepted in the United States of America (“GAAP”) requires management to make estimates and assumptions that affect the reported amounts of assets and liabilities at the date of the financial statements and the reported amounts of revenues and expenses during the reporting period including estimates and assumptions related to taxation. Actual results could differ from those estimates by a significant amount. In addition, the Fund monitors for material events or transactions that may occur or become known after the period-end date and before the date the financial statements are released to print. |
| H. | Indemnifications — Under the Trust’s organizational documents, each Trustee, officer, employee or other agent of the Trust is indemnified against certain liabilities that may arise out of the performance of their duties to the Fund. Additionally, in the normal course of business, the Fund enters into contracts, including the Fund’s servicing agreements, that contain a variety of indemnification clauses. The Fund’s maximum exposure under these arrangements is unknown as this would involve future claims that may be made against the Fund that have not yet occurred. The risk of material loss as a result of such indemnification claims is considered remote. |
| I. | Securities Lending — The Fund may lend portfolio securities having a market value up to one-third of the Fund’s total assets. Such loans are secured by collateral equal to no less than the market value of the loaned securities determined daily by the securities lending provider. Such collateral will be cash or debt securities issued or guaranteed by the U.S. Government or any of its sponsored agencies. Cash collateral received in connection with these loans is invested in short-term money market instruments or affiliated money market funds and is shown as such on the Schedule of Investments. It is the Fund’s policy to obtain additional collateral from or return excess collateral to the borrower by the end of the next business day, following the valuation date of the securities loaned. Therefore, the value of the collateral held may be temporarily less than the value of the securities on loan. Lending securities entails a risk of loss to the Fund if, and to the extent that, the market value of the securities loaned were to increase and the borrower did not increase the collateral accordingly, and the borrower failed to return the securities. Upon the failure of the borrower to return the securities, collateral may be liquidated and the securities may be purchased on the open market to replace the loaned securities. The Fund could experience delays and costs in gaining access to the collateral. The Fund bears the risk of any deficiency in the amount of the collateral available for return to the borrower due to any loss on the collateral invested. Dividends received on cash collateral investments for securities lending transactions, which are net of compensation to counterparties, is included in Dividends from affiliates on the Statement of Operations. The aggregate value of securities out on loan, if any, is shown as a footnote on the Statement of Assets and Liabilities. |
| J. | Futures Contracts — The Fund may enter into futures contracts to manage exposure to interest rate, equity and market price movements and/or currency risks. A futures contract is an agreement between two parties (“Counterparties”) to purchase or sell a specified underlying security, currency or commodity (or delivery of a cash settlement price, in the case of an index future) for a fixed price at a future date. The Fund currently invests only in exchange-traded futures and they are standardized as to maturity date and underlying financial instrument. Initial margin deposits required upon entering into futures contracts are satisfied by the segregation of specific securities or cash as collateral at the futures commission merchant (broker). During the period the futures contracts are open, changes in the value of the contracts are recognized as unrealized gains or losses by recalculating the value of the contracts on a daily basis. Subsequent or variation margin payments are received or made depending upon whether unrealized gains or losses are incurred. These amounts are reflected as receivables or payables on the Statement of Assets and Liabilities. When the contracts are closed or expire, the Fund recognizes a realized gain or loss equal to the difference between the |
16 Invesco Low Volatility Equity Yield Fund
| proceeds from, or cost of, the closing transaction and the Fund’s basis in the contract. The net realized gain (loss) and the change in unrealized gain (loss) on futures contracts held during the period is included on the Statement of Operations. The primary risks associated with futures contracts are market risk and the absence of a liquid secondary market. If the Fund were unable to liquidate a futures contract and/or enter into an offsetting closing transaction, the Fund would continue to be subject to market risk with respect to the value of the contracts and continue to be required to maintain the margin deposits on the futures contracts. Futures contracts have minimal Counterparty risk since the exchange’s clearinghouse, as Counterparty to all exchange-traded futures, guarantees the futures against default. Risks may exceed amounts recognized in the Statement of Assets and Liabilities. |
| K. | Collateral — To the extent the Fund has designated or segregated a security as collateral and that security is subsequently sold, it is the Fund’s practice to replace such collateral no later than the next business day. This practice does not apply to securities pledged as collateral for securities lending transactions. |
NOTE 2—Advisory Fees and Other Fees Paid to Affiliates
The Trust has entered into a master investment advisory agreement with Invesco Advisers, Inc. (the “Adviser” or “Invesco”). Under the terms of the investment advisory agreement, the Fund pays an advisory fee to the Adviser based on the annual rate of the Fund’s average daily net assets as follows:
| Average Daily Net Assets | Rate | |||||
First $250 million | 0 | .60% | ||||
Next $250 million | 0 | .575% | ||||
Next $500 million | 0 | .55% | ||||
Next $1.5 billion | 0 | .525% | ||||
Next $2.5 billion | 0 | .50% | ||||
Next $2.5 billion | 0 | .475% | ||||
Next $2.5 billion | 0 | .45% | ||||
Over $10 billion | 0 | .425% | ||||
For the year ended August 31, 2015, the effective advisory fees incurred by the Fund was 0.59%.
Under the terms of a master sub-advisory agreement between the Adviser and each of Invesco Asset Management Deutschland GmbH, Invesco Asset Management Limited, Invesco Asset Management (Japan) Limited, Invesco Hong Kong Limited, Invesco Senior Secured Management, Inc. and Invesco Canada Ltd. (collectively, the “Affiliated Sub-Advisers”) the Adviser, not the Fund, may pay 40% of the fees paid to the Adviser to any such Affiliated Sub-Adviser(s) that provide(s) discretionary investment management services to the Fund based on the percentage of assets allocated to such Affiliated Sub-Adviser(s).
Further, the Adviser has contractually agreed, through at least June 30, 2016, to waive advisory fees and/or reimburse expenses to the extent necessary to limit total annual fund operating expenses after fee waiver and/or reimbursement (excluding certain items discussed below) of Class A, Class B, Class C, Class R, Class Y, Investor Class and Class R5 shares to 2.00%, 2.75%, 2.75%, 2.25%, 1.75%, 2.00% and 1.75% of average daily net assets, respectively. In determining the Adviser’s obligation to waive advisory fees and/or reimburse expenses, the following expenses are not taken into account, and could cause the total annual fund operating expenses after fee waiver and/or reimbursement to exceed the numbers reflected above: (1) interest; (2) taxes; (3) dividend expense on short sales; (4) extraordinary or non-routine items, including litigation expenses; and (5) expenses that the Fund has incurred but did not actually pay because of an expense offset arrangement. Unless Invesco continues the fee waiver agreement, it will terminate on June 30, 2016. The fee waiver agreement cannot be terminated during its term. The Adviser did not waive fees and/or reimburse expenses during the period under this expense limitation.
Further, the Adviser has contractually agreed, through at least June 30, 2017, to waive the advisory fee payable by the Fund in an amount equal to 100% of the net advisory fees the Adviser receives from the affiliated money market funds on investments by the Fund of uninvested cash in such affiliated money market funds.
For the year ended August 31, 2015, the Adviser waived advisory fees of $12,116.
The Trust has entered into a master administrative services agreement with Invesco pursuant to which the Fund has agreed to pay Invesco for certain administrative costs incurred in providing accounting services to the Fund. For the year ended August 31, 2015, expenses incurred under the agreement are shown in the Statement of Operations as Administrative services fees.
The Trust has entered into a transfer agency and service agreement with Invesco Investment Services, Inc. (“IIS”) pursuant to which the Fund has agreed to pay IIS a fee for providing transfer agency and shareholder services to the Fund and reimburse IIS for certain expenses incurred by IIS in the course of providing such services. IIS may make payments to intermediaries that provide omnibus account services, sub-accounting services and/or networking services. All fees payable by IIS to intermediaries that provide omnibus account services or sub-accounting are charged back to the Fund, subject to certain limitations approved by the Trust’s Board of Trustees. For the year ended August 31, 2015, expenses incurred under the agreement are shown in the Statement of Operations as Transfer agent fees.
The Trust has entered into master distribution agreements with Invesco Distributors, Inc. (“IDI”) to serve as the distributor for the Class A, Class B, Class C, Class R, Class Y, Investor Class and Class R5 shares of the Fund. The Trust has adopted plans pursuant to Rule 12b-1 under the 1940 Act with respect to the Fund’s Class A, Class B, Class C, Class R and Investor Class shares (collectively, the “Plans”). The Fund, pursuant to the Plans, pays IDI compensation at the annual rate of 0.25% of the Fund’s average daily net assets of Class A shares, 1.00% of the average daily net assets of Class B and Class C shares, 0.50% of the average daily net assets of Class R shares and 0.25% of the average daily net assets of Investor Class shares. Of the Plan payments, up to 0.25% of the average daily net assets of each class of shares may be paid to furnish continuing personal shareholder services to customers who purchase and own shares of such classes. Any amounts not paid as a service fee under the Plans would constitute an asset-based sales charge. Rules of the Financial Industry Regulatory Authority (“FINRA”) impose a cap on the total sales charges, including asset-based sales
17 Invesco Low Volatility Equity Yield Fund
charges, that may be paid by any class of shares of the Fund. For the year ended August 31, 2015, expenses incurred under the Plans are shown in the Statement of Operations as Distribution fees.
Front-end sales commissions and CDSC (collectively, the “sales charges”) are not recorded as expenses of the Fund. Front-end sales commissions are deducted from proceeds from the sales of Fund shares prior to investment in Class A shares of the Fund. CDSC are deducted from redemption proceeds prior to remittance to the shareholder. During the year ended August 31, 2015, IDI advised the Fund that IDI retained $15,338 in front-end sales commissions from the sale of Class A shares and $206, $1,079 and $1,089 from Class A, Class B and Class C shares, respectively, for CDSC imposed on redemptions by shareholders.
Certain officers and trustees of the Trust are officers and directors of the Adviser, IIS and/or IDI.
NOTE 3—Additional Valuation Information
GAAP defines fair value as the price that would be received to sell an asset or paid to transfer a liability in an orderly transaction between market participants at the measurement date, under current market conditions. GAAP establishes a hierarchy that prioritizes the inputs to valuation methods, giving the highest priority to readily available unadjusted quoted prices in an active market for identical assets (Level 1) and the lowest priority to significant unobservable inputs (Level 3), generally when market prices are not readily available or are unreliable. Based on the valuation inputs, the securities or other investments are tiered into one of three levels. Changes in valuation methods may result in transfers in or out of an investment’s assigned level:
| Level 1 — | Prices are determined using quoted prices in an active market for identical assets. |
| Level 2 — | Prices are determined using other significant observable inputs. Observable inputs are inputs that other market participants may use in pricing a security. These may include quoted prices for similar securities, interest rates, prepayment speeds, credit risk, yield curves, loss severities, default rates, discount rates, volatilities and others. |
| Level 3 — | Prices are determined using significant unobservable inputs. In situations where quoted prices or observable inputs are unavailable (for example, when there is little or no market activity for an investment at the end of the period), unobservable inputs may be used. Unobservable inputs reflect the Fund’s own assumptions about the factors market participants would use in determining fair value of the securities or instruments and would be based on the best available information. |
The following is a summary of the tiered valuation input levels, as of August 31, 2015. The level assigned to the securities valuations may not be an indication of the risk or liquidity associated with investing in those securities. Because of the inherent uncertainties of valuation, the values reflected in the financial statements may materially differ from the value received upon actual sale of those investments.
| Level 1 | Level 2 | Level 3 | Total | |||||||||||||
Equity Securities | $ | 294,302,915 | $ | — | $ | — | $ | 294,302,915 | ||||||||
U.S. Treasury Securities | — | 699,998 | — | 699,998 | ||||||||||||
| 294,302,915 | 699,998 | — | 295,002,913 | |||||||||||||
Futures Contracts* | (187,991 | ) | — | — | (187,991 | ) | ||||||||||
Total Investments | $ | 294,114,924 | $ | 699,998 | $ | — | $ | 294,814,922 | ||||||||
| * | Unrealized appreciation (depreciation). |
NOTE 4—Derivative Investments
Value of Derivative Investments at Period-End
The table below summarizes the value of the Fund’s derivative investments, detailed by primary risk exposure, held as of August 31, 2015:
| Value | ||||||||
| Risk Exposure/Derivative Type | Assets | Liabilities | ||||||
Market risk: | ||||||||
Futures contracts(a) | $ | — | $ | (187,991 | ) | |||
Total | $ | — | $ | (187,991 | ) | |||
| (a) | Includes cumulative appreciation (depreciation) of futures contracts. Only current day’s variation margin receivable (payable) is reported within the Statement of Assets and Liabilities. |
Effect of Derivative Investments for the year ended August 31, 2015
The table below summarizes the gains (losses) on derivative investments, detailed by primary risk exposure, recognized in earnings during the period:
| Location of Gain (Loss) on Statement of Operations | ||||
| Futures Contracts | ||||
Realized Gain: | ||||
Market Risk | $ | 375,542 | ||
Change in Net Unrealized Appreciation (Depreciation): | ||||
Market Risk | (479,131 | ) | ||
Total | $ | (103,589 | ) | |
18 Invesco Low Volatility Equity Yield Fund
The table below summarizes the average notional value of futures contracts outstanding during the period.
| Futures Contracts | ||||
Average notional value | $ | 7,693,778 | ||
| Open Futures Contracts | ||||||||||||||||||||
| Futures Contracts — Market Risk | Type of Contract | Number of Contracts | Expiration Month | Notional Value | Unrealized Appreciation (Depreciation) | |||||||||||||||
E- Mini S&P 500 Index | Long | 34 | September-2015 | $ | 3,347,640 | $ | (187,991 | ) | ||||||||||||
NOTE 5—Expense Offset Arrangement(s)
The expense offset arrangement is comprised of transfer agency credits which result from balances in demand deposit accounts used by the transfer agent for clearing shareholder transactions. For the year ended August 31, 2015, the Fund received credits from this arrangement, which resulted in the reduction of the Fund’s total expenses of $2,606.
NOTE 6—Trustees’ and Officers’ Fees and Benefits
Trustees’ and Officers’ Fees and Benefits include amounts accrued by the Fund to pay remuneration to certain Trustees and Officers of the Fund. Trustees have the option to defer compensation payable by the Fund, and Trustees’ and Officers’ Fees and Benefits also include amounts accrued by the Fund to fund such deferred compensation amounts. Those Trustees who defer compensation have the option to select various Invesco Funds in which their deferral accounts shall be deemed to be invested. Finally, certain current Trustees were eligible to participate in a retirement plan that provided for benefits to be paid upon retirement to Trustees over a period of time based on the number of years of service. The Fund may have certain former Trustees who also participate in a retirement plan and receive benefits under such plan. Trustees’ and Officers’ Fees and Benefits include amounts accrued by the Fund to fund such retirement benefits. Obligations under the deferred compensation and retirement plans represent unsecured claims against the general assets of the Fund.
NOTE 7—Cash Balances
The Fund is permitted to temporarily carry a negative or overdrawn balance in its account with State Street Bank and Trust Company, the custodian bank. Such balances, if any at period end, are shown in the Statement of Assets and Liabilities under the payable caption Amount due custodian. To compensate the custodian bank for such overdrafts, the overdrawn Fund may either (1) leave funds as a compensating balance in the account so the custodian bank can be compensated by earning the additional interest; or (2) compensate by paying the custodian bank at a rate agreed upon by the custodian bank and Invesco, not to exceed the contractually agreed upon rate.
NOTE 8—Distributions to Shareholders and Tax Components of Net Assets
Tax Character of Distributions to Shareholders Paid During the Fiscal Years Ended August 31, 2015 and 2014:
| 2015 | 2014 | |||||||
Ordinary income | $ | 9,404,453 | $ | 8,860,538 | ||||
Long-term capital gain | 26,500,272 | 5,394,957 | ||||||
Total distributions | $ | 35,904,725 | $ | 14,255,495 | ||||
Tax Components of Net Assets at Period-End:
| 2015 | ||||
Undistributed ordinary income | $ | 2,965,647 | ||
Net unrealized appreciation (depreciation) — investments | (11,556,057 | ) | ||
Temporary book/tax differences | (227,343 | ) | ||
Post-October deferrals | (4,703,762 | ) | ||
Capital loss carryforward | (31,093,556 | ) | ||
Shares of beneficial interest | 329,356,767 | |||
Total net assets | $ | 284,741,696 | ||
The difference between book-basis and tax-basis unrealized appreciation (depreciation) is due to differences in the timing of recognition of gains and losses on investments for tax and book purposes. The Fund’s net unrealized appreciation (depreciation) difference is attributable primarily to wash sales.
The temporary book/tax differences are a result of timing differences between book and tax recognition of income and/or expenses. The Fund’s temporary book/tax differences are the result of the trustee deferral of compensation and retirement plan benefits.
Capital loss carryforward is calculated and reported as of a specific date. Results of transactions and other activity after that date may affect the amount of capital loss carryforward actually available for the Fund to utilize. Capital losses generated in years beginning after December 22, 2010 can be carried forward for an unlimited period, whereas previous losses expire in eight tax years. Capital losses with an expiration period may not be used to offset capital gains until all net capital losses without an expiration date have been utilized. Capital loss carryforwards with no expiration date
19 Invesco Low Volatility Equity Yield Fund
will retain their character as either short-term or long-term capital losses instead of as short-term capital losses as under prior law. The ability to utilize capital loss carryforwards in the future may be limited under the Internal Revenue Code and related regulations based on the results of future transactions.
The Fund has a capital loss carryforward as of August 31, 2015, which expires as follows:
| Capital Loss Carryforward* | ||||||||||||
| Expiration | Short-Term | Long-Term | Total | |||||||||
August 31, 2016 | $ | 9,977,947 | $ | — | $ | 9,977,947 | ||||||
August 31, 2018 | 21,115,609 | — | 21,115,609 | |||||||||
| $ | 31,093,556 | $ | — | $ | 31,093,556 | |||||||
| * | Capital loss carryforward as of the date listed above is reduced for limitations, if any, to the extent required by the Internal Revenue Code and may be further limited depending upon a variety of factors, including the realization of net unrealized gains or losses as of the date of any reorganization. |
NOTE 9—Investment Securities
The aggregate amount of investment securities (other than short-term securities, U.S. Treasury obligations and money market funds, if any) purchased and sold by the Fund during the year ended August 31, 2015 was $327,153,253 and $353,542,400, respectively. Cost of investments on a tax basis includes the adjustments for financial reporting purposes as of the most recently completed federal income tax reporting period-end.
| Unrealized Appreciation (Depreciation) of Investment Securities on a Tax Basis | ||||
Aggregate unrealized appreciation of investment securities | $ | 15,765,285 | ||
Aggregate unrealized (depreciation) of investment securities | (27,321,342 | ) | ||
Net unrealized appreciation (depreciation) of investment securities | $ | (11,556,057 | ) | |
Cost of investments for tax purposes is $306,558,970.
NOTE 10—Reclassification of Permanent Differences
Primarily as a result of differing book/tax treatment of expired capital loss carryforward, on August 31, 2015, undistributed net investment income was decreased by $5,280, undistributed net realized gain (loss) was increased by $61,347 and shares of beneficial interest was decreased by $56,067. This reclassification had no effect on the net assets of the Fund.
20 Invesco Low Volatility Equity Yield Fund
NOTE 11—Share Information
| Summary of Share Activity | ||||||||||||||||
| Years ended August 31, | ||||||||||||||||
| 2015(a) | 2014 | |||||||||||||||
| Shares | Amount | Shares | Amount | |||||||||||||
Sold: | ||||||||||||||||
Class A | 678,854 | $ | 7,278,910 | 942,877 | $ | 10,325,144 | ||||||||||
Class B | 7,577 | 80,772 | 19,559 | 214,463 | ||||||||||||
Class C | 190,688 | 2,019,877 | 248,245 | 2,662,846 | ||||||||||||
Class R | 7,169 | 74,689 | 6,518 | 69,319 | ||||||||||||
Class Y | 178,350 | 1,934,247 | 162,907 | 1,791,033 | ||||||||||||
Investor Class | 266,183 | 2,858,315 | 486,151 | 5,236,634 | ||||||||||||
Class R5 | 218,919 | 2,360,543 | 135,907 | 1,500,816 | ||||||||||||
Issued as reinvestment of dividends: | ||||||||||||||||
Class A | 1,971,458 | 20,490,517 | 764,241 | 8,048,990 | ||||||||||||
Class B | 82,277 | 842,760 | 38,089 | 394,085 | ||||||||||||
Class C | 301,117 | 3,076,130 | 108,516 | 1,121,474 | ||||||||||||
Class R | 1,537 | 15,910 | 731 | 7,634 | ||||||||||||
Class Y | 46,413 | 484,365 | 14,543 | 154,082 | ||||||||||||
Investor Class | 605,330 | 6,310,713 | 243,096 | 2,566,955 | ||||||||||||
Class R5 | 157,715 | 1,648,232 | 61,598 | 654,033 | ||||||||||||
Automatic conversion of Class B shares to Class A shares: | ||||||||||||||||
Class A | 377,824 | 3,982,977 | 158,984 | 1,737,656 | ||||||||||||
Class B | (383,127 | ) | (3,982,977 | ) | (161,092 | ) | (1,737,656 | ) | ||||||||
Reacquired: | ||||||||||||||||
Class A | (3,254,893 | ) | (33,951,304 | ) | (2,738,197 | ) | (29,580,990 | ) | ||||||||
Class B | (172,118 | ) | (1,817,296 | ) | (214,003 | ) | (2,294,256 | ) | ||||||||
Class C | (719,971 | ) | (7,461,110 | ) | (687,387 | ) | (7,315,411 | ) | ||||||||
Class R | (8,142 | ) | (86,782 | ) | (9,723 | ) | (103,450 | ) | ||||||||
Class Y | (166,333 | ) | (1,743,974 | ) | (139,361 | ) | (1,500,387 | ) | ||||||||
Investor Class | (817,875 | ) | (8,668,846 | ) | (1,608,307 | ) | (17,156,426 | ) | ||||||||
Class R5 | (286,382 | ) | (3,076,269 | ) | (116,076 | ) | (1,277,102 | ) | ||||||||
Net increase (decrease) in share activity | (717,430 | ) | $ | (7,329,601 | ) | (2,282,184 | ) | $ | (24,480,514 | ) | ||||||
| (a) | There are entities that are record owners of more than 5% of the outstanding shares of the Fund and in the aggregate own 17% of the outstanding shares of the Fund. IDI has an agreement with these entities to sell Fund shares. The Fund, Invesco and/or Invesco affiliates may make payments to these entities, which are considered to be related to the Fund, for providing services to the Fund, Invesco and/or Invesco affiliates including but not limited to services such as securities brokerage, distribution, third party record keeping and account servicing. The Fund has no knowledge as to whether all or any portion of the shares owned of record by these entities are also owned beneficially. |
21 Invesco Low Volatility Equity Yield Fund
NOTE 12—Financial Highlights
The following schedule presents financial highlights for a share of the Fund outstanding throughout the periods indicated.
| Net asset value, beginning of period | Net investment income(a) | Net gains (losses) on securities (both realized and unrealized) | Total from investment operations | Dividends from net investment income | Distributions from net realized gains | Total distributions | Net asset value, end of period | Total return(b) | Net assets, end of period (000’s omitted) | Ratio of expenses to average net assets with fee waivers and/or expenses absorbed | Ratio of expenses to average net assets without fee waivers and/or expenses absorbed | Ratio of net investment income to average net assets | Portfolio turnover(c) | |||||||||||||||||||||||||||||||||||||||||||
Class A | ||||||||||||||||||||||||||||||||||||||||||||||||||||||||
Year ended 08/31/15 | $ | 11.75 | $ | 0.26 | $ | (1.43 | ) | $ | (1.17 | ) | $ | (0.31 | ) | $ | (0.87 | ) | $ | (1.18 | ) | $ | 9.40 | (10.72 | )% | $ | 177,739 | 1.15 | %(d) | 1.15 | %(d) | 2.49 | %(d) | 101 | % | |||||||||||||||||||||||
Year ended 08/31/14 | 9.98 | 0.31 | 1.92 | 2.23 | (0.29 | ) | (0.17 | ) | (0.46 | ) | 11.75 | 22.91 | 224,786 | 1.14 | 1.14 | 2.80 | 109 | |||||||||||||||||||||||||||||||||||||||
Year ended 08/31/13 | 8.66 | 0.12 | 1.31 | 1.43 | (0.11 | ) | — | (0.11 | ) | 9.98 | 16.71 | 199,636 | 1.18 | 1.18 | 1.31 | 107 | ||||||||||||||||||||||||||||||||||||||||
Year ended 08/31/12 | 7.34 | 0.09 | 1.27 | 1.36 | (0.04 | ) | — | (0.04 | ) | 8.66 | 18.54 | 198,831 | 1.03 | 1.23 | 1.10 | 45 | ||||||||||||||||||||||||||||||||||||||||
Year ended 08/31/11 | 6.29 | 0.07 | 1.06 | 1.13 | (0.08 | ) | — | (0.08 | ) | 7.34 | 18.00 | 204,311 | 1.00 | 1.22 | 0.90 | 125 | ||||||||||||||||||||||||||||||||||||||||
Class B | ||||||||||||||||||||||||||||||||||||||||||||||||||||||||
Year ended 08/31/15 | 11.59 | 0.18 | (1.42 | ) | (1.24 | ) | (0.22 | ) | (0.87 | ) | (1.09 | ) | 9.26 | (11.42 | ) | 5,253 | 1.90 | (d) | 1.90 | (d) | 1.74 | (d) | 101 | |||||||||||||||||||||||||||||||||
Year ended 08/31/14 | 9.84 | 0.22 | 1.90 | 2.12 | (0.20 | ) | (0.17 | ) | (0.37 | ) | 11.59 | 22.08 | 11,962 | 1.89 | 1.89 | 2.05 | 109 | |||||||||||||||||||||||||||||||||||||||
Year ended 08/31/13 | 8.53 | 0.05 | 1.29 | 1.34 | (0.03 | ) | — | (0.03 | ) | 9.84 | 15.72 | 13,288 | 1.93 | 1.93 | 0.56 | 107 | ||||||||||||||||||||||||||||||||||||||||
Year ended 08/31/12 | 7.26 | 0.03 | 1.26 | 1.29 | (0.02 | ) | — | (0.02 | ) | 8.53 | 17.75 | 16,913 | 1.78 | 1.98 | 0.35 | 45 | ||||||||||||||||||||||||||||||||||||||||
Year ended 08/31/11 | 6.22 | 0.01 | 1.06 | 1.07 | (0.03 | ) | — | (0.03 | ) | 7.26 | 17.15 | 20,750 | 1.75 | 1.97 | 0.15 | 125 | ||||||||||||||||||||||||||||||||||||||||
Class C | ||||||||||||||||||||||||||||||||||||||||||||||||||||||||
Year ended 08/31/15 | 11.56 | 0.18 | (1.41 | ) | (1.23 | ) | (0.22 | ) | (0.87 | ) | (1.09 | ) | 9.24 | (11.37 | ) | 29,959 | 1.90 | (d) | 1.90 | (d) | 1.74 | (d) | 101 | |||||||||||||||||||||||||||||||||
Year ended 08/31/14 | 9.82 | 0.22 | 1.89 | 2.11 | (0.20 | ) | (0.17 | ) | (0.37 | ) | 11.56 | 22.01 | 40,119 | 1.89 | 1.89 | 2.05 | 109 | |||||||||||||||||||||||||||||||||||||||
Year ended 08/31/13 | 8.51 | 0.05 | 1.29 | 1.34 | (0.03 | ) | — | (0.03 | ) | 9.82 | 15.75 | 37,335 | 1.93 | 1.93 | 0.56 | 107 | ||||||||||||||||||||||||||||||||||||||||
Year ended 08/31/12 | 7.25 | 0.03 | 1.25 | 1.28 | (0.02 | ) | — | (0.02 | ) | 8.51 | 17.64 | 41,148 | 1.78 | 1.98 | 0.35 | 45 | ||||||||||||||||||||||||||||||||||||||||
Year ended 08/31/11 | 6.22 | 0.01 | 1.05 | 1.06 | (0.03 | ) | — | (0.03 | ) | 7.25 | 16.99 | 48,592 | 1.75 | 1.97 | 0.15 | 125 | ||||||||||||||||||||||||||||||||||||||||
Class R | ||||||||||||||||||||||||||||||||||||||||||||||||||||||||
Year ended 08/31/15 | 11.69 | 0.24 | (1.43 | ) | (1.19 | ) | (0.28 | ) | (0.87 | ) | (1.15 | ) | 9.35 | (10.93 | ) | 170 | 1.40 | (d) | 1.40 | (d) | 2.24 | (d) | 101 | |||||||||||||||||||||||||||||||||
Year ended 08/31/14 | 9.93 | 0.28 | 1.91 | 2.19 | (0.26 | ) | (0.17 | ) | (0.43 | ) | 11.69 | 22.60 | 206 | 1.39 | 1.39 | 2.55 | 109 | |||||||||||||||||||||||||||||||||||||||
Year ended 08/31/13 | 8.61 | 0.10 | 1.30 | 1.40 | (0.08 | ) | — | (0.08 | ) | 9.93 | 16.37 | 200 | 1.43 | 1.43 | 1.06 | 107 | ||||||||||||||||||||||||||||||||||||||||
Year ended 08/31/12 | 7.31 | 0.07 | 1.26 | 1.33 | (0.03 | ) | — | (0.03 | ) | 8.61 | 18.24 | 1,059 | 1.28 | 1.48 | 0.85 | 45 | ||||||||||||||||||||||||||||||||||||||||
Year ended 08/31/11 | 6.27 | 0.05 | 1.06 | 1.11 | (0.07 | ) | — | (0.07 | ) | 7.31 | 17.68 | 1,300 | 1.25 | 1.47 | 0.65 | 125 | ||||||||||||||||||||||||||||||||||||||||
Class Y | ||||||||||||||||||||||||||||||||||||||||||||||||||||||||
Year ended 08/31/15 | 11.80 | 0.29 | (1.43 | ) | (1.14 | ) | (0.34 | ) | (0.87 | ) | (1.21 | ) | 9.45 | (10.43 | ) | 4,861 | 0.90 | (d) | 0.90 | (d) | 2.74 | (d) | 101 | |||||||||||||||||||||||||||||||||
Year ended 08/31/14 | 10.02 | 0.33 | 1.94 | 2.27 | (0.32 | ) | (0.17 | ) | (0.49 | ) | 11.80 | 23.24 | 5,383 | 0.89 | 0.89 | 3.05 | 109 | |||||||||||||||||||||||||||||||||||||||
Year ended 08/31/13 | 8.71 | 0.15 | 1.30 | 1.45 | (0.14 | ) | — | (0.14 | ) | 10.02 | 16.90 | 4,189 | 0.93 | 0.93 | 1.56 | 107 | ||||||||||||||||||||||||||||||||||||||||
Year ended 08/31/12 | 7.37 | 0.11 | 1.27 | 1.38 | (0.04 | ) | — | (0.04 | ) | 8.71 | 18.89 | 4,269 | 0.78 | 0.98 | 1.35 | 45 | ||||||||||||||||||||||||||||||||||||||||
Year ended 08/31/11 | 6.32 | 0.09 | 1.06 | 1.15 | (0.10 | ) | — | (0.10 | ) | 7.37 | 18.24 | 3,846 | 0.75 | 0.97 | 1.15 | 125 | ||||||||||||||||||||||||||||||||||||||||
Investor Class | ||||||||||||||||||||||||||||||||||||||||||||||||||||||||
Year ended 08/31/15 | 11.78 | 0.27 | (1.44 | ) | (1.17 | ) | (0.31 | ) | (0.87 | ) | (1.18 | ) | 9.43 | (10.68 | ) | 52,880 | 1.15 | (d) | 1.15 | (d) | 2.49 | (d) | 101 | |||||||||||||||||||||||||||||||||
Year ended 08/31/14 | 10.01 | 0.31 | 1.92 | 2.23 | (0.29 | ) | (0.17 | ) | (0.46 | ) | 11.78 | 22.85 | 65,428 | 1.14 | 1.14 | 2.80 | 109 | |||||||||||||||||||||||||||||||||||||||
Year ended 08/31/13 | 8.69 | 0.12 | 1.31 | 1.43 | (0.11 | ) | — | (0.11 | ) | 10.01 | 16.65 | 64,369 | 1.18 | 1.18 | 1.31 | 107 | ||||||||||||||||||||||||||||||||||||||||
Year ended 08/31/12 | 7.36 | 0.09 | 1.28 | 1.37 | (0.04 | ) | — | (0.04 | ) | 8.69 | 18.63 | 63,296 | 1.03 | 1.23 | 1.10 | 45 | ||||||||||||||||||||||||||||||||||||||||
Year ended 08/31/11 | 6.32 | 0.07 | 1.05 | 1.12 | (0.08 | ) | — | (0.08 | ) | 7.36 | 17.76 | 63,890 | 1.00 | 1.22 | 0.90 | 125 | ||||||||||||||||||||||||||||||||||||||||
Class R5 | ||||||||||||||||||||||||||||||||||||||||||||||||||||||||
Year ended 08/31/15 | 11.82 | 0.31 | (1.44 | ) | (1.13 | ) | (0.36 | ) | (0.87 | ) | (1.23 | ) | 9.46 | (10.35 | ) | 13,881 | 0.75 | (d) | 0.75 | (d) | 2.89 | (d) | 101 | |||||||||||||||||||||||||||||||||
Year ended 08/31/14 | 10.03 | 0.35 | 1.94 | 2.29 | (0.33 | ) | (0.17 | ) | (0.50 | ) | 11.82 | 23.48 | 16,272 | 0.75 | 0.75 | 3.19 | 109 | |||||||||||||||||||||||||||||||||||||||
Year ended 08/31/13 | 8.71 | 0.16 | 1.31 | 1.47 | (0.15 | ) | — | (0.15 | ) | 10.03 | 17.12 | 13,000 | 0.76 | 0.76 | 1.73 | 107 | ||||||||||||||||||||||||||||||||||||||||
Year ended 08/31/12 | 7.37 | 0.11 | 1.28 | 1.39 | (0.05 | ) | — | (0.05 | ) | 8.71 | 18.90 | 11,397 | 0.76 | 0.77 | 1.37 | 45 | ||||||||||||||||||||||||||||||||||||||||
Year ended 08/31/11 | 6.32 | 0.09 | 1.06 | 1.15 | (0.10 | ) | — | (0.10 | ) | 7.37 | 18.24 | 11,645 | 0.74 | 0.77 | 1.18 | 125 | ||||||||||||||||||||||||||||||||||||||||
| (a) | Calculated using average shares outstanding. |
| (b) | Includes adjustments in accordance with accounting principles generally accepted in the United States of America and as such, the net asset value for financial reporting purposes and the returns based upon those net asset values may differ from the net asset value and returns for shareholder transactions. Does not include sales charges and is not annualized for periods less than one year, if applicable. |
| (c) | Portfolio turnover is calculated at the fund level and is not annualized for periods less than one year, if applicable. For the period ended August 31, 2011, the portfolio turnover calculation excludes the value of securities purchased of $286,080,448 and sold of $155,521,831 in the effort to realign the Fund’s portfolio holdings after the reorganization of Invesco Select Equity Fund and Invesco Van Kampen Equity Premium Income Fund into the Fund. |
| (d) | Ratios are based on average daily net assets (000’s omitted) of $208,203, $8,752, $36,161, $197, $5,651, $60,641 and $15,255 for Class A, Class B, Class C, Class R, Class Y, Investor Class and Class R5 shares, respectively. |
22 Invesco Low Volatility Equity Yield Fund
Report of Independent Registered Public Accounting Firm
To the Board of Trustees of AIM Counselor Series Trust (Invesco Counselor Series Trust)
and Shareholders of Invesco Low Volatility Equity Yield Fund:
In our opinion, the accompanying statement of assets and liabilities, including the schedule of investments, and the related statements of operations and of changes in net assets and the financial highlights present fairly, in all material respects, the financial position of Invesco Low Volatility Equity Yield Fund (one of the funds constituting AIM Counselor Series Trust (Invesco Counselor Series Trust), hereafter referred to as the “Fund”) at August 31, 2015, the results of its operations for the year then ended, the changes in its net assets for each of the two years in the period then ended and the financial highlights for each of the five years in the period then ended, in conformity with accounting principles generally accepted in the United States of America. These financial statements and financial highlights (hereafter referred to as “financial statements”) are the responsibility of the Fund’s management. Our responsibility is to express an opinion on these financial statements based on our audits. We conducted our audits of these financial statements in accordance with the standards of the Public Company Accounting Oversight Board (United States). Those standards require that we plan and perform the audit to obtain reasonable assurance about whether the financial statements are free of material misstatement. An audit includes examining, on a test basis, evidence supporting the amounts and disclosures in the financial statements, assessing the accounting principles used and significant estimates made by management, and evaluating the overall financial statement presentation. We believe that our audits, which included confirmation of securities at August 31, 2015 by correspondence with the custodian and brokers, and the application of alternative auditing procedures where confirmations of security purchases have not been received, provide a reasonable basis for our opinion.
PRICEWATERHOUSECOOPERS LLP
October 27, 2015
Houston, Texas
23 Invesco Low Volatility Equity Yield Fund
Calculating your ongoing Fund expenses
Example
As a shareholder of the Fund, you incur two types of costs: (1) transaction costs, which may include sales charges (loads) on purchase payments or contingent deferred sales charges on redemptions, if any; and (2) ongoing costs, including management fees, distribution and/or service (12b-1) fees, and other Fund expenses. This example is intended to help you understand your ongoing costs (in dollars) of investing in the Fund and to compare these costs with ongoing costs of investing in other mutual funds. The example is based on an investment of $1,000 invested at the beginning of the period and held for the entire period March 1, 2015 through August 31, 2015.
Actual expenses
The table below provides information about actual account values and actual expenses. You may use the information in this table, together with the amount you invested, to estimate the expenses that you paid over the period. Simply divide your account value by $1,000 (for example, an $8,600 account value divided by $1,000 = 8.6), then multiply the result by the number in the table under the heading entitled “Actual Expenses Paid During Period” to estimate the expenses you paid on your account during this period.
Hypothetical example for comparison purposes
The table below also provides information about hypothetical account values and hypothetical expenses based on the Fund’s actual expense ratio and an assumed rate of return of 5% per year before expenses, which is not the Fund’s actual return.
The hypothetical account values and expenses may not be used to estimate the actual ending account balance or expenses you paid for the period. You may use this information to compare the ongoing costs of investing in the Fund and other funds. To do so, compare this 5% hypothetical example with the 5% hypothetical examples that appear in the shareholder reports of the other funds.
Please note that the expenses shown in the table are meant to highlight your ongoing costs only and do not reflect any transaction costs, such as sales charges (loads) on purchase payments or contingent deferred sales charges on redemptions, if any. Therefore, the hypothetical information is useful in comparing ongoing costs only, and will not help you determine the relative total costs of owning different funds. In addition, if these transaction costs were included, your costs would have been higher.
| Class | Beginning Account Value (03/01/15) | ACTUAL | HYPOTHETICAL (5% annual return before expenses) | Annualized Expense Ratio | ||||||||||||||||||||
| Ending Account Value (08/31/15)1 | Expenses Paid During Period2 | Ending Account Value (08/31/15) | Expenses Paid During Period2 | |||||||||||||||||||||
| A | $ | 1,000.00 | $ | 899.50 | $ | 5.51 | $ | 1,019.41 | $ | 5.85 | 1.15 | % | ||||||||||||
| B | 1,000.00 | 896.30 | 9.08 | 1,015.63 | 9.65 | 1.90 | ||||||||||||||||||
| C | 1,000.00 | 896.10 | 9.08 | 1,015.63 | 9.65 | 1.90 | ||||||||||||||||||
| R | 1,000.00 | 897.90 | 6.70 | 1,018.15 | 7.12 | 1.40 | ||||||||||||||||||
| Y | 1,000.00 | 901.20 | 4.31 | 1,020.67 | 4.58 | 0.90 | ||||||||||||||||||
| Investor | 1,000.00 | 899.00 | 5.50 | 1,019.41 | 5.85 | 1.15 | ||||||||||||||||||
| R5 | 1,000.00 | 902.00 | 3.60 | 1,021.42 | 3.82 | 0.75 | ||||||||||||||||||
| 1 | The actual ending account value is based on the actual total return of the Fund for the period March 1, 2015 through August 31, 2015, after actual expenses and will differ from the hypothetical ending account value which is based on the Fund’s expense ratio and a hypothetical annual return of 5% before expenses. |
| 2 | Expenses are equal to the Fund’s annualized expense ratio as indicated above multiplied by the average account value over the period, multiplied by 184/365 to reflect the most recent fiscal half year. |
24 Invesco Low Volatility Equity Yield Fund
Approval of Investment Advisory and Sub-Advisory Contracts
The Board of Trustees (the Board) of AIM Counselor Series Trust (Invesco Counselor Series Trust) is required under the Investment Company Act of 1940, as amended, to approve annually the renewal of Invesco Low Volatility Equity Yield Fund’s (the Fund) investment advisory agreements. During contract renewal meetings held on June 9-10, 2015, the Board as a whole, and the disinterested or “independent” Trustees, who comprise over 75% of the Board, voting separately, approved the continuance for the Fund of the Master Investment Advisory Agreement with Invesco Advisers, Inc. (Invesco Advisers and the investment advisory agreement) and the Master Intergroup Sub-Advisory Contract for Mutual Funds with Invesco Asset Management Deutschland GmbH, Invesco Asset Management Limited, Invesco Asset Management (Japan) Limited, Invesco Hong Kong Limited, Invesco Senior Secured Management, Inc. and Invesco Canada Ltd. (collectively, the Affiliated Sub-Advisers and the sub-advisory contracts) for another year, effective July 1, 2015.
In evaluating the fairness and reasonableness of compensation under the Fund’s investment advisory agreement and sub-advisory contracts, the Board considered, among other things, the factors discussed below. The Board determined that continuation of the Fund’s investment advisory agreement and the sub-advisory contracts is in the best interest of the Fund and its shareholders and that the compensation payable to Invesco Advisers and the Affiliated Sub-Advisers under the agreements is fair and reasonable.
The Board’s Fund Evaluation Process
The Board’s Investments Committee has established three Sub-Committees, each of which is primarily responsible for overseeing the performance and investment management services provided by Invesco Advisers and the Affiliated Sub-Advisers to a number of the funds advised by Invesco Advisers (the Invesco Funds). The Sub-Committees meet throughout the year to review the performance of their assigned Invesco Funds, including reviewing materials prepared under the direction of the independent Senior Officer, an officer of the Invesco Funds who reports directly to the independent Trustees. Over the course of each year, the Sub-Committees meet with portfolio managers for their assigned Invesco Funds and other members of management to review the performance, investment objective(s), policies, strategies, limitations and investment risks of these funds. The Board had the benefit of reports from the Sub-Committees and Investments Committee throughout the year in considering approval of the continuance of each Invesco Fund’s investment advisory agreement and sub-advisory contracts for another year.
During the contract renewal process, the Board receives comparative performance and fee data regarding the Invesco Funds prepared by Invesco Advisers and Lipper Inc. (Lipper), an independent provider of investment company data. The Board also receives a report and this independent written evaluation from the Senior Officer. The Senior Officer’s evaluation is prepared as part of his responsibility to manage the process by which the Invesco Funds’ proposed management fees are negotiated during the annual contract renewal process to ensure they are negotiated in a manner that is at arms’ length and reasonable. In addition to meetings with Invesco Advisers and fund counsel, the independent Trustees also discuss the continuance of the investment advisory agreement and sub-advisory contracts in separate sessions with the Senior Officer and with independent legal counsel.
The Trustees recognized that the advisory fee rates for the Invesco Funds are, in many cases, the result of years of review and negotiation. The Trustees’ deliberations and conclusions in a particular year may be based in part on their deliberations and conclusions regarding these arrangements throughout the year and in prior years. The Trustees’ review and conclusions are based on the comprehensive consideration of all information presented to them and are not the result of any single determinative factor. Moreover, one Trustee may have weighed a particular piece of information or factor differently than another Trustee.
The discussion below is a summary of the Senior Officer’s independent written evaluation with respect to the Fund’s investment advisory agreement as well as a discussion of the material factors and related conclusions that formed the basis for the Board’s approval of the Fund’s investment advisory agreement and sub-advisory contracts. Unless otherwise stated, this information is current as of June 10, 2015, and does not reflect consideration of factors that became known to the Board after that date.
Factors and Conclusions and Summary of Independent Written Fee Evaluation
| A. | Nature, Extent and Quality of Services Provided by Invesco Advisers and the Affiliated Sub-Advisers |
The Board reviewed the advisory services provided to the Fund by Invesco Advisers under the Fund’s investment advisory agreement, the performance of Invesco Advisers in providing these services, and the credentials and experience of the officers and employees of Invesco Advisers who provide these services, including the Fund’s portfolio manager or managers. The Board’s review of the qualifications of Invesco Advisers to provide advisory services included the Board’s consideration of Invesco Advisers’ investment
process oversight, independent credit analysis and investment risk management. The Board also considered non-advisory services that Invesco Advisers and its affiliates provide to the Invesco Funds such as various back office support functions, equity and fixed income trading operations, internal audit, distribution, valuation and legal and compliance.
In determining whether to continue the Fund’s investment advisory agreement, the Board considered the benefits of reapproving an existing relationship and the greater uncertainty that may be associated with entering into a new relationship. The Board concluded that the nature, extent and quality of the services provided to the Fund by Invesco Advisers are appropriate and satisfactory and consistent with the terms of the Fund’s investment advisory agreement.
The Board reviewed the services that may be provided by the Affiliated Sub-Advisers under the sub-advisory contracts and the credentials and experience of the officers and employees of the Affiliated Sub-Advisers who provide these services. The Board noted that the Affiliated Sub-Advisers have offices and personnel that are located in financial centers around the world. As a result, the Affiliated Sub-Advisers can provide research and investment analysis on the markets and economies of various countries in which the Fund may invest, make recommendations regarding securities and assist with security trades. The Board concluded that the sub-advisory contracts benefit the Fund and its shareholders by permitting Invesco Advisers to use the resources and talents of the Affiliated Sub-Advisers in managing the Fund. The Board concluded that the nature, extent and quality of the services that may be provided by the Affiliated Sub-Advisers are appropriate and satisfactory and consistent with the terms of the Fund’s sub-advisory contracts.
| B. | Fund Performance |
The Board considered Fund performance as a relevant factor in considering whether to approve the investment advisory agreement. The Board did not view Fund performance as a relevant factor in considering whether to approve the sub-advisory contracts for the Fund, as no Affiliated Sub-Adviser currently manages assets of the Fund.
The Board compared the Fund’s performance during the past one, three and five calendar years to the performance of funds in the Lipper performance universe and against the Lipper Equity Income Funds Index. The Board noted that performance of Class A shares of the Fund was in the third quintile of its performance universe for the one year period, the second quintile for the three year period and the fourth quintile for the five year period (the first quintile being the best performing funds and the fifth quintile being the worst performing funds).
25 Invesco Low Volatility Equity Yield Fund
The Board noted that performance of Class A shares of the Fund was below the performance of the Index for the one and five year periods and above the performance of the Index for the three year period. The Trustees also reviewed more recent Fund performance and this review did not change their conclusions.
| C. | Advisory and Sub-Advisory Fees |
The Board compared the Fund’s contractual management fee rate to the contractual management fee rates of funds in the Fund’s Lipper expense group at a common asset level. The Board noted that the contractual management fee rate for Class A shares of the Fund was below the median contractual management fee rate of funds in its expense group. The Board noted that the term “contractual management fee” may include both advisory and certain administrative services fees, but that Lipper does not provide information on a fund by fund basis as to what is included. The Board noted that Invesco Advisers does not charge the Invesco Funds for the administrative services included in the term as defined by Lipper. The Board also reviewed the methodology used by Lipper in providing expense group information, which includes using each fund’s contractual management fee schedule (including any applicable breakpoints) as reported in the most recent prospectus or statement of additional information for each fund in the expense group.
The Board noted that Invesco Advisers and the Affiliated Sub-Advisers do not manage other mutual funds or client accounts with investment strategies comparable to those of the Fund.
The Board also considered the services that may be provided by the Affiliated Sub-Advisers pursuant to the sub-advisory contracts, as well as the fees payable by Invesco Advisers to the Affiliated Sub-Advisers pursuant to the sub-advisory contracts. The Board also noted that the sub-advisory fees are not paid directly by the Fund, but rather, are payable by Invesco Advisers to the Affiliated Sub-Advisers.
| D. | Economies of Scale and Breakpoints |
The Board considered the extent to which there are economies of scale in the provision of advisory services to the Fund. The Board also considered whether the Fund benefits from economies of scale through contractual breakpoints in the Fund’s advisory fee schedule. The Board also noted that the Fund shares directly in economies of scale through lower fees charged by third party service providers based on the combined size of the Invesco Funds and other clients advised by Invesco Advisers.
| E. | Profitability and Financial Resources |
The Board reviewed information from Invesco Advisers concerning the costs of the advisory and other services that Invesco Advisers and its affiliates provide to the Fund and the Invesco Funds and the profitability of Invesco Advisers and its affiliates in providing these services. The Board received information from Invesco Advisers about the methodology used to prepare the profitability information. The Board
noted that Invesco Advisers continues to operate at a net profit from services Invesco Advisers and its affiliates provide to the Invesco Funds and the Fund. The Board did not deem the level of profits realized by Invesco Advisers and its affiliates from providing services to the Fund to be excessive given the nature, quality and extent of the services provided. The Board received and accepted information from Invesco Advisers demonstrating that Invesco Advisers and each Affiliated Sub-Adviser are financially sound and have the resources necessary to perform their obligations under the investment advisory agreement and sub-advisory contracts.
| F. | Collateral Benefits to Invesco Advisers and its Affiliates |
The Board considered various other benefits received by Invesco Advisers and its affiliates from the relationship with the Fund, including the fees received for providing transfer agency and distribution services to the Fund. The Board considered comparative information regarding fees charged for these services, including information provided by Lipper and other independent sources. The Board considered the performance of Invesco Advisers and its affiliates in providing these services and the organizational structure employed to provide these services. The Board also considered that these services are provided to the Fund pursuant to written contracts that are reviewed and approved on an annual basis by the Board; and that the services are required for the operation of the Fund.
The Board considered the benefits realized by Invesco Advisers and the Affiliated Sub-Advisers as a result of portfolio brokerage transactions executed through “soft dollar” arrangements. The Board noted that soft dollar arrangements shift the payment obligation for research services from Invesco Advisers and the Affiliated Sub-Advisers to the Invesco Funds and that the research received may be used with other clients of Invesco Advisers and may reduce Invesco Advisers’ and the Affiliated Sub-Advisers’ expenses. The Board also considered that it receives periodic reports from the Chief Compliance Officer of the Invesco Funds demonstrating that these arrangements are consistent with regulatory requirements. The Board did not deem the soft dollar arrangements to be inappropriate.
The Board considered that the Fund’s uninvested cash and cash collateral from any securities lending arrangements may be invested in money market funds advised by Invesco Advisers pursuant to procedures approved by the Board. The Board noted that Invesco Advisers receives advisory fees from these affiliated money market funds attributable to such investments, although Invesco Advisers has contractually agreed to waive through varying periods the advisory fees payable by the Invesco Funds with respect to investments in the affiliated money market funds. The waiver is in an amount equal to 100% of the net advisory fee Invesco Advisers receives from the affiliated money market funds
with respect to the Fund’s investment in the affiliated money market funds of uninvested cash, but not cash collateral. The Board concluded that the amount of advisory fees received by Invesco Advisors from the Fund’s investment of cash collateral from any securities lending arrangements in the affiliated money market funds is fair and reasonable.
The Board also considered the Fund may use an affiliated broker to execute certain trades for the Fund to, among other things, control information leakage, and were advised that such trades would be executed in compliance with rules under the Investment Company Act of 1940, as amended, and consistent with best execution obligations.
26 Invesco Low Volatility Equity Yield Fund
Tax Information
Form 1099-DIV, Form 1042-S and other year–end tax information provide shareholders with actual calendar year amounts that should be included in their tax returns. Shareholders should consult their tax advisors.
The following distribution information is being provided as required by the Internal Revenue Code or to meet a specific state’s requirement.
The Fund designates the following amounts or, if subsequently determined to be different, the maximum amount allowable for its fiscal year ended August 31, 2015:
Federal and State Income Tax | ||||
Long-Term Capital Gain Distributions | $ | 26,500,272 | ||
Qualified Dividend Income* | 82.14 | % | ||
Corporate Dividends Received Deduction* | 71.89 | % | ||
U.S. Treasury Obligations* | 0 | % | ||
| * | The above percentages are based on ordinary income dividends paid to shareholders during the Fund’s fiscal year. |
27 Invesco Low Volatility Equity Yield Fund
Trustees and Officers
The address of each trustee and officer is AIM Counselor Series Trust (Invesco Counselor Series Trust) (the “Trust”), 11 Greenway Plaza, Suite 1000, Houston, Texas 77046-1173. The trustees serve for the life of the Trust, subject to their earlier death, incapacitation, resignation, retirement or removal as more specifically provided in the Trust’s organizational documents. Each officer serves for a one year term or until their successors are elected and qualified. Column two below includes length of time served with predecessor entities, if any.
| Name, Year of Birth and Position(s) Held with the Trust | Trustee and/ or Officer Since | Principal Occupation(s) During Past 5 Years | Number of Funds in Fund Complex Overseen by Trustee | Other Directorship(s) Held by Trustee During Past 5 Years | ||||
| Interested Persons | ||||||||
| Martin L. Flanagan1 — 1960 Trustee | 2007 | Executive Director, Chief Executive Officer and President, Invesco Ltd. (ultimate parent of Invesco and a global investment management firm); Advisor to the Board, Invesco Advisers, Inc. (formerly known as Invesco Institutional (N.A.), Inc.); Trustee, The Invesco Funds; Vice Chair, Investment Company Institute; and Member of Executive Board, SMU Cox School of Business
Formerly: Chairman and Chief Executive Officer, Invesco Advisers, Inc. (registered investment adviser); Director, Chairman, Chief Executive Officer and President, IVZ Inc. (holding company), INVESCO Group Services, Inc. (service provider) and Invesco North American Holdings, Inc. (holding company); Director, Chief Executive Officer and President, Invesco Holding Company Limited (parent of Invesco and a global investment management firm); Director, Invesco Ltd.; Chairman, Investment Company Institute and President, Co-Chief Executive Officer, Co-President, Chief Operating Officer and Chief Financial Officer, Franklin Resources, Inc. (global investment management organization). | 144 | None | ||||
| Philip A. Taylor2 — 1954 Trustee, President and Principal Executive Officer | 2006 | Head of North American Retail and Senior Managing Director, Invesco Ltd.; Director, Co-Chairman, Co-President and Co-Chief Executive Officer, Invesco Advisers, Inc. (formerly known as Invesco Institutional (N.A.), Inc.) (registered investment adviser); Director, Chairman, Chief Executive Officer and President, Invesco Management Group, Inc. (formerly known as Invesco Aim Management Group, Inc.) (financial services holding company); Director and President, INVESCO Funds Group, Inc. (registered investment adviser and registered transfer agent); Director and Chairman, Invesco Investment Services, Inc. (formerly known as Invesco Aim Investment Services, Inc.) (registered transfer agent) and IVZ Distributors, Inc. (formerly known as INVESCO Distributors, Inc.) (registered broker dealer); Director, President and Chairman, Invesco Inc. (holding company), Invesco Canada Holdings Inc. (holding company), Trimark Investments Ltd./Placements Trimark Ltèe and Invesco Financial Services Ltd/Services Financiers Invesco Ltèe; Chief Executive Officer, Invesco Corporate Class Inc. (corporate mutual fund company) Director, Chairman and Chief Executive Officer, Invesco Canada Ltd. (formerly known as Invesco Trimark Ltd./Invesco Trimark Ltèe) (registered investment adviser and registered transfer agent); Trustee, President and Principal Executive Officer, The Invesco Funds (other than AIM Treasurer’s Series Trust (Invesco Treasurer’s Series Trust), Short-Term Investments Trust and Invesco Management Trust); Trustee and Executive Vice President, The Invesco Funds (AIM Treasurer’s Series Trust (Invesco Treasurer’s Series Trust), Short-Term Investments Trust and Invesco Management Trust only); Director, Invesco Investment Advisers LLC (formerly known as Van Kampen Asset Management); Director, Chief Executive Officer and President, Van Kampen Exchange Corp.
Formerly: Chief Executive Officer, Invesco Canada Fund Inc (corporate mutual fund company); Director and Chairman, Van Kampen Investor Services Inc.; Director, Chief Executive Officer and President, 1371 Preferred Inc. (holding company) and Van Kampen Investments Inc.; Director and President, AIM GP Canada Inc. (general partner for limited partnerships) and Van Kampen Advisors, Inc.; Director and Chief Executive Officer, Invesco Trimark Dealer Inc. (registered broker dealer); Director, Invesco Distributors, Inc. (formerly known as Invesco Aim Distributors, Inc.) (registered broker dealer); Manager, Invesco PowerShares Capital Management LLC; Director, Chief Executive Officer and President, Invesco Advisers, Inc.; Director, Chairman, Chief Executive Officer and President, Invesco Aim Capital Management, Inc.; President, Invesco Trimark Dealer Inc. and Invesco Trimark Ltd./Invesco Trimark Ltèe; Director and President, AIM Trimark Corporate Class Inc. and AIM Trimark Canada Fund Inc.; Senior Managing Director, Invesco Holding Company Limited; Director and Chairman, Fund Management Company (former registered broker dealer); President and Principal Executive Officer, The Invesco Funds (AIM Treasurer’s Series Trust (Invesco Treasurer’s Series Trust), and Short-Term Investments Trust only); President, AIM Trimark Global Fund Inc. and AIM Trimark Canada Fund Inc.. | 144 | None |
| 1 | Mr. Flanagan is considered an interested person (within the meaning of Section 2(a)(19) of the 1940 Act) of the Trust because he is an officer of the Adviser to the Trust, and an officer and a director of Invesco Ltd., ultimate parent of the Adviser. |
| 2 | Mr. Taylor is considered an interested person (within the meaning of Section 2(a)(19) of the 1940 Act) of the Trust because he is an officer and a director of the Adviser. |
T-1 Invesco Low Volatility Equity Yield Fund
Trustees and Officers—(continued)
| Name, Year of Birth and Position(s) Held with the Trust | Trustee and/ or Officer Since | Principal Occupation(s) During Past 5 Years | Number of Funds in Fund Complex Overseen by Trustee | Other Directorship(s) Held by Trustee During Past 5 Years | ||||
| Independent Trustees | ||||||||
Bruce L. Crockett — 1944 Trustee and Chair | 2003 | Chairman, Crockett Technologies Associates (technology consulting company)
Formerly: Director, Captaris (unified messaging provider); Director, President and Chief Executive Officer, COMSAT Corporation; Chairman, Board of Governors of INTELSAT (international communications company); ACE Limited (insurance company); Independent Directors Council and Investment Company Institute | 144 | ALPS (Attorneys Liability Protection Society) (insurance company) and Globe Specialty Metals, Inc. (metallurgical company) | ||||
David C. Arch — 1945 Trustee | 2010 | Chairman of Blistex Inc., a consumer health care products manufacturer | 144 | Board member of the Illinois Manufacturers’ Association; Member of the Board of Visitors, Institute for the Humanities, University of Michigan; Member of the Audit Committee of the Edward-Elmhurst Hospital | ||||
James T. Bunch — 1942 Trustee | 2000 | Managing Member, Grumman Hill Group LLC (family office/private equity investments)
Formerly: Founder, Green Manning & Bunch Ltd. (investment banking firm) (1988-2010); Executive Committee, United States Golf Association; and Chairman, Board of Governors, Western Golf Association | 144 | Chairman of the Board of Trustees, Evans Scholars Foundation; and Chairman of the Board, Denver Film Society | ||||
Rodney F. Dammeyer — 1940 Trustee | 2010 | Chairman of CAC, LLC, (private company offering capital investment and management advisory services)
Formerly: Prior to 2001, Managing Partner at Equity Group Corporate Investments; Prior to 1995, Chief Executive Officer of Itel Corporation (formerly Anixter International); Prior to 1985, experience includes Senior Vice President and Chief Financial Officer of Household International, Inc., Executive Vice President and Chief Financial Officer of Northwest Industries, Inc. and Partner of Arthur Andersen & Co.; From 1987 to 2010, Director/Trustee of investment companies in the Van Kampen Funds complex | 144 | Director of Quidel Corporation and Stericycle, Inc. | ||||
Albert R. Dowden — 1941 Trustee | 2003 | Director of a number of public and private business corporations, including the Boss Group, Ltd. (private investment and management); Nature’s Sunshine Products, Inc. and Reich & Tang Funds (5 portfolios) (registered investment company)
Formerly: Director, Homeowners of America Holding Corporation/Homeowners of America Insurance Company (property casualty company); Director, Continental Energy Services, LLC (oil and gas pipeline service); Director, CompuDyne Corporation (provider of product and services to the public security market) and Director, Annuity and Life Re (Holdings), Ltd. (reinsurance company); Director, President and Chief Executive Officer, Volvo Group North America, Inc.; Senior Vice President, AB Volvo; Director of various public and private corporations; Chairman, DHJ Media, Inc.; Director, Magellan Insurance Company; and Director, The Hertz Corporation, Genmar Corporation (boat manufacturer), National Media Corporation; Advisory Board of Rotary Power International (designer, manufacturer, and seller of rotary power engines); and Chairman, Cortland Trust, Inc. (registered investment company) | 144 | Director of: Nature’s Sunshine Products, Inc., Reich & Tang Funds, Homeowners of America Holding Corporation/ Homeowners of America Insurance Company, the Boss Group | ||||
Jack M. Fields — 1952 Trustee | 2003 | Chief Executive Officer, Twenty First Century Group, Inc. (government affairs company); Owner and Chief Executive Officer, Dos Angeles Ranch, L.P. (cattle, hunting, corporate entertainment); and Discovery Global Education Fund (non-profit)
Formerly: Chief Executive Officer, Texana Timber LP (sustainable forestry company); Director of Cross Timbers Quail Research Ranch (non-profit); and member of the U.S. House of Representatives | 144 | Insperity, Inc. (formerly known as Administaff) | ||||
Prema Mathai-Davis — 1950 Trustee | 2003 | Retired. Formerly: Chief Executive Officer, YWCA of the U.S.A. | 144 | None | ||||
Larry Soll — 1942 Trustee | 1997 | Retired. Formerly: Chairman, Chief Executive Officer and President, Synergen Corp. (a biotechnology company) | 144 | None | ||||
Hugo F. Sonnenschein — 1940 Trustee | 2010 | President Emeritus and Honorary Trustee of the University of Chicago and the Adam Smith Distinguished Service Professor in the Department of Economics at the University of Chicago. Prior to 2000, President of the University of Chicago | 144 | Trustee of the University of Rochester and a member of its investment committee; Member of the National Academy of Sciences and the American Philosophical Society; Fellow of the American Academy of Arts and Sciences | ||||
| Raymond Stickel, Jr. — 1944 Trustee | 2005 | Retired. Formerly: Director, Mainstay VP Series Funds, Inc. (25 portfolios) and Partner, Deloitte & Touche | 144 | None |
T-2 Invesco Low Volatility Equity Yield Fund
Trustees and Officers—(continued)
| Name, Year of Birth and Position(s) Held with the Trust | Trustee and/ or Officer Since | Principal Occupation(s) During Past 5 Years | Number of Funds in Fund Complex Overseen by Trustee | Other Directorship(s) Held by Trustee During Past 5 Years | ||||
| Independent Trustees—(continued) | ||||||||
Suzanne H. Woolsey — 1941 Trustee | 2014 | Chief Executive Officer of Woolsey Partners LLC | 144 | Emeritus Chair of the Board of Trustees of the Institute for Defense Analyses; Trustee of Colorado College; Trustee of California Institute of Technology; Prior to 2014, Director of Fluor Corp.; Prior to 2010, Trustee of the German Marshall Fund of the United States; Prior to 2010 Trustee of the Rocky Mountain Institute | ||||
| Other Officers | ||||||||
Russell C. Burk — 1958 Senior Vice President and Senior Officer | 2005 | Senior Vice President and Senior Officer, The Invesco Funds | N/A | N/A | ||||
John M. Zerr — 1962 Senior Vice President, Chief Legal Officer and Secretary | 2006 | Director, Senior Vice President, Secretary and General Counsel, Invesco Management Group, Inc. (formerly known as Invesco Aim Management Group, Inc.) and Van Kampen Exchange Corp.; Senior Vice President, Invesco Advisers, Inc. (formerly known as Invesco Institutional (N.A.), Inc.) (registered investment adviser); Senior Vice President and Secretary, Invesco Distributors, Inc. (formerly known as Invesco Aim Distributors, Inc.); Director, Vice President and Secretary, Invesco Investment Services, Inc. (formerly known as Invesco Aim Investment Services, Inc.) and IVZ Distributors, Inc. (formerly known as INVESCO Distributors, Inc.); Director and Vice President, INVESCO Funds Group, Inc.; Senior Vice President, Chief Legal Officer and Secretary, The Invesco Funds; Managing Director, Invesco PowerShares Capital Management LLC; Director, Secretary and General Counsel, Invesco Investment Advisers LLC (formerly known as Van Kampen Asset Management); Secretary and General Counsel, Invesco Capital Markets, Inc. (formerly known as Van Kampen Funds Inc.) and Chief Legal Officer, PowerShares Exchange-Traded Fund Trust, PowerShares Exchange-Traded Fund Trust II, PowerShares India Exchange-Traded Fund Trust, PowerShares Actively Managed Exchange-Traded Fund Trust, and PowerShares Actively Managed Exchange-Traded Commodity Fund Trust
Formerly: Director and Vice President, Van Kampen Advisors Inc.; Director, Vice President, Secretary and General Counsel, Van Kampen Investor Services Inc.; Director, Invesco Distributors, Inc. (formerly known as Invesco Aim Distributors, Inc.); Director, Senior Vice President, General Counsel and Secretary, Invesco Aim Advisers, Inc. and Van Kampen Investments Inc.; Director, Vice President and Secretary, Fund Management Company; Director, Senior Vice President, Secretary, General Counsel and Vice President, Invesco Aim Capital Management, Inc.; Chief Operating Officer and General Counsel, Liberty Ridge Capital, Inc. (an investment adviser); Vice President and Secretary, PBHG Funds (an investment company) and PBHG Insurance Series Fund (an investment company); Chief Operating Officer, General Counsel and Secretary, Old Mutual Investment Partners (a broker-dealer); General Counsel and Secretary, Old Mutual Fund Services (an administrator) and Old Mutual Shareholder Services (a shareholder servicing center); Executive Vice President, General Counsel and Secretary, Old Mutual Capital, Inc. (an investment adviser); and Vice President and Secretary, Old Mutual Advisors Funds (an investment company) | N/A | N/A | ||||
| Sheri Morris — 1964 Vice President, Treasurer and Principal Financial Officer | 2003 | Vice President, Treasurer and Principal Financial Officer, The Invesco Funds; Vice President, Invesco Advisers, Inc. (formerly known as Invesco Institutional (N.A.), Inc.) (registered investment adviser); and Vice President, PowerShares Exchange-Traded Fund Trust, PowerShares Exchange-Traded Fund Trust II, PowerShares India Exchange-Traded Fund Trust, PowerShares Actively Managed Exchange-Traded Fund Trust, and PowerShares Actively Managed Exchange-Traded Commodity Fund Trust
Formerly: Vice President, Invesco Aim Advisers, Inc., Invesco Aim Capital Management, Inc. and Invesco Aim Private Asset Management, Inc.; Assistant Vice President and Assistant Treasurer, The Invesco Funds and Assistant Vice President, Invesco Advisers, Inc., Invesco Aim Capital Management, Inc. and Invesco Aim Private Asset Management, Inc.; and Treasurer, PowerShares Exchange-Traded Fund Trust, PowerShares Exchange-Traded Fund Trust II, PowerShares India Exchange-Traded Fund Trust and PowerShares Actively Managed Exchange-Traded Fund Trust | N/A | N/A | ||||
T-3 Invesco Low Volatility Equity Yield Fund
Trustees and Officers—(continued)
| Name, Year of Birth and Position(s) Held with the Trust | Trustee and/ or Officer Since | Principal Occupation(s) During Past 5 Years | Number of Funds in Fund Complex Overseen by Trustee | Other Directorship(s) Held by Trustee During Past 5 Years | ||||
| Other Officers—(continued) | ||||||||
| Karen Dunn Kelley — 1960 Vice President | 2003 | Senior Managing Director, Investments, Invesco Ltd.; Director, Co-President, Co-Chief Executive Officer, and Co-Chairman, Invesco Advisers, Inc. (formerly known as Invesco Institutional (N.A.), Inc.) (registered investment adviser); Chairman, Invesco Senior Secured Management, Inc.; Senior Vice President, Invesco Management Group, Inc. (formerly known as Invesco Aim Management Group, Inc.); Executive Vice President, Invesco Distributors, Inc. (formerly known as Invesco Aim Distributors, Inc.); Director, Invesco Mortgage Capital Inc. and Invesco Management Company Limited; Vice President, The Invesco Funds (other than AIM Treasurer’s Series Trust (Invesco Treasurer’s Series Trust), Short-Term Investments Trust and Invesco Management Trust); and President and Principal Executive Officer, The Invesco Funds (AIM Treasurer’s Series Trust (Invesco Treasurer’s Series Trust), Short-Term Investments Trust and Invesco Management Trust only)
Formerly: Director and President, INVESCO Asset Management (Bermuda) Ltd., Director, INVESCO Global Asset Management Limited and INVESCO Management S.A.; Senior Vice President, Van Kampen Investments Inc. and Invesco Advisers, Inc. (formerly known as Invesco Institutional (N.A.), Inc.) (registered investment adviser); Vice President, Invesco Advisers, Inc. (formerly known as Invesco Institutional (N.A.), Inc.); Director of Cash Management and Senior Vice President, Invesco Advisers, Inc. and Invesco Aim Capital Management, Inc.; Director and President, Fund Management Company; Chief Cash Management Officer, Director of Cash Management, Senior Vice President, and Managing Director, Invesco Aim Capital Management, Inc.; Director of Cash Management, Senior Vice President, and Vice President, Invesco Advisers, Inc. and The Invesco Funds (AIM Treasurer’s Series Trust (Invesco Treasurer’s Series Trust), and Short-Term Investments Trust only) | N/A | N/A | ||||
| Crissie M. Wisdom — 1969 Anti-Money Laundering Compliance Officer | 2013 | Anti-Money Laundering Compliance Officer, Invesco Advisers, Inc. (formerly known as Invesco Institutional (N.A.), Inc.) (registered investment adviser), Invesco Capital Markets, Inc. (formerly known as Van Kampen Funds Inc.), Invesco Distributors, Inc., Invesco Investment Services, Inc., Invesco Management Group, Inc., Van Kampen Exchange Corp., The Invesco Funds, and PowerShares Exchange-Traded Fund Trust, PowerShares Exchange-Traded Fund Trust II, PowerShares India Exchange-Traded Fund Trust, PowerShares Actively Managed Exchange-Traded Fund Trust and PowerShares Actively Managed Exchange-Traded Commodity Fund Trust; Anti-Money Laundering Compliance Officer and Bank Secrecy Act Officer, INVESCO National Trust Company and Invesco Trust Company; and Fraud Prevention Manager and Controls and Risk Analysis Manager for Invesco Investment Services, Inc.. | N/A | N/A | ||||
Lisa O. Brinkley — 1959 Chief Compliance Officer | 2004 | Senior Vice President and Chief Compliance Officer, Invesco Advisers, Inc. (registered investment adviser) (formerly known as Invesco Institutional (N.A., Inc.); and Chief Compliance Officer, The Invesco Funds
Formerly: Global Assurance Officer, Invesco Ltd. and Vice President, The Invesco Funds; Chief Compliance Officer, Invesco Distributors, Inc. (formerly known as Invesco Aim Distributors, Inc.), Invesco Investment Services, Inc.(formerly known as Invesco Aim Investment Services, Inc.) and Van Kampen Investor Services Inc.; Senior Vice President, Invesco Management Group, Inc.; Senior Vice President and Chief Compliance Officer, Invesco Advisers, Inc. and The Invesco Funds; Vice President and Chief Compliance Officer, Invesco Aim Capital Management, Inc. and Invesco Distributors, Inc.; Vice President, Invesco Investment Services, Inc. and Fund Management Company. | N/A | N/A |
The Statement of Additional Information of the Trust includes additional information about the Fund’s Trustees and is available upon request, without charge, by calling 1.800.959.4246. Please refer to the Fund’s prospectus for information on the Fund’s sub-advisers.
Office of the Fund 11 Greenway Plaza, Suite 1000 Houston, TX 77046-1173 | Investment Adviser Invesco Advisers, Inc. 1555 Peachtree Street, N.E. Atlanta, GA 30309 | Distributor Invesco Distributors, Inc. 11 Greenway Plaza, Suite 1000 Houston, TX 77046-1173 | Auditors PricewaterhouseCoopers LLP 1000 Louisiana Street, Suite 5800 Houston, TX 77002-5678 | |||
Counsel to the Fund Stradley Ronon Stevens & Young, LLP 2005 Market Street, Suite 2600 Philadelphia, PA 19103-7018 | Counsel to the Independent Trustees Goodwin Procter LLP 901 New York Avenue, N.W. Washington, D.C. 20001 | Transfer Agent Invesco Investment Services, Inc. 11 Greenway Plaza, Suite 1000 Houston, TX 77046-1173 | Custodian State Street Bank and Trust Company 225 Franklin Street Boston, MA 02110-2801 | |||
T-4 Invesco Low Volatility Equity Yield Fund

Invesco mailing information
Send general correspondence to Invesco Investment Services, Inc., P.O. Box 219078, Kansas City, MO 64121-9078.
Important notice regarding delivery of security holder documents
To reduce Fund expenses, only one copy of most shareholder documents may be mailed to shareholders with multiple accounts at the same address (Householding). Mailing of your shareholder documents may be householded indefinitely unless you instruct us otherwise. If you do not want the mailing of these documents to be combined with those for other members of your household, please contact Invesco Investment Services, Inc. at 800 959 4246 or contact your financial institution. We will begin sending you individual copies for each account within 30 days after receiving your request.
Fund holdings and proxy voting information
The Fund provides a complete list of its holdings four times in each fiscal year, at the quarter ends. For the second and fourth quarters, the lists appear in the Fund’s semiannual and annual reports to shareholders. For the first and third quarters, the Fund files the lists with the Securities and Exchange Commission (SEC) on Form N-Q. The most recent list of portfolio holdings is available at invesco.com/completeqtrholdings. Shareholders can also look up the Fund’s Forms N-Q on the SEC website at sec.gov. Copies of the Fund’s Forms N-Q may be reviewed and copied at the SEC Public Reference Room in Washington, D.C. You can obtain information on the operation of the Public Reference Room, including information about duplicating fee charges, by calling 202 551 8090 or 800 732 0330, or by electronic request at the following email address: publicinfo@sec.gov. The SEC file numbers for the Fund are shown below.
A description of the policies and procedures that the Fund uses to determine how to vote proxies relating to portfolio securities is available without charge, upon request, from our Client Services department at 800 959 4246 or at invesco.com/proxyguidelines. The information is also available on the SEC website, sec.gov.
Information regarding how the Fund voted proxies related to its portfolio securities during the most recent 12-month period ended June 30 is available at invesco.com/proxysearch. The information is also available on the SEC website, sec.gov. Invesco Advisers, Inc. is an investment adviser; it provides investment advisory services to individual and institutional clients and does not sell securities. Invesco Distributors, Inc. is the US distributor for Invesco Ltd.’s retail mutual funds, exchange-traded funds and institutional money market funds. Both are wholly owned, indirect subsidiaries of Invesco Ltd. |
|

SEC file numbers: 811-09913 and 333-36074 LVEY-AR-1 Invesco Distributors, Inc. |
Letters to Shareholders
Philip Taylor | Dear Shareholders: This annual report includes information about your Fund, including performance data and a complete list of its investments as of the close of the reporting period. Inside is a discussion of how your Fund was managed and the factors that affected its performance during the reporting period. I hope you find this report of interest. The US economy expanded and unemployment declined throughout the reporting period. The sharp drop in oil prices that began in mid-2014 continued to benefit consumers, but a strong US dollar crimped corporate profits. The US Federal Reserve signaled that it was increasingly likely to raise interest rates, based on generally positive economic data, but uncertainty remained about when it would act. Overseas, the story was much different. Low energy prices hurt the economies of some oil-producing nations, such as Brazil and Russia. During the reporting period, the European Central Bank as well as central banks in China and Japan – among other countries – either instituted or | |
| maintained extraordinarily accommodative monetary policies in response to economic weakness. | ||

Investor uncertainty, such as we saw for much of the reporting period – and market volatility, such as we saw at the end of the reporting period – are unfortunate facts of life when it comes to investing. Some investors use these things as excuses to delay saving and investing for their long-term financial goals. That’s why Invesco encourages investors to work with a professional financial adviser who can stress the importance of starting to save and invest early and the importance of adhering to a disciplined investment plan – when times are good and when they’re uncertain. A financial adviser who knows your unique financial situation, investment goals and risk tolerance can be an invaluable partner as you seek to achieve your financial goals. He or she can offer a long-term perspective when markets are volatile and time-tested advice and guidance when your financial situation or investment goals change.
Timely information when and where you want it
Invesco’s efforts to help investors achieve their financial objectives include providing individual investors and financial professionals with timely information about the markets, the economy and investing – whenever and wherever they want it.
Our website, invesco.com/us, offers a wide range of market insights and investment perspectives. On the website, you’ll find detailed information about our funds, including prices, performance, holdings and portfolio manager commentaries. You can access information about your account by completing a simple, secure online registration. Click on the “Need to register” link in the “Account Access” box on our homepage to get started.
Invesco’s mobile apps for iPhone® and iPad® (both available free from the App StoreSM) allow you to obtain the same detailed information, monitor your account and create customizable watch lists. Also, they allow you to access investment insights from our investment leaders, market strategists, economists and retirement experts. You can sign up to be alerted when new commentary is added, and you can watch portfolio manager videos and have instant access to Invesco news and updates wherever you may be.
In addition to the resources accessible on our website and through our mobile app, you can obtain timely updates to help you stay informed about the markets, the economy and investing by connecting with Invesco on Twitter, LinkedIn or Facebook. You can access our blog at blog.invesco.us.com. Our goal is to provide you the information you want, when and where you want it.
Have questions?
For questions about your account, feel free to contact an Invesco client services representative at 800 959 4246. For Invesco-related questions or comments, please email me directly at phil@invesco.com.
All of us at Invesco look forward to serving your investment management needs for many years to come. Thank you for investing with us.
Sincerely,

Philip Taylor
Senior Managing Director, Invesco Ltd.
iPhone and iPad are trademarks of Apple Inc., registered in the US and other countries. App Store is a service mark of Apple Inc. Invesco Distributors, Inc. is not affiliated with Apple Inc.
2 Invesco Pennsylvania Tax-Free Income Fund
Bruce Crockett | Dear Fellow Shareholders: Among the many important lessons I’ve learned in more than 40 years in a variety of business endeavors is the value of a trusted advocate. As independent chair of the Invesco Funds Board, I can assure you that the members of the Board are strong advocates for the interests of investors in Invesco’s mutual funds. We work hard to represent your interests through oversight of the quality of the investment management services your funds receive and other matters important to your investment, including but not limited to: n Ensuring that Invesco offers a diverse lineup of mutual funds that your financial adviser can use to strive to meet your financial needs as your investment goals change over time. n Monitoring how the portfolio management teams of the Invesco funds are performing in light of changing economic and market conditions. | |

| n | Assessing each portfolio management team’s investment performance within the context of the investment strategy described in the fund’s prospectus. |
| n | Monitoring for potential conflicts of interests that may impact the nature of the services that your funds receive. |
We believe one of the most important services we provide our fund shareholders is the annual review of the funds’ advisory and sub-advisory contracts with Invesco Advisers and its affiliates. This review is required by the Investment Company Act of 1940 and focuses on the nature and quality of the services Invesco provides as the adviser to the Invesco funds and the reasonableness of the fees that it charges for those services. Each year, we spend months carefully reviewing information received from Invesco and a variety of independent sources, such as performance and fee data prepared by Lipper Inc., an independent, third-party firm widely recognized as a leader in its field. We also meet with our independent legal counsel and other independent advisers to review and help us assess the information that we have received. Our goal is to assure that you receive quality investment management services for a reasonable fee.
I trust the measures outlined above provide assurance that you have a worthy advocate when it comes to choosing the Invesco Funds.
As always, please contact me at bruce@brucecrockett.com with any questions or concerns you may have. On behalf of the Board, we look forward to continuing to represent your interests and serving your needs.
Sincerely,

Bruce L. Crockett
Independent Chair
Invesco Funds Board of Trustees
3 Invesco Pennsylvania Tax-Free Income Fund
Management’s Discussion of Fund Performance
Performance summary
For the fiscal year ended August 31, 2015, Class A shares of Invesco Pennsylvania Tax-Free Income Fund (the Fund), at net asset value (NAV), posted a positive return. At NAV, the Fund outperformed the S&P Municipal Bond Index, its broad market benchmark, but underperformed the S&P Municipal Bond Pennsylvania 5+ Year Investment Grade Index, its style-specific benchmark.
Your Fund’s long-term performance appears later in this report.
Fund vs. Indexes
Total returns, 8/31/14 to 8/31/15, at net asset value (NAV). Performance shown does not include applicable contingent deferred sales charges (CDSC) or front-end sales charges, which would have reduced performance.
Class A Shares | 3.09 | % | ||
Class B Shares | 3.15 | |||
Class C Shares | 2.33 | |||
Class Y Shares | 3.41 | |||
S&P Municipal Bond Indexq (Broad Market Index) | 2.38 | |||
S&P Municipal Bond Pennsylvania 5+ Year Investment Grade Indexq (Style-Specific Index)* | 3.54 | |||
Barclays Pennsylvania Municipal Indexq (Former Style-Specific Index)* | 2.76 | |||
Lipper Pennsylvania Municipal Debt Funds Indexn (Peer Group Index) | 3.24 |
Source(s): qFactSet Research Systems Inc.; nLipper Inc.
| * | The Fund has elected to use the S&P Municipal Bond Pennsylvania 5+ Year Investment Grade Index rather than the Barclays Pennsylvania Municipal Index as its style-specific index because the S&P Municipal Bond Pennsylvania 5+ Year Investment Grade Index more closely represents the performance of the types of securities in which the Fund invests. |
Market conditions and your Fund
Pennsylvania benefits from a highly diversified economy in terms of industries and different employment sectors. Its economy tends to track the national economy but with less volatility. It has outperformed, relative to the US economy, in areas such as real estate, personal income and employment during periods of national economic contraction. Pennsylvania’s economic performance is largely dependent on job growth.
Pennsylvania’s population grew an estimated 0.7% between 2010 and 2014 to 12.8 million, lagging the US, which grew by 3.3% during the same period.1 The state’s population ranks sixth in the nation, just behind Illinois.1 The state’s real
gross domestic product (the broadest measure of economic activity) grew 1.8% in 20142 and Pennsylvania’s unemployment rate has steadily declined over the past five years. As of the close of the reporting period, the state’s general obligation bonds were rated AA- by Standard & Poor’s and Fitch Ratings – and Aa3 by Moody’s.3 All three credit-rating agencies applied a “stable” outlook as of May 2015.
Throughout the reporting period, fundamentals for municipal debt issuers improved modestly. Overall, state finances continued to improve, albeit at a modest pace, and spending proposals for fiscal 2016 remained cautious. While new spending is expected to be limited, state budgets in 42 states call for higher
general fund levels in fiscal 2016 than fiscal 2015. Mid-year fiscal 2015 budget cuts were minimal, although higher than the previous year’s level. Mid-year budget cuts typically address state budget gaps that occur during the fiscal year, as previously appropriated spending must be reduced. These mid-year budget cuts have subsided compared to the post-recession years when states were forced to make substantial spending cuts and take other actions to balance their budgets.
For the reporting period, investment grade municipal bonds, as measured by the S&P Municipal Bond Index, returned 2.38%. Pennsylvania municipal bonds, as measured by the S&P Municipal Bond Pennsylvania Index, returned 3.00% over the reporting period.4 These modest gains occurred despite investor anxiety over the potential for rising interest rates, uncertainty related to the Greek debt crisis and heightened concern about potential defaults by Chicago and Puerto Rico. Expectations that the US Federal Reserve (the Fed) would raise interest rates drove volatility in the US Treasury market, with the municipal market following suit. A spike in refundings seen in the municipal market in 2015 also contributed to volatility as it boosted issuance, leading to an imbalance between supply and demand.
The Greek debt crisis and expectations that the Fed was close to raising interest rates resulted in large upward moves in US Treasury rates during the reporting period. In June, Fed Chair Janet Yellen indicated that while the short-term federal funds target rate is still on track to rise by year-end, rates will remain low for the long term, and increases will be made at a measured pace. If the Fed raises interest rates before the end of calendar year 2015, it will be the first increase in the federal funds target rate since the
Portfolio Composition
By credit sector, based on total investments
Revenue Bonds | 86.3 | % | ||
General Obligation Bonds | 7.4 | |||
Pre-Refunded Bonds | 5.2 | |||
Other | 1.1 |
Top Five Debt Holdings
| 1. | Southcentral (Region of) General Authority (Wellspan Health Obligated Group); Series 2014 | 3.3% | ||
| 2. | Westmoreland (County of) Industrial Development Authority (Redstone Presbyterian Senior Care Obligated Group); Series 2005 A | 2.7 | ||
| 3. | Pennsylvania (Commonwealth of); First Series 2014 | 2.7 | ||
| 4. | Dauphin (County of) General Authority (Pinnacle Health System); Series 2009 A | 2.0 | ||
| 5. | Pennsylvania (State of) Turnpike Commission; Series 2009 C | 1.9 |
| Total Net Assets | $126.5 million | |||
| Total Number of Holdings | 133 | |||
The Fund’s holdings are subject to change, and there is no assurance that the Fund will continue to hold any particular security.
4 Invesco Pennsylvania Tax-Free Income Fund
2004-2006 cycle, when the target rate was raised by 0.25% 17 times over 24 months, from 1.00% to 5.25%.5
Fundamentally, the municipal bond market continued to see credit appreciation as tax collections continued to be strong and the housing market remained firm through the end of the reporting period. Revenue bonds continued to improve as the economy grew only modestly.
During the reporting period, the municipal market was characterized by low supply and strong demand. Historically low interest rates continued to make refundings attractive to issuers, while new bond issuance remained low as of the end of the reporting period. Municipal bond mutual fund flows turned negative in May, primarily due to investor reaction to the increase in interest rates and negative returns in April.
Over the reporting period, security selection among intermediate-to-longer maturity bonds benefited the Fund’s performance versus its style-specific benchmark. Allocations to short-maturity bonds slightly offset these gains. Security selection in bonds with coupons of 5.0% to 5.5% aided relative Fund performance. Overweight exposure to higher education bonds, the Fund’s largest allocation, along with overweight exposure to life care bonds, further added to relative performance. Security selection among industrial development/pollution control revenue bonds, and overweight exposure to the prerefunded/escrowed to maturity sector, detracted from relative Fund performance.
During the reporting period, leverage contributed to Fund performance. The Fund achieved a leveraged position through the use of inverse floating rate securities. The Fund uses leverage because we believe that, over time, leveraging provides opportunities for additional income and total return for shareholders. However, the use of leverage also can expose shareholders to additional volatility. For more information about the Fund’s use of leverage, see the Notes to Financial Statements later in this report.
We wish to remind you that the Fund is subject to interest rate risk, meaning when interest rates rise, the value of fixed income securities tends to fall. This risk may be greater in the current market environment because interest rates are at or near historic lows. The degree to which the value of fixed income securities may decline due to rising interest rates may vary depending on the speed and magnitude of the increase in interest
rates, as well as individual security characteristics such as price, maturity, duration and coupon and market forces such as supply and demand for similar securities. We are monitoring interest rates, and the market, economic and geopolitical factors that may impact the direction, speed and magnitude of changes to interest rates across the maturity spectrum, including the potential impact of monetary policy changes by the Fed and certain foreign central banks. If interest rates rise, markets may experience increased volatility, which may affect the value and/ or liquidity of certain of the Fund’s investments.
Thank you for investing in Invesco Pennsylvania Tax-Free Income Fund and for sharing our long-term investment horizon.
| 1 | Source: US Census Bureau |
| 2 | Source: Bureau of Economic Analysis |
| 3 | Sources: Standard & Poor’s, Fitch Ratings, Moody’s. A credit rating is an assessment provided by a nationally recognized statistical rating organization (NRSRO) of the creditworthiness of an issuer with respect to debt obligations, including specific securities, money market instruments or other debts. Ratings are measured on a scale that generally ranges from AAA (highest) to D (lowest); ratings are subject to change without notice. If securities are rated differently by the rating agencies, the higher rating is applied. For more information on the rating methodology, please visit www.standardandpoors.com and select “Understanding Ratings” under Rating Resources on the homepage; www.fitchratings. com and select “Ratings Definitions” on the homepage; and www.moodys.com and select “Rating Methodologies” under Research and Ratings on the homepage. |
| 4 | Source: Standard & Poor’s |
| 5 | Source: Federal Reserve Bank of New York |
The views and opinions expressed in management’s discussion of Fund performance are those of Invesco Advisers, Inc. These views and opinions are subject to change at any time based on factors such as market and economic conditions. These views and opinions may not be relied upon as investment advice or recommendations, or as an offer for a particular security. The information is not a complete analysis of every aspect of any market, country, industry, security or the Fund. Statements of fact are from sources considered reliable, but Invesco Advisers, Inc. makes no representation or warranty as to their completeness or accuracy. Although historical performance is no guarantee of future results, these insights may help you understand our investment management philosophy.
See important Fund and, if applicable, index disclosures later in this report.
 | William Black Chartered Financial Analyst, Portfolio Manager, is manager of Invesco Pennsylvania Tax-Free Income Fund. He | |
joined Invesco in 2010. Mr. Black earned a BS in engineering and public policy from Washington University in St. Louis and an MBA from Kellogg School of Management, Northwestern University.
| ||
 | Mark Paris Portfolio Manager, is manager of Invesco Pennsylvania Tax-Free Income Fund. He joined Invesco in 2010. Mr. Paris earned | |
| a BBA in finance from Baruch College, The City University of New York. | ||
 | James Phillips Portfolio Manager, is manager of Invesco Pennsylvania Tax-Free Income Fund. He joined Invesco in 2010. Mr. Phillips | |
| earned a BA in American literature from Empire State College and an MBA in finance from University at Albany, The State University of New York. | ||
 | Robert Stryker Chartered Financial Analyst, Portfolio Manager, is manager of Invesco Pennsylvania Tax-Free Income Fund. He | |
| joined Invesco in 2010. Mr. Stryker earned a BS in finance from the University of Illinois at Chicago. | ||
 | Julius Williams Portfolio Manager, is manager of Invesco Pennsylvania Tax-Free Income Fund. He joined Invesco in 2010. Mr. Williams | |
| earned a BA in economics and sociology and a Master of Education degree in educational psychology from the University of Virginia. | ||
5 Invesco Pennsylvania Tax-Free Income Fund
Your Fund’s Long-Term Performance
Results of a $10,000 Investment – Oldest Share Class(es)
Fund and index data from 8/31/05
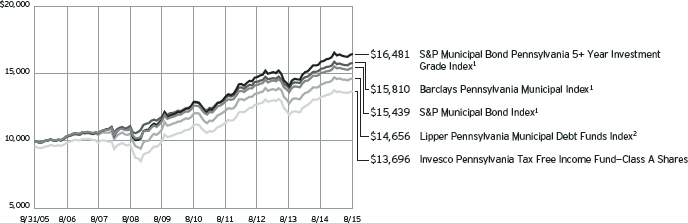
| 1 | Source: FactSet Research Systems Inc. |
| 2 | Source: Lipper Inc. |
Past performance cannot guarantee comparable future results.
During the reporting period, the Fund elected to use the S&P Municipal Bond Pennsylvania 5+ Year Investment Grade Index rather than the Barclays Pennsylvania Municipal Index as its style-specific index because the S&P Municipal Bond Pennsylvania 5+ Year Investment Grade Index more closely represents the
performance of the types of securities in which the Fund invests. Because this is the first reporting period since we adopted the new index, SEC guidelines require that we compare performance to both the old and new indexes.
The data shown in the chart include reinvested distributions, applicable sales charges and Fund expenses including management fees. Index results include
reinvested dividends, but they do not reflect sales charges. Performance of the peer group, if applicable, reflects fund expenses and management fees; performance of a market index does not. Performance shown in the chart and table(s) does not reflect deduction of taxes a shareholder would pay on Fund distributions or sale of Fund shares.
continued from page 9
Other information
| n | The returns shown in management’s discussion of Fund performance are based on net asset values (NAVs) calculated for shareholder transactions. Generally accepted accounting principles require adjustments to be made to the net assets of the Fund at period end for financial reporting purposes, and as such, the NAVs for shareholder transactions and the returns based on those NAVs may differ from the NAVs and returns reported in the Financial Highlights. |
6 Invesco Pennsylvania Tax-Free Income Fund
Average Annual Total Returns |
| |||||
As of 8/31/15, including maximum applicable sales charges
|
| |||||
Class A Shares | ||||||
Inception (5/1/87) | 5.65 | % | ||||
10 Years | 3.20 | |||||
5 Years | 3.24 | |||||
1 Year | -1.27 | |||||
Class B Shares | ||||||
Inception (5/3/93) | 4.20 | % | ||||
10 Years | 3.37 | |||||
5 Years | 3.85 | |||||
1 Year | -1.83 | |||||
Class C Shares | ||||||
Inception (8/13/93) | 3.60 | % | ||||
10 Years | 2.88 | |||||
5 Years | 3.38 | |||||
1 Year | 1.34 | |||||
Class Y Shares | ||||||
10 Years | 3.79 | % | ||||
5 Years | 4.41 | |||||
1 Year | 3.41 | |||||
Effective June 1, 2010, Class A, Class B and Class C shares of the predecessor fund, Van Kampen Pennsylvania Tax Free Income Fund, advised by Van Kampen Asset Management were reorganized into Class A, Class B and Class C shares, respectively, of Invesco Van Kampen Pennsylvania Tax Free Income Fund (renamed Invesco Pennsylvania Tax Free Income Fund). Returns shown above for Class A, Class B and Class C shares are blended returns of the predecessor fund and Invesco Pennsylvania Tax Free Income Fund. Share class returns will differ from the predecessor fund because of different expenses.
Class Y shares incepted on June 1, 2010. Performance shown prior to that date is that of the predecessor fund’s Class A shares and includes the 12b-1 fees applicable to Class A shares.
The performance data quoted represent past performance and cannot guarantee comparable future results; current performance may be lower or higher. Please visit invesco.com/performance for the most recent month-end performance. Performance figures reflect reinvested distributions, changes in net asset value and the effect of the maximum sales charge unless otherwise stated. Investment return and principal value will fluctuate so that you may have a gain or loss when you sell shares.
| Average Annual Total Returns | ||||||
As of 6/30/15, the most recent calendar quarter end, including maximum applicable sales charges
|
| |||||
Class A Shares | ||||||
Inception (5/1/87) | 5.65 | % | ||||
10 Years | 3.15 | |||||
5 Years | 3.71 | |||||
1 Year | -0.68 | |||||
Class B Shares | ||||||
Inception (5/3/93) | 4.19 | % | ||||
10 Years | 3.31 | |||||
5 Years | 4.31 | |||||
1 Year | -1.24 | |||||
Class C Shares | ||||||
Inception (8/13/93) | 3.59 | % | ||||
10 Years | 2.83 | |||||
5 Years | 3.85 | |||||
1 Year | 2.05 | |||||
Class Y Shares | ||||||
10 Years | 3.74 | % | ||||
5 Years | 4.89 | |||||
1 Year | 4.02 | |||||
The total annual Fund operating expense ratio set forth in the most recent Fund prospectus as of the date of this report for Class A, Class B, Class C and Class Y shares was 0.99%, 0.99%, 1.71% and 0.74%, respectively. The expense ratios presented above may vary from the expense ratios presented in other sections of this report that are based on expenses incurred during the period covered by this report.
Class A share performance reflects the maximum 4.25% sales charge, and Class B and Class C share performance reflects the applicable contingent deferred sales charge (CDSC) for the period involved. For shares purchased prior to June 1, 2010, the CDSC on Class B shares declines from 4% at the time of purchase to 0% at the beginning of the seventh year. For shares purchased on or after June 1, 2010, the CDSC on Class B shares declines from 5% at the time of purchase to 0% at the beginning of the seventh year. The CDSC on Class C shares is 1% for the first year after purchase. Class Y shares do not have a front-end sales charge or a CDSC; therefore, performance is at net asset value.
The performance of the Fund’s share classes will differ primarily due to different sales charge structures and class expenses.
Fund performance reflects any applicable fee waivers and/or expense reimbursements. Had the adviser not waived fees and/or reimbursed expenses currently or in the past, returns would have been lower. See current prospectus for more information.
7 Invesco Pennsylvania Tax-Free Income Fund
Invesco Pennsylvania Tax-Free Income Fund’s investment objective is to provide only Pennsylvania investors with a high level of current income exempt from federal and Pennsylvania state income taxes and, where possible under local law, local income and personal property taxes, through investment in a varied portfolio of medium- and lower-grade municipal securities.
| n | Unless otherwise stated, information presented in this report is as of August 31, 2015, and is based on total net assets. |
| n | Unless otherwise noted, all data provided by Invesco. |
| n | To access your Fund’s reports/prospectus, visit invesco.com/fundreports. |
About share classes
| n | Class B shares may not be purchased for new or additional investments. Please see the prospectus for more information. |
| n | Class Y shares are available to only certain investors. Please see the prospectus for more information. |
Principal risks of investing
in the Fund
| n | Alternative minimum tax risk. A portion of the Fund’s otherwise tax-exempt income may be taxable to those shareholders subject to the federal alternative minimum tax. |
| n | Call risk. If interest rates fall, it is possible that issuers of debt securities with high interest rates will prepay or call their securities before their maturity dates. In this event, the proceeds from the called securities would likely be reinvested by the Fund in securities bearing the new, lower interest rates, resulting in a possible decline in the Fund’s income and distributions to shareholders. |
| n | Changing fixed income market conditions risk. The current low interest rate environment was created in part by the Federal Reserve Board (FRB) and certain foreign central banks keeping the federal funds and equivalent foreign rates at or near zero. There is a risk that interest rates will rise when the FRB and central banks raise these rates. This risk is heightened due to the completion of the FRB’s quantitative easing program and the “tapering” of other similar foreign central bank actions. This eventual increase in the federal funds and equivalent foreign rates may expose fixed income markets to heightened volatility and reduced liquidity for certain fixed income investments, particularly those with longer maturities. In addition, decreases in fixed income dealer market-making capacity may also potentially lead to heightened volatility and |
reduced liquidity in the fixed income markets. As a result, the value of the Fund’s investments and share price may decline. Changes in central bank policies could also result in higher than normal shareholder redemptions, which could potentially increase portfolio turnover and the Fund’s transaction costs. |
| n | Credit risk. The issuer of instruments in which the Fund invests may be unable to meet interest and/or principal payments, thereby causing its instruments to decrease in value and lowering the issuer’s credit rating. |
| n | Derivatives risk. The value of a derivative instrument depends largely on (and is derived from) the value of an underlying security, currency, commodity, interest rate, index or other asset (each referred to as an underlying asset). In addition to risks relating to the underlying assets, the use of derivatives may include other, possibly greater, risks, including counterparty, leverage and liquidity risks. |
Counterparty risk is the risk that the counterparty to the derivative contract will default on its obligation to pay the Fund the amount owed or otherwise perform under the derivative contract. Derivatives create leverage risk because they do not require payment up front equal to the economic exposure created by owning the derivative. As a result, an adverse change in the value of the underlying asset could result in the Fund sustaining a loss that is substantially greater than the amount invested in the derivative, which may make the Fund’s returns more volatile and increase the risk of loss. Derivative instruments may also be less liquid than more traditional investments and the Fund may be unable to sell or close out its derivative positions at a desirable time or price. This risk may be more acute under adverse market conditions, during which the Fund may be most in need of liquidating its derivative positions. Derivatives may also be
| This report must be accompanied or preceded by a currently effective Fund prospectus, which contains more complete information, including sales charges and expenses. Investors should read it carefully before investing. |
NOT FDIC INSURED | MAY LOSE VALUE | NO BANK GUARANTEE | ||||
harder to value, less tax efficient and subject to changing government regulation that could impact the Fund’s ability to use certain derivatives or their cost. Also, derivatives used for hedging or to gain or limit exposure to a particular market segment may not provide the expected benefits, particularly during adverse market conditions. |
| n | High yield bond (junk bond) risk. Junk bonds involve a greater risk of default or price changes due to changes in the credit quality of the issuer. The values of junk bonds fluctuate more than those of high-quality bonds in response to company, political, regulatory or economic developments. Values of junk bonds can decline significantly over short periods of time. |
| n | Income risk. The income you receive from the Fund is based primarily on prevailing interest rates, which can vary widely over the short- and long-term. If interest rates drop, your income from the Fund may drop as well. |
| n | Interest rate risk. Interest rate risk refers to the risk that bond prices generally fall as interest rates rise; conversely, bond prices generally rise as interest rates fall. Specific bonds differ in their sensitivity to changes in interest rates depending on their individual characteristics, including duration. |
| n | Inverse floating rate obligations risk. Inverse floating rate obligations, including tender option bonds, may be subject to greater price volatility than a fixed income security with similar qualities. When short-term interest rates rise, they may decrease in value and produce less or no income. Additionally, these securities may lose principal. Similar to derivatives, inverse floating rate obligations have the following risks: counterparty, leverage, correlation, liquidity, market, interest rate, and management risks. |
| n | Liquidity risk. The Fund may hold illiquid securities that it may be unable to sell at the preferred time or price and could lose its entire investment in such securities. |
| n | Management risk. The investment techniques and risk analysis used by the Fund’s portfolio managers may not produce the desired results. |
8 Invesco Pennsylvania Tax-Free Income Fund
| n | Market risk. The prices of and the income generated by the Fund’s securities may decline in response to, among other things, investor sentiment, general economic and market conditions, regional or global instability, and currency and interest rate fluctuations. |
| n | Medium- and lower-grade municipal securities risk. Securities which are in the medium- and lower-grade categories generally offer higher yields than are offered by higher-grade securities of similar maturity, but they also generally involve more volatility and greater risks, such as greater credit risk, market risk, liquidity risk, management risk, and regulatory risk. Furthermore, many medium- and lower-grade securities are not listed for trading on any national securities exchange and many issuers of medium- and lower-grade securities choose not to have a rating assigned to their obligations by any nationally recognized statistical rating organization. As a result, the Fund’s portfolio may consist of a higher portion of unlisted or unrated securities as compared with an investment company that invests solely in higher-grade securities. Unrated securities are usually not as attractive to as many buyers as are rated securities, a factor which may make unrated securities less marketable. These factors may have the effect of limiting the availability of the securities for purchase by the Fund and may also limit the ability of the Fund to sell such securities at their fair value either to meet redemption requests or in response to changes in the economy or the financial markets. Investors should carefully consider the risks of owning shares of a Fund which invests in medium- and lower-grade municipal securities before investing in the Fund. |
| n | Municipal issuer focus risk. The Fund generally considers investments in municipal securities not to be subject to industry concentration policies (issuers of municipal securities as a group is not an industry) and the Fund may invest in municipal securities issued by entities having similar characteristics. The issuers may be located in the same geographic area or may pay their interest obligations from revenue of similar projects, such as hospitals, airports, utility systems and housing finance agencies. This may make the Fund’s investments more susceptible to similar social, economic, political or regulatory occurrences. As the similarity in issuers increases, the potential for fluctuation in the Fund’s net asset value also increases. |
| n | Municipal securities risk. The Fund may invest in municipal securities. Constitutional amendments, legislative enactments, executive orders, administrative regulations, voter initiatives, and the issuer’s regional economic conditions may affect the municipal security’s value, interest payments, repayment of principal and the Fund’s ability to sell it. Failure of a municipal security issuer to comply with applicable tax requirements may make income paid thereon taxable, resulting in a decline in the security’s value. In addition, there could be changes in applicable tax laws or tax treatments that reduce or eliminate the current federal income tax exemption on municipal securities or otherwise adversely affect the current federal or state tax status of municipal securities. |
| n | Pennsylvania and US territories municipal securities risk. The Fund is more susceptible to political, economic, regulatory or other factors affecting issuers of Pennsylvania municipal securities than a fund that does not limit its investments to such issuers. As with Pennsylvania municipal securities, events in any of the territories where the Fund is invested may affect the Fund’s investments and its performance. |
| n | Reinvestment risk. Reinvestment risk is the risk that a bond’s cash flows (coupon income and principal repayment) will be reinvested at an interest rate below that on the original bond. |
| n | Variable-rate demand notes risk. The absence of an active secondary market for certain variable and floating rate notes could make it difficult to dispose of the instruments, and the Fund could suffer a loss if the issuer defaults during periods in which the Fund is not entitled to exercise its demand rights. |
| n | When-issued and delayed delivery risks. When-issued and delayed delivery transactions are subject to market risk as the value or yield of a security at delivery may be more or less than the purchase price or the yield generally available on securities when delivery occurs. In addition, the Fund is subject to counterparty risk because it relies on the buyer or seller, as the case may be, to consummate the transaction, and failure by the other party to complete the transaction may result in the Fund missing the opportunity of obtaining a price or yield considered to be advantageous. |
| n | Zero coupon or pay-in-kind securities risk. The value, interest rates, and liquidity of non-cash paying instruments, |
| such as zero coupon and pay-in-kind securities, are subject to greater fluctuation than other types of securities. The higher yields and interest rates on pay-in-kind securities reflect the payment deferral and increased credit risk associated with such instruments and that such investments may represent a higher credit risk than coupon loans. Pay-in-kind securities may have a potential variability in valuations because their continuing accruals require continuing judgments about the collectability of the deferred payments and the value of any associated collateral. |
About indexes used in this report
| n | The S&P Municipal Bond Index is a broad, market value-weighted index that seeks to measure the performance of the US municipal bond market. |
| n | The S&P Municipal Bond Pennsylvania 5+ Year Investment Grade Index is a subset of the broad S&P Municipal Bond Index. This index of market value-weighted investment grade US municipal bonds seeks to measure the performance of Pennsylvania-issued US municipals whose maturities are equal to or greater than five years. |
| n | The Barclays Pennsylvania Municipal Index is an unmanaged index considered representative of Pennsylvania investment-grade municipal bonds. |
| n | The Lipper Pennsylvania Municipal Debt Funds Index is an unmanaged index considered representative of funds that limit assets to those securities that are exempt from taxation in Pennsylvania. |
| n | The S&P Municipal Bond Pennsylvania Index is a broad, market value-weighted index that seeks to measure the performance of bonds issued within Pennsylvania. |
| n | The Fund is not managed to track the performance of any particular index, including the index(es) described here, and consequently, the performance of the Fund may deviate significantly from the performance of the index(es). |
| n | A direct investment cannot be made in an index. Unless otherwise indicated, index results include reinvested dividends, and they do not reflect sales charges. Performance of the peer group, if applicable, reflects fund expenses; performance of a market index does not. |
continued on page 6
9 Invesco Pennsylvania Tax-Free Income Fund
Schedule of Investments
August 31, 2015
Interest Rate | Maturity Date | Principal Amount (000) | Value | |||||||||||||
Municipal Obligations–105.61% |
| |||||||||||||||
| Pennsylvania–100.35% | ||||||||||||||||
Allegheny (County of) Higher Education Building Authority (Chatham University); Series 2012 A, University RB | 5.00 | % | 09/01/35 | $ | 1,000 | $ | 1,059,900 | |||||||||
Allegheny (County of) Higher Education Building Authority (Duquesne University); | ||||||||||||||||
Series 1998, Ref. University RB (INS–AMBAC)(a) | 5.50 | % | 03/01/20 | 1,750 | 1,950,515 | |||||||||||
Series 2011 A, University RB | 5.50 | % | 03/01/31 | 550 | 616,869 | |||||||||||
Allegheny (County of) Higher Education Building Authority (Robert Morris University); Series 2008 A, University RB | 6.00 | % | 10/15/38 | 1,000 | 1,085,530 | |||||||||||
Allegheny (County of) Hospital Development Authority (Ohio Valley General Hospital); Series 2005 A, RB | 5.00 | % | 04/01/25 | 1,600 | 1,600,048 | |||||||||||
Allegheny (County of) Hospital Development Authority (University of Pittsburgh Medical Center); Series 2009, RB | 5.63 | % | 08/15/39 | 1,250 | 1,400,737 | |||||||||||
Allegheny (County of) Industrial Development Authority (Residential Resources, Inc.); Series 2006, Lease RB | 5.10 | % | 09/01/26 | 980 | 986,978 | |||||||||||
Allegheny (County of) Redevelopment Authority (Pittsburgh Mills); Series 2004, Tax Allocation RB | 5.60 | % | 07/01/23 | 1,125 | 1,137,679 | |||||||||||
Allegheny (County of) Sanitary Authority; Series 2015, Ref. RB(b) | 5.00 | % | 12/01/45 | 2,120 | 2,343,681 | |||||||||||
Allegheny (County of); Series 2008 C 61, Unlimited Tax GO Bonds (INS–AGC)(a) | 5.00 | % | 12/01/33 | 500 | 548,295 | |||||||||||
Beaver (County of) Industrial Development Authority (FirstEnergy Generation Corp.); Series 2008 A, Ref. PCR | 2.15 | % | 03/01/17 | 700 | 699,650 | |||||||||||
Beaver (County of) Industrial Development Authority; Series 2008 A, Ref. PCR(c) | 2.70 | % | 04/02/18 | 230 | 229,342 | |||||||||||
Beaver (County of); | ||||||||||||||||
Series 2009, Unlimited Tax GO Notes(c)(d) | 5.55 | % | 11/15/17 | 65 | 71,910 | |||||||||||
Series 2009, Unlimited Tax GO Notes (INS–AGM)(a) | 5.55 | % | 11/15/31 | 1,325 | 1,440,394 | |||||||||||
Berks (County of) Industrial Development Authority (One Douglassville); Series 2007 A, Ref. RB(e) | 6.13 | % | 11/01/34 | 440 | 444,800 | |||||||||||
Berks (County of) Municipal Authority (Reading Hospital Medical Center); Series 2012 A, RB | 5.00 | % | 11/01/40 | 1,000 | 1,089,080 | |||||||||||
Bethlehem (City of); | ||||||||||||||||
Series 2014, Gtd. Ref. Water RB | 5.00 | % | 11/15/30 | 425 | 476,769 | |||||||||||
Series 2014, Gtd. Ref. Water RB | 5.00 | % | 11/15/31 | 425 | 474,729 | |||||||||||
Bethlehem Area School District; Series 2010, Unlimited Tax GO Bonds (INS–AGM)(a) | 5.25 | % | 01/15/26 | 1,000 | 1,131,070 | |||||||||||
Bucks (County of) Industrial Development Authority (Lutheran Community Telford Center); Series 2007, RB | 5.75 | % | 01/01/37 | 2,000 | 2,019,600 | |||||||||||
Central Bradford Progress Authority (Guthrie Healthcare System); Series 2011, RB | 5.38 | % | 12/01/41 | 1,100 | 1,243,814 | |||||||||||
Centre (County of) Hospital Authority (Mt. Nittany Medical Center); Series 2011, RB | 6.25 | % | 11/15/41 | 500 | 579,240 | |||||||||||
Chartiers Valley Industrial & Commercial Development Authority (Asbury Health Center); | ||||||||||||||||
Series 2006, Ref. First Mortgage RB | 5.25 | % | 12/01/15 | 500 | 504,170 | |||||||||||
Series 2006, Ref. First Mortgage RB | 5.75 | % | 12/01/22 | 900 | 921,222 | |||||||||||
Chester (County of) Industrial Development Authority (Renaissance Academy Charter School); Series 2014, RB | 5.00 | % | 10/01/44 | 1,000 | 1,040,520 | |||||||||||
Chester (County of) Industrial Development Authority (University Student Housing, LLC at West Chester University of Pennsylvania); Series 2013, Student Housing RB | 5.00 | % | 08/01/45 | 750 | 777,053 | |||||||||||
Cumberland (County of) Municipal Authority (Asbury Pennsylvania Obligated Group); Series 2010, RB | 6.00 | % | 01/01/40 | 870 | 926,785 | |||||||||||
Cumberland (County of) Municipal Authority (Association of Independent Colleges & Universities of Pennsylvania Financing Program-Dickinson College); Series 2009, RB | 5.00 | % | 11/01/39 | 750 | 805,575 | |||||||||||
Cumberland (County of) Municipal Authority (Diakon Lutheran Ministries); | ||||||||||||||||
Series 2007, RB(c)(d) | 5.00 | % | 01/01/17 | 1,000 | 1,057,030 | |||||||||||
Series 2015, Ref. RB | 5.00 | % | 01/01/38 | 850 | 901,671 | |||||||||||
Cumberland (County of) Municipal Authority (Messiah Village); Series 2008 A, RB | 5.63 | % | 07/01/28 | 1,000 | 1,062,350 | |||||||||||
Dauphin (County of) General Authority (Pinnacle Health System); Series 2009 A, Health System RB | 6.00 | % | 06/01/36 | 2,215 | 2,529,176 | |||||||||||
Delaware (County of) Authority (Cabrini College); Series 1999, College RB (INS–AGC)(a) | 5.75 | % | 07/01/23 | 220 | 220,519 | |||||||||||
Delaware (County of) Authority (Neumann College); Series 2008, College RB | 6.25 | % | 10/01/38 | 110 | 110,432 | |||||||||||
Delaware (County of) Industrial Development Authority (Aqua Pennsylvania, Inc.); Series 2005 A, Water Facilities RB (INS–NATL)(a)(e) | 5.00 | % | 11/01/38 | 1,500 | 1,509,195 | |||||||||||
See accompanying Notes to Financial Statements which are an integral part of the financial statements.
10 Invesco Pennsylvania Tax Free Income Fund
Interest Rate | Maturity Date | Principal Amount (000) | Value | |||||||||||||
| Pennsylvania–(continued) | ||||||||||||||||
Delaware (County of) Industrial Development Authority (Covanta); Series 2015, Ref. RB | 5.00 | % | 07/01/43 | $ | 425 | $ | 426,692 | |||||||||
Delaware River Port Authority (Port District); | ||||||||||||||||
Series 2012, Ref. RB | 5.00 | % | 01/01/25 | 540 | 612,500 | |||||||||||
Series 2012, Ref. RB | 5.00 | % | 01/01/27 | 535 | 600,452 | |||||||||||
Delaware River Port Authority; Series 2010 D, RB | 5.00 | % | 01/01/40 | 1,000 | 1,105,800 | |||||||||||
Delaware Valley Regional Financial Authority; | ||||||||||||||||
Series 2002, RB | 5.75 | % | 07/01/17 | 1,160 | 1,256,953 | |||||||||||
Series 2002, RB | 5.75 | % | 07/01/32 | 1,000 | 1,208,700 | |||||||||||
Doylestown (City of) Hospital Authority; Series 2013 A, RB (INS–AGM)(a) | 5.00 | % | 07/01/24 | 1,000 | 1,127,870 | |||||||||||
East Hempfield (Township of) Industrial Development Authority (Student Services Inc. Student Housing); | ||||||||||||||||
Series 2013, RB | 5.00 | % | 07/01/35 | 500 | 519,885 | |||||||||||
Series 2014, RB | 5.00 | % | 07/01/39 | 250 | 259,078 | |||||||||||
Erie (City of) Higher Education Building Authority (Mercyhurst College); | ||||||||||||||||
Series 2004 B, Ref. College RB | 5.00 | % | 03/15/23 | 905 | 906,647 | |||||||||||
Series 2008, College RB | 5.50 | % | 03/15/38 | 500 | 539,530 | |||||||||||
Franklin (County of) Industrial Development Authority (Chambersburg Hospital); Series 2010, RB | 5.38 | % | 07/01/42 | 1,000 | 1,089,390 | |||||||||||
Geisinger Authority (Geisinger Health System); | ||||||||||||||||
Series 2011 A-1, Health System RB | 5.13 | % | 06/01/41 | 500 | 550,990 | |||||||||||
Series 2011 B, VRD Health System RB(f) | 0.01 | % | 06/01/41 | 1,500 | 1,500,000 | |||||||||||
Lancaster (County of) Hospital Authority (Brethren Village); Series 2008 A, RB | 6.50 | % | 07/01/40 | 350 | 362,597 | |||||||||||
Lancaster (County of) Hospital Authority (Masonic Villages); Series 2015, Ref. RB | 5.00 | % | 11/01/35 | 210 | 232,636 | |||||||||||
Lehigh (County of) Authority; Series 2013 A, Water & Sewer RB | 5.00 | % | 12/01/38 | 930 | 1,039,052 | |||||||||||
Lehigh (County of) General Purpose Authority (Bible Fellowship Church Homes, Inc.); Series 2013, RB | 5.25 | % | 07/01/42 | 825 | 851,449 | |||||||||||
Lehigh (County of) General Purpose Authority (Kidspeace Obligation Group); | ||||||||||||||||
Series 2014 A, RB | 7.50 | % | 02/01/44 | 683 | 682,386 | |||||||||||
Series 2014 B, Conv. CAB RB(g) | 7.50 | % | 02/01/44 | 172 | 48,236 | |||||||||||
Series 2014 C, RB(h) | 0.00 | % | 02/01/44 | 516 | 5 | |||||||||||
Lycoming (County of) Authority (Pennsylvania College of Technology); Series 2011, RB | 5.00 | % | 07/01/30 | 750 | 820,448 | |||||||||||
Lycoming (County of) Authority (Susquehanna Health System); Series 2009 A, Heath System RB | 5.75 | % | 07/01/39 | 1,250 | 1,348,850 | |||||||||||
Monroe (County of) Hospital Authority (Pocono Medical Center); Series 2007, RB | 5.13 | % | 01/01/37 | 1,500 | 1,558,305 | |||||||||||
Montgomery (County of) Higher Education & Health Authority (Abington Memorial Hospital Obligated Group); Series 2012, RB | 5.00 | % | 06/01/31 | 1,400 | 1,536,234 | |||||||||||
Montgomery (County of) Higher Education & Health Authority (Holy Redeemer Health System); Series 2014, Ref. RB | 5.00 | % | 10/01/27 | 390 | 422,846 | |||||||||||
Montgomery (County of) Industrial Development Authority (ACTS Retirement-Life Communities, Inc.); | ||||||||||||||||
Series 2009 A-1, RB | 6.25 | % | 11/15/29 | 1,000 | 1,126,410 | |||||||||||
Series 2012, Ref. RB | 5.00 | % | 11/15/28 | 900 | 962,046 | |||||||||||
Montgomery (County of) Industrial Development Authority (Albert Einstein Healthcare); Series 2015, Ref. Health System RB | 5.25 | % | 01/15/45 | 850 | 901,935 | |||||||||||
Montgomery (County of) Industrial Development Authority (Philadelphia Presbytery Homes, Inc.); Series 2010, RB | 6.63 | % | 12/01/30 | 1,500 | 1,714,395 | |||||||||||
Montgomery (County of) Industrial Development Authority (Whitemarsh Community); Series 2008, Mortgage RB(c)(d) | 7.00 | % | 02/01/18 | 500 | 573,605 | |||||||||||
Northampton (County of) General Purpose Authority (Lehigh University); Series 2009, Higher Education RB | 5.50 | % | 11/15/33 | 1,000 | 1,125,260 | |||||||||||
Northampton (County of) General Purpose Authority (St. Luke’s Hospital); | ||||||||||||||||
Series 2008 A, Hospital RB | 5.50 | % | 08/15/35 | 1,000 | 1,092,120 | |||||||||||
Series 2010 C, Hospital RB(c) | 4.50 | % | 08/15/16 | 1,000 | 1,031,310 | |||||||||||
Northampton (County of) Industrial Development Authority (Morningstar Senior Living, Inc.); Series 2012, RB | 5.00 | % | 07/01/32 | 920 | 946,202 | |||||||||||
Pennsylvania (Commonwealth of); First Series 2014, Unlimited Tax GO Bonds(b) | 5.00 | % | 06/15/34 | 3,000 | 3,376,440 | |||||||||||
Pennsylvania (State of) Economic Development Financing Agency (Forum Place); Series 2012, Governmental Lease RB | 5.00 | % | 03/01/34 | 500 | 549,975 | |||||||||||
See accompanying Notes to Financial Statements which are an integral part of the financial statements.
11 Invesco Pennsylvania Tax Free Income Fund
Interest Rate | Maturity Date | Principal Amount (000) | Value | |||||||||||||
| Pennsylvania–(continued) | ||||||||||||||||
Pennsylvania (State of) Economic Development Financing Authority (Amtrak); Series 2012 A, Ref. Exempt Facilities RB(e) | 5.00 | % | 11/01/41 | $ | 1,200 | $ | 1,278,684 | |||||||||
Pennsylvania (State of) Economic Development Financing Authority (National Gypson Co.); Series 2014, Ref. Exempt Facilities RB(e)(i) | 5.50 | % | 11/01/44 | 635 | 653,599 | |||||||||||
Pennsylvania (State of) Economic Development Financing Authority (PA Bridges FINCO LP); Series 2015, RB(e) | 5.00 | % | 06/30/42 | 1,585 | 1,660,589 | |||||||||||
Pennsylvania (State of) Economic Development Financing Authority (Philadelphia Biosolids Facility); Series 2009, Sewage Sludge Disposal RB | 6.25 | % | 01/01/32 | 1,000 | 1,108,990 | |||||||||||
Pennsylvania (State of) Economic Development Financing Authority (PPL Energy Supply); Series 2009 A, Ref. Exempt Facilities RB | 6.40 | % | 12/01/38 | 500 | 506,850 | |||||||||||
Pennsylvania (State of) Economic Development Financing Authority (Shippingport); Series 2006 A, Exempt Facilities RB(c) | 2.55 | % | 12/03/18 | 1,500 | 1,482,165 | |||||||||||
Pennsylvania (State of) Economic Development Financing Authority (Waste Management, Inc.); | ||||||||||||||||
Series 2004 A, Solid Waste Disposal RB(c) | 1.50 | % | 05/01/18 | 1,500 | 1,503,135 | |||||||||||
Series 2005 A, Solid Waste Disposal RB(e) | 5.10 | % | 10/01/27 | 1,300 | 1,317,849 | |||||||||||
Pennsylvania (State of) Higher Educational Facilities Authority (AICUP Financing Program-Del Valley College); Series 2012, RB | 5.00 | % | 11/01/42 | 535 | 554,800 | |||||||||||
Pennsylvania (State of) Higher Educational Facilities Authority (Edinboro University Foundation); | ||||||||||||||||
Series 2008, RB | 5.88 | % | 07/01/38 | 750 | 784,658 | |||||||||||
Series 2010, RB | 6.00 | % | 07/01/43 | 500 | 539,525 | |||||||||||
Pennsylvania (State of) Higher Educational Facilities Authority (La Salle University); Series 2012, RB | 5.00 | % | 05/01/42 | 1,180 | 1,228,687 | |||||||||||
Pennsylvania (State of) Higher Educational Facilities Authority (Shippensburg University Student Services); Series 2012, RB | 5.00 | % | 10/01/35 | 1,300 | 1,346,878 | |||||||||||
Pennsylvania (State of) Higher Educational Facilities Authority (St. Joseph’s University); Series 2010 A, RB | 5.00 | % | 11/01/34 | 500 | 540,545 | |||||||||||
Pennsylvania (State of) Higher Educational Facilities Authority (Temple University); First Series 2012, RB | 5.00 | % | 04/01/42 | 570 | 626,903 | |||||||||||
Pennsylvania (State of) Higher Educational Facilities Authority (Thomas Jefferson University); Series 2015, Ref. RB | 5.25 | % | 09/01/50 | 845 | 928,503 | |||||||||||
Pennsylvania (State of) Turnpike Commission; | ||||||||||||||||
Series 2008 B-1, Sub. RB | 5.50 | % | 06/01/33 | 1,000 | 1,093,900 | |||||||||||
Series 2009 C, Sub. Conv. CAB RB (INS–AGM)(a)(g) | 6.25 | % | 06/01/33 | 2,000 | 2,370,300 | |||||||||||
Series 2009 E, Sub. Conv. CAB RB(g) | 6.38 | % | 12/01/38 | 1,435 | 1,574,324 | |||||||||||
Series 2010 A 1, Motor License Fund Special RB | 5.00 | % | 12/01/38 | 500 | 548,410 | |||||||||||
Series 2010 A-2, Motor License Fund Special Conv. CAB RB(g) | 5.50 | % | 12/01/34 | 1,000 | 1,073,570 | |||||||||||
Series 2010 B 2, Conv. CAB RB(g) | 5.00 | % | 12/01/30 | 625 | 660,031 | |||||||||||
Series 2010 B 2, Conv. CAB RB(g) | 5.13 | % | 12/01/35 | 500 | 525,185 | |||||||||||
Philadelphia (City of) Authority for Industrial Development (The Children’s Hospital of Philadelphia); Series 2014 A, Hospital RB(b) | 5.00 | % | 07/01/42 | 1,500 | 1,676,880 | |||||||||||
Philadelphia (City of) Hospitals & Higher Education Facilities Authority (Jefferson Health System); Series 2010 B, RB(c)(d) | 5.00 | % | 05/15/20 | 1,500 | 1,746,420 | |||||||||||
Philadelphia (City of) Industrial Development Authority (Architecture & Design Charter High School); Series 2013, RB | 6.13 | % | 03/15/43 | 585 | 630,086 | |||||||||||
Philadelphia (City of) Industrial Development Authority (Discovery Charter School); Series 2012, RB | 6.25 | % | 04/01/42 | 1,000 | 1,064,720 | |||||||||||
Philadelphia (City of) Industrial Development Authority (First Philadelphia Preparatory Charter School); Series 2014 A, RB | 7.00 | % | 06/15/33 | 875 | 975,091 | |||||||||||
Philadelphia (City of) Industrial Development Authority (Independence Charter School); Series 2007 A, RB | 5.50 | % | 09/15/37 | 1,235 | 1,254,686 | |||||||||||
Philadelphia (City of) Industrial Development Authority (MaST Charter School); Series 2010, RB | 6.00 | % | 08/01/35 | 700 | 773,731 | |||||||||||
Philadelphia (City of) Industrial Development Authority (New Foundations Charter School); Series 2012, RB | 6.63 | % | 12/15/41 | 750 | 824,213 | |||||||||||
Philadelphia (City of) Industrial Development Authority (Performing Arts Charter School); Series 2013, RB(i) | 6.50 | % | 06/15/33 | 945 | 991,692 | |||||||||||
Philadelphia (City of); | ||||||||||||||||
Ninth Series 2010, Gas Works RB | 5.25 | % | 08/01/40 | 1,000 | 1,106,210 | |||||||||||
Series 2009 A, Ref. Unlimited Tax GO Bonds (INS–AGC)(a) | 5.50 | % | 08/01/24 | 1,000 | 1,144,690 | |||||||||||
Series 2010 C, Water & Wastewater RB (INS–AGM)(a) | 5.00 | % | 08/01/35 | 1,250 | 1,399,800 | |||||||||||
Series 2011, Unlimited Tax GO Bonds | 6.00 | % | 08/01/36 | 500 | 578,245 | |||||||||||
See accompanying Notes to Financial Statements which are an integral part of the financial statements.
12 Invesco Pennsylvania Tax Free Income Fund
Interest Rate | Maturity Date | Principal Amount (000) | Value | |||||||||||||
| Pennsylvania–(continued) | ||||||||||||||||
Philadelphia (State of) Authority for Industrial Development (Temple University); First Series 2015, Ref. RB | 5.00 | % | 04/01/45 | $ | 530 | $ | 582,905 | |||||||||
Philadelphia School District; Series 2008 E, Limited Tax GO Bonds (INS–BHAC)(a) | 5.13 | % | 09/01/23 | 1,500 | 1,664,745 | |||||||||||
Pittsburgh (City of) & Allegheny (County of) Sports & Exhibition Authority (Regional Asset District); Series 2010, Ref. Sales Tax RB (INS–AGM)(a) | 5.00 | % | 02/01/31 | 1,000 | 1,126,930 | |||||||||||
Pittsburgh (City of) Water & Sewer Authority; Series 2013 A, Ref. First Lien RB | 5.00 | % | 09/01/31 | 500 | 564,210 | |||||||||||
Southcentral (Region of) General Authority (Wellspan Health Obligated Group); | ||||||||||||||||
Series 2014, Ref. RB(b) | 5.00 | % | 06/01/44 | 3,180 | 3,501,435 | |||||||||||
Series 2014, Ref. RB | 5.00 | % | 06/01/44 | 635 | 699,186 | |||||||||||
State Public School Building Authority (Harrisburg School District); Series 2009 A, RB (INS–AGC)(a) | 5.00 | % | 11/15/33 | 1,000 | 1,090,630 | |||||||||||
Susquehanna Area Regional Airport Authority; Series 2012 A, Airport System RB(e) | 5.00 | % | 01/01/27 | 1,185 | 1,288,403 | |||||||||||
Union (County of) Hospital Authority (Evangelical Community Hospital); Series 2011, Ref. & Improvement RB | 7.00 | % | 08/01/41 | 1,000 | 1,179,400 | |||||||||||
Washington (County of) Industrial Development Authority (Washington Jefferson College); Series 2010, College RB | 5.25 | % | 11/01/30 | 500 | 563,255 | |||||||||||
Washington (County of) Redevelopment Authority (Victory Centre Tanger Outlet Development); Series 2006 A, Tax Allocation RB | 5.45 | % | 07/01/35 | 1,355 | 1,373,699 | |||||||||||
West View (Borough of) Municipal Authority; Series 2014, Water RB | 5.00 | % | 11/15/39 | 850 | 955,255 | |||||||||||
Westmoreland (County of) Industrial Development Authority (Redstone Presbyterian Senior Care Obligated Group); | ||||||||||||||||
Series 2005 A, Retirement Community RB(c)(d) | 5.75 | % | 01/01/16 | 2,500 | 2,546,425 | |||||||||||
Series 2005 A, Retirement Community RB(c)(d) | 5.88 | % | 01/01/16 | 900 | 917,082 | |||||||||||
Westmoreland (County of) Municipal Authority; Series 2013, RB | 5.00 | % | 08/15/31 | 750 | 845,835 | |||||||||||
Wilkes-Barre (City of) Finance Authority (University of Scranton); Series 2010, RB | 5.00 | % | 11/01/40 | 850 | 929,322 | |||||||||||
| 126,906,818 | ||||||||||||||||
| Guam–3.67% | ||||||||||||||||
Guam (Territory of) (Section 30); Series 2009 A, Limited Obligation RB | 5.75 | % | 12/01/34 | 1,250 | 1,384,563 | |||||||||||
Guam (Territory of) Power Authority; | ||||||||||||||||
Series 2010 A, RB | 5.50 | % | 10/01/40 | 410 | 452,287 | |||||||||||
Series 2012 A, Ref. RB | 5.00 | % | 10/01/34 | 520 | 557,081 | |||||||||||
Guam (Territory of) Waterworks Authority; | ||||||||||||||||
Series 2010, Water & Wastewater System RB | 5.63 | % | 07/01/40 | 1,000 | 1,092,760 | |||||||||||
Series 2014 A, Ref. Water & Wastewater System RB | 5.00 | % | 07/01/29 | 285 | 315,404 | |||||||||||
Guam (Territory of); Series 2011 A, Business Privilege Tax RB | 5.13 | % | 01/01/42 | 785 | 846,685 | |||||||||||
| 4,648,780 | ||||||||||||||||
| Virgin Islands–1.59% | ||||||||||||||||
Virgin Islands (Government of) Port Authority; Series 2014 A, Ref. Marine RB(e) | 5.00 | % | 09/01/29 | 575 | 631,781 | |||||||||||
Virgin Islands (Government of) Public Finance Authority (Matching Fund Loan Note-Diageo); Series 2009 A, Sub. RB | 6.63 | % | 10/01/29 | 750 | 840,705 | |||||||||||
Virgin Islands (Government of) Public Finance Authority (Matching Fund Loan Note); Series 2010 A, Sr. Lien RB | 5.00 | % | 10/01/29 | 500 | 541,170 | |||||||||||
| 2,013,656 | ||||||||||||||||
TOTAL INVESTMENTS(j)–105.61% (Cost $125,876,365) | 133,569,254 | |||||||||||||||
FLOATING RATE NOTE OBLIGATIONS–(5.16)% | ||||||||||||||||
Notes with interest and fee rates ranging from 0.55% to 0.66% at 08/31/15 and contractual maturities of collateral ranging from 06/15/34 to 12/01/45 (See Note 1J)(k) | (6,530,000 | ) | ||||||||||||||
OTHER ASSETS LESS LIABILITIES–(0.45)% | (571,321 | ) | ||||||||||||||
NET ASSETS–100.00% | $ | 126,467,933 | ||||||||||||||
See accompanying Notes to Financial Statements which are an integral part of the financial statements.
13 Invesco Pennsylvania Tax Free Income Fund
Investment Abbreviations:
| AGC | – Assured Guaranty Corp. | |
| AGM | – Assured Guaranty Municipal Corp. | |
| AMBAC | – American Municipal Bond Assurance Corp. | |
| BHAC | – Berkshire Hathaway Assurance Corp. | |
| CAB | – Capital Appreciation Bonds | |
| Conv. | – Convertible | |
| GO | – General Obligation | |
| Gtd | – Guaranteed | |
| INS | – Insurer | |
| NATL | – National Public Finance Guarantee Corp. | |
| PCR | – Pollution Control Revenue Bonds | |
| RB | – Revenue Bonds | |
| Ref. | – Refunding | |
| Sr. | – Senior | |
| Sub. | – Subordinated | |
| VRD | – Variable Rate Demand |
Notes to Schedule of Investments:
| (a) | Principal and/or interest payments are secured by the bond insurance company listed. |
| (b) | Underlying security related to TOB Trusts entered into by the Fund. See Note 1J. |
| (c) | Security has an irrevocable call by the issuer or mandatory put by the holder. Maturity date reflects such call or put. |
| (d) | Advance refunded; secured by an escrow fund of U.S. Government obligations or other highly rated collateral. |
| (e) | Security subject to the alternative minimum tax. |
| (f) | Demand security payable upon demand by the Fund at specified time intervals no greater than thirteen months. Interest rate is redetermined periodically. Rate shown is the rate in effect on August 31, 2015. |
| (g) | Convertible CAB. The interest rate shown represents the coupon rate at which the bond will accrue at a specified future date. |
| (h) | Zero coupon bond issued at a discount. |
| (i) | Security purchased or received in a transaction exempt from registration under the Securities Act of 1933, as amended (the “1933 Act”). The security may be resold pursuant to an exemption from registration under the 1933 Act, typically to qualified institutional buyers. The aggregate value of these securities at August 31, 2015 was $1,645,291, which represented 1.30% of the Fund’s Net Assets. |
| (j) | This table provides a listing of those entities that have either issued, guaranteed, backed or otherwise enhanced the credit quality of more than 5% of the securities held in the portfolio. In instances where the entity has guaranteed, backed or otherwise enhanced the credit quality of a security, it is not primarily responsible for the issuer’s obligations but may be called upon to satisfy the issuer’s obligations. |
| Entity | Percentage | |||
Assured Guaranty Municipal Corp. | 6.4 | % | ||
| (k) | Floating rate note obligations related to securities held. The interest and fee rates shown reflect the rates in effect at August 31, 2015. At August 31, 2015, the Fund’s investments with a value of $10,898,436 are held by TOB Trusts and serve as collateral for the $6,530,000 in the floating rate note obligations outstanding at that date. |
See accompanying Notes to Financial Statements which are an integral part of the financial statements.
14 Invesco Pennsylvania Tax Free Income Fund
Statement of Assets and Liabilities
August 31, 2015
Assets: | ||||
Investments, at value (Cost $125,876,365) | $ | 133,569,254 | ||
Receivable for: | ||||
Investments sold | 3,342,972 | |||
Fund shares sold | 96,040 | |||
Interest | 1,518,625 | |||
Investment for trustee deferred compensation and retirement plans | 30,959 | |||
Other assets | 32,006 | |||
Total assets | 138,589,856 | |||
Liabilities: | ||||
Floating rate note obligations | 6,530,000 | |||
Payable for: | ||||
Investments purchased | 3,757,335 | |||
Fund shares reacquired | 206,047 | |||
Amount due custodian | 1,379,413 | |||
Dividends | 127,000 | |||
Accrued fees to affiliates | 42,409 | |||
Accrued trustees’ and officers’ fees and benefits | 2,711 | |||
Accrued other operating expenses | 43,152 | |||
Trustee deferred compensation and retirement plans | 33,856 | |||
Total liabilities | 12,121,923 | |||
Net assets applicable to shares outstanding | $ | 126,467,933 | ||
Net assets consist of: | ||||
Shares of beneficial interest | $ | 128,560,755 | ||
Undistributed net investment income | 565,454 | |||
Undistributed net realized gain (loss) | (10,351,165 | ) | ||
Net unrealized appreciation | 7,692,889 | |||
| $ | 126,467,933 | |||
Net Assets: | ||||
Class A | $ | 112,409,049 | ||
Class B | $ | 1,247,430 | ||
Class C | $ | 9,487,967 | ||
Class Y | $ | 3,323,487 | ||
Shares outstanding, $0.01 par value per share, |
| |||
Class A | 6,836,791 | |||
Class B | 75,713 | |||
Class C | 576,390 | |||
Class Y | 201,937 | |||
Class A: | ||||
Net asset value per share | $ | 16.44 | ||
Maximum offering price per share | ||||
(Net asset value of $16.44 ¸ 95.75%) | $ | 17.17 | ||
Class B: | ||||
Net asset value and offering price per share | $ | 16.48 | ||
Class C: | ||||
Net asset value and offering price per share | $ | 16.46 | ||
Class Y: | ||||
Net asset value and offering price per share | $ | 16.46 | ||
See accompanying Notes to Financial Statements which are an integral part of the financial statements.
15 Invesco Pennsylvania Tax Free Income Fund
Statement of Operations
For the year ended August 31, 2015
Investment income: |
| |||
Interest | $ | 6,024,163 | ||
Expenses: | ||||
Advisory fees | 745,927 | |||
Administrative services fees | 50,000 | |||
Custodian fees | 4,005 | |||
Distribution fees: | ||||
Class A | 283,680 | |||
Class B | 3,601 | |||
Class C | 96,503 | |||
Interest, facilities and maintenance fees | 35,051 | |||
Transfer agent fees | 90,048 | |||
Trustees’ and officers’ fees and benefits | 21,098 | |||
Other | 168,510 | |||
Total expenses | 1,498,423 | |||
Less: Expense offset arrangement(s) | (199 | ) | ||
Net expenses | 1,498,224 | |||
Net investment income | 4,525,939 | |||
Realized and unrealized gain (loss) from: | ||||
Net realized gain (loss) from investment securities | (792,529 | ) | ||
Change in net unrealized appreciation of investment securities | 140,483 | |||
Net realized and unrealized gain (loss) | (652,046 | ) | ||
Net increase in net assets resulting from operations | $ | 3,873,893 | ||
See accompanying Notes to Financial Statements which are an integral part of the financial statements.
16 Invesco Pennsylvania Tax Free Income Fund
Statement of Changes in Net Assets
For the years ended August 31, 2015 and 2014
| 2015 | 2014 | |||||||
Operations: |
| |||||||
Net investment income | $ | 4,525,939 | $ | 4,983,924 | ||||
Net realized gain (loss) | (792,529 | ) | (2,475,247 | ) | ||||
Change in net unrealized appreciation | 140,483 | 11,214,093 | ||||||
Net increase in net assets resulting from operations | 3,873,893 | 13,722,770 | ||||||
Distributions to shareholders from net investment income: | ||||||||
Class A | (3,880,981 | ) | (4,337,929 | ) | ||||
Class B | (49,222 | ) | (59,962 | ) | ||||
Class C | (264,372 | ) | (310,949 | ) | ||||
Class Y | (115,097 | ) | (99,215 | ) | ||||
Total distributions from net investment income | (4,309,672 | ) | (4,808,055 | ) | ||||
Share transactions–net: | ||||||||
Class A | (1,083,200 | ) | (12,996,752 | ) | ||||
Class B | (293,384 | ) | (282,934 | ) | ||||
Class C | (281,205 | ) | (1,740,082 | ) | ||||
Class Y | 627,640 | (14,839 | ) | |||||
Net increase (decrease) in net assets resulting from share transactions | (1,030,149 | ) | (15,034,607 | ) | ||||
Net increase (decrease) in net assets | (1,465,928 | ) | (6,119,892 | ) | ||||
Net assets: | ||||||||
Beginning of year | 127,933,861 | 134,053,753 | ||||||
End of year (includes undistributed net investment income of $565,454 and $454,309, respectively) | $ | 126,467,933 | $ | 127,933,861 | ||||
Notes to Financial Statements
August 31, 2015
NOTE 1—Significant Accounting Policies
Invesco Pennsylvania Tax Free Income Fund (the “Fund”) is a series portfolio of AIM Counselor Series Trust (Invesco Counselor Series Trust) (the “Trust”). The Trust is a Delaware statutory trust registered under the Investment Company Act of 1940, as amended (the “1940 Act”), as an open-end series management investment company consisting of thirteen separate portfolios, each authorized to issue an unlimited number of shares of beneficial interest. The assets, liabilities and operations of each portfolio are accounted for separately. Information presented in these financial statements pertains only to the Fund. Matters affecting each portfolio or class will be voted on exclusively by the shareholders of such portfolio or class.
The Fund’s investment objective is to provide only Pennsylvania investors with a high level of current income exempt from federal and Pennsylvania state income taxes and, where possible under local law, local income and personal property taxes, through investment in a varied portfolio of medium- and lower-grade municipal securities.
The Fund currently consists of four different classes of shares: Class A, Class B, Class C and Class Y. Class A shares are sold with a front-end sales charge unless certain waiver criteria are met and under certain circumstances load waived shares may be subject to contingent deferred sales charges (“CDSC”). Class C shares are sold with a CDSC. Class Y shares are sold at net asset value. Effective November 30, 2010, new or additional investments in Class B shares are no longer permitted. Existing shareholders of Class B shares may continue to reinvest dividends and capital gains distributions in Class B shares until they convert to Class A shares. Also, shareholders in Class B shares will be able to exchange those shares for Class B shares of other Invesco Funds offering such shares until they convert to Class A shares. Generally, Class B shares will automatically convert to Class A shares on or about the month-end, which is at least eight years after the date of purchase. Redemption of Class B shares prior to conversion date will be subject to a CDSC.
The following is a summary of the significant accounting policies followed by the Fund in the preparation of its financial statements.
| A. | Security Valuations — Securities, including restricted securities, are valued according to the following policy. |
Securities are fair valued using an evaluated quote provided by an independent pricing service approved by the Board of Trustees. Evaluated quotes provided by the pricing service may be determined without exclusive reliance on quoted prices, and may reflect appropriate factors such as institution-size trading in similar groups of securities, developments related to specific securities, dividend rate (for unlisted equities), yield (for debt obligations), quality, type of issue, coupon rate (for debt obligations), maturity (for debt obligations), individual trading characteristics and other market data. Debt obligations are subject to interest rate and credit risks. In addition, all debt obligations involve some risk of default with respect to interest and/or principal payments.
Securities for which market quotations either are not readily available or became unreliable are valued at fair value as determined in good faith by or under the supervision of the Trust’s officers following procedures approved by the Board of Trustees. Some of the factors which may be
17 Invesco Pennsylvania Tax Free Income Fund
considered in determining fair value are fundamental analytical data relating to the investment; the nature and duration of any restrictions on transferability or disposition; trading in similar securities by the same issuer or comparable companies; relevant political, economic or issuer specific news; and other relevant factors under the circumstances.
The Fund may invest in securities that are subject to interest rate risk, meaning the risk that the prices will generally fall as interest rates rise and, conversely, the prices will generally rise as interest rates fall. Specific securities differ in their sensitivity to changes in interest rates depending on their individual characteristics. Changes in interest rates may result in increased market volatility, which may affect the value and/or liquidity of certain Fund investments.
Valuations change in response to many factors including the historical and prospective earnings of the issuer, the value of the issuer’s assets, general economic conditions, interest rates, investor perceptions and market liquidity. Because of the inherent uncertainties of valuation, the values reflected in the financial statements may materially differ from the value received upon actual sale of those investments.
| B. | Securities Transactions and Investment Income — Securities transactions are accounted for on a trade date basis. Realized gains or losses on sales are computed on the basis of specific identification of the securities sold. Interest income (net of withholding tax, if any) is recorded on the accrual basis from settlement date. Dividend income (net of withholding tax, if any) is recorded on the ex-dividend date. Bond premiums and discounts are amortized and/or accreted for financial reporting purposes. |
The Fund may periodically participate in litigation related to Fund investments. As such, the Fund may receive proceeds from litigation settlements. Any proceeds received are included in the Statement of Operations as realized gain (loss) for investments no longer held and as unrealized gain (loss) for investments still held.
Brokerage commissions and mark ups are considered transaction costs and are recorded as an increase to the cost basis of securities purchased and/or a reduction of proceeds on a sale of securities. Such transaction costs are included in the determination of net realized and unrealized gain (loss) from investment securities reported in the Statement of Operations and the Statement of Changes in Net Assets and the net realized and unrealized gains (losses) on securities per share in the Financial Highlights. Transaction costs are included in the calculation of the Fund’s net asset value and, accordingly, they reduce the Fund’s total returns. These transaction costs are not considered operating expenses and are not reflected in net investment income reported in the Statement of Operations and the Statement of Changes in Net Assets, or the net investment income per share and the ratios of expenses and net investment income reported in the Financial Highlights, nor are they limited by any expense limitation arrangements between the Fund and the investment adviser.
The Fund allocates realized and unrealized capital gains and losses to a class based on the relative net assets of each class. The Fund allocates income to a class based on the relative value of the settled shares of each class.
| C. | Country Determination — For the purposes of making investment selection decisions and presentation in the Schedule of Investments, the investment adviser may determine the country in which an issuer is located and/or credit risk exposure based on various factors. These factors include the laws of the country under which the issuer is organized, where the issuer maintains a principal office, the country in which the issuer derives 50% or more of its total revenues and the country that has the primary market for the issuer’s securities, as well as other criteria. Among the other criteria that may be evaluated for making this determination are the country in which the issuer maintains 50% or more of its assets, the type of security, financial guarantees and enhancements, the nature of the collateral and the sponsor organization. Country of issuer and/or credit risk exposure has been determined to be the United States of America, unless otherwise noted. |
| D. | Distributions — Distributions from net investment income, if any, are declared daily and paid monthly. Distributions from net realized capital gain, if any, are generally declared and paid annually and recorded on the ex-dividend date. The Fund may elect to treat a portion of the proceeds from redemptions as distributions for federal income tax purposes. |
| E. | Federal Income Taxes — The Fund intends to comply with the requirements of Subchapter M of the Internal Revenue Code of 1986, as amended (the “Internal Revenue Code”), necessary to qualify as a regulated investment company and to distribute substantially all of the Fund’s taxable and tax-exempt earnings to shareholders. As such, the Fund will not be subject to federal income taxes on otherwise taxable income (including net realized capital gain) that is distributed to shareholders. Therefore, no provision for federal income taxes is recorded in the financial statements. |
The Fund recognizes the tax benefits of uncertain tax positions only when the position is more likely than not to be sustained. Management has analyzed the Fund’s uncertain tax positions and concluded that no liability for unrecognized tax benefits should be recorded related to uncertain tax positions. Management is not aware of any tax positions for which it is reasonably possible that the total amounts of unrecognized tax benefits will change materially in the next 12 months.
In addition, the Fund intends to invest in such municipal securities to allow it to qualify to pay shareholders “exempt-interest dividends”, as defined in the Internal Revenue Code.
The Fund files tax returns in the U.S. Federal jurisdiction and certain other jurisdictions. Generally, the Fund is subject to examinations by such taxing authorities for up to three years after the filing of the return for the tax period.
| F. | Expenses — Fees provided for under the Rule 12b-1 plan of a particular class of the Fund and which are directly attributable to that class are charged to the operations of such class. All other expenses are allocated among the classes based on relative net assets. |
| G. | Interest, Facilities and Maintenance Fees — Interest, Facilities and Maintenance Fees include interest and related borrowing costs such as commitment fees and other expenses associated with lines of credit and interest and administrative expenses related to establishing and maintaining floating rate note obligations, if any. |
| H. | Accounting Estimates — The preparation of financial statements in conformity with accounting principles generally accepted in the United States of America (“GAAP”) requires management to make estimates and assumptions that affect the reported amounts of assets and liabilities at the date of the financial statements and the reported amounts of revenues and expenses during the reporting period including estimates and assumptions related to taxation. Actual results could differ from those estimates by a significant amount. In addition, the Fund monitors for material events or transactions that may occur or become known after the period-end date and before the date the financial statements are released to print. |
| I. | Indemnifications — Under the Trust’s organizational documents, each Trustee, officer, employee or other agent of the Trust is indemnified against certain liabilities that may arise out of the performance of their duties to the Fund. Additionally, in the normal course of business, the |
18 Invesco Pennsylvania Tax Free Income Fund
| Fund enters into contracts, including the Fund’s servicing agreements, that contain a variety of indemnification clauses. The Fund’s maximum exposure under these arrangements is unknown as this would involve future claims that may be made against the Fund that have not yet occurred. The risk of material loss as a result of such indemnification claims is considered remote. |
| J. | Floating Rate Note Obligations — The Fund invests in inverse floating rate securities, such as Tender Option Bonds (“TOBs”), for investment purposes and to enhance the yield of the Fund. Such securities may be purchased in the secondary market without first owning an underlying bond but generally are created through the sale of fixed rate bonds by the Fund to special purpose trusts established by a broker dealer or by the Fund (“TOB Trusts”) in exchange for cash and residual interests in the TOB Trusts’ assets and cash flows, which are in the form of inverse floating rate securities. The TOB Trusts finance the purchases of the fixed rate bonds by issuing floating rate notes to third parties and allowing the Fund to retain residual interests in the bonds. The floating rate notes issued by the TOB Trusts have interest rates that reset weekly and the floating rate note holders have the option to tender their notes to the TOB Trusts for redemption at par at each reset date. The residual interests held by the Fund (inverse floating rate securities) include the right of the Fund (1) to cause the holders of the floating rate notes to tender their notes at par at the next interest rate reset date, and (2) to transfer the municipal bond from the TOB Trust to the Fund, thereby collapsing the TOB Trust. Inverse floating rate securities tend to underperform the market for fixed rate bonds in a rising interest rate environment, but tend to outperform the market for fixed rate bonds when interest rates decline or remain relatively stable. |
The Fund generally invests in inverse floating rate securities that include embedded leverage, thus exposing the Fund to greater risks and increased costs. The primary risks associated with inverse floating rate securities are varying degrees of liquidity and decreases in the value of such securities in response to changes in interest rates to a greater extent than fixed rate securities having similar credit quality, redemption provisions and maturity, which may cause the Fund’s net asset value to be more volatile than if it had not invested in inverse floating rate securities. In certain instances, the short-term floating rate notes created by the TOB Trust may not be able to be sold to third parties or, in the case of holders tendering (or putting) such notes for repayment of principal, may not be able to be remarketed to third parties. In such cases, the TOB Trust holding the fixed rate bonds may be collapsed with the entity that contributed the fixed rate bonds to the TOB Trust. In the case where a TOB Trust is collapsed with the Fund, the Fund will be required to repay the principal amount of the tendered securities, which may require the Fund to sell other portfolio holdings to raise cash to meet that obligation. The Fund could therefore be required to sell other portfolio holdings at a disadvantageous time or price to raise cash to meet this obligation, which risk will be heightened during times of market volatility, illiquidity or uncertainty. The embedded leverage in the TOB Trust could cause the Fund to lose more money than the value of the asset it has contributed to the TOB Trust and greater levels of leverage create the potential for greater losses. In addition, a Fund may enter into reimbursement agreements with the liquidity provider of certain TOB transactions in connection with certain residuals held by the Fund. These agreements commit a Fund to reimburse the liquidity provider to the extent that the liquidity provider must provide cash to a TOB Trust, including following the termination of a TOB Trust resulting from a mandatory tender event (“liquidity shortfall”). The reimbursement agreement will effectively make the Fund liable for the amount of the negative difference, if any, between the liquidation value of the underlying security and the purchase price of the floating rate notes issued by the TOB Trust.
The Fund accounts for the transfer of fixed rate bonds to the TOB Trusts as secured borrowings, with the securities transferred remaining in the Fund’s investment assets, and the related floating rate notes reflected as Fund liabilities under the caption Floating rate note obligations on the Statement of Assets and Liabilities. The Fund records the interest income from the fixed rate bonds under the caption Interest and records the expenses related to floating rate obligations and any administrative expenses of the TOB Trusts as a component of Interest, facilities and maintenance fees on the Statement of Operations.
Final rules implementing section 619 of the Dodd-Frank Wall Street Reform and Consumer Protection Act (the “Volcker Rule”) prohibit banking entities from engaging in proprietary trading of certain instruments and limit such entities’ investments in, and relationships with, “covered funds”, as defined in the rules. These rules preclude banking entities and their affiliates from sponsoring and/or providing services for existing TOB Trusts. A new TOB structure is being utilized by the Fund wherein the Fund, as holder of the residuals, will perform certain duties previously performed by banking entities as “sponsors” of TOB Trusts. These duties may be performed by a third-party service provider. The Fund’s expanded role under the new TOB structure may increase its operational and regulatory risk. The new structure is substantially similar to the previous structure; however, pursuant to the Volcker Rule, the remarketing agent would not be able to repurchase tendered floaters for its own account upon a failed remarketing. In the event of a failed remarketing, a banking entity serving as liquidity provider may loan the necessary funds to the TOB Trust to purchase the tendered floaters. The TOB Trust, not the Fund, would be the borrower and the loan from the liquidity provider will be secured by the purchased floaters now held by the TOB Trust. However, as previously described, the Fund would bear the risk of loss with respect to any liquidity shortfall to the extent it entered into a reimbursement agreement with the liquidity provider.
There can be no assurances that the new TOB structure will continue to be a viable form of leverage. Further, there can be no assurances that alternative forms of leverage will be available to the Fund in order to maintain current levels of leverage. Any alternative forms of leverage may be less advantageous to the Fund, and may adversely affect the Fund’s net asset value, distribution rate and ability to achieve its investment objective.
TOBs are presently classified as private placement securities. Private placement securities are subject to restrictions on resale because they have not been registered under the Securities Act of 1933, as amended (the “1933 Act”), or are otherwise not readily marketable. As a result of the absence of a public trading market for these securities, they may be less liquid than publicly traded securities. Although atypical, these securities may be resold in privately negotiated transactions, the prices realized from these sales could be less than those originally paid by the Fund or less than what may be considered the fair value of such securities.
| K. | Other Risks — The value of, payment of interest on, repayment of principal for and the ability to sell a municipal security may be affected by constitutional amendments, legislative enactments, executive orders, administrative regulations, voter initiatives and the economics of the regions in which the issuers are located. |
Since many municipal securities are issued to finance similar projects, especially those relating to education, health care, transportation and utilities, conditions in those sectors can affect the overall municipal securities market and a Fund’s investments in municipal securities.
There is some risk that a portion or all of the interest received from certain tax-free municipal securities could become taxable as a result of determinations by the Internal Revenue Service.
19 Invesco Pennsylvania Tax Free Income Fund
Note 2—Advisory Fees and Other Fees Paid to Affiliates
The Trust has entered into a master investment advisory agreement with Invesco Advisers, Inc. (the “Adviser” or “Invesco”). Effective July 1, 2015, under the terms of the investment advisory agreement, the Fund pays an advisory fee to the Adviser based on the annual rate of the Fund’s average daily net assets as follows:
| Average Daily Net Assets | Rate | |||
First $500 million | 0.50% | |||
Over $500 million | 0.40% | |||
Prior to July 1, 2015, the Fund paid an advisory fee to the advisory based on the annual rate of the Fund’s average daily net assets as follows:
| Average Daily Net Assets | Rate | |||
First $500 million | 0.60% | |||
Over $500 million | 0.50% | |||
For the year ended August 31, 2015, the effective advisory fees incurred by the Fund was 0.58%.
Under the terms of a master sub-advisory agreement between the Adviser and each of Invesco Asset Management Deutschland GmbH, Invesco Asset Management Limited, Invesco Asset Management (Japan) Limited, Invesco Hong Kong Limited, Invesco Senior Secured Management, Inc. and Invesco Canada Ltd. (collectively, the “Affiliated Sub-Advisers”) the Adviser, not the Fund, may pay 40% of the fees paid to the Adviser to any such Affiliated Sub-Adviser(s) that provide(s) discretionary investment management services to the Fund based on the percentage of assets allocated to such Affiliated Sub-Adviser(s).
The Adviser has contractually agreed, through at least June 30, 2016, to waive advisory fees and/or reimburse expenses to the extent necessary to limit total annual fund operating expenses after fee waiver and/or expense reimbursement (excluding certain items discussed below) of Class A, Class B, Class C and Class Y shares to 1.50%, 2.25%, 2.25% and 1.25% of average daily net assets, respectively. In determining the Adviser’s obligation to waive advisory fees and/or reimburse expenses, the following expenses are not taken into account, and could cause total annual fund operating expenses after fee waiver and/or reimbursement to exceed the numbers reflected above: (1) interest, facilities and maintenance fees; (2) taxes; (3) dividend expense on short sales; (4) extraordinary or non-routine items, including litigation expenses; and (5) expenses that the Fund has incurred but did not actually pay because of an expense offset arrangement. Unless Invesco continues the fee waiver agreement, it will terminate on June 30, 2016. The fee waiver agreement cannot be terminated during its term. The Adviser did not waive fees and/or reimburse expenses during the period under this expense limitation.
The Trust has entered into a master administrative services agreement with Invesco pursuant to which the Fund has agreed to pay Invesco for certain administrative costs incurred in providing accounting services to the Fund. For the year ended August 31, 2015, expenses incurred under the agreement are shown in the Statement of Operations as Administrative services fees.
The Trust has entered into a transfer agency and service agreement with Invesco Investment Services, Inc. (“IIS”) pursuant to which the Fund has agreed to pay IIS a fee for providing transfer agency and shareholder services to the Fund and reimburse IIS for certain expenses incurred by IIS in the course of providing such services. IIS may make payments to intermediaries that provide omnibus account services, sub-accounting services and/or networking services. All fees payable by IIS to intermediaries that provide omnibus account services or sub-accounting are charged back to the Fund, subject to certain limitations approved by the Trust’s Board of Trustees. For the year ended August 31, 2015, the expenses incurred under the agreement are shown in the Statement of Operations as Transfer agent fees.
Shares of the Fund are distributed by Invesco Distributors, Inc. (“IDI”). The Fund has adopted a distribution plan pursuant to Rule 12b-1 under the 1940 Act, and a service plan (collectively, the “Plans”) for Class A shares, Class B shares and Class C shares to compensate IDI for the sale, distribution, shareholder servicing and maintenance of shareholder accounts for these shares. Under the Plans, the Fund will incur annual fees of up to 0.25% of Class A average daily net assets and up to 1.00% each of Class B and Class C average daily net assets.
With respect to Class B and Class C shares, the Fund is authorized to reimburse in future years any distribution related expenses that exceed the maximum annual reimbursement rate for such class, so long as such reimbursement does not cause the Fund to exceed the Class B and Class C maximum annual reimbursement rate, respectively. With respect to Class A shares, distribution related expenses that exceed the maximum annual reimbursement rate for such class are not carried forward to future years and the Fund will not reimburse IDI for any such expenses.
For the year ended August 31, 2015, expenses incurred under these agreements are shown in the Statement of Operations as Distribution fees.
Front-end sales commissions and CDSC (collectively, the “sales charges”) are not recorded as expenses of the Fund. Front-end sales commissions are deducted from proceeds from the sales of Fund shares prior to investment in Class A shares of the Fund. CDSC are deducted from redemption proceeds prior to remittance to the shareholder. During the year ended August 31, 2015, IDI advised the Fund that IDI retained $10,888 in front-end sales commissions from the sale of Class A shares $782 and $96 from Class B and Class C shares, respectively, for CDSC imposed on redemptions by shareholders.
Certain officers and trustees of the Trust are officers and directors of the Adviser, IIS and/or IDI.
NOTE 3—Additional Valuation Information
GAAP defines fair value as the price that would be received to sell an asset or paid to transfer a liability in an orderly transaction between market participants at the measurement date, under current market conditions. GAAP establishes a hierarchy that prioritizes the inputs to valuation methods, giving the highest priority to readily available unadjusted quoted prices in an active market for identical assets (Level 1) and the lowest priority to significant unobservable inputs (Level 3), generally when market prices are not readily available or are unreliable. Based on the valuation inputs, the securities or other investments are tiered into one of three levels. Changes in valuation methods may result in transfers in or out of an investment’s assigned level:
| Level 1 — | Prices are determined using quoted prices in an active market for identical assets. |
20 Invesco Pennsylvania Tax Free Income Fund
| Level 2 — | Prices are determined using other significant observable inputs. Observable inputs are inputs that other market participants may use in pricing a security. These may include quoted prices for similar securities, interest rates, prepayment speeds, credit risk, yield curves, loss severities, default rates, discount rates, volatilities and others. |
| Level 3 — | Prices are determined using significant unobservable inputs. In situations where quoted prices or observable inputs are unavailable (for example, when there is little or no market activity for an investment at the end of the period), unobservable inputs may be used. Unobservable inputs reflect the Fund’s own assumptions about the factors market participants would use in determining fair value of the securities or instruments and would be based on the best available information. |
As of August 31, 2015, all of the securities in this Fund were valued based on Level 2 inputs (see the Schedule of Investments for security categories). The level assigned to the securities valuations may not be an indication of the risk or liquidity associated with investing in those securities. Because of the inherent uncertainties of valuation, the values reflected in the financial statements may materially differ from the value received upon actual sale of those investments.
NOTE 4—Expense Offset Arrangement(s)
The expense offset arrangement is comprised of transfer agency credits which result from balances in demand deposit accounts used by the transfer agent for clearing shareholder transactions. For the year ended August 31, 2015, the Fund received credits from this arrangement, which resulted in the reduction of the Fund’s total expenses of $199.
NOTE 5—Trustees’ and Officers’ Fees and Benefits
Trustees’ and Officers’ Fees and Benefits include amounts accrued by the Fund to pay remuneration to certain Trustees and Officers of the Fund. Trustees have the option to defer compensation payable by the Fund, and Trustees’ and Officers’ Fees and Benefits also include amounts accrued by the Fund to fund such deferred compensation amounts. Those Trustees who defer compensation have the option to select various Invesco Funds in which their deferral accounts shall be deemed to be invested. Finally, certain current Trustees were eligible to participate in a retirement plan that provided for benefits to be paid upon retirement to Trustees over a period of time based on the number of years of service. The Fund may have certain former Trustees who also participate in a retirement plan and receive benefits under such plan. Trustees’ and Officers’ Fees and Benefits include amounts accrued by the Fund to fund such retirement benefits. Obligations under the deferred compensation and retirement plans represent unsecured claims against the general assets of the Fund.
NOTE 6—Cash Balances and Borrowings
The Fund is permitted to temporarily carry a negative or overdrawn balance in its account with State Street Bank and Trust Company (“SSB”), the custodian bank. Such balances, if any at period end, are shown in the Statement of Assets and Liabilities under the payable caption Amount due custodian. To compensate the custodian bank for such overdrafts, the overdrawn Fund may either (1) leave funds as a compensating balance in the account so the custodian bank can be compensated by earning the additional interest; or (2) compensate by paying the custodian bank at a rate agreed upon by the custodian bank and Invesco, not to exceed the contractually agreed upon rate.
Inverse floating rate obligations resulting from the transfer of bonds to TOB Trusts are accounted for as secured borrowings. The average floating rate notes outstanding and average annual interest and fee rate related to inverse floating rate note obligations during the year ended August 31, 2015 were $5,486,154 and 0.60%, respectively.
NOTE 7—Distributions to Shareholders and Tax Components of Net Assets
Tax Character of Distributions to Shareholders Paid During the Fiscal Years Ended August 31, 2015 and 2014:
| 2015 | 2014 | |||||||
Ordinary income — tax-exempt | $ | 4,309,672 | $ | 4,808,055 | ||||
Tax Components of Net Assets at Period-End:
| 2015 | ||||
Undistributed ordinary income | $ | 352,340 | ||
Net unrealized appreciation — investments | 7,865,759 | |||
Temporary book/tax differences | (33,733 | ) | ||
Capital loss carryforward | (10,277,188 | ) | ||
Shares of beneficial interest | 128,560,755 | |||
Total net assets | $ | 126,467,933 | ||
The difference between book-basis and tax-basis unrealized appreciation (depreciation) is due to differences in the timing of recognition of gains and losses on investments for tax and book purposes. The Fund’s net unrealized appreciation difference is attributable primarily to TOBs and book to tax accretion and amortization differences.
The temporary book/tax differences are a result of timing differences between book and tax recognition of income and/or expenses. The Fund’s temporary book/tax differences are the result of the trustee deferral of compensation and retirement plan benefits.
Capital loss carryforward is calculated and reported as of a specific date. Results of transactions and other activity after that date may affect the amount of capital loss carryforward actually available for the Fund to utilize. Capital losses generated in years beginning after December 22, 2010 can be carried forward for an unlimited period, whereas previous losses expire in eight tax years. Capital losses with an expiration period may not be used to offset capital gains until all net capital losses without an expiration date have been utilized. Capital loss carryforwards with no expiration date
21 Invesco Pennsylvania Tax Free Income Fund
will retain their character as either short-term or long-term capital losses instead of as short-term capital losses as under prior law. The ability to utilize capital loss carryforwards in the future may be limited under the Internal Revenue Code and related regulations based on the results of future transactions.
The Fund has a capital loss carryforward as of August 31, 2015, which expires as follows:
| Capital Loss Carryforward* | ||||||||||||
| Expiration | Short-Term | Long-Term | Total | |||||||||
August 31, 2017 | $ | 5,564,499 | $ | — | $ | 5,564,499 | ||||||
August 31, 2018 | 1,085,533 | — | 1,085,533 | |||||||||
Not subject to expiration | 426,981 | 3,200,175 | 3,627,156 | |||||||||
| $ | 7,077,013 | $ | 3,200,175 | $ | 10,277,188 | |||||||
| * | Capital loss carryforward as of the date listed above is reduced for limitations, if any, to the extent required by the Internal Revenue Code and may be further limited depending upon a variety of factors, including the realization of net unrealized gains or losses as of the date of any reorganization. |
NOTE 8—Investment Securities
The aggregate amount of investment securities (other than short-term securities, U.S. Treasury obligations and money market funds, if any) purchased and sold by the Fund during the year ended August 31, 2015 was $19,056,869 and $17,350,231, respectively. Cost of investments on a tax basis includes the adjustments for financial reporting purposes as of the most recently completed federal income tax reporting period-end.
| Unrealized Appreciation (Depreciation) of Investment Securities on a Tax Basis | ||||
Aggregate unrealized appreciation of investment securities | $ | 9,480,219 | ||
Aggregate unrealized (depreciation) of investment securities | (1,614,460 | ) | ||
Net unrealized appreciation of investment securities | $ | 7,865,759 | ||
Cost of investments for tax purposes is $125,703,495.
NOTE 9—Reclassification of Permanent Differences
Primarily as a result of differing book/tax treatment of accretion and amortization differences and net operating losses, on August 31, 2015, undistributed net investment income was decreased by $105,122, undistributed net realized gain (loss) was increased by $46,728 and shares of beneficial interest was increased by $58,394. This reclassification had no effect on the net assets of the Fund.
NOTE 10—Share Information
| Summary of Share Activity | ||||||||||||||||
| Years ended August 31, | ||||||||||||||||
| 2015(a) | 2014 | |||||||||||||||
| Shares | Amount | Shares | Amount | |||||||||||||
Sold: | ||||||||||||||||
Class A | 464,914 | $ | 7,705,345 | 269,977 | $ | 4,297,667 | ||||||||||
Class B | 529 | 8,818 | 715 | 11,620 | ||||||||||||
Class C | 56,650 | 939,389 | 36,704 | 581,058 | ||||||||||||
Class Y | 48,185 | 801,208 | 44,355 | 709,714 | ||||||||||||
Issued as reinvestment of dividends: | ||||||||||||||||
Class A | 150,694 | 2,495,101 | 168,578 | 2,690,022 | ||||||||||||
Class B | 1,125 | 18,669 | 1,644 | 26,235 | ||||||||||||
Class C | 9,544 | 158,254 | 12,381 | 197,653 | ||||||||||||
Class Y | 3,529 | 58,463 | 3,026 | 48,313 | ||||||||||||
Automatic conversion of Class B shares to Class A shares: | ||||||||||||||||
Class A | 10,583 | 175,149 | 14,675 | 232,134 | ||||||||||||
Class B | (10,560 | ) | (175,149 | ) | (14,640 | ) | (232,134 | ) | ||||||||
22 Invesco Pennsylvania Tax Free Income Fund
| Summary of Share Activity | ||||||||||||||||
| Years ended August 31, | ||||||||||||||||
| 2015(a) | 2014 | |||||||||||||||
| Shares | Amount | Shares | Amount | |||||||||||||
Reacquired: | ||||||||||||||||
Class A | (691,815 | ) | $ | (11,458,795 | ) | (1,280,624 | ) | $ | (20,216,575 | ) | ||||||
Class B | (8,776 | ) | (145,722 | ) | (5,707 | ) | (88,655 | ) | ||||||||
Class C | (82,985 | ) | (1,378,848 | ) | (159,172 | ) | (2,518,793 | ) | ||||||||
Class Y | (14,088 | ) | (232,031 | ) | (49,444 | ) | (772,866 | ) | ||||||||
Net increase (decrease) in share activity | (62,471 | ) | $ | (1,030,149 | ) | (957,532 | ) | $ | (15,034,607 | ) | ||||||
| (a) | There are entities that are record owners of more than 5% of the outstanding shares of the Fund and in the aggregate own 56% of the outstanding shares of the Fund. IDI has an agreement with these entities to sell Fund shares. The Fund, Invesco and/or Invesco affiliates may make payments to these entities, which are considered to be related to the Fund, for providing services to the Fund, Invesco and/or Invesco affiliates including but not limited to services such as securities brokerage, distribution, third party record keeping and account servicing. The Fund has no knowledge as to whether all or any portion of the shares owned of record by these entities are also owned beneficially. |
NOTE 11—Financial Highlights
The following schedule presents financial highlights for a share of the Fund outstanding throughout the periods indicated.
| Net asset value, beginning of period | Net investment income(a) | Net gains (losses) on securities (both realized and unrealized) | Total from investment operations | Dividends from net investment income | Net asset value, end of period | Total return(b) | Net assets, end of period (000’s omitted) | Ratio of expenses to average net assets with fee waivers and/or expenses absorbed | Supplemental Ratio: Ratio of expenses to average net assets (excluding interest, facilities and maintenance fees) | Ratio of net investment income to average net assets | Portfolio turnover(c) | |||||||||||||||||||||||||||||||||||||
Class A | ||||||||||||||||||||||||||||||||||||||||||||||||
Year ended 08/31/15 | $ | 16.50 | $ | 0.59 | $ | (0.09 | ) | $ | 0.50 | $ | (0.56 | ) | $ | 16.44 | 3.09 | % | $ | 112,409 | 1.12 | %(d) | 1.09 | %(d) | 3.59 | %(d) | 13 | % | ||||||||||||||||||||||
Year ended 08/31/14 | 15.39 | 0.62 | 1.09 | 1.71 | (0.60 | ) | 16.50 | 11.33 | 113,872 | 1.09 | 1.07 | 3.93 | 10 | |||||||||||||||||||||||||||||||||||
Year ended 08/31/13 | 17.05 | 0.63 | (1.65 | ) | (1.02 | ) | (0.64 | ) | 15.39 | (6.24 | ) | 118,936 | 1.03 | 1.01 | 3.72 | 17 | ||||||||||||||||||||||||||||||||
Year ended 08/31/12 | 15.85 | 0.68 | 1.19 | 1.87 | (0.67 | ) | 17.05 | 12.04 | 137,146 | 1.03 | 1.01 | 4.13 | 11 | |||||||||||||||||||||||||||||||||||
Year ended 08/31/11 | 16.29 | 0.70 | (0.47 | ) | 0.23 | (0.67 | ) | 15.85 | 1.58 | 130,344 | 1.02 | 1.00 | 4.47 | 13 | ||||||||||||||||||||||||||||||||||
Class B | ||||||||||||||||||||||||||||||||||||||||||||||||
Year ended 08/31/15 | 16.53 | 0.60 | (0.09 | ) | 0.51 | (0.56 | ) | 16.48 | 3.15 | 1,247 | 1.12 | (d)(e) | 1.09 | (d)(e) | 3.59 | (d)(e) | 13 | |||||||||||||||||||||||||||||||
Year ended 08/31/14 | 15.42 | 0.63 | 1.08 | 1.71 | (0.60 | ) | 16.53 | 11.32 | (e) | 1,544 | 1.09 | (e) | 1.07 | (e) | 3.93 | (e) | 10 | |||||||||||||||||||||||||||||||
Year ended 08/31/13 | 17.09 | 0.63 | (1.66 | ) | (1.03 | ) | (0.64 | ) | 15.42 | (6.28 | )(e) | 1,717 | 1.03 | (e) | 1.01 | (e) | 3.72 | (e) | 17 | |||||||||||||||||||||||||||||
Year ended 08/31/12 | 15.86 | 0.71 | 1.19 | 1.90 | (0.67 | ) | 17.09 | 12.22 | 2,430 | 0.86 | 0.84 | 4.30 | 11 | |||||||||||||||||||||||||||||||||||
Year ended 08/31/11 | 16.23 | 0.70 | (0.45 | ) | 0.25 | (0.62 | ) | 15.86 | 1.68 | (e) | 3,062 | 1.02 | (e) | 1.00 | (e) | 4.47 | (e) | 13 | ||||||||||||||||||||||||||||||
Class C | ||||||||||||||||||||||||||||||||||||||||||||||||
Year ended 08/31/15 | 16.53 | 0.47 | (0.09 | ) | 0.38 | (0.45 | ) | 16.46 | 2.33 | 9,488 | 1.87 | (d) | 1.84 | (d) | 2.84 | (d) | 13 | |||||||||||||||||||||||||||||||
Year ended 08/31/14 | 15.41 | 0.51 | 1.09 | 1.60 | (0.48 | ) | 16.53 | 10.56 | (f) | 9,804 | 1.81 | (f) | 1.79 | (f) | 3.21 | (f) | 10 | |||||||||||||||||||||||||||||||
Year ended 08/31/13 | 17.08 | 0.50 | (1.66 | ) | (1.16 | ) | (0.51 | ) | 15.41 | (7.00 | ) | 10,838 | 1.78 | 1.76 | 2.97 | 17 | ||||||||||||||||||||||||||||||||
Year ended 08/31/12 | 15.88 | 0.56 | 1.19 | 1.75 | (0.55 | ) | 17.08 | 11.19 | 11,020 | 1.78 | 1.76 | 3.38 | 11 | |||||||||||||||||||||||||||||||||||
Year ended 08/31/11 | 16.31 | 0.58 | (0.45 | ) | 0.13 | (0.56 | ) | 15.88 | 0.89 | 9,670 | 1.77 | 1.75 | 3.72 | 13 | ||||||||||||||||||||||||||||||||||
Class Y | ||||||||||||||||||||||||||||||||||||||||||||||||
Year ended 08/31/15 | 16.51 | 0.64 | (0.08 | ) | 0.56 | (0.61 | ) | 16.46 | 3.41 | 3,323 | 0.87 | (d) | 0.84 | (d) | 3.84 | (d) | 13 | |||||||||||||||||||||||||||||||
Year ended 08/31/14 | 15.40 | 0.66 | 1.09 | 1.75 | (0.64 | ) | 16.51 | 11.60 | 2,713 | 0.84 | 0.82 | 4.18 | 10 | |||||||||||||||||||||||||||||||||||
Year ended 08/31/13 | 17.06 | 0.67 | (1.65 | ) | (0.98 | ) | (0.68 | ) | 15.40 | (6.00 | ) | 2,562 | 0.78 | 0.76 | 3.97 | 17 | ||||||||||||||||||||||||||||||||
Year ended 08/31/12 | 15.86 | 0.73 | 1.18 | 1.91 | (0.71 | ) | 17.06 | 12.31 | 1,298 | 0.78 | 0.76 | 4.38 | 11 | |||||||||||||||||||||||||||||||||||
Year ended 08/31/11 | 16.30 | 0.74 | (0.47 | ) | 0.27 | (0.71 | ) | 15.86 | 1.84 | 179 | 0.77 | 0.75 | 4.72 | 13 | ||||||||||||||||||||||||||||||||||
| (a) | Calculated using average shares outstanding. |
| (b) | Includes adjustments in accordance with accounting principles generally accepted in the United States of America and as such, the net asset value for financial reporting purposes and the returns based upon those net asset values may differ from the net asset value and returns for shareholder transactions. Does not include sales charges and is not annualized for periods less than one year, if applicable. |
| (c) | Portfolio turnover is calculated at the fund level and is not annualized for periods less than one year, if applicable. |
| (d) | Ratios are based on average daily net assets (000’s omitted) of $113,654, $1,440, $9,663 and $3,145 for Class A, Class B, Class C and Class Y shares, respectively. |
| (e) | The total return, ratio of expenses to average net assets and ratio of net investment income to average net assets reflect actual 12b-1 fees of 0.25%, 0.25%, 0.25% and 0.25% for the years ended August 31, 2015, August 31, 2014, August 31, 2013 and August 31, 2011, respectively. |
| (f) | The total return, ratio of expenses to average net assets and ratio of net investment income to average net assets reflect actual 12b-1 fees of 0.97% for the year ended August 31, 2014. |
23 Invesco Pennsylvania Tax Free Income Fund
Report of Independent Registered Public Accounting Firm
To the Board of Trustees of AIM Counselor Series Trust (Invesco Counselor Series Trust)
and Shareholders of Invesco Pennsylvania Tax Free Income Fund:
In our opinion, the accompanying statement of assets and liabilities, including the schedule of investments, and the related statements of operations and of changes in net assets and the financial highlights present fairly, in all material respects, the financial position of Invesco Pennsylvania Tax Free Income Fund (one of the funds constituting AIM Counselor Series Trust (Invesco Counselor Series Trust, hereafter referred to as the “Fund”) at August 31, 2015, the results of its operations for the year then ended, the changes in its net assets for each of the two years in the period then ended and the financial highlights for each of the five years in the period then ended, in conformity with accounting principles generally accepted in the United States of America. These financial statements and financial highlights (hereafter referred to as “financial statements”) are the responsibility of the Fund’s management. Our responsibility is to express an opinion on these financial statements based on our audits. We conducted our audits of these financial statements in accordance with the standards of the Public Company Accounting Oversight Board (United States). Those standards require that we plan and perform the audit to obtain reasonable assurance about whether the financial statements are free of material misstatement. An audit includes examining, on a test basis, evidence supporting the amounts and disclosures in the financial statements, assessing the accounting principles used and significant estimates made by management, and evaluating the overall financial statement presentation. We believe that our audits, which included confirmation of securities at August 31, 2015 by correspondence with the custodian and brokers, and the application of alternative auditing procedures where confirmations of security purchases have not been received, provide a reasonable basis for our opinion.
PRICEWATERHOUSECOOPERS LLP
October 27, 2015
Houston, Texas
24 Invesco Pennsylvania Tax Free Income Fund
Calculating your ongoing Fund expenses
Example
As a shareholder of the Fund, you incur two types of costs: (1) transaction costs, which may include sales charges (loads) on purchase payments or contingent deferred sales charges on redemptions, if any; and (2) ongoing costs, including management fees, distribution and/or service (12b-1) fees, and other Fund expenses. This example is intended to help you understand your ongoing costs (in dollars) of investing in the Fund and to compare these costs with ongoing costs of investing in other mutual funds. The example is based on an investment of $1,000 invested at the beginning of the period and held for the entire period March 1, 2015 through August 31, 2015.
Actual expenses
The table below provides information about actual account values and actual expenses. You may use the information in this table, together with the amount you invested, to estimate the expenses that you paid over the period. Simply divide your account value by $1,000 (for example, an $8,600 account value divided by $1,000 = 8.6), then multiply the result by the number in the table under the heading entitled “Actual Expenses Paid During Period” to estimate the expenses you paid on your account during this period.
Hypothetical example for comparison purposes
The table below also provides information about hypothetical account values and hypothetical expenses based on the Fund’s actual expense ratio and an assumed rate of return of 5% per year before expenses, which is not the Fund’s actual return.
The hypothetical account values and expenses may not be used to estimate the actual ending account balance or expenses you paid for the period. You may use this information to compare the ongoing costs of investing in the Fund and other funds. To do so, compare this 5% hypothetical example with the 5% hypothetical examples that appear in the shareholder reports of the other funds.
Please note that the expenses shown in the table are meant to highlight your ongoing costs only and do not reflect any transaction costs, such as sales charges (loads) on purchase payments or contingent deferred sales charges on redemptions, if any. Therefore, the hypothetical information is useful in comparing ongoing costs only, and will not help you determine the relative total costs of owning different funds. In addition, if these transaction costs were included, your costs would have been higher.
| Class | Beginning Account Value (03/01/15) | ACTUAL | HYPOTHETICAL (5% annual return before expenses) | Annualized Ratio2 | ||||||||||||||||||||
| Ending Account Value (08/31/15)1 | Expenses Paid During Period2,3 | Ending Account Value (08/31/15) | Expenses Paid During Period2,4 | |||||||||||||||||||||
A | $ | 1,000.00 | $ | 1,004.50 | $ | 6.11 | $ | 1,019.11 | $ | 6.16 | 1.21 | % | ||||||||||||
B | 1,000.00 | 1,005.10 | 6.12 | 1,019.11 | 6.16 | 1.21 | ||||||||||||||||||
C | 1,000.00 | 1,000.90 | 9.88 | 1,015.32 | 9.96 | 1.96 | ||||||||||||||||||
Y | 1,000.00 | 1,006.30 | 4.85 | 1,020.37 | 4.89 | 0.96 | ||||||||||||||||||
| 1 | The actual ending account value is based on the actual total return of the Fund for the period March 1, 2015 through August 31, 2015, after actual expenses and will differ from the hypothetical ending account value which is based on the Fund’s expense ratio and a hypothetical annual return of 5% before expenses. |
| 2 | Expenses are equal to the Fund’s annualized expense ratio as indicated above multiplied by the average account value over the period, multiplied by 184/365 to reflect the most recent fiscal half year. Effective on July 1, 2015, the Board of Trustees approved a reduced contractual advisory fee schedule for the Fund. Pursuant to the new fee schedule, the Fund’s maximum annual advisory fee rate ranges from 0.50% (for average net assets up to $500 million) to 0.40% (for average net assets over $500 million). The annualized expense ratios restated as if this agreement had been in effect throughout the entire most recent fiscal half year are 1.14%, 1.14%, 1.89% and 0.89% for Class A, Class B, Class C and Class Y shares, respectively. |
| 3 | The actual expenses paid restated as if the change discussed above had been in effect throughout the entire most recent fiscal half year are $5.76, $5.76, $9.53 and $4.50 for Class A, Class B, Class C and Class Y shares, respectively. |
| 4 | The hypothetical expenses paid restated as if the change discussed above had been in effect throughout the entire most recent fiscal half year period are $5.80, $5.80, $9.60 and $4.53 for Class A, Class B, Class C and Class Y shares, respectively. |
25 Invesco Pennsylvania Tax Free Income Fund
Approval of Investment Advisory and Sub-Advisory Contracts
The Board of Trustees (the Board) of AIM Counselor Series Trust (Invesco Counselor Series Trust) is required under the Investment Company Act of 1940, as amended, to approve annually the renewal of Invesco Pennsylvania Tax Free Income Fund’s (the Fund) investment advisory agreements. During contract renewal meetings held on June 9-10, 2015, the Board as a whole, and the disinterested or “independent” Trustees, who comprise over 75% of the Board, voting separately, approved the continuance for the Fund of the Master Investment Advisory Agreement with Invesco Advisers, Inc. (Invesco Advisers and the investment advisory agreement) and the Master Intergroup Sub-Advisory Contract for Mutual Funds with Invesco Asset Management Deutschland GmbH, Invesco Asset Management Limited, Invesco Asset Management (Japan) Limited, Invesco Hong Kong Limited, Invesco Senior Secured Management, Inc. and Invesco Canada Ltd. (collectively, the Affiliated Sub-Advisers and the sub-advisory contracts) for another year, effective July 1, 2015.
In evaluating the fairness and reasonableness of compensation under the Fund’s investment advisory agreement and sub-advisory contracts, the Board considered, among other things, the factors discussed below. The Board determined that continuation of the Fund’s investment advisory agreement and the sub-advisory contracts is in the best interest of the Fund and its shareholders and that the compensation payable to Invesco Advisers and the Affiliated Sub-Advisers under the agreements is fair and reasonable.
The Board’s Fund Evaluation Process
The Board’s Investments Committee has established three Sub-Committees, each of which is primarily responsible for overseeing the performance and investment management services provided by Invesco Advisers and the Affiliated Sub-Advisers to a number of the funds advised by Invesco Advisers (the Invesco Funds). The Sub-Committees meet throughout the year to review the performance of their assigned Invesco Funds, including reviewing materials prepared under the direction of the independent Senior Officer, an officer of the Invesco Funds who reports directly to the independent Trustees. Over the course of each year, the Sub-Committees meet with portfolio managers for their assigned Invesco Funds and other members of management to review the performance, investment objective(s), policies, strategies, limitations and investment risks of these funds. The Board had the benefit of reports from the Sub-Committees and Investments Committee throughout the year in considering approval of the continuance of each Invesco Fund’s investment advisory agreement and sub-advisory contracts for another year.
During the contract renewal process, the Board receives comparative performance and fee data regarding the Invesco Funds prepared by Invesco Advisers and Lipper Inc. (Lipper), an independent provider of investment company data. The Board also receives a report and this independent written evaluation from the Senior Officer. The Senior Officer’s evaluation is prepared as part of his responsibility to manage the process by which the Invesco Funds’ proposed management fees are negotiated during the annual contract renewal process to ensure they are negotiated in a manner that is at arms’ length and reasonable. In addition to meetings with Invesco Advisers and fund counsel, the independent Trustees also discuss the continuance of the investment advisory agreement and sub-advisory contracts in separate sessions with the Senior Officer and with independent legal counsel.
The Trustees recognized that the advisory fee rates for the Invesco Funds are, in many cases, the result of years of review and negotiation. The Trustees’ deliberations and conclusions in a particular year may be based in part on their deliberations and conclusions regarding these arrangements throughout the year and in prior years. The Trustees’ review and conclusions are based on the comprehensive consideration of all information presented to them and are not the result of any single determinative factor. Moreover, one Trustee may have weighed a particular piece of information or factor differently than another Trustee.
The discussion below is a summary of the Senior Officer’s independent written evaluation with respect to the Fund’s investment advisory agreement as well as a discussion of the material factors and related conclusions that formed the basis for the Board’s approval of the Fund’s investment advisory agreement and sub-advisory contracts. Unless otherwise stated, this information is current as of June 10, 2015, and does not reflect consideration of factors that became known to the Board after that date.
Factors and Conclusions and Summary of Independent Written Fee Evaluation
| A. | Nature, Extent and Quality of Services Provided by Invesco Advisers and the Affiliated Sub-Advisers |
The Board reviewed the advisory services provided to the Fund by Invesco Advisers under the Fund’s investment advisory agreement, the performance of Invesco Advisers in providing these services, and the credentials and experience of the officers and employees of Invesco Advisers who provide these services, including the Fund’s portfolio manager or managers. The Board’s review of the qualifications of Invesco Advisers to provide advisory services included the Board’s consideration of Invesco Advisers’ investment
process oversight, independent credit analysis and investment risk management. The Board also considered non-advisory services that Invesco Advisers and its affiliates provide to the Invesco Funds such as various back office support functions, equity and fixed income trading operations, internal audit, distribution, valuation and legal and compliance.
In determining whether to continue the Fund’s investment advisory agreement, the Board considered the benefits of reapproving an existing relationship and the greater uncertainty that may be associated with entering into a new relationship. The Board concluded that the nature, extent and quality of the services provided to the Fund by Invesco Advisers are appropriate and satisfactory and consistent with the terms of the Fund’s investment advisory agreement.
The Board reviewed the services that may be provided by the Affiliated Sub-Advisers under the sub-advisory contracts and the credentials and experience of the officers and employees of the Affiliated Sub-Advisers who provide these services. The Board concluded that the sub-advisory contracts benefit the Fund and its shareholders by permitting Invesco Advisers to use the resources and talents of the Affiliated Sub-Advisers in managing the Fund. The Board concluded that the nature, extent and quality of the services that may be provided by the Affiliated Sub-Advisers are appropriate and satisfactory and consistent with the terms of the Fund’s sub-advisory contracts.
| B. | Fund Performance |
The Board considered Fund performance as a relevant factor in considering whether to approve the investment advisory agreement. The Board did not view Fund performance as a relevant factor in considering whether to approve the sub-advisory contracts for the Fund, as no Affiliated Sub-Adviser currently manages assets of the Fund.
The Board compared the Fund’s performance during the past one, three and five calendar years to the performance of funds in the Lipper performance universe and against the Lipper Pennsylvania Municipal Debt Funds Index. The Board noted that performance of Class A shares of the Fund was in the first quintile of its performance universe for the one year period and the second quintile for the three and five year periods (the first quintile being the best performing funds and the fifth quintile being the worst performing funds). The Board noted that performance of Class A shares of the Fund was above the performance of the Index for the one, three and five year periods. The Trustees also reviewed more recent Fund performance and this review did not change their conclusions.
| C. | Advisory and Sub-Advisory Fees |
The Board compared the Fund’s contractual management fee rate to the contractual management fee rates of funds in the Fund’s
26 Invesco Pennsylvania Tax Free Income Fund
Lipper expense group at a common asset level. The Board noted that the contractual management fee rate for Class A shares of the Fund was above the median contractual management fee rate of funds in its expense group. The Board noted that the term “contractual management fee” may include both advisory and certain administrative services fees, but that Lipper does not provide information on a fund by fund basis as to what is included. The Board noted that Invesco Advisers does not charge the Invesco Funds for the administrative services included in the term as defined by Lipper. The Board also reviewed the methodology used by Lipper in providing expense group information, which includes using each fund’s contractual management fee schedule (including any applicable breakpoints) as reported in the most recent prospectus or statement of additional information for each fund in the expense group.
The Board also compared the Fund’s effective advisory fee rate (the advisory fee rate after advisory fee waivers and before other expense limitations/waivers) to the effective advisory fee rates of other funds advised by Invesco Advisers and its affiliates with investment strategies comparable to those of the Fund. The Board noted that the Fund’s rate was below the rate of one closed end fund.
The Board noted that Invesco Advisers and the Affiliated Sub-Advisers do not manage other client accounts with investment strategies comparable to those of the Fund.
The Board also considered the services that may be provided by the Affiliated Sub-Advisers pursuant to the sub-advisory contracts, as well as the fees payable by Invesco Advisers to the Affiliated Sub-Advisers pursuant to the sub-advisory contracts. The Board also noted that the sub-advisory fees are not paid directly by the Fund, but rather, are payable by Invesco Advisers to the Affiliated Sub-Advisers.
| D. | Economies of Scale and Breakpoints |
The Board considered the extent to which there are economies of scale in the provision of advisory services to the Fund. The Board also considered whether the Fund benefits from economies of scale through contractual breakpoints in the Fund’s advisory fee schedule. The Board also noted that the Fund shares directly in economies of scale through lower fees charged by third party service providers based on the combined size of the Invesco Funds and other clients advised by Invesco Advisers.
| E. | Profitability and Financial Resources |
The Board reviewed information from Invesco Advisers concerning the costs of the advisory and other services that Invesco Advisers and its affiliates provide to the Fund and the Invesco Funds and the profitability of Invesco Advisers and its affiliates in providing these services. The Board received information from Invesco Advisers about the methodology used to prepare the profitability information. The Board noted that Invesco Advisers continues to operate at a net profit from services Invesco
Advisers and its affiliates provide to the Invesco Funds and the Fund. The Board did not deem the level of profits realized by Invesco Advisers and its affiliates from providing services to the Fund to be excessive given the nature, quality and extent of the services provided. The Board received and accepted information from Invesco Advisers demonstrating that Invesco Advisers and each Affiliated Sub-Adviser are financially sound and have the resources necessary to perform their obligations under the investment advisory agreement and sub-advisory contracts.
| F. | Collateral Benefits to Invesco Advisers and its Affiliates |
The Board considered various other benefits received by Invesco Advisers and its affiliates from the relationship with the Fund, including the fees received for providing transfer agency and distribution services to the Fund. The Board considered comparative information regarding fees charged for these services, including information provided by Lipper and other independent sources. The Board considered the performance of Invesco Advisers and its affiliates in providing these services and the organizational structure employed to provide these services. The Board also considered that these services are provided to the Fund pursuant to written contracts that are reviewed and approved on an annual basis by the Board; and that the services are required for the operation of the Fund.
The Board considered the benefits realized by Invesco Advisers and the Affiliated Sub-Advisers as a result of portfolio brokerage transactions executed through “soft dollar” arrangements. Invesco Advisers noted that the Fund does not execute brokerage transactions through “soft dollar” arrangements to any significant degree.
The Board considered that the Fund’s uninvested cash and cash collateral from any securities lending arrangements may be invested in money market funds advised by Invesco Advisers pursuant to procedures approved by the Board. The Board noted that Invesco Advisers receives advisory fees from these affiliated money market funds attributable to such investments, although Invesco Advisers has contractually agreed to waive through varying periods the advisory fees payable by the Invesco Funds with respect to investments in the affiliated money market funds. The waiver is in an amount equal to 100% of the net advisory fee Invesco Advisers receives from the affiliated money market funds with respect to the Fund’s investment in the affiliated money market funds of uninvested cash, but not cash collateral. The Board concluded that the amount of advisory fees received by Invesco Advisors from the Fund’s investment of cash collateral from any securities lending arrangements in the affiliated money market funds is fair and reasonable.
27 Invesco Pennsylvania Tax Free Income Fund
Tax Information
Form 1099-DIV, Form 1042-S and other year–end tax information provide shareholders with actual calendar year amounts that should be included in their tax returns. Shareholders should consult their tax advisors.
The following distribution information is being provided as required by the Internal Revenue Code or to meet a specific state’s requirement.
The Fund designates the following amounts or, if subsequently determined to be different, the maximum amount allowable for its fiscal year ended August 31, 2015:
Federal and State Income Tax | ||||
Qualified Dividend Income* | 0 | % | ||
Corporate Dividends Received Deduction* | 0 | % | ||
U.S. Treasury Obligations* | 0 | % | ||
Tax-Exempt Interest Dividends* | 100 | % | ||
| * | The above percentages are based on ordinary income dividends paid to shareholders during the Fund’s fiscal year. |
28 Invesco Pennsylvania Tax Free Income Fund
Trustees and Officers
The address of each trustee and officer is AIM Counselor Series Trust (Invesco Counselor Series Trust) (the “Trust”), 11 Greenway Plaza, Suite 1000, Houston, Texas 77046-1173. The trustees serve for the life of the Trust, subject to their earlier death, incapacitation, resignation, retirement or removal as more specifically provided in the Trust’s organizational documents. Each officer serves for a one year term or until their successors are elected and qualified. Column two below includes length of time served with predecessor entities, if any.
| Name, Year of Birth and Position(s) Held with the Trust | Trustee and/ or Officer Since | Principal Occupation(s) During Past 5 Years | Number of Funds in Fund Complex Overseen by Trustee | Other Directorship(s) Held by Trustee During Past 5 Years | ||||
| Interested Persons | ||||||||
| Martin L. Flanagan1 — 1960 Trustee | 2007 | Executive Director, Chief Executive Officer and President, Invesco Ltd. (ultimate parent of Invesco and a global investment management firm); Advisor to the Board, Invesco Advisers, Inc. (formerly known as Invesco Institutional (N.A.), Inc.); Trustee, The Invesco Funds; Vice Chair, Investment Company Institute; and Member of Executive Board, SMU Cox School of Business
Formerly: Chairman and Chief Executive Officer, Invesco Advisers, Inc. (registered investment adviser); Director, Chairman, Chief Executive Officer and President, IVZ Inc. (holding company), INVESCO Group Services, Inc. (service provider) and Invesco North American Holdings, Inc. (holding company); Director, Chief Executive Officer and President, Invesco Holding Company Limited (parent of Invesco and a global investment management firm); Director, Invesco Ltd.; Chairman, Investment Company Institute and President, Co-Chief Executive Officer, Co-President, Chief Operating Officer and Chief Financial Officer, Franklin Resources, Inc. (global investment management organization). | 144 | None | ||||
| Philip A. Taylor2 — 1954 Trustee, President and Principal Executive Officer | 2006 | Head of North American Retail and Senior Managing Director, Invesco Ltd.; Director, Co-Chairman, Co-President and Co-Chief Executive Officer, Invesco Advisers, Inc. (formerly known as Invesco Institutional (N.A.), Inc.) (registered investment adviser); Director, Chairman, Chief Executive Officer and President, Invesco Management Group, Inc. (formerly known as Invesco Aim Management Group, Inc.) (financial services holding company); Director and President, INVESCO Funds Group, Inc. (registered investment adviser and registered transfer agent); Director and Chairman, Invesco Investment Services, Inc. (formerly known as Invesco Aim Investment Services, Inc.) (registered transfer agent) and IVZ Distributors, Inc. (formerly known as INVESCO Distributors, Inc.) (registered broker dealer); Director, President and Chairman, Invesco Inc. (holding company), Invesco Canada Holdings Inc. (holding company), Trimark Investments Ltd./Placements Trimark Ltèe and Invesco Financial Services Ltd/Services Financiers Invesco Ltèe; Chief Executive Officer, Invesco Corporate Class Inc. (corporate mutual fund company) Director, Chairman and Chief Executive Officer, Invesco Canada Ltd. (formerly known as Invesco Trimark Ltd./Invesco Trimark Ltèe) (registered investment adviser and registered transfer agent); Trustee, President and Principal Executive Officer, The Invesco Funds (other than AIM Treasurer’s Series Trust (Invesco Treasurer’s Series Trust), Short-Term Investments Trust and Invesco Management Trust); Trustee and Executive Vice President, The Invesco Funds (AIM Treasurer’s Series Trust (Invesco Treasurer’s Series Trust), Short-Term Investments Trust and Invesco Management Trust only); Director, Invesco Investment Advisers LLC (formerly known as Van Kampen Asset Management); Director, Chief Executive Officer and President, Van Kampen Exchange Corp.
Formerly: Chief Executive Officer, Invesco Canada Fund Inc (corporate mutual fund company); Director and Chairman, Van Kampen Investor Services Inc.; Director, Chief Executive Officer and President, 1371 Preferred Inc. (holding company) and Van Kampen Investments Inc.; Director and President, AIM GP Canada Inc. (general partner for limited partnerships) and Van Kampen Advisors, Inc.; Director and Chief Executive Officer, Invesco Trimark Dealer Inc. (registered broker dealer); Director, Invesco Distributors, Inc. (formerly known as Invesco Aim Distributors, Inc.) (registered broker dealer); Manager, Invesco PowerShares Capital Management LLC; Director, Chief Executive Officer and President, Invesco Advisers, Inc.; Director, Chairman, Chief Executive Officer and President, Invesco Aim Capital Management, Inc.; President, Invesco Trimark Dealer Inc. and Invesco Trimark Ltd./Invesco Trimark Ltèe; Director and President, AIM Trimark Corporate Class Inc. and AIM Trimark Canada Fund Inc.; Senior Managing Director, Invesco Holding Company Limited; Director and Chairman, Fund Management Company (former registered broker dealer); President and Principal Executive Officer, The Invesco Funds (AIM Treasurer’s Series Trust (Invesco Treasurer’s Series Trust), and Short-Term Investments Trust only); President, AIM Trimark Global Fund Inc. and AIM Trimark Canada Fund Inc.. | 144 | None |
| 1 | Mr. Flanagan is considered an interested person (within the meaning of Section 2(a)(19) of the 1940 Act) of the Trust because he is an officer of the Adviser to the Trust, and an officer and a director of Invesco Ltd., ultimate parent of the Adviser. |
| 2 | Mr. Taylor is considered an interested person (within the meaning of Section 2(a)(19) of the 1940 Act) of the Trust because he is an officer and a director of the Adviser. |
T-1 Invesco Pennsylvania Tax Free Income Fund
Trustees and Officers—(continued)
| Name, Year of Birth and Position(s) Held with the Trust | Trustee and/ or Officer Since | Principal Occupation(s) During Past 5 Years | Number of Funds in Fund Complex Overseen by Trustee | Other Directorship(s) Held by Trustee During Past 5 Years | ||||
| Independent Trustees | ||||||||
Bruce L. Crockett — 1944 Trustee and Chair | 2003 | Chairman, Crockett Technologies Associates (technology consulting company)
Formerly: Director, Captaris (unified messaging provider); Director, President and Chief Executive Officer, COMSAT Corporation; Chairman, Board of Governors of INTELSAT (international communications company); ACE Limited (insurance company); Independent Directors Council and Investment Company Institute | 144 | ALPS (Attorneys Liability Protection Society) (insurance company) and Globe Specialty Metals, Inc. (metallurgical company) | ||||
David C. Arch — 1945 Trustee | 2010 | Chairman of Blistex Inc., a consumer health care products manufacturer | 144 | Board member of the Illinois Manufacturers’ Association; Member of the Board of Visitors, Institute for the Humanities, University of Michigan; Member of the Audit Committee of the Edward-Elmhurst Hospital | ||||
James T. Bunch — 1942 Trustee | 2000 | Managing Member, Grumman Hill Group LLC (family office/private equity investments)
Formerly: Founder, Green Manning & Bunch Ltd. (investment banking firm) (1988-2010); Executive Committee, United States Golf Association; and Chairman, Board of Governors, Western Golf Association | 144 | Chairman of the Board of Trustees, Evans Scholars Foundation; and Chairman of the Board, Denver Film Society | ||||
Rodney F. Dammeyer — 1940 Trustee | 2010 | Chairman of CAC, LLC, (private company offering capital investment and management advisory services)
Formerly: Prior to 2001, Managing Partner at Equity Group Corporate Investments; Prior to 1995, Chief Executive Officer of Itel Corporation (formerly Anixter International); Prior to 1985, experience includes Senior Vice President and Chief Financial Officer of Household International, Inc., Executive Vice President and Chief Financial Officer of Northwest Industries, Inc. and Partner of Arthur Andersen & Co.; From 1987 to 2010, Director/Trustee of investment companies in the Van Kampen Funds complex | 144 | Director of Quidel Corporation and Stericycle, Inc. | ||||
Albert R. Dowden — 1941 Trustee | 2003 | Director of a number of public and private business corporations, including the Boss Group, Ltd. (private investment and management); Nature’s Sunshine Products, Inc. and Reich & Tang Funds (5 portfolios) (registered investment company)
Formerly: Director, Homeowners of America Holding Corporation/Homeowners of America Insurance Company (property casualty company); Director, Continental Energy Services, LLC (oil and gas pipeline service); Director, CompuDyne Corporation (provider of product and services to the public security market) and Director, Annuity and Life Re (Holdings), Ltd. (reinsurance company); Director, President and Chief Executive Officer, Volvo Group North America, Inc.; Senior Vice President, AB Volvo; Director of various public and private corporations; Chairman, DHJ Media, Inc.; Director, Magellan Insurance Company; and Director, The Hertz Corporation, Genmar Corporation (boat manufacturer), National Media Corporation; Advisory Board of Rotary Power International (designer, manufacturer, and seller of rotary power engines); and Chairman, Cortland Trust, Inc. (registered investment company) | 144 | Director of: Nature’s Sunshine Products, Inc., Reich & Tang Funds, Homeowners of America Holding Corporation/ Homeowners of America Insurance Company, the Boss Group | ||||
Jack M. Fields — 1952 Trustee | 2003 | Chief Executive Officer, Twenty First Century Group, Inc. (government affairs company); Owner and Chief Executive Officer, Dos Angeles Ranch, L.P. (cattle, hunting, corporate entertainment); and Discovery Global Education Fund (non-profit)
Formerly: Chief Executive Officer, Texana Timber LP (sustainable forestry company); Director of Cross Timbers Quail Research Ranch (non-profit); and member of the U.S. House of Representatives | 144 | Insperity, Inc. (formerly known as Administaff) | ||||
Prema Mathai-Davis — 1950 Trustee | 2003 | Retired. Formerly: Chief Executive Officer, YWCA of the U.S.A. | 144 | None | ||||
Larry Soll — 1942 Trustee | 1997 | Retired. Formerly: Chairman, Chief Executive Officer and President, Synergen Corp. (a biotechnology company) | 144 | None | ||||
Hugo F. Sonnenschein — 1940 Trustee | 2010 | President Emeritus and Honorary Trustee of the University of Chicago and the Adam Smith Distinguished Service Professor in the Department of Economics at the University of Chicago. Prior to 2000, President of the University of Chicago | 144 | Trustee of the University of Rochester and a member of its investment committee; Member of the National Academy of Sciences and the American Philosophical Society; Fellow of the American Academy of Arts and Sciences | ||||
| Raymond Stickel, Jr. — 1944 Trustee | 2005 | Retired. Formerly: Director, Mainstay VP Series Funds, Inc. (25 portfolios) and Partner, Deloitte & Touche | 144 | None |
T-2 Invesco Pennsylvania Tax Free Income Fund
Trustees and Officers—(continued)
| Name, Year of Birth and Position(s) Held with the Trust | Trustee and/ or Officer Since | Principal Occupation(s) During Past 5 Years | Number of Funds in Fund Complex Overseen by Trustee | Other Directorship(s) Held by Trustee During Past 5 Years | ||||
| Independent Trustees—(continued) | ||||||||
Suzanne H. Woolsey — 1941 Trustee | 2014 | Chief Executive Officer of Woolsey Partners LLC | 144 | Emeritus Chair of the Board of Trustees of the Institute for Defense Analyses; Trustee of Colorado College; Trustee of California Institute of Technology; Prior to 2014, Director of Fluor Corp.; Prior to 2010, Trustee of the German Marshall Fund of the United States; Prior to 2010 Trustee of the Rocky Mountain Institute | ||||
| Other Officers | ||||||||
Russell C. Burk — 1958 Senior Vice President and Senior Officer | 2005 | Senior Vice President and Senior Officer, The Invesco Funds | N/A | N/A | ||||
John M. Zerr — 1962 Senior Vice President, Chief Legal Officer and Secretary | 2006 | Director, Senior Vice President, Secretary and General Counsel, Invesco Management Group, Inc. (formerly known as Invesco Aim Management Group, Inc.) and Van Kampen Exchange Corp.; Senior Vice President, Invesco Advisers, Inc. (formerly known as Invesco Institutional (N.A.), Inc.) (registered investment adviser); Senior Vice President and Secretary, Invesco Distributors, Inc. (formerly known as Invesco Aim Distributors, Inc.); Director, Vice President and Secretary, Invesco Investment Services, Inc. (formerly known as Invesco Aim Investment Services, Inc.) and IVZ Distributors, Inc. (formerly known as INVESCO Distributors, Inc.); Director and Vice President, INVESCO Funds Group, Inc.; Senior Vice President, Chief Legal Officer and Secretary, The Invesco Funds; Managing Director, Invesco PowerShares Capital Management LLC; Director, Secretary and General Counsel, Invesco Investment Advisers LLC (formerly known as Van Kampen Asset Management); Secretary and General Counsel, Invesco Capital Markets, Inc. (formerly known as Van Kampen Funds Inc.) and Chief Legal Officer, PowerShares Exchange-Traded Fund Trust, PowerShares Exchange-Traded Fund Trust II, PowerShares India Exchange-Traded Fund Trust, PowerShares Actively Managed Exchange-Traded Fund Trust, and PowerShares Actively Managed Exchange-Traded Commodity Fund Trust
Formerly: Director and Vice President, Van Kampen Advisors Inc.; Director, Vice President, Secretary and General Counsel, Van Kampen Investor Services Inc.; Director, Invesco Distributors, Inc. (formerly known as Invesco Aim Distributors, Inc.); Director, Senior Vice President, General Counsel and Secretary, Invesco Aim Advisers, Inc. and Van Kampen Investments Inc.; Director, Vice President and Secretary, Fund Management Company; Director, Senior Vice President, Secretary, General Counsel and Vice President, Invesco Aim Capital Management, Inc.; Chief Operating Officer and General Counsel, Liberty Ridge Capital, Inc. (an investment adviser); Vice President and Secretary, PBHG Funds (an investment company) and PBHG Insurance Series Fund (an investment company); Chief Operating Officer, General Counsel and Secretary, Old Mutual Investment Partners (a broker-dealer); General Counsel and Secretary, Old Mutual Fund Services (an administrator) and Old Mutual Shareholder Services (a shareholder servicing center); Executive Vice President, General Counsel and Secretary, Old Mutual Capital, Inc. (an investment adviser); and Vice President and Secretary, Old Mutual Advisors Funds (an investment company) | N/A | N/A | ||||
| Sheri Morris — 1964 Vice President, Treasurer and Principal Financial Officer | 2003 | Vice President, Treasurer and Principal Financial Officer, The Invesco Funds; Vice President, Invesco Advisers, Inc. (formerly known as Invesco Institutional (N.A.), Inc.) (registered investment adviser); and Vice President, PowerShares Exchange-Traded Fund Trust, PowerShares Exchange-Traded Fund Trust II, PowerShares India Exchange-Traded Fund Trust, PowerShares Actively Managed Exchange-Traded Fund Trust, and PowerShares Actively Managed Exchange-Traded Commodity Fund Trust
Formerly: Vice President, Invesco Aim Advisers, Inc., Invesco Aim Capital Management, Inc. and Invesco Aim Private Asset Management, Inc.; Assistant Vice President and Assistant Treasurer, The Invesco Funds and Assistant Vice President, Invesco Advisers, Inc., Invesco Aim Capital Management, Inc. and Invesco Aim Private Asset Management, Inc.; and Treasurer, PowerShares Exchange-Traded Fund Trust, PowerShares Exchange-Traded Fund Trust II, PowerShares India Exchange-Traded Fund Trust and PowerShares Actively Managed Exchange-Traded Fund Trust | N/A | N/A | ||||
T-3 Invesco Pennsylvania Tax Free Income Fund
Trustees and Officers—(continued)
| Name, Year of Birth and Position(s) Held with the Trust | Trustee and/ or Officer Since | Principal Occupation(s) During Past 5 Years | Number of Funds in Fund Complex Overseen by Trustee | Other Directorship(s) Held by Trustee During Past 5 Years | ||||
| Other Officers—(continued) | ||||||||
| Karen Dunn Kelley — 1960 Vice President | 2003 | Senior Managing Director, Investments, Invesco Ltd.; Director, Co-President, Co-Chief Executive Officer, and Co-Chairman, Invesco Advisers, Inc. (formerly known as Invesco Institutional (N.A.), Inc.) (registered investment adviser); Chairman, Invesco Senior Secured Management, Inc.; Senior Vice President, Invesco Management Group, Inc. (formerly known as Invesco Aim Management Group, Inc.); Executive Vice President, Invesco Distributors, Inc. (formerly known as Invesco Aim Distributors, Inc.); Director, Invesco Mortgage Capital Inc. and Invesco Management Company Limited; Vice President, The Invesco Funds (other than AIM Treasurer’s Series Trust (Invesco Treasurer’s Series Trust), Short-Term Investments Trust and Invesco Management Trust); and President and Principal Executive Officer, The Invesco Funds (AIM Treasurer’s Series Trust (Invesco Treasurer’s Series Trust), Short-Term Investments Trust and Invesco Management Trust only)
Formerly: Director and President, INVESCO Asset Management (Bermuda) Ltd., Director, INVESCO Global Asset Management Limited and INVESCO Management S.A.; Senior Vice President, Van Kampen Investments Inc. and Invesco Advisers, Inc. (formerly known as Invesco Institutional (N.A.), Inc.) (registered investment adviser); Vice President, Invesco Advisers, Inc. (formerly known as Invesco Institutional (N.A.), Inc.); Director of Cash Management and Senior Vice President, Invesco Advisers, Inc. and Invesco Aim Capital Management, Inc.; Director and President, Fund Management Company; Chief Cash Management Officer, Director of Cash Management, Senior Vice President, and Managing Director, Invesco Aim Capital Management, Inc.; Director of Cash Management, Senior Vice President, and Vice President, Invesco Advisers, Inc. and The Invesco Funds (AIM Treasurer’s Series Trust (Invesco Treasurer’s Series Trust), and Short-Term Investments Trust only) | N/A | N/A | ||||
| Crissie M. Wisdom — 1969 Anti-Money Laundering Compliance Officer | 2013 | Anti-Money Laundering Compliance Officer, Invesco Advisers, Inc. (formerly known as Invesco Institutional (N.A.), Inc.) (registered investment adviser), Invesco Capital Markets, Inc. (formerly known as Van Kampen Funds Inc.), Invesco Distributors, Inc., Invesco Investment Services, Inc., Invesco Management Group, Inc., Van Kampen Exchange Corp., The Invesco Funds, and PowerShares Exchange-Traded Fund Trust, PowerShares Exchange-Traded Fund Trust II, PowerShares India Exchange-Traded Fund Trust, PowerShares Actively Managed Exchange-Traded Fund Trust and PowerShares Actively Managed Exchange-Traded Commodity Fund Trust; Anti-Money Laundering Compliance Officer and Bank Secrecy Act Officer, INVESCO National Trust Company and Invesco Trust Company; and Fraud Prevention Manager and Controls and Risk Analysis Manager for Invesco Investment Services, Inc.. | N/A | N/A | ||||
Lisa O. Brinkley — 1959 Chief Compliance Officer | 2004 | Senior Vice President and Chief Compliance Officer, Invesco Advisers, Inc. (registered investment adviser) (formerly known as Invesco Institutional (N.A., Inc.); and Chief Compliance Officer, The Invesco Funds
Formerly: Global Assurance Officer, Invesco Ltd. and Vice President, The Invesco Funds; Chief Compliance Officer, Invesco Distributors, Inc. (formerly known as Invesco Aim Distributors, Inc.), Invesco Investment Services, Inc.(formerly known as Invesco Aim Investment Services, Inc.) and Van Kampen Investor Services Inc.; Senior Vice President, Invesco Management Group, Inc.; Senior Vice President and Chief Compliance Officer, Invesco Advisers, Inc. and The Invesco Funds; Vice President and Chief Compliance Officer, Invesco Aim Capital Management, Inc. and Invesco Distributors, Inc.; Vice President, Invesco Investment Services, Inc. and Fund Management Company. | N/A | N/A |
The Statement of Additional Information of the Trust includes additional information about the Fund’s Trustees and is available upon request, without charge, by calling 1.800.959.4246. Please refer to the Fund’s prospectus for information on the Fund’s sub-advisers.
Office of the Fund 11 Greenway Plaza, Suite 1000 Houston, TX 77046-1173 | Investment Adviser Invesco Advisers, Inc. 1555 Peachtree Street, N.E. Atlanta, GA 30309 | Distributor Invesco Distributors, Inc. 11 Greenway Plaza, Suite 1000 Houston, TX 77046-1173 | Auditors PricewaterhouseCoopers LLP 1000 Louisiana Street, Suite 5800 Houston, TX 77002-5678 | |||
Counsel to the Fund Stradley Ronon Stevens & Young, LLP 2005 Market Street, Suite 2600 Philadelphia, PA 19103-7018 | Counsel to the Independent Trustees Goodwin Procter LLP 901 New York Avenue, N.W. Washington, D.C. 20001 | Transfer Agent Invesco Investment Services, Inc. 11 Greenway Plaza, Suite 1000 Houston, TX 77046-1173 | Custodian State Street Bank and Trust Company 225 Franklin Street Boston, MA 02110-2801 | |||
T-4 Invesco Pennsylvania Tax Free Income Fund

Invesco mailing information
Send general correspondence to Invesco Investment Services, Inc., P.O. Box 219078, Kansas City, MO 64121-9078.
Important notice regarding delivery of security holder documents
To reduce Fund expenses, only one copy of most shareholder documents may be mailed to shareholders with multiple accounts at the same address (Householding). Mailing of your shareholder documents may be householded indefinitely unless you instruct us otherwise. If you do not want the mailing of these documents to be combined with those for other members of your household, please contact Invesco Investment Services, Inc. at 800 959 4246 or contact your financial institution. We will begin sending you individual copies for each account within 30 days after receiving your request.
Fund holdings and proxy voting information
The Fund provides a complete list of its holdings four times in each fiscal year, at the quarter ends. For the second and fourth quarters, the lists appear in the Fund’s semiannual and annual reports to shareholders. For the first and third quarters, the Fund files the lists with the Securities and Exchange Commission (SEC) on Form N-Q. The most recent list of portfolio holdings is available at invesco.com/completeqtrholdings. Shareholders can also look up the Fund’s Forms N-Q on the SEC website at sec.gov. Copies of the Fund’s Forms N-Q may be reviewed and copied at the SEC Public Reference Room in Washington, D.C. You can obtain information on the operation of the Public Reference Room, including information about duplicating fee charges, by calling 202 551 8090 or 800 732 0330, or by electronic request at the following email address: publicinfo@sec.gov.
The SEC file numbers for the Fund are shown below.
A description of the policies and procedures that the Fund uses to determine how to vote proxies relating to portfolio securities is available without charge, upon request, from our Client Services department at 800 959 4246 or at invesco.com/proxyguidelines. The information is also available on the SEC website, sec.gov.
Information regarding how the Fund voted proxies related to its portfolio securities during the most recent 12-month period ended June 30 is available at invesco.com/proxysearch. The information is also available on the SEC website, sec.gov. Invesco Advisers, Inc. is an investment adviser; it provides investment advisory services to individual and institutional clients and does not sell securities. Invesco Distributors, Inc. is the US distributor for Invesco Ltd.’s retail mutual funds, exchange-traded funds and institutional money market funds. Both are wholly owned, indirect subsidiaries of Invesco Ltd. |  |
SEC file numbers: 811-09913 and 333-36074 VK-PTFI-AR-1 Invesco Distributors, Inc.
| ||||
| Annual Report to Shareholders
| August 31, 2015 | ||
Invesco S&P 500 Index Fund | ||||
Nasdaq: A: SPIAX ¡ B: SPIBX ¡ C: SPICX ¡ Y: SPIDX | ||||


Letters to Shareholders
Philip Taylor | Dear Shareholders: This annual report includes information about your Fund, including performance data and a complete list of its investments as of the close of the reporting period. Inside is a discussion of how your Fund was managed and the factors that affected its performance during the reporting period. I hope you find this report of interest. The US economy expanded and unemployment declined throughout the reporting period. The sharp drop in oil prices that began in mid-2014 continued to benefit consumers, but a strong US dollar crimped corporate profits. The US Federal Reserve signaled that it was increasingly likely to raise interest rates, based on generally positive economic data, but uncertainty remained about when it would act. Overseas, the story was much different. Low energy prices hurt the economies of some oil-producing nations, such as Brazil and Russia. During the reporting period, the European Central Bank as well as central banks in China and |

Japan – among other countries – either instituted or maintained extraordinarily accommodative monetary policies in response to economic weakness.
Investor uncertainty, such as we saw for much of the reporting period – and market volatility, such as we saw at the end of the reporting period – are unfortunate facts of life when it comes to investing. Some investors use these things as excuses to delay saving and investing for their long-term financial goals. That’s why Invesco encourages investors to work with a professional financial adviser who can stress the importance of starting to save and invest early and the importance of adhering to a disciplined investment plan – when times are good and when they’re uncertain. A financial adviser who knows your unique financial situation, investment goals and risk tolerance can be an invaluable partner as you seek to achieve your financial goals. He or she can offer a long-term perspective when markets are volatile and time-tested advice and guidance when your financial situation or investment goals change.
Timely information when and where you want it
Invesco’s efforts to help investors achieve their financial objectives include providing individual investors and financial professionals with timely information about the markets, the economy and investing – whenever and wherever they want it.
Our website, invesco.com/us, offers a wide range of market insights and investment perspectives. On the website, you’ll find detailed information about our funds, including prices, performance, holdings and portfolio manager commentaries. You can access information about your account by completing a simple, secure online registration. Click on the “Need to register” link in the “Account Access” box on our homepage to get started.
Invesco’s mobile apps for iPhone® and iPad® (both available free from the App StoreSM) allow you to obtain the same detailed information, monitor your account and create customizable watch lists. Also, they allow you to access investment insights from our investment leaders, market strategists, economists and retirement experts. You can sign up to be alerted when new commentary is added, and you can watch portfolio manager videos and have instant access to Invesco news and updates wherever you may be.
In addition to the resources accessible on our website and through our mobile app, you can obtain timely updates to help you stay informed about the markets, the economy and investing by connecting with Invesco on Twitter, LinkedIn or Facebook. You can access our blog at blog.invesco.us.com. Our goal is to provide you the information you want, when and where you want it.
Have questions?
For questions about your account, feel free to contact an Invesco client services representative at 800 959 4246. For Invesco-related questions or comments, please email me directly at phil@invesco.com.
All of us at Invesco look forward to serving your investment management needs for many years to come. Thank you for investing with us.
Sincerely,

Philip Taylor
Senior Managing Director, Invesco Ltd.
iPhone and iPad are trademarks of Apple Inc., registered in the US and other countries. App Store is a service mark of Apple Inc. Invesco Distributors, Inc. is not affiliated with Apple Inc.
2 Invesco S&P 500 Index Fund
Bruce Crockett | Dear Fellow Shareholders: Among the many important lessons I’ve learned in more than 40 years in a variety of business endeavors is the value of a trusted advocate. As independent chair of the Invesco Funds Board, I can assure you that the members of the Board are strong advocates for the interests of investors in Invesco’s mutual funds. We work hard to represent your interests through oversight of the quality of the investment management services your funds receive and other matters important to your investment, including but not limited to: n Ensuring that Invesco offers a diverse lineup of mutual funds that your financial adviser can use to strive to meet your financial needs as your investment goals change over time. n Monitoring how the portfolio management teams of the Invesco funds are performing in light of changing economic and market conditions. |

| n | Assessing each portfolio management team’s investment performance within the context of the investment strategy described in the fund’s prospectus. |
| n | Monitoring for potential conflicts of interests that may impact the nature of the services that your funds receive. |
We believe one of the most important services we provide our fund shareholders is the annual review of the funds’ advisory and sub-advisory contracts with Invesco Advisers and its affiliates. This review is required by the Investment Company Act of 1940 and focuses on the nature and quality of the services Invesco provides as the adviser to the Invesco funds and the reasonableness of the fees that it charges for those services. Each year, we spend months carefully reviewing information received from Invesco and a variety of independent sources, such as performance and fee data prepared by Lipper Inc., an independent, third-party firm widely recognized as a leader in its field. We also meet with our independent legal counsel and other independent advisers to review and help us assess the information that we have received. Our goal is to assure that you receive quality investment management services for a reasonable fee.
I trust the measures outlined above provide assurance that you have a worthy advocate when it comes to choosing the Invesco Funds.
As always, please contact me at bruce@brucecrockett.com with any questions or concerns you may have. On behalf of the Board, we look forward to continuing to represent your interests and serving your needs.
Sincerely,

Bruce L. Crockett
Independent Chair
Invesco Funds Board of Trustees
3 Invesco S&P 500 Index Fund
Management’s Discussion of Fund Performance
Performance summary
For the fiscal year ended August 31, 2015, Invesco S&P 500 Index Fund (the Fund) sought to provide investment results that, before expenses, corresponded to the total return of the S&P 500 Index.
Your Fund’s long-term performance appears later in this report.
Fund vs. Indexes
Total returns, 8/31/14 to 8/31/15, at net asset value (NAV). Performance shown does not include applicable contingent deferred sales charges (CDSC) or front-end sales charges, which would have reduced performance.
Class A Shares | -0.05 | % | ||
Class B Shares | -0.85 | |||
Class C Shares | -0.81 | |||
Class Y Shares | 0.17 | |||
S&P 500 Indexq (Broad Market/Style-Specific Index) | 0.48 | |||
Lipper S&P 500 Objective Funds Indexn (Peer Group Index) | 0.23 | |||
Source(s): qFactSet Research Systems Inc.; nLipper Inc. |
Market conditions and your Fund
The US economy improved slowly, but somewhat steadily, during the fiscal year ended August 31, 2015 – although the performance of the underlying sectors of the economy varied dramatically. The headline story was the massive slowdown in energy markets, as oil prices plummeted when too much supply overwhelmed slowing global demand. However the more subtle story, which drove the economy forward during the year, was the improved position of the US consumer.
As the reporting period began, economic growth appeared to be stronger in the US than in the rest of the world. In mid-2014, when the price of oil began its sharp and prolonged decline, US equities fell as well. However, while global growth weakened and commodity-based economies and currencies underperformed those of the US, continued strengthening of the US consumer led US equity markets higher through the spring. Continued low interest rates, the increasing
availability of credit from lenders and an improving employment picture all contributed to higher consumer confidence. This strength also helped the market overcome summer fears that Greece and the eurozone would fail to reach an agreement on a financial bailout plan. In the final weeks of the fiscal year, however, US equity markets moved sharply lower. A significant downturn in China’s financial markets, weak global economic growth and the uncertain timing of a potential US interest rate increase were negatives for jittery US markets. While stocks were up slightly for the fiscal year, they ended the reporting period on a negative note.
Invesco S&P 500 Index Fund invests in stocks in approximately the same proportion as they are represented in the S&P 500 Index.
During the reporting period, sectors that contributed the most to overall Fund performance were the health care, consumer discretionary and consumer staples sectors. The industrials, materials, telecommunication services and energy
sectors detracted the most from Fund performance, with the energy sector being the largest detractor.
Consumer discretionary holdings were some of the largest contributors to the Fund’s performance during the reporting period. Within the sector, Amazon.com posted earnings high above analyst estimates toward the end of the fiscal year due to its growing streaming business.
Apple was also a top contributor to Fund performance during the reporting period. Apple announced increased earnings growth as a result of strong third quarter sales of iPhones and Mac computers, strong revenue from services and the successful launch of the Apple Watch.
Visa also posted strong earnings results over the reporting period due to better-than-expected growth in its service and data processing revenue as well as an increase in international transactions.
Many Fund holdings in the energy sector struggled due to the decrease in oil prices from oversupply during the fiscal year. Two of the top detractors in this sector were Exxon Mobil and Chevron.
Another top detractor from Fund performance was International Business Machines. The company posted disappointing earnings due to slowing international sales and a stronger US dollar during the fiscal year.
Please note that the Fund’s strategy is principally implemented through equity investments, but the Fund also may use S&P 500 futures contracts, a derivative instrument, to gain exposure to the equity market. During the reporting period, the Fund invested in S&P 500 futures contracts, which generated a negative return and was a slight detractor from Fund performance. Derivatives can be a cost-effective way to gain exposure to asset classes. However, derivatives
Portfolio Composition
By sector
| Information Technology | 19.7 | % | ||
Financials | 16.4 | |||
Health Care | 15.0 | |||
| Consumer Discretionary | 12.7 | |||
Industrials | 9.8 | |||
Consumer Staples | 9.6 | |||
| Energy | 7.2 | |||
Materials | 2.9 | |||
Utilities | 2.9 | |||
| Telecommunication Services | 2.4 | |||
| Money Market Funds Plus Other Assets Less Liabilities | 1.4 |
Top 10 Equity Holdings*
1. | Apple Inc. | 3.7 | % | |||
2. | Microsoft Corp. | 2.0 | ||||
3. | Exxon Mobil Corp. | 1.8 | ||||
4. | Johnson & Johnson | 1.5 | ||||
5. | General Electric Co. | 1.4 | ||||
6. | Wells Fargo & Co. | 1.4 | ||||
7. | Berkshire Hathaway Inc.- | 1.4 | ||||
8. | JPMorgan Chase & Co. | 1.4 | ||||
9. | AT&T Inc. | 1.2 | ||||
10. | Pfizer Inc. | 1.1 |
Total Net Assets | $ | 752.7 million | ||
Total Number of Holdings* | 503 | * | ||
The Fund’s holdings are subject to change, and there is no assurance that the Fund will continue to hold any particular security.
*Excluding money market fund holdings.
4 Invesco S&P 500 Index Fund
may amplify traditional investment risks through the creation of leverage and may be less liquid than traditional securities.
We welcome new investors who joined the Fund during the fiscal year and thank all our shareholders for their investments in Invesco S&P 500 Index Fund.
The views and opinions expressed in management’s discussion of Fund performance are those of Invesco Advisers, Inc. These views and opinions are subject to change at any time based on factors such as market and economic conditions. These views and opinions may not be relied upon as investment advice or recommendations, or as an offer for a particular security. The information is not a complete analysis of every aspect of any market, country, industry, security or the Fund. Statements of fact are from sources considered reliable, but Invesco Advisers, Inc. makes no representation or warranty as to their completeness or accuracy. Although historical performance is no guarantee of future results, these insights may help you understand our investment management philosophy.
See important Fund and, if applicable, index disclosures later in this report.
| Anthony Munchak Chartered Financial Analyst, Portfolio Manager, is manager of Invesco S&P 500 Index Fund. He joined Invesco in 2000. Mr. | |
Munchak earned a BS and an MS in finance from Boston College and an MBA from Bentley College.
| ||
| Glen Murphy Chartered Financial Analyst, Portfolio Manager, is manager of Invesco S&P 500 Index Fund. He joined Invesco in 1995. Mr. | |
Murphy earned a BA in business administration from the University of Massachusetts Amherst and an MS in finance from Boston College.
| ||
| Francis Orlando Chartered Financial Analyst, Portfolio Manager, is manager of Invesco S&P 500 Index Fund. He joined Invesco in 1987. Mr. | |
Orlando earned a BA in business administration from Merrimack College and an MBA from Boston University.
| ||
 | Daniel Tsai Chartered Financial Analyst, Portfolio Manager, is manager of Invesco S&P 500 Index Fund. He joined Invesco in 2000. | |
Mr. Tsai earned a BS in mechanical engineering from National Taiwan University, an MS in mechanical engineering from the University of Michigan and an MS in computer science from Wayne State University.
| ||
 | Anne Unflat Portfolio Manager, is manager of Invesco S&P 500 Index Fund. She joined Invesco in 1988. Ms. Unflat earned a BA in | |
| economics from Queens College and an MBA in finance from St. John’s University. | ||


5 Invesco S&P 500 Index Fund
Your Fund’s Long-Term Performance
Results of a $10,000 Investment – Oldest Share Class(es)
Fund and index data from 8/31/05

1 Source: FactSet Research Systems Inc.
2 Source: Lipper Inc.
Past performance cannot guarantee comparable future results.
The data shown in the chart include reinvested distributions, applicable sales charges and Fund expenses including management fees. Results for Class B shares are calculated as if a hypothetical
shareholder had liquidated his entire investment in the Fund at the close of the reporting period and paid the contingent deferred sales charges, if applicable. Index results include reinvested dividends, but they do not reflect sales charges. Performance of the peer group,
if applicable, reflects fund expenses and management fees; performance of a market index does not. Performance shown in the chart and table(s) does not reflect deduction of taxes a shareholder would pay on Fund distributions or sale of Fund shares.
continued from page 8
the returns based on those NAVs may differ from the NAVs and returns reported in the Financial Highlights.
| n | Industry classifications used in this report are generally according to the Global Industry Classification Standard, which was developed by and is the exclusive property and a service mark of MSCI Inc. and Standard & Poor’s. |
6 Invesco S&P 500 Index Fund
Average Annual Total Returns | ||
As of 8/31/15, including maximum applicable sales charges
| ||
Class A Shares | ||||
Inception (9/26/97) | 5.19 | % | ||
10 Years | 6.03 | |||
5 Years | 13.94 | |||
1 Year | -5.54 | |||
Class B Shares | ||||
Inception (9/26/97) | 5.16 | % | ||
10 Years | 5.98 | |||
5 Years | 14.13 | |||
1 Year | -5.78 | |||
Class C Shares | ||||
Inception (9/26/97) | 4.74 | % | ||
10 Years | 5.83 | |||
5 Years | 14.38 | |||
1 Year | -1.80 | |||
Class Y Shares | ||||
Inception (9/26/97) | 5.78 | % | ||
10 Years | 6.89 | |||
5 Years | 15.52 | |||
1 Year | 0.17 | |||
Effective June 1, 2010, Class A, Class B, Class C and Class I shares of the predecessor fund, Morgan Stanley S&P 500 Index Fund, advised by Morgan Stanley Investment Advisors Inc. were reorganized into Class A, Class B, Class C and Class Y shares, respectively, of Invesco S&P 500 Index Fund. Returns shown above for Class A, Class B, Class C and Class Y shares are blended returns of the predecessor fund and Invesco S&P 500 Index Fund. Share class returns will differ from the predecessor fund because of different expenses.
The performance data quoted represent past performance and cannot guarantee comparable future results; current performance may be lower or higher. Please visit invesco.com/performance for the most recent month-end performance. Performance figures reflect reinvested distributions, changes in net asset value and the effect of the maximum sales charge unless otherwise stated. Performance figures do not reflect deduction of taxes a shareholder would pay on Fund distributions or sale of Fund shares. Investment return and principal value will fluctuate so that you may have a gain or loss when you sell shares.
The total annual Fund operating expense ratio set forth in the most recent Fund prospectus as of the
Average Annual Total Returns | ||
As of 6/30/15, the most recent calendar quarter end, including maximum applicable sales charges | ||
Class A Shares | ||||
Inception (9/26/97) | 5.50 | % | ||
10 Years | 6.75 | |||
5 Years | 15.38 | |||
1 Year | 0.98 | |||
Class B Shares | ||||
Inception (9/26/97) | 5.47 | % | ||
10 Years | 6.72 | |||
5 Years | 15.59 | |||
1 Year | 1.05 | |||
Class C Shares | ||||
Inception (9/26/97) | 5.04 | % | ||
10 Years | 6.56 | |||
5 Years | 15.82 | |||
1 Year | 5.02 | |||
Class Y Shares | ||||
Inception (9/26/97) | 6.08 | % | ||
10 Years | 7.63 | |||
5 Years | 16.99 | |||
1 Year | 7.06 | |||
date of this report for Class A, Class B, Class C and Class Y shares was 0.59%, 1.35%, 1.35% and 0.35%, respectively. The expense ratios presented above may vary from the expense ratios presented in other sections of this report that are based on expenses incurred during the period covered by this report.
Class A share performance reflects the maximum 5.50% sales charge, and Class B and Class C share performance reflects the applicable contingent deferred sales charge (CDSC) for the period involved. The CDSC on Class B shares declines from 5% beginning at the time of purchase to 0% at the beginning of the seventh year. The CDSC on Class C shares is 1% for the first year after purchase. Class Y shares do not have a front-end sales charge or a CDSC; therefore, performance is at net asset value.
The performance of the Fund’s share classes will differ primarily due to different sales charge structures and class expenses.
Fund performance reflects any applicable fee waivers and/or expense reimbursements. Had the adviser not waived fees and/or reimbursed expenses currently or in the past, returns would have been lower. See current prospectus for more information.
7 Invesco S&P 500 Index Fund
Invesco S&P 500 Index Fund’s investment objective is total return through growth of capital and current income.
| n | Unless otherwise stated, information presented in this report is as of August 31, 2015, and is based on total net assets. |
| n | Unless otherwise noted, all data provided by Invesco. |
| n | To access your Fund’s reports/prospectus, visit invesco.com/fundreports. |
About share classes
| n | Class B shares may not be purchased for new or additional investments. Please see the prospectus for more information. |
| n | Class Y shares are available to only certain investors. Please see the prospectus for more information. |
Principal risks of investing in the Fund
| n | Depositary receipts risk. Depositary receipts involve many of the same risks as those associated with direct investment in foreign securities. In addition, the underlying issuers of certain depositary receipts, particularly unsponsored or unregistered depositary receipts, are under no obligation to distribute shareholder communications to the holders of such receipts or to pass through to them any voting rights with respect to the deposited securities. |
| n | Derivatives risk. The value of a derivative instrument depends largely on (and is derived from) the value of an underlying security, currency, commodity, interest rate, index or other asset (each referred to as an underlying asset). In addition to risks relating to the underlying assets, the use of derivatives may include other, possibly greater, risks, including counterparty, leverage and liquidity risks. Counter-party risk is the risk that the counter-party to the derivative contract will default on its obligation to pay the Fund the amount owed or otherwise perform under the derivative contract. Derivatives create leverage risk because they do not require payment up front equal to the economic exposure created by owning the derivative. As a result, an adverse change in the value of the underlying asset could result in the Fund sustaining a loss that is substantially greater than the amount invested in the derivative, which may make the Fund’s returns more volatile and increase the risk of loss. Derivative |
instruments may also be less liquid than more traditional investments and the Fund may be unable to sell or close out its derivative positions at a desirable time or price. This risk may be more acute under adverse market conditions, during which the Fund may be most in need of liquidating its derivative positions. Derivatives may also be harder to value, less tax efficient and subject to changing government regulation that could impact the Fund’s ability to use certain derivatives or their cost. Also, derivatives used for hedging or to gain or limit exposure to a particular market segment may not provide the expected benefits, particularly during adverse market conditions. |
| n | Developing/emerging markets securities risk. The prices of securities issued by foreign companies and governments located in developing/emerging markets countries may be affected more negatively by inflation, devaluation of their currencies, higher transaction costs, delays in settlement, adverse political developments, the introduction of capital controls, withholding taxes, nationalization of private assets, expropriation, social unrest, war or lack of timely information than those in developed countries. |
| n | Foreign securities risk. The Fund’s foreign investments may be affected by changes in a foreign country’s exchange rates, political and social instability, changes in economic or taxation policies, difficulties when enforcing obligations, decreased liquidity, and increased volatility. Foreign companies may be subject to less regulation resulting in less publicly available information about the companies. |
| n | Indexing risk. The Fund is operated as a passively managed index fund. As such, the adverse performance of a particular stock ordinarily will not result in the elimination of the stock from the Fund’s portfolio. The Fund will remain invested in common stocks even when stock prices are generally falling. |
This report must be accompanied or preceded by a currently effective Fund prospectus, which contains more complete information, including sales charges and expenses. Investors should read it carefully before investing.
NOT FDIC INSURED | MAY LOSE VALUE | NO BANK GUARANTEE |
| Ordinarily, the Adviser will not sell the Fund’s portfolio securities except to reflect additions or deletions of the stocks that comprise the S&P 500 Index, or as may be necessary to raise cash to pay Fund shareholders who sell Fund shares. The Fund’s ability to correlate its performance, before expenses, with the S&P 500 Index may be affected by, among other things, changes in securities markets, the manner in which the S&P 500 Index is calculated and the timing of purchases and sales, and also depends to some extent on the size of the Fund’s portfolio, the size of cash flows into and out of the Fund and differences between how and when the Fund and the Index are valued. |
| n | Management risk. The investment techniques and risk analysis used by the Fund’s portfolio managers may not produce the desired results. |
| n | Market risk. The prices of and the income generated by the Fund’s securities may decline in response to, among other things, investor sentiment, general economic and market conditions, regional or global instability, and currency and interest rate fluctuations. |
About indexes used in this report
| n | The S&P 500® Index is an unmanaged index considered representative of the US stock market. |
| n | The Lipper S&P 500 Objective Funds Index is an unmanaged index considered representative of S&P 500 funds tracked by Lipper. |
| n | A direct investment cannot be made in an index. Unless otherwise indicated, index results include reinvested dividends, and they do not reflect sales charges. Performance of the peer group, if applicable, reflects fund expenses; performance of a market index does not. |
Other information
| n | The returns shown in management’s discussion of Fund performance are based on net asset values (NAVs) calculated for shareholder transactions. Generally accepted accounting principles require adjustments to be made to the net assets of the Fund at period end for financial reporting purposes, and as such, the NAVs for shareholder transactions and |
continued on page 6
8 Invesco S&P 500 Index Fund
Schedule of Investments(a)
August 31, 2015
| Shares | Value | |||||||
Common Stocks & Other Equity Interests–98.62% |
| |||||||
| Advertising–0.14% | ||||||||
Interpublic Group of Cos., Inc. (The) | 17,609 | $ | 332,458 | |||||
Omnicom Group Inc. | 10,418 | 697,798 | ||||||
| 1,030,256 | ||||||||
| Aerospace & Defense–2.61% | ||||||||
Boeing Co. (The) | 27,425 | 3,583,899 | ||||||
General Dynamics Corp. | 13,317 | 1,891,413 | ||||||
Honeywell International Inc. | 33,336 | 3,309,265 | ||||||
L-3 Communications Holdings, Inc. | 3,511 | 370,305 | ||||||
Lockheed Martin Corp. | 11,409 | 2,295,263 | ||||||
Northrop Grumman Corp. | 8,263 | 1,352,984 | ||||||
Precision Castparts Corp. | 5,894 | 1,357,093 | ||||||
Raytheon Co. | 13,012 | 1,334,511 | ||||||
Rockwell Collins, Inc. | 5,639 | 461,552 | ||||||
Textron Inc. | 11,839 | 459,353 | ||||||
United Technologies Corp. | 35,306 | 3,234,383 | ||||||
| 19,650,021 | ||||||||
| Agricultural & Farm Machinery–0.16% | ||||||||
Deere & Co. | 14,237 | 1,164,302 | ||||||
| Agricultural Products–0.16% | ||||||||
Archer-Daniels-Midland Co. | 26,456 | 1,190,255 | ||||||
| Air Freight & Logistics–0.72% | ||||||||
C.H. Robinson Worldwide, Inc. | 6,218 | 419,280 | ||||||
Expeditors International of Washington, Inc. | 8,156 | 399,399 | ||||||
FedEx Corp. | 11,241 | 1,693,007 | ||||||
United Parcel Service, Inc.–Class B | 29,594 | 2,889,854 | ||||||
| 5,401,540 | ||||||||
| Airlines–0.50% | ||||||||
American Airlines Group Inc. | 29,544 | 1,151,625 | ||||||
Delta Air Lines, Inc. | 35,025 | 1,533,395 | ||||||
Southwest Airlines Co. | 28,499 | 1,045,913 | ||||||
| 3,730,933 | ||||||||
| Alternative Carriers–0.07% | ||||||||
Level 3 Communications, Inc.(b) | 12,545 | 561,138 | ||||||
| Aluminum–0.07% | ||||||||
Alcoa Inc. | 55,849 | 527,773 | ||||||
| Apparel Retail–0.57% | ||||||||
Gap, Inc. (The) | 11,212 | 367,866 | ||||||
L Brands, Inc. | 10,458 | 877,426 | ||||||
Ross Stores, Inc. | 17,646 | 857,948 | ||||||
TJX Cos., Inc. (The) | 29,015 | 2,040,335 | ||||||
Urban Outfitters, Inc.(b) | 4,151 | 128,100 | ||||||
| 4,271,675 | ||||||||
| Apparel, Accessories & Luxury Goods–0.50% | ||||||||
Coach, Inc. | 11,781 | 356,375 | ||||||
| Shares | Value | |||||||
| Apparel, Accessories & Luxury Goods–(continued) | ||||||||
Fossil Group, Inc.(b) | 1,826 | $ | 112,445 | |||||
Hanesbrands, Inc. | 17,128 | 515,724 | ||||||
Michael Kors Holdings Ltd.(b) | 8,472 | 368,193 | ||||||
PVH Corp. | 3,525 | 419,405 | ||||||
Ralph Lauren Corp. | 2,576 | 286,426 | ||||||
Under Armour, Inc.–Class A(b) | 7,168 | 684,759 | ||||||
VF Corp. | 14,498 | 1,050,090 | ||||||
| 3,793,417 | ||||||||
| Application Software–0.71% | ||||||||
Adobe Systems Inc.(b) | 20,267 | 1,592,378 | ||||||
Autodesk, Inc.(b) | 9,707 | 453,802 | ||||||
Citrix Systems, Inc.(b) | 6,834 | 465,464 | ||||||
Intuit Inc. | 11,755 | 1,007,991 | ||||||
salesforce.com, inc.(b) | 25,999 | 1,803,291 | ||||||
| 5,322,926 | ||||||||
| Asset Management & Custody Banks–1.20% | ||||||||
Affiliated Managers Group, Inc.(b) | 2,332 | 434,778 | ||||||
Ameriprise Financial, Inc. | 7,734 | 871,390 | ||||||
Bank of New York Mellon Corp. (The) | 47,828 | 1,903,554 | ||||||
BlackRock, Inc. | 5,414 | 1,637,573 | ||||||
Franklin Resources, Inc. | 16,632 | 674,927 | ||||||
Invesco Ltd.(c) | 18,367 | 626,498 | ||||||
Legg Mason, Inc. | 4,175 | 185,078 | ||||||
Northern Trust Corp. | 9,354 | 653,283 | ||||||
State Street Corp. | 17,555 | 1,262,556 | ||||||
T. Rowe Price Group Inc. | 11,204 | 805,343 | ||||||
| 9,054,980 | ||||||||
| Auto Parts & Equipment–0.33% | ||||||||
BorgWarner, Inc. | 9,648 | 421,039 | ||||||
Delphi Automotive PLC (United Kingdom) | 12,312 | 929,802 | ||||||
Johnson Controls, Inc. | 27,925 | 1,148,834 | ||||||
| 2,499,675 | ||||||||
| Automobile Manufacturers–0.54% | ||||||||
Ford Motor Co. | 169,536 | 2,351,464 | ||||||
General Motors Co. | 57,574 | 1,694,979 | ||||||
| 4,046,443 | ||||||||
| Automotive Retail–0.44% | ||||||||
Advance Auto Parts, Inc. | 3,120 | 546,780 | ||||||
AutoNation, Inc.(b) | 3,234 | 193,523 | ||||||
AutoZone, Inc.(b) | 1,351 | 967,302 | ||||||
CarMax, Inc.(b) | 8,922 | 544,242 | ||||||
O’Reilly Automotive, Inc.(b) | 4,305 | 1,033,501 | ||||||
| 3,285,348 | ||||||||
| Biotechnology–3.18% | ||||||||
Alexion Pharmaceuticals, Inc.(b) | 9,547 | 1,643,898 | ||||||
Amgen Inc. | 32,424 | 4,921,315 | ||||||
See accompanying Notes to Financial Statements which are an integral part of the financial statements.
9 Invesco S&P 500 Index Fund
| Shares | Value | |||||||
| Biotechnology–(continued) | ||||||||
Baxalta Inc.(b) | 23,209 | $ | 815,796 | |||||
Biogen Inc.(b) | 10,030 | 2,981,919 | ||||||
Celgene Corp.(b) | 33,824 | 3,993,938 | ||||||
Gilead Sciences, Inc. | 62,673 | 6,585,052 | ||||||
Regeneron Pharmaceuticals, Inc.(b) | 3,214 | 1,650,389 | ||||||
Vertex Pharmaceuticals Inc.(b) | 10,394 | 1,325,443 | ||||||
| 23,917,750 | ||||||||
| Brewers–0.06% | ||||||||
Molson Coors Brewing Co.–Class B | 6,807 | 463,489 | ||||||
| Broadcasting–0.24% | ||||||||
CBS Corp.–Class B | 19,308 | 873,494 | ||||||
Discovery Communications, Inc.–Class A(b) | 6,359 | 169,149 | ||||||
Discovery Communications, Inc.–Class C(b) | 11,133 | 282,333 | ||||||
Scripps Networks Interactive Inc.–Class A | 4,052 | 215,121 | ||||||
TEGNA Inc. | 9,673 | 230,121 | ||||||
| 1,770,218 | ||||||||
| Building Products–0.08% | ||||||||
Allegion PLC | 4,111 | 245,057 | ||||||
Masco Corp. | 14,822 | 388,781 | ||||||
| 633,838 | ||||||||
| Cable & Satellite–1.13% | ||||||||
Cablevision Systems Corp.–Class A | 9,401 | 236,623 | ||||||
Comcast Corp.–Class A | 107,194 | 6,038,238 | ||||||
Time Warner Cable Inc. | 12,054 | 2,242,285 | ||||||
| 8,517,146 | ||||||||
| Casinos & Gaming–0.04% | ||||||||
Wynn Resorts Ltd. | 3,476 | 260,874 | ||||||
| Coal & Consumable Fuels–0.02% | ||||||||
CONSOL Energy Inc. | 9,757 | 148,599 | ||||||
| Commodity Chemicals–0.19% | ||||||||
LyondellBasell Industries N.V.–Class A | 16,752 | 1,430,286 | ||||||
| Communications Equipment–1.49% | ||||||||
Cisco Systems, Inc. | 216,897 | 5,613,295 | ||||||
F5 Networks, Inc.(b) | 3,066 | 372,243 | ||||||
Harris Corp. | 5,254 | 403,612 | ||||||
Juniper Networks, Inc. | 14,985 | 385,264 | ||||||
Motorola Solutions, Inc. | 7,915 | 513,050 | ||||||
QUALCOMM, Inc. | 69,495 | 3,932,027 | ||||||
| 11,219,491 | ||||||||
| Computer & Electronics Retail–0.09% | ||||||||
Best Buy Co., Inc. | 12,486 | 458,736 | ||||||
GameStop Corp.–Class A | 4,550 | 193,284 | ||||||
| 652,020 | ||||||||
| Construction & Engineering–0.10% | ||||||||
Fluor Corp. | 6,286 | 286,767 | ||||||
Jacobs Engineering Group, Inc.(b) | 5,354 | 216,355 | ||||||
| Shares | Value | |||||||
| Construction & Engineering–(continued) | ||||||||
Quanta Services, Inc.(b) | 9,032 | $ | 218,936 | |||||
| 722,058 | ||||||||
| Construction Machinery & Heavy Trucks–0.51% | ||||||||
Caterpillar Inc. | 25,742 | 1,967,718 | ||||||
Cummins Inc. | 7,150 | 870,513 | ||||||
Joy Global Inc. | 4,194 | 101,579 | ||||||
PACCAR Inc. | 15,130 | 892,216 | ||||||
| 3,832,026 | ||||||||
| Construction Materials–0.13% | ||||||||
Martin Marietta Materials, Inc. | 2,646 | 443,999 | ||||||
Vulcan Materials Co. | 5,656 | 529,514 | ||||||
| 973,513 | ||||||||
| Consumer Electronics–0.07% | ||||||||
Garmin Ltd. | 5,142 | 193,391 | ||||||
Harman International Industries, Inc. | 3,054 | 298,498 | ||||||
| 491,889 | ||||||||
| Consumer Finance–0.78% | ||||||||
American Express Co. | 37,254 | 2,858,127 | ||||||
Capital One Financial Corp. | 23,302 | 1,811,731 | ||||||
Discover Financial Services | 18,870 | 1,013,885 | ||||||
Navient Corp. | 16,589 | 212,173 | ||||||
| 5,895,916 | ||||||||
| Data Processing & Outsourced Services–2.32% | ||||||||
Alliance Data Systems Corp.(b) | 2,645 | 680,268 | ||||||
Automatic Data Processing, Inc. | 20,022 | 1,548,101 | ||||||
Computer Sciences Corp. | 5,870 | 363,881 | ||||||
Fidelity National Information Services, Inc. | 12,087 | 834,728 | ||||||
Fiserv, Inc.(b) | 10,097 | 860,971 | ||||||
MasterCard, Inc.–Class A | 41,332 | 3,817,837 | ||||||
Paychex, Inc. | 13,940 | 622,560 | ||||||
PayPal Holdings, Inc.(b) | 47,144 | 1,650,040 | ||||||
Total System Services, Inc. | 6,994 | 320,535 | ||||||
Visa Inc.–Class A | 82,438 | 5,877,830 | ||||||
Western Union Co. (The) | 22,018 | 406,012 | ||||||
Xerox Corp. | 44,254 | 450,063 | ||||||
| 17,432,826 | ||||||||
| Department Stores–0.23% | ||||||||
Kohl’s Corp. | 8,437 | 430,540 | ||||||
Macy’s, Inc. | 14,345 | 840,760 | ||||||
Nordstrom, Inc. | 6,012 | 438,155 | ||||||
| 1,709,455 | ||||||||
| Distillers & Vintners–0.21% | ||||||||
Brown-Forman Corp.–Class B | 6,644 | 651,776 | ||||||
Constellation Brands, Inc.–Class A | 7,224 | 924,672 | ||||||
| 1,576,448 | ||||||||
| Distributors–0.07% | ||||||||
Genuine Parts Co. | 6,489 | 541,767 | ||||||
See accompanying Notes to Financial Statements which are an integral part of the financial statements.
10 Invesco S&P 500 Index Fund
| Shares | Value | |||||||
| Diversified Banks–5.13% | ||||||||
Bank of America Corp. | 447,883 | $ | 7,318,408 | |||||
Citigroup Inc. | 129,396 | 6,920,098 | ||||||
Comerica Inc. | 7,590 | 333,960 | ||||||
JPMorgan Chase & Co. | 158,266 | 10,144,851 | ||||||
U.S. Bancorp | �� | 75,613 | 3,202,211 | |||||
Wells Fargo & Co. | 199,834 | 10,657,147 | ||||||
| 38,576,675 | ||||||||
| Diversified Chemicals–0.59% | ||||||||
Dow Chemical Co. (The) | 46,216 | 2,022,412 | ||||||
E. I. du Pont de Nemours and Co. | 38,604 | 1,988,106 | ||||||
Eastman Chemical Co. | 6,352 | 460,266 | ||||||
| 4,470,784 | ||||||||
| Diversified Metals & Mining–0.06% | ||||||||
Freeport-McMoRan Inc. | 44,353 | 471,916 | ||||||
| Diversified Support Services–0.05% | ||||||||
Cintas Corp. | 4,048 | 344,039 | ||||||
| Drug Retail–1.08% | ||||||||
CVS Health Corp. | 48,119 | 4,927,386 | ||||||
Walgreens Boots Alliance, Inc. | 37,213 | 3,220,785 | ||||||
| 8,148,171 | ||||||||
| Electric Utilities–1.67% | ||||||||
American Electric Power Co., Inc. | 20,893 | 1,134,281 | ||||||
Duke Energy Corp. | 29,491 | 2,091,207 | ||||||
Edison International | 13,893 | 812,463 | ||||||
Entergy Corp. | 7,655 | 500,101 | ||||||
Eversource Energy | 13,545 | 639,866 | ||||||
Exelon Corp. | 36,728 | 1,129,753 | ||||||
FirstEnergy Corp. | 17,997 | 575,184 | ||||||
NextEra Energy, Inc. | 18,939 | 1,863,787 | ||||||
Pepco Holdings, Inc. | 10,780 | 247,724 | ||||||
Pinnacle West Capital Corp. | 4,722 | 281,101 | ||||||
PPL Corp. | 28,491 | 882,936 | ||||||
Southern Co. (The) | 38,733 | 1,681,400 | ||||||
Xcel Energy, Inc. | 21,617 | 729,141 | ||||||
| 12,568,944 | ||||||||
| Electrical Components & Equipment–0.49% | ||||||||
AMETEK, Inc. | 10,299 | 554,292 | ||||||
Eaton Corp. PLC(b) | 19,919 | 1,136,578 | ||||||
Emerson Electric Co. | 28,500 | 1,360,020 | ||||||
Rockwell Automation, Inc. | 5,739 | 641,793 | ||||||
| 3,692,683 | ||||||||
| Electronic Components–0.21% | ||||||||
Amphenol Corp.–Class A | 13,173 | 689,738 | ||||||
Corning Inc. | 53,672 | 923,695 | ||||||
| 1,613,433 | ||||||||
| Electronic Equipment & Instruments–0.02% | ||||||||
FLIR Systems, Inc. | 5,974 | 171,036 | ||||||
| Shares | Value | |||||||
| Electronic Manufacturing Services–0.14% | ||||||||
TE Connectivity Ltd. (Switzerland) | 17,338 | $ | 1,027,970 | |||||
| Environmental & Facilities Services–0.25% | ||||||||
Republic Services, Inc. | 10,637 | 435,904 | ||||||
Stericycle, Inc.(b) | 3,626 | 511,774 | ||||||
Waste Management, Inc. | 18,157 | 908,939 | ||||||
| 1,856,617 | ||||||||
| Fertilizers & Agricultural Chemicals–0.44% | ||||||||
CF Industries Holdings, Inc. | 10,035 | 575,808 | ||||||
FMC Corp. | 5,693 | 240,871 | ||||||
Monsanto Co. | 20,303 | 1,982,588 | ||||||
Mosaic Co. (The) | 13,234 | 540,344 | ||||||
| 3,339,611 | ||||||||
| Food Distributors–0.13% | ||||||||
Sysco Corp. | 25,321 | 1,009,548 | ||||||
| Food Retail–0.26% | ||||||||
Kroger Co. (The) | 41,810 | 1,442,445 | ||||||
Whole Foods Market, Inc. | 15,278 | 500,507 | ||||||
| 1,942,952 | ||||||||
| Footwear–0.44% | ||||||||
NIKE, Inc.–Class B | 29,698 | 3,318,751 | ||||||
| Gas Utilities–0.04% | ||||||||
AGL Resources Inc. | 5,113 | 311,842 | ||||||
| General Merchandise Stores–0.50% | ||||||||
Dollar General Corp. | 12,669 | 943,714 | ||||||
Dollar Tree, Inc.(b) | 9,504 | 724,775 | ||||||
Target Corp. | 27,228 | 2,115,888 | ||||||
| 3,784,377 | ||||||||
| Gold–0.05% | ||||||||
Newmont Mining Corp. | 22,552 | 384,963 | ||||||
| Health Care Distributors–0.62% | ||||||||
AmerisourceBergen Corp. | 8,899 | 890,256 | ||||||
Cardinal Health, Inc. | 14,108 | 1,160,665 | ||||||
Henry Schein, Inc.(b) | 3,585 | 490,464 | ||||||
McKesson Corp. | 9,874 | 1,950,905 | ||||||
Patterson Cos. Inc. | 3,653 | 167,417 | ||||||
| 4,659,707 | ||||||||
| Health Care Equipment–2.08% | ||||||||
Abbott Laboratories | 63,490 | 2,875,462 | ||||||
Baxter International Inc. | 23,209 | 892,386 | ||||||
Becton, Dickinson and Co. | 8,928 | 1,259,027 | ||||||
Boston Scientific Corp.(b) | 57,175 | 957,110 | ||||||
C.R. Bard, Inc. | 3,165 | 613,345 | ||||||
Edwards Lifesciences Corp.(b) | 4,586 | 646,076 | ||||||
Intuitive Surgical, Inc.(b) | 1,570 | 802,192 | ||||||
Medtronic PLC | 60,774 | 4,393,352 | ||||||
St. Jude Medical, Inc. | 11,945 | 845,825 | ||||||
See accompanying Notes to Financial Statements which are an integral part of the financial statements.
11 Invesco S&P 500 Index Fund
| Shares | Value | |||||||
| Health Care Equipment–(continued) | ||||||||
Stryker Corp. | 12,748 | $ | 1,257,590 | |||||
Varian Medical Systems, Inc.(b) | 4,263 | 346,369 | ||||||
Zimmer Biomet Holdings, Inc. | 7,275 | 753,399 | ||||||
| 15,642,133 | ||||||||
| Health Care Facilities–0.24% | ||||||||
HCA Holdings, Inc.(b) | 12,367 | 1,071,229 | ||||||
Tenet Healthcare Corp.(b) | 4,266 | 210,015 | ||||||
Universal Health Services, Inc.–Class B | 3,919 | 537,452 | ||||||
| 1,818,696 | ||||||||
| Health Care REIT’s–0.33% | ||||||||
Care Capital Properties, Inc.(b) | 1 | 16 | ||||||
HCP, Inc. | 19,688 | 729,637 | ||||||
Health Care REIT, Inc. | 14,969 | 948,286 | ||||||
Ventas, Inc. | 14,110 | 776,332 | ||||||
| 2,454,271 | ||||||||
| Health Care Services–0.52% | ||||||||
DaVita HealthCare Partners Inc.(b) | 7,332 | 554,593 | ||||||
Express Scripts Holding Co.(b) | 28,817 | 2,409,101 | ||||||
Laboratory Corp. of America Holdings(b) | 4,298 | 506,347 | ||||||
Quest Diagnostics Inc. | 6,124 | 415,207 | ||||||
| 3,885,248 | ||||||||
| Health Care Supplies–0.04% | ||||||||
DENTSPLY International Inc. | 5,961 | 312,416 | ||||||
| Health Care Technology–0.11% | ||||||||
Cerner Corp.(b) | 13,058 | 806,462 | ||||||
| Home Entertainment Software–0.20% | ||||||||
Activision Blizzard, Inc. | 21,368 | 611,766 | ||||||
Electronic Arts Inc.(b) | 13,259 | 877,083 | ||||||
| 1,488,849 | ||||||||
| Home Furnishings–0.10% | ||||||||
Leggett & Platt, Inc. | 5,875 | 260,967 | ||||||
Mohawk Industries, Inc.(b) | 2,648 | 521,577 | ||||||
| 782,544 | ||||||||
| Home Improvement Retail–1.22% | ||||||||
Home Depot, Inc. (The) | 55,396 | 6,451,418 | ||||||
Lowe’s Cos., Inc. | 39,775 | 2,751,237 | ||||||
| 9,202,655 | ||||||||
| Homebuilding–0.15% | ||||||||
D.R. Horton, Inc. | 14,227 | 432,074 | ||||||
Lennar Corp.–Class A | 7,612 | 387,451 | ||||||
PulteGroup Inc. | 13,993 | 289,515 | ||||||
| 1,109,040 | ||||||||
| Homefurnishing Retail–0.06% | ||||||||
Bed Bath & Beyond Inc.(b) | 7,304 | 453,651 | ||||||
| Hotel and Resort REIT’s–0.08% | ||||||||
Host Hotels & Resorts Inc. | 32,311 | 572,874 | ||||||
| Shares | Value | |||||||
| Hotels, Resorts & Cruise Lines–0.41% | ||||||||
Carnival Corp. | 19,233 | $ | 946,841 | |||||
Marriott International Inc.–Class A | 8,793 | 621,313 | ||||||
Royal Caribbean Cruises Ltd. | 7,032 | 619,941 | ||||||
Starwood Hotels & Resorts Worldwide, Inc. | 7,286 | 520,730 | ||||||
Wyndham Worldwide Corp. | 5,118 | 391,425 | ||||||
| 3,100,250 | ||||||||
| Household Appliances–0.08% | ||||||||
Whirlpool Corp. | 3,352 | 563,471 | ||||||
| Household Products–1.69% | ||||||||
Clorox Co. (The) | 5,593 | 621,774 | ||||||
Colgate-Palmolive Co. | 36,261 | 2,277,553 | ||||||
Kimberly-Clark Corp. | 15,526 | 1,653,985 | ||||||
Procter & Gamble Co. (The) | 115,700 | 8,176,519 | ||||||
| 12,729,831 | ||||||||
| Housewares & Specialties–0.06% | ||||||||
Newell Rubbermaid Inc. | 11,458 | 482,726 | ||||||
| Human Resource & Employment Services–0.04% | ||||||||
Robert Half International, Inc. | 5,759 | 293,882 | ||||||
| Hypermarkets & Super Centers–0.93% | ||||||||
Costco Wholesale Corp. | 18,741 | 2,624,677 | ||||||
Wal-Mart Stores, Inc. | 67,299 | 4,356,264 | ||||||
| 6,980,941 | ||||||||
| Independent Power Producers & Energy Traders–0.08% | ||||||||
AES Corp. (The) | 29,103 | 349,236 | ||||||
NRG Energy, Inc. | 14,221 | 283,282 | ||||||
| 632,518 | ||||||||
| Industrial Conglomerates–2.32% | ||||||||
3M Co. | 27,051 | 3,845,029 | ||||||
Danaher Corp. | 26,261 | 2,285,232 | ||||||
General Electric Co.(d) | 429,708 | 10,665,353 | ||||||
Roper Technologies, Inc. | 4,285 | 694,556 | ||||||
| 17,490,170 | ||||||||
| Industrial Gases–0.36% | ||||||||
Air Products and Chemicals, Inc. | 8,242 | 1,150,006 | ||||||
Airgas, Inc. | 2,853 | 275,372 | ||||||
Praxair, Inc. | 12,294 | 1,300,090 | ||||||
| 2,725,468 | ||||||||
| Industrial Machinery–0.65% | ||||||||
Dover Corp. | 6,838 | 423,614 | ||||||
Flowserve Corp. | 5,743 | 259,182 | ||||||
Illinois Tool Works Inc. | 14,425 | 1,219,345 | ||||||
Ingersoll-Rand PLC | 11,288 | 624,114 | ||||||
Parker Hannifin Corp. | 5,913 | 636,594 | ||||||
Pentair PLC (United Kingdom) | 7,660 | 423,521 | ||||||
Snap-on Inc. | 2,486 | 397,188 | ||||||
Stanley Black & Decker Inc. | 6,554 | 665,362 | ||||||
Xylem, Inc. | 7,733 | 250,936 | ||||||
| 4,899,856 | ||||||||
See accompanying Notes to Financial Statements which are an integral part of the financial statements.
12 Invesco S&P 500 Index Fund
| Shares | Value | |||||||
| Industrial REIT’s–0.11% | ||||||||
Prologis, Inc. | 22,348 | $ | 849,224 | |||||
| Insurance Brokers–0.31% | ||||||||
Aon PLC | 12,014 | 1,122,588 | ||||||
Marsh & McLennan Cos., Inc. | 22,960 | 1,233,641 | ||||||
| 2,356,229 | ||||||||
| Integrated Oil & Gas–2.96% | ||||||||
Chevron Corp. | 80,196 | 6,495,074 | ||||||
Exxon Mobil Corp. | 178,311 | 13,416,120 | ||||||
Occidental Petroleum Corp. | 32,757 | 2,391,588 | ||||||
| 22,302,782 | ||||||||
| Integrated Telecommunication Services–2.34% | ||||||||
AT&T Inc. | 262,035 | 8,699,562 | ||||||
CenturyLink Inc. | 24,041 | 650,069 | ||||||
Frontier Communications Corp. | 49,184 | 249,363 | ||||||
Verizon Communications Inc. | 173,934 | 8,002,703 | ||||||
| 17,601,697 | ||||||||
| Internet Retail–1.86% | ||||||||
Amazon.com, Inc.(b) | 16,284 | 8,351,901 | ||||||
Expedia, Inc. | 4,251 | 488,822 | ||||||
Netflix Inc.(b) | 18,096 | 2,081,583 | ||||||
Priceline Group Inc. (The)(b) | 2,209 | 2,758,246 | ||||||
TripAdvisor Inc.(b) | 4,772 | 333,563 | ||||||
| 14,014,115 | ||||||||
| Internet Software & Services–3.57% | ||||||||
Akamai Technologies, Inc.(b) | 7,614 | 542,954 | ||||||
eBay Inc.(b) | 47,144 | 1,278,074 | ||||||
Facebook Inc.–Class A(b) | 89,821 | 8,032,692 | ||||||
Google Inc.–Class A(b) | 12,204 | 7,905,995 | ||||||
Google Inc.–Class C(b) | 12,239 | 7,566,762 | ||||||
VeriSign, Inc.(b) | 4,468 | 308,024 | ||||||
Yahoo! Inc.(b) | 37,219 | 1,199,941 | ||||||
| 26,834,442 | ||||||||
| Investment Banking & Brokerage–0.97% | ||||||||
Charles Schwab Corp. (The) | 49,294 | 1,497,552 | ||||||
E*TRADE Financial Corp.(b) | 12,361 | 324,970 | ||||||
Goldman Sachs Group, Inc. (The) | 17,133 | 3,231,284 | ||||||
Morgan Stanley | 65,531 | 2,257,543 | ||||||
| 7,311,349 | ||||||||
| IT Consulting & Other Services–1.34% | ||||||||
Accenture PLC–Class A | 26,706 | 2,517,575 | ||||||
Cognizant Technology Solutions Corp.–Class A(b) | 26,035 | 1,638,643 | ||||||
International Business Machines Corp. | 39,055 | 5,775,844 | ||||||
Teradata Corp.(b) | 6,054 | 176,958 | ||||||
| 10,109,020 | ||||||||
| Leisure Products–0.09% | ||||||||
Hasbro, Inc. | 4,776 | 356,242 | ||||||
| Shares | Value | |||||||
| Leisure Products–(continued) | ||||||||
Mattel, Inc. | 14,428 | $ | 338,048 | |||||
| 694,290 | ||||||||
| Life & Health Insurance–0.91% | ||||||||
Aflac, Inc. | 18,502 | 1,084,217 | ||||||
Lincoln National Corp. | 10,789 | 547,973 | ||||||
MetLife, Inc. | 47,585 | 2,384,009 | ||||||
Principal Financial Group, Inc. | 11,686 | 588,390 | ||||||
Prudential Financial, Inc. | 19,318 | 1,558,963 | ||||||
Torchmark Corp. | 5,377 | 314,339 | ||||||
Unum Group | 10,639 | 356,832 | ||||||
| 6,834,723 | ||||||||
| Life Sciences Tools & Services–0.44% | ||||||||
Agilent Technologies, Inc. | 14,208 | 515,892 | ||||||
PerkinElmer, Inc. | 4,826 | 234,930 | ||||||
Thermo Fisher Scientific, Inc. | 16,974 | 2,128,030 | ||||||
Waters Corp.(b) | 3,550 | 430,899 | ||||||
| 3,309,751 | ||||||||
| Managed Health Care–1.42% | ||||||||
Aetna Inc. | 14,891 | 1,705,317 | ||||||
Anthem, Inc. | 11,280 | 1,591,044 | ||||||
Cigna Corp. | 10,974 | 1,545,029 | ||||||
Humana Inc. | 6,386 | 1,167,297 | ||||||
UnitedHealth Group Inc. | 40,594 | 4,696,726 | ||||||
| 10,705,413 | ||||||||
| Metal & Glass Containers–0.07% | ||||||||
Ball Corp. | 5,878 | 387,419 | ||||||
Owens-Illinois, Inc.(b) | 6,875 | 143,344 | ||||||
| 530,763 | ||||||||
| Motorcycle Manufacturers–0.07% | ||||||||
Harley-Davidson, Inc. | 8,914 | 499,630 | ||||||
| Movies & Entertainment–1.59% | ||||||||
Time Warner Inc. | 35,165 | 2,500,232 | ||||||
Twenty-First Century Fox, Inc.–Class A | 75,459 | 2,066,822 | ||||||
Viacom Inc.–Class B | 15,235 | 621,131 | ||||||
Walt Disney Co. (The) | 66,572 | 6,782,355 | ||||||
| 11,970,540 | ||||||||
| Multi-Line Insurance–0.67% | ||||||||
American International Group, Inc. | 56,864 | 3,431,174 | ||||||
Assurant, Inc. | 2,895 | 215,243 | ||||||
Genworth Financial Inc.–Class A(b) | 21,211 | 109,873 | ||||||
Hartford Financial Services Group, Inc. (The) | 17,907 | 822,827 | ||||||
Loews Corp. | 12,669 | 461,785 | ||||||
| 5,040,902 | ||||||||
| Multi-Sector Holdings–1.42% | ||||||||
Berkshire Hathaway Inc.–Class B(b) | 77,777 | 10,425,229 | ||||||
Leucadia National Corp. | 13,446 | 288,551 | ||||||
| 10,713,780 | ||||||||
See accompanying Notes to Financial Statements which are an integral part of the financial statements.
13 Invesco S&P 500 Index Fund
| Shares | Value | |||||||
| Multi-Utilities–1.13% | ||||||||
Ameren Corp. | 10,346 | $ | 416,840 | |||||
CenterPoint Energy, Inc. | 18,346 | 341,603 | ||||||
CMS Energy Corp. | 11,769 | 385,788 | ||||||
Consolidated Edison, Inc. | 12,489 | 785,683 | ||||||
Dominion Resources, Inc. | 25,308 | 1,765,233 | ||||||
DTE Energy Co. | 7,646 | 596,847 | ||||||
NiSource Inc. | 13,534 | 227,236 | ||||||
PG&E Corp. | 20,475 | 1,015,150 | ||||||
Public Service Enterprise Group Inc. | 21,572 | 868,273 | ||||||
SCANA Corp. | 6,094 | 322,312 | ||||||
Sempra Energy | 9,924 | 941,291 | ||||||
TECO Energy, Inc. | 10,026 | 211,248 | ||||||
WEC Energy Group, Inc. | 13,442 | 640,511 | ||||||
| 8,518,015 | ||||||||
| Office REIT’s–0.24% | ||||||||
Boston Properties, Inc. | 6,541 | 741,619 | ||||||
SL Green Realty Corp. | 4,283 | 443,333 | ||||||
Vornado Realty Trust | 7,466 | 650,960 | ||||||
| 1,835,912 | ||||||||
| Office Services & Supplies–0.02% | ||||||||
Pitney Bowes Inc. | 8,600 | 170,366 | ||||||
| Oil & Gas Drilling–0.10% | ||||||||
Diamond Offshore Drilling, Inc. | 2,865 | 67,929 | ||||||
Ensco PLC–Class A | 9,992 | 180,955 | ||||||
Helmerich & Payne, Inc. | 4,590 | 270,856 | ||||||
Transocean Ltd. | 14,565 | 207,260 | ||||||
| 727,000 | ||||||||
| Oil & Gas Equipment & Services–1.10% | ||||||||
Baker Hughes Inc. | 18,536 | 1,038,016 | ||||||
Cameron International Corp.(b) | 8,161 | 544,829 | ||||||
FMC Technologies, Inc.(b) | 9,846 | 342,444 | ||||||
Halliburton Co. | 36,286 | 1,427,854 | ||||||
National Oilwell Varco Inc. | 16,540 | 700,138 | ||||||
Schlumberger Ltd. | 54,149 | 4,189,508 | ||||||
| 8,242,789 | ||||||||
| Oil & Gas Exploration & Production–1.65% | ||||||||
Anadarko Petroleum Corp. | 21,661 | 1,550,494 | ||||||
Apache Corp. | 16,081 | 727,504 | ||||||
Cabot Oil & Gas Corp. | 17,638 | 417,491 | ||||||
Chesapeake Energy Corp. | 22,071 | 172,375 | ||||||
Cimarex Energy Co. | 3,993 | 441,266 | ||||||
ConocoPhillips | 52,580 | 2,584,307 | ||||||
Devon Energy Corp. | 16,479 | 702,994 | ||||||
EOG Resources, Inc. | 23,409 | 1,833,159 | ||||||
EQT Corp. | 6,496 | 505,519 | ||||||
Hess Corp. | 10,416 | 619,231 | ||||||
Marathon Oil Corp. | 28,783 | 497,658 | ||||||
Murphy Oil Corp. | 7,133 | 221,123 | ||||||
Newfield Exploration Co.(b) | 6,941 | 231,205 | ||||||
| Shares | Value | |||||||
| Oil & Gas Exploration & Production–(continued) | ||||||||
Noble Energy, Inc. | 18,253 | $ | 609,833 | |||||
Pioneer Natural Resources Co. | 6,366 | 783,400 | ||||||
Range Resources Corp. | 7,100 | 274,202 | ||||||
Southwestern Energy Co.(b) | 16,503 | 268,009 | ||||||
| 12,439,770 | ||||||||
| Oil & Gas Refining & Marketing–0.63% | ||||||||
Marathon Petroleum Corp. | 23,168 | 1,096,078 | ||||||
Phillips 66 | 23,127 | 1,828,652 | ||||||
Tesoro Corp. | 5,369 | 494,002 | ||||||
Valero Energy Corp. | 21,690 | 1,287,084 | ||||||
| 4,705,816 | ||||||||
| Oil & Gas Storage & Transportation–0.70% | ||||||||
Columbia Pipeline Group, Inc. | 13,534 | 343,222 | ||||||
Kinder Morgan Inc. | 73,971 | 2,397,400 | ||||||
ONEOK, Inc. | 8,902 | 320,561 | ||||||
Spectra Energy Corp. | 28,629 | 832,245 | ||||||
Williams Cos., Inc. (The) | 28,747 | 1,385,606 | ||||||
| 5,279,034 | ||||||||
| Packaged Foods & Meats–1.51% | ||||||||
Campbell Soup Co. | 7,578 | 363,668 | ||||||
ConAgra Foods, Inc. | 18,211 | 759,034 | ||||||
General Mills, Inc.(d) | 25,420 | 1,442,839 | ||||||
Hershey Co. (The) | 6,257 | 560,127 | ||||||
Hormel Foods Corp. | 5,746 | 351,081 | ||||||
JM Smucker Co. (The) | 4,132 | 486,419 | ||||||
Kellogg Co. | 10,684 | 708,136 | ||||||
Keurig Green Mountain Inc. | 4,923 | 278,642 | ||||||
Kraft Heinz Co. (The) | 25,258 | 1,835,246 | ||||||
McCormick & Co., Inc. | 5,448 | 431,917 | ||||||
Mead Johnson Nutrition Co. | 8,636 | 676,544 | ||||||
Mondelez International Inc.–Class A | 69,369 | 2,938,471 | ||||||
Tyson Foods, Inc.–Class A | 12,440 | 525,963 | ||||||
| 11,358,087 | ||||||||
| Paper Packaging–0.18% | ||||||||
Avery Dennison Corp. | 3,902 | 226,628 | ||||||
Sealed Air Corp. | 8,961 | 461,044 | ||||||
WestRock Co. | 11,118 | 659,853 | ||||||
| 1,347,525 | ||||||||
| Paper Products–0.10% | ||||||||
International Paper Co. | 18,033 | 777,944 | ||||||
| Personal Products–0.10% | ||||||||
Estee Lauder Cos. Inc. (The)–Class A | 9,520 | 759,410 | ||||||
| Pharmaceuticals–6.39% | ||||||||
AbbVie Inc. | 73,333 | 4,576,713 | ||||||
Allergan PLC(b) | 16,735 | 5,083,089 | ||||||
Bristol-Myers Squibb Co. | 71,090 | 4,227,722 | ||||||
Eli Lilly and Co. | 41,647 | 3,429,631 | ||||||
Endo International PLC(b) | 8,646 | 665,742 | ||||||
See accompanying Notes to Financial Statements which are an integral part of the financial statements.
14 Invesco S&P 500 Index Fund
| Shares | Value | |||||||
| Pharmaceuticals–(continued) | ||||||||
Hospira, Inc.(b) | 7,367 | $ | 662,809 | |||||
Johnson & Johnson | 118,261 | 11,114,169 | ||||||
Mallinckrodt PLC(b) | 4,987 | 430,079 | ||||||
Merck & Co., Inc. | 120,486 | 6,488,171 | ||||||
Mylan N.V.(b) | 17,553 | 870,453 | ||||||
Perrigo Co. PLC | 6,236 | 1,141,001 | ||||||
Pfizer Inc. | 262,606 | 8,461,165 | ||||||
Zoetis Inc. | 21,321 | 956,673 | ||||||
| 48,107,417 | ||||||||
| Property & Casualty Insurance–0.86% | ||||||||
ACE Ltd. | 13,927 | 1,422,782 | ||||||
Allstate Corp. (The) | 17,442 | 1,016,520 | ||||||
Chubb Corp. (The) | 9,797 | 1,183,576 | ||||||
Cincinnati Financial Corp. | 6,307 | 330,045 | ||||||
Progressive Corp. (The) | 22,768 | 682,129 | ||||||
Travelers Cos., Inc. (The) | 13,590 | 1,352,885 | ||||||
XL Group PLC | 13,076 | 487,604 | ||||||
| 6,475,541 | ||||||||
| Publishing–0.04% | ||||||||
News Corp.–Class A(b) | 21,353 | 291,041 | ||||||
| Railroads–0.77% | ||||||||
CSX Corp. | 42,133 | 1,153,601 | ||||||
Kansas City Southern | 4,713 | 437,084 | ||||||
Norfolk Southern Corp. | 12,999 | 1,012,752 | ||||||
Union Pacific Corp. | 37,340 | 3,201,532 | ||||||
| 5,804,969 | ||||||||
| Real Estate Services–0.05% | ||||||||
CBRE Group, Inc.–Class A(b) | 11,927 | 381,903 | ||||||
| Regional Banks–0.98% | ||||||||
BB&T Corp. | 33,138 | 1,223,455 | ||||||
Fifth Third Bancorp | 34,540 | 688,037 | ||||||
Huntington Bancshares Inc. | 34,480 | 376,177 | ||||||
KeyCorp | 36,176 | 497,058 | ||||||
M&T Bank Corp. | 5,669 | 670,303 | ||||||
People’s United Financial Inc. | 13,181 | 204,305 | ||||||
PNC Financial Services Group, Inc. (The) | 22,086 | 2,012,476 | ||||||
Regions Financial Corp. | 57,161 | 548,174 | ||||||
SunTrust Banks, Inc. | 22,014 | 888,705 | ||||||
Zions Bancorp. | 8,665 | 251,285 | ||||||
| 7,359,975 | ||||||||
| Research & Consulting Services–0.18% | ||||||||
Dun & Bradstreet Corp. (The) | 1,533 | 162,452 | ||||||
Equifax Inc. | 5,089 | 498,213 | ||||||
Nielsen Holdings PLC | 15,740 | 711,920 | ||||||
| 1,372,585 | ||||||||
| Residential REIT’s–0.38% | ||||||||
Apartment Investment & Management Co.–Class A | 6,663 | 240,068 | ||||||
AvalonBay Communities, Inc. | 5,636 | 930,278 | ||||||
| Shares | Value | |||||||
| Residential REIT’s–(continued) | ||||||||
Equity Residential | 15,522 | $ | 1,105,943 | |||||
Essex Property Trust, Inc. | 2,786 | 597,931 | ||||||
| 2,874,220 | ||||||||
| Restaurants–1.35% | ||||||||
Chipotle Mexican Grill, Inc.(b) | 1,323 | 939,343 | ||||||
Darden Restaurants, Inc. | 5,363 | 364,738 | ||||||
McDonald’s Corp. | 40,876 | 3,884,037 | ||||||
Starbucks Corp. | 63,991 | 3,500,948 | ||||||
Yum! Brands, Inc. | 18,439 | 1,470,879 | ||||||
| 10,159,945 | ||||||||
| Retail REIT’s–0.58% | ||||||||
General Growth Properties, Inc. | 26,833 | 681,022 | ||||||
Kimco Realty Corp. | 17,601 | 405,703 | ||||||
Macerich Co. (The) | 6,005 | 457,461 | ||||||
Realty Income Corp. | 9,916 | 443,146 | ||||||
Simon Property Group, Inc. | 13,273 | 2,380,114 | ||||||
| 4,367,446 | ||||||||
| Security & Alarm Services–0.12% | ||||||||
ADT Corp. (The) | 7,304 | 239,425 | ||||||
Tyco International PLC | 17,954 | 651,551 | ||||||
| 890,976 | ||||||||
| Semiconductor Equipment–0.22% | ||||||||
Applied Materials, Inc. | 52,523 | 844,833 | ||||||
KLA-Tencor Corp. | 6,819 | 341,700 | ||||||
Lam Research Corp. | 6,751 | 491,270 | ||||||
| 1,677,803 | ||||||||
| Semiconductors–2.07% | ||||||||
Altera Corp. | 12,839 | 623,333 | ||||||
Analog Devices, Inc. | 13,370 | �� | 746,848 | |||||
Avago Technologies Ltd. (Singapore) | 11,079 | 1,395,622 | ||||||
Broadcom Corp.–Class A | 23,192 | 1,198,331 | ||||||
First Solar, Inc.(b) | 3,181 | 152,179 | ||||||
Intel Corp. | 202,317 | 5,774,127 | ||||||
Linear Technology Corp. | 10,211 | 411,299 | ||||||
Microchip Technology Inc. | 8,968 | 381,140 | ||||||
Micron Technology, Inc.(b) | 45,943 | 753,925 | ||||||
NVIDIA Corp. | 21,795 | 489,952 | ||||||
Qorvo, Inc.(b) | 6,371 | 353,654 | ||||||
Skyworks Solutions, Inc. | 8,148 | 711,728 | ||||||
Texas Instruments Inc. | 44,367 | 2,122,517 | ||||||
Xilinx, Inc. | 11,027 | 461,921 | ||||||
| 15,576,576 | ||||||||
| Soft Drinks–1.91% | ||||||||
Coca-Cola Co. (The) | 167,296 | 6,578,079 | ||||||
Coca-Cola Enterprises, Inc. | 9,140 | 470,618 | ||||||
Dr Pepper Snapple Group, Inc. | 8,175 | 627,268 | ||||||
Monster Beverage Corp.(b) | 6,268 | 867,867 | ||||||
PepsiCo, Inc. | 62,948 | 5,849,758 | ||||||
| 14,393,590 | ||||||||
See accompanying Notes to Financial Statements which are an integral part of the financial statements.
15 Invesco S&P 500 Index Fund
| Shares | Value | |||||||
| Specialized Consumer Services–0.05% | ||||||||
H&R Block, Inc. | 11,737 | $ | 399,293 | |||||
| Specialized Finance–0.60% | ||||||||
CME Group Inc.–Class A | 13,531 | 1,277,868 | ||||||
Intercontinental Exchange, Inc. | 4,764 | 1,088,145 | ||||||
McGraw Hill Financial, Inc. | 11,671 | 1,131,970 | ||||||
Moody’s Corp. | 7,586 | 776,124 | ||||||
NASDAQ OMX Group, Inc. (The) | 5,049 | 258,458 | ||||||
| 4,532,565 | ||||||||
| Specialized REIT’s–0.78% | ||||||||
American Tower Corp. | 18,042 | 1,663,292 | ||||||
Crown Castle International Corp. | 14,391 | 1,200,066 | ||||||
Equinix, Inc. | 2,438 | 657,699 | ||||||
Iron Mountain Inc. | 7,990 | 226,437 | ||||||
Plum Creek Timber Co., Inc. | 7,488 | 288,213 | ||||||
Public Storage | 6,192 | 1,246,264 | ||||||
Weyerhaeuser Co. | 22,079 | 616,887 | ||||||
| 5,898,858 | ||||||||
| Specialty Chemicals–0.57% | ||||||||
Ecolab Inc. | 11,427 | 1,247,143 | ||||||
International Flavors & Fragrances Inc. | 3,450 | 377,947 | ||||||
PPG Industries, Inc. | 11,592 | 1,104,602 | ||||||
Sherwin-Williams Co. (The) | 3,377 | 863,870 | ||||||
Sigma-Aldrich Corp. | 5,092 | 709,876 | ||||||
| 4,303,438 | ||||||||
| Specialty Stores–0.23% | ||||||||
Signet Jewelers Ltd. | 3,424 | 472,512 | ||||||
Staples, Inc. | 27,321 | 388,231 | ||||||
Tiffany & Co. | 4,791 | 394,060 | ||||||
Tractor Supply Co. | 5,817 | 496,248 | ||||||
| 1,751,051 | ||||||||
| Steel–0.08% | ||||||||
Nucor Corp. | 13,609 | 589,134 | ||||||
| Systems Software–2.87% | ||||||||
CA, Inc. | 13,499 | 368,388 | ||||||
Microsoft Corp. | 344,996 | 15,014,226 | ||||||
Oracle Corp. | 135,956 | 5,042,608 | ||||||
Red Hat, Inc.(b) | 7,817 | 564,465 | ||||||
Symantec Corp. | 29,030 | 594,825 | ||||||
| 21,584,512 | ||||||||
| Shares | Value | |||||||
| Technology Hardware, Storage & Peripherals–4.56% | ||||||||
Apple Inc. | 245,690 | $ | 27,704,004 | |||||
EMC Corp. | 82,822 | 2,059,783 | ||||||
Hewlett-Packard Co. | 77,037 | 2,161,658 | ||||||
NetApp, Inc. | 13,295 | 424,908 | ||||||
SanDisk Corp. | 8,866 | 483,729 | ||||||
Seagate Technology PLC | 13,534 | 695,648 | ||||||
Western Digital Corp. | 9,255 | 758,540 | ||||||
| 34,288,270 | ||||||||
| Thrifts & Mortgage Finance–0.03% | ||||||||
Hudson City Bancorp, Inc. | 20,549 | 191,106 | ||||||
| Tires & Rubber–0.05% | ||||||||
Goodyear Tire & Rubber Co. (The) | 11,503 | 342,444 | ||||||
| Tobacco–1.49% | ||||||||
Altria Group, Inc. | 83,867 | 4,493,594 | ||||||
Philip Morris International Inc. | 66,065 | 5,271,987 | ||||||
Reynolds American Inc. | 17,726 | 1,484,552 | ||||||
| 11,250,133 | ||||||||
| Trading Companies & Distributors–0.17% | ||||||||
Fastenal Co. | 11,592 | 446,756 | ||||||
United Rentals, Inc.(b) | 4,134 | 286,610 | ||||||
W.W. Grainger, Inc. | 2,539 | 567,314 | ||||||
| 1,300,680 | ||||||||
| Trucking–0.06% | ||||||||
J.B. Hunt Transport Services, Inc. | 3,925 | 285,662 | ||||||
Ryder System, Inc. | 2,289 | 187,629 | ||||||
| 473,291 | ||||||||
Total Common Stocks & Other Equity Interests (Cost $390,812,520) |
| 742,321,342 | ||||||
Money Market Funds–1.41% |
| |||||||
Liquid Assets Portfolio–Institutional Class, 0.12%(e) | 5,293,707 | 5,293,707 | ||||||
Premier Portfolio–Institutional | 5,293,706 | 5,293,706 | ||||||
Total Money Market Funds |
| 10,587,413 | ||||||
TOTAL INVESTMENTS–100.03% |
| 752,908,755 | ||||||
OTHER ASSETS LESS LIABILITIES–(0.03)% |
| (212,858 | ) | |||||
NET ASSETS–100.00% |
| $ | 752,695,897 | |||||
Investment Abbreviations:
| REIT | – Real Estate Investment Trust |
Notes to Schedule of Investments:
| (a) | Industry and/or sector classifications used in this report are generally according to the Global Industry Classification Standard, which was developed by and is the exclusive property and a service mark of MSCI Inc. and Standard & Poor’s. |
| (b) | Non-income producing security. |
| (c) | The Fund’s Adviser is a subsidiary of Invesco Ltd. and therefore, Invesco Ltd. is considered to be affiliated with the Fund. See Note 5. |
| (d) | All or a portion of the value was pledged as collateral to cover margin requirements for open futures contracts. See Note 1I and Note 4. |
| (e) | The money market fund and the Fund are affiliated by having the same investment adviser. The rate shown is the 7-day SEC standardized yield as of August 31, 2015. |
See accompanying Notes to Financial Statements which are an integral part of the financial statements.
16 Invesco S&P 500 Index Fund
Statement of Assets and Liabilities
August 31, 2015
Assets: |
| |||
Investments, at value (Cost $390,368,619) | $ | 741,694,844 | ||
Investments in affiliates, at value (Cost $11,031,314) | 11,213,911 | |||
Total investments, at value (Cost $401,399,933) | 752,908,755 | |||
Cash | 578,853 | |||
Receivable for: | ||||
Fund shares sold | 1,906,764 | |||
Dividends | 1,663,217 | |||
Investment for trustee deferred compensation and retirement plans | 61,749 | |||
Other assets | 31,638 | |||
Total assets | 757,150,976 | |||
Liabilities: |
| |||
Payable for: | ||||
Investments purchased | 624,138 | |||
Fund shares reacquired | 2,873,320 | |||
Variation margin — futures contracts | 128,297 | |||
Accrued fees to affiliates | 682,383 | |||
Accrued trustees’ and officers’ fees and benefits | 4,153 | |||
Accrued other operating expenses | 70,688 | |||
Trustee deferred compensation and retirement plans | 72,100 | |||
Total liabilities | 4,455,079 | |||
Net assets applicable to shares outstanding | $ | 752,695,897 | ||
Net assets consist of: |
| |||
Shares of beneficial interest | $ | 453,738,286 | ||
Undistributed net investment income | 7,843,344 | |||
Undistributed net realized gain (loss) | (59,795,686 | ) | ||
Net unrealized appreciation | 350,909,953 | |||
| $ | 752,695,897 | |||
Net Assets: |
| |||
Class A | $ | 534,656,422 | ||
Class B | $ | 5,116,665 | ||
Class C | $ | 164,875,928 | ||
Class Y | $ | 48,046,882 | ||
Shares outstanding, $0.01 par value per share, |
| |||
Class A | 24,962,589 | |||
Class B | 244,349 | |||
Class C | 7,965,539 | |||
Class Y | 2,217,256 | |||
Class A: | ||||
Net asset value per share | $ | 21.42 | ||
Maximum offering price per share | ||||
(Net asset value of $21.42 ¸ 94.50%) | $ | 22.67 | ||
Class B: | ||||
Net asset value and offering price per share | $ | 20.94 | ||
Class C: | ||||
Net asset value and offering price per share | $ | 20.70 | ||
Class Y: | ||||
Net asset value and offering price per share | $ | 21.67 | ||
See accompanying Notes to Financial Statements which are an integral part of the financial statements.
17 Invesco S&P 500 Index Fund
Statement of Operations
For the year ended August 31, 2015
Investment income: |
| |||
Dividends (net of foreign withholding taxes of $6,025) | $ | 15,445,808 | ||
Dividends from affiliates | 28,766 | |||
Total investment income | 15,474,574 | |||
Expenses: | ||||
Advisory fees | 917,981 | |||
Administrative services fees | 190,947 | |||
Custodian fees | 35,874 | |||
Distribution fees: | ||||
Class A | 1,419,504 | |||
Class B | 67,736 | |||
Class C | 1,506,764 | |||
Transfer agent fees | 1,031,195 | |||
Trustees’ and officers’ fees and benefits | 30,471 | |||
Other | 355,181 | |||
Total expenses | 5,555,653 | |||
Less: Fees waived and expense offset arrangement(s) | (24,471 | ) | ||
Net expenses | 5,531,182 | |||
Net investment income | 9,943,392 | |||
Realized and unrealized gain (loss) from: | ||||
Net realized gain from: | ||||
Investment securities | 10,735,996 | |||
Futures contracts | 1,400,393 | |||
| 12,136,389 | ||||
Change in net unrealized appreciation (depreciation) of: | ||||
Investment securities | (23,565,691 | ) | ||
Futures contracts | (787,306 | ) | ||
| (24,352,997 | ) | |||
Net realized and unrealized gain (loss) | (12,216,608 | ) | ||
Net increase (decrease) in net assets resulting from operations | $ | (2,273,216 | ) | |
See accompanying Notes to Financial Statements which are an integral part of the financial statements.
18 Invesco S&P 500 Index Fund
Statement of Changes in Net Assets
For the years ended August 31, 2015 and 2014
| 2015 | 2014 | |||||||
Operations: |
| |||||||
Net investment income | $ | 9,943,392 | $ | 8,742,956 | ||||
Net realized gain | 12,136,389 | 11,844,995 | ||||||
Change in net unrealized appreciation (depreciation) | (24,352,997 | ) | 121,029,821 | |||||
Net increase (decrease) in net assets resulting from operations | (2,273,216 | ) | 141,617,772 | |||||
Distributions to shareholders from net investment income: | ||||||||
Class A | (6,708,197 | ) | (7,179,915 | ) | ||||
Class B | (41,456 | ) | (81,335 | ) | ||||
Class C | (776,453 | ) | (813,327 | ) | ||||
Class Y | (488,719 | ) | (436,370 | ) | ||||
Total distributions from net investment income | (8,014,825 | ) | (8,510,947 | ) | ||||
Share transactions–net: | ||||||||
Class A | (17,280,449 | ) | (14,239,028 | ) | ||||
Class B | (3,038,091 | ) | (4,900,844 | ) | ||||
Class C | 43,635,887 | 10,893,429 | ||||||
Class Y | 24,505,883 | (2,285,605 | ) | |||||
Net increase (decrease) in net assets resulting from share transactions | 47,823,230 | (10,532,048 | ) | |||||
Net increase in net assets | 37,535,189 | 122,574,777 | ||||||
Net assets: | ||||||||
Beginning of year | 715,160,708 | 592,585,931 | ||||||
End of year (includes undistributed net investment income of $7,843,344 and $5,900,382, respectively) | $ | 752,695,897 | $ | 715,160,708 | ||||
Notes to Financial Statements
August 31, 2015
NOTE 1—Significant Accounting Policies
Invesco S&P 500 Index Fund (the “Fund”) is a series portfolio of AIM Counselor Series Trust (Invesco Counselor Series Trust) (the “Trust”). The Trust is a Delaware statutory trust registered under the Investment Company Act of 1940, as amended (the “1940 Act”), as an open-end series management investment company consisting of thirteen separate portfolios, each authorized to issue an unlimited number of shares of beneficial interest. The assets, liabilities and operations of each portfolio are accounted for separately. Information presented in these financial statements pertains only to the Fund. Matters affecting each portfolio or class will be voted on exclusively by the shareholders of such portfolio or class.
The Fund’s investment objective is total return through growth of capital and current income.
The Fund currently consists of four different classes of shares: Class A, Class B, Class C and Class Y. Class A shares are sold with a front-end sales charge unless certain waiver criteria are met and under certain circumstances load waived shares may be subject to contingent deferred sales charges (“CDSC”). Class C shares are sold with a CDSC. Class Y shares are sold at net asset value. Effective November 30, 2010, new or additional investments in Class B shares are no longer permitted. Existing shareholders of Class B shares may continue to reinvest dividends and capital gains distributions in Class B shares until they convert to Class A shares. Also, shareholders in Class B shares will be able to exchange those shares for Class B shares of other Invesco Funds offering such shares until they convert to Class A shares. Generally, Class B shares will automatically convert to Class A shares on or about the month-end, which is at least eight years after the date of purchase. Redemption of Class B shares prior to conversion date will be subject to a CDSC.
The following is a summary of the significant accounting policies followed by the Fund in the preparation of its financial statements.
| A. | Security Valuations — Securities, including restricted securities, are valued according to the following policy. |
A security listed or traded on an exchange (except convertible securities) is valued at its last sales price or official closing price as of the close of the customary trading session on the exchange where the security is principally traded, or lacking any sales or official closing price on a particular day, the security may be valued at the closing bid price on that day. Securities traded in the over-the-counter market are valued based on prices furnished by independent pricing services or market makers. When such securities are valued by an independent pricing service they may be considered fair valued. Futures contracts are valued at the final settlement price set by an exchange on which they are principally traded. Listed options are valued at the mean between the last bid and asked prices from the exchange on which they are principally traded. Options not listed on an exchange are valued by an independent source at the mean between the last bid and asked prices. For purposes of determining net asset value (“NAV”) per share, futures and option contracts generally are valued 15 minutes after the close of the customary trading session of the New York Stock Exchange (“NYSE”).
Investments in open-end and closed-end registered investment companies that do not trade on an exchange are valued at the end-of-day net asset value per share. Investments in open-end and closed-end registered investment companies that trade on an exchange are valued at the last sales price or official closing price as of the close of the customary trading session on the exchange where the security is principally traded.
19 Invesco S&P 500 Index Fund
Debt obligations (including convertible securities) and unlisted equities are fair valued using an evaluated quote provided by an independent pricing service. Evaluated quotes provided by the pricing service may be determined without exclusive reliance on quoted prices, and may reflect appropriate factors such as institution-size trading in similar groups of securities, developments related to specific securities, dividend rate (for unlisted equities), yield (for debt obligations), quality, type of issue, coupon rate (for debt obligations), maturity (for debt obligations), individual trading characteristics and other market data. Debt obligations are subject to interest rate and credit risks. In addition, all debt obligations involve some risk of default with respect to interest and/or principal payments.
Foreign securities’ (including foreign exchange contracts) prices are converted into U.S. dollar amounts using the applicable exchange rates as of the close of the NYSE. If market quotations are available and reliable for foreign exchange-traded equity securities, the securities will be valued at the market quotations. Because trading hours for certain foreign securities end before the close of the NYSE, closing market quotations may become unreliable. If between the time trading ends on a particular security and the close of the customary trading session on the NYSE, events occur that the Adviser determines are significant and make the closing price unreliable, the Fund may fair value the security. If the event is likely to have affected the closing price of the security, the security will be valued at fair value in good faith using procedures approved by the Board of Trustees. Adjustments to closing prices to reflect fair value may also be based on a screening process of an independent pricing service to indicate the degree of certainty, based on historical data, that the closing price in the principal market where a foreign security trades is not the current value as of the close of the NYSE. Foreign securities’ prices meeting the approved degree of certainty that the price is not reflective of current value will be priced at the indication of fair value from the independent pricing service. Multiple factors may be considered by the independent pricing service in determining adjustments to reflect fair value and may include information relating to sector indices, American Depositary Receipts and domestic and foreign index futures. Foreign securities may have additional risks including exchange rate changes, potential for sharply devalued currencies and high inflation, political and economic upheaval, the relative lack of issuer information, relatively low market liquidity and the potential lack of strict financial and accounting controls and standards.
Securities for which market prices are not provided by any of the above methods may be valued based upon quotes furnished by independent sources. The last bid price may be used to value equity securities. The mean between the last bid and asked prices is used to value debt obligations, including corporate loans.
Securities for which market quotations are not readily available or became unreliable are valued at fair value as determined in good faith by or under the supervision of the Trust’s officers following procedures approved by the Board of Trustees. Issuer specific events, market trends, bid/asked quotes of brokers and information providers and other market data may be reviewed in the course of making a good faith determination of a security’s fair value.
The Fund may invest in securities that are subject to interest rate risk, meaning the risk that the prices will generally fall as interest rates rise and, conversely, the prices will generally rise as interest rates fall. Specific securities differ in their sensitivity to changes in interest rates depending on their individual characteristics. Changes in interest rates may result in increased market volatility, which may affect the value and/or liquidity of certain Fund investments.
Valuations change in response to many factors including the historical and prospective earnings of the issuer, the value of the issuer’s assets, general economic conditions, interest rates, investor perceptions and market liquidity. Because of the inherent uncertainties of valuation, the values reflected in the financial statements may materially differ from the value received upon actual sale of those investments.
| B. | Securities Transactions and Investment Income — Securities transactions are accounted for on a trade date basis. Realized gains or losses on sales are computed on the basis of specific identification of the securities sold. Interest income (net of withholding tax, if any) is recorded on the accrual basis from settlement date. Dividend income (net of withholding tax, if any) is recorded on the ex-dividend date. |
The Fund may periodically participate in litigation related to Fund investments. As such, the Fund may receive proceeds from litigation settlements. Any proceeds received are included in the Statement of Operations as realized gain (loss) for investments no longer held and as unrealized gain (loss) for investments still held.
Brokerage commissions and mark ups are considered transaction costs and are recorded as an increase to the cost basis of securities purchased and/or a reduction of proceeds on a sale of securities. Such transaction costs are included in the determination of net realized and unrealized gain (loss) from investment securities reported in the Statement of Operations and the Statement of Changes in Net Assets and the net realized and unrealized gains (losses) on securities per share in the Financial Highlights. Transaction costs are included in the calculation of the Fund’s net asset value and, accordingly, they reduce the Fund’s total returns. These transaction costs are not considered operating expenses and are not reflected in net investment income reported in the Statement of Operations and the Statement of Changes in Net Assets, or the net investment income per share and the ratios of expenses and net investment income reported in the Financial Highlights, nor are they limited by any expense limitation arrangements between the Fund and the investment adviser.
The Fund allocates income and realized and unrealized capital gains and losses to a class based on the relative net assets of each class.
| C. | Country Determination — For the purposes of making investment selection decisions and presentation in the Schedule of Investments, the investment adviser may determine the country in which an issuer is located and/or credit risk exposure based on various factors. These factors include the laws of the country under which the issuer is organized, where the issuer maintains a principal office, the country in which the issuer derives 50% or more of its total revenues and the country that has the primary market for the issuer’s securities, as well as other criteria. Among the other criteria that may be evaluated for making this determination are the country in which the issuer maintains 50% or more of its assets, the type of security, financial guarantees and enhancements, the nature of the collateral and the sponsor organization. Country of issuer and/or credit risk exposure has been determined to be the United States of America, unless otherwise noted. |
| D. | Distributions — Distributions from net investment income and net realized capital gain, if any, are generally declared and paid annually and recorded on the ex-dividend date. The Fund may elect to treat a portion of the proceeds from redemptions as distributions for federal income tax purposes. |
| E. | Federal Income Taxes — The Fund intends to comply with the requirements of Subchapter M of the Internal Revenue Code of 1986, as amended (the “Internal Revenue Code”), necessary to qualify as a regulated investment company and to distribute substantially all of the Fund’s taxable earnings to shareholders. As such, the Fund will not be subject to federal income taxes on otherwise taxable income (including net realized capital gain) that is distributed to shareholders. Therefore, no provision for federal income taxes is recorded in the financial statements. |
20 Invesco S&P 500 Index Fund
The Fund recognizes the tax benefits of uncertain tax positions only when the position is more likely than not to be sustained. Management has analyzed the Fund’s uncertain tax positions and concluded that no liability for unrecognized tax benefits should be recorded related to uncertain tax positions. Management is not aware of any tax positions for which it is reasonably possible that the total amounts of unrecognized tax benefits will change materially in the next 12 months.
The Fund files tax returns in the U.S. Federal jurisdiction and certain other jurisdictions. Generally, the Fund is subject to examinations by such taxing authorities for up to three years after the filing of the return for the tax period.
| F. | Expenses — Fees provided for under the Rule 12b-1 plan of a particular class of the Fund and which are directly attributable to that class are charged to the operations of such class. All other expenses are allocated among the classes based on relative net assets. |
| G. | Accounting Estimates — The preparation of financial statements in conformity with accounting principles generally accepted in the United States of America (“GAAP”) requires management to make estimates and assumptions that affect the reported amounts of assets and liabilities at the date of the financial statements and the reported amounts of revenues and expenses during the reporting period including estimates and assumptions related to taxation. Actual results could differ from those estimates by a significant amount. In addition, the Fund monitors for material events or transactions that may occur or become known after the period-end date and before the date the financial statements are released to print. |
| H. | Indemnifications — Under the Trust’s organizational documents, each Trustee, officer, employee or other agent of the Trust is indemnified against certain liabilities that may arise out of the performance of their duties to the Fund. Additionally, in the normal course of business, the Fund enters into contracts, including the Fund’s servicing agreements, that contain a variety of indemnification clauses. The Fund’s maximum exposure under these arrangements is unknown as this would involve future claims that may be made against the Fund that have not yet occurred. The risk of material loss as a result of such indemnification claims is considered remote. |
| I. | Futures Contracts — The Fund may enter into futures contracts to manage exposure to interest rate, equity and market price movements and/or currency risks. A futures contract is an agreement between two parties (“Counterparties”) to purchase or sell a specified underlying security, currency or commodity (or delivery of a cash settlement price, in the case of an index future) for a fixed price at a future date. The Fund currently invests only in exchange-traded futures and they are standardized as to maturity date and underlying financial instrument. Initial margin deposits required upon entering into futures contracts are satisfied by the segregation of specific securities or cash as collateral at the futures commission merchant (broker). During the period the futures contracts are open, changes in the value of the contracts are recognized as unrealized gains or losses by recalculating the value of the contracts on a daily basis. Subsequent or variation margin payments are received or made depending upon whether unrealized gains or losses are incurred. These amounts are reflected as receivables or payables on the Statement of Assets and Liabilities. When the contracts are closed or expire, the Fund recognizes a realized gain or loss equal to the difference between the proceeds from, or cost of, the closing transaction and the Fund’s basis in the contract. The net realized gain (loss) and the change in unrealized gain (loss) on futures contracts held during the period is included on the Statement of Operations. The primary risks associated with futures contracts are market risk and the absence of a liquid secondary market. If the Fund were unable to liquidate a futures contract and/or enter into an offsetting closing transaction, the Fund would continue to be subject to market risk with respect to the value of the contracts and continue to be required to maintain the margin deposits on the futures contracts. Futures contracts have minimal Counterparty risk since the exchange’s clearinghouse, as Counterparty to all exchange-traded futures, guarantees the futures against default. Risks may exceed amounts recognized in the Statement of Assets and Liabilities. |
| J. | Collateral — To the extent the Fund has designated or segregated a security as collateral and that security is subsequently sold, it is the Fund’s practice to replace such collateral no later than the next business day. |
NOTE 2—Advisory Fees and Other Fees Paid to Affiliates
The Trust has entered into a master investment advisory agreement with Invesco Advisers, Inc. (the “Adviser” or “Invesco”). Under the terms of the investment advisory agreement, the Fund pays an advisory fee to the Adviser based on the annual rate of the Fund’s average daily net assets as follows:
| Average Daily Net Assets | Rate | |||
First $2 billion | 0.12% | |||
Over $2 billion | 0.10% | |||
For the year ended August 31, 2015, the effective advisory fees incurred by the Fund was 0.12%.
Under the terms of a master sub-advisory agreement between the Adviser and each of Invesco Asset Management Deutschland GmbH, Invesco Asset Management Limited, Invesco Asset Management (Japan) Limited, Invesco Hong Kong Limited, Invesco Senior Secured Management, Inc. and Invesco Canada Ltd. (collectively, the “Affiliated Sub-Advisers”) the Adviser, not the Fund, may pay 40% of the fees paid to the Adviser to any such Affiliated Sub-Adviser(s) that provide(s) discretionary investment management services to the Fund based on the percentage of assets allocated to such Affiliated Sub-Adviser(s).
The Adviser has contractually agreed, through at least June 30, 2016, to waive advisory fees and/or reimburse expenses to the extent necessary to limit total annual fund operating expenses after fee waiver and/or reimbursement (excluding certain items discussed below) of Class A, Class B, Class C and Class Y shares to 2.00%, 2.75%, 2.75% and 1.75% of average daily net assets, respectively. In determining the Adviser’s obligation to waive advisory fees and/or reimburse expenses, the following expenses are not taken into account, and could cause total annual fund operating expenses after fee waiver and/or reimbursement to exceed the numbers reflected above: (1) interest; (2) taxes; (3) dividend expense on short sales; (4) extraordinary or non-routine items, including litigation expenses; and (5) expenses that the Fund has incurred but did not actually pay because of an expense offset arrangement. Unless Invesco continues the fee waiver agreement, it will terminate on June 30, 2016. The fee waiver agreement cannot be terminated during its term. The Adviser did not waive fees and/or reimburse expenses during the period under this expense limitation.
Further, the Adviser has contractually agreed, through at least June 30, 2017, to waive the advisory fee payable by the Fund in an amount equal to 100% of the net advisory fees the Adviser receives from the affiliated money market funds on investments by the Fund of uninvested cash in such affiliated money market funds.
21 Invesco S&P 500 Index Fund
For the year ended August 31, 2015, the Adviser waived advisory fees of $23,647.
The Trust has entered into a master administrative services agreement with Invesco pursuant to which the Fund has agreed to pay Invesco for certain administrative costs incurred in providing accounting services to the Fund. For the year ended August 31, 2015, expenses incurred under the agreement are shown in the Statement of Operations as Administrative services fees.
The Trust has entered into a transfer agency and service agreement with Invesco Investment Services, Inc. (“IIS”) pursuant to which the Fund has agreed to pay IIS a fee for providing transfer agency and shareholder services to the Fund and reimburse IIS for certain expenses incurred by IIS in the course of providing such services. IIS may make payments to intermediaries that provide omnibus account services, sub-accounting services and/or networking services. All fees payable by IIS to intermediaries that provide omnibus account services or sub-accounting are charged back to the Fund, subject to certain limitations approved by the Trust’s Board of Trustees. For the year ended August 31, 2015, the expenses incurred under the agreement are shown in the Statement of Operations as Transfer agent fees.
Shares of the Fund are distributed by Invesco Distributors, Inc. (“IDI”), an affiliate of the Adviser. The Fund has adopted a Plan of Distribution (the “Plan”) pursuant to Rule 12b-1 under the 1940 Act. The Plan provides that the Fund will reimburse IDI for distribution related expenses that IDI incurs up to a maximum of the following annual rates: (1) Class A — up to 0.25% of the average daily net assets of Class A shares; (2) Class B — up to 1.00% of the average daily net assets of Class B shares; and (3) Class C — up to 1.00% of the average daily net assets of Class C shares.
In the case of Class B shares, provided that the Plan continues in effect, any cumulative expenses incurred by IDI, but not yet reimbursed to IDI, may be recovered through the payment of future distribution fees from the Fund pursuant to the Plan and contingent deferred sales charges paid by investors upon redemption of Class B shares.
For the year ended August 31, 2015, expenses incurred under these agreements are shown in the Statement of Operations as Distribution fees.
Front-end sales commissions and CDSC (collectively, the “sales charges”) are not recorded as expenses of the Fund. Front-end sales commissions are deducted from proceeds from the sales of Fund shares prior to investment in Class A shares of the Fund. CDSC are deducted from redemption proceeds prior to remittance to the shareholder. During the year ended August 31, 2015, IDI advised the Fund that IDI retained $92,086 in front-end sales commissions from the sale of Class A shares and $820, $2,731 and $15,543 from Class A, Class B and Class C shares, respectively, for CDSC imposed on redemptions by shareholders.
Certain officers and trustees of the Trust are officers and directors of the Adviser, IIS and/or IDI.
NOTE 3—Additional Valuation Information
GAAP defines fair value as the price that would be received to sell an asset or paid to transfer a liability in an orderly transaction between market participants at the measurement date, under current market conditions. GAAP establishes a hierarchy that prioritizes the inputs to valuation methods, giving the highest priority to readily available unadjusted quoted prices in an active market for identical assets (Level 1) and the lowest priority to significant unobservable inputs (Level 3), generally when market prices are not readily available or are unreliable. Based on the valuation inputs, the securities or other investments are tiered into one of three levels. Changes in valuation methods may result in transfers in or out of an investment’s assigned level:
| Level 1 — | Prices are determined using quoted prices in an active market for identical assets. |
| Level 2 — | Prices are determined using other significant observable inputs. Observable inputs are inputs that other market participants may use in pricing a security. These may include quoted prices for similar securities, interest rates, prepayment speeds, credit risk, yield curves, loss severities, default rates, discount rates, volatilities and others. |
| Level 3 — | Prices are determined using significant unobservable inputs. In situations where quoted prices or observable inputs are unavailable (for example, when there is little or no market activity for an investment at the end of the period), unobservable inputs may be used. Unobservable inputs reflect the Fund’s own assumptions about the factors market participants would use in determining fair value of the securities or instruments and would be based on the best available information. |
The following is a summary of the tiered valuation input levels, as of August 31, 2015. The level assigned to the securities valuations may not be an indication of the risk or liquidity associated with investing in those securities. Because of the inherent uncertainties of valuation, the values reflected in the financial statements may materially differ from the value received upon actual sale of those investments.
| Level 1 | Level 2 | Level 3 | Total | |||||||||||||
Equity Securities | $ | 752,908,755 | $ | — | $ | — | $ | 752,908,755 | ||||||||
Futures Contracts* | (598,869 | ) | — | — | (598,869 | ) | ||||||||||
Total Investments | $ | 752,309,886 | $ | — | $ | — | $ | 752,309,886 | ||||||||
| * | Unrealized appreciation (depreciation). |
NOTE 4—Derivative Investments
Value of Derivative Investments at Period-End
The table below summarizes the value of the Fund’s derivative investments, detailed by primary risk exposure, held as of August 31, 2015:
| Value | ||||||||
| Risk Exposure/Derivative Type | Assets | Liabilities | ||||||
Equity risk: | ||||||||
Futures contracts(a) | $ | — | $ | (598,869 | ) | |||
| (a) | Includes cumulative appreciation (depreciation) of futures contracts. Only current day’s variation margin receivable (payable) is reported within the Statement of Assets and Liabilities. |
22 Invesco S&P 500 Index Fund
Effect of Derivative Investments for the year ended August 31, 2015
The table below summarizes the gains (losses) on derivative investments, detailed by primary risk exposure, recognized in earnings during the period:
| Location of Gain (Loss) on Statement of Operations | ||||
| Futures Contracts | ||||
Realized Gain: | ||||
Equity Risk | $ | 1,400,393 | ||
Change in Net Unrealized Appreciation (Depreciation): | ||||
Equity Risk | (787,306 | ) | ||
Total | $ | 613,087 | ||
The table below summarizes the average notional value of futures contracts outstanding during the period.
| Futures Contracts | ||||
Average notional value | $ | 16,770,203 | ||
| Open Futures Contracts — Equity Risk | ||||||||||||||||||||
| Futures Contracts | Type of Contract | Number of Contracts | Expiration Month | Notional Value | Unrealized Appreciation (Depreciation) | |||||||||||||||
E-Mini S&P 500 Index | Long | 121 | September-2015 | $ | 11,913,660 | $ | (598,869 | ) | ||||||||||||
NOTE 5—Investments in Affiliates
The Fund’s Adviser is a subsidiary of Invesco Ltd. and therefore, Invesco Ltd. is considered to be affiliated with the Fund. The following is a summary of the transactions in, and earnings from, investments in Invesco Ltd. for the year ended August 31, 2015.
Value 08/31/14 | Purchases at Cost | Proceeds from Sales | Change in Unrealized Appreciation (Depreciation) | Realized Gain | Value 08/31/15 | Dividend Income | ||||||||||||||||||||||
Invesco Ltd. | $ | 702,489 | $ | 49,885 | $ | (4,185 | ) | $ | (121,801 | ) | $ | 110 | $ | 626,498 | $ | 18,578 | ||||||||||||
NOTE 6—Expense Offset Arrangement(s)
The expense offset arrangement is comprised of transfer agency credits which result from balances in demand deposit accounts used by the transfer agent for clearing shareholder transactions. For the year ended August 31, 2015, the Fund received credits from this arrangement, which resulted in the reduction of the Fund’s total expenses of $824.
NOTE 7—Trustees’ and Officers’ Fees and Benefits
Trustees’ and Officers’ Fees and Benefits include amounts accrued by the Fund to pay remuneration to certain Trustees and Officers of the Fund. Trustees have the option to defer compensation payable by the Fund, and Trustees’ and Officers’ Fees and Benefits also include amounts accrued by the Fund to fund such deferred compensation amounts. Those Trustees who defer compensation have the option to select various Invesco Funds in which their deferral accounts shall be deemed to be invested. Finally, certain current Trustees were eligible to participate in a retirement plan that provided for benefits to be paid upon retirement to Trustees over a period of time based on the number of years of service. The Fund may have certain former Trustees who also participate in a retirement plan and receive benefits under such plan. Trustees’ and Officers’ Fees and Benefits include amounts accrued by the Fund to fund such retirement benefits. Obligations under the deferred compensation and retirement plans represent unsecured claims against the general assets of the Fund.
NOTE 8—Cash Balances
The Fund is permitted to temporarily carry a negative or overdrawn balance in its account with State Street Bank and Trust Company, the custodian bank. Such balances, if any at period end, are shown in the Statement of Assets and Liabilities under the payable caption Amount due custodian. To compensate the custodian bank for such overdrafts, the overdrawn Fund may either (1) leave funds as a compensating balance in the account so the custodian bank can be compensated by earning the additional interest; or (2) compensate by paying the custodian bank at a rate agreed upon by the custodian bank and Invesco, not to exceed the contractually agreed upon rate.
23 Invesco S&P 500 Index Fund
NOTE 9—Distributions to Shareholders and Tax Components of Net Assets
Tax Character of Distributions to Shareholders Paid During the Fiscal Years Ended August 31, 2015 and 2014:
| 2015 | 2014 | |||||||
Ordinary income | $ | 8,014,825 | $ | 8,510,947 | ||||
Tax Components of Net Assets at Period-End:
| 2015 | ||||
Undistributed ordinary income | $ | 7,916,773 | ||
Net unrealized appreciation — investments | 329,020,762 | |||
Temporary book/tax differences | (73,429 | ) | ||
Capital loss carryforward | (37,906,495 | ) | ||
Shares of beneficial interest | 453,738,286 | |||
Total net assets | $ | 752,695,897 | ||
The difference between book-basis and tax-basis unrealized appreciation (depreciation) is due to differences in the timing of recognition of gains and losses on investments for tax and book purposes. The Fund’s net unrealized appreciation difference is attributable primarily to wash sales.
The temporary book/tax differences are a result of timing differences between book and tax recognition of income and/or expenses. The Fund’s temporary book/tax differences are the result of the trustee deferral of compensation and retirement plan benefits.
Capital loss carryforward is calculated and reported as of a specific date. Results of transactions and other activity after that date may affect the amount of capital loss carryforward actually available for the Fund to utilize. Capital losses generated in years beginning after December 22, 2010 can be carried forward for an unlimited period, whereas previous losses expire in eight tax years. Capital losses with an expiration period may not be used to offset capital gains until all net capital losses without an expiration date have been utilized. Capital loss carryforwards with no expiration date will retain their character as either short-term or long-term capital losses instead of as short-term capital losses as under prior law. The ability to utilize capital loss carryforwards in the future may be limited under the Internal Revenue Code and related regulations based on the results of future transactions.
The Fund has a capital loss carryforward as of August 31, 2015, which expires as follows:
| Capital Loss Carryforward* | ||||||||||||
| Expiration | Short-Term | Long-Term | Total | |||||||||
August 31, 2017 | $ | 7,791,415 | $ | — | $ | 7,791,415 | ||||||
August 31, 2018 | 19,847,354 | — | 19,847,354 | |||||||||
August 31, 2019 | 10,267,726 | — | 10,267,726 | |||||||||
| $ | 37,906,495 | $ | — | $ | 37,906,495 | |||||||
| * | Capital loss carryforward as of the date listed above is reduced for limitations, if any, to the extent required by the Internal Revenue Code and may be further limited depending upon a variety of factors, including the realization of net unrealized gains or losses as of the date of any reorganization. |
NOTE 10—Investment Securities
The aggregate amount of investment securities (other than short-term securities, U.S. Treasury obligations and money market funds, if any) purchased and sold by the Fund during the year ended August 31, 2015 was $81,101,344 and $31,194,883, respectively. Cost of investments on a tax basis includes the adjustments for financial reporting purposes as of the most recently completed federal income tax reporting period-end.
| Unrealized Appreciation (Depreciation) of Investment Securities on a Tax Basis | ||||
Aggregate unrealized appreciation of investment securities | $ | 341,490,015 | ||
Aggregate unrealized (depreciation) of investment securities | (12,469,253 | ) | ||
Net unrealized appreciation of investment securities | $ | 329,020,762 | ||
Cost of investments for tax purposes is $423,887,993.
NOTE 11—Reclassification of Permanent Differences
Primarily as a result of differing book/tax treatment of fair fund settlements and return of capital adjustments, on August 31, 2015, undistributed net investment income was increased by $14,395, undistributed net realized gain (loss) was decreased by $5,133 and shares of beneficial interest was decreased by $9,262. This reclassification had no effect on the net assets of the Fund.
24 Invesco S&P 500 Index Fund
NOTE 12—Share Information
| Summary of Share Activity | ||||||||||||||||
| Years ended August 31, | ||||||||||||||||
| 2015(a) | 2014 | |||||||||||||||
| Shares | Amount | Shares | Amount | |||||||||||||
Sold: | ||||||||||||||||
Class A | 4,466,067 | $ | 98,414,922 | 3,235,124 | $ | 64,183,686 | ||||||||||
Class B | 27,111 | 593,239 | 42,427 | 815,218 | ||||||||||||
Class C | 2,802,822 | 60,071,002 | 1,352,961 | 26,035,607 | ||||||||||||
Class Y | 1,679,230 | 37,709,460 | 848,531 | 17,239,541 | ||||||||||||
Issued as reinvestment of dividends: | ||||||||||||||||
Class A | 281,199 | 6,051,415 | 341,048 | 6,486,732 | ||||||||||||
Class B | 1,732 | 36,649 | 3,781 | 70,771 | ||||||||||||
Class C | 32,806 | 685,648 | 39,586 | 732,740 | ||||||||||||
Class Y | 21,191 | 460,483 | 21,684 | 416,553 | ||||||||||||
Automatic conversion of Class B shares to Class A shares: | ||||||||||||||||
Class A | 106,759 | 2,375,610 | 196,646 | 3,877,345 | ||||||||||||
Class B | (108,964 | ) | (2,375,610 | ) | (200,486 | ) | (3,877,345 | ) | ||||||||
Reacquired: | ||||||||||||||||
Class A | (5,598,294 | ) | (124,122,396 | ) | (4,501,173 | ) | (88,786,791 | ) | ||||||||
Class B | (59,315 | ) | (1,292,369 | ) | (99,776 | ) | (1,909,488 | ) | ||||||||
Class C | (798,622 | ) | (17,120,763 | ) | (823,310 | ) | (15,874,918 | ) | ||||||||
Class Y | (616,691 | ) | (13,664,060 | ) | (998,411 | ) | (19,941,699 | ) | ||||||||
Net increase (decrease) in share activity | 2,237,031 | $ | 47,823,230 | (541,368 | ) | $ | (10,532,048 | ) | ||||||||
| (a) | There are entities that are record owners of more than 5% of the outstanding shares of the Fund and own, in the aggregate, 59% of the outstanding shares of the Fund. IDI has an agreement with these entities to sell Fund shares. The Fund, Invesco and/or Invesco affiliates may make payments to these entities, which are considered to be related to the Fund, for providing services to the Fund, Invesco and/or Invesco affiliates including but not limited to services such as, securities brokerage, distribution, third party record keeping and account servicing. The Fund has no knowledge as to whether all or any portion of the shares owned of record by these entities are also owned beneficially. |
25 Invesco S&P 500 Index Fund
NOTE 13—Financial Highlights
The following schedule presents financial highlights for a share of the Fund outstanding throughout the periods indicated.
| Net asset value, beginning of period | Net investment income(a) | Net gains (losses) on securities (both realized and unrealized) | Total from investment operations | Dividends from net investment income | Net asset value, end of period | Total return(b) | Net assets, end of period (000’s omitted) | Ratio of expenses to average net assets with fee waivers and/or expenses absorbed | Ratio of expenses to average net assets without fee waivers and/or expenses absorbed | Ratio of net investment income to average net assets | Portfolio turnover(c) | |||||||||||||||||||||||||||||||||||||
Class A |
| |||||||||||||||||||||||||||||||||||||||||||||||
Year ended 08/31/15 | $ | 21.69 | $ | 0.32 | $ | (0.33 | ) | $ | (0.01 | ) | $ | (0.26 | ) | $ | 21.42 | (0.05 | )% | $ | 534,656 | 0.58 | %(d) | 0.58 | %(d) | 1.44 | %(d) | 4 | % | |||||||||||||||||||||
Year ended 08/31/14 | 17.67 | 0.29 | 4.01 | 4.30 | (0.28 | ) | 21.69 | 24.54 | (e) | 557,688 | 0.59 | (e) | 0.59 | (e) | 1.45 | (e) | 5 | |||||||||||||||||||||||||||||||
Year ended 08/31/13 | 15.26 | 0.27 | 2.43 | 2.70 | (0.29 | ) | 17.67 | 18.04 | 467,234 | 0.62 | 0.62 | 1.64 | 6 | |||||||||||||||||||||||||||||||||||
Year ended 08/31/12 | 13.25 | 0.22 | 2.03 | 2.25 | (0.24 | ) | 15.26 | 17.26 | 410,772 | 0.65 | 0.67 | 1.55 | 3 | |||||||||||||||||||||||||||||||||||
Year ended 08/31/11 | 11.36 | 0.19 | 1.85 | 2.04 | (0.15 | ) | 13.25 | 17.94 | 369,597 | 0.61 | 0.61 | 1.42 | 4 | |||||||||||||||||||||||||||||||||||
Class B | ||||||||||||||||||||||||||||||||||||||||||||||||
Year ended 08/31/15 | 21.24 | 0.15 | (0.33 | ) | (0.18 | ) | (0.12 | ) | 20.94 | (0.85 | ) | 5,117 | 1.33 | (d) | 1.33 | (d) | 0.69 | (d) | 4 | |||||||||||||||||||||||||||||
Year ended 08/31/14 | 17.32 | 0.13 | 3.94 | 4.07 | (0.15 | ) | 21.24 | 23.60 | 8,150 | 1.35 | 1.35 | 0.69 | 5 | |||||||||||||||||||||||||||||||||||
Year ended 08/31/13 | 14.96 | 0.14 | 2.40 | 2.54 | (0.18 | ) | 17.32 | 17.14 | 11,045 | 1.37 | 1.37 | 0.89 | 6 | |||||||||||||||||||||||||||||||||||
Year ended 08/31/12 | 12.92 | 0.11 | 2.01 | 2.12 | (0.08 | ) | 14.96 | 16.47 | 19,912 | 1.40 | 1.42 | 0.80 | 3 | |||||||||||||||||||||||||||||||||||
Year ended 08/31/11 | 11.10 | 0.09 | 1.80 | 1.89 | (0.07 | ) | 12.92 | 17.02 | 37,840 | 1.36 | 1.36 | 0.67 | 4 | |||||||||||||||||||||||||||||||||||
Class C | ||||||||||||||||||||||||||||||||||||||||||||||||
Year ended 08/31/15 | 20.99 | 0.15 | (0.32 | ) | (0.17 | ) | (0.12 | ) | 20.70 | (0.81 | ) | 164,876 | 1.33 | (d) | 1.33 | (d) | 0.69 | (d) | 4 | |||||||||||||||||||||||||||||
Year ended 08/31/14 | 17.12 | 0.13 | 3.89 | 4.02 | (0.15 | ) | 20.99 | 23.59 | 124,452 | 1.35 | 1.35 | 0.69 | 5 | |||||||||||||||||||||||||||||||||||
Year ended 08/31/13 | 14.79 | 0.14 | 2.37 | 2.51 | (0.18 | ) | 17.12 | 17.14 | (f) | 91,761 | 1.36 | (f) | 1.36 | (f) | 0.90 | (f) | 6 | |||||||||||||||||||||||||||||||
Year ended 08/31/12 | 12.79 | 0.11 | 1.99 | 2.10 | (0.10 | ) | 14.79 | 16.50 | 78,797 | 1.40 | 1.42 | 0.80 | 3 | |||||||||||||||||||||||||||||||||||
Year ended 08/31/11 | 10.99 | 0.10 | 1.77 | 1.87 | (0.07 | ) | 12.79 | 17.01 | (f) | 68,753 | 1.27 | (f) | 1.27 | (f) | 0.76 | (f) | 4 | |||||||||||||||||||||||||||||||
Class Y | ||||||||||||||||||||||||||||||||||||||||||||||||
Year ended 08/31/15 | 21.94 | 0.38 | (0.34 | ) | 0.04 | (0.31 | ) | 21.67 | 0.17 | 48,047 | 0.33 | (d) | 0.33 | (d) | 1.69 | (d) | 4 | |||||||||||||||||||||||||||||||
Year ended 08/31/14 | 17.87 | 0.34 | 4.05 | 4.39 | (0.32 | ) | 21.94 | 24.83 | 24,870 | 0.35 | 0.35 | 1.69 | 5 | |||||||||||||||||||||||||||||||||||
Year ended 08/31/13 | 15.43 | 0.32 | 2.45 | 2.77 | (0.33 | ) | 17.87 | 18.33 | 22,546 | 0.37 | 0.37 | 1.89 | 6 | |||||||||||||||||||||||||||||||||||
Year ended 08/31/12 | 13.40 | 0.26 | 2.06 | 2.32 | (0.29 | ) | 15.43 | 17.64 | 14,518 | 0.40 | 0.42 | 1.80 | 3 | |||||||||||||||||||||||||||||||||||
Year ended 08/31/11 | 11.48 | 0.23 | 1.86 | 2.09 | (0.17 | ) | 13.40 | 18.21 | 16,824 | 0.36 | 0.36 | 1.67 | 4 | |||||||||||||||||||||||||||||||||||
| (a) | Calculated using average shares outstanding. |
| (b) | Includes adjustments in accordance with accounting principles generally accepted in the United States of America and as such, the net asset value for financial reporting purposes and the returns based upon those net asset values may differ from the net asset value and returns for shareholder transactions. Does not include sales charges and is not annualized for periods less than one year, if applicable. |
| (c) | Portfolio turnover is calculated at the fund level and is not annualized for periods less than one year, if applicable. |
| (d) | Ratios are based on average daily net assets (000’s omitted) of $567,802, $6,774, $150,676 and $39,733 for Class A, Class B, Class C and Class Y shares, respectively. |
| (e) | The total return, ratio of expenses to average net assets and ratio of net investment income to average net assets reflect actual 12b-1 fees of 0.24% for the year ended August 31, 2014. |
| (f) | The total return, ratio of expenses to average net assets and ratio of net investment income to average net assets reflect actual 12b-1 fees of 0.99% and 0.91% for the years ended August 31, 2013 and 2011, respectively. |
26 Invesco S&P 500 Index Fund
Report of Independent Registered Public Accounting Firm
To the Board of Trustees of AIM Counselor Series Trust (Invesco Counselor Series Trust)
and Shareholders of Invesco S&P 500 Index Fund:
In our opinion, the accompanying statement of assets and liabilities, including the schedule of investments, and the related statements of operations and of changes in net assets and the financial highlights present fairly, in all material respects, the financial position of Invesco S&P 500 Index Fund (one of the funds constituting AIM Counselor Series Trust (Invesco Counselor Series Trust), hereafter referred to as the “Fund”) at August 31, 2015, the results of its operations for the year then ended, the changes in its net assets for each of the two years in the period then ended and the financial highlights for each of the five years in the period then ended, in conformity with accounting principles generally accepted in the United States of America. These financial statements and financial highlights (hereafter referred to as “financial statements”) are the responsibility of the Fund’s management. Our responsibility is to express an opinion on these financial statements based on our audits. We conducted our audits of these financial statements in accordance with the standards of the Public Company Accounting Oversight Board (United States). Those standards require that we plan and perform the audit to obtain reasonable assurance about whether the financial statements are free of material misstatement. An audit includes examining, on a test basis, evidence supporting the amounts and disclosures in the financial statements, assessing the accounting principles used and significant estimates made by management, and evaluating the overall financial statement presentation. We believe that our audits, which included confirmation of securities at August 31, 2015 by correspondence with the custodian and brokers, and the application of alternative auditing procedures where confirmations of security purchases have not been received, provide a reasonable basis for our opinion.
PRICEWATERHOUSECOOPERS LLP
October 27, 2015
Houston, Texas
27 Invesco S&P 500 Index Fund
Calculating your ongoing Fund expenses
Example
As a shareholder of the Fund, you incur two types of costs: (1) transaction costs, which may include sales charges (loads) on purchase payments or contingent deferred sales charges on redemptions, if any; and (2) ongoing costs, including management fees, distribution and/or service (12b-1) fees, and other Fund expenses. This example is intended to help you understand your ongoing costs (in dollars) of investing in the Fund and to compare these costs with ongoing costs of investing in other mutual funds. The example is based on an investment of $1,000 invested at the beginning of the period and held for the entire period March 1, 2015 through August 31, 2015.
Actual expenses
The table below provides information about actual account values and actual expenses. You may use the information in this table, together with the amount you invested, to estimate the expenses that you paid over the period. Simply divide your account value by $1,000 (for example, an $8,600 account value divided by $1,000 = 8.6), then multiply the result by the number in the table under the heading entitled “Actual Expenses Paid During Period” to estimate the expenses you paid on your account during this period.
Hypothetical example for comparison purposes
The table below also provides information about hypothetical account values and hypothetical expenses based on the Fund’s actual expense ratio and an assumed rate of return of 5% per year before expenses, which is not the Fund’s actual return.
The hypothetical account values and expenses may not be used to estimate the actual ending account balance or expenses you paid for the period. You may use this information to compare the ongoing costs of investing in the Fund and other funds. To do so, compare this 5% hypothetical example with the 5% hypothetical examples that appear in the shareholder reports of the other funds.
Please note that the expenses shown in the table are meant to highlight your ongoing costs only and do not reflect any transaction costs, such as sales charges (loads) on purchase payments or contingent deferred sales charges on redemptions, if any. Therefore, the hypothetical information is useful in comparing ongoing costs only, and will not help you determine the relative total costs of owning different funds. In addition, if these transaction costs were included, your costs would have been higher.
| Class | Beginning Account Value (03/01/15) | ACTUAL | HYPOTHETICAL (5% annual return before expenses) | Annualized Expense Ratio | ||||||||||||||||||||
| Ending Account Value (08/31/15)1 | Expenses Paid During Period2 | Ending Account Value (08/31/15) | Expenses Paid During Period2 | |||||||||||||||||||||
| A | $ | 1,000.00 | $ | 944.50 | $ | 2.84 | $ | 1,022.28 | $ | 2.96 | 0.58 | % | ||||||||||||
| B | 1,000.00 | 940.70 | 6.51 | 1,018.50 | 6.77 | 1.33 | ||||||||||||||||||
| C | 1,000.00 | 940.90 | 6.51 | 1,018.50 | 6.77 | 1.33 | ||||||||||||||||||
| Y | 1,000.00 | 945.50 | 1.62 | 1,023.54 | 1.68 | 0.33 | ||||||||||||||||||
| 1 | The actual ending account value is based on the actual total return of the Fund for the period March 1, 2015 through August 31, 2015, after actual expenses and will differ from the hypothetical ending account value which is based on the Fund’s expense ratio and a hypothetical annual return of 5% before expenses. |
| 2 | Expenses are equal to the Fund’s annualized expense ratio as indicated above multiplied by the average account value over the period, multiplied by 184/365 to reflect the most recent fiscal half year. |
28 Invesco S&P 500 Index Fund
Approval of Investment Advisory and Sub-Advisory Contracts
The Board of Trustees (the Board) of AIM Counselor Series Trust (Invesco Counselor Series Trust) is required under the Investment Company Act of 1940, as amended, to approve annually the renewal of Invesco S&P 500 Index Fund’s (the Fund) investment advisory agreements. During contract renewal meetings held on June 9-10, 2015, the Board as a whole, and the disinterested or “independent” Trustees, who comprise over 75% of the Board, voting separately, approved the continuance for the Fund of the Master Investment Advisory Agreement with Invesco Advisers, Inc. (Invesco Advisers and the investment advisory agreement) and the Master Intergroup Sub-Advisory Contract for Mutual Funds with Invesco Asset Management Deutschland GmbH, Invesco Asset Management Limited, Invesco Asset Management (Japan) Limited, Invesco Hong Kong Limited, Invesco Senior Secured Management, Inc. and Invesco Canada Ltd. (collectively, the Affiliated Sub-Advisers and the sub-advisory contracts) for another year, effective July 1, 2015.
In evaluating the fairness and reasonableness of compensation under the Fund’s investment advisory agreement and sub-advisory contracts, the Board considered, among other things, the factors discussed below. The Board determined that continuation of the Fund’s investment advisory agreement and the sub-advisory contracts is in the best interest of the Fund and its shareholders and that the compensation payable to Invesco Advisers and the Affiliated Sub-Advisers under the agreements is fair and reasonable.
The Board’s Fund Evaluation Process
The Board’s Investments Committee has established three Sub-Committees, each of which is primarily responsible for overseeing the performance and investment management services provided by Invesco Advisers and the Affiliated Sub-Advisers to a number of the funds advised by Invesco Advisers (the Invesco Funds). The Sub-Committees meet throughout the year to review the performance of their assigned Invesco Funds, including reviewing materials prepared under the direction of the independent Senior Officer, an officer of the Invesco Funds who reports directly to the independent Trustees. Over the course of each year, the Sub-Committees meet with portfolio managers for their assigned Invesco Funds and other members of management to review the performance, investment objective(s), policies, strategies, limitations and investment risks of these funds. The Board had the benefit of reports from the Sub-Committees and Investments Committee throughout the year in considering approval of the continuance of each Invesco Fund’s investment advisory agreement and sub-advisory contracts for another year.
During the contract renewal process, the Board receives comparative performance and fee data regarding the Invesco Funds prepared by Invesco Advisers and Lipper Inc. (Lipper), an independent provider of investment company data. The Board also receives a report and this independent written evaluation from the Senior Officer. The Senior Officer’s evaluation is prepared as part of his responsibility to manage the process by which the Invesco Funds’ proposed management fees are negotiated during the annual contract renewal process to ensure they are negotiated in a manner that is at arms’ length and reasonable. In addition to meetings with Invesco Advisers and fund counsel, the independent Trustees also discuss the continuance of the investment advisory agreement and sub-advisory contracts in separate sessions with the Senior Officer and with independent legal counsel.
The Trustees recognized that the advisory fee rates for the Invesco Funds are, in many cases, the result of years of review and negotiation. The Trustees’ deliberations and conclusions in a particular year may be based in part on their deliberations and conclusions regarding these arrangements throughout the year and in prior years. The Trustees’ review and conclusions are based on the comprehensive consideration of all information presented to them and are not the result of any single determinative factor. Moreover, one Trustee may have weighed a particular piece of information or factor differently than another Trustee.
The discussion below is a summary of the Senior Officer’s independent written evaluation with respect to the Fund’s investment advisory agreement as well as a discussion of the material factors and related conclusions that formed the basis for the Board’s approval of the Fund’s investment advisory agreement and sub-advisory contracts. Unless otherwise stated, this information is current as of June 10, 2015, and does not reflect consideration of factors that became known to the Board after that date.
Factors and Conclusions and Summary of Independent Written Fee Evaluation
| A. | Nature, Extent and Quality of Services Provided by Invesco Advisers and the Affiliated Sub-Advisers |
The Board reviewed the advisory services provided to the Fund by Invesco Advisers under the Fund’s investment advisory agreement, the performance of Invesco Advisers in providing these services, and the credentials and experience of the officers and employees of Invesco Advisers who provide these services, including the Fund’s portfolio manager or managers. The Board’s review of the qualifications of Invesco Advisers to provide advisory services included the Board’s consideration of Invesco Advisers’ investment
process oversight, independent credit analysis and investment risk management. The Board also considered non-advisory services that Invesco Advisers and its affiliates provide to the Invesco Funds such as various back office support functions, equity and fixed income trading operations, internal audit, distribution, valuation and legal and compliance.
In determining whether to continue the Fund’s investment advisory agreement, the Board considered the benefits of reapproving an existing relationship and the greater uncertainty that may be associated with entering into a new relationship. The Board concluded that the nature, extent and quality of the services provided to the Fund by Invesco Advisers are appropriate and satisfactory and consistent with the terms of the Fund’s investment advisory agreement.
The Board reviewed the services that may be provided by the Affiliated Sub-Advisers under the sub-advisory contracts and the credentials and experience of the officers and employees of the Affiliated Sub-Advisers who provide these services. The Board noted that the Affiliated Sub-Advisers have offices and personnel that are located in financial centers around the world. As a result, the Affiliated Sub-Advisers can provide research and investment analysis on the markets and economies of various countries in which the Fund may invest, make recommendations regarding securities and assist with security trades. The Board concluded that the sub-advisory contracts benefit the Fund and its shareholders by permitting Invesco Advisers to use the resources and talents of the Affiliated Sub-Advisers in managing the Fund. The Board concluded that the nature, extent and quality of the services that may be provided by the Affiliated Sub-Advisers are appropriate and satisfactory and consistent with the terms of the Fund’s sub-advisory contracts.
| B. | Fund Performance |
The Board considered Fund performance as a relevant factor in considering whether to approve the investment advisory agreement. The Board did not view Fund performance as a relevant factor in considering whether to approve the sub-advisory contracts for the Fund, as no Affiliated Sub-Adviser currently manages assets of the Fund.
The Board compared the Fund’s performance during the past one, three and five calendar years to the performance of funds in the Lipper performance universe and against the Lipper S&P 500 Funds Index. The Board noted that performance of Class A shares of the Fund was in the fourth quintile of its performance universe for the one and three year periods and the third quintile for the five year period (the first quintile being the best performing funds and the fifth quintile being the worst performing funds). The Board noted that performance of Class A shares of the Fund was below the
29 Invesco S&P 500 Index Fund
performance of the Index for the one, three and five year periods. The Trustees also reviewed more recent Fund performance and this review did not change their conclusions.
| C. | Advisory and Sub-Advisory Fees |
The Board compared the Fund’s contractual management fee rate to the contractual management fee rates of funds in the Fund’s Lipper expense group at a common asset level. The Board noted that the contractual management fee rate for Class A shares of the Fund was below the median contractual management fee rate of funds in its expense group. The Board noted that the term “contractual management fee” may include both advisory and certain administrative services fees, but that Lipper does not provide information on a fund by fund basis as to what is included. The Board noted that Invesco Advisers does not charge the Invesco Funds for the administrative services included in the term as defined by Lipper. The Board also reviewed the methodology used by Lipper in providing expense group information, which includes using each fund’s contractual management fee schedule (including any applicable breakpoints) as reported in the most recent prospectus or statement of additional information for each fund in the expense group.
The Board also compared the Fund’s effective advisory fee rate (the advisory fee rate after advisory fee waivers and before other expense limitations/waivers) to the effective advisory fee rates of other mutual funds advised by Invesco Advisers and its affiliates with investment strategies comparable to those of the Fund. The Board noted that the Fund’s rate was the same as the rate of one such mutual fund.
The Board noted that Invesco Advisers and the Affiliated Sub-Advisers do not manage other client accounts with investment strategies comparable to those of the Fund.
The Board also considered the services that may be provided by the Affiliated Sub-Advisers pursuant to the sub-advisory contracts, as well as the fees payable by Invesco Advisers to the Affiliated Sub-Advisers pursuant to the sub-advisory contracts. The Board also noted that the sub-advisory fees are not paid directly by the Fund, but rather, are payable by Invesco Advisers to the Affiliated Sub-Advisers.
| D. | Economies of Scale and Breakpoints |
The Board considered the extent to which there are economies of scale in the provision of advisory services to the Fund. The Board also considered whether the Fund benefits from economies of scale through contractual breakpoints in the Fund’s advisory fee schedule. The Board also noted that the Fund shares directly in economies of scale through lower fees charged by third party service providers based on the combined size of the Invesco Funds and other clients advised by Invesco Advisers.
| E. | Profitability and Financial Resources |
The Board reviewed information from Invesco Advisers concerning the costs of the advisory and other services that Invesco Advisers and its
affiliates provide to the Fund and the Invesco Funds and the profitability of Invesco Advisers and its affiliates in providing these services. The Board received information from Invesco Advisers about the methodology used to prepare the profitability information. The Board noted that Invesco Advisers continues to operate at a net profit from services Invesco Advisers and its affiliates provide to the Invesco Funds. The Board noted that although Invesco Advisers received a minimal amount of revenues from advising the Fund, Invesco Advisers and its subsidiaries did not make a profit from managing the Fund. The Board received and accepted information from Invesco Advisers demonstrating that Invesco Advisers and each Affiliated Sub-Adviser are financially sound and have the resources necessary to perform their obligations under the investment advisory agreement and sub-advisory contracts.
| F. | Collateral Benefits to Invesco Advisers and its Affiliates |
The Board considered various other benefits received by Invesco Advisers and its affiliates from the relationship with the Fund, including the fees received for providing transfer agency and distribution services to the Fund. The Board considered comparative information regarding fees charged for these services, including information provided by Lipper and other independent sources. The Board considered the performance of Invesco Advisers and its affiliates in providing these services and the organizational structure employed to provide these services. The Board also considered that these services are provided to the Fund pursuant to written contracts that are reviewed and approved on an annual basis by the Board; and that the services are required for the operation of the Fund.
The Board considered the benefits realized by Invesco Advisers and the Affiliated Sub-Advisers as a result of portfolio brokerage transactions executed through “soft dollar” arrangements. The Board noted that soft dollar arrangements shift the payment obligation for research services from Invesco Advisers and the Affiliated Sub-Advisers to the Invesco Funds and that the research received may be used with other clients of Invesco Advisers and may reduce Invesco Advisers’ and the Affiliated Sub-Advisers’ expenses. The Board also considered that it receives periodic reports from the Chief Compliance Officer of the Invesco Funds demonstrating that these arrangements are consistent with regulatory requirements. The Board did not deem the soft dollar arrangements to be inappropriate.
The Board considered that the Fund’s uninvested cash and cash collateral from any securities lending arrangements may be invested in money market funds advised by Invesco Advisers pursuant to procedures approved by the Board. The Board noted that Invesco Advisers receives advisory fees from these affiliated money market funds attributable to such investments, although Invesco Advisers has contractually agreed to
waive through varying periods the advisory fees payable by the Invesco Funds with respect to investments in the affiliated money market funds. The waiver is in an amount equal to 100% of the net advisory fee Invesco Advisers receives from the affiliated money market funds with respect to the Fund’s investment in the affiliated money market funds of uninvested cash, but not cash collateral. The Board concluded that the amount of advisory fees received by Invesco Advisors from the Fund’s investment of cash collateral from any securities lending arrangements in the affiliated money market funds is fair and reasonable.
The Board also considered the Fund may use an affiliated broker to execute certain trades for the Fund to, among other things, control information leakage, and were advised that such trades would be executed in compliance with rules under the Investment Company Act of 1940, as amended, and consistent with best execution obligations.
30 Invesco S&P 500 Index Fund
Tax Information
Form 1099-DIV, Form 1042-S and other year–end tax information provide shareholders with actual calendar year amounts that should be included in their tax returns. Shareholders should consult their tax advisors.
The following distribution information is being provided as required by the Internal Revenue Code or to meet a specific state’s requirement.
The Fund designates the following amounts or, if subsequently determined to be different, the maximum amount allowable for its fiscal year ended August 31, 2015:
Federal and State Income Tax | ||||
Qualified Dividend Income* | 100 | % | ||
Corporate Dividends Received Deduction* | 100 | % | ||
U.S. Treasury Obligations* | 0 | % | ||
| * | The above percentages are based on ordinary income dividends paid to shareholders during the Fund’s fiscal year. |
31 Invesco S&P 500 Index Fund
Trustees and Officers
The address of each trustee and officer is AIM Counselor Series Trust (Invesco Counselor Series Trust) (the “Trust”), 11 Greenway Plaza, Suite 1000, Houston, Texas 77046-1173. The trustees serve for the life of the Trust, subject to their earlier death, incapacitation, resignation, retirement or removal as more specifically provided in the Trust’s organizational documents. Each officer serves for a one year term or until their successors are elected and qualified. Column two below includes length of time served with predecessor entities, if any.
| Name, Year of Birth and Position(s) Held with the Trust | Trustee and/ or Officer Since | Principal Occupation(s) During Past 5 Years | Number of Funds in Fund Complex Overseen by Trustee | Other Directorship(s) Held by Trustee During Past 5 Years | ||||
| Interested Persons | ||||||||
| Martin L. Flanagan1 — 1960 Trustee | 2007 | Executive Director, Chief Executive Officer and President, Invesco Ltd. (ultimate parent of Invesco and a global investment management firm); Advisor to the Board, Invesco Advisers, Inc. (formerly known as Invesco Institutional (N.A.), Inc.); Trustee, The Invesco Funds; Vice Chair, Investment Company Institute; and Member of Executive Board, SMU Cox School of Business
Formerly: Chairman and Chief Executive Officer, Invesco Advisers, Inc. (registered investment adviser); Director, Chairman, Chief Executive Officer and President, IVZ Inc. (holding company), INVESCO Group Services, Inc. (service provider) and Invesco North American Holdings, Inc. (holding company); Director, Chief Executive Officer and President, Invesco Holding Company Limited (parent of Invesco and a global investment management firm); Director, Invesco Ltd.; Chairman, Investment Company Institute and President, Co-Chief Executive Officer, Co-President, Chief Operating Officer and Chief Financial Officer, Franklin Resources, Inc. (global investment management organization). | 144 | None | ||||
| Philip A. Taylor2 — 1954 Trustee, President and Principal Executive Officer | 2006 | Head of North American Retail and Senior Managing Director, Invesco Ltd.; Director, Co-Chairman, Co-President and Co-Chief Executive Officer, Invesco Advisers, Inc. (formerly known as Invesco Institutional (N.A.), Inc.) (registered investment adviser); Director, Chairman, Chief Executive Officer and President, Invesco Management Group, Inc. (formerly known as Invesco Aim Management Group, Inc.) (financial services holding company); Director and President, INVESCO Funds Group, Inc. (registered investment adviser and registered transfer agent); Director and Chairman, Invesco Investment Services, Inc. (formerly known as Invesco Aim Investment Services, Inc.) (registered transfer agent) and IVZ Distributors, Inc. (formerly known as INVESCO Distributors, Inc.) (registered broker dealer); Director, President and Chairman, Invesco Inc. (holding company), Invesco Canada Holdings Inc. (holding company), Trimark Investments Ltd./Placements Trimark Ltèe and Invesco Financial Services Ltd/Services Financiers Invesco Ltèe; Chief Executive Officer, Invesco Corporate Class Inc. (corporate mutual fund company) Director, Chairman and Chief Executive Officer, Invesco Canada Ltd. (formerly known as Invesco Trimark Ltd./Invesco Trimark Ltèe) (registered investment adviser and registered transfer agent); Trustee, President and Principal Executive Officer, The Invesco Funds (other than AIM Treasurer’s Series Trust (Invesco Treasurer’s Series Trust), Short-Term Investments Trust and Invesco Management Trust); Trustee and Executive Vice President, The Invesco Funds (AIM Treasurer’s Series Trust (Invesco Treasurer’s Series Trust), Short-Term Investments Trust and Invesco Management Trust only); Director, Invesco Investment Advisers LLC (formerly known as Van Kampen Asset Management); Director, Chief Executive Officer and President, Van Kampen Exchange Corp.
Formerly: Chief Executive Officer, Invesco Canada Fund Inc (corporate mutual fund company); Director and Chairman, Van Kampen Investor Services Inc.; Director, Chief Executive Officer and President, 1371 Preferred Inc. (holding company) and Van Kampen Investments Inc.; Director and President, AIM GP Canada Inc. (general partner for limited partnerships) and Van Kampen Advisors, Inc.; Director and Chief Executive Officer, Invesco Trimark Dealer Inc. (registered broker dealer); Director, Invesco Distributors, Inc. (formerly known as Invesco Aim Distributors, Inc.) (registered broker dealer); Manager, Invesco PowerShares Capital Management LLC; Director, Chief Executive Officer and President, Invesco Advisers, Inc.; Director, Chairman, Chief Executive Officer and President, Invesco Aim Capital Management, Inc.; President, Invesco Trimark Dealer Inc. and Invesco Trimark Ltd./Invesco Trimark Ltèe; Director and President, AIM Trimark Corporate Class Inc. and AIM Trimark Canada Fund Inc.; Senior Managing Director, Invesco Holding Company Limited; Director and Chairman, Fund Management Company (former registered broker dealer); President and Principal Executive Officer, The Invesco Funds (AIM Treasurer’s Series Trust (Invesco Treasurer’s Series Trust), and Short-Term Investments Trust only); President, AIM Trimark Global Fund Inc. and AIM Trimark Canada Fund Inc.. | 144 | None |
| 1 | Mr. Flanagan is considered an interested person (within the meaning of Section 2(a)(19) of the 1940 Act) of the Trust because he is an officer of the Adviser to the Trust, and an officer and a director of Invesco Ltd., ultimate parent of the Adviser. |
| 2 | Mr. Taylor is considered an interested person (within the meaning of Section 2(a)(19) of the 1940 Act) of the Trust because he is an officer and a director of the Adviser. |
T-1 Invesco S&P 500 Index Fund
Trustees and Officers—(continued)
| Name, Year of Birth and Position(s) Held with the Trust | Trustee and/ or Officer Since | Principal Occupation(s) During Past 5 Years | Number of Funds in Fund Complex Overseen by Trustee | Other Directorship(s) Held by Trustee During Past 5 Years | ||||
| Independent Trustees | ||||||||
Bruce L. Crockett — 1944 Trustee and Chair | 2003 | Chairman, Crockett Technologies Associates (technology consulting company)
Formerly: Director, Captaris (unified messaging provider); Director, President and Chief Executive Officer, COMSAT Corporation; Chairman, Board of Governors of INTELSAT (international communications company); ACE Limited (insurance company); Independent Directors Council and Investment Company Institute | 144 | ALPS (Attorneys Liability Protection Society) (insurance company) and Globe Specialty Metals, Inc. (metallurgical company) | ||||
David C. Arch — 1945 Trustee | 2010 | Chairman of Blistex Inc., a consumer health care products manufacturer | 144 | Board member of the Illinois Manufacturers’ Association; Member of the Board of Visitors, Institute for the Humanities, University of Michigan; Member of the Audit Committee of the Edward-Elmhurst Hospital | ||||
James T. Bunch — 1942 Trustee | 2000 | Managing Member, Grumman Hill Group LLC (family office/private equity investments)
Formerly: Founder, Green Manning & Bunch Ltd. (investment banking firm) (1988-2010); Executive Committee, United States Golf Association; and Chairman, Board of Governors, Western Golf Association | 144 | Chairman of the Board of Trustees, Evans Scholars Foundation; and Chairman of the Board, Denver Film Society | ||||
Rodney F. Dammeyer — 1940 Trustee | 2010 | Chairman of CAC, LLC, (private company offering capital investment and management advisory services)
Formerly: Prior to 2001, Managing Partner at Equity Group Corporate Investments; Prior to 1995, Chief Executive Officer of Itel Corporation (formerly Anixter International); Prior to 1985, experience includes Senior Vice President and Chief Financial Officer of Household International, Inc., Executive Vice President and Chief Financial Officer of Northwest Industries, Inc. and Partner of Arthur Andersen & Co.; From 1987 to 2010, Director/Trustee of investment companies in the Van Kampen Funds complex | 144 | Director of Quidel Corporation and Stericycle, Inc. | ||||
Albert R. Dowden — 1941 Trustee | 2003 | Director of a number of public and private business corporations, including the Boss Group, Ltd. (private investment and management); Nature’s Sunshine Products, Inc. and Reich & Tang Funds (5 portfolios) (registered investment company)
Formerly: Director, Homeowners of America Holding Corporation/Homeowners of America Insurance Company (property casualty company); Director, Continental Energy Services, LLC (oil and gas pipeline service); Director, CompuDyne Corporation (provider of product and services to the public security market) and Director, Annuity and Life Re (Holdings), Ltd. (reinsurance company); Director, President and Chief Executive Officer, Volvo Group North America, Inc.; Senior Vice President, AB Volvo; Director of various public and private corporations; Chairman, DHJ Media, Inc.; Director, Magellan Insurance Company; and Director, The Hertz Corporation, Genmar Corporation (boat manufacturer), National Media Corporation; Advisory Board of Rotary Power International (designer, manufacturer, and seller of rotary power engines); and Chairman, Cortland Trust, Inc. (registered investment company) | 144 | Director of: Nature’s Sunshine Products, Inc., Reich & Tang Funds, Homeowners of America Holding Corporation/ Homeowners of America Insurance Company, the Boss Group | ||||
Jack M. Fields — 1952 Trustee | 2003 | Chief Executive Officer, Twenty First Century Group, Inc. (government affairs company); Owner and Chief Executive Officer, Dos Angeles Ranch, L.P. (cattle, hunting, corporate entertainment); and Discovery Global Education Fund (non-profit)
Formerly: Chief Executive Officer, Texana Timber LP (sustainable forestry company); Director of Cross Timbers Quail Research Ranch (non-profit); and member of the U.S. House of Representatives | 144 | Insperity, Inc. (formerly known as Administaff) | ||||
Prema Mathai-Davis — 1950 Trustee | 2003 | Retired. Formerly: Chief Executive Officer, YWCA of the U.S.A. | 144 | None | ||||
Larry Soll — 1942 Trustee | 1997 | Retired. Formerly: Chairman, Chief Executive Officer and President, Synergen Corp. (a biotechnology company) | 144 | None | ||||
Hugo F. Sonnenschein — 1940 Trustee | 2010 | President Emeritus and Honorary Trustee of the University of Chicago and the Adam Smith Distinguished Service Professor in the Department of Economics at the University of Chicago. Prior to 2000, President of the University of Chicago | 144 | Trustee of the University of Rochester and a member of its investment committee; Member of the National Academy of Sciences and the American Philosophical Society; Fellow of the American Academy of Arts and Sciences | ||||
| Raymond Stickel, Jr. — 1944 Trustee | 2005 | Retired. Formerly: Director, Mainstay VP Series Funds, Inc. (25 portfolios) and Partner, Deloitte & Touche | 144 | None |
T-2 Invesco S&P 500 Index Fund
Trustees and Officers—(continued)
| Name, Year of Birth and Position(s) Held with the Trust | Trustee and/ or Officer Since | Principal Occupation(s) During Past 5 Years | Number of Funds in Fund Complex Overseen by Trustee | Other Directorship(s) Held by Trustee During Past 5 Years | ||||
| Independent Trustees—(continued) | ||||||||
Suzanne H. Woolsey — 1941 Trustee | 2014 | Chief Executive Officer of Woolsey Partners LLC | 144 | Emeritus Chair of the Board of Trustees of the Institute for Defense Analyses; Trustee of Colorado College; Trustee of California Institute of Technology; Prior to 2014, Director of Fluor Corp.; Prior to 2010, Trustee of the German Marshall Fund of the United States; Prior to 2010 Trustee of the Rocky Mountain Institute | ||||
| Other Officers | ||||||||
Russell C. Burk — 1958 Senior Vice President and Senior Officer | 2005 | Senior Vice President and Senior Officer, The Invesco Funds | N/A | N/A | ||||
John M. Zerr — 1962 Senior Vice President, Chief Legal Officer and Secretary | 2006 | Director, Senior Vice President, Secretary and General Counsel, Invesco Management Group, Inc. (formerly known as Invesco Aim Management Group, Inc.) and Van Kampen Exchange Corp.; Senior Vice President, Invesco Advisers, Inc. (formerly known as Invesco Institutional (N.A.), Inc.) (registered investment adviser); Senior Vice President and Secretary, Invesco Distributors, Inc. (formerly known as Invesco Aim Distributors, Inc.); Director, Vice President and Secretary, Invesco Investment Services, Inc. (formerly known as Invesco Aim Investment Services, Inc.) and IVZ Distributors, Inc. (formerly known as INVESCO Distributors, Inc.); Director and Vice President, INVESCO Funds Group, Inc.; Senior Vice President, Chief Legal Officer and Secretary, The Invesco Funds; Managing Director, Invesco PowerShares Capital Management LLC; Director, Secretary and General Counsel, Invesco Investment Advisers LLC (formerly known as Van Kampen Asset Management); Secretary and General Counsel, Invesco Capital Markets, Inc. (formerly known as Van Kampen Funds Inc.) and Chief Legal Officer, PowerShares Exchange-Traded Fund Trust, PowerShares Exchange-Traded Fund Trust II, PowerShares India Exchange-Traded Fund Trust, PowerShares Actively Managed Exchange-Traded Fund Trust, and PowerShares Actively Managed Exchange-Traded Commodity Fund Trust
Formerly: Director and Vice President, Van Kampen Advisors Inc.; Director, Vice President, Secretary and General Counsel, Van Kampen Investor Services Inc.; Director, Invesco Distributors, Inc. (formerly known as Invesco Aim Distributors, Inc.); Director, Senior Vice President, General Counsel and Secretary, Invesco Aim Advisers, Inc. and Van Kampen Investments Inc.; Director, Vice President and Secretary, Fund Management Company; Director, Senior Vice President, Secretary, General Counsel and Vice President, Invesco Aim Capital Management, Inc.; Chief Operating Officer and General Counsel, Liberty Ridge Capital, Inc. (an investment adviser); Vice President and Secretary, PBHG Funds (an investment company) and PBHG Insurance Series Fund (an investment company); Chief Operating Officer, General Counsel and Secretary, Old Mutual Investment Partners (a broker-dealer); General Counsel and Secretary, Old Mutual Fund Services (an administrator) and Old Mutual Shareholder Services (a shareholder servicing center); Executive Vice President, General Counsel and Secretary, Old Mutual Capital, Inc. (an investment adviser); and Vice President and Secretary, Old Mutual Advisors Funds (an investment company) | N/A | N/A | ||||
| Sheri Morris — 1964 Vice President, Treasurer and Principal Financial Officer | 2003 | Vice President, Treasurer and Principal Financial Officer, The Invesco Funds; Vice President, Invesco Advisers, Inc. (formerly known as Invesco Institutional (N.A.), Inc.) (registered investment adviser); and Vice President, PowerShares Exchange-Traded Fund Trust, PowerShares Exchange-Traded Fund Trust II, PowerShares India Exchange-Traded Fund Trust, PowerShares Actively Managed Exchange-Traded Fund Trust, and PowerShares Actively Managed Exchange-Traded Commodity Fund Trust
Formerly: Vice President, Invesco Aim Advisers, Inc., Invesco Aim Capital Management, Inc. and Invesco Aim Private Asset Management, Inc.; Assistant Vice President and Assistant Treasurer, The Invesco Funds and Assistant Vice President, Invesco Advisers, Inc., Invesco Aim Capital Management, Inc. and Invesco Aim Private Asset Management, Inc.; and Treasurer, PowerShares Exchange-Traded Fund Trust, PowerShares Exchange-Traded Fund Trust II, PowerShares India Exchange-Traded Fund Trust and PowerShares Actively Managed Exchange-Traded Fund Trust | N/A | N/A | ||||
T-3 Invesco S&P 500 Index Fund
Trustees and Officers—(continued)
| Name, Year of Birth and Position(s) Held with the Trust | Trustee and/ or Officer Since | Principal Occupation(s) During Past 5 Years | Number of Funds in Fund Complex Overseen by Trustee | Other Directorship(s) Held by Trustee During Past 5 Years | ||||
| Other Officers—(continued) | ||||||||
| Karen Dunn Kelley — 1960 Vice President | 2003 | Senior Managing Director, Investments, Invesco Ltd.; Director, Co-President, Co-Chief Executive Officer, and Co-Chairman, Invesco Advisers, Inc. (formerly known as Invesco Institutional (N.A.), Inc.) (registered investment adviser); Chairman, Invesco Senior Secured Management, Inc.; Senior Vice President, Invesco Management Group, Inc. (formerly known as Invesco Aim Management Group, Inc.); Executive Vice President, Invesco Distributors, Inc. (formerly known as Invesco Aim Distributors, Inc.); Director, Invesco Mortgage Capital Inc. and Invesco Management Company Limited; Vice President, The Invesco Funds (other than AIM Treasurer’s Series Trust (Invesco Treasurer’s Series Trust), Short-Term Investments Trust and Invesco Management Trust); and President and Principal Executive Officer, The Invesco Funds (AIM Treasurer’s Series Trust (Invesco Treasurer’s Series Trust), Short-Term Investments Trust and Invesco Management Trust only)
Formerly: Director and President, INVESCO Asset Management (Bermuda) Ltd., Director, INVESCO Global Asset Management Limited and INVESCO Management S.A.; Senior Vice President, Van Kampen Investments Inc. and Invesco Advisers, Inc. (formerly known as Invesco Institutional (N.A.), Inc.) (registered investment adviser); Vice President, Invesco Advisers, Inc. (formerly known as Invesco Institutional (N.A.), Inc.); Director of Cash Management and Senior Vice President, Invesco Advisers, Inc. and Invesco Aim Capital Management, Inc.; Director and President, Fund Management Company; Chief Cash Management Officer, Director of Cash Management, Senior Vice President, and Managing Director, Invesco Aim Capital Management, Inc.; Director of Cash Management, Senior Vice President, and Vice President, Invesco Advisers, Inc. and The Invesco Funds (AIM Treasurer’s Series Trust (Invesco Treasurer’s Series Trust), and Short-Term Investments Trust only) | N/A | N/A | ||||
| Crissie M. Wisdom — 1969 Anti-Money Laundering Compliance Officer | 2013 | Anti-Money Laundering Compliance Officer, Invesco Advisers, Inc. (formerly known as Invesco Institutional (N.A.), Inc.) (registered investment adviser), Invesco Capital Markets, Inc. (formerly known as Van Kampen Funds Inc.), Invesco Distributors, Inc., Invesco Investment Services, Inc., Invesco Management Group, Inc., Van Kampen Exchange Corp., The Invesco Funds, and PowerShares Exchange-Traded Fund Trust, PowerShares Exchange-Traded Fund Trust II, PowerShares India Exchange-Traded Fund Trust, PowerShares Actively Managed Exchange-Traded Fund Trust and PowerShares Actively Managed Exchange-Traded Commodity Fund Trust; Anti-Money Laundering Compliance Officer and Bank Secrecy Act Officer, INVESCO National Trust Company and Invesco Trust Company; and Fraud Prevention Manager and Controls and Risk Analysis Manager for Invesco Investment Services, Inc.. | N/A | N/A | ||||
Lisa O. Brinkley — 1959 Chief Compliance Officer | 2004 | Senior Vice President and Chief Compliance Officer, Invesco Advisers, Inc. (registered investment adviser) (formerly known as Invesco Institutional (N.A., Inc.); and Chief Compliance Officer, The Invesco Funds
Formerly: Global Assurance Officer, Invesco Ltd. and Vice President, The Invesco Funds; Chief Compliance Officer, Invesco Distributors, Inc. (formerly known as Invesco Aim Distributors, Inc.), Invesco Investment Services, Inc.(formerly known as Invesco Aim Investment Services, Inc.) and Van Kampen Investor Services Inc.; Senior Vice President, Invesco Management Group, Inc.; Senior Vice President and Chief Compliance Officer, Invesco Advisers, Inc. and The Invesco Funds; Vice President and Chief Compliance Officer, Invesco Aim Capital Management, Inc. and Invesco Distributors, Inc.; Vice President, Invesco Investment Services, Inc. and Fund Management Company. | N/A | N/A |
The Statement of Additional Information of the Trust includes additional information about the Fund’s Trustees and is available upon request, without charge, by calling 1.800.959.4246. Please refer to the Fund’s prospectus for information on the Fund’s sub-advisers.
Office of the Fund 11 Greenway Plaza, Suite 1000 Houston, TX 77046-1173 | Investment Adviser Invesco Advisers, Inc. 1555 Peachtree Street, N.E. Atlanta, GA 30309 | Distributor Invesco Distributors, Inc. 11 Greenway Plaza, Suite 1000 Houston, TX 77046-1173 | Auditors PricewaterhouseCoopers LLP 1000 Louisiana Street, Suite 5800 Houston, TX 77002-5678 | |||
Counsel to the Fund Stradley Ronon Stevens & Young, LLP 2005 Market Street, Suite 2600 Philadelphia, PA 19103-7018 | Counsel to the Independent Trustees Goodwin Procter LLP 901 New York Avenue, N.W. Washington, D.C. 20001 | Transfer Agent Invesco Investment Services, Inc. 11 Greenway Plaza, Suite 1000 Houston, TX 77046-1173 | Custodian State Street Bank and Trust Company 225 Franklin Street Boston, MA 02110-2801 | |||
T-4 Invesco S&P 500 Index Fund

Invesco mailing information
Send general correspondence to Invesco Investment Services, Inc., P.O. Box 219078, Kansas City, MO 64121-9078.
Important notice regarding delivery of security holder documents
To reduce Fund expenses, only one copy of most shareholder documents may be mailed to shareholders with multiple accounts at the same address (Householding). Mailing of your shareholder documents may be householded indefinitely unless you instruct us otherwise. If you do not want the mailing of these documents to be combined with those for other members of your household, please contact Invesco Investment Services, Inc. at 800 959 4246 or contact your financial institution. We will begin sending you individual copies for each account within 30 days after receiving your request.
Fund holdings and proxy voting information
The Fund provides a complete list of its holdings four times in each fiscal year, at the quarter ends. For the second and fourth quarters, the lists appear in the Fund’s semiannual and annual reports to shareholders. For the first and third quarters, the Fund files the lists with the Securities and Exchange Commission (SEC) on Form N-Q. The most recent list of portfolio holdings is available at invesco.com/completeqtrholdings. Shareholders can also look up the Fund’s Forms N-Q on the SEC website at sec.gov. Copies of the Fund’s Forms N-Q may be reviewed and copied at the SEC Public Reference Room in Washington, D.C. You can obtain information on the operation of the Public Reference Room, including information about duplicating fee charges, by calling 202 551 8090 or 800 732 0330, or by electronic request at the following email address: publicinfo@sec.gov.
The SEC file numbers for the Fund are shown below.
A description of the policies and procedures that the Fund uses to determine how to vote proxies relating to portfolio securities is available without charge, upon request, from our Client Services department at 800 959 4246 or at invesco.com/proxyguidelines. The information is also available on the SEC website, sec.gov.
Information regarding how the Fund voted proxies related to its portfolio securities during the most recent 12-month period ended June 30 is available at invesco.com/proxysearch. The information is also available on the SEC website, sec.gov. Invesco Advisers, Inc. is an investment adviser; it provides investment advisory services to individual and institutional clients and does not sell securities. Invesco Distributors, Inc. is the US distributor for Invesco Ltd.’s retail mutual funds, exchange-traded funds and institutional money market funds. Both are wholly owned, indirect subsidiaries of Invesco Ltd. |  |
SEC file numbers: 811-09913 and 333-36074 MS-SPI-AR-1 Invesco Distributors, Inc.
|
| |||
Annual Report to Shareholders
| August 31, 2015 | |||
Invesco Small Cap Discovery Fund | ||||
Nasdaq: A: VASCX ¡ B: VBSCX ¡ C: VCSCX ¡ Y: VISCX ¡ R5: VESCX ¡ R6: VFSCX | ||||


Letters to Shareholders
Philip Taylor | Dear Shareholders: This annual report includes information about your Fund, including performance data and a complete list of its investments as of the close of the reporting period. Inside is a discussion of how your Fund was managed and the factors that affected its performance during the reporting period. I hope you find this report of interest. The US economy expanded and unemployment declined throughout the reporting period. The sharp drop in oil prices that began in mid-2014 continued to benefit consumers, but a strong US dollar crimped corporate profits. The US Federal Reserve signaled that it was increasingly likely to raise interest rates, based on generally positive economic data, but uncertainty remained about when it would act. Overseas, the story was much different. Low energy prices hurt the economies of some oil-producing nations, such as Brazil and Russia. During the reporting period, the European Central Bank as well as central banks in China and Japan – among other countries – either instituted or maintained extraordinarily accommodative monetary policies in response to economic weakness. |

Investor uncertainty, such as we saw for much of the reporting period – and market volatility, such as we saw at the end of the reporting period – are unfortunate facts of life when it comes to investing. Some investors use these things as excuses to delay saving and investing for their long-term financial goals. That’s why Invesco encourages investors to work with a professional financial adviser who can stress the importance of starting to save and invest early and the importance of adhering to a disciplined investment plan – when times are good and when they’re uncertain. A financial adviser who knows your unique financial situation, investment goals and risk tolerance can be an invaluable partner as you seek to achieve your financial goals. He or she can offer a long-term perspective when markets are volatile and time-tested advice and guidance when your financial situation or investment goals change.
Timely information when and where you want it
Invesco’s efforts to help investors achieve their financial objectives include providing individual investors and financial professionals with timely information about the markets, the economy and investing – whenever and wherever they want it.
Our website, invesco.com/us, offers a wide range of market insights and investment perspectives. On the website, you’ll find detailed information about our funds, including prices, performance, holdings and portfolio manager commentaries. You can access information about your account by completing a simple, secure online registration. Click on the “Need to register” link in the “Account Access” box on our homepage to get started.
Invesco’s mobile apps for iPhone® and iPad® (both available free from the App StoreSM) allow you to obtain the same detailed information, monitor your account and create customizable watch lists. Also, they allow you to access investment insights from our investment leaders, market strategists, economists and retirement experts. You can sign up to be alerted when new commentary is added, and you can watch portfolio manager videos and have instant access to Invesco news and updates wherever you may be.
In addition to the resources accessible on our website and through our mobile app, you can obtain timely updates to help you stay informed about the markets, the economy and investing by connecting with Invesco on Twitter, LinkedIn or Facebook. You can access our blog at blog.invesco.us.com. Our goal is to provide you the information you want, when and where you want it.
Have questions?
For questions about your account, feel free to contact an Invesco client services representative at 800 959 4246. For Invesco-related questions or comments, please email me directly at phil@invesco.com.
All of us at Invesco look forward to serving your investment management needs for many years to come. Thank you for investing with us.
Sincerely,

Philip Taylor
Senior Managing Director, Invesco Ltd.
iPhone and iPad are trademarks of Apple Inc., registered in the US and other countries. App Store is a service mark of Apple Inc. Invesco Distributors, Inc. is not affiliated with Apple Inc.
2 Invesco Small Cap Discovery Fund
Bruce Crockett | Dear Fellow Shareholders: Among the many important lessons I’ve learned in more than 40 years in a variety of business endeavors is the value of a trusted advocate. As independent chair of the Invesco Funds Board, I can assure you that the members of the Board are strong advocates for the interests of investors in Invesco’s mutual funds. We work hard to represent your interests through oversight of the quality of the investment management services your funds receive and other matters important to your investment, including but not limited to: n Ensuring that Invesco offers a diverse lineup of mutual funds that your financial adviser can use to strive to meet your financial needs as your investment goals change over time. n Monitoring how the portfolio management teams of the Invesco funds are performing in light of changing economic and market conditions. | |

| n | Assessing each portfolio management team’s investment performance within the context of the investment strategy described in the fund’s prospectus. |
| n | Monitoring for potential conflicts of interests that may impact the nature of the services that your funds receive. |
We believe one of the most important services we provide our fund shareholders is the annual review of the funds’ advisory and sub-advisory contracts with Invesco Advisers and its affiliates. This review is required by the Investment Company Act of 1940 and focuses on the nature and quality of the services Invesco provides as the adviser to the Invesco funds and the reasonableness of the fees that it charges for those services. Each year, we spend months carefully reviewing information received from Invesco and a variety of independent sources, such as performance and fee data prepared by Lipper Inc., an independent, third-party firm widely recognized as a leader in its field. We also meet with our independent legal counsel and other independent advisers to review and help us assess the information that we have received. Our goal is to assure that you receive quality investment management services for a reasonable fee.
I trust the measures outlined above provide assurance that you have a worthy advocate when it comes to choosing the Invesco Funds.
As always, please contact me at bruce@brucecrockett.com with any questions or concerns you may have. On behalf of the Board, we look forward to continuing to represent your interests and serving your needs.
Sincerely,

Bruce L. Crockett
Independent Chair
Invesco Funds Board of Trustees
3 Invesco Small Cap Discovery Fund
Management’s Discussion of Fund Performance
Performance summary
For the fiscal year ended August 31, 2015, Class A shares of Invesco Small Cap Discovery Fund (the Fund), at net asset value (NAV), outperformed the Russell 2000 Growth Index, the Fund’s style-specific benchmark.
Your Fund’s long-term performance appears later in this report.
Fund vs. Indexes
Total returns, 8/31/14 to 8/31/15, at net asset value (NAV). Performance shown does not include applicable contingent deferred sales charges (CDSC) or front-end sales charges, which would have reduced performance.
Class A Shares | 5.24 | % | ||
Class B Shares | 5.19 | |||
Class C Shares | 4.50 | |||
Class Y Shares | 5.51 | |||
Class R5 Shares | 5.68 | |||
Class R6 Shares | 5.66 | |||
S&P 500 Indexq (Broad Market Index) | 0.48 | |||
Russell 2000 Growth Indexq (Style-Specific Index) | 5.11 | |||
Lipper Small-Cap Growth Funds Indexn (Peer Group Index) | 4.00 |
Source(s): qFactSet Research Systems Inc.; nLipper Inc.
Market conditions and your Fund
The US economy improved slowly, but somewhat steadily, during the fiscal year ended August 31, 2015 – although the performance of the underlying sectors of the economy varied dramatically. The headline story was the massive slowdown in energy markets, as oil prices plummeted when too much supply overwhelmed slowing global demand. However the more subtle story, which drove the economy forward during the year, was the improved position of the US consumer.
As the reporting period began, economic growth appeared to be stronger in the US than in the rest of the world. In mid-2014, when the price of oil began its sharp and prolonged decline, US equities fell as well. However, while global growth weakened and commodity-based economies and currencies underperformed those of the US, continued strengthening of the US consumer led US equity markets higher through the spring. Continued low interest rates, the increasing availability of credit from lenders and an
improving employment picture all contributed to higher consumer confidence. This strength also helped the market overcome summer fears that Greece and the eurozone would fail to reach agreement on a financial bailout plan. In the final weeks of the fiscal year, however, US equity markets moved sharply lower. A significant downturn in China’s financial markets, weak global economic growth and the uncertain timing of a potential US interest rate increase were negatives for jittery US markets. While stocks were up slightly for the fiscal year, they ended the reporting period on a negative note.
At NAV, the Fund’s Class A shares outperformed the Fund’s style-specific benchmark, the Russell 2000 Growth Index, for the fiscal year due to positive stock selection across several sectors, especially the energy, industrials and consumer discretionary sectors. Some of this outperformance was offset by underperformance in the information technology (IT), health care and financials sectors due to stock selection.
The Fund outperformed by the widest margin in the embattled energy sector. The energy portion of the Russell 2000 Growth Index declined by more than 50% during the reporting period, but the Fund’s energy holdings performed much better. Athlon Energy was acquired by another company early in the fiscal year, resulting in a solid gain for the Fund. We sold our holdings in Athlon Energy before the close of the reporting period. We purchased RSP Permian, an oil-focused exploration and production (E&P) company, to replace Athlon Energy in the portfolio, and it contributed significantly to Fund performance during the fiscal year. Laredo Petroleum is another Permian Basin-focused E&P company that performed well. Before the close of the reporting period, however, we sold our position to reduce the Fund’s exposure to the volatile energy sector.
The Fund also outperformed its style-specific index in the industrials sector, driven by positive stock selection. Taser International was a solid performer during the fiscal year. The company benefited from new product introductions, and national headlines kept non-lethal law enforcement tools in the forefront of police department budgets. Driven by operational improvements and healthier end-markets, Lennox International also contributed to Fund performance during the fiscal year.
Consumer discretionary holdings also were a source of outperformance for the Fund relative to the Fund’s style-specific index. While many retailers were hurt during the reporting period from factors ranging from poor weather to port closures, G-III Apparel Group reported several strong quarters of earnings results and benefited performance. Skechers USA also was a significant contributor to Fund performance, as the stock rallied on solid earnings growth.
The area of greatest challenge for the Fund was the IT sector. Internet service
Portfolio Composition |
By sector
Health Care | 25.5 | % | ||
Information Technology | 23.1 | |||
Consumer Discretionary | 18.5 | |||
Industrials | 14.4 | |||
Financials | 8.5 | |||
Materials | 3.2 | |||
Consumer Staples | 2.5 | |||
Energy | 1.6 | |||
Money Market Funds Plus Other Assets Less Liabilities | 2.7 |
Top 10 Equity Holdings* |
| 1. | Cavium Inc. | 1.8% | ||||
| 2. | Cadence Design Systems, Inc. | 1.7 | ||||
| 3. | DexCom Inc. | 1.6 | ||||
| 4. | Team Health Holdings, Inc. | 1.6 | ||||
| 5. | Brunswick Corp. | 1.6 | ||||
| 6. | VCA, Inc. | 1.5 | ||||
| 7. | Guidewire Software, Inc. | 1.5 | ||||
| 8. | Euronet Worldwide, Inc. | 1.4 | ||||
| 9. | Burlington Stores, Inc. | 1.4 | ||||
| 10. | Carlisle Cos., Inc. | 1.4 |
| Total Net Assets | $764.2 million | |||
| Total Number of Holdings* | 107 | |||
The Fund’s holdings are subject to change, and there is no assurance that the Fund will continue to hold any particular security.
*Excluding money market fund holdings.
4 Invesco Small Cap Discovery Fund
company Yelp was one of the larger detractors from Fund performance in the sector. Company management gave lackluster financial guidance, which pressured the stock. Power Integrations also detracted from the Fund’s results as the company’s growth slowed more than was expected. We sold our positions in Yelp and Power Integrations during the reporting period. Another detractor from Fund performance was Qorvo, which pulled back after the company forecasted less-than-expected demand for its smart-phone components.
Health care stocks generally were strong during the reporting period, and the Fund’s top overall contributors included Synageva Biopharma, Dexcom, Thoratec and Impax Labs. Synageva Biopharma was acquired during the fiscal year, and we sold our holdings before the close of the reporting period. However, the performance of the Fund’s health care holdings trailed that of the health care holdings in the Fund’s style-specific benchmark. In particular, Pacira Pharmaceuticals was a large relative detractor. The company’s pain treatment is the only viable alternative to opioid use during surgeries, but as the growth rate of its treatment slowed, the stock pulled back. The management team at Fund holding Fluidigm has an excellent reputation among academic and clinical researchers. Company officials were less successful in managing investor expectations during the fiscal year, however, and the company’s stock pulled back on execution issues, which disappointed investors.
The Fund underperformed its style-specific index modestly in the financials sector. Northstar Realty Finance and Realogy Holdings were two stocks that hurt the Fund’s relative performance.
As we’ve discussed, the Fund’s Class A shares at NAV produced a positive return for the reporting period and outperformed the Fund’s style-specific benchmark. However, stocks remain volatile and we caution investors against making investment decisions based on short-term performance.
We thank you for your commitment to Invesco Small Cap Discovery Fund.
The views and opinions expressed in management’s discussion of Fund performance are those of Invesco Advisers, Inc. These views and opinions are subject to change at any time based on factors such as market and economic conditions. These views and opinions may not be relied upon as investment advice or recommendations, or as an offer for a particular security. The information is not a complete analysis of every aspect of any market, country, industry, security or the Fund. Statements of fact are from sources considered reliable, but Invesco Advisers, Inc. makes no representation or warranty as to their completeness or accuracy. Although historical performance is no guarantee of future results, these insights may help you understand our investment management philosophy.
See important Fund and, if applicable, index disclosures later in this report.
 | Matthew Hart Chartered Financial Analyst, Portfolio Manager, is lead manager of Invesco Small Cap Discovery Fund. He joined Invesco | |
in 2010. Mr. Hart earned a BBA from Southern Methodist University.
| ||
 | Justin Speer Portfolio Manager, is manager of Invesco Small Cap Discovery Fund. He joined Invesco in 2010. Mr. Speer earned a BS with an | |
| emphasis in finance and accounting from Texas Christian University. | ||
5 Invesco Small Cap Discovery Fund
Your Fund’s Long-Term Performance
Results of a $10,000 Investment – Oldest Share Class(es)
Fund and index data from 8/31/05
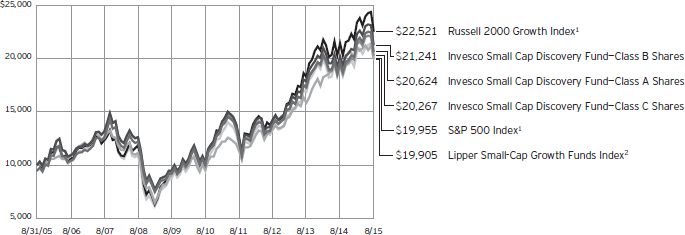
| 1 | Source: FactSet Research Systems Inc. |
| 2 | Source: Lipper Inc. |
Past performance cannot guarantee comparable future results.
The data shown in the chart include reinvested distributions, applicable sales charges and Fund expenses including management fees. Results for Class B shares are calculated as if a hypothetical
shareholder had liquidated his entire investment in the Fund at the close of the reporting period and paid the contingent deferred sales charges, if applicable. Index results include reinvested dividends, but they do not reflect sales charges. Performance of the peer group,
if applicable, reflects fund expenses and management fees; performance of a market index does not. Performance shown in the chart and table(s) does not reflect deduction of taxes a shareholder would pay on Fund distributions or sale of Fund shares.
6 Invesco Small Cap Discovery Fund
Average Annual Total Returns |
| |||
As of 8/31/15, including maximum applicable sales charges |
| |||
Class A Shares | ||||
Inception (11/27/00) | 4.10 | % | ||
10 Years | 7.51 | |||
5 Years | 14.26 | |||
1 Year | -0.56 | |||
Class B Shares | ||||
Inception (11/27/00) | 4.09 | % | ||
10 Years | 7.82 | |||
5 Years | 15.36 | |||
1 Year | 0.79 | |||
Class C Shares | ||||
Inception (11/27/00) | 3.73 | % | ||
10 Years | 7.32 | |||
5 Years | 14.73 | |||
1 Year | 3.63 | |||
Class Y Shares | ||||
Inception (2/2/06) | 7.30 | % | ||
5 Years | 15.89 | |||
1 Year | 5.51 | |||
Class R5 Shares | ||||
10 Years | 8.25 | % | ||
5 Years | 15.85 | |||
1 Year | 5.68 | |||
Class R6 Shares | ||||
10 Years | 8.26 | % | ||
5 Years | 15.86 | |||
1 Year | 5.66 | |||
Effective June 1, 2010, Class A, Class B, Class C and Class I shares of the predecessor fund, Van Kampen Small Cap Growth Fund, advised by Van Kampen Asset Management were reorganized into Class A, Class B, Class C and Class Y shares, respectively, of Invesco Van Kampen Small Cap Growth Fund (renamed Invesco Small Cap Discovery Fund). Returns shown above for Class A, Class B, Class C and Class Y shares are blended returns of the predecessor fund and Invesco Small Cap Discovery Fund. Share class returns will differ from the predecessor fund because of different expenses.
Class R5 shares incepted on September 24, 2012. Performance shown prior to that date is that of the Fund’s and the predecessor fund’s Class A shares and includes the 12b-1 fees applicable to Class A shares.
Class R6 shares incepted on September 24, 2012. Performance shown prior to that date is that of the Fund’s and the predecessor fund’s Class A shares
Average Annual Total Returns |
| |||
As of 6/30/15, the most recent calendar quarter end, including maximum applicable sales charges |
| |||
Class A Shares | ||||
Inception (11/27/00) | 4.77 | % | ||
10 Years | 9.12 | |||
5 Years | 16.13 | |||
1 Year | 7.42 | |||
Class B Shares | ||||
Inception (11/27/00) | 4.76 | % | ||
10 Years | 9.43 | |||
5 Years | 17.22 | |||
1 Year | 9.05 | |||
Class C Shares | ||||
Inception (11/27/00) | 4.41 | % | ||
10 Years | 8.93 | |||
5 Years | 16.59 | |||
1 Year | 11.96 | |||
Class Y Shares | ||||
Inception (2/2/06) | 8.43 | % | ||
5 Years | 17.73 | |||
1 Year | 13.96 | |||
Class R5 Shares | ||||
10 Years | 9.86 | % | ||
5 Years | 17.71 | |||
1 Year | 14.19 | |||
Class R6 Shares | ||||
10 Years | 9.87 | % | ||
5 Years | 17.73 | |||
1 Year | 14.26 | |||
and includes the 12b-1 fees applicable to Class A shares.
The performance data quoted represent past performance and cannot guarantee comparable future results; current performance may be lower or higher. Please visit invesco.com/performance for the most recent month-end performance. Performance figures reflect reinvested distributions, changes in net asset value and the effect of the maximum sales charge unless otherwise stated. Investment return and principal value will fluctuate so that you may have a gain or loss when you sell shares.
The total annual Fund operating expense ratio set forth in the most recent Fund prospectus as of the date of this report for Class A, Class B, Class C, Class Y, Class R5 and Class R6 shares was 1.32%, 1.32%, 2.07%, 1.07%, 0.94% and 0.84%, respectively. The expense ratios presented above may vary from the expense ratios presented in other sections of this report that are based on expenses
incurred during the period covered by this report.
Class A share performance reflects the maximum 5.50% sales charge, and Class B and Class C share performance reflects the applicable contingent deferred sales charge (CDSC) for the period involved. For shares purchased prior to June 1, 2010, the CDSC on Class B shares declines from 5% at the time of purchase to 0% at the beginning of the sixth year. For shares purchased on or after June 1, 2010, the CDSC on Class B shares declines from 5% at the time of purchase to 0% at the beginning of the seventh year. The CDSC on Class C shares is 1% for the first year after purchase. Class Y, Class R5 and Class R6 shares do not have a front-end sales charge or a CDSC; therefore, performance is at net asset value.
The performance of the Fund’s share classes will differ primarily due to different sales charge structures and class expenses.
Fund performance reflects any applicable fee waivers and/or expense reimbursements. Had the adviser not waived fees and/or reimbursed expenses currently or in the past, returns would have been lower. See current prospectus for more information.
7 Invesco Small Cap Discovery Fund |
Invesco Small Cap Discovery Fund’s investment objective is to seek capital appreciation.
| n | Unless otherwise stated, information presented in this report is as of August 31, 2015, and is based on total net assets. |
| n | Unless otherwise noted, all data provided by Invesco. |
| n | To access your Fund’s reports/prospectus, visit invesco.com/fundreports. |
About share classes
| n | Class B shares may not be purchased for new or additional investments. Please see the prospectus for more information. |
| n | Class Y shares are available only to certain investors. Please see the prospectus for more information. |
| n | Class R5 shares and Class R6 shares are primarily intended for employer sponsored retirement and benefit plans that meet certain standards and for institutional investors. Please see the prospectus for more information. |
Principal risks of investing in the Fund
| n | Foreign securities risk. The Fund’s foreign investments may be affected by changes in a foreign country’s exchange rates, political and social instability, changes in economic or taxation policies, difficulties when enforcing obligations, decreased liquidity, and increased volatility. Foreign companies may be subject to less regulation resulting in less publicly available information about the companies. |
| n | Growth investing risk. Growth stocks tend to be more expensive relative to their earnings or assets compared with other types of stock. As a result they tend to be more sensitive to changes in their earnings and can be more volatile. |
| n | Initial public offerings (IPO) risk. The prices of IPOs securities fluctuate more than prices of equity securities of companies with longer trading histories. In addition, companies offering securities in IPOs may have less experienced management or limited operating histories. There can be no assurance that the Fund will have favorable IPO investment opportunities. |
| n | Management risk. The investment techniques and risk analysis used by the Fund’s portfolio managers may not produce the desired results. |
| n | Market risk. The prices of and the income generated by the Fund’s securities may decline in response to, among |
other things, investor sentiment, general economic and market conditions, regional or global instability, and currency and interest rate fluctuations. |
| n | Real estate investment trust (REIT)/real estate risk. Investments in real estate related instruments may be affected by economic, legal, cultural, environmental or technological factors that affect property values, rents or occupancies of real estate related to the Fund’s holdings. Shares of real estate related companies, which tend to be small- and mid-cap companies, may be more volatile and less liquid. |
| n | Small-and mid-capitalization risks. Stocks of small- and mid-sized companies tend to be more vulnerable to adverse developments and may have little or no operating history or track record of success, and limited product lines, markets, management and financial resources. The securities of small- and mid-sized companies may be more volatile due to less market interest and less publicly available information about the issuer. They also may be illiquid or restricted as to resale, or may trade less frequently and in smaller volumes, all of which may cause difficulty when establishing or closing a position at a desirable price. |
| n | Unseasoned issuer risk. Investments in unseasoned companies or companies with special circumstances often involve much greater risks than are inherent in other types of investments and securities of such companies may be more likely to experience fluctuations in price. In addition, investments made in anticipation of future events may, if the events are delayed or never achieved, cause stock prices to fall. |
About indexes used in this report
| n | The S&P 500® Index is an unmanaged index considered representative of the US stock market. |
| n | The Russell 2000® Growth Index is an unmanaged index considered representative of small-cap growth stocks. The Russell 2000 Growth Index is a trade- |
This report must be accompanied or preceded by a currently effective Fund prospectus, which contains more complete information, including sales charges and expenses. Investors should read it carefully before investing.
NOT FDIC INSURED | MAY LOSE VALUE | NO BANK GUARANTEE |
| mark/service mark of the Frank Russell Co. Russell® is a trademark of the Frank Russell Co. |
| n | The Lipper Small-Cap Growth Funds Index is an unmanaged index considered representative of small-cap growth funds tracked by Lipper. |
| n | The Fund is not managed to track the performance of any particular index, including the index(es) described here, and consequently, the performance of the Fund may deviate significantly from the performance of the index(es). |
| n | A direct investment cannot be made in an index. Unless otherwise indicated, index results include reinvested dividends, and they do not reflect sales charges. Performance of the peer group, if applicable, reflects fund expenses; performance of a market index does not. |
Other information
| n | The returns shown in management’s discussion of Fund performance are based on net asset values (NAVs) calculated for shareholder transactions. Generally accepted accounting principles require adjustments to be made to the net assets of the Fund at period end for financial reporting purposes, and as such, the NAVs for shareholder transactions and the returns based on those NAVs may differ from the NAVs and returns reported in the Financial Highlights. |
| n | Industry classifications used in this report are generally according to the Global Industry Classification Standard, which was developed by and is the exclusive property and a service mark of MSCI Inc. and Standard & Poor’s. |
8 Invesco Small Cap Discovery Fund
Schedule of Investments(a)
August 31, 2015
| Shares | Value | |||||||
Common Stocks & Other Equity Interests–97.31% |
| |||||||
| Aerospace & Defense–0.39% | ||||||||
TASER International, Inc.(b)(c) | 126,062 | $ | 2,949,851 | |||||
| Airlines–0.49% | ||||||||
Spirit Airlines Inc.(c) | 73,085 | 3,745,606 | ||||||
| Apparel, Accessories & Luxury Goods–1.35% | ||||||||
G-III Apparel Group, Ltd.(c) | 149,126 | 10,338,906 | ||||||
| Application Software–9.40% | ||||||||
Aspen Technology, Inc.(c) | 75,382 | 2,854,716 | ||||||
Cadence Design Systems, Inc.(c) | 656,018 | 13,133,480 | ||||||
Guidewire Software Inc.(c) | 198,453 | 11,095,507 | ||||||
Manhattan Associates, Inc.(c) | 134,681 | 7,876,145 | ||||||
Paycom Software Inc.(c) | 184,944 | 7,127,742 | ||||||
Qlik Technologies Inc.(c) | 97,711 | 3,699,339 | ||||||
SolarWinds, Inc.(c) | 190,103 | 7,556,594 | ||||||
SS&C Technologies Holdings, Inc. | 139,778 | 9,468,562 | ||||||
Ultimate Software Group, Inc. (The)(c) | 51,361 | 9,049,295 | ||||||
| 71,861,380 | ||||||||
| Asset Management & Custody Banks–1.76% | ||||||||
Affiliated Managers Group, Inc.(c) | 30,389 | 5,665,725 | ||||||
WisdomTree Investments, Inc. | 416,416 | 7,807,800 | ||||||
| 13,473,525 | ||||||||
| Auto Parts & Equipment–1.26% | ||||||||
Gentherm Inc.(c) | 125,995 | 5,744,112 | ||||||
Tenneco Inc.(c) | 83,328 | 3,920,582 | ||||||
| 9,664,694 | ||||||||
| Biotechnology–5.67% | ||||||||
Chiasma, Inc.(c) | 71,571 | 1,857,983 | ||||||
Clovis Oncology Inc.(c) | 90,927 | 7,079,576 | ||||||
Esperion Therapeutics, Inc(b)(c) | 82,977 | 3,978,747 | ||||||
Exact Sciences Corp.(c) | 324,043 | 7,164,591 | ||||||
Intercept Pharmaceuticals, Inc.(c) | 19,998 | 3,794,821 | ||||||
Medivation Inc.(c) | 86,119 | 7,583,639 | ||||||
Neurocrine Biosciences, Inc.(c) | 163,648 | 7,589,994 | ||||||
Retrophin, Inc.(c) | 155,397 | 4,260,986 | ||||||
| 43,310,337 | ||||||||
| Building Products–4.59% | ||||||||
A.O. Smith Corp. | 90,210 | 5,819,447 | ||||||
American Woodmark Corp.(c) | 126,657 | 8,394,826 | ||||||
Lennox International Inc. | 54,800 | 6,468,592 | ||||||
Masonite International Corp.(c) | 74,343 | 4,910,355 | ||||||
Owens Corning | 100,817 | 4,465,185 | ||||||
Trex Co., Inc.(c) | 129,175 | 5,013,282 | ||||||
| 35,071,687 | ||||||||
| Commodity Chemicals–0.40% | ||||||||
Methanex Corp. (Canada) | 74,950 | 3,054,962 | ||||||
| Shares | Value | |||||||
| Communications Equipment–1.78% | ||||||||
ARRIS Group Inc.(c) | 277,356 | $ | 7,327,745 | |||||
Infinera Corp.(c) | 286,686 | 6,255,489 | ||||||
| 13,583,234 | ||||||||
| Construction & Engineering–1.13% | ||||||||
Dycom Industries, Inc.(c) | 121,736 | 8,654,212 | ||||||
| Consumer Electronics–0.74% | ||||||||
Harman International Industries, Inc. | 58,012 | 5,670,093 | ||||||
| Data Processing & Outsourced Services–2.10% | ||||||||
Euronet Worldwide, Inc.(c) | 170,735 | 11,007,286 | ||||||
WEX Inc.(c) | 53,002 | 5,010,279 | ||||||
| 16,017,565 | ||||||||
| Distributors–1.65% | ||||||||
Core-Mark Holding Co., Inc. | 96,688 | 5,811,916 | ||||||
Pool Corp. | 97,985 | 6,827,595 | ||||||
| 12,639,511 | ||||||||
| Diversified REIT’s–0.74% | ||||||||
NorthStar Realty Finance Corp. | 402,600 | 5,656,530 | ||||||
| Diversified Support Services–0.55% | ||||||||
Mobile Mini, Inc. | 124,515 | 4,234,755 | ||||||
| Electronic Equipment & Instruments–0.57% | ||||||||
Cognex Corp. | 121,923 | 4,335,582 | ||||||
| Footwear–1.18% | ||||||||
Skechers U.S.A., Inc.–Class A(c) | 64,089 | 9,019,886 | ||||||
| General Merchandise Stores–1.42% | ||||||||
Burlington Stores, Inc.(c) | 204,821 | 10,873,947 | ||||||
| Health Care Equipment–5.14% | ||||||||
DexCom Inc.(c) | 132,916 | 12,512,712 | ||||||
Globus Medical, Inc.–Class A(c) | 334,983 | 8,180,285 | ||||||
Thoratec Corp.(c) | 161,867 | 10,168,485 | ||||||
Wright Medical Group, Inc.(c) | 366,627 | 8,458,085 | ||||||
| 39,319,567 | ||||||||
| Health Care Facilities–4.19% | ||||||||
Acadia Healthcare Co., Inc.(c) | 106,041 | 7,744,174 | ||||||
Capital Senior Living Corp.(c) | 320,021 | 6,669,238 | ||||||
Tenet Healthcare Corp.(c) | 131,510 | 6,474,237 | ||||||
VCA, Inc.(c) | 201,592 | 11,164,165 | ||||||
| 32,051,814 | ||||||||
| Health Care Services–1.60% | ||||||||
Team Health Holdings, Inc.(c) | 208,810 | 12,265,499 | ||||||
| Health Care Supplies–0.83% | ||||||||
Align Technology, Inc.(c) | 111,602 | 6,316,673 | ||||||
See accompanying Notes to Financial Statements which are an integral part of the financial statements.
9 Invesco Small Cap Discovery Fund
| Shares | Value | |||||||
| Homefurnishing Retail–1.00% | ||||||||
Mattress Firm Holding Corp.(b)(c) | 126,599 | $ | 7,607,334 | |||||
| Household Appliances–0.73% | ||||||||
Helen of Troy Ltd.(c) | 65,771 | 5,599,743 | ||||||
| Housewares & Specialties–0.86% | ||||||||
Jarden Corp.(c) | 127,428 | 6,542,154 | ||||||
| Human Resource & Employment Services–1.02% | ||||||||
TrueBlue, Inc.(c) | 323,218 | 7,757,232 | ||||||
| Industrial Conglomerates–1.39% | ||||||||
Carlisle Cos. Inc. | 105,122 | 10,585,785 | ||||||
| Industrial Machinery–1.01% | ||||||||
Woodward Inc. | 169,793 | 7,742,561 | ||||||
| Internet Software & Services–2.30% | ||||||||
CoStar Group Inc.(c) | 40,186 | 7,114,530 | ||||||
Marketo, Inc.(c) | 185,886 | 5,206,667 | ||||||
Wix.com Ltd. (Israel)(c) | 266,975 | 5,272,756 | ||||||
| 17,593,953 | ||||||||
| Investment Banking & Brokerage–1.95% | ||||||||
E*TRADE Financial Corp.(c) | 221,685 | 5,828,099 | ||||||
Evercore Partners Inc.–Class A | 172,964 | 9,059,854 | ||||||
| 14,887,953 | ||||||||
| IT Consulting & Other Services–1.68% | ||||||||
EPAM Systems, Inc.(c) | 99,786 | 7,045,890 | ||||||
InterXion Holding N.V. (Netherlands)(c) | 211,700 | 5,809,048 | ||||||
| 12,854,938 | ||||||||
| Leisure Facilities–1.01% | ||||||||
Vail Resorts, Inc. | 71,421 | 7,707,040 | ||||||
| Leisure Products–1.58% | ||||||||
Brunswick Corp. | 242,740 | 12,066,605 | ||||||
| Life Sciences Tools & Services–4.78% | ||||||||
Bio-Techne Corp. | 88,786 | 8,388,501 | ||||||
Bruker Corp.(c) | 325,194 | 5,977,066 | ||||||
Fluidigm Corp.(c) | 427,604 | 5,212,493 | ||||||
PAREXEL International Corp.(c) | 120,148 | 7,896,127 | ||||||
VWR Corp.(c) | 345,958 | 9,081,397 | ||||||
| 36,555,584 | ||||||||
| Marine–0.53% | ||||||||
Kirby Corp.(c) | 57,963 | 4,088,130 | ||||||
| Metal & Glass Containers–0.99% | ||||||||
Berry Plastics Group Inc.(c) | 255,609 | 7,566,026 | ||||||
| Movies & Entertainment–1.92% | ||||||||
Cinemark Holdings, Inc. | 237,800 | 8,453,790 | ||||||
Lions Gate Entertainment Corp. | 169,385 | 6,214,736 | ||||||
| 14,668,526 | ||||||||
| Shares | Value | |||||||
| Office Services & Supplies–0.68% | ||||||||
Steelcase Inc.–Class A | 293,151 | $ | 5,168,252 | |||||
| Oil & Gas Exploration & Production–1.59% | ||||||||
Diamondback Energy Inc.(c) | 121,060 | 8,267,188 | ||||||
RSP Permian Inc.(c) | 161,080 | 3,856,255 | ||||||
| 12,123,443 | ||||||||
| Packaged Foods & Meats–1.79% | ||||||||
Hain Celestial Group, Inc. (The)(c) | 104,934 | 6,386,283 | ||||||
WhiteWave Foods Co. (The)(c) | 158,115 | 7,295,426 | ||||||
| 13,681,709 | ||||||||
| Pharmaceuticals–4.02% | ||||||||
Flamel Technologies S.A.–ADR (France)(c) | 261,539 | 5,793,089 | ||||||
IGI Laboratories, Inc.(b)(c) | 728,114 | 5,701,132 | ||||||
Impax Laboratories, Inc.(c) | 235,581 | 9,649,398 | ||||||
Pacira Pharmaceuticals, Inc.(c) | 165,794 | 9,541,445 | ||||||
| 30,685,064 | ||||||||
| Real Estate Services–0.74% | ||||||||
Realogy Holdings Corp.(c) | 140,860 | 5,676,658 | ||||||
| Regional Banks–1.98% | ||||||||
Signature Bank(c) | 64,188 | 8,568,456 | ||||||
SVB Financial Group(c) | 52,365 | 6,549,814 | ||||||
| 15,118,270 | ||||||||
| Research & Consulting Services–0.60% | ||||||||
CEB Inc. | 64,224 | 4,599,723 | ||||||
| Restaurants–3.25% | ||||||||
Jack in the Box Inc. | 116,764 | 9,128,610 | ||||||
Papa John’s International, Inc. | 54,728 | 3,680,458 | ||||||
Texas Roadhouse, Inc. | 205,458 | 7,394,433 | ||||||
Zoe’s Kitchen Inc.(b)(c) | 134,269 | 4,637,651 | ||||||
| 24,841,152 | ||||||||
| Semiconductors–4.99% | ||||||||
Cavium Inc.(c) | 201,422 | 13,700,724 | ||||||
Cypress Semiconductor Corp.(c) | 529,176 | 5,291,760 | ||||||
MA-COM Technology Solutions | 205,060 | 6,051,321 | ||||||
Qorvo, Inc.(c) | 151,434 | 8,406,101 | ||||||
Silicon Laboratories Inc.(c) | 106,945 | 4,649,969 | ||||||
| 38,099,875 | ||||||||
| Specialty Chemicals–1.86% | ||||||||
Cytec Industries Inc. | 101,611 | 7,539,536 | ||||||
PolyOne Corp. | 205,451 | 6,670,994 | ||||||
| 14,210,530 | ||||||||
| Specialty Stores–0.51% | ||||||||
Tractor Supply Co. | 45,375 | 3,870,941 | ||||||
| Systems Software–1.17% | ||||||||
Barracuda Networks, Inc.(c) | 339,211 | 8,917,857 | ||||||
See accompanying Notes to Financial Statements which are an integral part of the financial statements.
10 Invesco Small Cap Discovery Fund
| Shares | Value | |||||||
| Thrifts & Mortgage Finance–1.31% | ||||||||
MGIC Investment Corp.(c) | 949,398 | $ | 10,025,643 | |||||
| Trading Companies & Distributors–0.41% | ||||||||
WESCO International, Inc.(b)(c) | 56,254 | 3,148,536 | ||||||
| Trucking–0.73% | ||||||||
ArcBest Corp. | 192,175 | 5,550,014 | ||||||
Total Common Stocks & Other Equity Interests (Cost $602,391,589) |
| 743,651,047 | ||||||
Money Market Funds–3.08% | ||||||||
Liquid Assets Portfolio–Institutional Class, 0.12 %(d) | 11,774,237 | 11,774,237 | ||||||
Premier Portfolio–Institutional Class, 0.09%(d) | 11,774,237 | 11,774,237 | ||||||
Total Money Market Funds |
| 23,548,474 | ||||||
TOTAL INVESTMENTS (excluding investments purchased with cash collateral from securities on loan)–100.39% |
| 767,199,521 | ||||||
| Shares | Value | |||||||
Investments Purchased with Cash Collateral from Securities on Loan |
| |||||||
Money Market Funds–2.75% |
| |||||||
Liquid Assets Portfolio–Institutional Class, 0.12% | 21,014,230 | $ | 21,014,230 | |||||
TOTAL INVESTMENTS–103.14% |
| 788,213,751 | ||||||
OTHER ASSETS LESS LIABILITIES–(3.14)% |
| (23,994,825 | ) | |||||
NET ASSETS–100.00% |
| $ | 764,218,926 | |||||
Investment Abbreviations:
| ADR | – American Depositary Receipt | |
| REIT | – Real Estate Investment Trust |
Notes to Schedule of Investments:
| (a) | Industry and/or sector classifications used in this report are generally according to the Global Industry Classification Standard, which was developed by and is the exclusive property and a service mark of MSCI Inc. and Standard & Poor’s. |
| (b) | All or a portion of this security was out on loan at August 31, 2015. |
| (c) | Non-income producing security. |
| (d) | The money market fund and the Fund are affiliated by having the same investment adviser. The rate shown is the 7-day SEC standardized yield as of August 31, 2015. |
| (e) | The security has been segregated to satisfy the commitment to return the cash collateral received in securities lending transactions upon the borrower’s return of the securities loaned. See Note 1I. The following table presents the Fund’s gross and net amount of assets available for offset by the Fund as of August 31, 2015. |
| Counterparty | Gross Amount of Securities on Loan at Value | Cash Collateral Received for Securities Loaned* | Net Amount | |||||||||
Brown Brothers Harriman | $ | 19,877,678 | $ | (19,877,678 | ) | $ | — | |||||
| * | Amount does not include excess collateral received. |
See accompanying Notes to Financial Statements which are an integral part of the financial statements.
11 Invesco Small Cap Discovery Fund
Statement of Assets and Liabilities
August 31, 2015
Assets: | ||||
Investments, at value (Cost $602,391,589)* | $ | 743,651,047 | ||
Investments in affiliated money market funds, at value and cost | 44,562,704 | |||
Total investments, at value (Cost $646,954,293) | 788,213,751 | |||
Receivable for: | ||||
Investments sold | 10,850,782 | |||
Fund shares sold | 3,313,839 | |||
Dividends | 264,431 | |||
Investment for trustee deferred compensation and retirement plans | 99,429 | |||
Other assets | 35,353 | |||
Total assets | 802,777,585 | |||
Liabilities: | ||||
Payable for: | ||||
Investments purchased | 15,677,652 | |||
Fund shares reacquired | 1,133,805 | |||
Collateral upon return of securities loaned | 21,014,230 | |||
Accrued fees to affiliates | 547,820 | |||
Accrued trustees’ and officers’ fees and benefits | 4,207 | |||
Accrued other operating expenses | 65,411 | |||
Trustee deferred compensation and retirement plans | 115,534 | |||
Total liabilities | 38,558,659 | |||
Net assets applicable to shares outstanding | $ | 764,218,926 | ||
Net assets consist of: |
| |||
Shares of beneficial interest | $ | 543,808,183 | ||
Undistributed net investment income (loss) | (4,498,577 | ) | ||
Undistributed net realized gain | 83,649,862 | |||
Net unrealized appreciation | 141,259,458 | |||
| $ | 764,218,926 | |||
Net Assets: | ||||
Class A | $ | 512,762,898 | ||
Class B | $ | 7,715,129 | ||
Class C | $ | 62,772,675 | ||
Class Y | $ | 97,497,289 | ||
Class R5 | $ | 6,783,806 | ||
Class R6 | $ | 76,687,129 | ||
Shares outstanding, $0.01 par value per share, |
| |||
Class A | 48,381,756 | |||
Class B | 815,477 | |||
Class C | 7,126,763 | |||
Class Y | 8,848,363 | |||
Class R5 | 612,466 | |||
Class R6 | 6,914,711 | |||
Class A: | ||||
Net asset value per share | $ | 10.60 | ||
Maximum offering price per share | ||||
(Net asset value of $10.60 ¸ 94.50%) | $ | 11.22 | ||
Class B: | ||||
Net asset value and offering price per share | $ | 9.46 | ||
Class C: | ||||
Net asset value and offering price per share | $ | 8.81 | ||
Class Y: | ||||
Net asset value and offering price per share | $ | 11.02 | ||
Class R5: | ||||
Net asset value and offering price per share | $ | 11.08 | ||
Class R6: | ||||
Net asset value and offering price per share | $ | 11.09 | ||
| * | At August 31, 2015, securities with an aggregate value of $19,877,678 were on loan to brokers. |
See accompanying Notes to Financial Statements which are an integral part of the financial statements.
12 Invesco Small Cap Discovery Fund
Statement of Operations
For the year ended August 31, 2015
Investment income: |
| |||
Dividends (net of foreign withholding taxes of $19,324) | $ | 3,319,950 | ||
Dividends from affiliated money market funds (includes securities lending income of $428,150) | 445,187 | |||
Total investment income | 3,765,137 | |||
Expenses: | ||||
Advisory fees | 6,288,072 | |||
Administrative services fees | 210,168 | |||
Custodian fees | 24,446 | |||
Distribution fees: | ||||
Class A | 1,303,433 | |||
Class B | 23,072 | |||
Class C | 594,252 | |||
Transfer agent fees — A, B, C and Y | 1,550,287 | |||
Transfer agent fees — R5 | 23,330 | |||
Transfer agent fees — R6 | 2,929 | |||
Trustees’ and officers’ fees and benefits | 32,752 | |||
Other | 254,853 | |||
Total expenses | 10,307,594 | |||
Less: Fees waived and expense offset arrangement(s) | (39,632 | ) | ||
Net expenses | 10,267,962 | |||
Net investment income (loss) | (6,502,825 | ) | ||
Realized and unrealized gain (loss) from: | ||||
Net realized gain from investment securities | 102,187,981 | |||
Change in net unrealized appreciation (depreciation) of investment securities | (53,678,797 | ) | ||
Net realized and unrealized gain | 48,509,184 | |||
Net increase in net assets resulting from operations | $ | 42,006,359 | ||
See accompanying Notes to Financial Statements which are an integral part of the financial statements.
13 Invesco Small Cap Discovery Fund
Statement of Changes in Net Assets
For the years ended August 31, 2015 and 2014
| 2015 | 2014 | �� | ||||||
Operations: | ||||||||
Net investment income (loss) | $ | (6,502,825 | ) | $ | (7,306,432 | ) | ||
Net realized gain | 102,187,981 | 145,820,748 | ||||||
Change in net unrealized appreciation (depreciation) | (53,678,797 | ) | (25,746,767 | ) | ||||
Net increase in net assets resulting from operations | 42,006,359 | 112,767,549 | ||||||
Distributions to shareholders from net realized gains: | ||||||||
Class A | (73,267,917 | ) | (83,192,368 | ) | ||||
Class B | (1,515,016 | ) | (1,952,149 | ) | ||||
Class C | (9,251,581 | ) | (9,359,747 | ) | ||||
Class Y | (15,070,292 | ) | (24,205,240 | ) | ||||
Class R5 | (6,371,266 | ) | (6,651,766 | ) | ||||
Class R6 | (15,078,987 | ) | (10,227,636 | ) | ||||
Total distributions from net realized gains | (120,555,059 | ) | (135,588,906 | ) | ||||
Share transactions–net: | ||||||||
Class A | 35,689,215 | 1,500,037 | ||||||
Class B | (1,525,306 | ) | (1,951,636 | ) | ||||
Class C | 14,340,675 | 5,350,077 | ||||||
Class Y | (8,219,671 | ) | (42,967,605 | ) | ||||
Class R5 | (36,289,288 | ) | 1,899,903 | |||||
Class R6 | (24,408,949 | ) | 39,545,974 | |||||
Net increase (decrease) in net assets resulting from share transactions | (20,413,324 | ) | 3,376,750 | |||||
Net increase (decrease) in net assets | (98,962,024 | ) | (19,444,607 | ) | ||||
Net assets: | ||||||||
Beginning of year | 863,180,950 | 882,625,557 | ||||||
End of year (includes undistributed net investment income (loss) of $(4,498,577) and $(4,993,149), respectively) | $ | 764,218,926 | $ | 863,180,950 | ||||
Notes to Financial Statements
August 31, 2015
NOTE 1—Significant Accounting Policies
Invesco Small Cap Discovery Fund (the “Fund”) is a series portfolio of AIM Counselor Series Trust (Invesco Counselor Series Trust) (the “Trust”). The Trust is a Delaware statutory trust registered under the Investment Company Act of 1940, as amended (the “1940 Act”), as an open-end series management investment company consisting of thirteen separate portfolios, each authorized to issue an unlimited number of shares of beneficial interest. The assets, liabilities and operations of each portfolio are accounted for separately. Information presented in these financial statements pertains only to the Fund. Matters affecting each portfolio or class will be voted on exclusively by the shareholders of such portfolio or class.
The Fund’s investment objective is to seek capital appreciation.
The Fund currently consists of six different classes of shares: Class A, Class B, Class C, Class Y, Class R5 and Class R6. Class A shares are sold with a front-end sales charge unless certain waiver criteria are met and under certain circumstances load waived shares may be subject to contingent deferred sales charges (“CDSC”). Class C shares are sold with a CDSC. Class Y, Class R5 and Class R6 shares are sold at net asset value. Effective November 30, 2010, new or additional investments in Class B shares are no longer permitted. Existing shareholders of Class B shares may continue to reinvest dividends and capital gains distributions in Class B shares until they convert to Class A shares. Also, shareholders in Class B shares will be able to exchange those shares for Class B shares of other Invesco Funds offering such shares until they convert to Class A shares. Generally, Class B shares will automatically convert to Class A shares on or about the month-end, which is at least eight years after the date of purchase. Redemption of Class B shares prior to the conversion date will be subject to a CDSC.
The following is a summary of the significant accounting policies followed by the Fund in the preparation of its financial statements.
| A. | Security Valuations — Securities, including restricted securities, are valued according to the following policy. |
A security listed or traded on an exchange (except convertible securities) is valued at its last sales price or official closing price as of the close of the customary trading session on the exchange where the security is principally traded, or lacking any sales or official closing price on a particular day, the security may be valued at the closing bid price on that day. Securities traded in the over-the-counter market are valued based on prices furnished by independent pricing services or market makers. When such securities are valued by an independent pricing service they may be considered fair valued. Futures contracts are valued at the final settlement price set by an exchange on which they are principally traded. Listed options are valued at the mean between the last bid and asked prices from the exchange on which they are principally traded. Options not
14 Invesco Small Cap Discovery Fund
listed on an exchange are valued by an independent source at the mean between the last bid and asked prices. For purposes of determining net asset value (“NAV”) per share, futures and option contracts generally are valued 15 minutes after the close of the customary trading session of the New York Stock Exchange (“NYSE”).
Investments in open-end and closed-end registered investment companies that do not trade on an exchange are valued at the end-of-day net asset value per share. Investments in open-end and closed-end registered investment companies that trade on an exchange are valued at the last sales price or official closing price as of the close of the customary trading session on the exchange where the security is principally traded.
Debt obligations (including convertible securities) and unlisted equities are fair valued using an evaluated quote provided by an independent pricing service. Evaluated quotes provided by the pricing service may be determined without exclusive reliance on quoted prices, and may reflect appropriate factors such as institution-size trading in similar groups of securities, developments related to specific securities, dividend rate (for unlisted equities), yield (for debt obligations), quality, type of issue, coupon rate (for debt obligations), maturity (for debt obligations), individual trading characteristics and other market data. Debt obligations are subject to interest rate and credit risks. In addition, all debt obligations involve some risk of default with respect to interest and/or principal payments.
Foreign securities’ (including foreign exchange contracts) prices are converted into U.S. dollar amounts using the applicable exchange rates as of the close of the NYSE. If market quotations are available and reliable for foreign exchange-traded equity securities, the securities will be valued at the market quotations. Because trading hours for certain foreign securities end before the close of the NYSE, closing market quotations may become unreliable. If between the time trading ends on a particular security and the close of the customary trading session on the NYSE, events occur that the Adviser determines are significant and make the closing price unreliable, the Fund may fair value the security. If the event is likely to have affected the closing price of the security, the security will be valued at fair value in good faith using procedures approved by the Board of Trustees. Adjustments to closing prices to reflect fair value may also be based on a screening process of an independent pricing service to indicate the degree of certainty, based on historical data, that the closing price in the principal market where a foreign security trades is not the current value as of the close of the NYSE. Foreign securities’ prices meeting the approved degree of certainty that the price is not reflective of current value will be priced at the indication of fair value from the independent pricing service. Multiple factors may be considered by the independent pricing service in determining adjustments to reflect fair value and may include information relating to sector indices, American Depositary Receipts and domestic and foreign index futures. Foreign securities may have additional risks including exchange rate changes, potential for sharply devalued currencies and high inflation, political and economic upheaval, the relative lack of issuer information, relatively low market liquidity and the potential lack of strict financial and accounting controls and standards.
Securities for which market prices are not provided by any of the above methods may be valued based upon quotes furnished by independent sources. The last bid price may be used to value equity securities. The mean between the last bid and asked prices is used to value debt obligations, including corporate loans.
Securities for which market quotations are not readily available or became unreliable are valued at fair value as determined in good faith by or under the supervision of the Trust’s officers following procedures approved by the Board of Trustees. Issuer specific events, market trends, bid/asked quotes of brokers and information providers and other market data may be reviewed in the course of making a good faith determination of a security’s fair value.
The Fund may invest in securities that are subject to interest rate risk, meaning the risk that the prices will generally fall as interest rates rise and, conversely, the prices will generally rise as interest rates fall. Specific securities differ in their sensitivity to changes in interest rates depending on their individual characteristics. Changes in interest rates may result in increased market volatility, which may affect the value and/or liquidity of certain Fund investments.
Valuations change in response to many factors including the historical and prospective earnings of the issuer, the value of the issuer’s assets, general economic conditions, interest rates, investor perceptions and market liquidity. Because of the inherent uncertainties of valuation, the values reflected in the financial statements may materially differ from the value received upon actual sale of those investments.
| B. | Securities Transactions and Investment Income — Securities transactions are accounted for on a trade date basis. Realized gains or losses on sales are computed on the basis of specific identification of the securities sold. Interest income (net of withholding tax, if any) is recorded on the accrual basis from settlement date. Dividend income (net of withholding tax, if any) is recorded on the ex-dividend date. |
The Fund may periodically participate in litigation related to Fund investments. As such, the Fund may receive proceeds from litigation settlements. Any proceeds received are included in the Statement of Operations as realized gain (loss) for investments no longer held and as unrealized gain (loss) for investments still held.
Brokerage commissions and mark ups are considered transaction costs and are recorded as an increase to the cost basis of securities purchased and/or a reduction of proceeds on a sale of securities. Such transaction costs are included in the determination of net realized and unrealized gain (loss) from investment securities reported in the Statement of Operations and the Statement of Changes in Net Assets and the net realized and unrealized gains (losses) on securities per share in the Financial Highlights. Transaction costs are included in the calculation of the Fund’s net asset value and, accordingly, they reduce the Fund’s total returns. These transaction costs are not considered operating expenses and are not reflected in net investment income reported in the Statement of Operations and the Statement of Changes in Net Assets, or the net investment income per share and the ratios of expenses and net investment income reported in the Financial Highlights, nor are they limited by any expense limitation arrangements between the Fund and the investment adviser.
The Fund allocates income and realized and unrealized capital gains and losses to a class based on the relative net assets of each class.
| C. | Country Determination — For the purposes of making investment selection decisions and presentation in the Schedule of Investments, the investment adviser may determine the country in which an issuer is located and/or credit risk exposure based on various factors. These factors include the laws of the country under which the issuer is organized, where the issuer maintains a principal office, the country in which the issuer derives 50% or more of its total revenues and the country that has the primary market for the issuer’s securities, as well as other criteria. Among the other criteria that may be evaluated for making this determination are the country in which the issuer maintains 50% or more of its assets, the type of security, financial guarantees and enhancements, the nature of the collateral and the sponsor organization. Country of issuer and/or credit risk exposure has been determined to be the United States of America, unless otherwise noted. |
15 Invesco Small Cap Discovery Fund
| D. | Distributions — Distributions from net investment income and net realized capital gain, if any, are generally declared and paid annually and recorded on the ex-dividend date. The Fund may elect to treat a portion of the proceeds from redemptions as distributions for federal income tax purposes. |
| E. | Federal Income Taxes — The Fund intends to comply with the requirements of Subchapter M of the Internal Revenue Code of 1986, as amended (the “Internal Revenue Code”), necessary to qualify as a regulated investment company and to distribute substantially all of the Fund’s taxable earnings to shareholders. As such, the Fund will not be subject to federal income taxes on otherwise taxable income (including net realized capital gain) that is distributed to shareholders. Therefore, no provision for federal income taxes is recorded in the financial statements. |
The Fund recognizes the tax benefits of uncertain tax positions only when the position is more likely than not to be sustained. Management has analyzed the Fund’s uncertain tax positions and concluded that no liability for unrecognized tax benefits should be recorded related to uncertain tax positions. Management is not aware of any tax positions for which it is reasonably possible that the total amounts of unrecognized tax benefits will change materially in the next 12 months.
The Fund files tax returns in the U.S. Federal jurisdiction and certain other jurisdictions. Generally, the Fund is subject to examinations by such taxing authorities for up to three years after the filing of the return for the tax period.
| F. | Expenses — Fees provided for under the Rule 12b-1 plan of a particular class of the Fund are charged to the operations of such class. Transfer agency fees and expenses and other shareholder recordkeeping fees and expenses attributable to Class R5 and Class R6 are allocated to each share class based on relative net assets. Sub-accounting fees attributable to Class R5 are charged to the operations of the class. Transfer agency fees and expenses and other shareholder recordkeeping fees and expenses relating to all other classes are allocated among those classes based on relative net assets. All other expenses are allocated among the classes based on relative net assets. |
| G. | Accounting Estimates — The preparation of financial statements in conformity with accounting principles generally accepted in the United States of America (“GAAP”) requires management to make estimates and assumptions that affect the reported amounts of assets and liabilities at the date of the financial statements and the reported amounts of revenues and expenses during the reporting period including estimates and assumptions related to taxation. Actual results could differ from those estimates by a significant amount. In addition, the Fund monitors for material events or transactions that may occur or become known after the period-end date and before the date the financial statements are released to print. |
| H. | Indemnifications — Under the Trust’s organizational documents, each Trustee, officer, employee or other agent of the Trust is indemnified against certain liabilities that may arise out of the performance of their duties to the Fund. Additionally, in the normal course of business, the Fund enters into contracts, including the Fund’s servicing agreements, that contain a variety of indemnification clauses. The Fund’s maximum exposure under these arrangements is unknown as this would involve future claims that may be made against the Fund that have not yet occurred. The risk of material loss as a result of such indemnification claims is considered remote. |
| I. | Securities Lending — The Fund may lend portfolio securities having a market value up to one-third of the Fund’s total assets. Such loans are secured by collateral equal to no less than the market value of the loaned securities determined daily by the securities lending provider. Such collateral will be cash or debt securities issued or guaranteed by the U.S. Government or any of its sponsored agencies. Cash collateral received in connection with these loans is invested in short-term money market instruments or affiliated money market funds and is shown as such on the Schedule of Investments. It is the Fund’s policy to obtain additional collateral from or return excess collateral to the borrower by the end of the next business day, following the valuation date of the securities loaned. Therefore, the value of the collateral held may be temporarily less than the value of the securities on loan. Lending securities entails a risk of loss to the Fund if, and to the extent that, the market value of the securities loaned were to increase and the borrower did not increase the collateral accordingly, and the borrower failed to return the securities. Upon the failure of the borrower to return the securities, collateral may be liquidated and the securities may be purchased on the open market to replace the loaned securities. The Fund could experience delays and costs in gaining access to the collateral. The Fund bears the risk of any deficiency in the amount of the collateral available for return to the borrower due to any loss on the collateral invested. Dividends received on cash collateral investments for securities lending transactions, which are net of compensation to counterparties, is included in Dividends from affiliated money market funds on the Statement of Operations. The aggregate value of securities out on loan, if any, is shown as a footnote on the Statement of Assets and Liabilities. |
NOTE 2—Advisory Fees and Other Fees Paid to Affiliates
The Trust has entered into a master investment advisory agreement with Invesco Advisers, Inc. (the “Adviser” or “Invesco”). Under the terms of the investment advisory agreement, the Fund pays an advisory fee to the Adviser based on the annual rate of the Fund’s average daily net assets as follows:
| Average Daily Net Assets | Rate | |||
First $500 million | 0.80% | |||
Next $500 million | 0.75% | |||
Over $1 billion | 0.70% | |||
For the year ended August 31, 2015, the effective advisory fees incurred by the Fund was 0.78%.
Under the terms of a master sub-advisory agreement between the Adviser and each of Invesco Asset Management Deutschland GmbH, Invesco Asset Management Limited, Invesco Asset Management (Japan) Limited, Invesco Hong Kong Limited, Invesco Senior Secured Management, Inc. and Invesco Canada Ltd. (collectively, the “Affiliated Sub-Advisers”) the Adviser, not the Fund, may pay 40% of the fees paid to the Adviser to any such Affiliated Sub-Adviser(s) that provide(s) discretionary investment management services to the Fund based on the percentage of assets allocated to such Affiliated Sub-Adviser(s).
The Adviser has contractually agreed, through at least June 30, 2016, to waive advisory fees and/or reimburse expenses to the extent necessary to limit total annual fund operating expenses after fee waiver and/or expense reimbursement (excluding certain items discussed below) of Class A, Class B, Class C, Class Y, Class R5 and Class R6 shares to 2.00%, 2.75%, 2.75%, 1.75%, 1.75% and 1.75% of average daily net assets,
16 Invesco Small Cap Discovery Fund
respectively. In determining the Adviser’s obligation to waive advisory fees and/or reimburse expenses, the following expenses are not taken into account, and could cause total annual fund operating expenses after fee waiver and/or reimbursement to exceed the numbers reflected above: (1) interest; (2) taxes; (3) dividend expense on short sales; (4) extraordinary or non-routine items, including litigation expenses; and (5) expenses that the Fund has incurred but did not actually pay because of an expense offset arrangement. Unless Invesco continues the fee waiver agreement, it will terminate on June 30, 2016. The fee waiver agreement cannot be terminated during its term. The Adviser did not waive fees and/or reimburse expenses during the period under this expense limitation.
Further, the Adviser has contractually agreed, through at least June 30, 2017, to waive the advisory fee payable by the Fund in an amount equal to 100% of the net advisory fees the Adviser receives from the affiliated money market funds on investments by the Fund of uninvested cash (excluding investments of cash collateral from securities lending) in such affiliated money market funds.
For the year ended August 31, 2015, the Adviser waived advisory fees of $38,216.
The Trust has entered into a master administrative services agreement with Invesco pursuant to which the Fund has agreed to pay Invesco for certain administrative costs incurred in providing accounting services to the Fund. For the year ended August 31, 2015, expenses incurred under the agreement are shown in the Statement of Operations as Administrative services fees.
The Trust has entered into a transfer agency and service agreement with Invesco Investment Services, Inc. (“IIS”) pursuant to which the Fund has agreed to pay IIS a fee for providing transfer agency and shareholder services to the Fund and reimburse IIS for certain expenses incurred by IIS in the course of providing such services. IIS may make payments to intermediaries that provide omnibus account services, sub-accounting services and/or networking services. All fees payable by IIS to intermediaries that provide omnibus account services or sub-accounting are charged back to the Fund, subject to certain limitations approved by the Trust’s Board of Trustees. For the year ended August 31, 2015, the expenses incurred under the agreement are shown in the Statement of Operations as Transfer agent fees.
Shares of the Fund are distributed by Invesco Distributors, Inc. (“IDI”). The Fund has adopted a distribution plan pursuant to Rule 12b-1 under the 1940 Act, and a service plan (collectively, the “Plans”) for Class A shares, Class B shares and Class C shares to compensate IDI for the sale, distribution, shareholder servicing and maintenance of shareholder accounts for these shares. Under the Plans, the Fund will incur annual fees of up to 0.25% of Class A average daily net assets and up to 1.00% each of Class B and Class C average daily net assets.
With respect to Class B and Class C shares, the Fund is authorized to reimburse in future years any distribution related expenses that exceed the maximum annual reimbursement rate for such class, so long as such reimbursement does not cause the Fund to exceed the Class B and Class C maximum annual reimbursement rate, respectively. With respect to Class A shares, distribution related expenses that exceed the maximum annual reimbursement rate for such class are not carried forward to future years and the Fund will not reimburse IDI for any such expenses.
For the year ended August 31, 2015, expenses incurred under these agreements are shown in the Statement of Operations as Distribution fees.
Front-end sales commissions and CDSC (collectively, the “sales charges”) are not recorded as expenses of the Fund. Front-end sales commissions are deducted from proceeds from the sales of Fund shares prior to investment in Class A shares of the Fund. CDSC are deducted from redemption proceeds prior to remittance to the shareholder. During the year ended August 31, 2015, IDI advised the Fund that IDI retained $113,848 in front-end sales commissions from the sale of Class A shares and $1,422, $1,232 and $1,209 from Class A, Class B and Class C shares, respectively, for CDSC imposed on redemptions by shareholders.
For the year ended August 31, 2015, the Fund incurred $8,920 in brokerage commissions with Invesco Capital Markets, Inc., an affiliate of the Adviser and IDI, for portfolio transactions executed on behalf of the Fund.
Certain officers and trustees of the Trust are officers and directors of the Adviser, IIS and/or IDI.
NOTE 3—Additional Valuation Information
GAAP defines fair value as the price that would be received to sell an asset or paid to transfer a liability in an orderly transaction between market participants at the measurement date, under current market conditions. GAAP establishes a hierarchy that prioritizes the inputs to valuation methods, giving the highest priority to readily available unadjusted quoted prices in an active market for identical assets (Level 1) and the lowest priority to significant unobservable inputs (Level 3), generally when market prices are not readily available or are unreliable. Based on the valuation inputs, the securities or other investments are tiered into one of three levels. Changes in valuation methods may result in transfers in or out of an investment’s assigned level:
| Level 1 — | Prices are determined using quoted prices in an active market for identical assets. |
| Level 2 — | Prices are determined using other significant observable inputs. Observable inputs are inputs that other market participants may use in pricing a security. These may include quoted prices for similar securities, interest rates, prepayment speeds, credit risk, yield curves, loss severities, default rates, discount rates, volatilities and others. |
| Level 3 — | Prices are determined using significant unobservable inputs. In situations where quoted prices or observable inputs are unavailable (for example, when there is little or no market activity for an investment at the end of the period), unobservable inputs may be used. Unobservable inputs reflect the Fund’s own assumptions about the factors market participants would use in determining fair value of the securities or instruments and would be based on the best available information. |
As of August 31, 2015, all of the securities in this Fund were valued based on Level 1 inputs (see the Schedule of Investments for security categories). The level assigned to the securities valuations may not be an indication of the risk or liquidity associated with investing in those securities. Because of the inherent uncertainties of valuation, the values reflected in the financial statements may materially differ from the value received upon actual sale of those investments.
NOTE 4—Expense Offset Arrangement(s)
The expense offset arrangement is comprised of transfer agency credits which result from balances in demand deposit accounts used by the transfer agent for clearing shareholder transactions. For the year ended August 31, 2015, the Fund received credits from this arrangement, which resulted in the reduction of the Fund’s total expenses of $1,416.
17 Invesco Small Cap Discovery Fund
NOTE 5—Trustees’ and Officers’ Fees and Benefits
Trustees’ and Officers’ Fees and Benefits include amounts accrued by the Fund to pay remuneration to certain Trustees and Officers of the Fund. Trustees have the option to defer compensation payable by the Fund, and Trustees’ and Officers’ Fees and Benefits also include amounts accrued by the Fund to fund such deferred compensation amounts. Those Trustees who defer compensation have the option to select various Invesco Funds in which their deferral accounts shall be deemed to be invested. Finally, certain current Trustees were eligible to participate in a retirement plan that provided for benefits to be paid upon retirement to Trustees over a period of time based on the number of years of service. The Fund may have certain former Trustees who also participate in a retirement plan and receive benefits under such plan. Trustees’ and Officers’ Fees and Benefits include amounts accrued by the Fund to fund such retirement benefits. Obligations under the deferred compensation and retirement plans represent unsecured claims against the general assets of the Fund.
NOTE 6—Cash Balances
The Fund is permitted to temporarily carry a negative or overdrawn balance in its account with State Street Bank and Trust Company, the custodian bank. Such balances, if any at period end, are shown in the Statement of Assets and Liabilities under the payable caption Amount due custodian. To compensate the custodian bank for such overdrafts, the overdrawn Fund may either (1) leave funds as a compensating balance in the account so the custodian bank can be compensated by earning the additional interest; or (2) compensate by paying the custodian bank at a rate agreed upon by the custodian bank and Invesco, not to exceed the contractually agreed upon rate.
NOTE 7—Distributions to Shareholders and Tax Components of Net Assets
Tax Character of Distributions to Shareholders Paid During the Fiscal Years Ended August 31, 2015 and 2014:
| 2015 | 2014 | |||||||
Ordinary income | $ | — | $ | 26,321,533 | ||||
Long-term capital gain | 120,555,059 | 109,267,373 | ||||||
Total distributions | $ | 120,555,059 | $ | 135,588,906 | ||||
Tax Components of Net Assets at Period-End:
| 2015 | ||||
Undistributed long-term gain | $ | 86,598,251 | ||
Net unrealized appreciation — investments | 138,311,070 | |||
Temporary book/tax differences | (118,434 | ) | ||
Late-Year ordinary loss deferral | (4,380,144 | ) | ||
Shares of beneficial interest | 543,808,183 | |||
Total net assets | $ | 764,218,926 | ||
The difference between book-basis and tax-basis unrealized appreciation (depreciation) is due to differences in the timing of recognition of gains and losses on investments for tax and book purposes. The Fund’s net unrealized appreciation difference is attributable primarily to wash sales.
The temporary book/tax differences are a result of timing differences between book and tax recognition of income and/or expenses. The Fund’s temporary book/tax differences are the result of the trustee deferral of compensation and retirement plan benefits.
Capital loss carryforward is calculated and reported as of a specific date. Results of transactions and other activity after that date may affect the amount of capital loss carryforward actually available for the Fund to utilize. Capital losses generated in years beginning after December 22, 2010 can be carried forward for an unlimited period, whereas previous losses expire in eight tax years. Capital losses with an expiration period may not be used to offset capital gains until all net capital losses without an expiration date have been utilized. Capital loss carryforwards with no expiration date will retain their character as either short-term or long-term capital losses instead of as short-term capital losses as under prior law. The ability to utilize capital loss carryforwards in the future may be limited under the Internal Revenue Code and related regulations based on the results of future transactions.
The Fund does not have a capital loss carryforward as of August 31, 2015.
NOTE 8—Investment Securities
The aggregate amount of investment securities (other than short-term securities, U.S. Treasury obligations and money market funds, if any) purchased and sold by the Fund during the year ended August 31, 2015 was $495,589,374 and $646,236,685, respectively. Cost of investments on a tax basis includes the adjustments for financial reporting purposes as of the most recently completed federal income tax reporting period-end.
| Unrealized Appreciation (Depreciation) of Investment Securities on a Tax Basis | ||||
Aggregate unrealized appreciation of investment securities | $ | 172,252,846 | ||
Aggregate unrealized (depreciation) of investment securities | (33,941,776 | ) | ||
Net unrealized appreciation of investment securities | $ | 138,311,070 | ||
Cost of investments for tax purposes is $649,902,681.
18 Invesco Small Cap Discovery Fund
NOTE 9—Reclassification of Permanent Differences
Primarily as a result of differing book/tax treatment of net operating losses, on August 31, 2015, undistributed net investment income (loss) was increased by $6,997,397, undistributed net realized gain was decreased by $5,459,280 and shares of beneficial interest was decreased by $1,538,117. This reclassification had no effect on the net assets of the Fund.
NOTE 10—Share Information
| Summary of Share Activity | ||||||||||||||||
| Years ended August 31, | ||||||||||||||||
| 2015(a) | 2014 | |||||||||||||||
| Shares | Amount | Shares | Amount | |||||||||||||
Sold: | ||||||||||||||||
Class A | 13,575,929 | $ | 153,093,532 | 11,162,845 | $ | 136,194,937 | ||||||||||
Class B | 39,831 | 403,879 | 39,041 | 438,517 | ||||||||||||
Class C | 1,891,145 | 17,770,645 | 1,160,335 | 12,325,902 | ||||||||||||
Class Y | 3,272,479 | 38,406,104 | 3,179,180 | 39,762,440 | ||||||||||||
Class R5 | 357,167 | 4,193,167 | 326,211 | 4,170,947 | ||||||||||||
Class R6 | 4,726,056 | 55,761,349 | 3,554,223 | 41,450,915 | ||||||||||||
Issued as reinvestment of dividends: | ||||||||||||||||
Class A | 7,017,483 | 70,245,010 | 7,095,938 | 80,255,054 | ||||||||||||
Class B | 160,889 | 1,438,345 | 182,437 | 1,873,622 | ||||||||||||
Class C | 1,051,442 | 8,800,570 | 906,196 | 8,880,723 | ||||||||||||
Class Y | 1,411,862 | 14,669,253 | 2,050,361 | 23,866,200 | ||||||||||||
Class R5 | 610,714 | 6,369,745 | 570,336 | 6,650,122 | ||||||||||||
Class R6 | 1,442,820 | 15,077,466 | 876,263 | 10,225,992 | ||||||||||||
Automatic conversion of Class B shares to Class A shares: | ||||||||||||||||
Class A | 150,402 | 1,687,700 | 205,429 | 2,466,712 | ||||||||||||
Class B | (167,885 | ) | (1,687,700 | ) | (225,501 | ) | (2,466,712 | ) | ||||||||
Reacquired: | ||||||||||||||||
Class A | (16,981,379 | ) | (189,337,027 | ) | (18,171,031 | ) | (217,416,666 | ) | ||||||||
Class B | (168,071 | ) | (1,679,830 | ) | (161,282 | ) | (1,797,063 | ) | ||||||||
Class C | (1,306,193 | ) | (12,230,540 | ) | (1,521,901 | ) | (15,856,548 | ) | ||||||||
Class Y | (5,260,213 | ) | (61,295,028 | ) | (8,846,264 | ) | (106,596,245 | ) | ||||||||
Class R5 | (4,043,733 | ) | (46,852,200 | ) | (725,066 | ) | (8,921,166 | ) | ||||||||
Class R6 | (8,164,378 | ) | (95,247,764 | ) | (983,764 | ) | (12,130,933 | ) | ||||||||
Net increase (decrease) in share activity | (383,633 | ) | $ | (20,413,324 | ) | 673,986 | $ | 3,376,750 | ||||||||
| (a) | There are entities that are record owners of more than 5% of the outstanding shares of the Fund and in the aggregate own 29% of the outstanding shares of the Fund. IDI has an agreement with these entities to sell Fund shares. The Fund, Invesco and/or Invesco affiliates may make payments to these entities, which are considered to be related to the Fund, for providing services to the Fund, Invesco and/or Invesco affiliates including but not limited to services such as securities brokerage, distribution, third party record keeping and account servicing. The Fund has no knowledge as to whether all or any portion of the shares owned of record by these entities are also owned beneficially. |
19 Invesco Small Cap Discovery Fund
NOTE 11—Financial Highlights
The following schedule presents financial highlights for a share of the Fund outstanding throughout the periods indicated.
| Net asset value, beginning of period | Net investment income (loss)(a) | Net gains on securities (both realized and unrealized) | Total from investment operations | Distributions from net realized gains | Net asset value, end of period(b) | Total return(c) | Net assets, end of period (000’s omitted) | Ratio of expenses to average net assets with fee waivers and/or expenses absorbed | Ratio of expenses to average net assets without fee waivers and/or expenses absorbed | Ratio of net investment income (loss) to average net assets | Portfolio turnover(d) | |||||||||||||||||||||||||||||||||||||
Class A |
| |||||||||||||||||||||||||||||||||||||||||||||||
Year ended 08/31/15 | $ | 11.83 | $ | (0.09 | ) | $ | 0.61 | $ | 0.52 | $ | (1.75 | ) | $ | 10.60 | 5.24 | % | $ | 512,763 | 1.32 | %(e) | 1.32 | %(e) | (0.85 | )%(e) | 63 | % | ||||||||||||||||||||||
Year ended 08/31/14 | 12.20 | (0.10 | ) | 1.62 | 1.52 | (1.89 | ) | 11.83 | 13.15 | 527,759 | 1.32 | 1.32 | (0.85 | ) | 79 | |||||||||||||||||||||||||||||||||
Year ended 08/31/13 | 10.85 | (0.08 | ) | 2.56 | 2.48 | (1.13 | ) | 12.20 | 25.31 | 540,979 | 1.32 | 1.33 | (0.72 | ) | 70 | |||||||||||||||||||||||||||||||||
Year ended 08/31/12 | 10.56 | (0.08 | ) | 1.47 | 1.39 | (1.10 | ) | 10.85 | 14.33 | 607,073 | 1.38 | 1.43 | (0.80 | ) | 78 | |||||||||||||||||||||||||||||||||
Year ended 08/31/11 | 8.74 | (0.11 | ) | 1.93 | 1.82 | — | 10.56 | 20.82 | 820,988 | 1.38 | 1.42 | (1.01 | ) | 114 | ||||||||||||||||||||||||||||||||||
Class B |
| |||||||||||||||||||||||||||||||||||||||||||||||
Year ended 08/31/15 | 10.75 | (0.08 | ) | 0.54 | 0.46 | (1.75 | ) | 9.46 | 5.19 | (f) | 7,715 | 1.32 | (e)(f) | 1.32 | (e)(f) | (0.85 | )(e)(f) | 63 | ||||||||||||||||||||||||||||||
Year ended 08/31/14 | 11.25 | (0.09 | ) | 1.48 | 1.39 | (1.89 | ) | 10.75 | 13.11 | (f) | 10,216 | 1.32 | (f) | 1.32 | (f) | (0.85 | )(f) | 79 | ||||||||||||||||||||||||||||||
Year ended 08/31/13 | 10.09 | (0.07 | ) | 2.36 | 2.29 | (1.13 | ) | 11.25 | 25.34 | (f) | 12,554 | 1.32 | (f) | 1.33 | (f) | (0.72 | )(f) | 70 | ||||||||||||||||||||||||||||||
Year ended 08/31/12 | 9.89 | (0.08 | ) | 1.38 | 1.30 | (1.10 | ) | 10.09 | 14.40 | (f) | 13,754 | 1.38 | (f) | 1.43 | (f) | (0.80 | )(f) | 78 | ||||||||||||||||||||||||||||||
Year ended 08/31/11 | 8.18 | (0.11 | ) | 1.82 | 1.71 | — | 9.89 | 20.90 | (f) | 16,910 | 1.40 | (f) | 1.44 | (f) | (1.03 | )(f) | 114 | |||||||||||||||||||||||||||||||
Class C |
| |||||||||||||||||||||||||||||||||||||||||||||||
Year ended 08/31/15 | 10.19 | (0.15 | ) | 0.52 | 0.37 | (1.75 | ) | 8.81 | 4.50 | (g) | 62,773 | 2.07 | (e) | 2.07 | (e) | (1.60 | )(e) | 63 | ||||||||||||||||||||||||||||||
Year ended 08/31/14 | 10.83 | (0.17 | ) | 1.42 | 1.25 | (1.89 | ) | 10.19 | 12.21 | 55,961 | 2.07 | 2.07 | (1.60 | ) | 79 | |||||||||||||||||||||||||||||||||
Year ended 08/31/13 | 9.82 | (0.15 | ) | 2.29 | 2.14 | (1.13 | ) | 10.83 | 24.43 | 53,560 | 2.07 | 2.08 | (1.47 | ) | 70 | |||||||||||||||||||||||||||||||||
Year ended 08/31/12 | 9.73 | (0.15 | ) | 1.34 | 1.19 | (1.10 | ) | 9.82 | 13.43 | 48,486 | 2.13 | 2.18 | (1.55 | ) | 78 | |||||||||||||||||||||||||||||||||
Year ended 08/31/11 | 8.10 | (0.17 | ) | 1.80 | 1.63 | — | 9.73 | 20.12 | (g) | 51,212 | 2.06 | (g) | 2.10 | (g) | (1.69 | )(g) | 114 | |||||||||||||||||||||||||||||||
Class Y |
| |||||||||||||||||||||||||||||||||||||||||||||||
Year ended 08/31/15 | 12.20 | (0.07 | ) | 0.64 | 0.57 | (1.75 | ) | 11.02 | 5.51 | 97,497 | 1.07 | (e) | 1.07 | (e) | (0.60 | )(e) | 63 | |||||||||||||||||||||||||||||||
Year ended 08/31/14 | 12.50 | (0.07 | ) | 1.66 | 1.59 | (1.89 | ) | 12.20 | 13.42 | 114,973 | 1.07 | 1.07 | (0.60 | ) | 79 | |||||||||||||||||||||||||||||||||
Year ended 08/31/13 | 11.06 | (0.05 | ) | 2.62 | 2.57 | (1.13 | ) | 12.50 | 25.67 | 163,072 | 1.07 | 1.08 | (0.47 | ) | 70 | |||||||||||||||||||||||||||||||||
Year ended 08/31/12 | 10.72 | (0.06 | ) | 1.50 | 1.44 | (1.10 | ) | 11.06 | 14.60 | 206,367 | 1.13 | 1.18 | (0.55 | ) | 78 | |||||||||||||||||||||||||||||||||
Year ended 08/31/11 | 8.84 | (0.09 | ) | 1.97 | 1.88 | — | 10.72 | 21.27 | 233,467 | 1.13 | 1.17 | (0.76 | ) | 114 | ||||||||||||||||||||||||||||||||||
Class R5 |
| |||||||||||||||||||||||||||||||||||||||||||||||
Year ended 08/31/15 | 12.23 | (0.05 | ) | 0.65 | 0.60 | (1.75 | ) | 11.08 | 5.77 | 6,784 | 0.94 | (e) | 0.94 | (e) | (0.47 | )(e) | 63 | |||||||||||||||||||||||||||||||
Year ended 08/31/14 | 12.52 | (0.05 | ) | 1.65 | 1.60 | (1.89 | ) | 12.23 | 13.49 | 45,126 | 0.94 | 0.94 | (0.47 | ) | 79 | |||||||||||||||||||||||||||||||||
Year ended 08/31/13(h) | 11.48 | (0.04 | ) | 2.21 | 2.17 | (1.13 | ) | 12.52 | 21.25 | 44,037 | 0.93 | (i) | 0.94 | (i) | (0.33 | )(i) | 70 | |||||||||||||||||||||||||||||||
Class R6 |
| |||||||||||||||||||||||||||||||||||||||||||||||
Year ended 08/31/15 | 12.25 | (0.04 | ) | 0.63 | 0.59 | (1.75 | ) | 11.09 | 5.66 | 76,687 | 0.85 | (e) | 0.85 | (e) | (0.38 | )(e) | 63 | |||||||||||||||||||||||||||||||
Year ended 08/31/14 | 12.52 | (0.04 | ) | 1.66 | 1.62 | (1.89 | ) | 12.25 | 13.67 | 109,145 | 0.84 | 0.84 | (0.37 | ) | 79 | |||||||||||||||||||||||||||||||||
Year ended 08/31/13(h) | 11.48 | (0.03 | ) | 2.20 | 2.17 | (1.13 | ) | 12.52 | 21.25 | 68,425 | 0.83 | (i) | 0.84 | (i) | (0.23 | )(i) | 70 | |||||||||||||||||||||||||||||||
| (a) | Calculated using average shares outstanding. |
| (b) | Includes redemption fees added to shares of beneficial interest which were less than $0.005 per share for fiscal years ended prior to August 31, 2013. |
| (c) | Includes adjustments in accordance with accounting principles generally accepted in the United States of America and as such, the net asset value for financial reporting purposes and the returns based upon those net asset values may differ from the net asset value and returns for shareholder transactions. Does not include sales charges and is not annualized for periods less than one year, if applicable. |
| (d) | Portfolio turnover is calculated at the fund level and is not annualized for periods less than one year, if applicable. |
| (e) | Ratios are based on average daily net assets (000’s omitted) of $521,373, $9,229, $59,425, $107,154, $25,485 and $82,409 for Class A, Class B, Class C, Class Y, Class R5 and Class R6 shares, respectively. |
| (f) | The total return, ratio of expenses to average net assets and ratio of net investment income (loss) to average net assets reflect actual 12b-1 fees of 0.25%, 0.25%, 0.25%, 0.25% and 0.27% for the years ended August 31, 2015, August 31, 2014, August 31, 2013, August 31, 2012, and August 31, 2011 respectively. |
| (g) | The total return, ratio of expenses to average net assets and ratio of net investment income (loss) to average net assets reflect actual 12b-1 fees of 0.93% for the year ended August 31, 2011. |
| (h) | Commencement date of September 24, 2012 for Class R5 and Class R6 shares, respectively. |
| (i) | Annualized. |
20 Invesco Small Cap Discovery Fund
Report of Independent Registered Public Accounting Firm
To the Board of Trustees of AIM Counselor Series Trust (Invesco Counselor Series Trust)
and Shareholders of Invesco Small Cap Discovery Fund:
In our opinion, the accompanying statement of assets and liabilities, including the schedule of investments, and the related statements of operations and of changes in net assets and the financial highlights present fairly, in all material respects, the financial position of Invesco Small Cap Discovery Fund (one of the funds constituting AIM Counselor Series Trust (Invesco Counselor Series Trust), hereafter referred to as the “Fund”) at August 31, 2015, the results of its operations for the year then ended, the changes in its net assets for each of the two years in the period then ended and the financial highlights for each of the five years in the period then ended, in conformity with accounting principles generally accepted in the United States of America. These financial statements and financial highlights (hereafter referred to as “financial statements”) are the responsibility of the Fund’s management. Our responsibility is to express an opinion on these financial statements based on our audits. We conducted our audits of these financial statements in accordance with the standards of the Public Company Accounting Oversight Board (United States). Those standards require that we plan and perform the audit to obtain reasonable assurance about whether the financial statements are free of material misstatement. An audit includes examining, on a test basis, evidence supporting the amounts and disclosures in the financial statements, assessing the accounting principles used and significant estimates made by management, and evaluating the overall financial statement presentation. We believe that our audits, which included confirmation of securities at August 31, 2015 by correspondence with the custodian and brokers, and the application of alternative auditing procedures where confirmations of security purchases have not been received, provide a reasonable basis for our opinion.
PRICEWATERHOUSECOOPERS LLP
October 27, 2015
Houston, Texas
21 Invesco Small Cap Discovery Fund
Calculating your ongoing Fund expenses
Example
As a shareholder of the Fund, you incur two types of costs: (1) transaction costs, which may include sales charges (loads) on purchase payments or contingent deferred sales charges on redemptions, if any; and (2) ongoing costs, including management fees, distribution and/or service (12b-1) fees, and other Fund expenses. This example is intended to help you understand your ongoing costs (in dollars) of investing in the Fund and to compare these costs with ongoing costs of investing in other mutual funds. The example is based on an investment of $1,000 invested at the beginning of the period and held for the entire period March 1, 2015 through August 31, 2015.
Actual expenses
The table below provides information about actual account values and actual expenses. You may use the information in this table, together with the amount you invested, to estimate the expenses that you paid over the period. Simply divide your account value by $1,000 (for example, an $8,600 account value divided by $1,000 = 8.6), then multiply the result by the number in the table under the heading entitled “Actual Expenses Paid During Period” to estimate the expenses you paid on your account during this period.
Hypothetical example for comparison purposes
The table below also provides information about hypothetical account values and hypothetical expenses based on the Fund’s actual expense ratio and an assumed rate of return of 5% per year before expenses, which is not the Fund’s actual return.
The hypothetical account values and expenses may not be used to estimate the actual ending account balance or expenses you paid for the period. You may use this information to compare the ongoing costs of investing in the Fund and other funds. To do so, compare this 5% hypothetical example with the 5% hypothetical examples that appear in the shareholder reports of the other funds.
Please note that the expenses shown in the table are meant to highlight your ongoing costs only and do not reflect any transaction costs, such as sales charges (loads) on purchase payments or contingent deferred sales charges on redemptions, if any. Therefore, the hypothetical information is useful in comparing ongoing costs only, and will not help you determine the relative total costs of owning different funds. In addition, if these transaction costs were included, your costs would have been higher.
Class | Beginning | ACTUAL | HYPOTHETICAL (5% annual return before | Annualized | ||||||||||||||||||||
| Ending Account Value (08/31/15)1 | Expenses Paid During Period2 | Ending Account Value (08/31/15) | Expenses Paid During Period2 | |||||||||||||||||||||
| A | $ | 1,000.00 | $ | 953.20 | $ | 6.40 | $ | 1,018.65 | $ | 6.61 | 1.30 | % | ||||||||||||
| B | 1,000.00 | 952.70 | 6.40 | 1,018.65 | 6.61 | 1.30 | ||||||||||||||||||
| C | 1,000.00 | 949.40 | 10.22 | 1,014.72 | 10.56 | 2.08 | ||||||||||||||||||
| Y | 1,000.00 | 954.90 | 5.17 | 1,019.92 | 5.34 | 1.05 | ||||||||||||||||||
| R5 | 1,000.00 | 956.00 | 4.44 | 1,020.67 | 4.58 | 0.90 | ||||||||||||||||||
| R6 | 1,000.00 | 954.40 | 4.19 | 1,020.92 | 4.33 | 0.85 | ||||||||||||||||||
| 1 | The actual ending account value is based on the actual total return of the Fund for the period March 1, 2015 through August 31, 2015, after actual expenses and will differ from the hypothetical ending account value which is based on the Fund’s expense ratio and a hypothetical annual return of 5% before expenses. |
| 2 | Expenses are equal to the Fund’s annualized expense ratio as indicated above multiplied by the average account value over the period, multiplied by 184/365 to reflect the most recent fiscal half year. |
22 Invesco Small Cap Discovery Fund
Approval of Investment Advisory and Sub-Advisory Contracts
The Board of Trustees (the Board) of AIM Counselor Series Trust (Invesco Counselor Series Trust) is required under the Investment Company Act of 1940, as amended, to approve annually the renewal of Invesco Small Cap Discovery Fund’s (the Fund) investment advisory agreements. During contract renewal meetings held on June 9-10, 2015, the Board as a whole, and the disinterested or “independent” Trustees, who comprise over 75% of the Board, voting separately, approved the continuance for the Fund of the Master Investment Advisory Agreement with Invesco Advisers, Inc. (Invesco Advisers and the investment advisory agreement) and the Master Intergroup Sub-Advisory Contract for Mutual Funds with Invesco Asset Management Deutschland GmbH, Invesco Asset Management Limited, Invesco Asset Management (Japan) Limited, Invesco Hong Kong Limited, Invesco Senior Secured Management, Inc. and Invesco Canada Ltd. (collectively, the Affiliated Sub-Advisers and the sub-advisory contracts) for another year, effective July 1, 2015.
In evaluating the fairness and reasonableness of compensation under the Fund’s investment advisory agreement and sub-advisory contracts, the Board considered, among other things, the factors discussed below. The Board determined that continuation of the Fund’s investment advisory agreement and the sub-advisory contracts is in the best interest of the Fund and its shareholders and that the compensation payable to Invesco Advisers and the Affiliated Sub-Advisers under the agreements is fair and reasonable.
The Board’s Fund Evaluation Process
The Board’s Investments Committee has established three Sub-Committees, each of which is primarily responsible for overseeing the performance and investment management services provided by Invesco Advisers and the Affiliated Sub-Advisers to a number of the funds advised by Invesco Advisers (the Invesco Funds). The Sub-Committees meet throughout the year to review the performance of their assigned Invesco Funds, including reviewing materials prepared under the direction of the independent Senior Officer, an officer of the Invesco Funds who reports directly to the independent Trustees. Over the course of each year, the Sub-Committees meet with portfolio managers for their assigned Invesco Funds and other members of management to review the performance, investment objective(s), policies, strategies, limitations and investment risks of these funds. The Board had the benefit of reports from the Sub-Committees and Investments Committee throughout the year in considering approval of the continuance of each Invesco Fund’s investment advisory agreement and sub-advisory contracts for another year.
During the contract renewal process, the Board receives comparative performance and fee data regarding the Invesco Funds prepared by Invesco Advisers and Lipper Inc. (Lipper), an independent provider of investment company data. The Board also receives a report and this independent written evaluation from the Senior Officer. The Senior Officer’s evaluation is prepared as part of his responsibility to manage the process by which the Invesco Funds’ proposed management fees are negotiated during the annual contract renewal process to ensure they are negotiated in a manner that is at arms’ length and reasonable. In addition to meetings with Invesco Advisers and fund counsel, the independent Trustees also discuss the continuance of the investment advisory agreement and sub-advisory contracts in separate sessions with the Senior Officer and with independent legal counsel.
The Trustees recognized that the advisory fee rates for the Invesco Funds are, in many cases, the result of years of review and negotiation. The Trustees’ deliberations and conclusions in a particular year may be based in part on their deliberations and conclusions regarding these arrangements throughout the year and in prior years. The Trustees’ review and conclusions are based on the comprehensive consideration of all information presented to them and are not the result of any single determinative factor. Moreover, one Trustee may have weighed a particular piece of information or factor differently than another Trustee.
The discussion below is a summary of the Senior Officer’s independent written evaluation with respect to the Fund’s investment advisory agreement as well as a discussion of the material factors and related conclusions that formed the basis for the Board’s approval of the Fund’s investment advisory agreement and sub-advisory contracts. Unless otherwise stated, this information is current as of June 10, 2015, and does not reflect consideration of factors that became known to the Board after that date.
Factors and Conclusions and Summary of Independent Written Fee Evaluation
| A. | Nature, Extent and Quality of Services Provided by Invesco Advisers and the Affiliated Sub-Advisers |
The Board reviewed the advisory services provided to the Fund by Invesco Advisers under the Fund’s investment advisory agreement, the performance of Invesco Advisers in providing these services, and the credentials and experience of the officers and employees of Invesco Advisers who provide these services, including the Fund’s portfolio manager or managers. The Board’s review of the qualifications of Invesco Advisers to provide advisory services included the Board’s consideration of Invesco Advisers’ investment
process oversight, independent credit analysis and investment risk management. The Board also considered non-advisory services that Invesco Advisers and its affiliates provide to the Invesco Funds such as various back office support functions, equity and fixed income trading operations, internal audit, distribution, valuation and legal and compliance.
In determining whether to continue the Fund’s investment advisory agreement, the Board considered the benefits of reapproving an existing relationship and the greater uncertainty that may be associated with entering into a new relationship. The Board concluded that the nature, extent and quality of the services provided to the Fund by Invesco Advisers are appropriate and satisfactory and consistent with the terms of the Fund’s investment advisory agreement.
The Board reviewed the services that may be provided by the Affiliated Sub-Advisers under the sub-advisory contracts and the credentials and experience of the officers and employees of the Affiliated Sub-Advisers who provide these services. The Board noted that the Affiliated Sub-Advisers have offices and personnel that are located in financial centers around the world. As a result, the Affiliated Sub-Advisers can provide research and investment analysis on the markets and economies of various countries in which the Fund may invest, make recommendations regarding securities and assist with security trades. The Board concluded that the sub-advisory contracts benefit the Fund and its shareholders by permitting Invesco Advisers to use the resources and talents of the Affiliated Sub-Advisers in managing the Fund. The Board concluded that the nature, extent and quality of the services that may be provided by the Affiliated Sub-Advisers are appropriate and satisfactory and consistent with the terms of the Fund’s sub-advisory contracts.
| B. | Fund Performance |
The Board considered Fund performance as a relevant factor in considering whether to approve the investment advisory agreement. The Board did not view Fund performance as a relevant factor in considering whether to approve the sub-advisory contracts for the Fund, as no Affiliated Sub-Adviser currently manages assets of the Fund.
The Board compared the Fund’s performance during the past one, three and five calendar years to the performance of funds in the Lipper performance universe and against the Lipper Small-Cap Growth Funds Index. The Board noted that performance of Class A shares of the Fund was in the third quintile of its performance universe for the one and three year periods and the fourth quintile for the five year period (the first quintile being the best performing funds and the fifth quintile being the worst performing funds). The Board noted that performance of Class A shares of the Fund was above the
23 Invesco Small Cap Discovery Fund
performance of the Index for the one year period, at the same level as the performance of the Index for the three year period and below the performance of the Index for the five year period. Invesco Advisers noted that the Fund has a quality bias and performed as expected in a low quality market environment. The Trustees also reviewed more recent Fund performance and this review did not change their conclusions.
| C. | Advisory and Sub-Advisory Fees |
The Board compared the Fund’s contractual management fee rate to the contractual management fee rates of funds in the Fund’s Lipper expense group at a common asset level. The Board noted that the contractual management fee rate for Class A shares of the Fund was below the median contractual management fee rate of funds in its expense group. The Board noted that the term “contractual management fee” may include both advisory and certain administrative services fees, but that Lipper does not provide information on a fund by fund basis as to what is included. The Board noted that Invesco Advisers does not charge the Invesco Funds for the administrative services included in the term as defined by Lipper. The Board also reviewed the methodology used by Lipper in providing expense group information, which includes using each fund’s contractual management fee schedule (including any applicable breakpoints) as reported in the most recent prospectus or statement of additional information for each fund in the expense group.
The Board also noted how the Fund’s rate compared to the effective sub-adviser fee rate of one other mutual fund sub-advised by Invesco Advisers. The Board noted that Invesco Advisers and the Affiliated Sub-Advisers do not manage other client accounts with investment strategies comparable to those of the Fund.
The Board also considered the services that may be provided by the Affiliated Sub-Advisers pursuant to the sub-advisory contracts, as well as the fees payable by Invesco Advisers to the Affiliated Sub-Advisers pursuant to the sub-advisory contracts. The Board also noted that the sub-advisory fees are not paid directly by the Fund, but rather, are payable by Invesco Advisers to the Affiliated Sub-Advisers.
| D. | Economies of Scale and Breakpoints |
The Board considered the extent to which there are economies of scale in the provision of advisory services to the Fund. The Board also considered whether the Fund benefits from economies of scale through contractual breakpoints in the Fund’s advisory fee schedule. The Board also noted that the Fund shares directly in economies of scale through lower fees charged by third party service providers based on the combined size of the Invesco Funds and other clients advised by Invesco Advisers.
| E. | Profitability and Financial Resources |
The Board reviewed information from Invesco Advisers concerning the costs of the advisory and other services that Invesco Advisers and its
affiliates provide to the Fund and the Invesco Funds and the profitability of Invesco Advisers and its affiliates in providing these services. The Board received information from Invesco Advisers about the methodology used to prepare the profitability information. The Board noted that Invesco Advisers continues to operate at a net profit from services Invesco Advisers and its affiliates provide to the Invesco Funds and the Fund. The Board did not deem the level of profits realized by Invesco Advisers and its affiliates from providing services to the Fund to be excessive given the nature, quality and extent of the services provided. The Board received and accepted information from Invesco Advisers demonstrating that Invesco Advisers and each Affiliated Sub-Adviser are financially sound and have the resources necessary to perform their obligations under the investment advisory agreement and sub-advisory contracts.
| F. | Collateral Benefits to Invesco Advisers and its Affiliates |
The Board considered various other benefits received by Invesco Advisers and its affiliates from the relationship with the Fund, including the fees received for providing transfer agency and distribution services to the Fund. The Board considered comparative information regarding fees charged for these services, including information provided by Lipper and other independent sources. The Board considered the performance of Invesco Advisers and its affiliates in providing these services and the organizational structure employed to provide these services. The Board also considered that these services are provided to the Fund pursuant to written contracts that are reviewed and approved on an annual basis by the Board; and that the services are required for the operation of the Fund.
The Board considered the benefits realized by Invesco Advisers and the Affiliated Sub-Advisers as a result of portfolio brokerage transactions executed through “soft dollar” arrangements. The Board noted that soft dollar arrangements shift the payment obligation for research services from Invesco Advisers and the Affiliated Sub-Advisers to the Invesco Funds and that the research received may be used with other clients of Invesco Advisers and may reduce Invesco Advisers’ and the Affiliated Sub-Advisers’ expenses. The Board also considered that it receives periodic reports from the Chief Compliance Officer of the Invesco Funds demonstrating that these arrangements are consistent with regulatory requirements. The Board did not deem the soft dollar arrangements to be inappropriate.
The Board considered that the Fund’s uninvested cash and cash collateral from any securities lending arrangements may be invested in money market funds advised by Invesco Advisers pursuant to procedures approved by the Board. The Board noted that Invesco Advisers receives advisory fees from these affiliated money market funds attributable to such investments, although Invesco Advisers has contractually agreed to
waive through varying periods the advisory fees payable by the Invesco Funds with respect to investments in the affiliated money market funds. The waiver is in an amount equal to 100% of the net advisory fee Invesco Advisers receives from the affiliated money market funds with respect to the Fund’s investment in the affiliated money market funds of uninvested cash, but not cash collateral. The Board concluded that the amount of advisory fees received by Invesco Advisors from the Fund’s investment of cash collateral from any securities lending arrangements in the affiliated money market funds is fair and reasonable.
The Board also considered the Fund may use an affiliated broker to execute certain trades for the Fund to, among other things, control information leakage, and were advised that such trades would be executed in compliance with rules under the Investment Company Act of 1940, as amended, and consistent with best execution obligations.
24 Invesco Small Cap Discovery Fund
Tax Information
Form 1099-DIV, Form 1042-S and other year–end tax information provide shareholders with actual calendar year amounts that should be included in their tax returns. Shareholders should consult their tax advisors.
The following distribution information is being provided as required by the Internal Revenue Code or to meet a specific state’s requirement.
The Fund designates the following amounts or, if subsequently determined to be different, the maximum amount allowable for its fiscal year ended August 31, 2015:
Federal and State Income Tax | ||||
Long-Term Capital Gain Distributions | $ | 120,555,059 | ||
Qualified Dividend Income* | 0.00 | % | ||
Corporate Dividends Received Deduction* | 0.00 | % | ||
U.S. Treasury Obligations* | 0.00 | % | ||
| * | The above percentages are based on ordinary income dividends paid to shareholders during the Fund’s fiscal year. |
25 Invesco Small Cap Discovery Fund
Trustees and Officers
The address of each trustee and officer is AIM Counselor Series Trust (Invesco Counselor Series Trust) (the “Trust”), 11 Greenway Plaza, Suite 1000, Houston, Texas 77046-1173. The trustees serve for the life of the Trust, subject to their earlier death, incapacitation, resignation, retirement or removal as more specifically provided in the Trust’s organizational documents. Each officer serves for a one year term or until their successors are elected and qualified. Column two below includes length of time served with predecessor entities, if any.
| Name, Year of Birth and Position(s) Held with the Trust | Trustee and/ or Officer Since | Principal Occupation(s) During Past 5 Years | Number of Funds in Fund Complex Overseen by Trustee | Other Directorship(s) Held by Trustee During Past 5 Years | ||||
| Interested Persons | ||||||||
| Martin L. Flanagan1 — 1960 Trustee | 2007 | Executive Director, Chief Executive Officer and President, Invesco Ltd. (ultimate parent of Invesco and a global investment management firm); Advisor to the Board, Invesco Advisers, Inc. (formerly known as Invesco Institutional (N.A.), Inc.); Trustee, The Invesco Funds; Vice Chair, Investment Company Institute; and Member of Executive Board, SMU Cox School of Business
Formerly: Chairman and Chief Executive Officer, Invesco Advisers, Inc. (registered investment adviser); Director, Chairman, Chief Executive Officer and President, IVZ Inc. (holding company), INVESCO Group Services, Inc. (service provider) and Invesco North American Holdings, Inc. (holding company); Director, Chief Executive Officer and President, Invesco Holding Company Limited (parent of Invesco and a global investment management firm); Director, Invesco Ltd.; Chairman, Investment Company Institute and President, Co-Chief Executive Officer, Co-President, Chief Operating Officer and Chief Financial Officer, Franklin Resources, Inc. (global investment management organization). | 144 | None | ||||
| Philip A. Taylor2 — 1954 Trustee, President and Principal Executive Officer | 2006 | Head of North American Retail and Senior Managing Director, Invesco Ltd.; Director, Co-Chairman, Co-President and Co-Chief Executive Officer, Invesco Advisers, Inc. (formerly known as Invesco Institutional (N.A.), Inc.) (registered investment adviser); Director, Chairman, Chief Executive Officer and President, Invesco Management Group, Inc. (formerly known as Invesco Aim Management Group, Inc.) (financial services holding company); Director and President, INVESCO Funds Group, Inc. (registered investment adviser and registered transfer agent); Director and Chairman, Invesco Investment Services, Inc. (formerly known as Invesco Aim Investment Services, Inc.) (registered transfer agent) and IVZ Distributors, Inc. (formerly known as INVESCO Distributors, Inc.) (registered broker dealer); Director, President and Chairman, Invesco Inc. (holding company), Invesco Canada Holdings Inc. (holding company), Trimark Investments Ltd./Placements Trimark Ltèe and Invesco Financial Services Ltd/Services Financiers Invesco Ltèe; Chief Executive Officer, Invesco Corporate Class Inc. (corporate mutual fund company) Director, Chairman and Chief Executive Officer, Invesco Canada Ltd. (formerly known as Invesco Trimark Ltd./Invesco Trimark Ltèe) (registered investment adviser and registered transfer agent); Trustee, President and Principal Executive Officer, The Invesco Funds (other than AIM Treasurer’s Series Trust (Invesco Treasurer’s Series Trust), Short-Term Investments Trust and Invesco Management Trust); Trustee and Executive Vice President, The Invesco Funds (AIM Treasurer’s Series Trust (Invesco Treasurer’s Series Trust), Short-Term Investments Trust and Invesco Management Trust only); Director, Invesco Investment Advisers LLC (formerly known as Van Kampen Asset Management); Director, Chief Executive Officer and President, Van Kampen Exchange Corp.
Formerly: Chief Executive Officer, Invesco Canada Fund Inc (corporate mutual fund company); Director and Chairman, Van Kampen Investor Services Inc.; Director, Chief Executive Officer and President, 1371 Preferred Inc. (holding company) and Van Kampen Investments Inc.; Director and President, AIM GP Canada Inc. (general partner for limited partnerships) and Van Kampen Advisors, Inc.; Director and Chief Executive Officer, Invesco Trimark Dealer Inc. (registered broker dealer); Director, Invesco Distributors, Inc. (formerly known as Invesco Aim Distributors, Inc.) (registered broker dealer); Manager, Invesco PowerShares Capital Management LLC; Director, Chief Executive Officer and President, Invesco Advisers, Inc.; Director, Chairman, Chief Executive Officer and President, Invesco Aim Capital Management, Inc.; President, Invesco Trimark Dealer Inc. and Invesco Trimark Ltd./Invesco Trimark Ltèe; Director and President, AIM Trimark Corporate Class Inc. and AIM Trimark Canada Fund Inc.; Senior Managing Director, Invesco Holding Company Limited; Director and Chairman, Fund Management Company (former registered broker dealer); President and Principal Executive Officer, The Invesco Funds (AIM Treasurer’s Series Trust (Invesco Treasurer’s Series Trust), and Short-Term Investments Trust only); President, AIM Trimark Global Fund Inc. and AIM Trimark Canada Fund Inc.. | 144 | None |
| 1 | Mr. Flanagan is considered an interested person (within the meaning of Section 2(a)(19) of the 1940 Act) of the Trust because he is an officer of the Adviser to the Trust, and an officer and a director of Invesco Ltd., ultimate parent of the Adviser. |
| 2 | Mr. Taylor is considered an interested person (within the meaning of Section 2(a)(19) of the 1940 Act) of the Trust because he is an officer and a director of the Adviser. |
T-1 Invesco Small Cap Discovery Fund
Trustees and Officers—(continued)
| Name, Year of Birth and Position(s) Held with the Trust | Trustee and/ or Officer Since | Principal Occupation(s) During Past 5 Years | Number of Funds in Fund Complex Overseen by Trustee | Other Directorship(s) Held by Trustee During Past 5 Years | ||||
| Independent Trustees | ||||||||
Bruce L. Crockett — 1944 Trustee and Chair | 2003 | Chairman, Crockett Technologies Associates (technology consulting company)
Formerly: Director, Captaris (unified messaging provider); Director, President and Chief Executive Officer, COMSAT Corporation; Chairman, Board of Governors of INTELSAT (international communications company); ACE Limited (insurance company); Independent Directors Council and Investment Company Institute | 144 | ALPS (Attorneys Liability Protection Society) (insurance company) and Globe Specialty Metals, Inc. (metallurgical company) | ||||
David C. Arch — 1945 Trustee | 2010 | Chairman of Blistex Inc., a consumer health care products manufacturer | 144 | Board member of the Illinois Manufacturers’ Association; Member of the Board of Visitors, Institute for the Humanities, University of Michigan; Member of the Audit Committee of the Edward-Elmhurst Hospital | ||||
James T. Bunch — 1942 Trustee | 2000 | Managing Member, Grumman Hill Group LLC (family office/private equity investments)
Formerly: Founder, Green Manning & Bunch Ltd. (investment banking firm) (1988-2010); Executive Committee, United States Golf Association; and Chairman, Board of Governors, Western Golf Association | 144 | Chairman of the Board of Trustees, Evans Scholars Foundation; and Chairman of the Board, Denver Film Society | ||||
Rodney F. Dammeyer — 1940 Trustee | 2010 | Chairman of CAC, LLC, (private company offering capital investment and management advisory services)
Formerly: Prior to 2001, Managing Partner at Equity Group Corporate Investments; Prior to 1995, Chief Executive Officer of Itel Corporation (formerly Anixter International); Prior to 1985, experience includes Senior Vice President and Chief Financial Officer of Household International, Inc., Executive Vice President and Chief Financial Officer of Northwest Industries, Inc. and Partner of Arthur Andersen & Co.; From 1987 to 2010, Director/Trustee of investment companies in the Van Kampen Funds complex | 144 | Director of Quidel Corporation and Stericycle, Inc. | ||||
Albert R. Dowden — 1941 Trustee | 2003 | Director of a number of public and private business corporations, including the Boss Group, Ltd. (private investment and management); Nature’s Sunshine Products, Inc. and Reich & Tang Funds (5 portfolios) (registered investment company)
Formerly: Director, Homeowners of America Holding Corporation/Homeowners of America Insurance Company (property casualty company); Director, Continental Energy Services, LLC (oil and gas pipeline service); Director, CompuDyne Corporation (provider of product and services to the public security market) and Director, Annuity and Life Re (Holdings), Ltd. (reinsurance company); Director, President and Chief Executive Officer, Volvo Group North America, Inc.; Senior Vice President, AB Volvo; Director of various public and private corporations; Chairman, DHJ Media, Inc.; Director, Magellan Insurance Company; and Director, The Hertz Corporation, Genmar Corporation (boat manufacturer), National Media Corporation; Advisory Board of Rotary Power International (designer, manufacturer, and seller of rotary power engines); and Chairman, Cortland Trust, Inc. (registered investment company) | 144 | Director of: Nature’s Sunshine Products, Inc., Reich & Tang Funds, Homeowners of America Holding Corporation/ Homeowners of America Insurance Company, the Boss Group | ||||
Jack M. Fields — 1952 Trustee | 2003 | Chief Executive Officer, Twenty First Century Group, Inc. (government affairs company); Owner and Chief Executive Officer, Dos Angeles Ranch, L.P. (cattle, hunting, corporate entertainment); and Discovery Global Education Fund (non-profit)
Formerly: Chief Executive Officer, Texana Timber LP (sustainable forestry company); Director of Cross Timbers Quail Research Ranch (non-profit); and member of the U.S. House of Representatives | 144 | Insperity, Inc. (formerly known as Administaff) | ||||
Prema Mathai-Davis — 1950 Trustee | 2003 | Retired. Formerly: Chief Executive Officer, YWCA of the U.S.A. | 144 | None | ||||
Larry Soll — 1942 Trustee | 1997 | Retired. Formerly: Chairman, Chief Executive Officer and President, Synergen Corp. (a biotechnology company) | 144 | None | ||||
Hugo F. Sonnenschein — 1940 Trustee | 2010 | President Emeritus and Honorary Trustee of the University of Chicago and the Adam Smith Distinguished Service Professor in the Department of Economics at the University of Chicago. Prior to 2000, President of the University of Chicago | 144 | Trustee of the University of Rochester and a member of its investment committee; Member of the National Academy of Sciences and the American Philosophical Society; Fellow of the American Academy of Arts and Sciences | ||||
| Raymond Stickel, Jr. — 1944 Trustee | 2005 | Retired. Formerly: Director, Mainstay VP Series Funds, Inc. (25 portfolios) and Partner, Deloitte & Touche | 144 | None |
T-2 Invesco Small Cap Discovery Fund
Trustees and Officers—(continued)
| Name, Year of Birth and Position(s) Held with the Trust | Trustee and/ or Officer Since | Principal Occupation(s) During Past 5 Years | Number of Funds in Fund Complex Overseen by Trustee | Other Directorship(s) Held by Trustee During Past 5 Years | ||||
| Independent Trustees—(continued) | ||||||||
Suzanne H. Woolsey — 1941 Trustee | 2014 | Chief Executive Officer of Woolsey Partners LLC | 144 | Emeritus Chair of the Board of Trustees of the Institute for Defense Analyses; Trustee of Colorado College; Trustee of California Institute of Technology; Prior to 2014, Director of Fluor Corp.; Prior to 2010, Trustee of the German Marshall Fund of the United States; Prior to 2010 Trustee of the Rocky Mountain Institute | ||||
| Other Officers | ||||||||
Russell C. Burk — 1958 Senior Vice President and Senior Officer | 2005 | Senior Vice President and Senior Officer, The Invesco Funds | N/A | N/A | ||||
John M. Zerr — 1962 Senior Vice President, Chief Legal Officer and Secretary | 2006 | Director, Senior Vice President, Secretary and General Counsel, Invesco Management Group, Inc. (formerly known as Invesco Aim Management Group, Inc.) and Van Kampen Exchange Corp.; Senior Vice President, Invesco Advisers, Inc. (formerly known as Invesco Institutional (N.A.), Inc.) (registered investment adviser); Senior Vice President and Secretary, Invesco Distributors, Inc. (formerly known as Invesco Aim Distributors, Inc.); Director, Vice President and Secretary, Invesco Investment Services, Inc. (formerly known as Invesco Aim Investment Services, Inc.) and IVZ Distributors, Inc. (formerly known as INVESCO Distributors, Inc.); Director and Vice President, INVESCO Funds Group, Inc.; Senior Vice President, Chief Legal Officer and Secretary, The Invesco Funds; Managing Director, Invesco PowerShares Capital Management LLC; Director, Secretary and General Counsel, Invesco Investment Advisers LLC (formerly known as Van Kampen Asset Management); Secretary and General Counsel, Invesco Capital Markets, Inc. (formerly known as Van Kampen Funds Inc.) and Chief Legal Officer, PowerShares Exchange-Traded Fund Trust, PowerShares Exchange-Traded Fund Trust II, PowerShares India Exchange-Traded Fund Trust, PowerShares Actively Managed Exchange-Traded Fund Trust, and PowerShares Actively Managed Exchange-Traded Commodity Fund Trust
Formerly: Director and Vice President, Van Kampen Advisors Inc.; Director, Vice President, Secretary and General Counsel, Van Kampen Investor Services Inc.; Director, Invesco Distributors, Inc. (formerly known as Invesco Aim Distributors, Inc.); Director, Senior Vice President, General Counsel and Secretary, Invesco Aim Advisers, Inc. and Van Kampen Investments Inc.; Director, Vice President and Secretary, Fund Management Company; Director, Senior Vice President, Secretary, General Counsel and Vice President, Invesco Aim Capital Management, Inc.; Chief Operating Officer and General Counsel, Liberty Ridge Capital, Inc. (an investment adviser); Vice President and Secretary, PBHG Funds (an investment company) and PBHG Insurance Series Fund (an investment company); Chief Operating Officer, General Counsel and Secretary, Old Mutual Investment Partners (a broker-dealer); General Counsel and Secretary, Old Mutual Fund Services (an administrator) and Old Mutual Shareholder Services (a shareholder servicing center); Executive Vice President, General Counsel and Secretary, Old Mutual Capital, Inc. (an investment adviser); and Vice President and Secretary, Old Mutual Advisors Funds (an investment company) | N/A | N/A | ||||
| Sheri Morris — 1964 Vice President, Treasurer and Principal Financial Officer | 2003 | Vice President, Treasurer and Principal Financial Officer, The Invesco Funds; Vice President, Invesco Advisers, Inc. (formerly known as Invesco Institutional (N.A.), Inc.) (registered investment adviser); and Vice President, PowerShares Exchange-Traded Fund Trust, PowerShares Exchange-Traded Fund Trust II, PowerShares India Exchange-Traded Fund Trust, PowerShares Actively Managed Exchange-Traded Fund Trust, and PowerShares Actively Managed Exchange-Traded Commodity Fund Trust
Formerly: Vice President, Invesco Aim Advisers, Inc., Invesco Aim Capital Management, Inc. and Invesco Aim Private Asset Management, Inc.; Assistant Vice President and Assistant Treasurer, The Invesco Funds and Assistant Vice President, Invesco Advisers, Inc., Invesco Aim Capital Management, Inc. and Invesco Aim Private Asset Management, Inc.; and Treasurer, PowerShares Exchange-Traded Fund Trust, PowerShares Exchange-Traded Fund Trust II, PowerShares India Exchange-Traded Fund Trust and PowerShares Actively Managed Exchange-Traded Fund Trust | N/A | N/A | ||||
T-3 Invesco Small Cap Discovery Fund
Trustees and Officers—(continued)
| Name, Year of Birth and Position(s) Held with the Trust | Trustee and/ or Officer Since | Principal Occupation(s) During Past 5 Years | Number of Funds in Fund Complex Overseen by Trustee | Other Directorship(s) Held by Trustee During Past 5 Years | ||||
| Other Officers—(continued) | ||||||||
| Karen Dunn Kelley — 1960 Vice President | 2003 | Senior Managing Director, Investments, Invesco Ltd.; Director, Co-President, Co-Chief Executive Officer, and Co-Chairman, Invesco Advisers, Inc. (formerly known as Invesco Institutional (N.A.), Inc.) (registered investment adviser); Chairman, Invesco Senior Secured Management, Inc.; Senior Vice President, Invesco Management Group, Inc. (formerly known as Invesco Aim Management Group, Inc.); Executive Vice President, Invesco Distributors, Inc. (formerly known as Invesco Aim Distributors, Inc.); Director, Invesco Mortgage Capital Inc. and Invesco Management Company Limited; Vice President, The Invesco Funds (other than AIM Treasurer’s Series Trust (Invesco Treasurer’s Series Trust), Short-Term Investments Trust and Invesco Management Trust); and President and Principal Executive Officer, The Invesco Funds (AIM Treasurer’s Series Trust (Invesco Treasurer’s Series Trust), Short-Term Investments Trust and Invesco Management Trust only)
Formerly: Director and President, INVESCO Asset Management (Bermuda) Ltd., Director, INVESCO Global Asset Management Limited and INVESCO Management S.A.; Senior Vice President, Van Kampen Investments Inc. and Invesco Advisers, Inc. (formerly known as Invesco Institutional (N.A.), Inc.) (registered investment adviser); Vice President, Invesco Advisers, Inc. (formerly known as Invesco Institutional (N.A.), Inc.); Director of Cash Management and Senior Vice President, Invesco Advisers, Inc. and Invesco Aim Capital Management, Inc.; Director and President, Fund Management Company; Chief Cash Management Officer, Director of Cash Management, Senior Vice President, and Managing Director, Invesco Aim Capital Management, Inc.; Director of Cash Management, Senior Vice President, and Vice President, Invesco Advisers, Inc. and The Invesco Funds (AIM Treasurer’s Series Trust (Invesco Treasurer’s Series Trust), and Short-Term Investments Trust only) | N/A | N/A | ||||
| Crissie M. Wisdom — 1969 Anti-Money Laundering Compliance Officer | 2013 | Anti-Money Laundering Compliance Officer, Invesco Advisers, Inc. (formerly known as Invesco Institutional (N.A.), Inc.) (registered investment adviser), Invesco Capital Markets, Inc. (formerly known as Van Kampen Funds Inc.), Invesco Distributors, Inc., Invesco Investment Services, Inc., Invesco Management Group, Inc., Van Kampen Exchange Corp., The Invesco Funds, and PowerShares Exchange-Traded Fund Trust, PowerShares Exchange-Traded Fund Trust II, PowerShares India Exchange-Traded Fund Trust, PowerShares Actively Managed Exchange-Traded Fund Trust and PowerShares Actively Managed Exchange-Traded Commodity Fund Trust; Anti-Money Laundering Compliance Officer and Bank Secrecy Act Officer, INVESCO National Trust Company and Invesco Trust Company; and Fraud Prevention Manager and Controls and Risk Analysis Manager for Invesco Investment Services, Inc.. | N/A | N/A | ||||
Lisa O. Brinkley — 1959 Chief Compliance Officer | 2004 | Senior Vice President and Chief Compliance Officer, Invesco Advisers, Inc. (registered investment adviser) (formerly known as Invesco Institutional (N.A., Inc.); and Chief Compliance Officer, The Invesco Funds
Formerly: Global Assurance Officer, Invesco Ltd. and Vice President, The Invesco Funds; Chief Compliance Officer, Invesco Distributors, Inc. (formerly known as Invesco Aim Distributors, Inc.), Invesco Investment Services, Inc.(formerly known as Invesco Aim Investment Services, Inc.) and Van Kampen Investor Services Inc.; Senior Vice President, Invesco Management Group, Inc.; Senior Vice President and Chief Compliance Officer, Invesco Advisers, Inc. and The Invesco Funds; Vice President and Chief Compliance Officer, Invesco Aim Capital Management, Inc. and Invesco Distributors, Inc.; Vice President, Invesco Investment Services, Inc. and Fund Management Company. | N/A | N/A |
The Statement of Additional Information of the Trust includes additional information about the Fund’s Trustees and is available upon request, without charge, by calling 1.800.959.4246. Please refer to the Fund’s prospectus for information on the Fund’s sub-advisers.
Office of the Fund 11 Greenway Plaza, Suite 1000 Houston, TX 77046-1173 | Investment Adviser Invesco Advisers, Inc. 1555 Peachtree Street, N.E. Atlanta, GA 30309 | Distributor Invesco Distributors, Inc. 11 Greenway Plaza, Suite 1000 Houston, TX 77046-1173 | Auditors PricewaterhouseCoopers LLP 1000 Louisiana Street, Suite 5800 Houston, TX 77002-5678 | |||
Counsel to the Fund Stradley Ronon Stevens & Young, LLP 2005 Market Street, Suite 2600 Philadelphia, PA 19103-7018 | Counsel to the Independent Trustees Goodwin Procter LLP 901 New York Avenue, N.W. Washington, D.C. 20001 | Transfer Agent Invesco Investment Services, Inc. 11 Greenway Plaza, Suite 1000 Houston, TX 77046-1173 | Custodian State Street Bank and Trust Company 225 Franklin Street Boston, MA 02110-2801 | |||
T-4 Invesco Small Cap Discovery Fund

Invesco mailing information
Send general correspondence to Invesco Investment Services, Inc., P.O. Box 219078, Kansas City, MO 64121-9078.
Important notice regarding delivery of security holder documents
To reduce Fund expenses, only one copy of most shareholder documents may be mailed to shareholders with multiple accounts at the same address (Householding). Mailing of your shareholder documents may be householded indefinitely unless you instruct us otherwise. If you do not want the mailing of these documents to be combined with those for other members of your household, please contact Invesco Investment Services, Inc. at 800 959 4246 or contact your financial institution. We will begin sending you individual copies for each account within 30 days after receiving your request.
Fund holdings and proxy voting information
The Fund provides a complete list of its holdings four times in each fiscal year, at the quarter ends. For the second and fourth quarters, the lists appear in the Fund’s semiannual and annual reports to shareholders. For the first and third quarters, the Fund files the lists with the Securities and Exchange Commission (SEC) on Form N-Q. The most recent list of portfolio holdings is available at invesco.com/completeqtrholdings. Shareholders can also look up the Fund’s Forms N-Q on the SEC website at sec.gov. Copies of the Fund’s Forms N-Q may be reviewed and copied at the SEC Public Reference Room in Washington, D.C. You can obtain information on the operation of the Public Reference Room, including information about duplicating fee charges, by calling 202 551 8090 or 800 732 0330, or by electronic request at the following email address: publicinfo@sec.gov.
The SEC file numbers for the Fund are shown below.
A description of the policies and procedures that the Fund uses to determine how to vote proxies relating to portfolio securities is available without charge, upon request, from our Client Services department at 800 959 4246 or at invesco.com/proxyguidelines. The information is also available on the SEC website, sec.gov.
Information regarding how the Fund voted proxies related to its portfolio securities during the most recent 12-month period ended June 30 is available at invesco.com/proxysearch. The information is also available on the SEC website, sec.gov. Invesco Advisers, Inc. is an investment adviser; it provides investment advisory services to individual and institutional clients and does not sell securities. Invesco Distributors, Inc. is the US distributor for Invesco Ltd.’s retail mutual funds, exchange-traded funds and institutional money market funds. Both are wholly owned, indirect subsidiaries of Invesco Ltd. |  |
SEC file numbers: 811-09913 and 333-36074 VK-SCD-AR-1 Invesco Distributors, Inc.
| Annual Report to Shareholders
| August 31, 2015 | ||
Invesco Strategic Real Return Fund | ||||
Nasdaq: A: SRRAX ¡ C: SRRCX ¡ R: SRRQX ¡ Y: SRRYX ¡ R5: SRRFX ¡ R6: SRRSX | ||||


Letters to Shareholders
Philip Taylor | Dear Shareholders: This annual report includes information about your Fund, including performance data and a complete list of its investments as of the close of the reporting period. Inside is a discussion of how your Fund was managed and the factors that affected its performance during the reporting period. I hope you find this report of interest. The US economy expanded and unemployment declined throughout the reporting period. The sharp drop in oil prices that began in mid-2014 continued to benefit consumers, but a strong US dollar crimped corporate profits. The US Federal Reserve signaled that it was increasingly likely to raise interest rates, based on generally positive economic data, but uncertainty remained about when it would act. Overseas, the story was much different. Low energy prices hurt the economies of some oil-producing nations, such as Brazil and Russia. During the reporting period, the European Central Bank as well as central banks in China and |

Japan – among other countries – either instituted or maintained extraordinarily accommodative monetary policies in response to economic weakness.
Investor uncertainty, such as we saw for much of the reporting period – and market volatility, such as we saw at the end of the reporting period – are unfortunate facts of life when it comes to investing. Some investors use these things as excuses to delay saving and investing for their long-term financial goals. That’s why Invesco encourages investors to work with a professional financial adviser who can stress the importance of starting to save and invest early and the importance of adhering to a disciplined investment plan – when times are good and when they’re uncertain. A financial adviser who knows your unique financial situation, investment goals and risk tolerance can be an invaluable partner as you seek to achieve your financial goals. He or she can offer a long-term perspective when markets are volatile and time-tested advice and guidance when your financial situation or investment goals change.
Timely information when and where you want it
Invesco’s efforts to help investors achieve their financial objectives include providing individual investors and financial professionals with timely information about the markets, the economy and investing – whenever and wherever they want it.
Our website, invesco.com/us, offers a wide range of market insights and investment perspectives. On the website, you’ll find detailed information about our funds, including prices, performance, holdings and portfolio manager commentaries. You can access information about your account by completing a simple, secure online registration. Click on the “Need to register” link in the “Account Access” box on our homepage to get started.
Invesco’s mobile apps for iPhone® and iPad® (both available free from the App StoreSM) allow you to obtain the same detailed information, monitor your account and create customizable watch lists. Also, they allow you to access investment insights from our investment leaders, market strategists, economists and retirement experts. You can sign up to be alerted when new commentary is added, and you can watch portfolio manager videos and have instant access to Invesco news and updates wherever you may be.
In addition to the resources accessible on our website and through our mobile app, you can obtain timely updates to help you stay informed about the markets, the economy and investing by connecting with Invesco on Twitter, LinkedIn or Facebook. You can access our blog at blog.invesco.us.com. Our goal is to provide you the information you want, when and where you want it.
Have questions?
For questions about your account, feel free to contact an Invesco client services representative at 800 959 4246. For Invesco-related questions or comments, please email me directly at phil@invesco.com.
All of us at Invesco look forward to serving your investment management needs for many years to come. Thank you for investing with us.
Sincerely,

Philip Taylor
Senior Managing Director, Invesco Ltd.
iPhone and iPad are trademarks of Apple Inc., registered in the US and other countries. App Store is a service mark of Apple Inc. Invesco Distributors, Inc. is not affiliated with Apple Inc.
2 Invesco Strategic Real Return Fund
Bruce Crockett | Dear Fellow Shareholders: Among the many important lessons I’ve learned in more than 40 years in a variety of business endeavors is the value of a trusted advocate. As independent chair of the Invesco Funds Board, I can assure you that the members of the Board are strong advocates for the interests of investors in Invesco’s mutual funds. We work hard to represent your interests through oversight of the quality of the investment management services your funds receive and other matters important to your investment, including but not limited to: n Ensuring that Invesco offers a diverse lineup of mutual funds that your financial adviser can use to strive to meet your financial needs as your investment goals change over time. n Monitoring how the portfolio management teams of the Invesco funds are performing in light of changing economic and market conditions. |

| n | Assessing each portfolio management team’s investment performance within the context of the investment strategy described in the fund’s prospectus. |
| n | Monitoring for potential conflicts of interests that may impact the nature of the services that your funds receive. |
We believe one of the most important services we provide our fund shareholders is the annual review of the funds’ advisory and sub-advisory contracts with Invesco Advisers and its affiliates. This review is required by the Investment Company Act of 1940 and focuses on the nature and quality of the services Invesco provides as the adviser to the Invesco funds and the reasonableness of the fees that it charges for those services. Each year, we spend months carefully reviewing information received from Invesco and a variety of independent sources, such as performance and fee data prepared by Lipper Inc., an independent, third-party firm widely recognized as a leader in its field. We also meet with our independent legal counsel and other independent advisers to review and help us assess the information that we have received. Our goal is to assure that you receive quality investment management services for a reasonable fee.
I trust the measures outlined above provide assurance that you have a worthy advocate when it comes to choosing the Invesco Funds.
As always, please contact me at bruce@brucecrockett.com with any questions or concerns you may have. On behalf of the Board, we look forward to continuing to represent your interests and serving your needs.
Sincerely,

Bruce L. Crockett
Independent Chair
Invesco Funds Board of Trustees
3 Invesco Strategic Real Return Fund
Management’s Discussion of Fund Performance
Performance summary For the fiscal year ended August 31, 2015, Class A shares of Invesco Strategic Real Return Fund (the Fund), at net asset value (NAV), returned -2.26% versus the Fund’s style-specific benchmark, the Custom Invesco Strategic Real Return Index, which returned -1.73%. Your Fund’s long-term performance appears later in this report.
|
| |||
Fund vs. Indexes Total returns, 8/31/14 to 8/31/15, at net asset value (NAV). Performance shown does not include applicable contingent deferred sales charges (CDSC) or front-end sales charges, which would have reduced performance. |
| |||
Class A Shares | -2.26 | % | ||
Class C Shares | -3.00 | |||
Class R Shares | -2.51 | |||
Class Y Shares | -2.02 | |||
Class R5 Shares | -2.02 | |||
Class R6 Shares | -2.02 | |||
| Bank of America Merrill Lynch Current 10-Year Treasury Indexq (Broad Market Index) | 3.24 | |||
Custom Invesco Strategic Real Return Indexn (Style-Specific Index) | -1.73 | |||
Lipper Inflation Protected Bond Fund Index¿ (Peer Group Index) | -3.52 | |||
Source(s):qBloomberg LP; nInvesco, Bloomberg LP, FactSet Research Systems Inc., S&P Dow Jones Indices LLC; ¿Lipper Inc. | ||
Market conditions and your Fund
During the fiscal year ended August 31, 2015, inflation was on the minds of many market participants around the world, albeit the concerns were about the low level of inflation. Much of the focus of the world’s central banks had been, and continues to be, implementing policies to fight deflation, rather than to control general price increases. Concern over global economic growth, specifically Chinese growth, was a catalyst for lower commodity prices. A key part of the collapse of commodity prices was the price of oil. In November, OPEC actions drove oil prices into free-fall. In addition, the world was faced with the prospect of increased oil production in Iran, another factor putting downward pressure on prices.
Due to geopolitical influences, which are particularly hard to predict, adjustments to the Fund’s asset allocation between asset categories were minimal.
Inflation expectations moved lower over the fiscal year. This view was
reflected in Treasury Inflation Protected Securities’ (TIPS) returns. As part of the Fund’s strategy, the largest allocation is to TIPS.
During the reporting period, TIPS accounted for 45% of the Fund’s assets. Before any fee allocation, the TIPS portion of the Fund’s portfolio returned -2.85%. By contrast, The BofA Merrill Lynch U.S. Inflation-Linked Treasury Index, a component of the Fund’s custom style-specific index and by which TIPS funds are usually measured, returned -2.82%. (The Fund uses an index replication approach to the TIPS portion of the portfolio and will try to achieve the returns of The BofA Merrill Lynch U.S. Inflation-Linked Treasury Index.)
The Fund employs a diversified approach to attempt to manage inflation risk. In addition to TIPS, the Fund maintains allocations to both bank loans and high yield securities. These three sectors are expected to perform well in inflationary environments, while offering a
competitive yield. This multi-asset strategy benefited Fund investors during the reporting period as the Fund’s Class A shares, at NAV, outperformed The BofA Merrill Lynch U.S. Inflation-Linked Treasury Index which is used to measure traditional TIPs funds.
During the reporting period, the Fund’s high yield allocation aided relative performance versus the Fund’s style-specific index. The Fund’s high yield exposure significantly outperformed the high yield market overall as represented by the Bank of America Merrill Lynch U.S. High Yield Constrained Index, a component of the Fund’s custom style-specific index. The Fund’s allocation to high yield returned -1.31% while the Bank of America Merrill Lynch U.S. High Yield Constrained index returned -3.07%.
The Fund’s allocation to bank loans during the reporting period detracted from relative Fund performance. The bank loan portion of the Fund’s style-specific index, represented by the S&P/LSTA Leveraged Loan Total Return Index, returned 0.98% while the Fund’s bank loans exposure returned -0.08%.
We wish to remind you that the Fund is subject to interest rate risk, meaning when interest rates rise, the value of fixed income securities tends to fall. This risk may be greater in the current market environment because interest rates are at or near historic lows. The degree to which the value of fixed income securities may decline due to rising interest rates may vary depending on the speed and magnitude of the increase in interest rates, as well as individual security characteristics such as price, maturity, duration and coupon and market forces such as supply and demand for similar securities. The Fund also invests in senior secured loans, which are an asset class that behaves differently from many traditional fixed income investments. The interest income generated by a portfolio of senior secured loans is usually determined by a fixed credit
Portfolio Composition By security type
|
| |||
U.S. Treasury Securities | 44.6 | % | ||
Common Stocks | 29.9 | |||
Bonds and Notes | 23.2 | |||
Money Market Funds Plus Other Assets Less Liabilities | 2.3 | |||
Top 10 Debt Issuers*
|
| |||||
1. | U.S. Treasury | 44.6 | % | |||
2. | Tenet Healthcare Corp. | 1.0 | ||||
3. | International Lease Finance Corp. | 0.8 | ||||
4. | Aircastle Ltd. | 0.8 | ||||
5. | T-Mobile USA, Inc. | 0.8 | ||||
6. | Crown Castle International Corp. | 0.8 | ||||
7. | Reynolds Group Issuer Inc./LLC | 0.8 | ||||
8. | CIT Group Inc. | 0.8 | ||||
9. | Gibraltar Industries Inc. | 0.8 | ||||
10. | Dana Holding Corp. | 0.8 | ||||
Total Net Assets | $ | 16.7 million | ||
| Total Number of Holdings* | 173 | |||
The Fund’s holdings are subject to change, and there is no assurance that the Fund will continue to hold any particular security.
| * | Excluding US treasury bills and money market fund holdings. |
4 Invesco Strategic Real Return Fund
spread over the London Interbank Offered Rate (Libor). Because senior secured loans generally have a very short duration and the coupons or interest rates are usually adjusted every 30 to 90 days as Libor changes, the yield on the portfolio adjusts. Interest rate risk refers to the tendency for traditional fixed income prices to decline when interest rates rise. For senior secured loans, however, interest rates and income are variable and the prices of loans are therefore less sensitive to interest rate changes than traditional fixed income bonds – and senior secured loans provide a natural hedge against rising interest rates. We are monitoring interest rates, the market and economic and geopolitical factors that may impact the direction, speed and magnitude of changes to interest rates across the maturity spectrum, including the potential impact of monetary policy changes by the US Federal Reserve and certain central banks. If interest rates rise, markets may experience increased volatility, which may affect the value and/or liquidity of certain of the Fund’s investments or the market price of the Fund’s shares.
In sum, during the fiscal year, the Fund achieved returns from diversified sources of infiation risk. This remains a key objective of the Fund.
Thank you for your investment in Invesco Strategic Real Return Fund.
| * | Asset allocation/diversification does not guarantee a profit or eliminate the risk of loss. |
The views and opinions expressed in management’s discussion of Fund performance are those of Invesco Advisers, Inc. These views and opinions are subject to change at any time based on factors such as market and economic conditions. These views and opinions may not be relied upon as investment advice or recommendations, or as an offer for a particular security. The information is not a complete analysis of every aspect of any market, country, industry, security or the Fund. Statements of fact are from sources considered reliable, but Invesco Advisers, Inc. makes no representation or warranty as to their completeness or accuracy. Although historical performance is no guarantee of future results, these insights may help you understand our investment management philosophy.
See important Fund and, if applicable, index disclosures later in this report.
 | Erik Jensen Portfolio Manager, is co-lead manager of Invesco Strategic Real Return Fund. He joined Invesco and/or its investment advisory | |
| affiliates in 1987. Mr. Jensen earned a BES degree from Johns Hopkins University and an SM degree in management from the Massachusetts Institute of Technology. | ||
 | Robert Young Chartered Financial Analyst, Portfolio Manager, is co-lead manager of Invesco Strategic Real Return Fund. He joined | |
| Invesco in 2001. Mr. Young earned a BA in economics from Cornell University and an MBA in finance and international business from Fordham University. | ||
 | Thomas Ewald Portfolio Manager, is manager of Invesco Strategic Real Return Fund. He joined Invesco in 2000. Mr. Ewald earned a BA | |
| from Harvard College and an MBA from the University of Virginia Darden School of Business. | ||
 | Darren Hughes Chartered Financial Analyst, Portfolio Manager, is manager of Invesco Strategic Real Return Fund. He joined Invesco in 1992. | |
| Mr. Hughes earned a BBA in finance and economics from Baylor University. | ||
5 Invesco Strategic Real Return Fund
Your Fund’s Long-Term Performance
Results of a $10,000 Investment – Oldest Share Class(es) since Inception
Fund and index data from 4/30/14
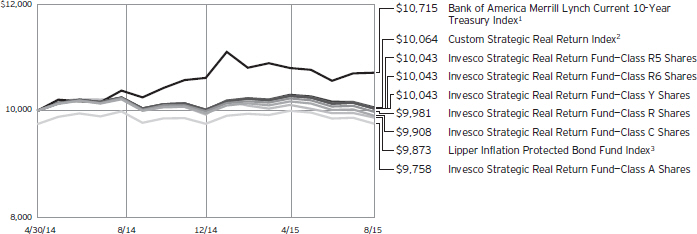
1 Source: Bloomberg LP
2 Source(s): Invesco, Bloomberg LP, FactSet Research Systems Inc., S&P Dow Jones Indices LLC
3 Source: Lipper Inc.
Past performance cannot guarantee comparable future results.
The data shown in the chart include reinvested distributions, applicable sales charges and Fund expenses including
management fees. Index results include reinvested dividends, but they do not reflect sales charges. Performance of the peer group, if applicable, reflects fund expenses and management fees;
performance of a market index does not. Performance shown in the chart and table(s) does not reflect deduction of taxes a shareholder would pay on Fund distributions or sale of Fund shares.
continued from page 9 |
| protected securities with at least $1 billion in outstanding face value and a remaining term to final maturity of greater than one year. |
| n | The S&P/LSTA Leveraged Loan Index is a broad index designed to reflect the performance of US dollar facilities in the leverage loan market. |
| n | The Bank of America Merrill Lynch U.S. High Yield Constrained Index contains all the securities in the Bank of America Merrill Lynch U.S. High Yield Index but caps issuer exposure at 2%. |
| n | The Fund is not managed to track the performance of any particular index, including the index(es) described here, and consequently, the performance of the Fund may deviate significantly from the performance of the index(es). |
| n | A direct investment cannot be made in an index. Unless otherwise indicated, index results include reinvested dividends, and they do not reflect sales charges. Performance of the peer group, if applicable, reflects fund expenses; performance of a market index does not. |
| n | Merrill Lynch, Pierce, Fenner & Smith Incorporated and its affiliates (“BofAML”) indices and related information, the |
name “Bank of America Merrill Lynch,” and related trademarks, are intellectual property licensed from BofAML, and may not be copied, used or distributed without BofAML’s prior written approval. The licensee’s products have not been passed on as to their legality or suitability, and are not regulated, issued, endorsed, sold, guaranteed or promoted by BofAML. BOFAML MAKES NO WARRANTIES AND BEARS NO LIABILITY WITH RESPECT TO THE INDICES, ANY RELATED INFORMATION, ITS TRADEMARKS, OR THE PRODUCT(S) (INCLUDING WITHOUT LIMITATION, THEIR QUALITY, ACCURACY, SUITABILITY AND/OR COMPLETENESS) |
Other information
| n | The returns shown in management’s discussion of Fund performance are based on net asset values (NAVs) calculated for shareholder transactions. Generally accepted accounting principles require adjustments to be made to the net assets of the Fund at period end for financial reporting purposes, and as such, the NAVs for shareholder transactions and the returns based on those NAVs may differ from the NAVs and returns reported in the Financial Highlights. |
6 Invesco Strategic Real Return Fund
Average Annual Total Returns |
| |||
As of 8/31/15, including maximum applicable sales charges
|
| |||
Class A Shares | ||||
Inception (4/30/14) | -1.81 | % | ||
1 Year | -4.71 | |||
Class C Shares | ||||
Inception (4/30/14) | -0.69 | % | ||
1 Year | -3.95 | |||
Class R Shares | ||||
Inception (4/30/14) | -0.14 | % | ||
1 Year | -2.51 | |||
Class Y Shares | ||||
Inception (4/30/14) | 0.32 | % | ||
1 Year | -2.02 | |||
Class R5 Shares | ||||
Inception (4/30/14) | 0.32 | % | ||
1 Year | -2.02 | |||
Class R6 Shares | ||||
Inception (4/30/14) | 0.32 | % | ||
1 Year | -2.02 | |||
The performance data quoted represent past performance and cannot guarantee comparable future results; current performance may be lower or higher. Please visit invesco.com/performance for the most recent month-end performance. Performance figures reflect reinvested distributions, changes in net asset value and the effect of the maximum sales charge unless otherwise stated. Investment return and principal value will fluctuate so that you may have a gain or loss when you sell shares.
The net annual Fund operating expense ratio set forth in the most
Average Annual Total Returns |
| |||
| As of 6/30/15, the most recent calendar quarter end, including maximum applicable sales charges | ||||
Class A Shares | ||||
Inception (4/30/14) | -1.28 | % | ||
1 Year | -3.43 | |||
Class C Shares | ||||
Inception (4/30/14) | 0.12 | % | ||
1 Year | -2.67 | |||
Class R Shares | ||||
Inception (4/30/14) | 0.68 | % | ||
1 Year | -1.11 | |||
Class Y Shares | ||||
Inception (4/30/14) | 1.15 | % | ||
1 Year | -0.71 | |||
Class R5 Shares | ||||
Inception (4/30/14) | 1.15 | % | ||
1 Year | -0.71 | |||
Class R6 Shares | ||||
Inception (4/30/14) | 1.15 | % | ||
1 Year | -0.71 | |||
recent Fund prospectus as of the date of this report for Class A, Class C, Class R, Class Y, Class R5 and Class R6 shares 0.82%, 1.57%, 1.07%, 0.57%, 0.57% and 0.57%, respectively.1,2 The total annual Fund operating expense ratio set forth in the most recent Fund prospectus as of the date of this report for Class A, Class C, Class R, Class Y, Class R5 and Class R6 shares was 1.83%, 2.58%, 2.08%, 1.58%, 1.55% and 1.50%, respectively. The expense ratios presented above may vary from the expense ratios presented in other sections of
this report that are based on expenses incurred during the period covered by this report.
Class A share performance reflects the maximum 2.50% sales charge, and Class C share performance reflects the applicable contingent deferred sales charge (CDSC) for the period involved. The CDSC on Class C shares is 1% for the first year after purchase. Class R, Class Y, Class R5 and Class R6 shares do not have a front-end sales charge or a CDSC; therefore, performance is at net asset value.
The performance of the Fund’s share classes will differ primarily due to different sales charge structures and class expenses.
Fund performance reflects any applicable fee waivers and/or expense reimbursements. Had the adviser not waived fees and/or reimbursed expenses currently or in the past, returns would have been lower. See current prospectus for more information.
| 1 | Total annual Fund operating expenses after any contractual fee waivers and/or expense reimbursements by the adviser in effect through at least December 31, 2015. See current prospectus for more information. |
| 2 | Total annual Fund operating expenses after any contractual fee waivers and/or expense reimbursements by the adviser in effect through at least June 30, 2017. See current prospectus for more information. |
7 Invesco Strategic Real Return Fund
Invesco Strategic Real Return Fund’s investment objective is to seek to mitigate the effects of unanticipated inflation and to provide current income.
| n | Unless otherwise stated, information presented in this report is as of August 31, 2015, and is based on total net assets. |
| n | Unless otherwise noted, all data provided by Invesco. |
| n | To access your Fund’s reports/prospectus, visit invesco.com/fundreports. |
About share classes
| n | Class R shares are generally available only to employer sponsored retirement and benefit plans. Please see the prospectus for more information. |
| n | Class Y shares are available only to certain investors. Please see the prospectus for more information. |
| n | Class R5 shares and Class R6 shares are primarily intended for employer sponsored retirement and benefit plans that meet certain standards and for institutional investors. Please see the prospectus for more information. |
Principal in the Fund risks of investing
| n | Asset-backed securities risk. The Fund may invest in asset-backed securities that are subject to prepayment or call risk, which is the risk that the borrower’s payments may be received earlier or later than expected due to changes in prepayment rates on underlying loans. Faster prepayments often happen when interest rates are falling. As a result, the Fund may reinvest these early payments at lower interest rates, thereby reducing the Fund’s income. Conversely, when interest rates rise, prepayments may happen more slowly, causing the security to lengthen in duration. Longer duration securities tend to be more volatile. Securities may be prepaid at a price less than the original purchase value. |
| n | Changing fixed income market conditions risk. The current low interest rate environment was created in part by the Federal Reserve Board (FRB) and certain foreign central banks keeping the federal funds and equivalent foreign rates at or near zero. There is a risk that interest rates will rise when the FRB and central banks raise these rates. This risk is heightened due to the completion of the FRB’s quantitative easing program and “the tapering” of other similar foreign central bank actions. This eventual increase in the federal funds and equivalent foreign rates may expose fixed income markets to heightened volatility |
and reduced liquidity for certain fixed income investments, particularly those with longer maturities. In addition, decreases in fixed income dealer market-making capacity may also potentially lead to heightened volatility and reduced liquidity in the fixed income markets. As a result, the value of the Fund’s investments and share price may decline. Changes in central bank policies could also result in higher than normal shareholder redemptions, which could potentially increase portfolio turnover and the Fund’s transaction costs. |
| n | Collateralized loan obligations risk. In addition to the normal interest rate, default and other risks of fixed income securities, collateralized loan obligations carry additional risks, including the possibility that distributions from collateral securities will not be adequate to make interest or other payments, the quality of the collateral may decline in value or default, the Fund may invest in collateralized loan obligations that are subordinate to other classes, values may be volatile, and disputes with the issuer may produce unexpected investment results. |
| n | Convertible securities risk. The Fund may own convertible securities, the value of which may be affected by market interest rates, the risk that the issuer will default, the value of the underlying stock or the right of the issuer to buy back the convertible securities. |
| n | Credit risk. The issuer of instruments in which the Fund invests may be unable to meet interest and/or principal payments, thereby causing its instruments to decrease in value and lowering the issuer’s credit rating. |
| n | Defaulted securities risk. Defaulted securities involve the substantial risk that principal will not be repaid. Defaulted securities and any securities received in an exchange for such securities may be subject to restrictions on resale. |
| n | Derivatives risk. The value of a derivative instrument depends largely on (and is derived from) the value of an underlying security, currency, commodity, interest rate, index or other as- |
set (each referred to as an underlying asset). In addition to risks relating to the underlying assets, the use of derivatives may include other, possibly greater, risks, including counterparty, leverage and liquidity risks. Counterparty risk is the risk that the counterparty to the derivative contract will default on its obligation to pay the Fund the amount owed or otherwise perform under the derivative contract. Derivatives create leverage risk because they do not require payment up front equal to the economic exposure created by owning the derivative. As a result, an adverse change in the value of the underlying asset could result in the Fund sustaining a loss that is substantially greater than the amount invested in the derivative, which may make the Fund’s returns more volatile and increase the risk of loss. Derivative instruments may also be less liquid than more traditional investments and the Fund may be unable to sell or close out its derivative positions at a desirable time or price. This risk may be more acute under adverse market conditions, during which the Fund may be most in need of liquidating its derivative positions. Derivatives may also be harder to value, less tax efficient and subject to changing government regulation that could impact the Fund’s ability to use certain derivatives or their cost. Also, derivatives used for hedging or to gain or limit exposure to a particular market segment may not provide the expected benefits, particularly during adverse market conditions. |
| n | Emerging markets securities risk. The prices of securities issued by foreign companies and governments located in emerging markets countries may be affected more negatively by inflation, devaluation of their currencies, higher transaction costs, delays in settlement, adverse political developments, the introduction of capital controls, withholding taxes, nationalization of private assets, expropriation, social unrest, war or lack of timely information than those in developed countries. |
| n | Exchange-traded funds risk. An investment by the Fund in exchange-traded funds generally presents the same primary risks as an investment in a mutual fund. In addition, an exchange-traded fund may be subject to the following: (1) a discount of the exchange-traded |
This report must be accompanied or preceded by a currently effective Fund prospectus, which contains more complete information, including sales charges and expenses. Investors should read it carefully before investing.
NOT FDIC INSURED | MAY LOSE VALUE | NO BANK GUARANTEE |
| 8 Invesco Strategic Real Return Fund |
fund’s shares to its net asset value; (2) failure to develop an active trading market for the exchange-traded fund’s shares; (3) the listing exchange halting trading of the exchange-traded fund’s shares; (4) failure of the exchange-traded fund’s shares to track the referenced asset; and (5) holding troubled securities in the referenced index or basket of investments. Investments in exchange-traded funds may involve duplication of management fees and certain other expenses, as the Fund indirectly bears its proportionate share of any expenses paid by the exchange-traded funds in which it invests. Further, certain of the exchange-traded funds in which the Fund may invest are leveraged. The more the Fund invests in such leveraged exchange-traded funds, the more this leverage will magnify any losses on those investments. |
| n | Floating rate risk. The Fund may invest in floating rate loans and debt securities that require collateral. There is a risk that the value of the collateral may not be sufficient to cover the amount owed, collateral securing a loan may be found invalid, and collateral may be used to pay other outstanding obligations of the borrower under applicable law or may be difficult to sell. There is also the risk that the collateral may be difficult to liquidate, or that a majority of the collateral may be illiquid. |
| n | Foreign securities risk. The Fund’s foreign investments may be affected by changes in a foreign country’s exchange rates, political and social instability, changes in economic or taxation policies, difficulties when enforcing obligations, decreased liquidity, and increased volatility. Foreign companies may be subject to less regulation resulting in less publicly available information about the companies. |
| n | High yield bond (junk bond) risk. High yield bonds (commonly referred to as junk bonds) involve a greater risk of default or price changes due to changes in the credit quality of the issuer. The values of junk bonds fluctuate more than those of high- quality bonds in response to company, political, regulatory or economic developments. Values of junk bonds can decline significantly over short periods of time. |
| n | Income risk. The income you receive from the Fund is based primarily on prevailing interest rates, which can vary widely over the short- and long-term. If interest rates drop, your income from the Fund may drop as well. |
| n | Indexing risk. The TIPS Portfolio does not utilize an investing strategy that |
seeks returns in excess of the underlying index. Therefore, it would not necessarily sell a security unless that security is removed from the underlying index. |
| n | Industry focus risk. To the extent a Fund invests in securities issued or guaranteed by companies in the banking and financial services industries, the Fund’s performance will depend on the overall condition of those industries, which may be affected by the following factors: the supply of short-term financing; changes in government regulation and interest rates; and the overall economy. |
| n | Inflation-indexed security risk. The risk that the value of an inflation indexed security (such as TIPS) tends to decrease when real interest rates increase and increase when real interest rates decrease. Interest payments on inflation-indexed securities will vary along with changes in the Consumer Price Index. |
| n | Interest rate risk. Interest rate risk refers to the risk that bond prices generally fall as interest rates rise; conversely, bond prices generally rise as interest rates fall. Specific bonds differ in their sensitivity to changes in interest rates depending on their individual characteristics, including duration. |
| n | Liquidity risk. The Fund may hold illiquid securities that it is unable to sell at the preferred time or price and could lose its entire investment in such securities. |
| n | Management risk. The investment techniques and risk analysis used by the Fund’s portfolio managers may not produce the desired results. Because the Fund’s investment process relies heavily on its asset allocation process, market movements that are counter to the portfolio managers’ expectations may have a significant adverse effect on the Fund’s net asset value. |
| n | Market risk. The prices of and the income generated by the Fund’s securities may decline in response to, among other things, investor sentiment, general economic and market conditions, regional or global instability, and currency and interest rate fluctuations. |
| n | Preferred securities risk. Preferred securities may include provisions that permit the issuer, in its discretion, to defer or omit distributions for a certain period of time. If the Fund owns a security that is deferring or omitting its distributions, the Fund may be required to report the distribution on its tax returns, even though it may not have received this income. Further, preferred securities may lose substantial value due to the omission or deferment of |
dividend payments. |
| n | Prepayment risk. An issuer’s ability to prepay principal on a loan or debt security prior to maturity can limit the Fund’s potential gains. Prepayments may require the Fund to replace the loan or debt security with a lower yielding security, adversely affecting the Fund’s yield. |
| n | Reinvestment risk. Reinvestment risk is the risk that a bond’s cash flows (coupon income and principal repayment) will be reinvested at an interest rate below that on the original bond. |
| n | Sampling risk. TIPS Portfolio’s use of a representative sampling approach will result in its holding a smaller number of bonds than are in the Underlying Index. As a result, an adverse development respecting an issuer of bonds held by the TIPS Portfolio could result in a greater decline in NAV than would be the case if the Fund held all of the bonds in the Underlying Index. To the extent the assets in the TIPS Portfolio are smaller, these risks will be greater. |
| n | When-issued and delayed delivery risks. When-issued and delayed delivery transactions are subject to market risk as the value or yield of a security at delivery may be more or less than the purchase price or the yield generally available on securities when delivery occurs. In addition, the Fund is subject to counterparty risk because it relies on the buyer or seller, as the case may be, to consummate the transaction, and failure by the other party to complete the transaction may result in the Fund missing the opportunity of obtaining a price or yield considered to be advantageous. |
About indexes used in this report
| n | The Bank of America Merrill Lynch Current 10-Year Treasury Index is a one-security index composed of the most recently issued 10-year US Treasury Note. The index is rebalanced monthly. |
| n | The Custom Invesco Strategic Real Return Index consists of 45% BofA Merrill Lynch U.S. Inflation Linked Treasury Index, 30% S&P/LSTA Leveraged Loan Total Return Index and 25% Bank of America Merrill Lynch U.S. High Yield Constrained Index. |
| n | The Lipper Inflation Protected Bond Fund Index is an index based on the total return of certain mutual funds within the Fund’s designated category as determined by Lipper. |
| n | The BofA Merrill Lynch U.S. Inflation-Linked Treasury Index is an unmanaged index comprised of US Treasury inflation |
continued on page 6
9 Invesco Strategic Real Return Fund
Schedule of Investments(a)
August 31, 2015
| Principal Amount | Value | |||||||
U.S. Treasury Securities–44.59% |
| |||||||
| U.S. Treasury Bills–0.03% | ||||||||
0.29%, 05/26/16(b)(c) | $ | 5,000 | $ | 4,989 | ||||
| U.S. Treasury Inflation — Indexed Notes–30.00%(d) | ||||||||
2.38%, 01/15/17 | 140,802 | 144,794 | ||||||
0.13%, 04/15/17 | 326,721 | 325,369 | ||||||
2.63%, 07/15/17 | 112,825 | 118,390 | ||||||
1.63%, 01/15/18 | 129,843 | 134,693 | ||||||
0.13%, 04/15/18 | 358,184 | 357,715 | ||||||
1.38%, 07/15/18 | 115,079 | 119,877 | ||||||
2.13%, 01/15/19 | 112,248 | 119,910 | ||||||
0.13%, 04/15/19 | 354,372 | 353,423 | ||||||
1.88%, 07/15/19 | 116,221 | 124,465 | ||||||
1.38%, 01/15/20 | 144,548 | 152,198 | ||||||
0.13%, 04/15/20 | 127,365 | 126,803 | ||||||
1.25%, 07/15/20 | 243,989 | 257,057 | ||||||
1.13%, 01/15/21 | 275,967 | 287,432 | ||||||
0.63%, 07/15/21 | 262,555 | 266,696 | ||||||
0.13%, 01/15/22 | 304,675 | 297,772 | ||||||
0.13%, 07/15/22 | 295,719 | 289,115 | ||||||
0.13%, 01/15/23 | 292,548 | 283,138 | ||||||
0.38%, 07/15/23 | 290,166 | 286,458 | ||||||
0.63%, 01/15/24 | 293,495 | 294,013 | ||||||
0.13%, 07/15/24 | 289,414 | 277,853 | ||||||
0.25%, 01/15/25 | 288,122 | 277,742 | ||||||
0.38%, 07/15/25 | 104,644 | 102,608 | ||||||
| 4,997,521 | ||||||||
| U.S. Treasury Inflation — Indexed Bonds–14.56%(d) | ||||||||
2.38%, 01/15/25 | 249,374 | 289,024 | ||||||
2.00%, 01/15/26 | 168,309 | 190,366 | ||||||
2.38%, 01/15/27 | 137,252 | 161,677 | ||||||
1.75%, 01/15/28 | 125,287 | 139,518 | ||||||
3.63%, 04/15/28 | 172,608 | 230,600 | ||||||
2.50%, 01/15/29 | 106,692 | 128,934 | ||||||
3.88%, 04/15/29 | 200,301 | 278,153 | ||||||
3.38%, 04/15/32 | 49,739 | 68,908 | ||||||
2.13%, 02/15/40 | 119,229 | 144,414 | ||||||
2.13%, 02/15/41 | 181,962 | 221,964 | ||||||
0.75%, 02/15/42 | 168,958 | 152,900 | ||||||
0.63%, 02/15/43 | 166,054 | 144,824 | ||||||
1.38%, 02/15/44 | 164,835 | 172,999 | ||||||
0.75%, 02/15/45 | 112,475 | 101,085 | ||||||
| 2,425,366 | ||||||||
Total U.S. Treasury Securities |
| 7,427,876 | ||||||
Shares | Value | |||||||
Common Stocks–29.89% | ||||||||
| Fixed Income Funds–29.89% | ||||||||
Invesco Floating Rate Fund–Class R6 (Cost $5,235,508) (e) | 658,654 | $ | 4,979,425 | |||||
| Principal Amount | ||||||||
Bonds and Notes–23.24% |
| |||||||
| Aerospace & Defense–0.35% | ||||||||
Bombardier Inc. (Canada), Sr. Unsec. Notes, 7.50%, 03/15/25(f) | $ | 20,000 | 15,200 | |||||
KLX Inc., Sr. Unsec. Gtd. Notes, 5.88%, 12/01/22(f) | 12,000 | 11,850 | ||||||
Moog Inc., Sr. Unsec. Gtd. Notes, 5.25%, 12/01/22(f) | 5,000 | 5,025 | ||||||
TransDigm Inc., Sr. Unsec. Gtd. Sub. Notes, 6.50%, 05/15/25(f) | 27,000 | 26,595 | ||||||
| 58,670 | ||||||||
| Airlines–0.16% | ||||||||
Air Canada (Canada), Sr. Unsec. Gtd. Notes, 7.75%, 04/15/21(f) | 25,000 | 26,974 | ||||||
| Alternative Carriers–0.06% | ||||||||
Level 3 Financing, Inc., Sr. Unsec. Gtd. Notes, 5.13%, 05/01/23(f) | 10,000 | 9,800 | ||||||
| Apparel Retail–0.24% | ||||||||
Men’s Wearhouse, Inc. (The), Sr. Unsec. Gtd. Global Notes, 7.00%, 07/01/22 | 38,000 | 40,375 | ||||||
| Application Software–0.04% | ||||||||
SS&C Technologies Holdings, Inc., Sr. Unsec. Gtd. Notes, 5.88%, 07/15/23(f) | 7,000 | 7,263 | ||||||
| Asset Management & Custody Banks–0.26% | ||||||||
Alphabet Holding Co., Inc., Sr. Unsec. Global PIK Notes, 8.50%, 11/01/17(g) | 30,000 | 29,813 | ||||||
DJO Finco Inc./DJO Finance LLC/Corp., Sec. Second Lien Notes, | 13,000 | 13,536 | ||||||
| 43,349 | ||||||||
| Auto Parts & Equipment–0.86% | ||||||||
Dana Holding Corp., Sr. Unsec. Notes, 5.38%, 09/15/21 | 125,000 | 125,625 | ||||||
Tenneco Inc., Sr. Unsec. Gtd. Global Notes, 5.38%, 12/15/24 | 18,000 | 18,360 | ||||||
| 143,985 | ||||||||
| Automotive Retail–0.01% | ||||||||
CST Brands, Inc., Sr. Unsec. Gtd. Global Notes, 5.00%, 05/01/23 | 2,000 | 1,970 | ||||||
| Broadcasting–0.23% | ||||||||
iHeartCommunications, Inc., Sr. Sec. Gtd. First Lien Global Notes, 10.63%, 03/15/23 | 15,000 | 13,575 | ||||||
Sinclair Television Group Inc., Sr. Unsec. Gtd. Notes, 5.63%, 08/01/24(f) | 25,000 | 23,875 | ||||||
| 37,450 | ||||||||
See accompanying Notes to Financial Statements which are an integral part of the financial statements.
10 Invesco Strategic Real Return Fund
| Principal Amount | Value | |||||||
| Building Products–1.26% | ||||||||
Builders FirstSource, Inc., | $ | 25,000 | $ | 26,344 | ||||
Sr. Unsec. Gtd. Notes, | 30,000 | 30,600 | ||||||
Building Materials Holding Corp., Sr. Sec. Notes, 9.00%, 09/15/18(f) | 25,000 | 26,750 | ||||||
Gibraltar Industries Inc., Sr. Unsec. Gtd. Sub. Global Notes, 6.25%, 02/01/21 | 125,000 | 126,875 | ||||||
| 210,569 | ||||||||
| Cable & Satellite–1.46% | ||||||||
CCO Holdings LLC/CCO Holdings Capital Corp., | 50,000 | 50,687 | ||||||
Sr. Unsec. Gtd. Notes, | ||||||||
5.13%, 05/01/23(f) | 25,000 | 25,125 | ||||||
5.38%, 05/01/25(f) | 25,000 | 24,375 | ||||||
DISH DBS Corp., Sr. Unsec. Gtd. Global Notes, 5.13%, 05/01/20 | 125,000 | 123,125 | ||||||
Intelsat Jackson Holdings S.A. (Luxembourg), | 15,000 | 13,350 | ||||||
6.63%, 12/15/22 | 8,000 | 7,040 | ||||||
| 243,702 | ||||||||
| Casinos & Gaming–0.23% | ||||||||
Boyd Gaming Corp., Sr. Unsec. Gtd. Global Notes, 6.88%, 05/15/23 | 24,000 | 24,960 | ||||||
Mohegan Tribal Gaming Authority, Sr. Unsec. Gtd. Notes, 9.75%, 09/01/21(f) | 13,000 | 13,455 | ||||||
| 38,415 | ||||||||
| Commercial Printing–0.06% | ||||||||
Multi-Color Corp., Sr. Unsec. Gtd. Notes, 6.13%, 12/01/22(f) | 10,000 | 10,238 | ||||||
| Computer & Electronics Retail–0.13% | ||||||||
Rent-A-Center, Inc., Sr. Unsec. Gtd. Global Notes, 4.75%, 05/01/21 | 26,000 | 22,230 | ||||||
| Construction & Engineering–0.14% | ||||||||
AECOM, Sr. Unsec. Gtd. Notes, 5.75%, 10/15/22(f) | 23,000 | 22,993 | ||||||
| Construction Machinery & Heavy Trucks–1.67% | ||||||||
Allied Specialty Vehicles, Inc., Sr. Sec. Notes, 8.50%, 11/01/19(f) | 25,000 | 26,313 | ||||||
Meritor Inc., Sr. Unsec. Gtd. Notes, 6.25%, 02/15/24 | 125,000 | 122,500 | ||||||
Navistar International Corp., Sr. Unsec. Gtd. Notes, 8.25%, 11/01/21 | 82,000 | 71,442 | ||||||
Oshkosh Corp., Sr. Unsec. Gtd. Global Notes, 5.38%, 03/01/25 | 58,000 | 58,435 | ||||||
| 278,690 | ||||||||
| Construction Materials–0.26% | ||||||||
Building Materials Corp. of America, | 25,000 | 25,656 | ||||||
| Principal Amount | Value | |||||||
| Construction Materials–(continued) | ||||||||
Shea Homes L.P./Shea Homes Funding Corp., Sr. Unsec. Gtd. Notes, | $ | 3,000 | $ | 3,090 | ||||
Unifrax I LLC/Unifrax Holding Co., Sr. Unsec. Gtd. Notes, 7.50%, 02/15/19(f) | 15,000 | 15,113 | ||||||
| 43,859 | ||||||||
| Consumer Finance–0.11% | ||||||||
Ally Financial Inc., Sr. Unsec. Global Notes, | ||||||||
4.63%, 03/30/25 | 15,000 | 14,550 | ||||||
5.13%, 09/30/24 | 4,000 | 4,040 | ||||||
| 18,590 | ||||||||
| Data Processing & Outsourced Services–0.55% | ||||||||
First Data Corp., Sr. Unsec. Gtd. Sub. Global Notes, 11.75%, 08/15/21 | 81,000 | 91,631 | ||||||
| Diversified Chemicals–0.03% | ||||||||
Tronox Finance LLC, Sr. Unsec. Gtd. Notes, 7.50%, 03/15/22(f) | 6,000 | 4,860 | ||||||
| Diversified Metals & Mining–0.05% | ||||||||
Compass Minerals International, Inc., | 8,000 | 7,740 | ||||||
| Electrical Components & Equipment–0.05% | ||||||||
EnerSys, Sr. Unsec. Gtd. Notes, 5.00%, 04/30/23(f) | 8,000 | 7,750 | ||||||
| Environmental & Facilities Services–0.09% | ||||||||
ADS Waste Holdings, Inc., Sr. Unsec. Gtd. Global Notes, 8.25%, 10/01/20 | 15,000 | 15,619 | ||||||
| Gas Utilities–0.07% | ||||||||
Ferrellgas L.P./Ferrellgas Finance Corp., Sr. Unsec. Gtd. Notes, | 8,000 | 7,760 | ||||||
Suburban Propane Partners, L.P./Suburban Energy Finance Corp., Sr. Unsec. Global Notes, 5.50%, 06/01/24 | 4,000 | 3,780 | ||||||
| 11,540 | ||||||||
| General Merchandise Stores–0.16% | ||||||||
Dollar Tree, Inc., Sr. Unsec. Gtd. Notes, 5.75%, 03/01/23(f) | 25,000 | 26,375 | ||||||
| Health Care Facilities–1.36% | ||||||||
Community Health Systems, Inc., | 15,000 | 16,012 | ||||||
HCA, Inc., Sr. Unsec. Gtd. Notes, 5.38%, 02/01/25 | 27,000 | 27,675 | ||||||
Surgical Care Affiliates, Inc., Sr. Unsec. Gtd. Notes, 6.00%, 04/01/23(f) | 15,000 | 15,225 | ||||||
Tenet Healthcare Corp., Sr. Unsec. | ||||||||
6.75%, 02/01/20 | 125,000 | 131,875 | ||||||
6.75%, 06/15/23 | 7,000 | 7,280 | ||||||
8.13%, 04/01/22 | 25,000 | 27,750 | ||||||
| 225,817 | ||||||||
See accompanying Notes to Financial Statements which are an integral part of the financial statements.
11 Invesco Strategic Real Return Fund
| Principal Amount | Value | |||||||
| Health Care Services–0.35% | ||||||||
MPH Acquisition Holdings LLC, Sr. Unsec. Gtd. Notes, 6.63%, 04/01/22(f) | $ | 30,000 | $ | 30,900 | ||||
Omnicare Inc., Sr. Unsec. Gtd. Notes, 5.00%, 12/01/24 | 25,000 | 26,969 | ||||||
| 57,869 | ||||||||
| Home Improvement Retail–0.14% | ||||||||
Hillman Group Inc. (The), Sr. Unsec. Notes, 6.38%, 07/15/22(f) | 25,000 | 23,500 | ||||||
| Homebuilding–0.76% | ||||||||
Beazer Homes USA Inc., Sr. Unsec. Gtd. Global Notes, 7.50%, 09/15/21 | 35,000 | 34,650 | ||||||
K. Hovnanian Enterprises Inc., Sr. Unsec. Gtd. Notes, | ||||||||
7.00%, 01/15/19(f) | 25,000 | 19,406 | ||||||
8.00%, 11/01/19(f) | 24,000 | 18,570 | ||||||
Meritage Homes Corp., Sr. Unsec. Gtd. Global Notes, | ||||||||
6.00%, 06/01/25 | 13,000 | 12,968 | ||||||
7.15%, 04/15/20 | 5,000 | 5,419 | ||||||
Ryland Group Inc. (The), Sr. Unsec. Gtd. Notes, | 25,000 | 25,406 | ||||||
Taylor Morrison Communities Inc./Monarch Communities Inc., Sr. Unsec. Gtd. Notes, 5.88%, 04/15/23(f) | 10,000 | 10,100 | ||||||
| 126,519 | ||||||||
| Household Products–0.86% | ||||||||
Reynolds Group Issuer Inc./LLC (New Zealand), Sr. Unsec. Gtd. Global Notes, 8.25%, 02/15/21 | 125,000 | 128,281 | ||||||
Springs Industries, Inc., Sr. Sec. Global Notes, 6.25%, 06/01/21 | 15,000 | 15,019 | ||||||
| 143,300 | ||||||||
| Independent Power Producers & Energy Traders–0.23% | ||||||||
AES Corp., Sr. Unsec. Notes, 5.50%, 04/15/25 | 5,000 | 4,725 | ||||||
Calpine Corp., Sr. Unsec. Global Notes, 5.50%, 02/01/24 | 34,000 | 33,192 | ||||||
| 37,917 | ||||||||
| Integrated Oil & Gas–0.16% | ||||||||
California Resources Corp., Sr. Unsec. Gtd. Global Notes, 5.50%, 09/15/21 | 33,000 | 25,740 | ||||||
| Internet Retail–0.11% | ||||||||
Netflix, Inc., Sr. Unsec. Global Notes, 5.75%, 03/01/24 | 17,000 | 17,765 | ||||||
| Internet Software & Services–0.54% | ||||||||
EarthLink Holdings Corp., Sr. Sec. Gtd. First Lien Global Notes, 7.38%, 06/01/20 | 35,000 | 36,662 | ||||||
Equinix Inc., Sr. Unsec. Notes, 5.38%, 01/01/22 | 52,000 | 52,650 | ||||||
| 89,312 | ||||||||
| Principal Amount | Value | |||||||
| Leisure Products–0.20% | ||||||||
Party City Holdings Inc., Sr. Unsec. Gtd. Notes, 6.13%, 08/15/23(f) | $ | 12,000 | $ | 12,195 | ||||
Vista Outdoor Inc., Sr. Unsec. Gtd. Notes, 5.88%, 10/01/23(f) | 21,000 | 21,525 | ||||||
| 33,720 | ||||||||
| Metal & Glass Containers–0.32% | ||||||||
Berry Plastics Corp., Sec. Gtd. Second Lien Notes, 5.50%, 05/15/22 | 39,000 | 38,025 | ||||||
Owens-Brockway Glass Container, Inc., | ||||||||
Sr. Unsec. Gtd. Notes, | ||||||||
5.88%, 08/15/23(f) | 6,000 | 6,097 | ||||||
6.38%, 08/15/25(f) | 9,000 | 9,225 | ||||||
| 53,347 | ||||||||
| Office REIT’s–0.46% | ||||||||
CyrusOne L.P./CyrusOne Finance Corp., Sr. Unsec. Gtd. Global Notes, 6.38%, 11/15/22 | 75,000 | 76,687 | ||||||
| Oil & Gas Equipment & Services–0.11% | ||||||||
Exterran Partners, L.P./EXLP Finance Corp., Sr. Unsec. Gtd. Global Notes, 6.00%, 04/01/21 | 23,000 | 18,745 | ||||||
| Oil & Gas Exploration & Production–1.55% | ||||||||
Antero Resources Corp., Sr. Unsec. Gtd. Global Notes, | ||||||||
5.38%, 11/01/21 | 13,000 | 12,090 | ||||||
6.00%, 12/01/20 | 10,000 | 9,650 | ||||||
Carrizo Oil & Gas, Inc., | ||||||||
6.25%, 04/15/23 | 23,000 | 20,872 | ||||||
Sr. Unsec. Gtd. Notes, | ||||||||
7.50%, 09/15/20 | 7,000 | 6,720 | ||||||
Chaparral Energy, Inc., Sr. Unsec. Gtd. Global Notes, 9.88%, 10/01/20 | 17,000 | 9,010 | ||||||
Chesapeake Energy Corp., Sr. Unsec. Gtd. Notes, 6.63%, 08/15/20 | 15,000 | 12,113 | ||||||
Concho Resources Inc., Sr. Unsec. Gtd. Global Notes, | ||||||||
5.50%, 10/01/22 | 8,000 | 7,950 | ||||||
5.50%, 04/01/23 | 27,000 | 26,797 | ||||||
Gulfport Energy Corp., Sr. Unsec. Gtd. Notes, 6.63%, 05/01/23(f) | 6,000 | 5,670 | ||||||
Laredo Petroleum, Inc., Sr. Unsec. Gtd. Global Notes, 7.38%, 05/01/22 | 20,000 | 19,700 | ||||||
Parsley Energy LLC/Parsley Finance Corp., Sr. Unsec. Notes, 7.50%, 02/15/22(f) | 12,000 | 11,820 | ||||||
Range Resources Corp., | ||||||||
Sr. Unsec. Gtd. Sub. Global Notes, | ||||||||
5.00%, 03/15/23 | 17,000 | 15,555 | ||||||
Sr. Unsec. Gtd. Sub. Notes, | ||||||||
5.00%, 08/15/22 | 7,000 | 6,493 | ||||||
5.75%, 06/01/21 | 10,000 | 9,700 | ||||||
Rice Energy Inc., Sr. Unsec. Gtd. Notes, 7.25%, 05/01/23(f) | 28,000 | 26,320 | ||||||
See accompanying Notes to Financial Statements which are an integral part of the financial statements.
12 Invesco Strategic Real Return Fund
| Principal Amount | Value | |||||||
| Oil & Gas Exploration & Production–(continued) | ||||||||
RSP Permian, Inc., Sr. Unsec. Gtd. Notes, | ||||||||
6.63%, 10/01/22(f) | $ | 4,000 | $ | 3,960 | ||||
6.63%, 10/01/22(f) | 9,000 | 8,910 | ||||||
SandRidge Energy, Inc., Sr. Unsec. Gtd. Global Notes, 7.50%, 03/15/21 | 13,000 | 3,770 | ||||||
SM Energy Co., Sr. Unsec. Global Notes, 6.50%, 01/01/23 | 9,000 | 8,685 | ||||||
Whiting Petroleum Corp., Sr. Unsec. Gtd. Notes, | ||||||||
5.00%, 03/15/19 | 8,000 | 7,200 | ||||||
5.75%, 03/15/21 | 4,000 | 3,600 | ||||||
WPX Energy, Inc., Sr. Unsec. Notes, 7.50%, 08/01/20 | 22,400 | 21,616 | ||||||
| 258,201 | ||||||||
| Oil & Gas Storage & Transportation–0.78% | ||||||||
Crestwood Midstream Partners L.P./Crestwood Midstream Finance Corp., Sr. Unsec. Gtd. Global Bonds, 6.13%, 03/01/22 | 6,000 | 5,550 | ||||||
Energy Transfer Equity, L.P., | ||||||||
Sr. Sec. First Lien Notes, | ||||||||
5.50%, 06/01/27 | 14,000 | 13,160 | ||||||
Sr. Sec. Gtd. First Lien Notes, | ||||||||
7.50%, 10/15/20 | 65,000 | 69,956 | ||||||
Genesis Energy L.P./Genesis Energy Finance Corp., Sr. Unsec. Gtd. Notes, 6.75%, 08/01/22 | 15,000 | 14,625 | ||||||
Targa Resources Partners L.P./Targa Resources Partners Finance Corp., | ||||||||
Sr. Unsec. Gtd. Global Bonds, | ||||||||
5.25%, 05/01/23 | 10,000 | 9,450 | ||||||
Sr. Unsec. Gtd. Global Notes, | ||||||||
6.88%, 02/01/21 | 11,000 | 11,055 | ||||||
Teekay Offshore Partners L.P./Teekay Offshore Finance Corp. (Bermuda), Sr. Unsec. Global Notes, 6.00%, 07/30/19 | 5,000 | 4,263 | ||||||
Tesoro Logistics L.P./Tesoro Logistics Finance Corp., Sr. Unsec. Gtd. Notes, 6.25%, 10/15/22(f) | 2,000 | 2,010 | ||||||
| 130,069 | ||||||||
| Packaged Foods & Meats–0.04% | ||||||||
WhiteWave Foods Co. (The), Sr. Unsec. Gtd. Notes, 5.38%, 10/01/22 | 7,000 | 7,280 | ||||||
| Paper Packaging–0.04% | ||||||||
Graphic Packaging International Inc., Sr. Unsec. Gtd. Notes, | ||||||||
4.75%, 04/15/21 | 2,000 | 2,040 | ||||||
4.88%, 11/15/22 | 4,000 | 4,050 | ||||||
| 6,090 | ||||||||
| Paper Products–0.11% | ||||||||
Clearwater Paper Corp., | ||||||||
Sr. Unsec. Gtd. Global Notes, | ||||||||
4.50%, 02/01/23 | 3,000 | 2,865 | ||||||
Sr. Unsec. Gtd. Notes, | ||||||||
5.38%, 02/01/25(f) | 8,000 | 7,800 | ||||||
| Principal Amount | Value | |||||||
| Paper Products–(continued) | ||||||||
Mercer International Inc., Sr. Unsec. Gtd. Global Notes, 7.00%, 12/01/19 | $ | 7,000 | $ | 7,201 | ||||
| 17,866 | ||||||||
| Personal Products–0.06% | ||||||||
Elizabeth Arden, Inc., Sr. Unsec. Global Notes, 7.38%, 03/15/21 | 15,000 | 9,788 | ||||||
| Pharmaceuticals–0.33% | ||||||||
Concordia Healthcare Corp. (Canada), Sr. Unsec. Gtd. Notes, | 16,000 | 16,520 | ||||||
Quintiles Transnational Corp., Sr. Unsec. Gtd. Notes, 4.88%, 05/15/23(f) | 3,000 | 3,068 | ||||||
Valeant Pharmaceuticals International, Inc., Sr. Unsec. Gtd. Notes, | 25,000 | 25,312 | ||||||
5.88%, 05/15/23(f) | 5,000 | 5,138 | ||||||
6.13%, 04/15/25(f) | 5,000 | 5,187 | ||||||
| 55,225 | ||||||||
| Regional Banks–0.77% | ||||||||
CIT Group Inc., Sr. Unsec. Global Notes, 5.00%, 08/15/22 | 125,000 | 127,812 | ||||||
| Restaurants–0.40% | ||||||||
1011778 BC ULC/ New Red Finance, Inc. (Canada), | ||||||||
Sec. Gtd. Second Lien Notes, | ||||||||
6.00%, 04/01/22(f) | 37,000 | 38,156 | ||||||
Sr. Sec. Gtd. First Lien Notes, | ||||||||
4.63%, 01/15/22(f) | 8,000 | 8,070 | ||||||
Carrols Restaurant Group, Inc., Sec. Gtd. Second Lien Global Notes, 8.00%, 05/01/22 | 19,000 | 20,116 | ||||||
| 66,342 | ||||||||
| Semiconductor Equipment–0.64% | ||||||||
Amkor Technology Inc., Sr. Unsec. Global Notes, 6.38%, 10/01/22 | 108,000 | 105,840 | ||||||
| Specialized Consumer Services–0.03% | ||||||||
ServiceMaster Co., LLC (The), Sr. Unsec. Notes, 7.45%, 08/15/27 | 5,000 | 5,069 | ||||||
| Specialized Finance–1.63% | ||||||||
Aircastle Ltd., Sr. Unsec. Global Notes, 7.63%, 04/15/20 | 118,000 | 134,520 | ||||||
International Lease Finance Corp., | 115,000 | 137,425 | ||||||
| 271,945 | ||||||||
| Specialized REIT’s–0.77% | ||||||||
Crown Castle International Corp., Sr. Unsec. Notes, 4.88%, 04/15/22 | 125,000 | 128,906 | ||||||
| Steel–0.04% | ||||||||
FMG Resources (August 2006) Pty. Ltd. (Australia), Sr. Unsec. Gtd. Notes, 8.25%, 11/01/19(f) | 9,000 | 6,998 | ||||||
See accompanying Notes to Financial Statements which are an integral part of the financial statements.
13 Invesco Strategic Real Return Fund
| Principal Amount | Value | |||||||
| Trading Companies & Distributors–0.11% | ||||||||
United Rentals North America Inc., Sr. Unsec. Gtd. Global Notes, 5.50%, 07/15/25 | $ | 18,000 | $ | 17,415 | ||||
| Trucking–0.08% | ||||||||
OPE KAG Finance Sub. Inc., Sr. Unsec. Notes, | 13,000 | 13,357 | ||||||
| Wireless Telecommunication Services–1.73% | ||||||||
SBA Communications Corp., Sr. Unsec. Global Notes, | 25,000 | 24,875 | ||||||
Sprint Capital Corp., Sr. Unsec. Gtd. Global Notes, 6.88%, 11/15/28 | 20,000 | 17,300 | ||||||
Sprint Communications Inc., | 125,000 | 112,813 | ||||||
T-Mobile USA, Inc., Sr. Unsec. Gtd. Global Bonds, 6.84%, 04/28/23 | 125,000 | 132,187 | ||||||
| 287,175 | ||||||||
Total Bonds and Notes |
| 3,870,253 | ||||||
| Shares | Value | |||||||
Money Market Funds–1.99% |
| |||||||
Liquid Assets Portfolio–Institutional Class, 0.12%(h) | 165,429 | $ | 165,429 | |||||
Premier Portfolio–Institutional Class, 0.09%(h) | 165,429 | 165,429 | ||||||
Total Money Market Funds |
| 330,858 | ||||||
TOTAL INVESTMENTS–99.71% |
| 16,608,412 | ||||||
OTHER ASSETS LESS LIABILITIES–0.29% |
| 49,012 | ||||||
NET ASSETS–100.00% |
| $ | 16,657,424 | |||||
Investment Abbreviations:
| Gtd. | – Guaranteed | |
| PIK | – Payment in Kind | |
| REIT | – Real Estate Investment Trust | |
| Sec. | – Secured | |
| Sr. | – Senior | |
| Sub. | – Subordinated | |
| Unsec. | – Unsecured |
Notes to Schedule of Investments:
| (a) | Industry and/or sector classifications used in this report are generally according to the Global Industry Classification Standard, which was developed by and is the exclusive property and a service mark of MSCI Inc. and Standard & Poor’s. |
| (b) | Security traded on a discount basis. The interest rate shown represents the discount rate at the time of purchase by the Fund. |
| (c) | All or a portion of the value was pledged as collateral to cover margin requirements for open futures contracts. See Note 1L and Note 4. |
| (d) | Principal amount of security and interest payments are adjusted for inflation. See Note 1I. |
| (e) | Invesco Floating Rate Fund and the Fund are affiliated by either having the same investment adviser or an investment adviser under common control with the Fund’s investment adviser. The value of this security as of August 31, 2015 represented 29.89% of the Fund’s Net Assets. See Note 5. |
| (f) | Security purchased or received in a transaction exempt from registration under the Securities Act of 1933, as amended (the “1933 Act”). The security may be resold pursuant to an exemption from registration under the 1933 Act, typically to qualified institutional buyers. The aggregate value of these securities at August 31, 2015 was $799,694, which represented 4.80% of the Fund’s Net Assets. |
| (g) | All or a portion of this security is Payment-in-Kind. |
| Issuer | Cash Rate | PIK Rate | ||||||
Alphabet Holding Co., Inc., Sr. Unsec. Global PIK Notes | — | 8.50 | % | |||||
| (h) | The money market fund and the Fund are affiliated by having the same investment adviser. The rate shown is the 7-day SEC standardized yield as of August 31, 2015. |
See accompanying Notes to Financial Statements which are an integral part of the financial statements.
14 Invesco Strategic Real Return Fund
Statement of Assets and Liabilities
August 31, 2015
Assets: |
| |||
Investments, at value (Cost $11,532,253) | $ | 11,298,129 | ||
Investments in affiliates, at value (Cost $5,566,366) | 5,310,283 | |||
Total investments, at value (Cost $17,098,619) | 16,608,412 | |||
Receivable for: | ||||
Investments sold | 7,803 | |||
Variation margin — futures | 141 | |||
Fund shares sold | 1,724 | |||
Dividends and interest | 100,859 | |||
Investment for trustee deferred compensation and retirement plans | 2,343 | |||
Other assets | 36,585 | |||
Total assets | 16,757,867 | |||
Liabilities: |
| |||
Payable for: | ||||
Investments purchased | 50,148 | |||
Fund shares reacquired | 1,000 | |||
Accrued fees to affiliates | 3,427 | |||
Accrued trustees’ and officers’ fees and benefits | 3,308 | |||
Accrued other operating expenses | 40,217 | |||
Trustee deferred compensation and retirement plans | 2,343 | |||
Total liabilities | 100,443 | |||
Net assets applicable to shares outstanding | $ | 16,657,424 | ||
Net assets consist of: |
| |||
Shares of beneficial interest | $ | 17,258,385 | ||
Undistributed net investment income | 68,101 | |||
Undistributed net realized gain (loss) | (178,868 | ) | ||
Net unrealized appreciation (depreciation) | (490,194 | ) | ||
| $ | 16,657,424 | |||
Net Assets: |
| |||
Class A | $ | 8,935,815 | ||
Class C | $ | 458,767 | ||
Class R | $ | 34,666 | ||
Class Y | $ | 7,208,912 | ||
Class R5 | $ | 9,632 | ||
Class R6 | $ | 9,632 | ||
Shares outstanding, $0.01 par value per share, |
| |||
Class A | 928,899 | |||
Class C | 47,736 | |||
Class R | 3,604 | |||
Class Y | 749,236 | |||
Class R5 | 1,001 | |||
Class R6 | 1,001 | |||
Class A: | ||||
Net asset value per share | $ | 9.62 | ||
Maximum offering price per share | ||||
(Net asset value of $9.62 ¸ 97.50%) | $ | 9.87 | ||
Class C: | ||||
Net asset value and offering price per share | $ | 9.61 | ||
Class R: | ||||
Net asset value and offering price per share | $ | 9.62 | ||
Class Y: | ||||
Net asset value and offering price per share | $ | 9.62 | ||
Class R5: | ||||
Net asset value and offering price per share | $ | 9.62 | ||
Class R6: | ||||
Net asset value and offering price per share | $ | 9.62 | ||
See accompanying Notes to Financial Statements which are an integral part of the financial statements.
15 Invesco Strategic Real Return Fund
Statement of Operations
For the year ended August 31, 2015
Investment income: |
| |||
Interest | $ | 287,715 | ||
Dividends from affiliated underlying funds | 245,840 | |||
Total investment income | 533,555 | |||
Expenses: | ||||
Advisory fees | 64,542 | |||
Administrative services fees | 50,000 | |||
Custodian fees | 7,608 | |||
Distribution fees: | ||||
Class A | 20,904 | |||
Class C | 3,803 | |||
Class R | 92 | |||
Transfer agent fees — A, C, R and Y | 5,206 | |||
Transfer agent fees — R5 | 10 | |||
Transfer agent fees — R6 | 10 | |||
Trustees’ and officers’ fees and benefits | 20,300 | |||
Registration and filing fees | 93,261 | |||
Reports to shareholders | 18,900 | |||
Professional services fees | 46,514 | |||
Other | 16,389 | |||
Total expenses | 347,539 | |||
Less: Fees waived and expenses reimbursed | (266,937 | ) | ||
Net expenses | 80,602 | |||
Net investment income | 452,953 | |||
Realized and unrealized gain (loss) from: | ||||
Net realized gain (loss) from: | ||||
Investment securities | (153,893 | ) | ||
Futures contracts | (15,181 | ) | ||
| (169,074 | ) | |||
Change in net unrealized appreciation (depreciation) of: | ||||
Investment securities | (632,748 | ) | ||
Futures contracts | (260 | ) | ||
| (633,008 | ) | |||
Net realized and unrealized gain (loss) | (802,082 | ) | ||
Net increase (decrease) in net assets resulting from operations | $ | (349,129 | ) | |
See accompanying Notes to Financial Statements which are an integral part of the financial statements.
16 Invesco Strategic Real Return Fund
Statement of Changes in Net Assets
For the years ended August 31, 2015 and 2014
| 2015 | 2014 | |||||||
Operations: | ||||||||
Net investment income | $ | 452,953 | $ | 224,456 | ||||
Net realized gain (loss) | (169,074 | ) | 4,055 | |||||
Change in net unrealized appreciation (depreciation) | (633,008 | ) | 142,814 | |||||
Net increase (decrease) in net assets resulting from operations | (349,129 | ) | 371,325 | |||||
Distributions to shareholders from net investment income: | ||||||||
Class A | (219,582 | ) | (101,299 | ) | ||||
Class C | (6,386 | ) | (114 | ) | ||||
Class R | (387 | ) | (127 | ) | ||||
Class Y | (215,309 | ) | (104,346 | ) | ||||
Class R5 | (288 | ) | (140 | ) | ||||
Class R6 | (288 | ) | (140 | ) | ||||
Total distributions from net investment income | (442,240 | ) | (206,166 | ) | ||||
Share transactions–net: | ||||||||
Class A | 1,466,432 | 7,797,368 | ||||||
Class C | 418,097 | 53,818 | ||||||
Class R | 25,789 | 10,010 | ||||||
Class Y | 12,090 | 7,480,010 | ||||||
Class R5 | — | 10,010 | ||||||
Class R6 | — | 10,010 | ||||||
Net increase in net assets resulting from share transactions | 1,922,408 | 15,361,226 | ||||||
Net increase in net assets | 1,131,039 | 15,526,385 | ||||||
Net assets: | ||||||||
Beginning of year | 15,526,385 | — | ||||||
End of year (includes undistributed net investment income of $68,101 and $45,161, respectively) | $ | 16,657,424 | $ | 15,526,385 | ||||
Notes to Financial Statements
August 31, 2015
NOTE 1—Significant Accounting Policies
Invesco Strategic Real Return Fund (the “Fund”) is a series portfolio of AIM Counselor Series Trust (Invesco Counselor Series Trust) (the “Trust”). The Trust is a Delaware statutory trust registered under the Investment Company Act of 1940, as amended (the “1940 Act”), as an open-end series management investment company consisting of thirteen separate portfolios, each authorized to issue an unlimited number of shares of beneficial interest. The assets, liabilities and operations of each portfolio are accounted for separately. Information presented in these financial statements pertains only to the Fund. Matters affecting each portfolio or class will be voted on exclusively by the shareholders of such portfolio or class.
The Fund’s investment objective is to seek to mitigate the effects of unanticipated inflation and to provide current income.
The Fund currently consists of six different classes of shares: Class A, Class C, Class R, Class Y, Class R5 and Class R6. Class A shares are sold with a front-end sales charge unless certain waiver criteria are met and under certain circumstances load waived shares may be subject to contingent deferred sales charges (“CDSC”). Class C shares are sold with a CDSC. Class R, Class Y, Class R5 and Class R6 shares are sold at net asset value.
The following is a summary of the significant accounting policies followed by the Fund in the preparation of its financial statements.
| A. | Security Valuations — Securities, including restricted securities, are valued according to the following policy. |
Debt obligations (including convertible securities) and unlisted equities are fair valued using an evaluated quote provided by an independent pricing service. Evaluated quotes provided by the pricing service may be determined without exclusive reliance on quoted prices, and may reflect appropriate factors such as institution-size trading in similar groups of securities, developments related to specific securities, dividend rate (for unlisted equities), yield (for debt obligations), quality, type of issue, coupon rate (for debt obligations), maturity (for debt obligations), individual trading characteristics and other market data. Debt obligations are subject to interest rate and credit risks. In addition, all debt obligations involve some risk of default with respect to interest and/or principal payments.
A security listed or traded on an exchange (except convertible securities) is valued at its last sales price or official closing price as of the close of the customary trading session on the exchange where the security is principally traded, or lacking any sales or official closing price on a particular day, the security may be valued at the closing bid price on that day. Securities traded in the over-the-counter market are valued based on prices furnished by independent pricing services or market makers. When such securities are valued by an independent pricing service they may be considered fair valued. Futures contracts are valued at the final settlement price set by an exchange on which they are principally traded.
17 Invesco Strategic Real Return Fund
Listed options are valued at the mean between the last bid and asked prices from the exchange on which they are principally traded. Options not listed on an exchange are valued by an independent source at the mean between the last bid and asked prices. For purposes of determining net asset value (“NAV”) per share, futures and option contracts generally are valued 15 minutes after the close of the customary trading session of the New York Stock Exchange (“NYSE”).
Investments in open-end and closed-end registered investment companies that do not trade on an exchange are valued at the end-of-day net asset value per share. Investments in open-end and closed-end registered investment companies that trade on an exchange are valued at the last sales price or official closing price as of the close of the customary trading session on the exchange where the security is principally traded.
Foreign securities’ (including foreign exchange contracts) prices are converted into U.S. dollar amounts using the applicable exchange rates as of the close of the NYSE. If market quotations are available and reliable for foreign exchange-traded equity securities, the securities will be valued at the market quotations. Because trading hours for certain foreign securities end before the close of the NYSE, closing market quotations may become unreliable. If between the time trading ends on a particular security and the close of the customary trading session on the NYSE, events occur that the Adviser determines are significant and make the closing price unreliable, the Fund may fair value the security. If the event is likely to have affected the closing price of the security, the security will be valued at fair value in good faith using procedures approved by the Board of Trustees. Adjustments to closing prices to reflect fair value may also be based on a screening process of an independent pricing service to indicate the degree of certainty, based on historical data, that the closing price in the principal market where a foreign security trades is not the current value as of the close of the NYSE. Foreign securities’ prices meeting the approved degree of certainty that the price is not reflective of current value will be priced at the indication of fair value from the independent pricing service. Multiple factors may be considered by the independent pricing service in determining adjustments to reflect fair value and may include information relating to sector indices, American Depositary Receipts and domestic and foreign index futures. Foreign securities may have additional risks including exchange rate changes, potential for sharply devalued currencies and high inflation, political and economic upheaval, the relative lack of issuer information, relatively low market liquidity and the potential lack of strict financial and accounting controls and standards.
Securities for which market prices are not provided by any of the above methods may be valued based upon quotes furnished by independent sources. The last bid price may be used to value equity securities. The mean between the last bid and asked prices is used to value debt obligations, including corporate loans.
Securities for which market quotations are not readily available or became unreliable are valued at fair value as determined in good faith by or under the supervision of the Trust’s officers following procedures approved by the Board of Trustees. Issuer specific events, market trends, bid/asked quotes of brokers and information providers and other market data may be reviewed in the course of making a good faith determination of a security’s fair value.
The Fund may invest in securities that are subject to interest rate risk, meaning the risk that the prices will generally fall as interest rates rise and, conversely, the prices will generally rise as interest rates fall. Specific securities differ in their sensitivity to changes in interest rates depending on their individual characteristics. Changes in interest rates may result in increased market volatility, which may affect the value and/or liquidity of certain Fund investments.
Valuations change in response to many factors including the historical and prospective earnings of the issuer, the value of the issuer’s assets, general economic conditions, interest rates, investor perceptions and market liquidity. Because of the inherent uncertainties of valuation, the values reflected in the financial statements may materially differ from the value received upon actual sale of those investments.
| B. | Securities Transactions and Investment Income — Securities transactions are accounted for on a trade date basis. Realized gains or losses on sales are computed on the basis of specific identification of the securities sold. Interest income (net of withholding tax, if any) is recorded on the accrual basis from settlement date. Dividend income (net of withholding tax, if any) is recorded on the ex-dividend date. Bond premiums and discounts are amortized and/or accreted for financial reporting purposes. |
The Fund may periodically participate in litigation related to Fund investments. As such, the Fund may receive proceeds from litigation settlements. Any proceeds received are included in the Statement of Operations as realized gain (loss) for investments no longer held and as unrealized gain (loss) for investments still held.
Brokerage commissions and mark ups are considered transaction costs and are recorded as an increase to the cost basis of securities purchased and/or a reduction of proceeds on a sale of securities. Such transaction costs are included in the determination of net realized and unrealized gain (loss) from investment securities reported in the Statement of Operations and the Statement of Changes in Net Assets and the net realized and unrealized gains (losses) on securities per share in the Financial Highlights. Transaction costs are included in the calculation of the Fund’s net asset value and, accordingly, they reduce the Fund’s total returns. These transaction costs are not considered operating expenses and are not reflected in net investment income reported in the Statement of Operations and the Statement of Changes in Net Assets, or the net investment income per share and the ratios of expenses and net investment income reported in the Financial Highlights, nor are they limited by any expense limitation arrangements between the Fund and the investment adviser.
The Fund allocates income and realized and unrealized capital gains and losses to a class based on the relative net assets of each class.
| C. | Country Determination — For the purposes of making investment selection decisions and presentation in the Schedule of Investments, the investment adviser may determine the country in which an issuer is located and/or credit risk exposure based on various factors. These factors include the laws of the country under which the issuer is organized, where the issuer maintains a principal office, the country in which the issuer derives 50% or more of its total revenues and the country that has the primary market for the issuer’s securities, as well as other criteria. Among the other criteria that may be evaluated for making this determination are the country in which the issuer maintains 50% or more of its assets, the type of security, financial guarantees and enhancements, the nature of the collateral and the sponsor organization. Country of issuer and/or credit risk exposure has been determined to be the United States of America, unless otherwise noted. |
| D. | Distributions — Distributions from net investment income, if any, are declared and paid monthly. Distributions from net realized capital gain, if any, are generally declared and paid annually and recorded on the ex-dividend date. The Fund may elect to treat a portion of the proceeds from redemptions as distributions for federal income tax purposes. |
| E. | Federal Income Taxes — The Fund intends to comply with the requirements of Subchapter M of the Internal Revenue Code of 1986, as amended (the “Internal Revenue Code”), necessary to qualify as a regulated investment company and to distribute substantially all of the Fund’s |
18 Invesco Strategic Real Return Fund
| taxable earnings to shareholders. As such, the Fund will not be subject to federal income taxes on otherwise taxable income (including net realized capital gain) that is distributed to shareholders. Therefore, no provision for federal income taxes is recorded in the financial statements. |
The Fund recognizes the tax benefits of uncertain tax positions only when the position is more likely than not to be sustained. Management has analyzed the Fund’s uncertain tax positions and concluded that no liability for unrecognized tax benefits should be recorded related to uncertain tax positions. Management is not aware of any tax positions for which it is reasonably possible that the total amounts of unrecognized tax benefits will change materially in the next 12 months.
The Fund files tax returns in the U.S. Federal jurisdiction and certain other jurisdictions. Generally, the Fund is subject to examinations by such taxing authorities for up to three years after the filing of the return for the tax period.
| F. | Expenses — Fees provided for under the Rule 12b-1 plan of a particular class of the Fund are charged to the operations of such class. Transfer agency fees and expenses and other shareholder recordkeeping fees and expenses attributable to Class R5 and Class R6 are allocated to each share class based on relative net assets. Sub-accounting fees attributable to Class R5 are charged to the operations of the class. Transfer agency fees and expenses and other shareholder recordkeeping fees and expenses relating to all other classes are allocated among those classes based on relative net assets. All other expenses are allocated among the classes based on relative net assets. |
| G. | Accounting Estimates — The preparation of financial statements in conformity with accounting principles generally accepted in the United States of America (“GAAP”) requires management to make estimates and assumptions that affect the reported amounts of assets and liabilities at the date of the financial statements and the reported amounts of revenues and expenses during the reporting period including estimates and assumptions related to taxation. Actual results could differ from those estimates by a significant amount. In addition, the Fund monitors for material events or transactions that may occur or become known after the period-end date and before the date the financial statements are released to print. |
| H. | Indemnifications — Under the Trust’s organizational documents, each Trustee, officer, employee or other agent of the Trust is indemnified against certain liabilities that may arise out of the performance of their duties to the Fund. Additionally, in the normal course of business, the Fund enters into contracts, including the Fund’s servicing agreements, that contain a variety of indemnification clauses. The Fund’s maximum exposure under these arrangements is unknown as this would involve future claims that may be made against the Fund that have not yet occurred. The risk of material loss as a result of such indemnification claims is considered remote. |
| I. | Treasury Inflation-Protected Securities — The Fund may invest in Treasury Inflation-Protected Securities (“TIPS”). TIPS are fixed income securities whose principal value is periodically adjusted to the rate of inflation. The principal value of TIPS will be adjusted upward or downward, and any increase or decrease in the principal amount of TIPS will be included as interest income in the Statement of Operations, even though investors do not receive their principal until maturity. |
| J. | Foreign Currency Translations — Foreign currency is valued at the close of the NYSE based on quotations posted by banks and major currency dealers. Portfolio securities and other assets and liabilities denominated in foreign currencies are translated into U.S. dollar amounts at date of valuation. Purchases and sales of portfolio securities (net of foreign taxes withheld on disposition) and income items denominated in foreign currencies are translated into U.S. dollar amounts on the respective dates of such transactions. The Fund does not separately account for the portion of the results of operations resulting from changes in foreign exchange rates on investments and the fluctuations arising from changes in market prices of securities held. The combined results of changes in foreign exchange rates and the fluctuation of market prices on investments (net of estimated foreign tax withholding) are included with the net realized and unrealized gain or loss from investments in the Statement of Operations. Reported net realized foreign currency gains or losses arise from (1) sales of foreign currencies, (2) currency gains or losses realized between the trade and settlement dates on securities transactions, and (3) the difference between the amounts of dividends, interest, and foreign withholding taxes recorded on the Fund’s books and the U.S. dollar equivalent of the amounts actually received or paid. Net unrealized foreign currency gains and losses arise from changes in the fair values of assets and liabilities, other than investments in securities at fiscal period end, resulting from changes in exchange rates. |
The Fund may invest in foreign securities, which may be subject to foreign taxes on income, gains on investments or currency repatriation, a portion of which may be recoverable. Foreign taxes, if any, are recorded based on the tax regulations and rates that exist in the foreign markets in which the Fund invests and are shown in the Statement of Operations.
| K. | Forward Foreign Currency Contracts — The Fund may engage in foreign currency transactions either on a spot (i.e. for prompt delivery and settlement) basis, or through forward foreign currency contracts, to manage or minimize currency or exchange rate risk. |
The Fund may also enter into forward foreign currency contracts for the purchase or sale of a security denominated in a foreign currency in order to “lock in” the U.S. dollar price of that security, or the Fund may also enter into forward foreign currency contracts that do not provide for physical settlement of the two currencies, but instead are settled by a single cash payment calculated as the difference between the agreed upon exchange rate and the spot rate at settlement based upon an agreed upon notional amount (non-deliverable forwards). The Fund will set aside liquid assets in an amount equal to daily mark-to-market obligation for forward foreign currency contracts.
A forward foreign currency contract is an obligation between two parties (“Counterparties”) to purchase or sell a specific currency for an agreed-upon price at a future date. The use of forward foreign currency contracts does not eliminate fluctuations in the price of the underlying securities the Fund owns or intends to acquire but establishes a rate of exchange in advance. Fluctuations in the value of these contracts are measured by the difference in the contract date and reporting date exchange rates and are recorded as unrealized appreciation (depreciation) until the contracts are closed. When the contracts are closed, realized gains (losses) are recorded. Realized and unrealized gains (losses) on the contracts are included in the Statement of Operations. The primary risks associated with forward foreign currency contracts include failure of the Counterparty to meet the terms of the contract and the value of the foreign currency changing unfavorably. These risks may be in excess of the amounts reflected in the Statement of Assets and Liabilities.
| L. | Futures Contracts — The Fund may enter into futures contracts to manage exposure to interest rate, equity and market price movements and/or currency risks. A futures contract is an agreement between Counterparties to purchase or sell a specified underlying security, currency or commodity (or delivery of a cash settlement price, in the case of an index future) for a fixed price at a future date. The Fund currently invests only in exchange-traded futures and they are standardized as to maturity date and underlying financial instrument. Initial margin deposits required upon entering into futures contracts are satisfied by the segregation of specific securities or cash as collateral at the futures commission merchant (broker). During the period the futures contracts are open, changes in the value of the contracts are recognized as unrealized gains or |
19 Invesco Strategic Real Return Fund
| losses by recalculating the value of the contracts on a daily basis. Subsequent or variation margin payments are received or made depending upon whether unrealized gains or losses are incurred. These amounts are reflected as receivables or payables on the Statement of Assets and Liabilities. When the contracts are closed or expire, the Fund recognizes a realized gain or loss equal to the difference between the proceeds from, or cost of, the closing transaction and the Fund’s basis in the contract. The net realized gain (loss) and the change in unrealized gain (loss) on futures contracts held during the period is included on the Statement of Operations. The primary risks associated with futures contracts are market risk and the absence of a liquid secondary market. If the Fund were unable to liquidate a futures contract and/or enter into an offsetting closing transaction, the Fund would continue to be subject to market risk with respect to the value of the contracts and continue to be required to maintain the margin deposits on the futures contracts. Futures contracts have minimal Counterparty risk since the exchange’s clearinghouse, as Counterparty to all exchange-traded futures, guarantees the futures against default. Risks may exceed amounts recognized in the Statement of Assets and Liabilities. |
| M. | Collateral — To the extent the Fund has designated or segregated a security as collateral and that security is subsequently sold, it is the Fund’s practice to replace such collateral no later than the next business day. |
NOTE 2—Advisory Fees and Other Fees Paid to Affiliates
The Trust has entered into a master investment advisory agreement with Invesco Advisers, Inc. (the “Adviser” or “Invesco”). Under the terms of the investment advisory agreement, the Fund pays an advisory fee to the Adviser based on the annual rate of the Fund’s average daily net assets as follows:
| Average Daily Net Assets | Rate | |||
First $1 billion | 0.40% | |||
Next $2.5 billion | 0.35% | |||
Over $3.5 billion | 0.33% | |||
For the year ended August 31, 2015, the effective advisory fees incurred by the Fund was 0.40%.
Under the terms of a master sub-advisory agreement between the Adviser and each of Invesco Asset Management Deutschland GmbH, Invesco Asset Management Limited, Invesco Asset Management (Japan) Limited, Invesco Hong Kong Limited, Invesco Senior Secured Management, Inc., Invesco Canada Ltd. and Invesco PowerShares Capital Management LLC (collectively, the “Affiliated Sub-Advisers”) the Adviser, not the Fund, may pay 40% of the fees paid to the Adviser to any such Affiliated Sub-Adviser(s) that provide(s) discretionary investment management services to the Fund based on the percentage of assets allocated to such Affiliated Sub-Adviser(s).
Effective May 1, 2015, the Adviser has contractually agreed, through at least December 31, 2015 to waive advisory fees and/or reimburse expenses of all shares to the extent necessary to limit total annual fund operating expenses after fee waiver and/or expense reimbursement (excluding certain items discussed below) of Class A, Class C, Class R, Class Y, Class R5 and Class R6 shares to 0.79%, 1.54%, 1.04%, 0.54%, 0.54% and 0.54%, respectively, of average daily net assets. Prior to May 1, 2015, the Adviser had contractually agreed to waive advisory fees and/or reimburse expenses of all shares to the extent necessary to limit total annual fund operating expenses after fee waiver and/or expense reimbursement (excluding certain items discussed below) of Class A, Class C, Class R, Class Y, Class R5 and Class R6 shares to 0.78%, 1.53%, 1.03%, 0.53%, 0.53% and 0.53%, respectively, of average daily net assets. In determining the Adviser’s obligation to waive advisory fees and/or reimburse expenses, the following expenses are not taken into account, and could cause the total annual fund operating expenses after fee waiver and/or expense reimbursement to exceed the numbers reflected above: (1) interest; (2) taxes; (3) dividend expense on short sales; (4) extraordinary or non-routine items, including litigation expenses; and (5) expenses that the Fund has incurred but did not actually pay because of an expense offset arrangement. Acquired Fund Fees and Expenses are not operating expenses of the Fund directly, but are fees and expenses, including management fees, of the investment companies in which the Fund invests. As a result, the total annual fund operating expenses after expense reimbursement may exceed the expense limits above. Unless Invesco continues the fee waiver agreement, it will terminate on December 31, 2015. The fee waiver agreement cannot be terminated during its term.
Further, the Adviser has contractually agreed, through at least June 30, 2017, to waive the advisory fee payable by the Fund in an amount equal to 100% of the net advisory fees the Adviser receives on the Fund’s investments in certain affiliated funds.
For the year ended August 31, 2015, the Adviser waived advisory fees of $64,542 and reimbursed class level expenses of $104,878, $4,769, $231, $92,257, $130 and $130 of Class A, Class C, Class R, Class Y, Class R5 and Class R6 shares, respectively.
The Trust has entered into a master administrative services agreement with Invesco pursuant to which the Fund has agreed to pay Invesco for certain administrative costs incurred in providing accounting services to the Fund. For the year ended August 31, 2015, expenses incurred under the agreement are shown in the Statement of Operations as Administrative services fees.
The Trust has entered into a transfer agency and service agreement with Invesco Investment Services, Inc. (“IIS”) pursuant to which the Fund has agreed to pay IIS a fee for providing transfer agency and shareholder services to the Fund and reimburse IIS for certain expenses incurred by IIS in the course of providing such services. IIS may make payments to intermediaries that provide omnibus account services, sub-accounting services and/or networking services. All fees payable by IIS to intermediaries that provide omnibus account services or sub-accounting are charged back to the Fund, subject to certain limitations approved by the Trust’s Board of Trustees. For the year ended August 31, 2015, expenses incurred under the agreement are shown in the Statement of Operations as Transfer agent fees.
The Trust has entered into master distribution agreements with Invesco Distributors, Inc. (“IDI”) to serve as the distributor for the Class A, Class C, Class R, Class Y, Class R5 and Class R6 shares of the Fund. The Trust has adopted plans pursuant to Rule 12b-1 under the 1940 Act with respect to the Fund’s Class A, Class C and Class R shares (collectively the “Plans”). The Fund, pursuant to the Plans, pays IDI compensation at the annual rate of 0.25% of the Fund’s average daily net assets of Class A shares, 1.00% of the average daily net assets of Class C shares and 0.50% of the average daily net assets of Class R shares. Of the Plan payments, up to 0.25% of the average daily net assets of each class of shares may be paid to furnish continuing personal shareholder services to customers who purchase and own shares of such classes. Any amounts not paid as a service fee under the Plans would constitute an asset-based sales charge. Rules of the Financial Industry Regulatory Authority (“FINRA”) impose a cap on the total sales charges, including asset-based sales charges, that may be paid by any class of shares of the Fund. For the year ended August 31, 2015, expenses incurred under the Plans are shown in the Statement of Operations as Distribution fees.
20 Invesco Strategic Real Return Fund
Front-end sales commissions and CDSC (collectively, the “sales charges”) are not recorded as expenses of the Fund. Front-end sales commissions are deducted from proceeds from the sales of Fund shares prior to investment in Class A shares of the Fund. CDSC are deducted from redemption proceeds prior to remittance to the shareholder. During the year ended August 31, 2015, IDI advised the Fund that IDI retained $1,601 in front-end sales commissions from the sale of Class A shares and $68 from Class C shares, respectively, for CDSC imposed upon redemptions by shareholders.
Certain officers and trustees of the Trust are officers and directors of the Adviser, IIS and/or IDI.
NOTE 3—Additional Valuation Information
GAAP defines fair value as the price that would be received to sell an asset or paid to transfer a liability in an orderly transaction between market participants at the measurement date, under current market conditions. GAAP establishes a hierarchy that prioritizes the inputs to valuation methods, giving the highest priority to readily available unadjusted quoted prices in an active market for identical assets (Level 1) and the lowest priority to significant unobservable inputs (Level 3), generally when market prices are not readily available or are unreliable. Based on the valuation inputs, the securities or other investments are tiered into one of three levels. Changes in valuation methods may result in transfers in or out of an investment’s assigned level:
| Level 1 — | Prices are determined using quoted prices in an active market for identical assets. |
| Level 2 — | Prices are determined using other significant observable inputs. Observable inputs are inputs that other market participants may use in pricing a security. These may include quoted prices for similar securities, interest rates, prepayment speeds, credit risk, yield curves, loss severities, default rates, discount rates, volatilities and others. |
| Level 3 — | Prices are determined using significant unobservable inputs. In situations where quoted prices or observable inputs are unavailable (for example, when there is little or no market activity for an investment at the end of the period), unobservable inputs may be used. Unobservable inputs reflect the Fund’s own assumptions about the factors market participants would use in determining fair value of the securities or instruments and would be based on the best available information. |
The following is a summary of the tiered valuation input levels, as of August 31, 2015. The level assigned to the securities valuations may not be an indication of the risk or liquidity associated with investing in those securities. Because of the inherent uncertainties of valuation, the values reflected in the financial statements may materially differ from the value received upon actual sale of those investments.
| Level 1 | Level 2 | Level 3 | Total | |||||||||||||
Equity Securities | $ | 5,310,283 | $ | — | $ | — | $ | 5,310,283 | ||||||||
U.S. Treasury Securities | — | 7,427,876 | — | 7,427,876 | ||||||||||||
Corporate Debt Securities | — | 3,870,253 | — | 3,870,253 | ||||||||||||
| 5,310,283 | 11,298,129 | — | 16,608,412 | |||||||||||||
Futures Contracts* | 13 | — | — | 13 | ||||||||||||
Total Investments | $ | 5,310,296 | $ | 11,298,129 | $ | — | $ | 16,608,425 | ||||||||
| * | Unrealized appreciation. |
NOTE 4—Derivative Investments
Value of Derivative Investments at Period-End
The table below summarizes the value of the Fund’s derivative investments, detailed by primary risk exposure, held as of August 31, 2015:
| Value | ||||||||
| Risk Exposure/Derivative Type | Assets | Liabilities | ||||||
Interest rate risk: | ||||||||
Futures contracts(a) | $ | 13 | $ | — | ||||
| (a) | Includes cumulative appreciation of futures contracts. Only current day’s variation margin receivable is reported within the Statement of Assets and Liabilities. |
Effect of Derivative Investments for the year ended August 31, 2015
The table below summarizes the gains (losses) on derivative investments, detailed by primary risk exposure, recognized in earnings during the period:
| Location of Gain (Loss) on Statement of Operations | ||||
| Futures Contracts | ||||
Realized Gain (Loss): | ||||
Interest Rate Risk | $ | (15,181 | ) | |
Change in Net Unrealized Appreciation (Depreciation): | ||||
Interest Rate Risk | (260 | ) | ||
Total | $ | (15,441 | ) | |
The table below summarizes the average notional value of futures contracts outstanding during the period.
| Futures Contracts | ||||
Average notional value | $ | 339,574 | ||
21 Invesco Strategic Real Return Fund
| Open Futures Contracts — Interest Rate Risk | ||||||||||||||||||||
| Futures Contracts | Type of Contract | Number of Contracts | Expiration Month | Notional Value | Unrealized Appreciation | |||||||||||||||
U.S. Treasury 10 Year Notes | Short | 1 | December-2015 | $ | (127,063 | ) | $ | 13 | ||||||||||||
NOTE 5—Investments in Affiliates
The Fund’s Adviser and the adviser for Invesco Floating Rate Fund are subsidiaries of Invesco Ltd. and therefore, Invesco Floating Rate Fund is considered to be affiliated with the Fund. The following is a summary of the transactions in, and earnings from, investments in Invesco Floating Rate Fund for the year ended August 31, 2015.
Value 08/31/14 | Purchases at Cost | Proceeds from Sales | Change in Unrealized Appreciation (Depreciation) | Realized Gain (Loss) | Value 08/31/15 | Dividend Income | ||||||||||||||||||||||
Invesco Floating Rate Fund | $ | 4,952,598 | $ | 275,929 | $ | — | $ | (249,102 | ) | $ | — | $ | 4,979,425 | $ | 245,748 | |||||||||||||
NOTE 6—Trustees’ and Officers’ Fees and Benefits
Trustees’ and Officers’ Fees and Benefits include amounts accrued by the Fund to pay remuneration to certain Trustees and Officers of the Fund. Trustees have the option to defer compensation payable by the Fund, and Trustees’ and Officers’ Fees and Benefits also include amounts accrued by the Fund to fund such deferred compensation amounts. Those Trustees who defer compensation have the option to select various Invesco Funds in which their deferral accounts shall be deemed to be invested. Obligations under the deferred compensation plan represent unsecured claims against the general assets of the Fund.
NOTE 7—Cash Balances
The Fund is permitted to temporarily carry a negative or overdrawn balance in its account with State Street Bank and Trust Company, the custodian bank. Such balances, if any at period end, are shown in the Statement of Assets and Liabilities under the payable caption Amount due custodian. To compensate the custodian bank for such overdrafts, the overdrawn Fund may either (1) leave funds as a compensating balance in the account so the custodian bank can be compensated by earning the additional interest; or (2) compensate by paying the custodian bank at a rate agreed upon by the custodian bank and Invesco, not to exceed the contractually agreed upon rate. The Fund may not purchase additional securities when any borrowings from banks exceed 5% of the Fund’s total assets.
NOTE 8—Distributions to Shareholders and Tax Components of Net Assets
Tax Character of Distributions to Shareholders Paid During the Fiscal Years Ended August 31, 2015 and 2014:
| 2015 | 2014 | |||||||
Ordinary income | $ | 442,240 | $ | 206,166 | ||||
Tax Components of Net Assets at Period-End:
| 2015 | ||||
Undistributed ordinary income | $ | 128,601 | ||
Net unrealized appreciation (depreciation) — investments | (563,658 | ) | ||
Temporary book/tax differences | (2,264 | ) | ||
Capital loss carryforward | (163,640 | ) | ||
Shares of beneficial interest | 17,258,385 | |||
Total net assets | $ | 16,657,424 | ||
The difference between book-basis and tax-basis unrealized appreciation (depreciation) is due to differences in the timing of recognition of gains and losses on investments for tax and book purposes. The Fund’s net unrealized appreciation (depreciation) difference is attributable primarily to wash sales and bond premium amortization.
The temporary book/tax differences are a result of timing differences between book and tax recognition of income and/or expenses. The Fund’s temporary book/tax differences are the result of the trustee deferral of compensation and retirement plan benefits.
Capital loss carryforward is calculated and reported as of a specific date. Results of transactions and other activity after that date may affect the amount of capital loss carryforward actually available for the Fund to utilize. The ability to utilize capital loss carryforward in the future may be limited under the Internal Revenue Code and related regulations based on the results of future transactions.
The Fund has a capital loss carryforward as of August 31, 2015, which expires as follows:
| Capital Loss Carryforward* | ||||||||||||
| Expiration | Short-Term | Long-Term | Total | |||||||||
Not Subject to Expiration | $ | 112,120 | $ | 51,520 | $ | 163,640 | ||||||
| * | Capital loss carryforward as of the date listed above is reduced for limitations, if any, to the extent required by the Internal Revenue Code and may be further limited depending upon a variety of factors, including the realization of net unrealized gains or losses as of the date of any reorganization. |
22 Invesco Strategic Real Return Fund
NOTE 9—Investment Securities
The aggregate amount of investment securities (other than short-term securities, U.S. Treasury obligations and money market funds, if any) purchased and sold by the Fund during the year ended August 31, 2015 was $3,252,444 and $2,894,380, respectively. During the same period, purchases and sales of U.S. Treasury obligations were $2,481,598 and $1,054,063, respectively. Cost of investments on a tax basis includes the adjustments for financial reporting purposes as of the most recently completed federal income tax reporting period-end.
| Unrealized Appreciation (Depreciation) of Investment Securities on a Tax Basis | ||||
Aggregate unrealized appreciation of investment securities | $ | 19,968 | ||
Aggregate unrealized (depreciation) of investment securities | (583,626 | ) | ||
Net unrealized appreciation (depreciation) of investment securities | $ | (563,658 | ) | |
Cost of investments for tax purposes is $17,172,070.
NOTE 10—Reclassification of Permanent Differences
Primarily as a result of differing book/tax treatment of distributions and bond premium amortization on August 31, 2015, undistributed net investment income was increased by $12,227 and undistributed net realized gain (loss) was decreased by $12,227. This reclassification had no effect on the net assets of the Fund.
NOTE 11—Share Information
| Summary of Share Activity | ||||||||||||||||
| Years ended August 31, | ||||||||||||||||
| 2015(a) | 2014 | |||||||||||||||
| Shares | Amount | Shares | Amount | |||||||||||||
Sold: | ||||||||||||||||
Class A | 174,539 | $ | 1,714,799 | 783,367 | $ | 7,836,144 | ||||||||||
Class C | 49,594 | 488,421 | 5,340 | 53,818 | ||||||||||||
Class R | 2,588 | 25,640 | 1,001 | 10,010 | ||||||||||||
Class Y | 1,227 | 12,010 | 748,001 | 7,480,010 | ||||||||||||
Class R5 | — | — | 1,001 | 10,010 | ||||||||||||
Class R6 | — | — | 1,001 | 10,010 | ||||||||||||
Issued as reinvestment of dividends: | ||||||||||||||||
Class A | 2,237 | 21,862 | 165 | 1,666 | ||||||||||||
Class C | 632 | 6,170 | — | — | ||||||||||||
Class R | 15 | 149 | — | — | ||||||||||||
Class Y | 11 | 109 | — | — | ||||||||||||
Reacquired: | ||||||||||||||||
Class A | (27,409 | ) | (270,229 | ) | (4,000 | ) | (40,442 | ) | ||||||||
Class C | (7,830 | ) | (76,494 | ) | — | — | ||||||||||
Class Y | (3 | ) | (29 | ) | — | — | ||||||||||
Net increase in share activity | 195,601 | $ | 1,922,408 | 1,535,876 | $ | 15,361,226 | ||||||||||
| (a) | 87% of the outstanding shares of the Fund are owned by the Adviser. |
23 Invesco Strategic Real Return Fund
NOTE 12—Financial Highlights
The following schedule presents financial highlights for a share of the Fund outstanding throughout the periods indicated.
| Net asset value, beginning of period | Net investment income(a) | Net gains (losses) on securities (both realized and unrealized) | Total from investment operations | Dividends from net investment income | Net asset value, end of period | Total return(b) | Net assets, end of period (000’s omitted) | Ratio of expenses to average net assets with fee waivers and/or expenses absorbed | Ratio of expenses to average net assets without fee waivers and/or expenses absorbed | Ratio of net investment income to average net assets | Portfolio turnover(c) | |||||||||||||||||||||||||||||||||||||
Class A | ||||||||||||||||||||||||||||||||||||||||||||||||
Year ended 08/31/15 | $ | 10.11 | $ | 0.26 | $ | (0.49 | ) | $ | (0.23 | ) | $ | (0.26 | ) | $ | 9.62 | (2.26 | )% | $ | 8,936 | 0.60 | %(d)(e) | 2.25 | %(d)(e) | 2.71 | %(d)(e) | 25 | % | |||||||||||||||||||||
Year ended 08/31/14(f) | 10.00 | 0.14 | 0.10 | 0.24 | (0.13 | ) | 10.11 | 2.44 | 7,880 | 0.59 | (g) | 2.87 | (g) | 4.21 | (g) | 13 | ||||||||||||||||||||||||||||||||
Class C | ||||||||||||||||||||||||||||||||||||||||||||||||
Year ended 08/31/15 | 10.10 | 0.19 | (0.49 | ) | (0.30 | ) | (0.19 | ) | 9.61 | (3.00 | ) | 459 | 1.35 | (d)(e) | 3.00 | (d)(e) | 1.96 | (d)(e) | 25 | |||||||||||||||||||||||||||||
Year ended 08/31/14(f) | 10.00 | 0.12 | 0.09 | 0.21 | (0.11 | ) | 10.10 | 2.14 | 54 | 1.34 | (g) | 3.62 | (g) | 3.46 | (g) | 13 | ||||||||||||||||||||||||||||||||
Class R | ||||||||||||||||||||||||||||||||||||||||||||||||
Year ended 08/31/15 | 10.11 | 0.24 | (0.49 | ) | (0.25 | ) | (0.24 | ) | 9.62 | (2.51 | ) | 35 | 0.85 | (d)(e) | 2.50 | (d)(e) | 2.46 | (d)(e) | 25 | |||||||||||||||||||||||||||||
Year ended 08/31/14(f) | 10.00 | 0.14 | 0.10 | 0.24 | (0.13 | ) | 10.11 | 2.37 | 10 | 0.84 | (g) | 3.12 | (g) | 3.96 | (g) | 13 | ||||||||||||||||||||||||||||||||
Class Y | ||||||||||||||||||||||||||||||||||||||||||||||||
Year ended 08/31/15 | 10.11 | 0.29 | (0.49 | ) | (0.20 | ) | (0.29 | ) | 9.62 | (2.02 | ) | 7,209 | 0.35 | (d)(e) | 2.00 | (d)(e) | 2.96 | (d)(e) | 25 | |||||||||||||||||||||||||||||
Year ended 08/31/14(f) | 10.00 | 0.15 | 0.10 | 0.25 | (0.14 | ) | 10.11 | 2.50 | 7,563 | 0.34 | (g) | 2.62 | (g) | 4.46 | (g) | 13 | ||||||||||||||||||||||||||||||||
Class R5 | ||||||||||||||||||||||||||||||||||||||||||||||||
Year ended 08/31/15 | 10.11 | 0.29 | (0.49 | ) | (0.20 | ) | (0.29 | ) | 9.62 | (2.02 | ) | 10 | 0.35 | (d)(e) | 2.07 | (d)(e) | 2.96 | (d)(e) | 25 | |||||||||||||||||||||||||||||
Year ended 08/31/14(f) | 10.00 | 0.15 | 0.10 | 0.25 | (0.14 | ) | 10.11 | 2.50 | 10 | 0.34 | (g) | 2.68 | (g) | 4.46 | (g) | 13 | ||||||||||||||||||||||||||||||||
Class R6 | ||||||||||||||||||||||||||||||||||||||||||||||||
Year ended 08/31/15 | 10.11 | 0.29 | (0.49 | ) | (0.20 | ) | (0.29 | ) | 9.62 | (2.02 | ) | 10 | 0.35 | (d)(e) | 2.07 | (d)(e) | 2.96 | (d)(e) | 25 | |||||||||||||||||||||||||||||
Year ended 08/31/14(f) | 10.00 | 0.15 | 0.10 | 0.25 | (0.14 | ) | 10.11 | 2.50 | 10 | 0.34 | (g) | 2.68 | (g) | 4.46 | (g) | 13 | ||||||||||||||||||||||||||||||||
| (a) | Calculated using average shares outstanding. |
| (b) | Includes adjustments in accordance with accounting principles generally accepted in the United States of America and as such, the net asset value for financial reporting purposes and the returns based upon those net asset values may differ from the net asset value and returns for shareholder transactions. Does not include sales charges and is not annualized for periods less than one year, if applicable. |
| (c) | Portfolio turnover is calculated at the fund level and is not annualized for periods less than one year, if applicable. |
| (d) | Ratios are based on average daily net assets (000’s omitted) of $8,362, $380, $18, $7,355, $10 and $10 for Class A, Class C, Class R, Class Y, Class R5 and Class R6 shares, respectively. |
| (e) | In addition to the fees and expenses which the Fund bears directly; the Fund indirectly bears a pro rata share of the fees and expenses of the underlying funds in which the Fund invests. Because the underlying funds have varied expenses and fee levels and the Fund may own different proportions at different times, the amount of fees and expenses incurred indirectly by the Fund will vary. Estimated underlying fund expenses are not expenses that are incurred directly by your Fund. They are expenses that are incurred directly by the underlying funds and are deducted from the value of the funds your Fund invests in. The effect of the estimated underlying fund expenses that your Fund bears indirectly is included in your Fund’s total return. Estimated acquired fund fees from underlying funds were 0.22% for the year ended August 31, 2015 and 0.21% for the period April 30, 2014 (commencement date) through August 31, 2014. |
| (f) | Commencement date of April 30, 2014. |
| (g) | Annualized |
24 Invesco Strategic Real Return Fund
Report of Independent Registered Public Accounting Firm
To the Board of Trustees of AIM Counselor Series Trust (Invesco Counselor Series Trust)
and Shareholders of Invesco Strategic Real Return Fund:
In our opinion, the accompanying statement of assets and liabilities, including the schedule of investments, and the related statements of operations and of changes in net assets and the financial highlights present fairly, in all material respects, the financial position of Invesco Strategic Real Return Fund (one of the funds constituting AIM Counselor Series Trust (Invesco Counselor Series Trust), hereafter referred to as the “Fund”) at August 31, 2015, the results of its operations, the changes in its net assets and the financial highlights for the year then ended and for the period April 30, 2014 (commencement of operations) through August 31, 2014, in conformity with accounting principles generally accepted in the United States of America. These financial statements and financial highlights (hereafter referred to as “financial statements”) are the responsibility of the Fund’s management. Our responsibility is to express an opinion on these financial statements based on our audits. We conducted our audits of these financial statements in accordance with the standards of the Public Company Accounting Oversight Board (United States). Those standards require that we plan and perform the audit to obtain reasonable assurance about whether the financial statements are free of material misstatement. An audit includes examining, on a test basis, evidence supporting the amounts and disclosures in the financial statements, assessing the accounting principles used and significant estimates made by management, and evaluating the overall financial statement presentation. We believe that our audits, which included confirmation of securities at August 31, 2015 by correspondence with the custodian and brokers, and the application of alternative auditing procedures where confirmations of security purchases have not been received, provide a reasonable basis for our opinion.
PRICEWATERHOUSECOOPERS LLP
October 27, 2015
Houston, Texas
25 Invesco Strategic Real Return Fund
Calculating your ongoing Fund expenses
Example
As a shareholder of the Fund, you incur two types of costs: (1) transaction costs, which may include sales charges (loads) on purchase payments or contingent deferred sales charges on redemptions, if any; and (2) ongoing costs, including management fees, distribution and/or service (12b-1) fees, and other Fund expenses. This example is intended to help you understand your ongoing costs (in dollars) of investing in the Fund and to compare these costs with ongoing costs of investing in other mutual funds. The example is based on an investment of $1,000 invested at the beginning of the period and held for the entire period March 1, 2015 through August 31, 2015.
Actual expenses
The table below provides information about actual account values and actual expenses. You may use the information in this table, together with the amount you invested, to estimate the expenses that you paid over the period. Simply divide your account value by $1,000 (for example, an $8,600 account value divided by $1,000 = 8.6), then multiply the result by the number in the table under the heading entitled “Actual Expenses Paid During Period” to estimate the expenses you paid on your account during this period.
Hypothetical example for comparison purposes
The table below also provides information about hypothetical account values and hypothetical expenses based on the Fund’s actual expense ratio and an assumed rate of return of 5% per year before expenses, which is not the Fund’s actual return.
The hypothetical account values and expenses may not be used to estimate the actual ending account balance or expenses you paid for the period. You may use this information to compare the ongoing costs of investing in the Fund and other funds. To do so, compare this 5% hypothetical example with the 5% hypothetical examples that appear in the shareholder reports of the other funds.
Please note that the expenses shown in the table are meant to highlight your ongoing costs only and do not reflect any transaction costs, such as sales charges (loads) on purchase payments or contingent deferred sales charges on redemptions, if any. Therefore, the hypothetical information is useful in comparing ongoing costs only, and will not help you determine the relative total costs of owning different funds. In addition, if these transaction costs were included, your costs would have been higher.
| Class | Beginning Account Value (03/01/15) | ACTUAL | HYPOTHETICAL (5% annual return before | Annualized Expense Ratio | ||||||||||||||||||||
| Ending Account Value (08/31/15)1 | Expenses Paid During Period2 | Ending Account Value (08/31/15) | Expenses Paid During Period2 | |||||||||||||||||||||
| A | $ | 1,000.00 | $ | 981.90 | $ | 3.00 | $ | 1,022.18 | $ | 3.06 | 0.60 | % | ||||||||||||
| C | 1,000.00 | 977.20 | 6.73 | 1,018.40 | 6.87 | 1.35 | ||||||||||||||||||
| R | 1,000.00 | 980.70 | 4.24 | 1,020.92 | 4.33 | 0.85 | ||||||||||||||||||
| Y | 1,000.00 | 982.10 | 1.75 | 1,023.44 | 1.79 | 0.35 | ||||||||||||||||||
| R5 | 1,000.00 | 982.10 | 1.75 | 1,023.44 | 1.79 | 0.35 | ||||||||||||||||||
| R6 | 1,000.00 | 982.10 | 1.75 | 1,023.44 | 1.79 | 0.35 | ||||||||||||||||||
| 1 | The actual ending account value is based on the actual total return of the Fund for the period March 1, 2015 through August 31, 2015, after actual expenses and will differ from the hypothetical ending account value which is based on the Fund’s expense ratio and a hypothetical annual return of 5% before expenses. |
| 2 | Expenses are equal to the Fund’s annualized expense ratio as indicated above multiplied by the average account value over the period, multiplied by 184/365 to reflect the most recent fiscal half year. |
26 Invesco Strategic Real Return Fund
Approval of Investment Advisory and Sub-Advisory Agreements
The Board of Trustees (the Board) of AIM Counselor Series Trust (Invesco Counselor Series Trust) (the Company) is required under the Investment Company Act of 1940, as amended, to approve annually the renewal of Invesco Strategic Real Return Fund’s (the Fund) investment advisory agreements. During contract renewal meetings held on June 9-10, 2015, the Board as a whole, and the disinterested or “independent” Trustees, who comprise over 75% of the Board, voting separately, approved the continuance for the Fund of the Master Investment Advisory Agreement with Invesco Advisers, Inc. (Invesco Advisers and the investment advisory agreement) and the Master Intergroup Sub-Advisory Contract for Mutual Funds with Invesco Asset Management Deutschland GmbH, Invesco Asset Management Limited, Invesco Asset Management (Japan) Limited, Invesco Hong Kong Limited, Invesco Senior Secured Management, Inc., Invesco Canada Ltd. and Invesco PowerShares Capital Management LLC (collectively, the Affiliated Sub-Advisers and the sub-advisory contracts) for another year, effective July 1, 2015.
In evaluating the fairness and reasonableness of compensation under the Fund’s investment advisory agreement and sub-advisory contracts, the Board considered, among other things, the factors discussed below. The Board determined that continuation of the Fund’s investment advisory agreement and the sub-advisory contracts is in the best interest of the Fund and its shareholders and that the compensation payable to Invesco Advisers and the Affiliated Sub-Advisers under the agreements is fair and reasonable.
The Board’s Fund Evaluation Process
The Board’s Investments Committee has established three Sub-Committees, each of which is primarily responsible for overseeing the performance and investment management services provided by Invesco Advisers and the Affiliated Sub-Advisers to a number of the funds advised by Invesco Advisers (the Invesco Funds). The Sub-Committees meet throughout the year to review the performance of their assigned Invesco Funds, including reviewing materials prepared under the direction of the independent Senior Officer, an officer of the Invesco Funds who reports directly to the independent Trustees. Over the course of each year, the Sub-Committees meet with portfolio managers for their assigned Invesco Funds and other members of management to review the performance, investment objective(s), policies, strategies, limitations and investment risks of these funds. The Board had the benefit of reports from the Sub-Committees and Investments Committee throughout the year in considering approval of the continuance of each
Invesco Fund’s investment advisory agreement and sub-advisory contracts for another year.
During the contract renewal process, the Board receives comparative performance and fee data regarding the Invesco Funds prepared by Invesco Advisers and Lipper Inc. (Lipper), an independent provider of investment company data. The Board also receives a report and this independent written evaluation from the Senior Officer. The Senior Officer’s evaluation is prepared as part of his responsibility to manage the process by which the Invesco Funds’ proposed management fees are negotiated during the annual contract renewal process to ensure they are negotiated in a manner that is at arms’ length and reasonable. In addition to meetings with Invesco Advisers and fund counsel, the independent Trustees also discuss the continuance of the investment advisory agreement and sub-advisory contracts in separate sessions with the Senior Officer and with independent legal counsel.
The Trustees recognized that the advisory fee rates for the Invesco Funds are, in many cases, the result of years of review and negotiation. The Trustees’ deliberations and conclusions in a particular year may be based in part on their deliberations and conclusions regarding these arrangements throughout the year and in prior years. The Trustees’ review and conclusions are based on the comprehensive consideration of all information presented to them and are not the result of any single determinative factor. Moreover, one Trustee may have weighed a particular piece of information or factor differently than another Trustee.
The discussion below is a summary of the Senior Officer’s independent written evaluation with respect to the Fund’s investment advisory agreement as well as a discussion of the material factors and related conclusions that formed the basis for the Board’s approval of the Fund’s investment advisory agreement and sub-advisory contracts. Unless otherwise stated, this information is current as of June 10, 2015, and does not reflect consideration of factors that became known to the Board after that date.
Factors and Conclusions and Summary of Evaluation of Investment Advisory and Sub-Advisory Agreements
| A. | Nature, Extent and Quality of Services Provided by Invesco Advisers and the Affiliated Sub-Advisers |
The Board reviewed the advisory services provided to the Fund by Invesco Advisers under the Fund’s investment advisory agreement, the performance of Invesco Advisers in providing these services, and the credentials and experience of the officers and employees of Invesco Advisers who provide these services, including the Fund’s portfolio manager or managers. The Board’s review of the
qualifications of Invesco Advisers to provide advisory services included the Board’s consideration of Invesco Advisers’ investment process oversight, independent credit analysis and investment risk management. The Board also considered non-advisory services that Invesco Advisers and its affiliates provide to the Invesco Funds such as various back office support functions, equity and fixed income trading operations, internal audit, distribution, valuation and legal and compliance.
In determining whether to continue the Fund’s investment advisory agreement, the Board considered the benefits of reapproving an existing relationship and the greater uncertainty that may be associated with entering into a new relationship. The Board concluded that the nature, extent and quality of the services provided to the Fund by Invesco Advisers are appropriate and satisfactory and consistent with the terms of the Fund’s investment advisory agreement.
The Board reviewed the services that may be provided by the Affiliated Sub-Advisers under the sub-advisory contracts and the credentials and experience of the officers and employees of the Affiliated Sub-Advisers who provide these services. The Board noted that the Affiliated Sub-Advisers have offices and personnel that are located in financial centers around the world. As a result, the Affiliated Sub-Advisers can provide research and investment analysis on the markets and economies of various countries in which the Fund may invest, make recommendations regarding securities and assist with security trades. The Board concluded that the sub-advisory contracts benefit the Fund and its shareholders by permitting Invesco Advisers to use the resources and talents of the Affiliated Sub-Advisers in managing the Fund. The Board concluded that the nature, extent and quality of the services that may be provided by the Affiliated Sub-Advisers are appropriate and satisfactory and consistent with the terms of the Fund’s sub-advisory contracts.
| B. | Fund Performance |
The Board did not consider Fund performance as a relevant factor in considering whether to approve the investment advisory agreement as the Fund had less than one year of performance history.
| C. | Advisory and Sub-Advisory Fees and Fee Waivers |
The Board considered the advisory fee schedule of the Fund and the contractual fee waivers and/or expense limitations that will be in place for the Fund through December 31, 2015. The Board had no comparative Lipper fee data because the Fund was launched in April 2014.
The Board noted that Invesco Advisers and the Affiliated Sub-Advisers do not manage other mutual funds or client accounts with investment strategies comparable to those of the Fund.
27 Invesco Strategic Real Return Fund
The Board also considered the services that may be provided by the Affiliated Sub-Advisers pursuant to the sub-advisory contracts, as well as the fees payable by Invesco Advisers to the Affiliated Sub-Advisers pursuant to the sub-advisory contracts. The Board also noted that the sub-advisory fees are not paid directly by the Fund, but rather, are payable by Invesco Advisers to the Affiliated Sub-Advisers.
| D. | Economies of Scale and Breakpoints |
The Board considered the extent to which there are economies of scale in the provision of advisory services to the Fund. The Board also considered whether the Fund benefits from economies of scale through contractual breakpoints in the Fund’s advisory fee schedule. The Board also noted that the Fund shares directly in economies of scale through lower fees charged by third party service providers based on the combined size of the Invesco Funds and other clients advised by Invesco Advisers.
| E. | Profitability and Financial Resources |
The Board reviewed information from Invesco Advisers concerning the costs of the advisory and other services that Invesco Advisers and its affiliates provide to the Fund and the Invesco Funds and the profitability of Invesco Advisers and its affiliates in providing these services. The Board received information from Invesco Advisers about the methodology used to prepare the profitability information. The Board noted that Invesco Advisers continues to operate at a net profit from services Invesco Advisers and its affiliates provide to the Invesco Funds. The Board noted that although Invesco Advisers received a minimal amount of revenues from advising the Fund, Invesco Advisers and its subsidiaries did not make a profit from managing the Fund as a result of fee and expense waivers. The Board received and accepted information from Invesco Advisers demonstrating that Invesco Advisers and each Affiliated Sub-Adviser are financially sound and have the resources necessary to perform their obligations under the investment advisory agreement and sub-advisory contracts.
| F. | Collateral Benefits to Invesco Advisers and its Affiliates |
The Board considered various other benefits received by Invesco Advisers and its affiliates from the relationship with the Fund, including the fees received for providing transfer agency and distribution services to the Fund. The Board considered comparative information regarding fees charged for these services, including information provided by Lipper and other independent sources. The Board considered the performance of Invesco Advisers and its affiliates in providing these services and the organizational structure employed to provide these services. The Board also considered that these services are provided to the Fund pursuant to written contracts that are reviewed and approved on an annual basis by the Board; and that the services are required for the operation of the Fund.
The Board considered the benefits realized by Invesco Advisers and the Affiliated Sub-Advisers as a result of portfolio brokerage transactions executed through “soft dollar” arrangements. Invesco Advisers noted that the Fund does not execute brokerage transactions through “soft dollar” arrangements to any significant degree.
The Board considered that the Fund’s uninvested cash and cash collateral from any securities lending arrangements may be invested in money market funds advised by Invesco Advisers pursuant to procedures approved by the Board. The Board noted that Invesco Advisers receives advisory fees from these affiliated money market funds attributable to such investments, although Invesco Advisers has contractually agreed to waive through varying periods the advisory fees payable by the Invesco Funds with respect to investments in the affiliated money market funds. The waiver is in an amount equal to 100% of the net advisory fee Invesco Advisers receives from the affiliated money market funds with respect to the Fund’s investment in the affiliated money market funds of uninvested cash, but not cash collateral. The Board concluded that the amount of advisory fees received by Invesco Advisors from the Fund’s investment of cash collateral from any securities lending arrangements in the affiliated money market funds is fair and reasonable.
28 Invesco Strategic Real Return Fund
Tax Information
Form 1099-DIV, Form 1042-S and other year–end tax information provide shareholders with actual calendar year amounts that should be included in their tax returns. Shareholders should consult their tax advisors.
The following distribution information is being provided as required by the Internal Revenue Code or to meet a specific state’s requirement.
The Fund designates the following amounts or, if subsequently determined to be different, the maximum amount allowable for its fiscal year ended August 31, 2015:
Federal and State Income Tax | ||||
Qualified Dividend Income* | 0 | % | ||
Corporate Dividends Received Deduction* | 0 | % | ||
U.S. Treasury Obligations* | 13.46 | % | ||
Tax-Exempt Interest Dividends* | 0 | % | ||
| * | The above percentages are based on ordinary income dividends paid to shareholders during the Fund’s fiscal year. |
Non-Resident Alien Shareholders | |||||
Qualified Short-Term Gains** | $ | 3,609 | |||
| ** | The above percentage is based on income dividends paid to shareholders during the Fund’s fiscal year. |
29 Invesco Strategic Real Return Fund
Trustees and Officers
The address of each trustee and officer is AIM Counselor Series Trust (Invesco Counselor Series Trust) (the “Trust”), 11 Greenway Plaza, Suite 1000, Houston, Texas 77046-1173. The trustees serve for the life of the Trust, subject to their earlier death, incapacitation, resignation, retirement or removal as more specifically provided in the Trust’s organizational documents. Each officer serves for a one year term or until their successors are elected and qualified. Column two below includes length of time served with predecessor entities, if any.
| Name, Year of Birth and Position(s) Held with the Trust | Trustee and/ or Officer Since | Principal Occupation(s) During Past 5 Years | Number of Funds in Fund Complex Overseen by Trustee | Other Directorship(s) Held by Trustee During Past 5 Years | ||||
| Interested Persons | ||||||||
| Martin L. Flanagan1 — 1960 Trustee | 2007 | Executive Director, Chief Executive Officer and President, Invesco Ltd. (ultimate parent of Invesco and a global investment management firm); Advisor to the Board, Invesco Advisers, Inc. (formerly known as Invesco Institutional (N.A.), Inc.); Trustee, The Invesco Funds; Vice Chair, Investment Company Institute; and Member of Executive Board, SMU Cox School of Business
Formerly: Chairman and Chief Executive Officer, Invesco Advisers, Inc. (registered investment adviser); Director, Chairman, Chief Executive Officer and President, IVZ Inc. (holding company), INVESCO Group Services, Inc. (service provider) and Invesco North American Holdings, Inc. (holding company); Director, Chief Executive Officer and President, Invesco Holding Company Limited (parent of Invesco and a global investment management firm); Director, Invesco Ltd.; Chairman, Investment Company Institute and President, Co-Chief Executive Officer, Co-President, Chief Operating Officer and Chief Financial Officer, Franklin Resources, Inc. (global investment management organization). | 144 | None | ||||
| Philip A. Taylor2 — 1954 Trustee, President and Principal Executive Officer | 2006 | Head of North American Retail and Senior Managing Director, Invesco Ltd.; Director, Co-Chairman, Co-President and Co-Chief Executive Officer, Invesco Advisers, Inc. (formerly known as Invesco Institutional (N.A.), Inc.) (registered investment adviser); Director, Chairman, Chief Executive Officer and President, Invesco Management Group, Inc. (formerly known as Invesco Aim Management Group, Inc.) (financial services holding company); Director and President, INVESCO Funds Group, Inc. (registered investment adviser and registered transfer agent); Director and Chairman, Invesco Investment Services, Inc. (formerly known as Invesco Aim Investment Services, Inc.) (registered transfer agent) and IVZ Distributors, Inc. (formerly known as INVESCO Distributors, Inc.) (registered broker dealer); Director, President and Chairman, Invesco Inc. (holding company), Invesco Canada Holdings Inc. (holding company), Trimark Investments Ltd./Placements Trimark Ltèe and Invesco Financial Services Ltd/Services Financiers Invesco Ltèe; Chief Executive Officer, Invesco Corporate Class Inc. (corporate mutual fund company) Director, Chairman and Chief Executive Officer, Invesco Canada Ltd. (formerly known as Invesco Trimark Ltd./Invesco Trimark Ltèe) (registered investment adviser and registered transfer agent); Trustee, President and Principal Executive Officer, The Invesco Funds (other than AIM Treasurer’s Series Trust (Invesco Treasurer’s Series Trust), Short-Term Investments Trust and Invesco Management Trust); Trustee and Executive Vice President, The Invesco Funds (AIM Treasurer’s Series Trust (Invesco Treasurer’s Series Trust), Short-Term Investments Trust and Invesco Management Trust only); Director, Invesco Investment Advisers LLC (formerly known as Van Kampen Asset Management); Director, Chief Executive Officer and President, Van Kampen Exchange Corp.
Formerly: Chief Executive Officer, Invesco Canada Fund Inc (corporate mutual fund company); Director and Chairman, Van Kampen Investor Services Inc.; Director, Chief Executive Officer and President, 1371 Preferred Inc. (holding company) and Van Kampen Investments Inc.; Director and President, AIM GP Canada Inc. (general partner for limited partnerships) and Van Kampen Advisors, Inc.; Director and Chief Executive Officer, Invesco Trimark Dealer Inc. (registered broker dealer); Director, Invesco Distributors, Inc. (formerly known as Invesco Aim Distributors, Inc.) (registered broker dealer); Manager, Invesco PowerShares Capital Management LLC; Director, Chief Executive Officer and President, Invesco Advisers, Inc.; Director, Chairman, Chief Executive Officer and President, Invesco Aim Capital Management, Inc.; President, Invesco Trimark Dealer Inc. and Invesco Trimark Ltd./Invesco Trimark Ltèe; Director and President, AIM Trimark Corporate Class Inc. and AIM Trimark Canada Fund Inc.; Senior Managing Director, Invesco Holding Company Limited; Director and Chairman, Fund Management Company (former registered broker dealer); President and Principal Executive Officer, The Invesco Funds (AIM Treasurer’s Series Trust (Invesco Treasurer’s Series Trust), and Short-Term Investments Trust only); President, AIM Trimark Global Fund Inc. and AIM Trimark Canada Fund Inc.. | 144 | None |
| 1 | Mr. Flanagan is considered an interested person (within the meaning of Section 2(a)(19) of the 1940 Act) of the Trust because he is an officer of the Adviser to the Trust, and an officer and a director of Invesco Ltd., ultimate parent of the Adviser. |
| 2 | Mr. Taylor is considered an interested person (within the meaning of Section 2(a)(19) of the 1940 Act) of the Trust because he is an officer and a director of the Adviser. |
T-1 Invesco Strategic Real Return Fund
Trustees and Officers—(continued)
| Name, Year of Birth and Position(s) Held with the Trust | Trustee and/ or Officer Since | Principal Occupation(s) During Past 5 Years | Number of Funds in Fund Complex Overseen by Trustee | Other Directorship(s) Held by Trustee During Past 5 Years | ||||
| Independent Trustees | ||||||||
Bruce L. Crockett — 1944 Trustee and Chair | 2003 | Chairman, Crockett Technologies Associates (technology consulting company)
Formerly: Director, Captaris (unified messaging provider); Director, President and Chief Executive Officer, COMSAT Corporation; Chairman, Board of Governors of INTELSAT (international communications company); ACE Limited (insurance company); Independent Directors Council and Investment Company Institute | 144 | ALPS (Attorneys Liability Protection Society) (insurance company) and Globe Specialty Metals, Inc. (metallurgical company) | ||||
David C. Arch — 1945 Trustee | 2010 | Chairman of Blistex Inc., a consumer health care products manufacturer | 144 | Board member of the Illinois Manufacturers’ Association; Member of the Board of Visitors, Institute for the Humanities, University of Michigan; Member of the Audit Committee of the Edward-Elmhurst Hospital | ||||
James T. Bunch — 1942 Trustee | 2000 | Managing Member, Grumman Hill Group LLC (family office/private equity investments)
Formerly: Founder, Green Manning & Bunch Ltd. (investment banking firm) (1988-2010); Executive Committee, United States Golf Association; and Chairman, Board of Governors, Western Golf Association | 144 | Chairman of the Board of Trustees, Evans Scholars Foundation; and Chairman of the Board, Denver Film Society | ||||
Rodney F. Dammeyer — 1940 Trustee | 2010 | Chairman of CAC, LLC, (private company offering capital investment and management advisory services)
Formerly: Prior to 2001, Managing Partner at Equity Group Corporate Investments; Prior to 1995, Chief Executive Officer of Itel Corporation (formerly Anixter International); Prior to 1985, experience includes Senior Vice President and Chief Financial Officer of Household International, Inc., Executive Vice President and Chief Financial Officer of Northwest Industries, Inc. and Partner of Arthur Andersen & Co.; From 1987 to 2010, Director/Trustee of investment companies in the Van Kampen Funds complex | 144 | Director of Quidel Corporation and Stericycle, Inc. | ||||
Albert R. Dowden — 1941 Trustee | 2003 | Director of a number of public and private business corporations, including the Boss Group, Ltd. (private investment and management); Nature’s Sunshine Products, Inc. and Reich & Tang Funds (5 portfolios) (registered investment company)
Formerly: Director, Homeowners of America Holding Corporation/Homeowners of America Insurance Company (property casualty company); Director, Continental Energy Services, LLC (oil and gas pipeline service); Director, CompuDyne Corporation (provider of product and services to the public security market) and Director, Annuity and Life Re (Holdings), Ltd. (reinsurance company); Director, President and Chief Executive Officer, Volvo Group North America, Inc.; Senior Vice President, AB Volvo; Director of various public and private corporations; Chairman, DHJ Media, Inc.; Director, Magellan Insurance Company; and Director, The Hertz Corporation, Genmar Corporation (boat manufacturer), National Media Corporation; Advisory Board of Rotary Power International (designer, manufacturer, and seller of rotary power engines); and Chairman, Cortland Trust, Inc. (registered investment company) | 144 | Director of: Nature’s Sunshine Products, Inc., Reich & Tang Funds, Homeowners of America Holding Corporation/ Homeowners of America Insurance Company, the Boss Group | ||||
Jack M. Fields — 1952 Trustee | 2003 | Chief Executive Officer, Twenty First Century Group, Inc. (government affairs company); Owner and Chief Executive Officer, Dos Angeles Ranch, L.P. (cattle, hunting, corporate entertainment); and Discovery Global Education Fund (non-profit)
Formerly: Chief Executive Officer, Texana Timber LP (sustainable forestry company); Director of Cross Timbers Quail Research Ranch (non-profit); and member of the U.S. House of Representatives | 144 | Insperity, Inc. (formerly known as Administaff) | ||||
Prema Mathai-Davis — 1950 Trustee | 2003 | Retired. Formerly: Chief Executive Officer, YWCA of the U.S.A. | 144 | None | ||||
Larry Soll — 1942 Trustee | 1997 | Retired. Formerly: Chairman, Chief Executive Officer and President, Synergen Corp. (a biotechnology company) | 144 | None | ||||
Hugo F. Sonnenschein — 1940 Trustee | 2010 | President Emeritus and Honorary Trustee of the University of Chicago and the Adam Smith Distinguished Service Professor in the Department of Economics at the University of Chicago. Prior to 2000, President of the University of Chicago | 144 | Trustee of the University of Rochester and a member of its investment committee; Member of the National Academy of Sciences and the American Philosophical Society; Fellow of the American Academy of Arts and Sciences | ||||
| Raymond Stickel, Jr. — 1944 Trustee | 2005 | Retired. Formerly: Director, Mainstay VP Series Funds, Inc. (25 portfolios) and Partner, Deloitte & Touche | 144 | None |
T-2 Invesco Strategic Real Return Fund
Trustees and Officers—(continued)
| Name, Year of Birth and Position(s) Held with the Trust | Trustee and/ or Officer Since | Principal Occupation(s) During Past 5 Years | Number of Funds in Fund Complex Overseen by Trustee | Other Directorship(s) Held by Trustee During Past 5 Years | ||||
| Independent Trustees—(continued) | ||||||||
Suzanne H. Woolsey — 1941 Trustee | 2014 | Chief Executive Officer of Woolsey Partners LLC | 144 | Emeritus Chair of the Board of Trustees of the Institute for Defense Analyses; Trustee of Colorado College; Trustee of California Institute of Technology; Prior to 2014, Director of Fluor Corp.; Prior to 2010, Trustee of the German Marshall Fund of the United States; Prior to 2010 Trustee of the Rocky Mountain Institute | ||||
| Other Officers | ||||||||
Russell C. Burk — 1958 Senior Vice President and Senior Officer | 2005 | Senior Vice President and Senior Officer, The Invesco Funds | N/A | N/A | ||||
John M. Zerr — 1962 Senior Vice President, Chief Legal Officer and Secretary | 2006 | Director, Senior Vice President, Secretary and General Counsel, Invesco Management Group, Inc. (formerly known as Invesco Aim Management Group, Inc.) and Van Kampen Exchange Corp.; Senior Vice President, Invesco Advisers, Inc. (formerly known as Invesco Institutional (N.A.), Inc.) (registered investment adviser); Senior Vice President and Secretary, Invesco Distributors, Inc. (formerly known as Invesco Aim Distributors, Inc.); Director, Vice President and Secretary, Invesco Investment Services, Inc. (formerly known as Invesco Aim Investment Services, Inc.) and IVZ Distributors, Inc. (formerly known as INVESCO Distributors, Inc.); Director and Vice President, INVESCO Funds Group, Inc.; Senior Vice President, Chief Legal Officer and Secretary, The Invesco Funds; Managing Director, Invesco PowerShares Capital Management LLC; Director, Secretary and General Counsel, Invesco Investment Advisers LLC (formerly known as Van Kampen Asset Management); Secretary and General Counsel, Invesco Capital Markets, Inc. (formerly known as Van Kampen Funds Inc.) and Chief Legal Officer, PowerShares Exchange-Traded Fund Trust, PowerShares Exchange-Traded Fund Trust II, PowerShares India Exchange-Traded Fund Trust, PowerShares Actively Managed Exchange-Traded Fund Trust, and PowerShares Actively Managed Exchange-Traded Commodity Fund Trust
Formerly: Director and Vice President, Van Kampen Advisors Inc.; Director, Vice President, Secretary and General Counsel, Van Kampen Investor Services Inc.; Director, Invesco Distributors, Inc. (formerly known as Invesco Aim Distributors, Inc.); Director, Senior Vice President, General Counsel and Secretary, Invesco Aim Advisers, Inc. and Van Kampen Investments Inc.; Director, Vice President and Secretary, Fund Management Company; Director, Senior Vice President, Secretary, General Counsel and Vice President, Invesco Aim Capital Management, Inc.; Chief Operating Officer and General Counsel, Liberty Ridge Capital, Inc. (an investment adviser); Vice President and Secretary, PBHG Funds (an investment company) and PBHG Insurance Series Fund (an investment company); Chief Operating Officer, General Counsel and Secretary, Old Mutual Investment Partners (a broker-dealer); General Counsel and Secretary, Old Mutual Fund Services (an administrator) and Old Mutual Shareholder Services (a shareholder servicing center); Executive Vice President, General Counsel and Secretary, Old Mutual Capital, Inc. (an investment adviser); and Vice President and Secretary, Old Mutual Advisors Funds (an investment company) | N/A | N/A | ||||
| Sheri Morris — 1964 Vice President, Treasurer and Principal Financial Officer | 2003 | Vice President, Treasurer and Principal Financial Officer, The Invesco Funds; Vice President, Invesco Advisers, Inc. (formerly known as Invesco Institutional (N.A.), Inc.) (registered investment adviser); and Vice President, PowerShares Exchange-Traded Fund Trust, PowerShares Exchange-Traded Fund Trust II, PowerShares India Exchange-Traded Fund Trust, PowerShares Actively Managed Exchange-Traded Fund Trust, and PowerShares Actively Managed Exchange-Traded Commodity Fund Trust
Formerly: Vice President, Invesco Aim Advisers, Inc., Invesco Aim Capital Management, Inc. and Invesco Aim Private Asset Management, Inc.; Assistant Vice President and Assistant Treasurer, The Invesco Funds and Assistant Vice President, Invesco Advisers, Inc., Invesco Aim Capital Management, Inc. and Invesco Aim Private Asset Management, Inc.; and Treasurer, PowerShares Exchange-Traded Fund Trust, PowerShares Exchange-Traded Fund Trust II, PowerShares India Exchange-Traded Fund Trust and PowerShares Actively Managed Exchange-Traded Fund Trust | N/A | N/A | ||||
T-3 Invesco Strategic Real Return Fund
Trustees and Officers—(continued)
| Name, Year of Birth and Position(s) Held with the Trust | Trustee and/ or Officer Since | Principal Occupation(s) During Past 5 Years | Number of Funds in Fund Complex Overseen by Trustee | Other Directorship(s) Held by Trustee During Past 5 Years | ||||
| Other Officers—(continued) | ||||||||
| Karen Dunn Kelley — 1960 Vice President | 2003 | Senior Managing Director, Investments, Invesco Ltd.; Director, Co-President, Co-Chief Executive Officer, and Co-Chairman, Invesco Advisers, Inc. (formerly known as Invesco Institutional (N.A.), Inc.) (registered investment adviser); Chairman, Invesco Senior Secured Management, Inc.; Senior Vice President, Invesco Management Group, Inc. (formerly known as Invesco Aim Management Group, Inc.); Executive Vice President, Invesco Distributors, Inc. (formerly known as Invesco Aim Distributors, Inc.); Director, Invesco Mortgage Capital Inc. and Invesco Management Company Limited; Vice President, The Invesco Funds (other than AIM Treasurer’s Series Trust (Invesco Treasurer’s Series Trust), Short-Term Investments Trust and Invesco Management Trust); and President and Principal Executive Officer, The Invesco Funds (AIM Treasurer’s Series Trust (Invesco Treasurer’s Series Trust), Short-Term Investments Trust and Invesco Management Trust only)
Formerly: Director and President, INVESCO Asset Management (Bermuda) Ltd., Director, INVESCO Global Asset Management Limited and INVESCO Management S.A.; Senior Vice President, Van Kampen Investments Inc. and Invesco Advisers, Inc. (formerly known as Invesco Institutional (N.A.), Inc.) (registered investment adviser); Vice President, Invesco Advisers, Inc. (formerly known as Invesco Institutional (N.A.), Inc.); Director of Cash Management and Senior Vice President, Invesco Advisers, Inc. and Invesco Aim Capital Management, Inc.; Director and President, Fund Management Company; Chief Cash Management Officer, Director of Cash Management, Senior Vice President, and Managing Director, Invesco Aim Capital Management, Inc.; Director of Cash Management, Senior Vice President, and Vice President, Invesco Advisers, Inc. and The Invesco Funds (AIM Treasurer’s Series Trust (Invesco Treasurer’s Series Trust), and Short-Term Investments Trust only) | N/A | N/A | ||||
| Crissie M. Wisdom — 1969 Anti-Money Laundering Compliance Officer | 2013 | Anti-Money Laundering Compliance Officer, Invesco Advisers, Inc. (formerly known as Invesco Institutional (N.A.), Inc.) (registered investment adviser), Invesco Capital Markets, Inc. (formerly known as Van Kampen Funds Inc.), Invesco Distributors, Inc., Invesco Investment Services, Inc., Invesco Management Group, Inc., Van Kampen Exchange Corp., The Invesco Funds, and PowerShares Exchange-Traded Fund Trust, PowerShares Exchange-Traded Fund Trust II, PowerShares India Exchange-Traded Fund Trust, PowerShares Actively Managed Exchange-Traded Fund Trust and PowerShares Actively Managed Exchange-Traded Commodity Fund Trust; Anti-Money Laundering Compliance Officer and Bank Secrecy Act Officer, INVESCO National Trust Company and Invesco Trust Company; and Fraud Prevention Manager and Controls and Risk Analysis Manager for Invesco Investment Services, Inc.. | N/A | N/A | ||||
Lisa O. Brinkley — 1959 Chief Compliance Officer | 2004 | Senior Vice President and Chief Compliance Officer, Invesco Advisers, Inc. (registered investment adviser) (formerly known as Invesco Institutional (N.A., Inc.); and Chief Compliance Officer, The Invesco Funds
Formerly: Global Assurance Officer, Invesco Ltd. and Vice President, The Invesco Funds; Chief Compliance Officer, Invesco Distributors, Inc. (formerly known as Invesco Aim Distributors, Inc.), Invesco Investment Services, Inc.(formerly known as Invesco Aim Investment Services, Inc.) and Van Kampen Investor Services Inc.; Senior Vice President, Invesco Management Group, Inc.; Senior Vice President and Chief Compliance Officer, Invesco Advisers, Inc. and The Invesco Funds; Vice President and Chief Compliance Officer, Invesco Aim Capital Management, Inc. and Invesco Distributors, Inc.; Vice President, Invesco Investment Services, Inc. and Fund Management Company. | N/A | N/A |
The Statement of Additional Information of the Trust includes additional information about the Fund’s Trustees and is available upon request, without charge, by calling 1.800.959.4246. Please refer to the Fund’s prospectus for information on the Fund’s sub-advisers.
Office of the Fund 11 Greenway Plaza, Suite 1000 Houston, TX 77046-1173 | Investment Adviser Invesco Advisers, Inc. 1555 Peachtree Street, N.E. Atlanta, GA 30309 | Distributor Invesco Distributors, Inc. 11 Greenway Plaza, Suite 1000 Houston, TX 77046-1173 | Auditors PricewaterhouseCoopers LLP 1000 Louisiana Street, Suite 5800 Houston, TX 77002-5678 | |||
Counsel to the Fund Stradley Ronon Stevens & Young, LLP 2005 Market Street, Suite 2600 Philadelphia, PA 19103-7018 | Counsel to the Independent Trustees Goodwin Procter LLP 901 New York Avenue, N.W. Washington, D.C. 20001 | Transfer Agent Invesco Investment Services, Inc. 11 Greenway Plaza, Suite 1000 Houston, TX 77046-1173 | Custodian State Street Bank and Trust Company 225 Franklin Street Boston, MA 02110-2801 | |||
T-4 Invesco Strategic Real Return Fund

Invesco mailing information
Send general correspondence to Invesco Investment Services, Inc., P.O. Box 219078, Kansas City, MO 64121-9078.
Important notice regarding delivery of security holder documents
To reduce Fund expenses, only one copy of most shareholder documents may be mailed to shareholders with multiple accounts at the same address (Householding). Mailing of your shareholder documents may be householded indefinitely unless you instruct us otherwise. If you do not want the mailing of these documents to be combined with those for other members of your household, please contact Invesco Investment Services, Inc. at 800 959 4246 or contact your financial institution. We will begin sending you individual copies for each account within 30 days after receiving your request.
Fund holdings and proxy voting information
The Fund provides a complete list of its holdings four times in each fiscal year, at the quarter ends. For the second and fourth quarters, the lists appear in the Fund’s semiannual and annual reports to shareholders. For the first and third quarters, the Fund files the lists with the Securities and Exchange Commission (SEC) on Form N-Q. The most recent list of portfolio holdings is available at invesco.com/completeqtrholdings. Shareholders can also look up the Fund’s Forms N-Q on the SEC website at sec.gov. Copies of the Fund’s Forms N-Q may be reviewed and copied at the SEC Public Reference Room in Washington, D.C. You can obtain information on the operation of the Public Reference Room, including information about duplicating fee charges, by calling 202 551 8090 or 800 732 0330, or by electronic request at the following email address: publicinfo@sec.gov.
The SEC file numbers for the Fund are shown below.
A description of the policies and procedures that the Fund uses to determine how to vote proxies relating to portfolio securities is available without charge, upon request, from our Client Services department at 800 959 4246 or at invesco.com/proxyguidelines. The information is also available on the SEC website, sec.gov.
Information regarding how the Fund voted proxies related to its portfolio securities during the most recent 12-month period ended June 30 is available at invesco.com/proxysearch. The information is also available on the SEC website, sec.gov. Invesco Advisers, Inc. is an investment adviser; it provides investment advisory services to individual and institutional clients and does not sell securities. Invesco Distributors, Inc. is the US distributor for Invesco Ltd.’s retail mutual funds, exchange-traded funds and institutional money market funds. Both are wholly owned, indirect subsidiaries of Invesco Ltd. |  |
SEC file numbers: 811-09913 and 333-36074 SRR-AR-1 Invesco Distributors, Inc.
| ITEM 2. | CODE OF ETHICS. |
There were no amendments to the Code of Ethics (the “Code”) that applies to the Registrant’s Principal Executive Officer (“PEO”) and Principal Financial Officer (“PFO”) during the period covered by the report. The Registrant did not grant any waivers, including implicit waivers, from any provisions of the Code to the PEO or PFO during the period covered by this report.
| ITEM 3. | AUDIT COMMITTEE FINANCIAL EXPERT. |
The Board of Trustees has determined that the Registrant has at least one audit committee financial expert serving on its Audit Committee. The Audit Committee financial expert is Raymond Stickel, Jr. Mr. Stickel is “independent” within the meaning of that term as used in Form N-CSR.
| ITEM 4. | PRINCIPAL ACCOUNTANT FEES AND SERVICES. |
(a) to (d)
Fees Billed by PWC Related to the Registrant
PWC billed the Registrant aggregate fees for services rendered to the Registrant for the last two fiscal years as follows:
| Fees Billed for Services Rendered to the Registrant for fiscal year end 2015 | (e)(2) Percentage of Fees Billed Applicable to Non-Audit Services Provided for fiscal year end 2015 Pursuant to Waiver of Pre-Approval Requirement(1) | Fees Billed for Services Rendered to the Registrant for fiscal year end 2014 | (e)(2) Percentage of Fees Billed Applicable to Non-Audit Services Provided for fiscal year end 2014 Pursuant to Waiver of Pre-Approval Requirement(1) | |||||||||||||
Audit Fees | $ | 430,750 | N/A | $ | 374,875 | N/A | ||||||||||
Audit-Related Fees(2) | $ | 0 | 0 | % | $ | 6,500 | 0 | % | ||||||||
Tax Fees(3) | $ | 104,715 | 0 | % | $ | 177,710 | 0 | % | ||||||||
All Other Fees | $ | 0 | 0 | % | $ | 0 | 0 | % | ||||||||
|
|
|
| |||||||||||||
Total Fees | $ | 535,465 | 0 | % | $ | 559,085 | 0 | % | ||||||||
(g) PWC billed the Registrant aggregate non-audit fees of $104,715 for the fiscal year ended 2015, and $184,210 for the fiscal year ended 2014, for non-audit services rendered to the Registrant.
| (1) | With respect to the provision of non-audit services, the pre-approval requirement is waived pursuant to a de minimis exception if (i) such services were not recognized as non-audit services by the Registrant at the time of engagement, (ii) the aggregate amount of all such services provided is no more than 5% of the aggregate audit and non-audit fees paid by the Registrant to PWC during a fiscal year; and (iii) such services are promptly brought to the attention of the Registrant’s Audit Committee and approved by the Registrant’s Audit Committee prior to the completion of the audit. |
| (2) | Audit-related fees for the fiscal year end 2014 include fees billed for agreed upon procedures related to fund mergers. |
| (3) | Tax fees for the fiscal year end 2015 include fees billed for reviewing tax returns. Tax fees for the fiscal year end 2014 includes fees billed for reviewing tax returns, consultation services and fund mergers. |
Fees Billed by PWC Related to Invesco and Invesco Affiliates
PWC billed Invesco Advisers, Inc. (“Invesco”), the Registrant’s adviser, and any entity controlling, controlled by or under common control with Invesco that provides ongoing services to the Registrant (“Invesco Affiliates”) aggregate fees for pre-approved non-audit services rendered to Invesco and Invesco Affiliates for the last two fiscal years as follows:
| Fees Billed for Non- Audit Services Rendered to Invesco and Invesco Affiliates for fiscal year end 2015 That Were Required to be Pre-Approved by the Registrant’s Audit Committee | (e)(2) Percentage of Fees Billed Applicable to Non-Audit Services Provided for fiscal year end 2015 Pursuant to Waiver of Pre- Approval Requirement(1) | Fees Billed for Non- Audit Services Rendered to Invesco and Invesco Affiliates for fiscal year end 2014 That Were Required to be Pre-Approved by the Registrant’s Audit Committee | (e)(2) Percentage of Fees Billed Applicable to Non-Audit Services Provided for fiscal year end 2014 Pursuant to Waiver of Pre- Approval Requirement(1) | |||||||||||||
Audit-Related Fees | $ | 574,000 | 0 | % | $ | 574,000 | 0 | % | ||||||||
Tax Fees | $ | 0 | 0 | % | $ | 0 | 0 | % | ||||||||
All Other Fees | $ | 2,600,000 | 0 | % | $ | 0 | 0 | % | ||||||||
|
|
|
| |||||||||||||
Total Fees(2) | $ | 3,174,000 | 0 | % | $ | 574,000 | 0 | % | ||||||||
| (1) | With respect to the provision of non-audit services, the pre-approval requirement is waived pursuant to a de minimis exception if (i) such services were not recognized as non-audit services by the Registrant at the time of engagement, (ii) the aggregate amount of all such services provided is no more than 5% of the aggregate audit and non-audit fees paid by the Registrant, Invesco and Invesco Affiliates to PWC during a fiscal year; and (iii) such services are promptly brought to the attention of the Registrant’s Audit Committee and approved by the Registrant’s Audit Committee prior to the completion of the audit. |
| (2) | Audit-Related fees for the year end 2015 include fees billed related to reviewing controls at a service organization. Audit-Related fees for the year end 2014 include fees billed related to reviewing controls at a service organization. |
(g) Including the fees for services not required to be pre-approved by the registrant’s audit committee, PWC billed Invesco and Invesco Affiliates aggregate non-audit fees of $7,224,954 for the fiscal year ended 2015, and $2,684,926 for the fiscal year ended 2014, for non-audit services rendered to Invesco and Invesco Affiliates.
(h) The Audit Committee also has considered whether the provision of non-audit services that were rendered to Invesco and Invesco Affiliates that were not required to be pre-approved pursuant to SEC regulations, if any, is compatible with maintaining PWC’s independence. To the extent that such services were provided, the Audit Committee determined that the provision of such services is compatible with PWC maintaining independence with respect to the Registrant.
(f) Not applicable.
(e)(1)
PRE-APPROVAL OF AUDIT AND NON-AUDIT SERVICES
POLICIES AND PROCEDURES
As adopted by the Audit Committees of
the Invesco Funds (the “Funds”)
Last Amended May 4, 2010
Statement of Principles
Under the Sarbanes-Oxley Act of 2002 and rules adopted by the Securities and Exchange Commission (“SEC”) (“Rules”), the Audit Committees of the Funds’ (the “Audit Committees”) Board of Trustees (the “Board”) are responsible for the appointment, compensation and oversight of the work of independent accountants (an “Auditor”). As part of this responsibility and to assure that the Auditor’s independence is not impaired, the Audit Committees pre-approve the audit and non-audit services provided to the Funds by each Auditor, as well as all non-audit services provided by the Auditor to the Funds’ investment adviser and to affiliates of the adviser that provide ongoing services to the Funds (“Service Affiliates”) if the services directly impact the Funds’ operations or financial reporting. The SEC Rules also specify the types of services that an Auditor may not provide to its audit client. The following policies and procedures comply with the requirements for pre-approval and provide a mechanism by which management of the Funds may request and secure pre-approval of audit and non-audit services in an orderly manner with minimal disruption to normal business operations.
Proposed services either may be pre-approved without consideration of specific case-by-case services by the Audit Committees (“general pre-approval”) or require the specific pre-approval of the Audit Committees (“specific pre-approval”). As set forth in these policies and procedures, unless a type of service has received general pre-approval, it will require specific pre-approval by the Audit Committees. Additionally, any fees exceeding 110% of estimated pre-approved fee levels provided at the time the service was pre-approved will also require specific approval by the Audit Committees before payment is made. The Audit Committees will also consider the impact of additional fees on the Auditor’s independence when determining whether to approve any additional fees for previously pre-approved services.
The Audit Committees will annually review and generally pre-approve the services that may be provided by each Auditor without obtaining specific pre-approval from the Audit Committee generally on an annual basis. The term of any general pre-approval runs from the date of such pre-approval through September 30th of the following year, unless the Audit Committees consider a different period and state otherwise. The Audit Committees will add to or subtract from the list of general pre-approved services from time to time, based on subsequent determinations.
The purpose of these policies and procedures is to set forth the guidelines to assist the Audit Committees in fulfilling their responsibilities.
Delegation
The Audit Committees may from time to time delegate pre-approval authority to one or more of its members who are Independent Trustees. All decisions to pre-approve a service by a delegated member shall be reported to the Audit Committees at the next quarterly meeting.
Audit Services
The annual audit services engagement terms will be subject to specific pre-approval of the Audit Committees. Audit services include the annual financial statement audit and other procedures such as tax provision work that is required to be performed by the independent auditor to be able to form an opinion on the Funds’ financial statements. The Audit Committees will obtain, review and consider sufficient information concerning the proposed Auditor to make a reasonable evaluation of the Auditor’s qualifications and independence.
In addition to the annual Audit services engagement, the Audit Committees may grant either general or specific pre-approval of other audit services, which are those services that only the independent auditor reasonably can provide. Other Audit services may include services such as issuing consents for the inclusion of audited financial statements with SEC registration statements, periodic reports and other documents filed with the SEC or other documents issued in connection with securities offerings.
Non-Audit Services
The Audit Committees may provide either general or specific pre-approval of any non-audit services to the Funds and its Service Affiliates if the Audit Committees believe that the provision of the service will not impair the independence of the Auditor, is consistent with the SEC’s Rules on auditor independence, and otherwise conforms to the Audit Committees’ general principles and policies as set forth herein.
Audit-Related Services
“Audit-related services” are assurance and related services that are reasonably related to the performance of the audit or review of the Fund’s financial statements or that are traditionally performed by the independent auditor. Audit-related services include, among others, accounting consultations related to accounting, financial reporting or disclosure matters not classified as “Audit services”; assistance with understanding and implementing new accounting and financial reporting guidance from rulemaking authorities; and agreed-upon procedures related to mergers, compliance with ratings agency requirements and interfund lending activities.
Tax Services
“Tax services” include, but are not limited to, the review and signing of the Funds’ federal tax returns, the review of required distributions by the Funds and consultations regarding tax matters such as the tax treatment of new investments or the impact of new regulations. The Audit Committees will scrutinize carefully the retention of the Auditor in connection with a transaction initially recommended by the Auditor, the major business purpose of which may be tax avoidance or the tax treatment of which may not be supported in the Internal Revenue Code and related regulations. The Audit Committees will consult with the Funds’ Treasurer (or his or her designee) and may consult with outside counsel or advisors as necessary to ensure the consistency of Tax services rendered by the Auditor with the foregoing policy.
No Auditor shall represent any Fund or any Service Affiliate before a tax court, district court or federal court of claims.
Under rules adopted by the Public Company Accounting Oversight Board and approved by the SEC, in connection with seeking Audit Committees’ pre-approval of permissible Tax services, the Auditor shall:
| 1. | Describe in writing to the Audit Committees, which writing may be in the form of the proposed engagement letter: |
| a. | The scope of the service, the fee structure for the engagement, and any side letter or amendment to the engagement letter, or any other agreement between the Auditor and the Fund, relating to the service; and |
| b. | Any compensation arrangement or other agreement, such as a referral agreement, a referral fee or fee-sharing arrangement, between the Auditor and any person (other than the Fund) with respect to the promoting, marketing, or recommending of a transaction covered by the service; |
| 2. | Discuss with the Audit Committees the potential effects of the services on the independence of the Auditor; and |
| 3. | Document the substance of its discussion with the Audit Committees. |
All Other Auditor Services
The Audit Committees may pre-approve non-audit services classified as “All other services” that are not categorically prohibited by the SEC, as listed in Exhibit 1 to this policy.
Pre-Approval Fee Levels or Established Amounts
Pre-approval of estimated fees or established amounts for services to be provided by the Auditor under general or specific pre-approval policies will be set periodically by the Audit Committees. Any proposed fees exceeding 110% of the maximum estimated pre-approved fees or established amounts for pre-approved audit and non-audit services will be reported to the Audit Committees at the quarterly Audit Committees meeting and will require specific approval by the Audit Committees before payment is made.
The Audit Committees will always factor in the overall relationship of fees for audit and non-audit services in determining whether to pre-approve any such services and in determining whether to approve any additional fees exceeding 110% of the maximum pre-approved fees or established amounts for previously pre-approved services.
Procedures
Generally on an annual basis, Invesco Advisers, Inc. (“Invesco”) will submit to the Audit Committees for general pre-approval, a list of non-audit services that the Funds or Service Affiliates of the Funds may request from the Auditor. The list will describe the non-audit services in reasonable detail and will include an estimated range of fees and such other information as the Audit Committee may request.
Each request for services to be provided by the Auditor under the general pre-approval of the Audit Committees will be submitted to the Funds’ Treasurer (or his or her designee) and must include a detailed description of the services to be rendered. The Treasurer or his or her designee will ensure that such services are included within the list of services that have received the general pre-approval of the Audit Committees. The Audit Committees will be informed at the next quarterly scheduled Audit Committees meeting of any such services for which the Auditor rendered an invoice and whether such services and fees had been pre-approved and if so, by what means.
Each request to provide services that require specific approval by the Audit Committees shall be submitted to the Audit Committees jointly by the Fund’s Treasurer or his or her designee and the Auditor, and must include a joint statement that, in their view, such request is consistent with the policies and procedures and the SEC Rules.
Each request to provide tax services under either the general or specific pre-approval of the Audit Committees will describe in writing: (i) the scope of the service, the fee structure for the engagement, and any side letter or amendment to the engagement letter, or any other agreement between the Auditor and the audit client, relating to the service; and (ii) any compensation arrangement or other agreement between the Auditor and any person (other than the audit client) with respect to the promoting, marketing, or recommending of a transaction covered by the service. The Auditor will discuss with the Audit Committees the potential effects of the services on the Auditor’s independence and will document the substance of the discussion.
Non-audit services pursuant to the de minimis exception provided by the SEC Rules will be promptly brought to the attention of the Audit Committees for approval, including documentation that each of the conditions for this exception, as set forth in the SEC Rules, has been satisfied.
On at least an annual basis, the Auditor will prepare a summary of all the services provided to any entity in the investment company complex as defined in section 2-01(f)(14) of Regulation S-X in sufficient detail as to the nature of the engagement and the fees associated with those services.
The Audit Committees have designated the Funds’ Treasurer to monitor the performance of all services provided by the Auditor and to ensure such services are in compliance with these policies and procedures. The Funds’ Treasurer will report to the Audit Committees on a periodic basis as to the results of such monitoring. Both the Funds’ Treasurer and management of Invesco will immediately report to the chairman of the Audit Committees any breach of these policies and procedures that comes to the attention of the Funds’ Treasurer or senior management of Invesco.
Exhibit 1 to Pre-Approval of Audit and Non-Audit Services Policies and Procedures
Conditionally Prohibited Non-Audit Services (not prohibited if the Fund can reasonably conclude that the results of the service would not be subject to audit procedures in connection with the audit of the Fund’s financial statements)
| • | Bookkeeping or other services related to the accounting records or financial statements of the audit client |
| • | Financial information systems design and implementation |
| • | Appraisal or valuation services, fairness opinions, or contribution-in-kind reports |
| • | Actuarial services |
| • | Internal audit outsourcing services |
Categorically Prohibited Non-Audit Services
| • | Management functions |
| • | Human resources |
| • | Broker-dealer, investment adviser, or investment banking services |
| • | Legal services |
| • | Expert services unrelated to the audit |
| • | Any service or product provided for a contingent fee or a commission |
| • | Services related to marketing, planning, or opining in favor of the tax treatment of confidential transactions or aggressive tax position transactions, a significant purpose of which is tax avoidance |
| • | Tax services for persons in financial reporting oversight roles at the Fund |
| • | Any other service that the Public Company Oversight Board determines by regulation is impermissible. |
| ITEM 5. | AUDIT COMMITTEE OF LISTED REGISTRANTS. |
Not applicable.
| ITEM 6. | SCHEDULE OF INVESTMENTS. |
Investments in securities of unaffiliated issuers is included as part of the reports to stockholders filed under Item 1 of this Form.
| ITEM 7. | DISCLOSURE OF PROXY VOTING POLICIES AND PROCEDURES FOR CLOSED-END MANAGEMENT INVESTMENT COMPANIES. |
Not applicable.
| ITEM 8. | PORTFOLIO MANAGERS OF CLOSED-END MANAGEMENT COMPANIES. |
Not applicable.
| ITEM 9. | PURCHASES OF EQUITY SECURITIES BY CLOSED-END MANAGEMENT INVESTMENT COMPANY AND AFFILIATED PURCHASERS. |
Not applicable.
| ITEM 10. | SUBMISSION OF MATTERS TO A VOTE OF SECURITY HOLDERS. |
None
| ITEM 11. | CONTROLS AND PROCEDURES. |
| (a) | As of August 13, 2015, an evaluation was performed under the supervision and with the participation of the officers of the Registrant, including the PEO and PFO, to assess the effectiveness of the Registrant’s disclosure controls and procedures, as that term is defined in Rule 30a-3(c) under the Investment Company Act of 1940 (the “Act”), as amended. Based on that evaluation, the Registrant’s officers, including the PEO and PFO, concluded that, as of August 13, 2015, the Registrant’s disclosure controls and procedures were reasonably designed to ensure: (1) that information required to be disclosed by the Registrant on Form N-CSR is recorded, processed, summarized and reported within the time periods specified by the rules and forms of the Securities and Exchange Commission; and (2) that material information relating to the Registrant is made known to the PEO and PFO as appropriate to allow timely decisions regarding required disclosure. |
| (b) | There have been no changes in the Registrant’s internal control over financial reporting (as defined in Rule 30a-3(d) under the Act) that occurred during the second fiscal quarter of the period covered by this report that have materially affected, or are reasonably likely to materially affect, the Registrant’s internal control over financial reporting. |
| ITEM 12. | EXHIBITS. |
| 12(a) (1) | Code of Ethics. | |
| 12(a) (2) | Certifications of principal executive officer and principal financial officer as required by Rule 30a-2(a) under the Investment Company Act of 1940. | |
| 12(a) (3) | Not applicable. | |
| 12(b) | Certifications of principal executive officer and principal financial officer as required by Rule 30a-2(b) under the Investment Company Act of 1940. | |
SIGNATURES
Pursuant to the requirements of the Securities Exchange Act of 1934 and the Investment Company Act of 1940, the Registrant has duly caused this report to be signed on its behalf by the undersigned, thereunto duly authorized.
Registrant: AIM Counselor Series Trust (Invesco Counselor Series Trust)
| By: | /s/ Philip A. Taylor | |
| Philip A. Taylor | ||
| Principal Executive Officer | ||
| Date: | November 9, 2015 | |
Pursuant to the requirements of the Securities and Exchange Act of 1934 and the Investment Company Act of 1940, this report has been signed below by the following persons on behalf of the Registrant and in the capacities and on the dates indicated.
| By: | /s/ Philip A. Taylor | |
| Philip A. Taylor | ||
| Principal Executive Officer | ||
| Date: | November 9, 2015 | |
| By: | /s/ Sheri Morris | |
| Sheri Morris | ||
| Principal Financial Officer | ||
| Date: | November 9, 2015 | |
EXHIBIT INDEX
| 12(a) (1) | Code of Ethics. | |
| 12(a) (2) | Certifications of principal executive officer and principal financial officer as required by Rule 30a-2(a) under the Investment Company Act of 1940. | |
| 12(a) (3) | Not applicable. | |
| 12(b) | Certifications of principal executive officer and principal financial officer as required by Rule 30a-2(b) under the Investment Company Act of 1940. | |